1 Background........................................................................................................................... 1
Table
3-1 Tentative Schedule of Dewatering Works and Respective Dewatering
Rate 5
Table 4-2 Recharge Areas and Monitoring Location 7
Table 5-3 Baseline Groundwater
Testing Parameters 10
Table 6-4 Summary of Baseline
Groundwater Monitoring Results 13
Table 7-5 Limit Levels of TPH at Recharge Wells/Outlet of Treatment
Facilities 14
Table 7-6 Limit Levels at Monitoring Wells 15
Table 7-7 Event and Action Plan 16
Table 8-8 Number of Treatment
Facilities 16
Figure 4‑1 Sections of Construction Site of KSL
Contracts 8
Figure 4‑2 Groundwater
Sampling Locations in KSL EIA 9
Figure 8- 3 Schematic Process of Groundwater Treatment 16
Annex
Annex 1 Locations
of Dewatering Areas, Recharge Areas and Monitoring Wells
Annex 2 Analytical Results of
Five Sampling Location in EIA Stage
Annex 3 Information of Old
Seawall
Annex 34 Site Layout of KDB400
Annex 4 As-built Monitoring Well Locations
Annex 5 Typical
Installation Details of Groundwater Monitoring Well
Annex 6 Baseline Monitoring
Results
A Contamination Assessment Report (CAR) and Remediation Action Plan (RAP) for the site of KCRC Kowloon Southern Link (KSL) (Appendix 10.2 of the KSL EIA Report) were prepared. Groundwater at some spots of the KSL alignment was found contaminated with primarily heavy metals (i.e. Copper, Lead and Mercury) of which their levels exceeded the Dutch C level for groundwater. Within the construction sites of KDB300 & KDB400, water sample collected at borehole KSD100/DHEPZ113 in the vicinity of Tai Kok Tsui petrol filling station at Skyway House exceeded the discharge limit as stipulated in Technical Memorandum on Standards for Effluents Discharged into Drainage and Sewerage Systems, Inland and Coastal Waters (TM) and Dutch C Levels as indicated in KSL EIA Report.
According to the KSL EIA Report and Further Environmental Permits (FEPs) (EP No. FEP-02/215/2005/A and FEP-03/215/2005/A) for KDB300 & KDB400, direct discharge of contaminated groundwater will not be adopted. Contaminated groundwater should be diverted to pre-determined well(s) for recharging back to the ground. In accordance with the KSL EIA Report and EM&A Manual, recharge wells should be selected at places where the groundwater quality will not be affected by recharge operation. According to Conditions 3.4 and 3.5 of the FEPs for KDB300 and KDB400 respectively, a Working Plan (WP) including a number of recharge wells and their specific locations, baseline parameters of the recharge and monitoring locations, and number of treatment facilities and their treatment capacities should be prepared and submitted to EPD prior to dewatering works.
According to the KSL EIA Report and EM&A Manual, ambient measurements on the groundwater quality at the WKN and the cut-&-cover tunnel to the north of WKN prior to the selection of recharge wells is required. The measurement results will be used to update the potential of groundwater contamination and to form groundwater baseline condition. After performing the ambient groundwater quality measurement, recharge wells would be selected for recharging contaminated groundwater.
A
Groundwater Monitoring Working Plan was prepared and endorsed by EPD on 31
October 2006.
In
the endorsed Groundwater Monitoring Working Plan, three potential control wells
C1, C2 and C3 were identified for groundwater monitoring during the recharge
operation. From preliminary investigation, utility as-built records showed that
the location of well C2 is full of underground utilities (detailed in Section
4.4). There is much risk involved to drill at this location. In consideration of the extensive
underground utilities located at potential control well C2, control wells C1
and C3 will be used for groundwater monitoring during the recharge operation.
From on-site
experience it has been observed that the flow rate is lower than previously
estimated, hence, the actual dewatering rate is lower than previously
estimated. Therefore, only five
dewatering zones are required (Zone A, B+C, D+E, F and G) compared to the seven
dewatering zones (Zone A, B, C, D ,E ,F and G) stated in the endorsed
Groundwater Monitoring Working Plan.
This updated Working Plan (WP) is
prepared to:
§
Revise
the dewatering zones to take into account the lower dewatering rate than
previously estimated;
§
Describe
general approach of groundwater monitoring works;
§
Identify
ambient groundwater monitoring locations;
§
Formulate
ambient/baseline groundwater monitoring programme and stipulate monitoring
parameters, reporting limits and analytical method for the ambient, recharge
and monitoring locations;
§
Update
the extent of potential groundwater contamination;
§
Identify
possible areas for recharging groundwater, locations of recharge wells, impact
monitoring wells and control wells;
§
Formulate
the impact monitoring programme including Limit Level of impact monitoring and
Event and Action Plan;
§
Describe
the requirements of groundwater monitoring wells, sampling methodology and
sample handling requirements; and
§
Identity
the number and capacity of the treatment facility required.
2.1
Ambient Groundwater Monitoring
According to the KSL EIA
Report and EM&A Manual, ambient groundwater monitoring should be carried
out for updating the extent of
the groundwater contamination identified in the KSL EIA report. The ambient groundwater monitoring will
also form part of the baseline groundwater monitoring of the groundwater
monitoring programme
for recharging contaminated groundwater.
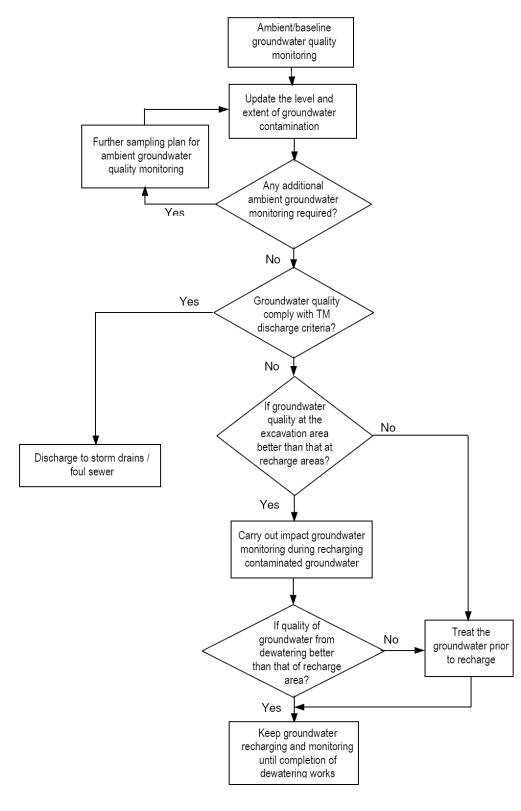
Groundwater would be considered as
contaminated if it cannot comply with the discharge limits of the relevant flow
band as stipulated in Table 9a – Standards for Effluent Discharged into the
Inshore Waters of VHWCZ of the TM and it contains any prohibited substance
listed in Section 9.2 of the TM.
The following diagram shows the approach of the groundwater monitoring works.
2.2
Groundwater Monitoring Phases
Groundwater
monitoring for recharging groundwater work will be separated into baseline and
impact phases.
2.2.1
Baseline
Groundwater Monitoring
Baseline monitoring will be undertaken at the following monitoring wells:
I.
Ambient
Groundwater Quality Monitoring Well
II.
Recharge
Well
III.
Control Well
IV.
Impact Monitoring Well
Groundwater
samples from the above wells will be collected daily for 7 consecutive
days. Monitoring will be carried
out at ambient groundwater monitoring wells to determine the level and extent
of groundwater contamination, if any.
If ambient groundwater
monitoring results show that the groundwater quality does not comply with the
discharge limits as stipulated in TM or the
groundwater is contaminated (i.e. concentration of contaminants above the Dutch
C Levels)contains prohibited substances as stipulated in TM,
baseline monitoring will also be carried out at recharge well(s), control
well(s) and impact monitoring well(s). Based on the baseline monitoring results, limit levels will
be established once the analytical results are available based on the
followings:
§ Ambient groundwater quality measurement results; and
§ The groundwater quality of the monitoring wells at the site boundaries will not be affected by the recharging operation.
2.2.2
Impact
Groundwater Monitoring
Impact monitoring will be carried
out at the recharge wells and monitoring wells in order to
ensure the quality of groundwater from dewatering is better than that of the
recharge areas. In addition, monitoring will also be
carried out at the control well for monitoring the natural variation of
groundwater quality.
In case of any exceedance,
appropriate action will be undertaken in accordance with the Event and Action
Plan as described in Table 7-4.
3.1 Dewatering Works at KDB400
KSL railway will be laid underground and will be constructed by cut-&-cover. Excavation and dewatering works along the alignment will be required and will be carried out in separate zones within KDB400. Each of the excavation areas will be surrounded by cofferdam walls (by means of sheet-pile or pipe-pile), which restrict the seepage of groundwater into the excavation zones. The first zone of where excavation works will be carried out is Zone A at Nam Cheong Park as shown in Annex 1.
From on-site experience, taking into account the actual permeability of the soils, the flow rate is lower than previously estimated, hence, the actual dewatering rate is lower than previously estimated. Therefore, only five dewatering zones are required (Zone A, B+C, D+E, F and G) compared to the seven dewatering zones (Zone A, B, C, D , E ,F and G) in the previous Working Plan.
Two site areas have been identified for recharging the groundwater from dewatering process. Groundwater from Zones A and B+C will be recharged to recharge area at Nam Cheong Park near Zone A (R2). Groundwater from Zones D+E, F and G will be recharged to recharge area adjacent the KSL alignment near the construction site of Olympic City Phase III near Zone F (R1). Annex 1 shows the identified recharge areas and tentative programme for dewatering works of Zones A to G.
Dewatering rate depends on the dewatering requirement of each phase of dewatering works. In general, dewatering works will be separated into two phases. Phase I dewatering works include pumping test and full drawn-down of water table and phase II dewatering works control the seepage of groundwater during excavation and tunnel construction works. The estimated average hourly dewatering rate of the dewatering well and the daily dewatering rate of dewatering zones in different phases are given in Annex 1. As dewatering works of different zones will be overlapped in certain time periods, the estimated daily groundwater dewatering rates at different time periods are summarised in Table 3-1.
|
Period |
Zone |
Dewatering
Works |
Estimated
Dewatering Rate, m3/day |
Recharge
Area |
|
|
Pumping
Test and Draw-down Water
Table |
Seepage
Control |
||||
|
|
|||||
|
09 Nov 06 to 15 Nov 06 |
A |
ü |
|
576 |
Recharge area at Nam Cheong
Park near Zone A |
|
16 Nov 06 to 15 Mar 07 |
A |
|
ü |
192 |
|
|
16 April 07 to 23 April 07 |
B+C |
ü |
|
1,440 |
|
|
24 April 07 to 31 Aug 07 |
B+C |
|
ü |
480 |
|
|
23 Mar 07 to 30 Mar 07 |
D+E |
ü |
|
1,440 |
Recharge area adjacent to the
KSL alignment near the construction site of Olympic City Phase III near Zone
F |
|
1 April 07 to 24 May 07 |
D+E |
|
ü |
480 |
|
|
25 May 07 to 31 May 07 |
D+E |
|
ü |
1,920 |
|
|
F |
ü |
|
|||
|
01 June 07 to 22 June 07 |
D+E |
|
ü |
960 |
|
|
F |
|
ü |
|||
|
23 Jun 07 to 30 Jun 07 |
D+E |
|
ü |
2,688 |
|
|
F |
|
ü |
|||
|
G |
ü |
|
|||
|
01 Jul 07 to 31 Aug 07 |
D+E |
|
ü |
1,536 |
|
|
F |
|
ü |
|||
|
G |
|
ü |
|||
|
01 Sep 07 to 31 Oct 07 |
F |
|
ü |
1,056 |
|
|
G |
|
ü |
|||
|
01 Nov 07 to 30 Nov 07 |
G |
|
ü |
576 |
|
Table 3-1 Tentative Schedule of Dewatering Works and Respective Dewatering Rate
4.1 Ambient Groundwater Monitoring Wells
According to the KSL EIA report, six sampling locations were identified at five identified potential contaminated areas. Figure 4-1 shows the sections of the construction sites of KSL Contracts KDB200, KDB300 and KDB400. Figure 4-2 shows five groundwater sampling locations identified in the KSL EIA report. Only two sampling locations (KSD100/DHEPZ113 and KSD100/DHE120) are located within the construction site of KDB400. There was no potential contaminated area identified in the construction site of KDB300. The analytical results of these five locations extracted from the EIA report are given in Annex 2.
Groundwater sample from the borehole KSD100/DHEPZ113 in the vicinity of Tai Kok Tsui petrol filling station at Skyway House exceeded the discharge limit of Mercury as stipulated in TM. TPH (C15-C28) was also present in the groundwater sample. As the testing for TPH (C10-C14 and C29-C36), PAHs and BTEX in the EIA study was not up to the required reporting limits, such substances might also be present in the sample.
TPH (C15-C28 and C29-C36) was present in the groundwater sample at borehole KSD100/DHE120 that is located at the former shipyard site in West Kowloon Reclamation Area. Moreover, as the testing for TPH (C10-C14), PAHs and BTEX in the EIA study was not up to the required reporting limits, such substances might also be present in the sample.
Annex
23 shows that there is
an old seawall down to –5mPD (approximate 11m below ground level) at Chainage
6+950* (at about the northern end of MTR
Olympic Station and the Chainage is referred to Site Layout for KDB400 (Drawing
no.: KDB400/HA/Y0001 rev A) as given in Annex 34). This would potentially restrict the
migration of groundwater across the seawall.
For
updating the extent of the groundwater contamination and to evaluate the
groundwater quality at the excavation areas, the ambient groundwater quality
monitoring wells are located between Chainage 6+950* and Chainage 7+200* (where it is midway between boreholes
KSD100/DHEPZ113 and KSD100/DHE120).
Six ambient groundwater quality monitoring wells, AGM 1 to AGM 6, along
the alignment are shown in Annex 41.
In
addition, one ambient groundwater well (AGM 7) has been identified in the
vicinity of KSD100/DHE120 as shown in Annex 41 to update
the groundwater contamination at the site of Nam Cheong Park.
All
of these ambient groundwater wells are located at the excavation areas where
dewatering works will be undertaken to the north of the old seawall. Thus AGM1 to AGM7 can represent the
groundwater quality from Zone A to Zone G.
Two
recharge areas locating recharging wells for groundwater recharge operation were
identified. Recharge areas near
Zone F and Zone A are identified for recharging groundwater from Zone D+E to
Zone G and Zone A to Zone B+C respectively. Two recharge well locations; R1 and R2, for evaluating the
groundwater contamination at recharge areas were identified as shown in Annex 41. R1 is located at the site area adjacent
to the KSL alignment near the construction site of Olympic City Phase III near
Zone F and R2 is located within the construction site of Nam Cheong Park near
Zone A.
Pit will be constructed at each recharge area as it is not practicable that recharge groundwater from dewatering works into a single recharge well. The adequacy of the recharge well to accommodate the dewatered groundwater would be subject to the soil permeability data which will be obtained from the pumping test. Pit will be enlarged or additional recharge area will be identified if it is found that the pit at the recharge area is not sufficient to accommodate the dewatered groundwater.
As mentioned in Section 3.1, cofferdam wall will be constructed surrounding the excavation zones to restrict the groundwater seepage. This would also restrict the groundwater recharged to R1 and R2 to migrate seaward across the alignment. Thus, monitoring and control wells as mentioned below are also located to the east side of the KSL alignment where R1 and R2 are located.
Monitoring well locations, M1/AGM5a, M2, M2a and M3, are identified at
the site boundary near the recharge wells as shown in Annexes 1 for ensuring there is no
likelihood of locally risen groundwater level and transfer of pollutants beyond the
site boundary. Due to site constraint, M2 was used for obtaining
the baseline groundwater quality near the site boundary while M2a will be the actual
monitoring location during impact monitoring and 4.
Control well will be used to monitor the natural variation of the groundwater quality. Groundwater quality should not be affected by excavation works and recharge operation. Three potential control wells C1, C2 and C3 were identified for groundwater monitoring during the recharge operation and they are shown in Annex 1. From preliminary investigation, utility as-built records showed that the location of well C2 is full of utilities, e.g. tel-cable, optical cable, town gas pipe, etc and therefore poses too much risk to drill on. In consideration of the extensive underground utilities located at potential control well C2, control wells C1 and C3 will be used for groundwater monitoring during the recharge operation.
The control wells have been identified at the best available locations with the consideration of the followings in order to ensure that the groundwater quality at control wells can represent natural variation but not affecting the KSL construction works:
§ excavation and dewatering works;
§ recharge operation;
§ limited site area (as the site area railway construction is narrow);
§ most of the suitable areas are existing roads and slopes which are not suitable for locating sampling well; and
§ Consideration of underground utilities.
C1/C3
will be used as control well for recharge operation for Zone A as M2a will be
used as monitoring well during the recharge operation. C3 will be used as control well for
Zone B+C as M3 will be used as monitoring well during the recharge
operation. For recharge operation
for Zones D+E, F and G, as M1/M1 AGM5a (to be renamed as M4) will be used as
monitoring well, C3 will be used as control well.
Table 4-2 shows the respective recharge areas, monitoring wells and control wells for the recharge operation for different excavation zones.
|
Zone |
Dewatering
Period |
Recharge
Area/Well |
Monitoring
Well |
Control
Well |
|
Zone
A |
Nov
06 to Mar 07 |
R2 |
|
C1/C3 |
|
Zone
B+C |
April
07 to Aug 07 |
R2 |
|
C3 |
|
Zone
D+E |
Mar
07 to Aug 07 |
R1 |
M1/ |
C3 |
|
Zone
F |
May
07 to Oct 07 |
R1 |
M1/ |
C3 |
|
Zone
G |
Jun
07 to Nov 07 |
R1 |
M1/ |
C3 |
Table 4-2 Recharge Areas and Monitoring Location
Baseline monitoring should be
carried out at all sampling wells identified in Section 4.
Baseline monitoring was carried out
from 23 June to 29 June 2006 at the sampling wells, AGM1 to AGM4, AGM6&7,
M1 and M2, R1 and R2, and C1. Due
to the temporary traffic arrangement, access to AGM5 was not available during
the baseline monitoring period.
Thus, alternative location, AGM5a, was identified. However, due to the site constraint,
AGM5a could only be located within the outside the excavation area but at the site
boundary near the recharge area near Zone F as shown in Annex 1. Monitoring at AGM5a was carried
out from 6 July to 12 July 2006.
Baseline monitoring at M3 and C3 has
been scheduled from 24 January 2007 to 30 January 2007.
5.1.1
Sampling
Frequency
Groundwater samples from the wells
were collected daily for 7 consecutive days in accordance with the KSL EM&A
manual.
5.1.2
Testing
Parameters
With reference to KSL EIA report, within KDB400 site, only the concentration of contaminant of Mercury (Hg) was found to exceed the discharge limit as stipulated in TM at KSD100/DHEPZ113 and TPH was present in the groundwater at KSD100/DHEPZ113 and KSD100/DHE120. KSL report also shows that the concentrations of Cd, Cu, Pb and Zn at KSD100/DHEPZ113 and Cd at KSD100/DHE120 were close to the discharge limits. Therefore groundwater samples were tested for the parameters as listed in Table 5-3. Table 5-3 also shows the reporting limits and analytical methods of the parameters to be tested. All the analytical works, except pH and Temperature, will be carried out by HOKLAS accredited laboratory. All the surplus groundwater generated from the sampling works will be recharged to the same location.
|
Parameters |
Monitoring Well |
Analytical Method |
Reporting Limit1 (mg/L) |
TM-Water effluent limit2
for inshore waters of VHWCZ (mg/L) |
|
Groundwater
Level |
AGM1 to AGM7, R1
to R2, M1 to M3, C1 and C3 (14 wells) |
In
house |
0.1m |
--- |
|
pH |
In
house |
0.1unit |
6-9 |
|
|
Temperature
°C |
In
house |
0.1°C |
< 40°C |
|
|
TPH
C6 – C9 |
USEPA8015 |
20 mg/L |
--- |
|
|
TPH
C10–C14 |
25 mg/L |
--- |
||
|
TPH
C15 – C28 |
25 mg/L |
--- |
||
|
TPH
C29 – C36 |
25 mg/L |
--- |
||
|
Cd |
USEPA6020 |
0.0002 |
0.001 |
|
|
Cu |
AGM1
to AGM6, R1, M1, C1 and C3 (10 wells) |
0.001 |
0.1 |
|
|
Pb |
0.001 |
0.1 |
||
|
Zn |
0.01 |
0.1 |
||
|
Hg |
APHA3112B |
0.0005 |
0.001 |
|
|
Total Toxic Metals |
N/A |
N/A |
N/A |
0.2 |
Notes:
1.
Lowest detection limits could be achieved by
common commercial laboratories in Hong Kong. For those substances not detected using these detection
limits, it is assumed that such substances do not exist in the water sample.
2.
As the maximum dewatering rate is 3,200m3/day, Subject to actual flow of
the groundwater to be discharged or the groundwater discharge license obtained
from EPDthe
discharge limits for the flow band of >3,000 and ≤4,000 3,200m3/day are adopted.
Table 5-3 Baseline
Groundwater Testing Parameters
Impact
monitoring will be carried out at monitoring well, control well and, where
appropriate, inlet of recharge well or outlet of treatment facilities according
to Table 4-2 as mentioned in Section 4 during the recharge operation.
5.2.1
Sampling
Frequency
Weekly
monitoring of groundwater quality at the monitoring well, inlet of recharge
wells/outlet of treatment facilities and control wells will be carried out
during the recharging operation.
Groundwater level at the monitoring wells and control wells will also be
monitored on a daily basis.
5.2.2
Testing
Parameters
As the baseline monitoring results show that only the concentration of TPH in the groundwater does not comply with discharge limit as stipulated in TM (details are mentioned in Section 6), monitoring parameters will only include groundwater level and TPH during the impact monitoring stage. The analytical method and detection limit will be the same as mentioned in Table 4-1.
5.3.1
Requirements
of Monitoring Wells
Following are the general requirements of the groundwater monitoring wells:
§
Monitoring
wells should be constructed to the depth of at least 3m below groundwater
table.
§
A well
pipe should be placed within a borehole for the formation of well.
§
The
well pipe should comprise a well casing and a well screen with an inner
diameter of 75mm. The materials
for well casing and well screen should be inert not reacting with, releasing
and adsorbing contaminants.
§
The
well screen, which is the bottom part of the well pipe, should be formed from
the bottom end of the monitoring well to the depth of ground water table. The well screen should be a slotted
pipe that allows water flow into the well without allowing the entrance of soil
particles into the well causing build up of sediment in the well.
§
The well
screen should be surrounded by granular material (filter pack) such as gravel
in the annular space of the borehole.
§
The
well casing should be a solid walled pipe that connects the well screen with
the ground surface.
§
Approximate
1m bentonite seal should be placed around the well casing at the annular space
of the borehole above the sampling zone of the well screen to prevent migration
of contaminants. Above the
bentonite seal, the annular space of the borehole should be grouted with
cement, bentonite or water slurry.
§
A
concrete pad should be constructed at the ground surface around the well
casing.
§
Sampling
cap and bottom cap should be provided at the top and bottom end of the well
pipe.
§
A
concrete security casing with lockable cover should be installed at the ground
surface for protecting the monitoring well.
§
Following
the installation, the well should be developed using pump, bailer or surge
block to remove any materials or contaminants that might have entered the well
during installation and from filter pack.
Development should be continued until the water is visibly clean.
§
After
development of the monitoring well, sufficient time for equilibrium should be
allowed.
Typical installation details of
groundwater monitoring well are shown in Annex 5.
5.3.2
Groundwater
Sampling
§
Prior
to any groundwater sampling, purging will be carried out for removing stagnant
water. No sample will be collected
from the well that is not purged within 24 hours.
§
During
groundwater purging, at least three volume of groundwater in the well will be
purged. The pumping rate for
purging will less than the pumping rate in developing the monitoring well.
§
The
presence of floating product and its thickness will be recorded at each
sampling point before and after groundwater purging.
§
Samples
may be taken by pump or Teflon/stainless steel downhole bailer. Sampling equipment should be
decontaminated between sampling locations using distilled water.
All the groundwater samples collected should be transferred to clearly labelled and pre-cleaned sample containers with necessary preservatives immediately after collection. The sample containers should be provided by HOKLAS accredited laboratory. Sufficient quantity of samples should be collected for all laboratory analyses. Following sampling, samples should be stored in a cool box at temperature of between 0 and 4 oC, and transported to the laboratory within the sample retention time as advised by the laboratory under proper chain-of-custody system.
Table 6-4 summarises average value of the baseline monitoring results at each sampling location throughout the sampling period. Detailed baseline monitoring results are given in Annex 6.
|
|
Discharge Limit |
AGM1 |
AGM2 |
AGM3 |
AGM4 |
AGM6 |
AGM7 |
R1 |
AGM5a |
R2 |
M1 |
M2 |
C1 |
|
|
Temperature |
Average |
< 40°C |
27.2 |
26.9 |
26.6 |
27.4 |
26.5 |
26.9 |
27.2 |
26.2 |
26.7 |
26.5 |
25.6 |
26.2 |
|
Range |
27.1 – 27.4 |
26.7 – 27.2 |
26.4 – 27.1 |
27.0 – 27.9 |
26.0 – 27.0 |
26.4 – 27.5 |
27.1 – 27.4 |
26.0 – 26.3 |
26.3 – 27.0 |
26.2 – 26.9 |
25.3 – 26.0 |
25.4 – 26.7 |
||
|
pH |
Average |
6-9 |
7.6 |
7.4 |
7.5 |
7.7 |
7.5 |
7.5 |
7.6 |
8.1 |
7.8 |
7.8 |
7.5 |
7.6 |
|
Range |
7.6 – 7.8 |
7.2 – 7.5 |
7.4 – 7.6 |
7.6 – 7.8 |
7.4 – 7.5 |
7.4 – 7.6 |
7.6 – 7.8 |
8.1 – 8.1 |
7.4 – 8.1 |
7.5 – 8.2 |
7.3 – 7.8 |
7.6 – 7.7 |
||
|
Groundwater Level |
Average |
- |
2.0 |
2.3 |
2.5 |
1.4 |
2.1 |
2.4 |
2.1 |
2.1 |
2.8 |
2.2 |
5.0 |
2.4 |
|
Mercury |
Average |
1 |
0.50 |
0.50 |
0.50 |
0.50 |
0.50 |
N/A |
0.50 |
0.50 |
N/A |
0.50 |
N/A |
0.50 |
|
Range |
0.5 – 0.5 |
0.5 – 0.5 |
0.5 – 0.5 |
0.5 – 0.5 |
0.5 – 0.5 |
N/A |
0.5 – 0.5 |
0.5 – 0.5 |
N/A |
0.5 – 0.5 |
N/A |
0.5 – 0.5 |
||
|
Cadmium |
Average |
1 |
0.23 |
0.27 |
0.20 |
0.23 |
0.21 |
0.76 |
0.20 |
0.20 |
0.23 |
0.40 |
0.43 |
0.50 |
|
Range |
0.2 – 0.3 |
0.2 – 0.5 |
0.2 – 0.2 |
0.2 – 0.3 |
0.2 – 0.3 |
0.4 – 1.0 |
0.2 – 0.2 |
0.2 – 0.2 |
0.2 – 0.4 |
0.2 – 1.0 |
0.2 – 0.5 |
0.2 – 1.0 |
||
|
Copper |
Average |
100 |
3.3 |
7.7 |
2.0 |
1.3 |
1.0 |
N/A |
3.4 |
1.0 |
N/A |
2.7 |
N/A |
2.9 |
|
Range |
1 – 7 |
1 – 20 |
1 – 4 |
1 – 2 |
1 – 1 |
N/A |
2 – 6 |
1 – 1 |
N/A |
1 – 7 |
N/A |
2 – 5 |
||
|
Lead |
Average |
100 |
34.9 |
42.4 |
13.4 |
38.0 |
7.3 |
N/A |
41.0 |
5.6 |
N/A |
140.1 |
N/A |
139.1 |
|
Range |
11 – 50 |
14 – 97 |
4 – 28 |
8 – 75 |
4 – 23 |
N/A |
26 – 76 |
4 – 8 |
N/A |
26 – 420 |
N/A |
28 – 327 |
||
|
Zinc |
Average |
100 |
51.0 |
63.3 |
13.0 |
12.7 |
10.0 |
N/A |
15.7 |
10.0 |
N/A |
13.4 |
N/A |
24.3 |
|
Range |
19 – 116 |
12 – 156 |
13 – 164 |
10 – 27 |
10 – 10 |
N/A |
10 – 25 |
10 – 10 |
N/A |
10 – 25 |
N/A |
12 – 39 |
||
|
Total
Toxic Metals |
Average |
200 |
89.9 |
114.2 |
29.1 |
52.7 |
19.1 |
0.76 |
60.8 |
17.3 |
0.23 |
157.1 |
0.43 |
167.3 |
|
Range |
34.7 – 163.7 |
28.7 – 236.7 |
18.7 – 196.7 |
19.7 – 104.8 |
15.7 – 34.8 |
0.4 – 1.0 |
42.7 – 107.7 |
15.7 – 19.7 |
0.2 – 0.4 |
37.7 – 453.5 |
0.2 – 0.5 |
42.7 – 372.5 |
||
|
TPH
C6 – C9 |
Average |
- |
20.00 |
22.86 |
20.00 |
20.00 |
20.00 |
78.43 |
76.43 |
60.57 |
20.14 |
133.71 |
120.00 |
54.14 |
|
Range |
20 – 20 |
20 – 40 |
20 – 20 |
20 – 20 |
20 – 20 |
20 – 107 |
20 – 188 |
30 – 124 |
20 – 21 |
30 – 237 |
20 – 199 |
20 – 118 |
||
|
TPH
C10–C14 |
Average |
- |
36.86 |
61.29 |
40.14 |
33.14 |
26.57 |
89.29 |
197.29 |
30.57 |
90.14 |
53.00 |
79.57 |
49.86 |
|
Range |
25 – 78 |
25 – 166 |
25 – 58 |
25 – 45 |
25 – 36 |
64 – 123 |
25 – 588 |
25 – 42 |
32 – 262 |
29 – 80 |
59 – 102 |
38 – 62 |
||
|
TPH
C15 – C28 |
Average |
- |
189.86 |
431.71 |
313.86 |
136.71 |
150.29 |
264.14 |
374.86 |
784.43 |
285.86 |
310.43 |
255.71 |
409.86 |
|
Range |
53 – 342 |
183 – 971 |
122 – 448 |
25 – 235 |
67 – 210 |
206 – 301 |
154 – 797 |
651 – 913 |
101 – 552 |
180 – 533 |
188 – 318 |
215 – 580 |
||
|
TPH
C29 – C36 |
Average |
- |
58.71 |
136.14 |
128.14 |
31.00 |
26.00 |
63.00 |
87.00 |
30.43 |
217.43 |
43.00 |
39.57 |
41.00 |
|
Range |
25 – 138 |
40 – 335 |
52 – 214 |
25 – 48 |
25 – 29 |
48 – 110 |
25 – 123 |
25 – 40 |
32 – 506 |
25 – 53 |
26 – 52 |
35 – 45 |
||
|
TPH (Total) |
Average |
- |
305.4 |
652.0 |
502.1 |
220.9 |
222.9 |
494.9 |
735.6 |
906.0 |
613.6 |
540.1 |
494.9 |
554.9 |
|
Range |
123 – 547 |
273 – 1492 |
219 – 740 |
95 – 331 |
137 – 291 |
346 – 588 |
224 – 1528 |
738 – 1009 |
185 – 1311 |
300 – 768 |
302 – 616 |
351 – 696 |
||
Notes:
1.
All results units are in mg/L except for groundwater
level. Groundwater level is in
mPD.
2.
No groundwater level limit is stipulated in TM.
3.
TPH is prohibited substance according to TM.
4.
N/A – Testing of the parameters was not carried out. Referring to Section 5.1,, the parameters are not of concern
at the relevant locations.
Table 6-4 Summary
of Baseline Groundwater Monitoring Results
Baseline
monitoring results show that the average concentrations of Hg, Cd, Cu, Pb and Zn
and average concentrations of total toxic metals at AGM1 to AGM4 and AGM6, and
average concentration of Cd at AGM7 comply with their respective discharge
limits of the flow band (of >3000 and ≦4000 m3/day,
(i.e. the
maximum dewatering rate) as stipulated in the TM.
TPH was found in the groundwater samples from all of the monitoring wells. The average concentrations of TPH were found from the range of 220.9mg/L to 906.5mg/L. The highest average TPH concentration is found at AGM5a which is located within the recharge area near Zone F. AGM5a is outside the tunnel footprint and no water at AGM5a will be dewatered. The average TPH concentrations at R1 and R2 are 735.6mg/L and 613.6mg/L respectively.
It is found that the average TPH concentrations at ambient groundwater monitoring wells, AGM4 and AGM6, are better than that of R1. However, it is found that average TPH (C15-C28 and C29-C36 at AGM2 and C29-C36 at AGM3) concentrations are higher than those of R1. Moreover, average TPH (C6-C9) concentration at AGM7 is higher than that of either R1 or R2.
AGM2 and AGM3 can represent groundwater quality of Zones F and G. AGM6 and AGM7 represents groundwater quality of Zone D+E and AGM7 represents groundwater quality of Zones A and B+C. Thus, groundwater from all Zones should be treated prior to recharge in order to avoid affecting the groundwater quality at the recharge area. Details of the requirements of treatment facility are discussed in Section 8.
The
baseline monitoring results show that TPH and heavy metals wasere found across the
site area to the north of the old seawall at KDB400. However, the average
concentrations of individual metals and total toxic metals at relevant sampling locations, except for the average concentration of lead at C1, comply
with respective discharge limits as stipulated in the TM. As
mentioned in Section 4.1, the old seawall would potentially restrict the
migration of contaminated groundwater from the petrol filling station at Skyway
House to the south of the seawall.
Moreover, there was no potential contaminated area identified at the
site areas to the south of the seawall at KDB400 in the KSL EIA report. Thus, it is considered that the extent
of the contamination of groundwater is from the old seawall to the northern end
of KDB400 site.
Limit Levels for the impact monitoring have been developed based on the ambient water quality measurement. Reference is also made to the approach for determining Action and Limit (A/L) Levels in Appendix D2 to the Environmental Monitoring and Audit Guidelines for Development Projects in Hong Kong (EPD, February 1998) and KSL EM&A manual for the inlet of recharge wells/outlet of treatment facilities. The Limit Levels for R1 and R2 of where impact monitoring will be carried out are shown in Table 7-5.
|
Parameters |
Limit Level (95 percentile of baseline data) |
|
|
R1 |
R2 |
|
|
TPH (C6-C9) |
165.5 |
20.7 |
|
TPH (C10-C14) |
531.3 |
227.2 |
|
TPH (C15-C28) |
711.5 |
543.9 |
|
TPH (C29-C36) |
118.8 |
497.3 |
Note: Exceedance is considered valid only if there is no justification from the monitoring at the control well.
Table 7-5 Limit Levels of TPH at Recharge Wells/Outlet of Treatment Facilities
Monitoring wells will be used to ensure there is no
likelihood of local risen of and transfer of pollutant beyond the site boundary. The limit levels for the groundwater level and TPH
at monitoring wells
As groundwater level monitoring at recharge wells
is not practicable, groundwater level monitoring will be carried out at
monitoring wells.
Limit Levels for groundwater level at monitoring well are
shown in Table 7-6. In order to
monitor the natural variation of groundwater, water level at control well will
also be monitored.
|
Parameters |
Limit Level |
|||
|
M1 |
|
M2a |
M3 |
|
|
Groundwater level |
3.2 |
3.1 |
6.0 |
To be Determined |
|
TPH (C6-C9) |
284.4 |
148.8 |
238.8 |
To be Determined |
|
TPH (C10-C14) |
96 |
50.4 |
122.4 |
To be Determined |
|
TPH (C15-C28) |
639.6 |
1095.6 |
381.6 |
To be Determined |
|
TPH (C29-C36) |
63.6 |
48 |
62.4 |
To be Determined |
Notes:
1.
Exceedance is considered valid only if there is no
justification from the monitoring at the control well.
2.
Limit
level for groundwater level is 1m above baseline level.
3. Limit level for TPH is 120% of the maximum concentration of the baseline monitoring. As M2a is close to M2, baseline monitoring results of M2 is considered representative for establishing the limit level of M2a. Otherwise, baseline monitoring at M2a is required to determine the limit level prior to the impact monitoring.
Table 7-6 Limit
Levels of Groundwater Level at Monitoring
Wells
In case of any exceedance of
Limit Levels, actions in accordance with the event and action plan as shown in
Table 7-7 should be taken.
|
Event |
Action |
|||
|
ET Leader |
IEC |
ER |
Contractor |
|
|
Groundwater level exceeds 1m from baseline Level |
· Notify IEC and the Contractor. · Carry out investigation. · Report the results of investigation to IEC and the Contractor. · Discuss with the Contractor and formulate remedial measures. · Increase monitoring frequency to check mitigation measures. |
· Review with analysed results submitted by ET. · Review the proposed remedial measures by the Contractor and advise ER accordingly. · Supervise the implement of remedial measures. |
· Confirm receipt of notification of exceedance in writing. · Notify the Contractor. · Require the Contractor to propose remedial measures for the analysed groundwater problem. · Ensure remedial measures are properly implemented. |
· Reduce the recharge rate AND / OR · Suspend the recharge until the groundwater level falls back to less than 1m difference with the baseline |
|
Limit Level Exceedance for TPH |
· Notify IEC and the Contractor. · Carry out investigation. · Report the results of investigation to IEC and the Contractor. · Discuss with the Contractor and formulate remedial measures. · Increase monitoring frequency to check mitigation measures. |
· Review with analysed results submitted by ET. · Review the proposed remedial measures by the Contractor and advise ER accordingly. · Supervise the implement of remedial measures. |
· Confirm receipt of notification of exceedance in writing. · Notify the Contractor. · Require the Contractor to propose remedial measures for the analysed groundwater problem. · Ensure remedial measures are properly implemented. |
· Suspended the recharge OR ·
Treatment of the recharged
groundwater until monitoring result shows the compliance of Limit Level
|
Table 7-7 Event and
Action Plan
Based on the baseline monitoring
results, recharge areas have been identified for recharging the
groundwater. As mentioned in
Section 6, groundwater from all zones is required to be treated prior to
recharge.
It is considered that treatment
process such as chemical enhanced sedimentation, physical filtration and
activated carbon filter should be used to remove the suspended solids and
organics laden in the groundwater.
Groundwater treatment plant with treatment capacity of 40m3/hr
(960 m3/day) will be provided.
Based on the dewatering rates, the numbers of treatment facilities at
different time periods are shown in Table 8-8 below:
|
Period |
Estimated Dewatering Rate,
m3/day |
Number of Treatment
Facilities |
Recharge Area |
|
09 Nov 06 to 15 Nov 06 |
576 |
1 |
Recharge
area at Nam Cheong Park near Zone A |
|
16 Nov 06 to 15 Mar 07 |
192 |
1 |
|
|
16 April 07 to 23 April 07 |
1,440 |
2 |
|
|
24 April 07 to 31 Aug 07 |
480 |
1 |
|
|
23 Mar 07 to 30 Mar 07 |
1,440 |
2 |
Recharge
area adjacent the KSL alignment near the construction site of Olympic City
Phase III near Zone F |
|
1 April 07 to 24 May 07 |
480 |
1 |
|
|
25 May 07 to 31 May 07 |
1,920 |
2 |
|
|
01 June 07 to 22 June 07 |
960 |
1 |
|
|
23 Jun 07 to 30 Jun 07 |
2,688 |
3 |
|
|
01 Jul 07 to 31 Aug 07 |
1,536 |
2 |
|
|
01 Sep 07 to 31 Oct 07 |
1,056 |
2 |
|
|
01 Nov 07 to 30 Nov 07 |
576 |
1 |
Table 8-8 Number of
Treatment Facilities
Each of the treatment plant will
include three treatment components: chemical enhanced sedimentation tank, sand
filter and activated carbon filter.
The schematic process of the groundwater treatment is shown in Figure
8-3. Suspended solids in the
contaminated groundwater will be removed by both chemical enhanced
sedimentation and sand filter to approximate 5mg/L in order to avoid blockage
of activated carbon filter.
Activated carbon filter will be designed to treat the TPH to be half of
the Limit Levels of the recharges wells.
Figure 8- 3 Schematic Process of Groundwater Treatment
It should be noted that baseline monitoring
results of C3 and M3 were not available during the preparation of this working
plan. The baseline monitoring
results of these locations is for comparing with the impact monitoring results
during the impact monitoring stage for evaluating any significant impact of
groundwater by the recharge operation.
The identified recharge wells and, if necessary, appropriate treatment
facilities would not be subject to the baseline monitoring results of C3 and M3. Baseline monitoring results of C3 and
M3 will be submitted to EPD for record prior to any impact monitoring at these
locations (i.e. dewatering works of Zones B+C to G).
This working plan has been prepared
based on the best available information at this stage. Nevertheless, if additional recharge
areas (refer to Section 4.2) and evaluation of contamination of groundwater for
further excavation areas are required, baseline monitoring at additional
sampling wells will be required to determine the suitable recharge well and
ascertain the necessity of treatment prior to groundwater recharge. Additional baseline monitoring and
formulation of impact monitoring including the Limit Level for impact
monitoring would adopt the same approach of this WP.
|
Annex 1 |
|
Locations of Dewatering Areas, Recharge Areas and Monitoring Wells |
|
Annex 2 |
|
Analytical Results of
Five Sampling Location in EIA Stage |
|
Annex 3 |
|
Information of Old Seawall |
|
Annex |
|
|
|
|
|
Annex 5 |
|
Typical Installation Details of Groundwater Monitoring Wells |
|
Annex 6 |
|
Baseline Monitoring Results |
* All Chainages are referred to Site Layout for KDB 400 (Drawing no.: KDB400/HA/Y001 rev A) as given in Annex 2.