1.1 Background to the Project
1.2 Objectives of the EIA
1.3 EIA Approach
1.4 Structure of the Report
2.1 Planning and Development Control Framwork
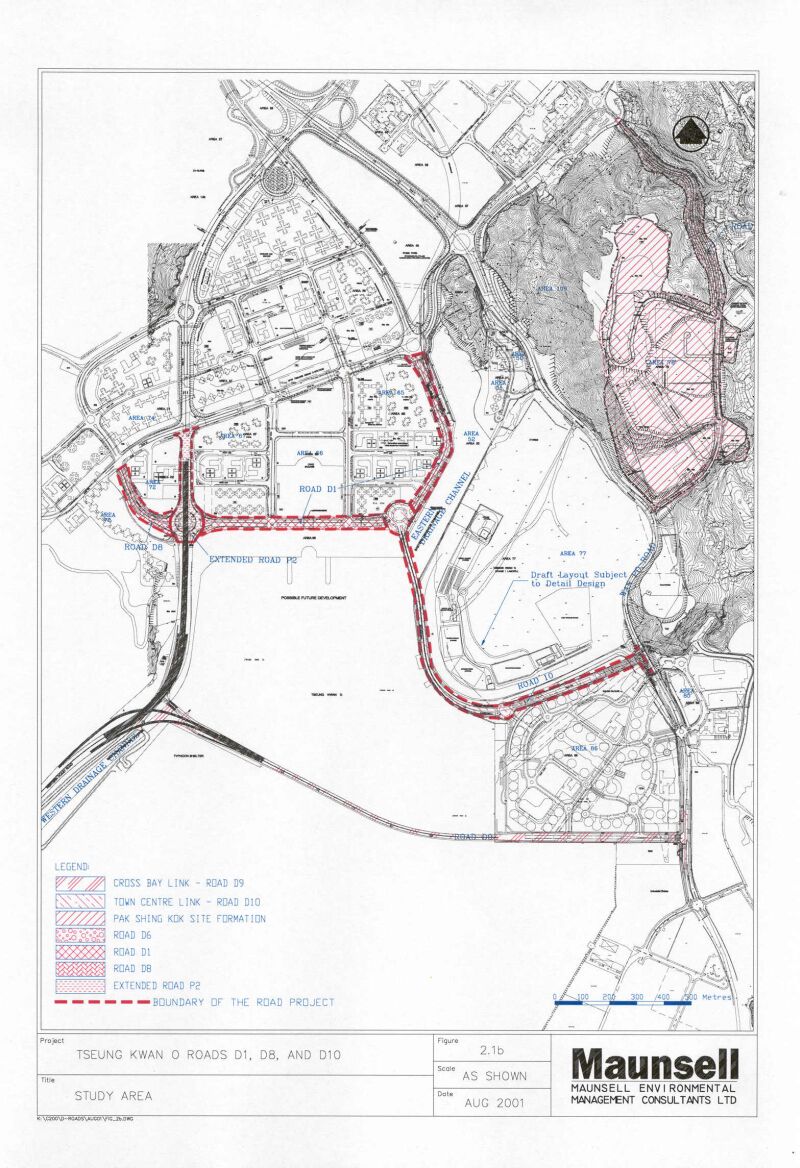
2.2 EIA Study Area
2.3 Study Location
2.4 Construction Methods and Engineering Requirement
2.5 "Without the Project" Scenario
2.6 Consideration of Different Options
3.1 Introduction
3.2 Environmental Legislation, Policies, Plans, Standards and Criteria
3.3 Description of the Environment
3.4 Assessment Methodologies
3.5 Environmental Impact Identification, Prediction and Evaluation
3.6 Mitigation of Adverse Environmental Impacts
3.7 Definition and Evaluation of Residual Environmental Impacts
4.1 Environmental Legislation, Policies, Plans, Standards and Criteria Description of the Environment
4.2 Description of the Environment
4.3 Assessment Methodologies
4.4 Overview of Relevant Studies
4.5 Environmental Impact Identification, Prediction and Evaluation
4.6 Mitigation of Adverse Environmental Impacts
4.7 Definition and Evaluation of Residual Environmental Impacts
5.1 Introduction
5.2 Environmental Legislation, Policies, Plans, Standards and Criteria
5.3 Description of the Environment
5.4 Assessment Methodologies
5.5 Environmental Impact Identification, Prediction and Evaluation
5.6 Mitigation of Adverse Environmental Impacts
5.7 Definition and Evaluation of Residual Environmental Impacts
5.8 Conclusion
6.1 Introduction
6.2 Environmental Legislation, Policies plans and Standards
6.3 Assessment Methodology and Criteria
6.4 Environmental Impact Identification, Prediction and Evaluation
6.5 Mitigation of Adverse Impacts
6.6 Definition and Evaluation of Residual Environmental Impacts
6.7 Conclusions
7. Landfill Gas Hazard Assessment
7.1 Introduction
7.2 Government Legislation and Standards
7.3 Description of the Environment
7.4 Assessment Methodology
7.5 Qualitative Source-Pathway-Target Analysis
7.6 Mitigation Measures
7.7 Monitoring Requirements
7.8 Conclusions
8. LANDSCAPE AND VISUAL IMPACTS
8.1 Introduction
8.2 Environmental Legislation and Guidelines
8.3 Scope and Content of the Study
8.4 Planning and Development Control Framework
8.5 Baseline Study
8.6 Construction Impacts
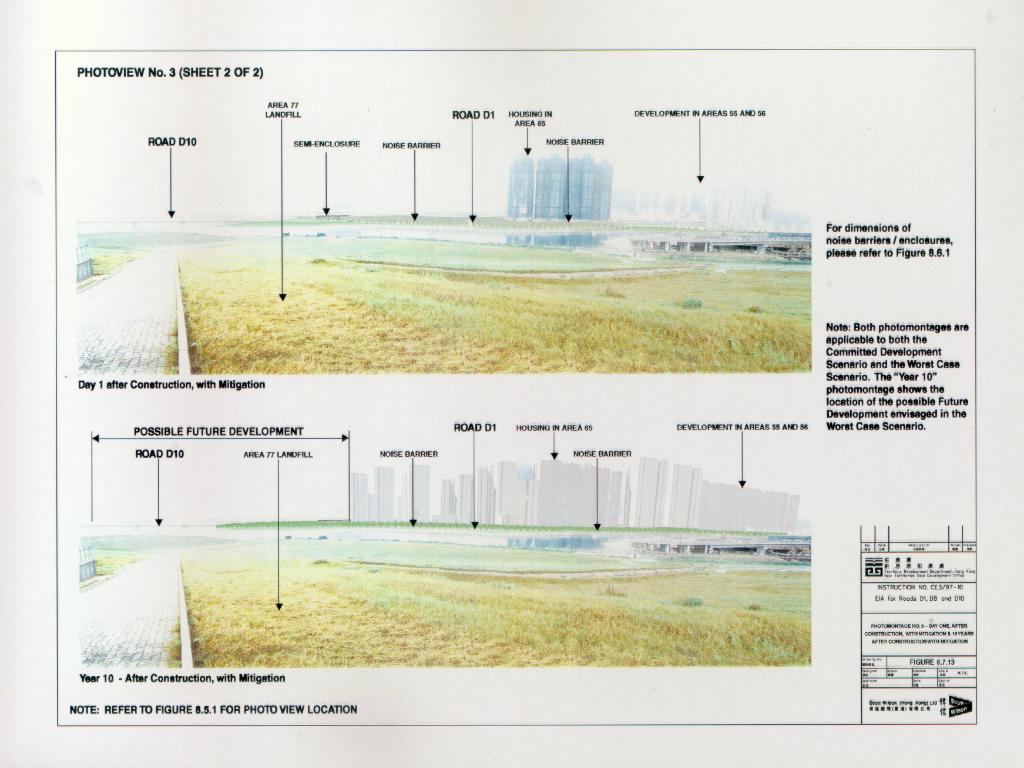
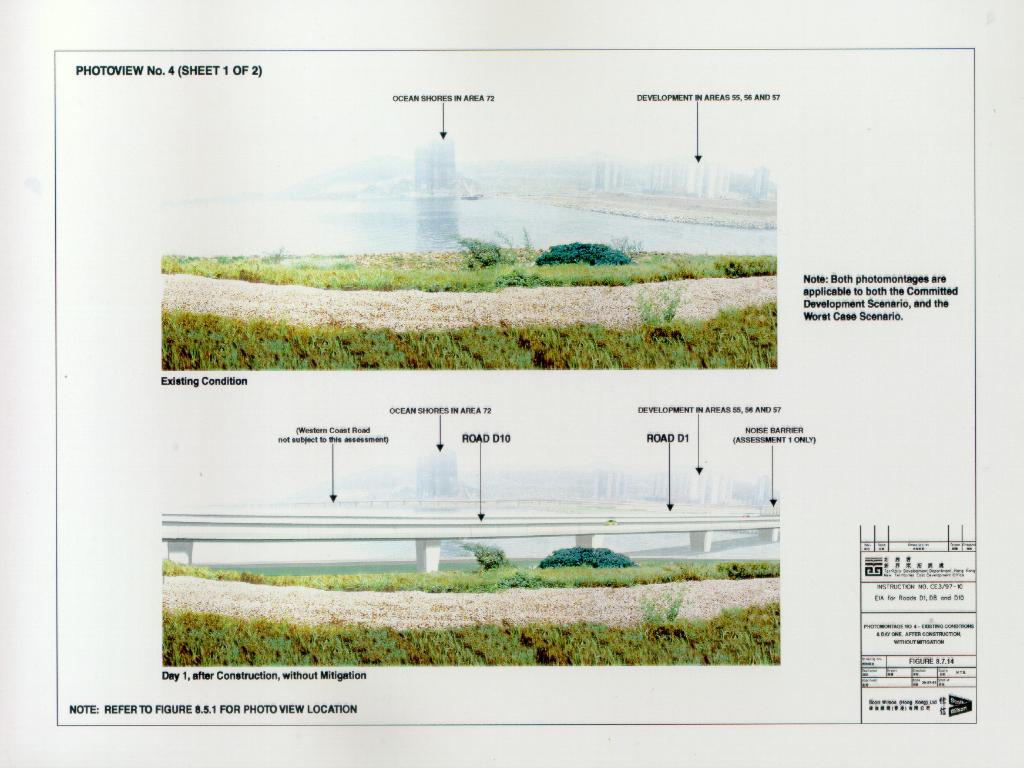
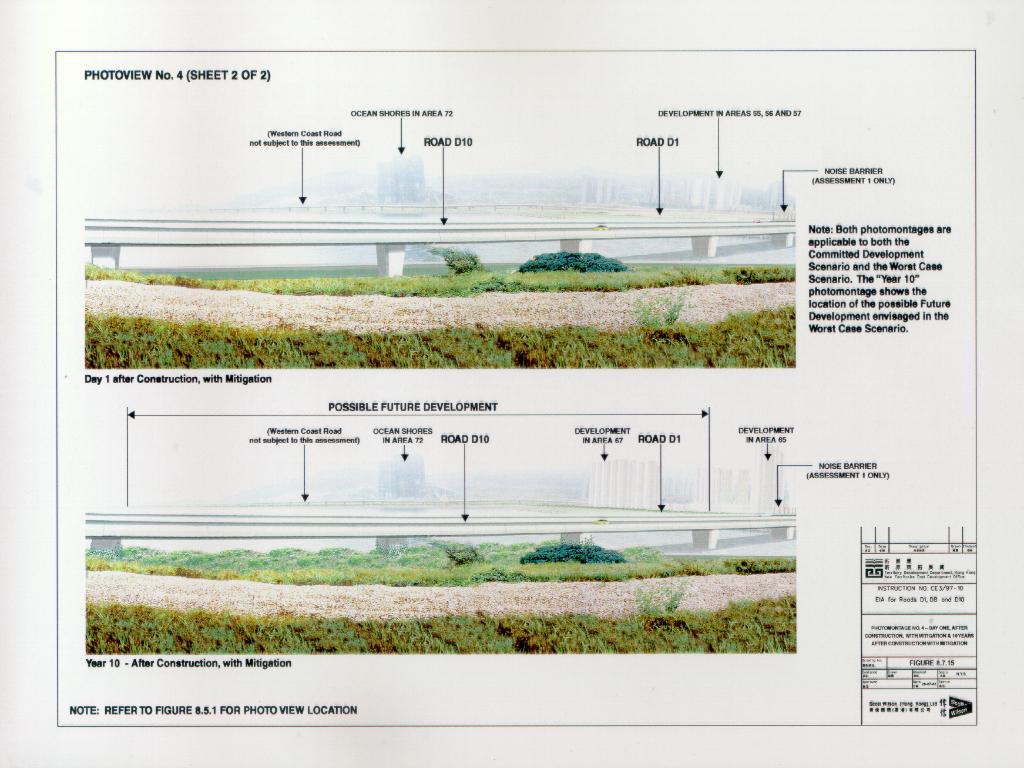
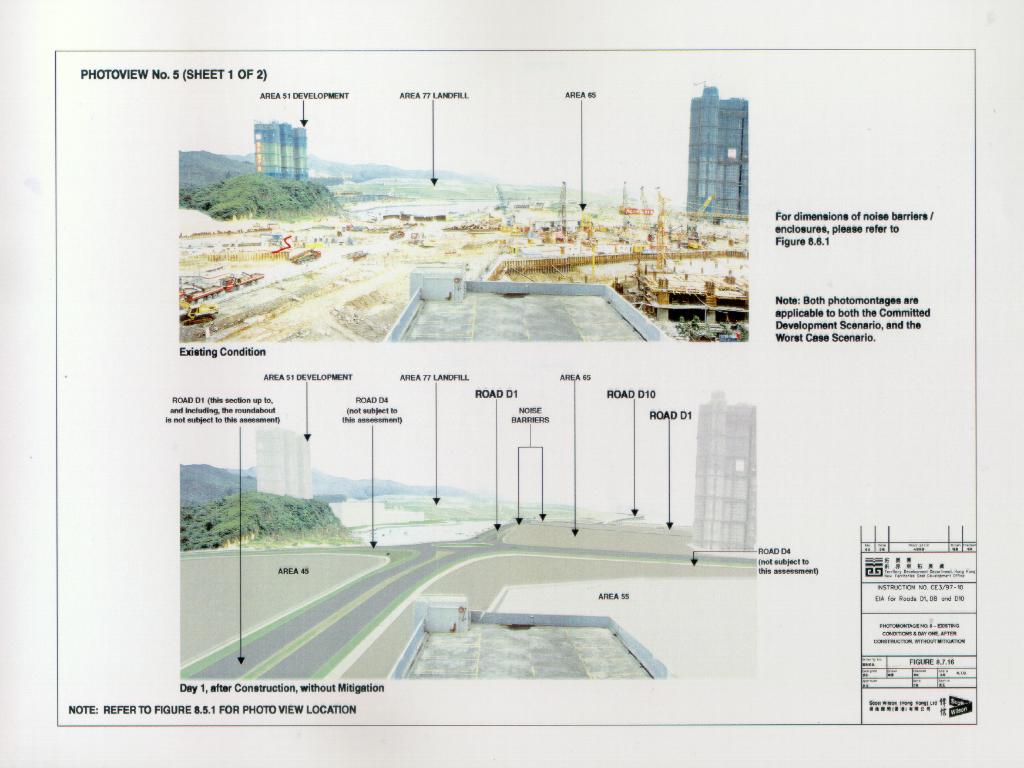
8.7 Operational Impacts
8.8 Conclusions
9. ENVIRONMENTAL MONITORING AND AUDIT
9.1 Existing Legislation and Procedures
9.2 Existing Environment and Baseline Monitoring
9.3 Methodology Proposed and Specification of EM&A Programme
9.4 Environmental Performance Specifications and Action Plans
9.5 Environmental Audit Requirements and Procedures
10.1 Introduction
11.1 Introduction
11.2 Air Quality
11.3 Noise Impacts
11.4 Water Quality
11.5 Solid Waste Management
11.6 Landfill Gas Hazard
11.7 Landscape and Visual Impact
11.8 Environmental Monitoring and Audit
11.9 Key Environmental Outcomes
11.10 Environmental Benefits of the Proposed Noise Mitigation Measures
11.11 Conclusions
appendices
Appendix 3.1 Calculations of Dust Emission Factors
Appendix 3.2 Sample Computer Output of FDM Calculations
Appendix 3.3 Calculations of Emission Factors
Appendix 3.4 Sample Computer Outputs of Caline4 Calculations
Appendix 3.5 Calculations of NO2 Concentration inside the Two Sections
of Deckover on Road D1
Appendix 4.1A Powered Mechanical Equipment (PME) for the Different Construction
Tasks
Appendix 4.1B Construction Noise Assessment for Representative NSRs in Worst Case
Scenario
Appendix 4.2A Traffic Noise Assessment Results – Unmitigated Scenario
Appendix 4.2B Traffic Noise Assessment Results – Mitigated Scenario
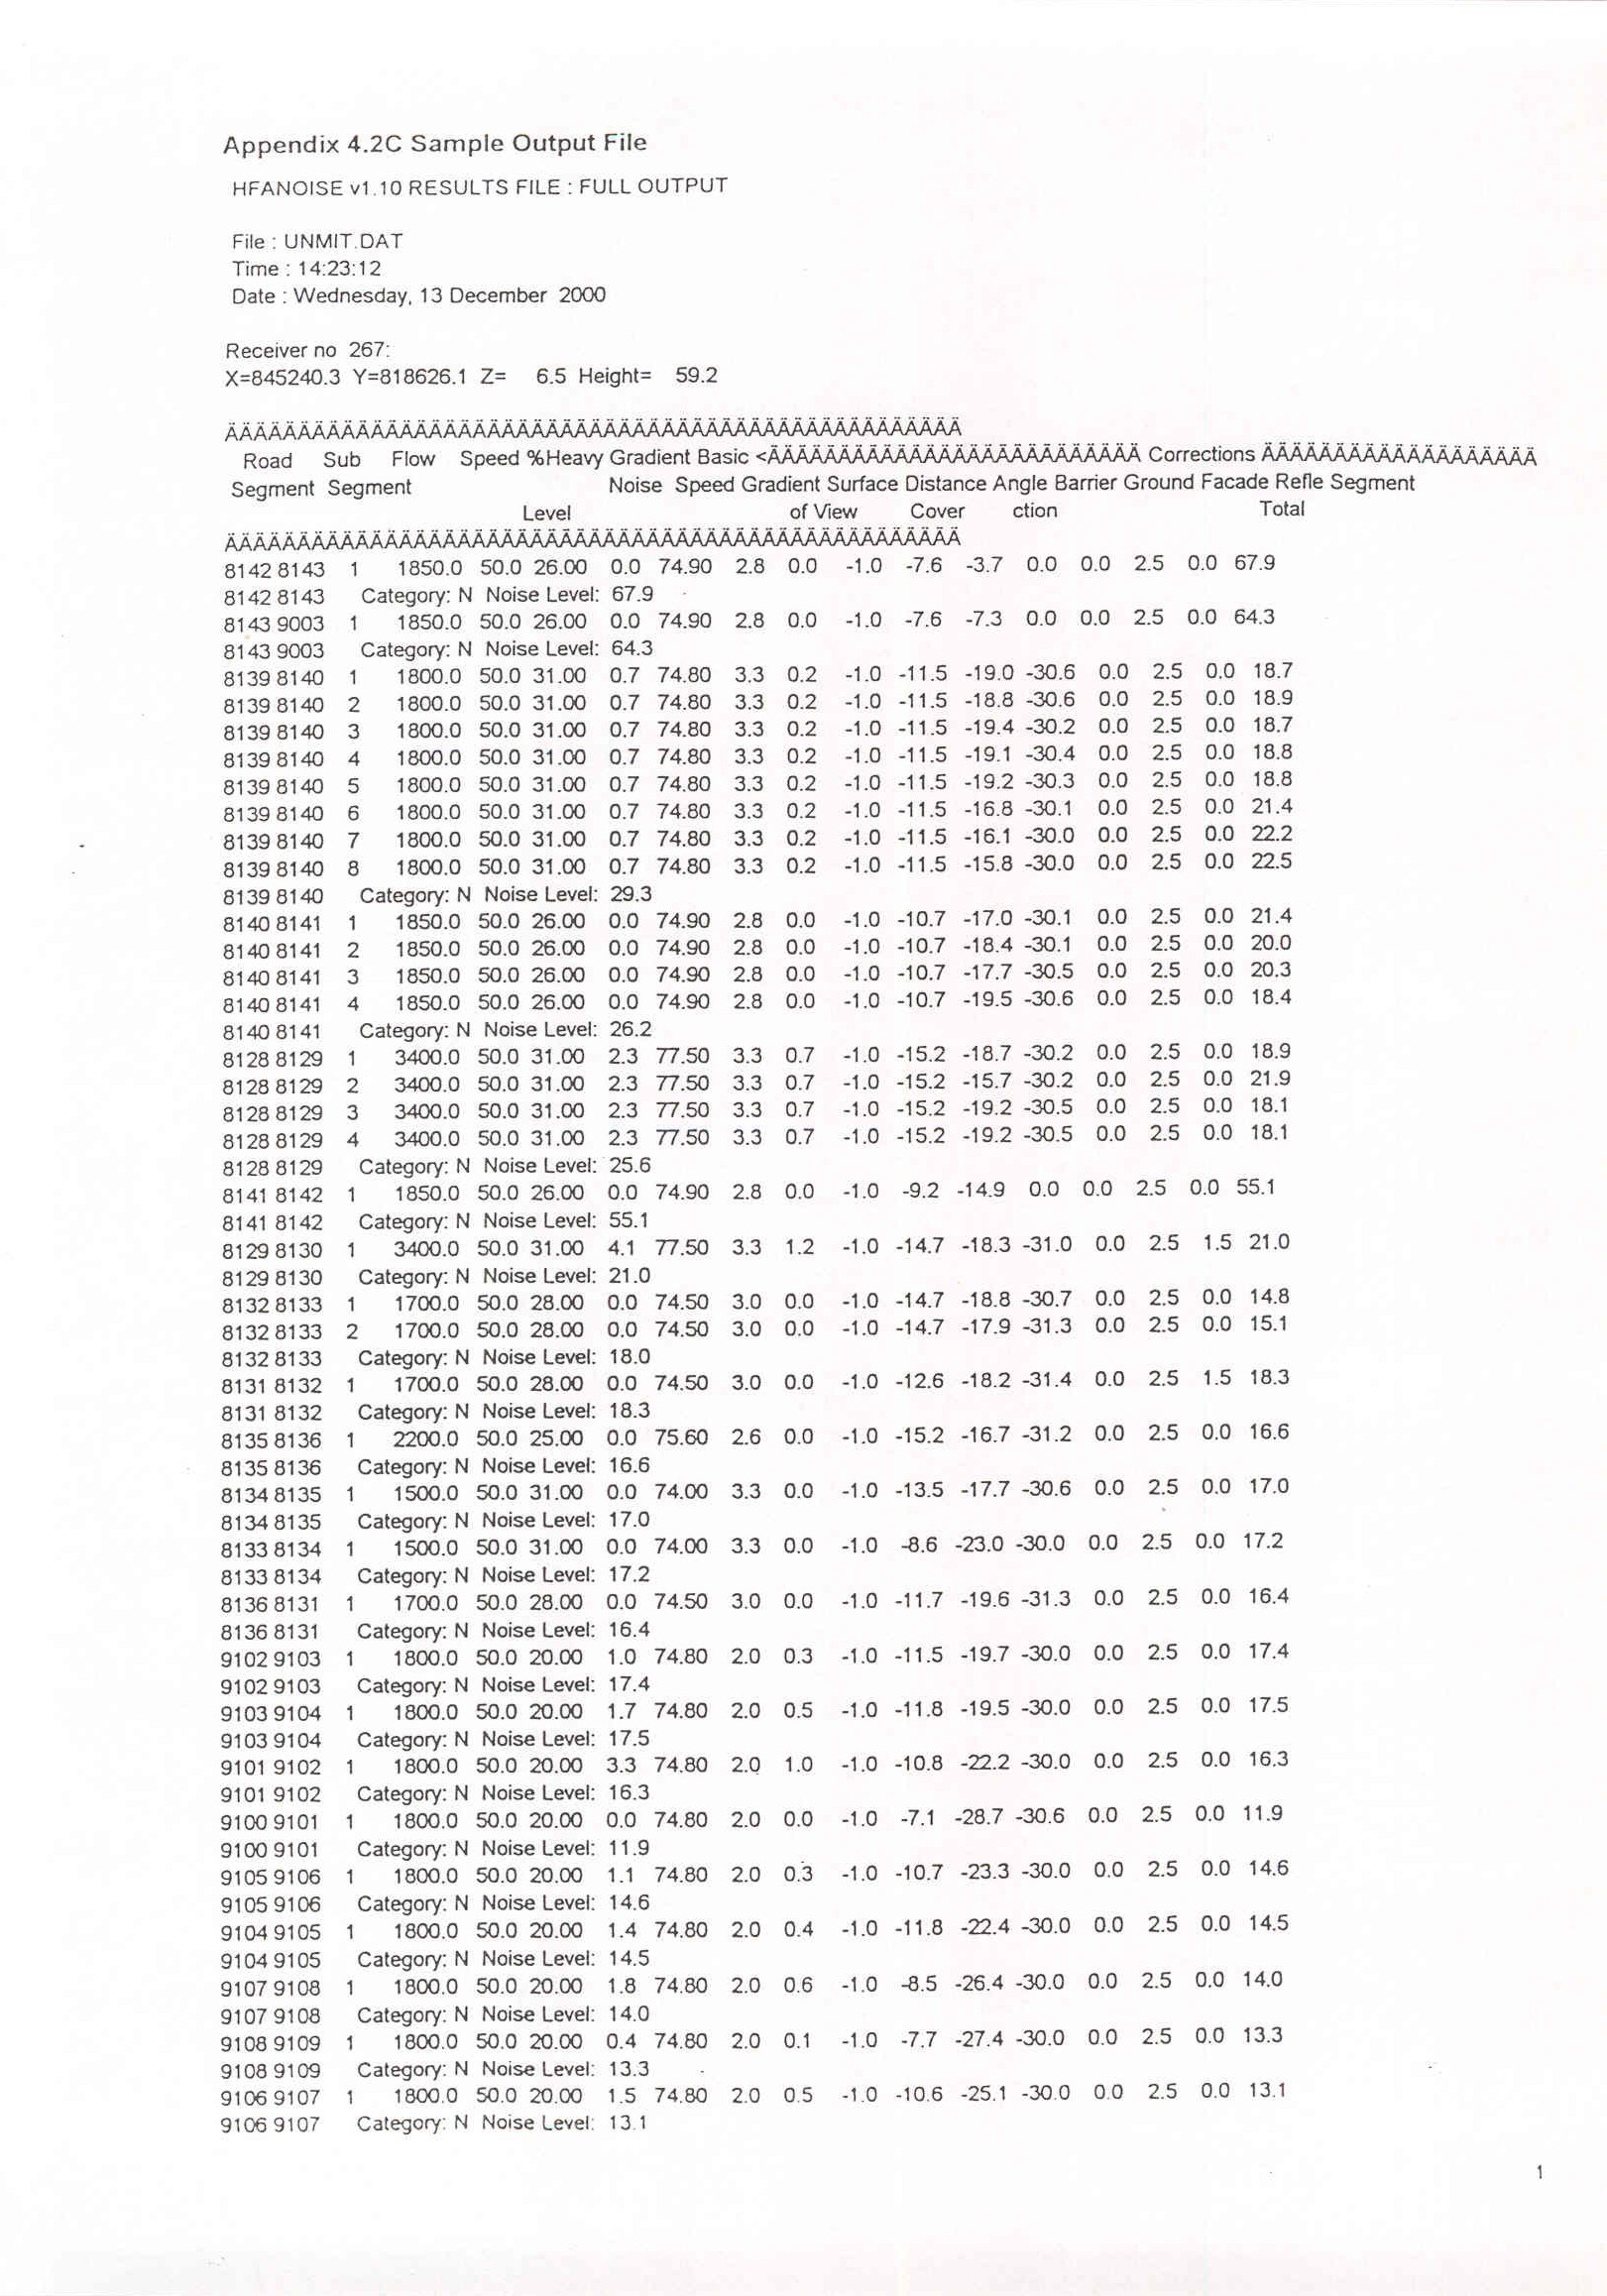
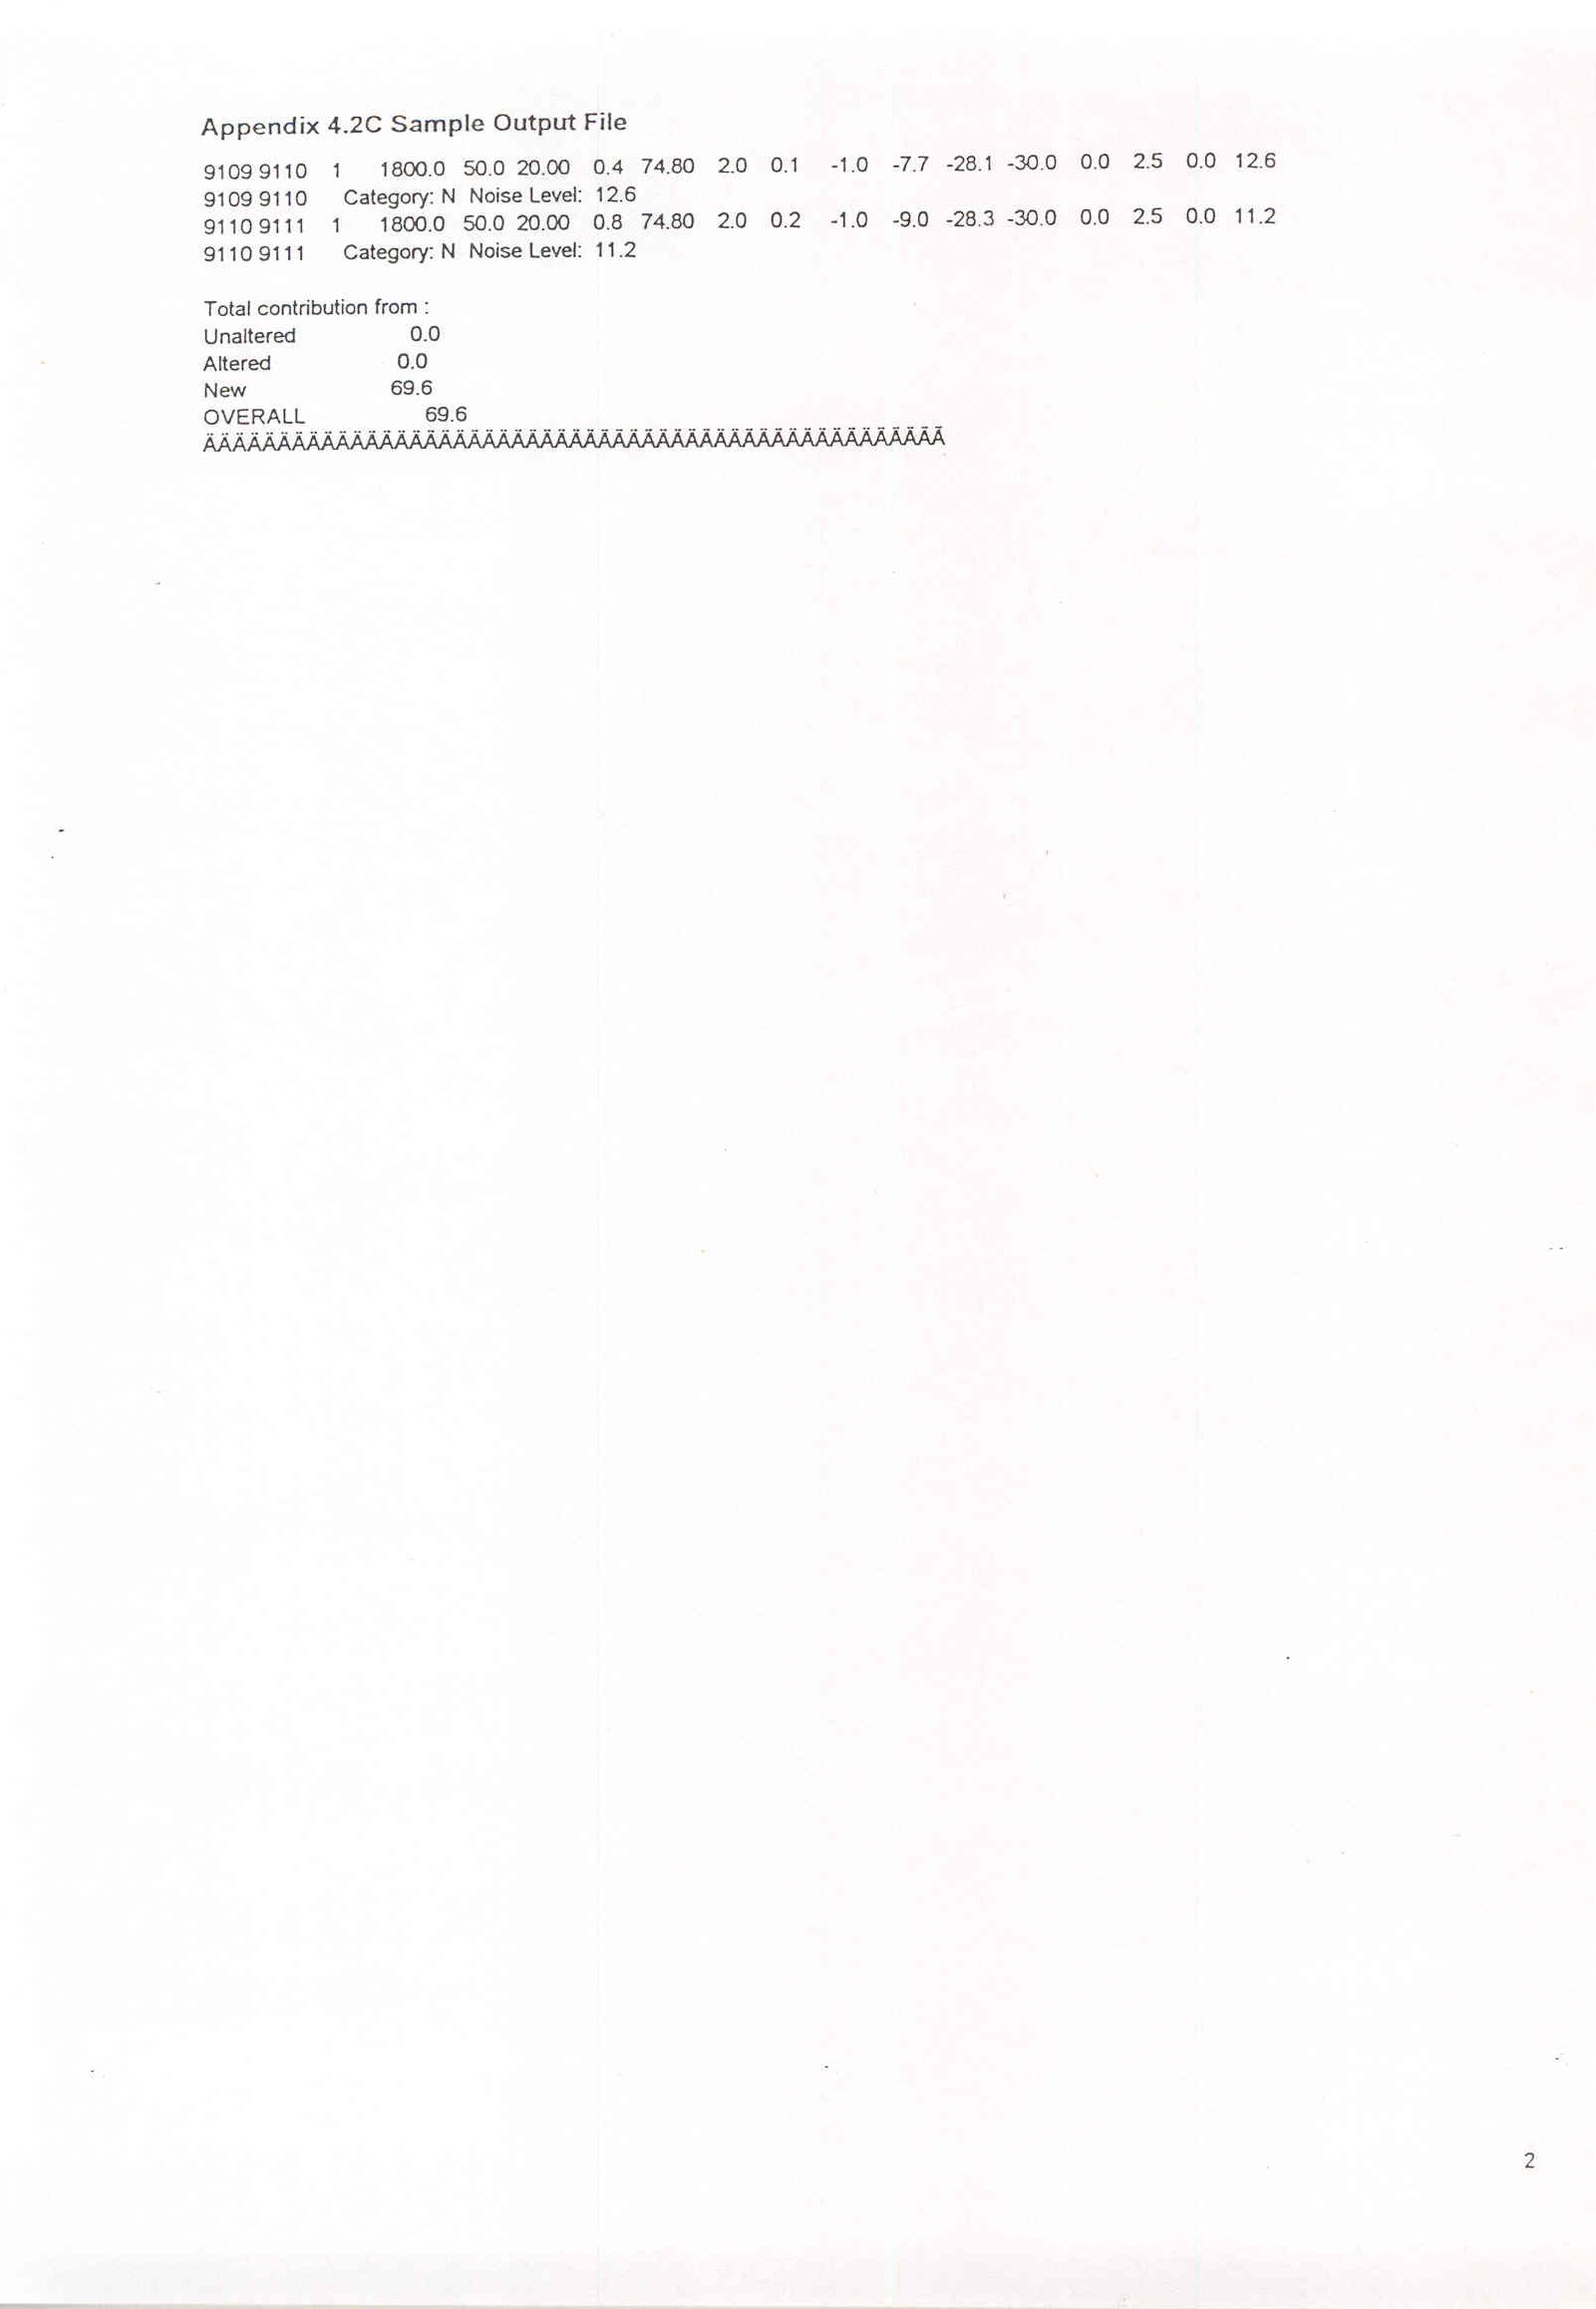
Appendix 4.2C Sample Output File (Sheet 1,
2)
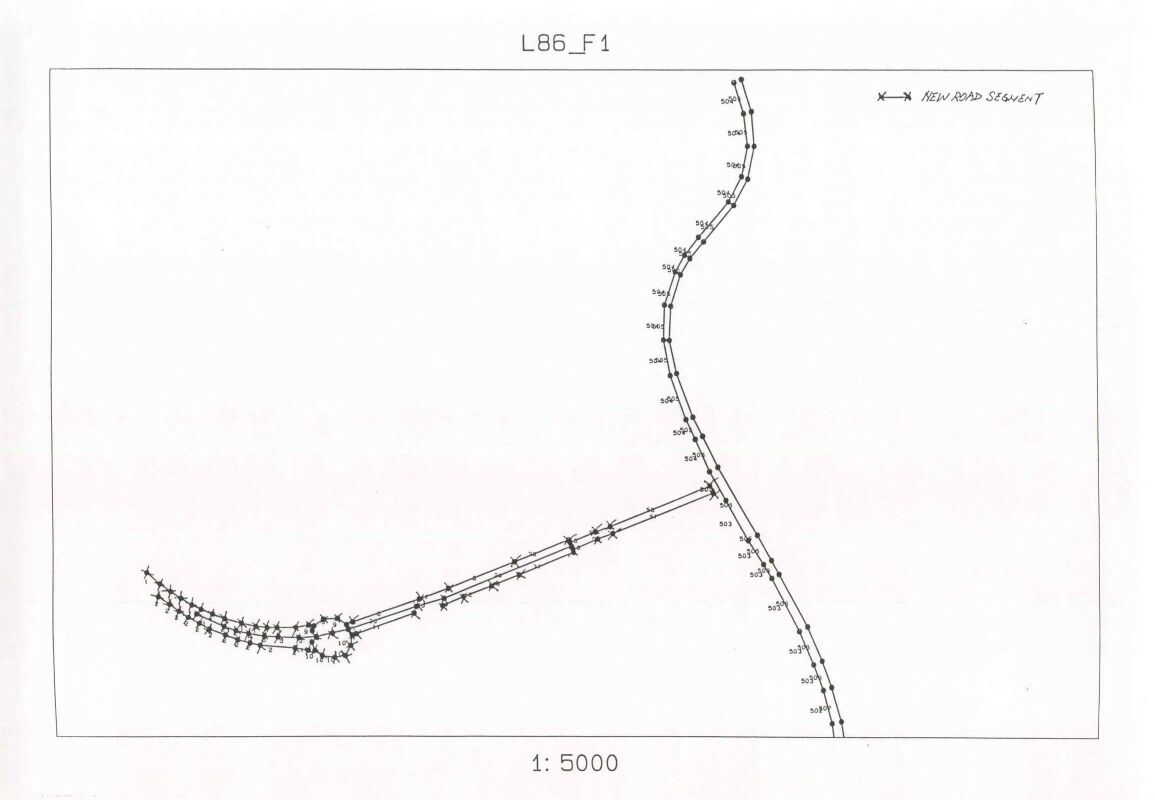
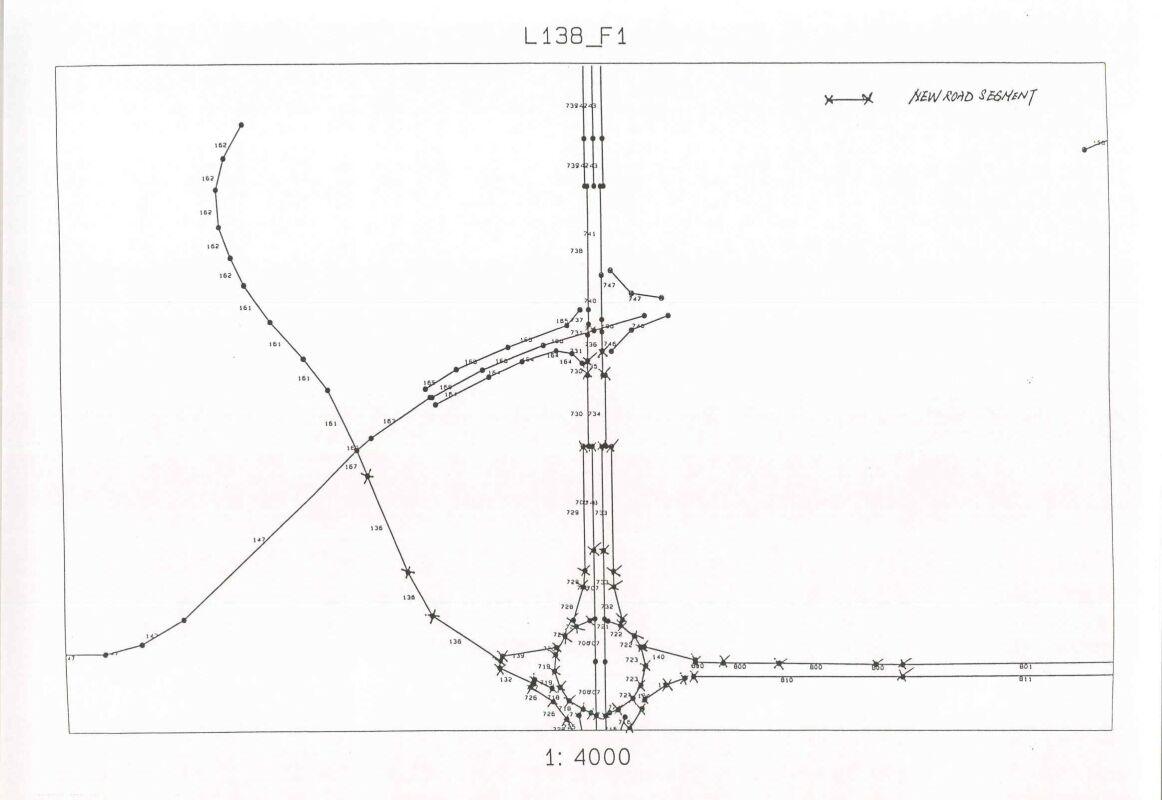
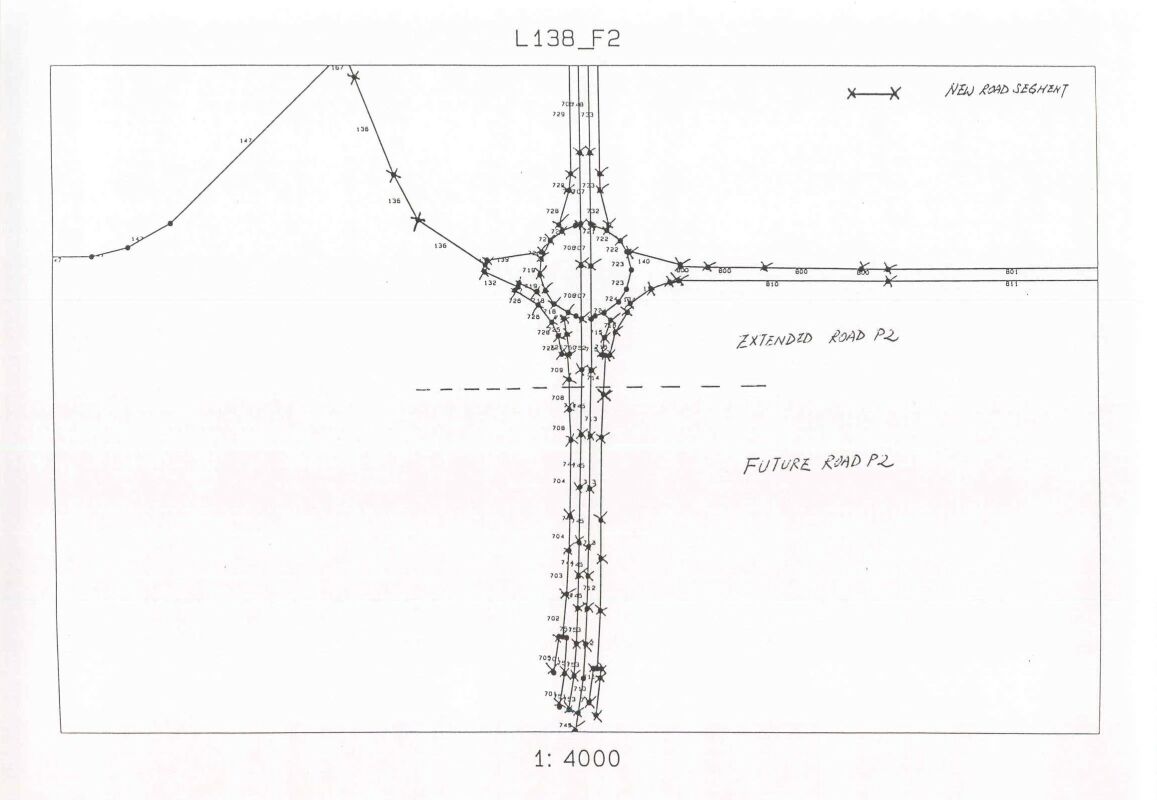
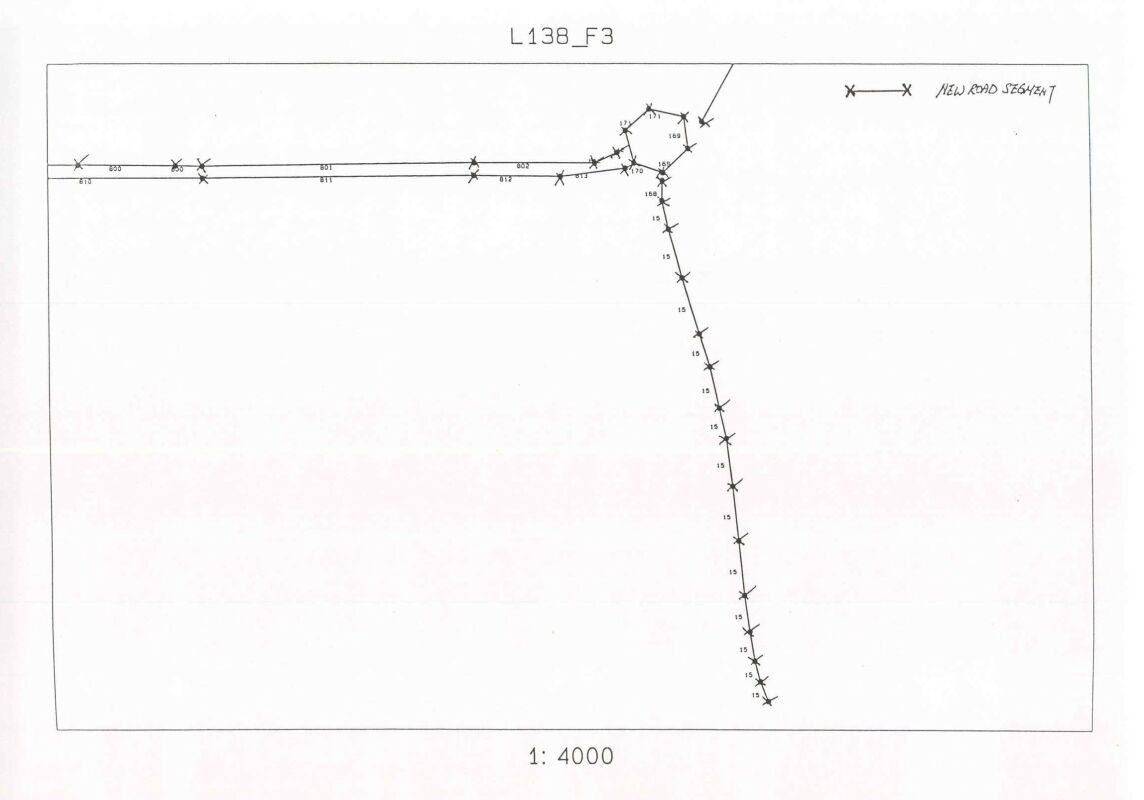
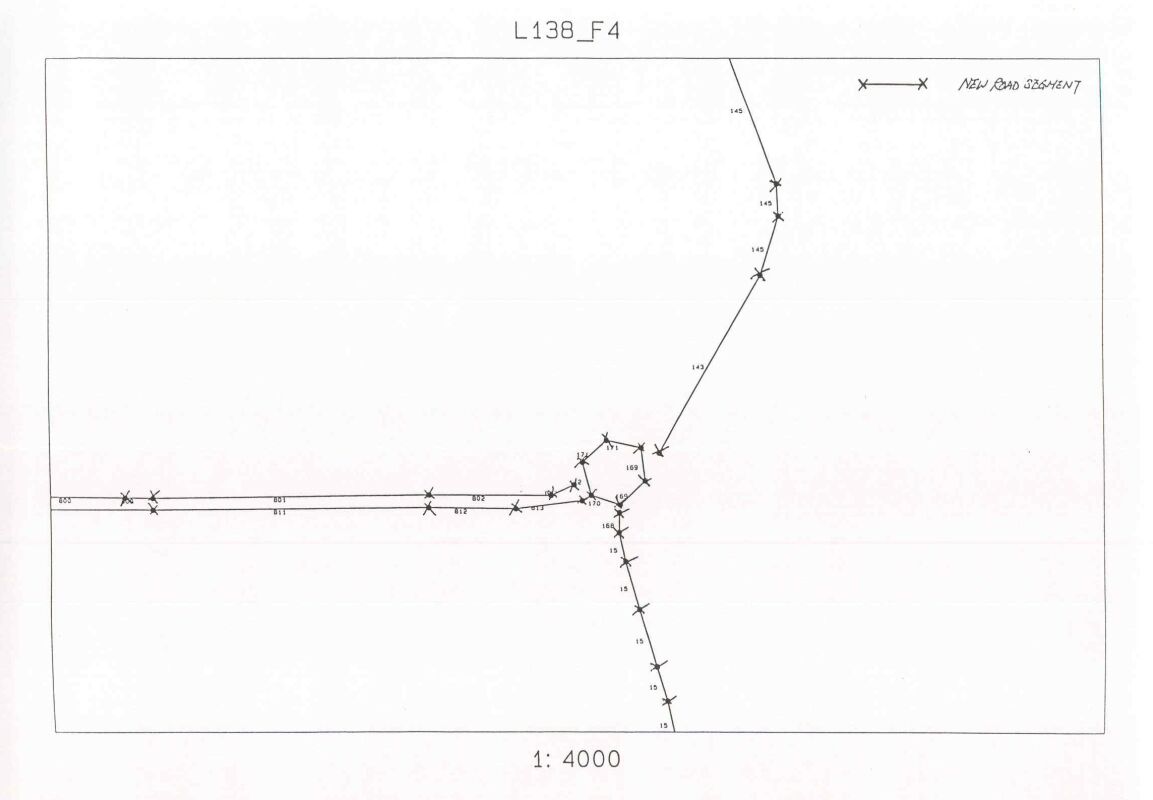
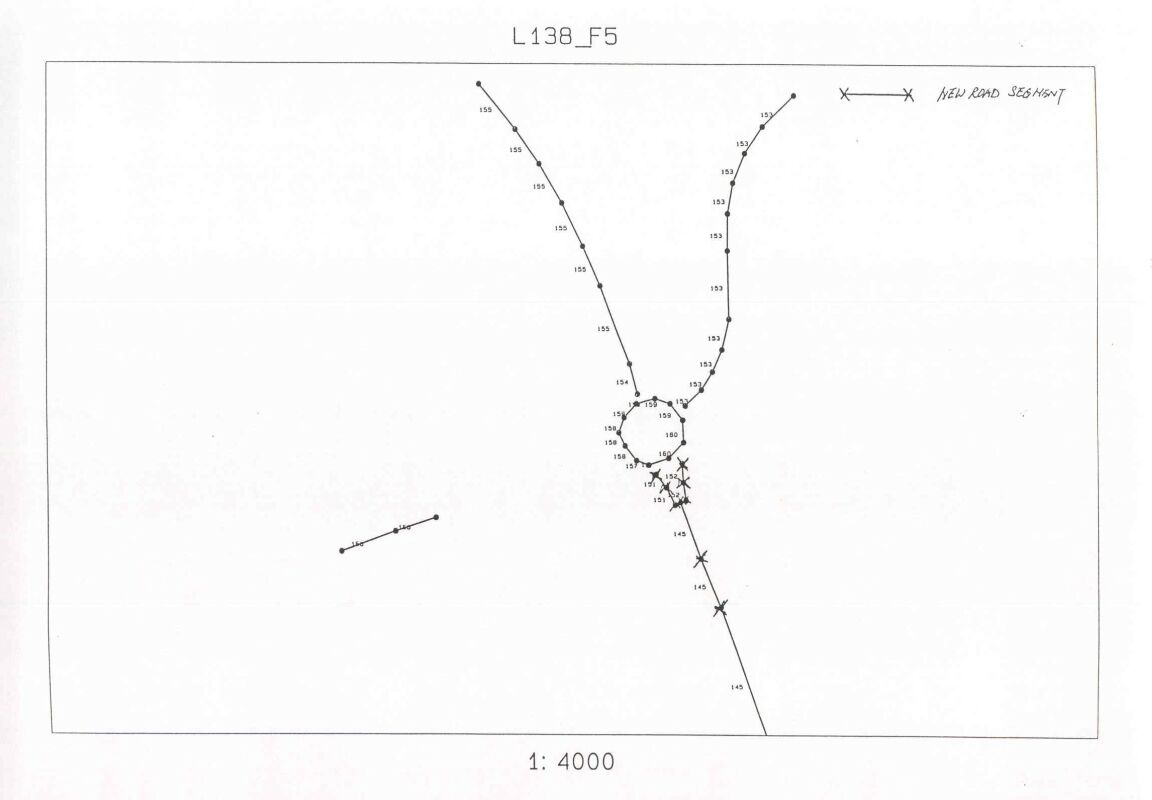
Appendix 4.2D Computer Road Plots (Sheet 1,
2, 3, 4,
5, 6)
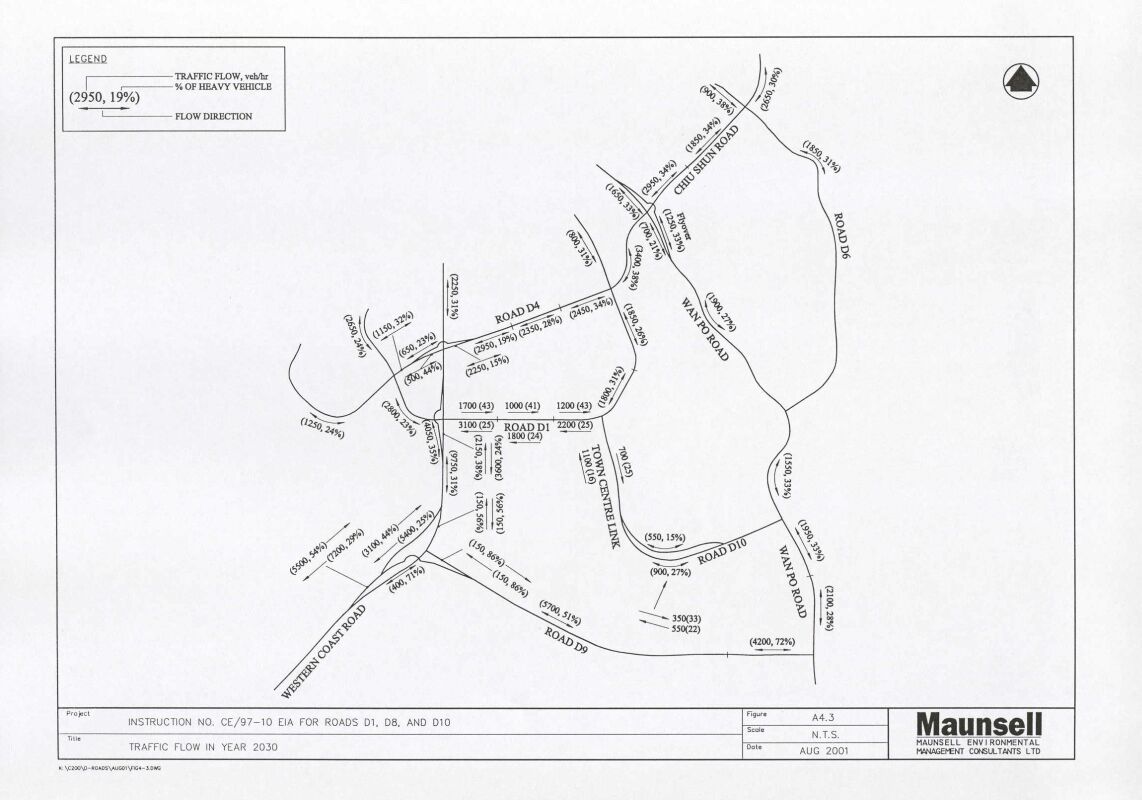
Appendix 4.3 Traffic Flow In Year 2030
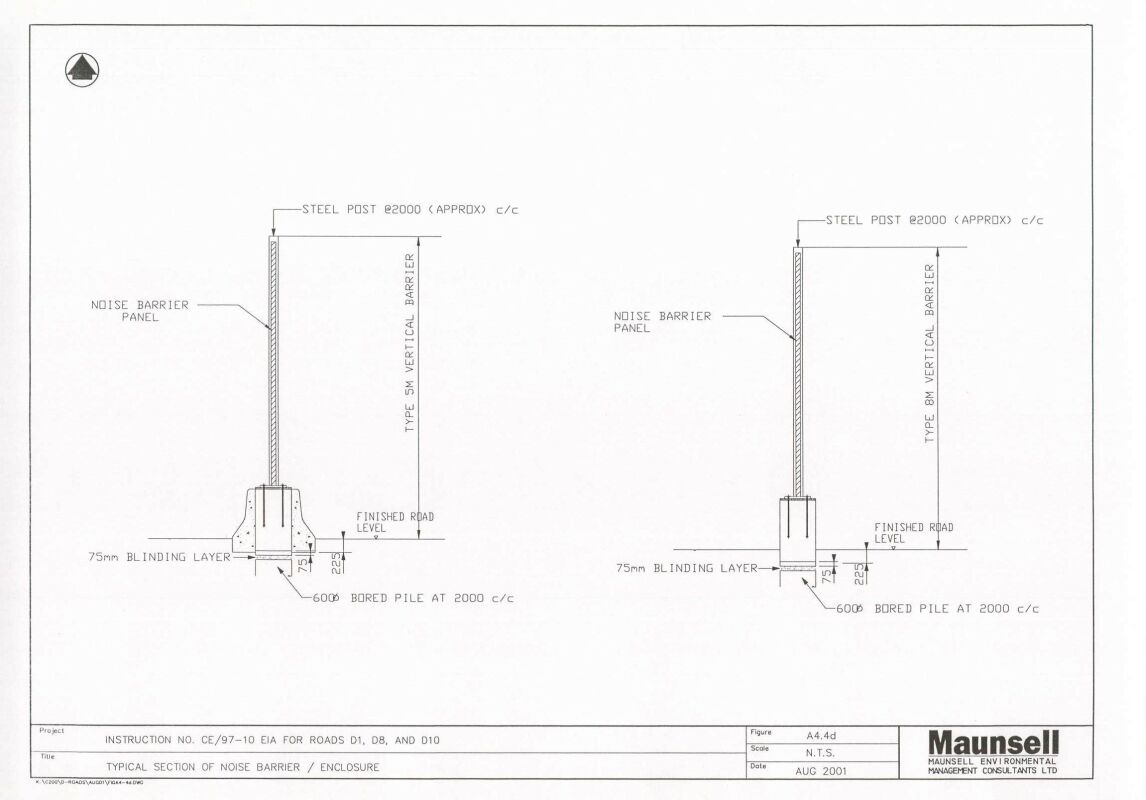
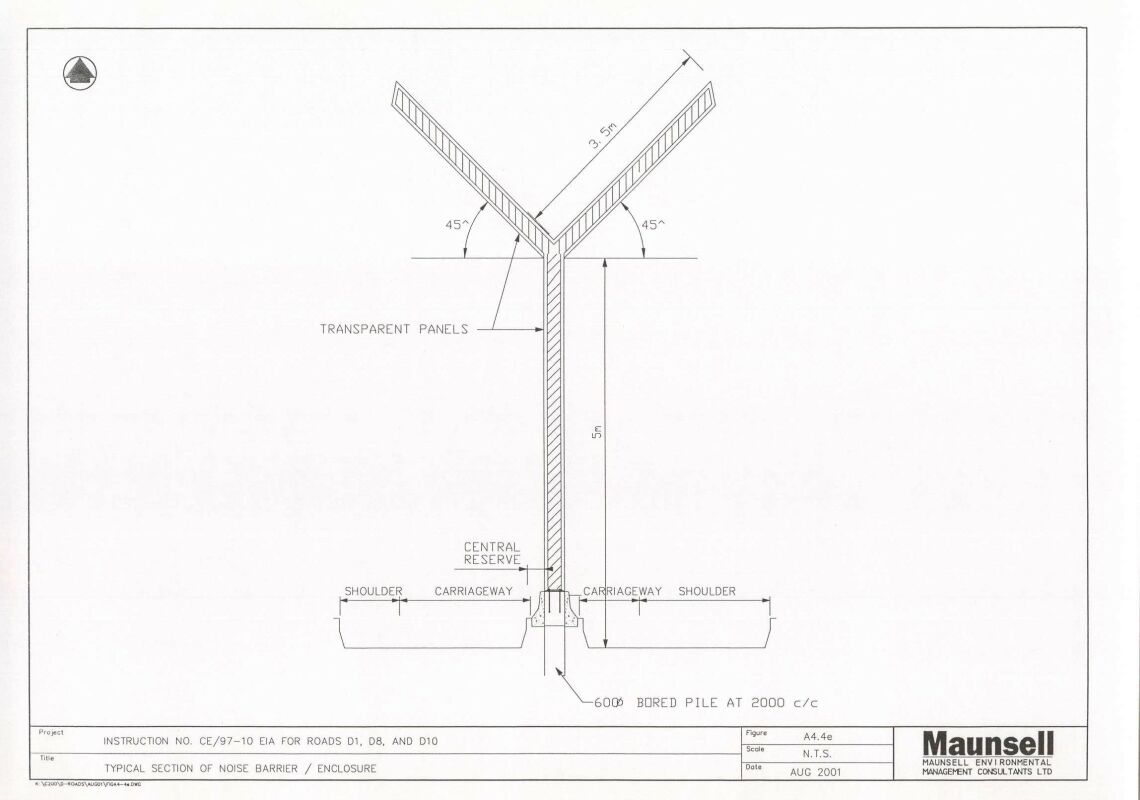
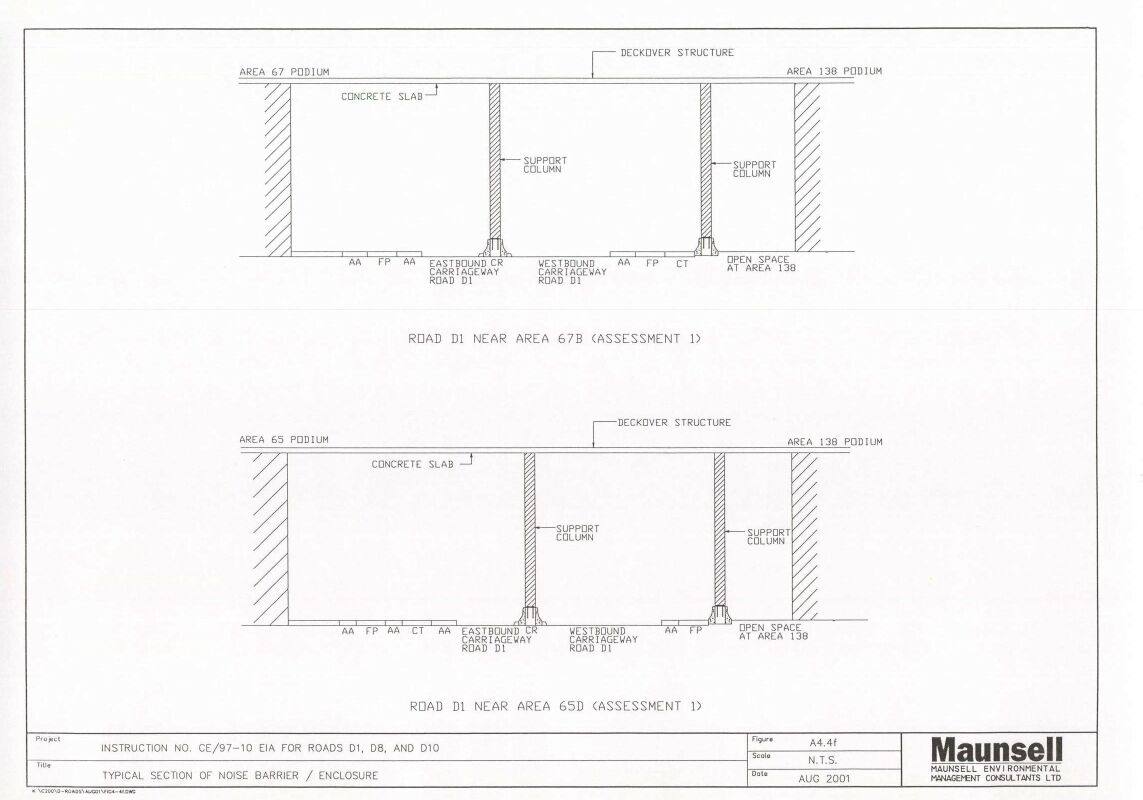
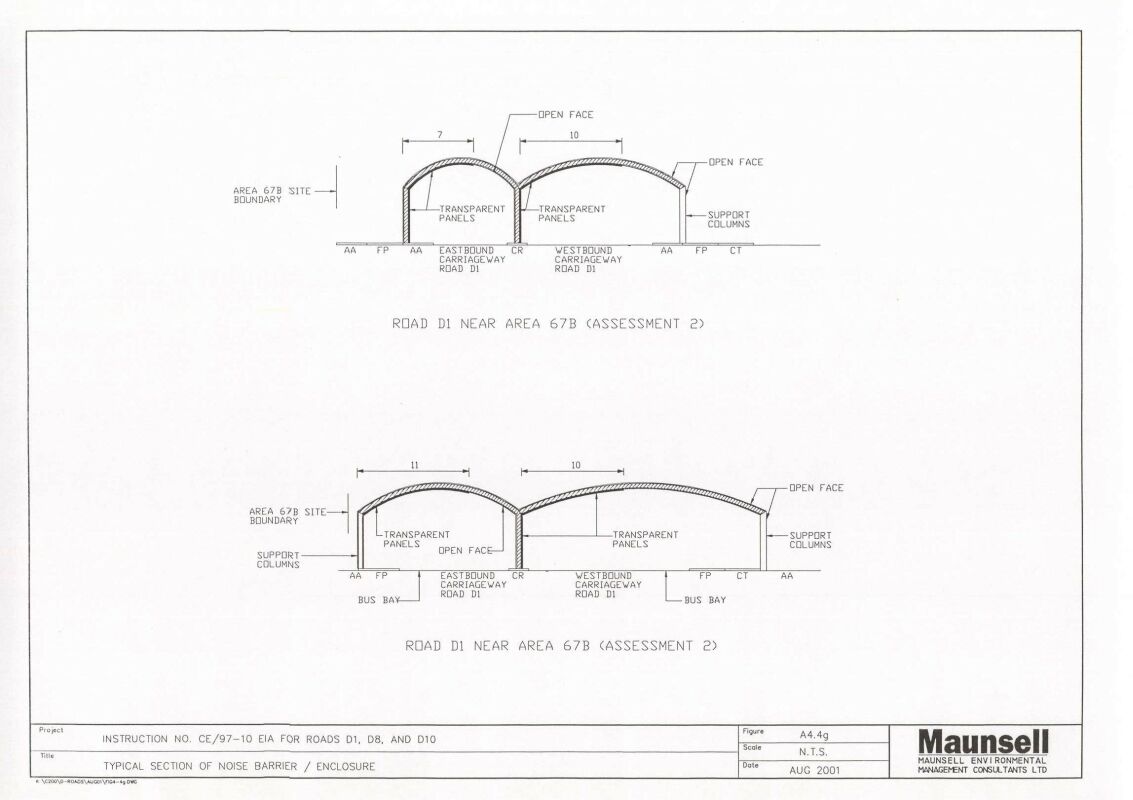
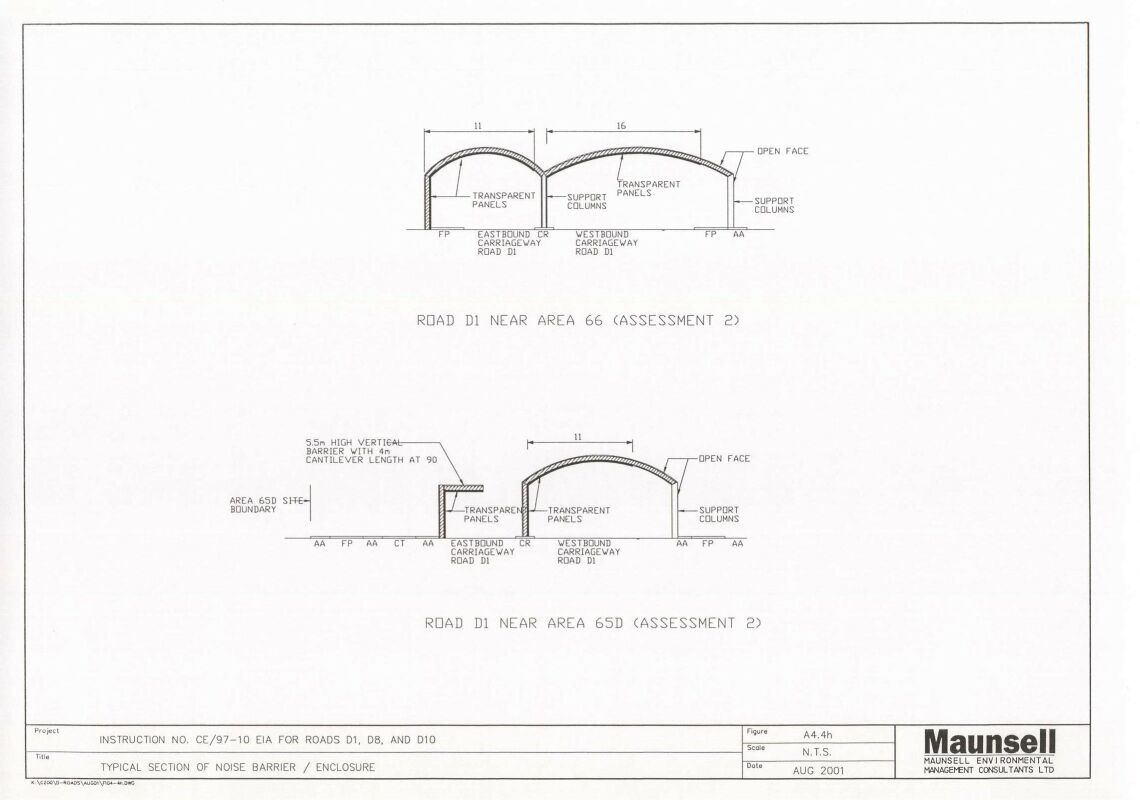
Appendix
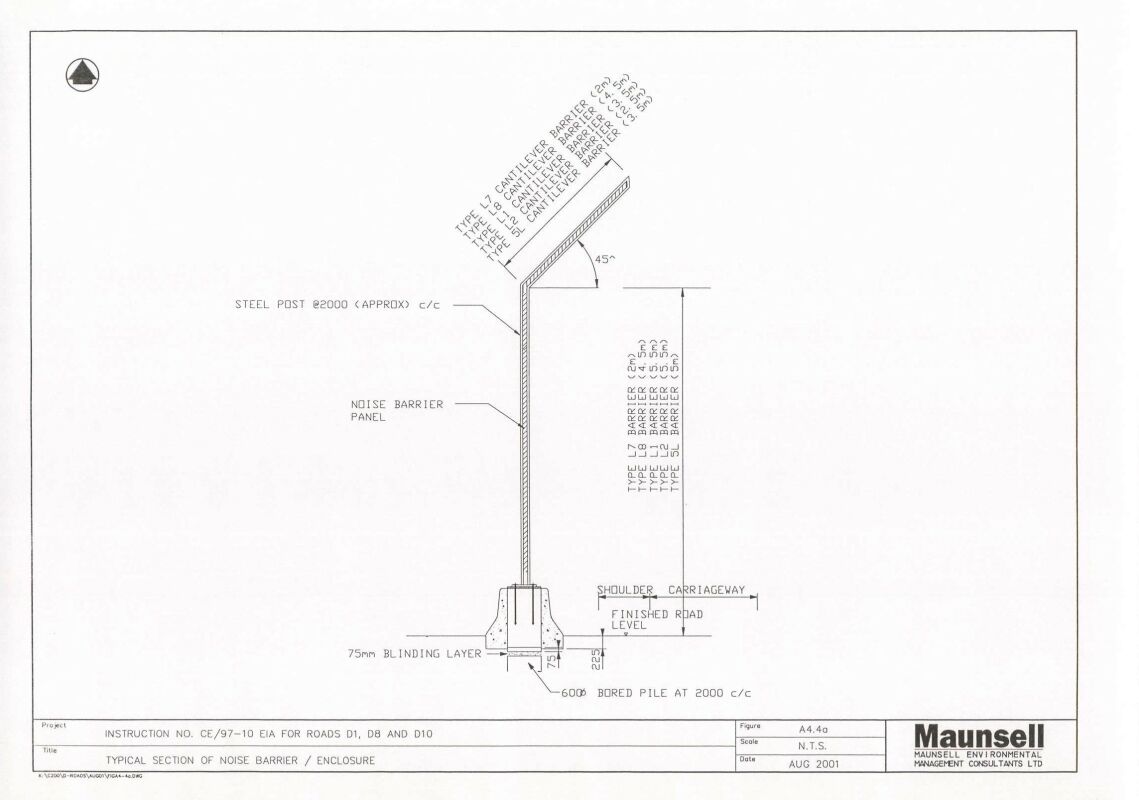
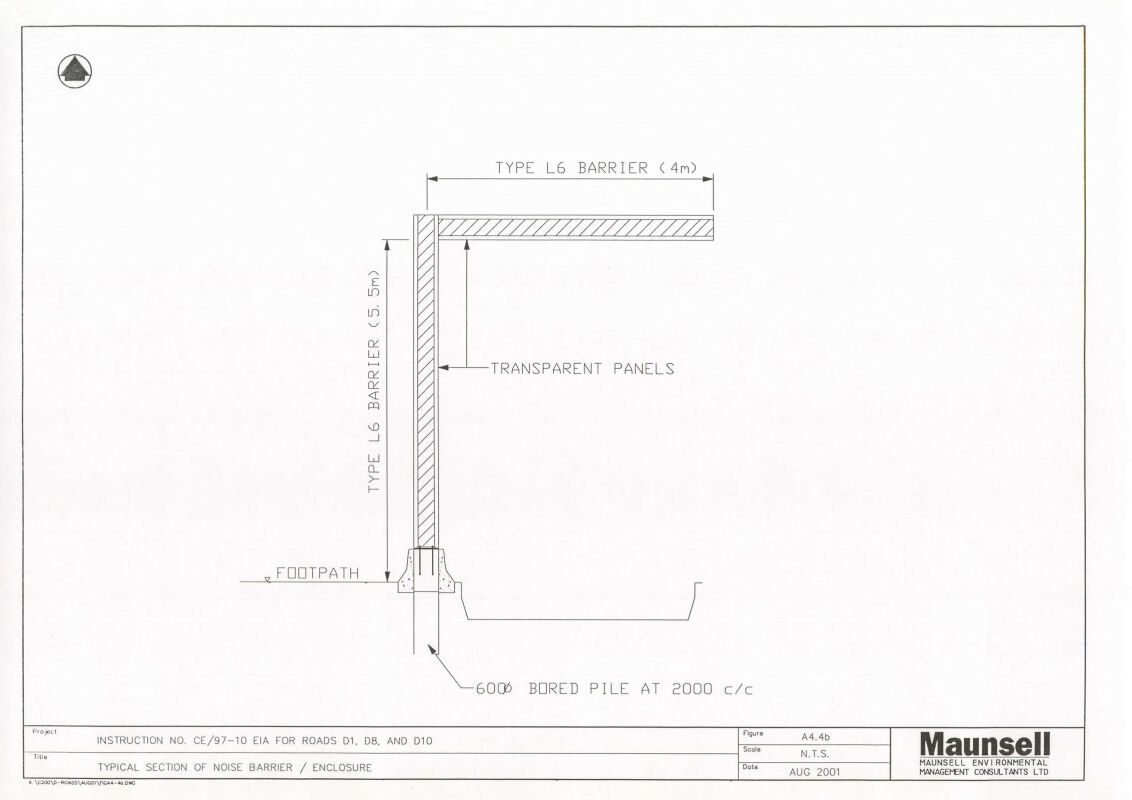
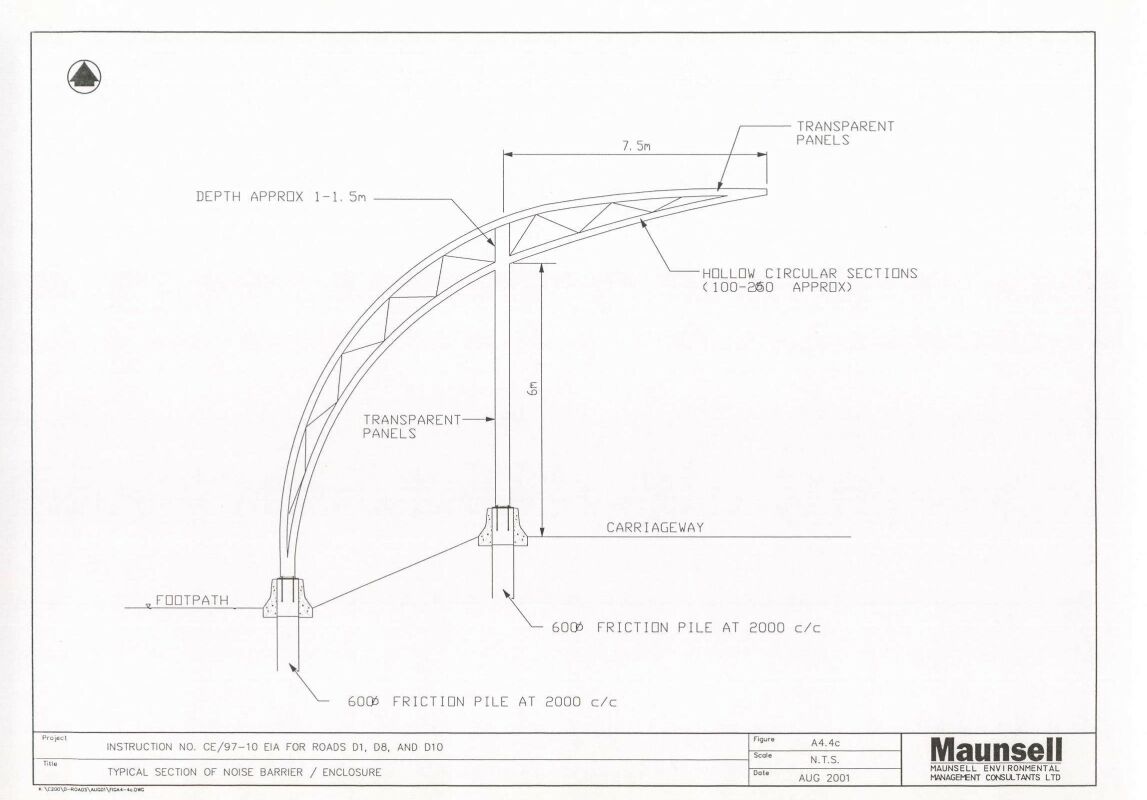
4.4 Typical Section of Noise
Barrier / Enclosure (a, b,
c, d, e,
f, g, h)
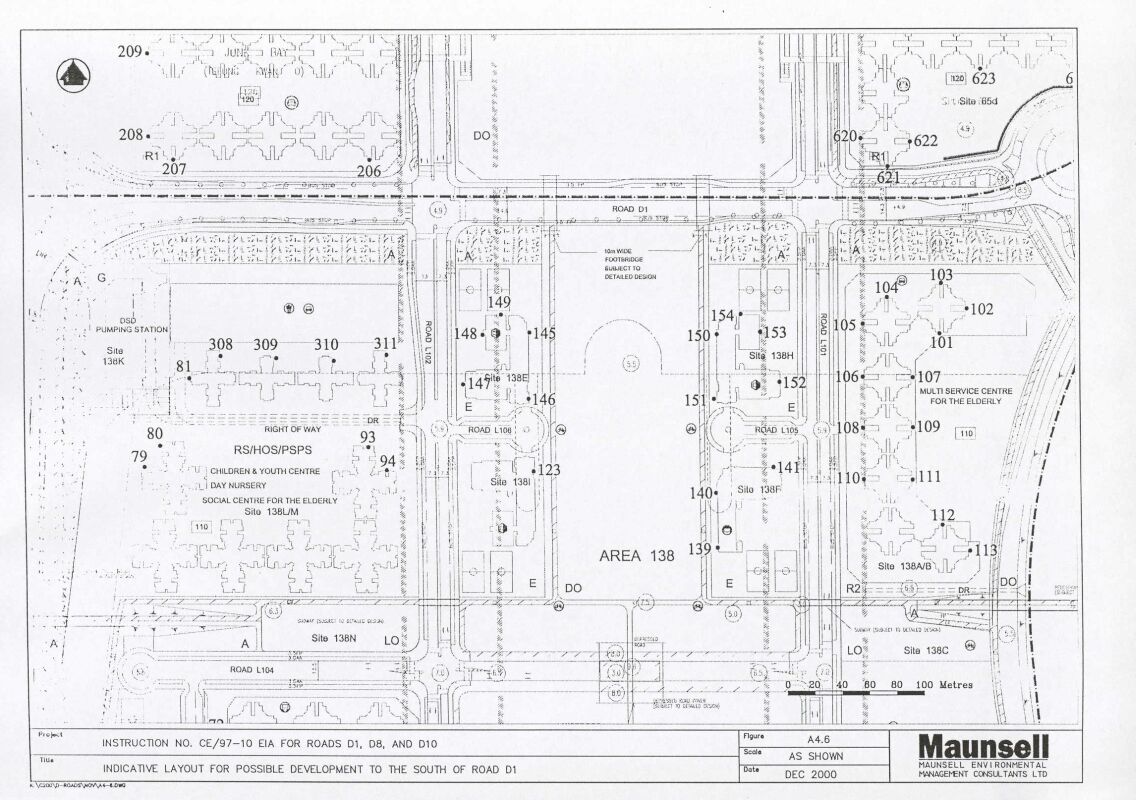
Appendix
4.5 Indicative Layout for Development
to the South of Road D1
LISTS OF TABLES
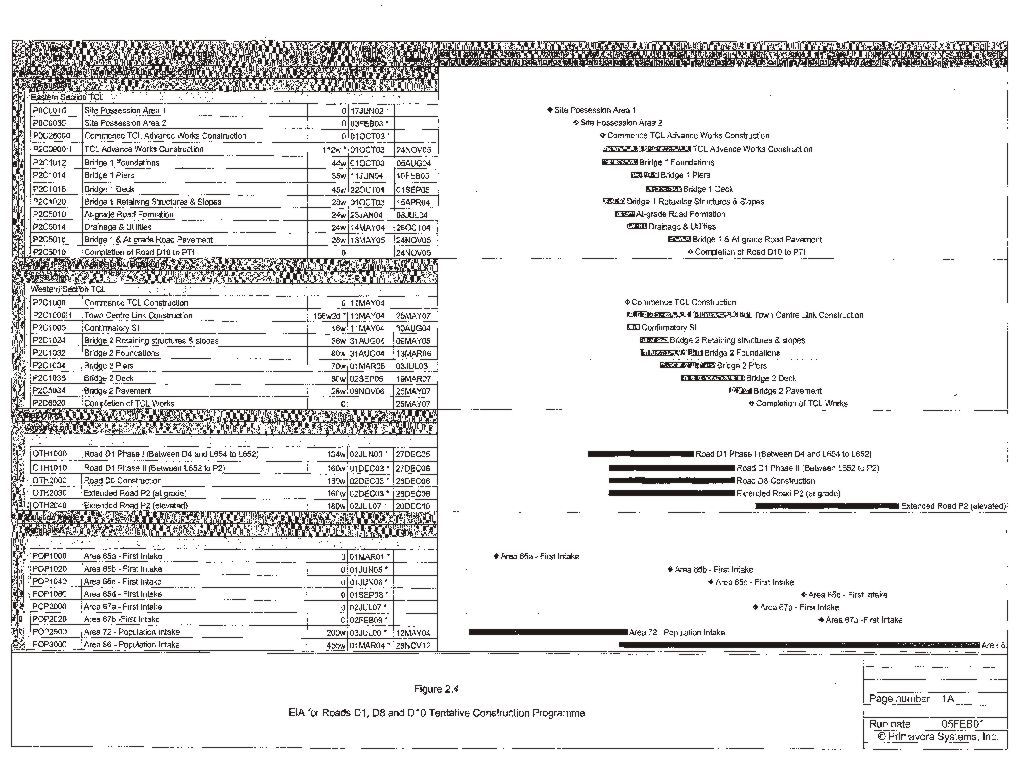
Table 2.1 Preliminary
Implementation Programme for Roads D1, D8, D10 and the Extended Road P2
Table 2.2 Environmental
Benefits and Disbenefits of Alternative Road Alignment Options
Table 3.1 Hong
Kong Air Quality Objectives
Table 3.2 Tunnel
Air Quality Criteria
Table 3.3 Maximum
Predicted SO2, NO2 and TSP Concentrations from the
Separate EA Study for Area 86
Table 3.4 Air
Pollutant Levels Recorded at EPD Air Quality Monitoring Stations
Table 3.5 Description
of Air Sensitive Receivers (ASRs) during Construction Phase in Year 2005
Table 3.6 Description
of Air Sensitive Receivers (ASRs) during Operation Phase
Table 3.7 Dust
Emission Factors used in this Assessment
Table 3.8 Emission
Factors for Year 2011 for Different Vehicle Category
Table 3.9 Predicted
Cumulative TSP Concentrations at the Representative ASRs in Year 2005
(Unmitigated)
Table 3.10 Predicted 1-hour Average NO2, 24-hour Average NO2
and 24-hour Average RSP Concentrations at the Representative ASRs (Assessment
1)
Table 3.11 Predicted Maximum NO2 Concentrations within the Two
Sections of the Deckover
Table 3.12 Predicted 1-hour Average NO2, 24-hour Average NO2
and 24-hour Average RSP Concentrations at the Representative ASRs (Assessment
2)
Table 3.13 Predicted TSP Concentrations at the Representative ASRs in Year 2005
(Mitigated)
Table 4.1 Construction
Noise Criteria for Activity other than Percussive Piling
Table 4.2 Acceptable
Noise Levels for Percussive Piling
Table 4.3 Permitted Hours of Operation for Percussive
Piling
Table 4.4 Description
of the Representative NSRs in Worst Year Scenario
Table 4.5 Description
of Noise Sensitive Receivers during Operation Phase
Table 4.6 Predicted
Unmitigated Construction Noise Levels at NSRs in Worst Year Scenario
Table 4.7 Predicted
Mitigated Construction Noise Levels at NSRs in Worst Year Scenario (using
Quieter Plants)
Table 4.8 Predicted
Mitigated Construction Noise Levels at NSRs in Worst Year Scenario (Quiet
Plants + Movable Noise Barrier)
Table 4.9 Predicted
Mitigated Construction Noise Levels at NSRs in Worst Year Scenario (Quiet
Plants + Movable Noise Barrier + Limiting No. of PMEs)
Table 4.10 Summary of Predicted Cumulative Construction Noise Levels at NSRs
Table 4.11 Summary of Number of Non-compliance Dwellings and Classrooms
Table 5.1 Water
Quality Objectives Statement for TKO Bay WCZ
Table 5.2 WSD
Standards for Sea Water for Flushing Supply (at intake point)
Table 5.3 Summary
Statistics of Marine Water Quality of TKO Bay WCZ for 1997
Table 5.4 Monitoring
Data of Groundwater Quality at TKO Stage I Landfill (for monitoring borehole
B133)
Table 5.5 Discharge
across Control Lines at the Mouth and Middle of the Eastern Drainage Channel
Table 6.1 Estimated
Earthworks Quantities for the Construction of Roads D1, D8 and D10
Table 6.2 Summary
of Waste Handling Procedures and Disposal Routes
Table
7.1 LFG Monitoring Data for Monitoring
Well D113
Table
7.2 LFG Monitoring Data for Monitoring
Well D114
Table
7.3 LFG Monitoring Data for Monitoring
Well D115
Table
7.4 LFG Monitoring Data for Monitoring
Well D118
Table
7.5 LFG Monitoring Data for Monitoring
Well D120
Table
7.6 LFG Monitoring Data for Monitoring
Well D126
Table
7.7 LFG Monitoring Data for Monitoring
Well D130
Table
7.8 LFG Monitoring Data for Monitoring
Well D157
Table
7.9 LFG Monitoring Data for Monitoring
Well 1DG1
Table
7.10 LFG Monitoring Data for Monitoring
Well 1DG2
Table
7.11 LFG Monitoring Data for Monitoring
Well 1DG3
Table
7.12 LFG Monitoring Data for Monitoring
Well 1DG4
Table
7.13 LFG Monitoring Data for Monitoring
Well 1DG5
Table
7.14 LFG Monitoring Data for Monitoring
Well 1DG6
Table
7.15 Summary of
Qualitative-Source-Pathway-Target Analysis
Table
8.1 Relationship between Receptor
Sensitivity and Impact Magnitude in Defining Impact Significance
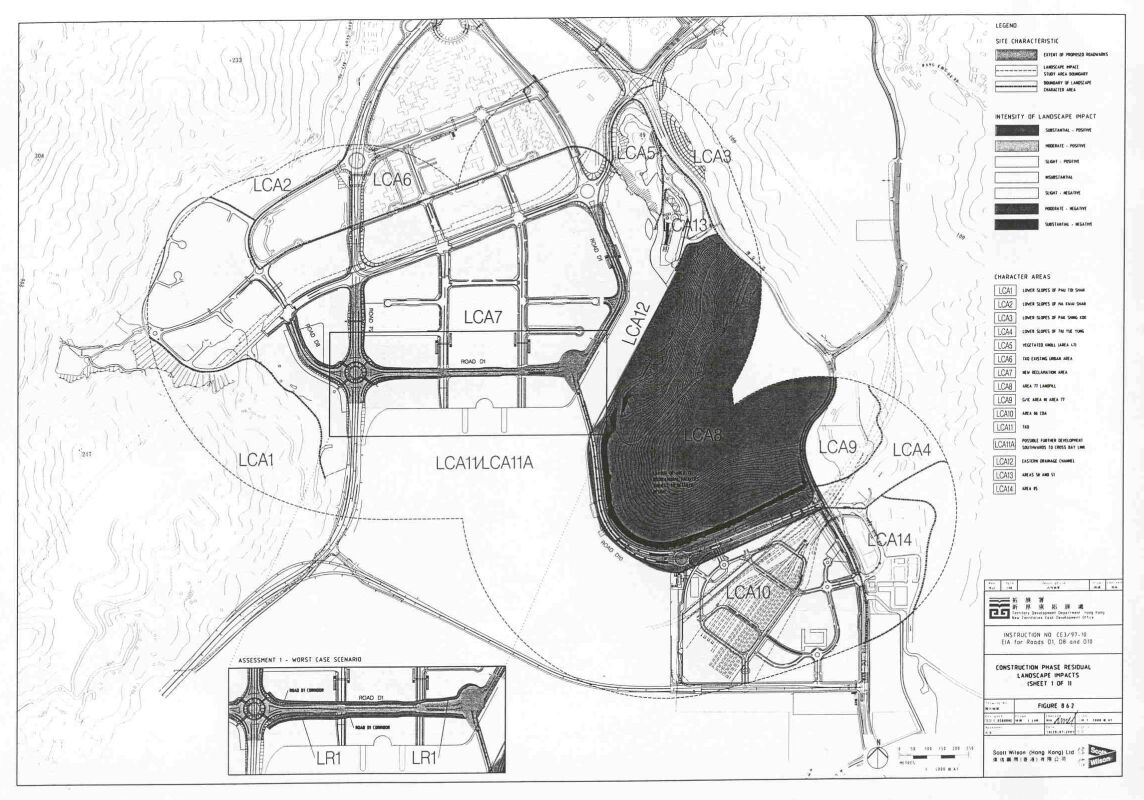
Table 8.2 List of the Landscape Resources Affected during
Construction Phase
Table 8.3 List of the Landscape Resources Affected during
Operation Phase
Table 8.4
List of the Key VSRs during Construction
Phase
Table 8.5 List of the Key VSRs during Operation Phase –
Assessment 1 – Worst Case Scenario
Table
8.5A List of the Key VSRs during Operation
Phase – Assessment 2 – Committed Development
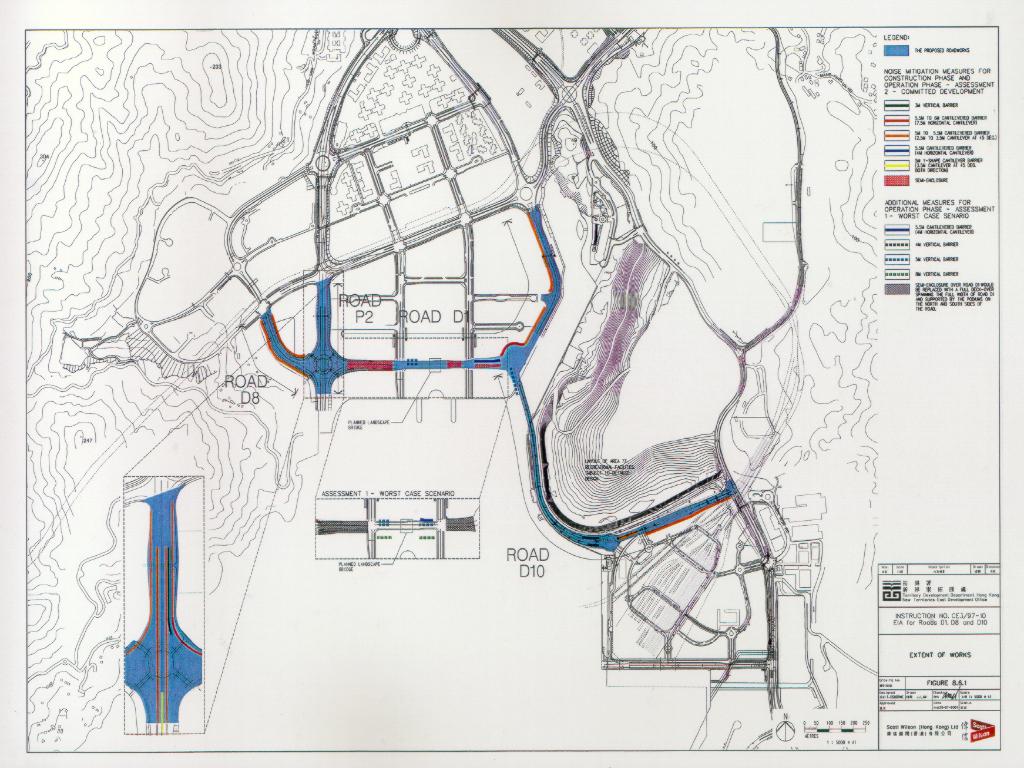
Table 8.6 Proposed Construction Phase Mitigation Measures
Table 8.7 Significance of Landscape Impacts in
Construction Phase
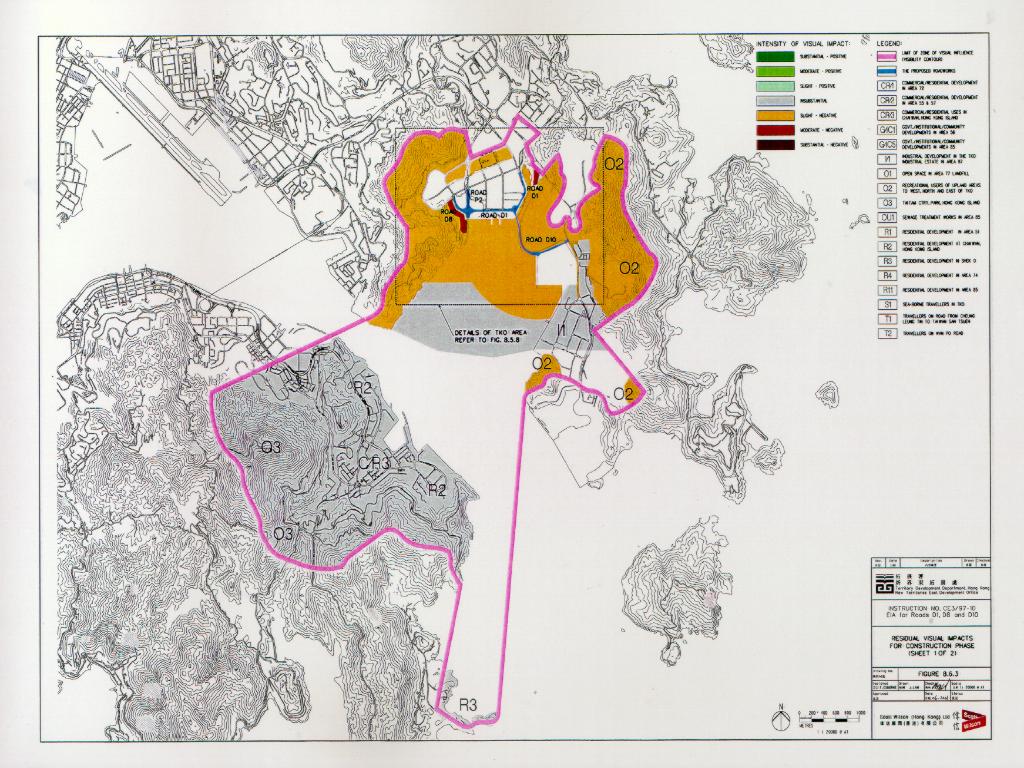
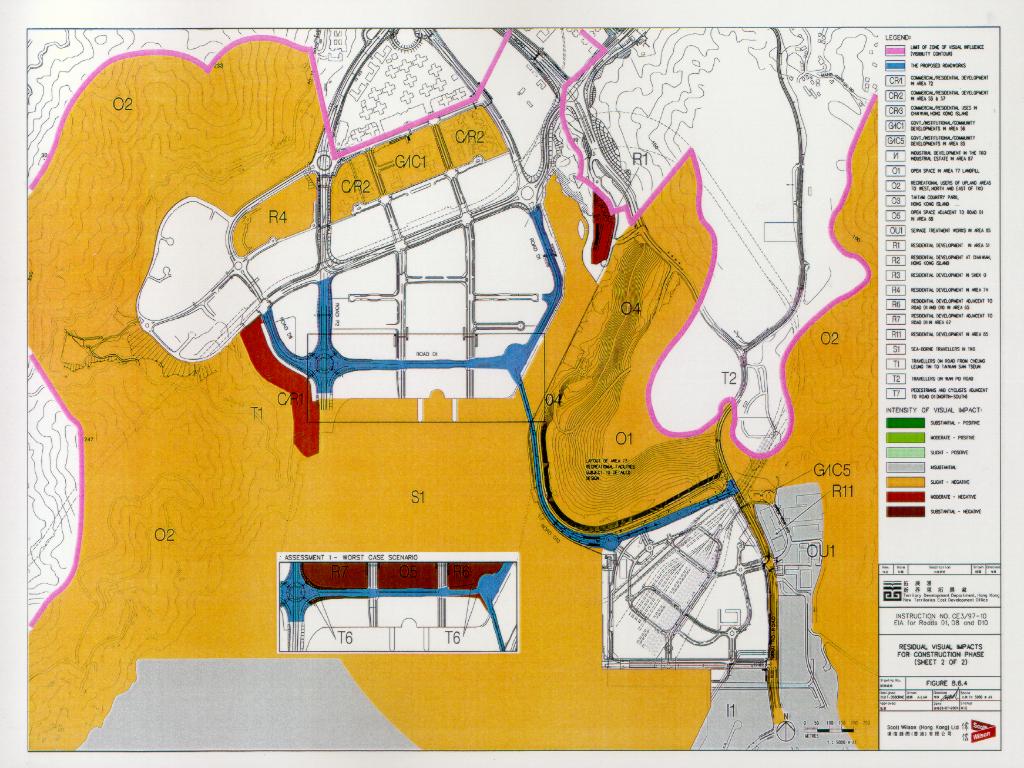
Table 8.8 Significance of Visual Impacts during
Construction Phase
Table 8.9 Proposed Operation Phase Mitigation Measures
Table 8.10 Significance of Landscape Impacts in
the Operation Phase
Table
8.11 Significance of Visual Impacts in the
Operation Phase – Assessment 1 – Worst Case Scenario (with Possible Further
Development)
Table 8.11A Significance of Visual Impacts in the Operation Phase – Assessment 2
– Committed Development
Table 10.1 Implementation Schedule of Air Quality Measures - Construction Phase
Table 10.2 Implementation Schedule of Noise Measures – Construction Stage
Table 10.3a Implementation Schedule of Noise Measures – Operational Stage
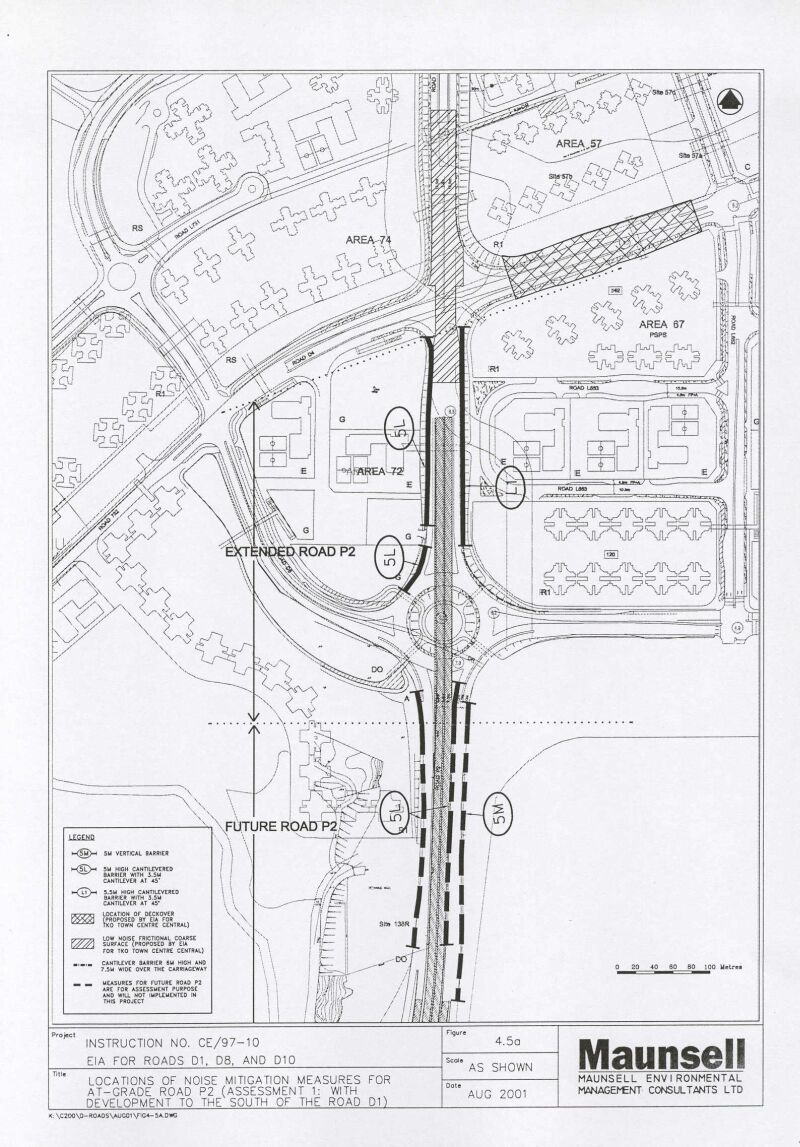
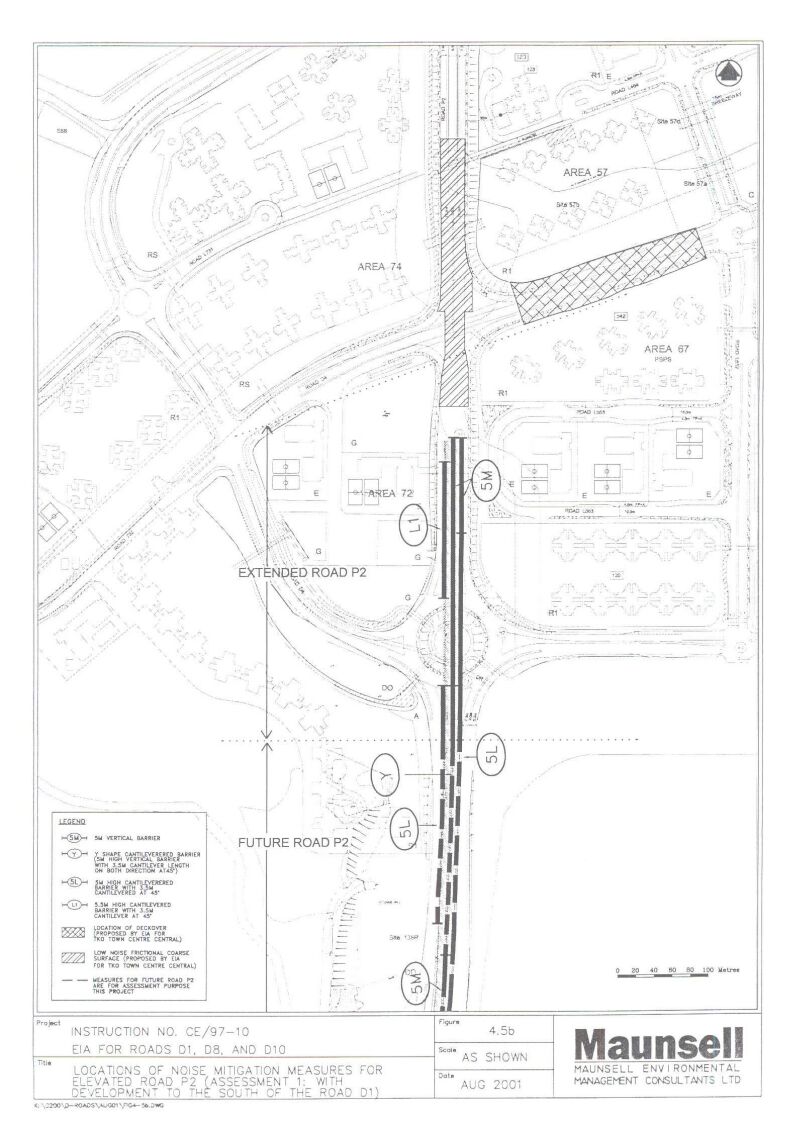
(Extended Road P2)
Table 10.3b Implementation Schedule of Noise Measures – Operational Stage (Roads
D1, D8 and D10 – With the development to the South of Road D1)
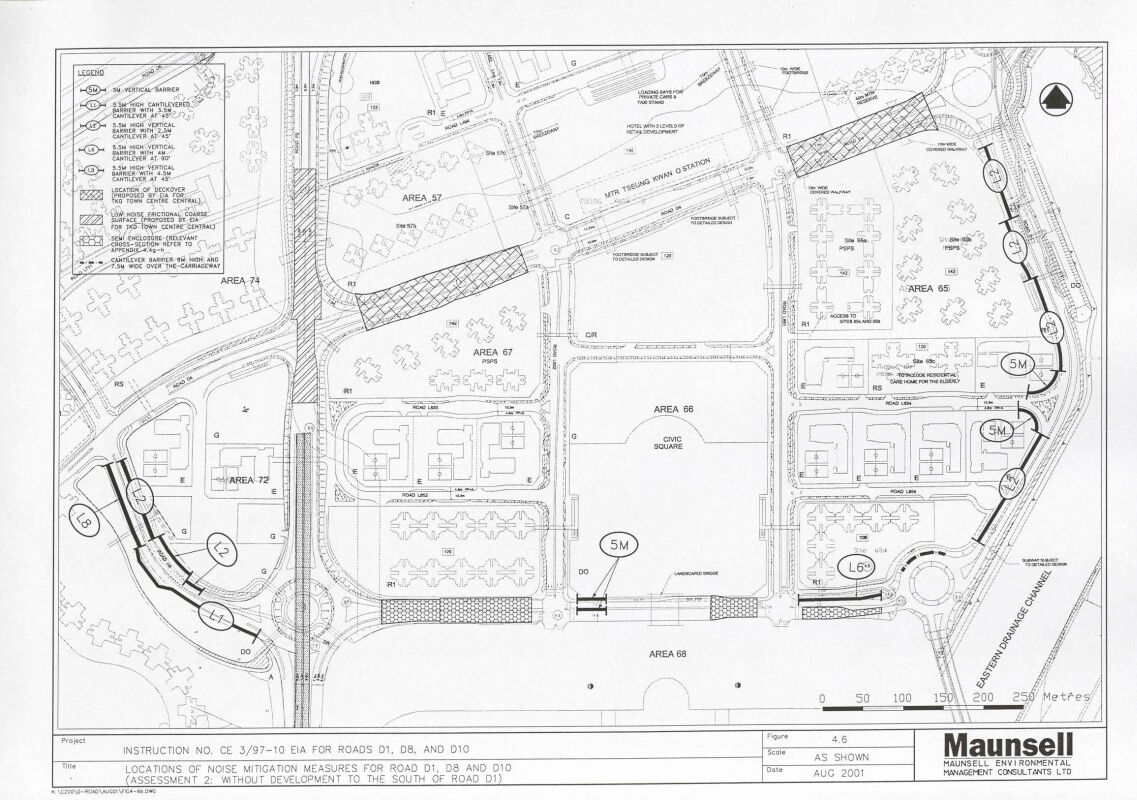
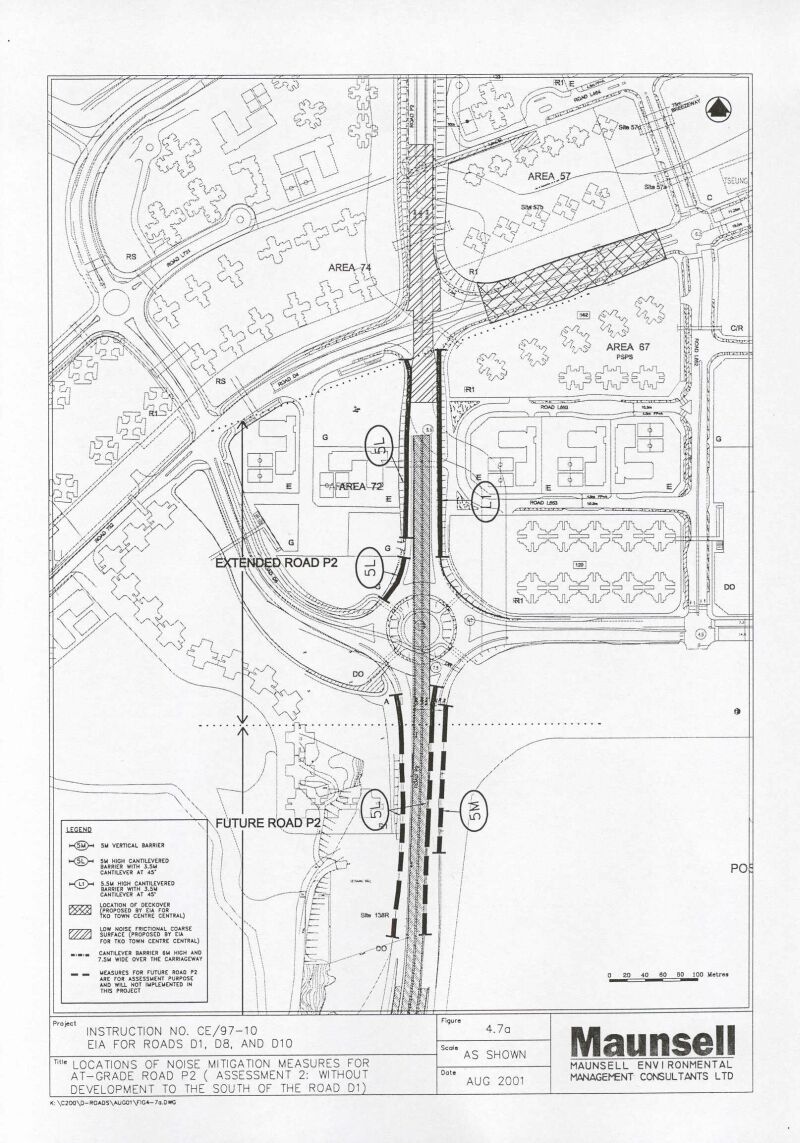
Table 10.3c Implementation Schedule of Noise Measures – Operational State (Roads
D1, D8 and D19 – Without the development to the South of Road D1)
Table 10.4 Implementation Schedule of Waste Measures
Table 10.5 Implementation Schedule of Water Quality Measures
Table 10.6a Implementation Schedule of Landfill Gas Hazard Measures –
Construction Phase
Table 10.6b Implementation Schedule of Landfill Gas Hazard Measures –
Operational Phase
Table 10.7 Implementation Schedule of Landscape and Visual Mitigation Measures
–Construction Phase
Table 10.8 Implementation Schedule of Landscape and Visual Mitigation Measures
–Operational Phase
LIST
OF FIGURES
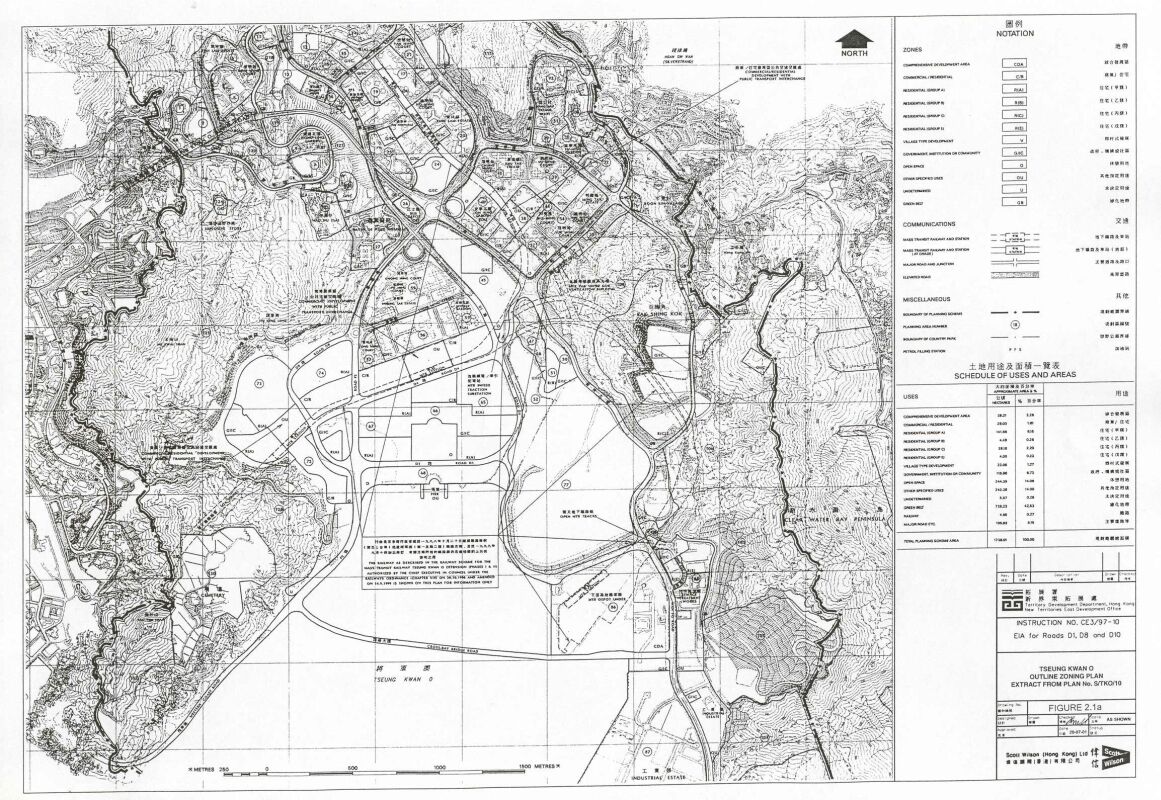
Figure 2.1a Tseung Kwan O Outline Zoning Plan No. S/TKO/10
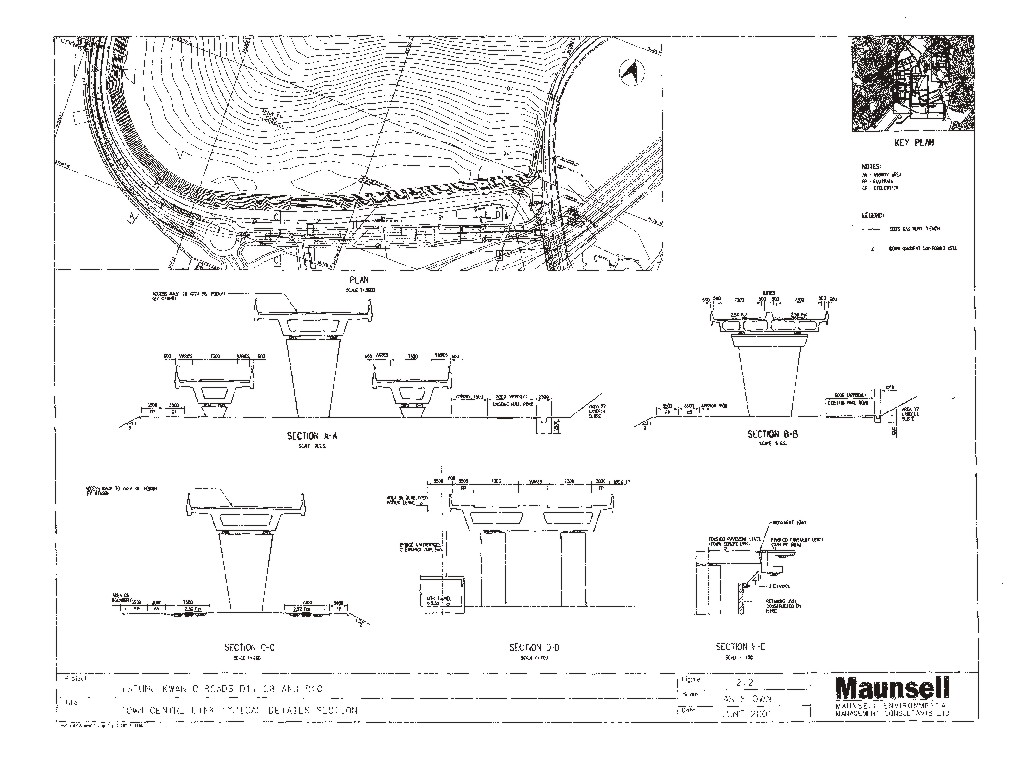
Figure 2.2 Town Centre Link Typical Details Section
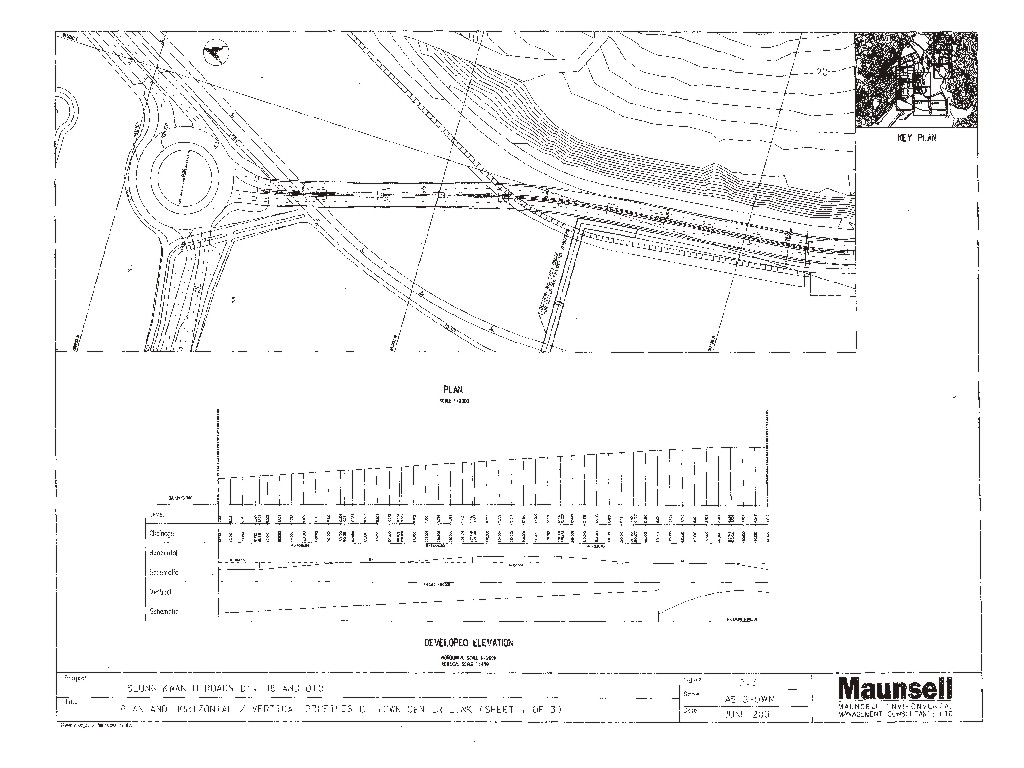
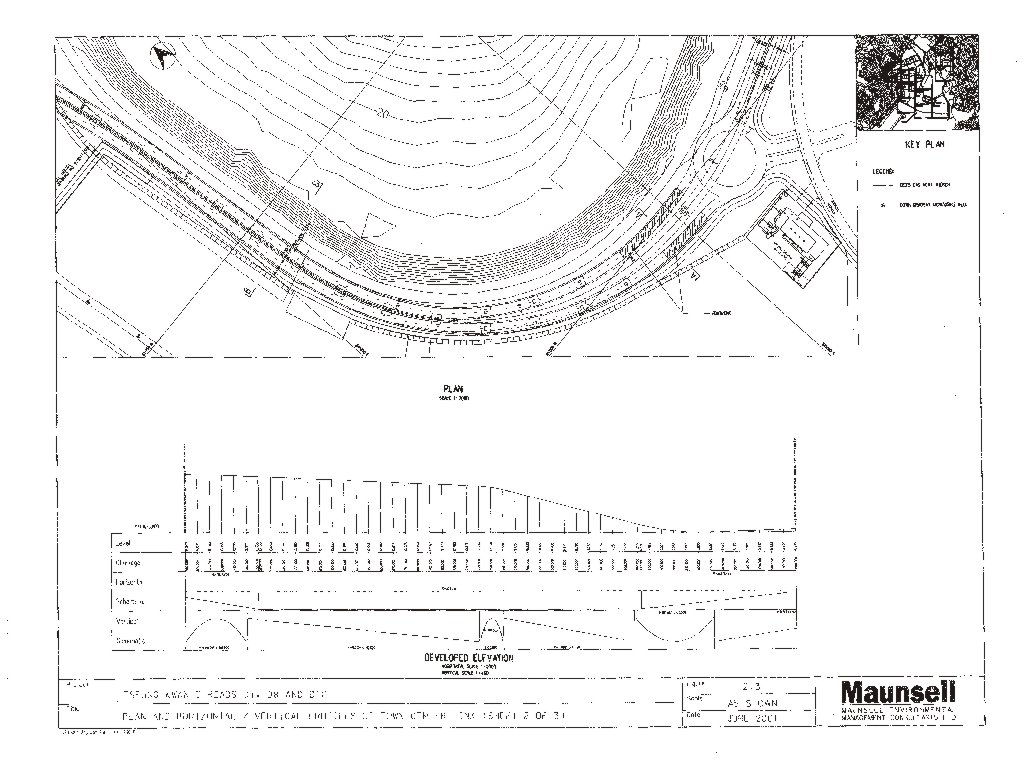
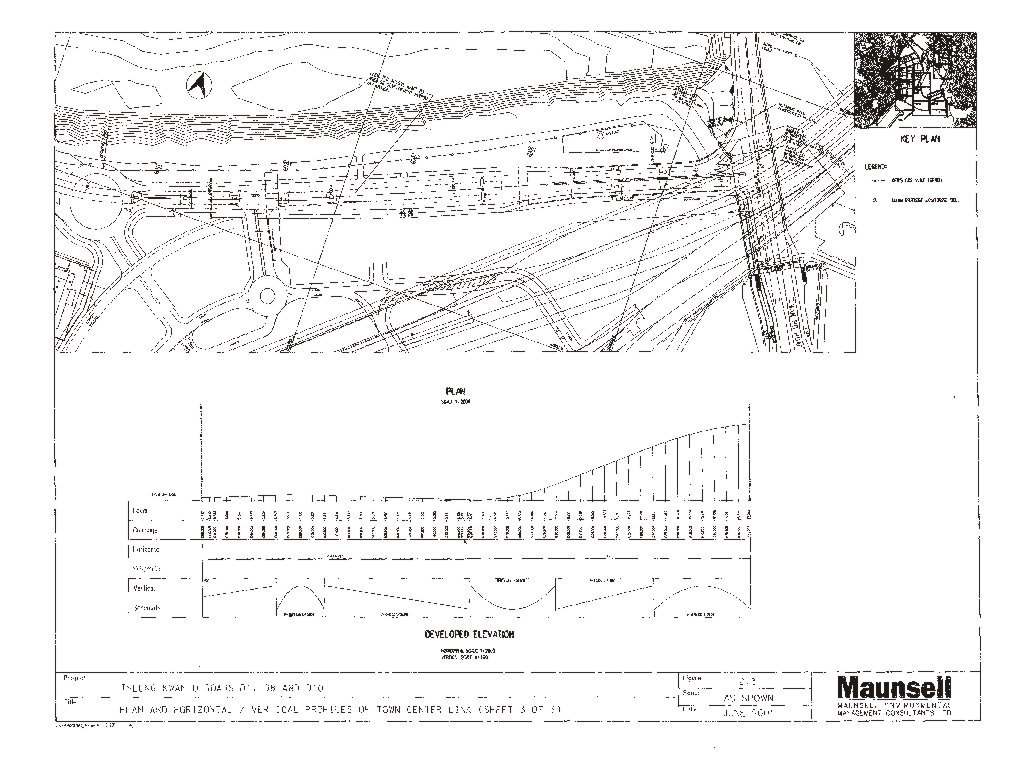
Figure 2.3 Plan and Horizontal / Vertical Profiles of Town Centre Link
(Sheet 1, 2, 3)
Figure 2.4 Tentative Implementation Programme for Roads D1, D8 and D10
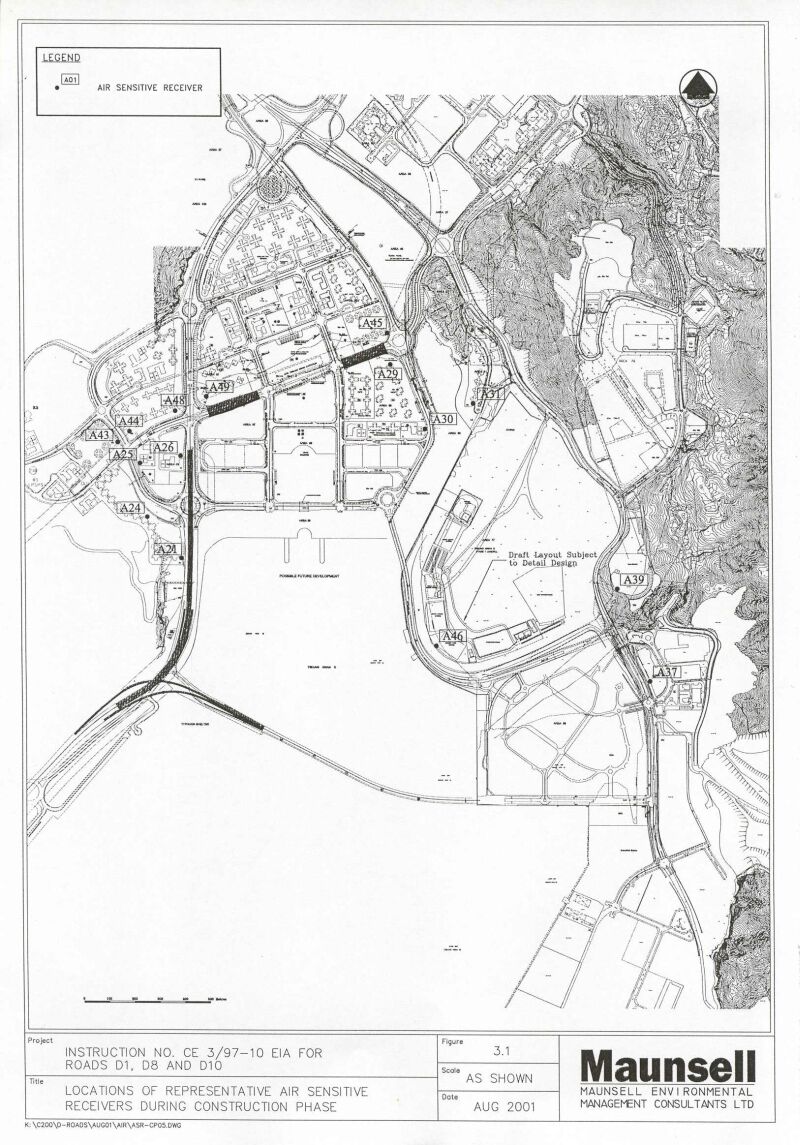
Figure
3.1 Locations of Representative Air Sensitive
Receivers during Construction Phase
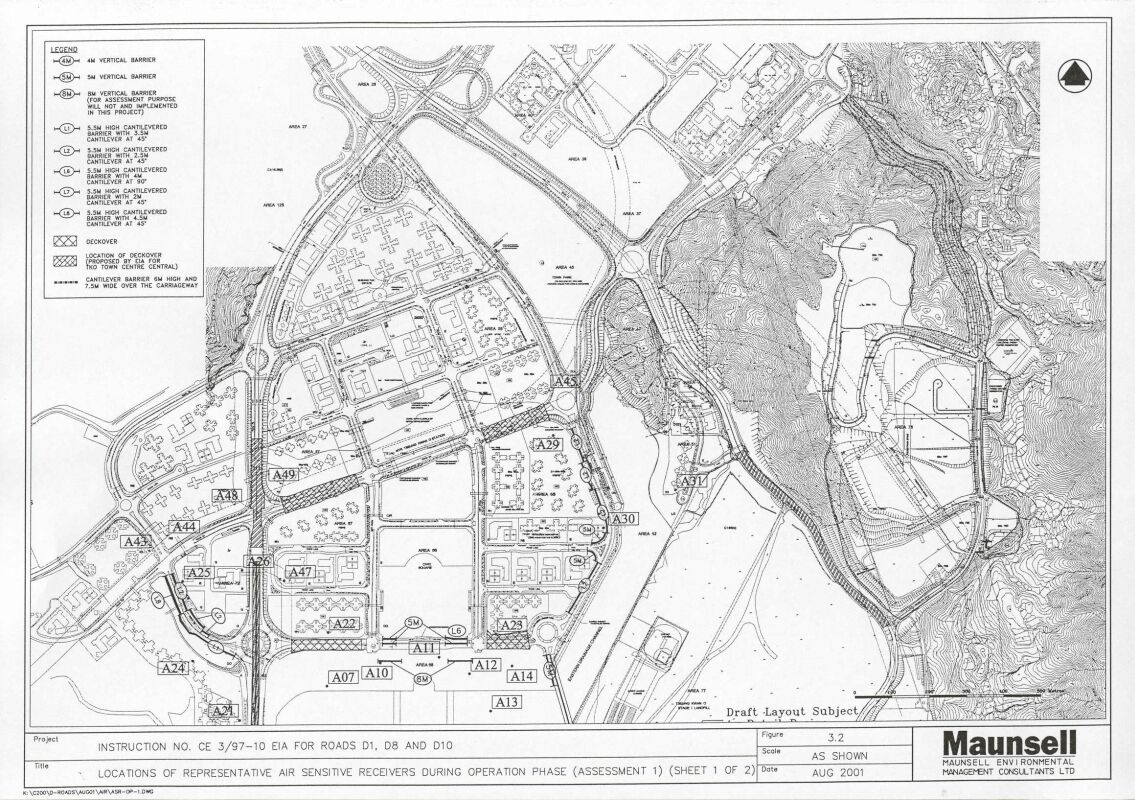
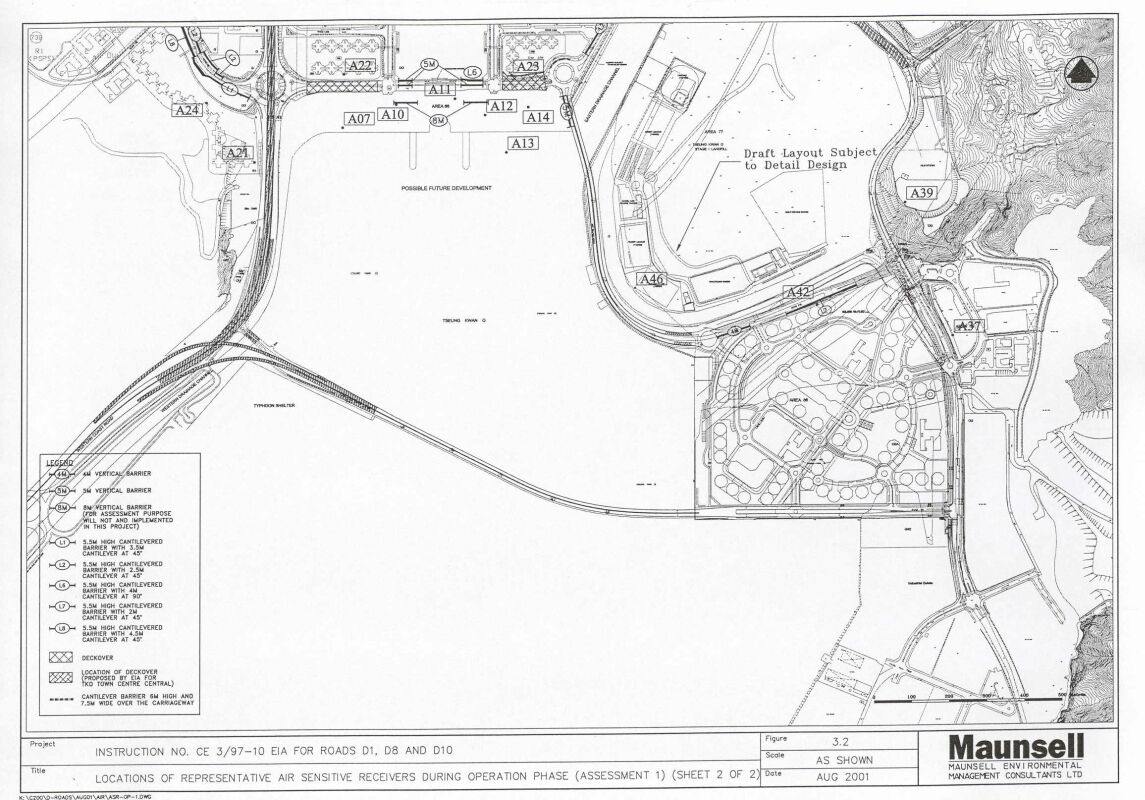
Figure
3.2 Locations of Representative Air Sensitive
Receivers during Operation Phase (Assessment 1) (Sheet 1,
2)
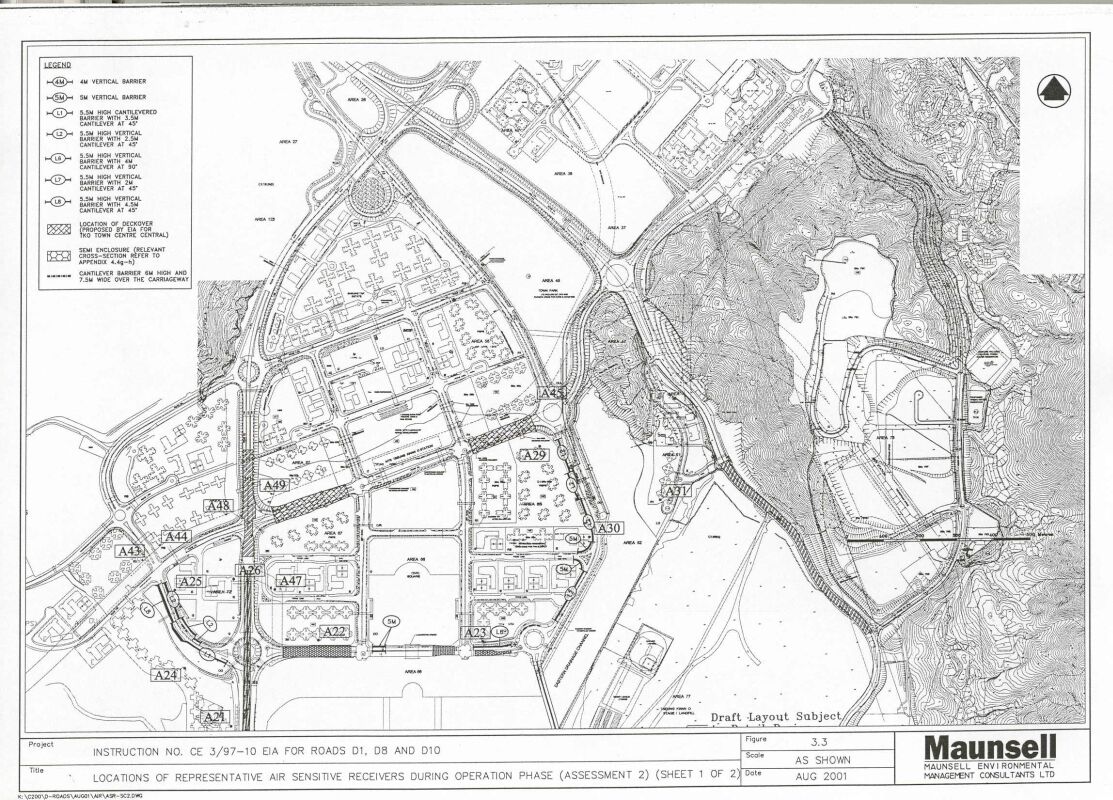
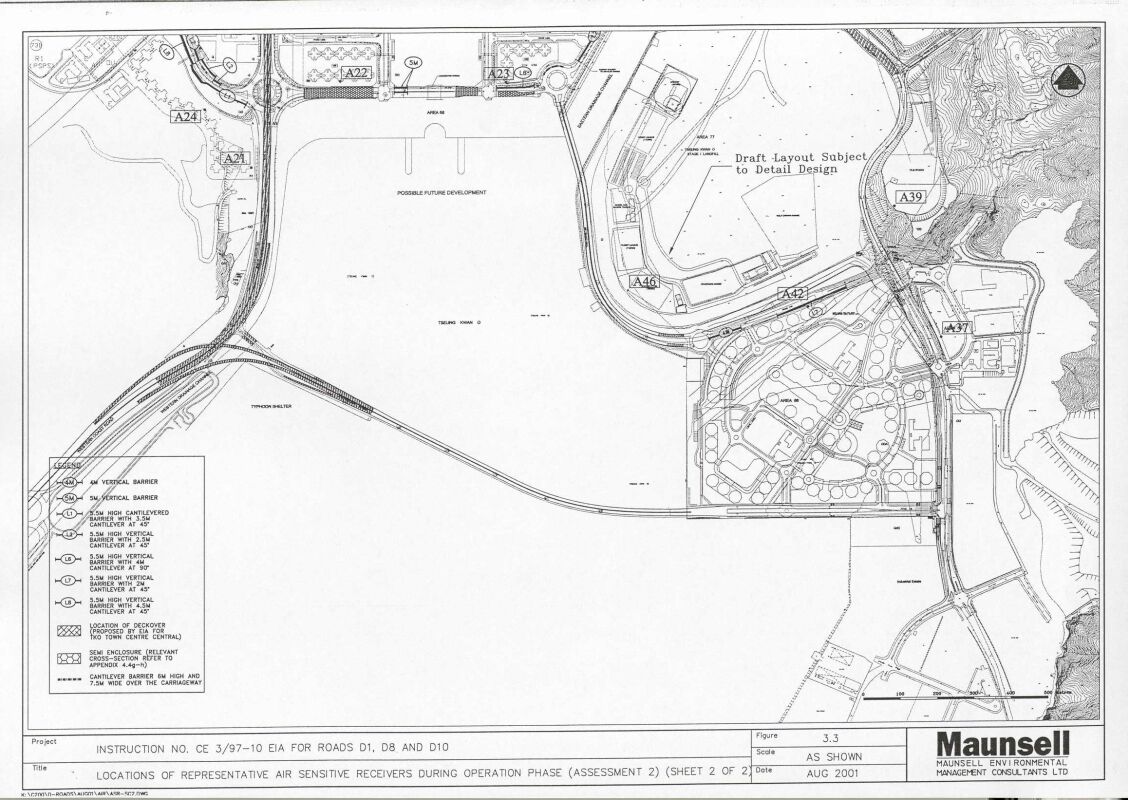
Figure
3.3 Locations of Representative Air Sensitive
Receivers during Operation Phase (Assessment 2) (Sheet 1,
2)
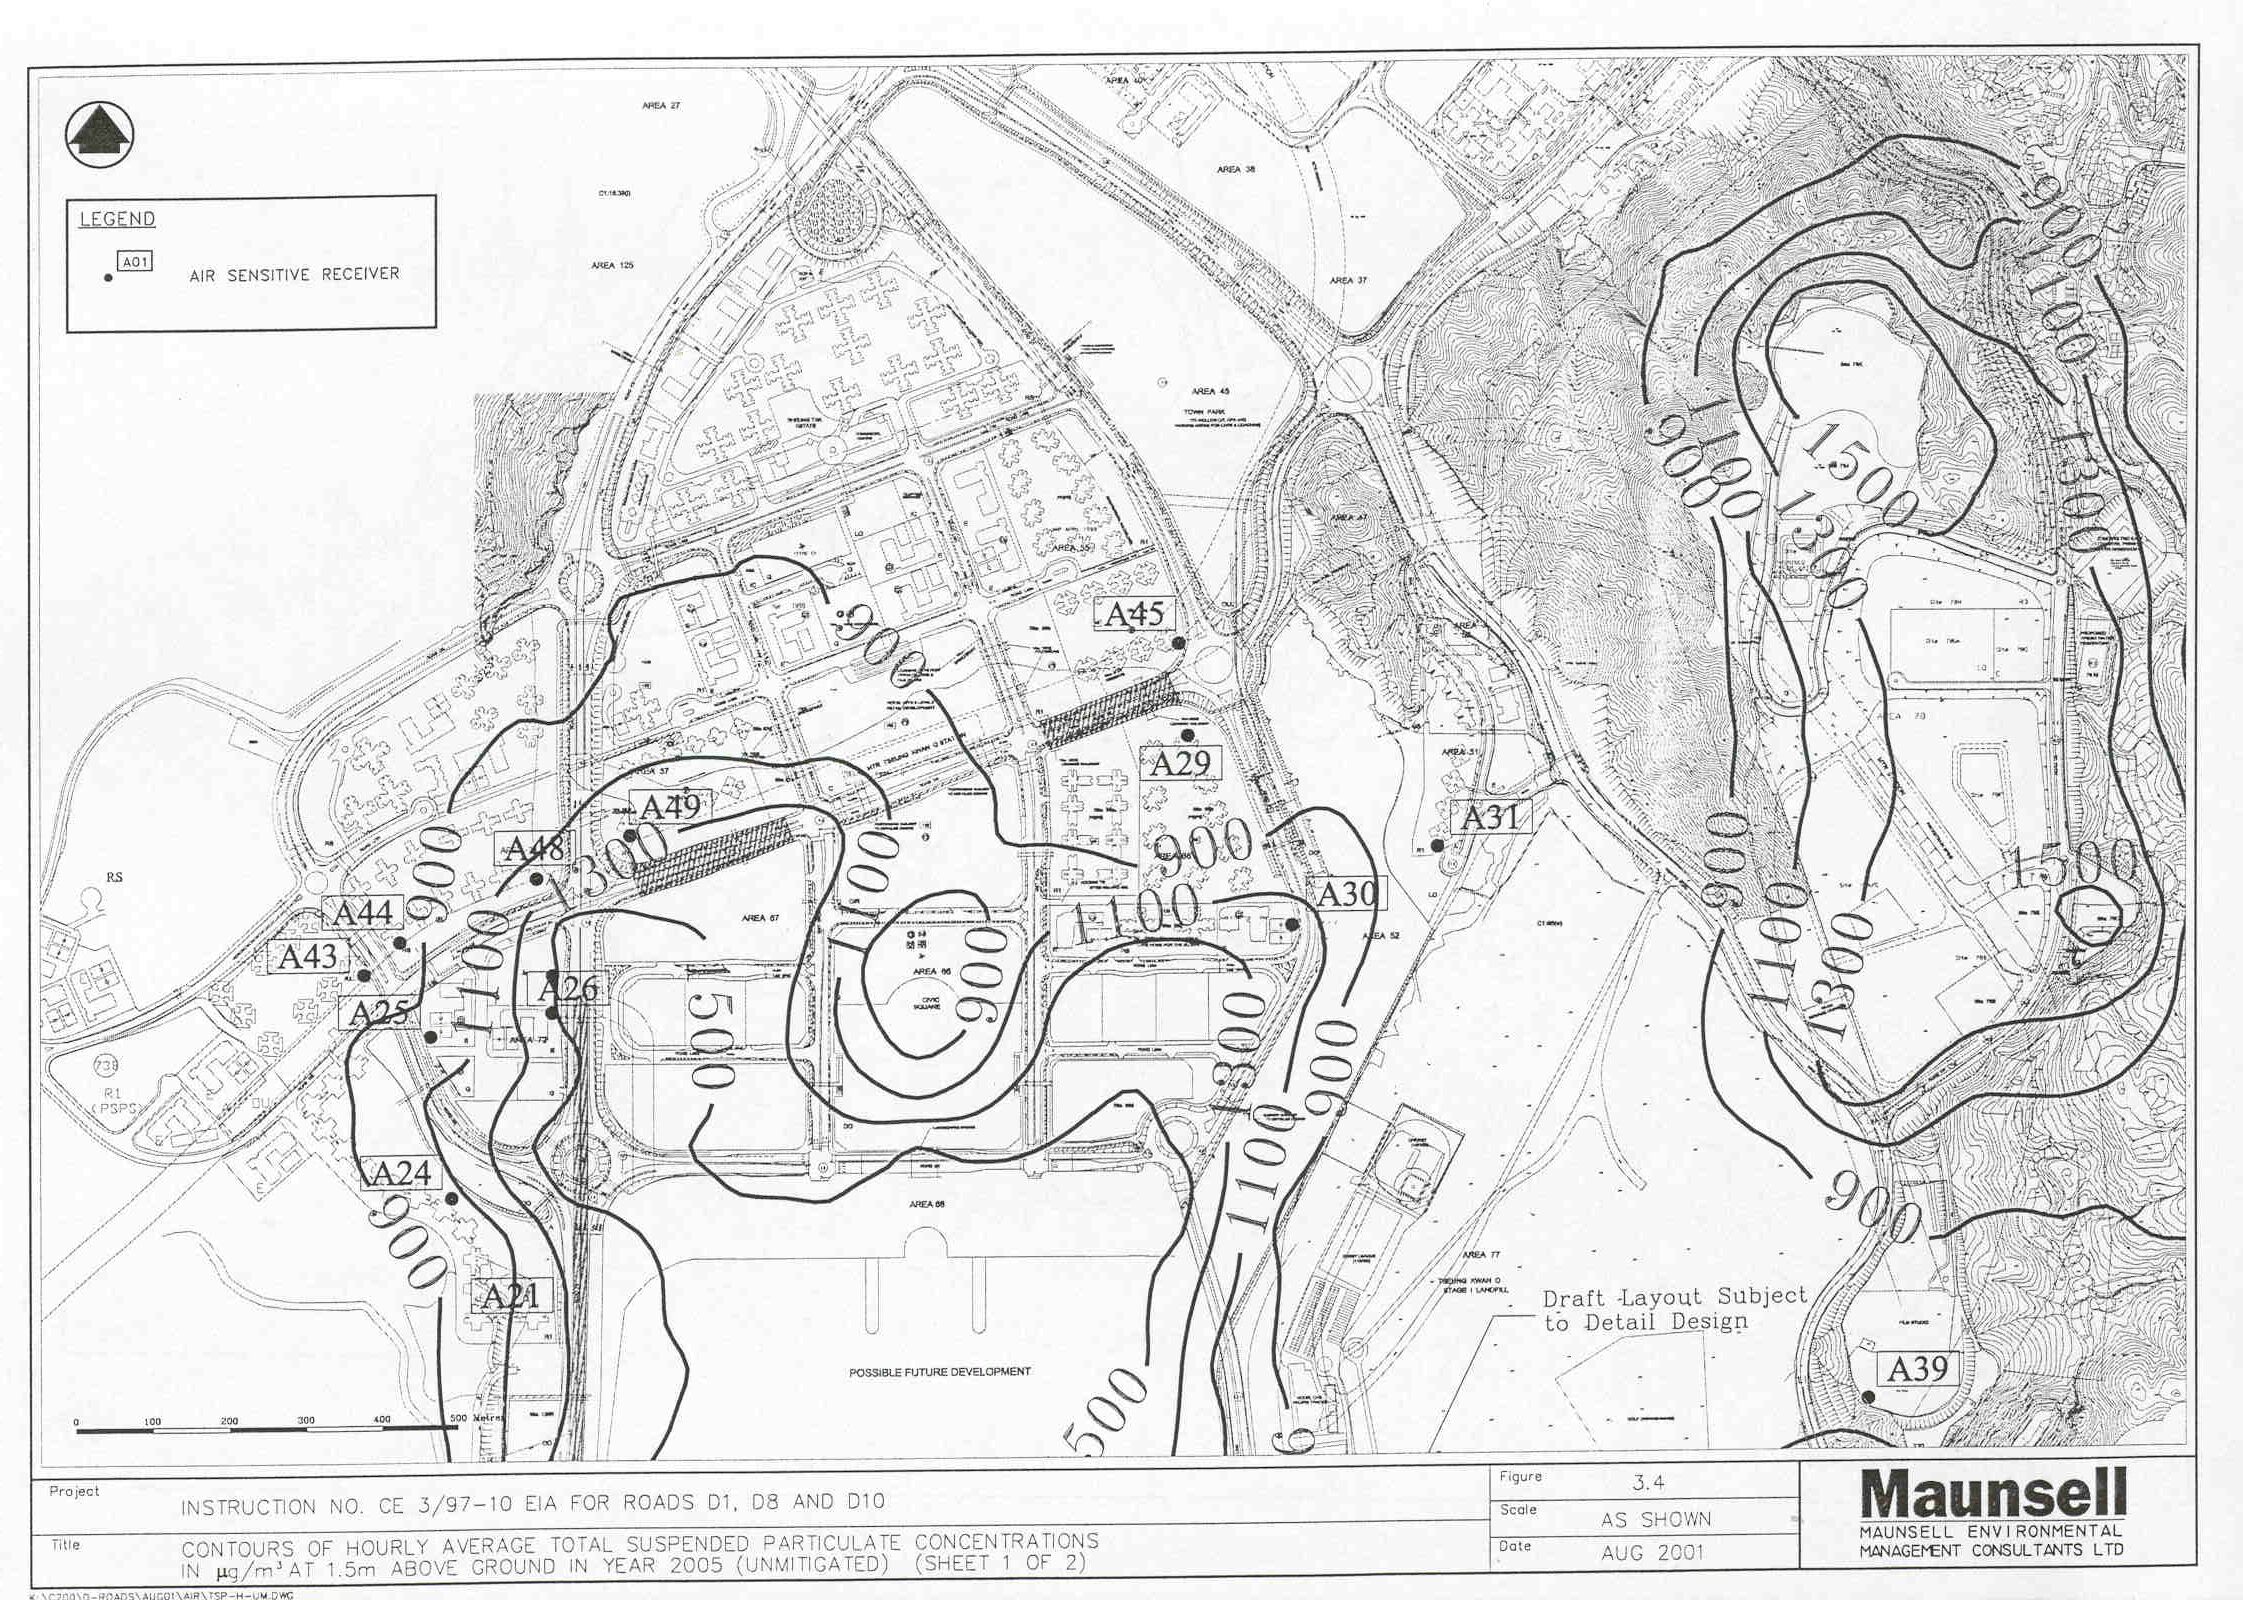
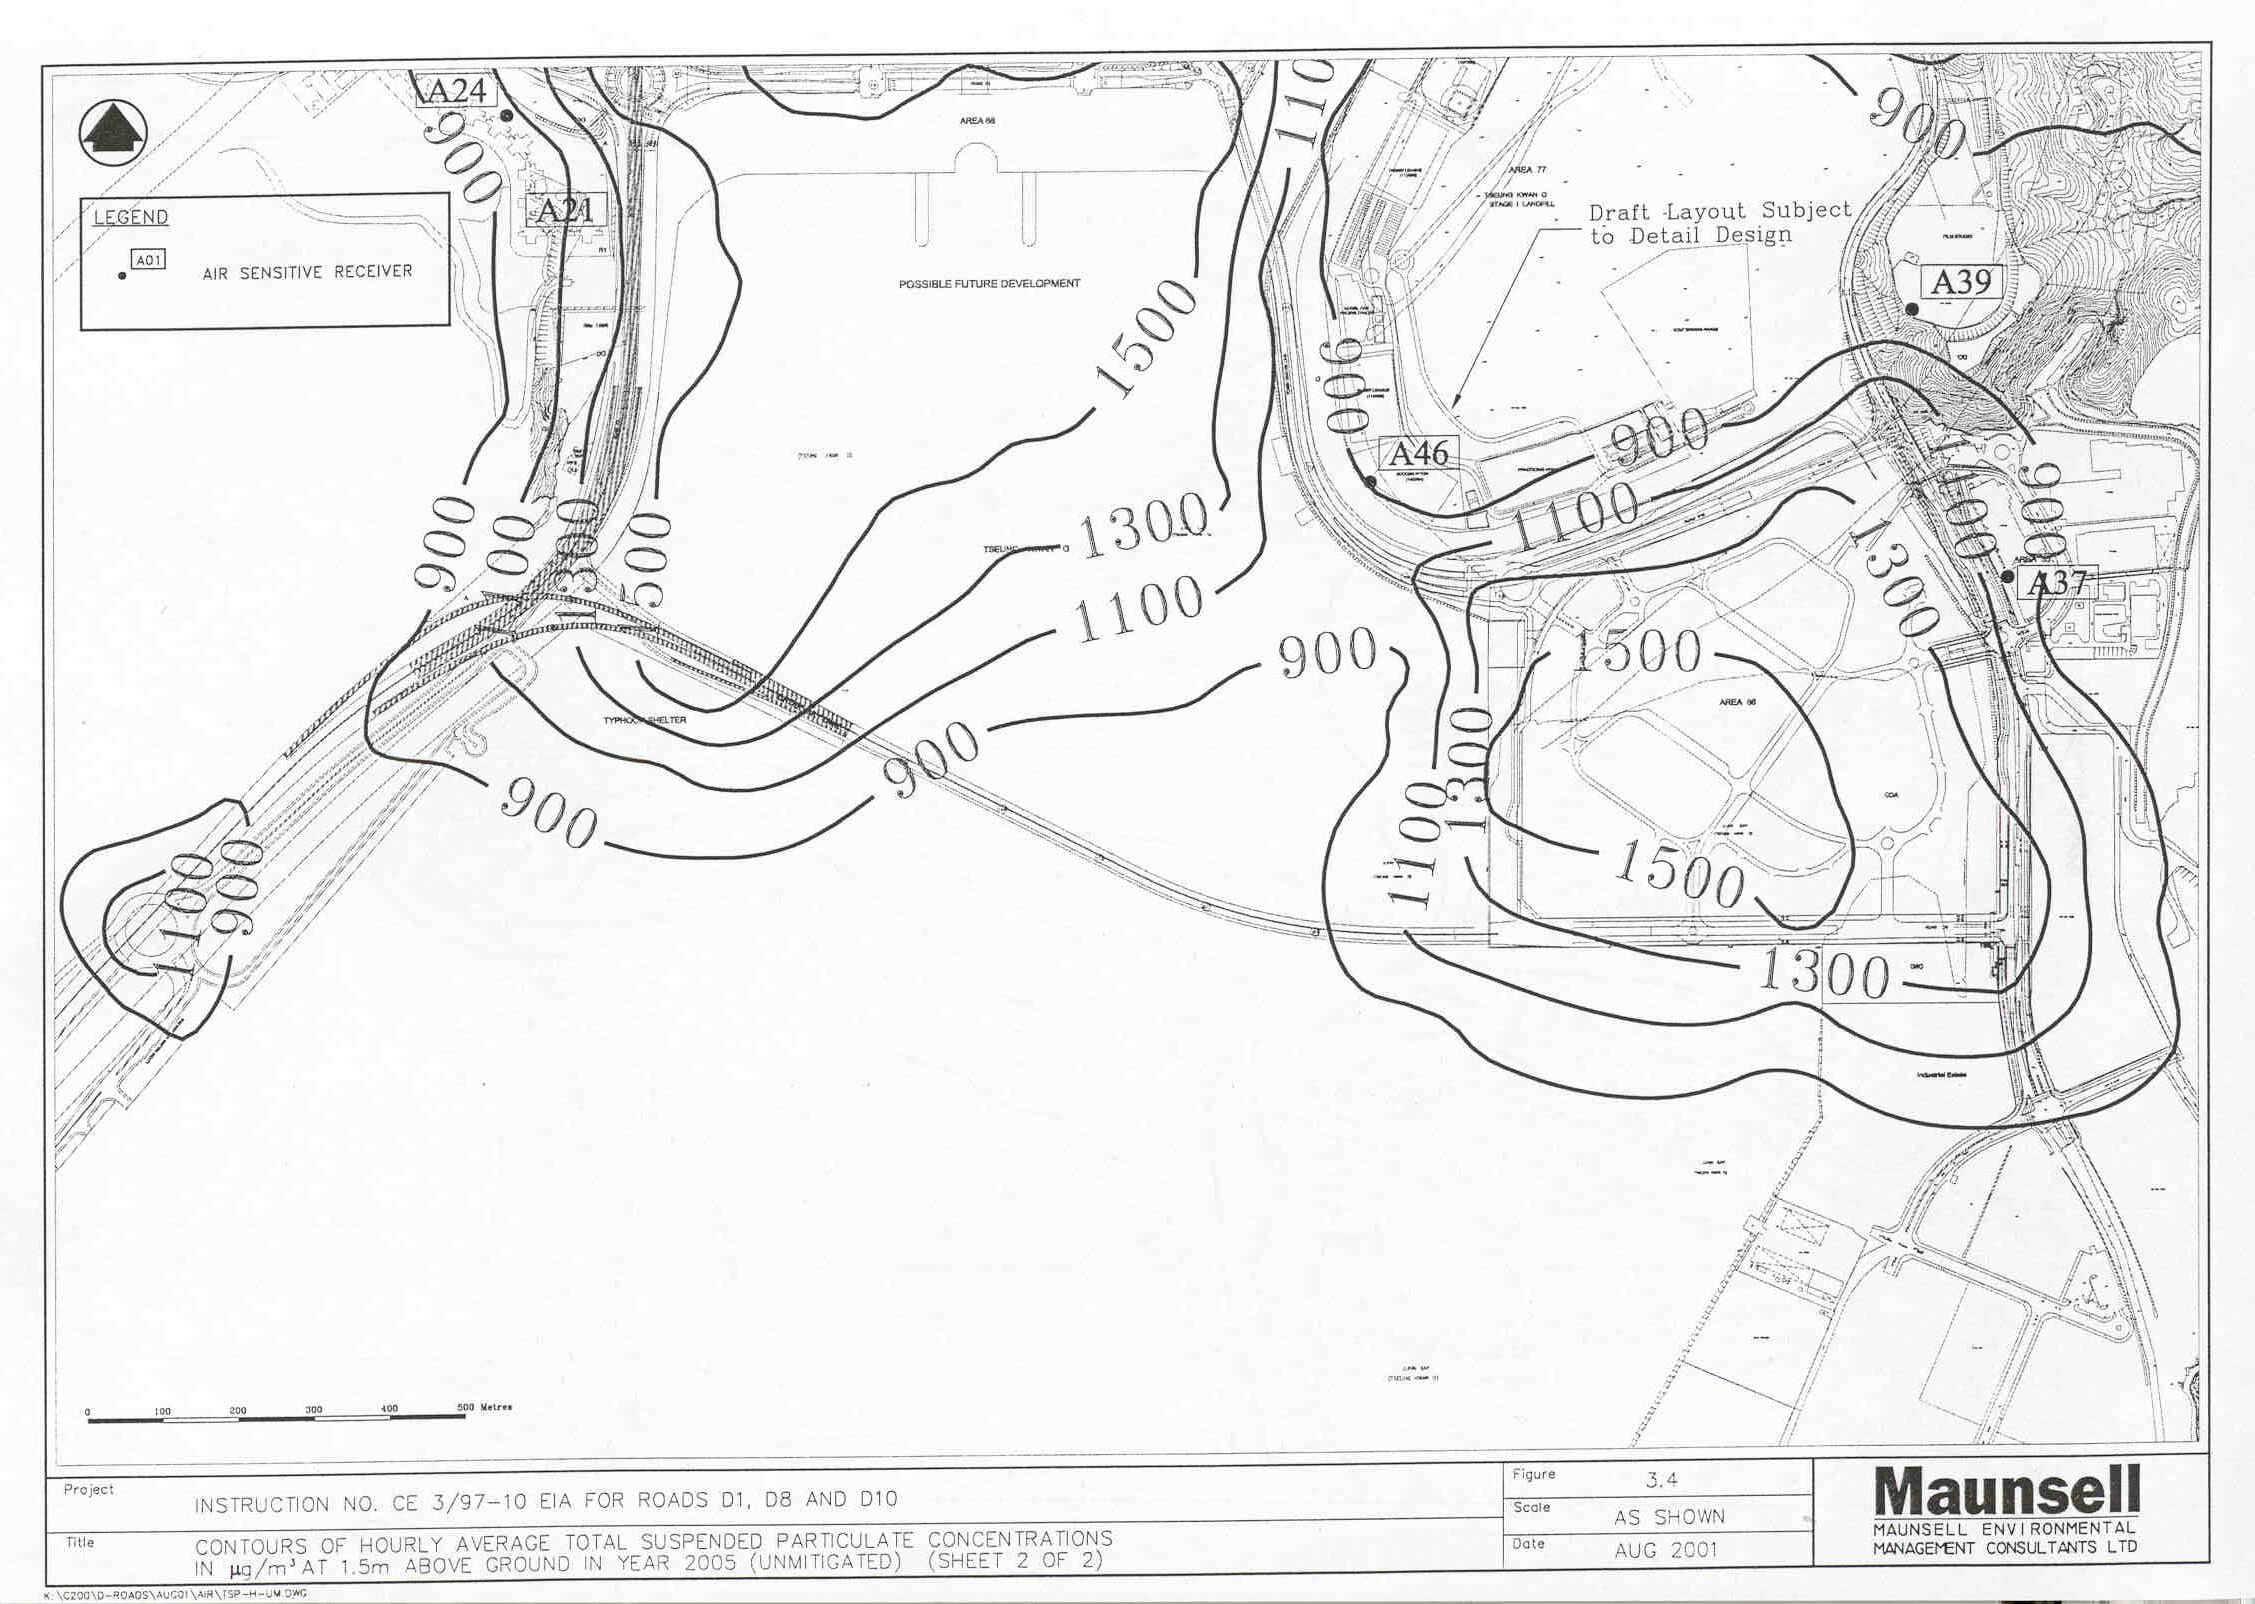
Figure
3.4 Contours of Hourly Average Total
Suspended Particulate Concentrations in mg/m3
at 1.5m above Ground in Year 2005 (Unmitigated) (Sheet 1,
2)
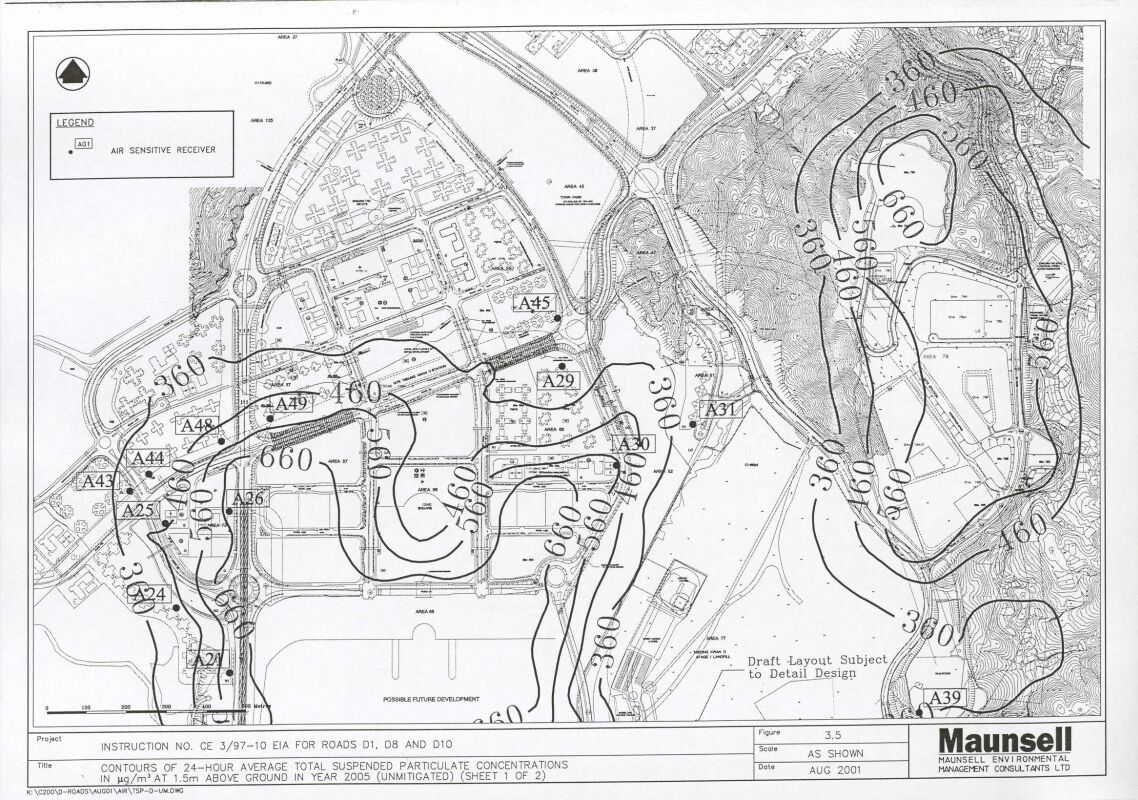
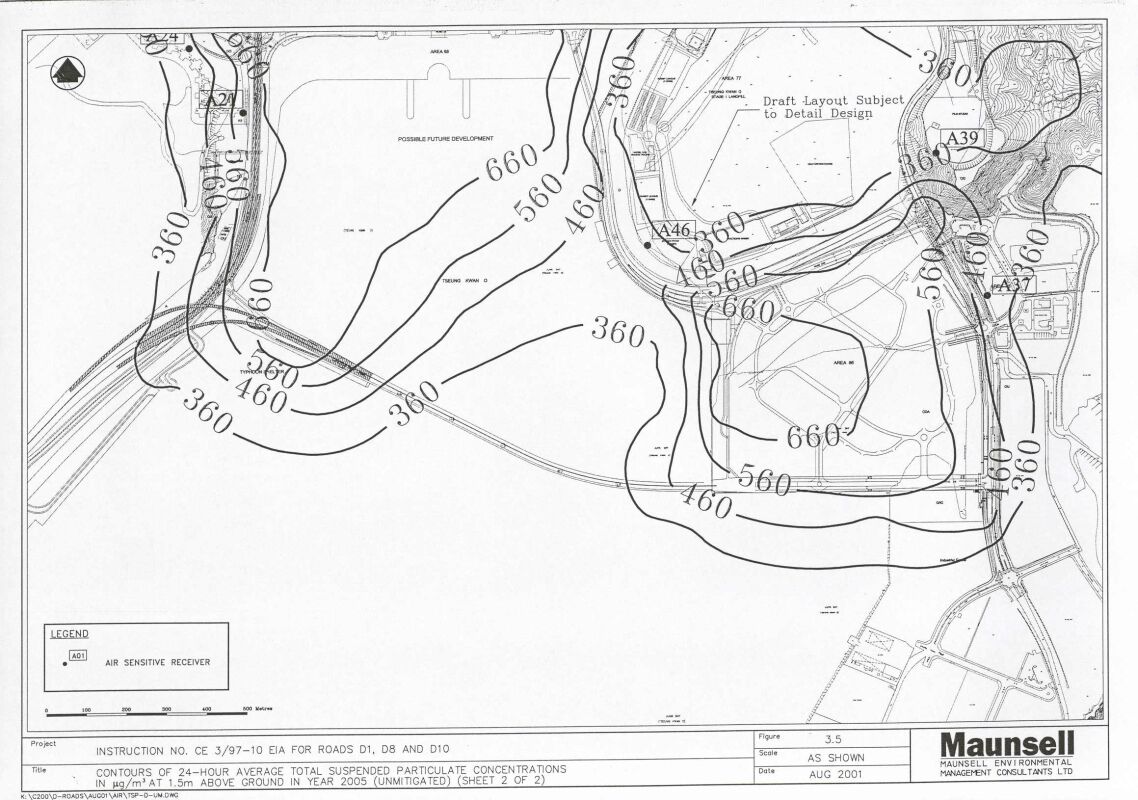
Figure
3.5 Contours of 24-hour Average
Total Suspended Particulate Concentrations in mg/m3
at 1.5m above Ground in Year 2005 (Unmitigated) (Sheet 1,
2)
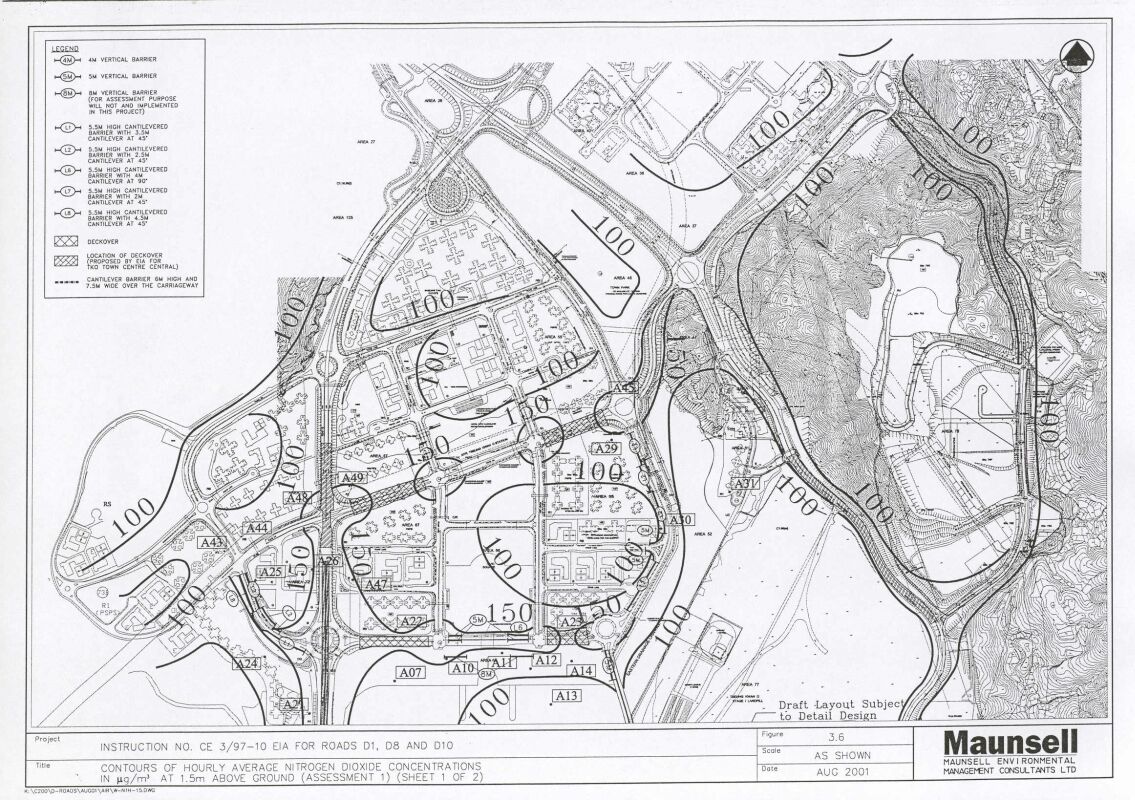
Figure
3.6 Contours of Hourly Average
Nitrogen Dioxide Concentrations in mg/m3
at 1.5m above Ground (Assessment 1) (Sheet 1, 2)
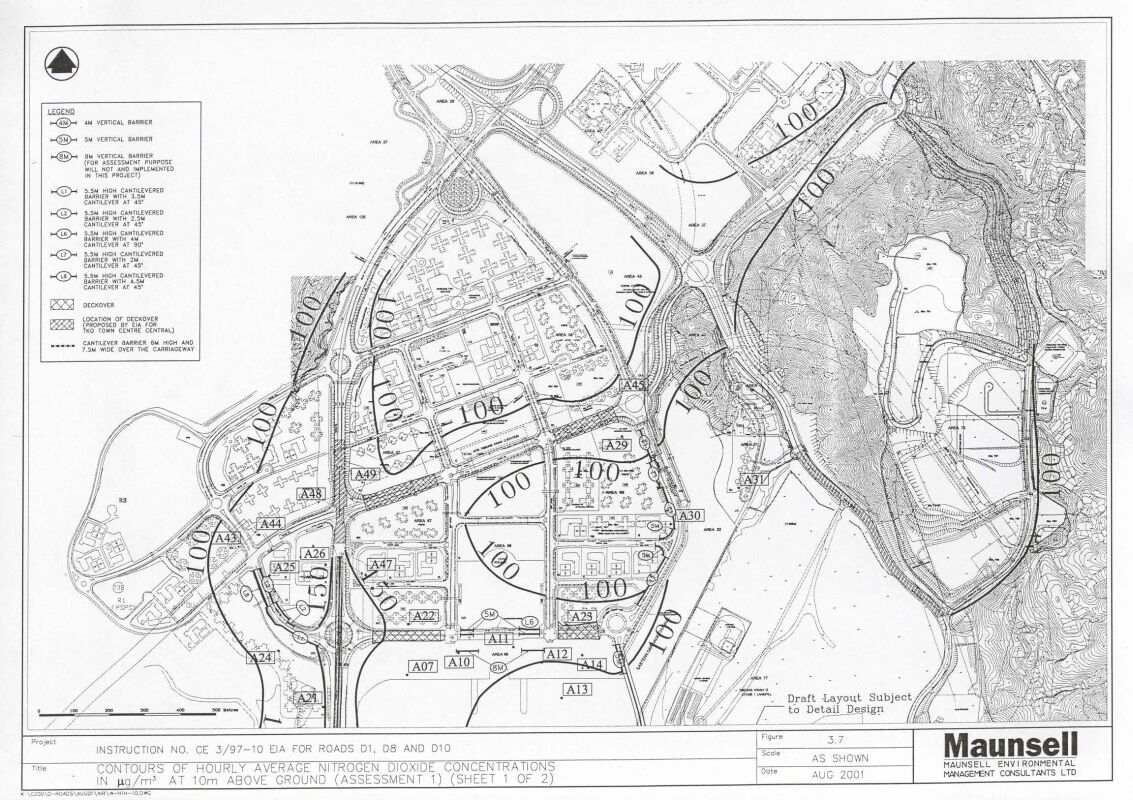
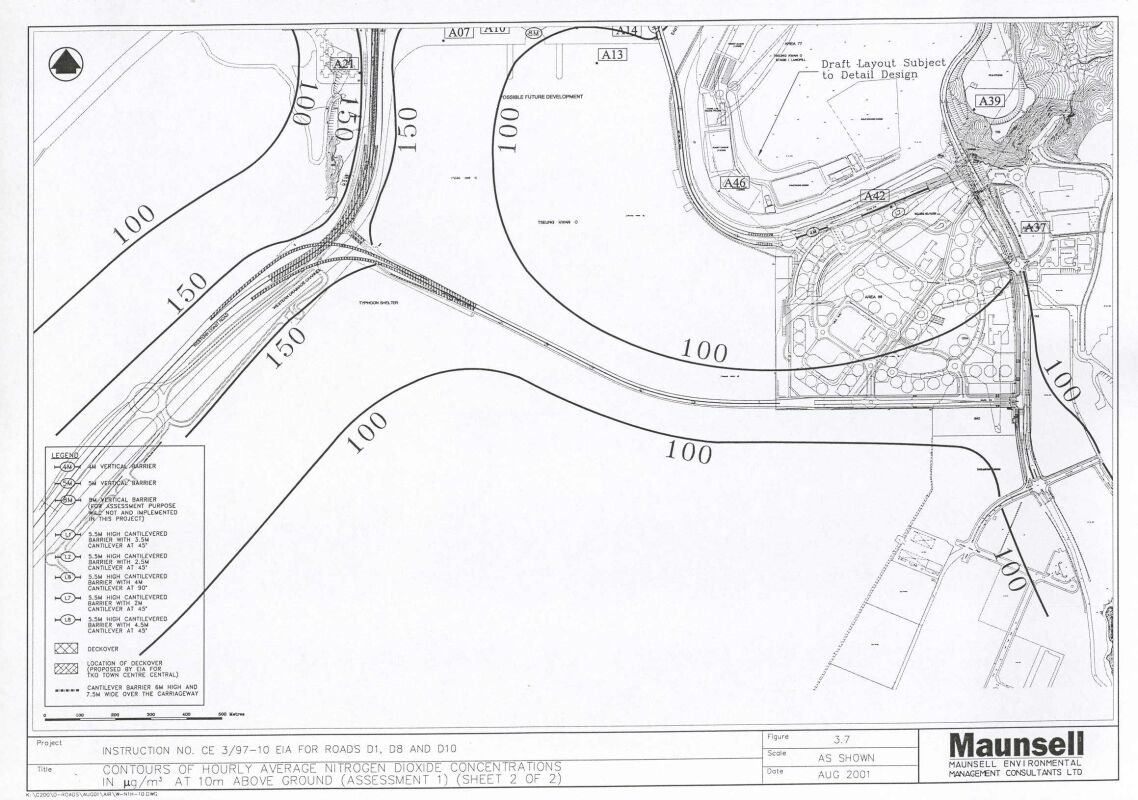
Figure
3.7 Contours of Hourly Average
Nitrogen Dioxide Concentrations in mg/m3
at 10m above Ground (Assessment 1) (Sheet 1, 2)
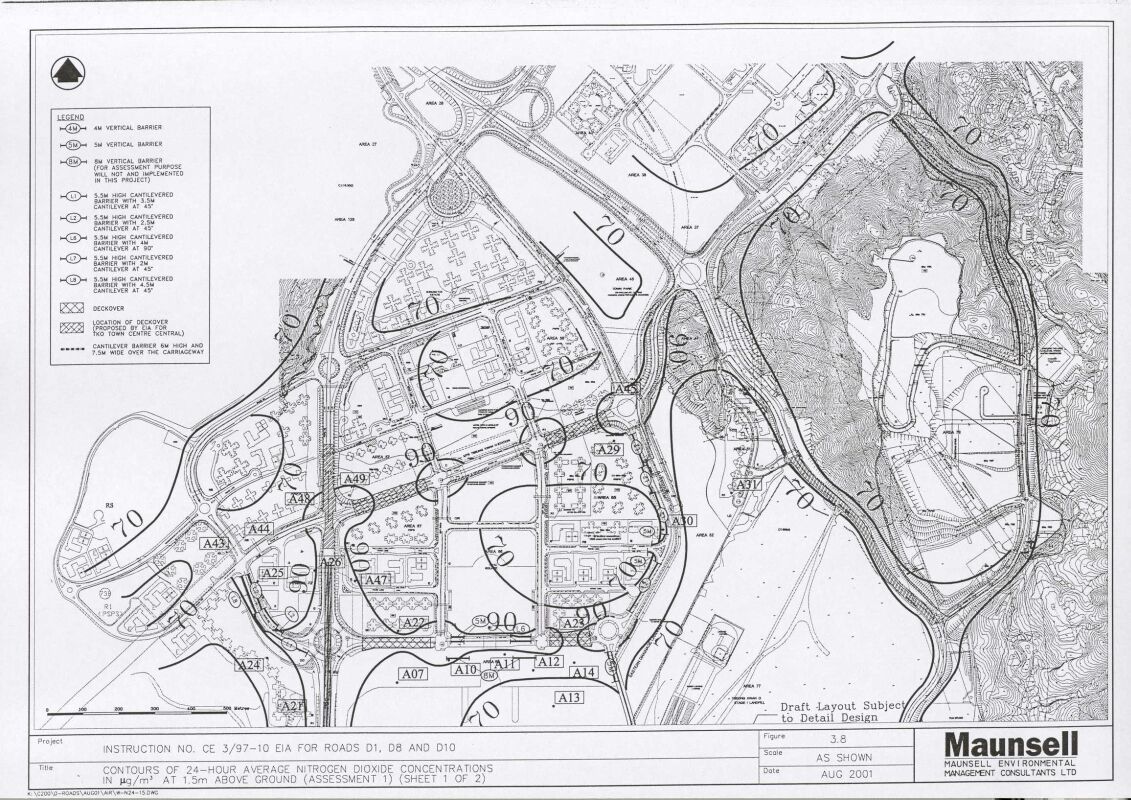
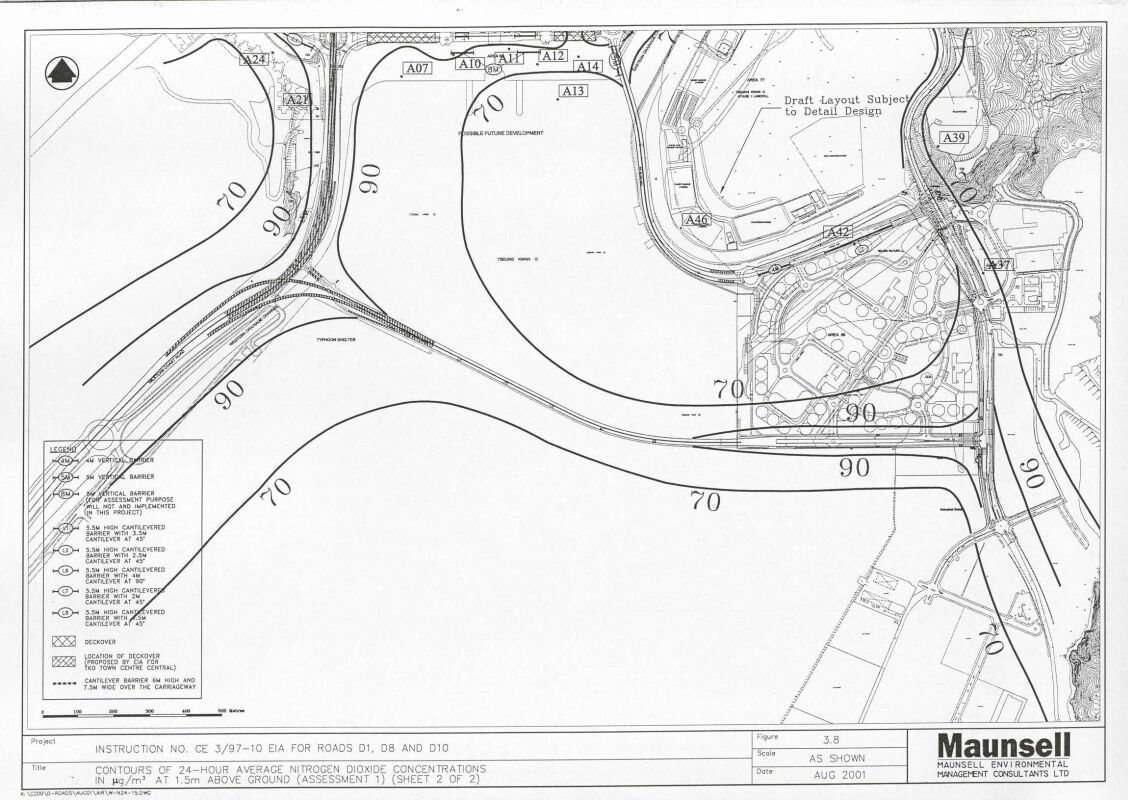
Figure
3.8 Contours of 24-Hour Average
Nitrogen Dioxide Concentrations in mg/m3
at 1.5m above Ground (Assessment 1) (Sheet 1, 2)
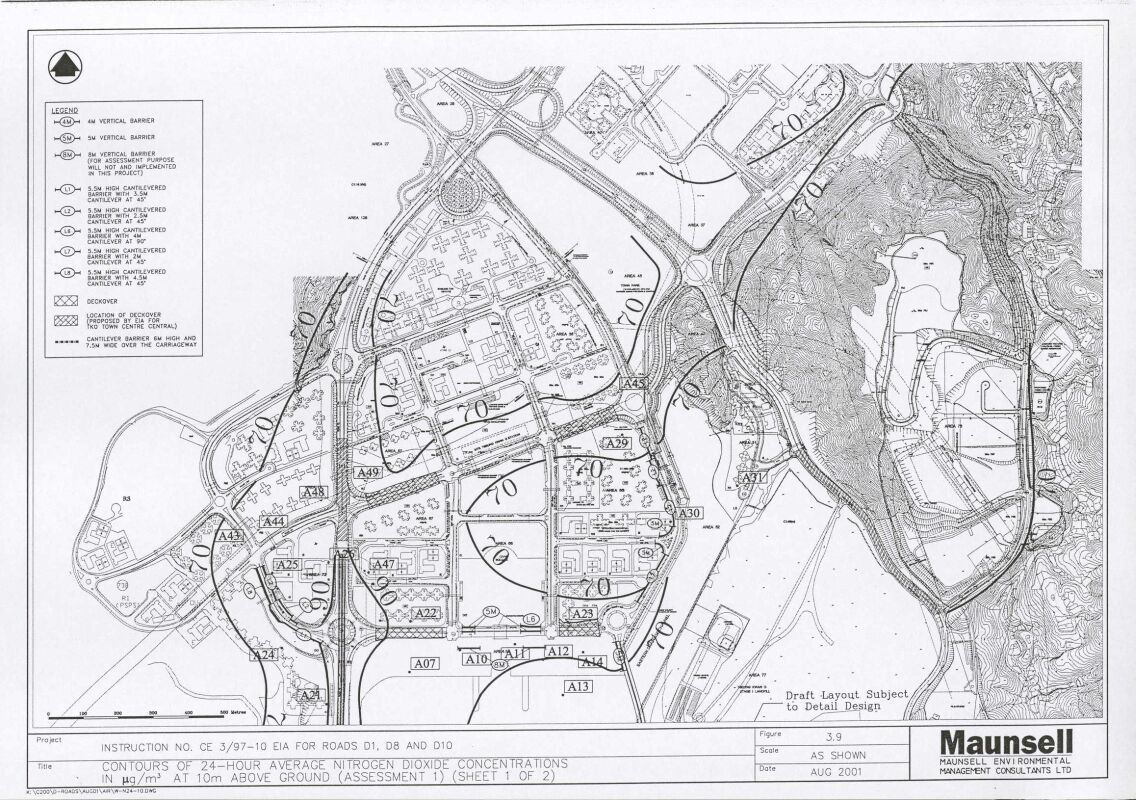
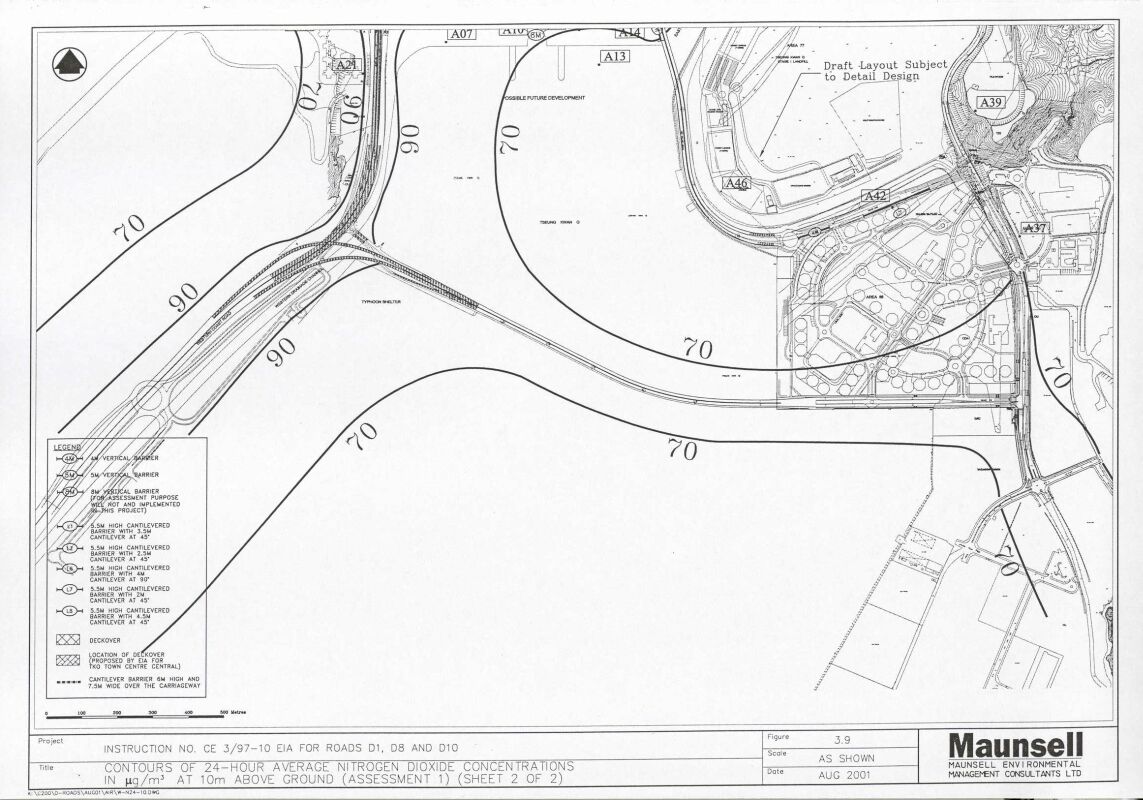
Figure
3.9 Contours of 24-Hour Average
Nitrogen Dioxide Concentrations in mg/m3
at 10m above Ground (Assessment 1) (Sheet 1, 2)
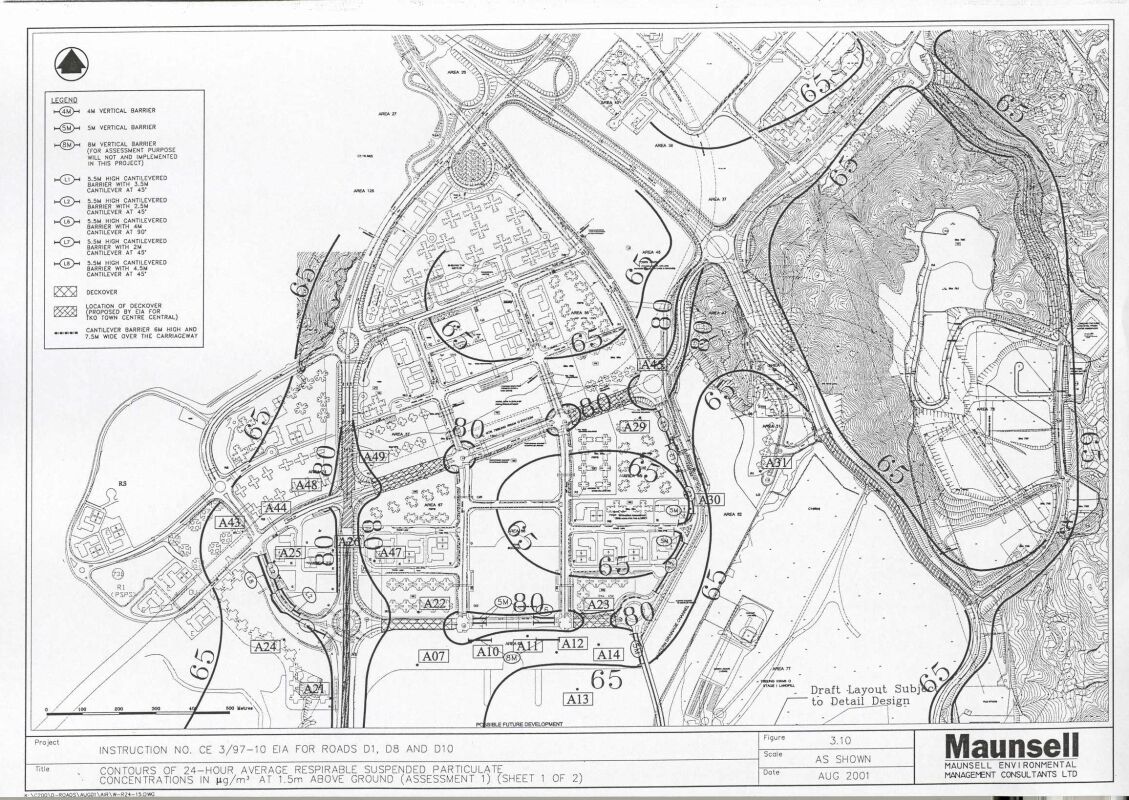
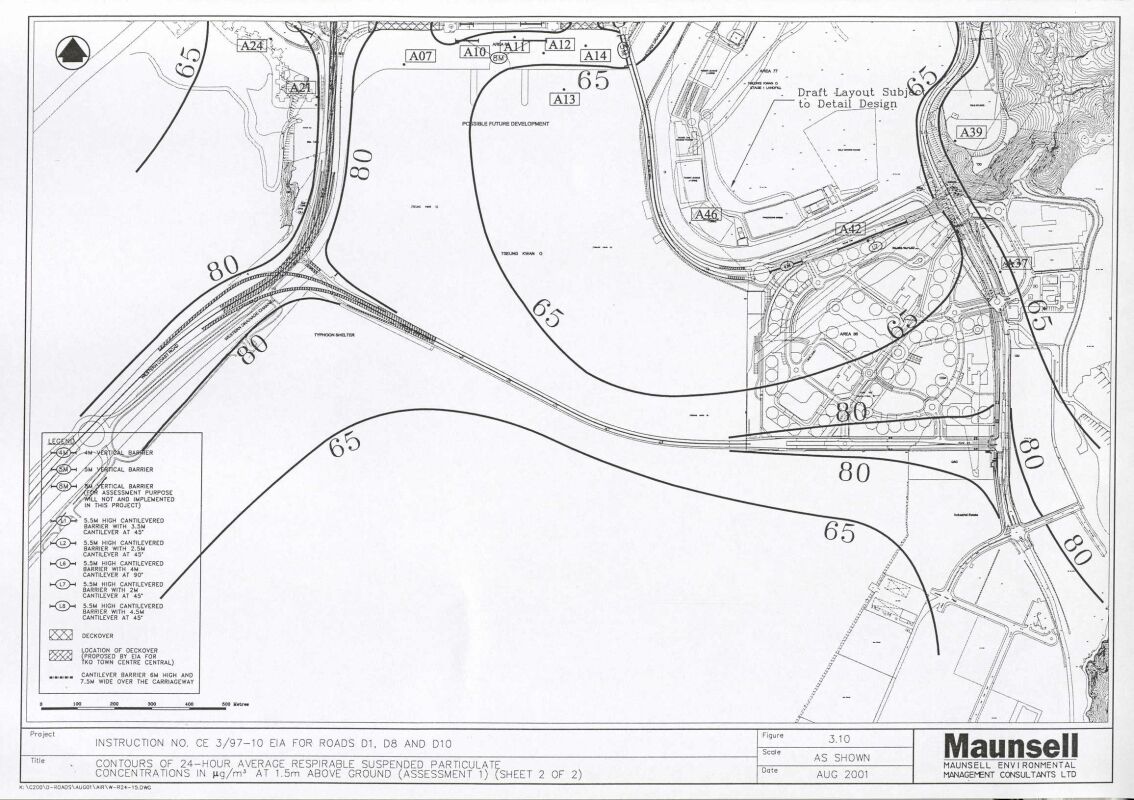
Figure
3.10 Contours of 24-hour average
Respirable Suspended Particulate Concentrations in mg/m3
at 1.5m above Ground (Assessment 1) (Sheet 1,
2)
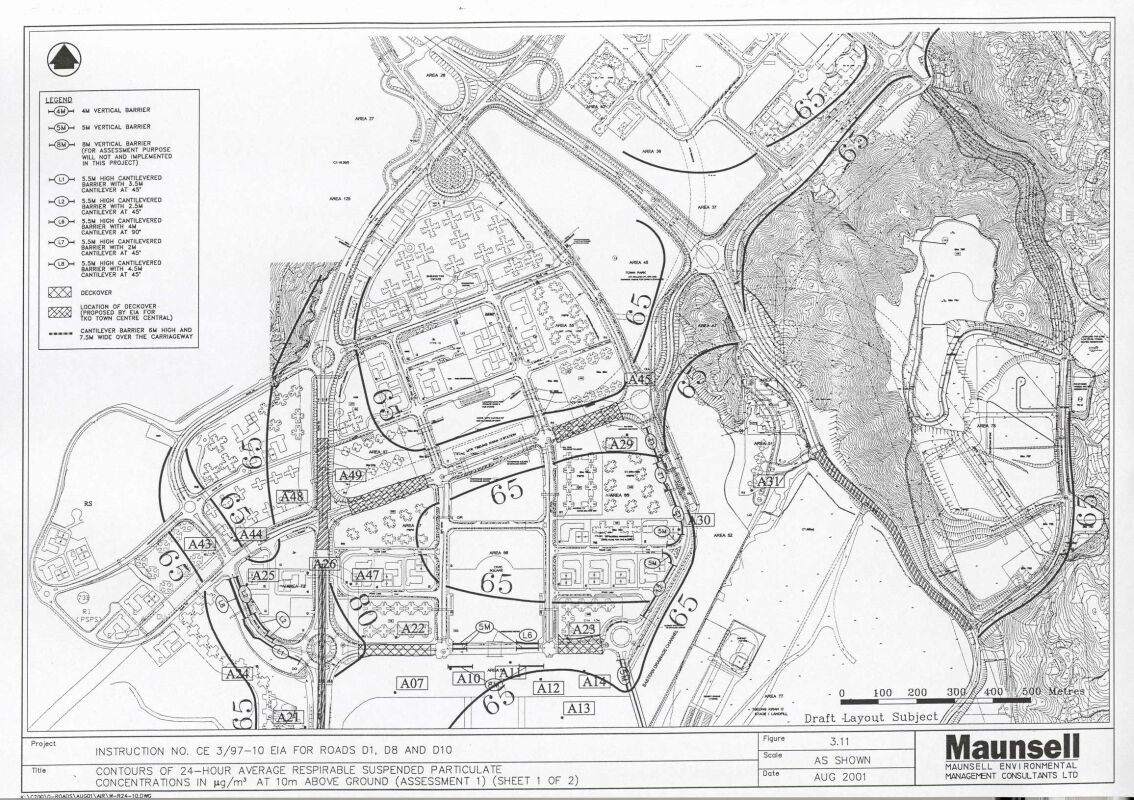
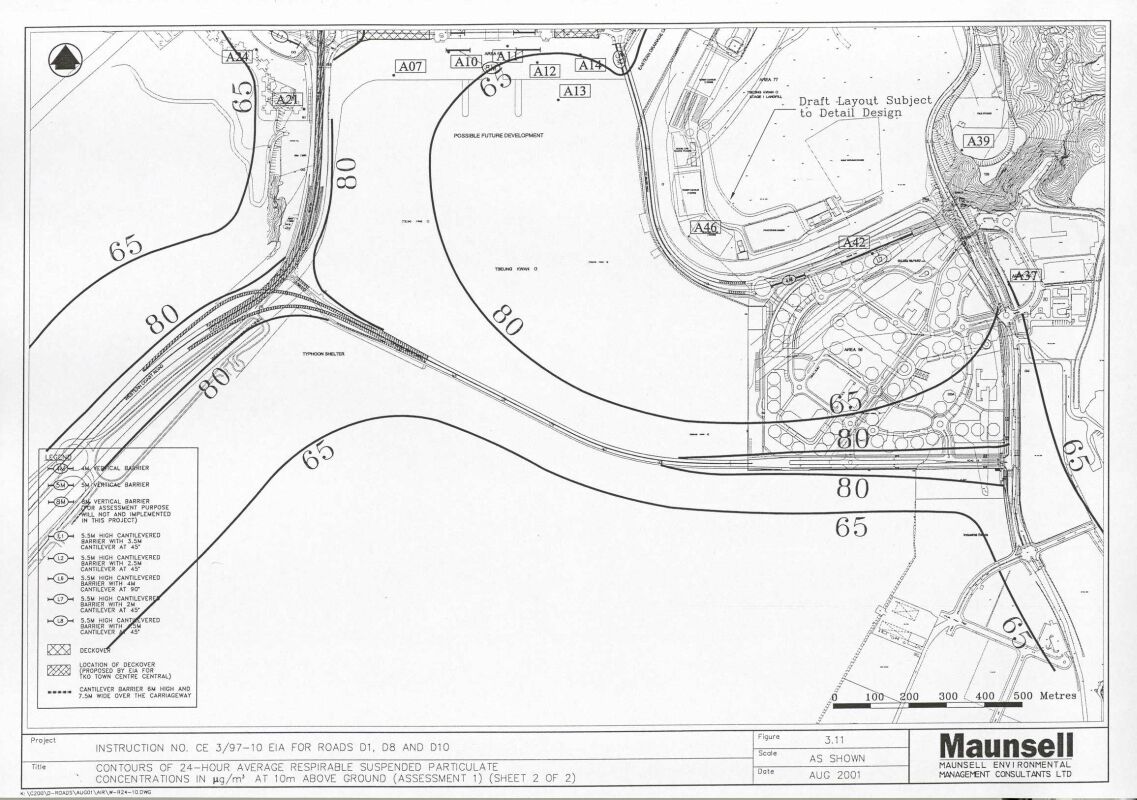
Figure
3.11 Contours of 24-hour average
Respirable Suspended Particulate Concentrations in mg/m3
at 10m above Ground (Assessment 1) (Sheet 1, 2)
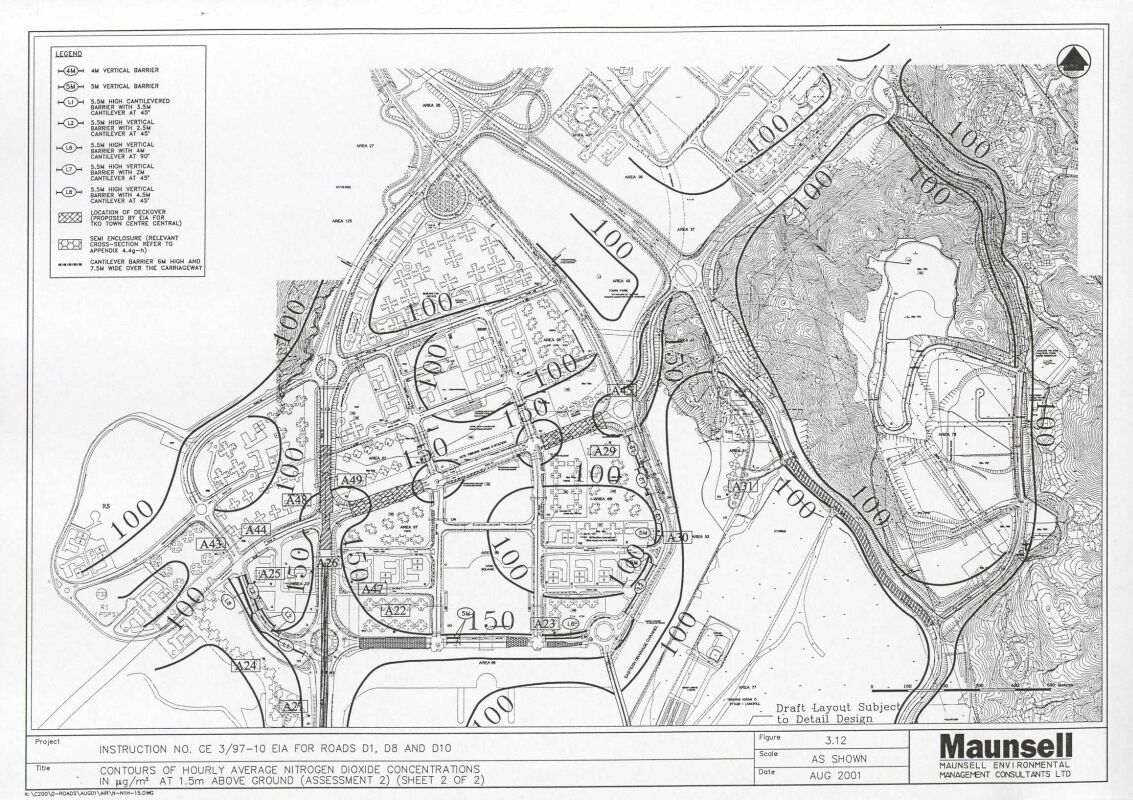
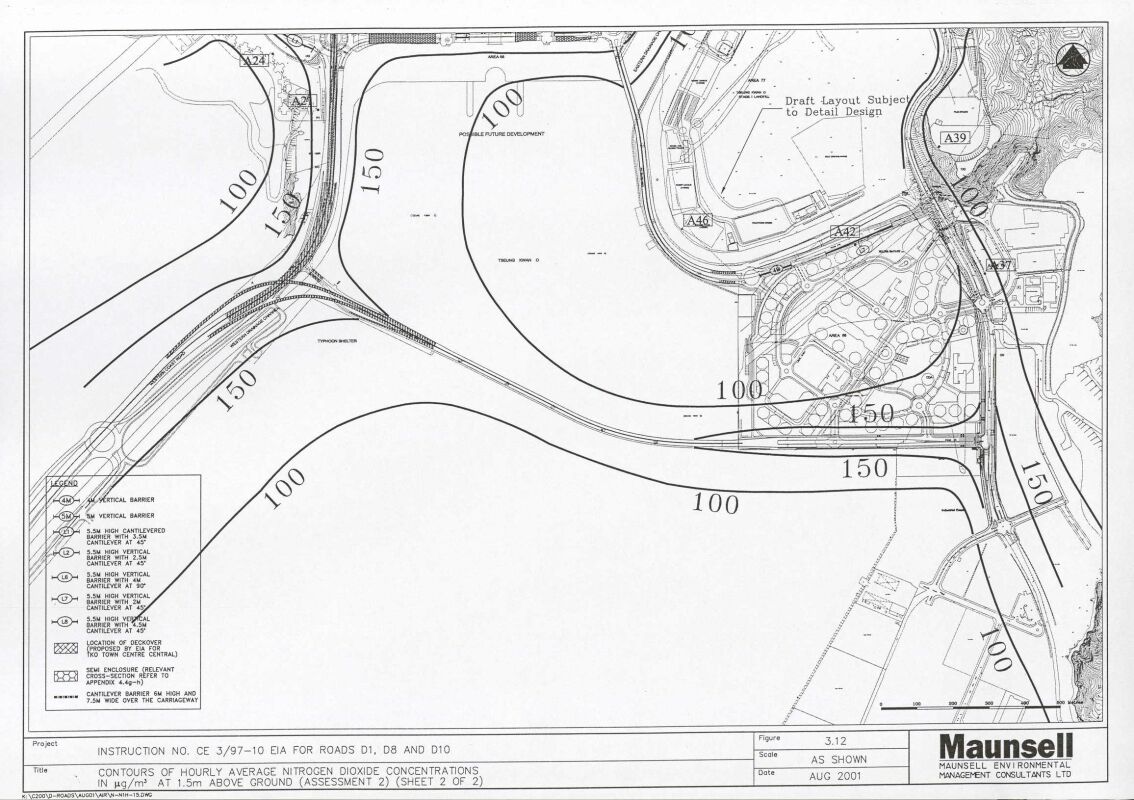
Figure
3.12 Contours of Hourly Average
Nitrogen Dioxide Concentrations in mg/m3
at 1.5m above Ground (Assessment 2) (Sheet 1,
2)
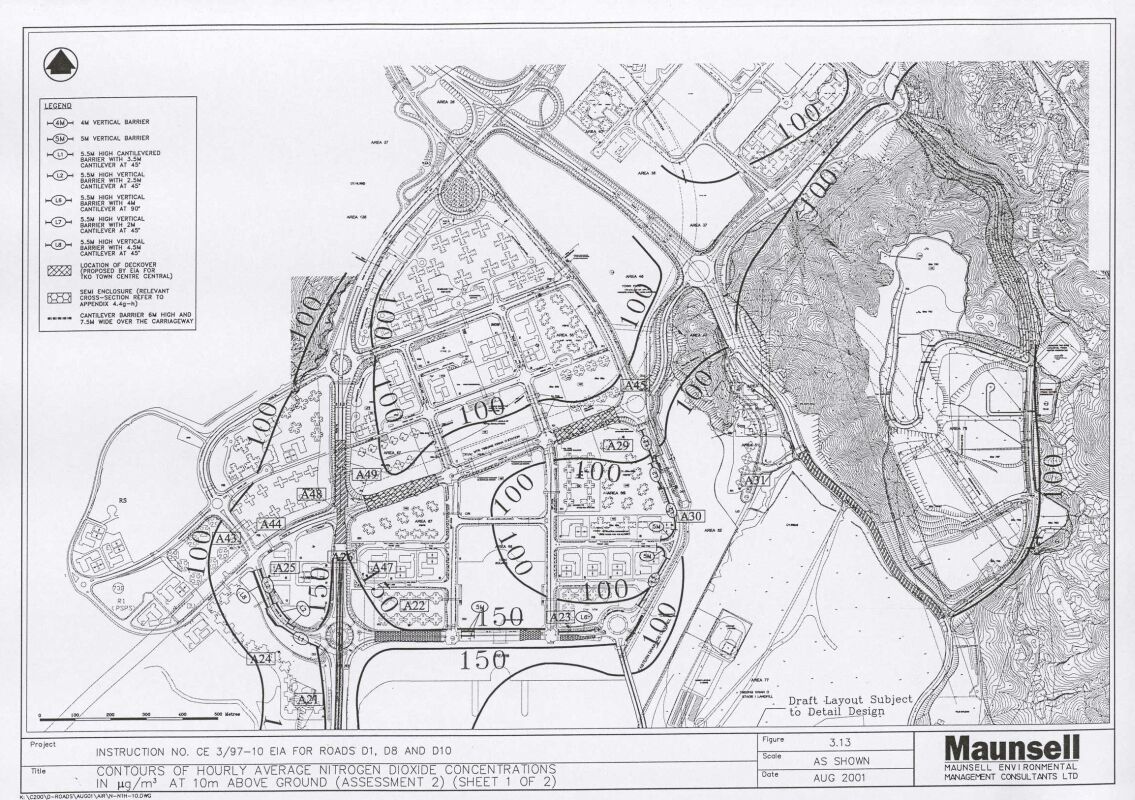
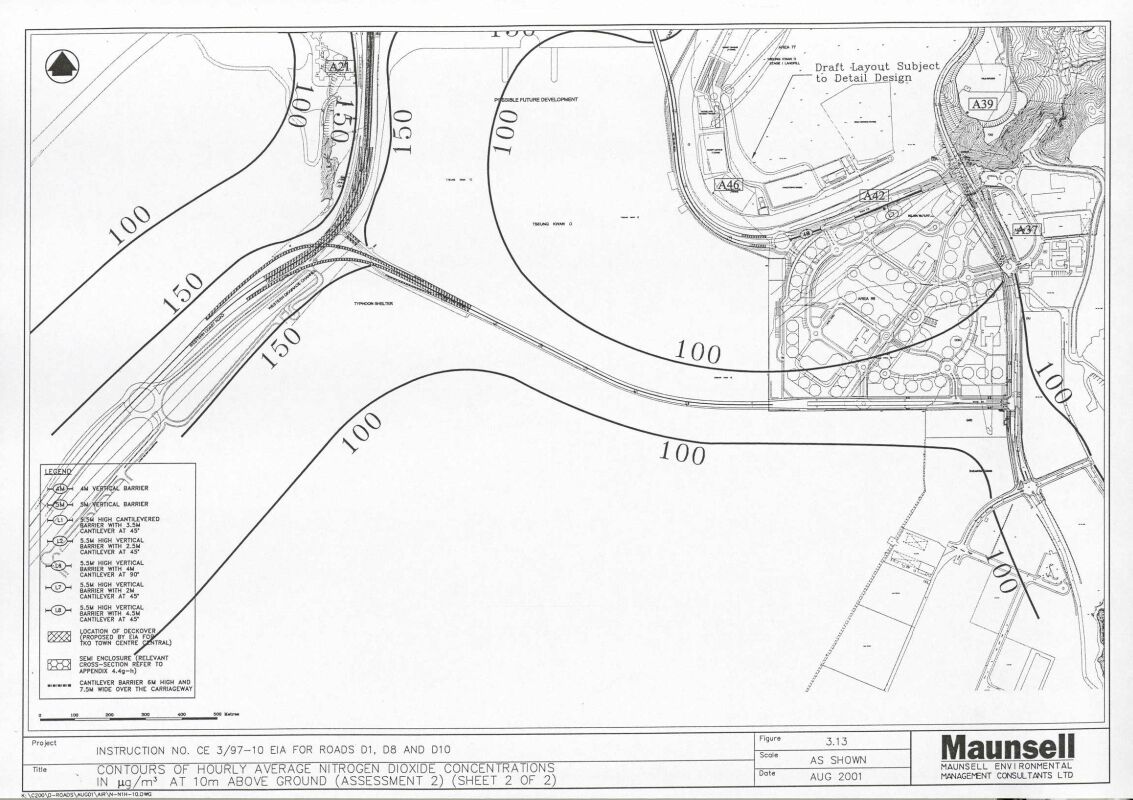
Figure
3.13 Contours of Hourly Average
Nitrogen Dioxide Concentrations in mg/m3
at 10m above Ground (Assessment 2) (Sheet 1, 2)
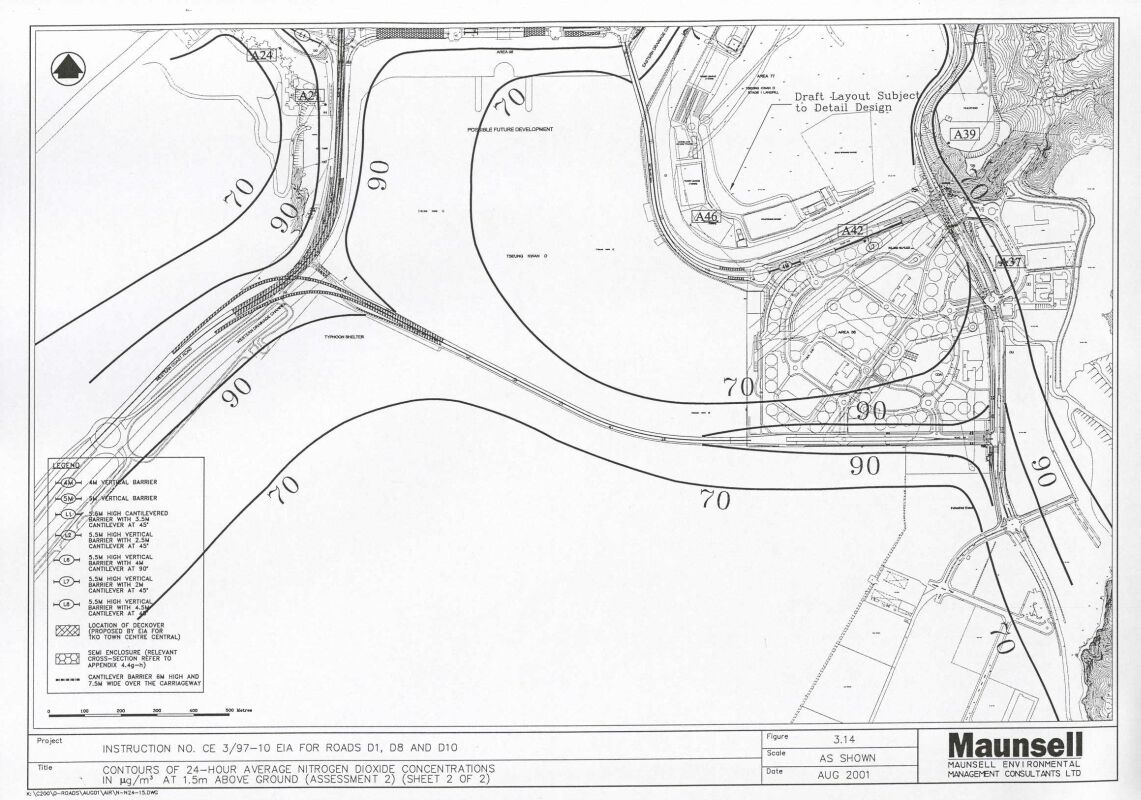
Figure
3.14 Contours of 24-Hour Average
Nitrogen Dioxide Concentrations in mg/m3
at 1.5m above Ground (Assessment 2) (Sheet 1,
2)
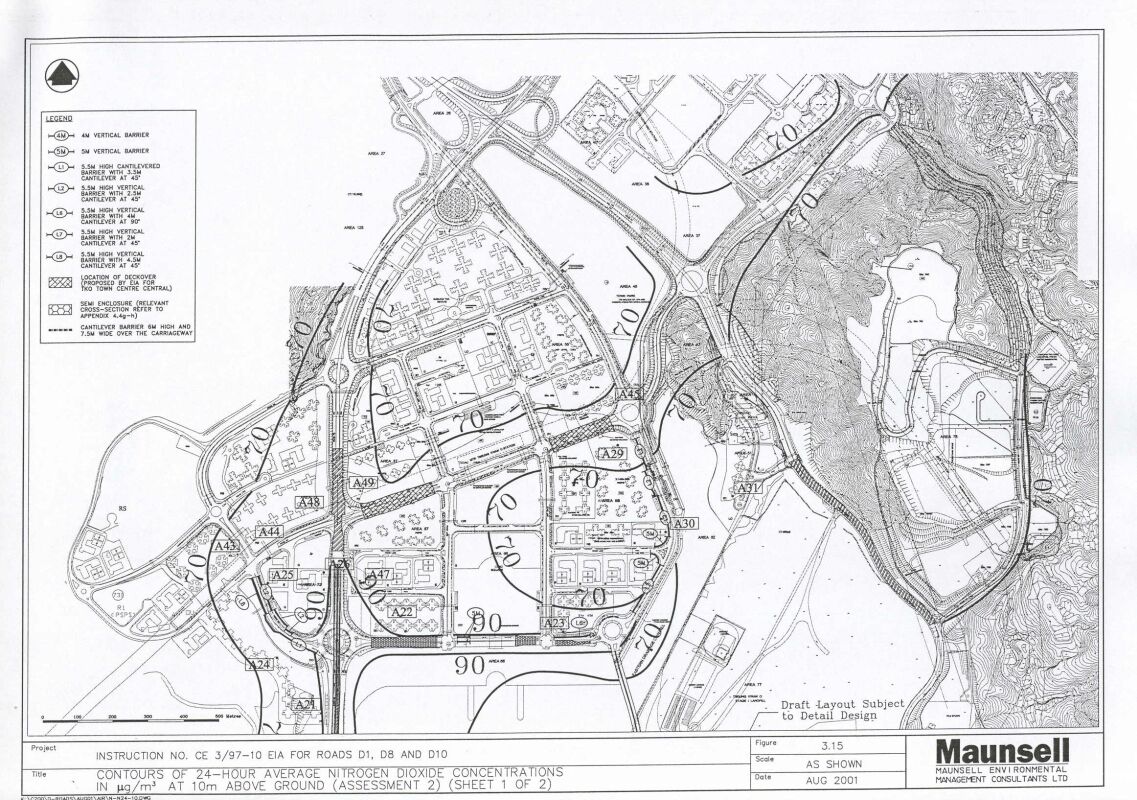
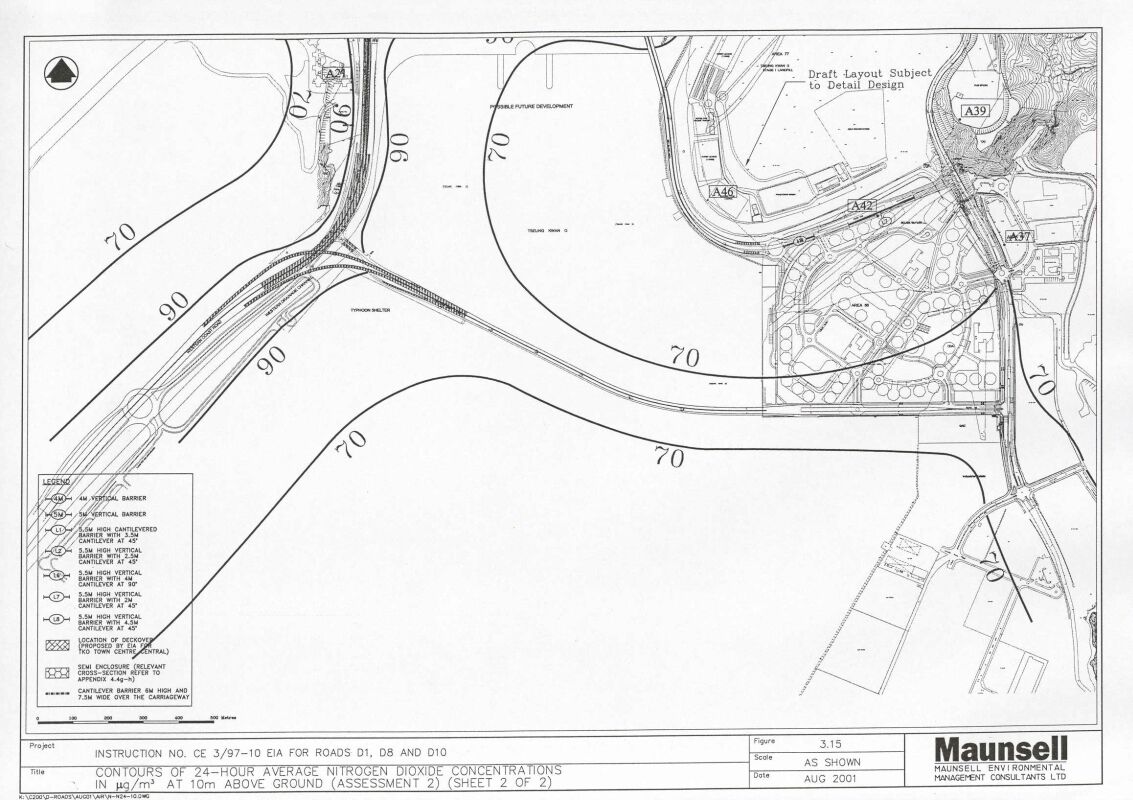
Figure
3.15 Contours of 24-Hour Average
Nitrogen Dioxide Concentrations in mg/m3
at 10m above Ground (Assessment 2) (Sheet 1, 2)
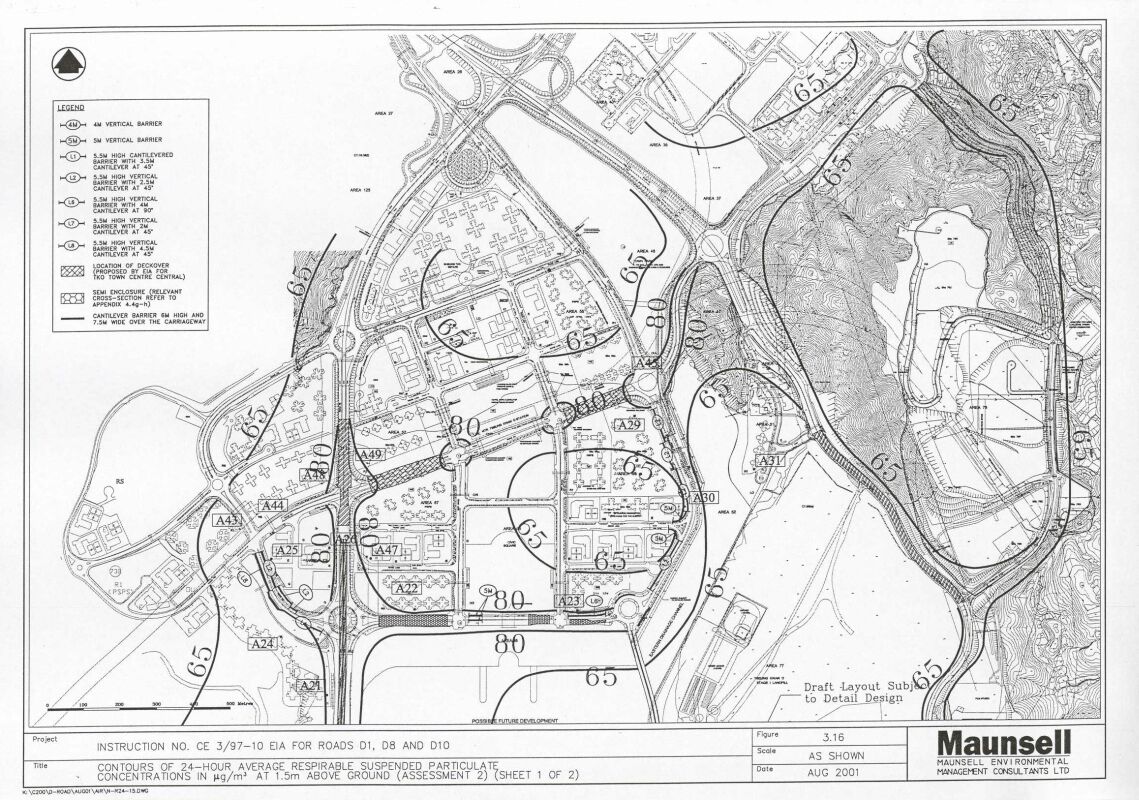
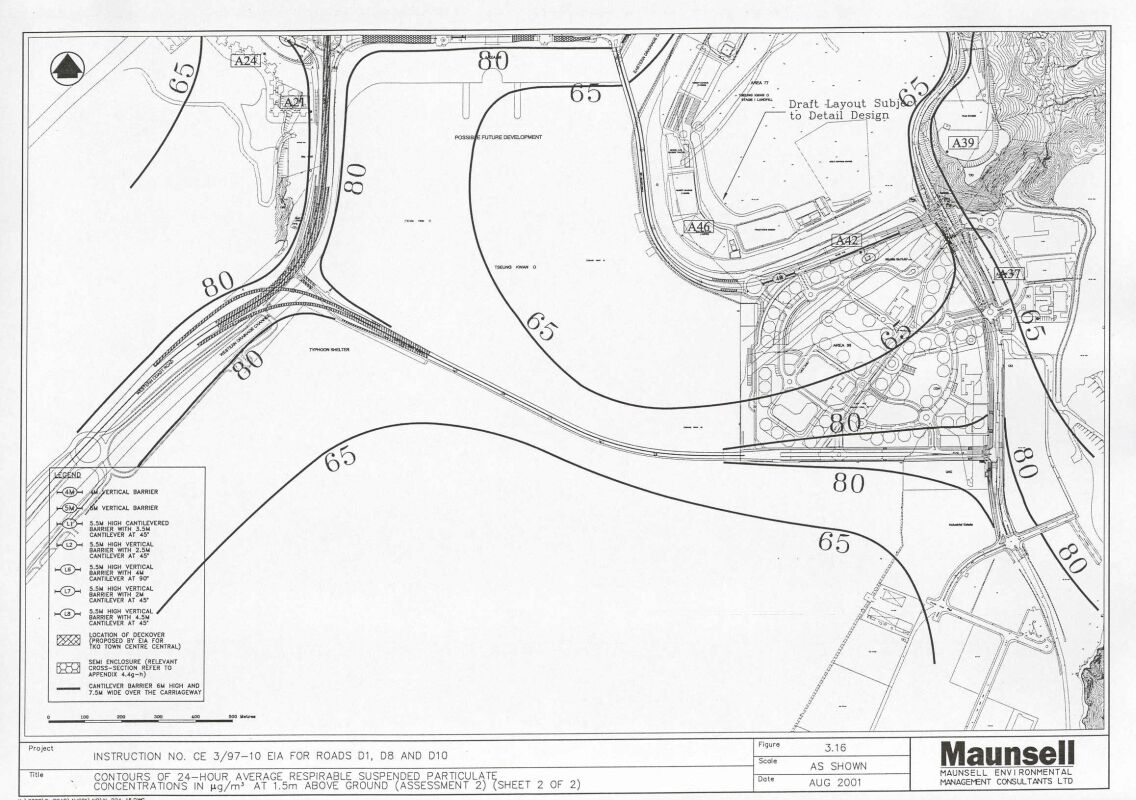
Figure
3.16 Contours of 24-hour average
Respirable Suspended Particulate Concentrations in mg/m3
at 15.m above Ground (Assessment 2) (Sheet 1,
2)
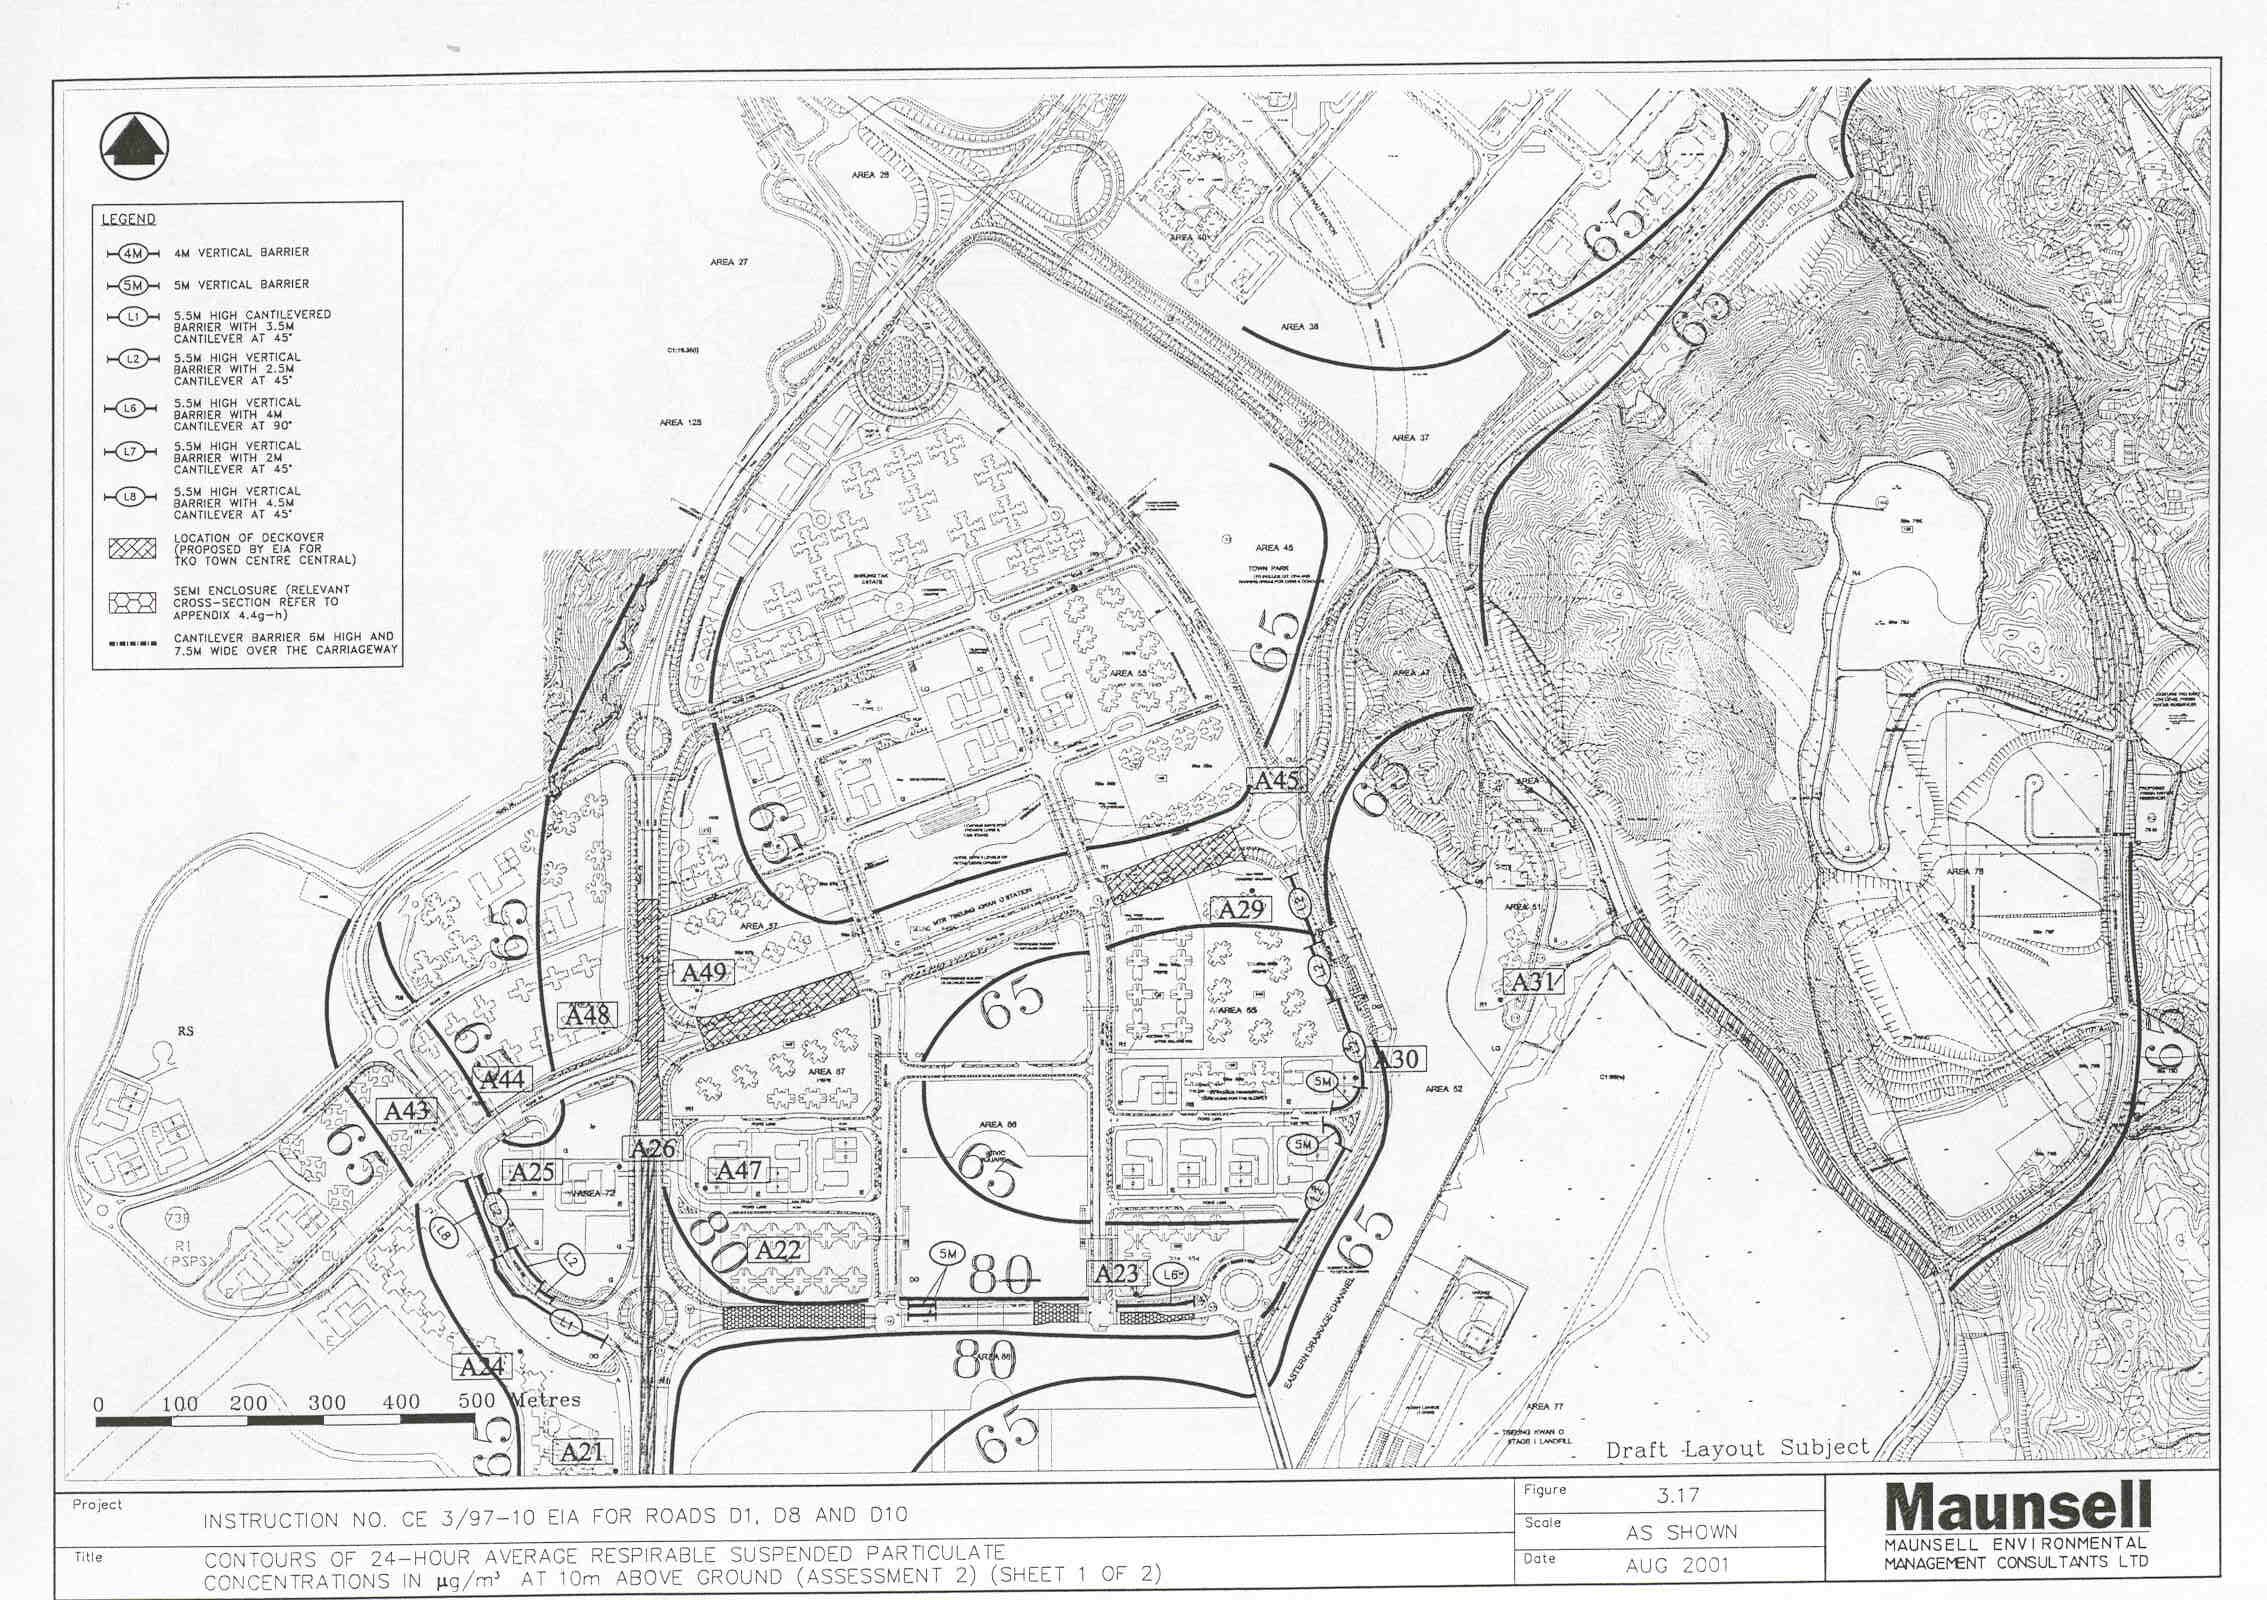
Figure
3.17 Contours of 24-hour average
Respirable Suspended Particulate Concentrations in mg/m3
at 10m above Ground (Assessment 2) (Sheet 1, 2)
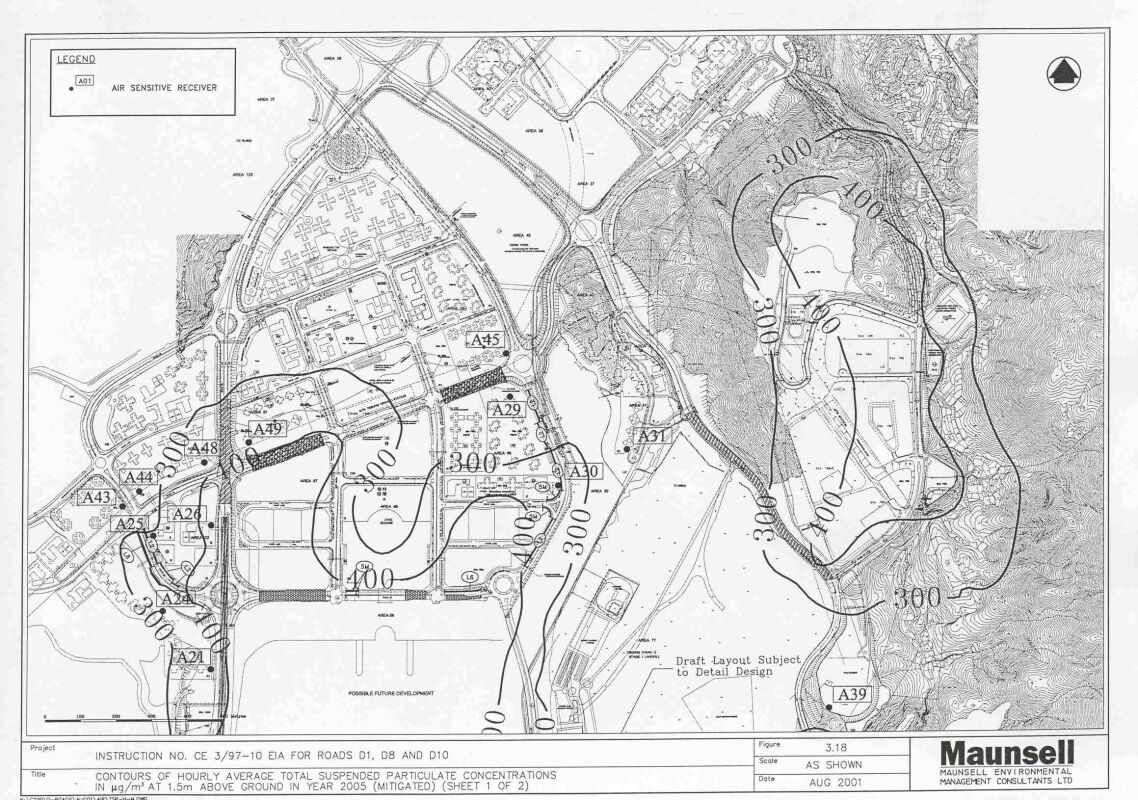
Figure
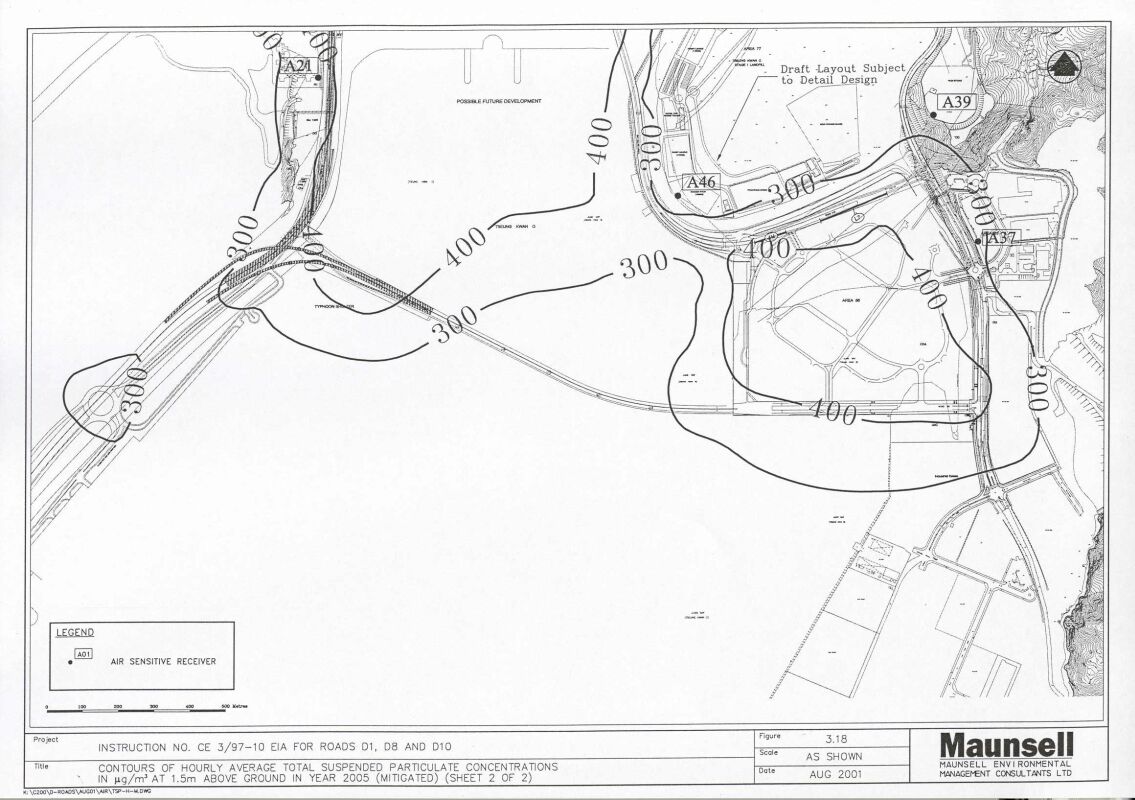
3.18 Contours of Hourly Average
Total Suspended Particulate Concentrations in mg/m3
at 1.5m above Ground in Year 2005 (Mitigated) (Sheet 1,
2)
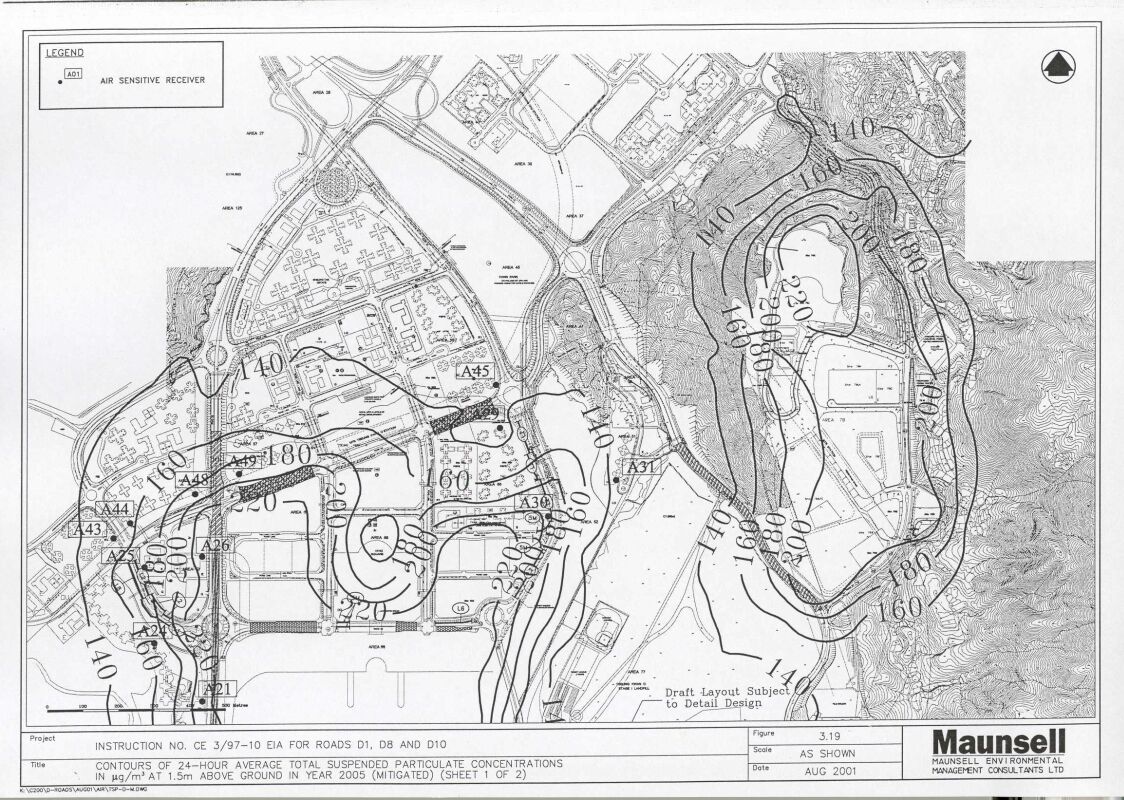
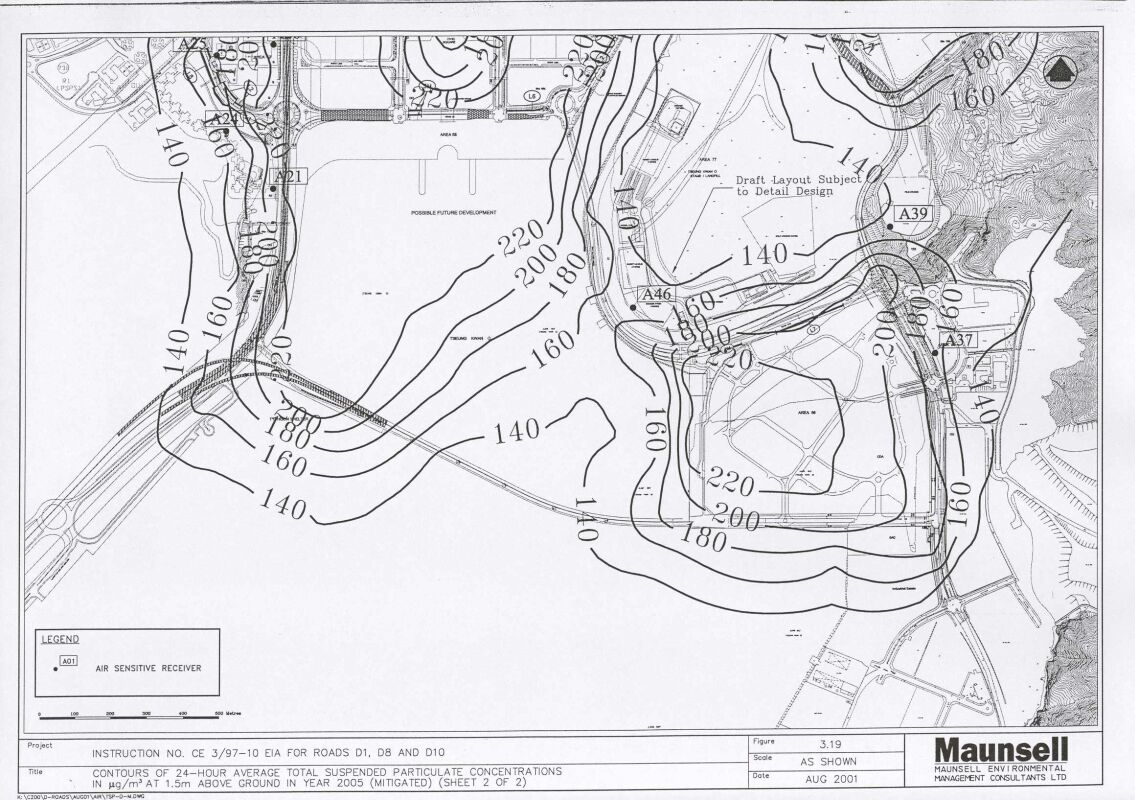
Figure
3.19 Contours of 24-hour average
Total Suspended Particulate Concentrations in mg/m3
at 1.5m above Ground in Year 2005 (Mitigated) (Sheet 1,
2)
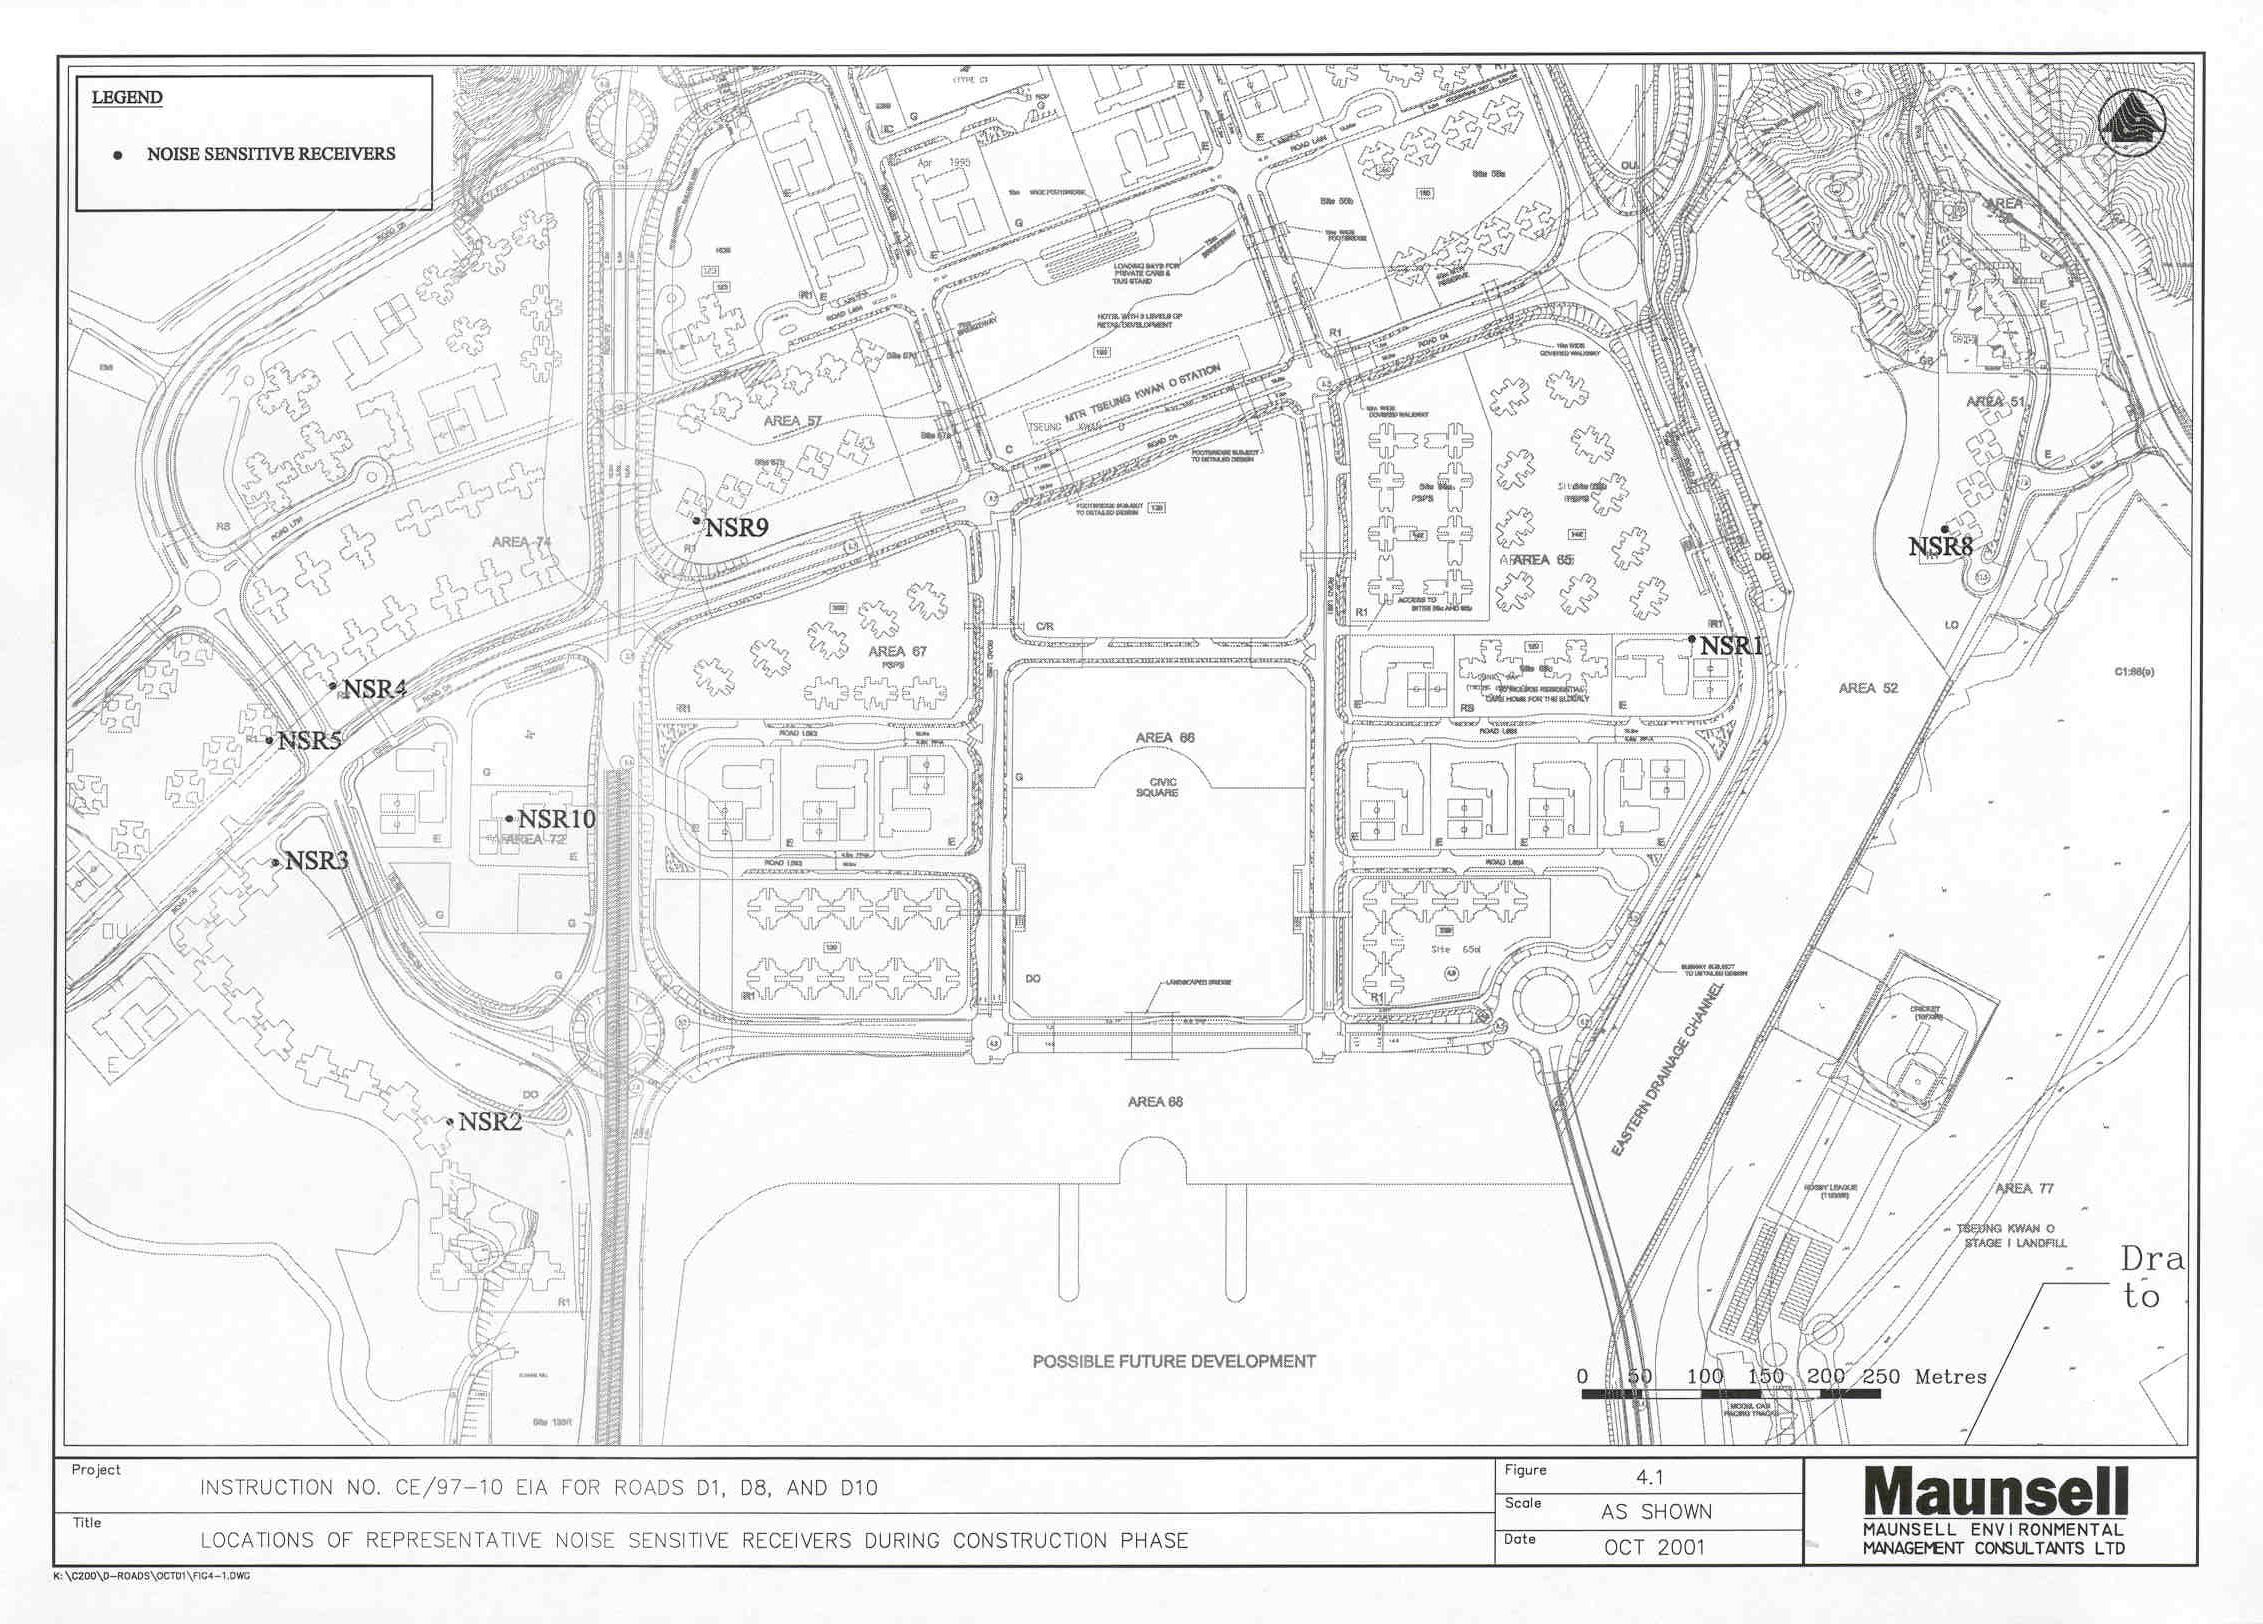
Figure 4.1 Locations of Representative Noise Sensitive Receivers during Construction
Phase
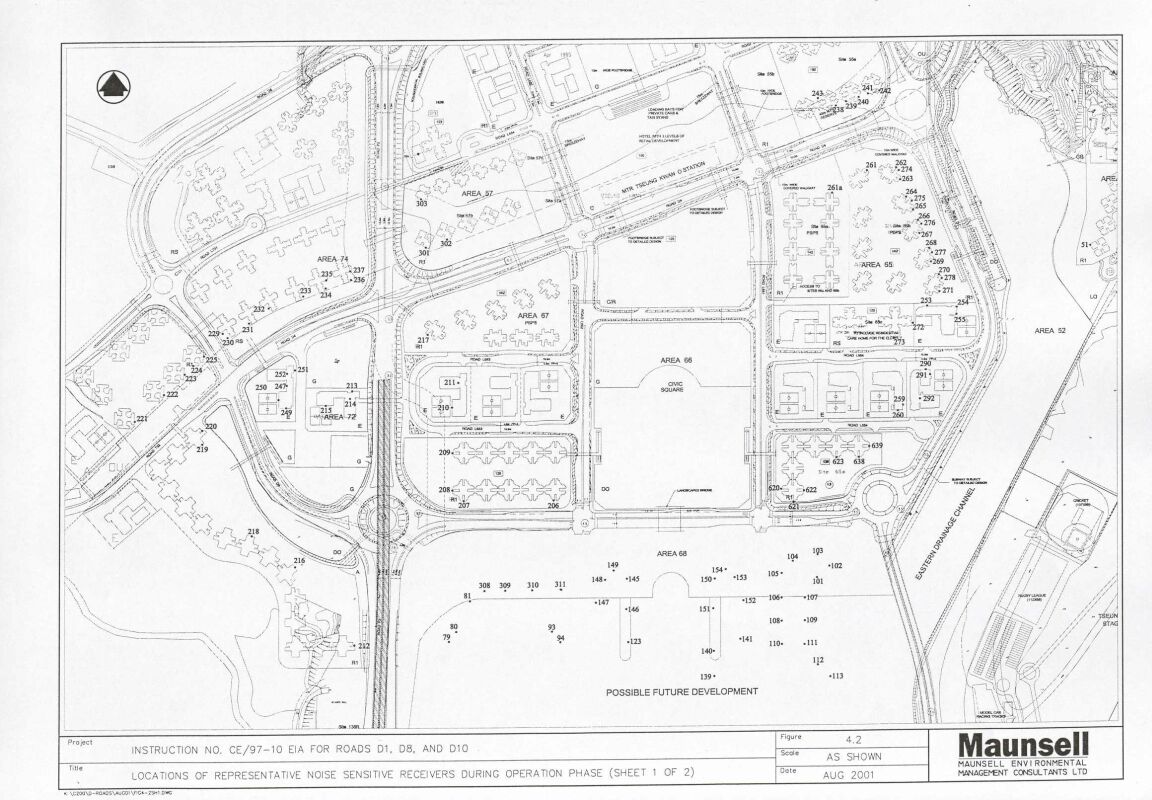
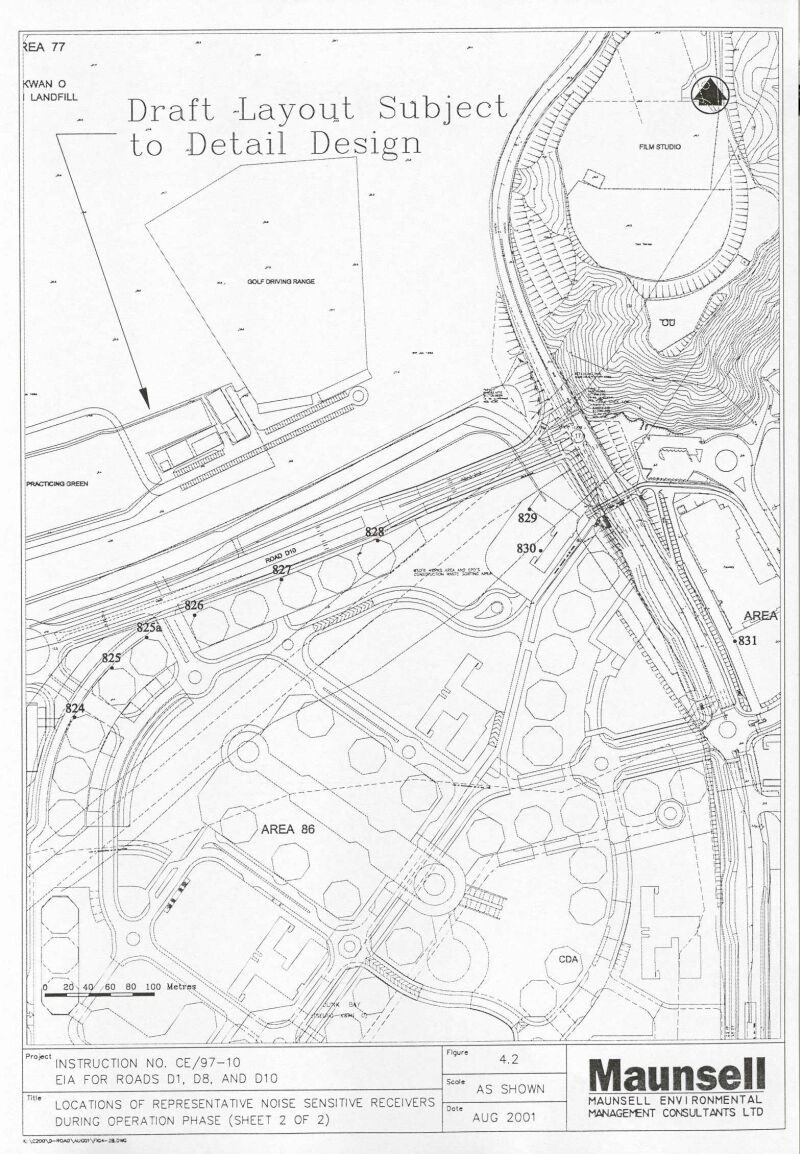
Figure 4.2 Locations of Representative Noise Sensitive Receivers during Operation
Phase (Sheet 1, 2)
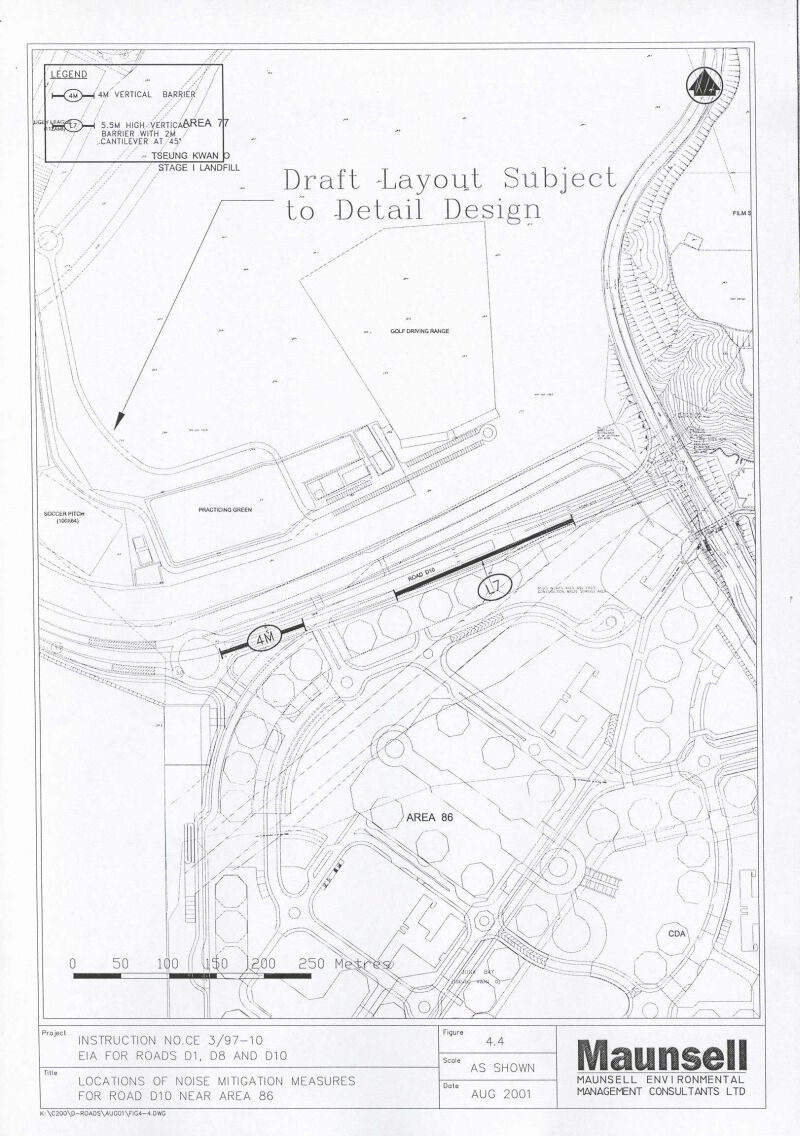
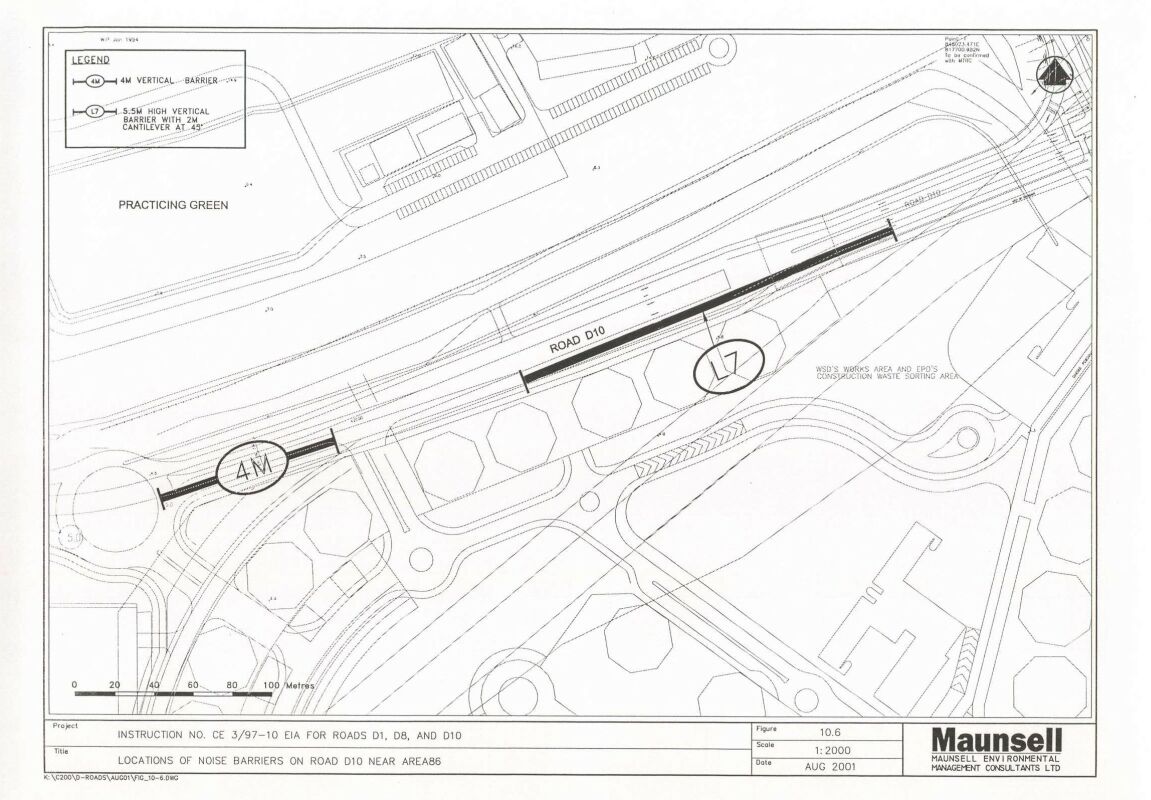
Figure 4.4 Location of Noise Mitigation Measure for Road D10 near Area 86
Figure 4.8 Location of Non-building Zone
Figure 4.9 Location of Non-building Zone
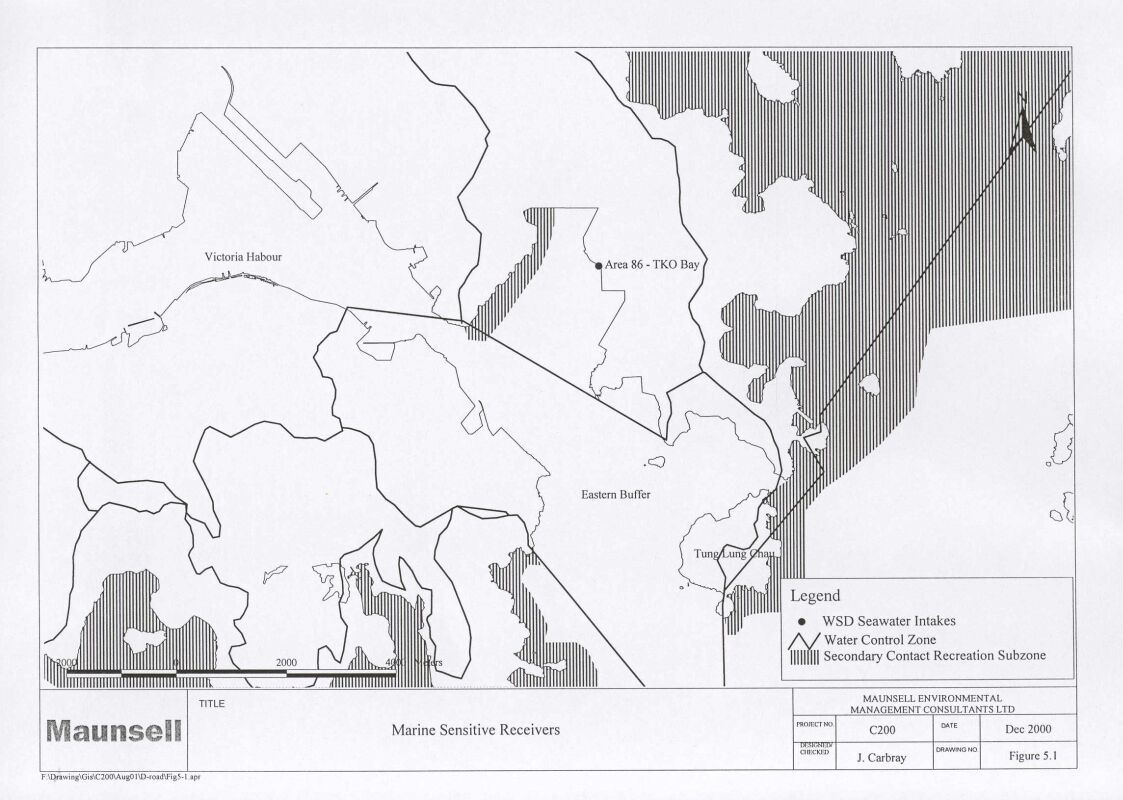
Figure 5.1 Marine Sensitive Receivers
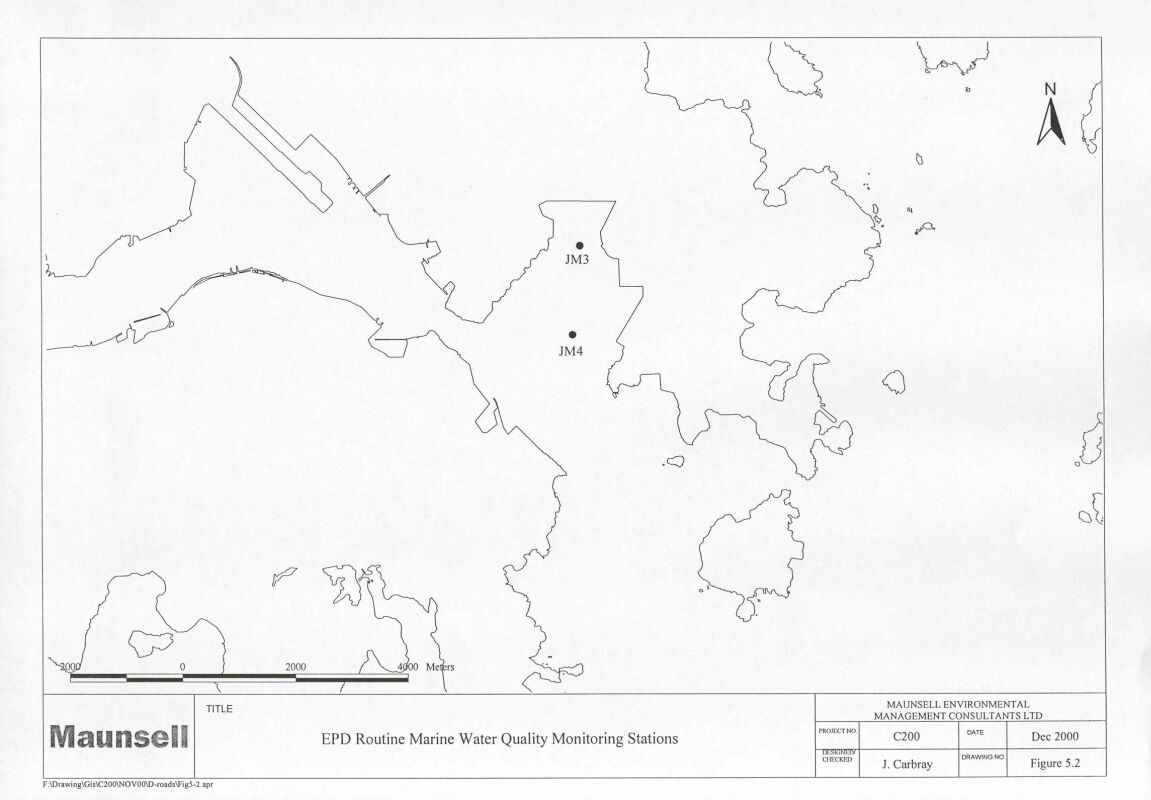
Figure 5.2 EPD Routine Marine Water Quality Monitoring Stations
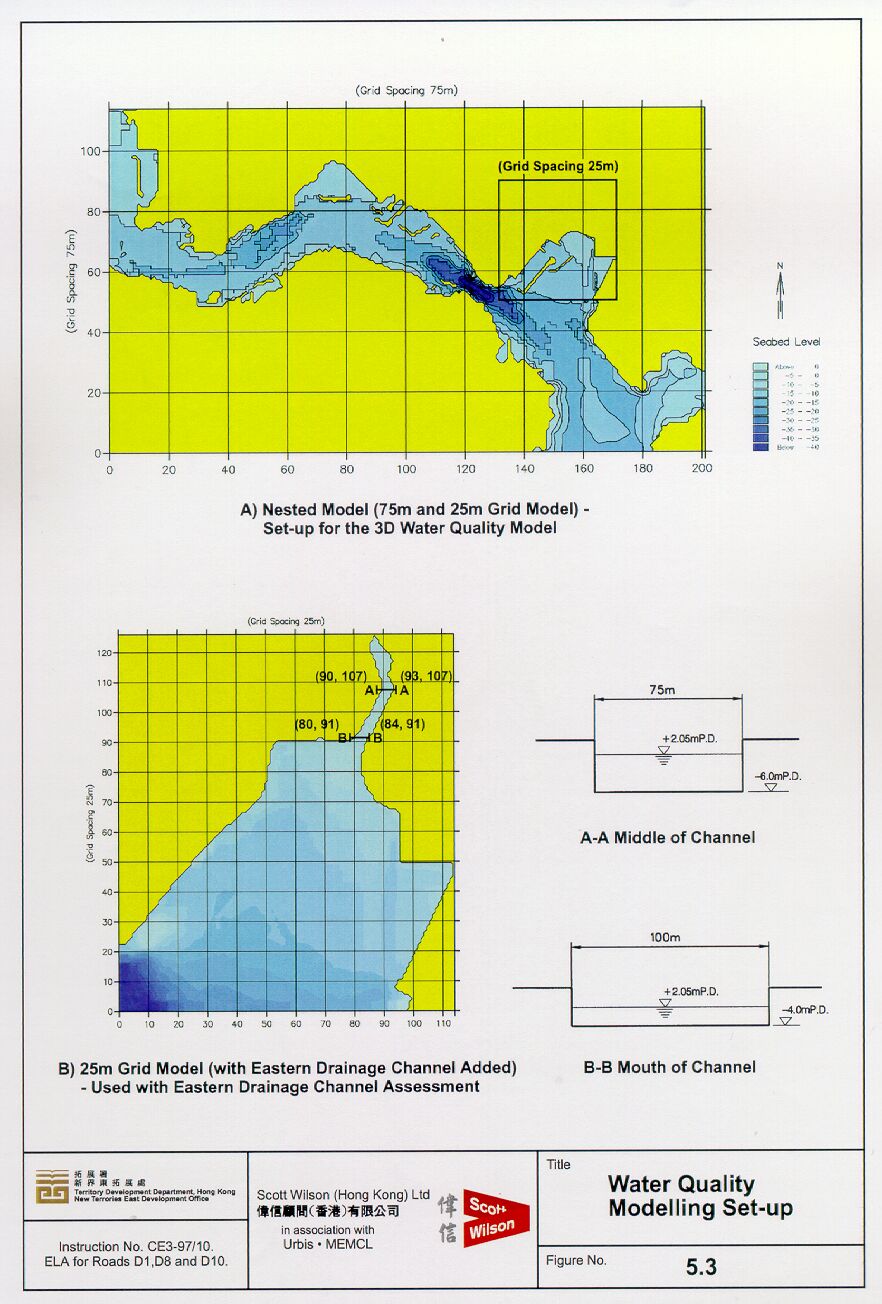
Figure 5.3 Water Quality Modelling Set-up
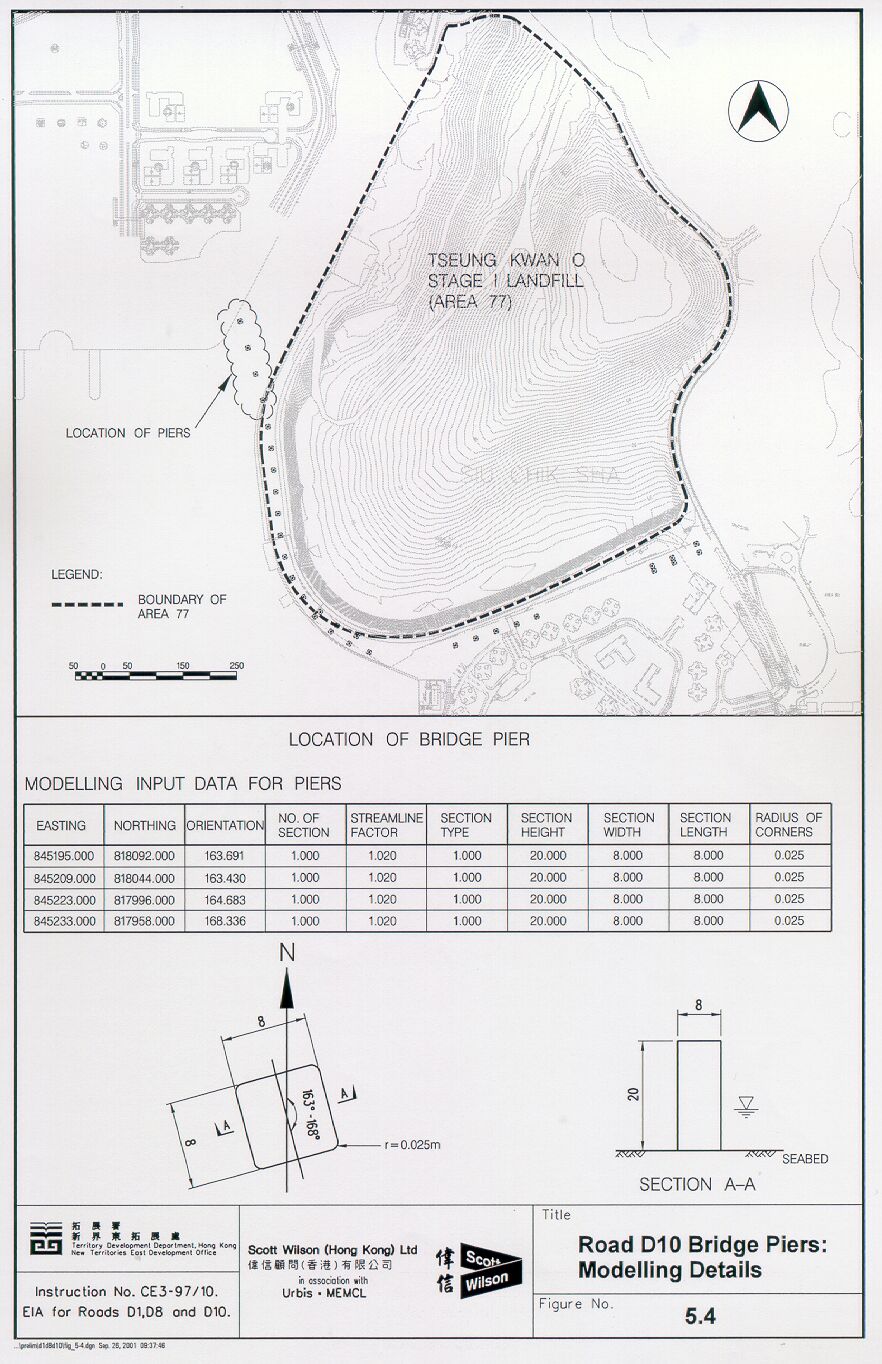
Figure 5.4 Road D10 Bridge Piers : Modelling Details
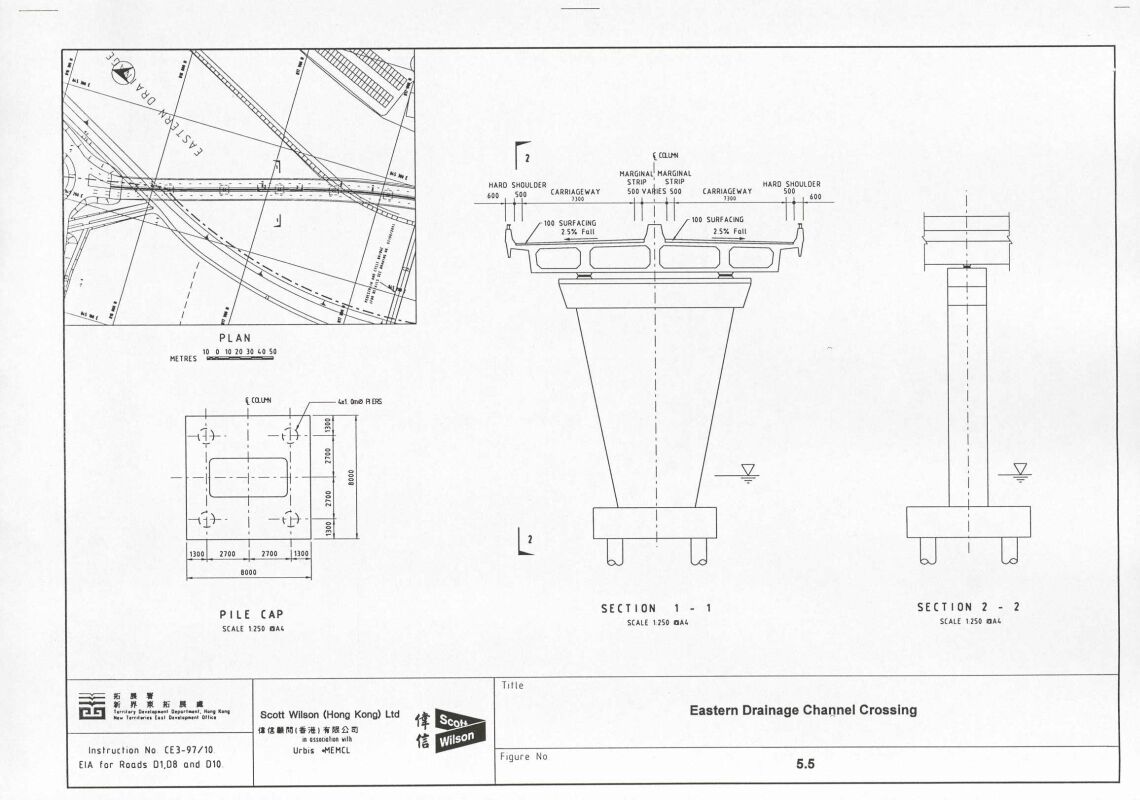
Figure 5.5 Eastern Drainage Channel Crossing
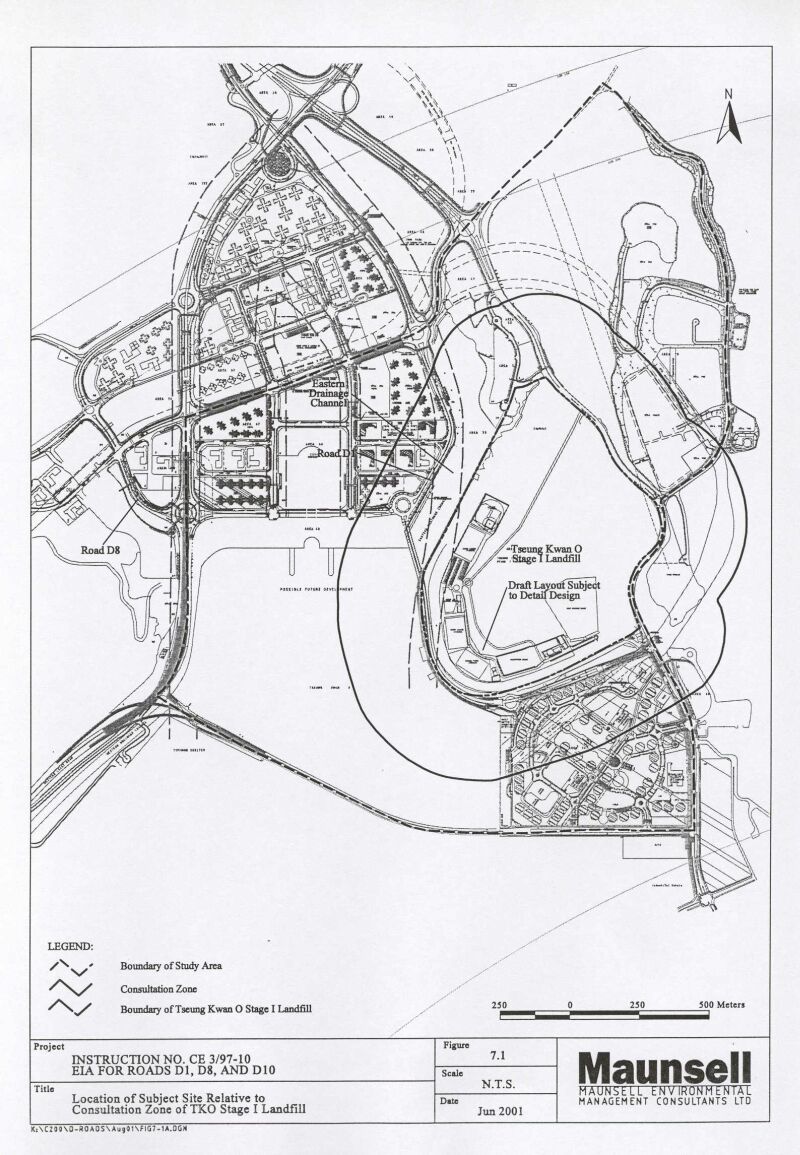
Figure 7.1 Location of Subject Site Relative to Consultation Zone of TKO Stage
I Landfill
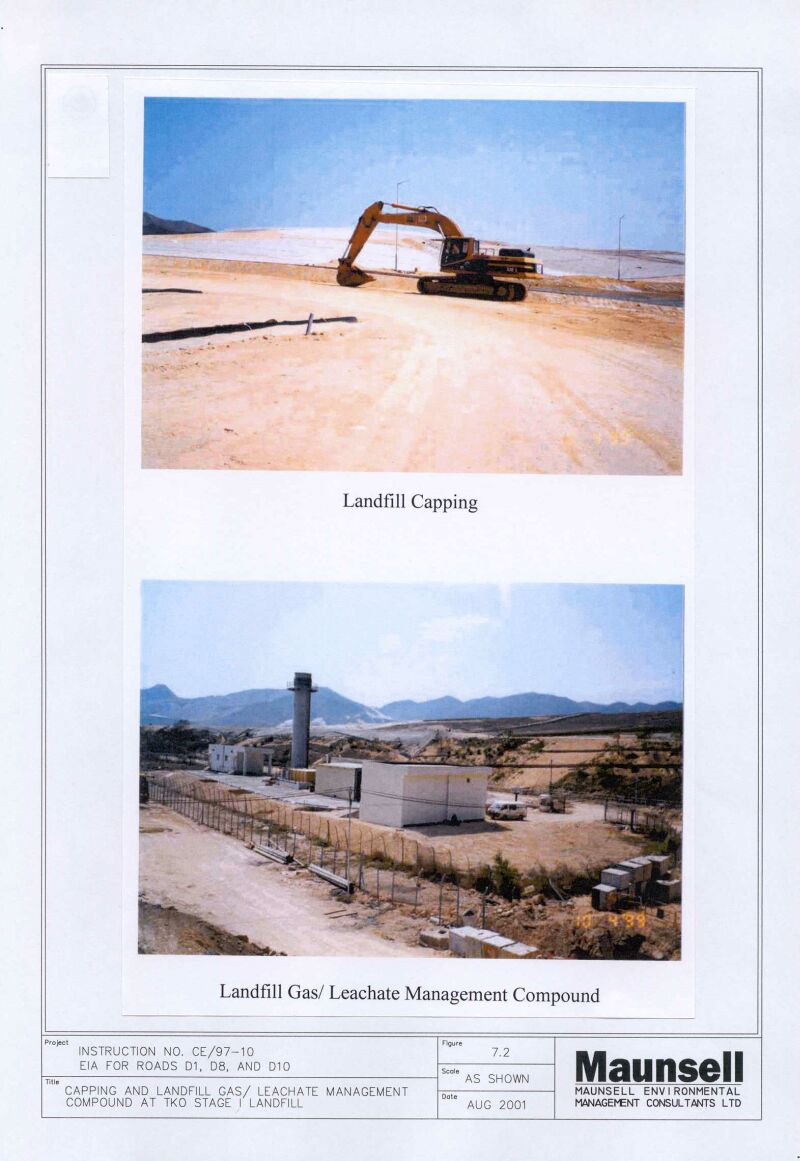
Figure 7.2 Capping and Landfill Gas/Leachate Management Compound at TKO Stage
I Landfill
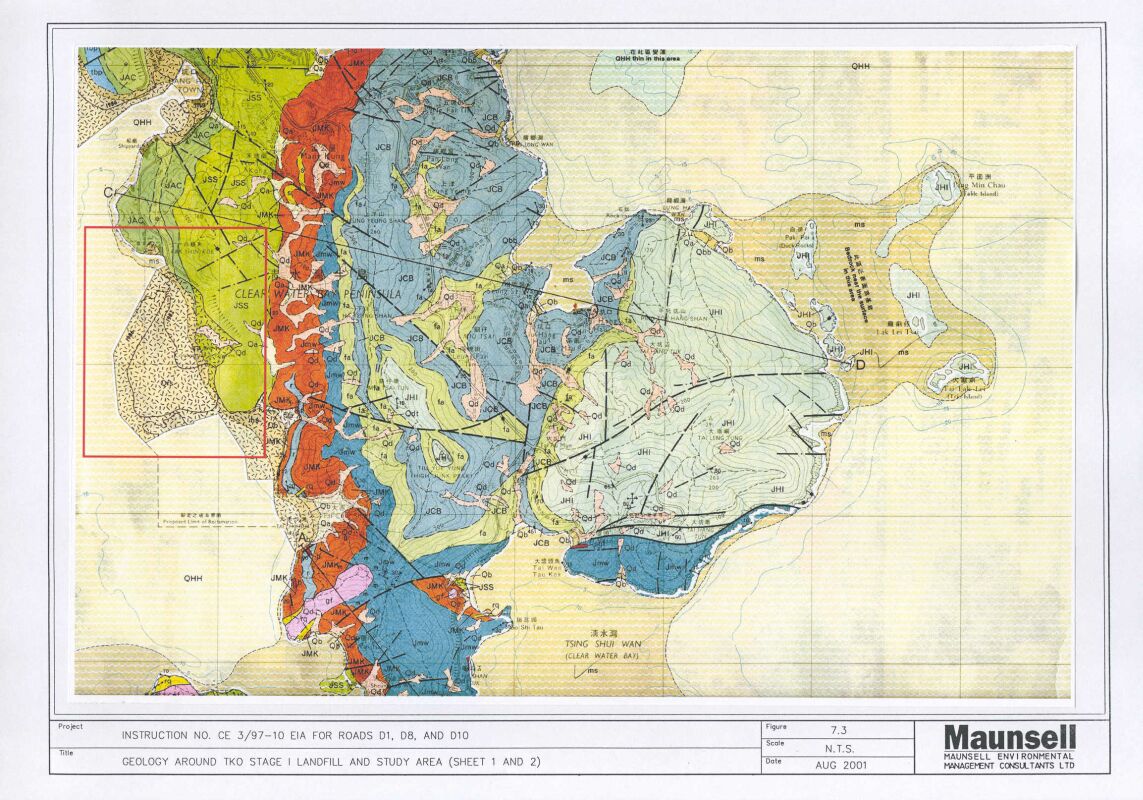
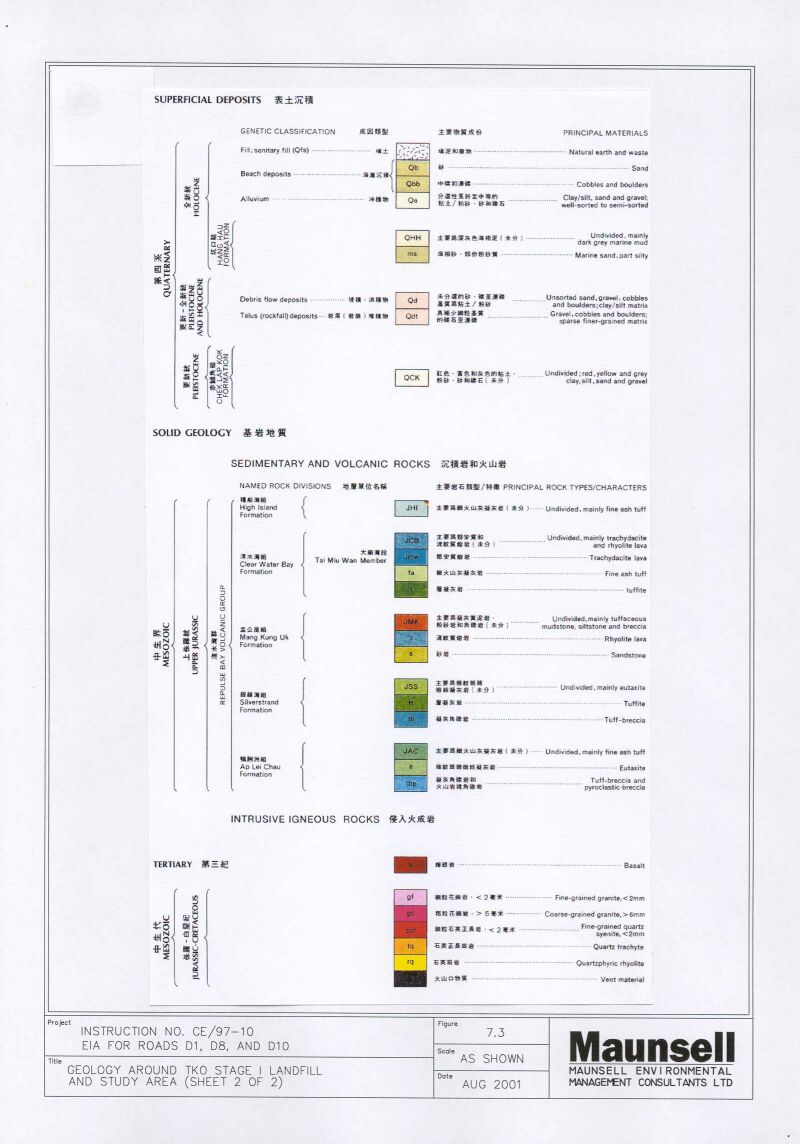
Figure 7.3 Geology Around TKO Stage I Landfill and Study Area (Sheet 1,
2)
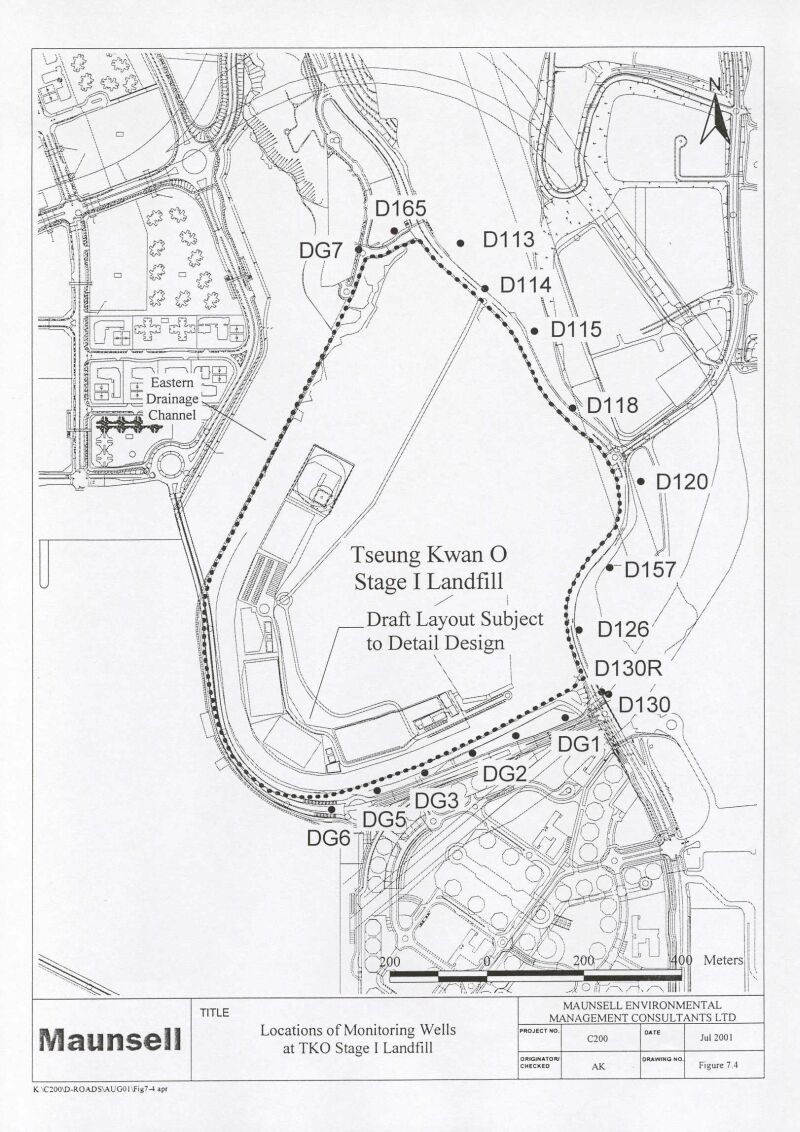
Figure 7.4 Locations of Monitoring Wells at TKO Stage I Landfill
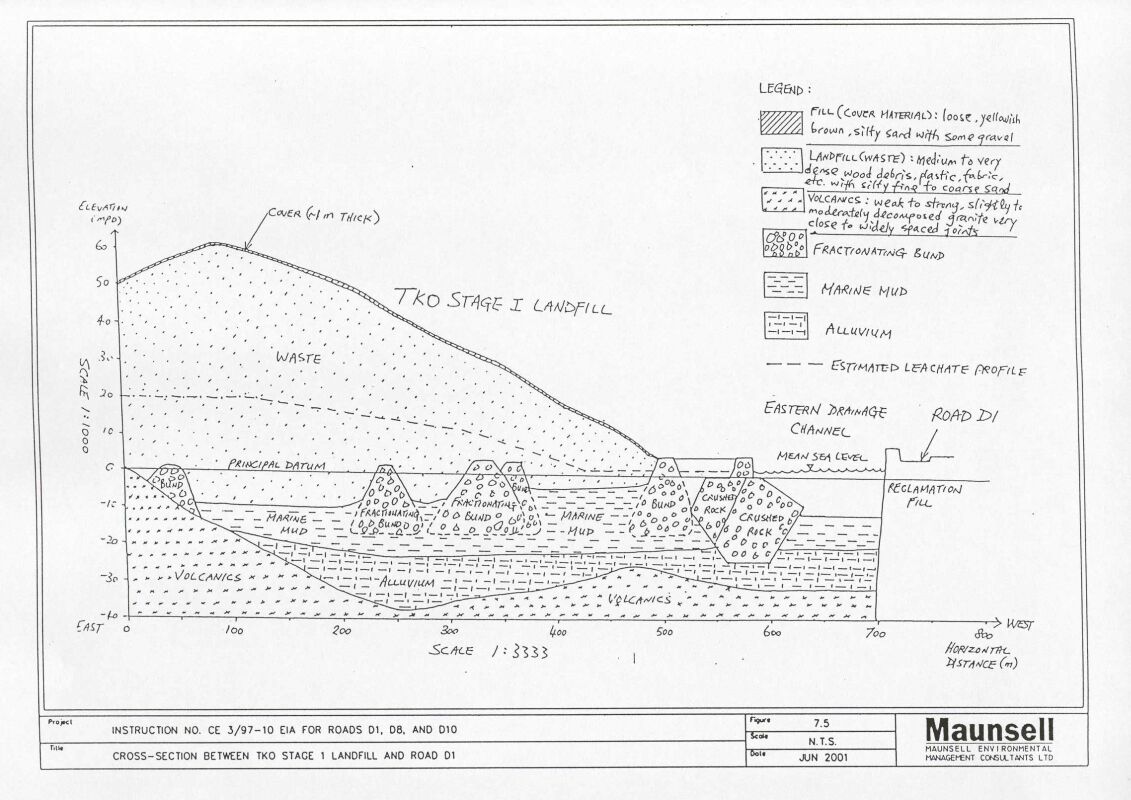
Figure 7.5 Cross-section Between TKO stage 1 Landfill and Road D1
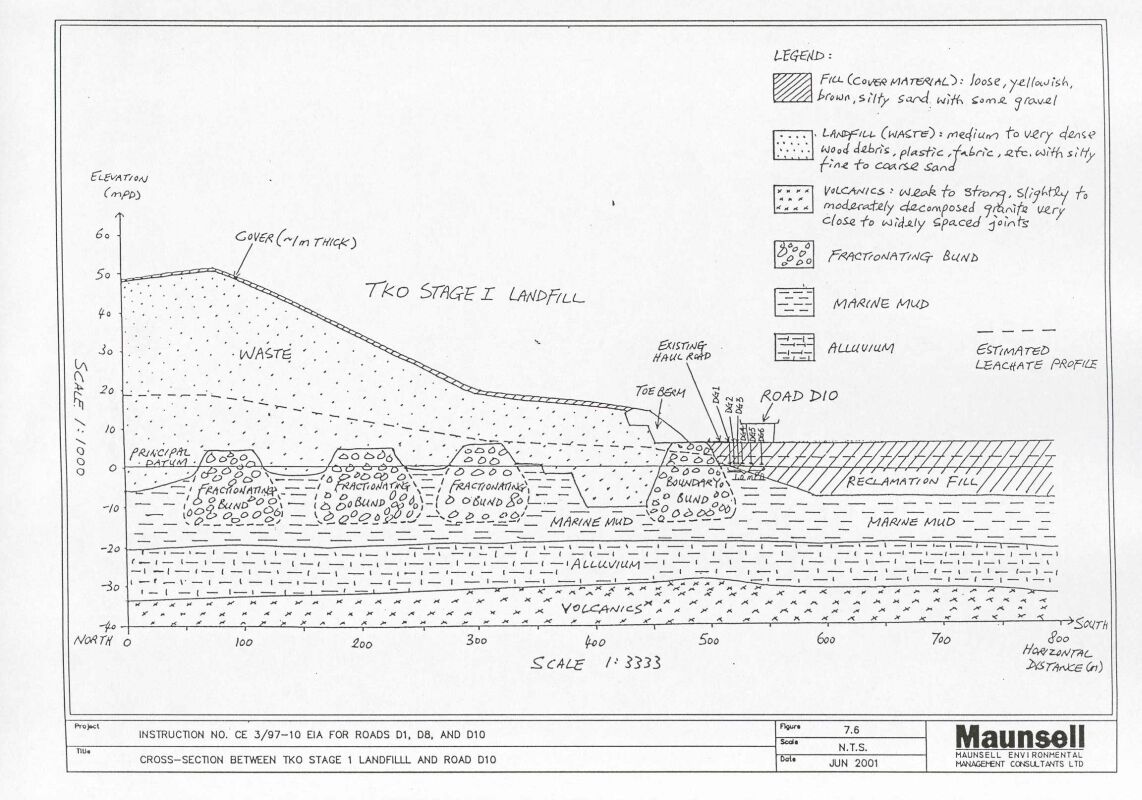
Figure 7.6 Cross-section Between TKO stage 1 Landfill and Road D10
Figure
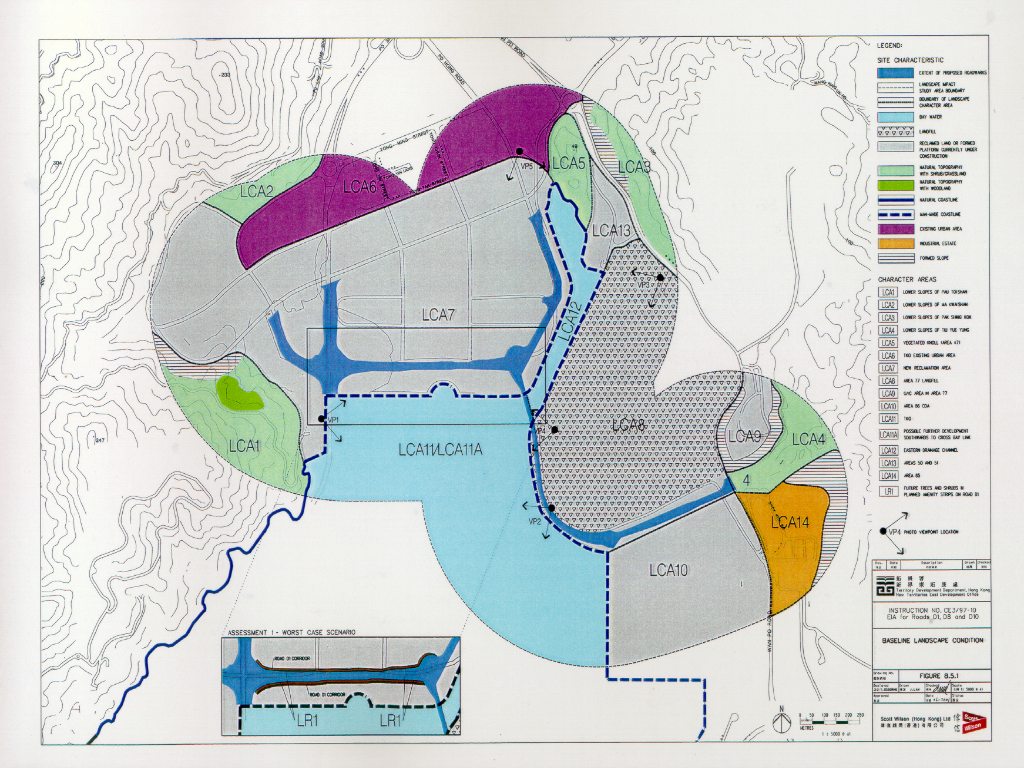
8.5.1 Baseline Landscape Conditions
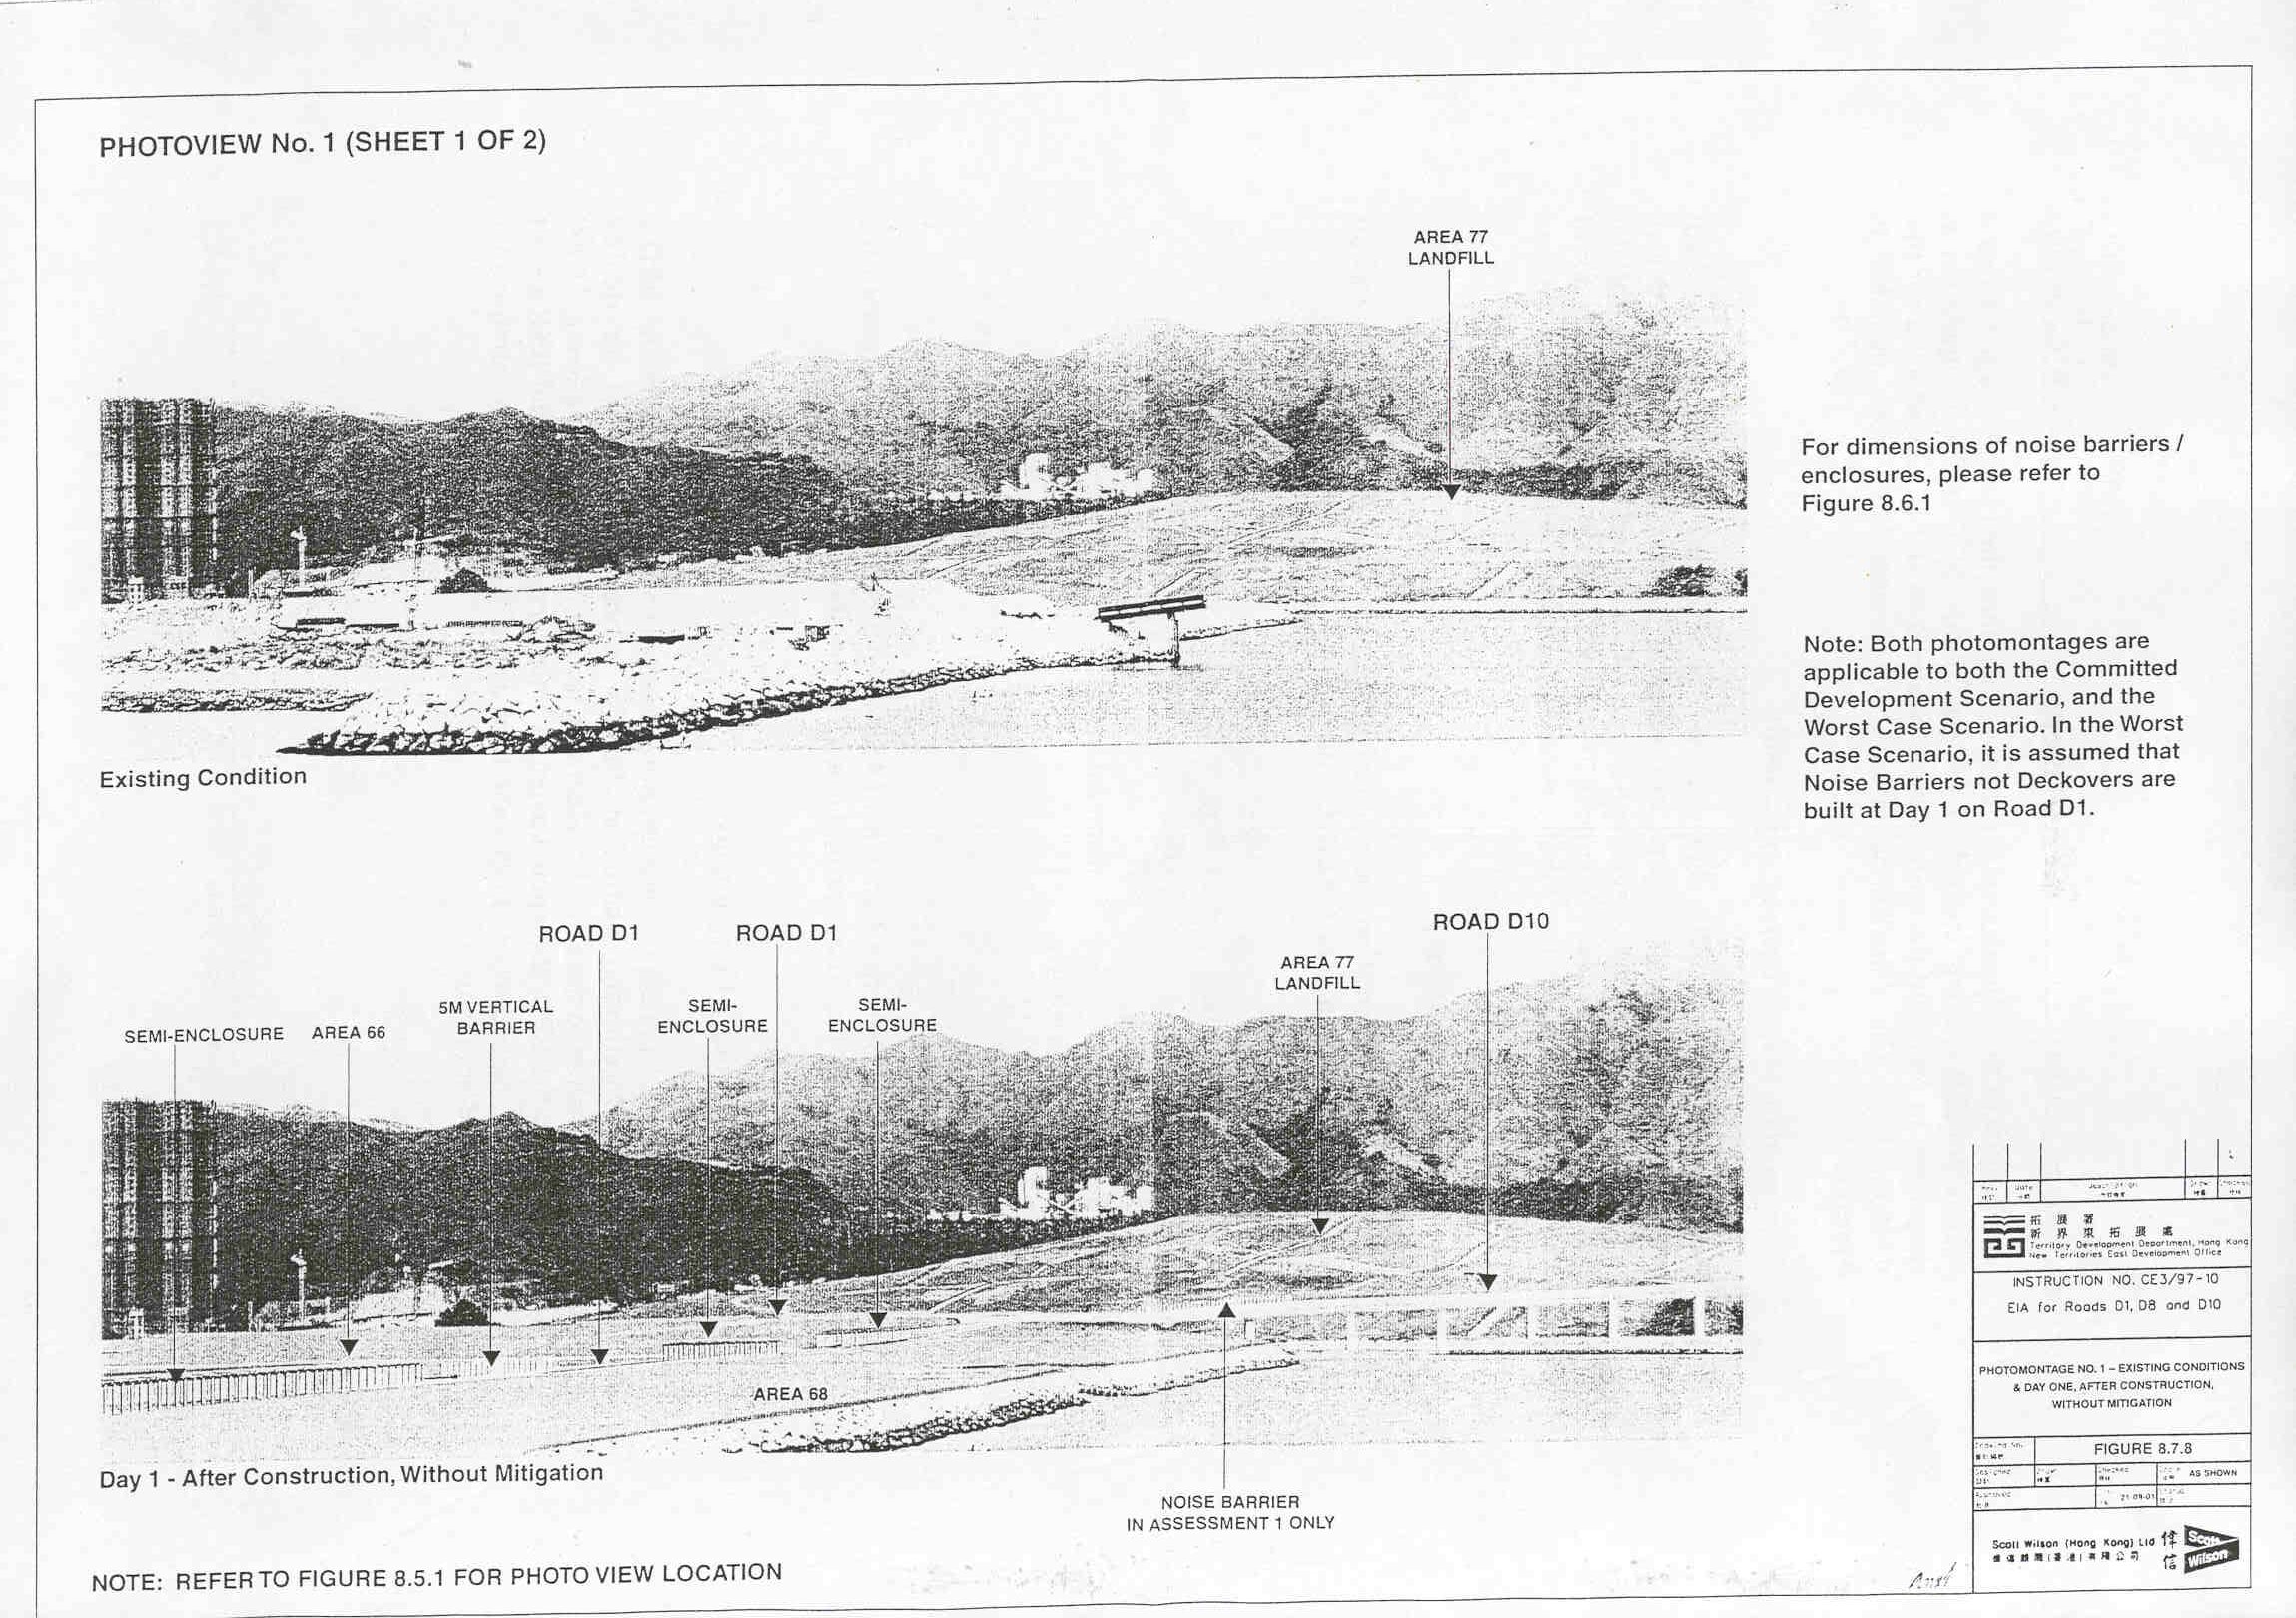
Figure
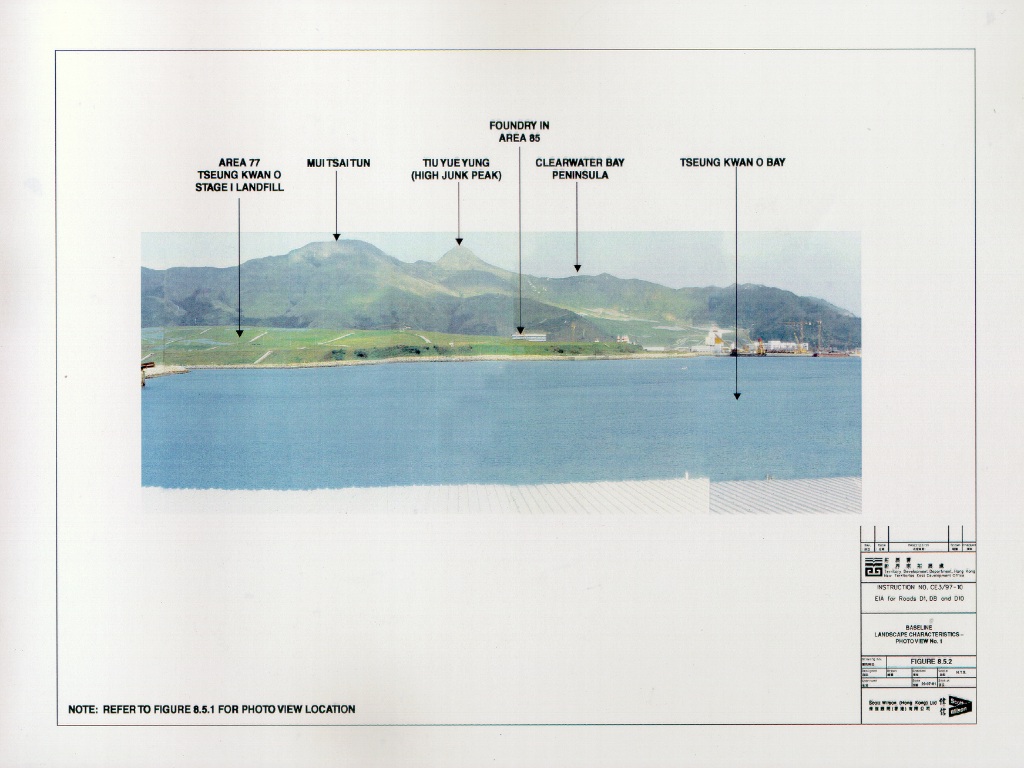
8.5.2 Baseline Landscape Characteristics
– Photo View No.1
Figure
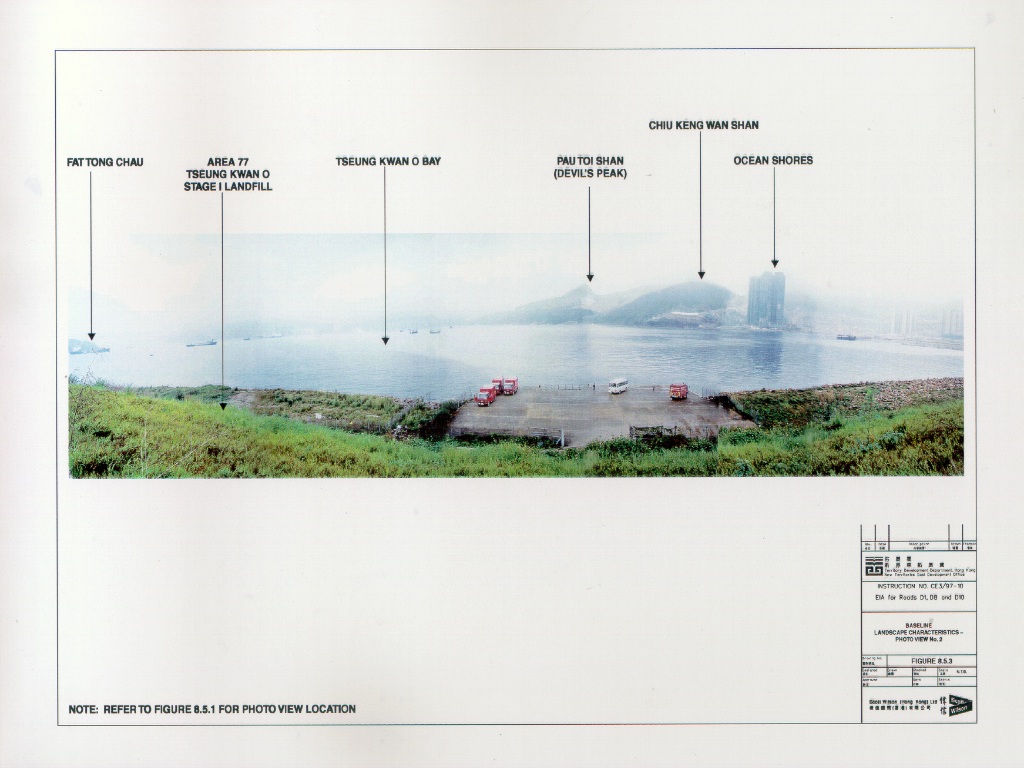
8.5.3 Baseline Landscape Characteristics
– Photo View No.2
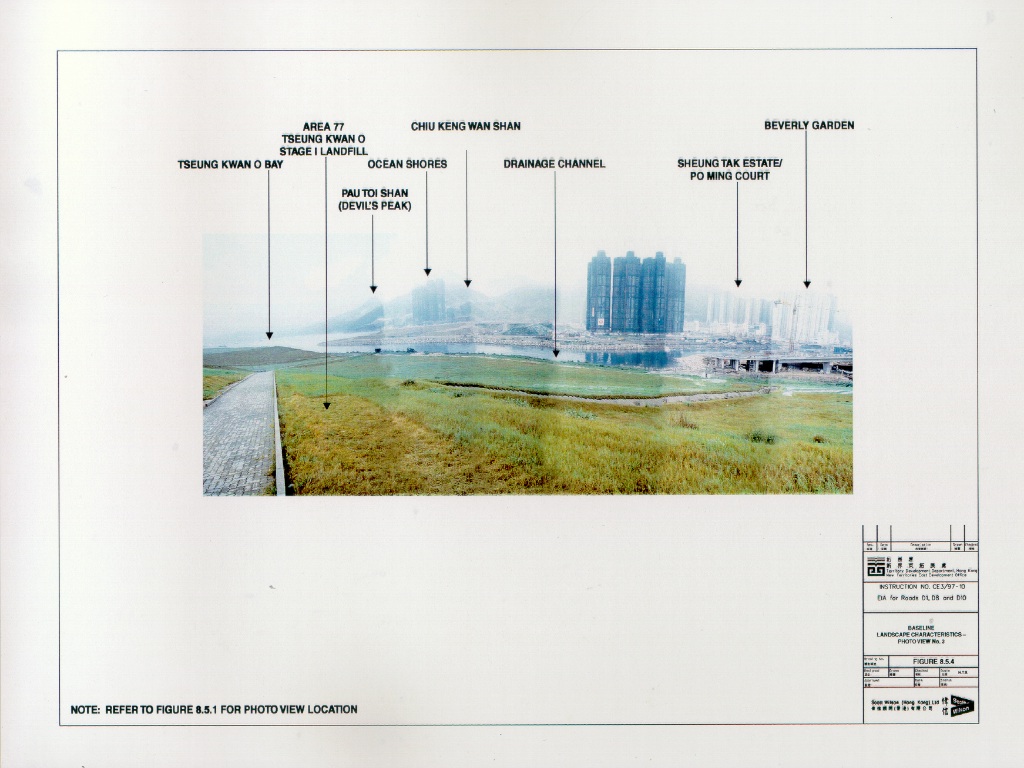
Figure
8.5.4 Baseline Landscape Characteristics
– Photo View No.3
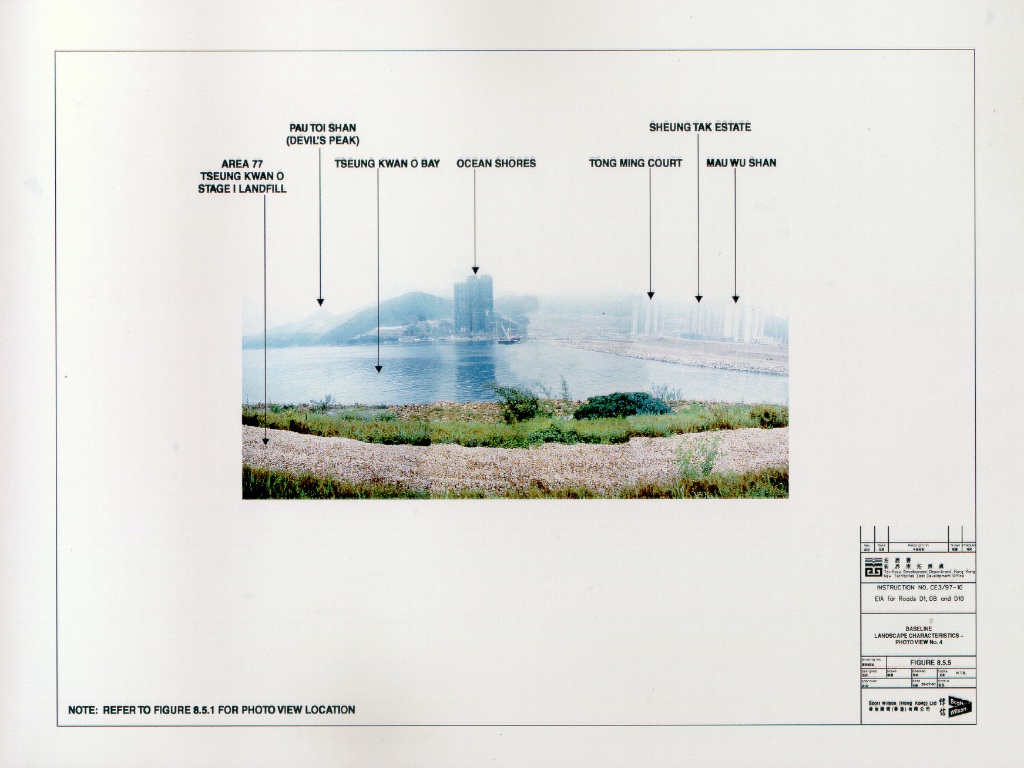
Figure
8.5.5 Baseline Landscape Characteristics
– Photo View No.4
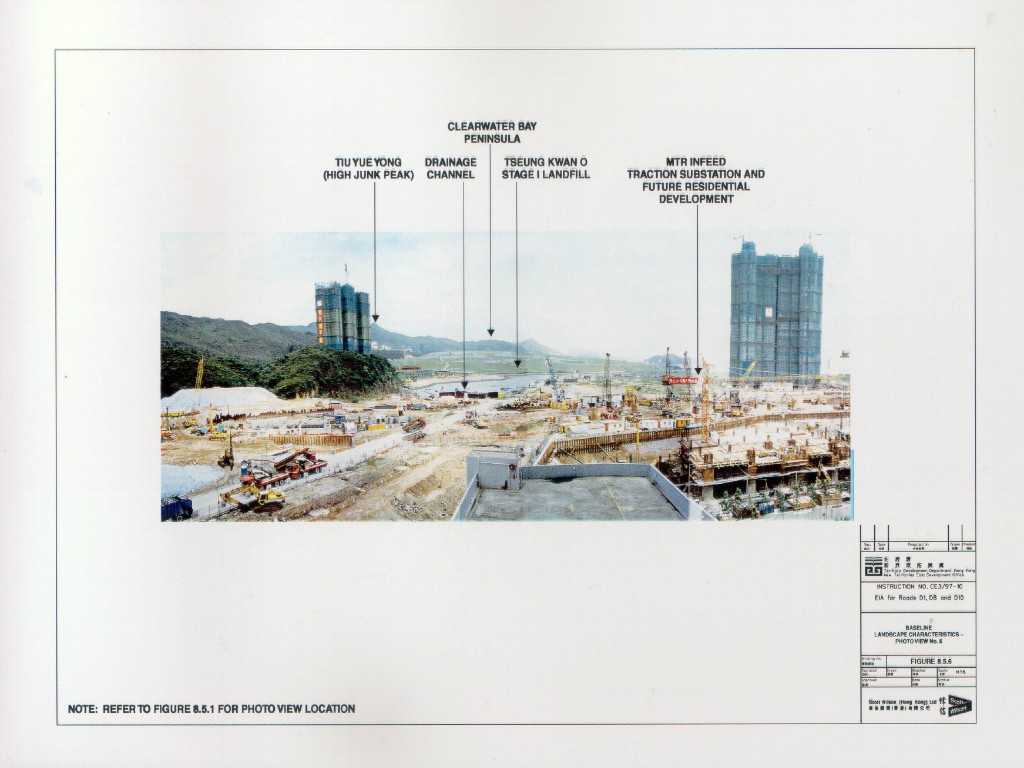
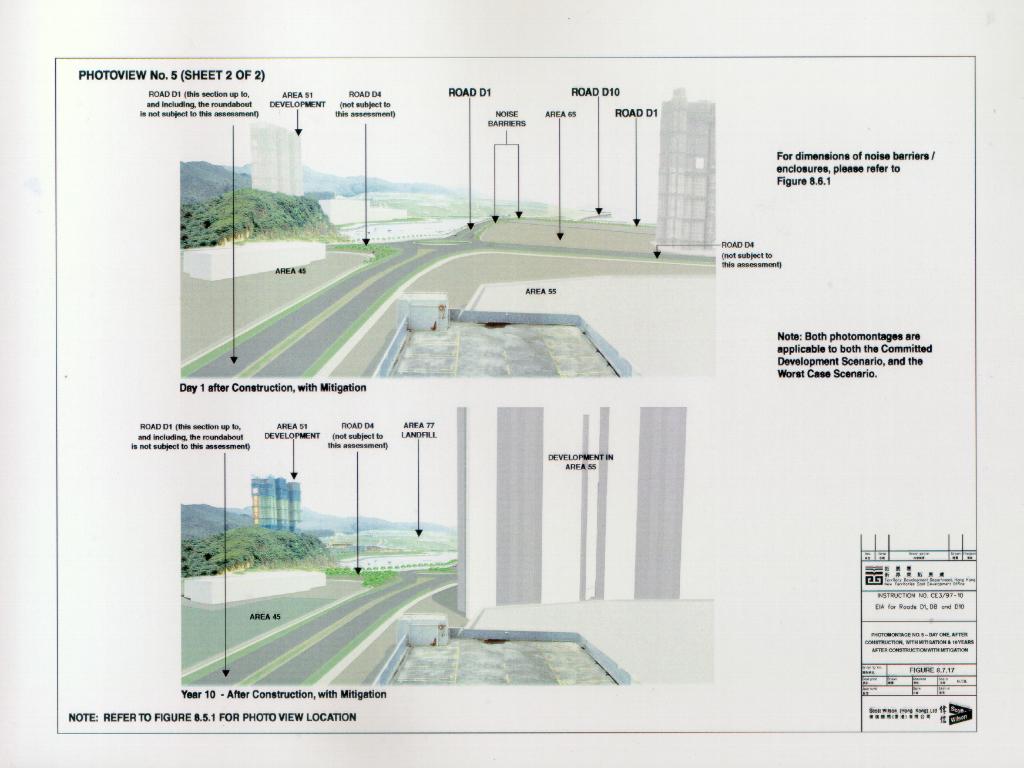
Figure
8.5.6 Baseline Landscape Characteristics
– Photo View No.5
Figure
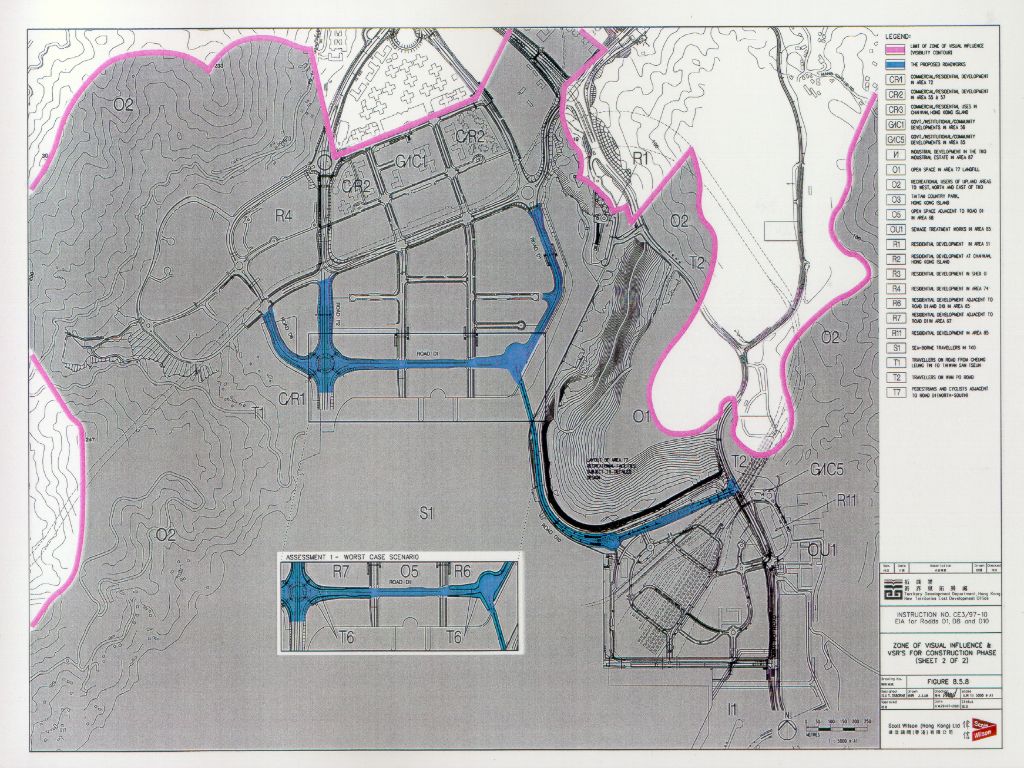
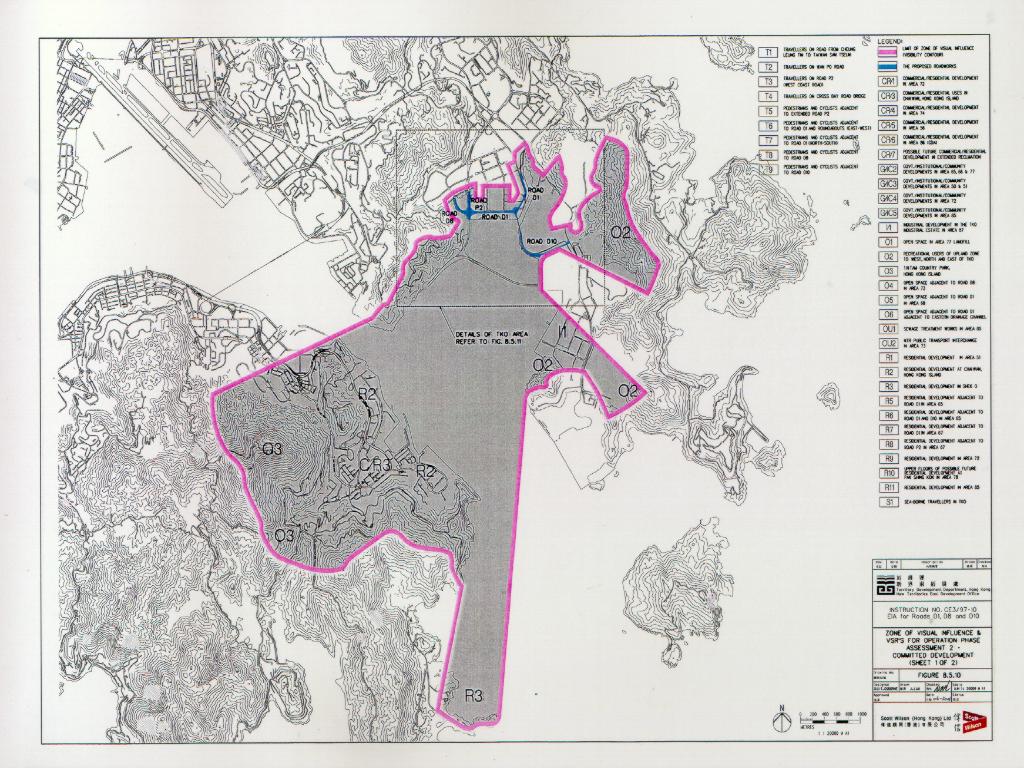
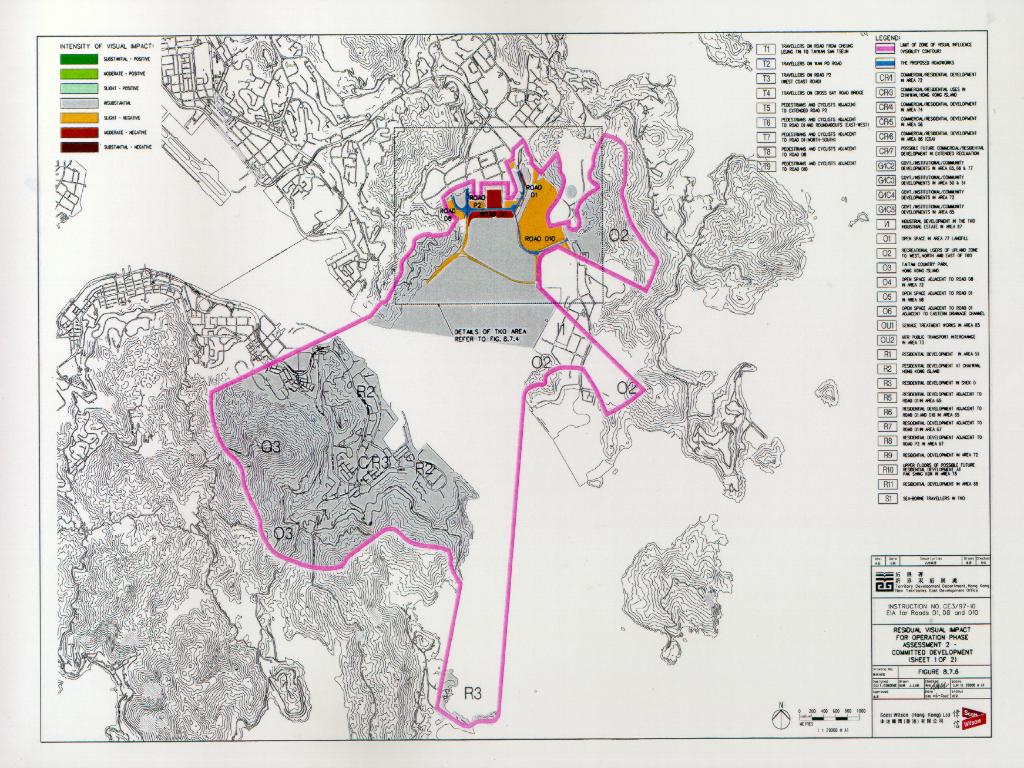
8.5.10 ZVI & VSR’s for Operation Phase – Assessment
2 – Committed Development (Sheet 1 of 2)
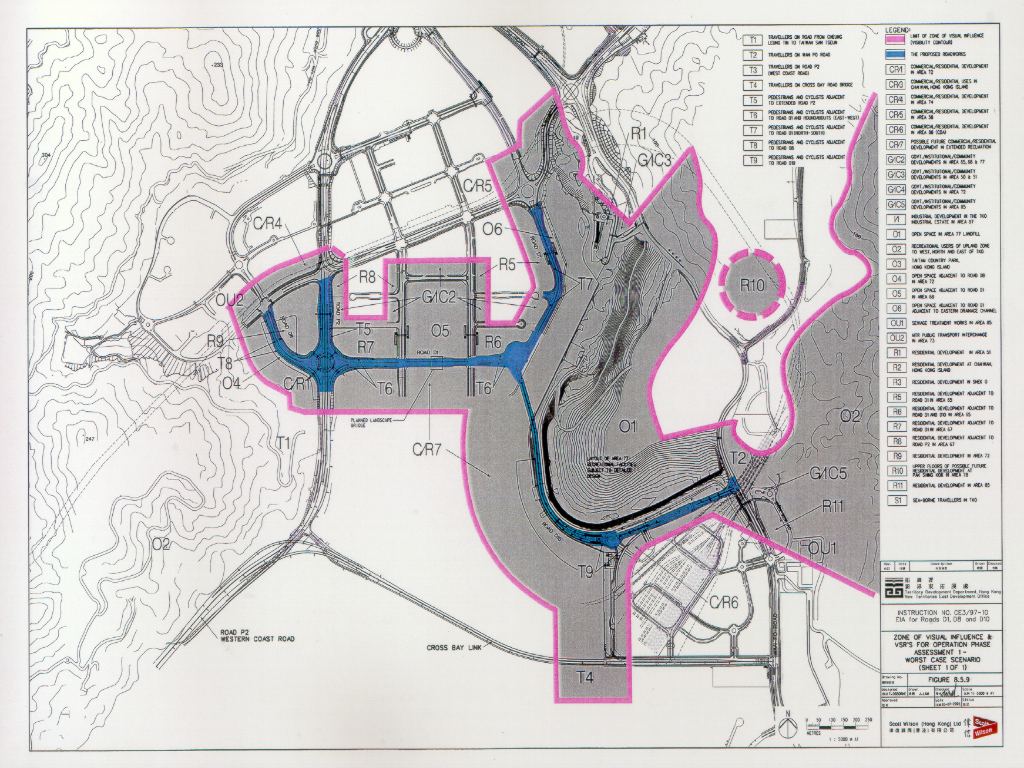
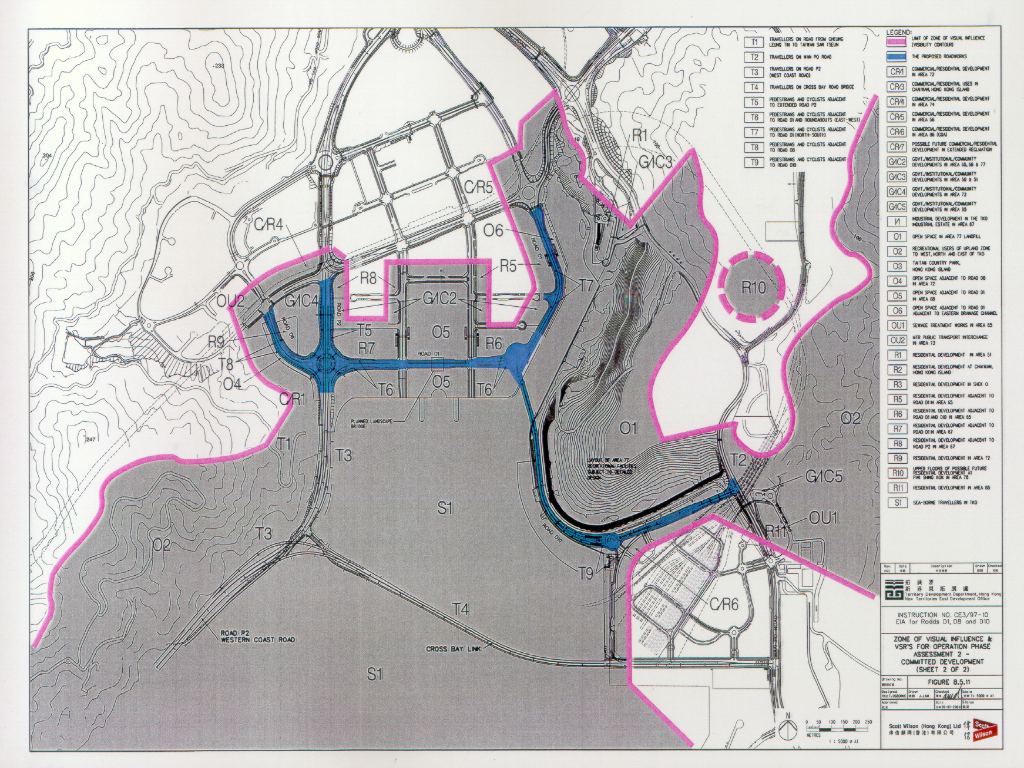
Figure
8.5.11 ZVI & VSR’s for Operation Phase – Assessment
2 – Committed Development (Sheet 2 of 2)
Figure
8.6.1 Extent of the Works
Figure
8.6.2 Construction Phase Residual Landscape
Impacts
Figure
8.6.3 Construction Phase Residual Visual
Impacts (Sheet 1 of 2)
Figure
8.6.4 Construction Phase Residual Visual
Impacts (Sheet 2 of 2)
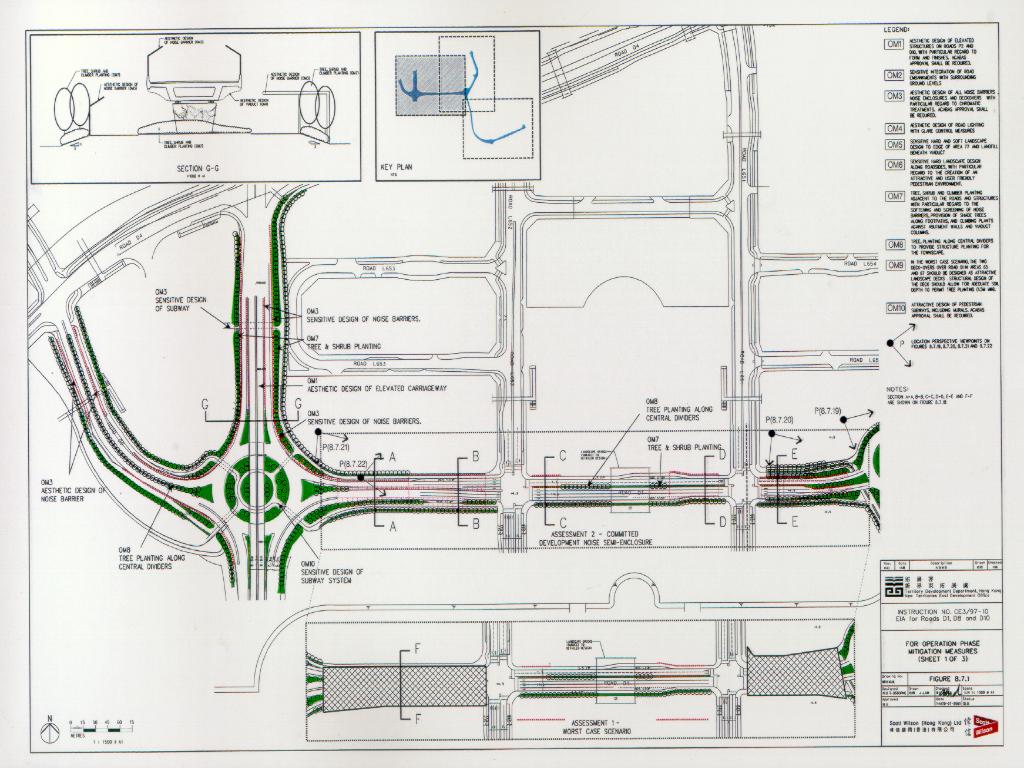
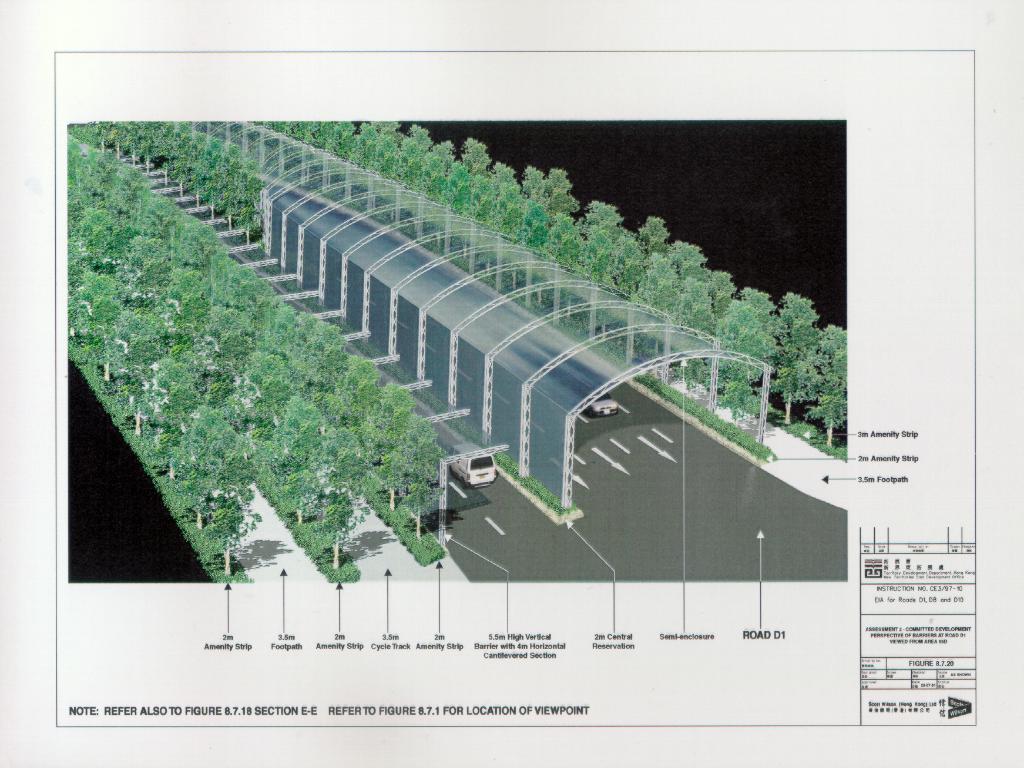
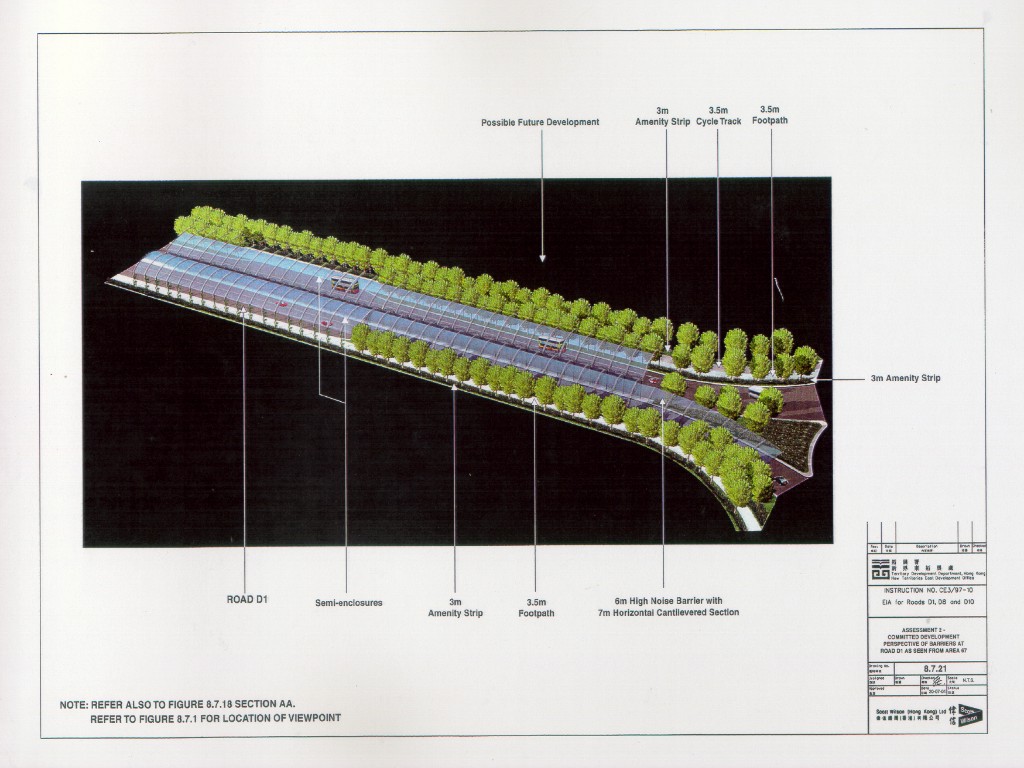
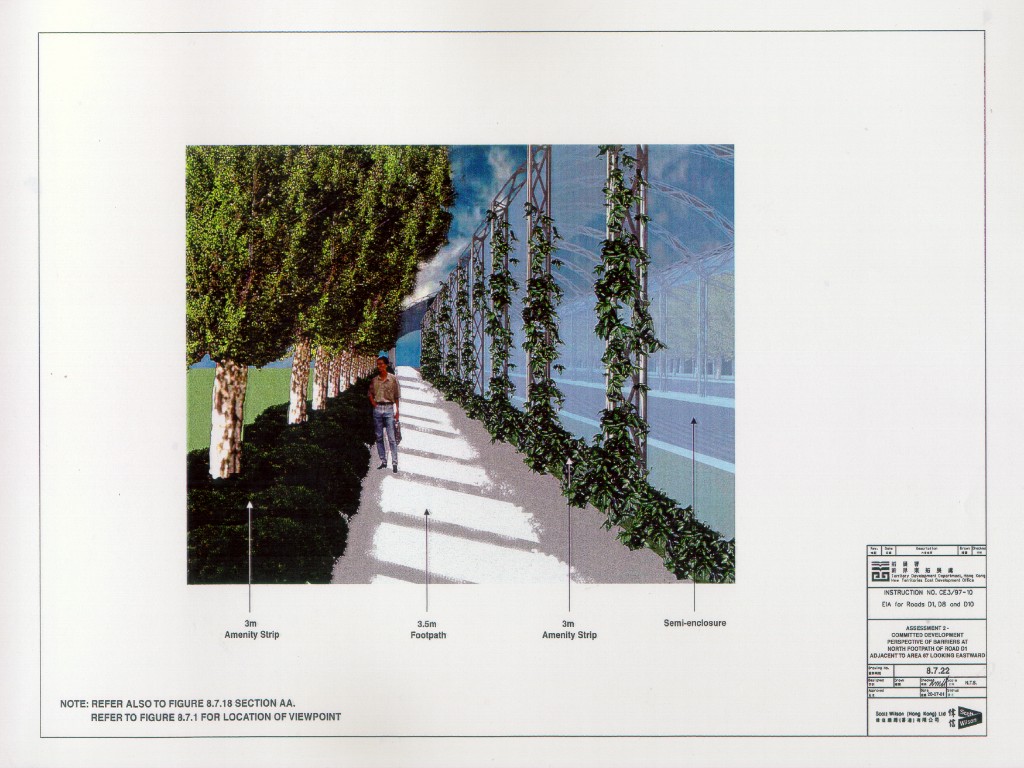
Figure
8.7.1 Operation Phase Mitigation Measures
(Sheet 1 of 3)
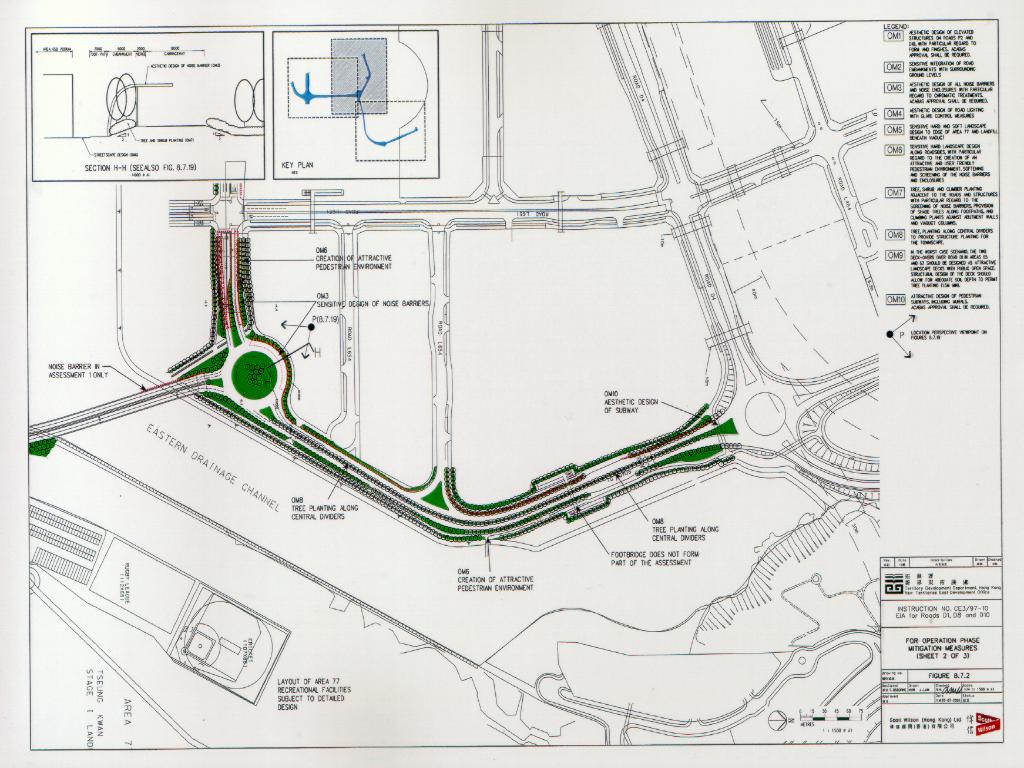
Figure
8.7.2 Operation Phase Mitigation Measures
(Sheet 2 of 3)
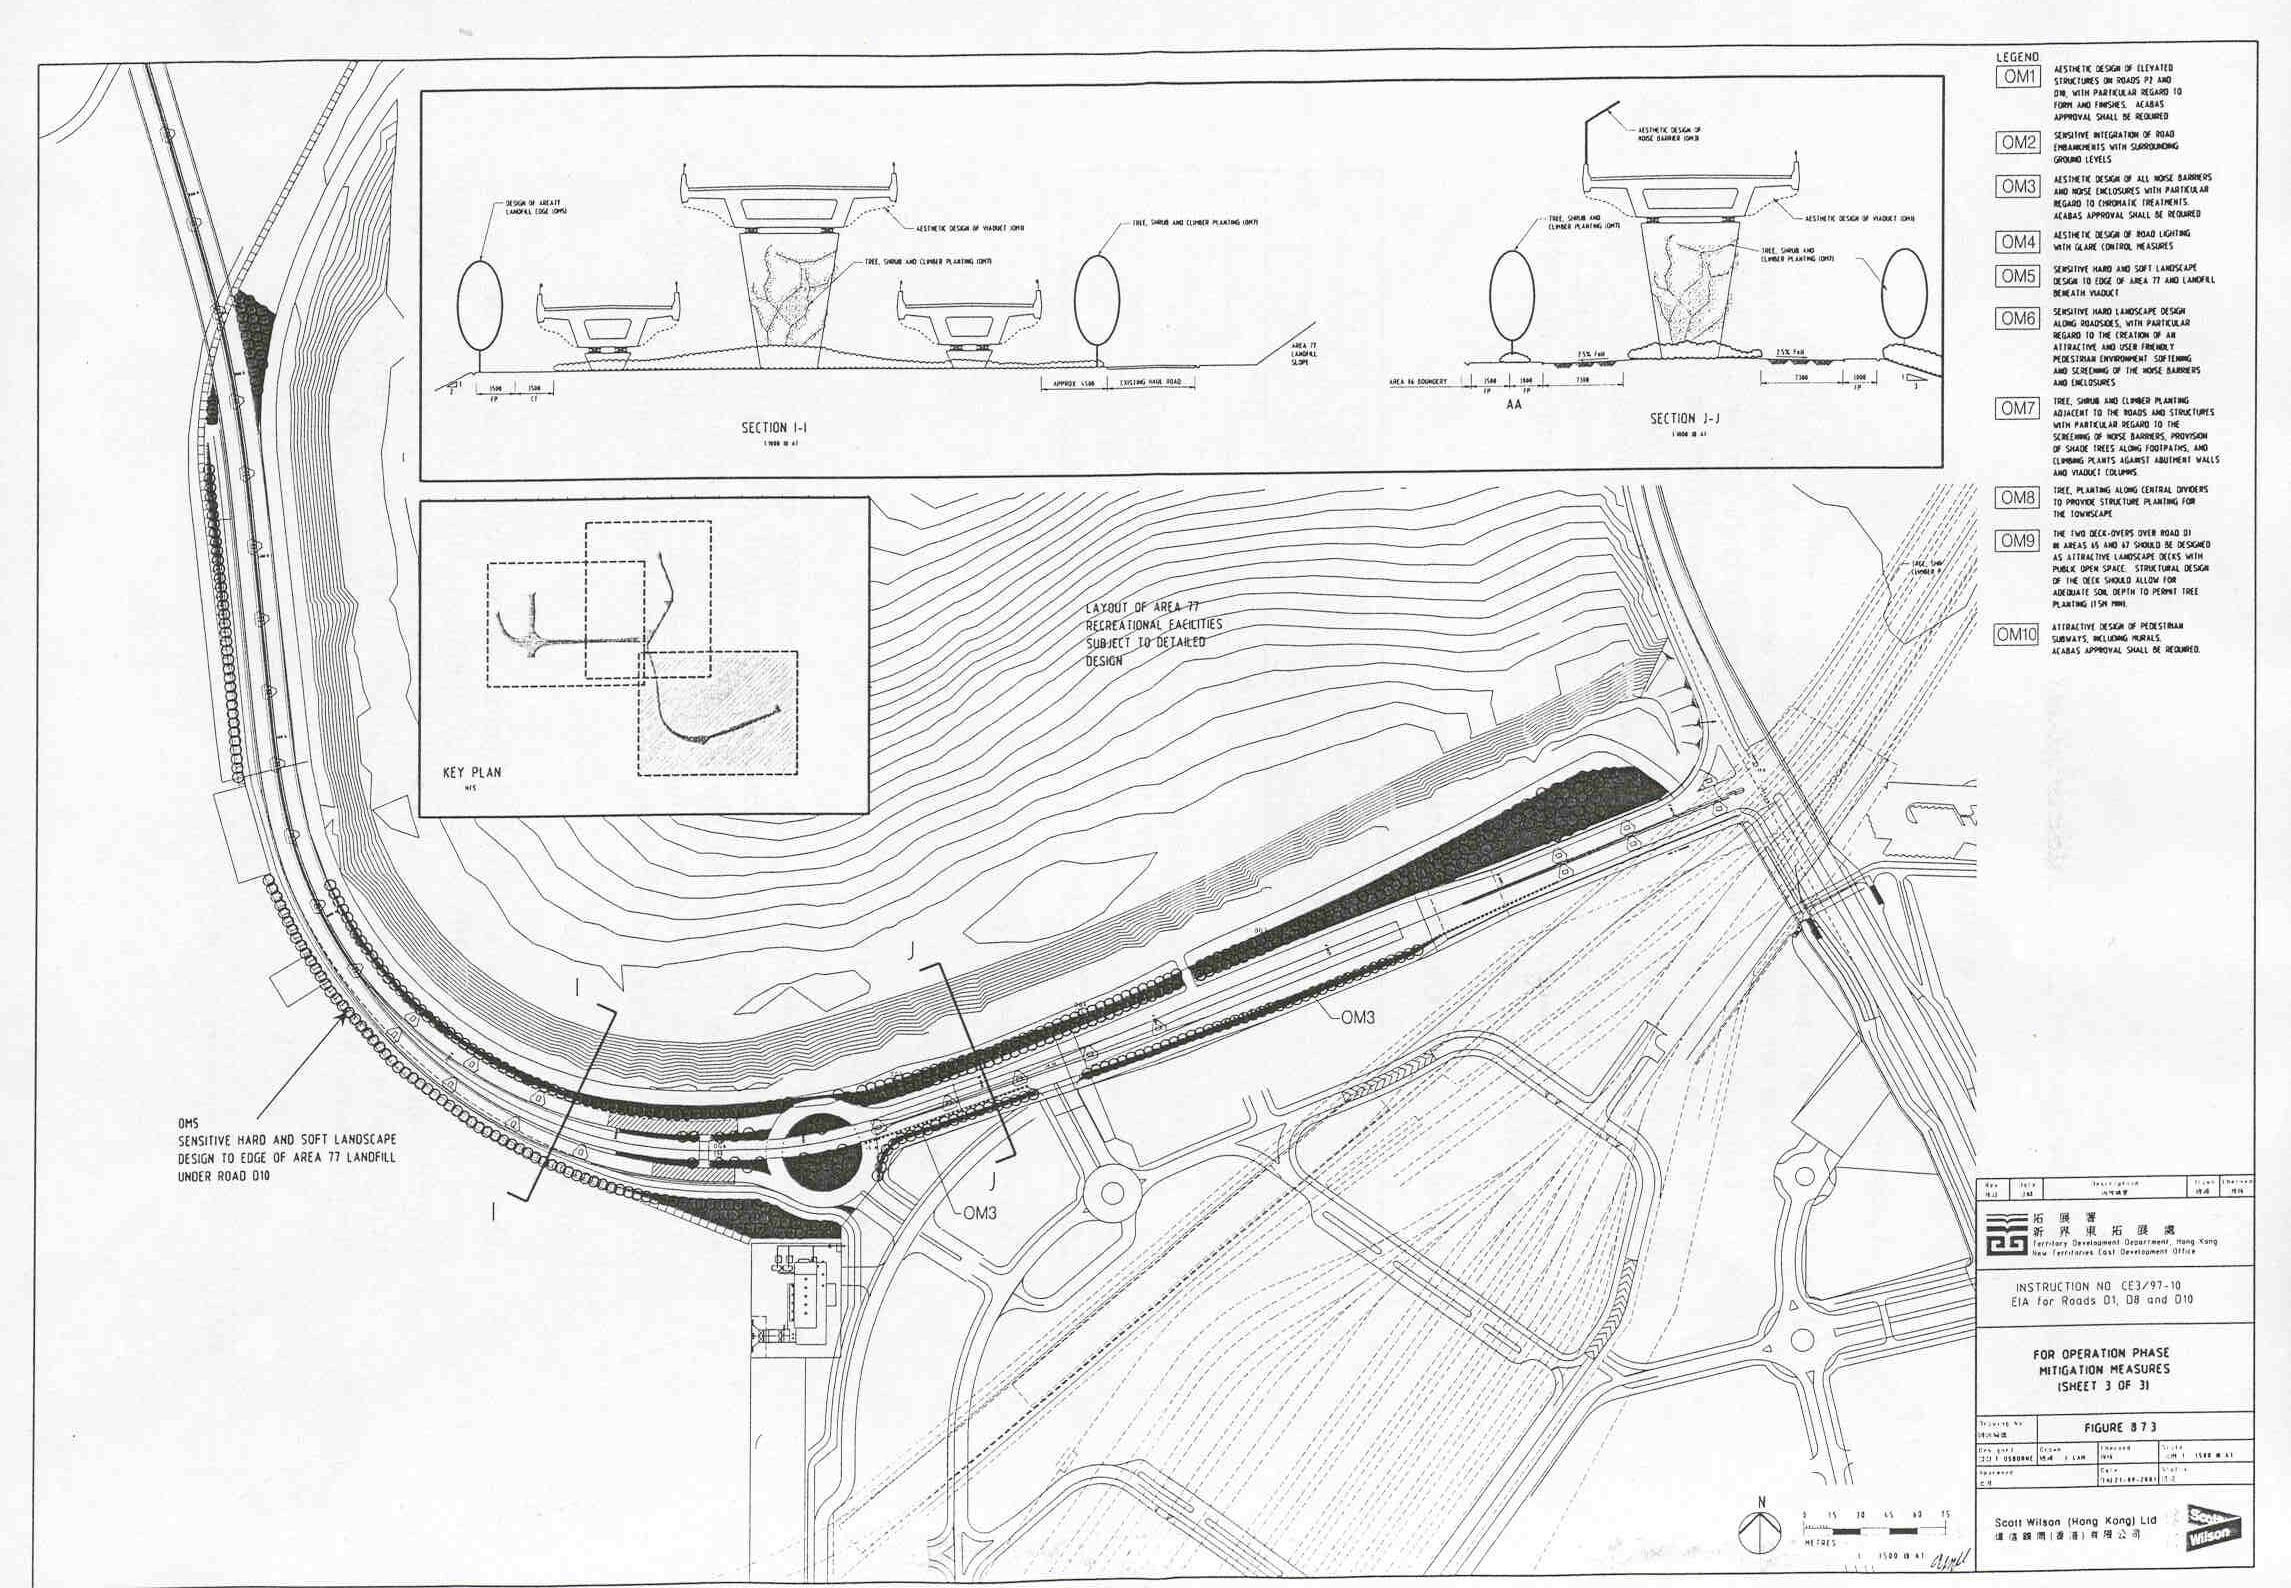
Figure
8.7.3 Operation Phase Mitigation Measures
(Sheet 3 of 3)
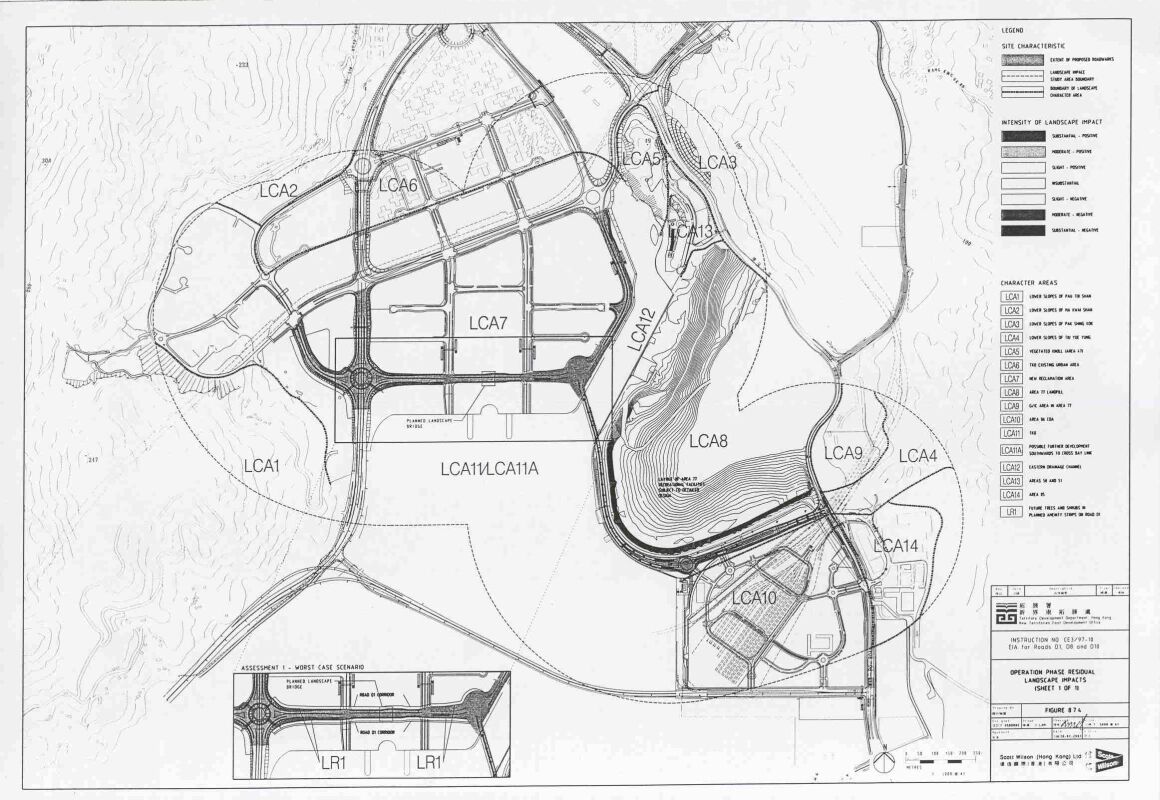
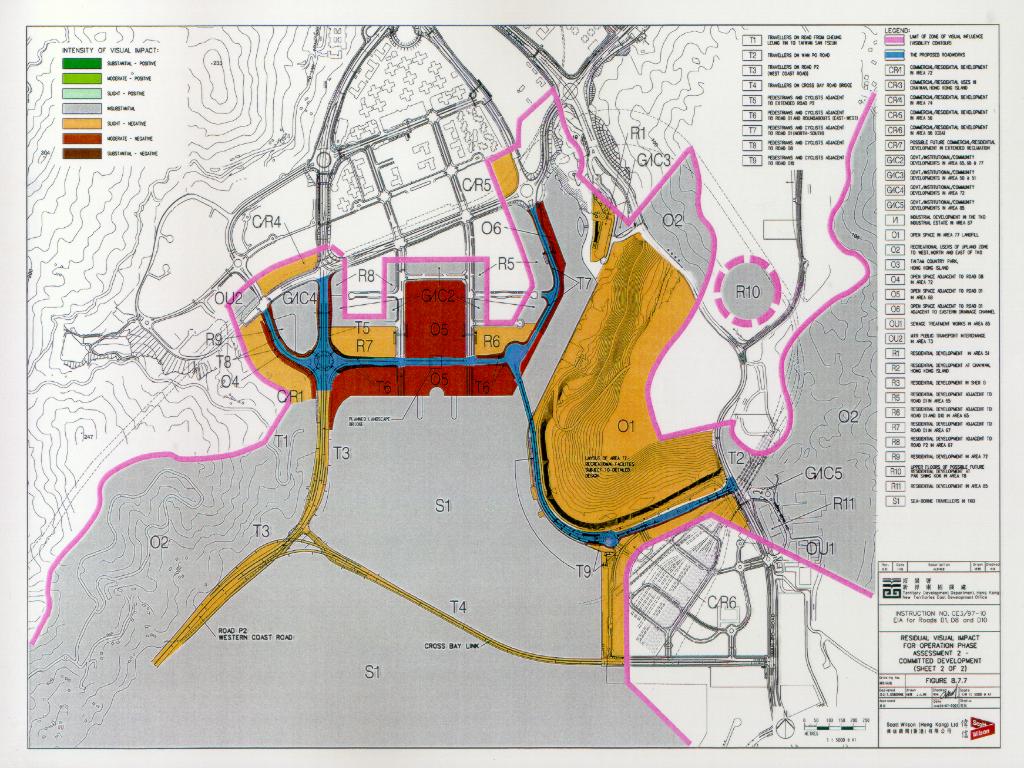
Figure
8.7.4 Operation Phase Residual Landscape
Impacts
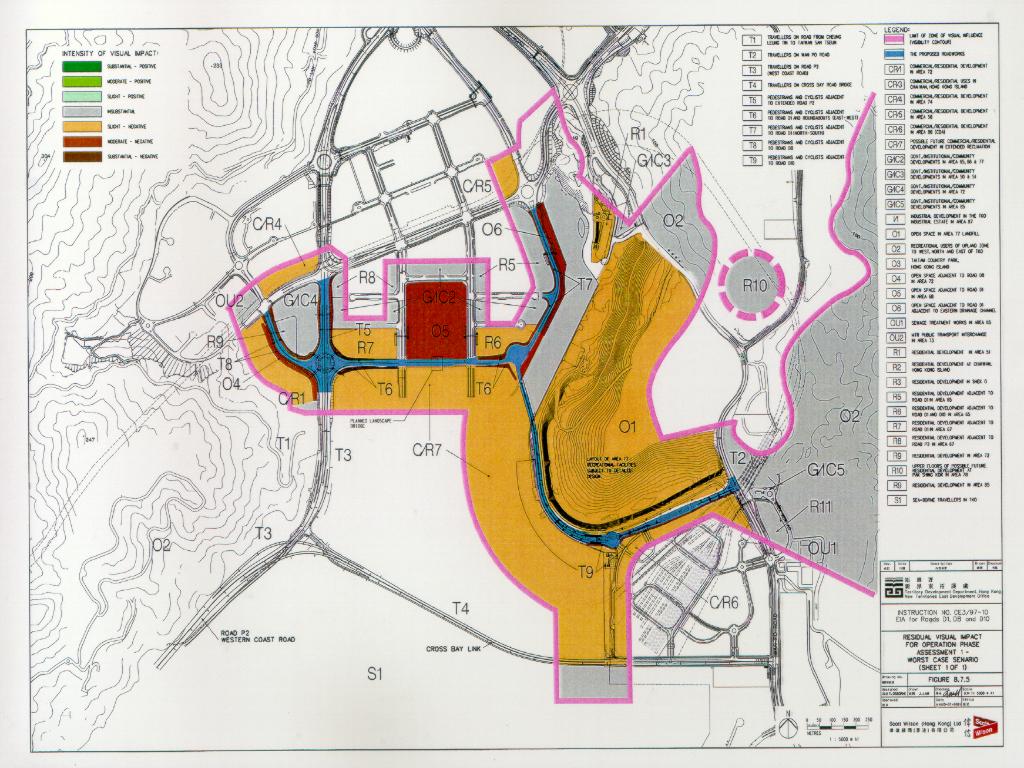
Figure
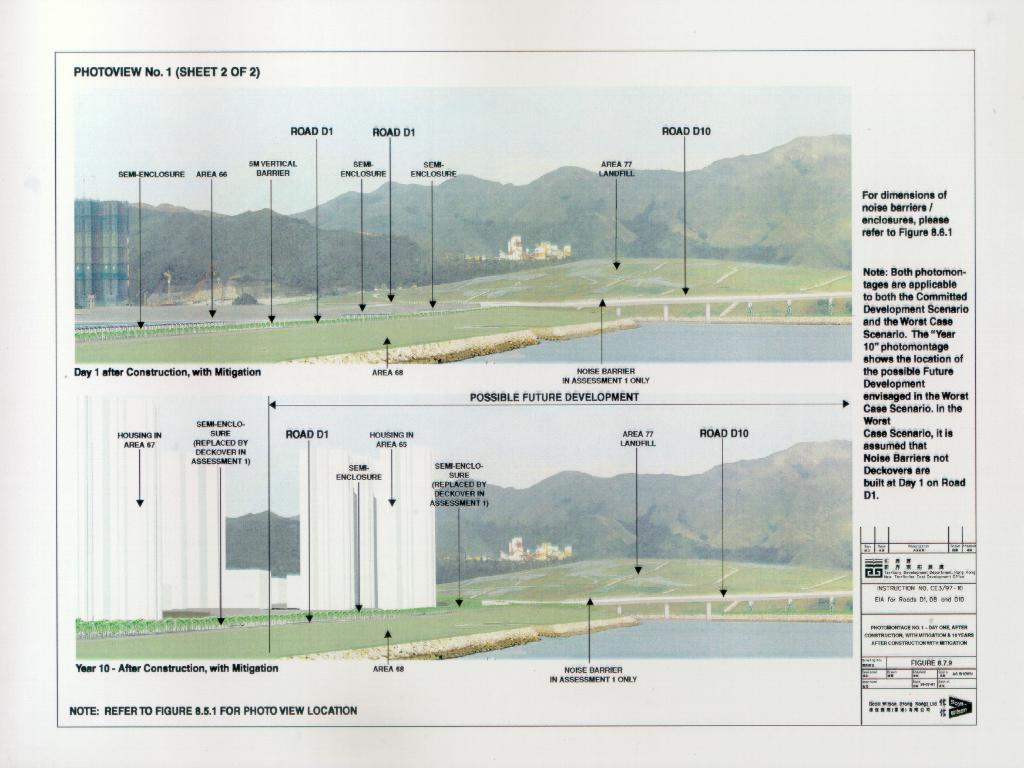
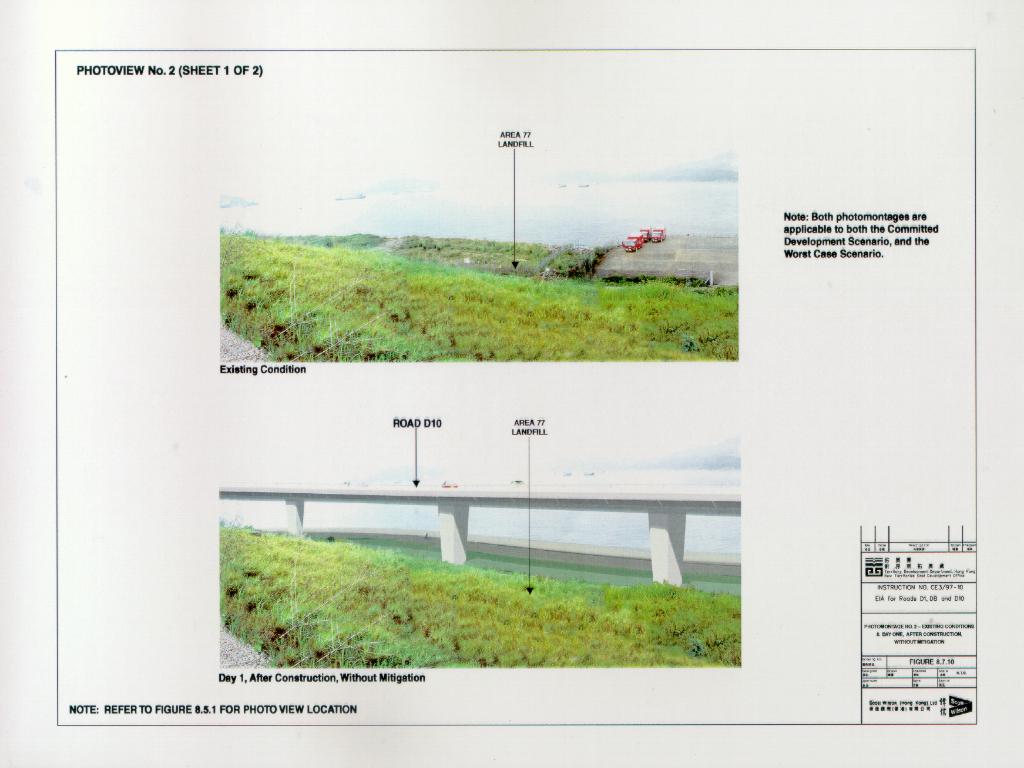
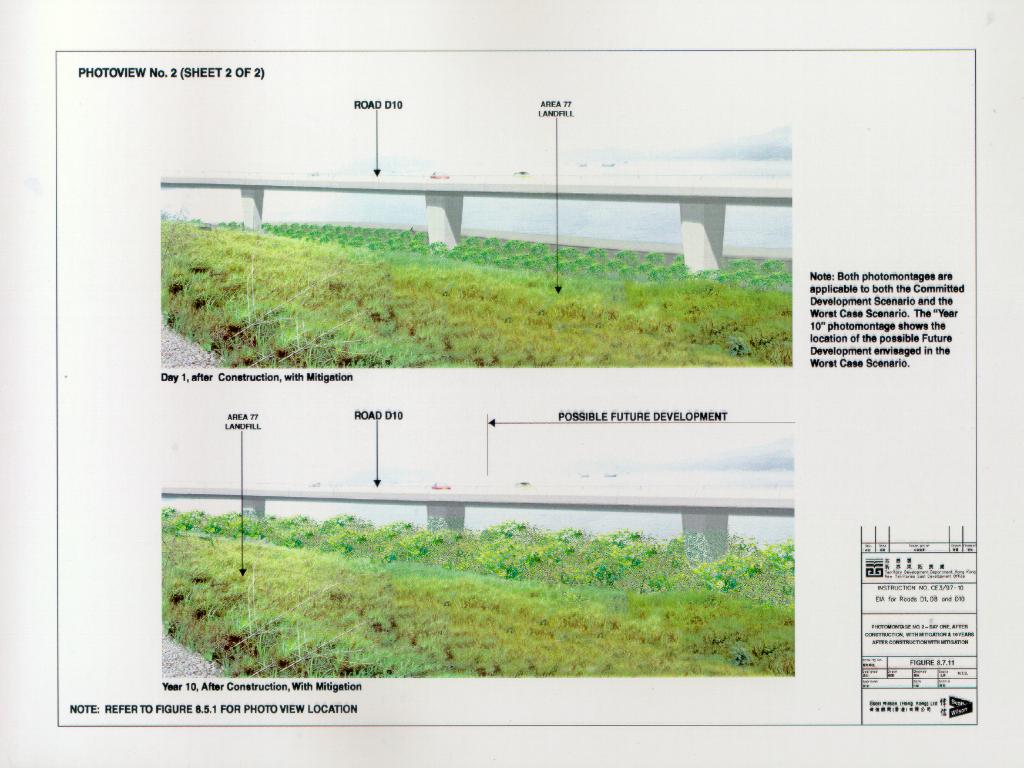
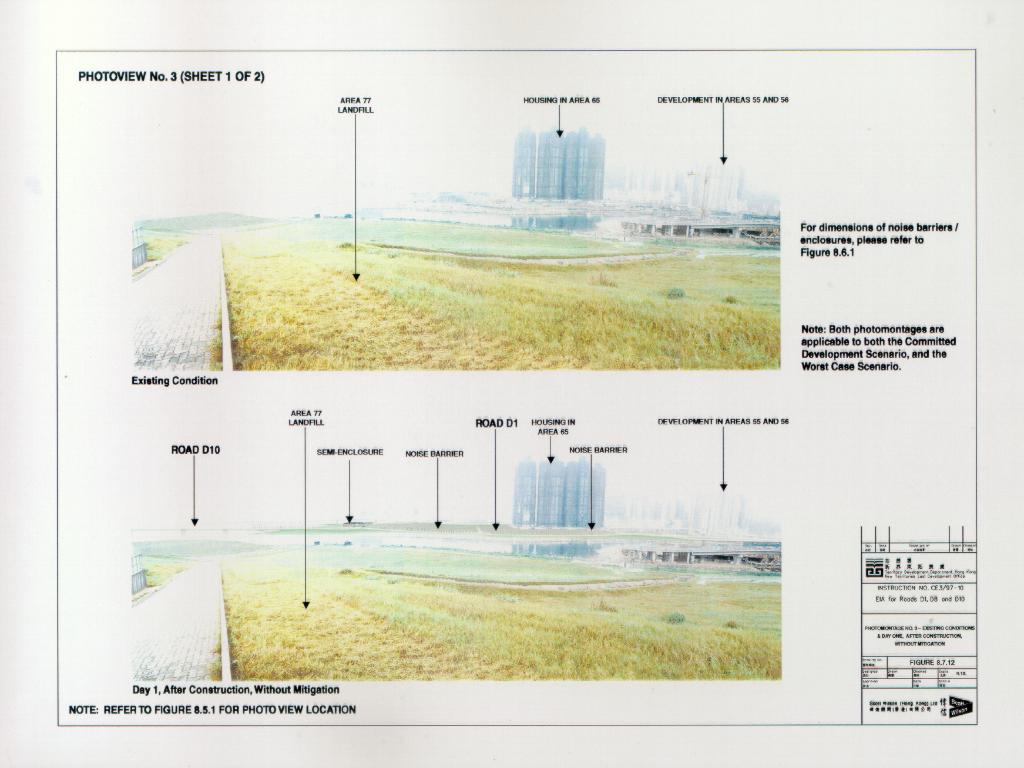
8.7.5 Operation Phase Residual Visual Impacts
– Assessment 1 – Worst Case Scenario
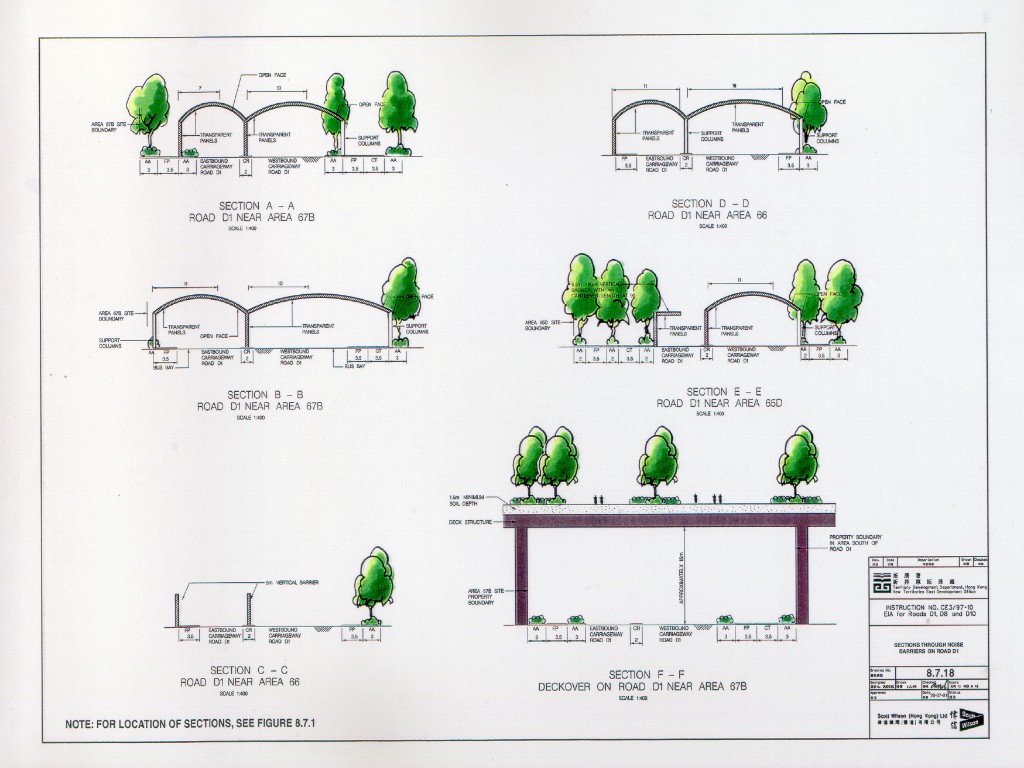
Figure
8.7.18 Sections through Noise Barrier on Road D1
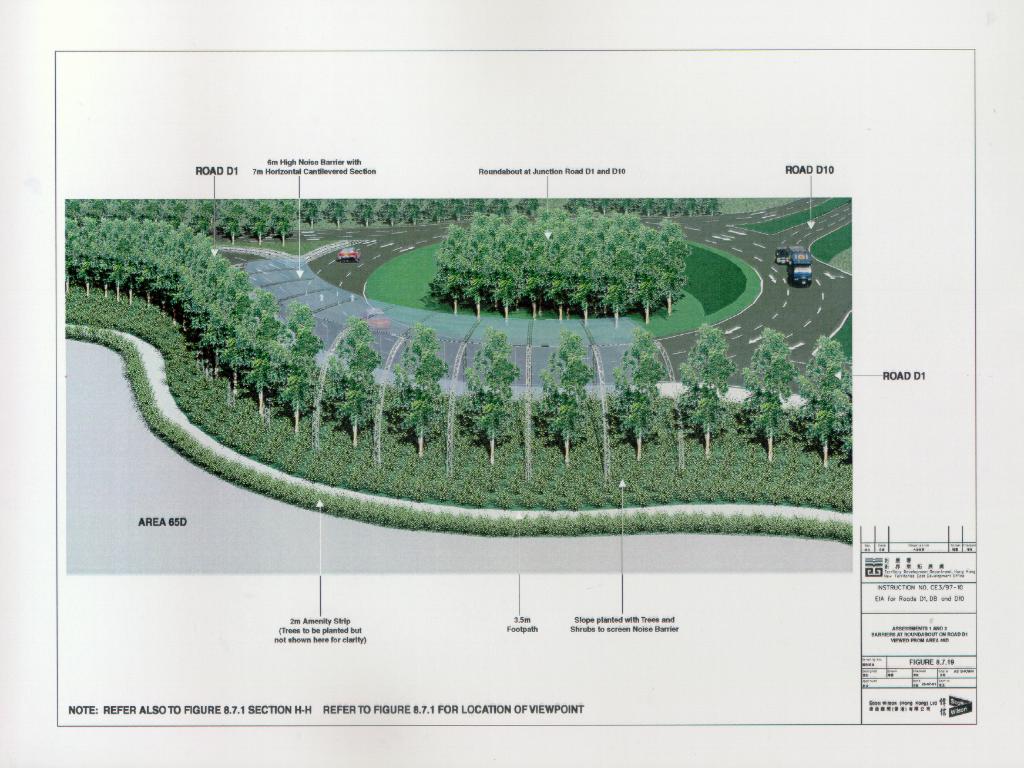
Figure
8.7.19 Assessments 1 and 2 – Barriers at Roundabout on
Road D1 adjacent to Area 65D
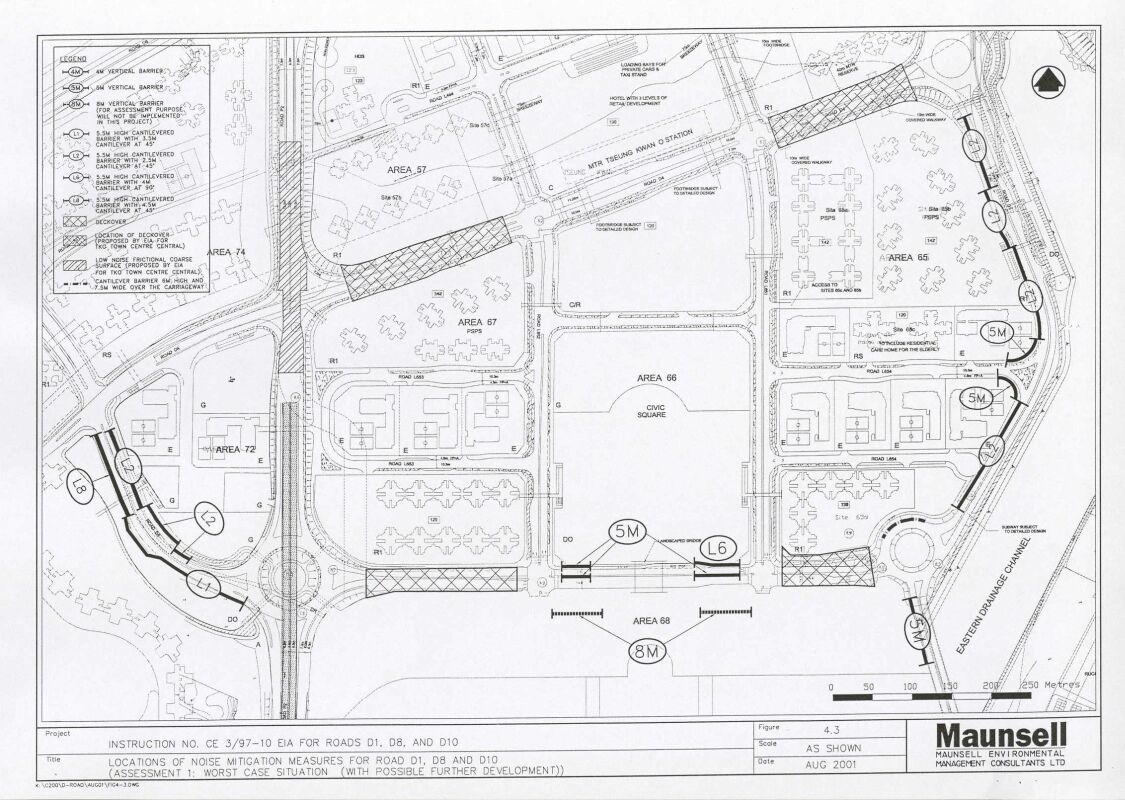
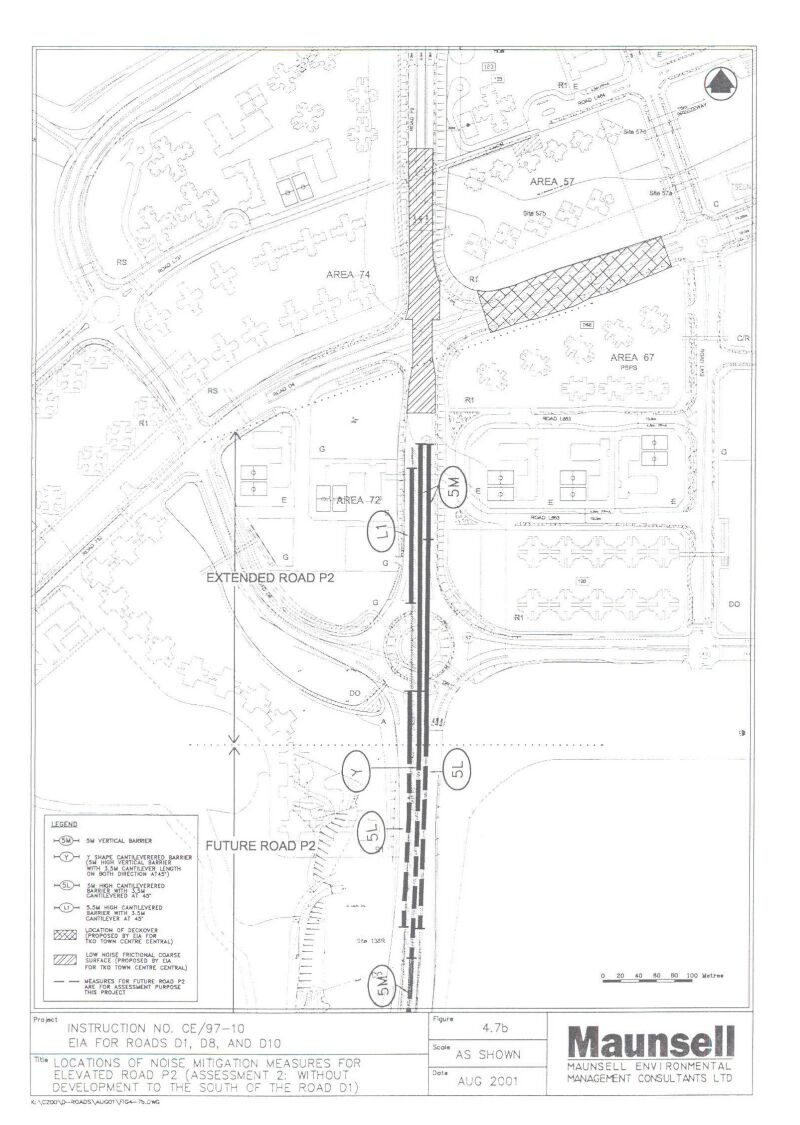
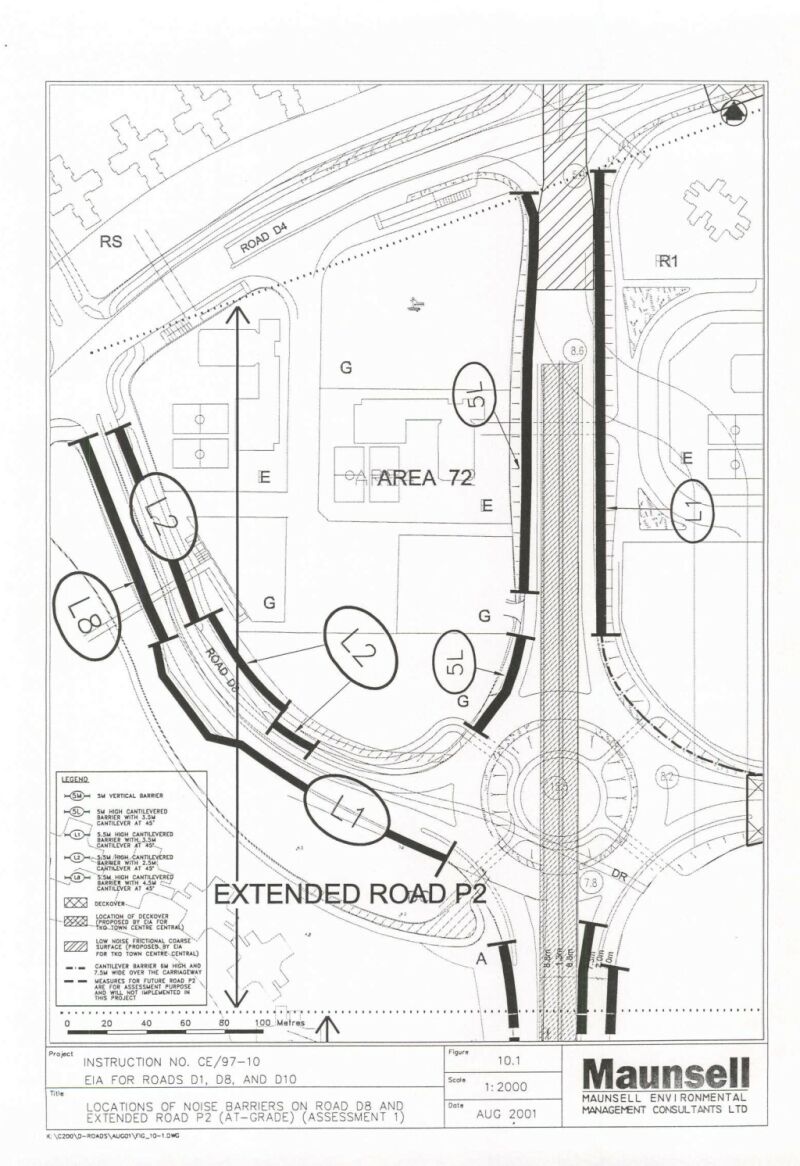
Figure 10.1
Locations of Noise Barriers on Road D8 and Extended Road P2 (At-grade)
(Assessment 1)
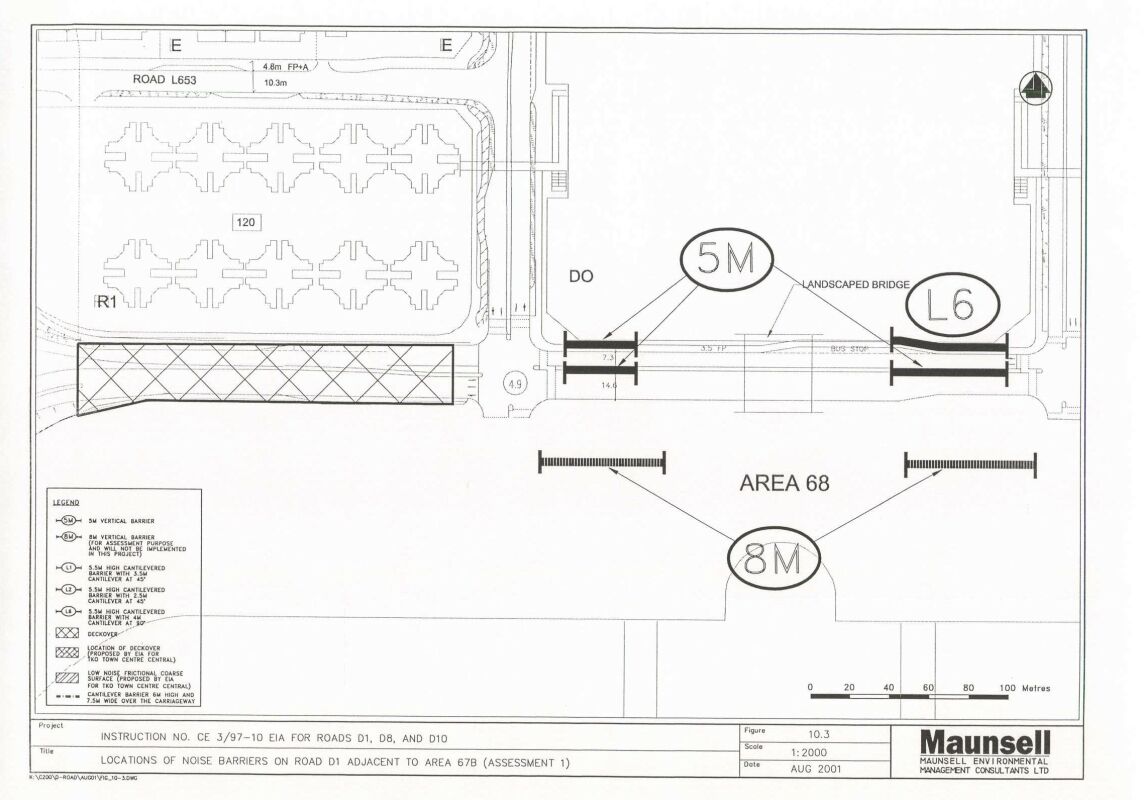
Figure 10.3
Locations of Noise Barriers on Road D1 Adjacent to Area 67B (Assessment
1)
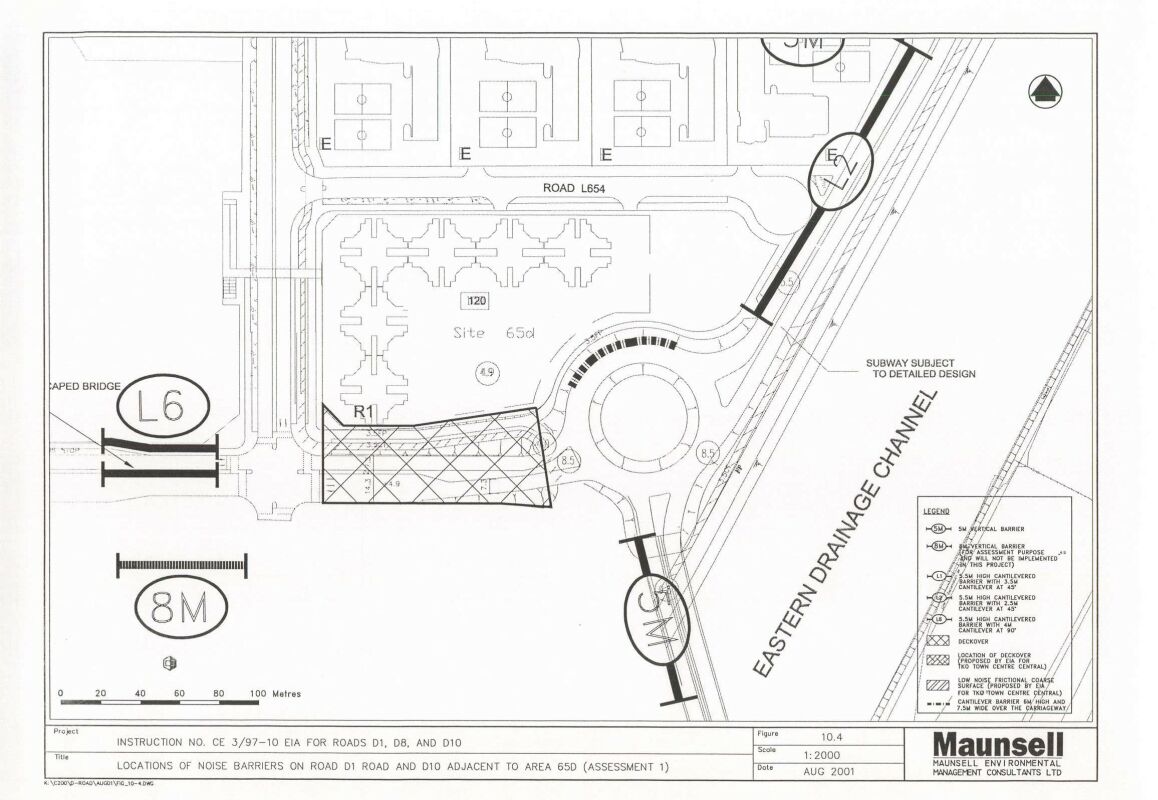
Figure 10.4
Locations of Noise Barriers on Road D1 and D10 Adjacent to Area 65D
(Assessment 1)
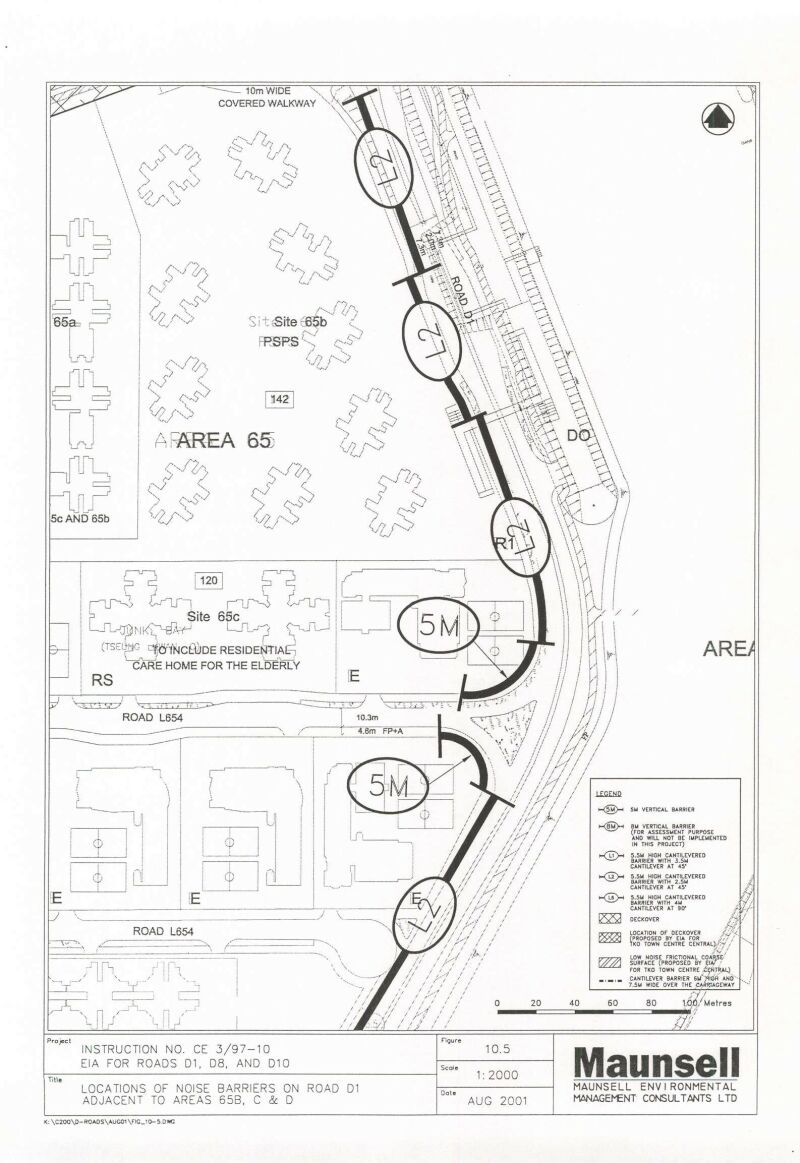
Figure 10.5
Locations of Noise Barriers on Road D1 Adjacent to Areas 65B, C &
D
Figure 10.6
Locations of Noise Barriers on Road D10 near Area 86
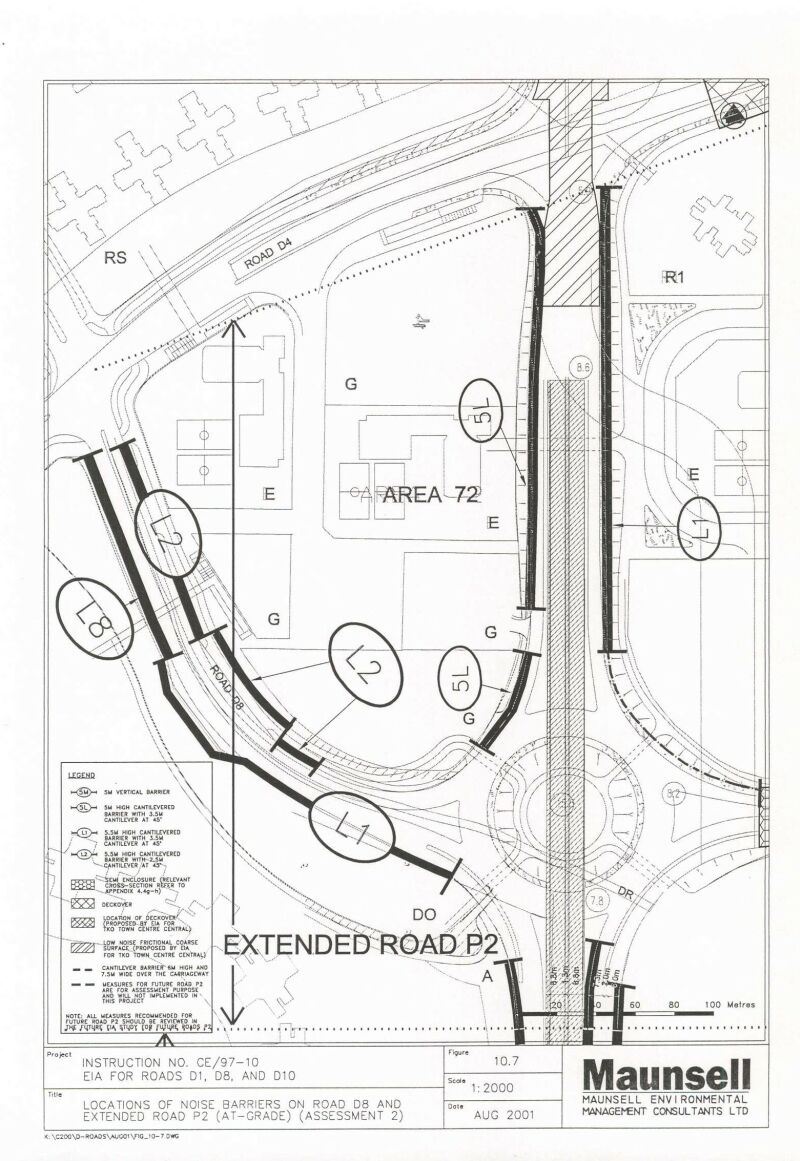
Figure 10.7
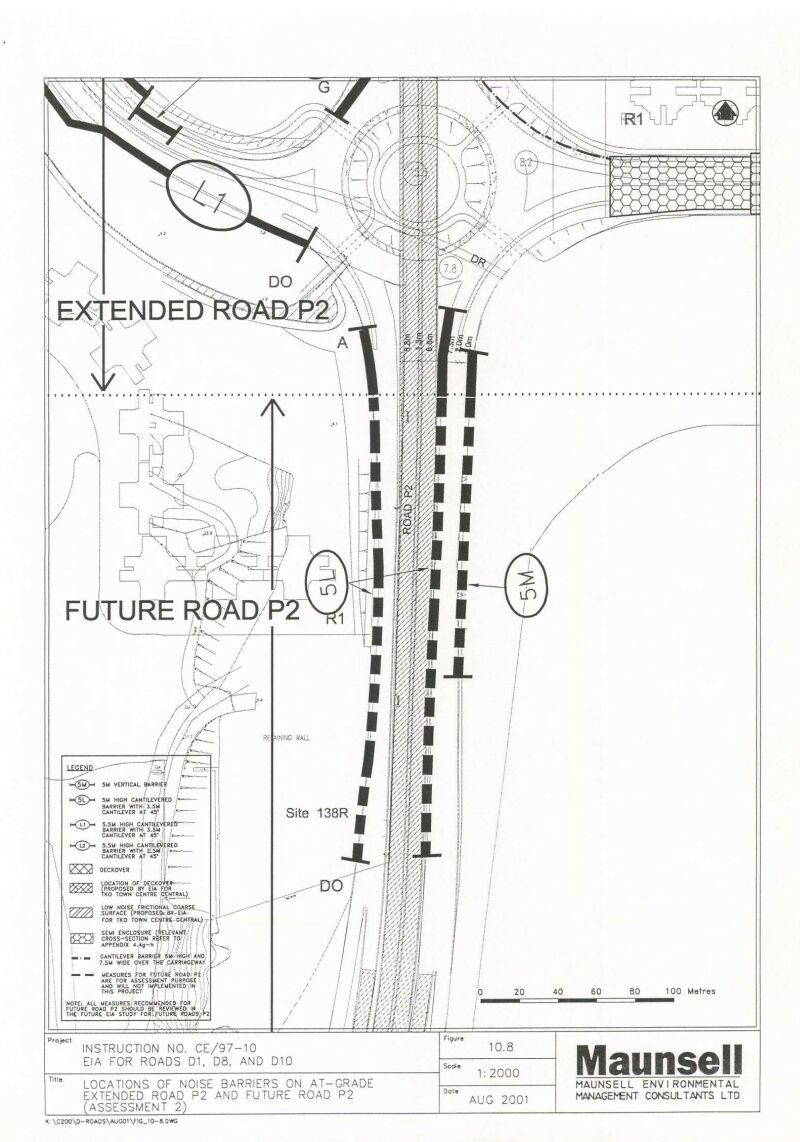
Locations of Noise Barriers on Road D8 and Extended Road P2 (At-grade)
(Assessment 2)
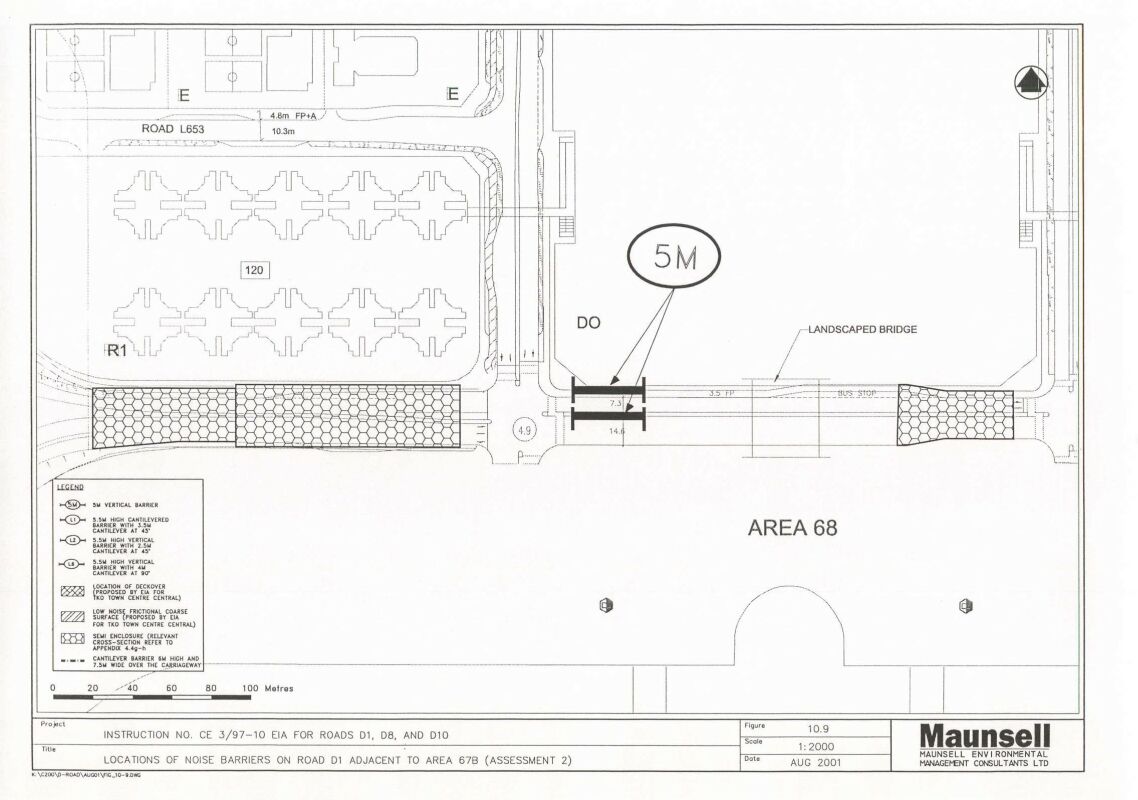
Figure 10.9
Locations of Noise Barriers on Road D1 Adjacent to Area 67B (Assessment
2)
Figure 10.10
Locations of Noise Barriers on Road D1 and Road D10 Adjacent to Area
65D (Assessment 2)
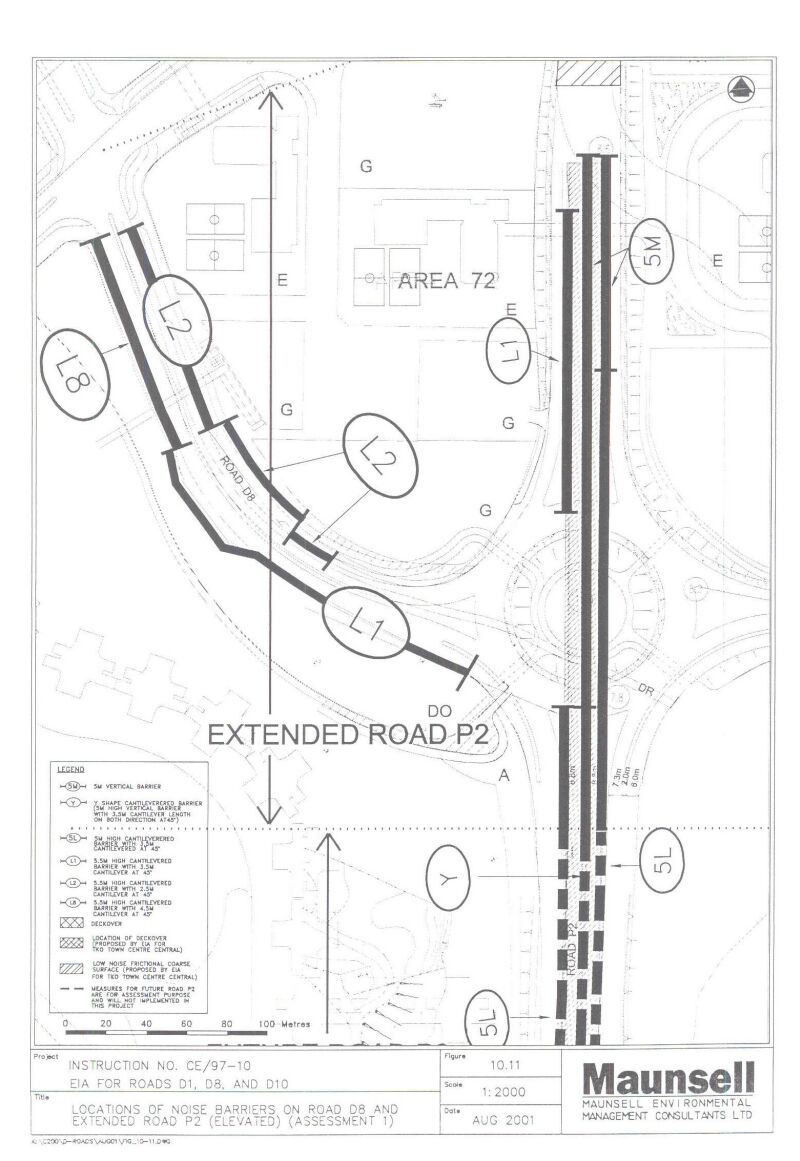
Figure 10.11
Locations of Noise Barriers on Road D8 and Extended Road P2 (Elevated)
(Assessment 1)
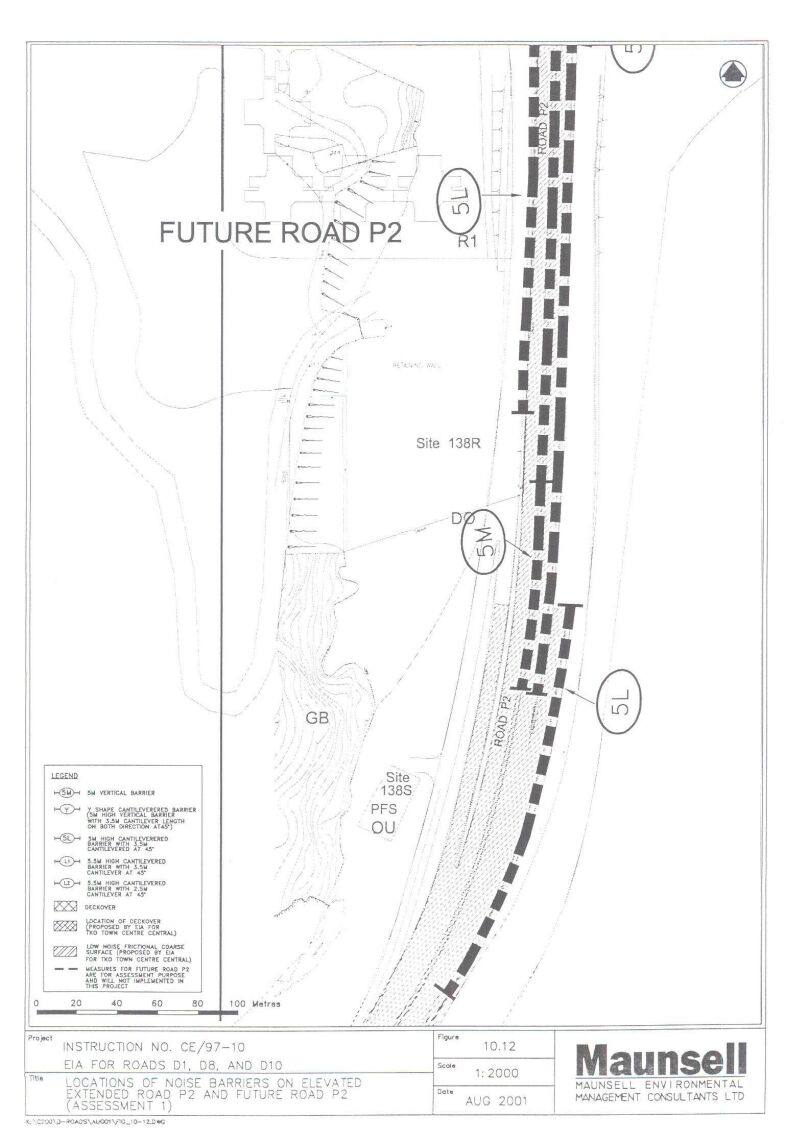
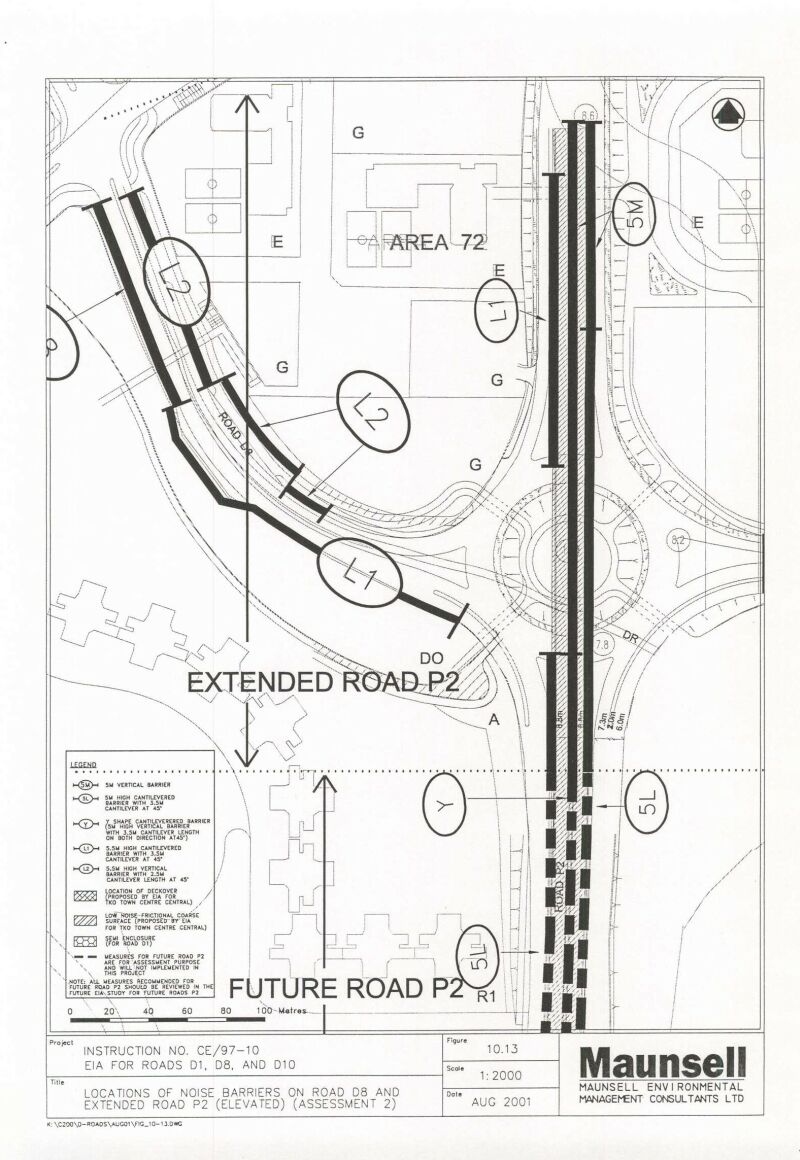
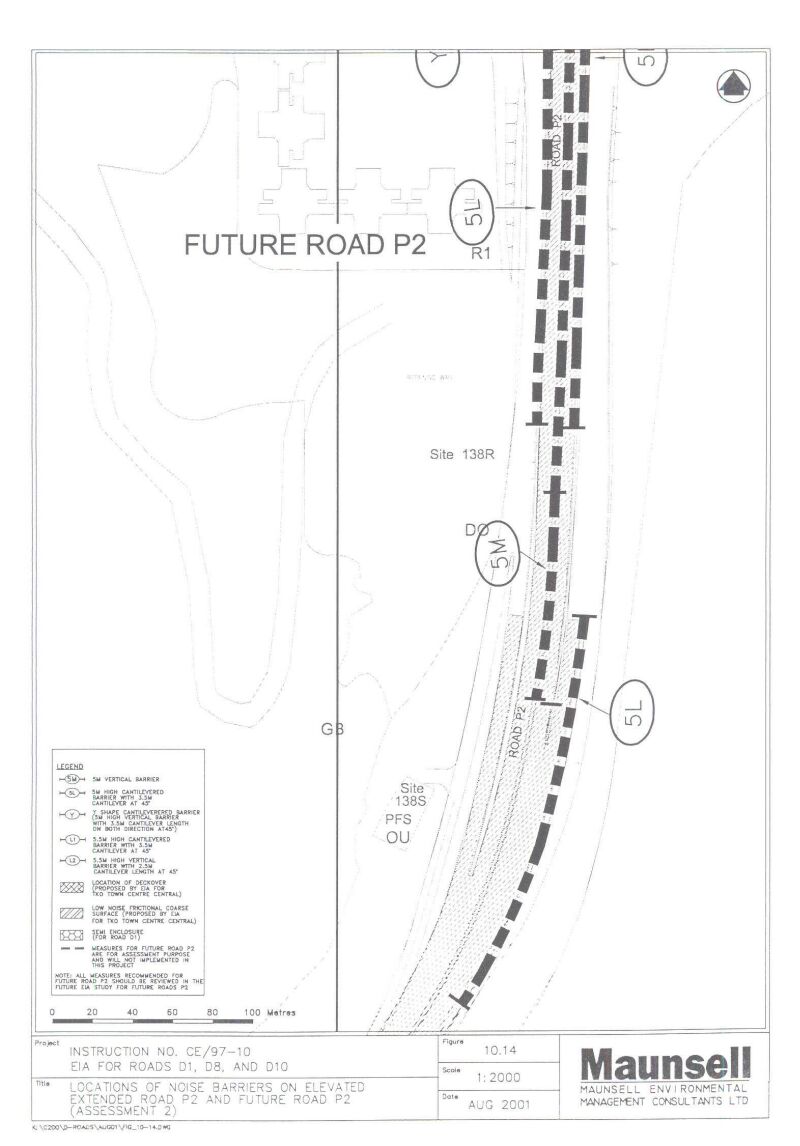
Figure 10.13
Locations of Noise Barriers on Road D8 and Extended Road P2 (Elevated)
(Assessment 2)
TKO Tseung Kwan O
EIAO TM Environmental
Impact Assessment Ordinance Technical Memorandum
WBTC Works Branch Technical Circular
PLBTC Planning & Lands
Bureau Technical Circular
GEO Geotechnical Engineering Office
CDA Comprehensive Development Area
VSR Visually Sensitive Receiver
ZVI Zone of Visual Influence
SENT South East New Territories
MTR Mass Transit Railway
C/R Commercial/Residential
R/A Residential Group A
G/IC Government/Institution
or Community
O Open Space
PSPS Private Sector Participation Scheme