Table of Content
Volume I - Environmental Impact
Assessment Report
1. INTRODUCTION
Project Background
Requirements of the Environmental Impact Assessment Ordinance
Objectives of the EIA Study
The Approach
Report Structure
Ocean Park Corporation
Project Scope
Previous Submissions
Project Location
Site History
Need for and Benefits of the Project
Project Design & Consideration of Alternatives
“Without the Project” Scenario
The EIA Assessment area
Works Programme and Implementation
Concurrent Projects Having Potential for Cumulative Effects
Traffic Forecasts
3. NOISE IMPACT
Introduction
Environmental Legislation, Standards and Guidelines
Noise Sensitive Receivers
Description of the Environment
Assessment Methodology and Uncertainties
Identification of Environmental Impact
Evaluation of Impacts
Mitigation of Adverse Environmental Impacts
Evaluation of Residual Impacts
Environmental Monitoring and Audit
Conclusion
4. LANDSCAPE AND VISUAL IMPACT ASSESSMENT
Introduction
Project Description
Review of Planning and Development Control Framework
Environmental Legislation and Standards
Methodology of Assessment of Landscape Impacts
Methodology of Assessment of Visual Impacts
Baseline Study
Landscape Impact Assessment
Visual Impact Assessment
Recommended Landscape and Visual Mitigation Measures
Residual impacts
Conclusion
5. ECOLOGY
Introduction
Environmental Legislation, Standards and Guidelines
Assessment Methodology
Ecological Value
Environmental Impact Identification, Prediction and Evaluation
Mitigation of Adverse Environmental Impacts
Evaluation of Residual Impacts
Environmental Monitoring and Audit
Conclusion
References
6. WASTE MANAGEMENT IMPLICATIONS
Introduction
Environmental Legislation, Policies, Plans, Standards and Criteria
Assessment Methodology
Identification and Evaluation of Environmental Impacts
Operation Phase
Mitigation of Adverse Environmental Impacts
Evaluation of Residual Impacts
Environmental Monitoring and Audit
Conclusion
Introduction
Environmental Legislation, Policies, Plans, Standards and Criteria
Assessment Methodology
Description of the Environment
Identification of Potential Environmental Impacts
Identification of Sensitive Receivers
Land Contamination Assessment
Prediction and Evaluation of Environmental Impacts
Preliminary Programmes for Site Investigation and Remediation (Alternative
Scenarios for HKSM site)
Mitigation Measures for Land Contamination
Residual Environmental Impact
Environmental Monitoring and Audit Requirements
Conclusions
Introduction
Environmental Legislation, Standards and Guidelines
Description of the Environment
Air Sensitive Receivers
Identification of Pollutant Sources
Assessment Methodology
Evaluation of Impacts
Mitigation of Adverse Environmental Impacts
Evaluation of Residual Impacts
Environmental Monitoring and Audit
Conclusion
Introduction
Environmental Legislation and Standards
Baseline Conditions
Water Sensitive Receivers
Assessment Methodology
Identification and Evaluation of Environmental Impacts
Mitigation Measures
Residual Environmental Impacts
Conclusion
10. SEWERAGE AND SEWAGE TREATMENT
Introduction
Background
Sewerage Catchment Area
Design assumptions and criteria
Development and Flow Projections
Existing & Committed Sewerage Infrastructure
Sewerage Impact Assessment
Conclusion
11. CULTURAL HERITAGE IMPACT ASSESSMENT
Introduction
Project Location
Proposed Works
Environmental Legislation and Standards
Archaeology
Identification and Evaluation of Potential Impacts
Mitigation Measures
Built Heritage
Baseline Conditions
Identification and Evaluation of Potential Impacts
Mitigation Measures
Conclusion
EM&A
References
12. HAZARD TO LIFE
Introduction
Environmental Legislations, Policies, Plans, Standards and Criteria
Assessment Approach and Methodology
Assessment Result
Conclusions and Recommendations
13. ENVIRONMENTAL MONITORING AND AUDIT
Introduction
Noise Impact
Landscape and Visual Impact
Ecological Impact
Waste Management Implications
Land Contamination
Air Quality Impact
Water Quality Impact
Sewerage and Sewage Treatment Implication
Impact on Cultural Heritage
Hazard to Life
14. CONCLUSIONS & SUMMARY OF ENVIRONMENTAL OUTCOMES
Introduction
Noise Impact
Landscape and Visual Impact
Ecological Impact
Waste Management Implications
Land Contamination
Air Quality Impact
Water Quality Impact
Sewerage and Sewage Treatment Implications
Impact on Cultural Heritage
Hazard to Life
Overall Conclusion
15. IMPLEMENTATION SCHEDULE AND RECOMMENDED MITIGATION
MEASURES
List of Tables
Table 2.1 Summary
of Construction Period for the Development
Table 3.1 Acceptable
Noise Level for Fixed Plant Noise
Table 3.2 Representative
Noise Sensitive Receivers
Table 3.3 Key
Noise Sources to the existing NSRs
Table 3.3a Noise
Measurement Locations
Table 3.3b Measured
Noise Levels
Table 3.4 Prevailing
Background Noise Levels at Representative NSRs
Table 3.5 Traffic
Scenarios Assessed
Table 3.7 Unmitigated
Construction Noise Levels During Normal Daytime Working Hours
Table 3.10 Predicted
Fixed Plant Noise Levels
Table 3.11 Predicted
Entertainment Noise Levels – Scenarios A and B
Table 3.12 Cumulative
Impact of Fixed Noise Sources – Scenario IIA
Table 3.13 Cumulative
Impact of Fixed Noise Sources – Scenario IIB
Table 3.14 Summary
of Mitigated Construction Noise Levels During Non-restricted Hours
Table 4.4 Example
Matrix for Assessment of Glare – Noon
Table 4.5 Example
Matrix for Assessment of Glare – Morning or Dusk
Table 4.6 Extent
of View and Relative Altitudes of VSRs Compared with Ocean Park
Table 4.7 Significance
of Visual Impacts in Construction and Operational Phases Before Mitigation
Table 4.9 Recommended
Mitigation Measures and Residual Impact AFTER Mitigation for LR
Table 4.10 Recommended
Mitigation Measures and Residual Impact AFTER Mitigation for LCA
Table 4.11 Recommended
Mitigation Measures and Residual Impact AFTER Mitigation for VSR
Table 5.1 Summary
of Rapid Ecological Assessment dive survey results
Table 5.2 Summary
Information on Coral Species recorded
Table 5.3 Summary
of Ocean Park Dive Survey compared to the five best transects of the HKUWS
Table 5.4a Ecological
Value of Low Shrubland and Tall Shrubland in the Assessment Area
Table 5.4b Ecological
Value of Plantation & Parkland and Developed Areas in the Assessment Area
Table 5.4c Ecological
Value of Freshwater Habitats & Rocky Shore in the Assessment Area
Table 5.4d Ecological
Value of Sandy Shore and Artificial Seawall in the Assessment Area
Table 5.4e Ecological
Value of Subtidal Habitats in the Assessment Area
Table 5.5a Evaluation of Floral Species of
Conservation Interest Recorded Within the Assessment Area
Table 5.5b Evaluation of Faunal Species of
Conservation Interest Recorded Within Assessment Area
Table 5.6 Direct
Habitat Loss Resulting From Proposed Works
Table 5.7a Overall
Impact Evaluation of Low Shrubland and Tall Shrubland
Table 5.7b Overall
Impact Evaluation of Plantation & Parkland & Developed Areas
Table 5.7c Overall
Impact Evaluation of Freshwater Habitats
Table 5.8 Overall
Impacts to Species of Conservation Interest
Table 5.7d Overall
Impact Evaluation of Rocky Shore and Sandy Habitats
Table 5.7e Overall
Impact Evaluation of Artificial Seawall and Subtidal Habitats
Table 6.1 Summary
of C&D Material Volumes
Table 6.2 Estimated
Timing of C&D Material and C&D Waste Generation
Table 6.3 Summary
of Waste Materials Produced During Park Operation
Table 6.4 Summary
of Waste Handling Procedures and Disposal Routes
Table 7.1 Aerial
Photographs Reviewed
Table 7.2 Records
of Current and Past Registration of Storage of Dangerous Goods
Table 7.3 Potential
Contaminative Areas/Activities in the Hong Kong School of Motoring
Table 7.4 Potential
Contaminative Areas/Activities in the Citybus Depot
Table 7.5 Potential
Contaminative Areas/Activities in the Existing Ocean Park
Table 7.6a Summary
of Elevated Levels of Heavy Metal in Soil Samples at CBD Site
Table 7.6b Estimated
Volume of Heavy Metals Contaminated Soil for CS/S Treatment
Table 7.7 Estimated
Volume of Contaminated Soil at Identified Hotspots in HKSM
Table 7.8 Possible
Remediation Options and Preliminary Remediation Programme For HKSM Site
Table 7.9 Comparison
between Tai Shue Wan and Open Space near the Rest Garden for Biopile Treatment
Table 8.1 Hong
Kong Air Quality Objectives
Table 8.2 Background
Air Pollutant Concentration for the Study Area
Table 8.3 Summary
of Representative Air Sensitive Receivers
Table 8.4 Details
of Aberdeen Tunnel and Ventilation Shafts
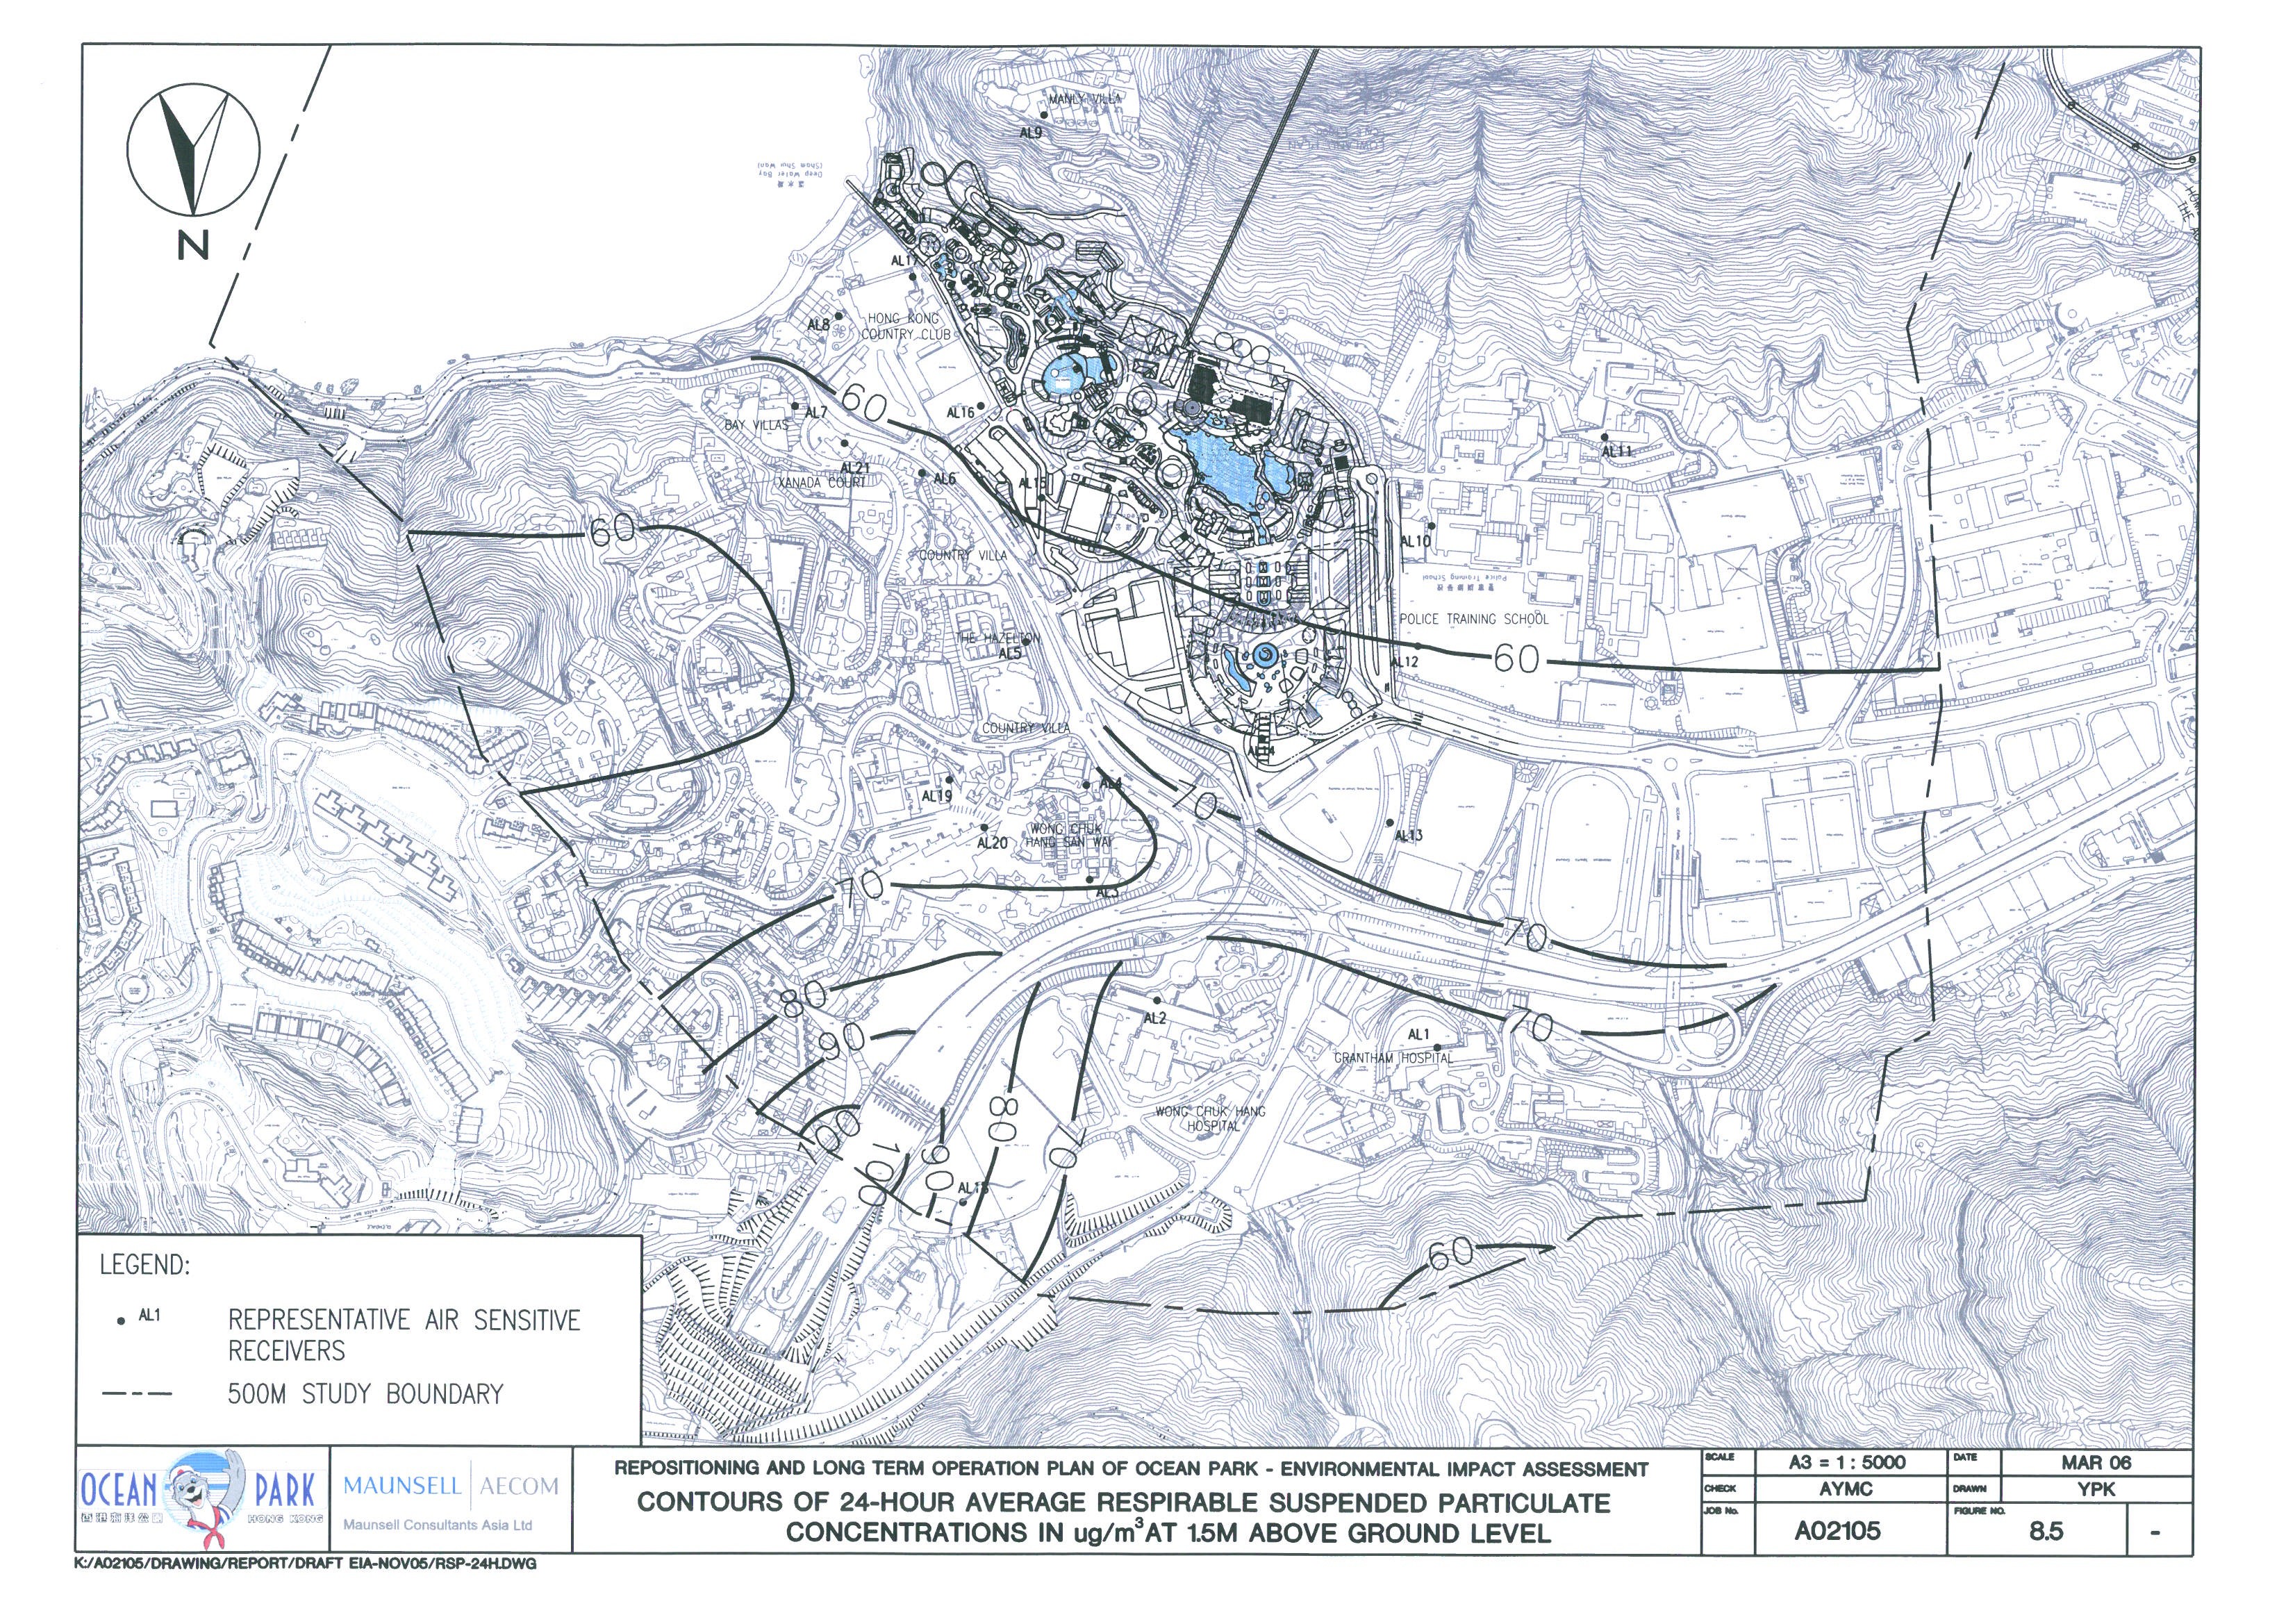
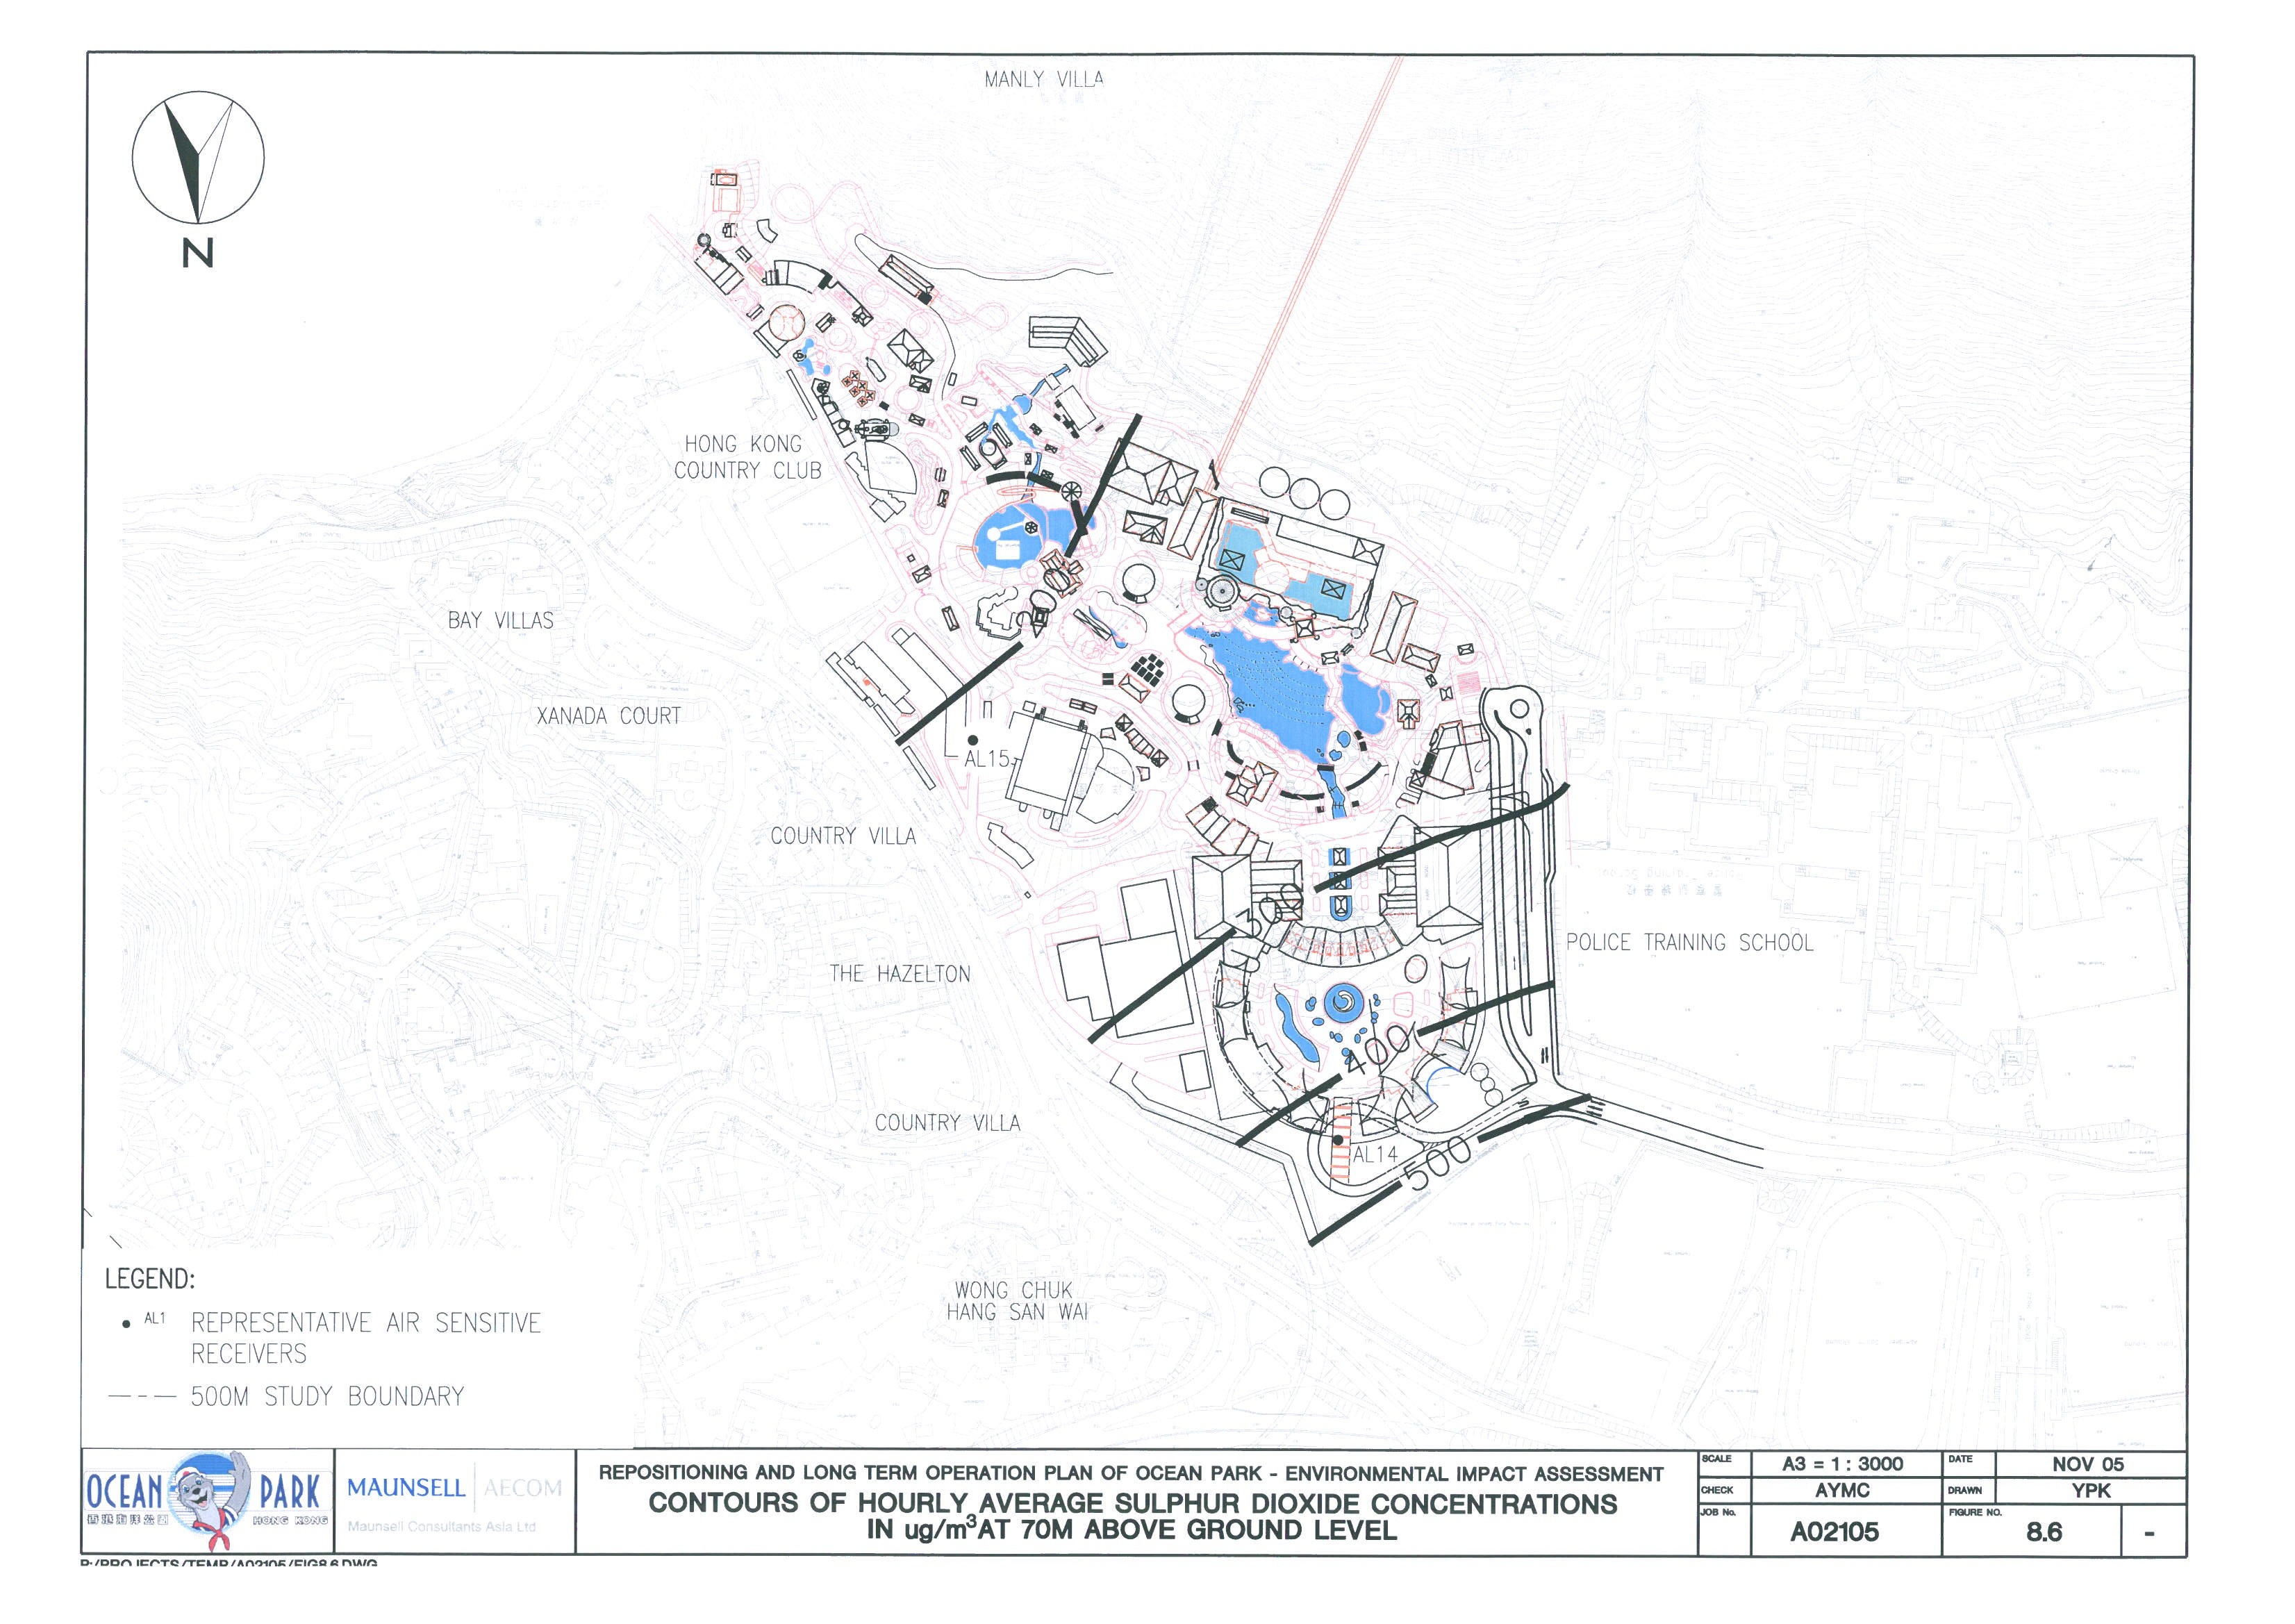
Table 8.7 Predicted
SO2 concentrations at Representative ASRs for Future Scenario
Table 9.1 Summary
of Water Quality Objectives for Marine Waters of Southern Water Control Zone
Table 9.2 Summary
of Water Quality Objectives for Marine Waters of Western Buffer Water Control
Zone
Table 9.3 Summary
Statistics of Marine Water Quality in the Southern WCZ at Station SM2
Table 10.1 Assumptions
on Unit Flow Factors
Table 10.2 Recommended
Unit Flow Factors
Table 10.3 ADWF
in Year 2016 for the Aberdeen Catchment
Table 10.4 Recommended
Peaking Factors for Sewers
Table 10.5 Estimated
sewage flow from Ocean Park after redevelopment
Table 10.6 Existing
Facilities of the Aberdeen PTW*
Table 10.7 Summary
of Surcharged Sewers at Peak Flow under SIA Condition
Table 10.8 Summary
of Recommended Sewerage Upgrading Works
Table 11.1 Recommended
Mitigation Measures for the Proposed Project
Table 11.2 Adverse
Impacts to Historical Buildings during the Construction Phase
Table 11.3 Adverse
Impacts to Historical Graves during the Construction Phase
Table 11.4 Adverse
Impacts to Historical Buildings during the Operation Phase
Table 11.5 Adverse
impacts to the Historical Graves during the Operational Phase
Table 14.1 Summary
of Key Environmental Outcomes / Benefits
Table 15.1 Project
Implementation Schedule
Volume II – Drawings
List of Figures
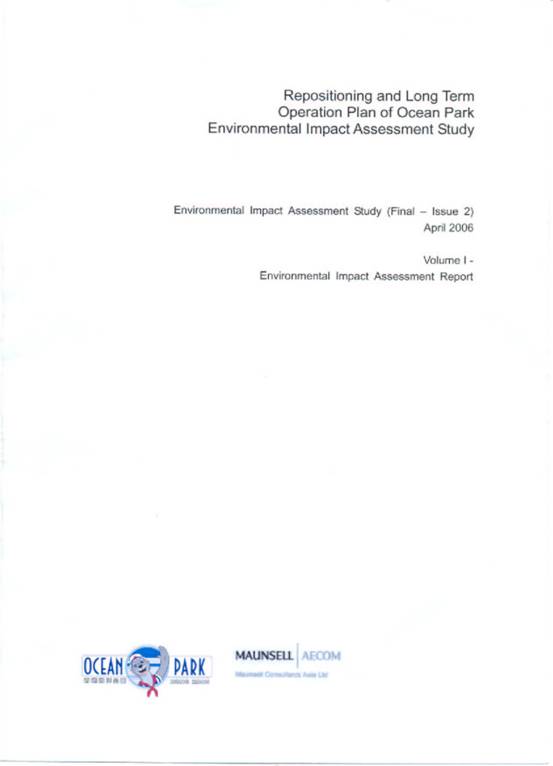
Figure 1.1 Location
of the Project Site
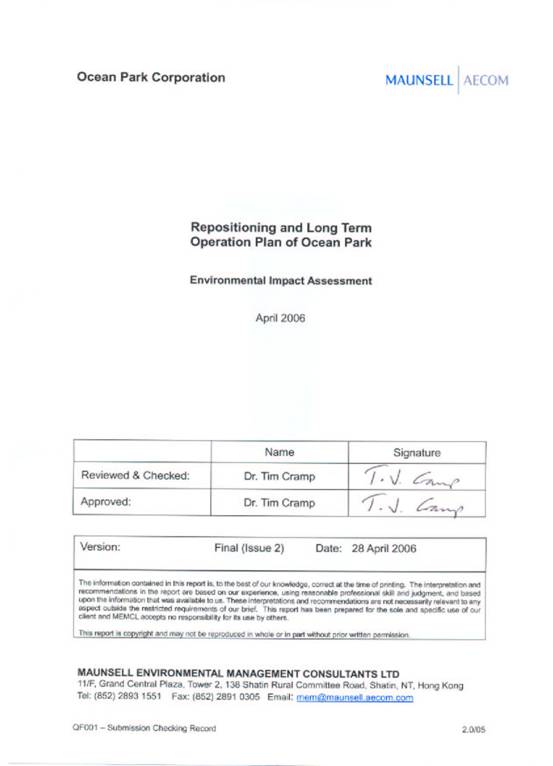
Figure 2.1 Master
Plan –The Waterfront
Figure 2.2 Master
Plan –The Summit
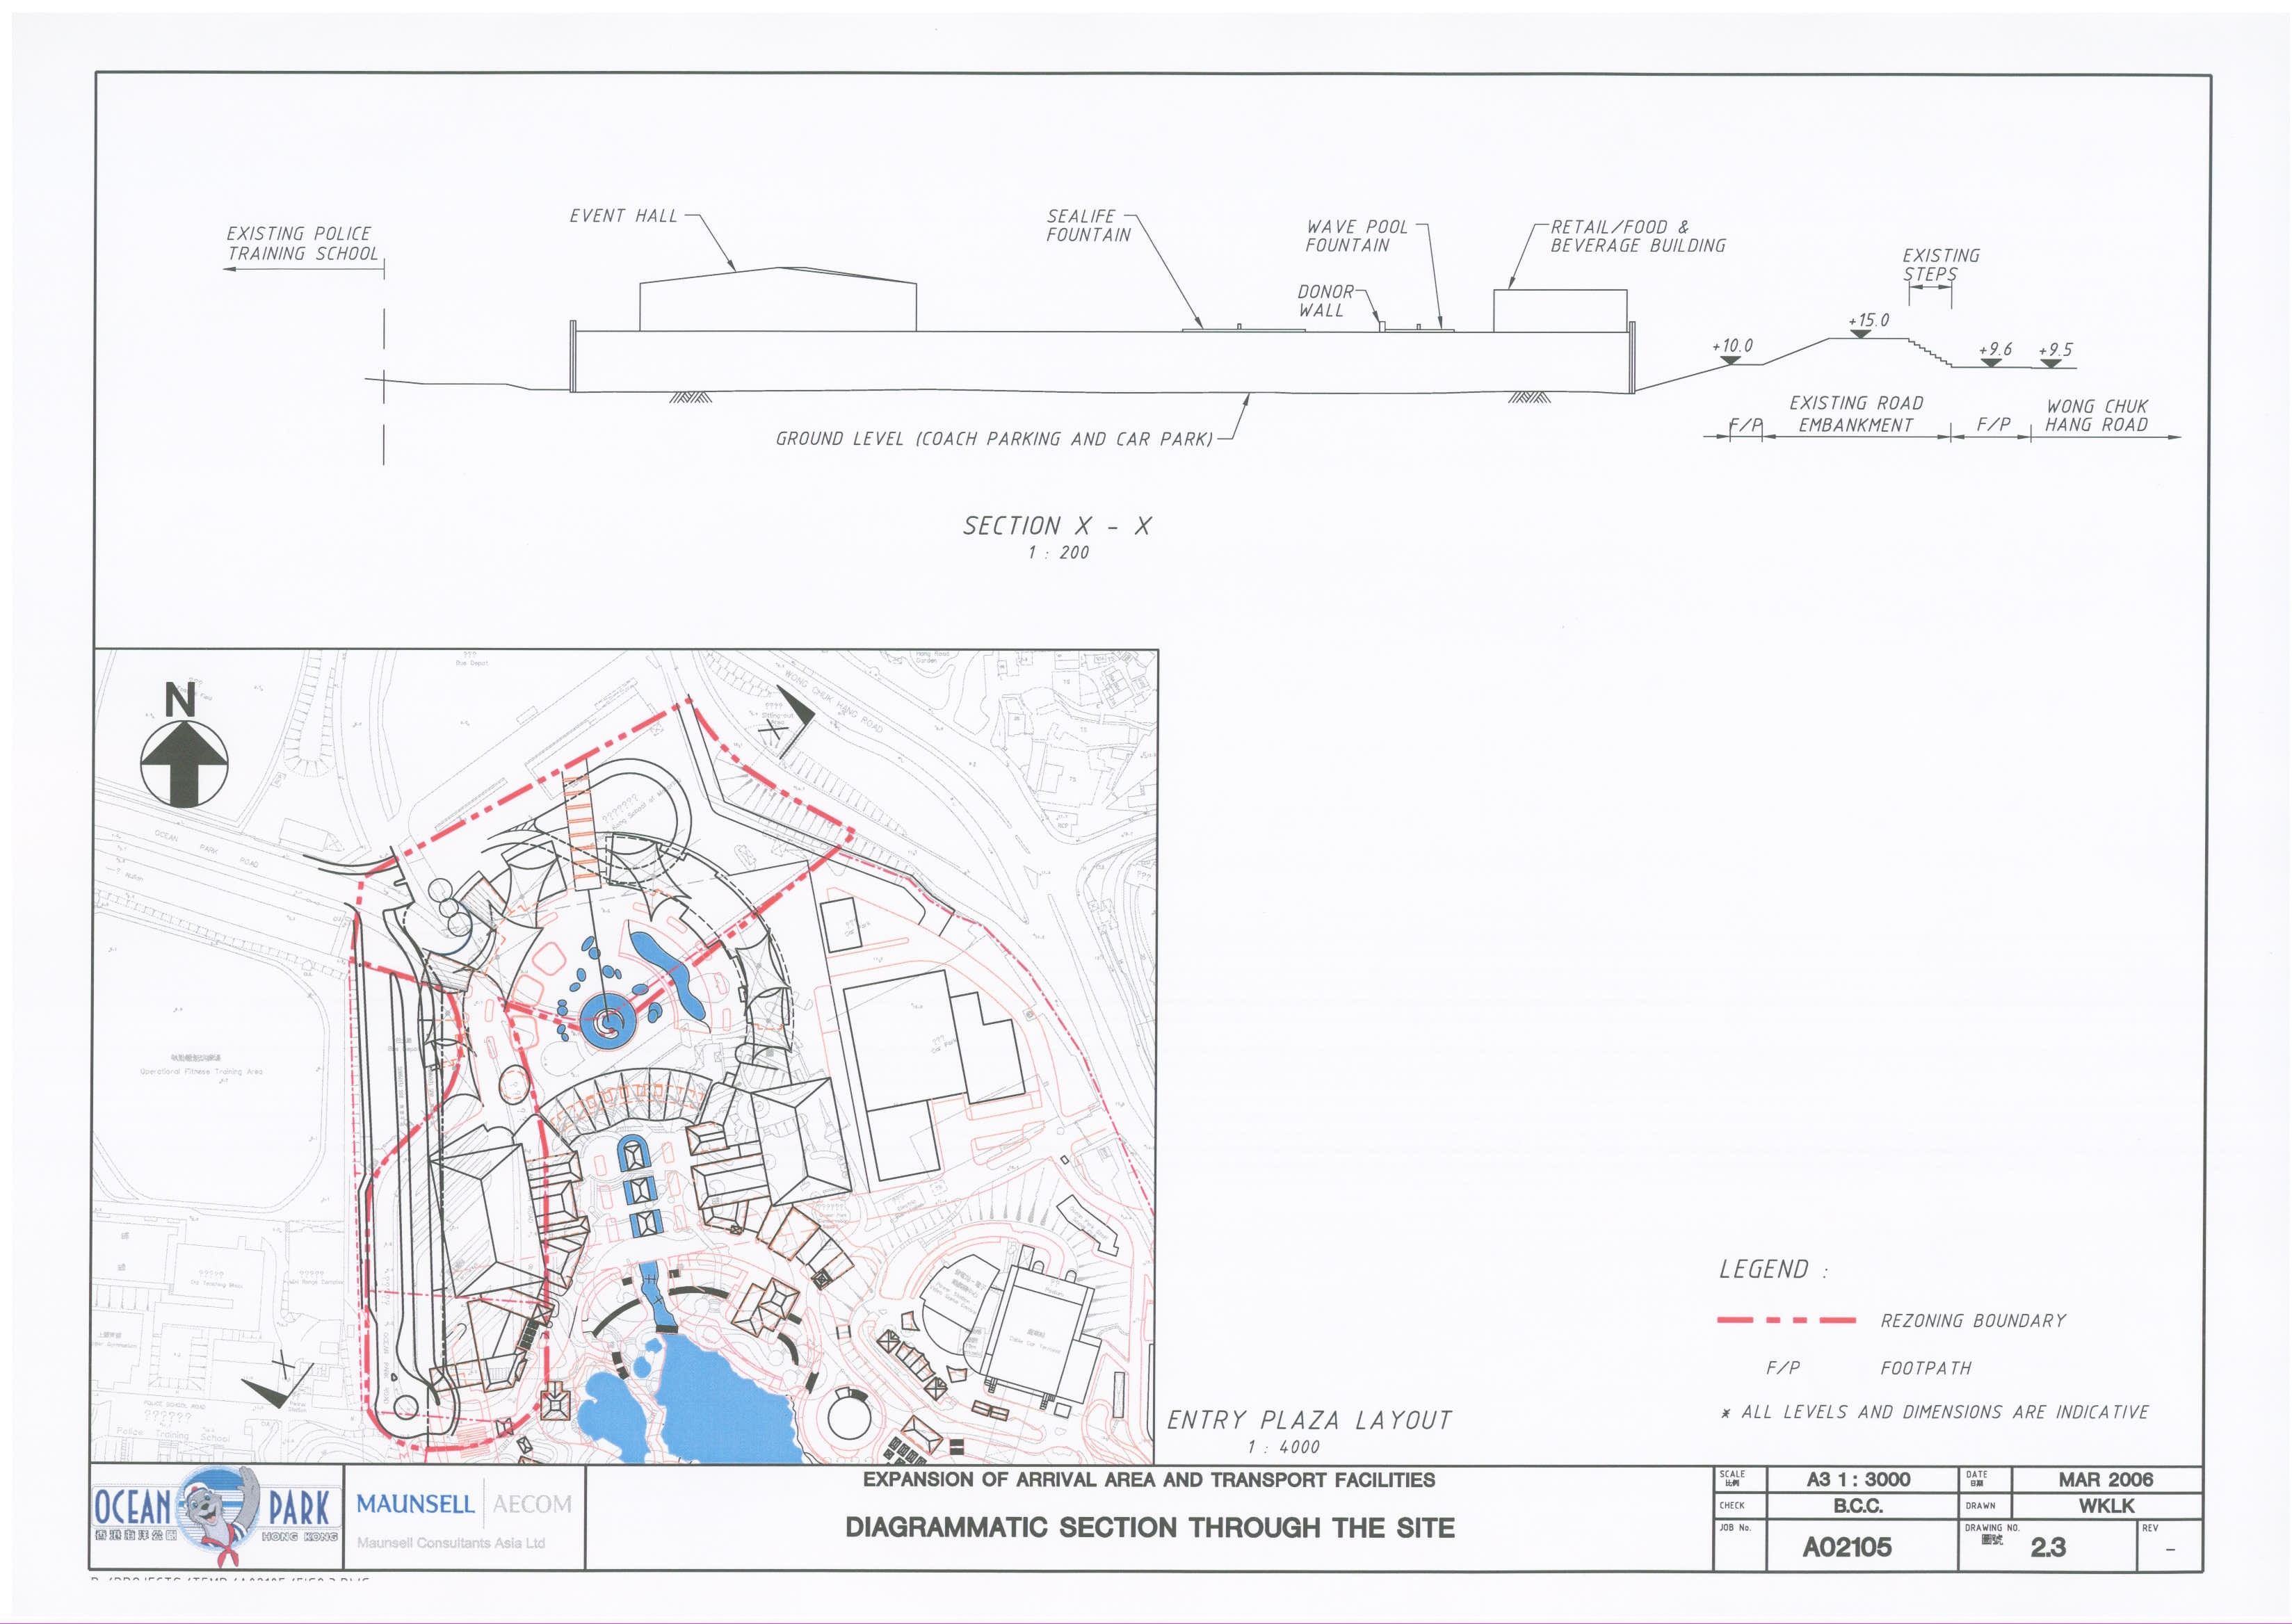
Figure 2.3 Diagrammatic
Section Through the Site
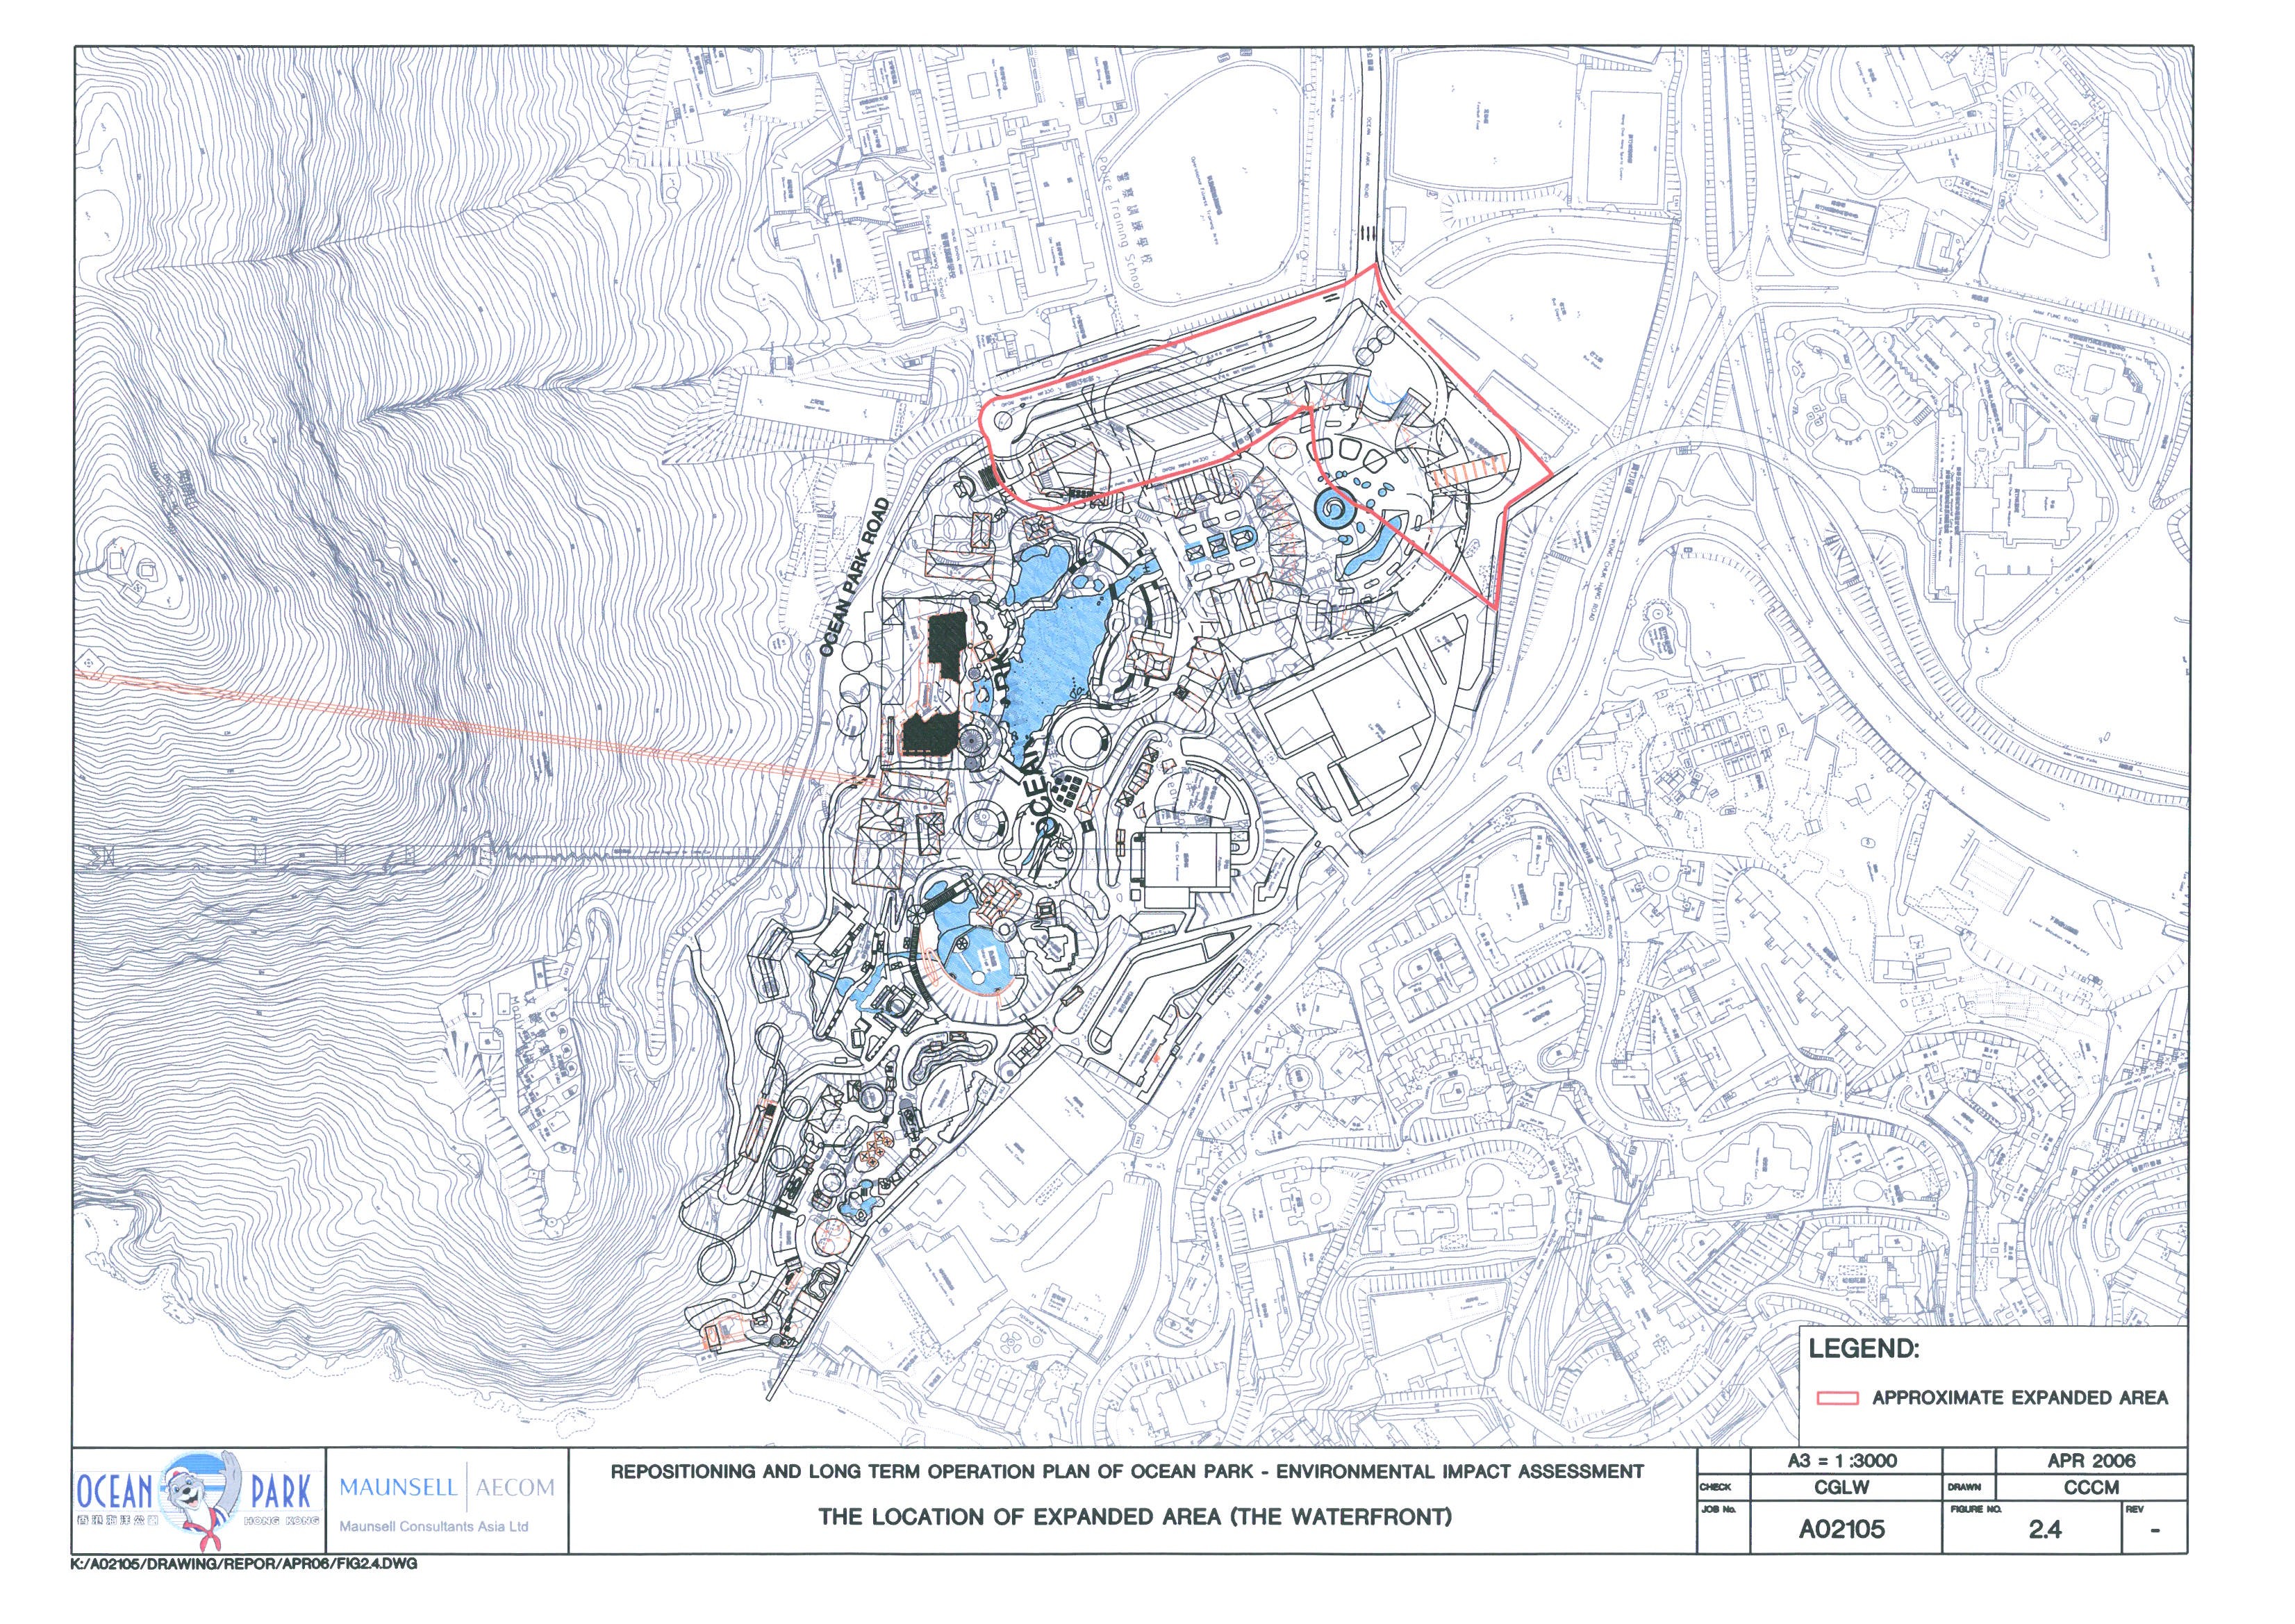
Figure 2.4 The
Location of Expanded Area (The Waterfront)
Figure 2.5 The
Location of Expanded Area (The Summit)
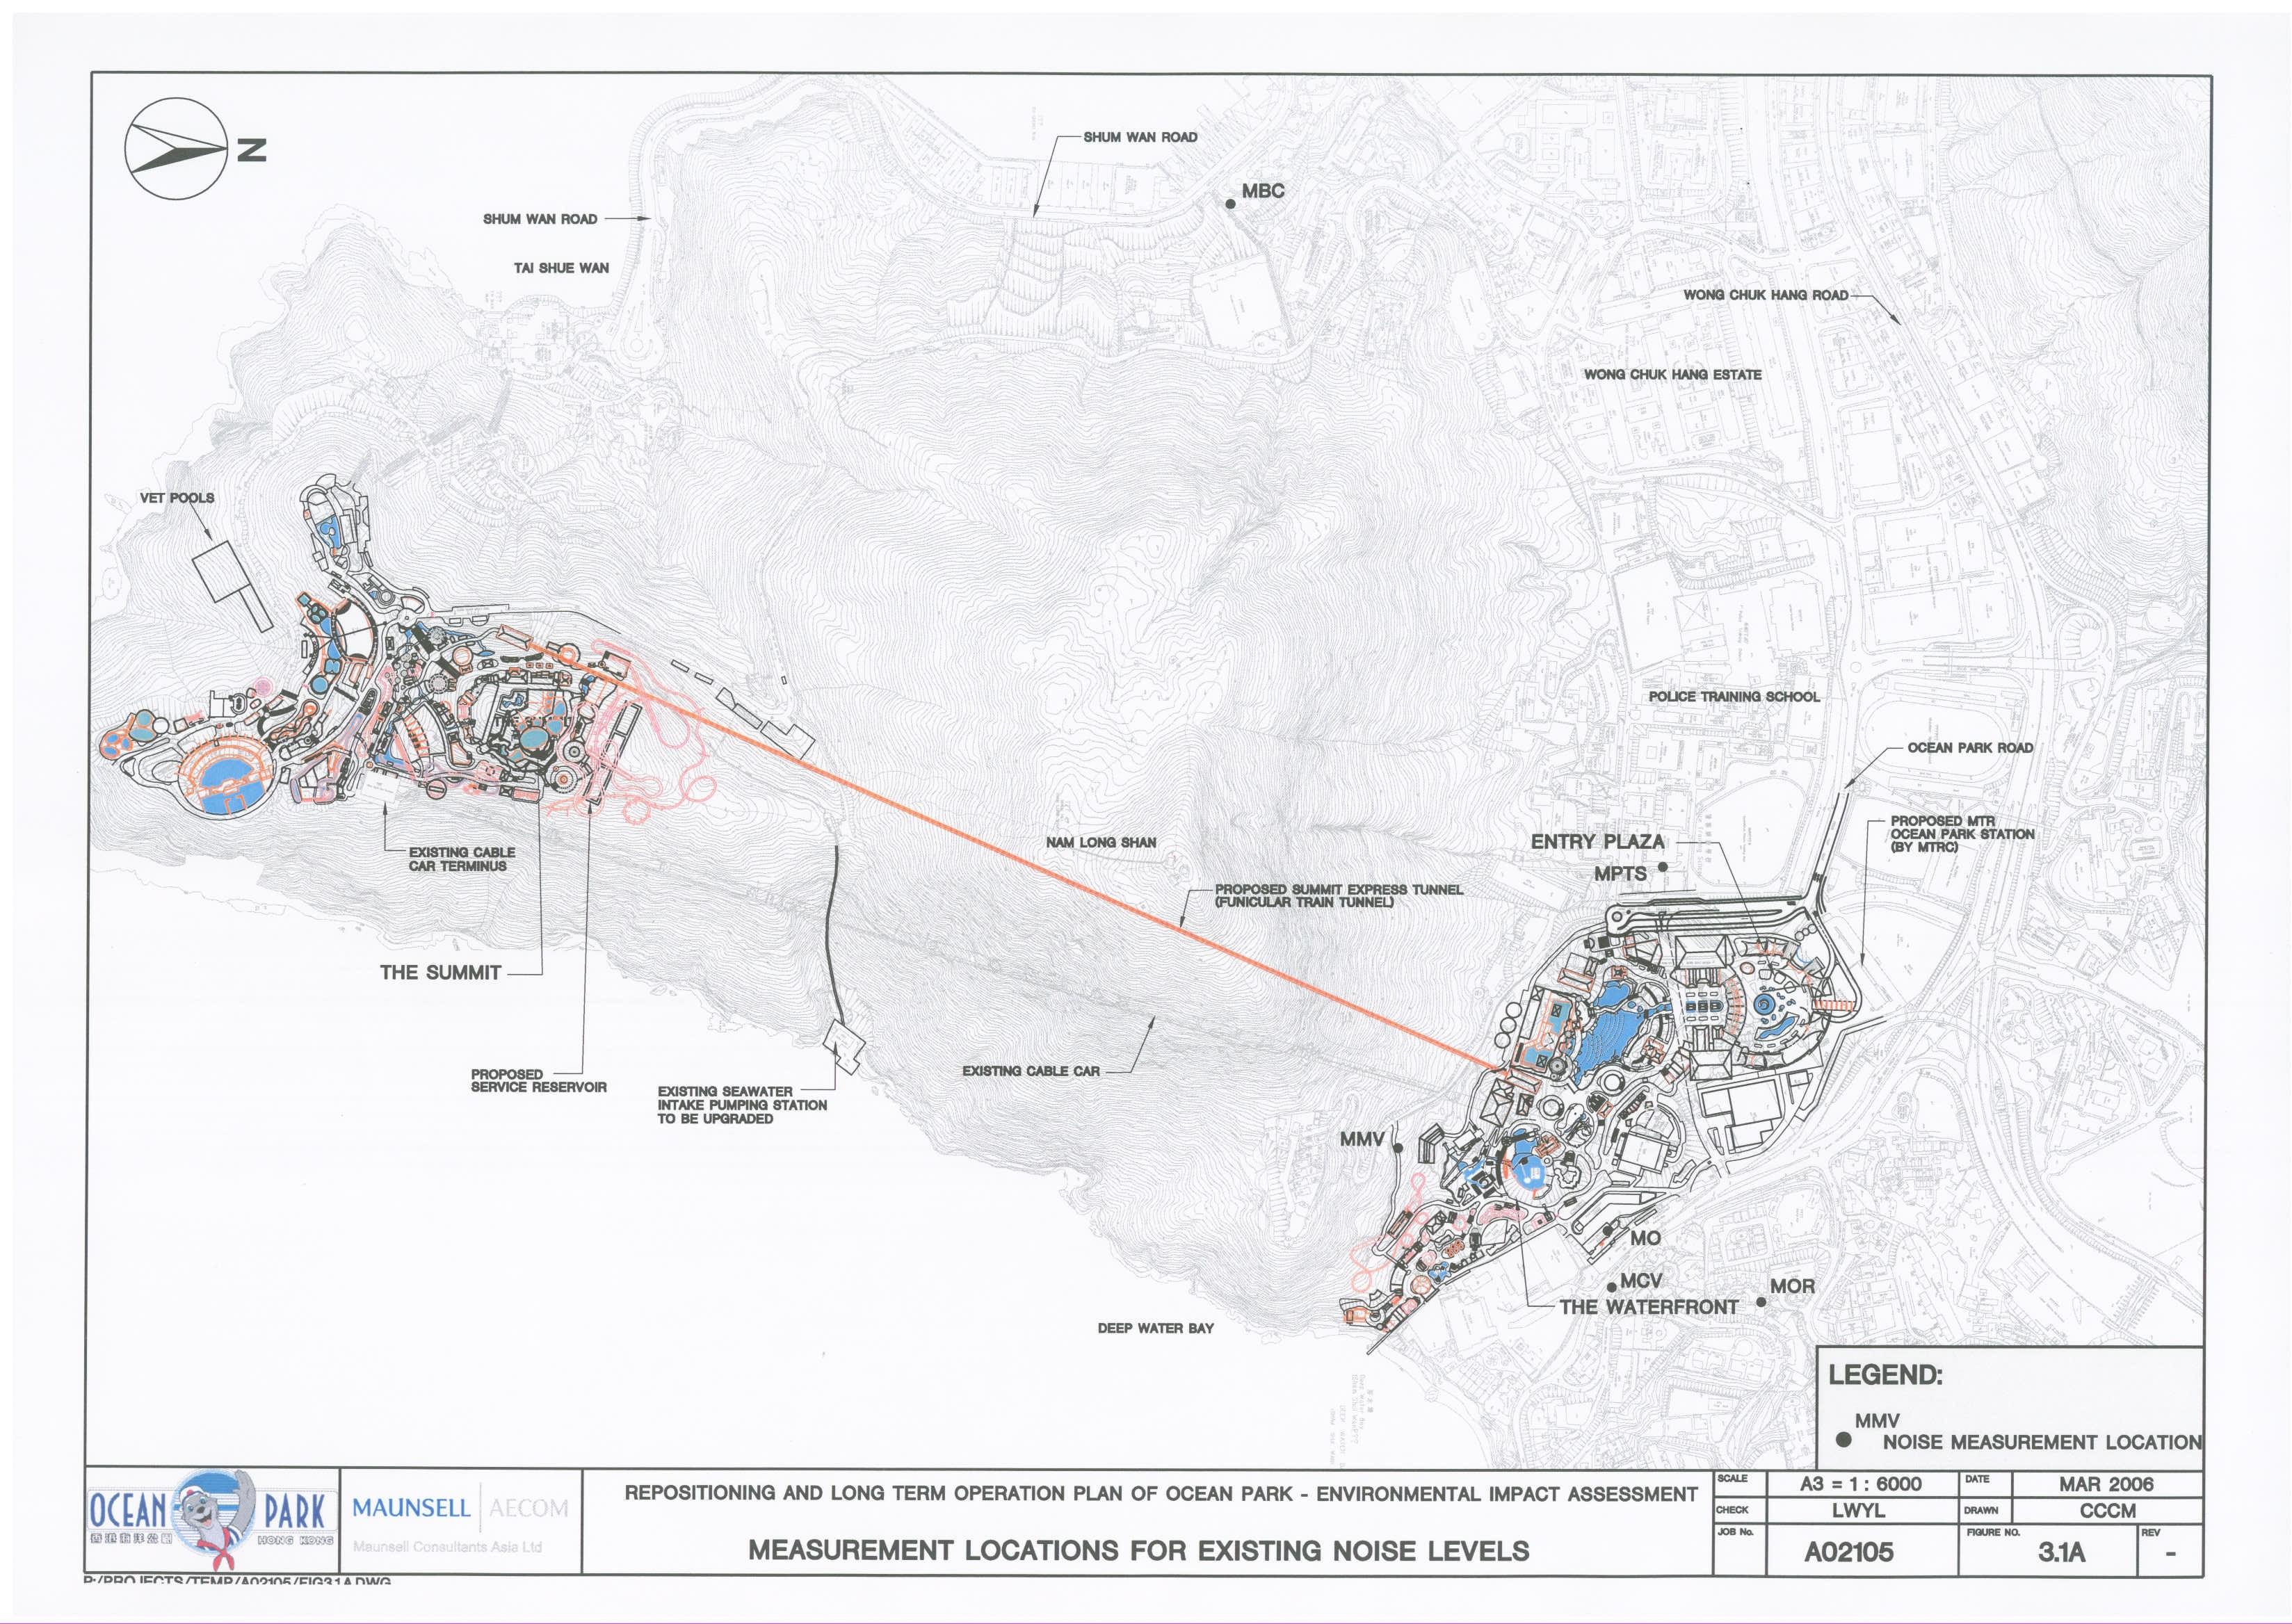
Figure 3.1a Measurement
Locations for Existing Noise Levels
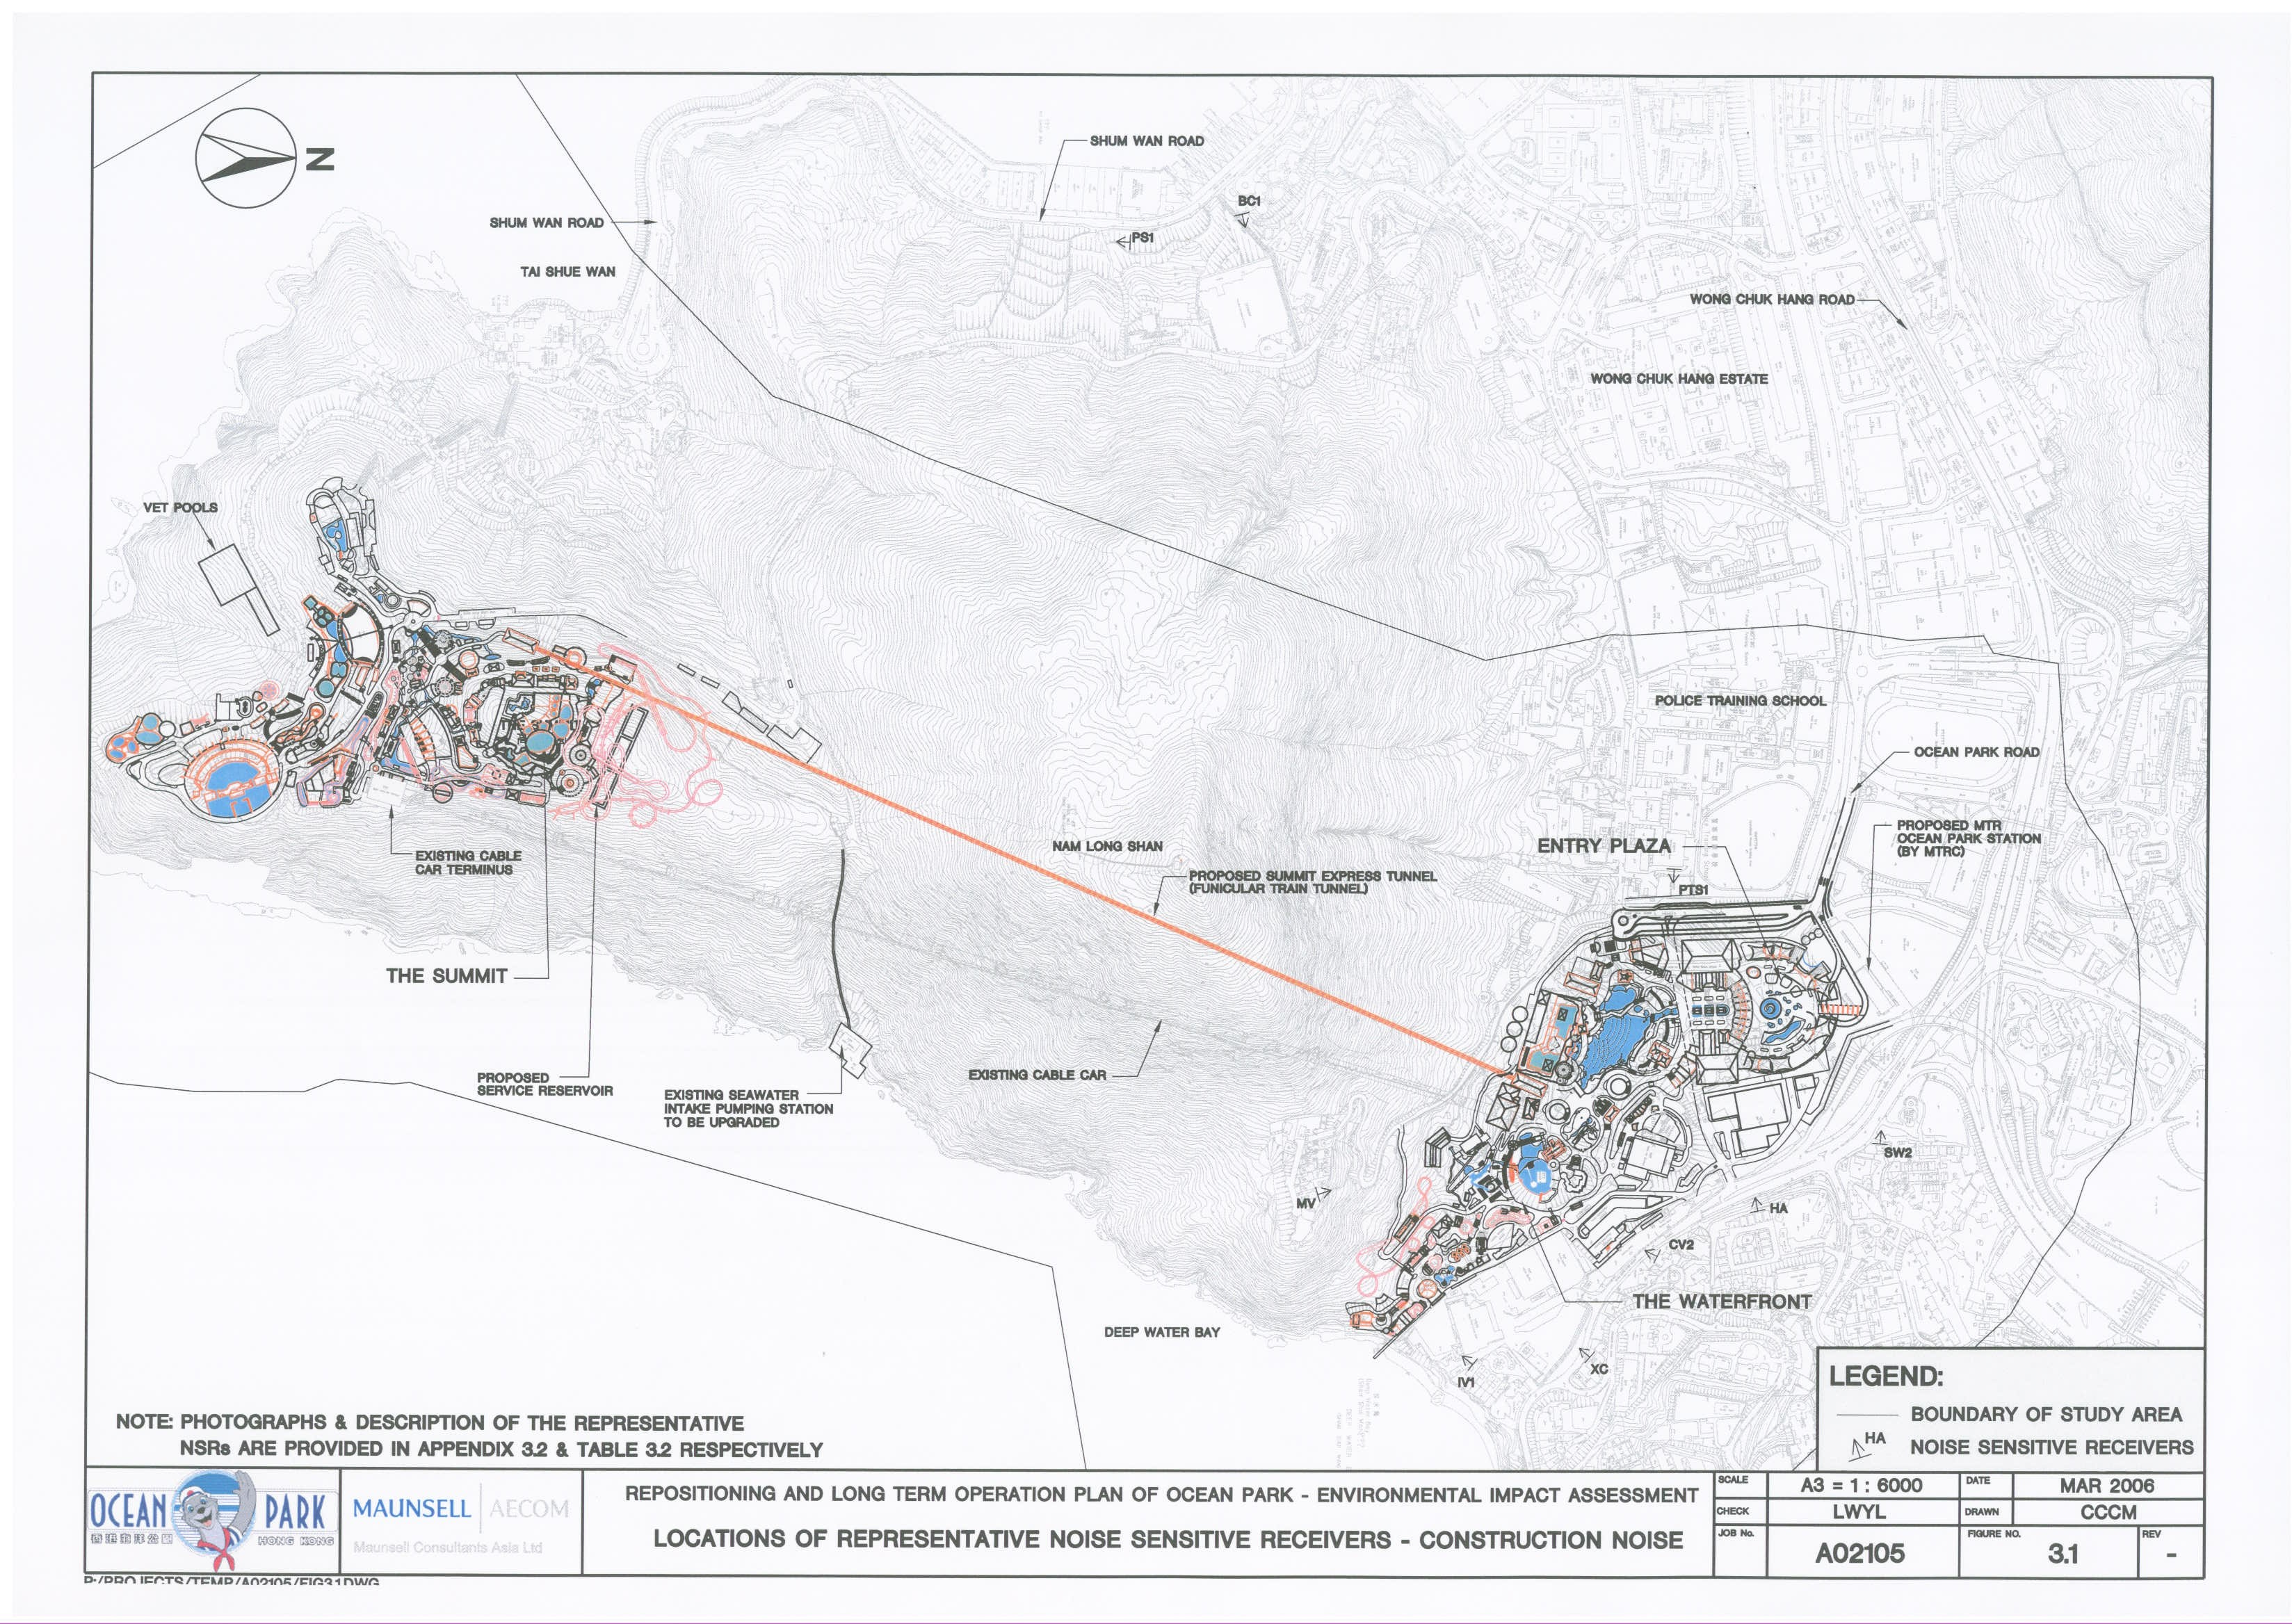
Figure 3.1 Locations
of Representative Noise Sensitive Receivers-Construction Noise
Figure 3.2 Locations
of Representative Noise Sensitive Receivers-Project Inducted Traffic Noise
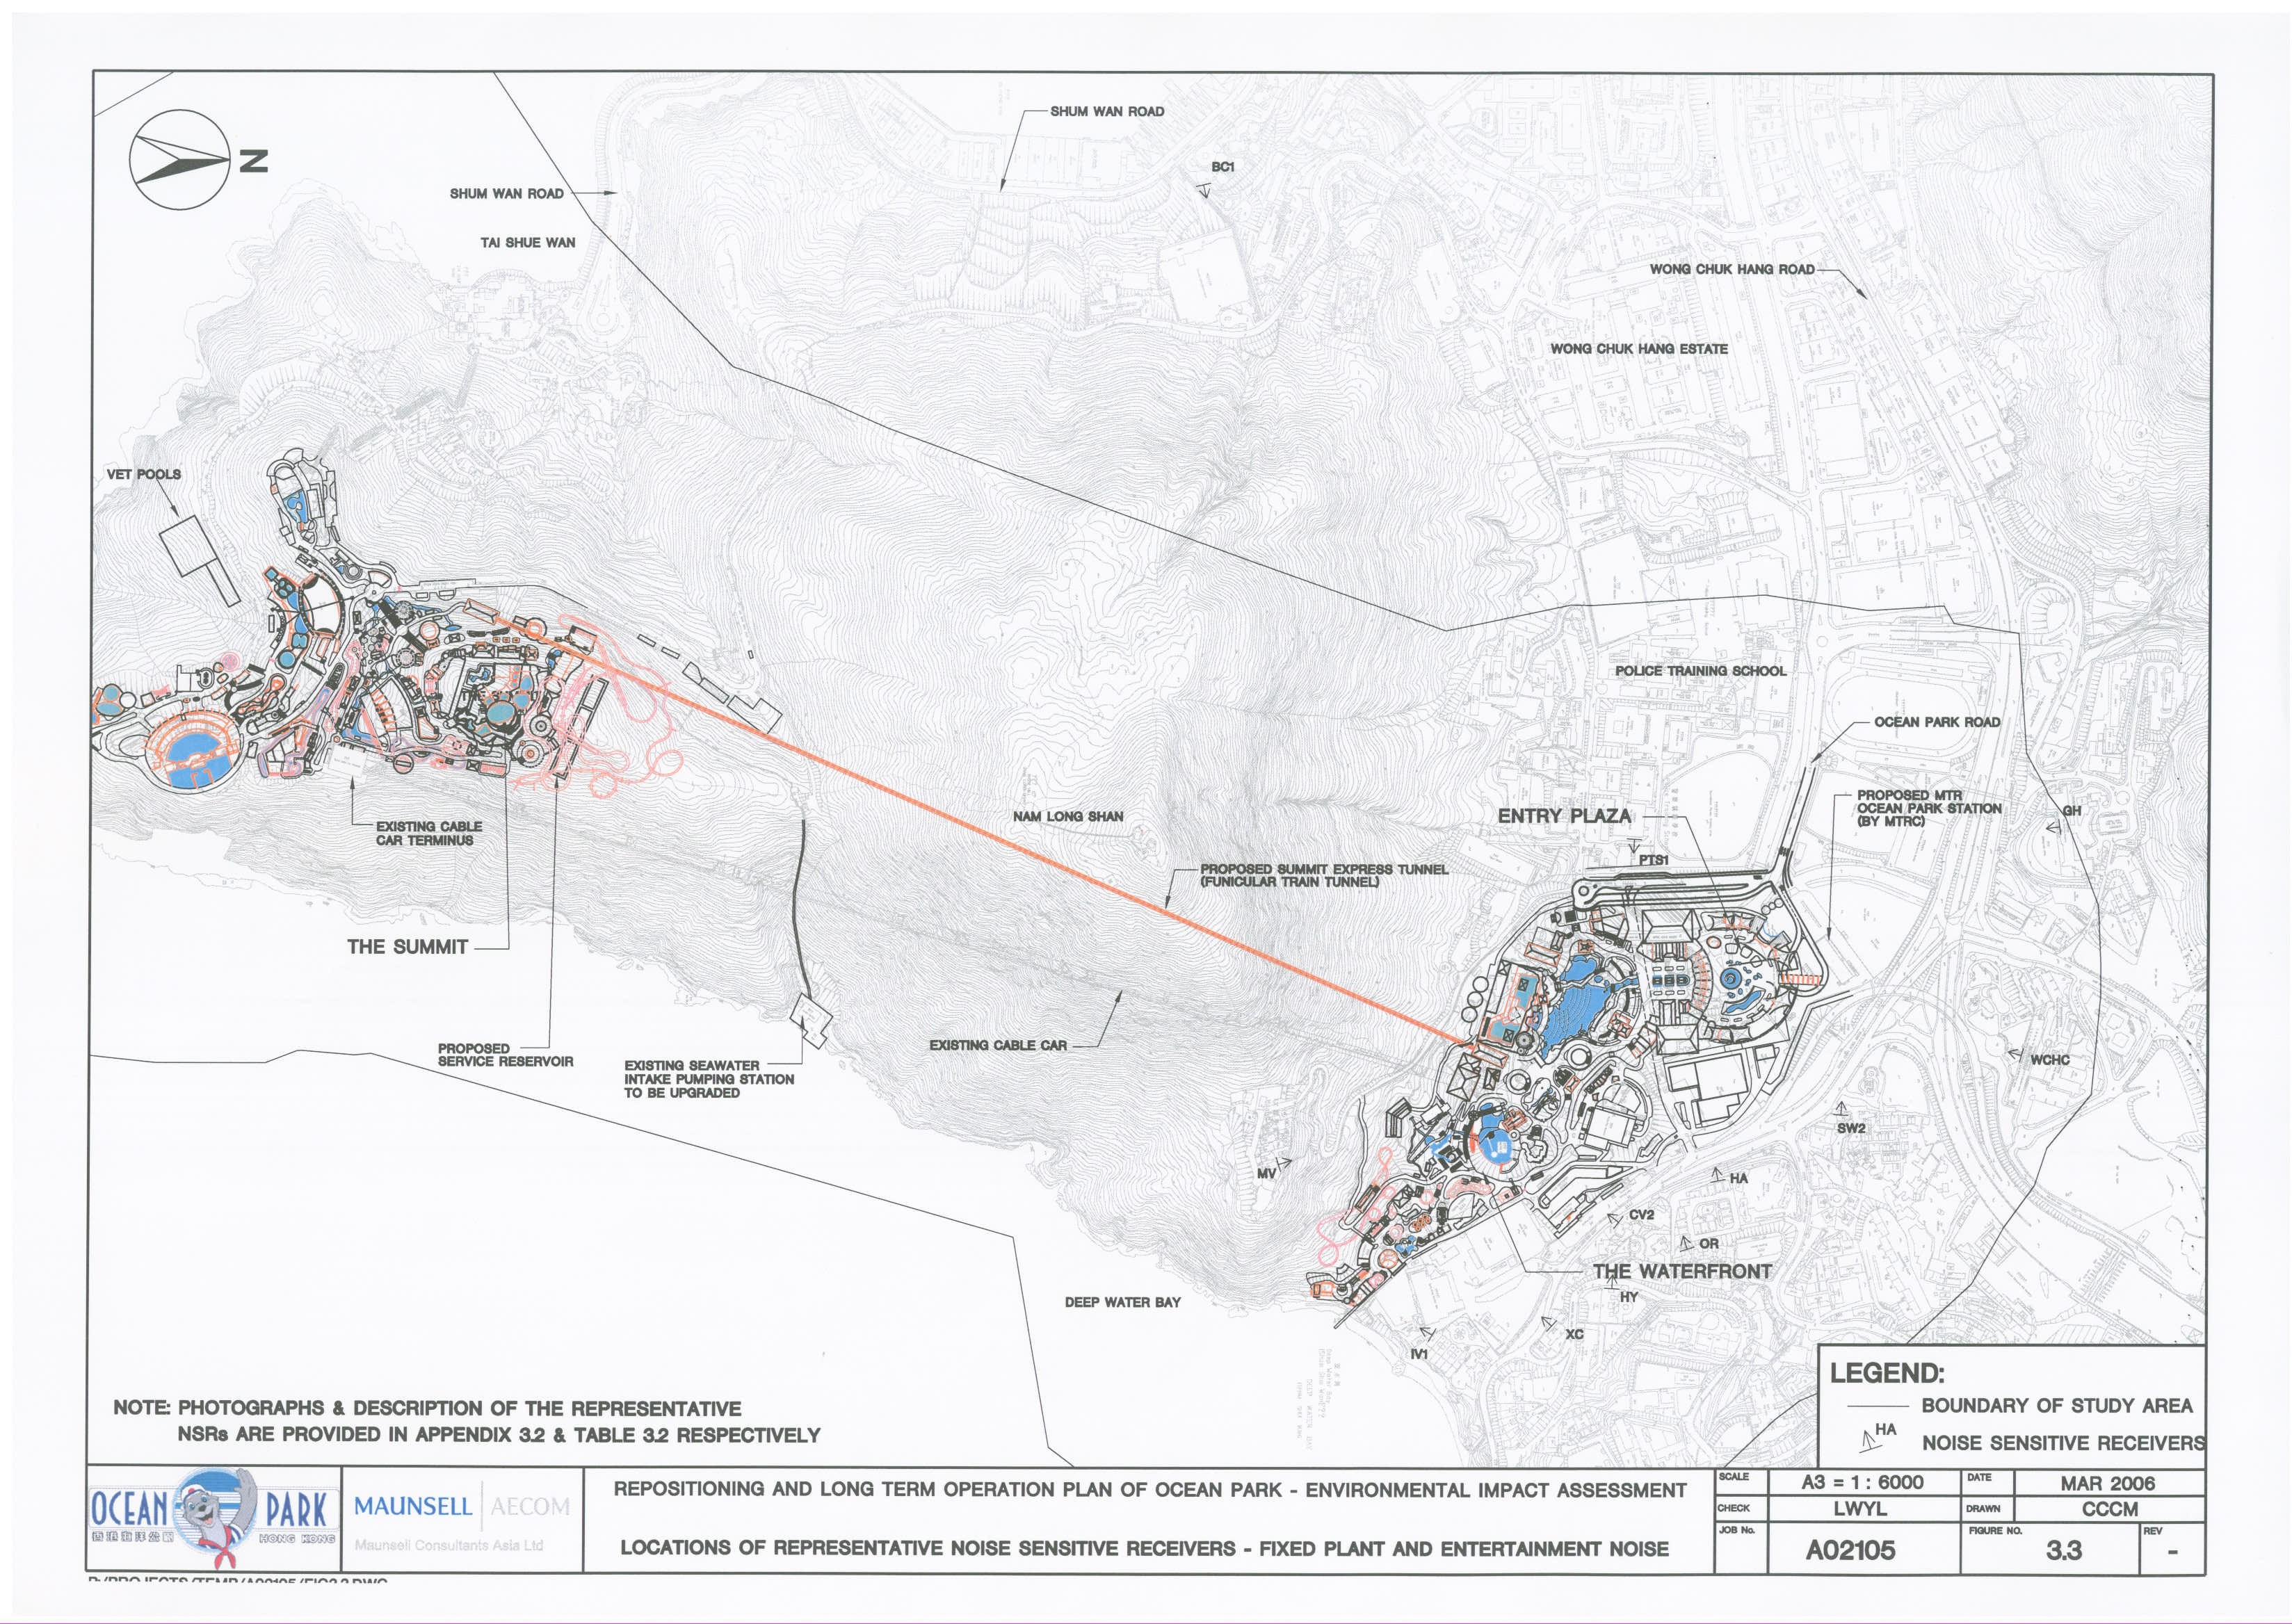
Figure 3.3 Locations
of Representative Noise Sensitive Receivers-Fixed Plant and Entertainment Noise
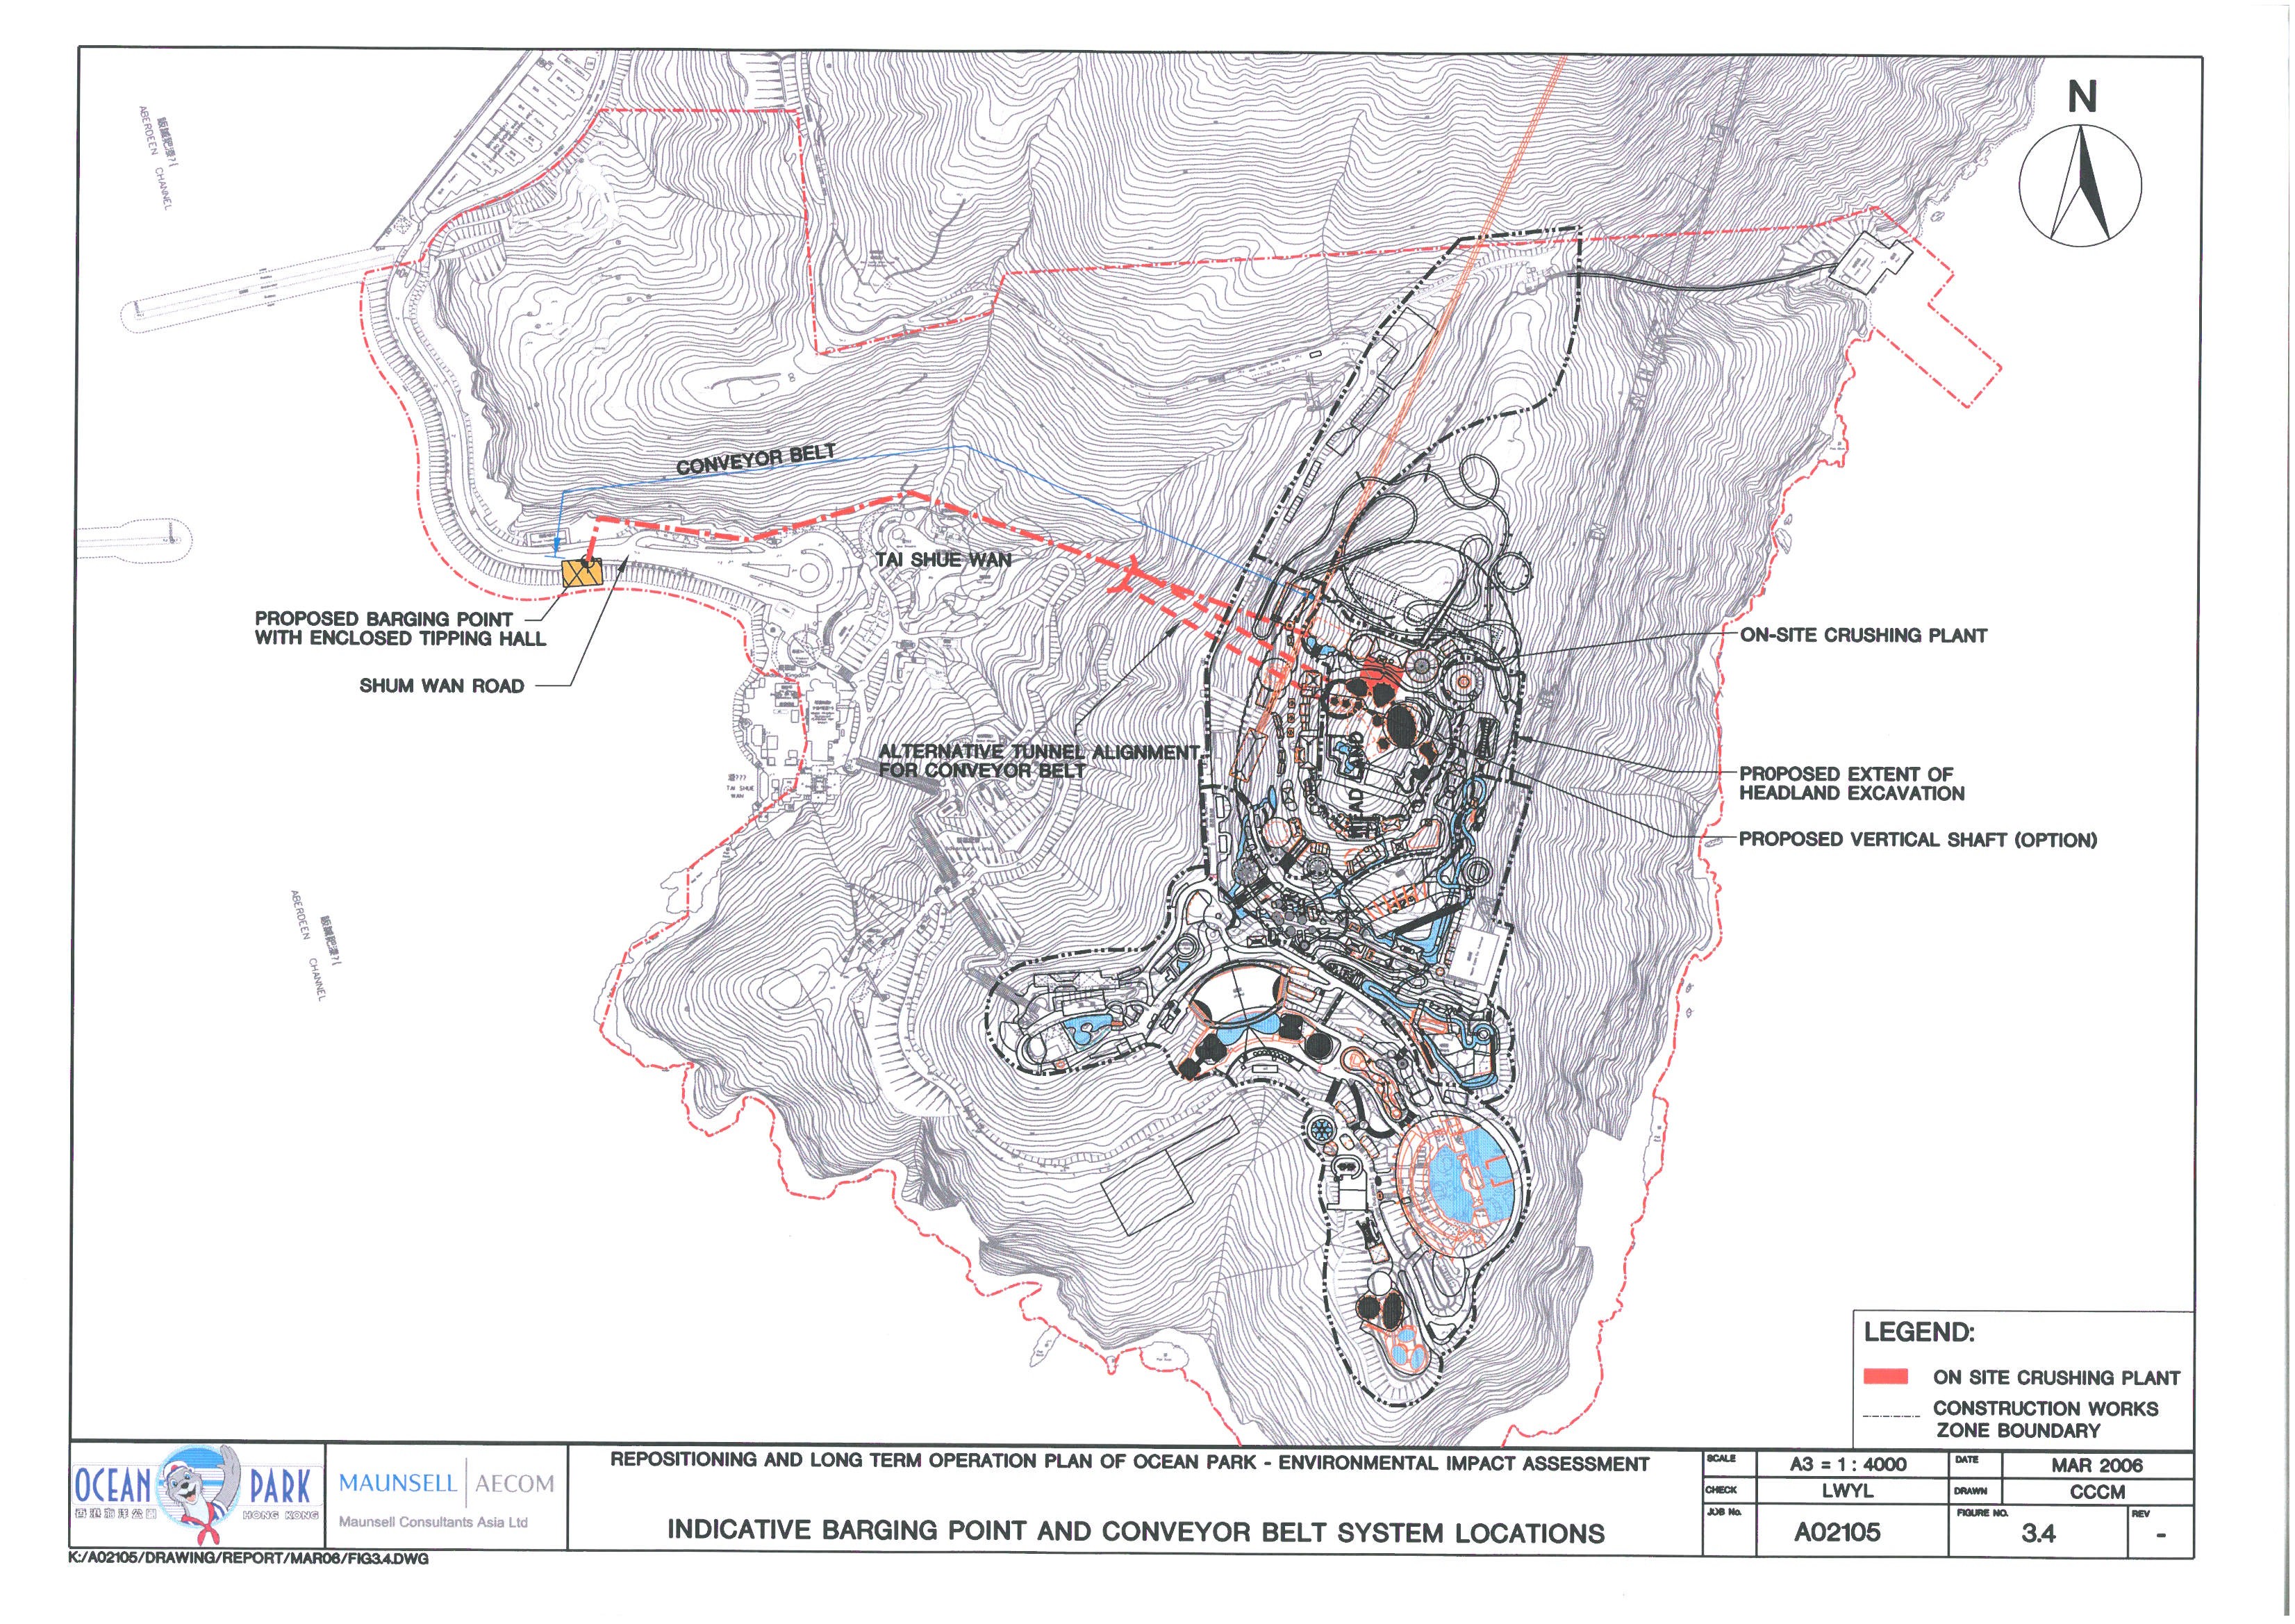
Figure 3.4 Indicative
Barging Point and Conveyor Belt System Locations
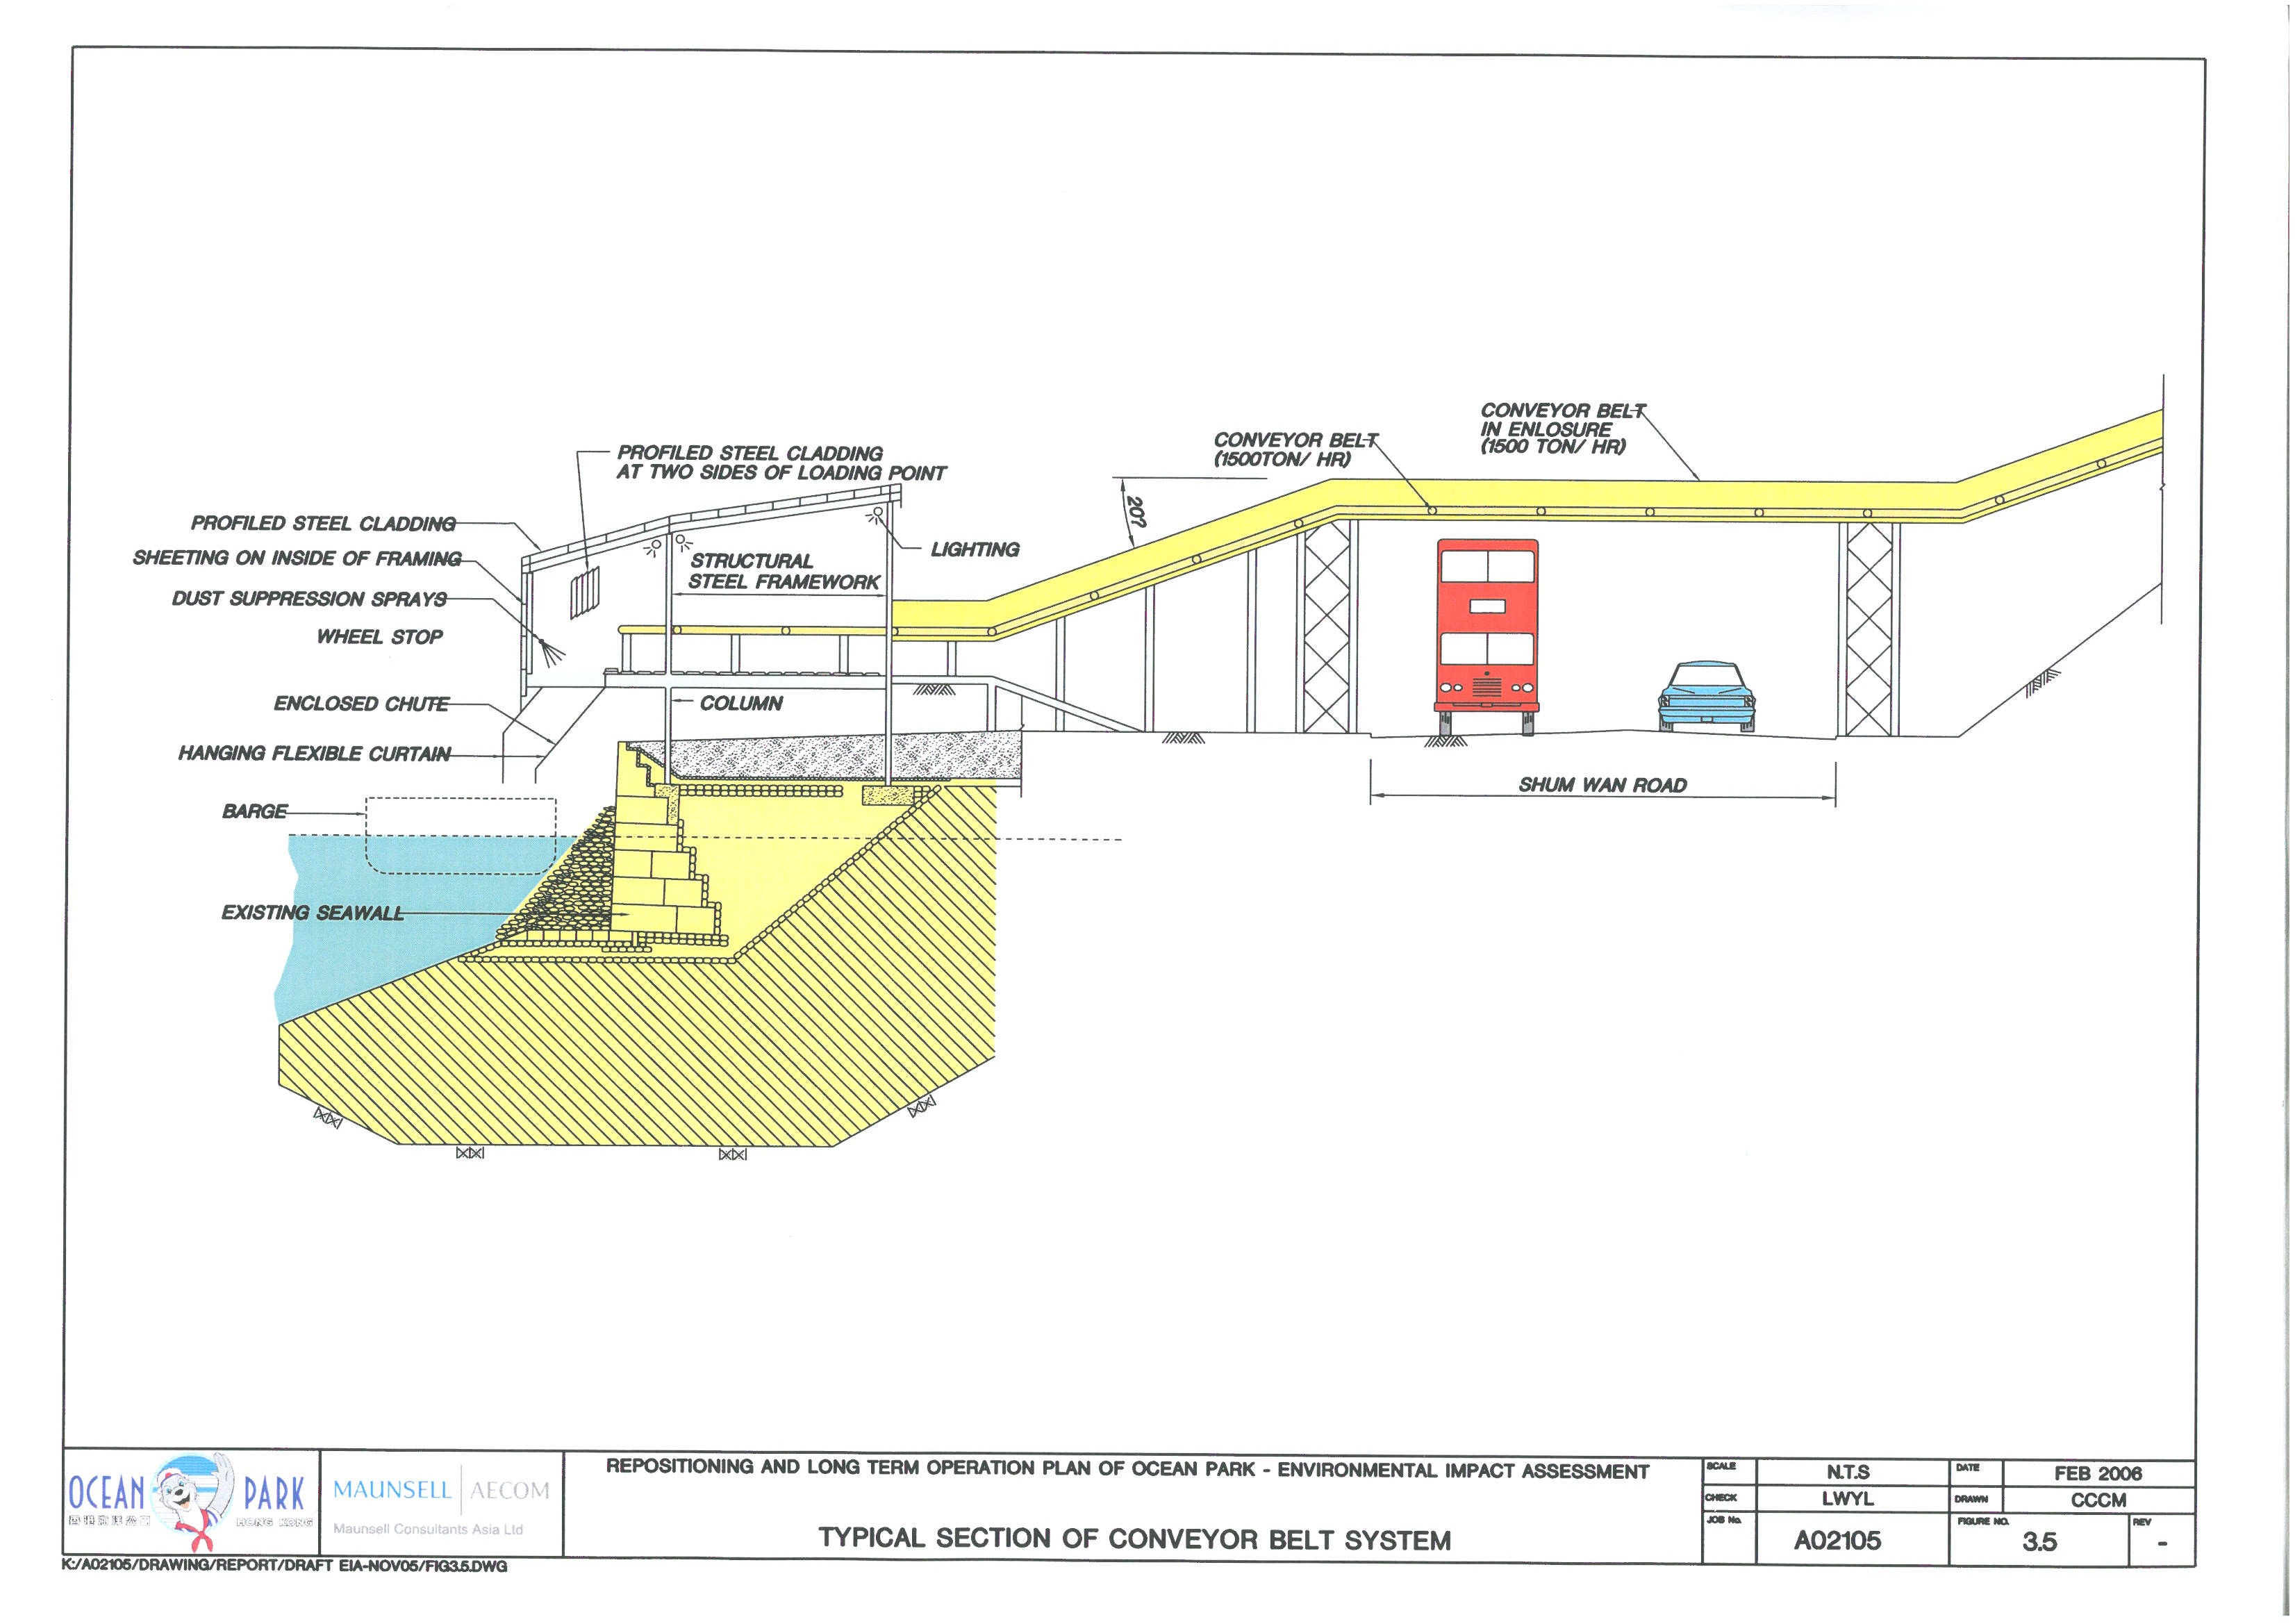
Figure 3.5 Typical
Section of Conveyor Belt System
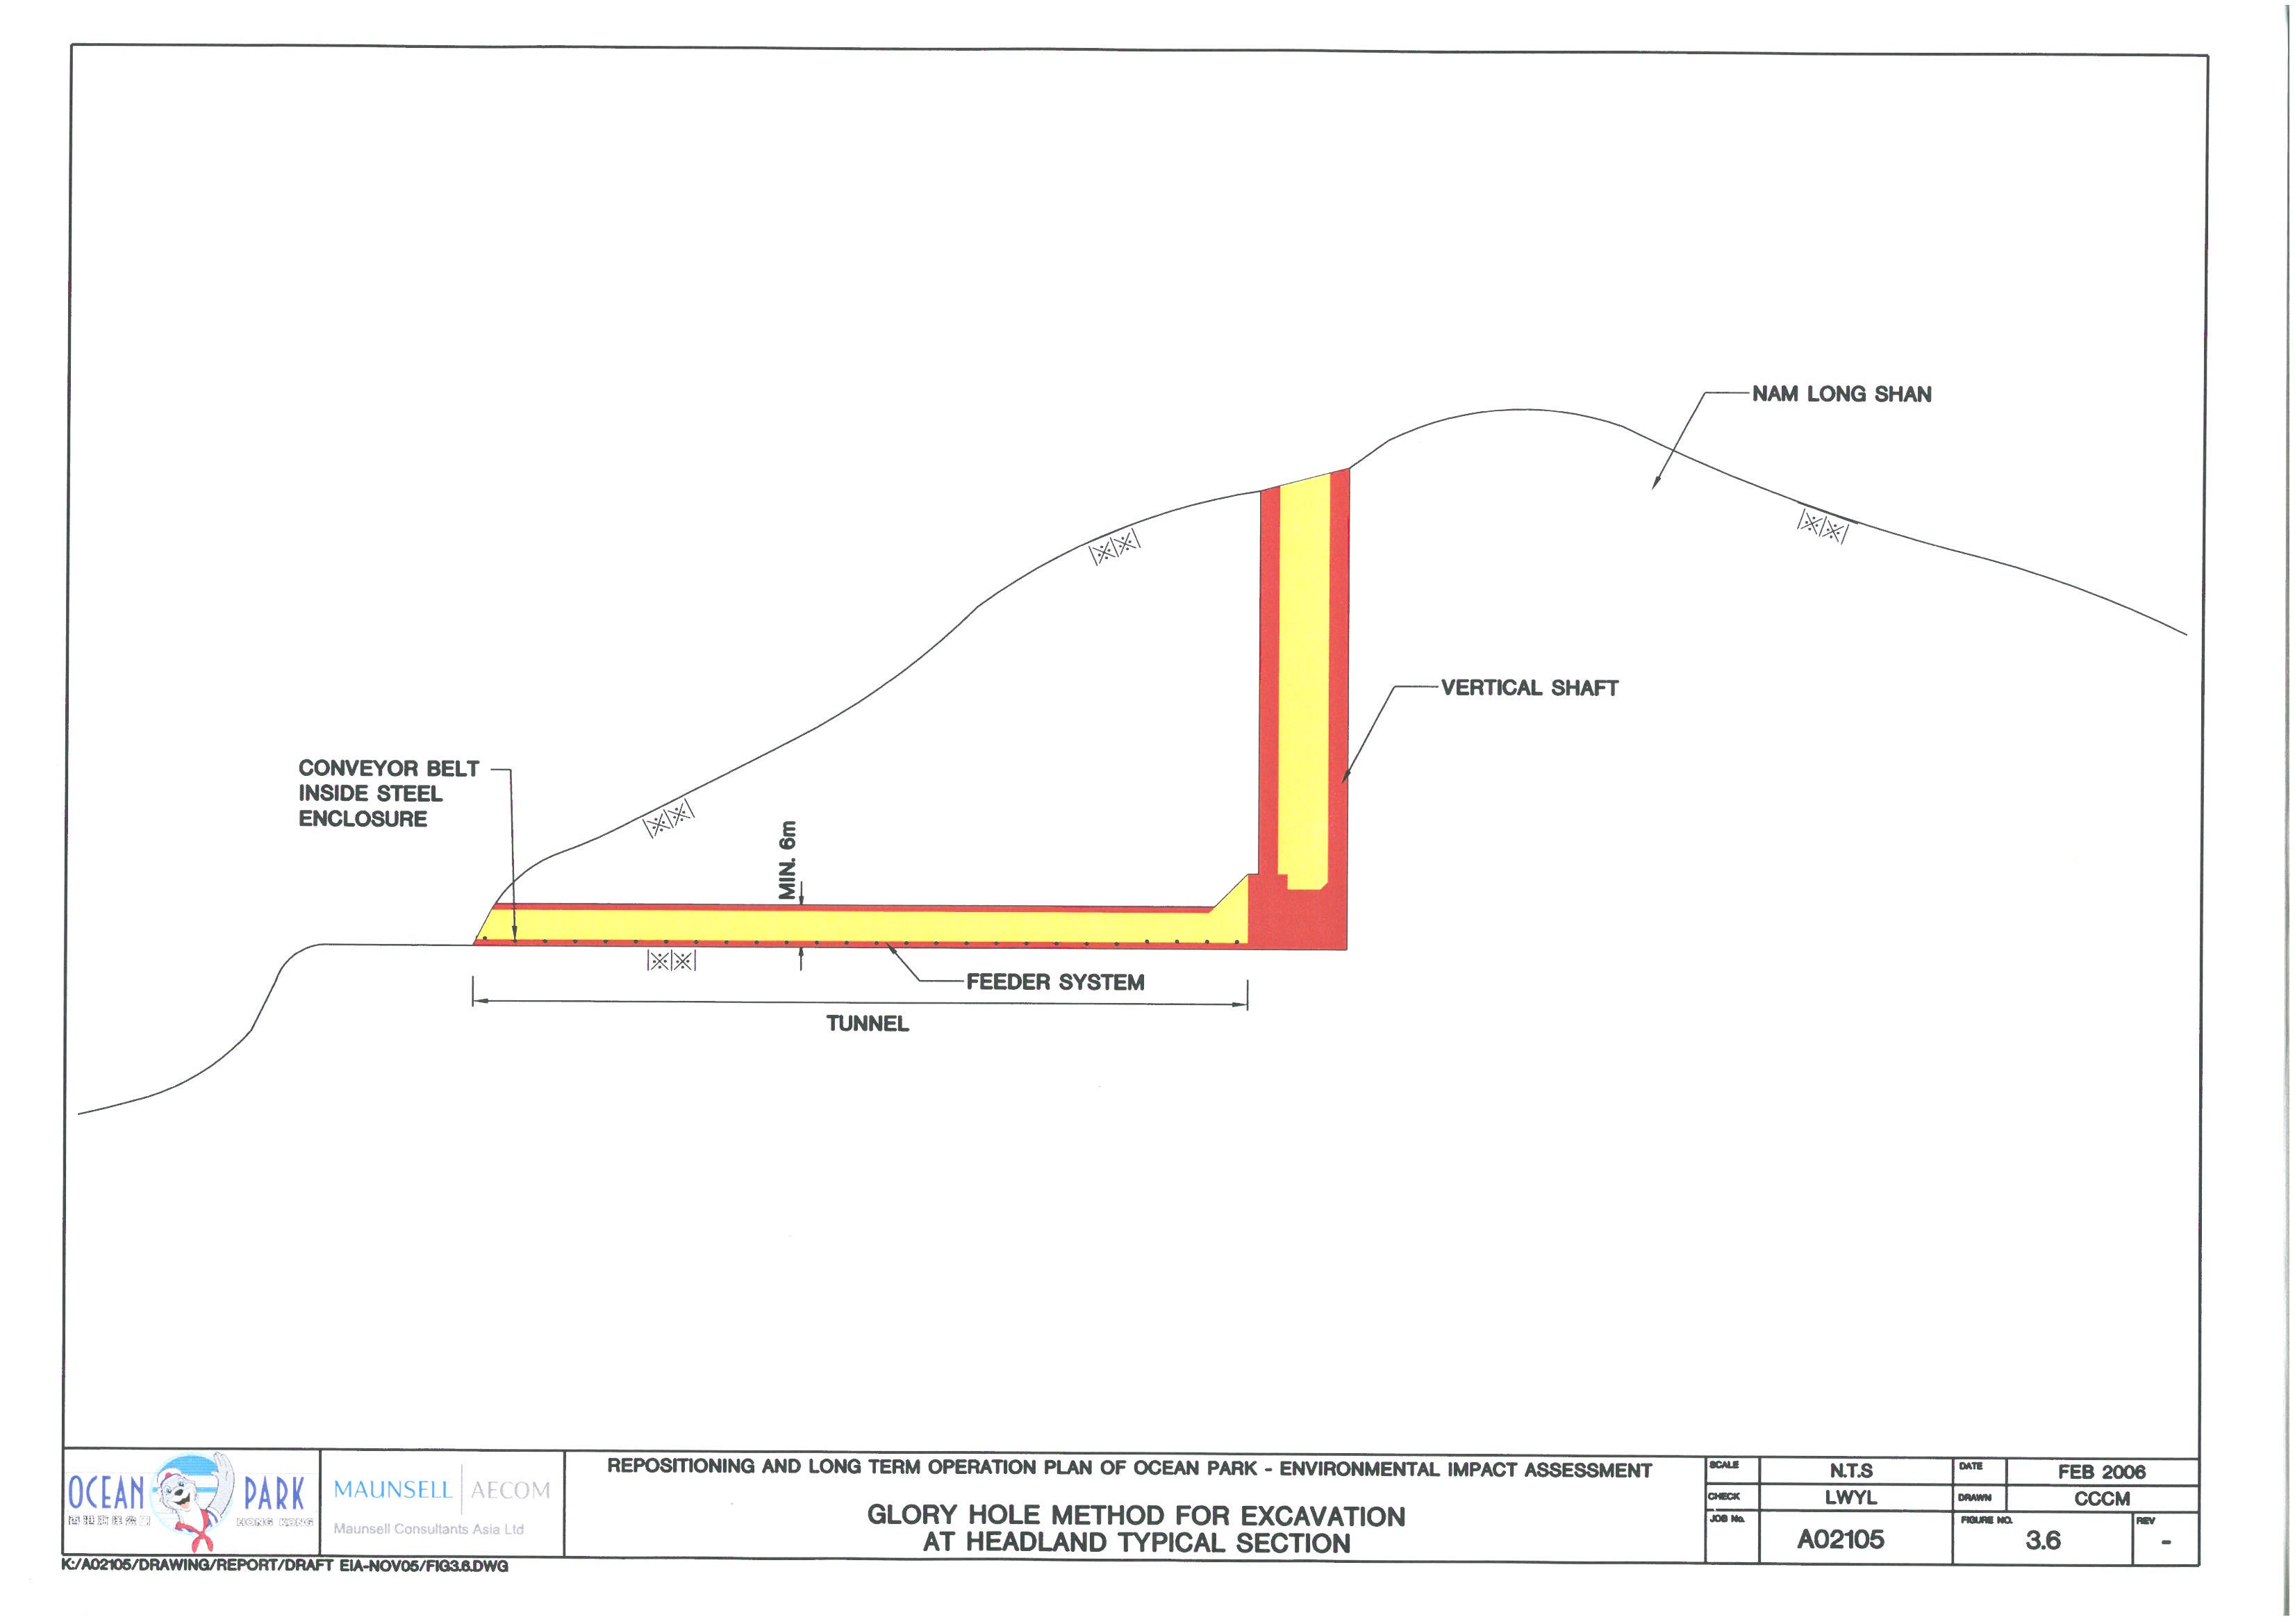
Figure 3.6 Glory
Hole Method for Excavation at Headland Typical Section
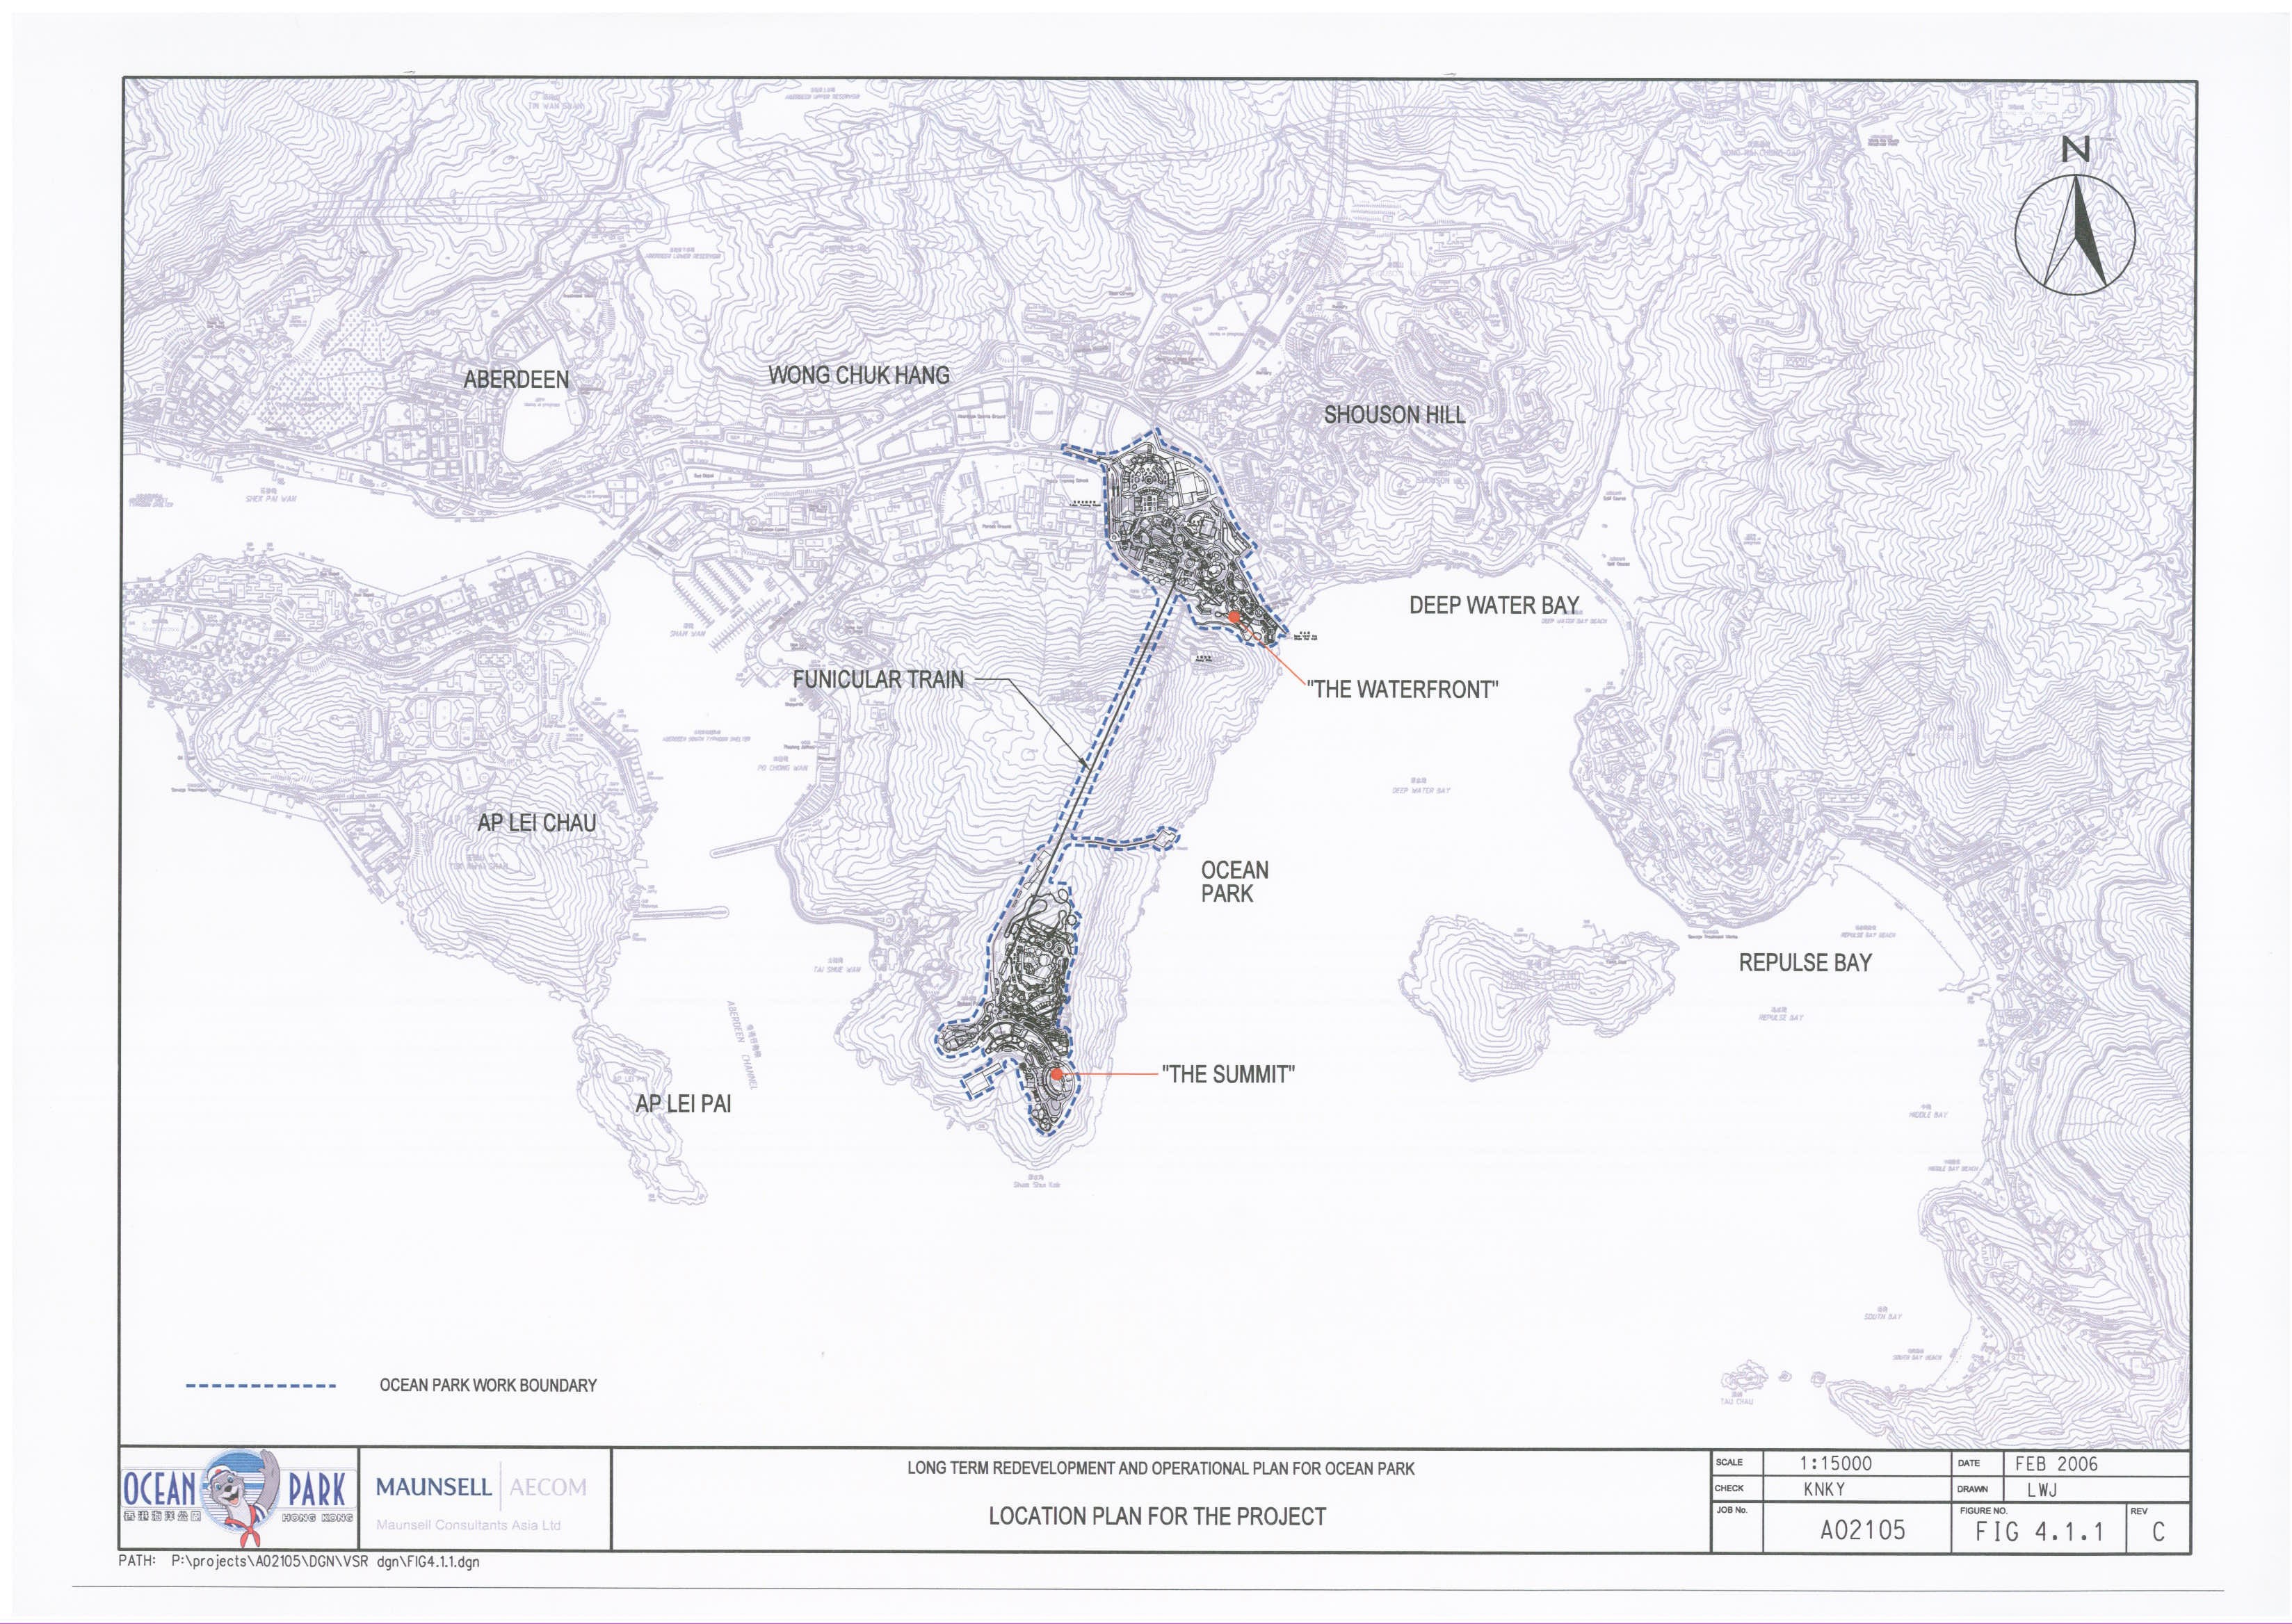
Figure
4.1.1 Location
Plan for the Project
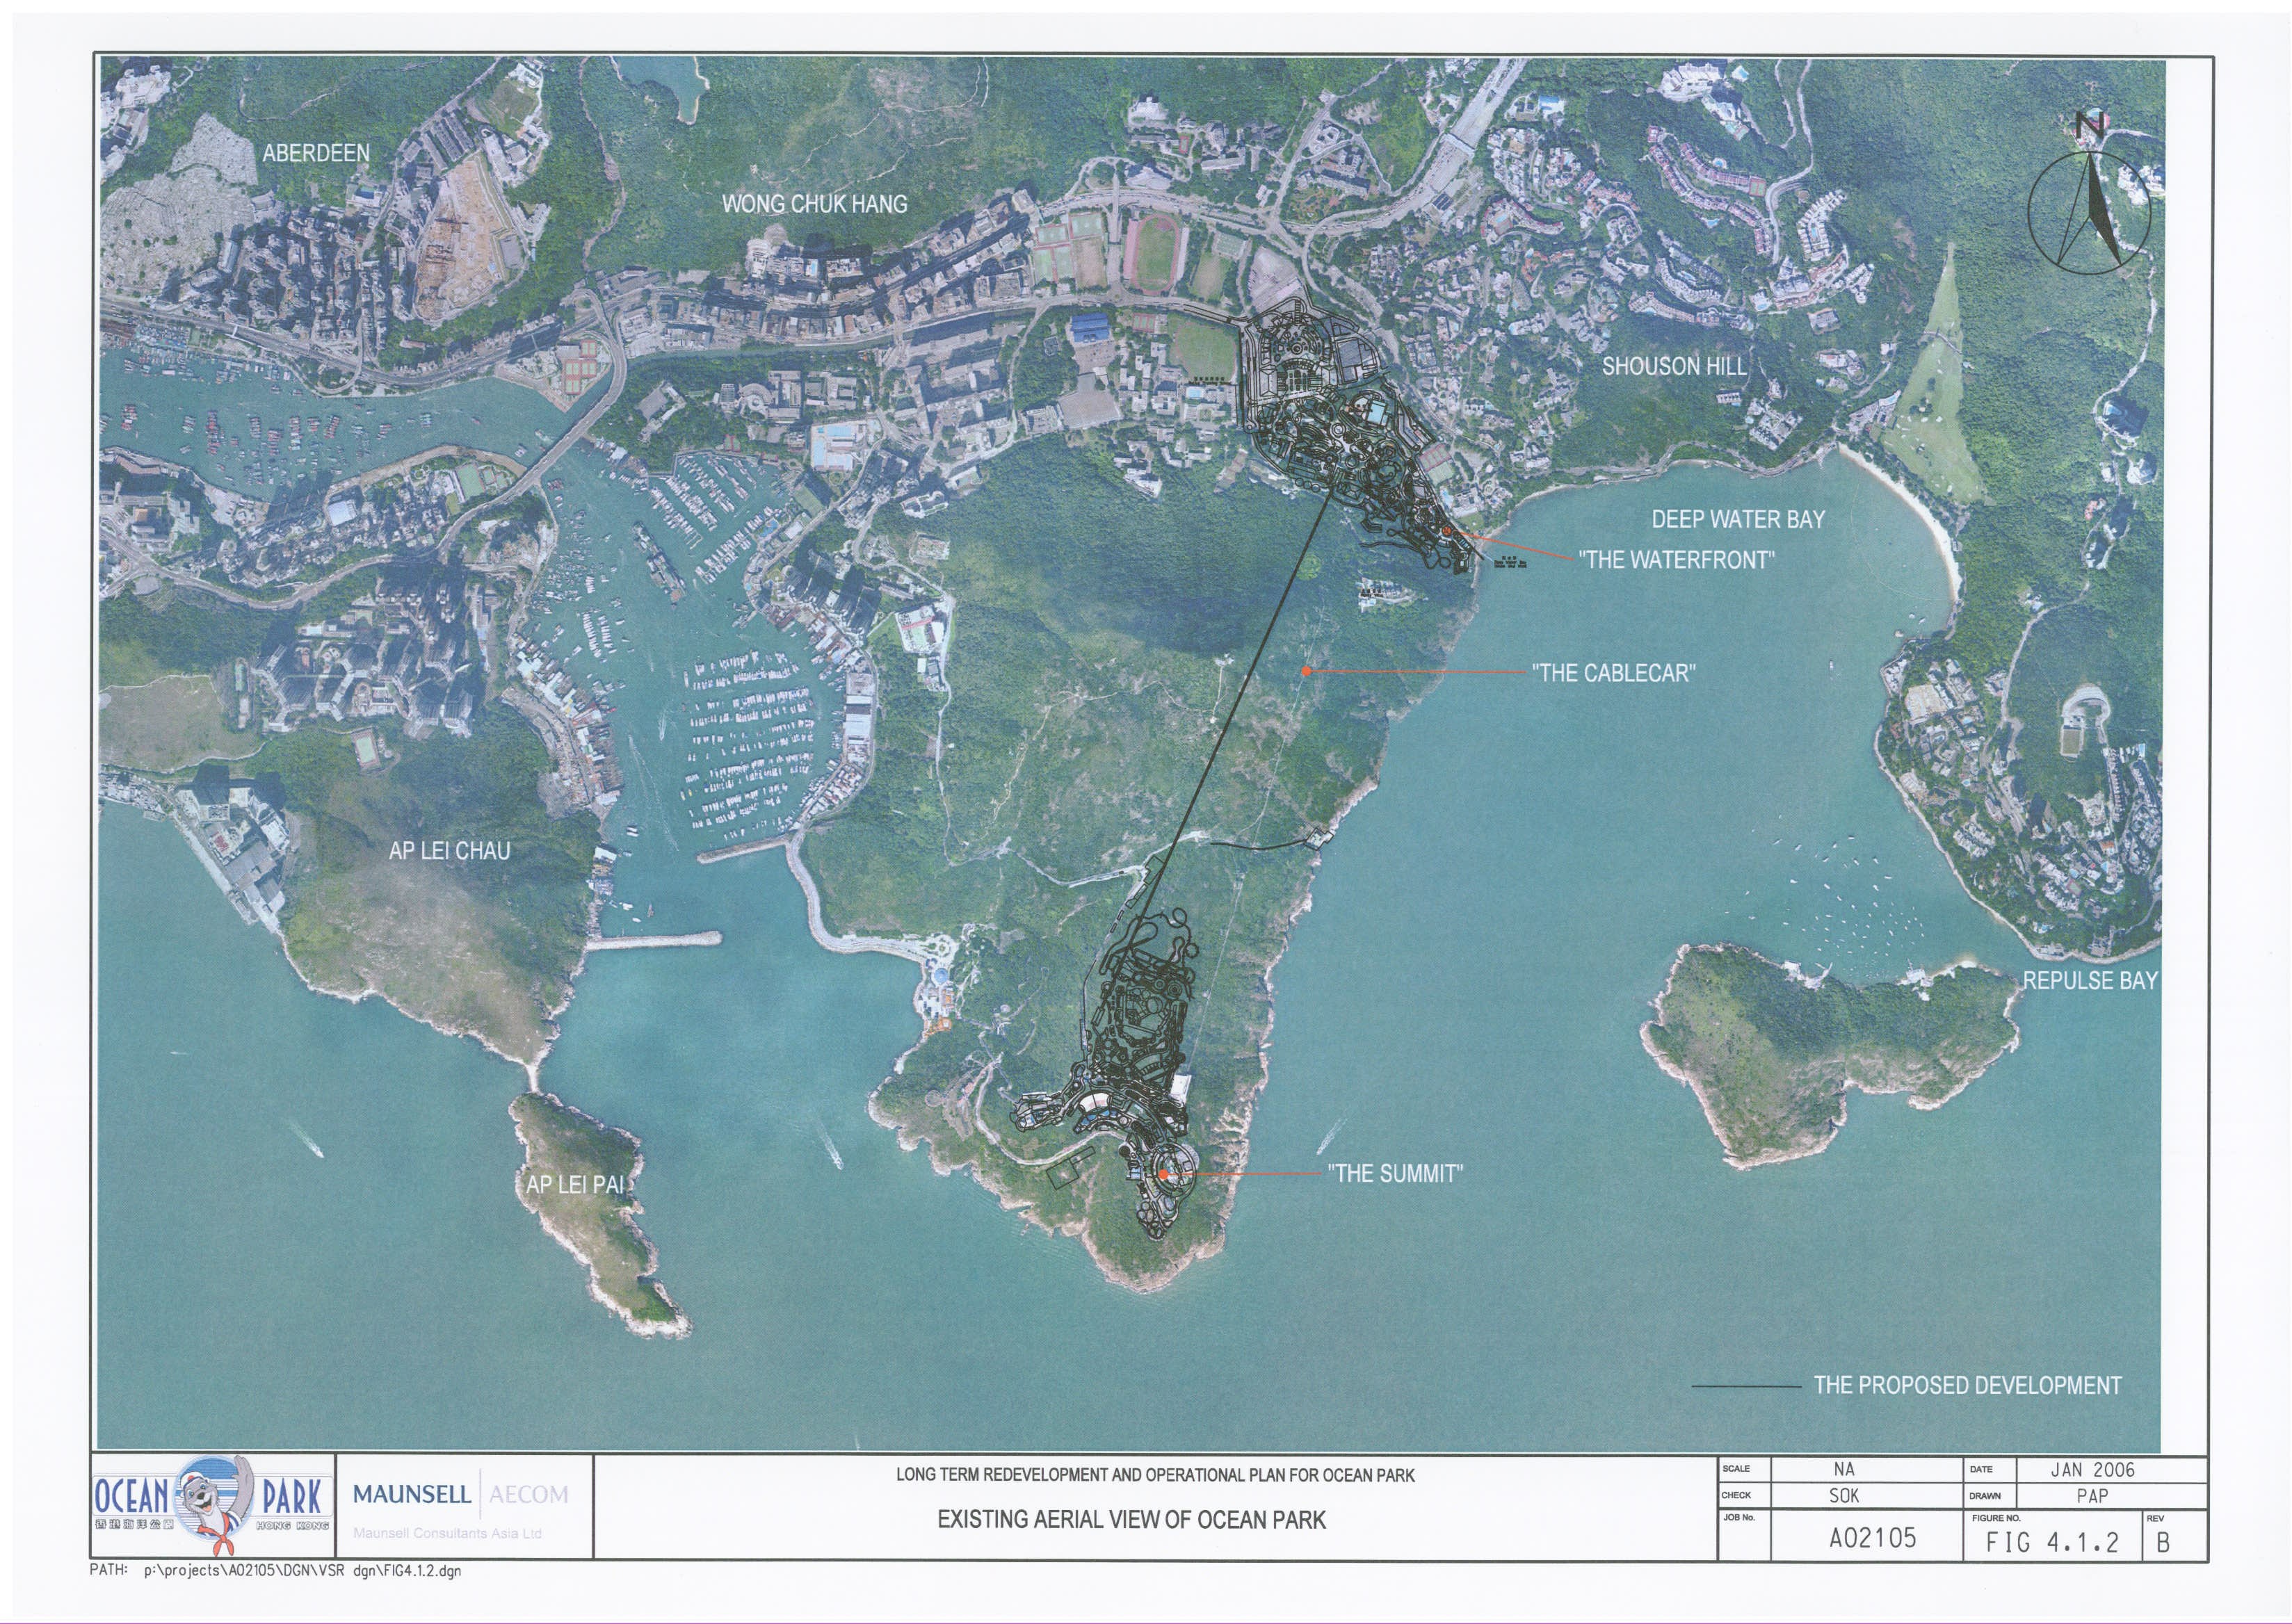
Figure
4.1.2 Existing
Aerial View of Ocean Park
Figure
4.1.3 The
Proposed Development – Master Layout Plan
Figure
4.1.4 The
Proposed Development – Image for “The Waterfront”
Figure
4.1.5 The
Proposed Development – Image for “The Summit”
Figure
4.1.6 Planning
& Development Framework (OZP)
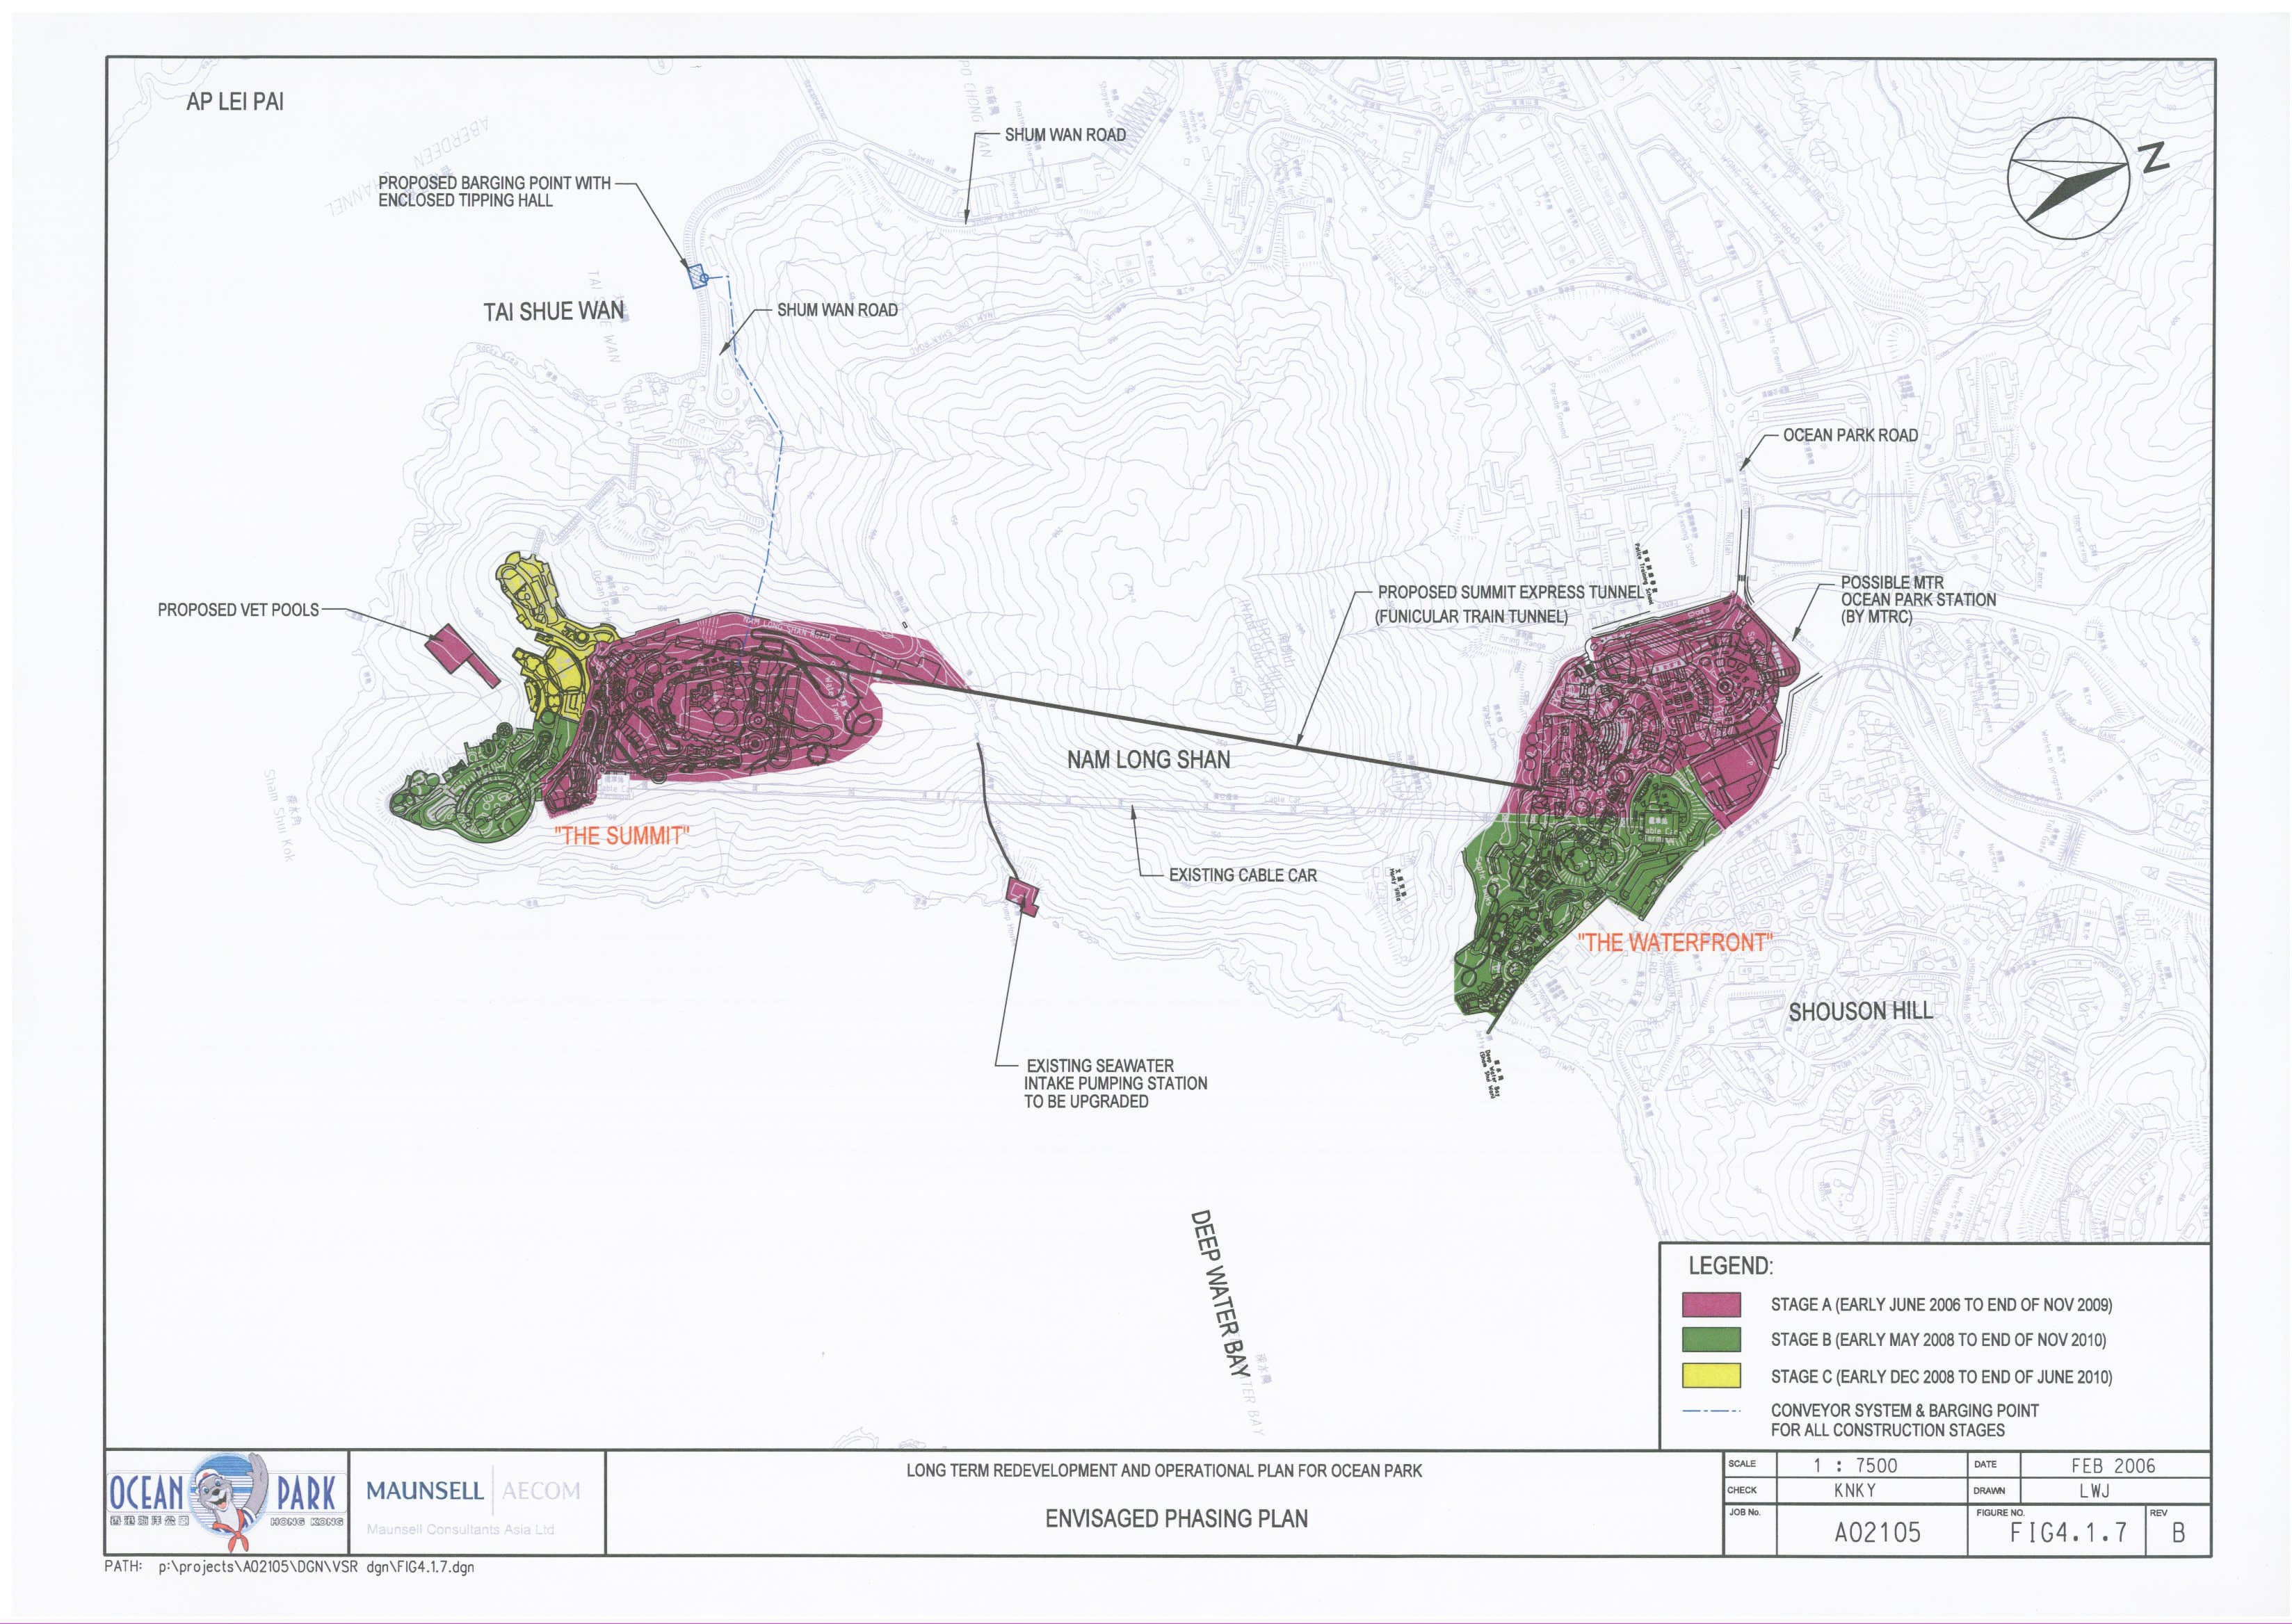
Figure
4.1.7 Envisaged
Phasing Plan
Figure
Figure
Figure
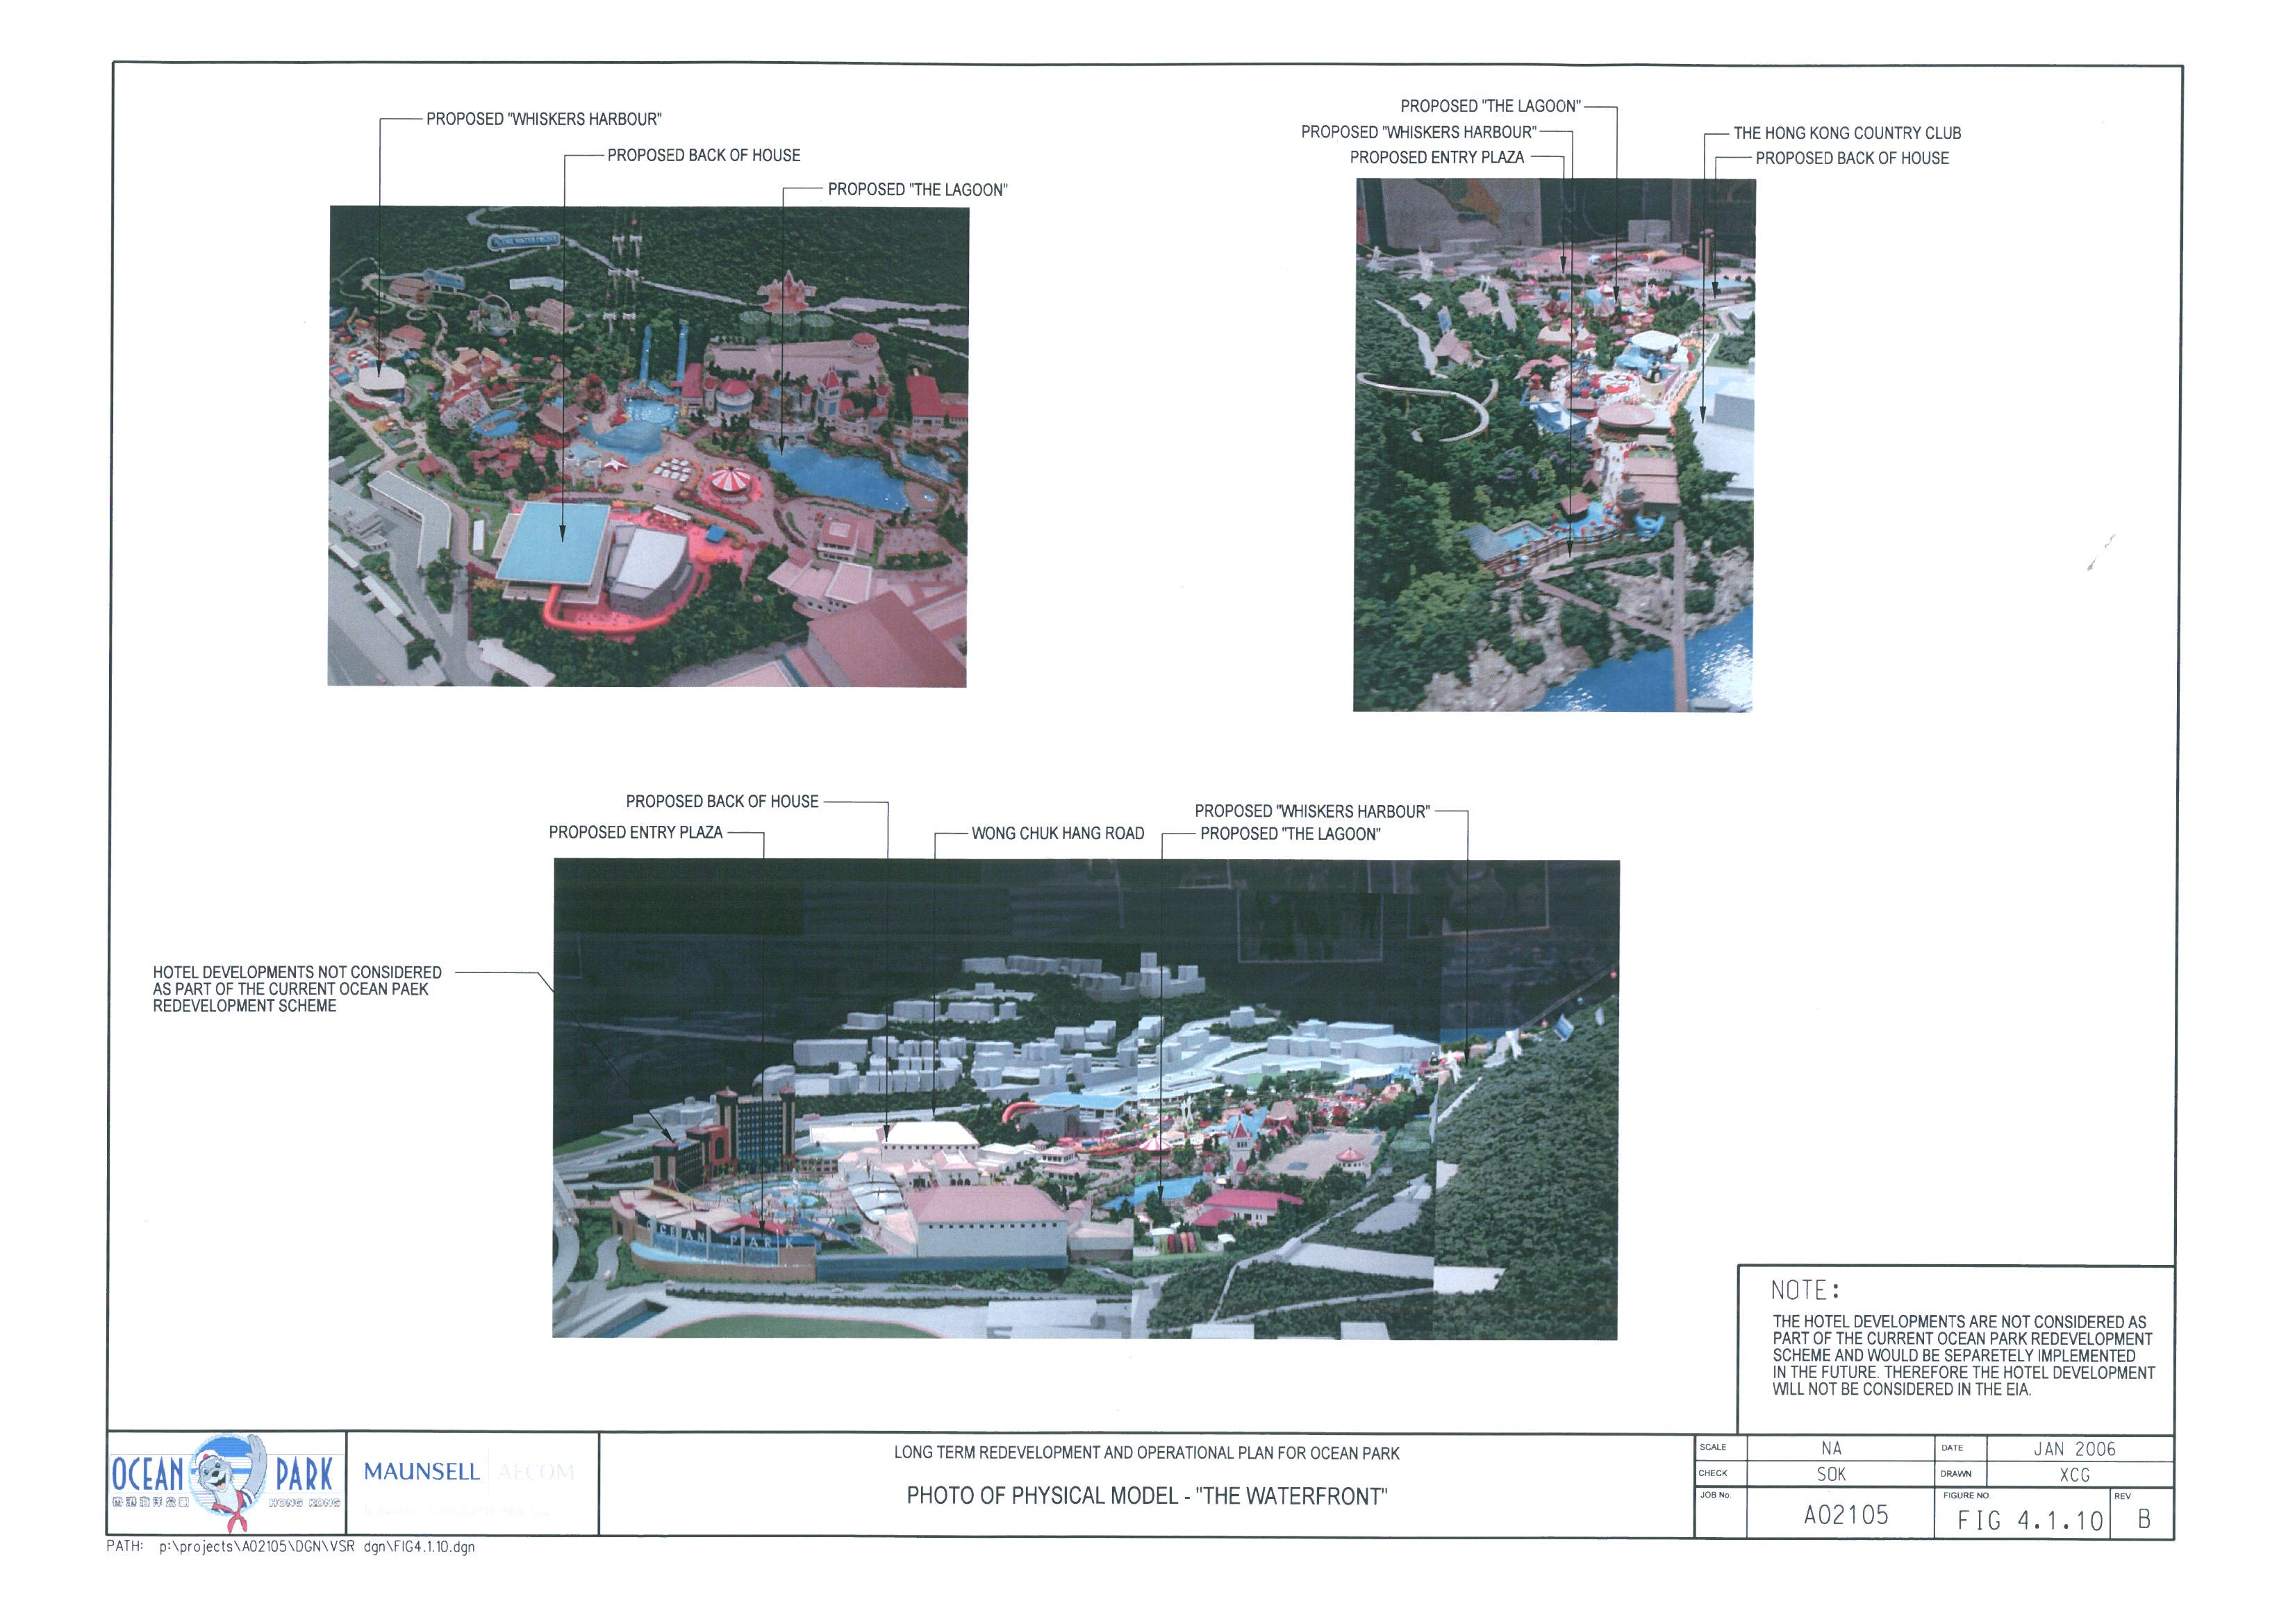
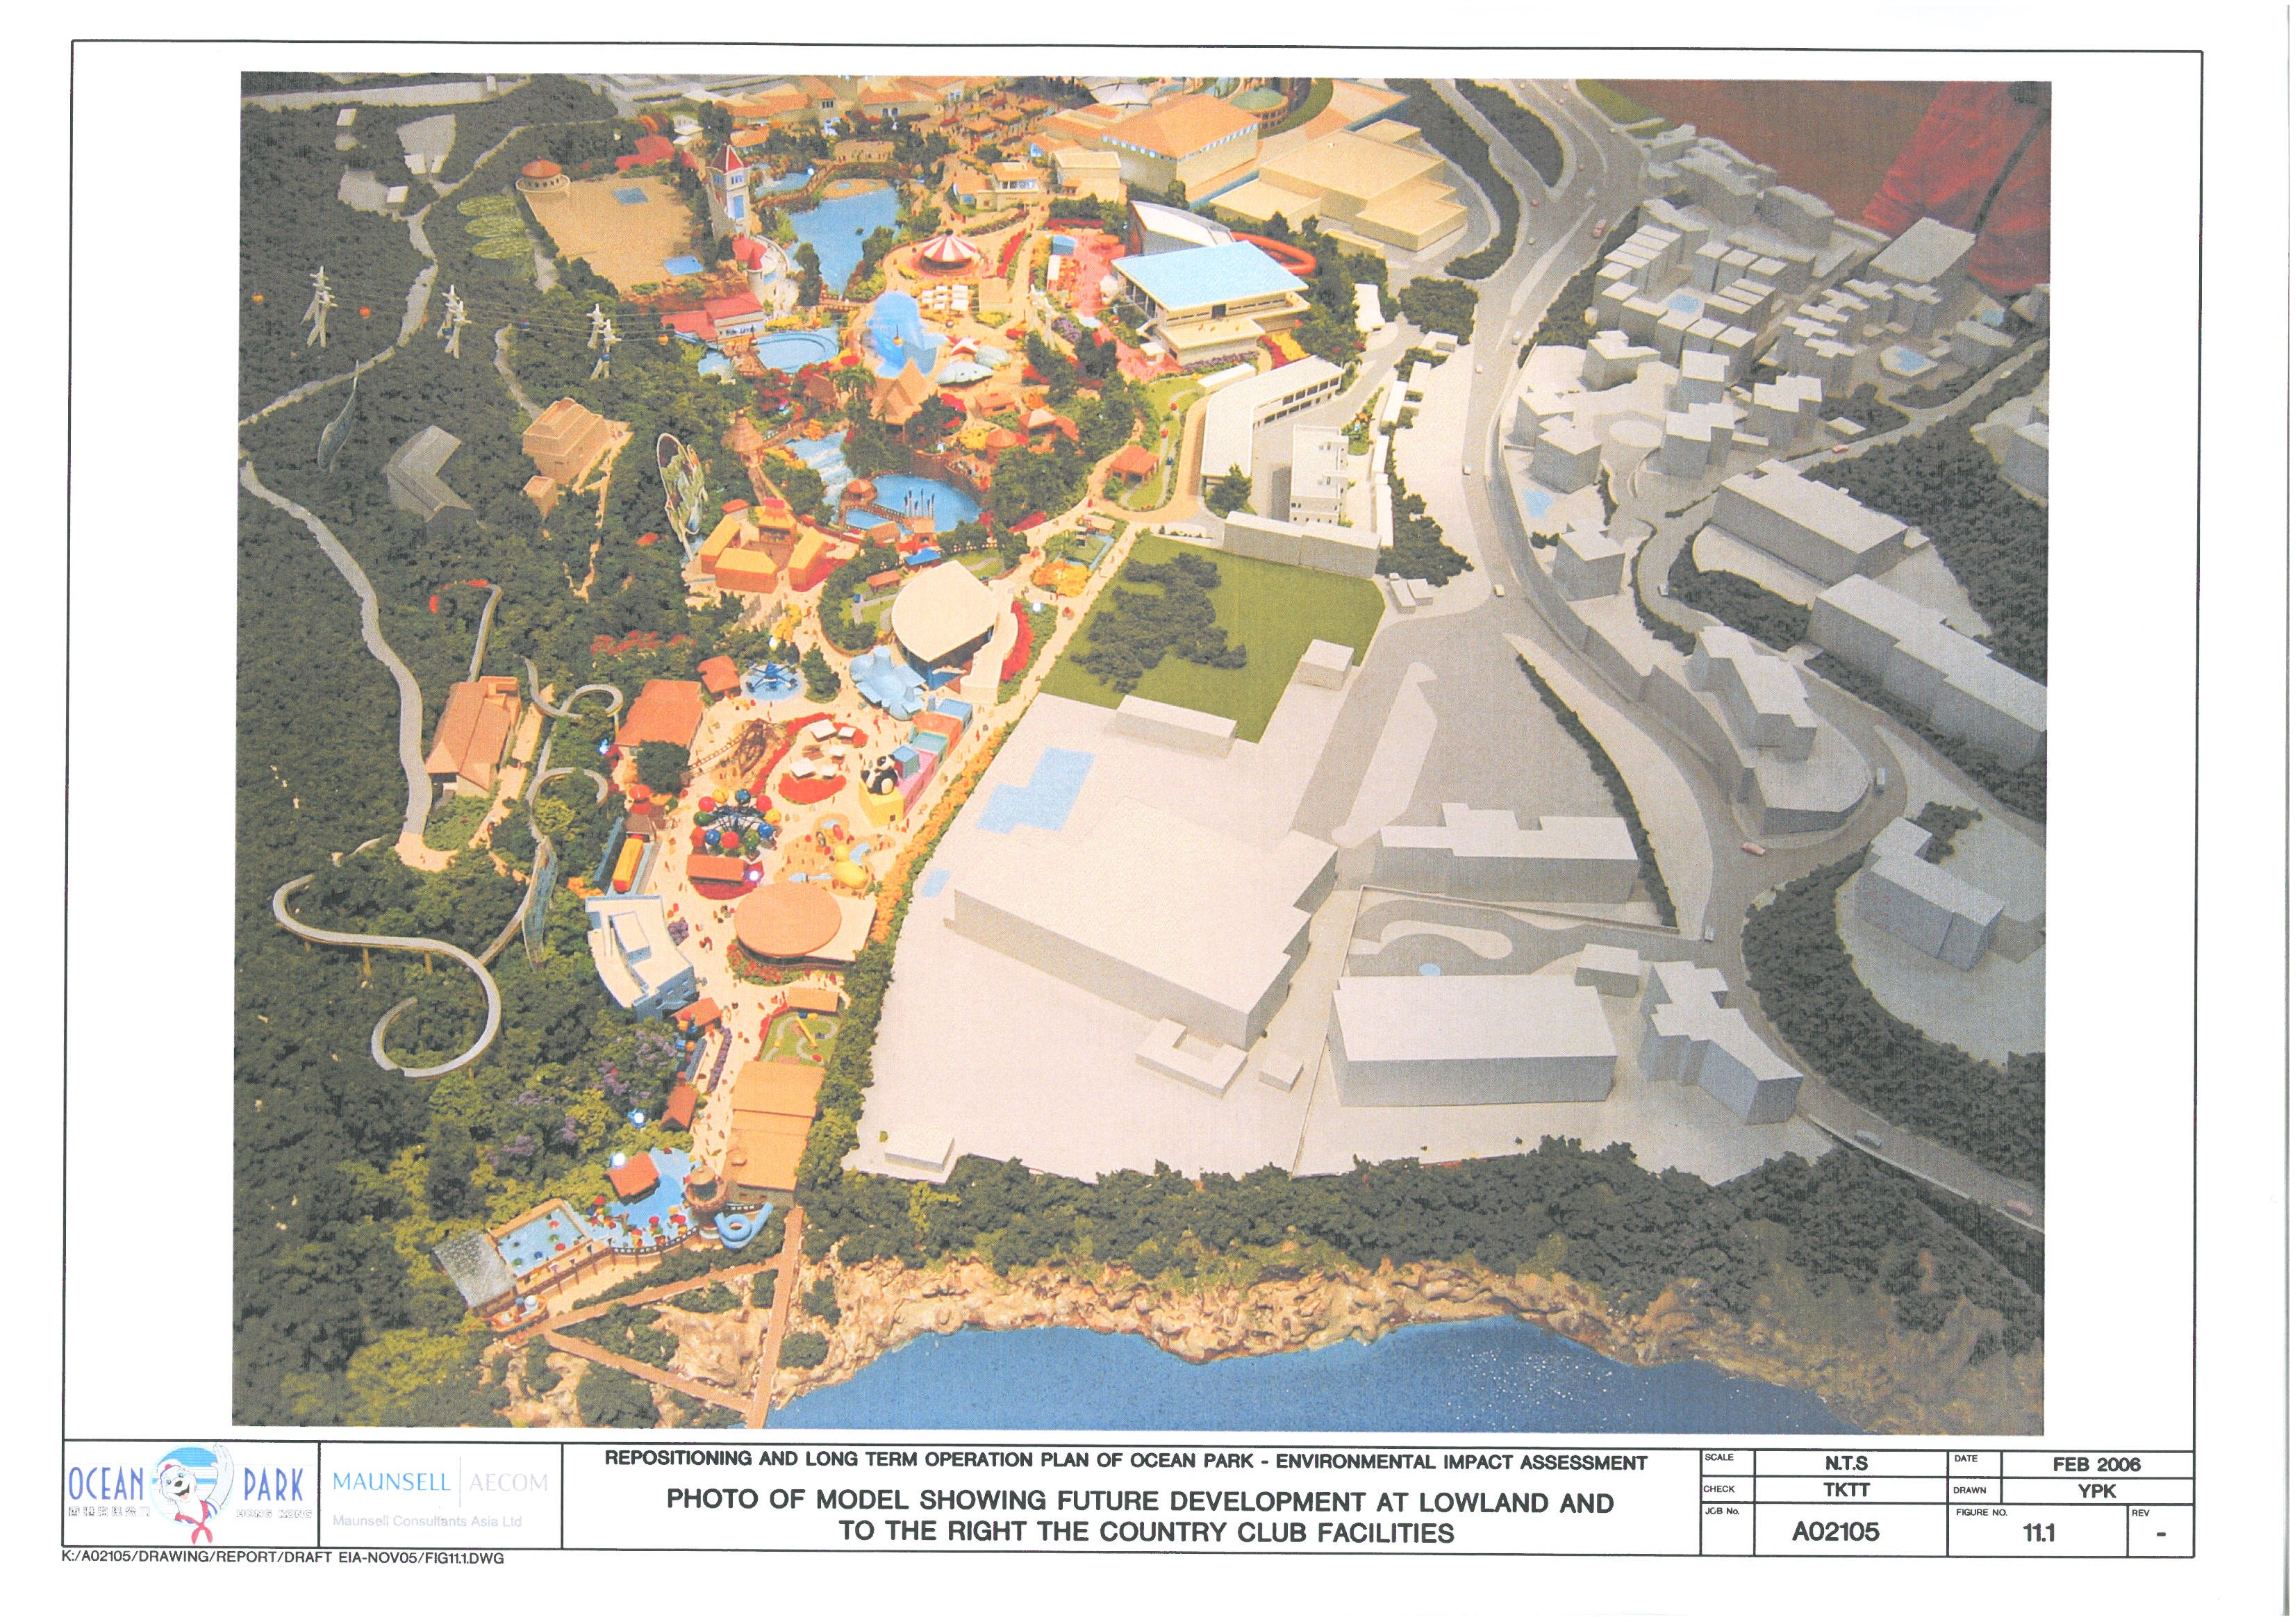
4.1.10 Photo of
Physical Model – “The Waterfront”
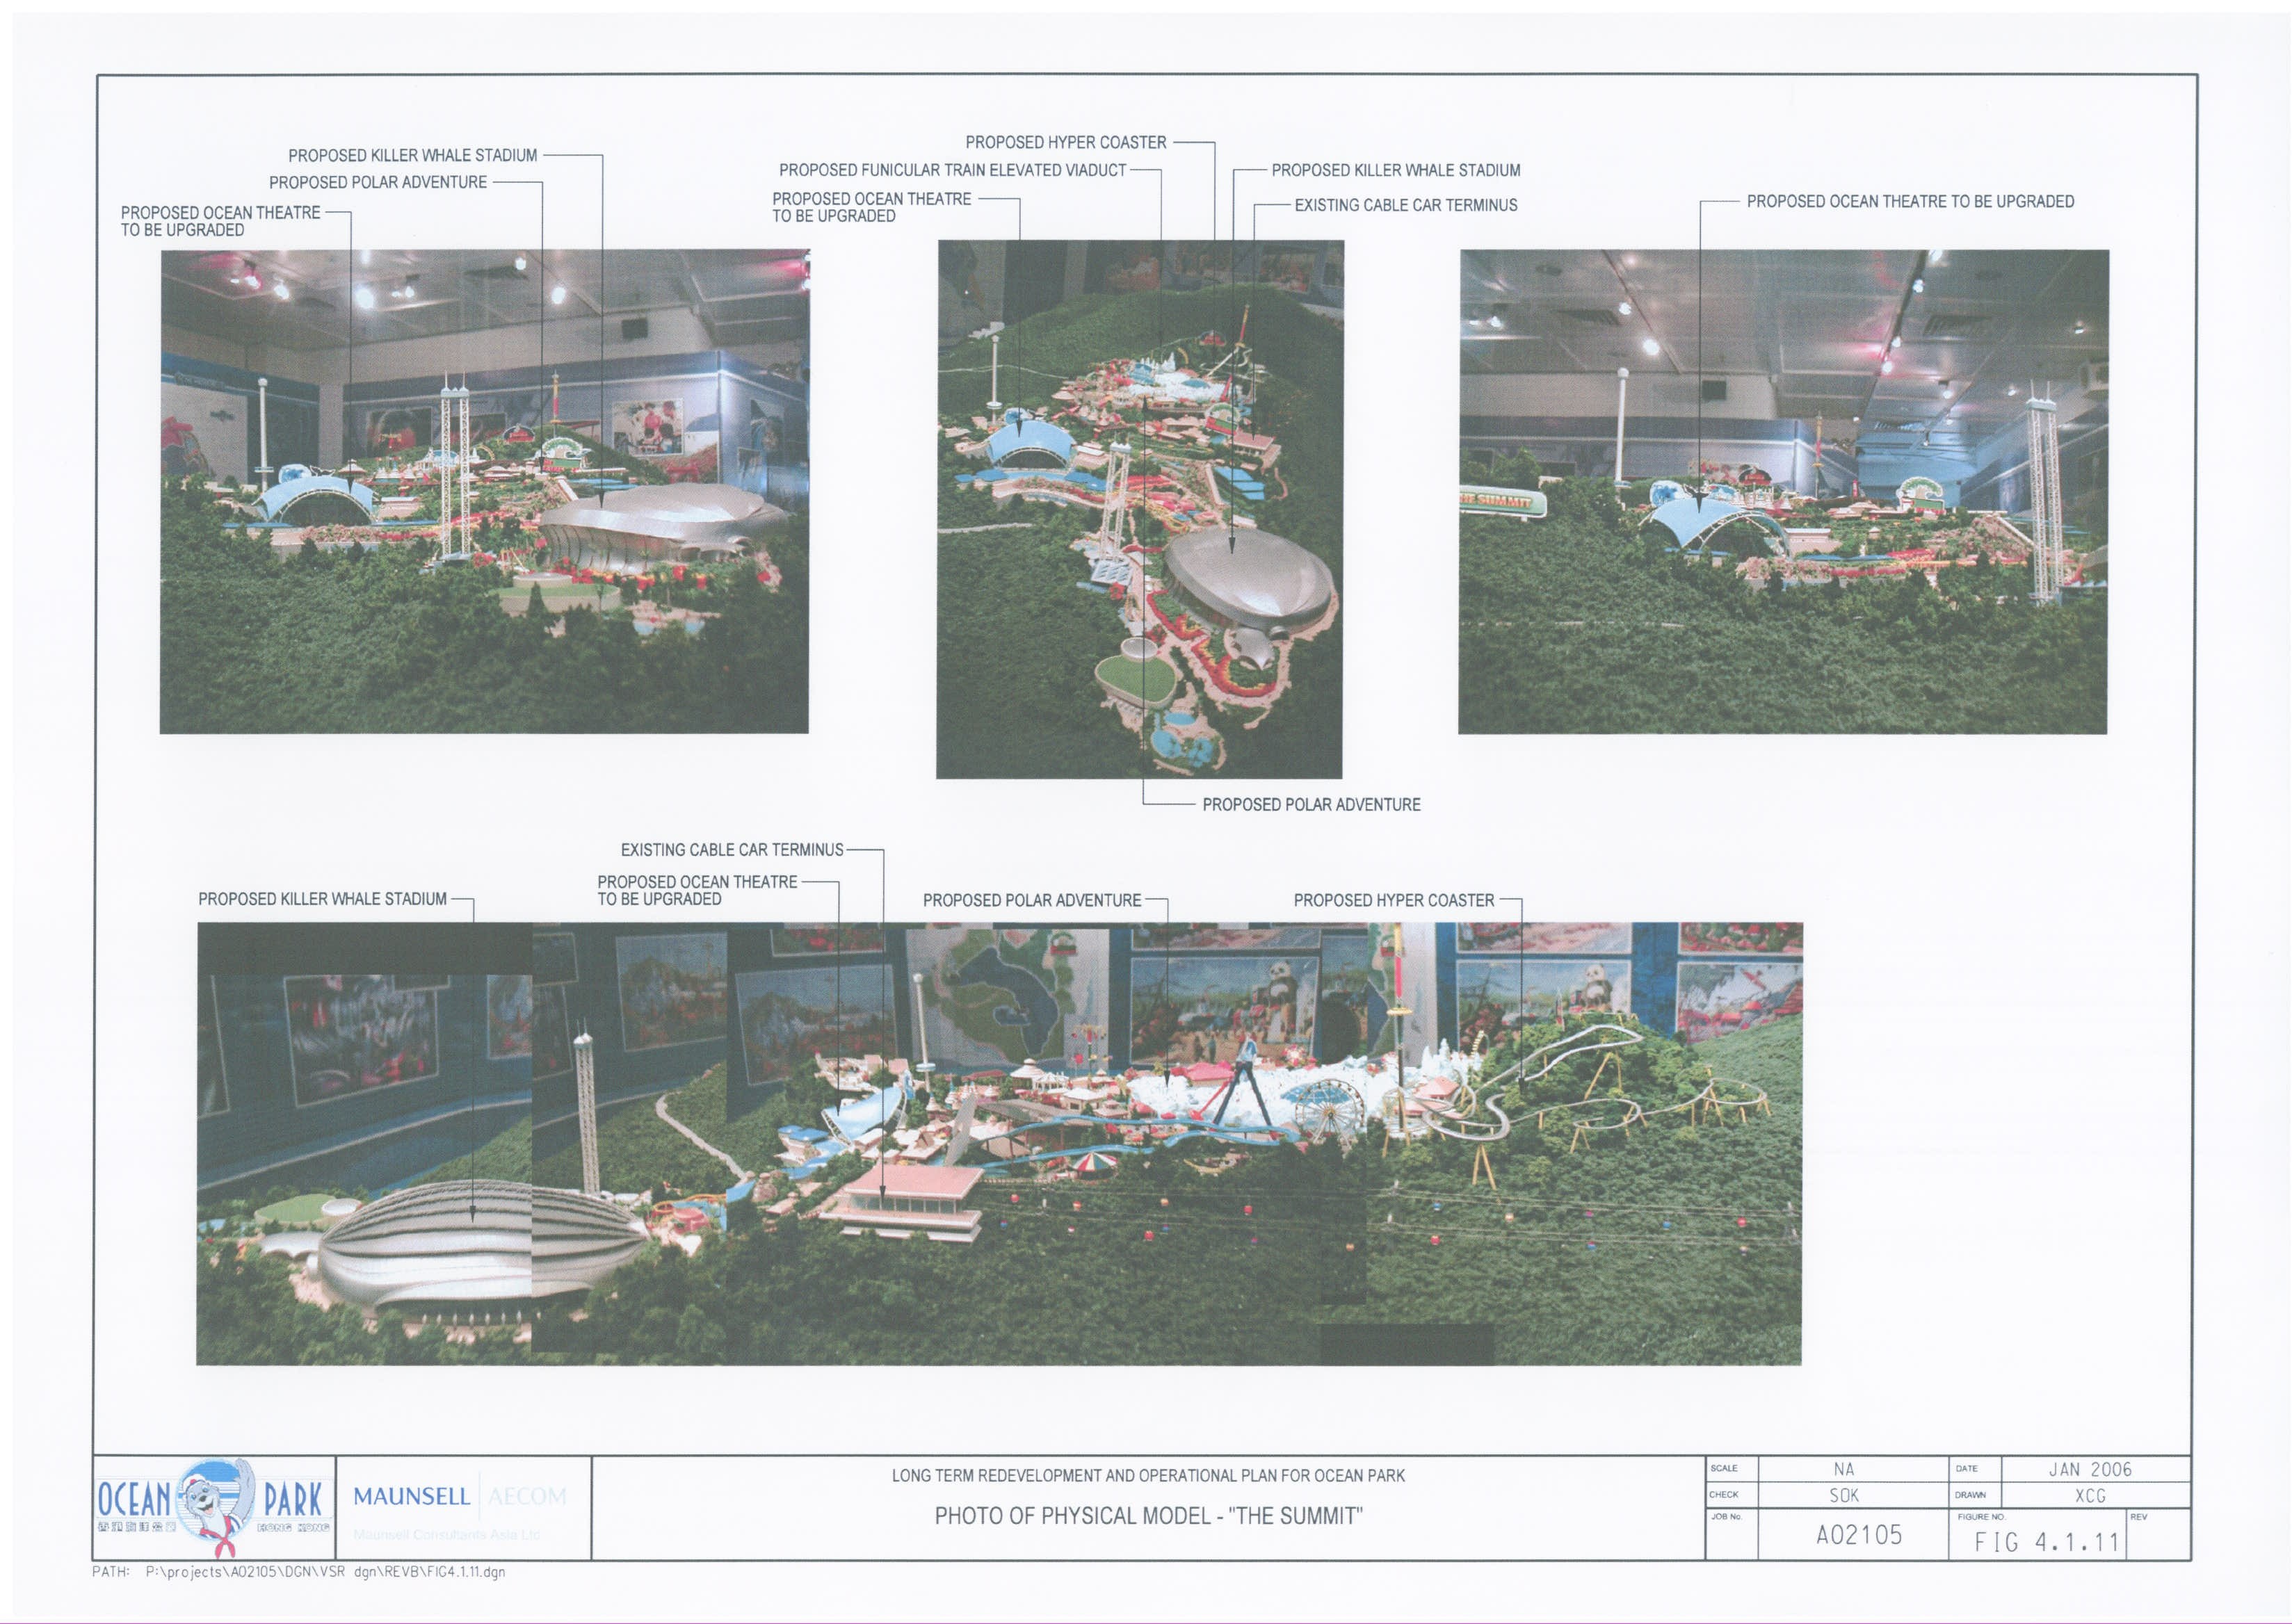
Figure
4.1.11 Photo of
Physical Model –“The Summit”
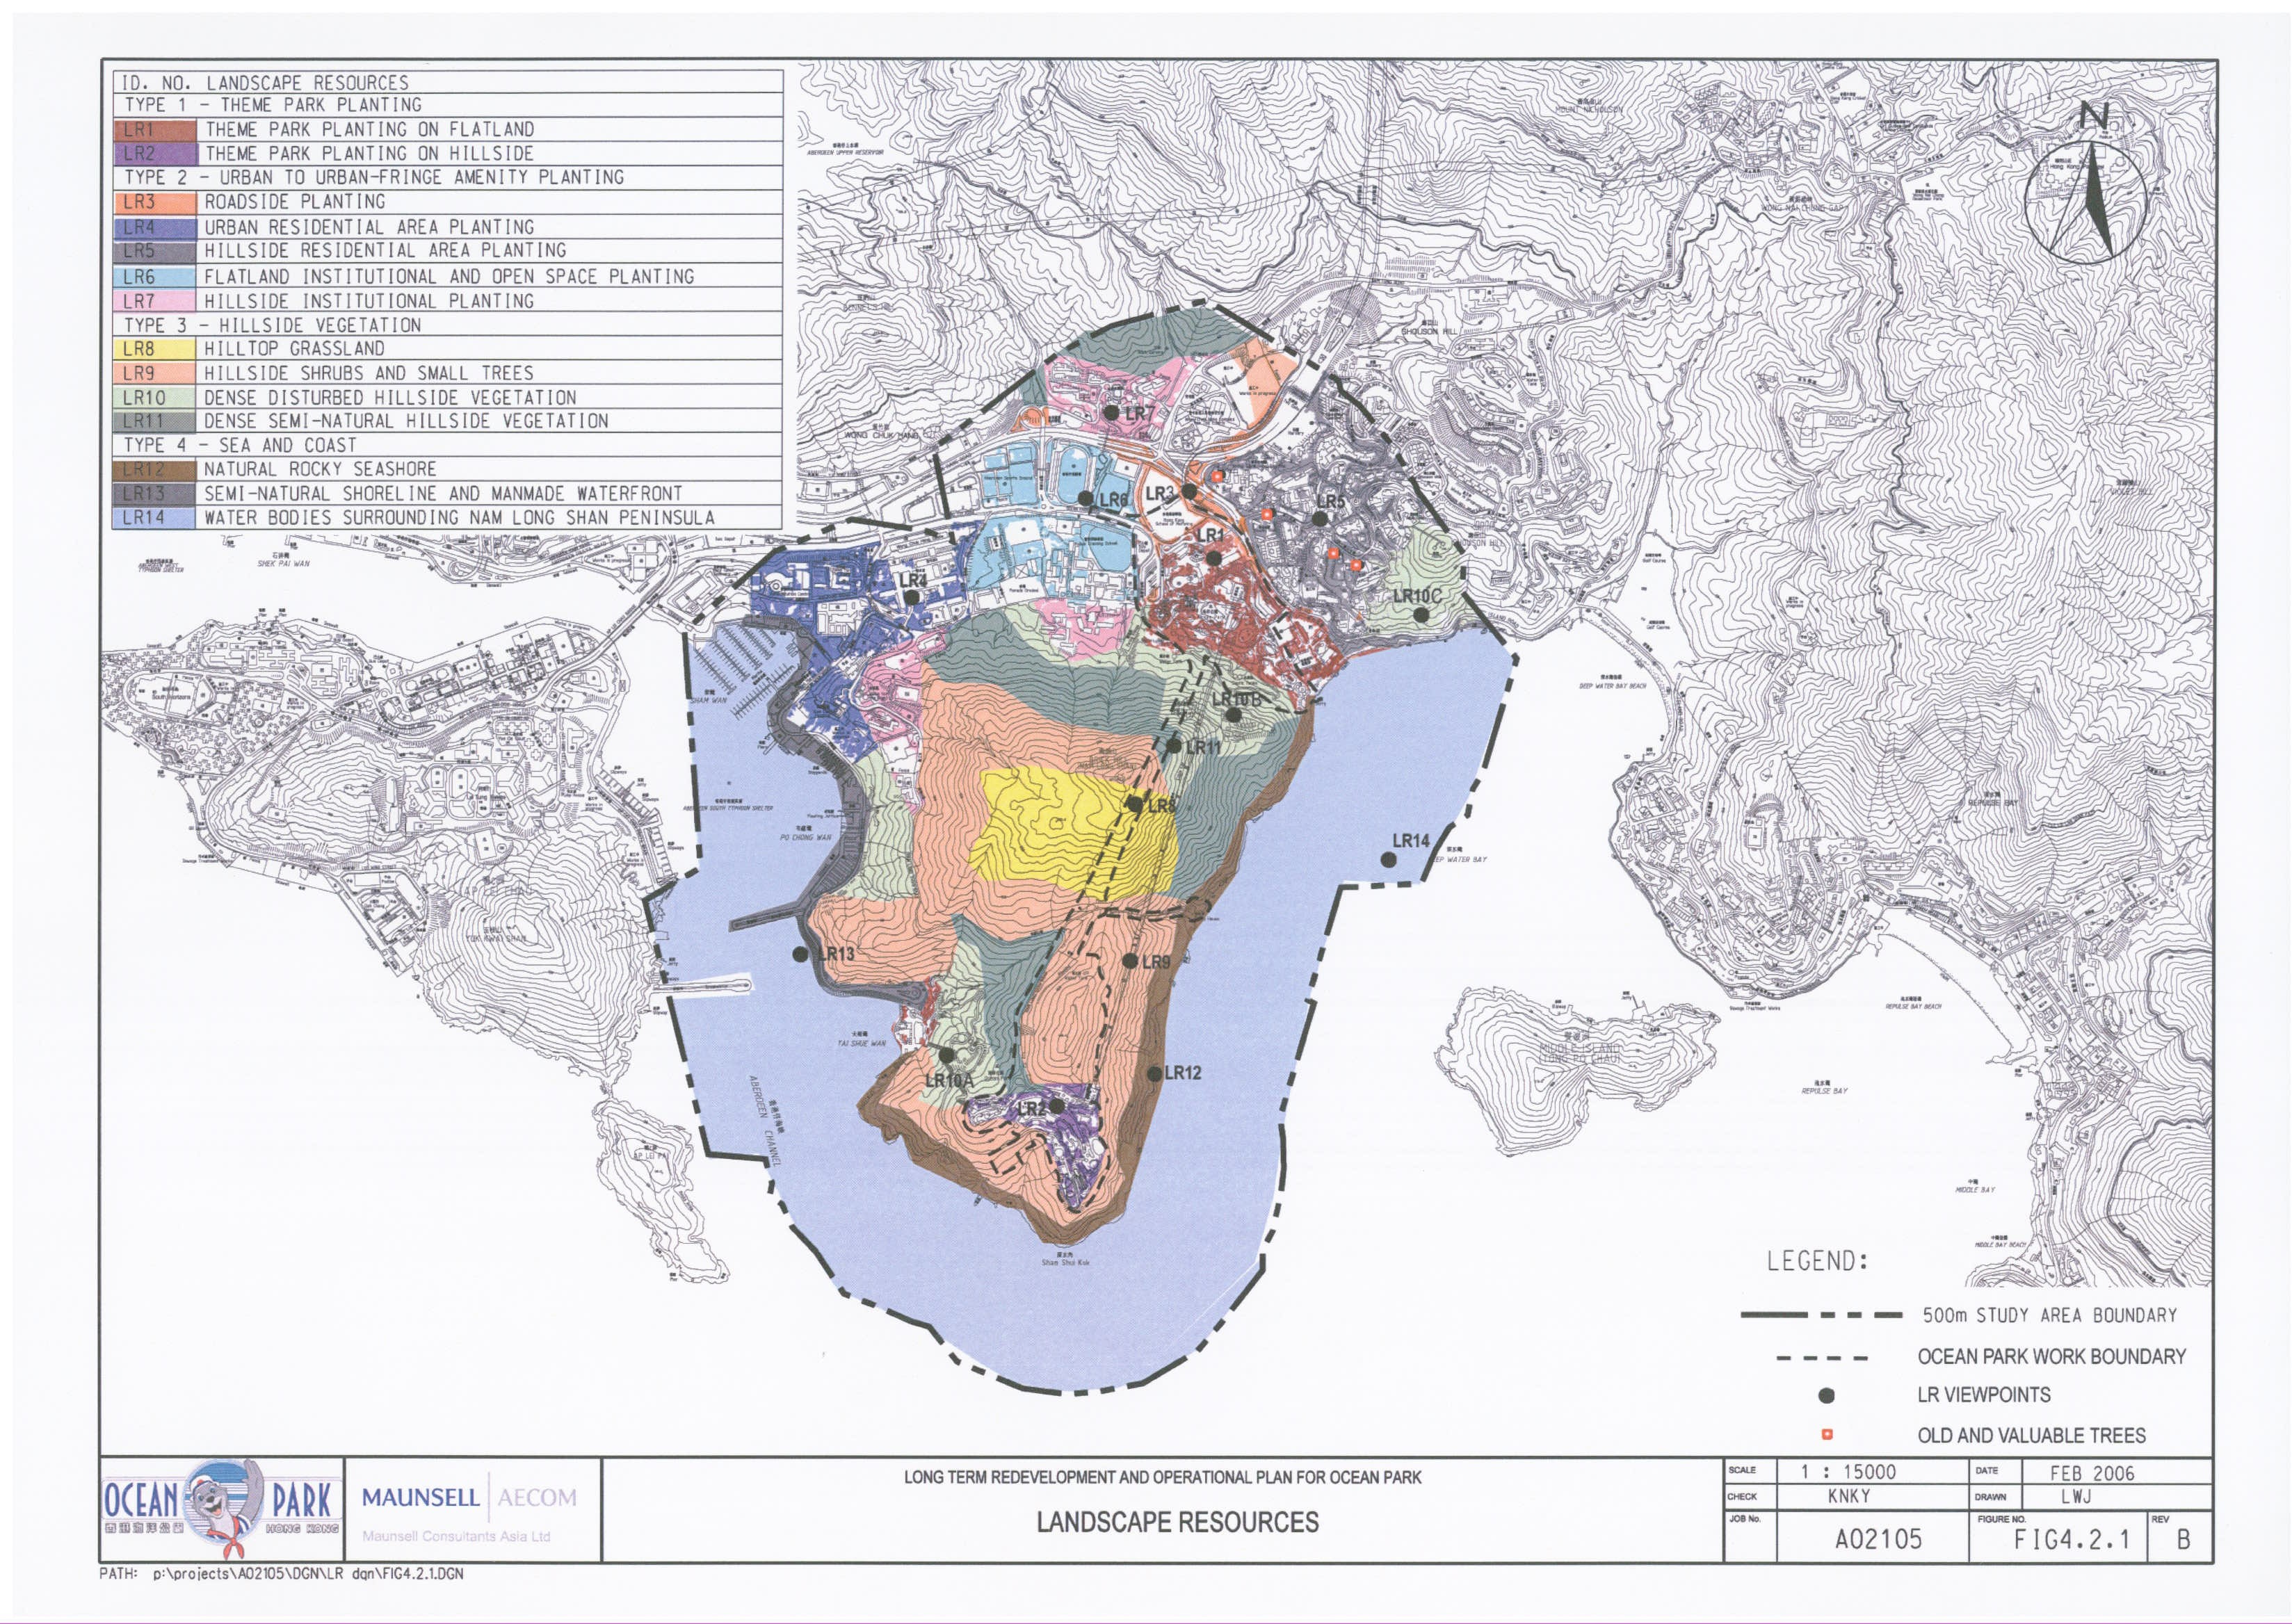
Figure
4.2.1 Landscape
Resources
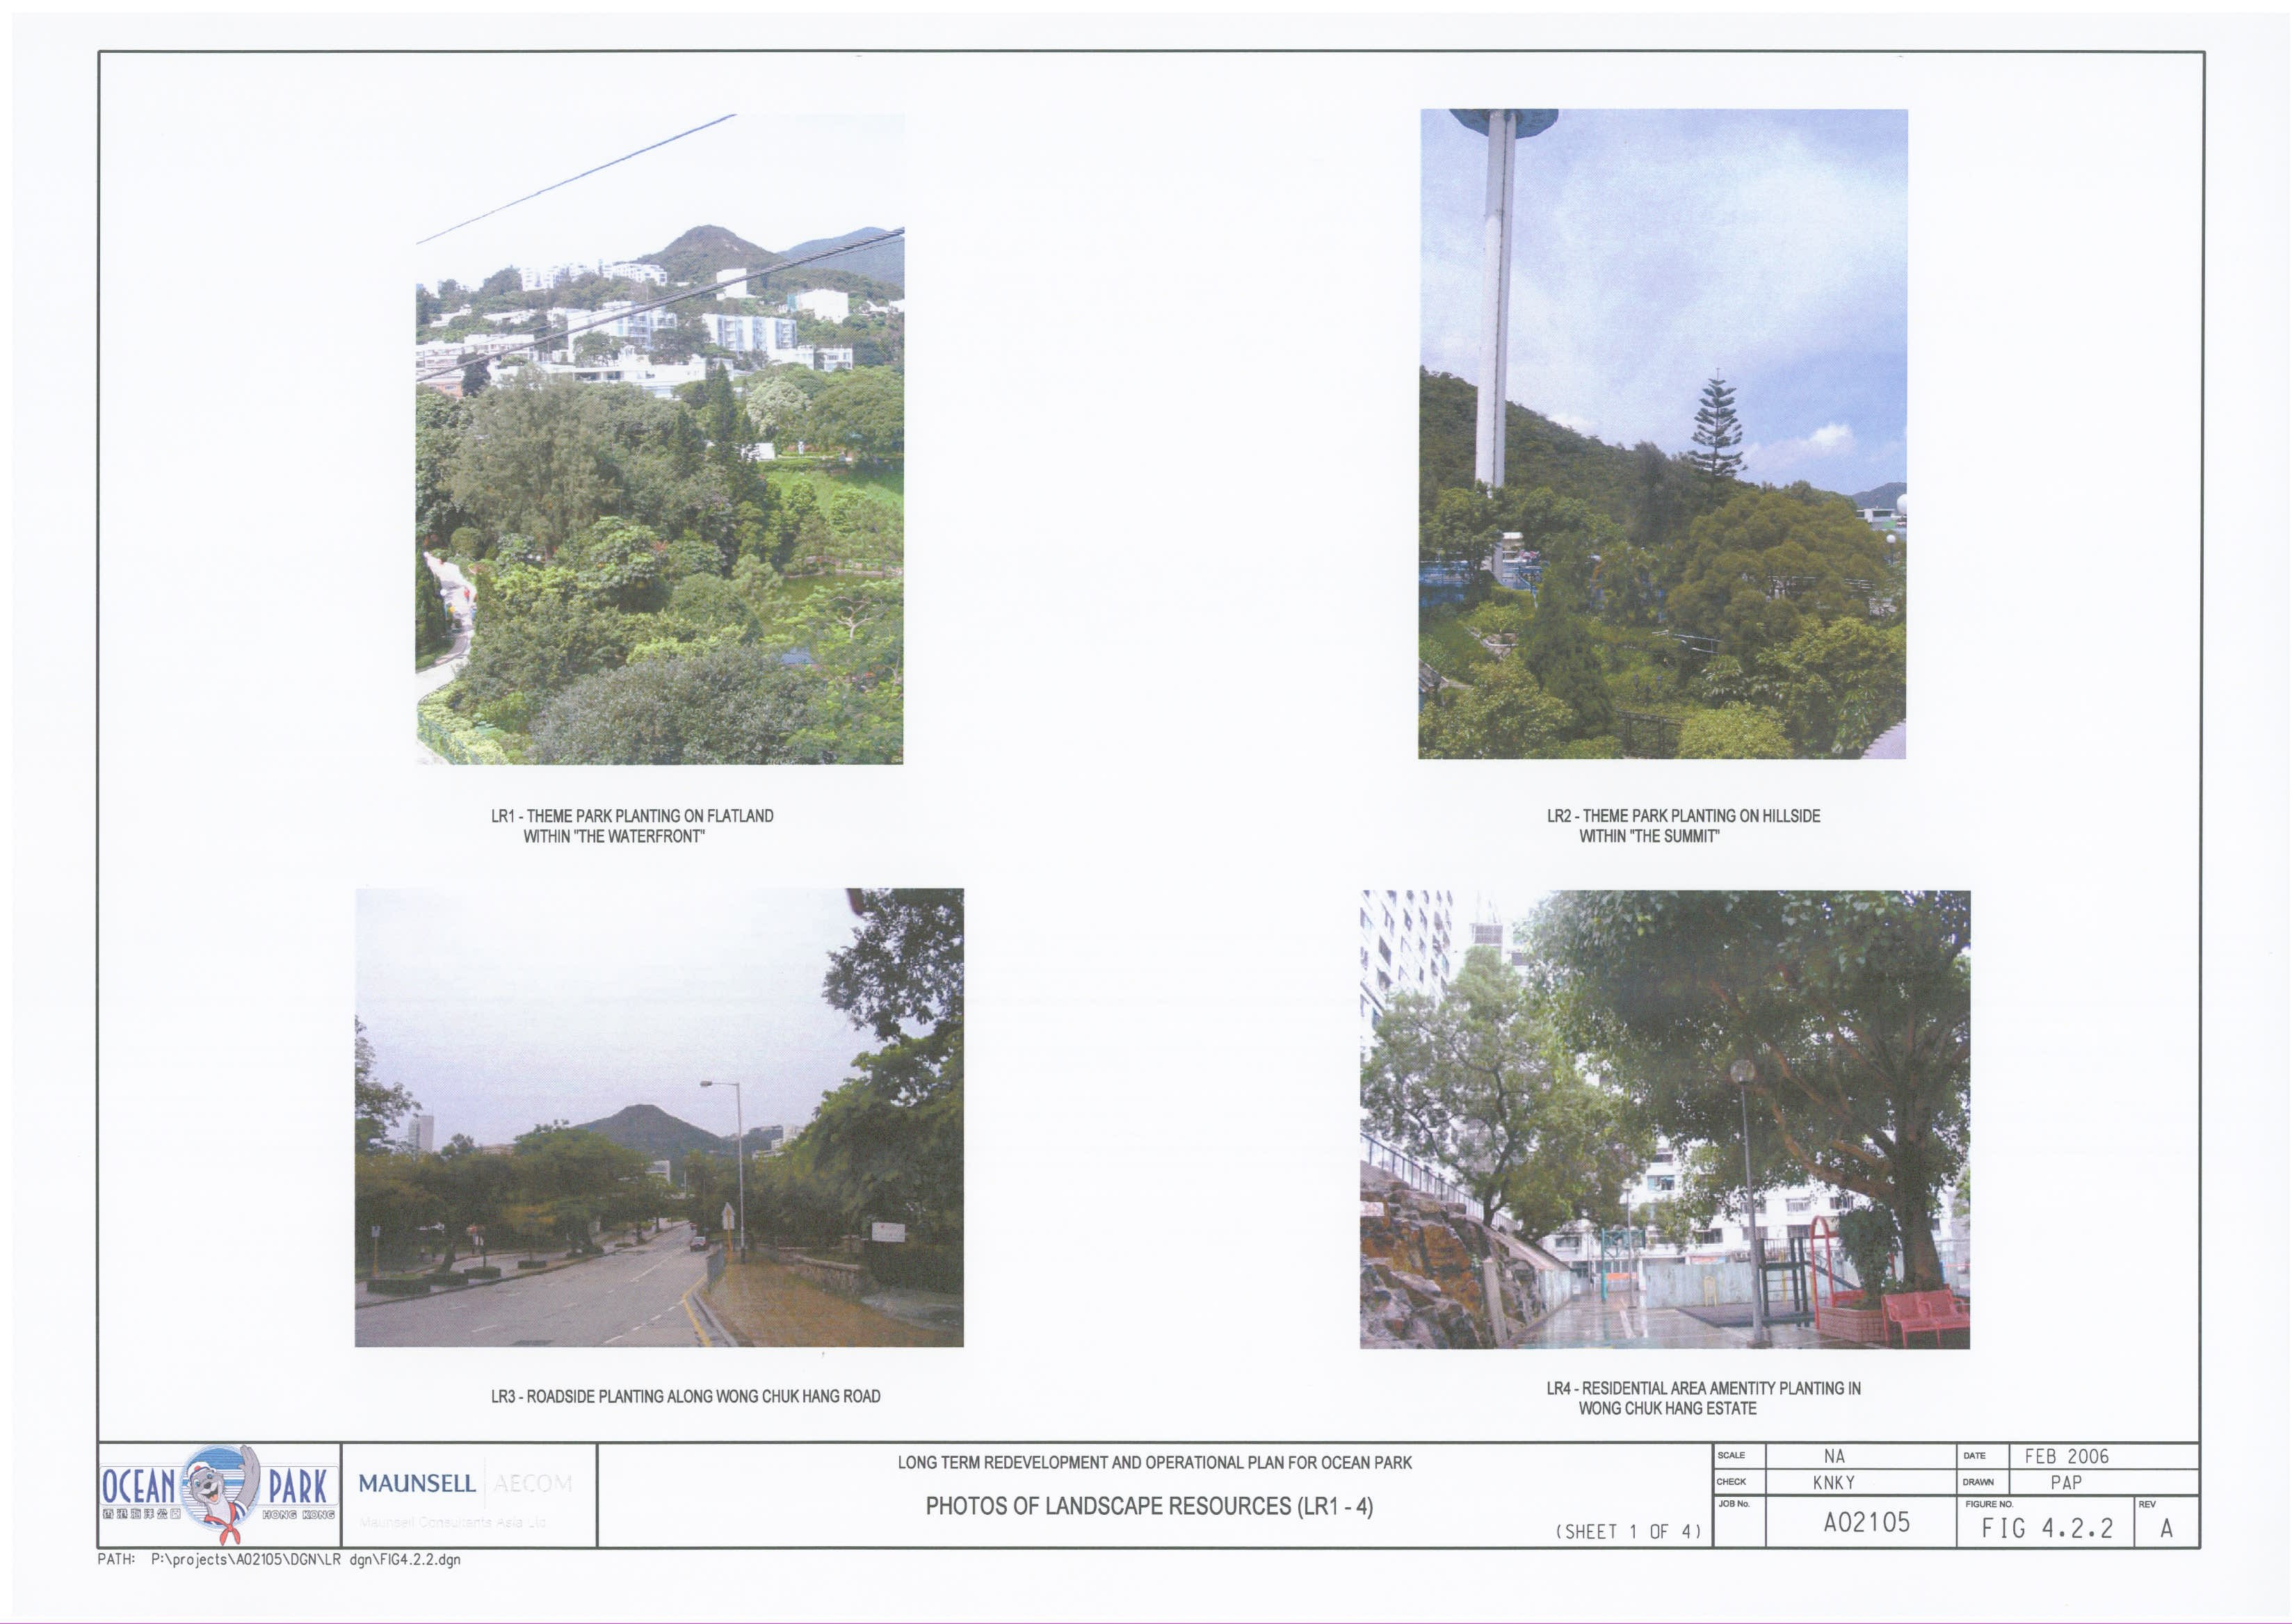
Figure
4.2.2 Photo
of Landscape Resources (LR1 - 4) – Sheet 1 of 4
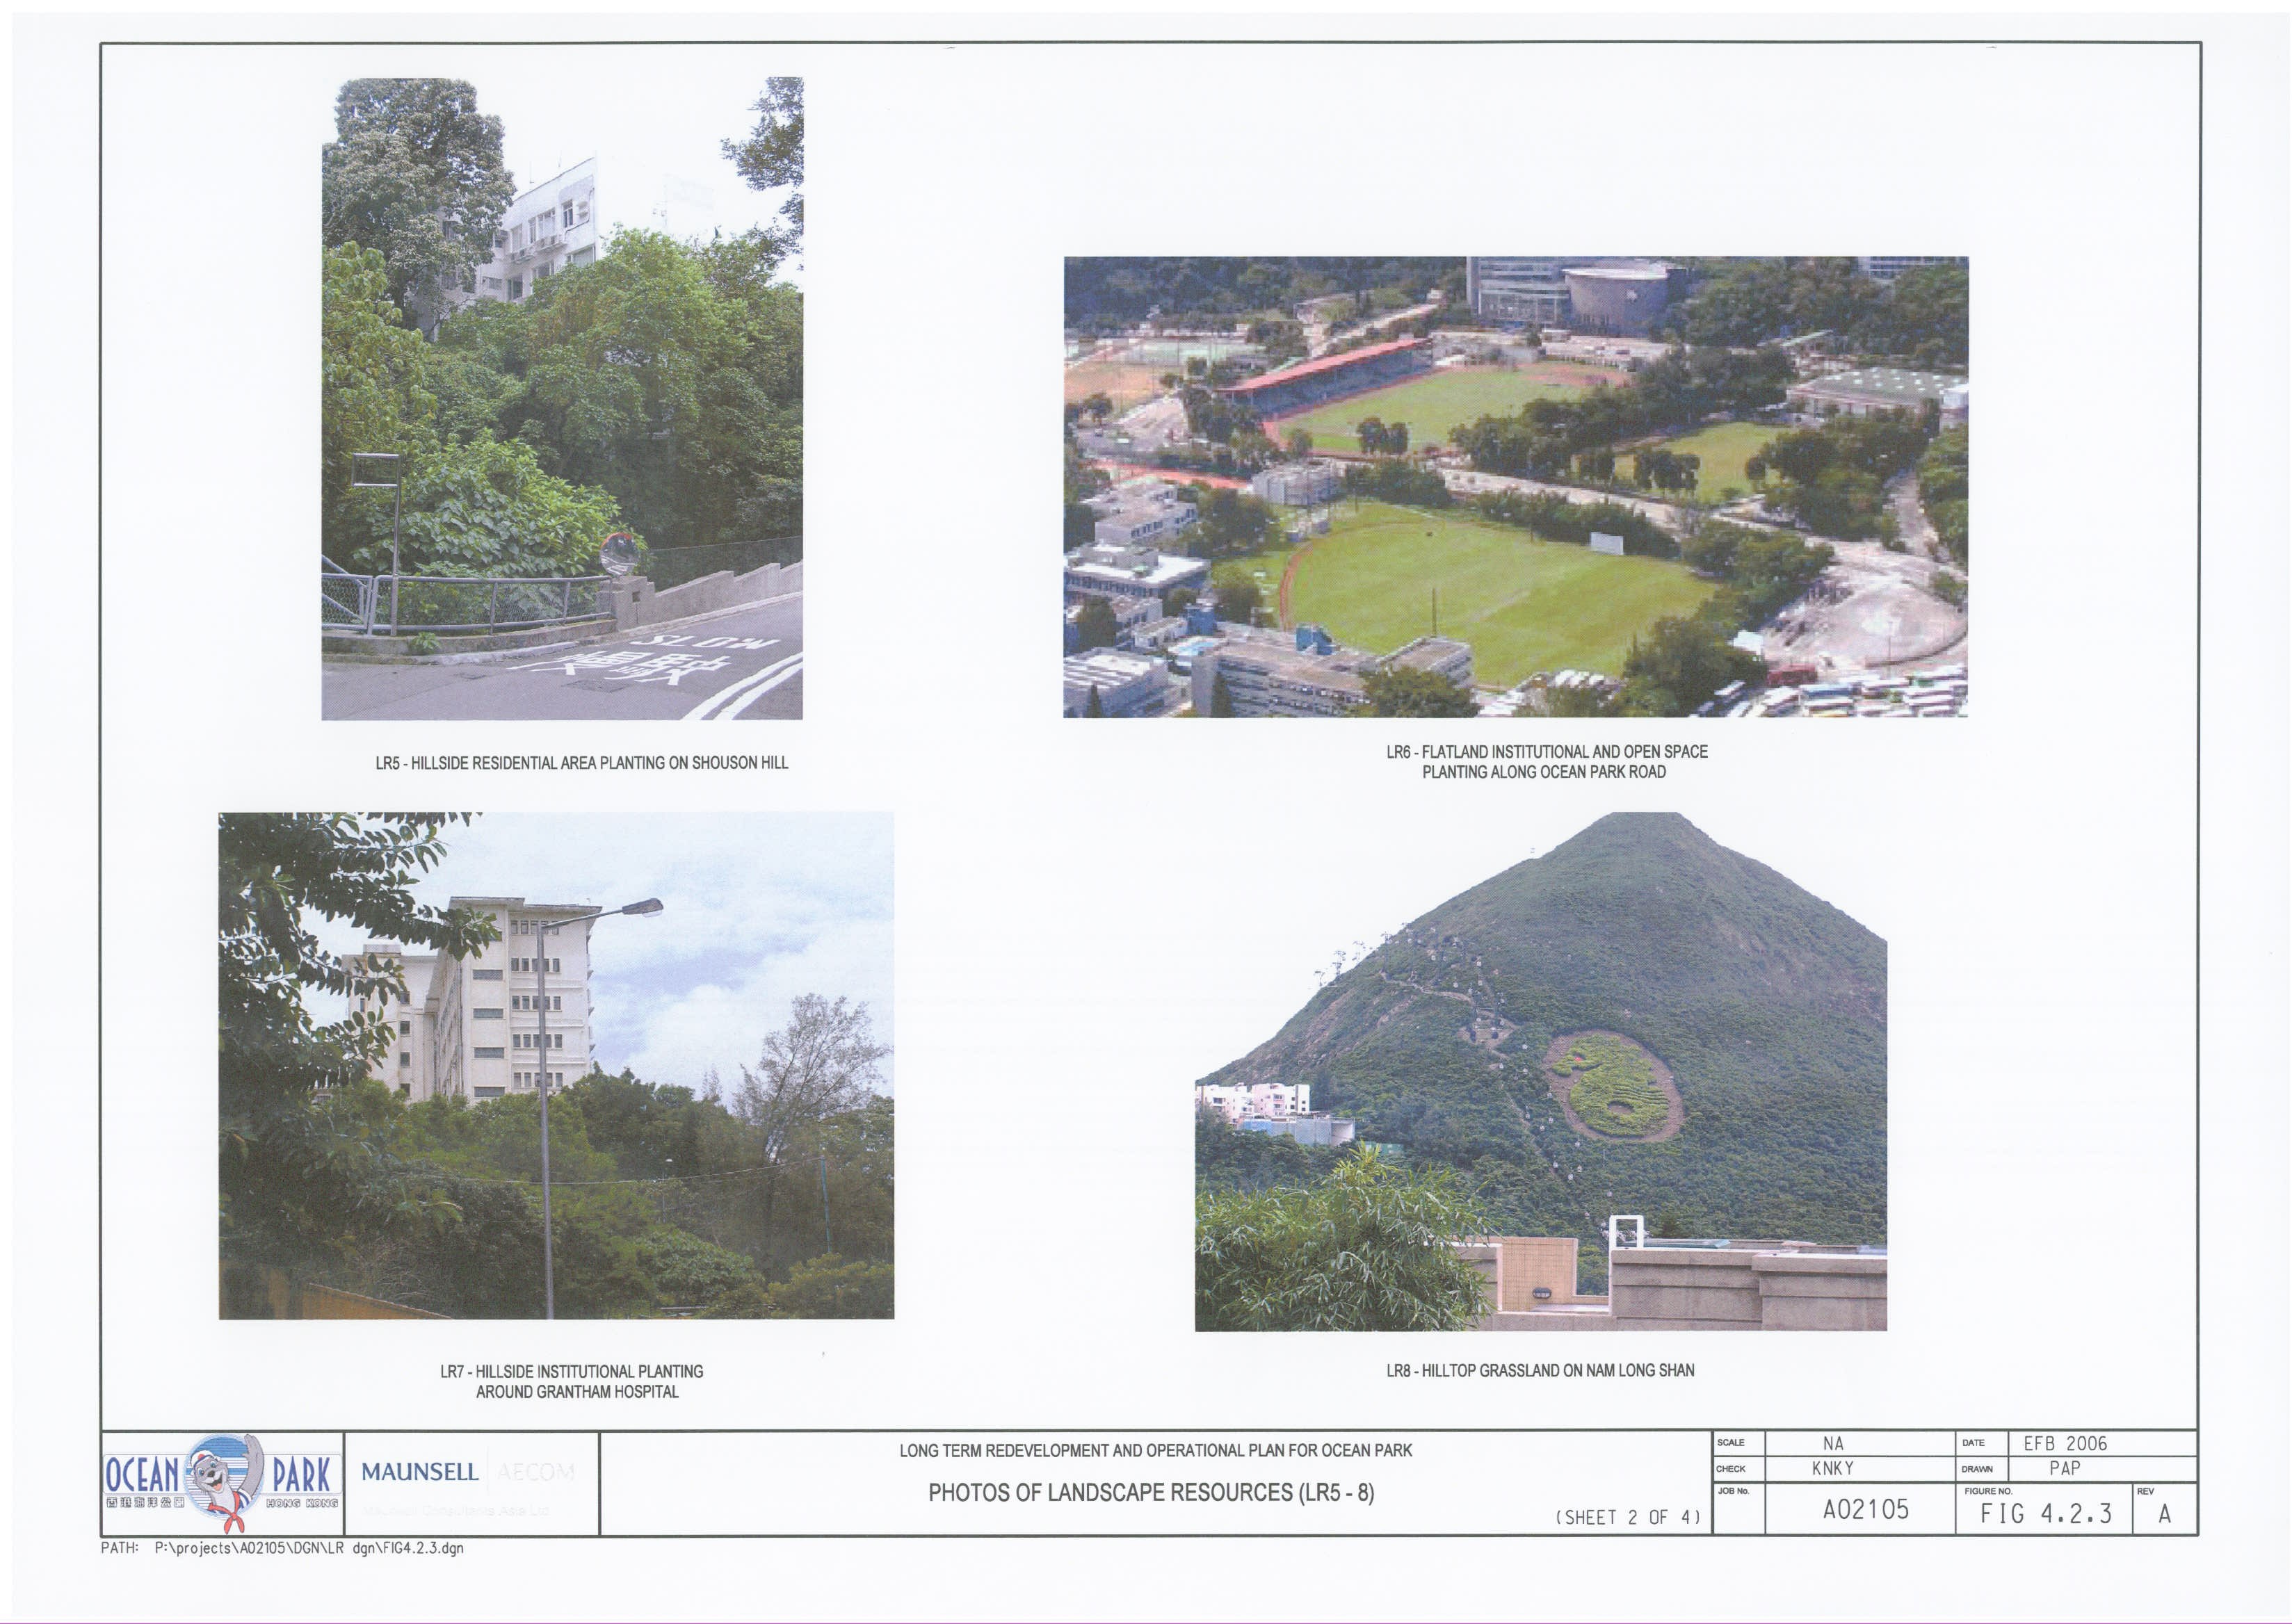
Figure
4.2.3 Photo
of Landscape Resources (LR5 - 8) – Sheet 2 of 4
Figure
4.2.4 Photo
of Landscape Resources (LR9 - 10) – Sheet 3 of 4
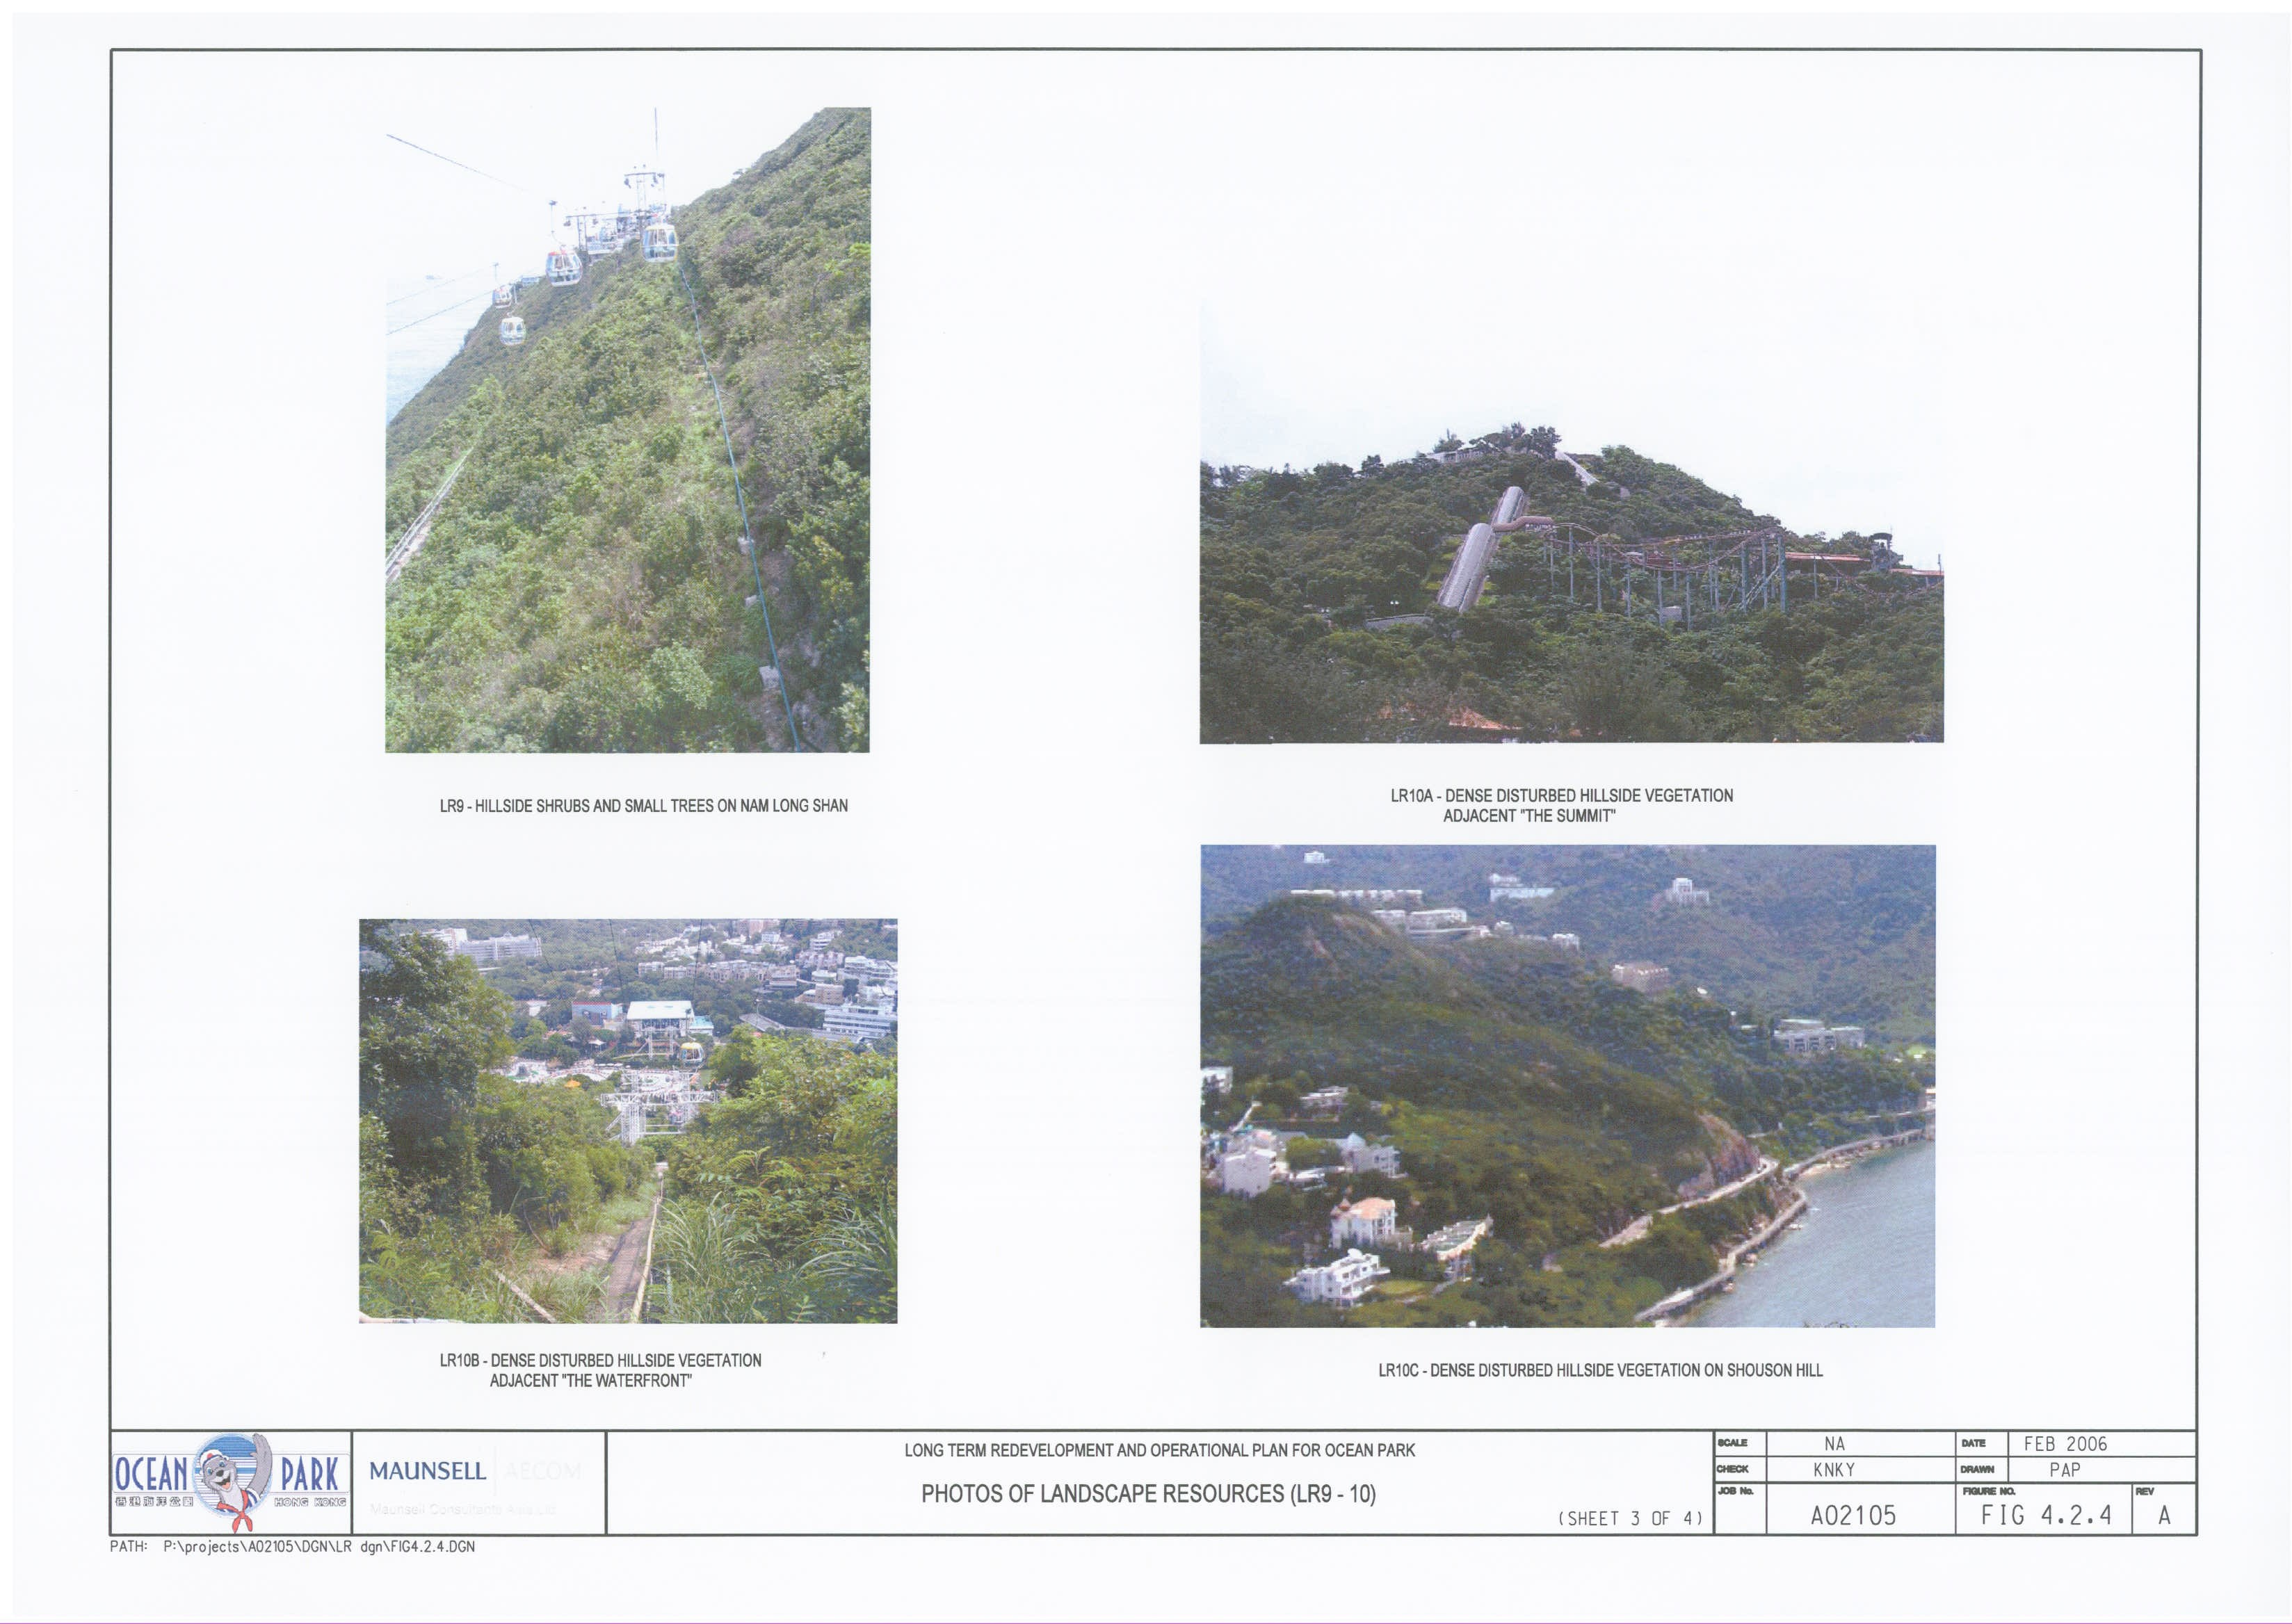
Figure
4.2.5 Photo of Landscape
Resources (LR11 - 14) – Sheet 4 of 4
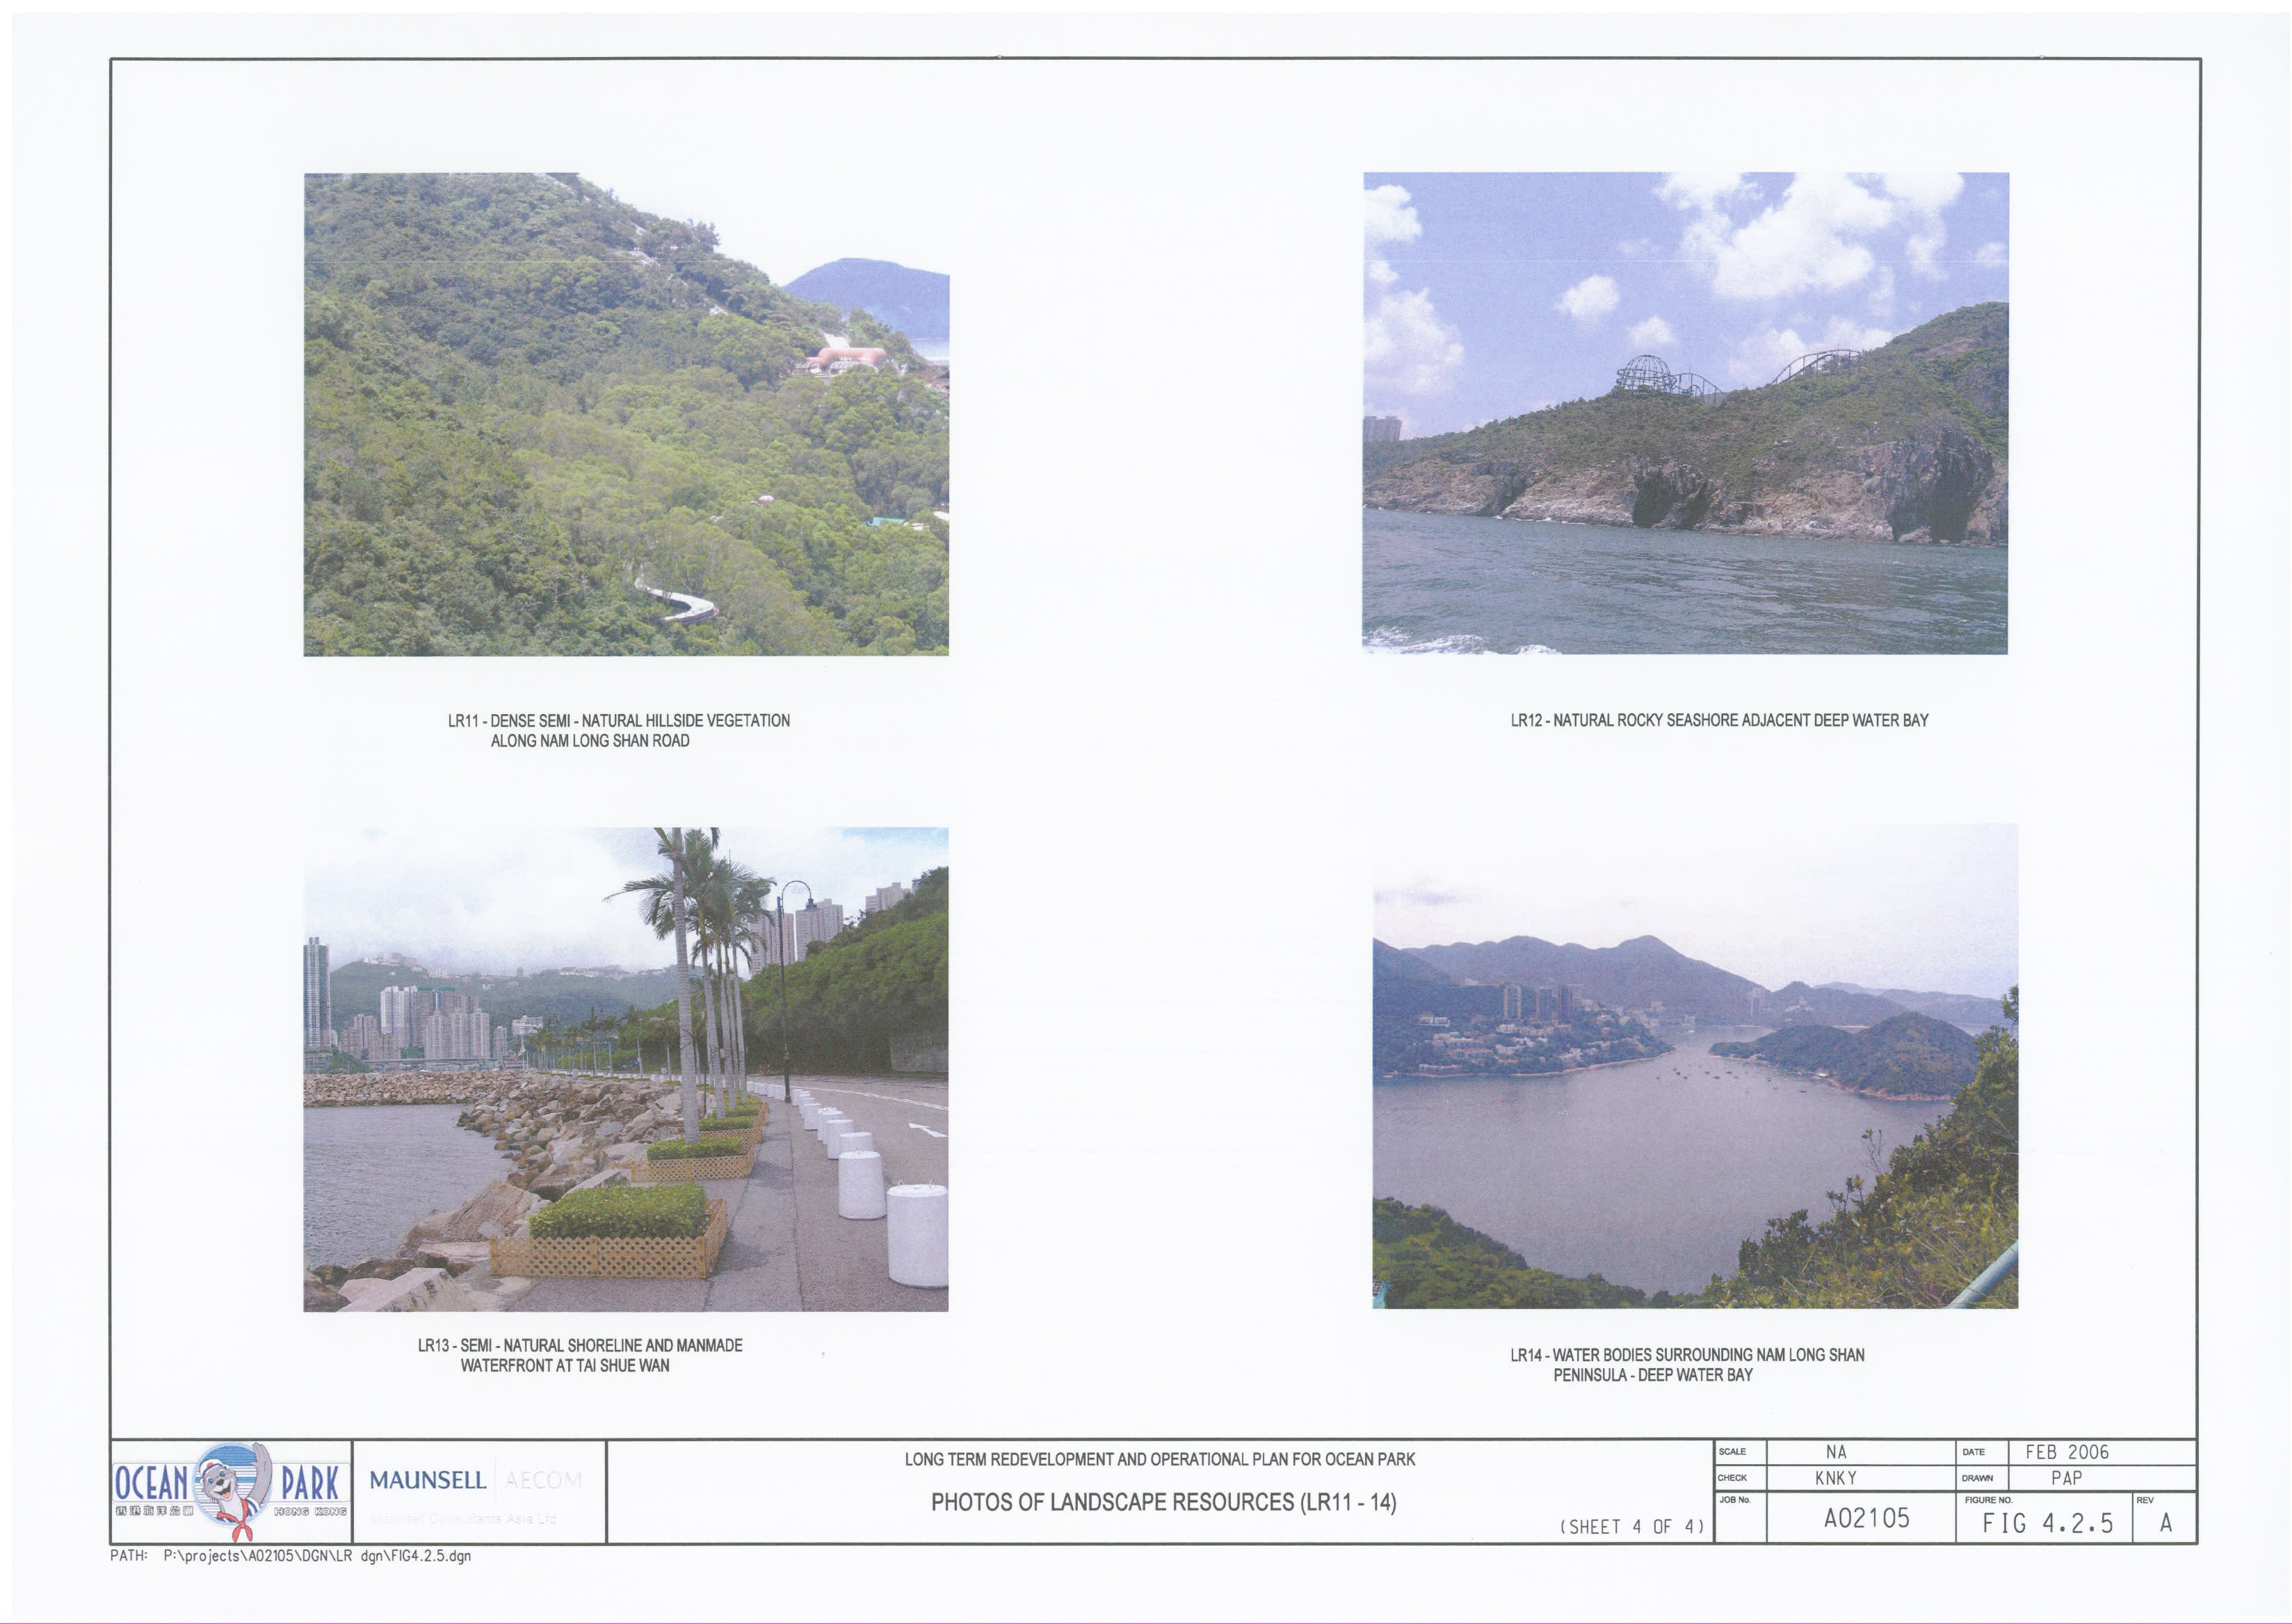
Figure
4.3.1 Landscape
Character Area
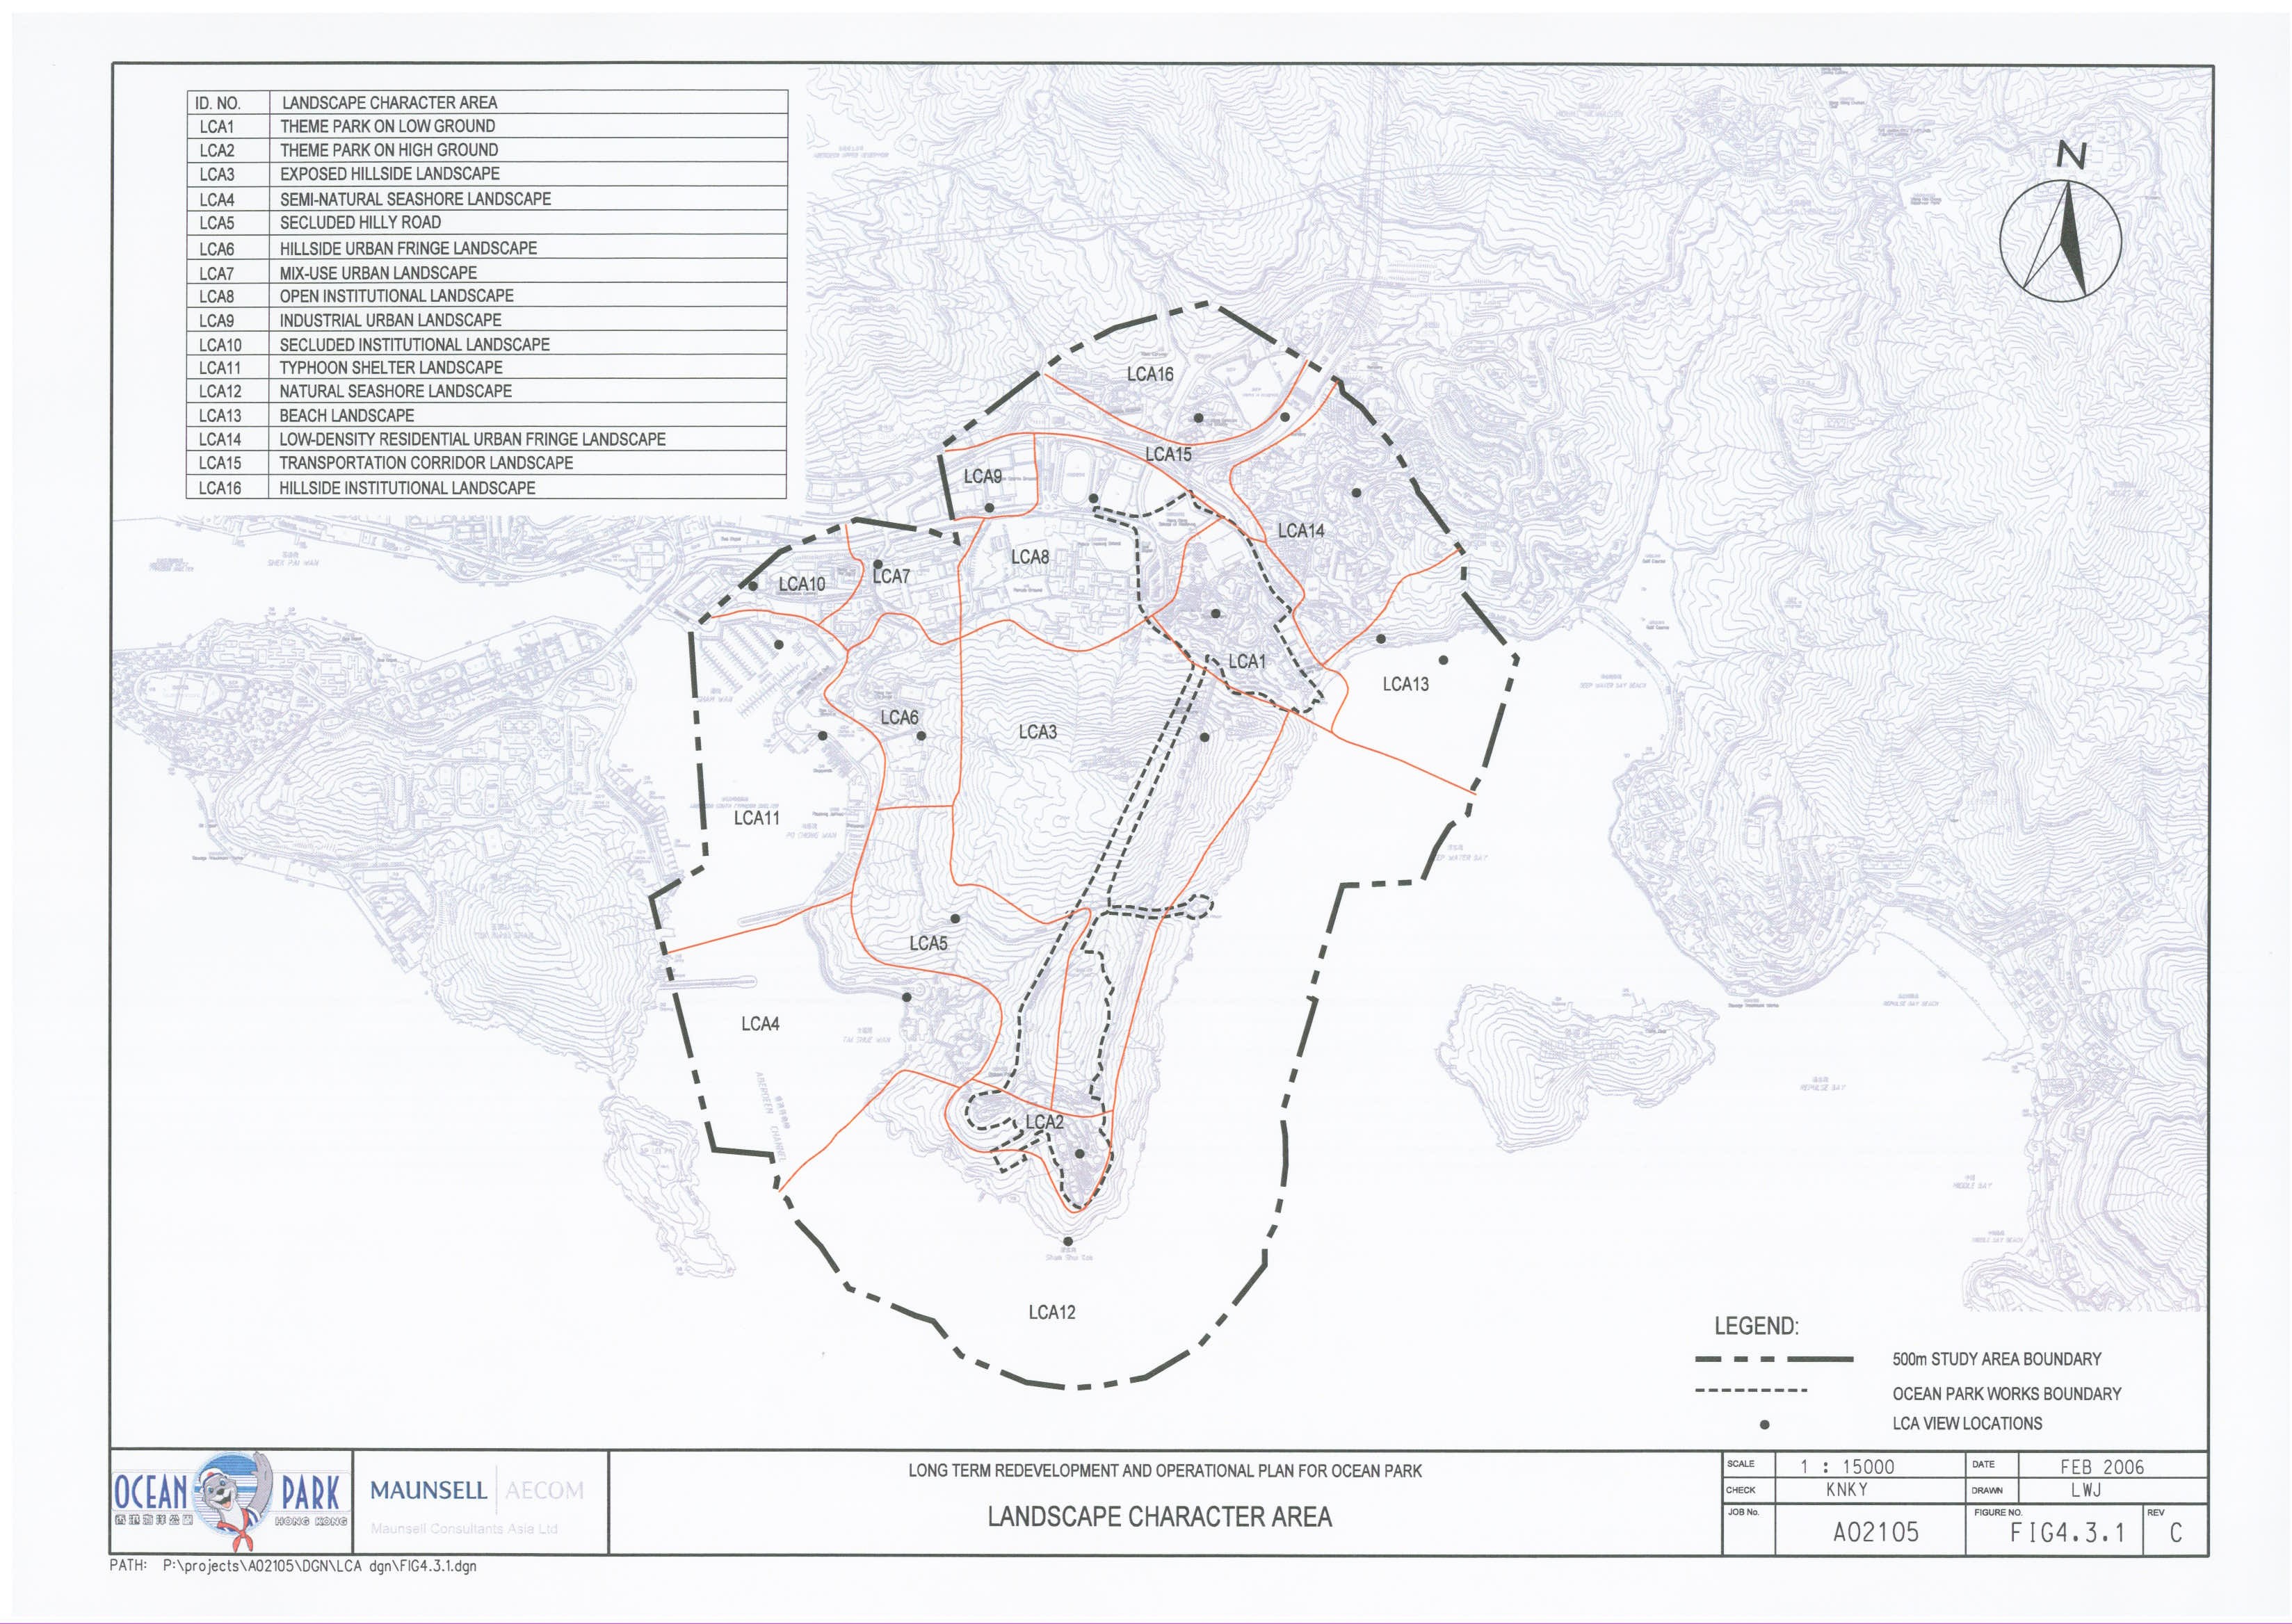
Figure
4.3.2 Photo
of Landscape Character Area (LCA1 - 5) – Sheet 1 of 5
Figure
4.3.3 Photo
of Landscape Character Area (LCA6 - 9) – Sheet 2 of 5
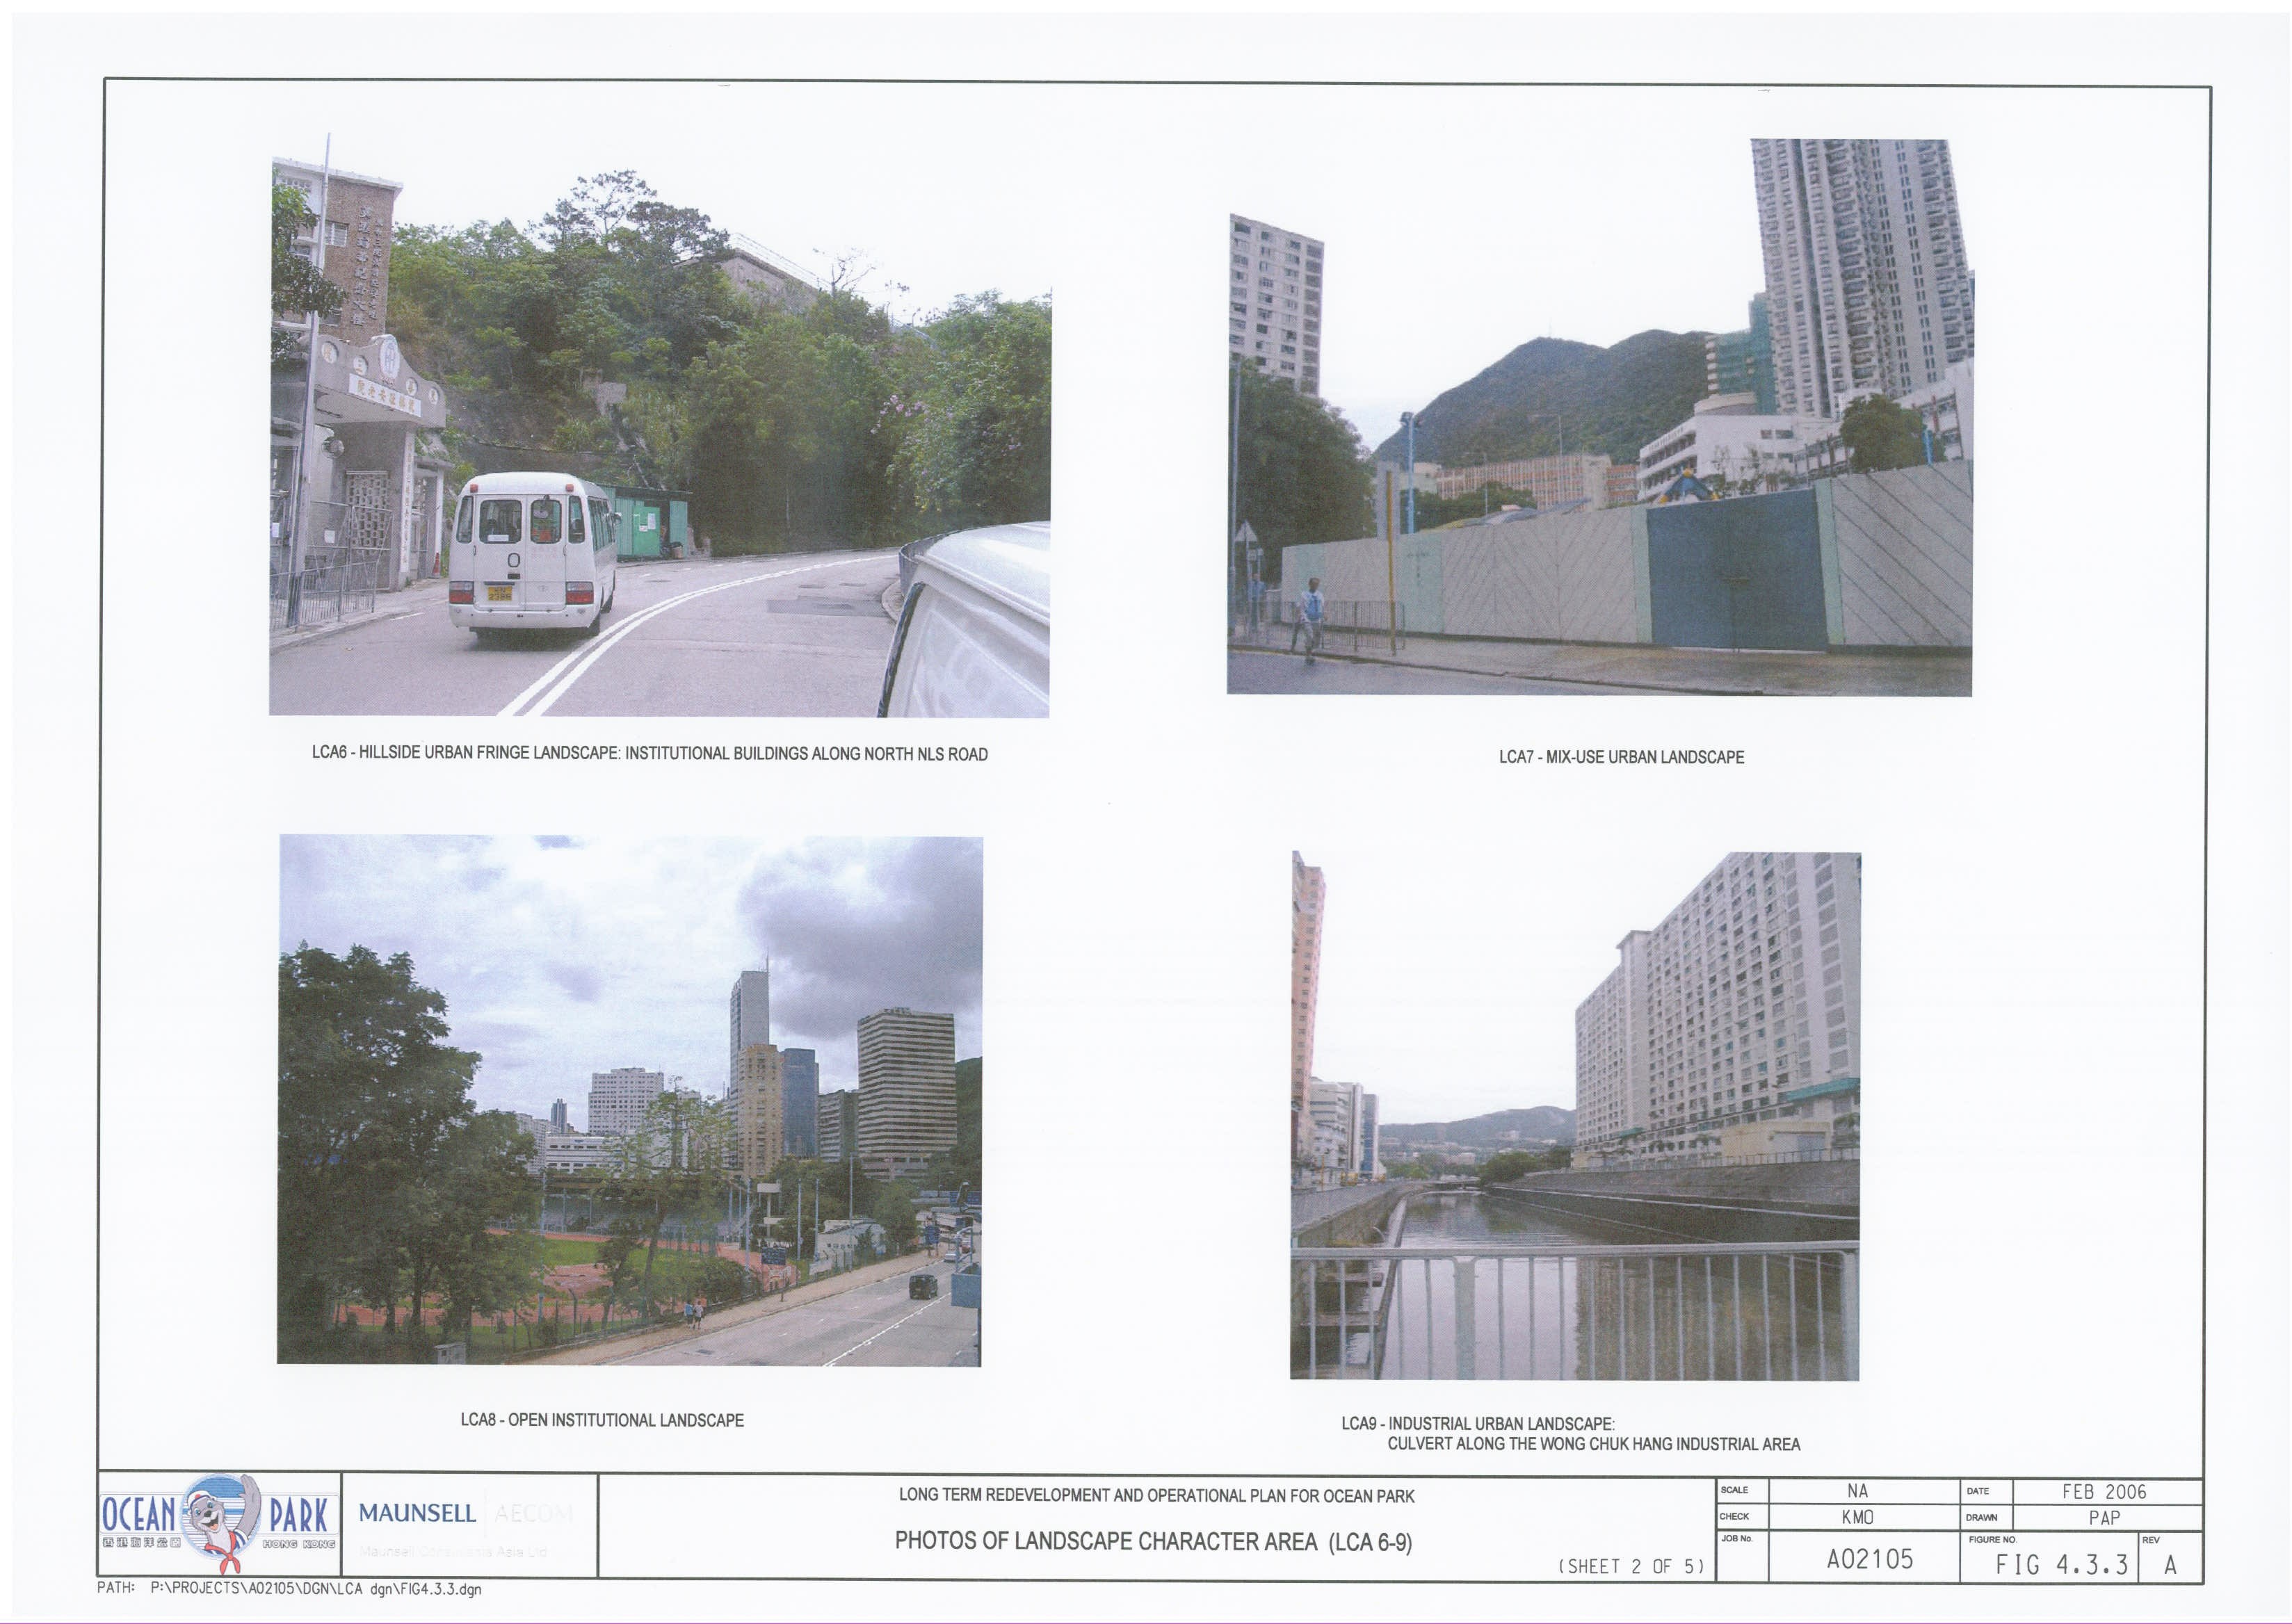
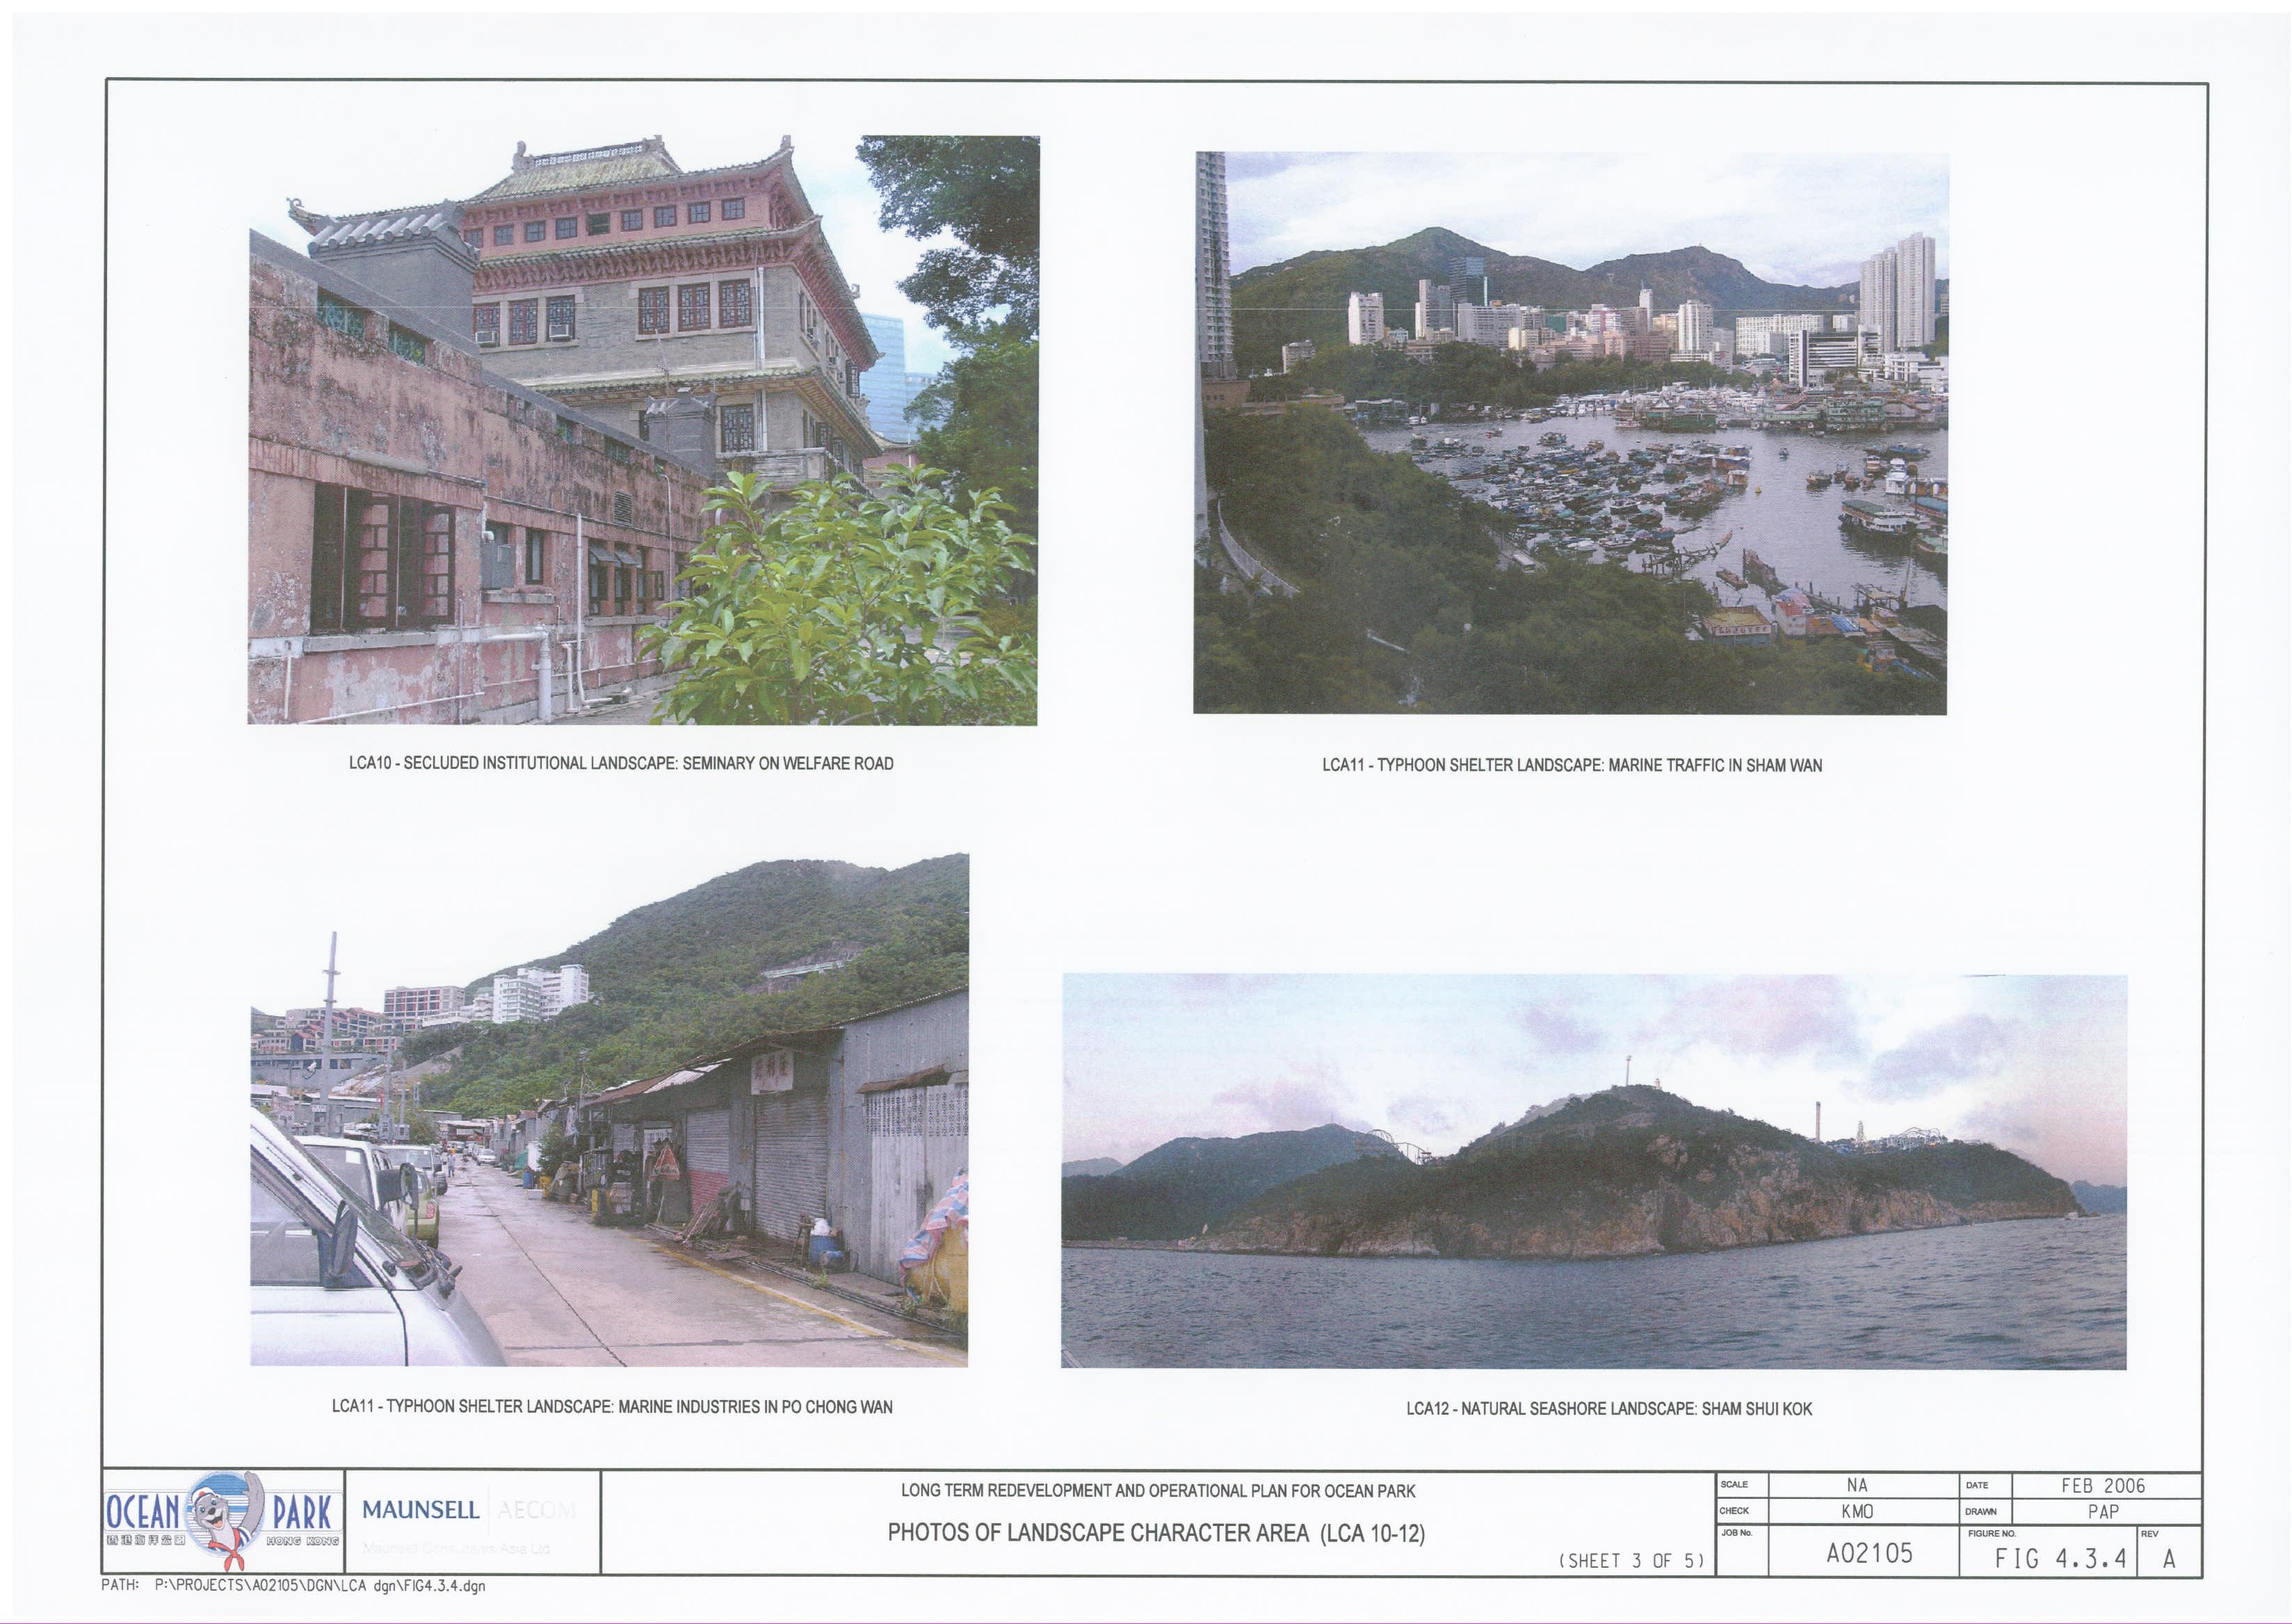
Figure
4.3.4 Photo
of Landscape Character Area (LCA10 - 12) – Sheet 3 of 5
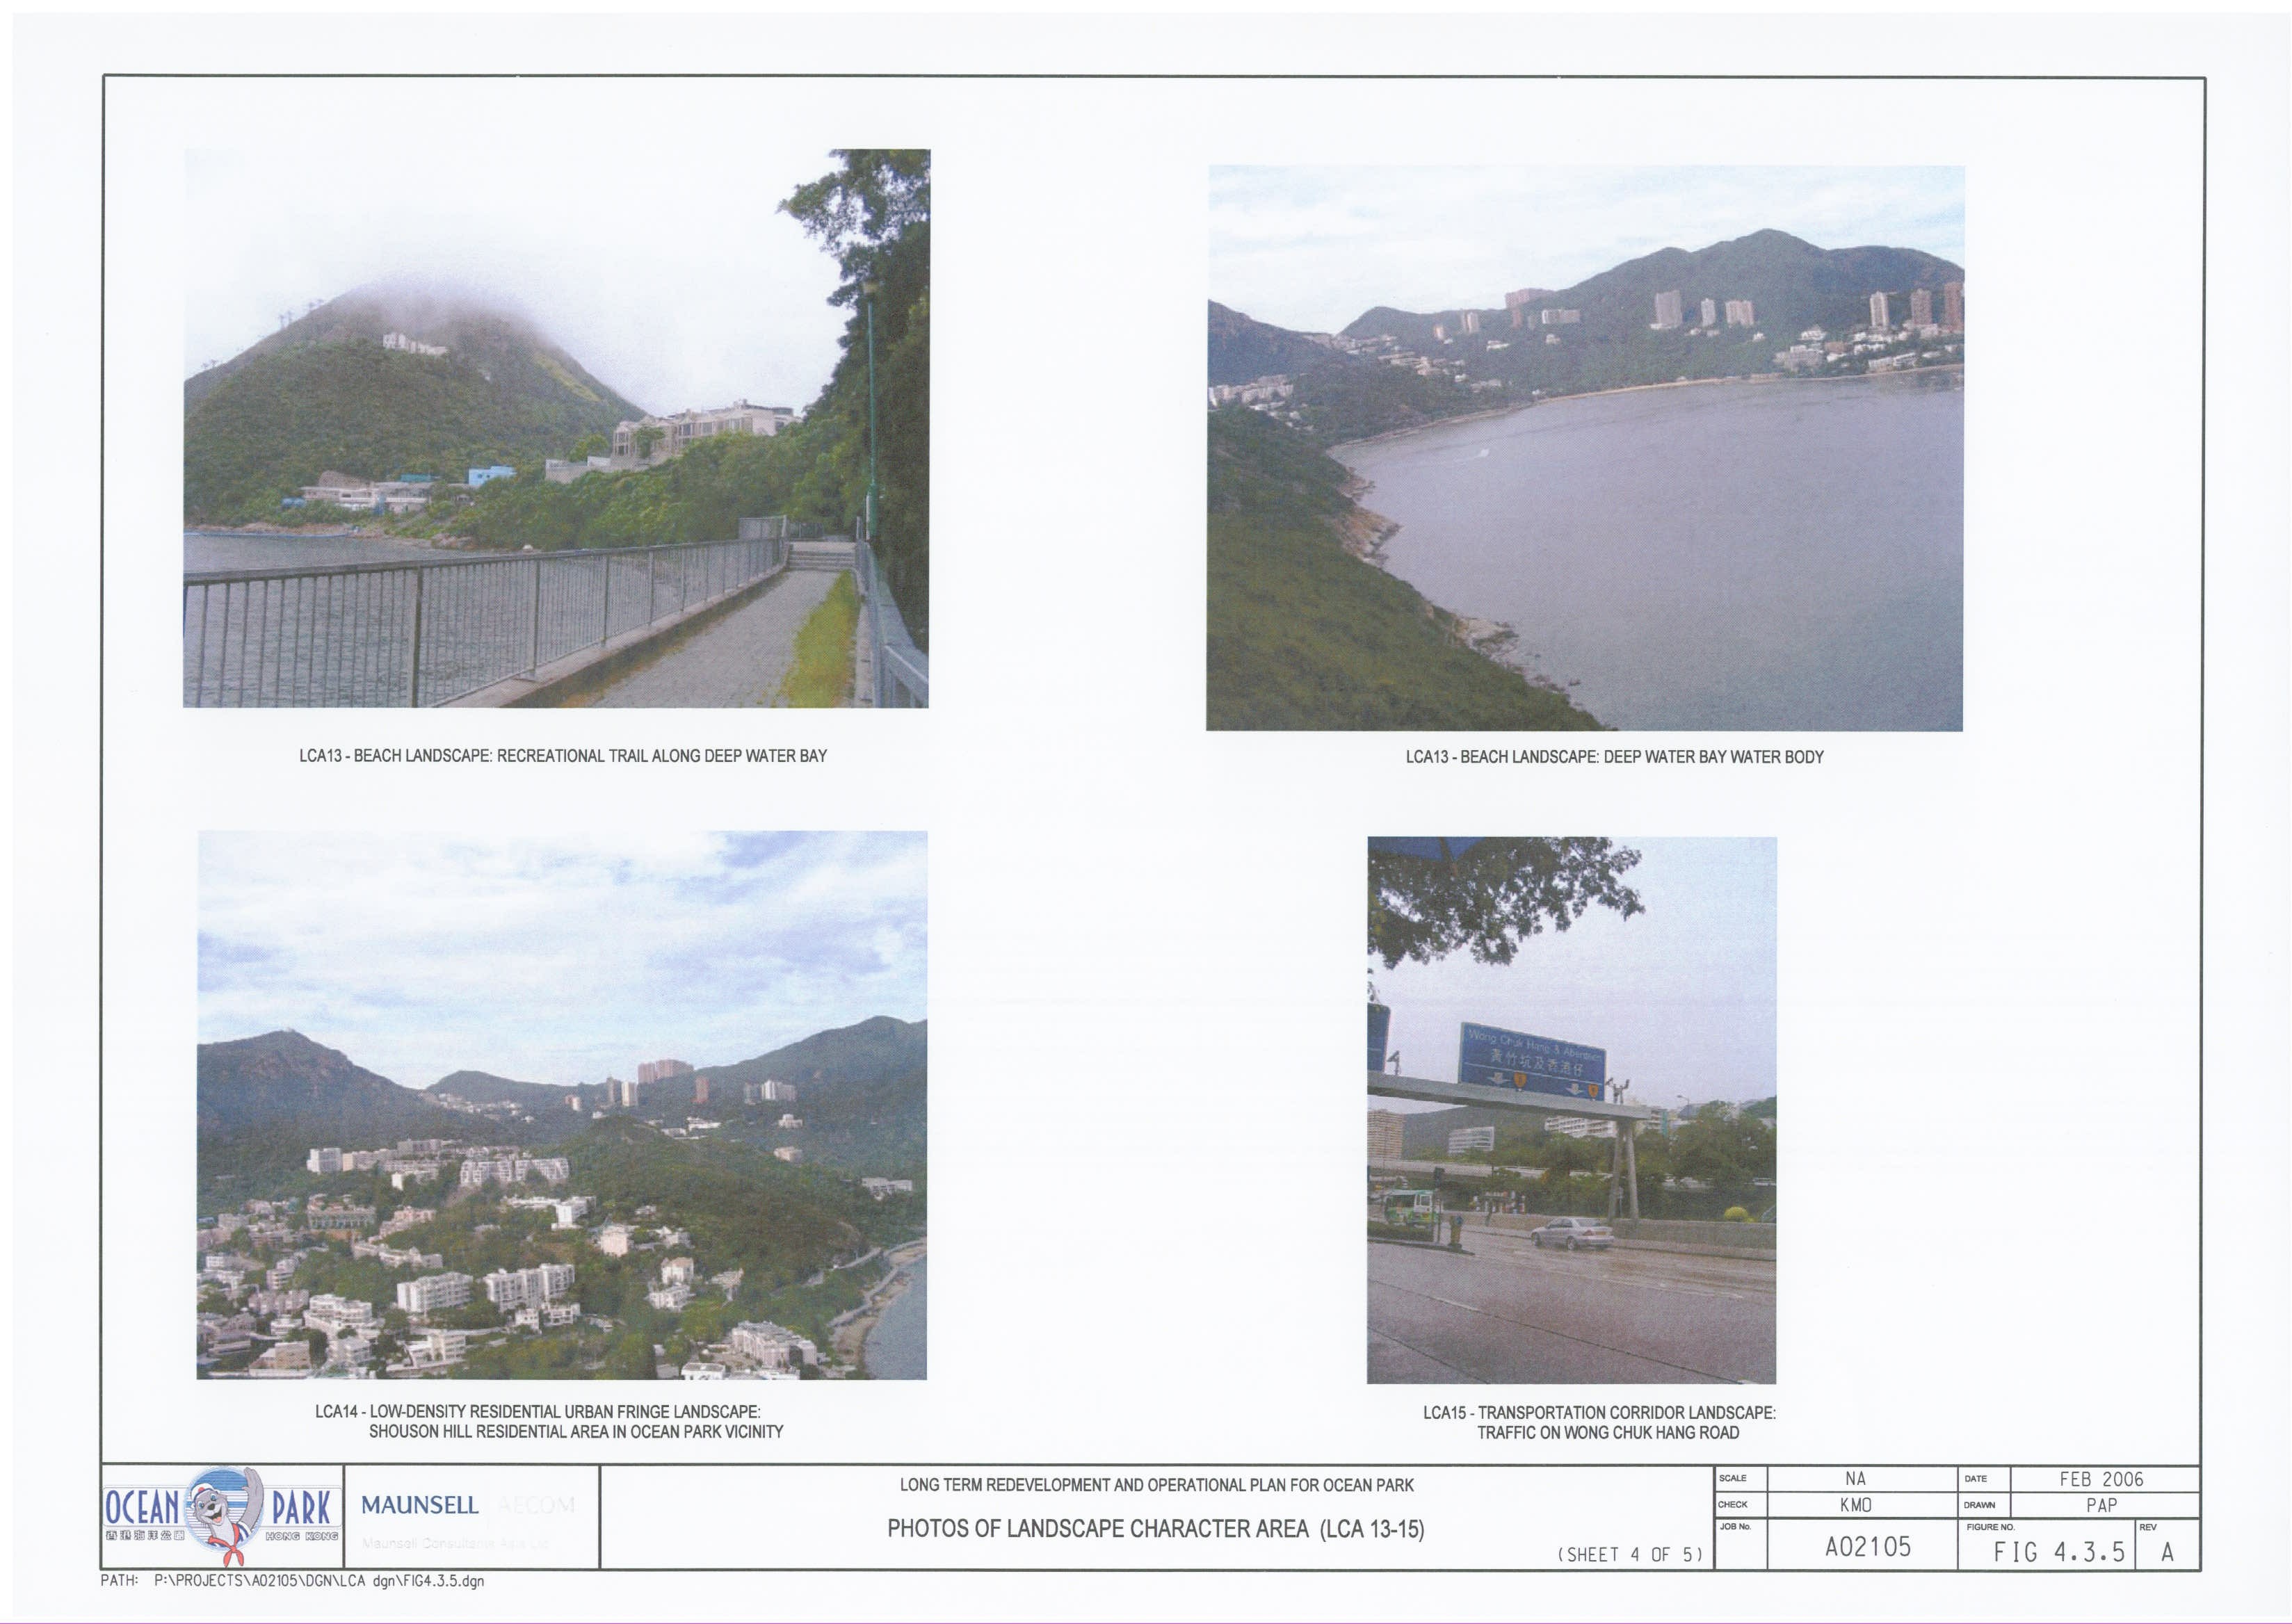
Figure
4.3.5 Photo
of Landscape Character Area (LCA13 - 15) – Sheet 4 of 5
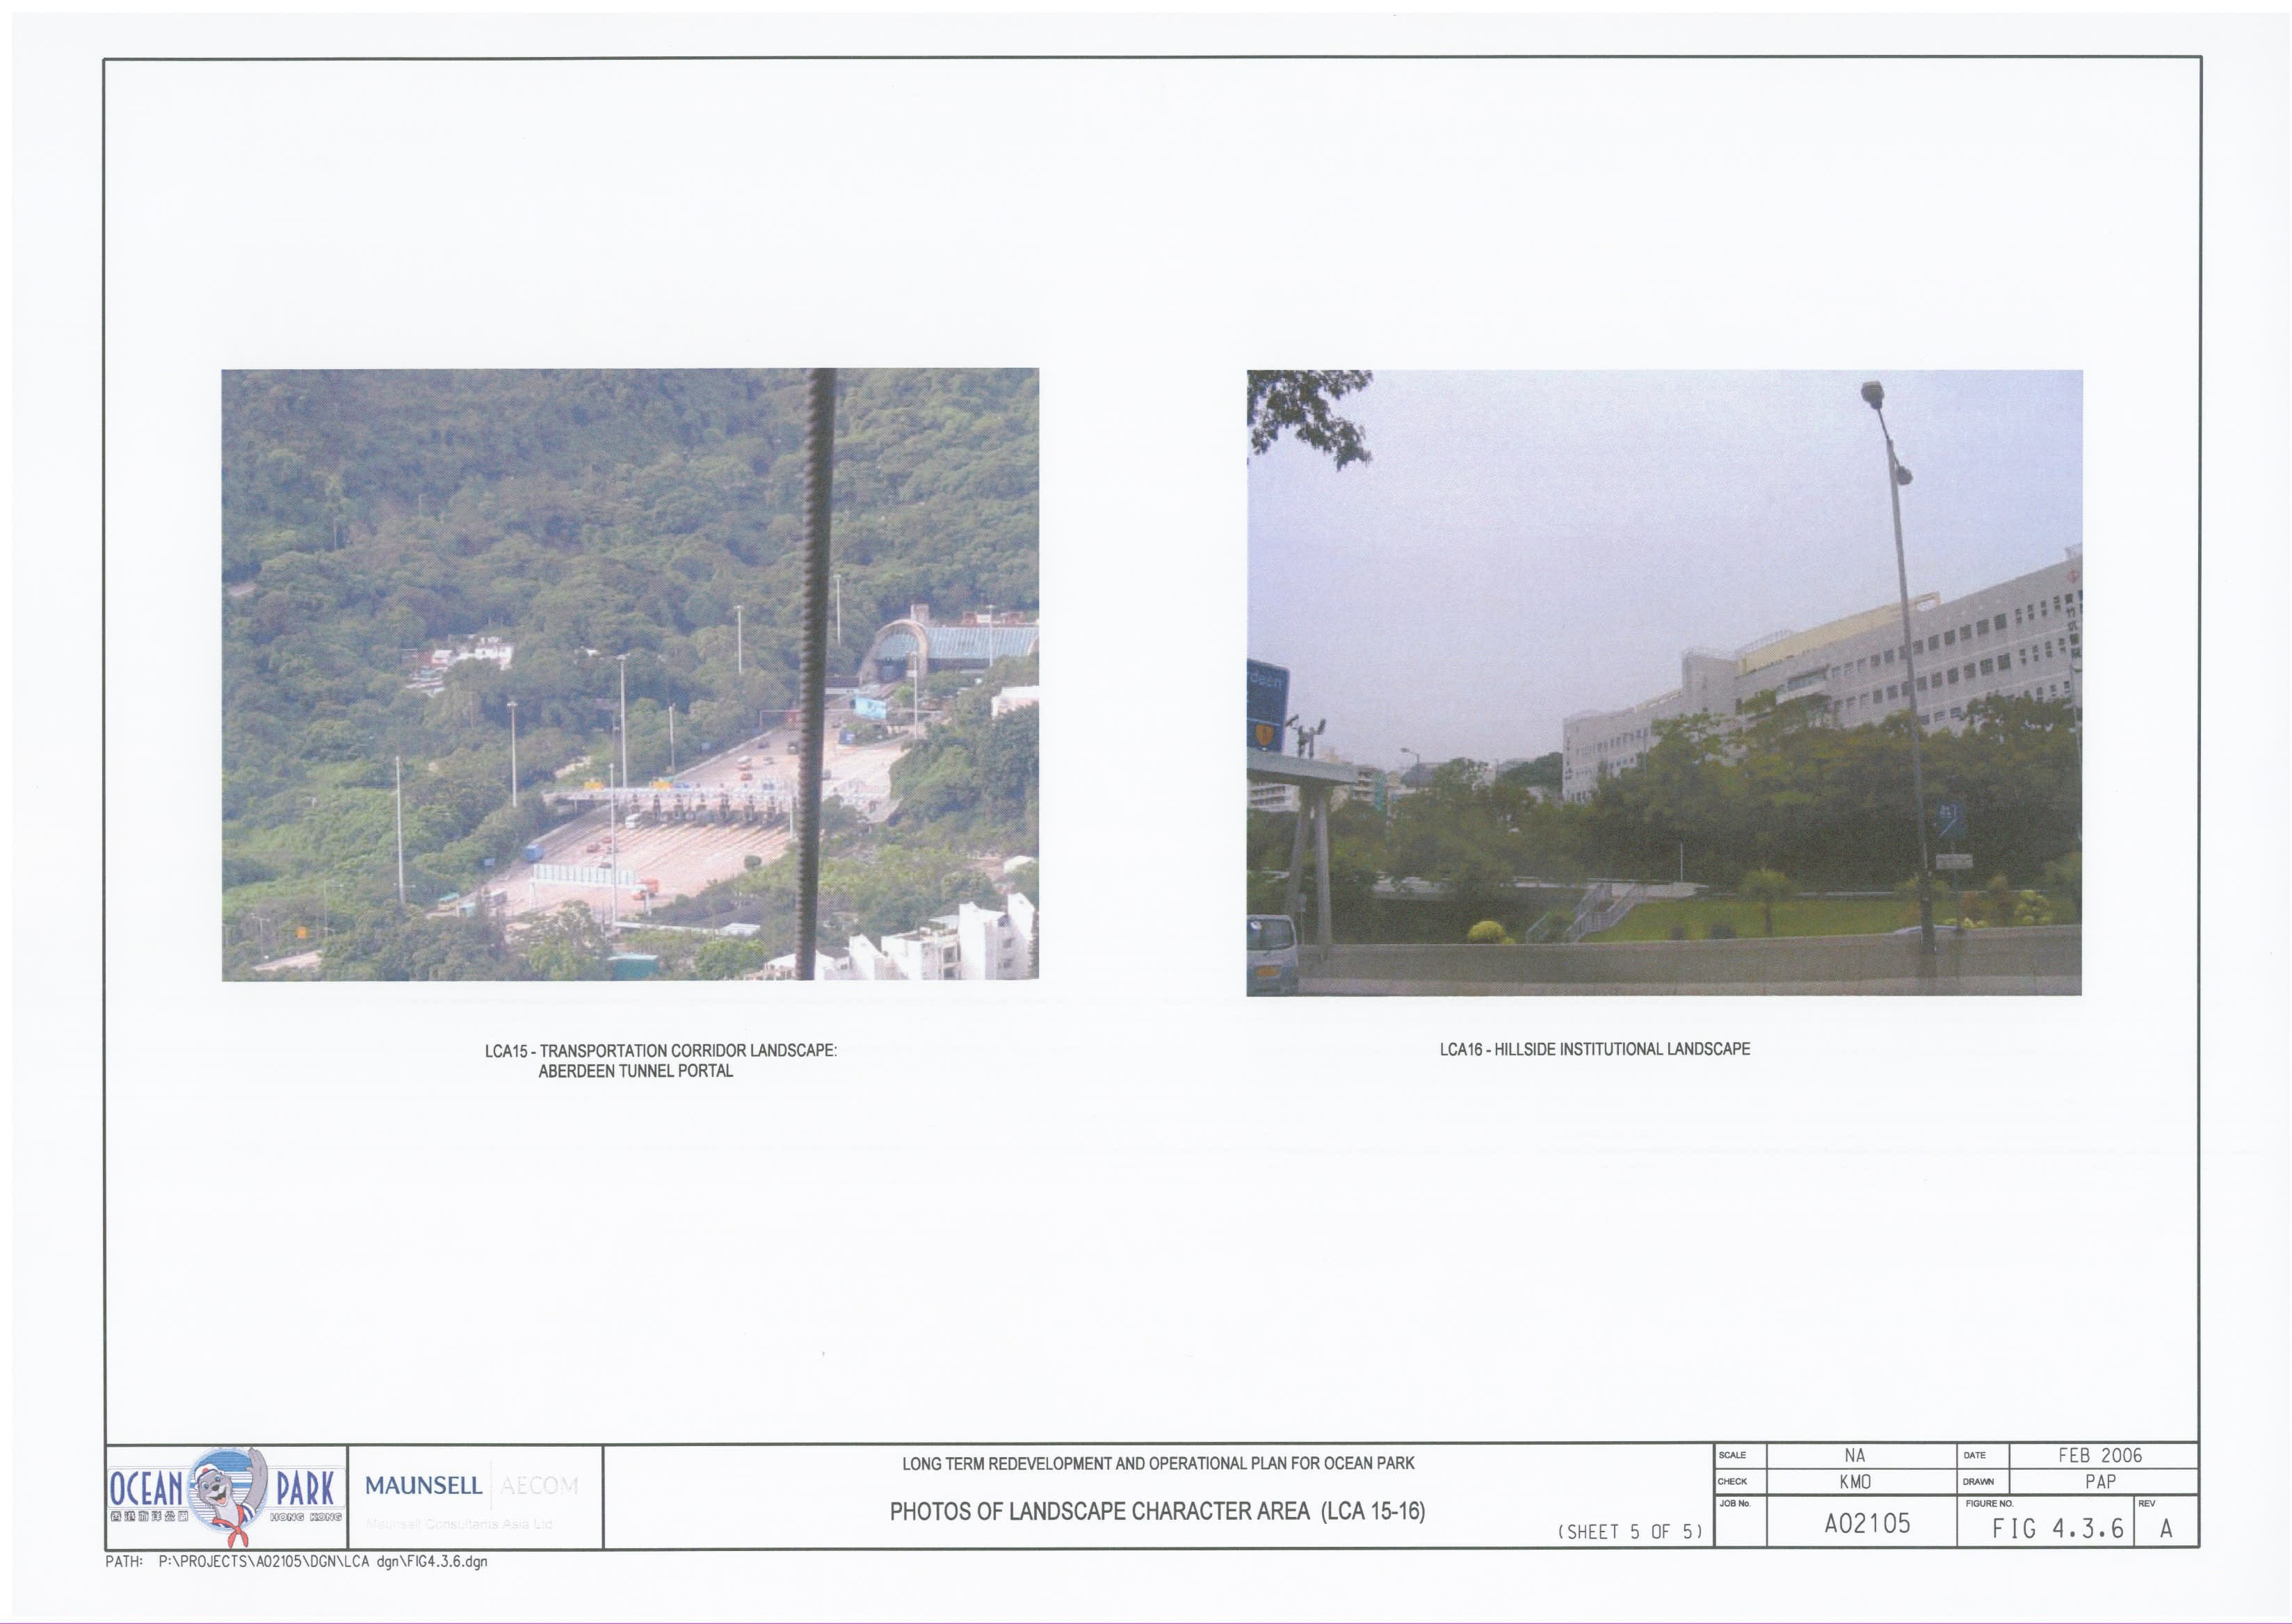
Figure
4.3.6 Photo
of Landscape Character Area (LCA15 - 16) – Sheet 5 of 5
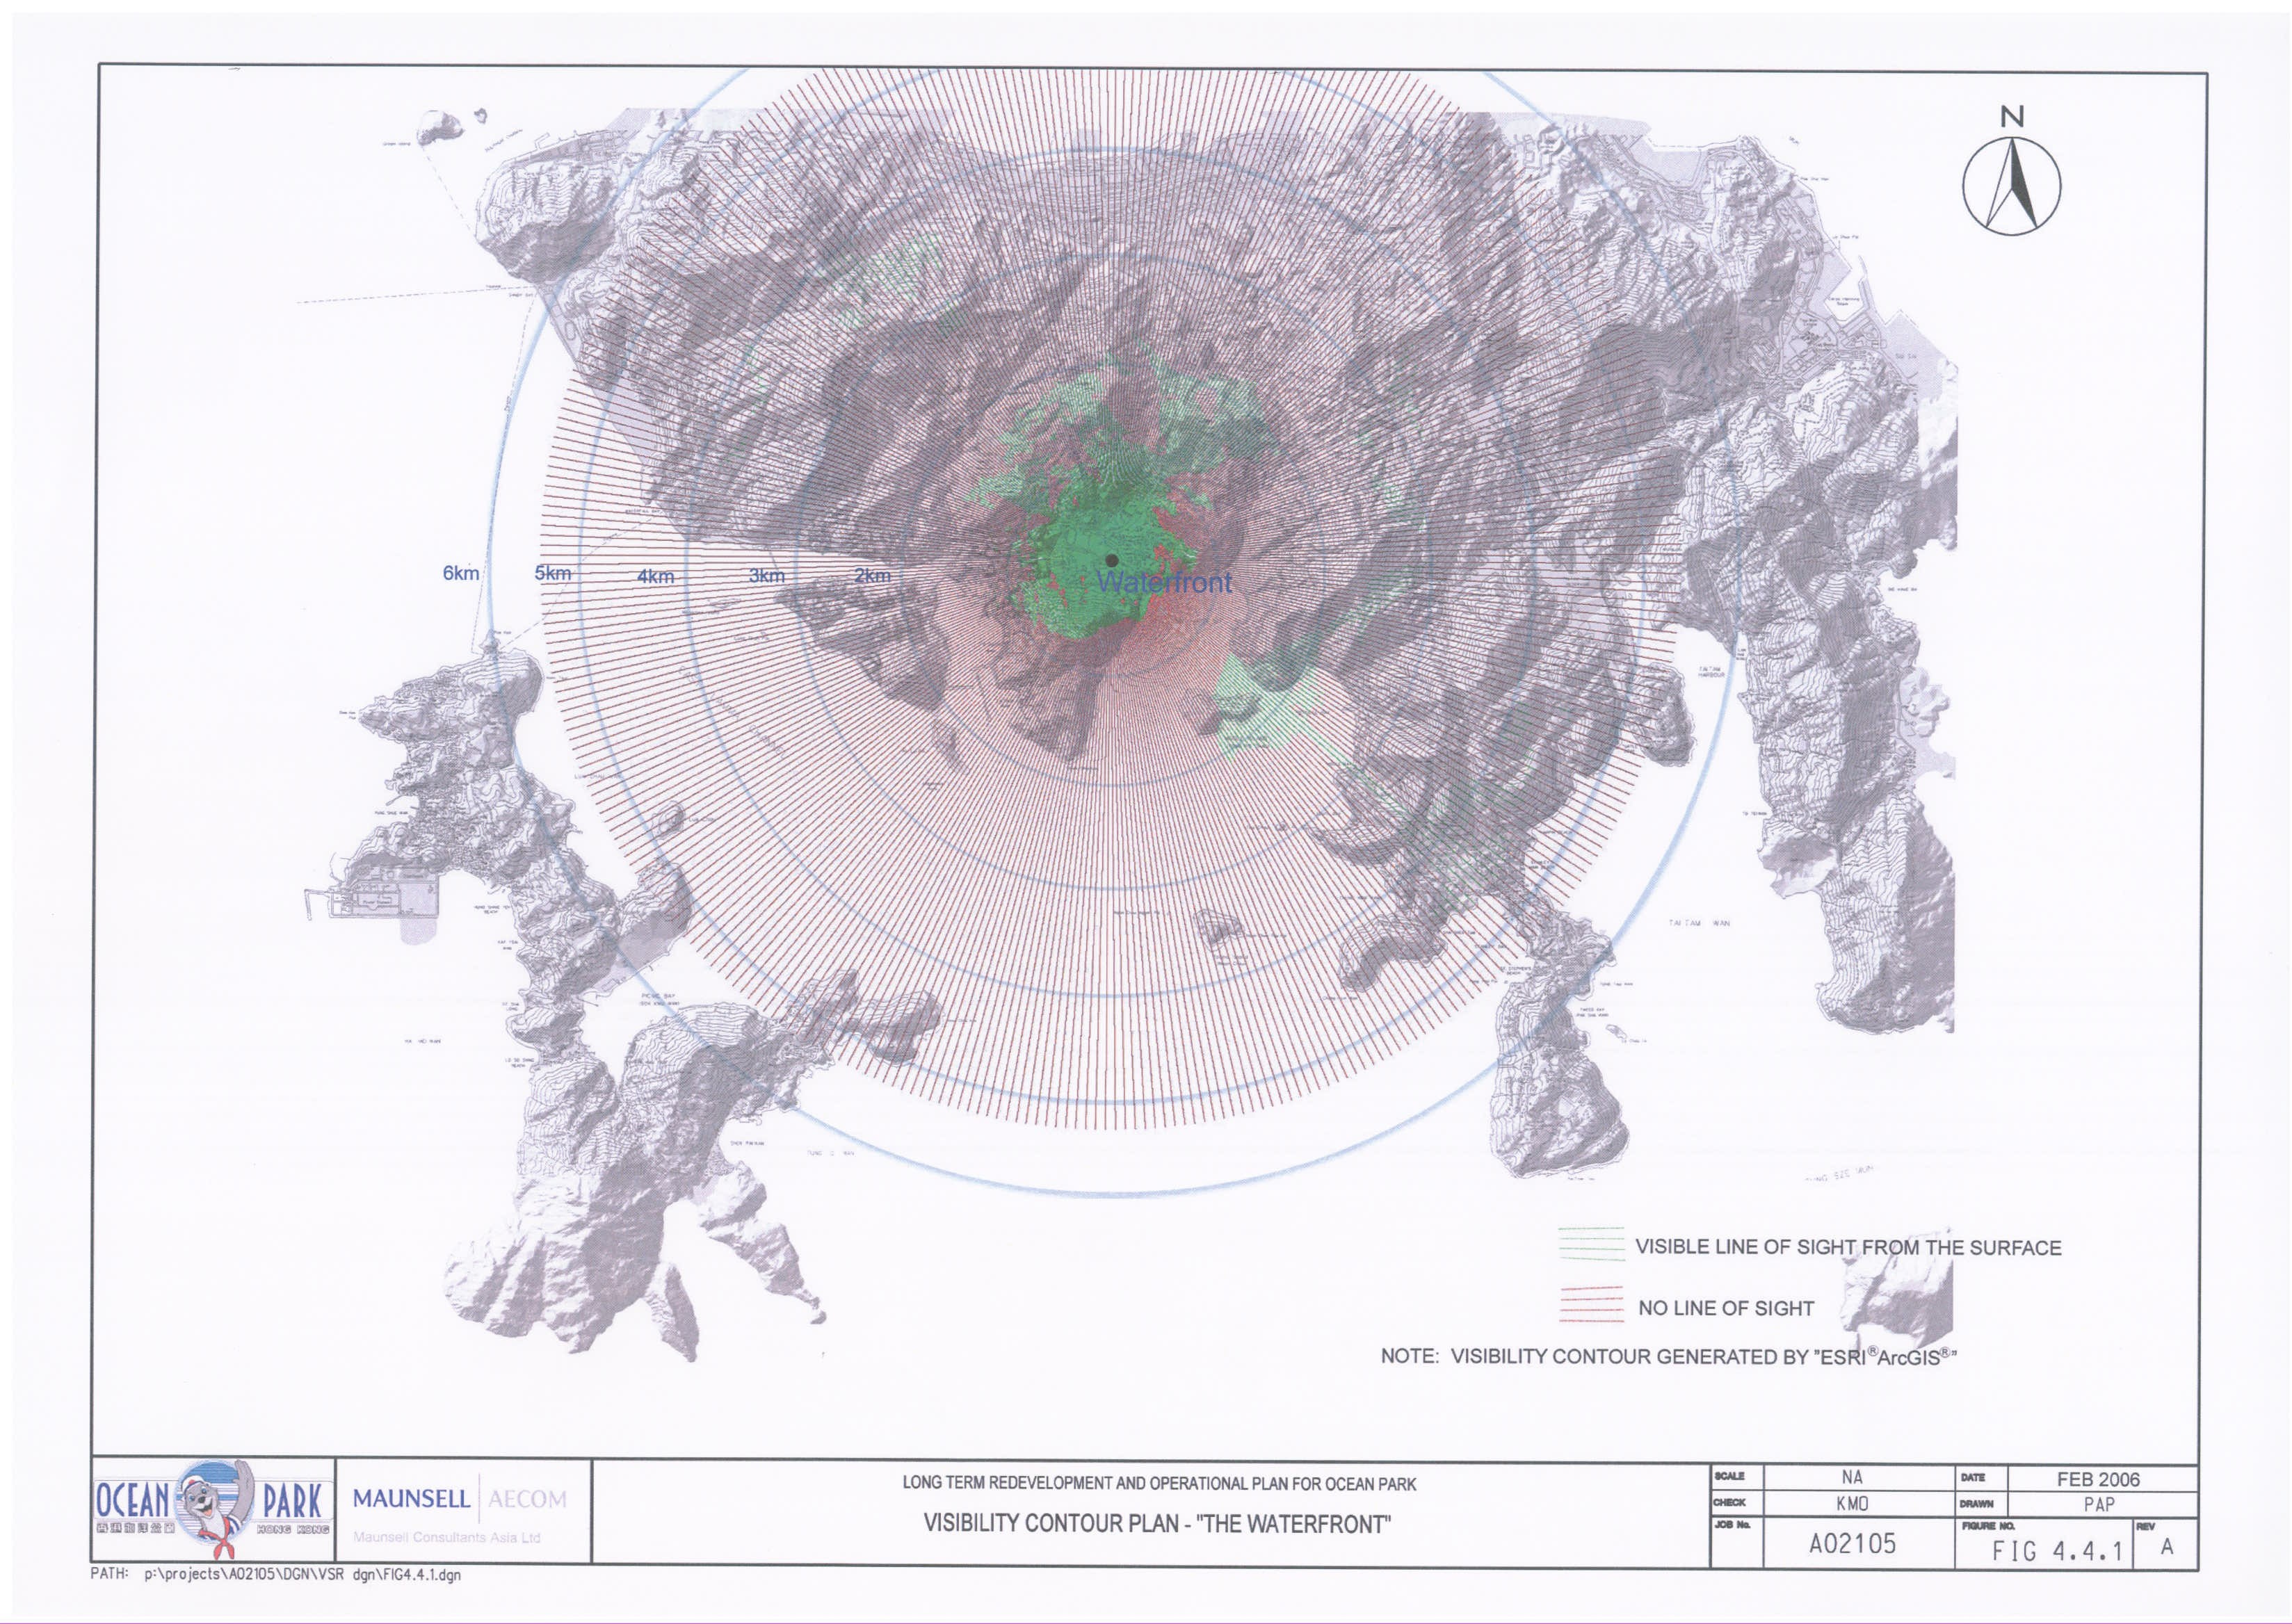
Figure
4.4.1 Visibility
Contour Plan – “The Waterfront”
Figure
4.4.2 Visibility
Contour Plan – “The Summit”
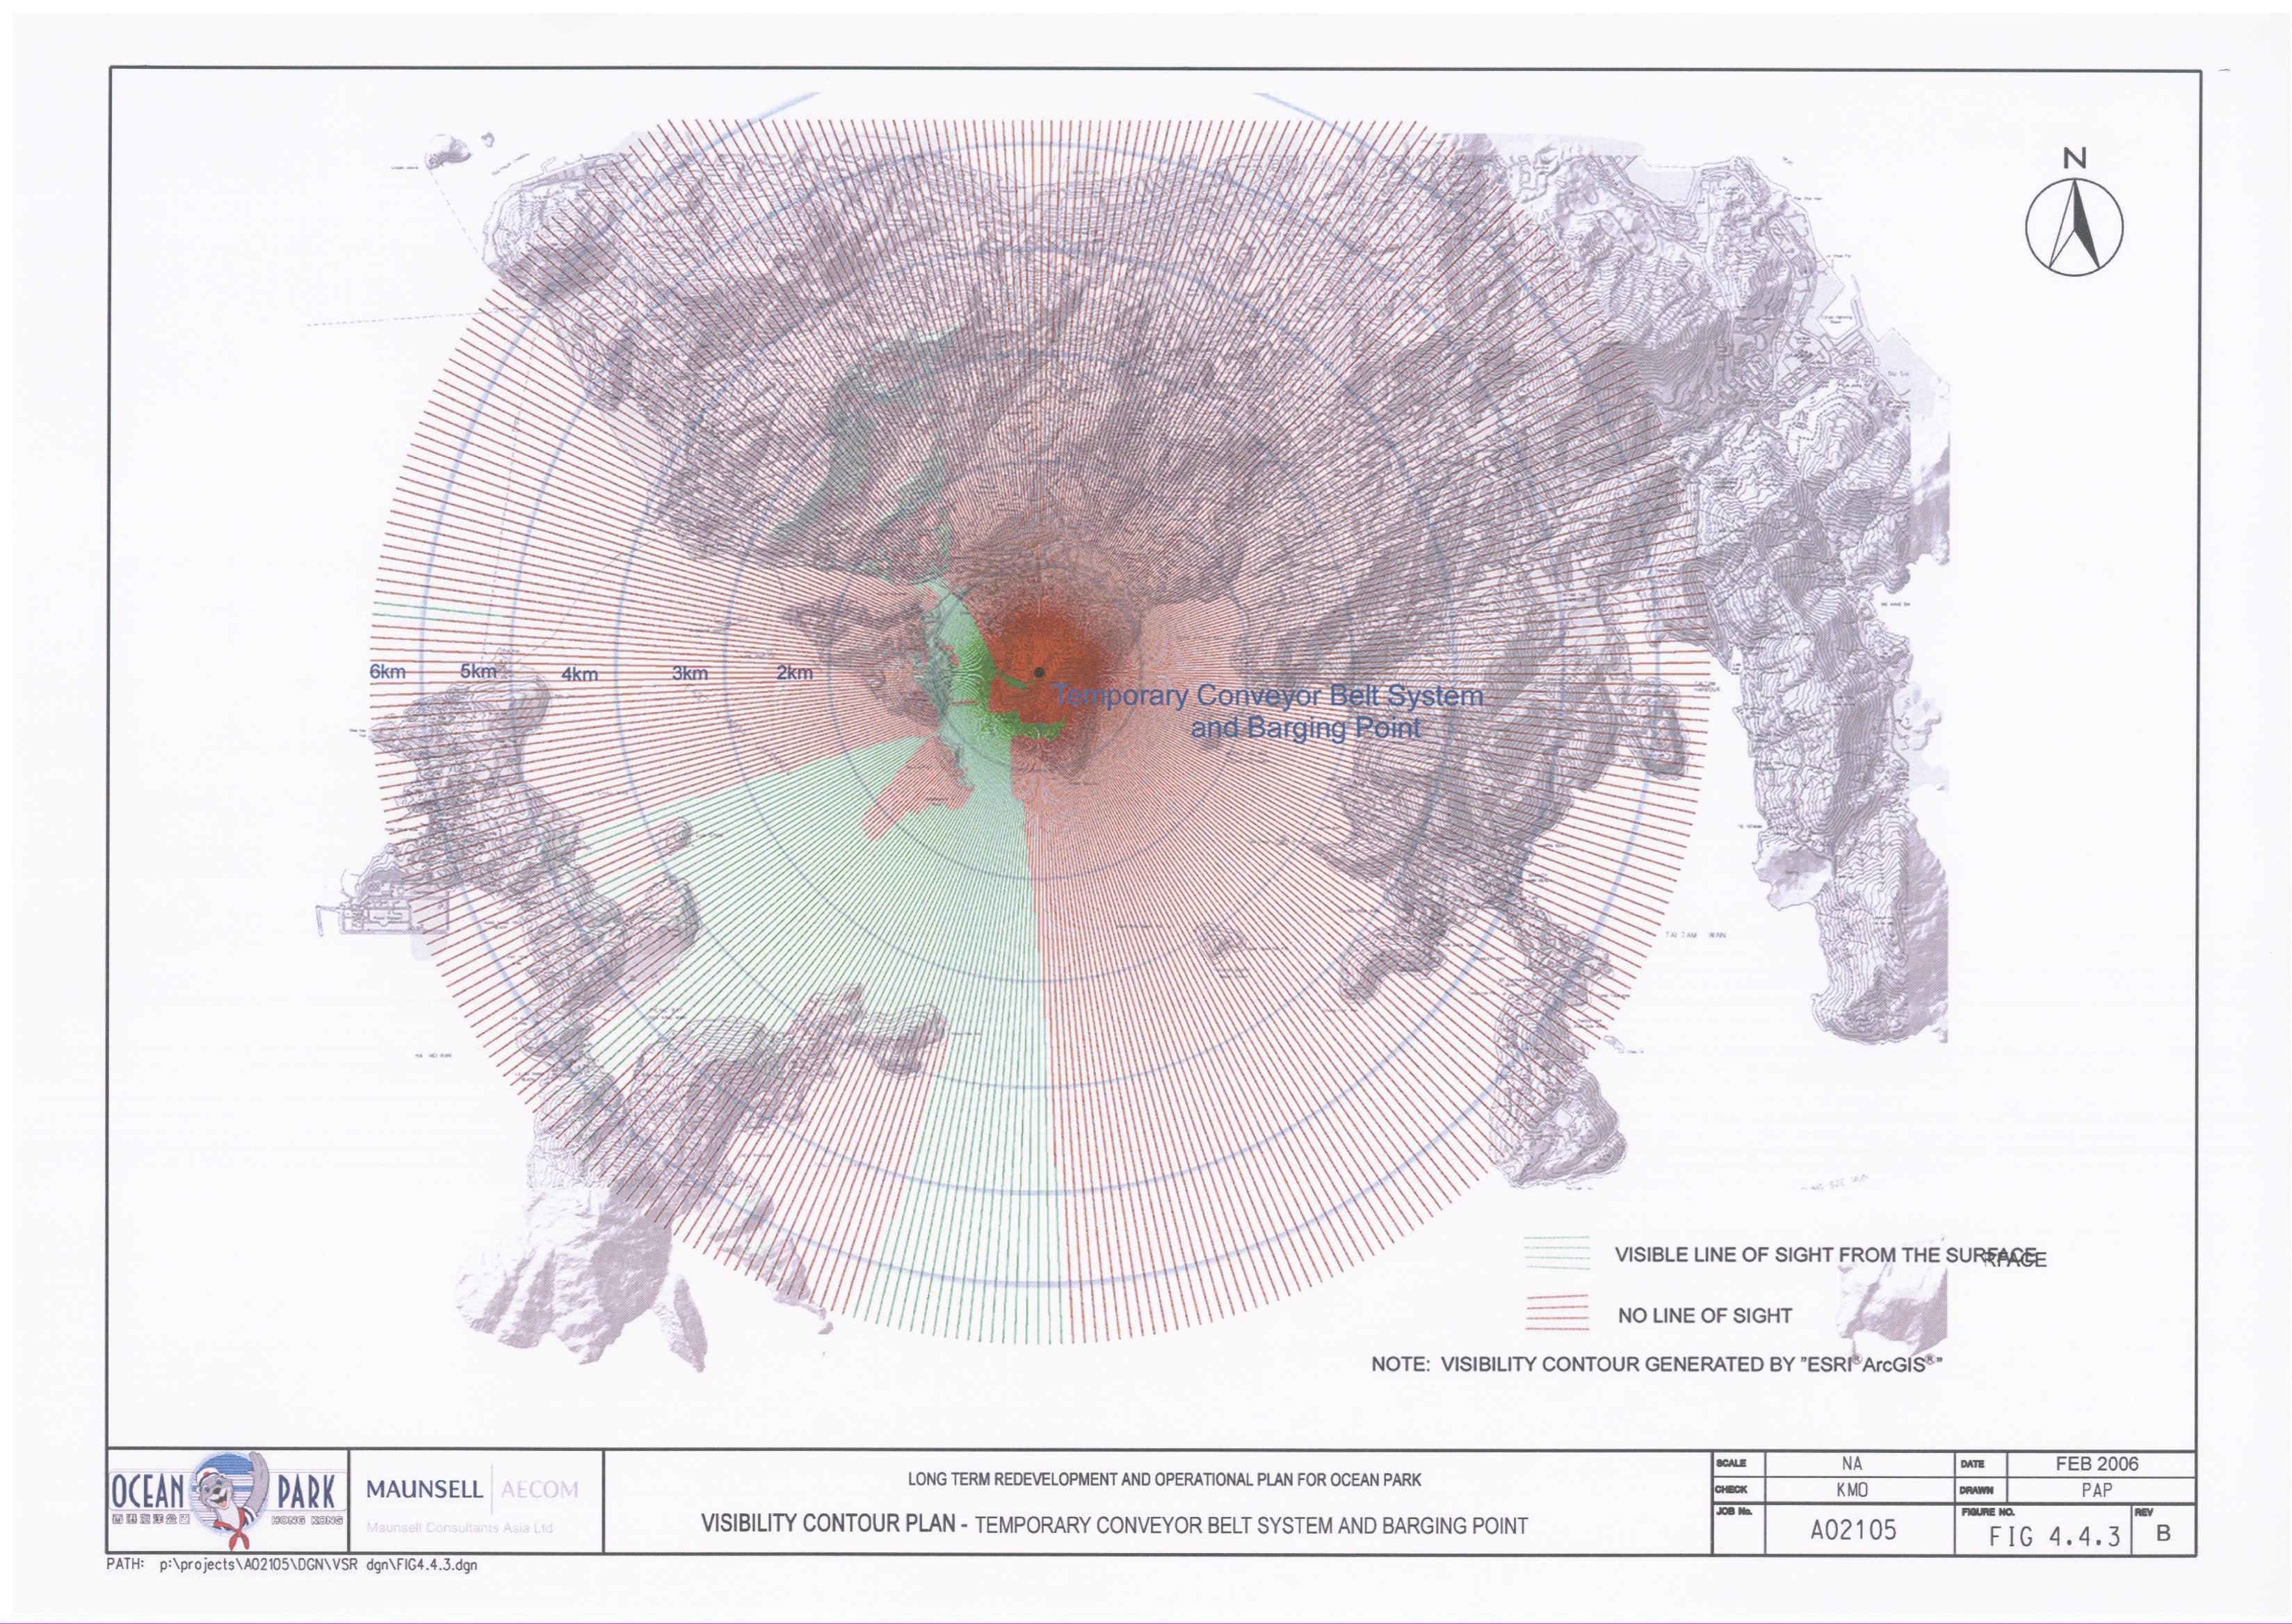
Figure
4.4.3 Visibility
Contour Plan – Funicular Train
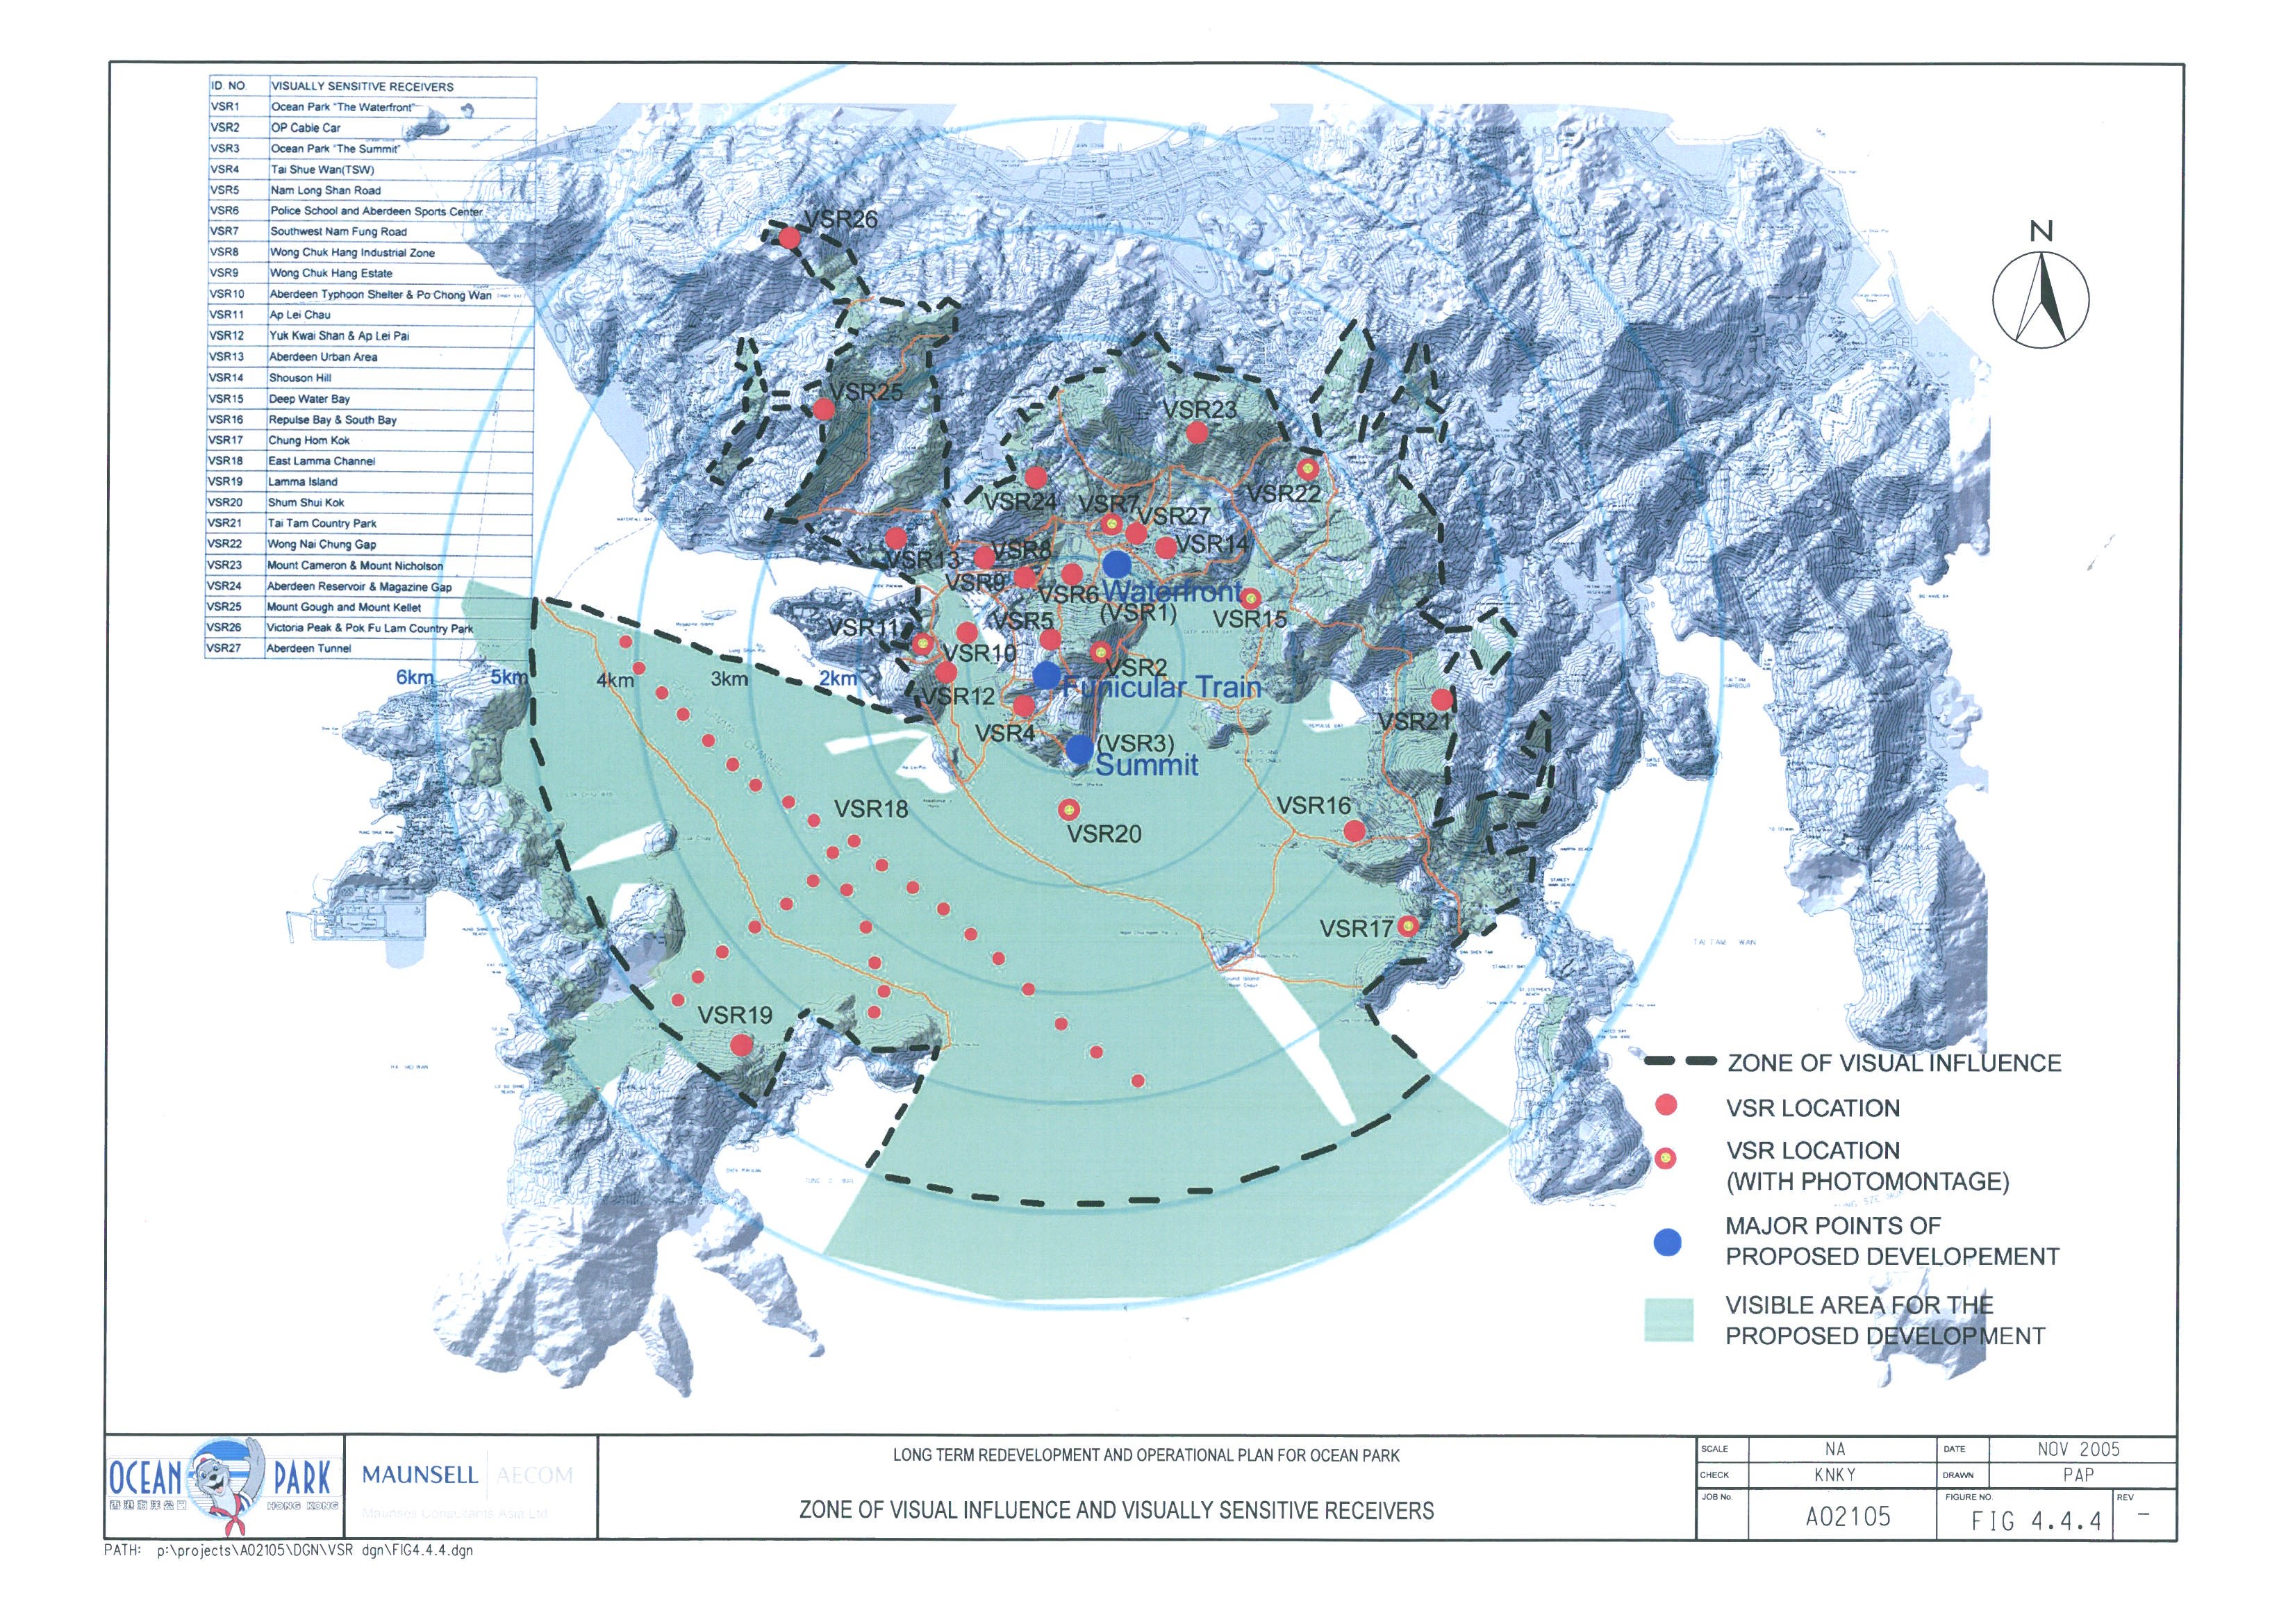
Figure
4.4.4 Zone
of Visual Influence for Visual Sensitive Receivers
Figure
4.4.5 Photo
of Visual Sensitive Receivers Group (VSR1 - 3) – Sheet 1 of 7
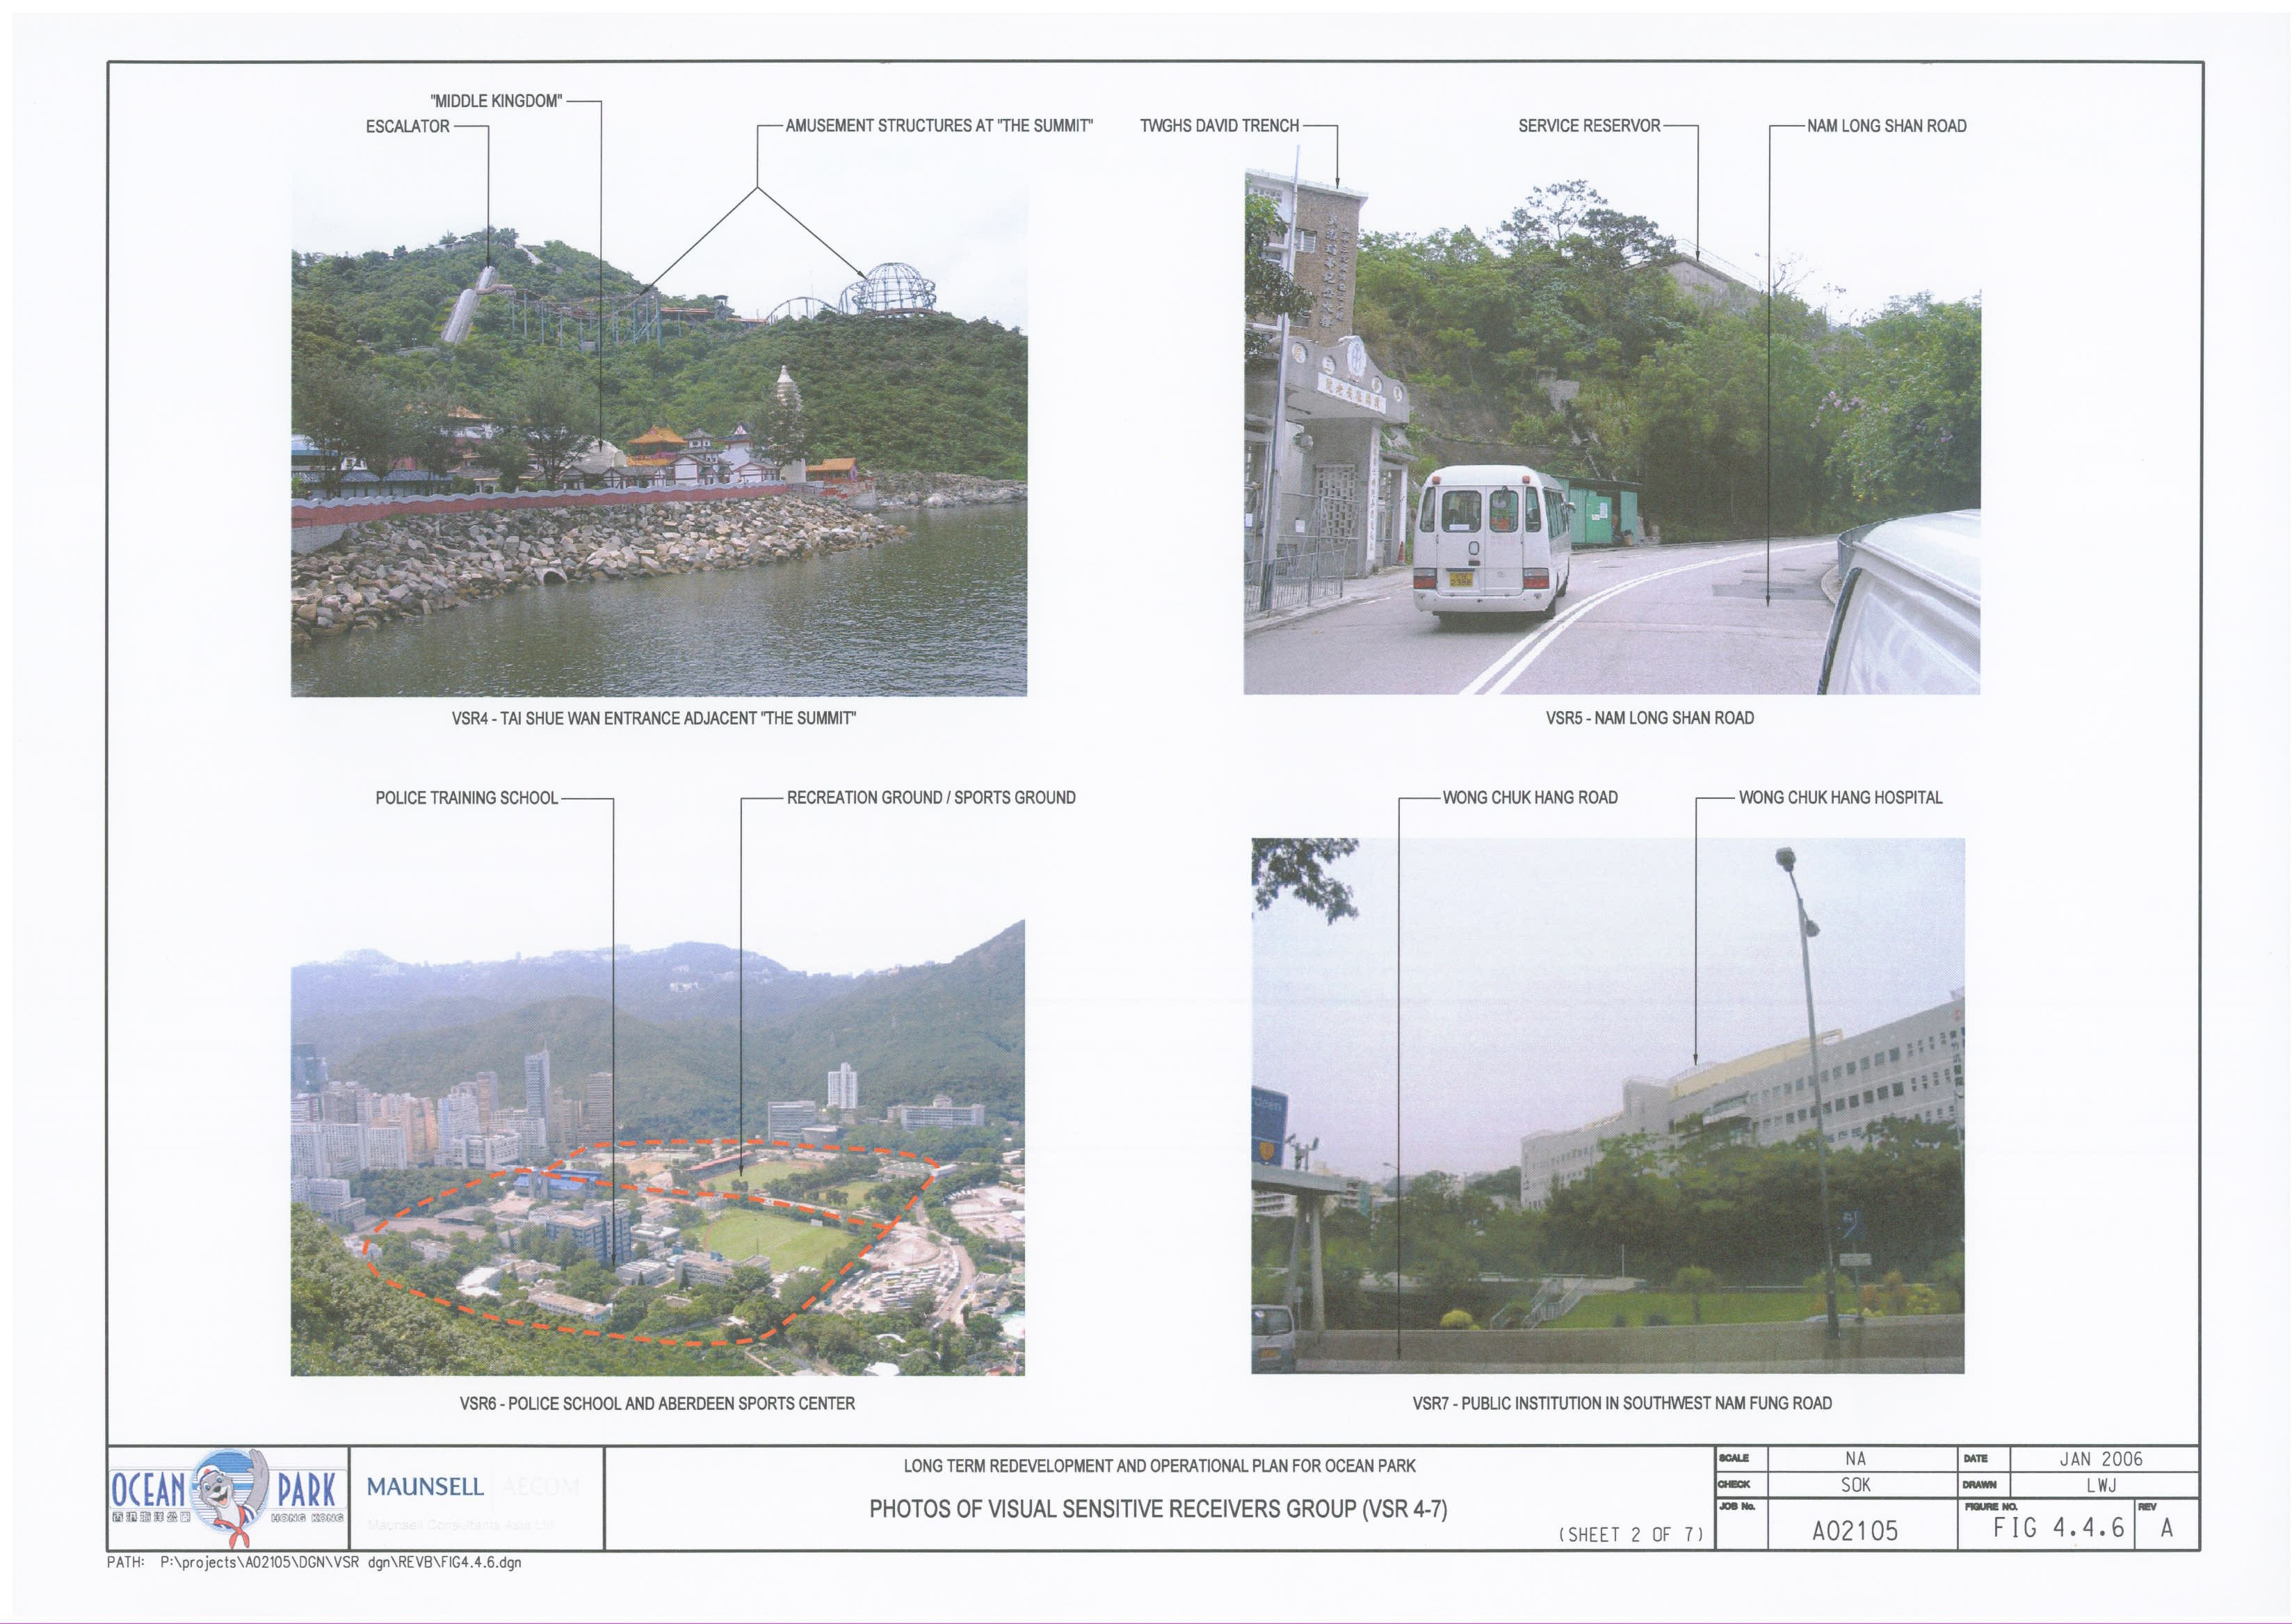
Figure
4.4.6 Photo
of Visual Sensitive Receivers Group (VSR4 - 7) – Sheet 2 of 7
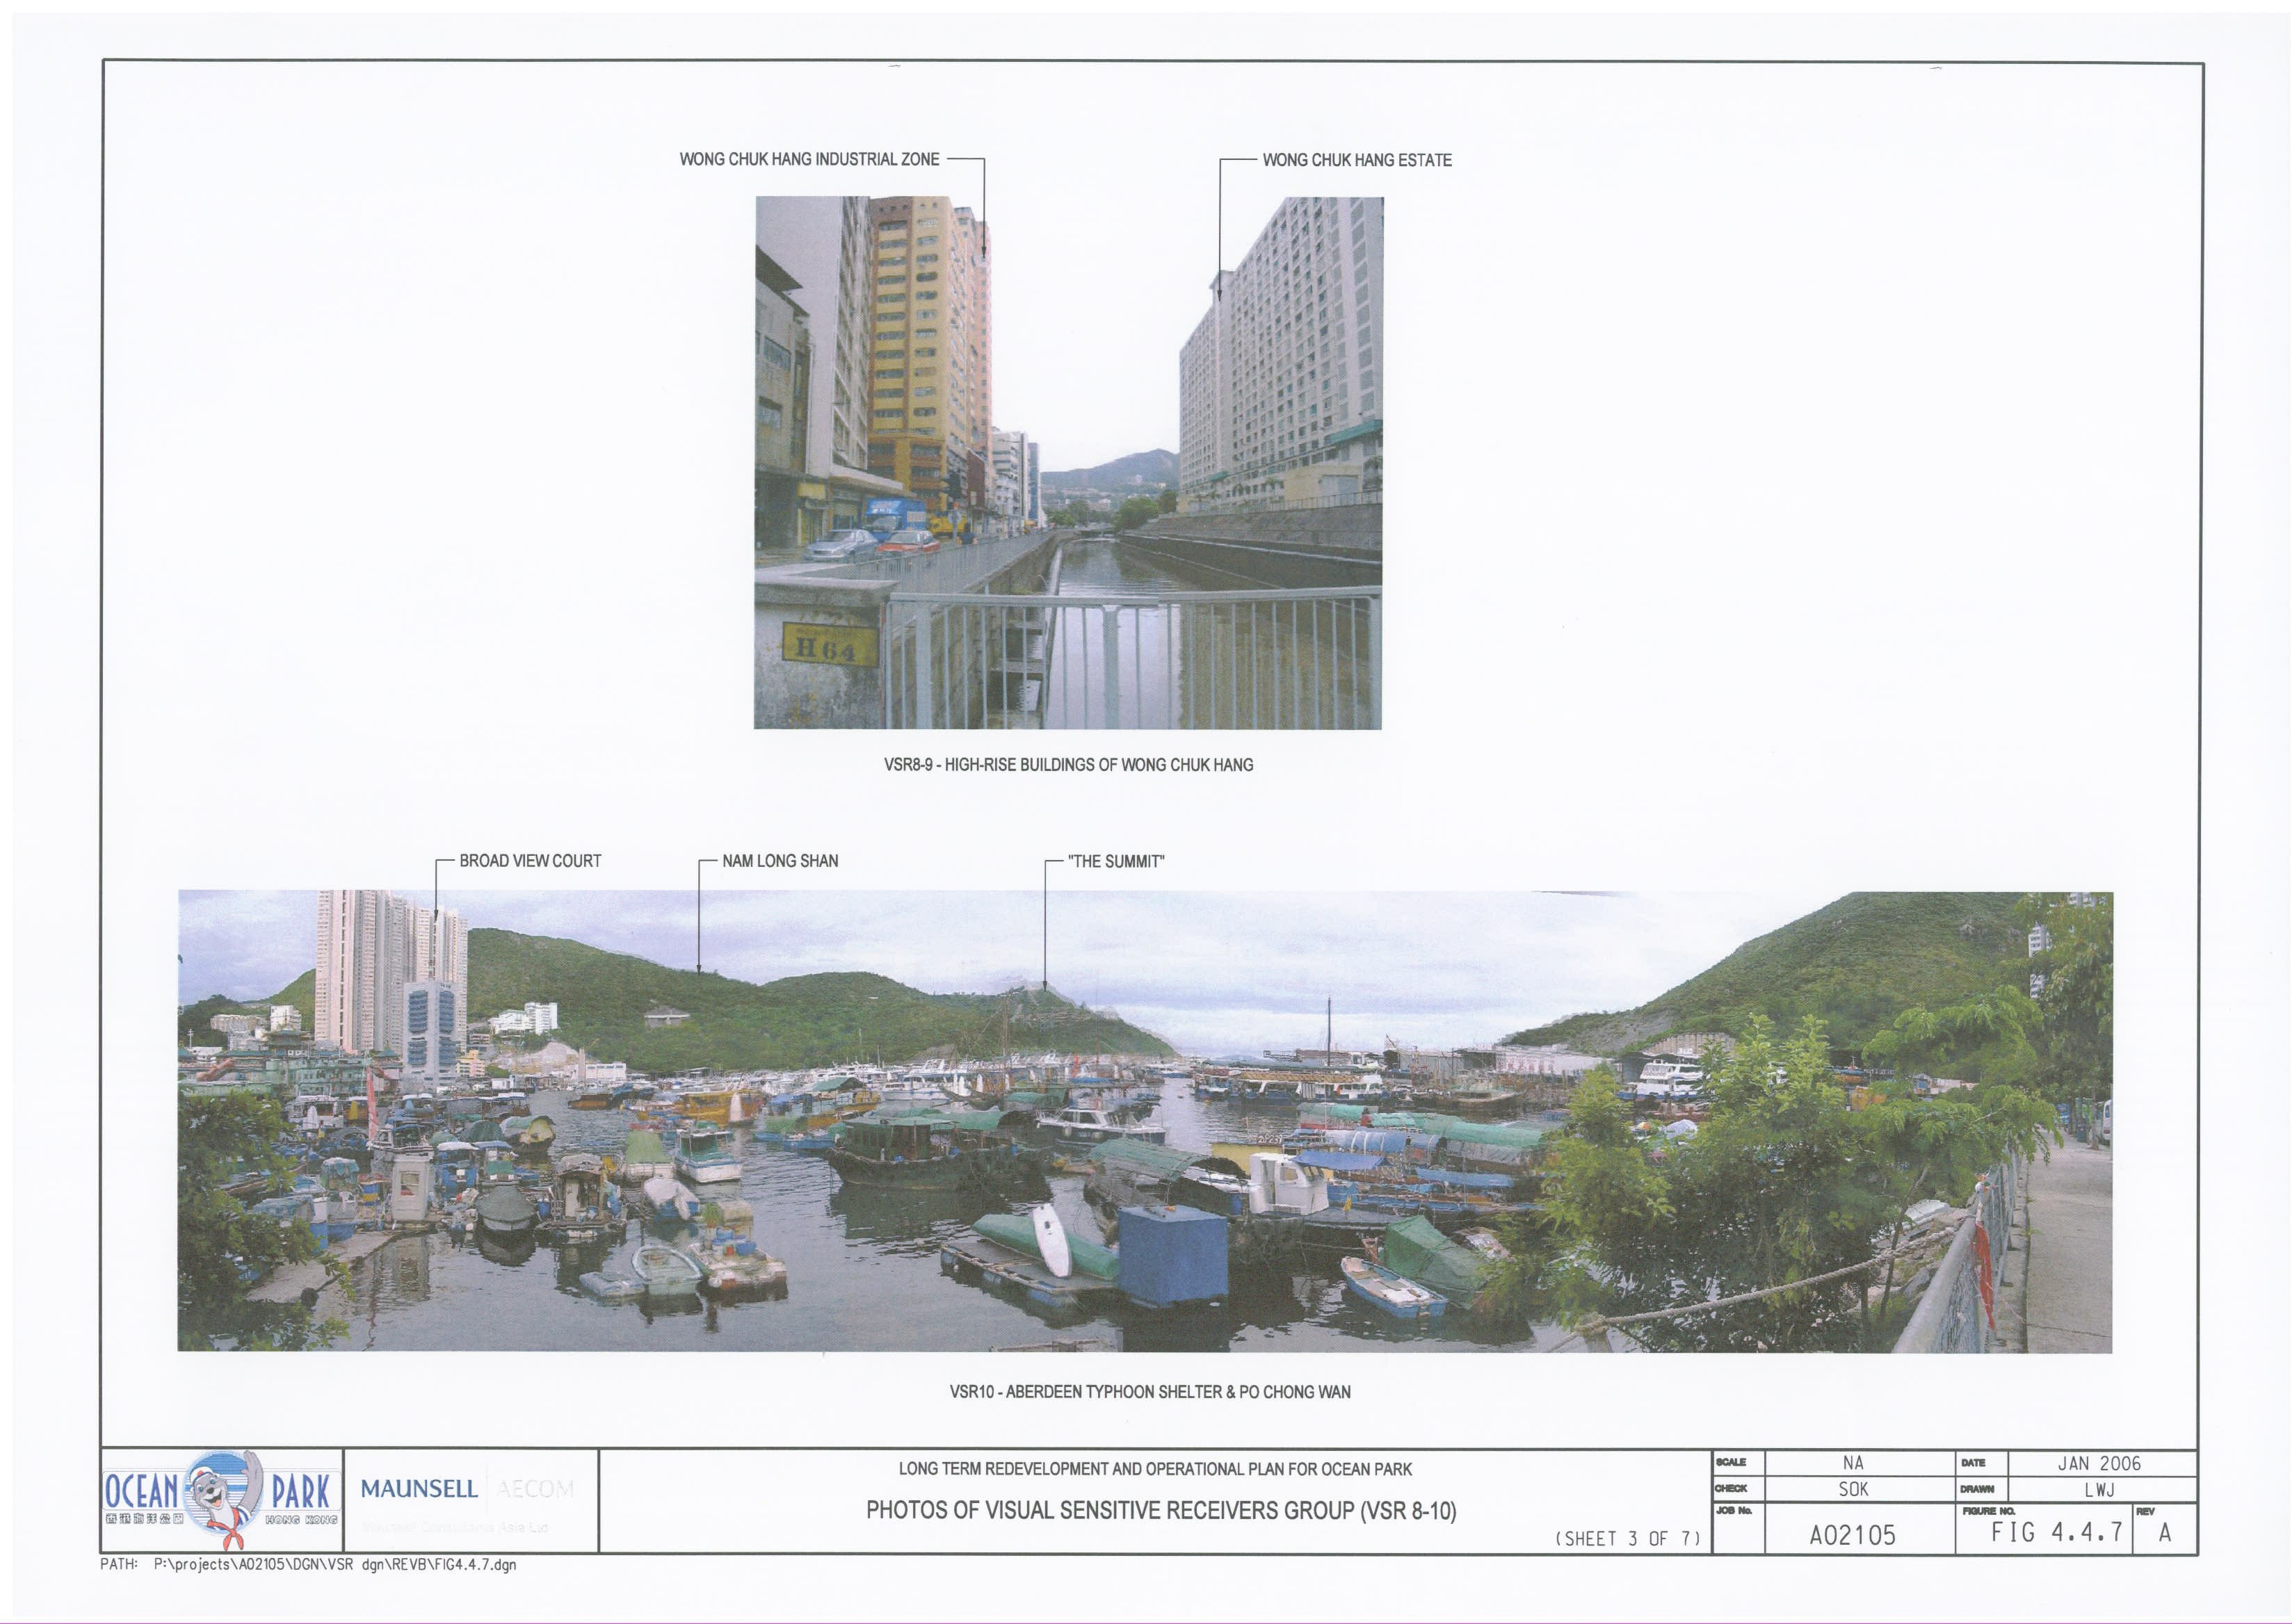
Figure
4.4.7 Photo
of Visual Sensitive Receivers Group (VSR8 - 10) – Sheet 3 of 7
Figure
4.4.8 Photo
of Visual Sensitive Receivers Group (VSR11 – 15) – Sheet 4 of 7
Figure
4.4.9 Photo
of Visual Sensitive Receivers Group (VSR16 – 19) – Sheet 5 of 7
Figure
4.4.10 Photo of
Visual Sensitive Receivers Group (VSR20 - 23) – Sheet 6 of 7
Figure
4.4.11 Photo of
Visual Sensitive Receivers Group (VSR24 – 27) – Sheet 7 of 7
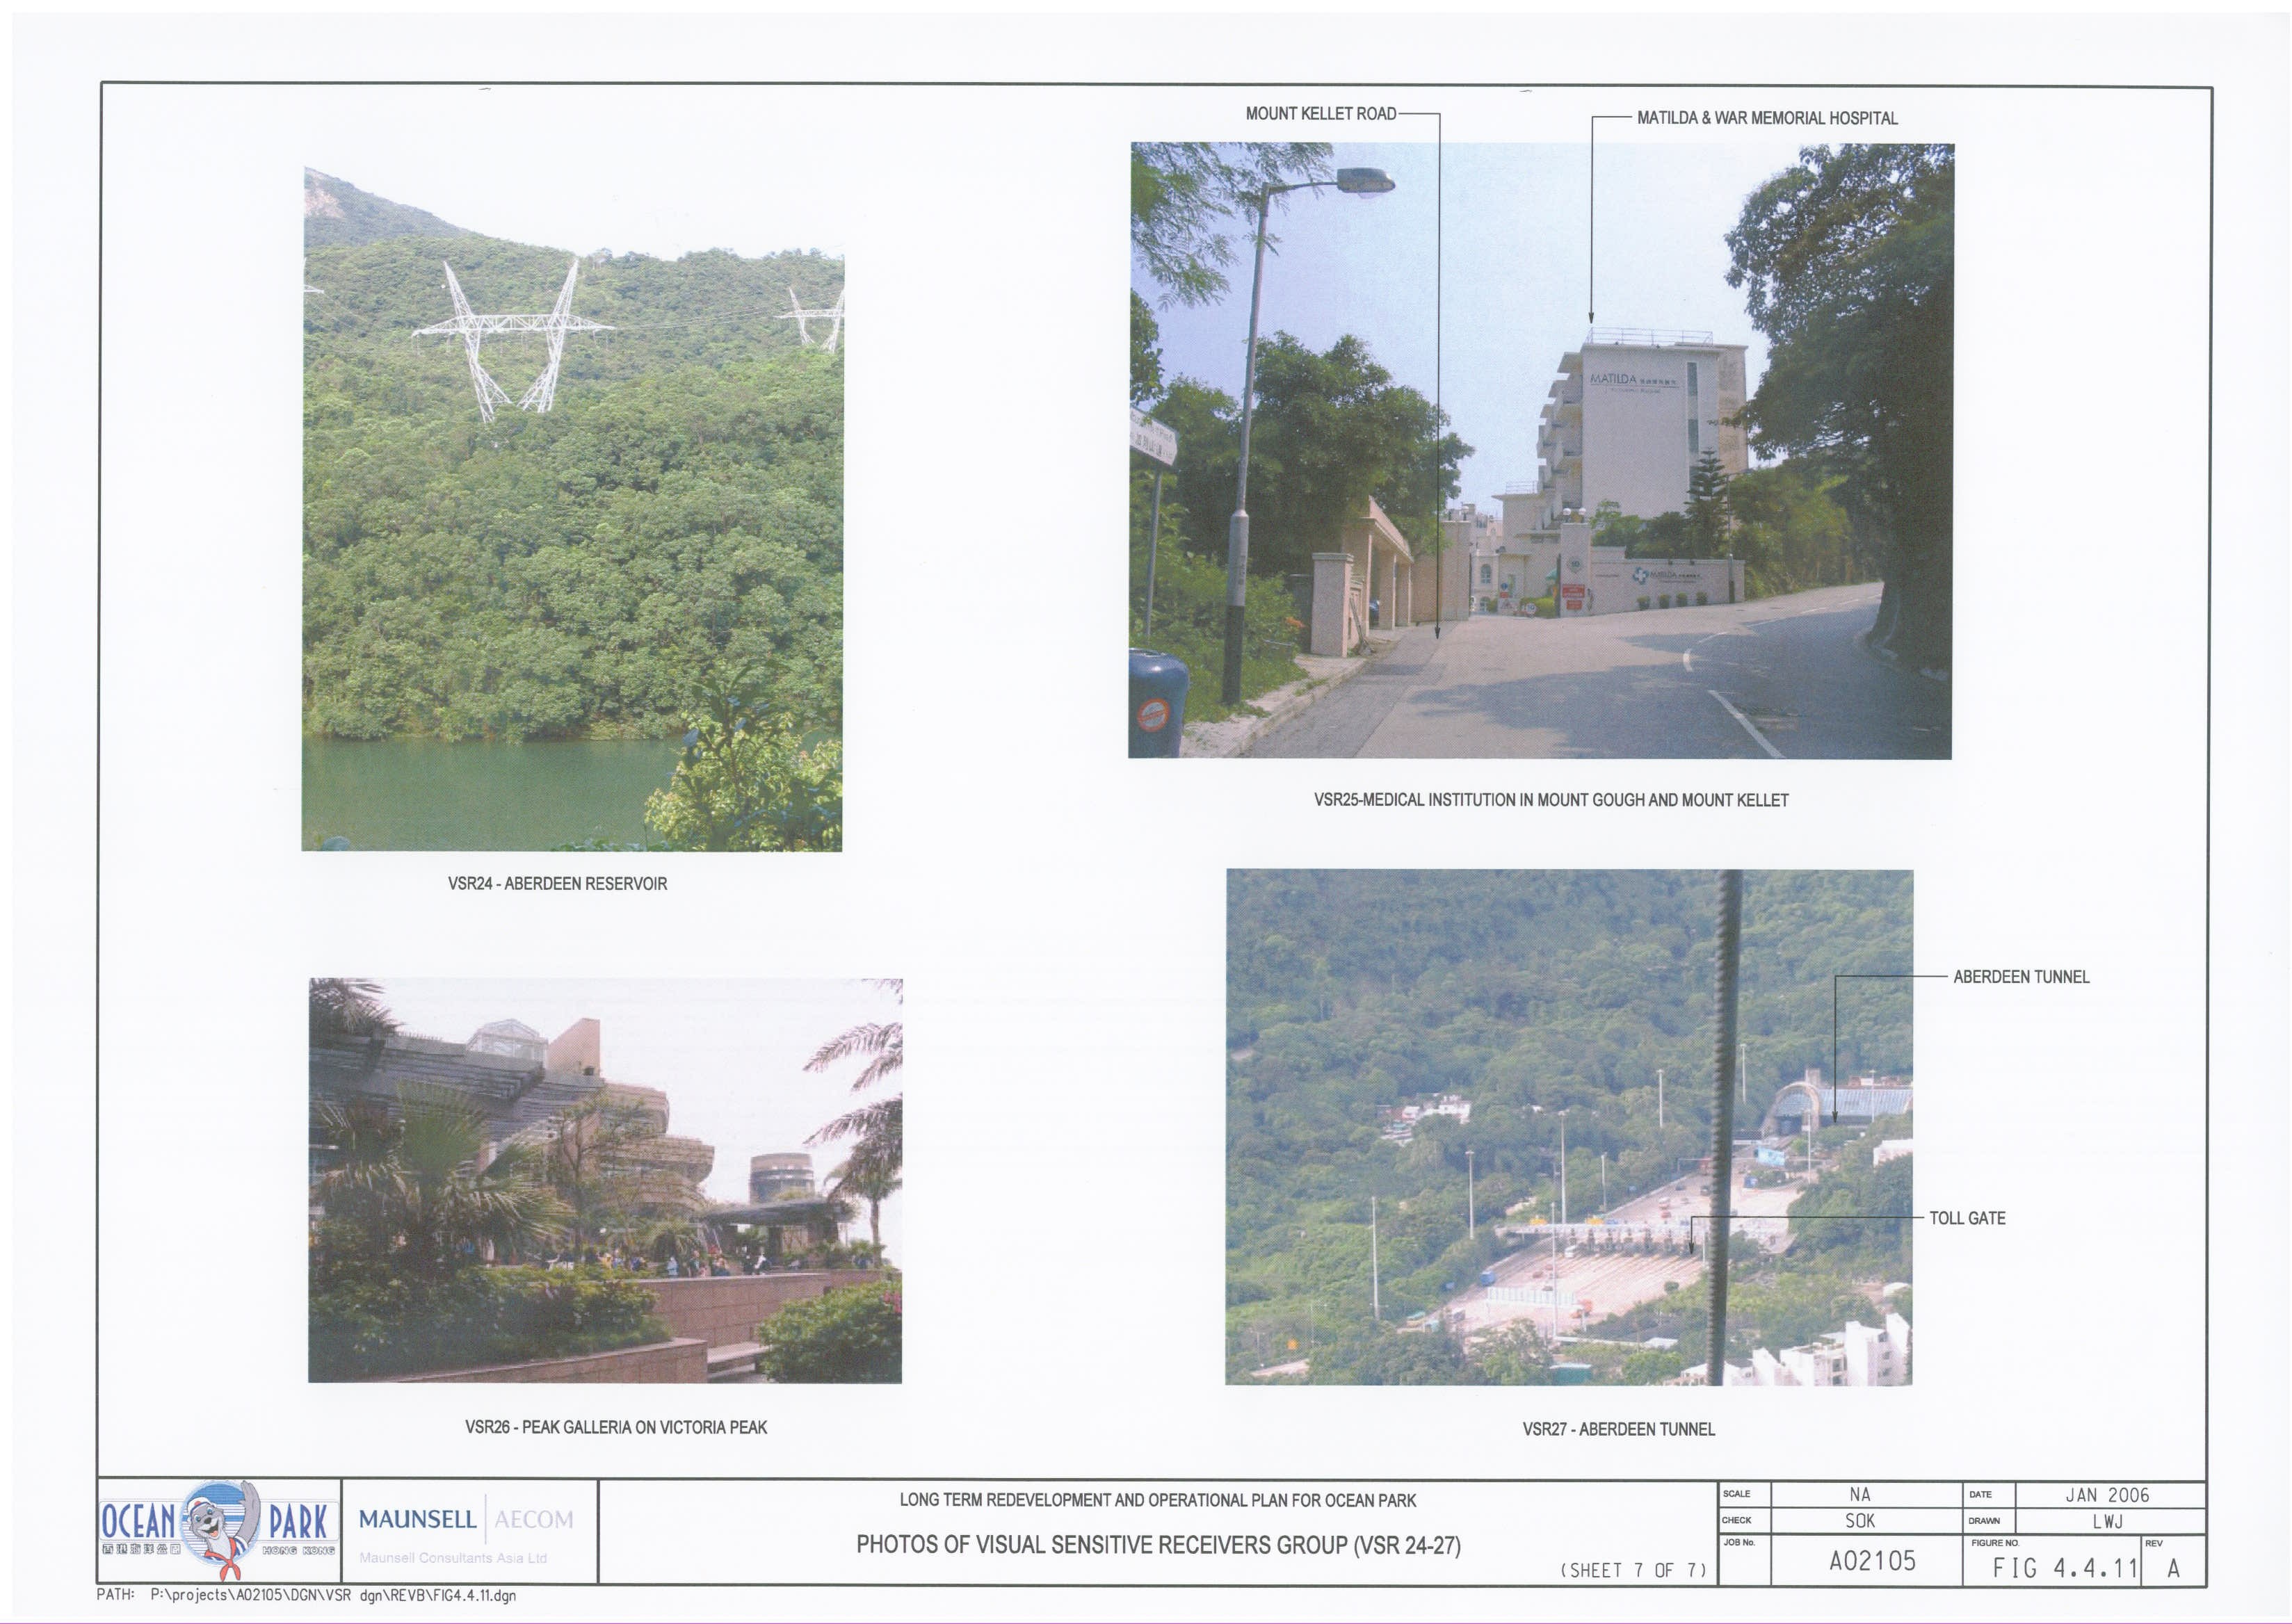
Figure
4.5.1 Views
for Visual Sensitive Receivers (VSR1 – 4) – Sheet 1 of 8
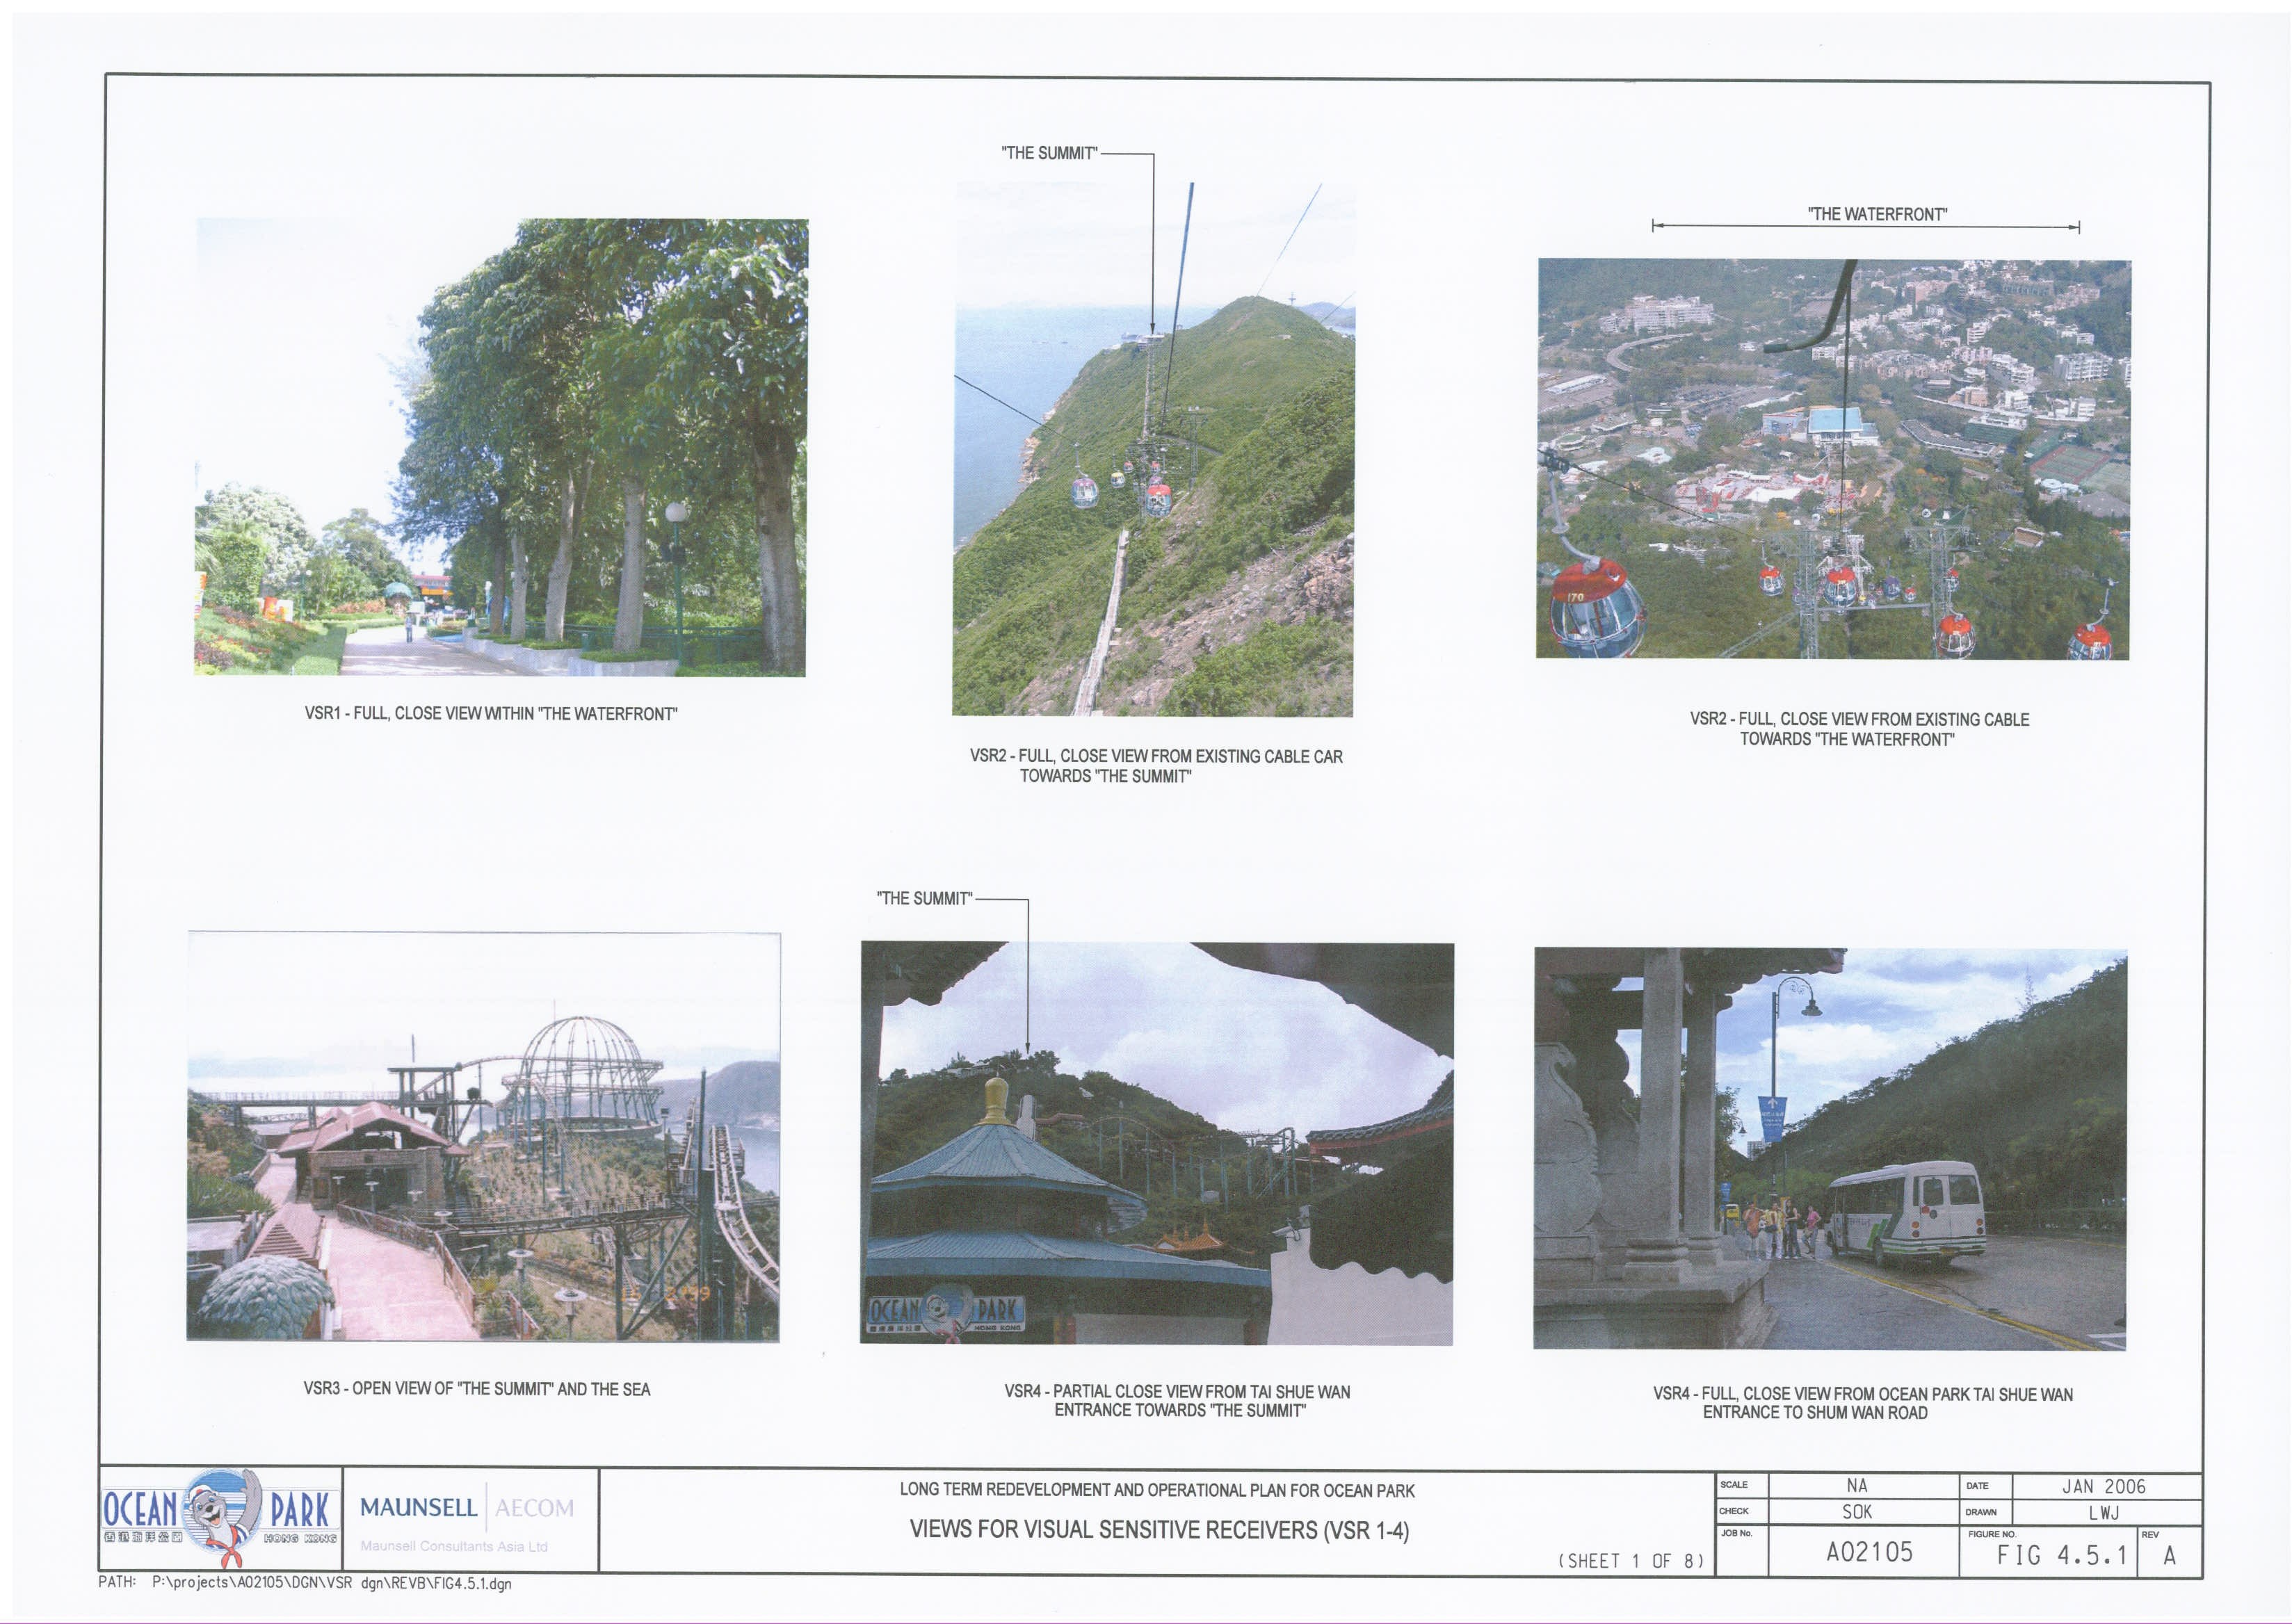
Figure
4.5.2 Views
for Visual Sensitive Receivers (VSR5 – 8) – Sheet 2 of 8
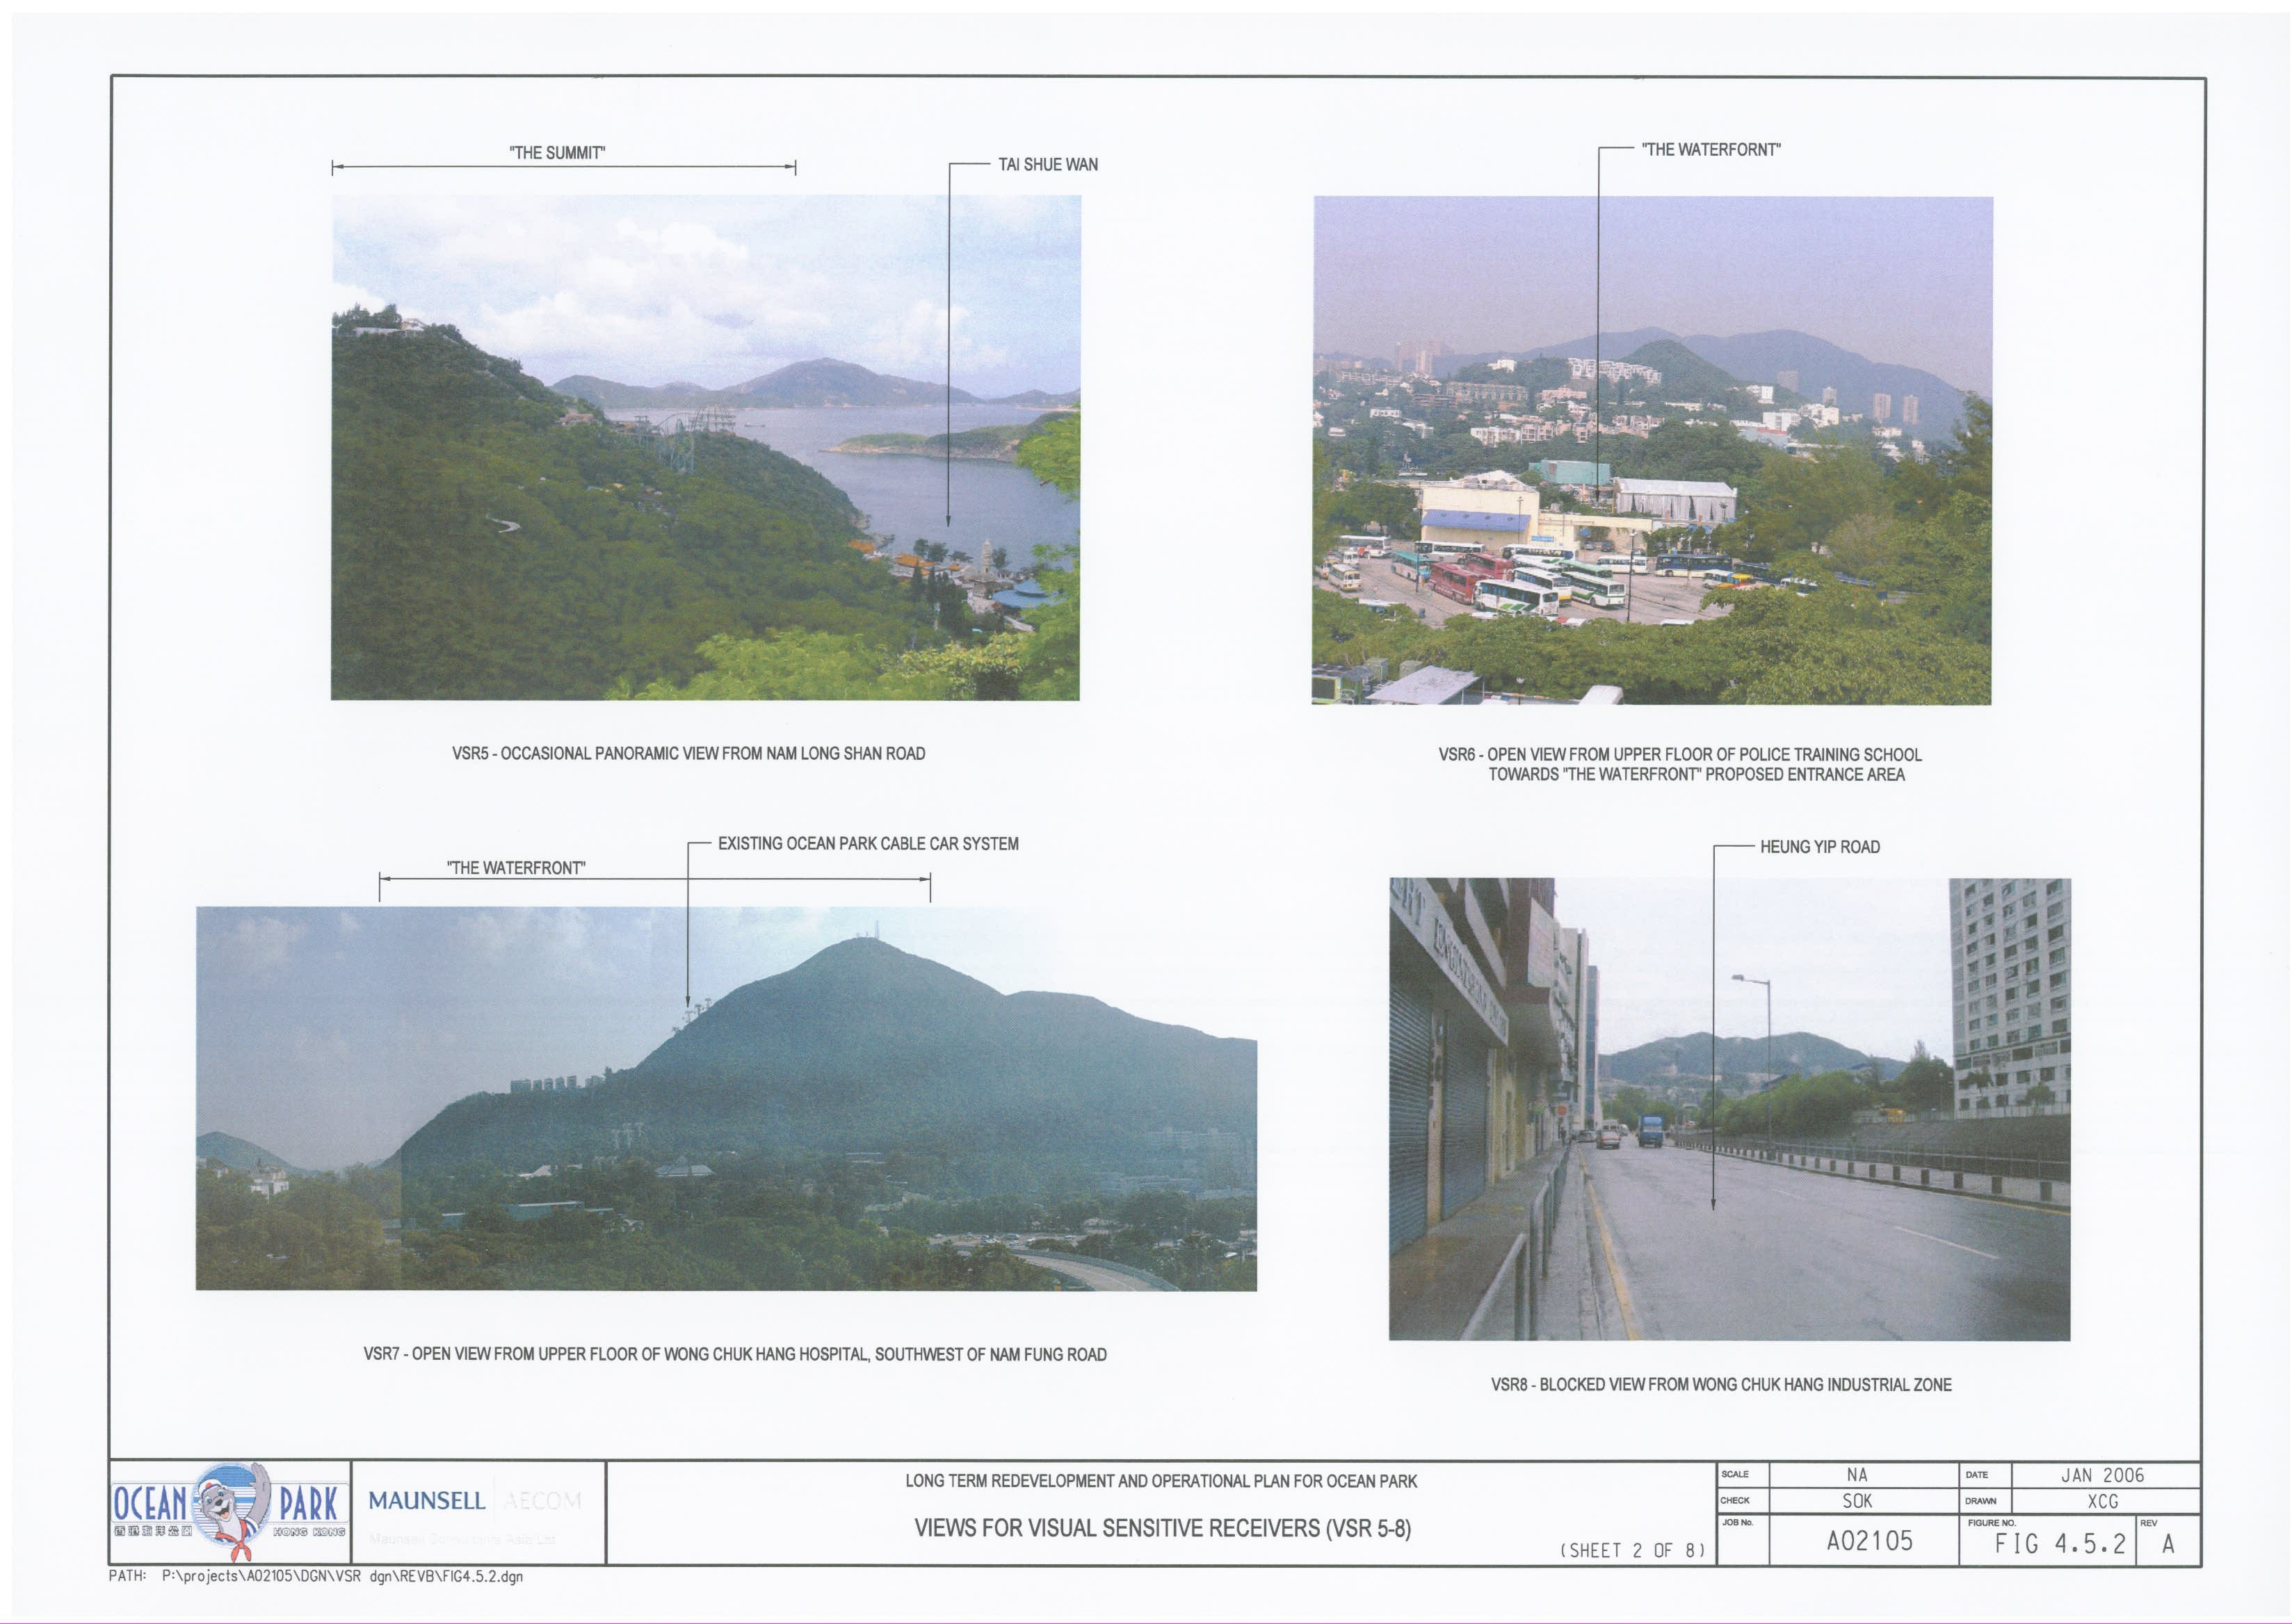
Figure
4.5.3 Views
for Visual Sensitive Receivers (VSR9 – 10) – Sheet 3 of 8
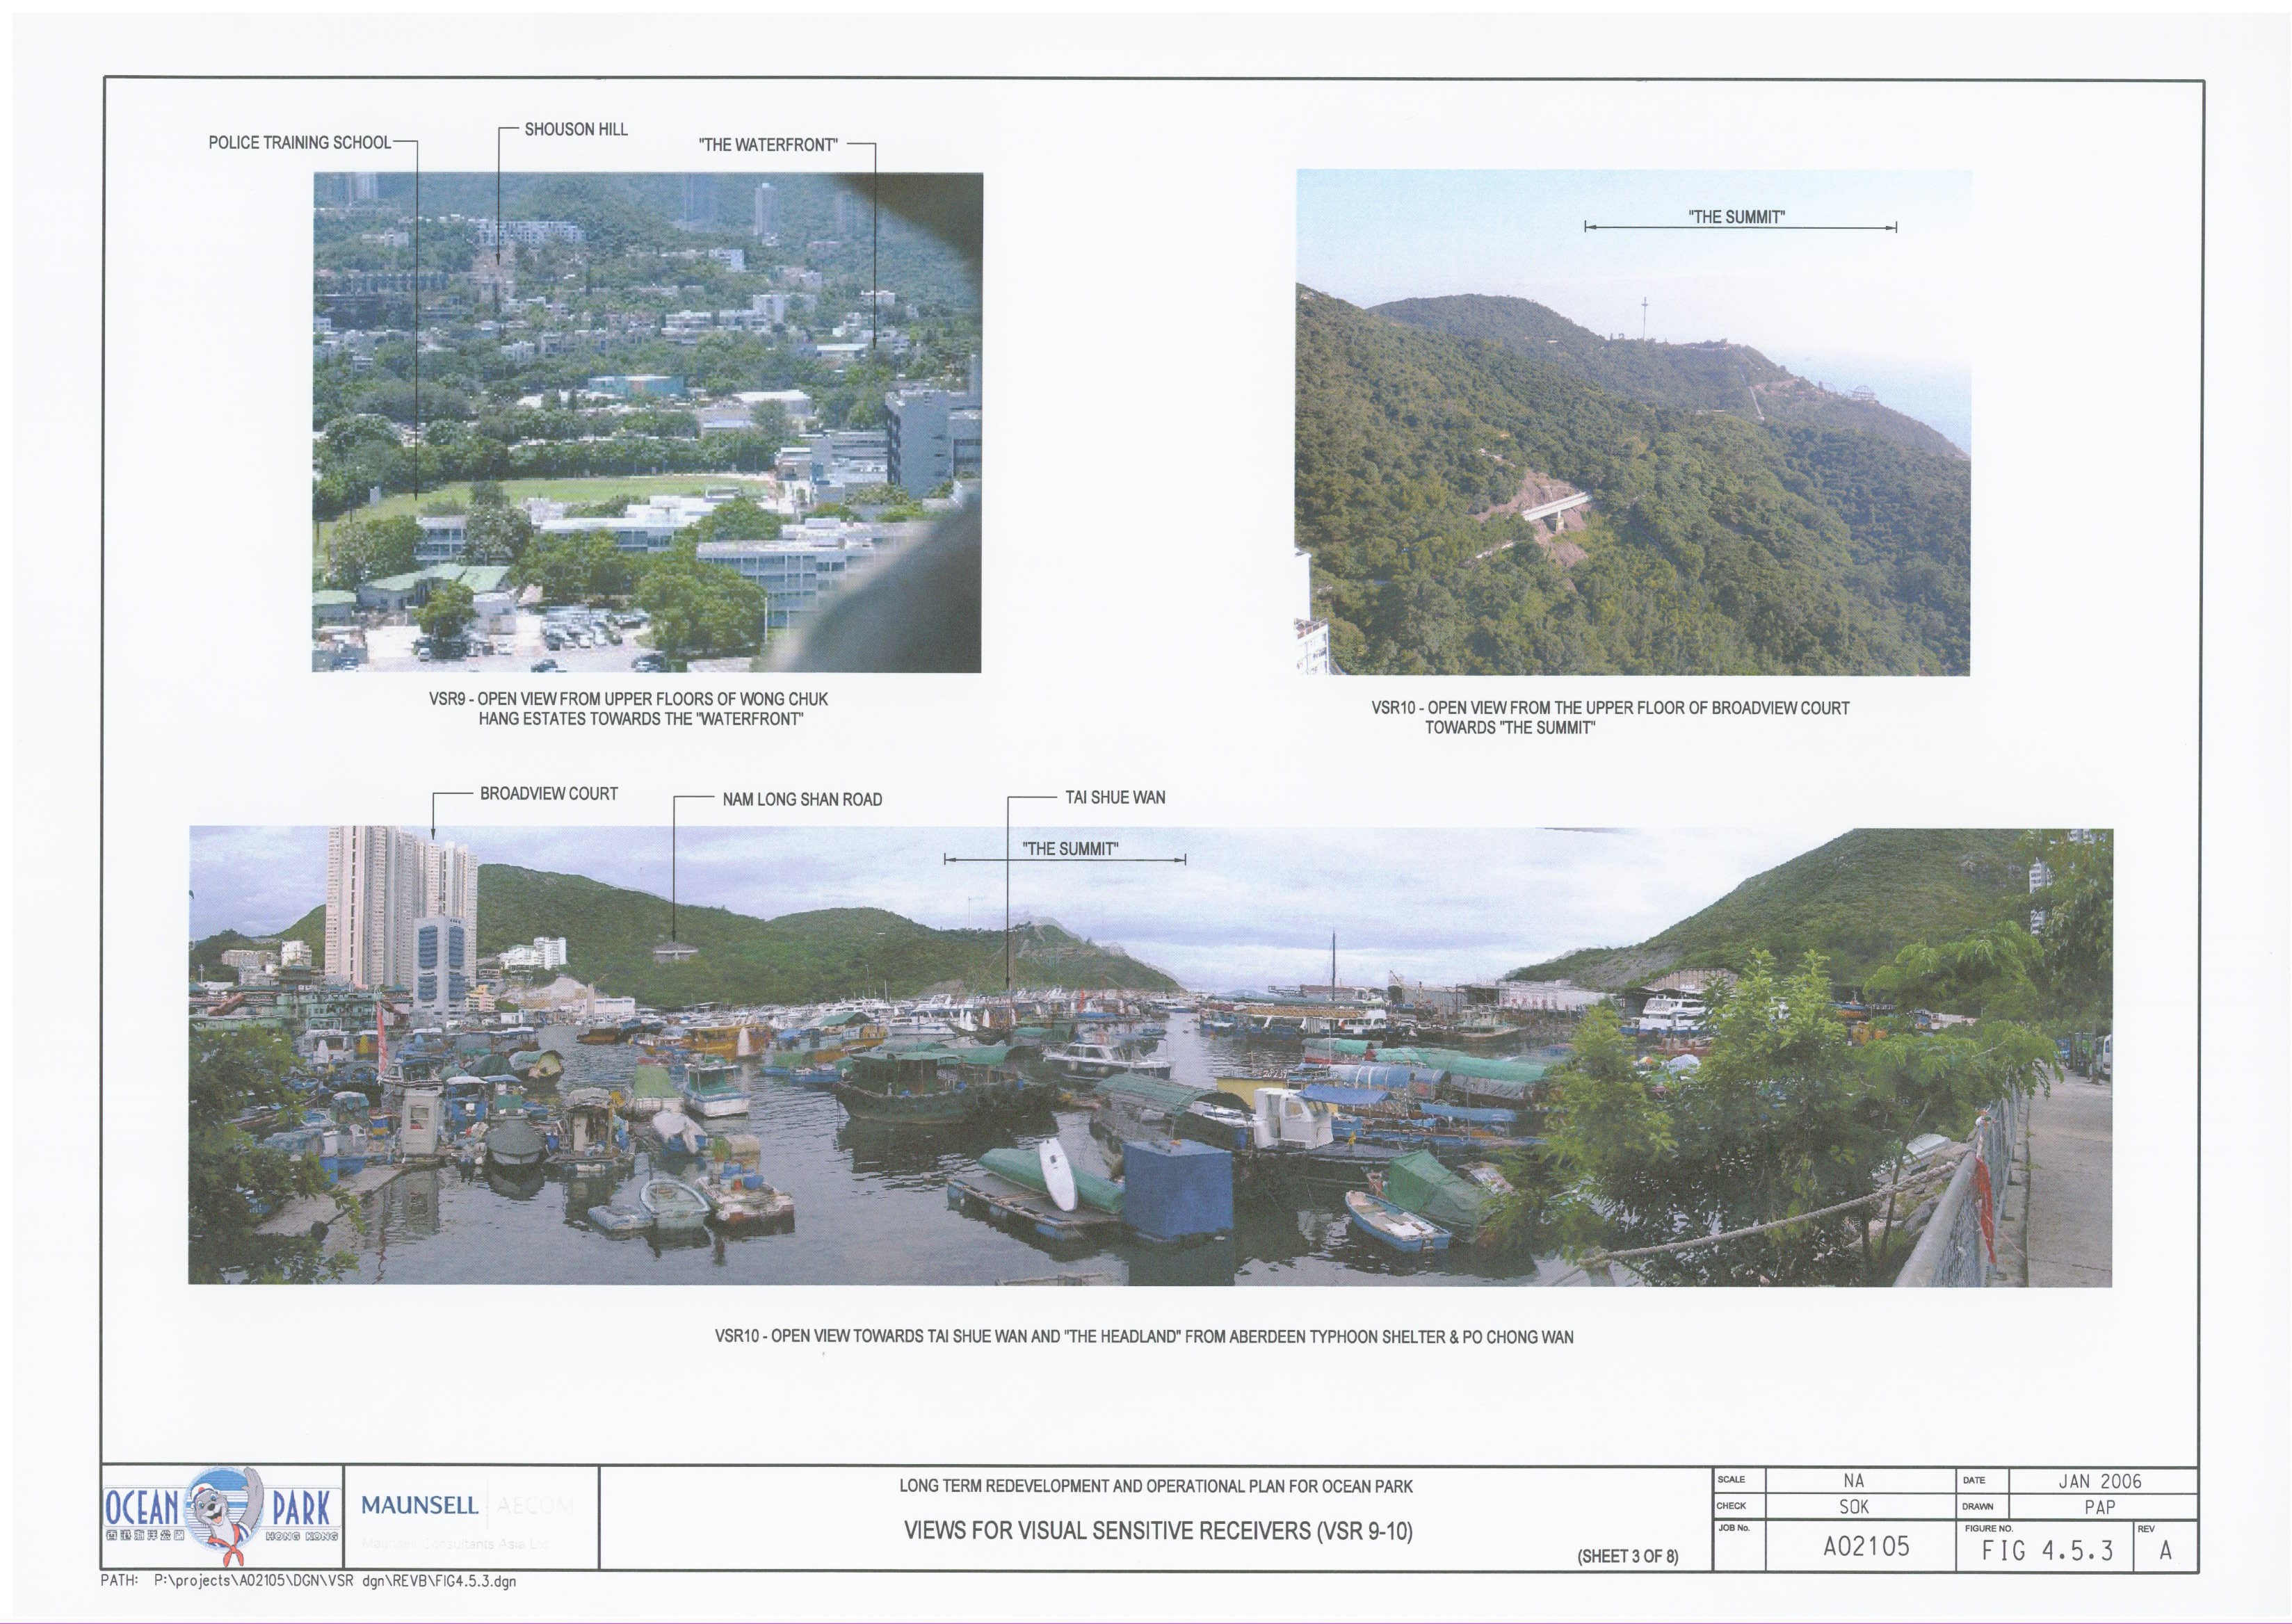
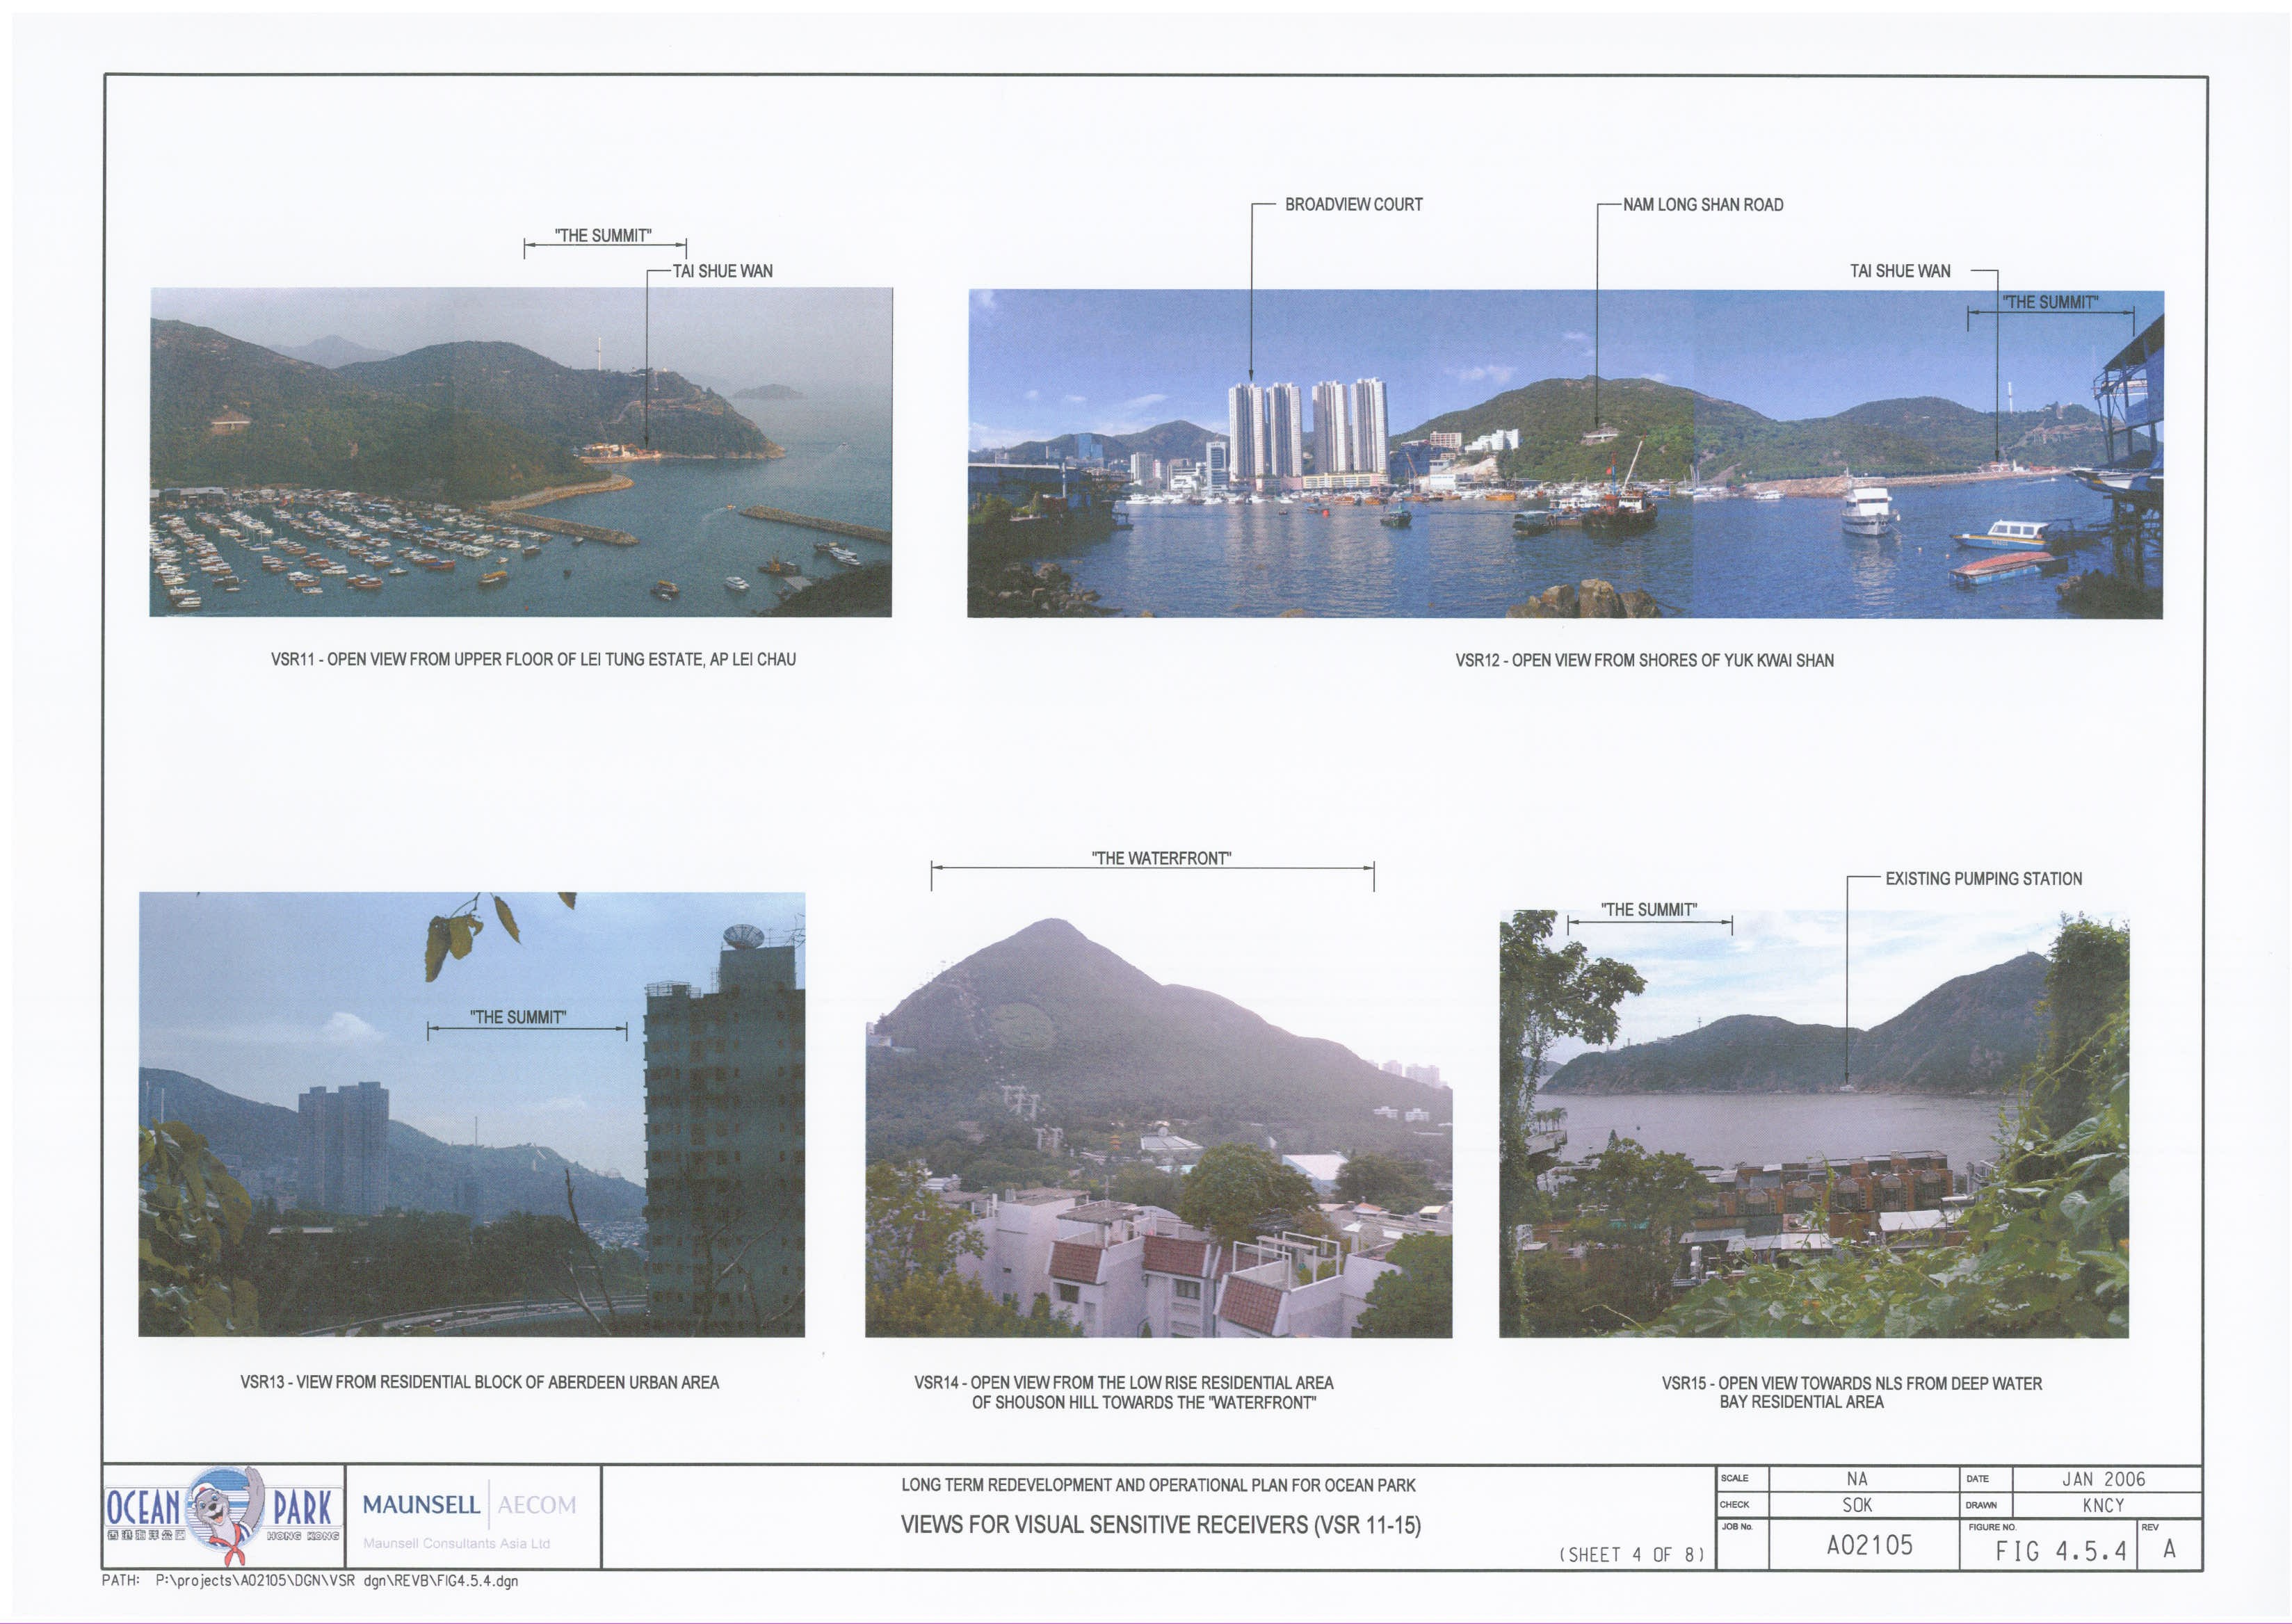
Figure
4.5.4 Views
for Visual Sensitive Receivers (VSR11 – 15) – Sheet 4 of 8
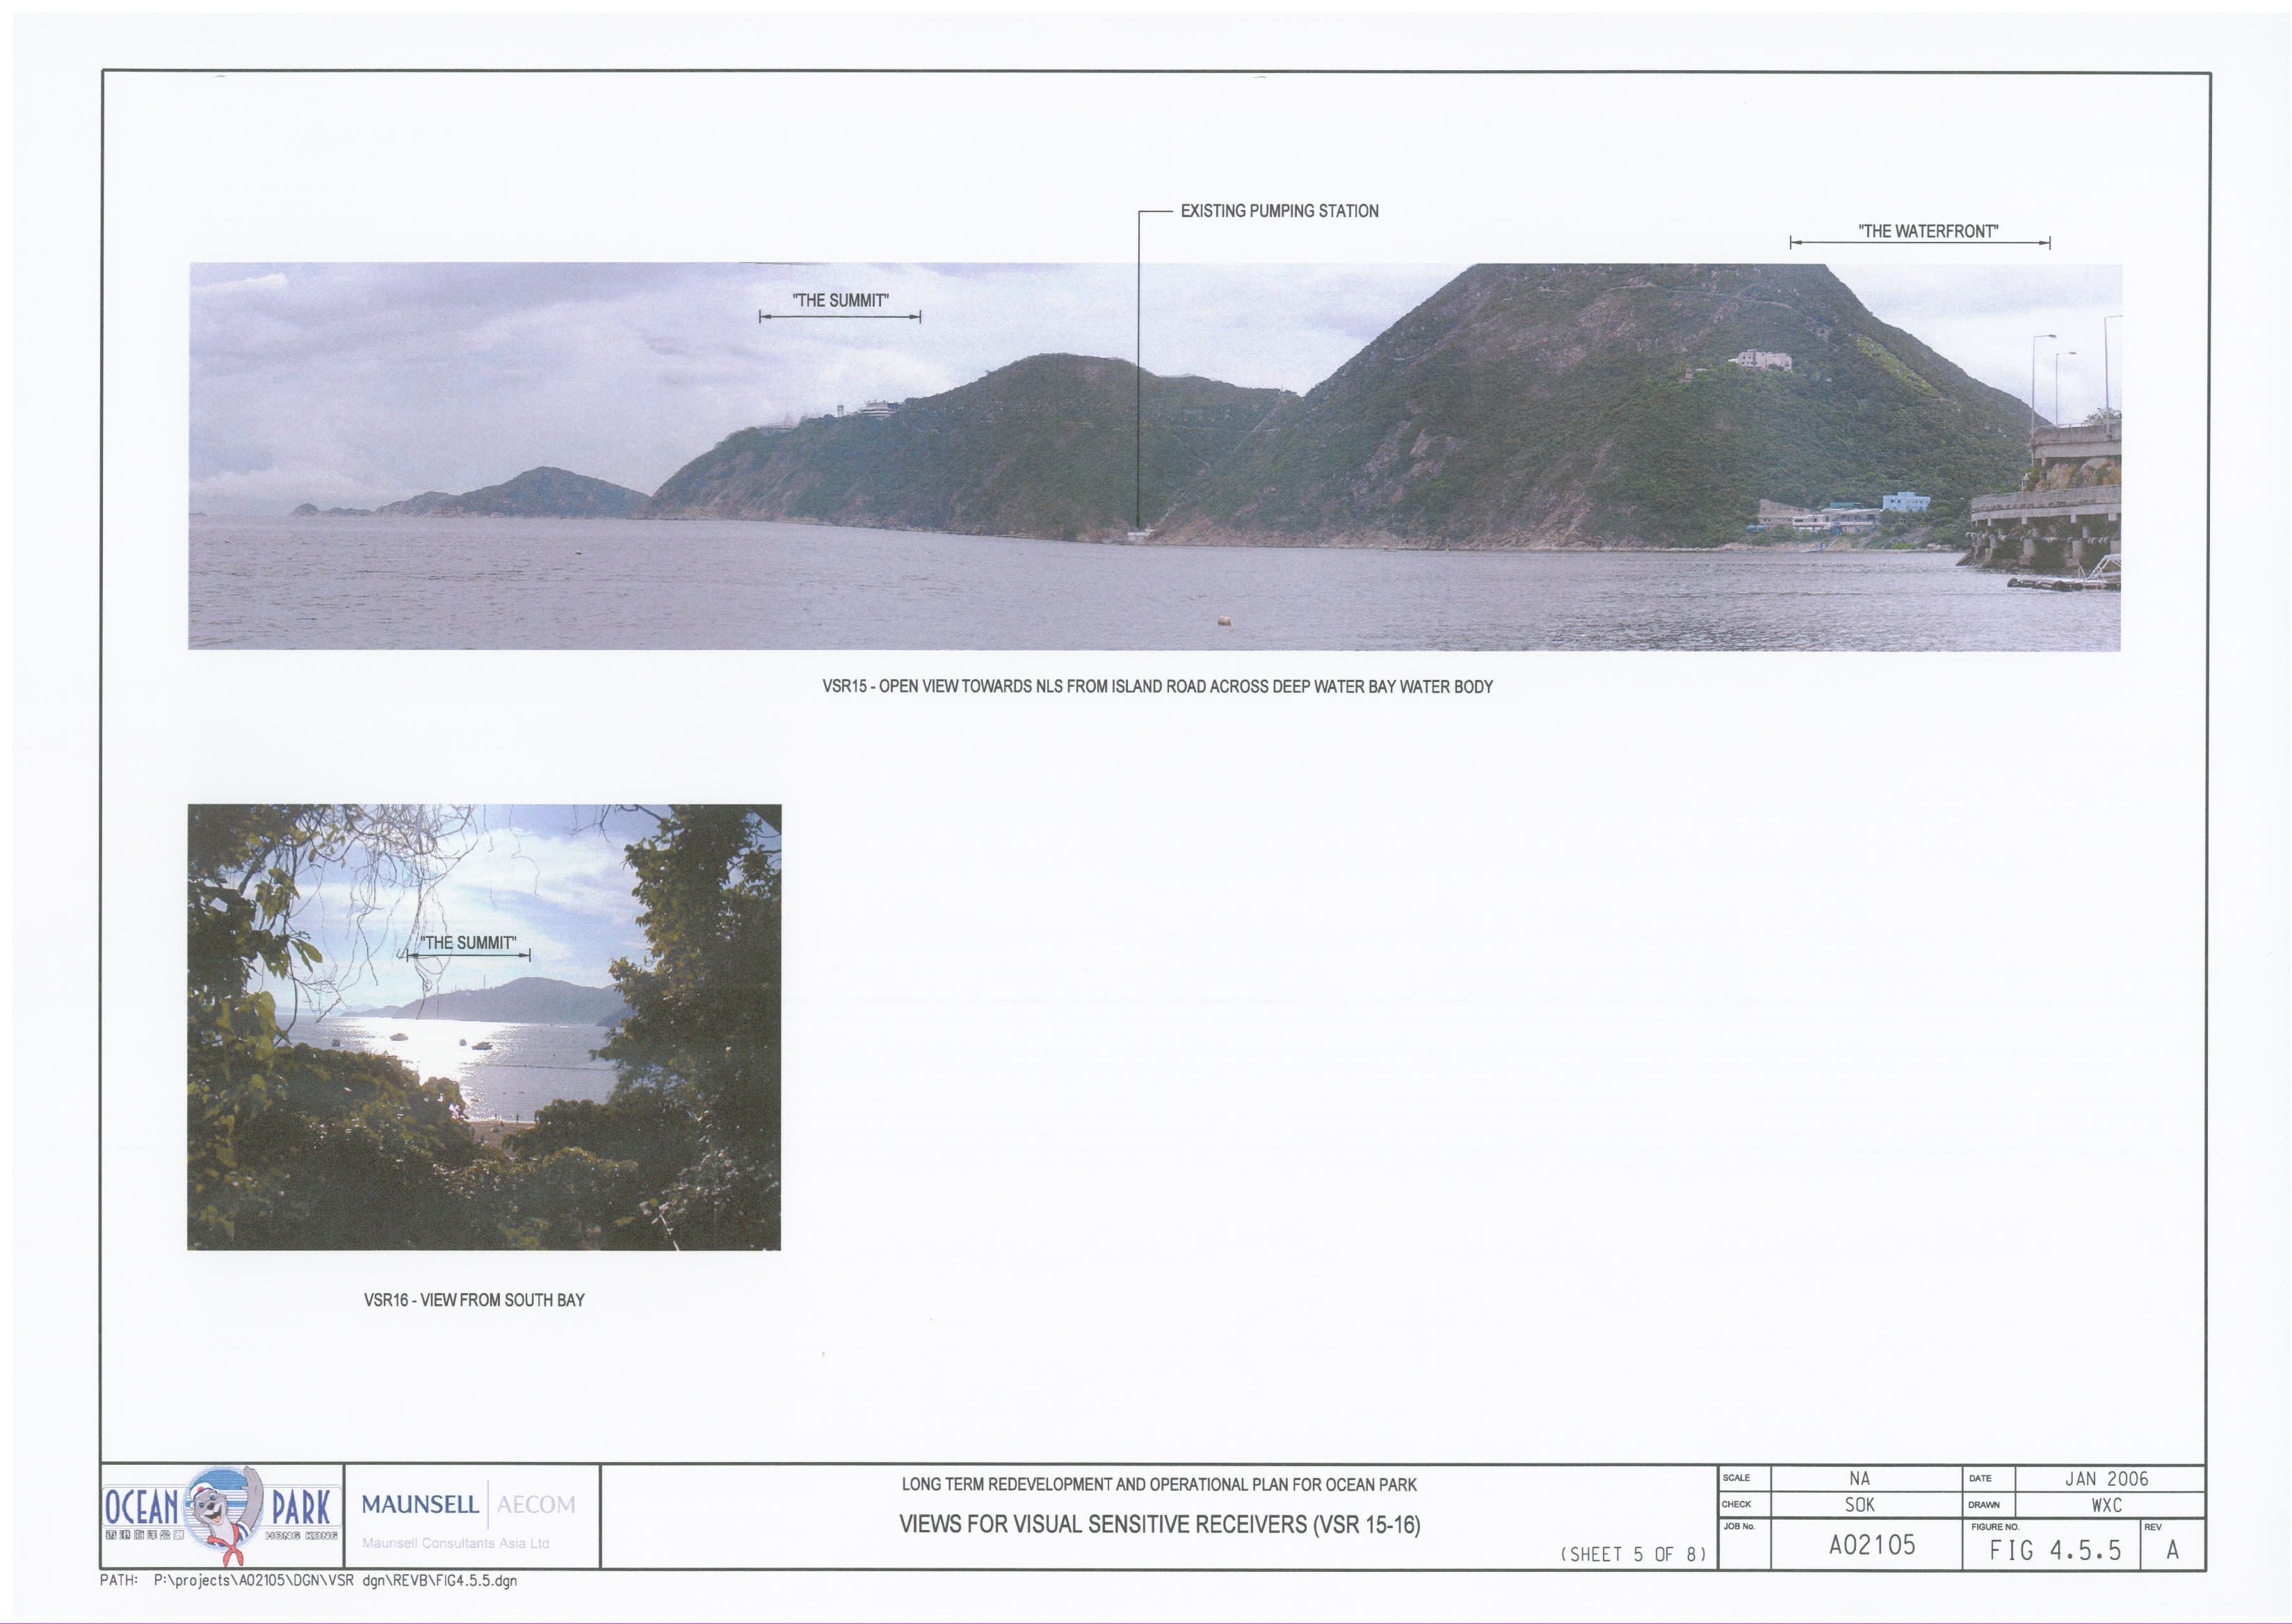
Figure
4.5.5 Views
for Visual Sensitive Receivers (VSR15 – 16) – Sheet 5 of 8
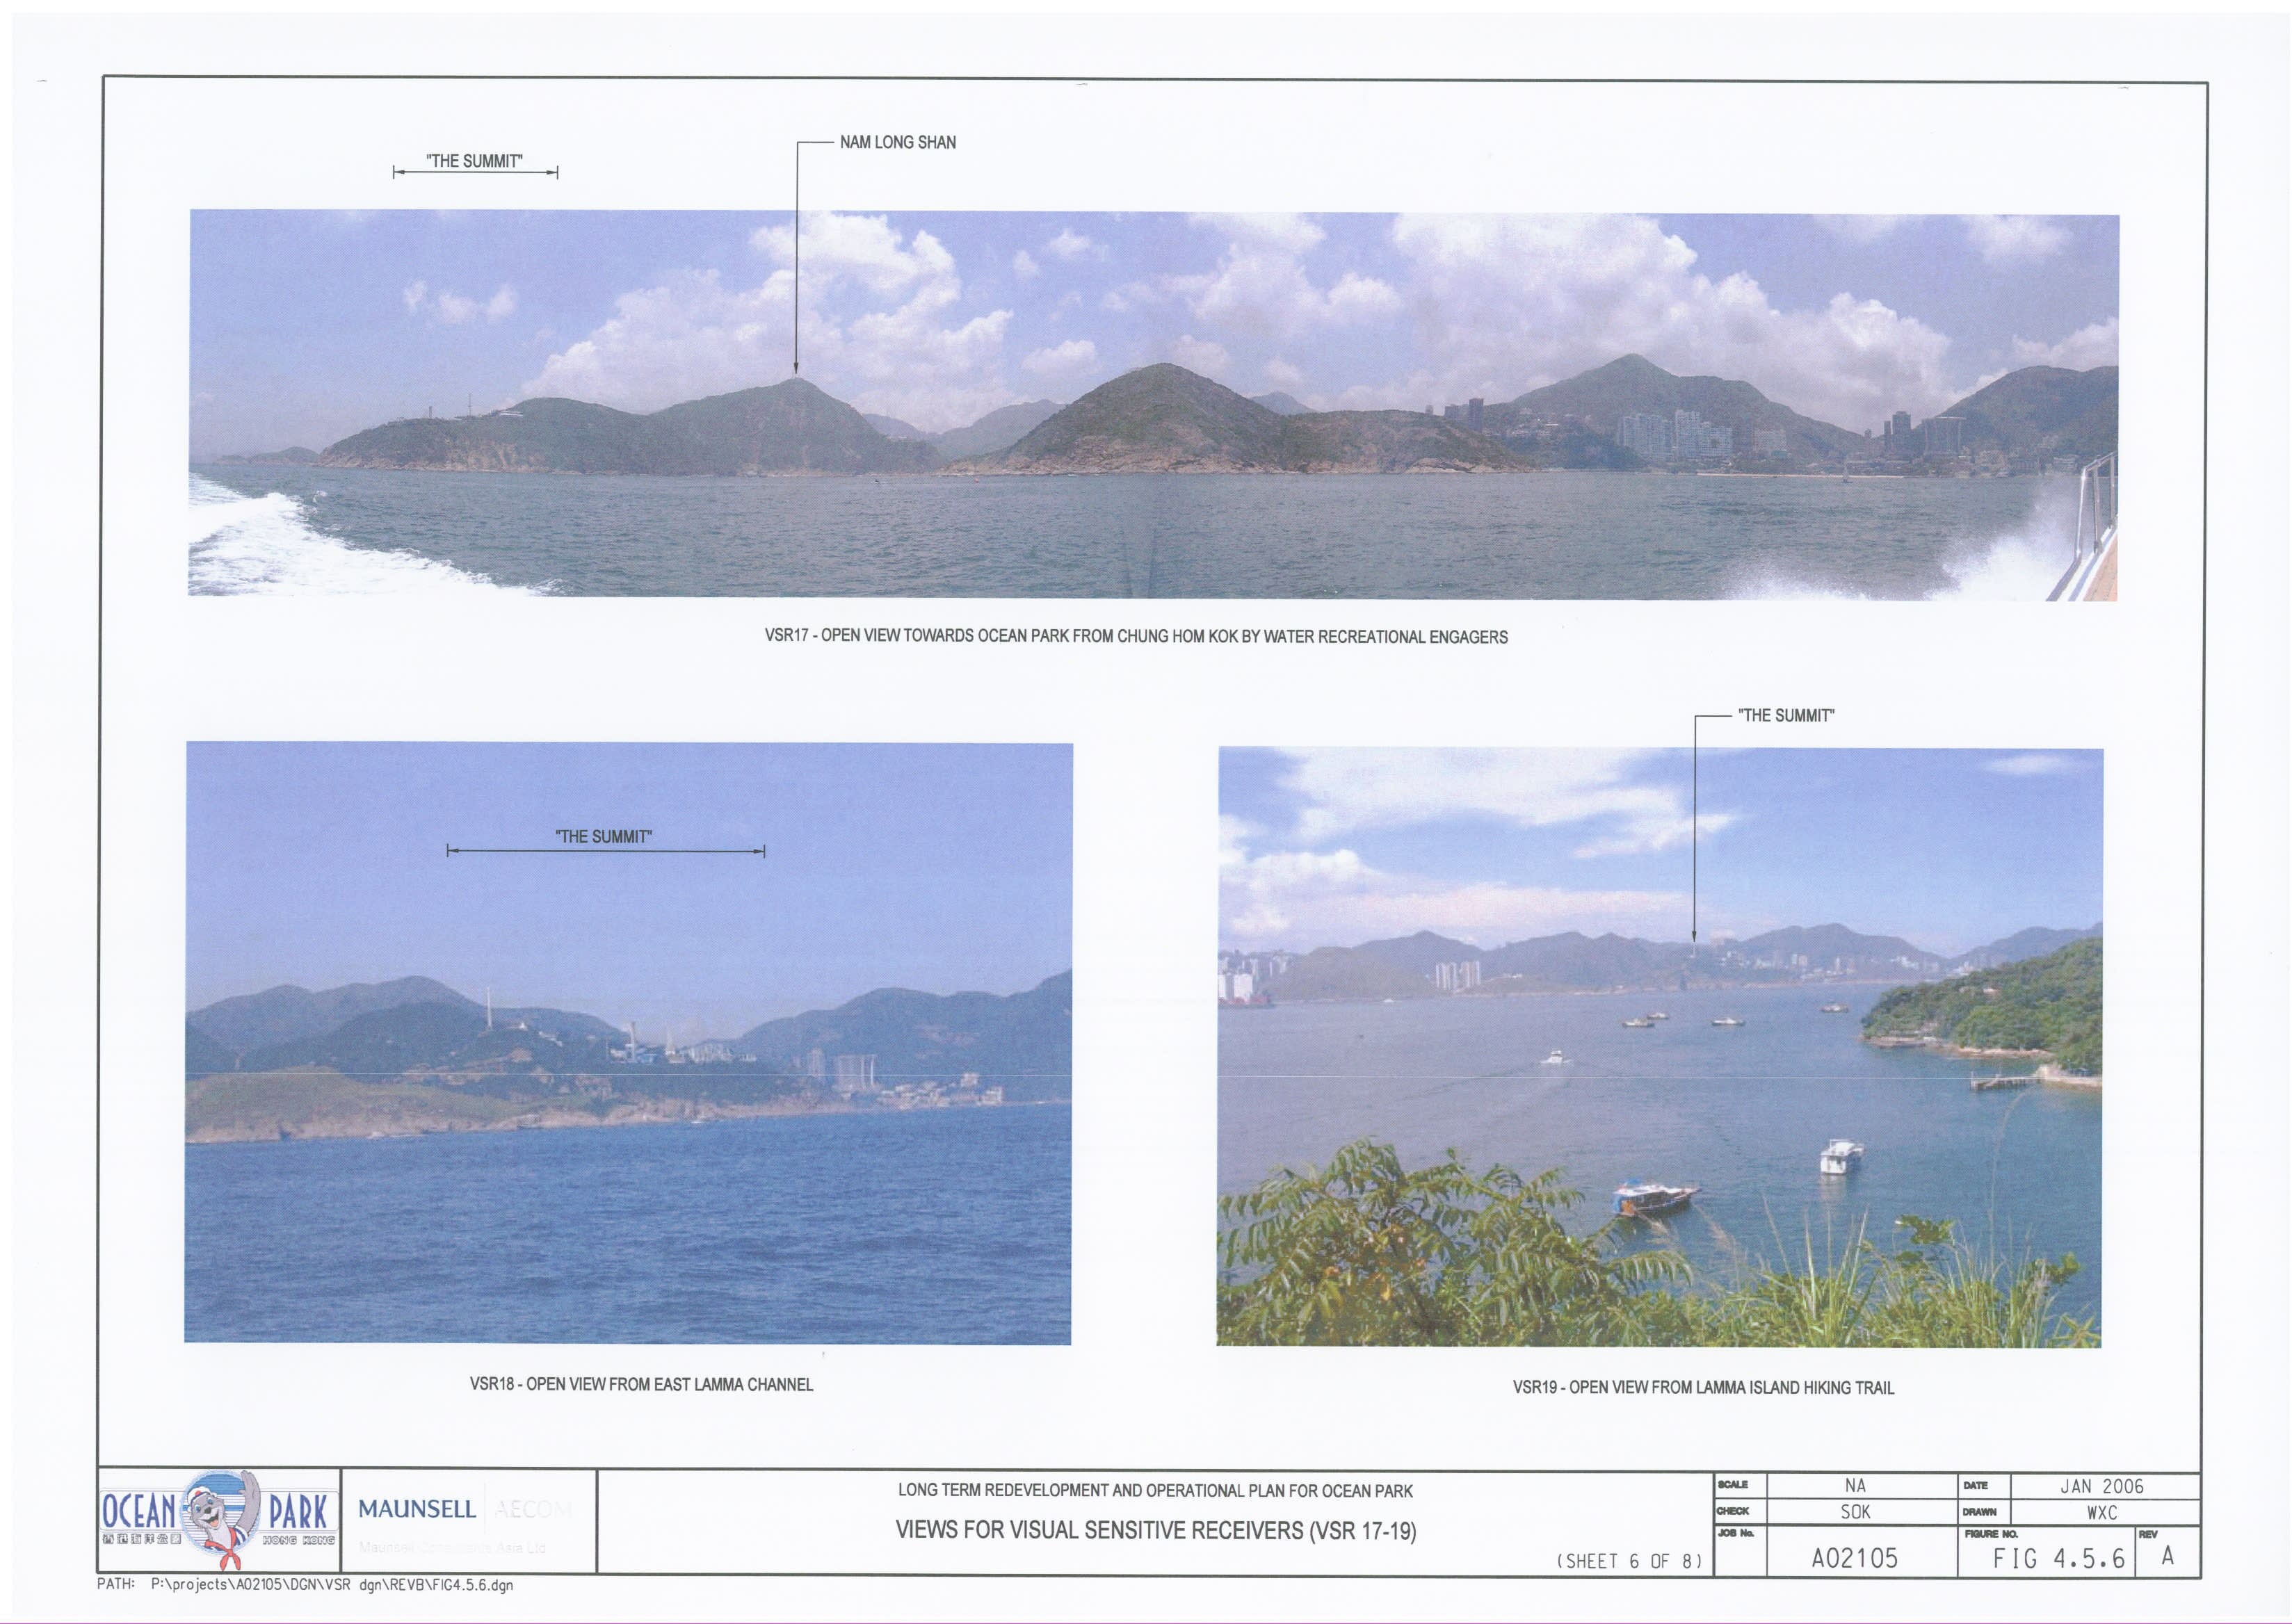
Figure
4.5.6 Views
for Visual Sensitive Receivers (VSR17 – 19) – Sheet 6 of 8
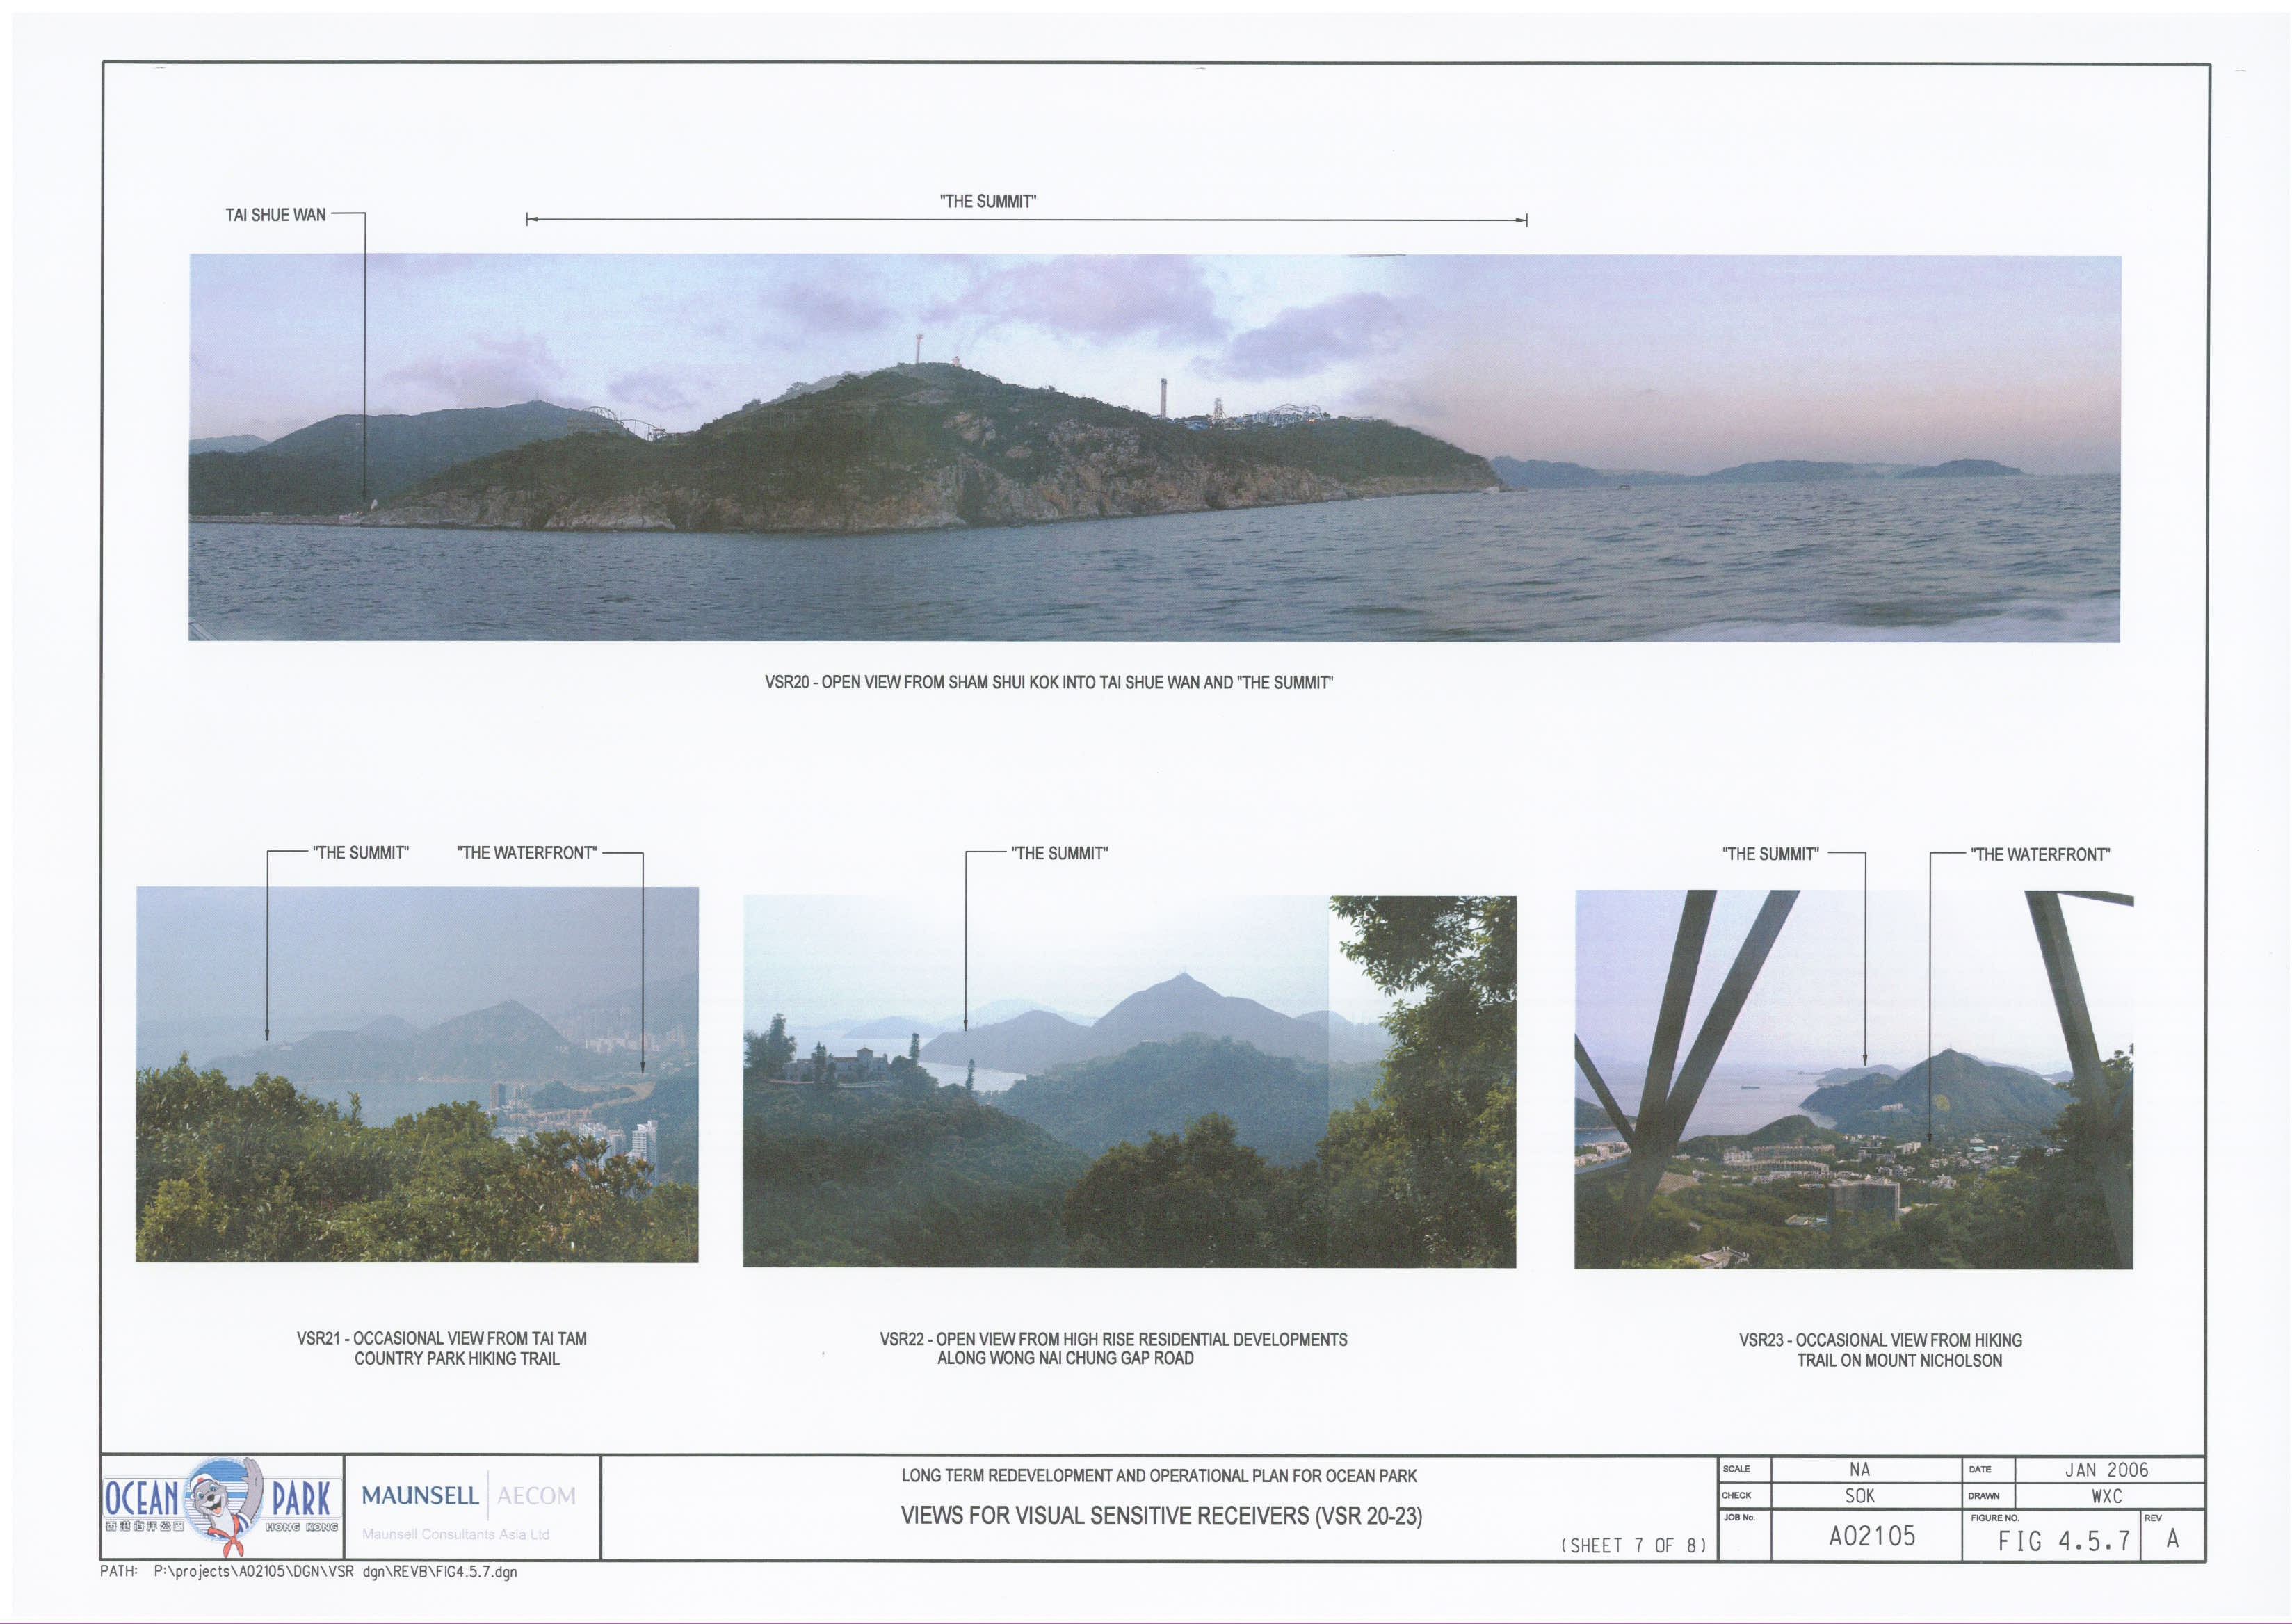
Figure
4.5.7 Views
for Visual Sensitive Receivers (VSR20 – 23) – Sheet 7 of 8
Figure
4.5.8 Views
for Visual Sensitive Receivers (VSR24 – 27) – Sheet 8 of 8
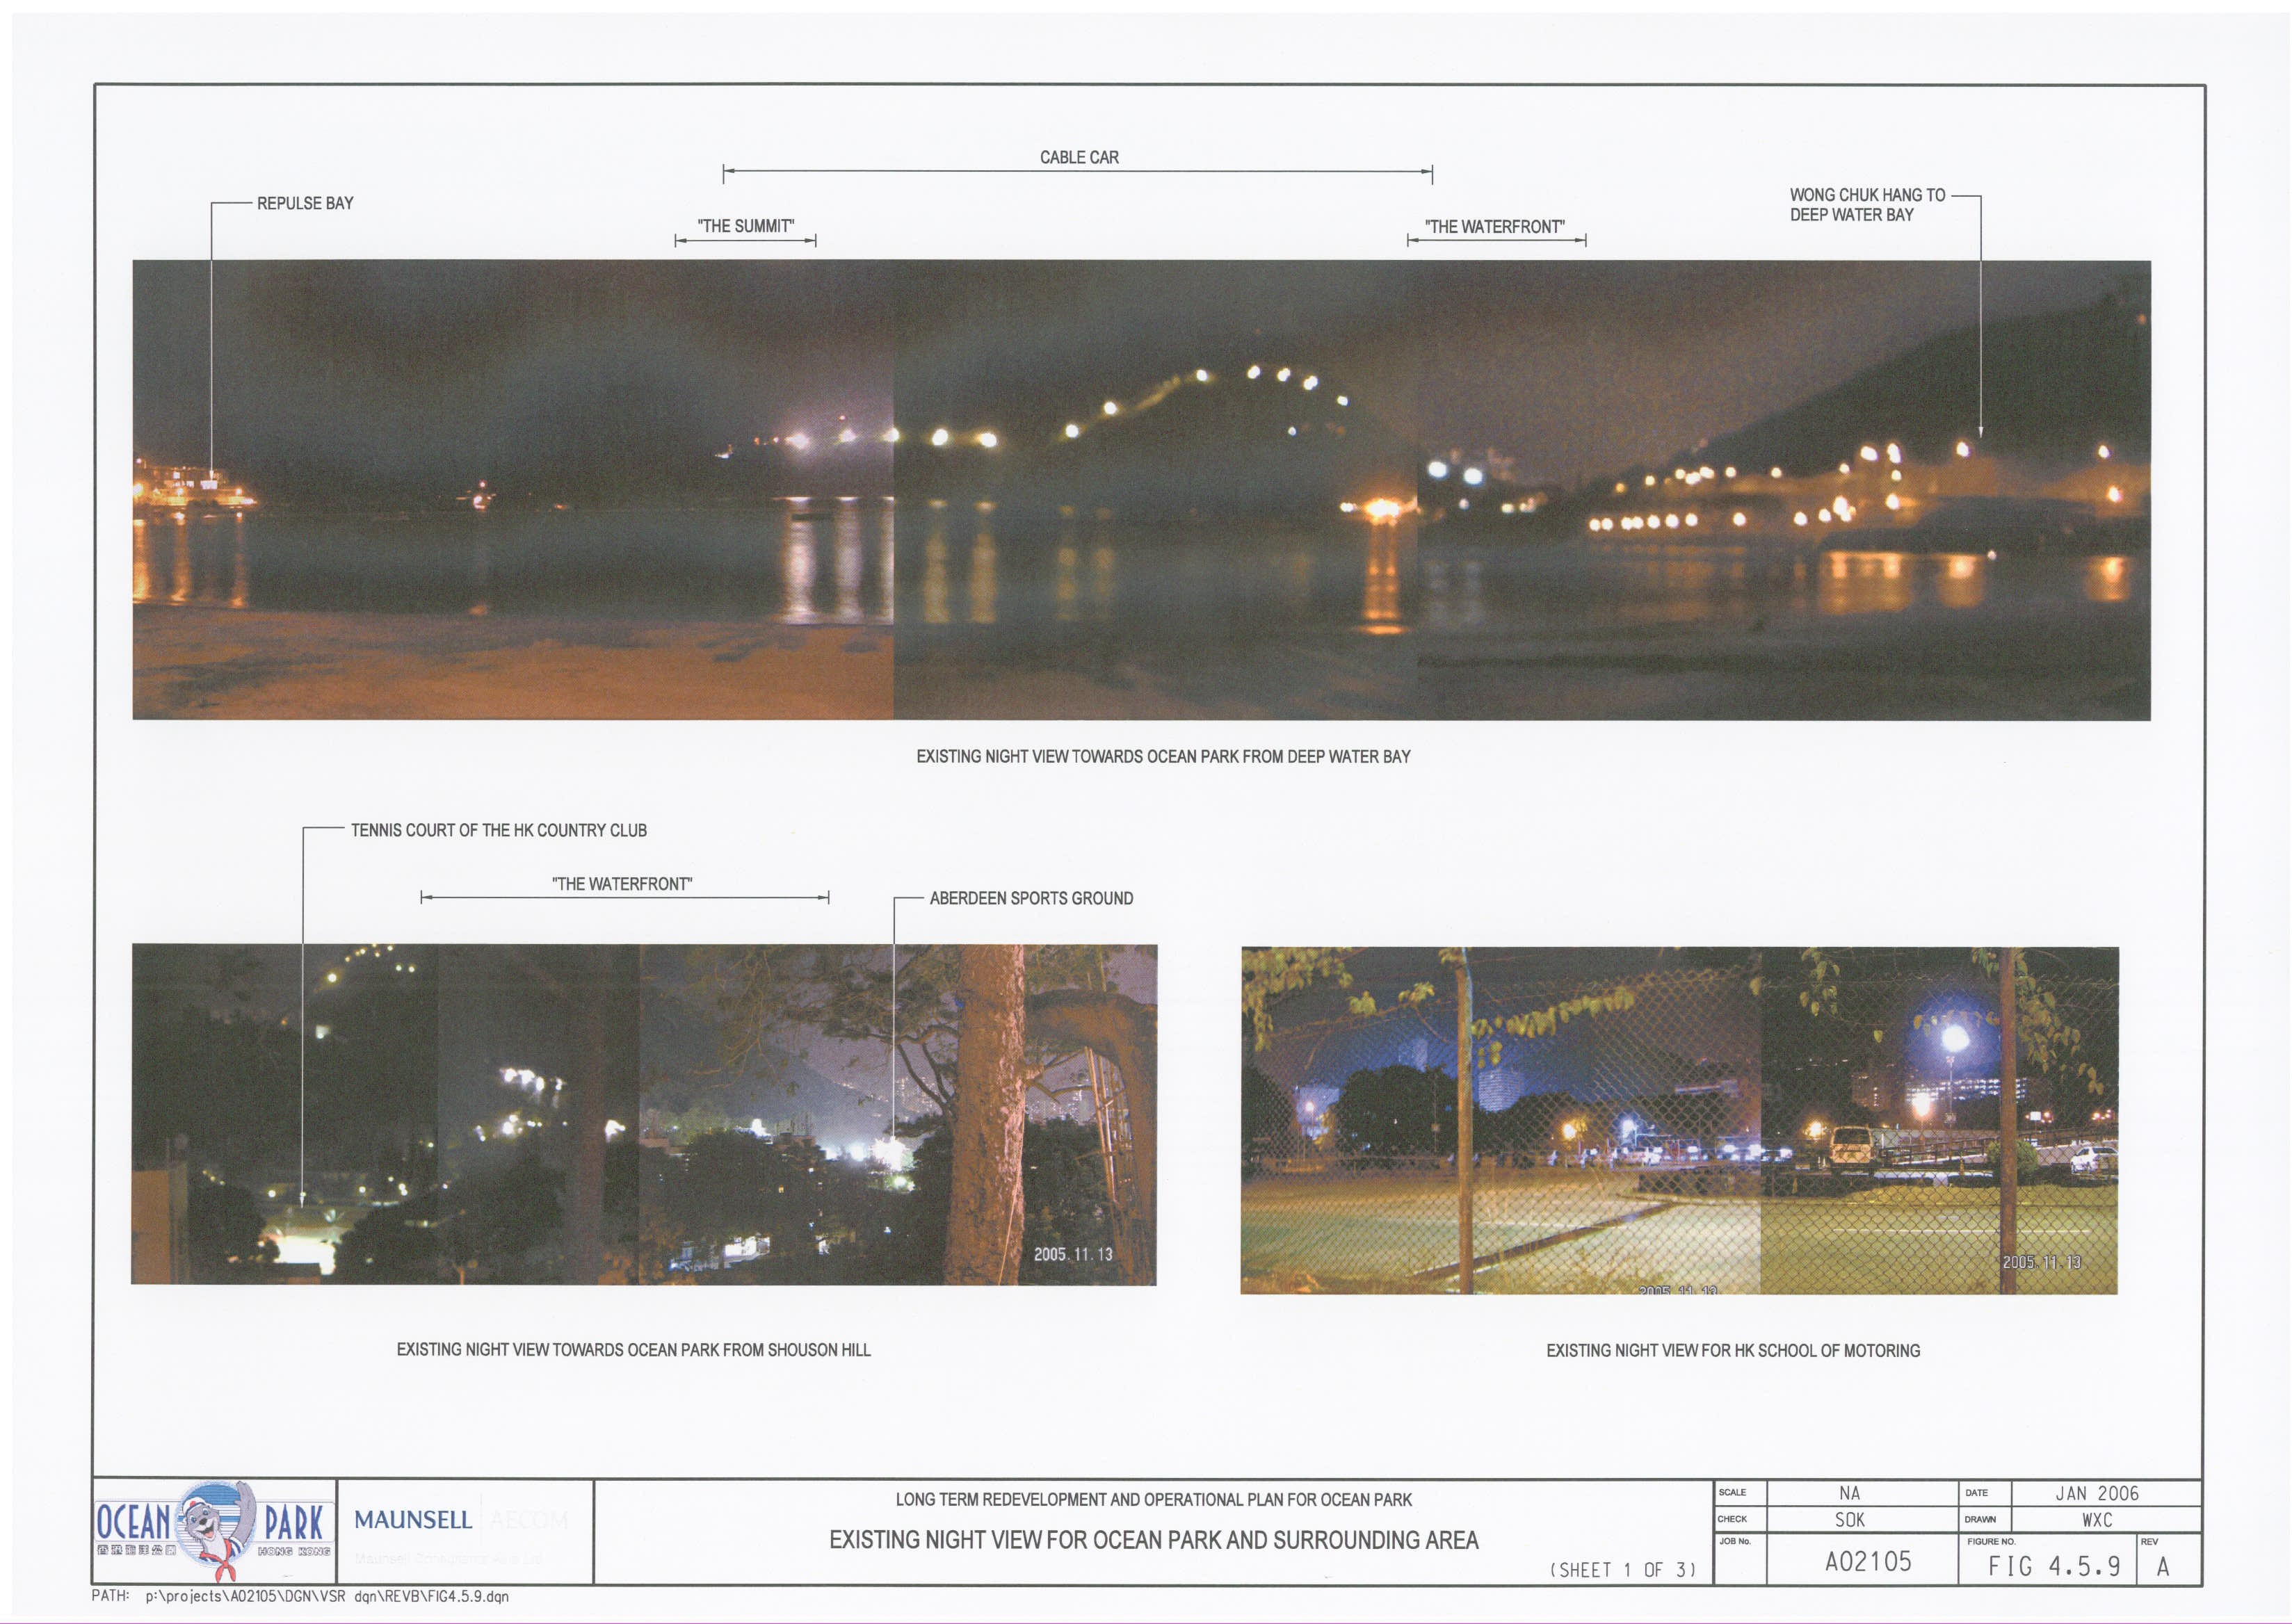
Figure
4.5.9 Existing
Night View for Ocean Park and Surrounding Area – Sheet 1 of 3
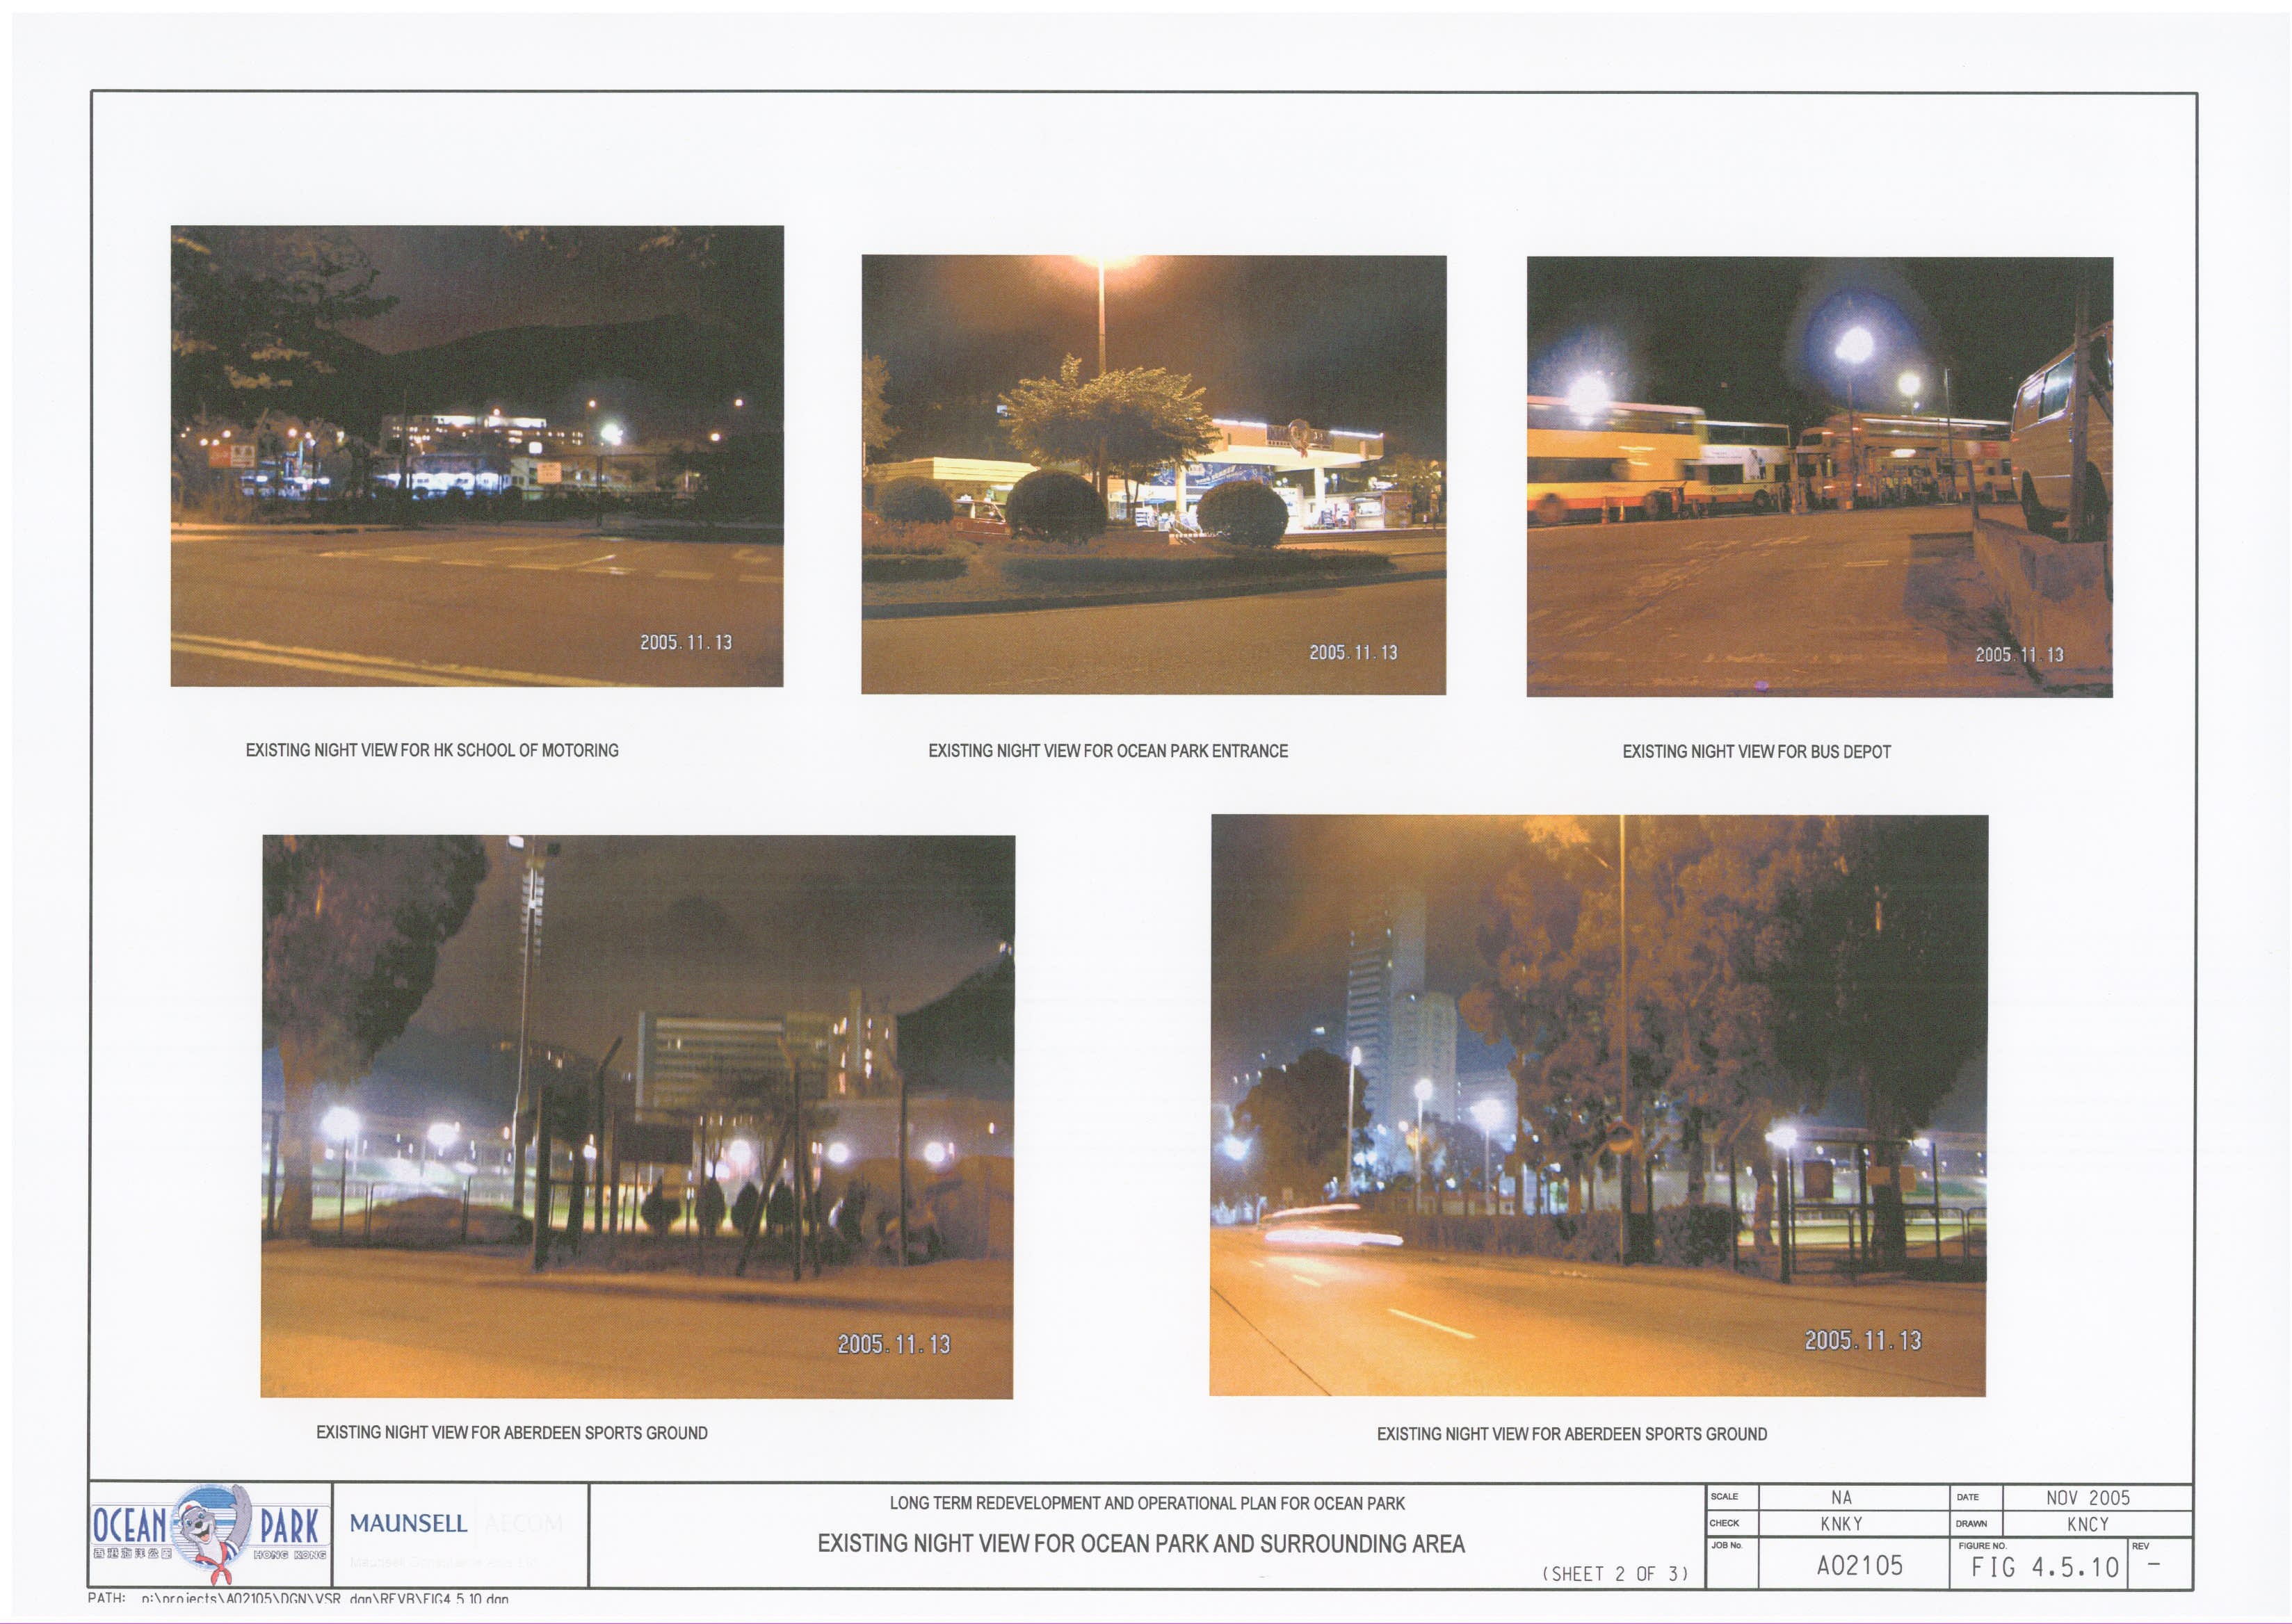
Figure
4.5.10 Existing
Night View for Ocean Park and Surrounding Area – Sheet 2 of 3
Figure
4.5.11 Existing
Night View for Ocean Park and Surrounding Area – Sheet 3 of 3
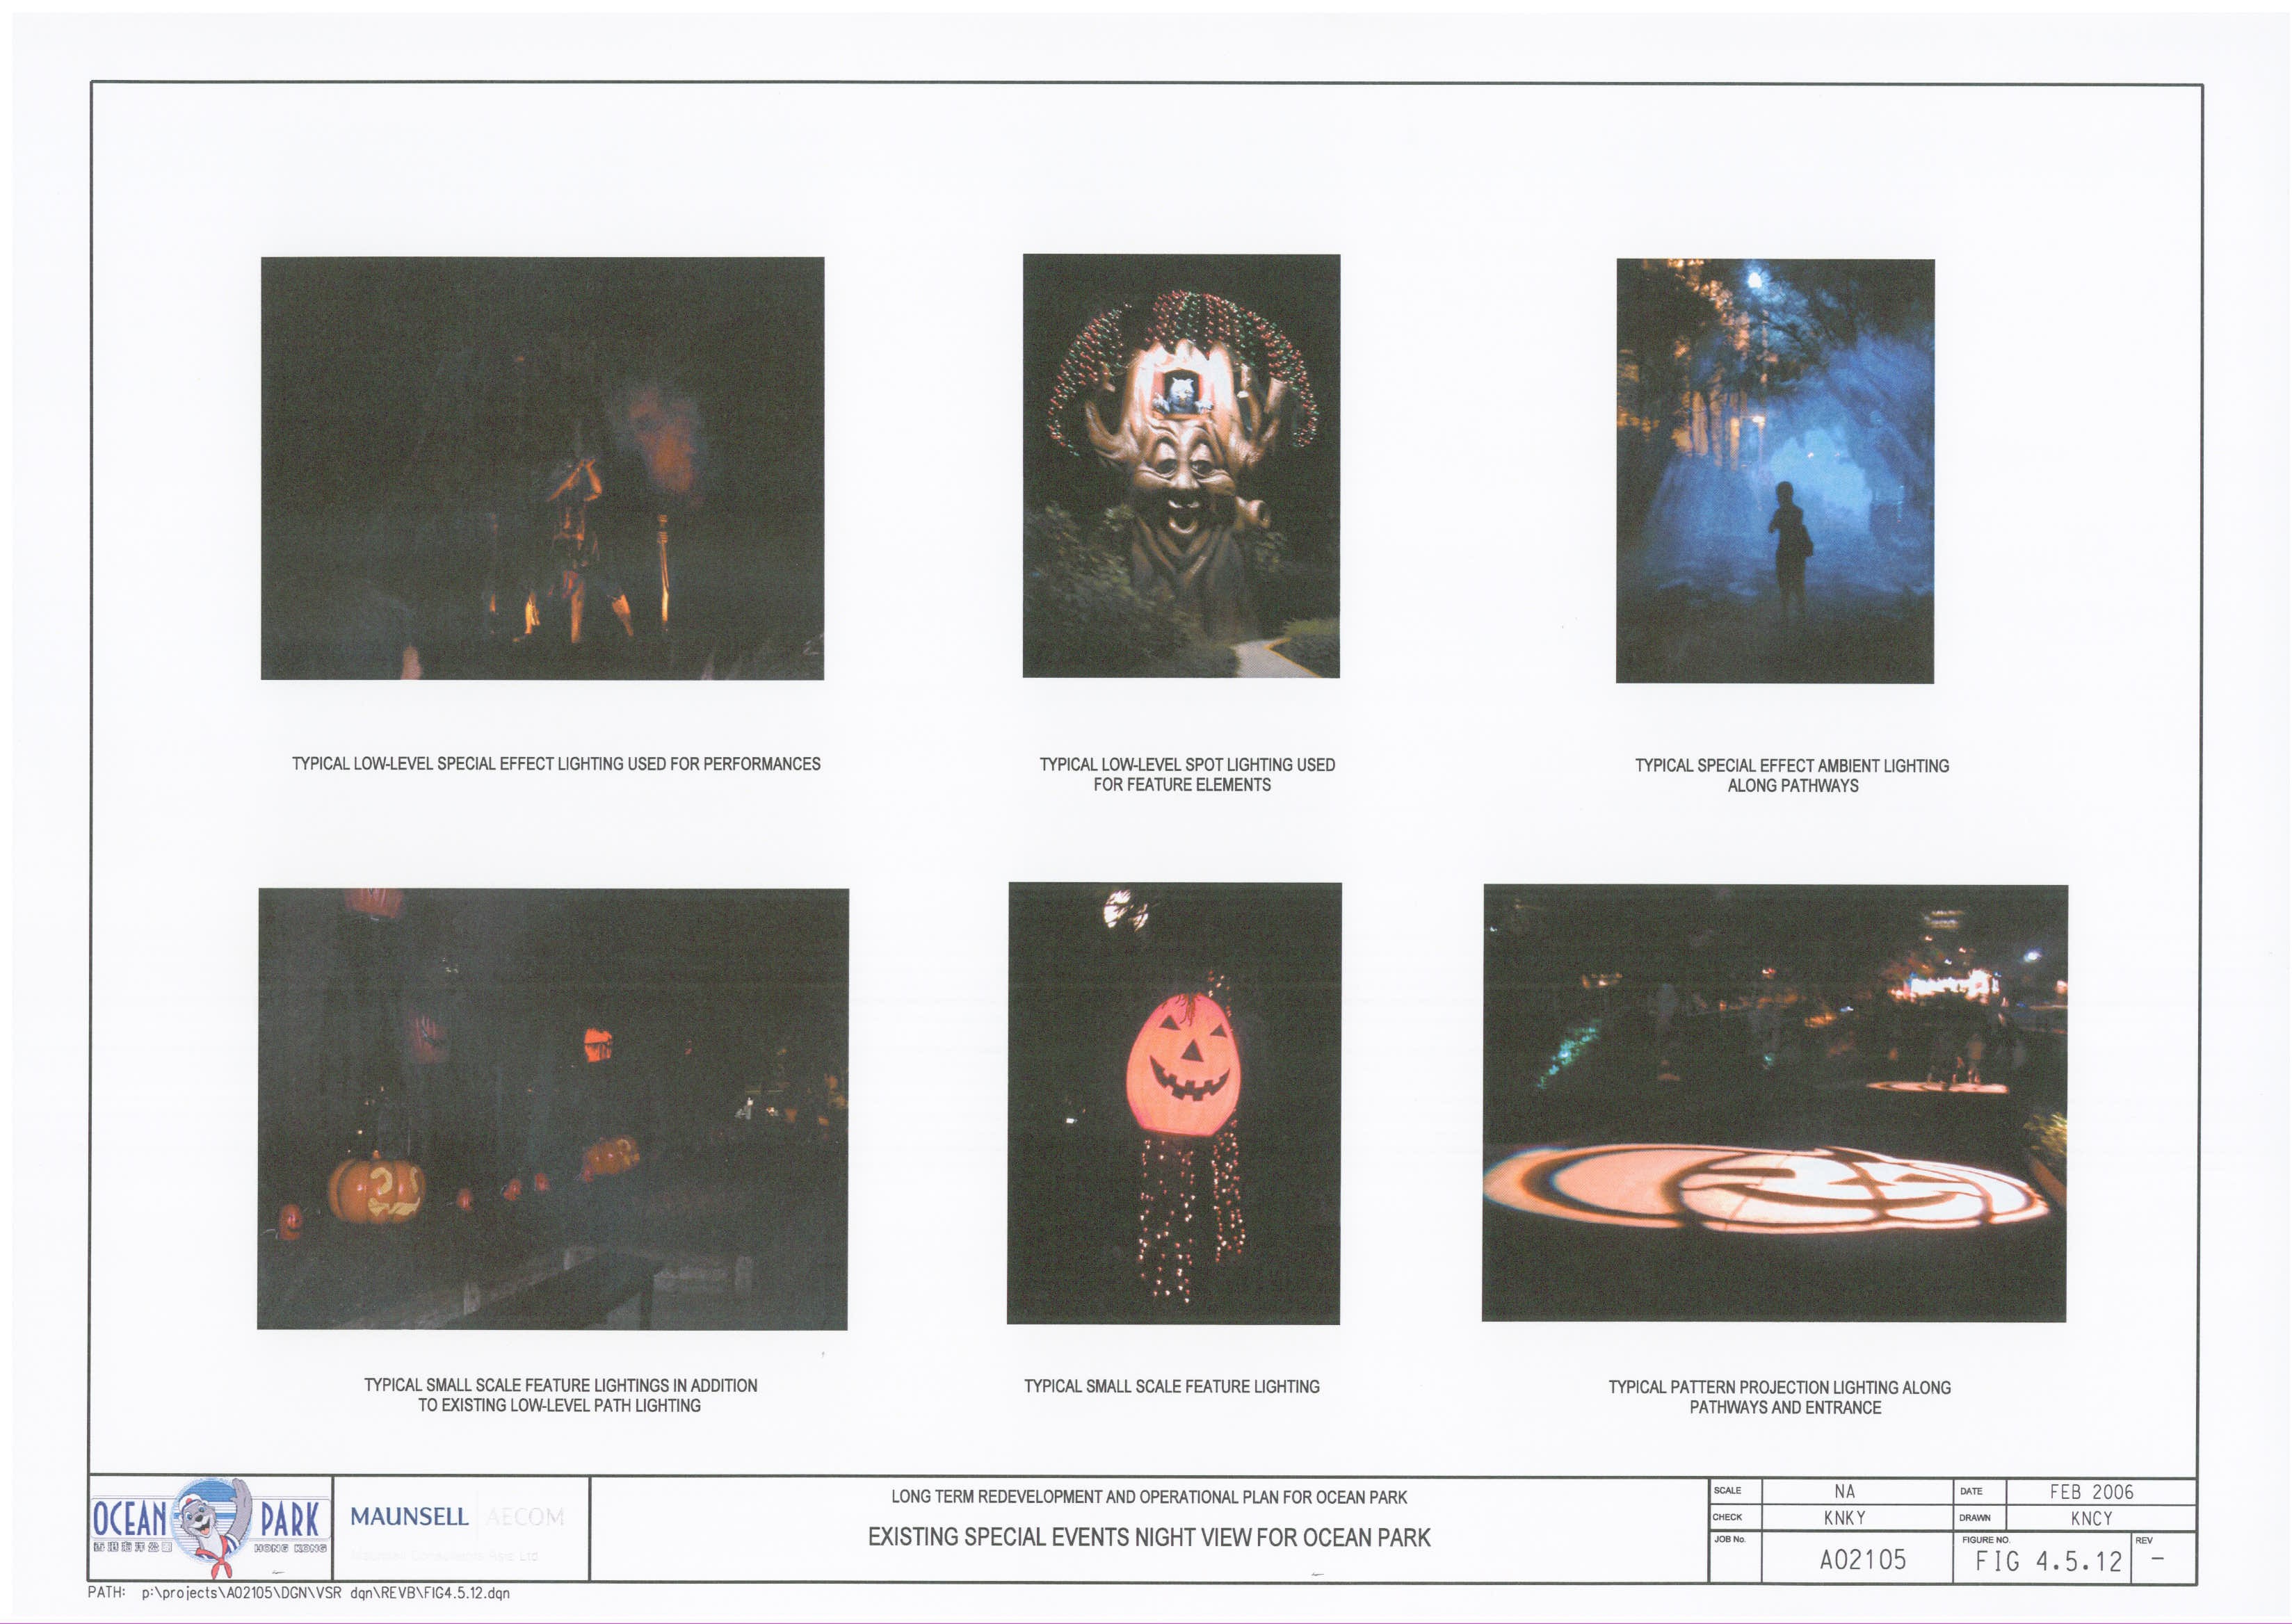
Figure
4.5.12 Existing
Special Events Night View for Ocean Park
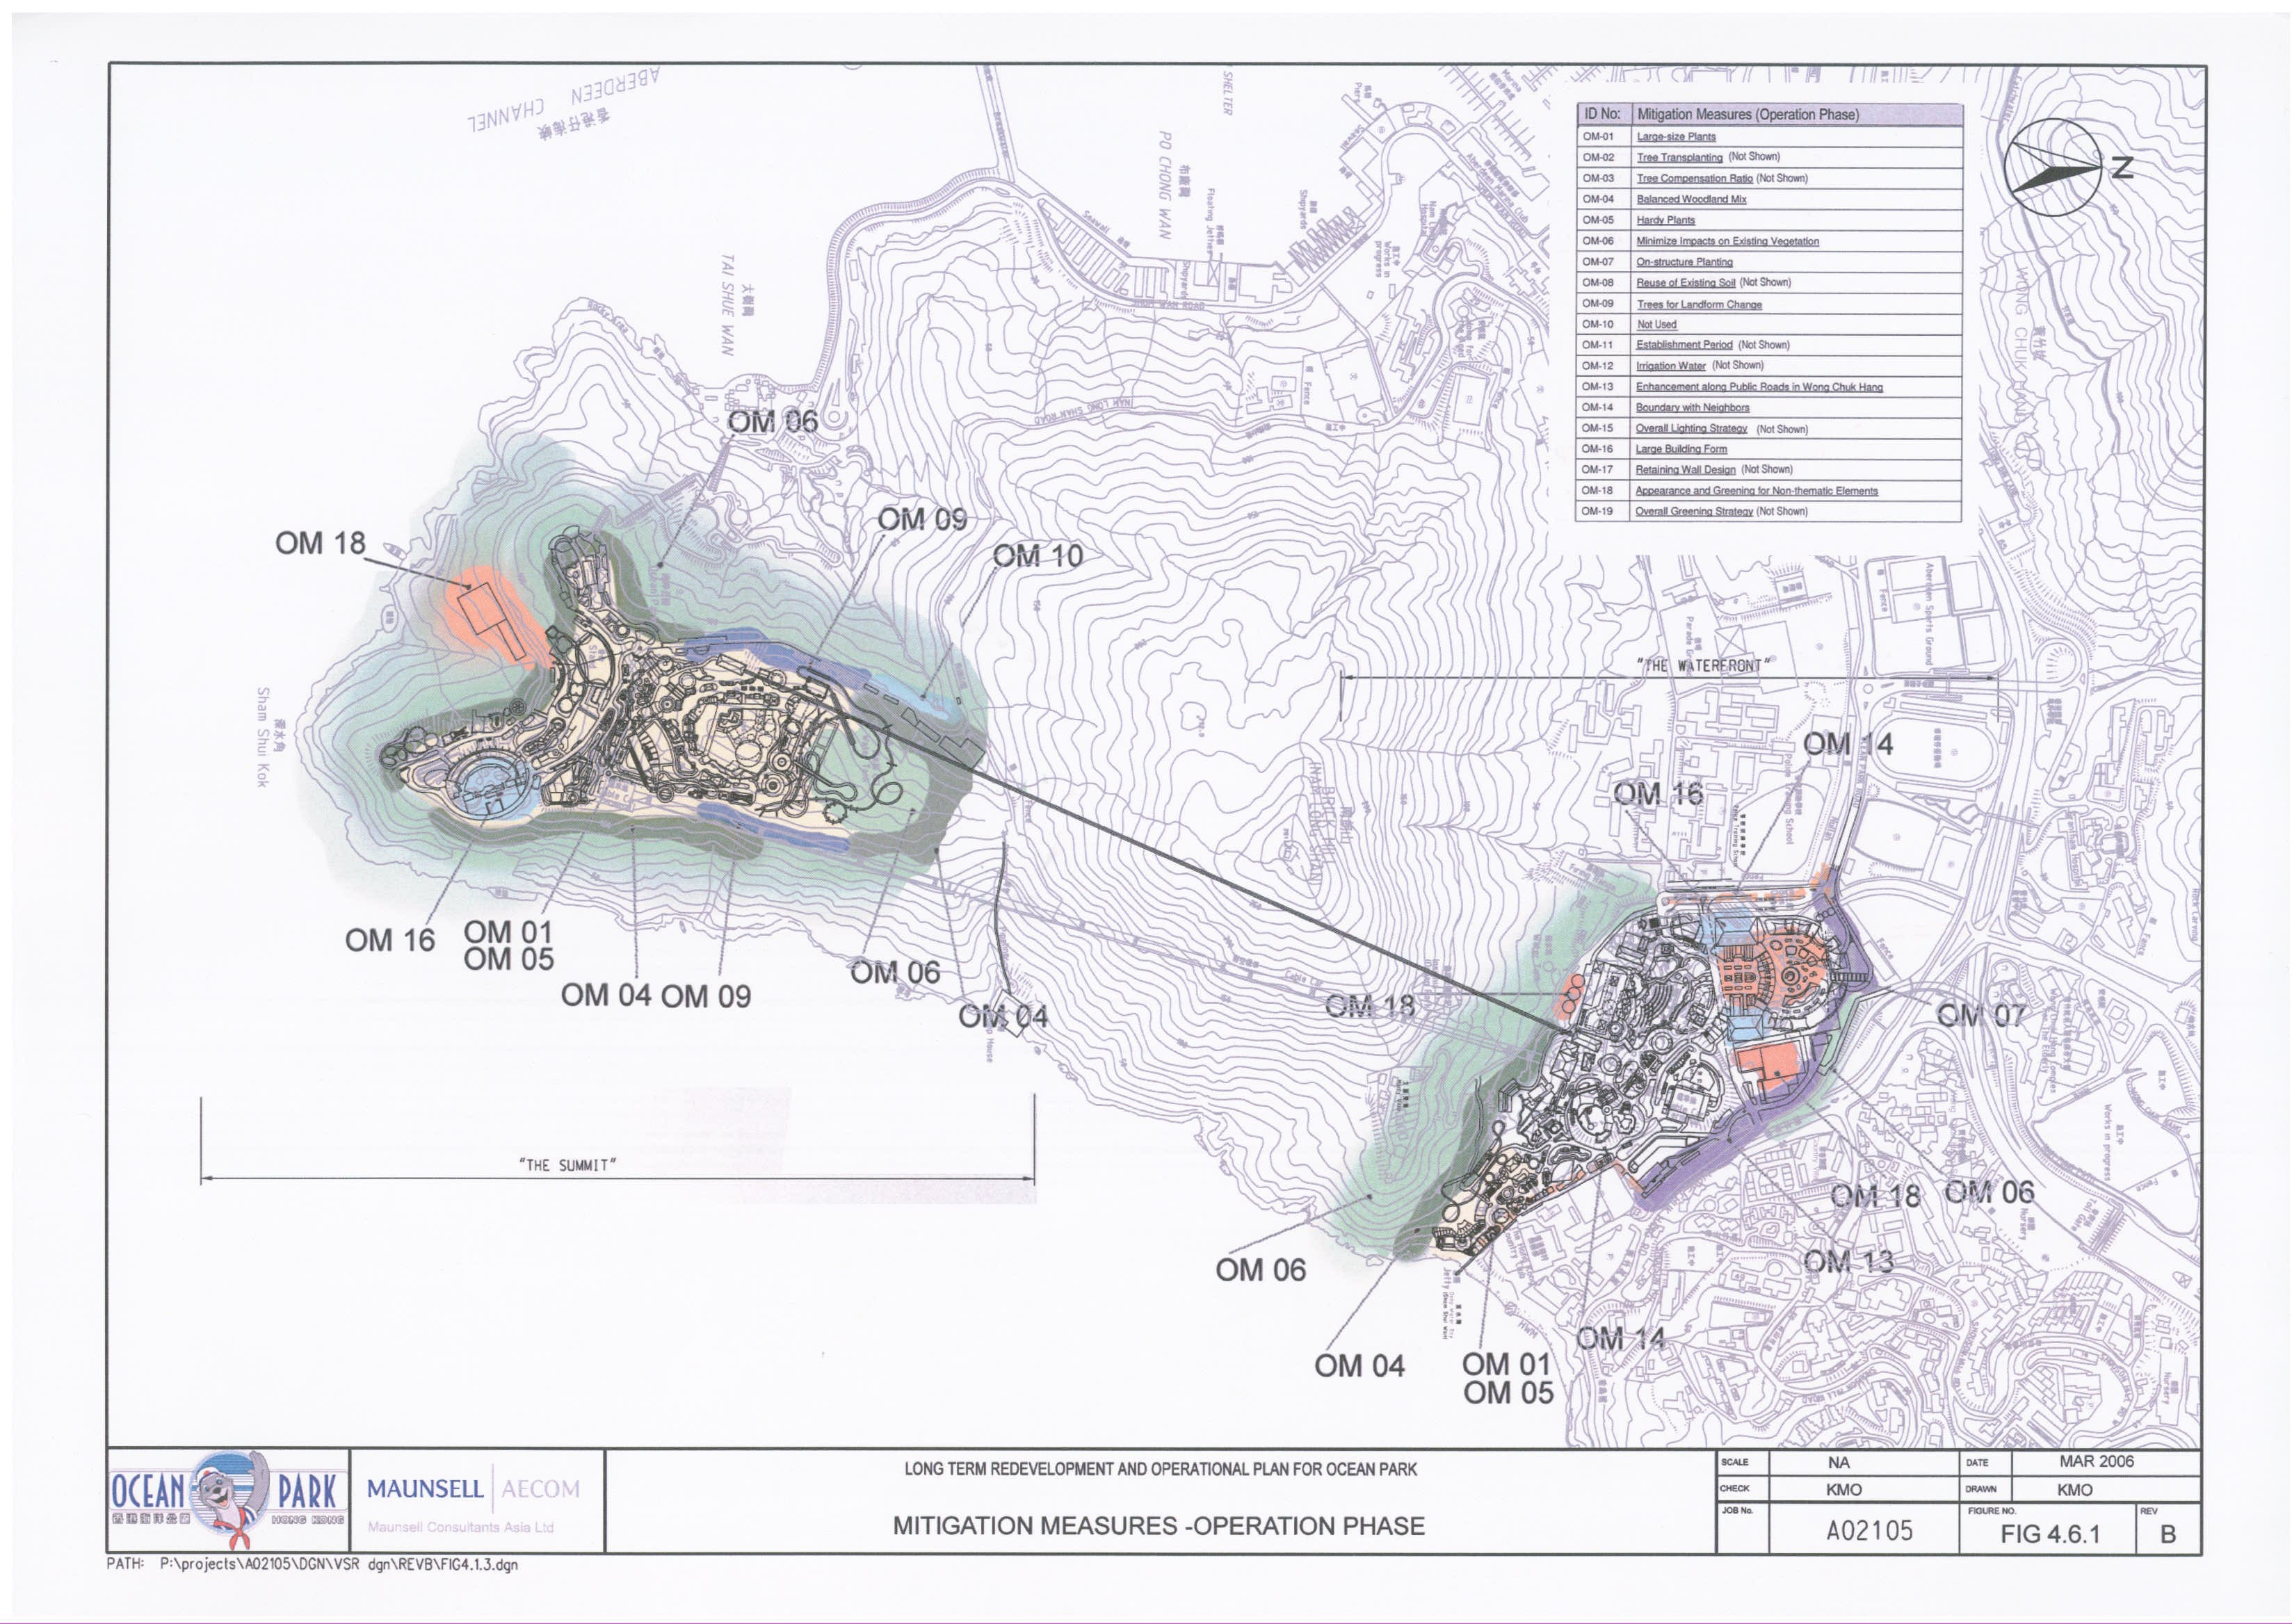
Figure
4.6.1 Mitigation
measures – Operation Phase
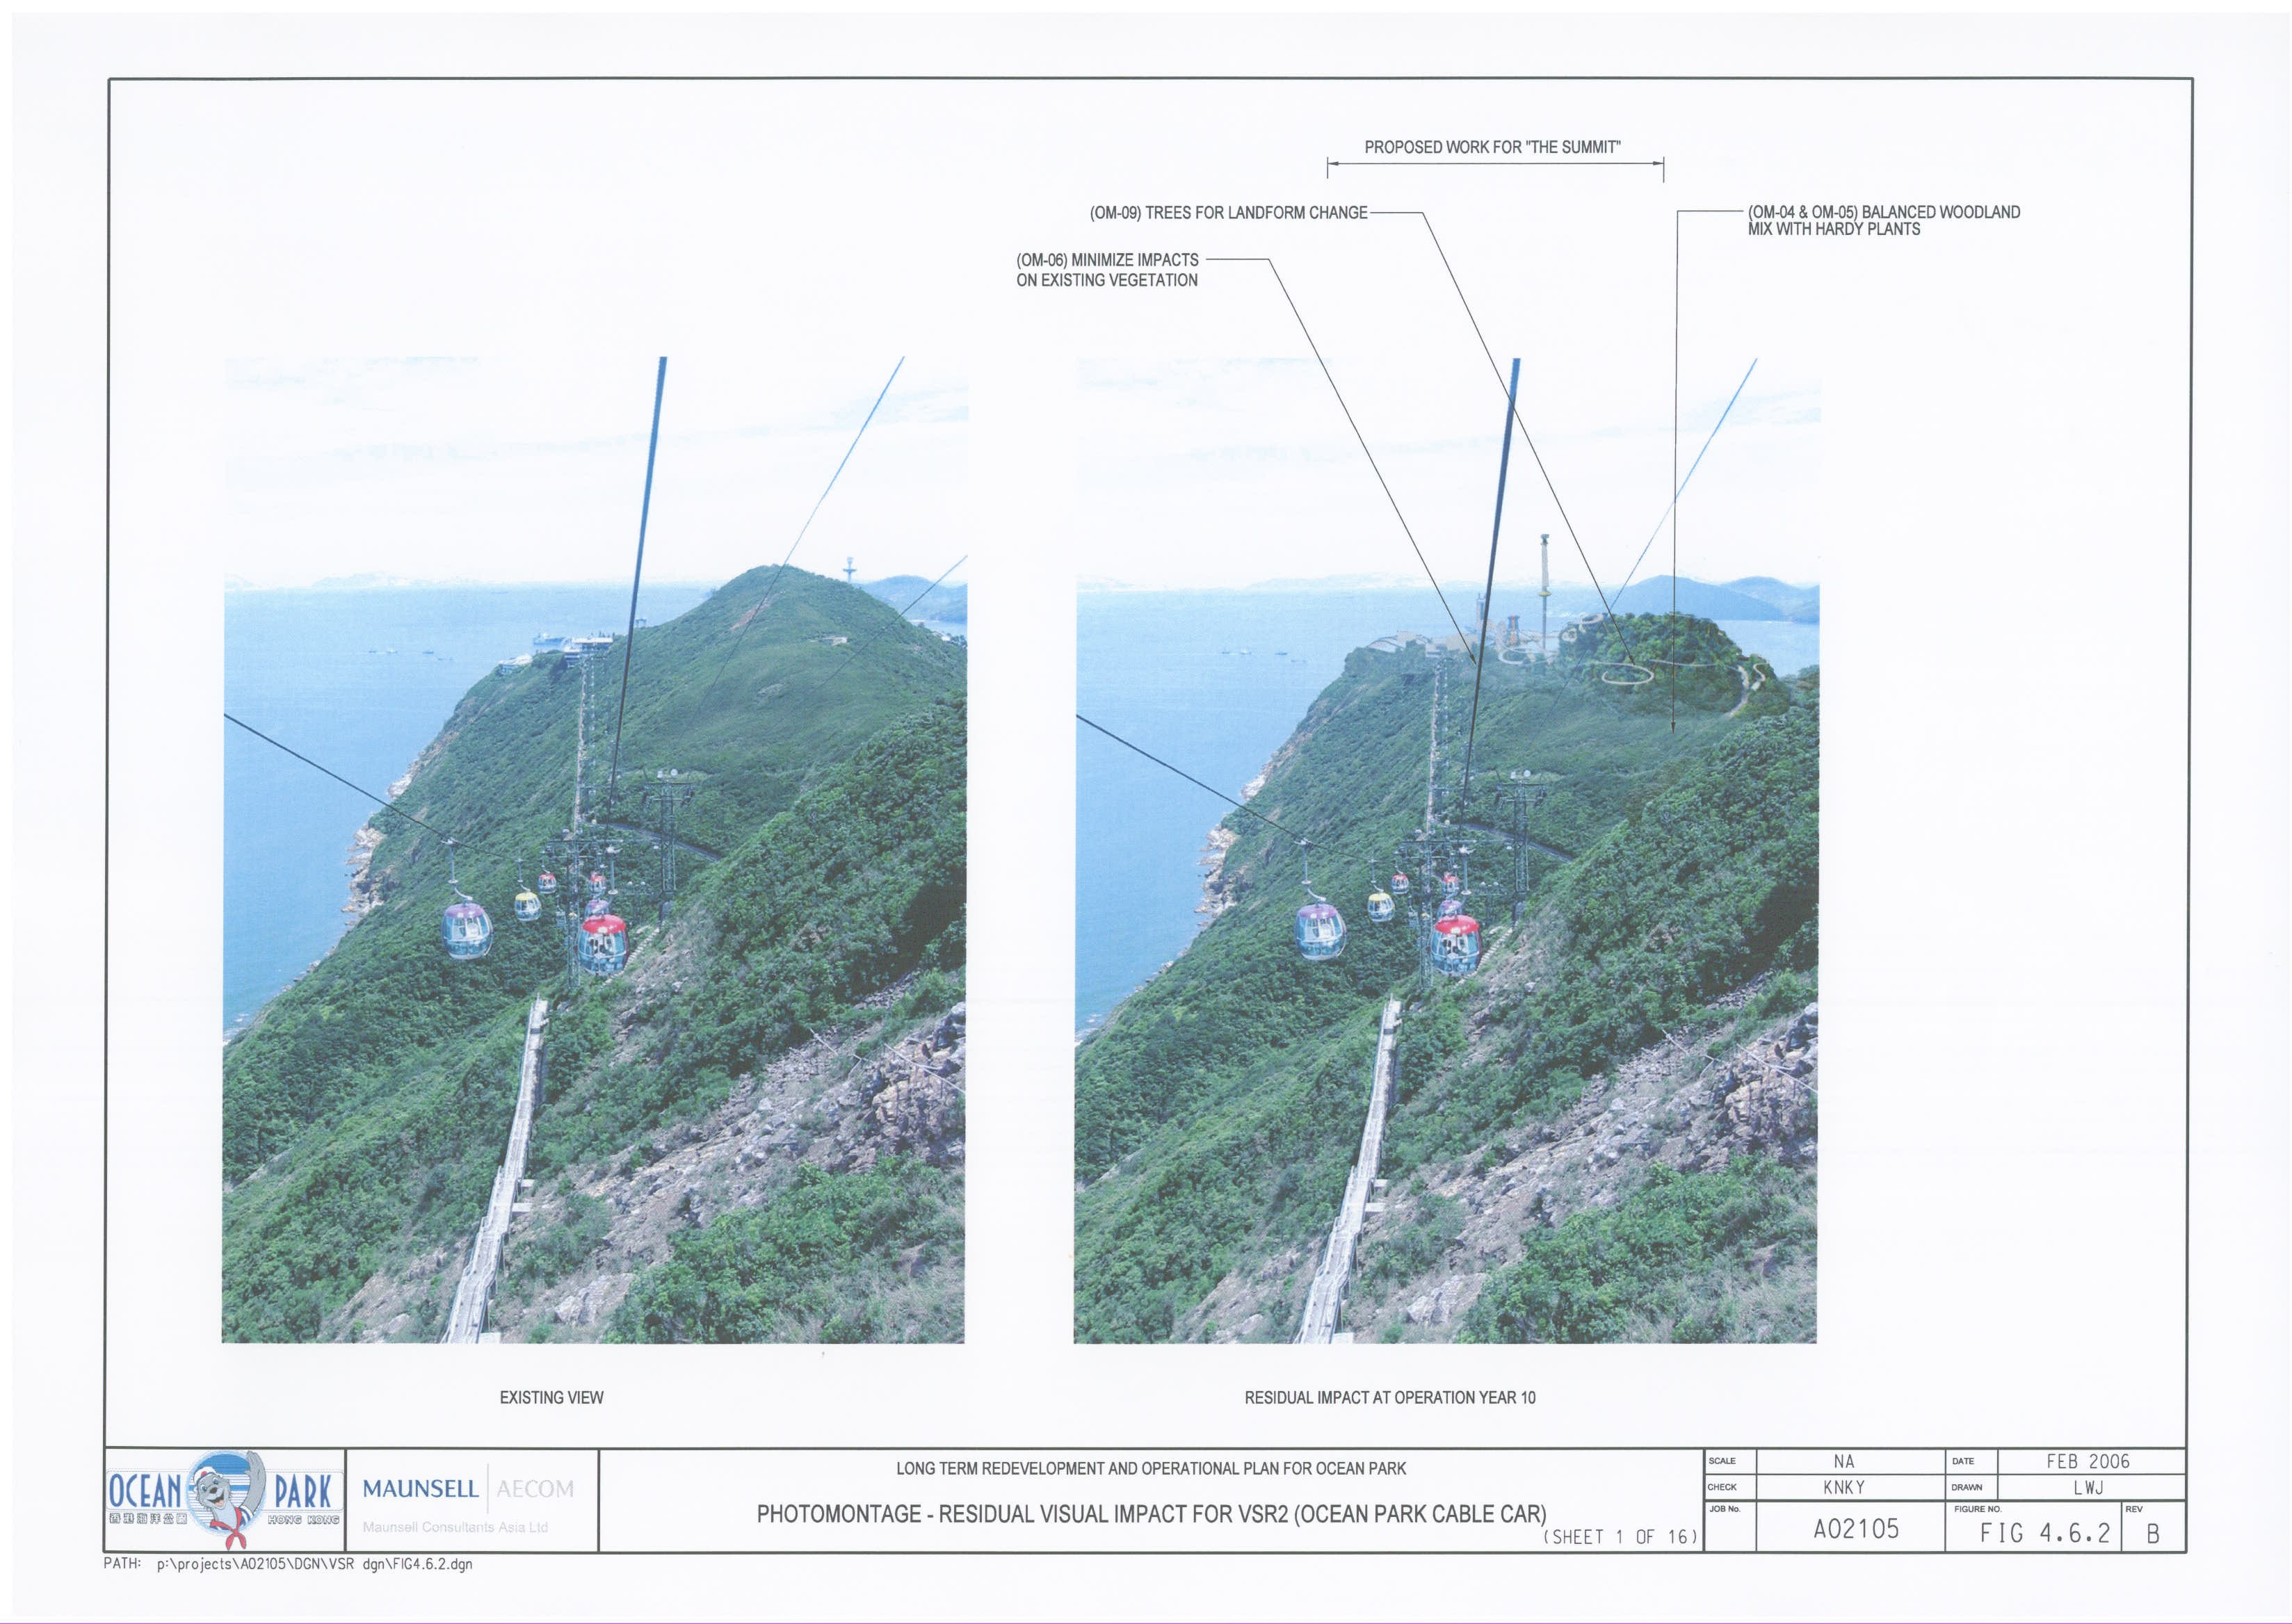
Figure
4.6.2 Photomontage
– Residual Visual Impact for VSR2 (Ocean Park Cable Car) – Sheet 1 of 16
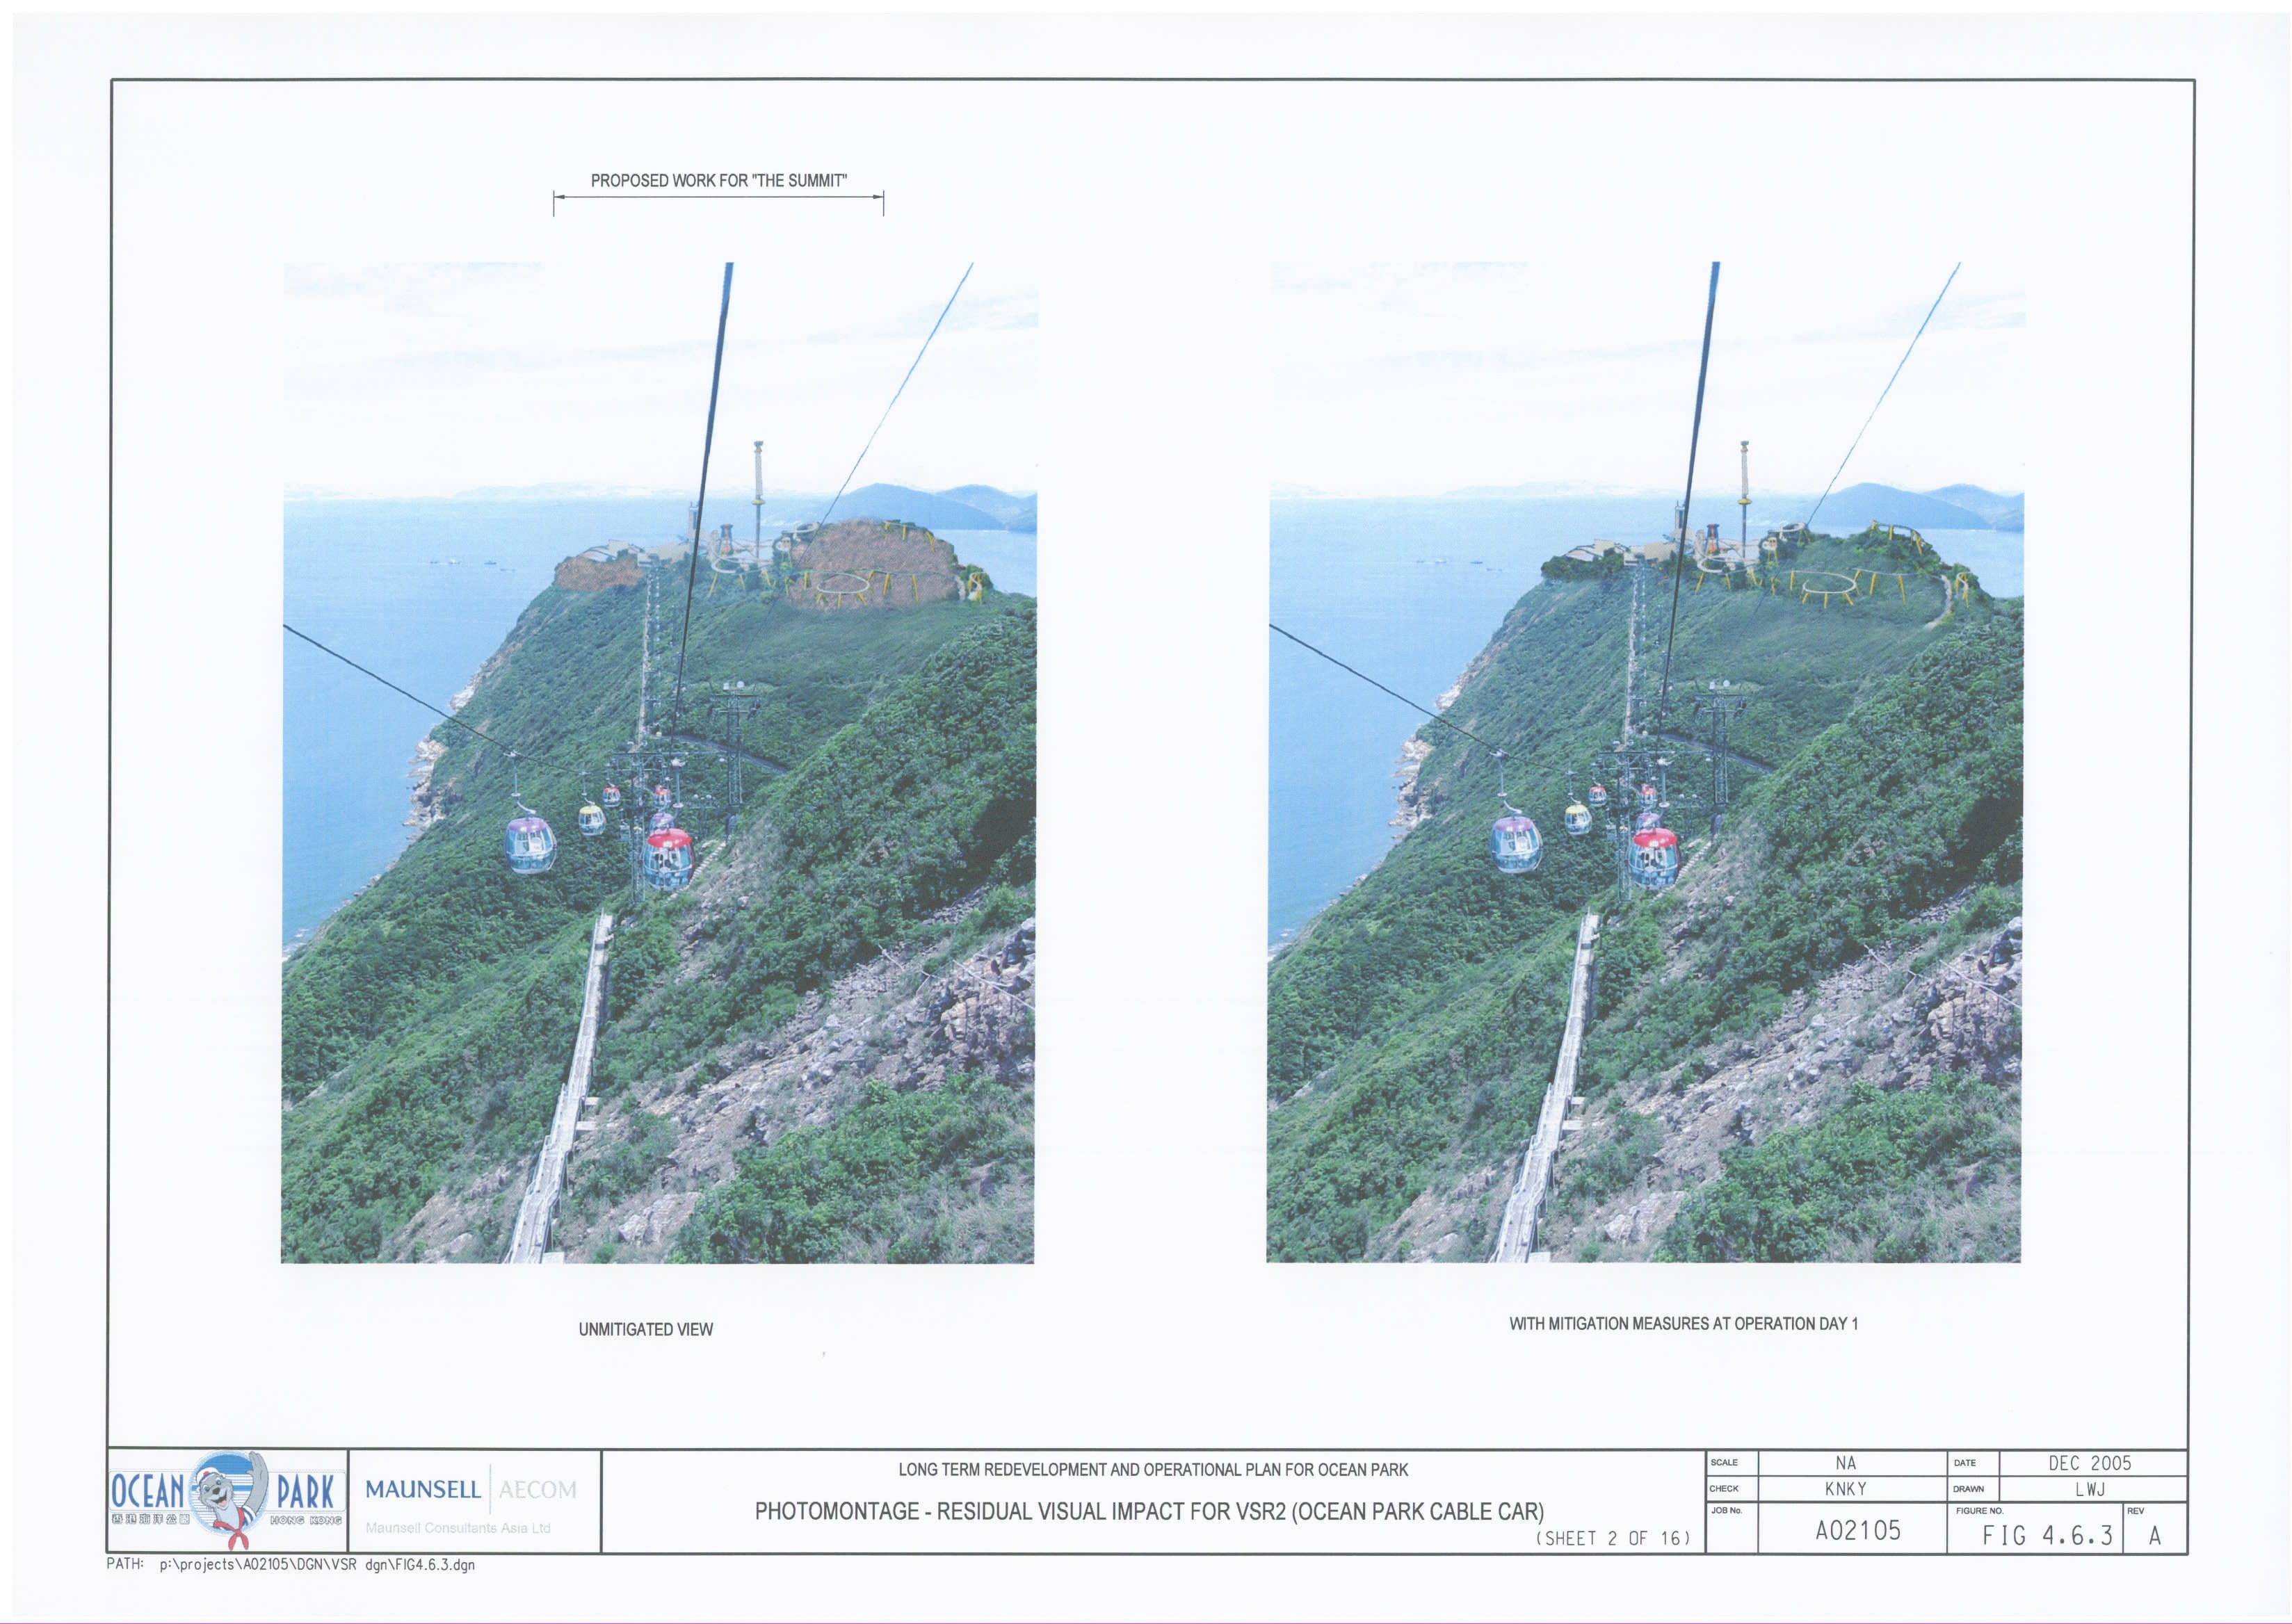
Figure
4.6.3 Photomontage
– Residual Visual Impact for VSR2 (Ocean Park Cable Car) – Sheet 2 of 16
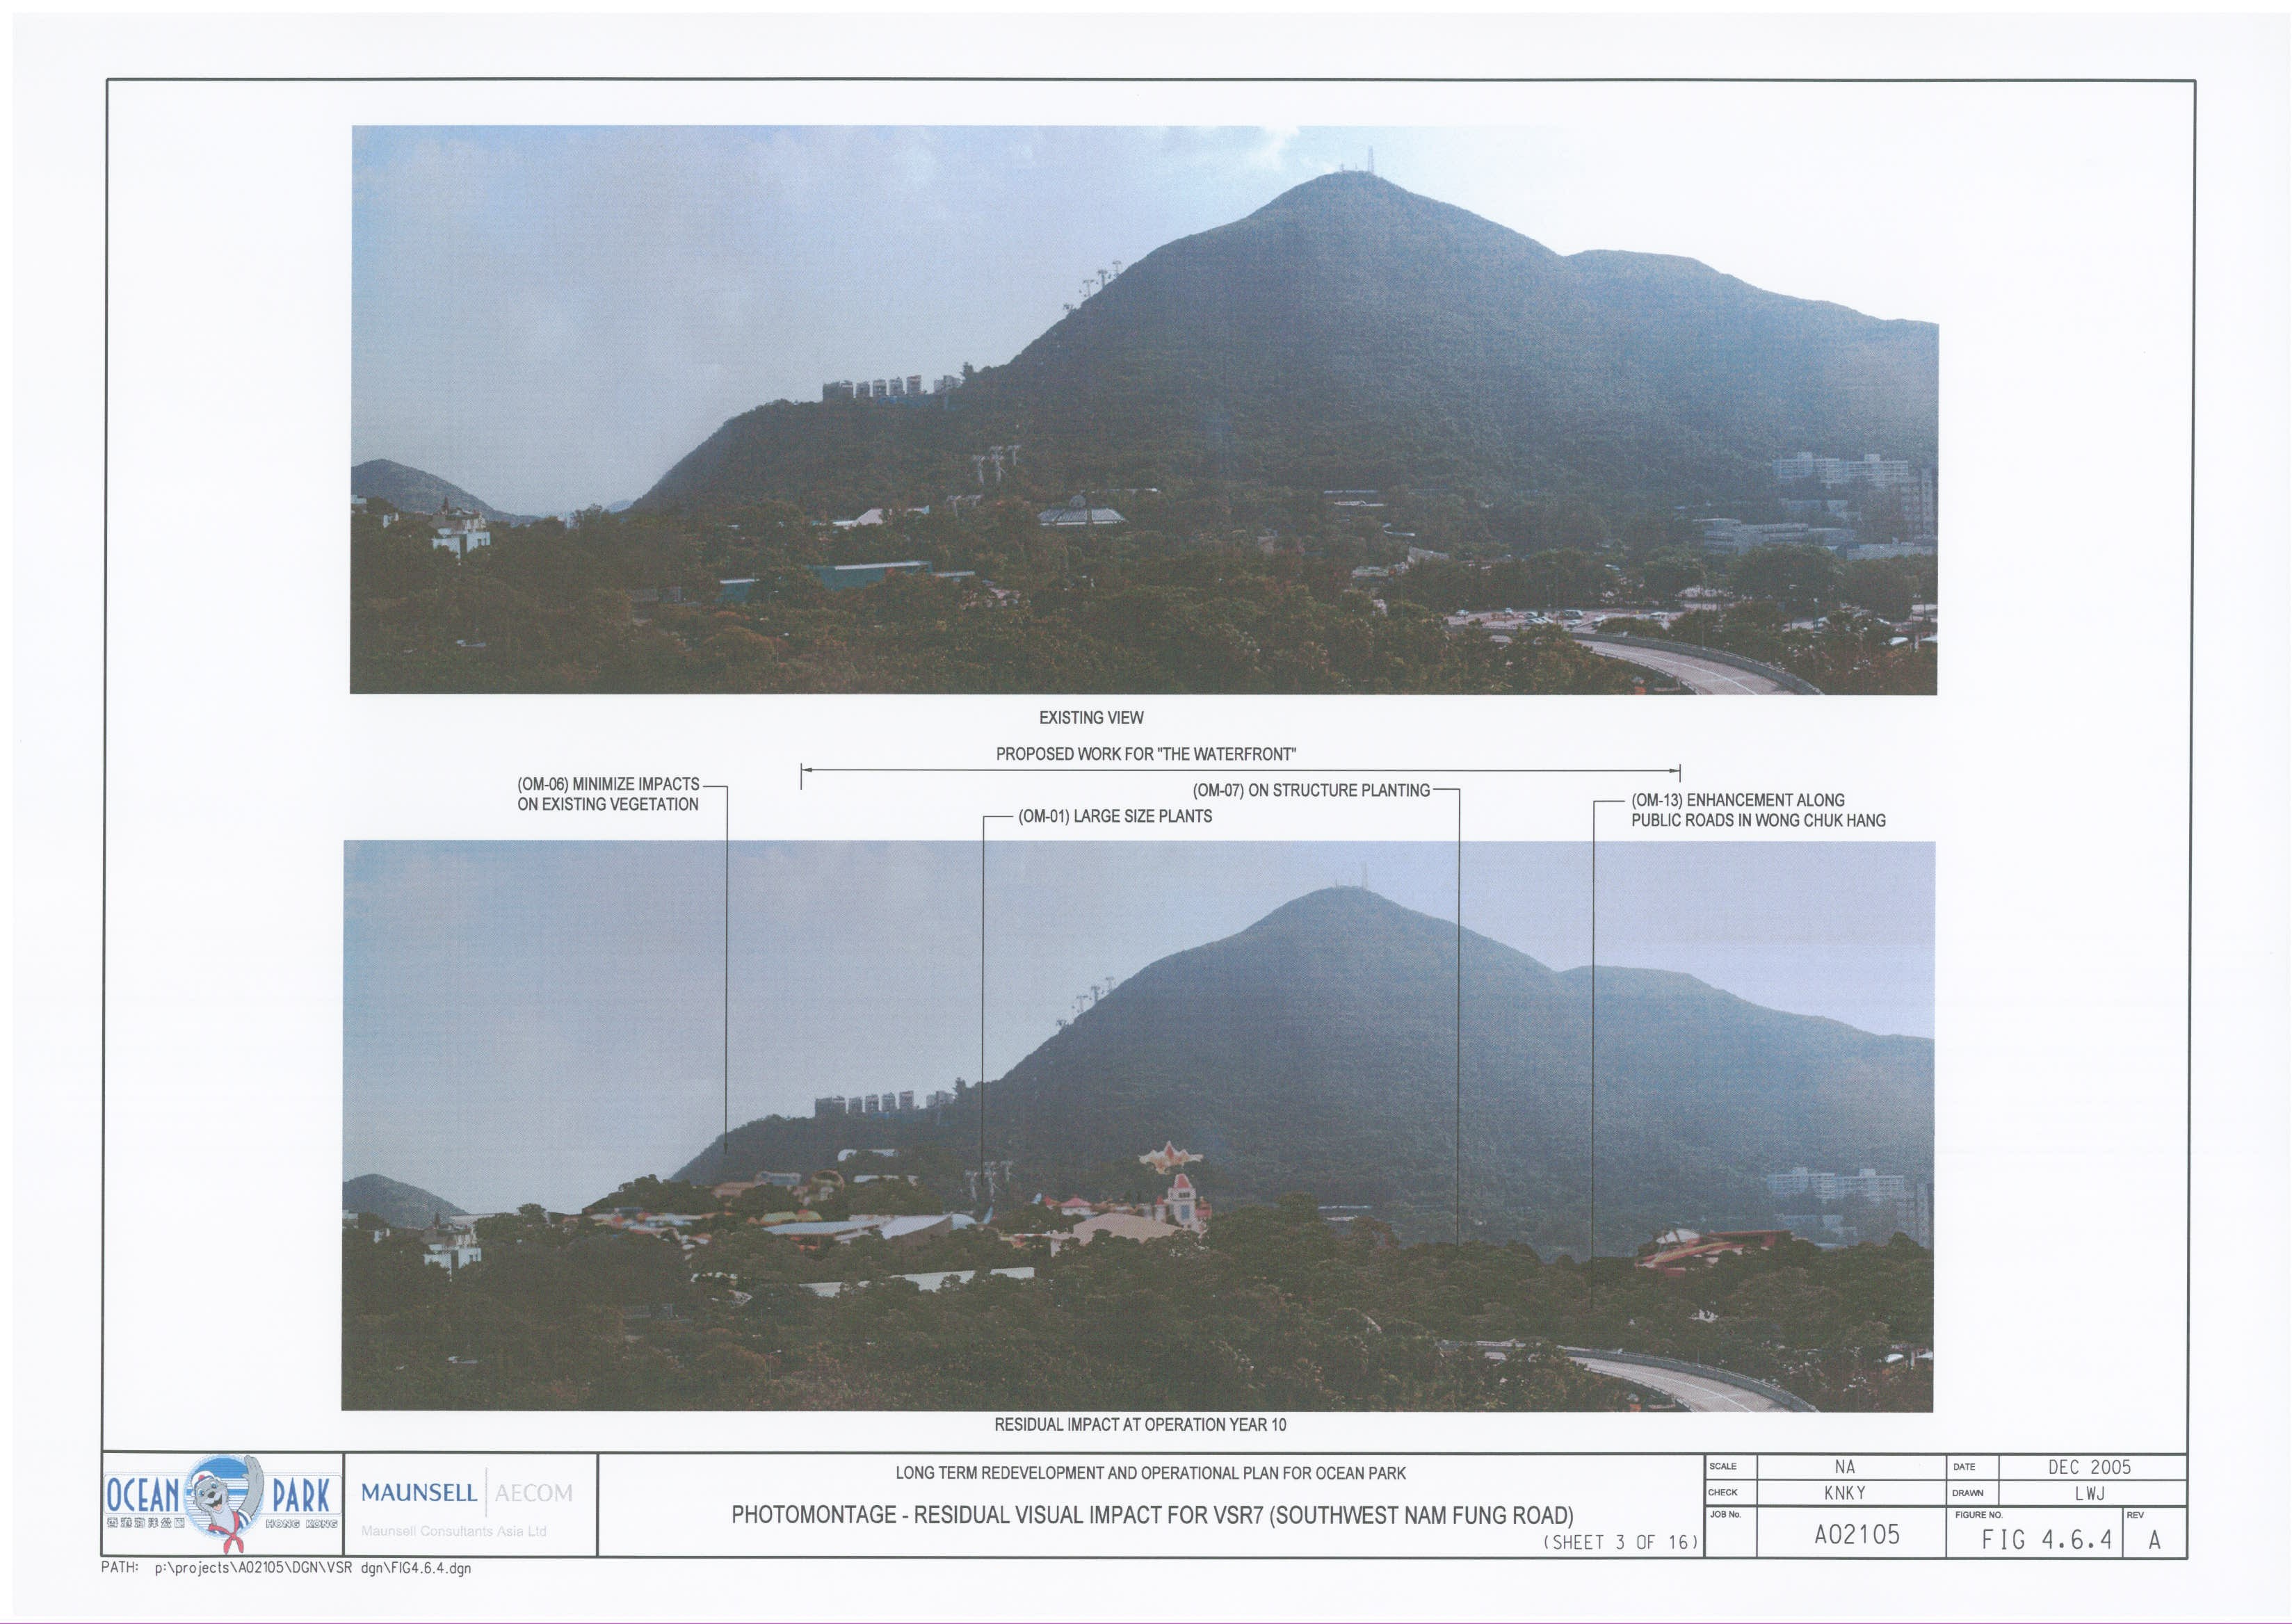
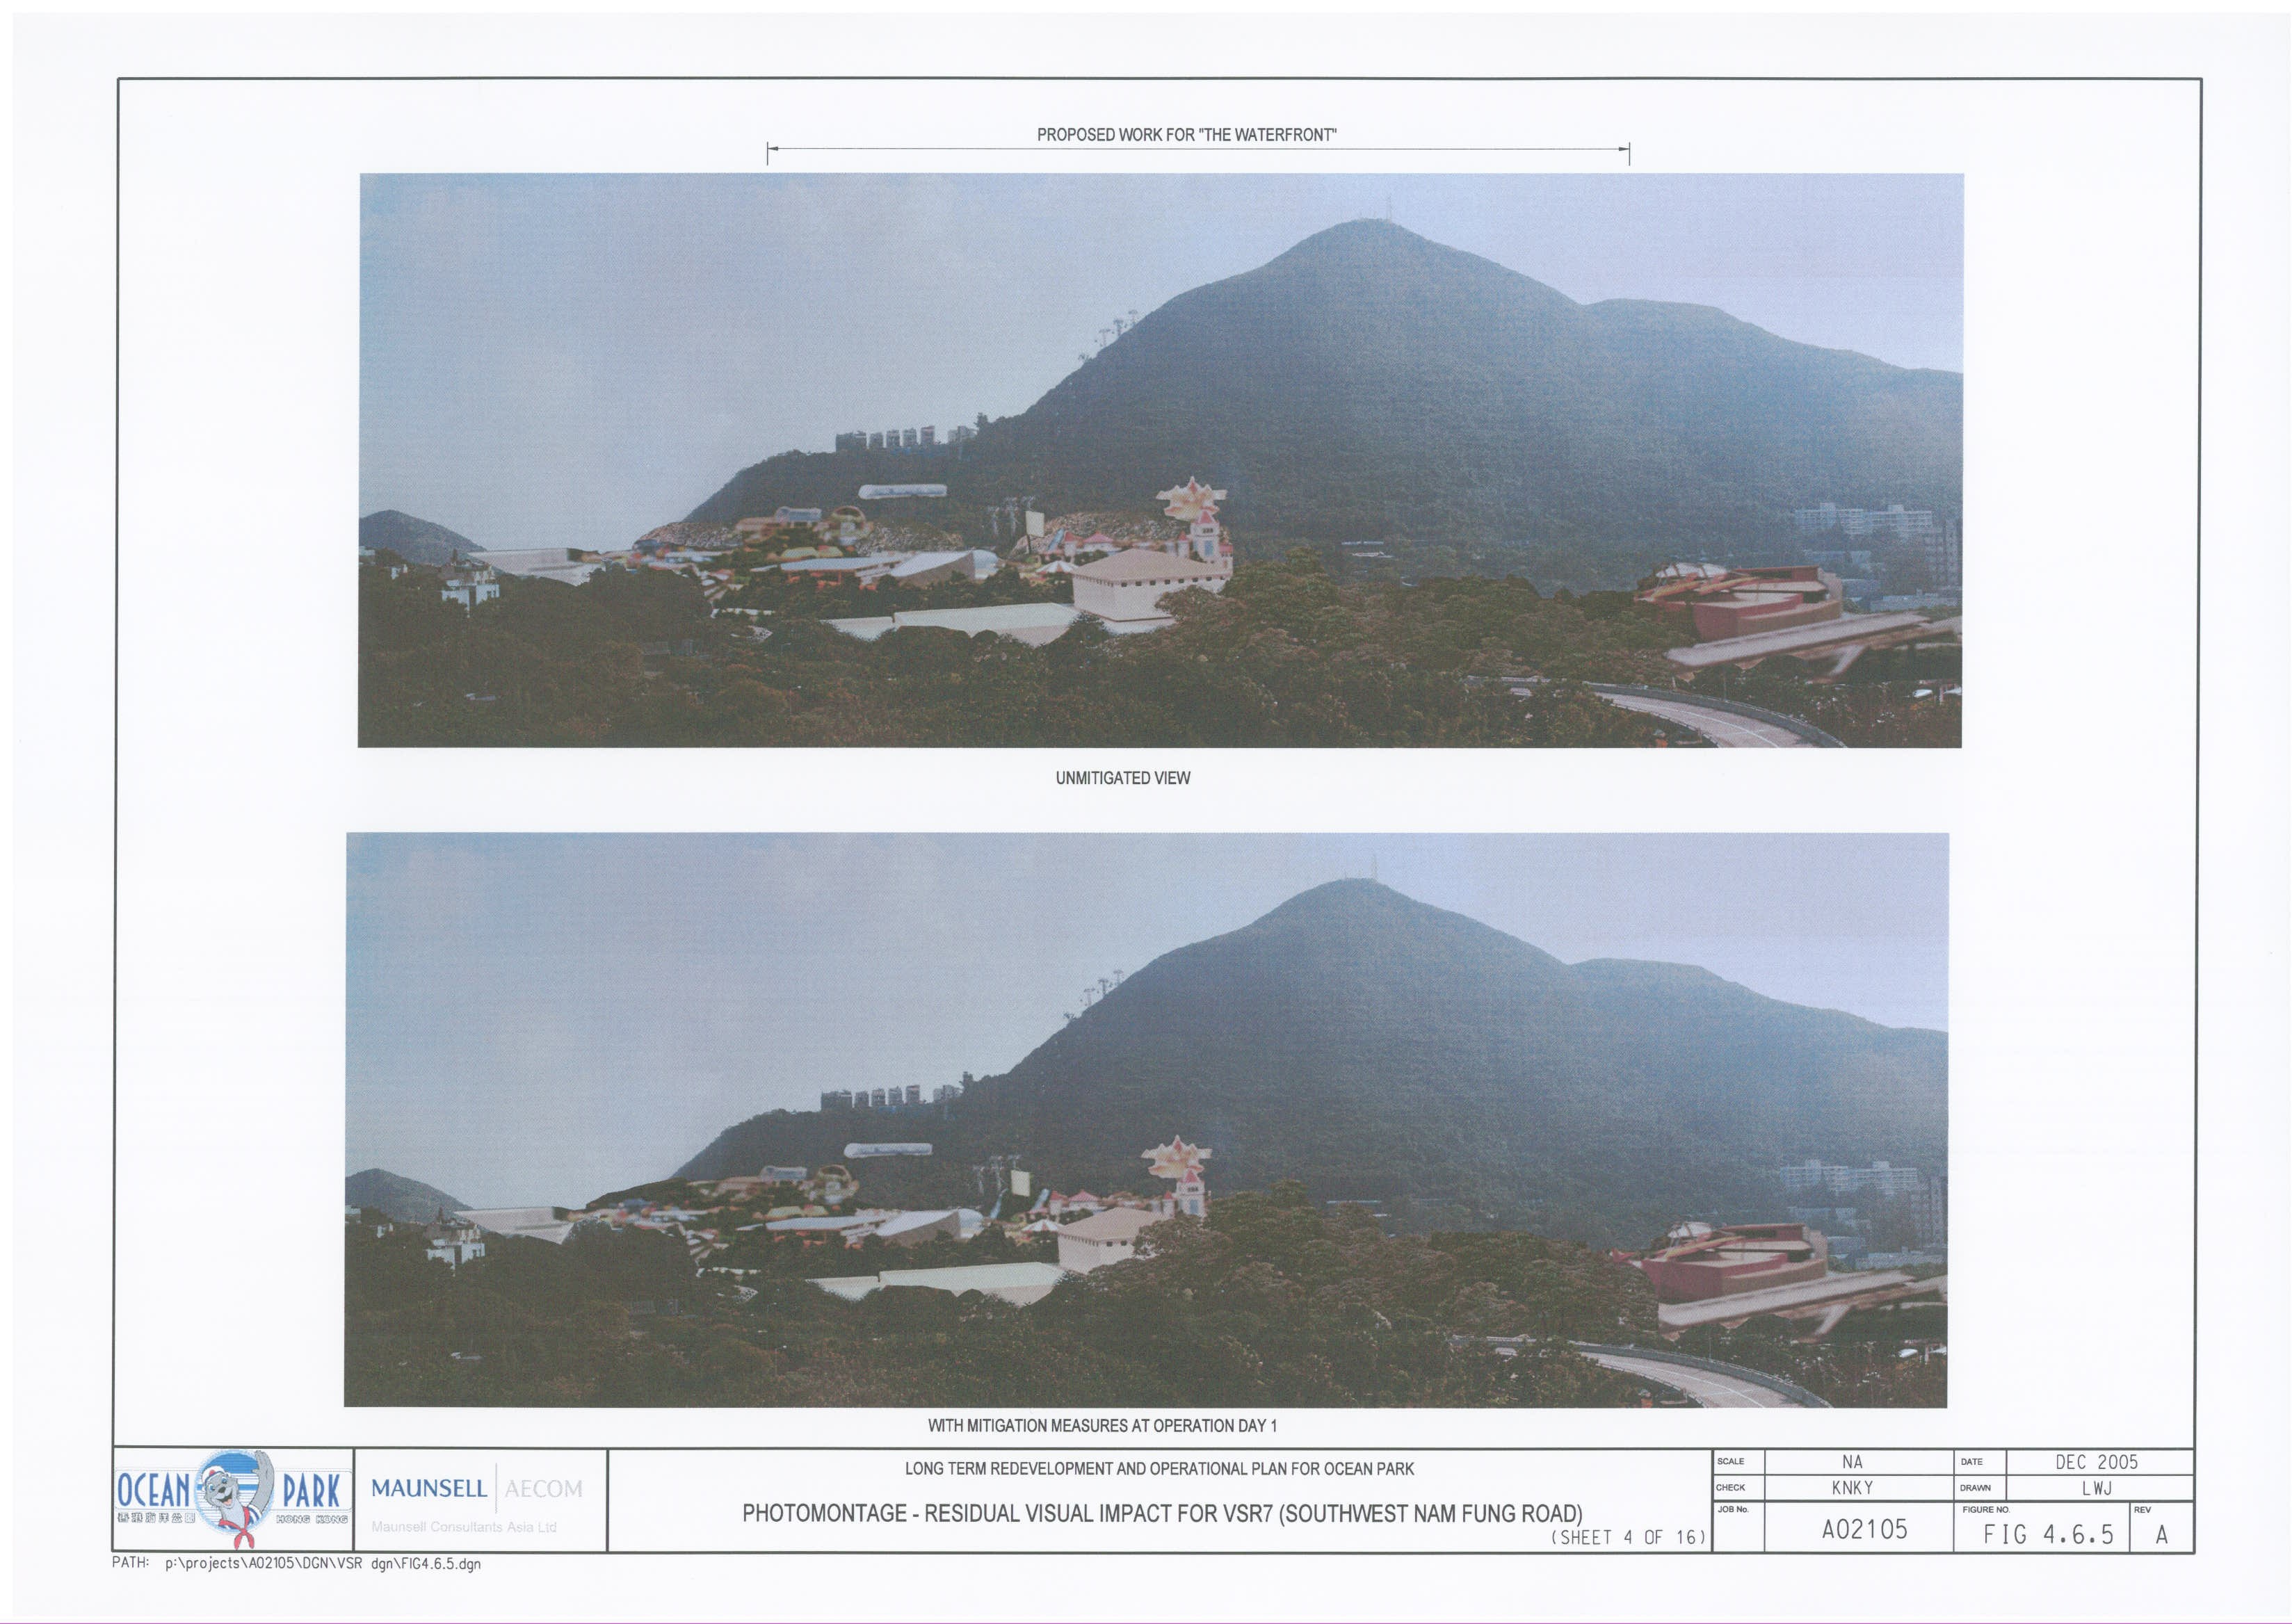
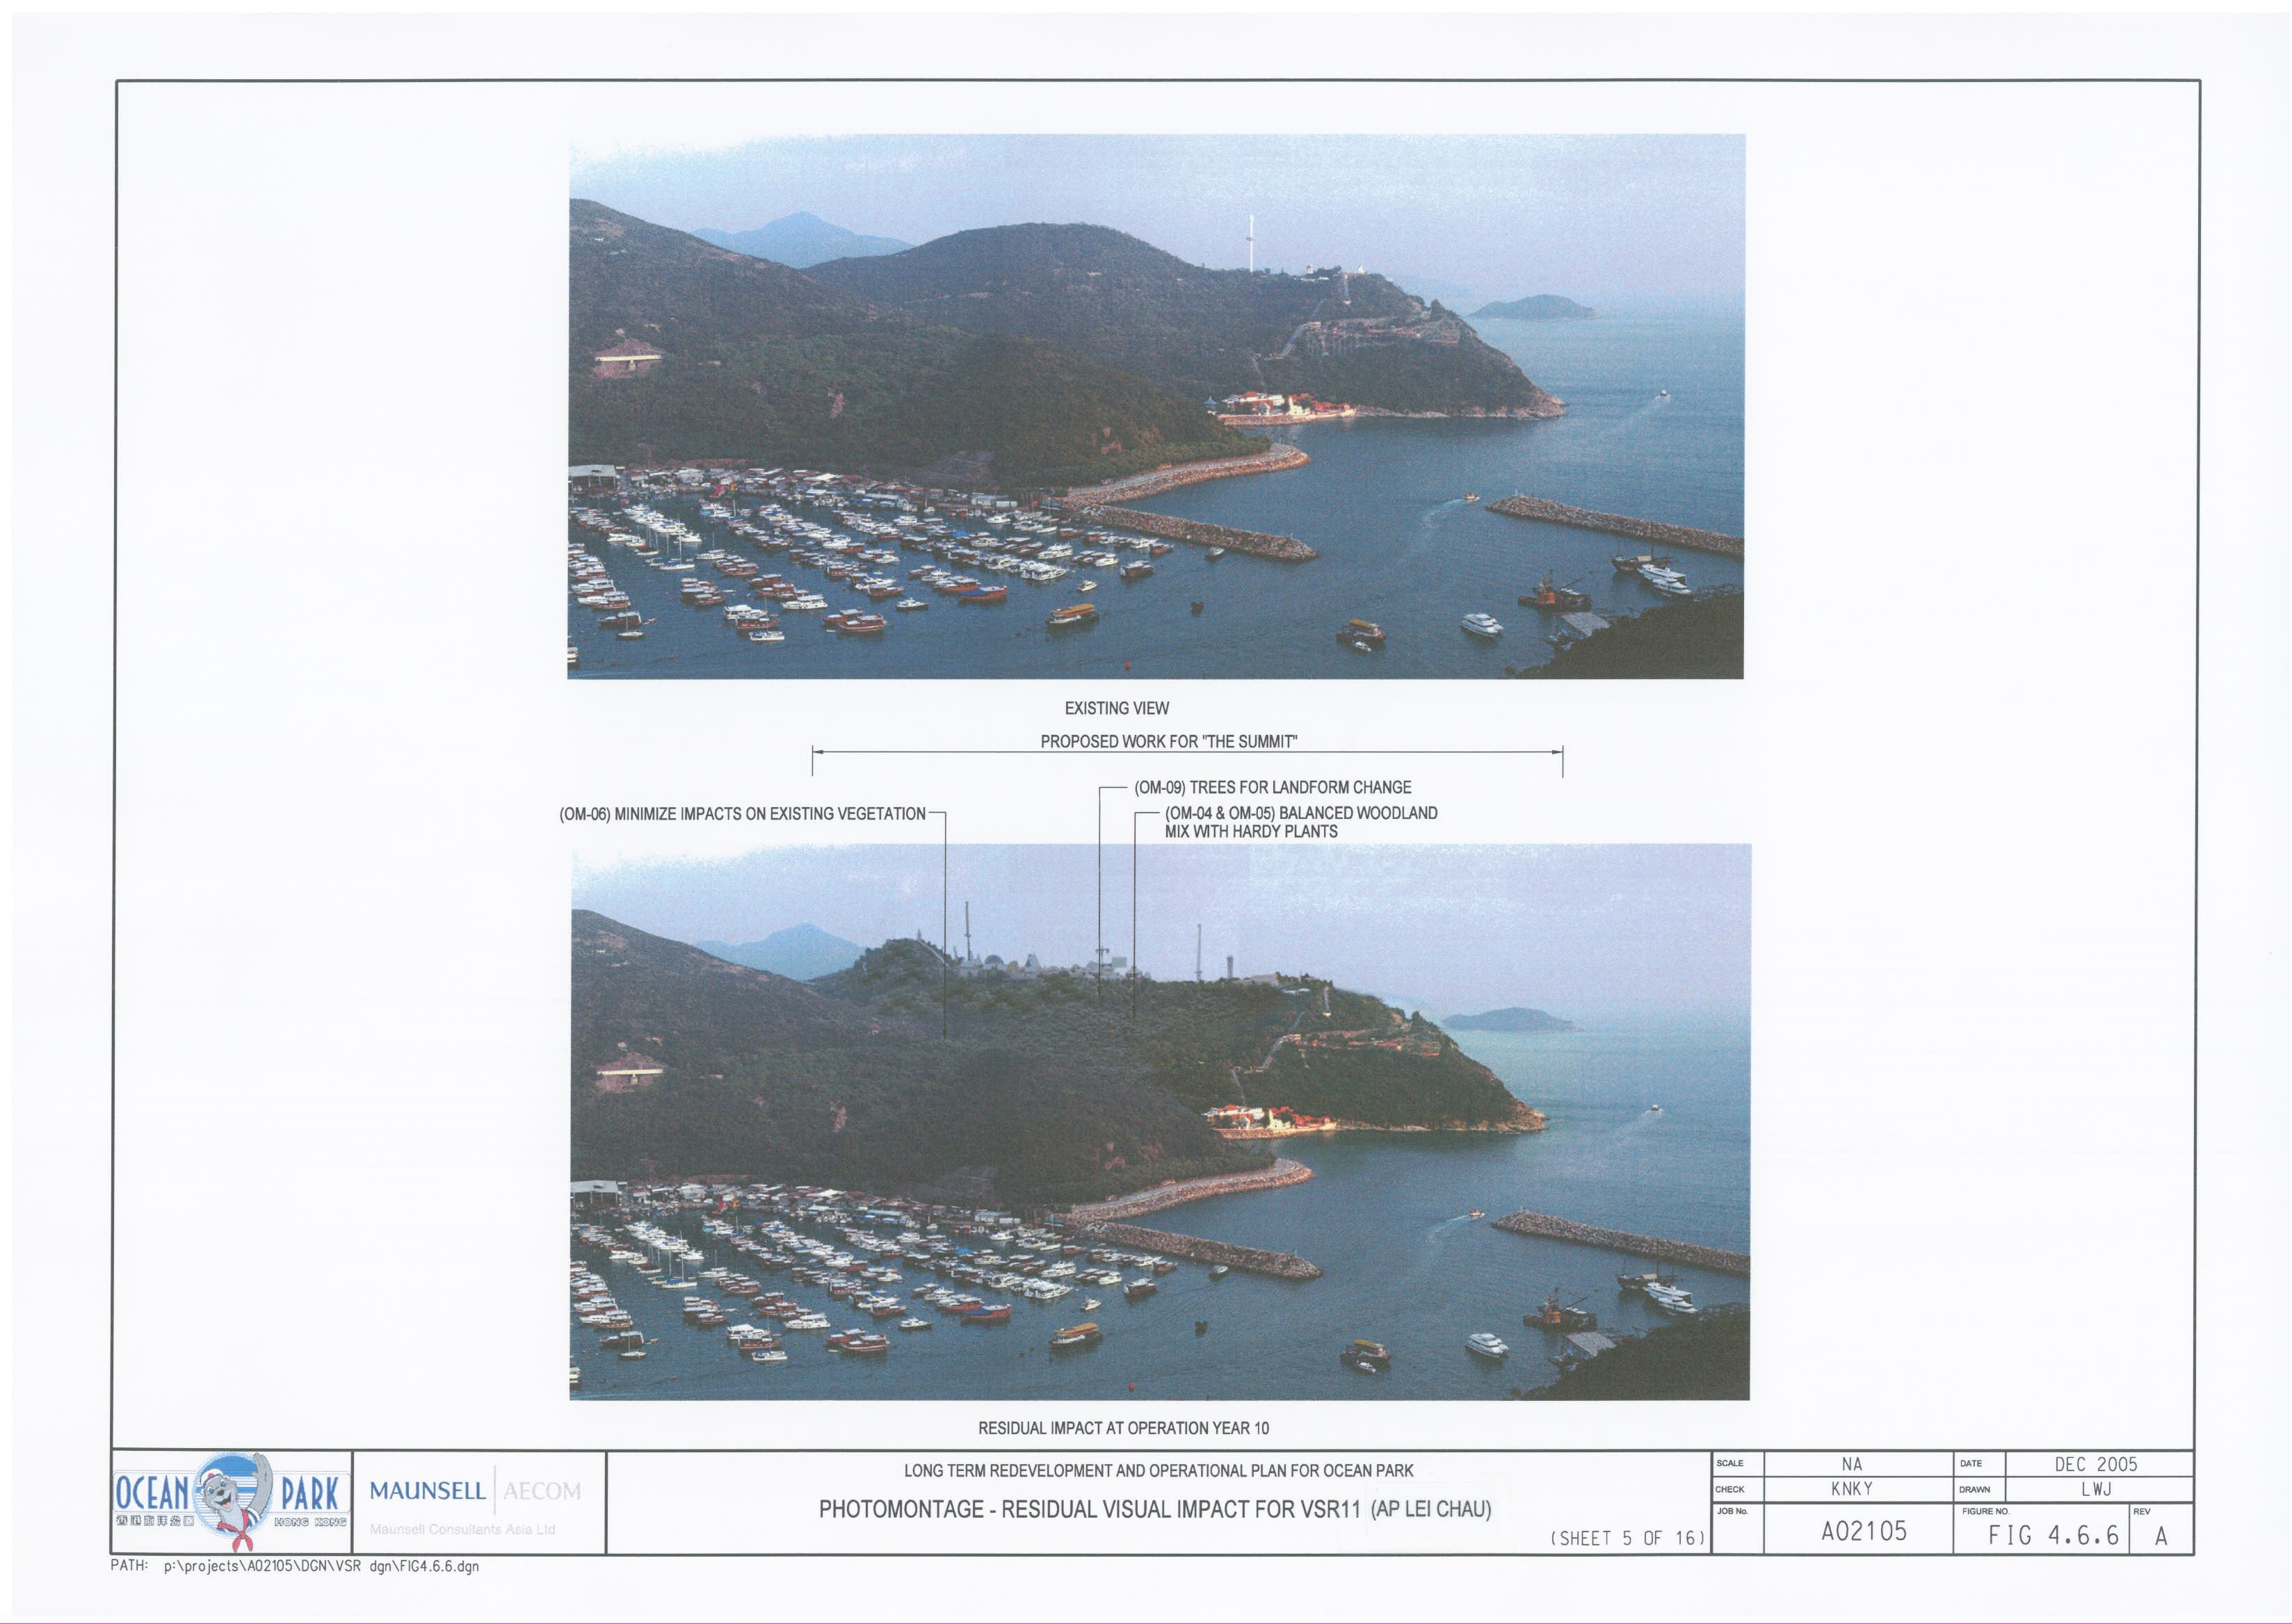
Figure
4.6.6 Photomontage
– Residual Visual Impact for VSR11 (Ap Lei Chau) – Sheet 5 of 16
Figure
4.6.7 Photomontage
– Residual Visual Impact for VSR11 (Ap Lei Chau) – Sheet 6 of 16
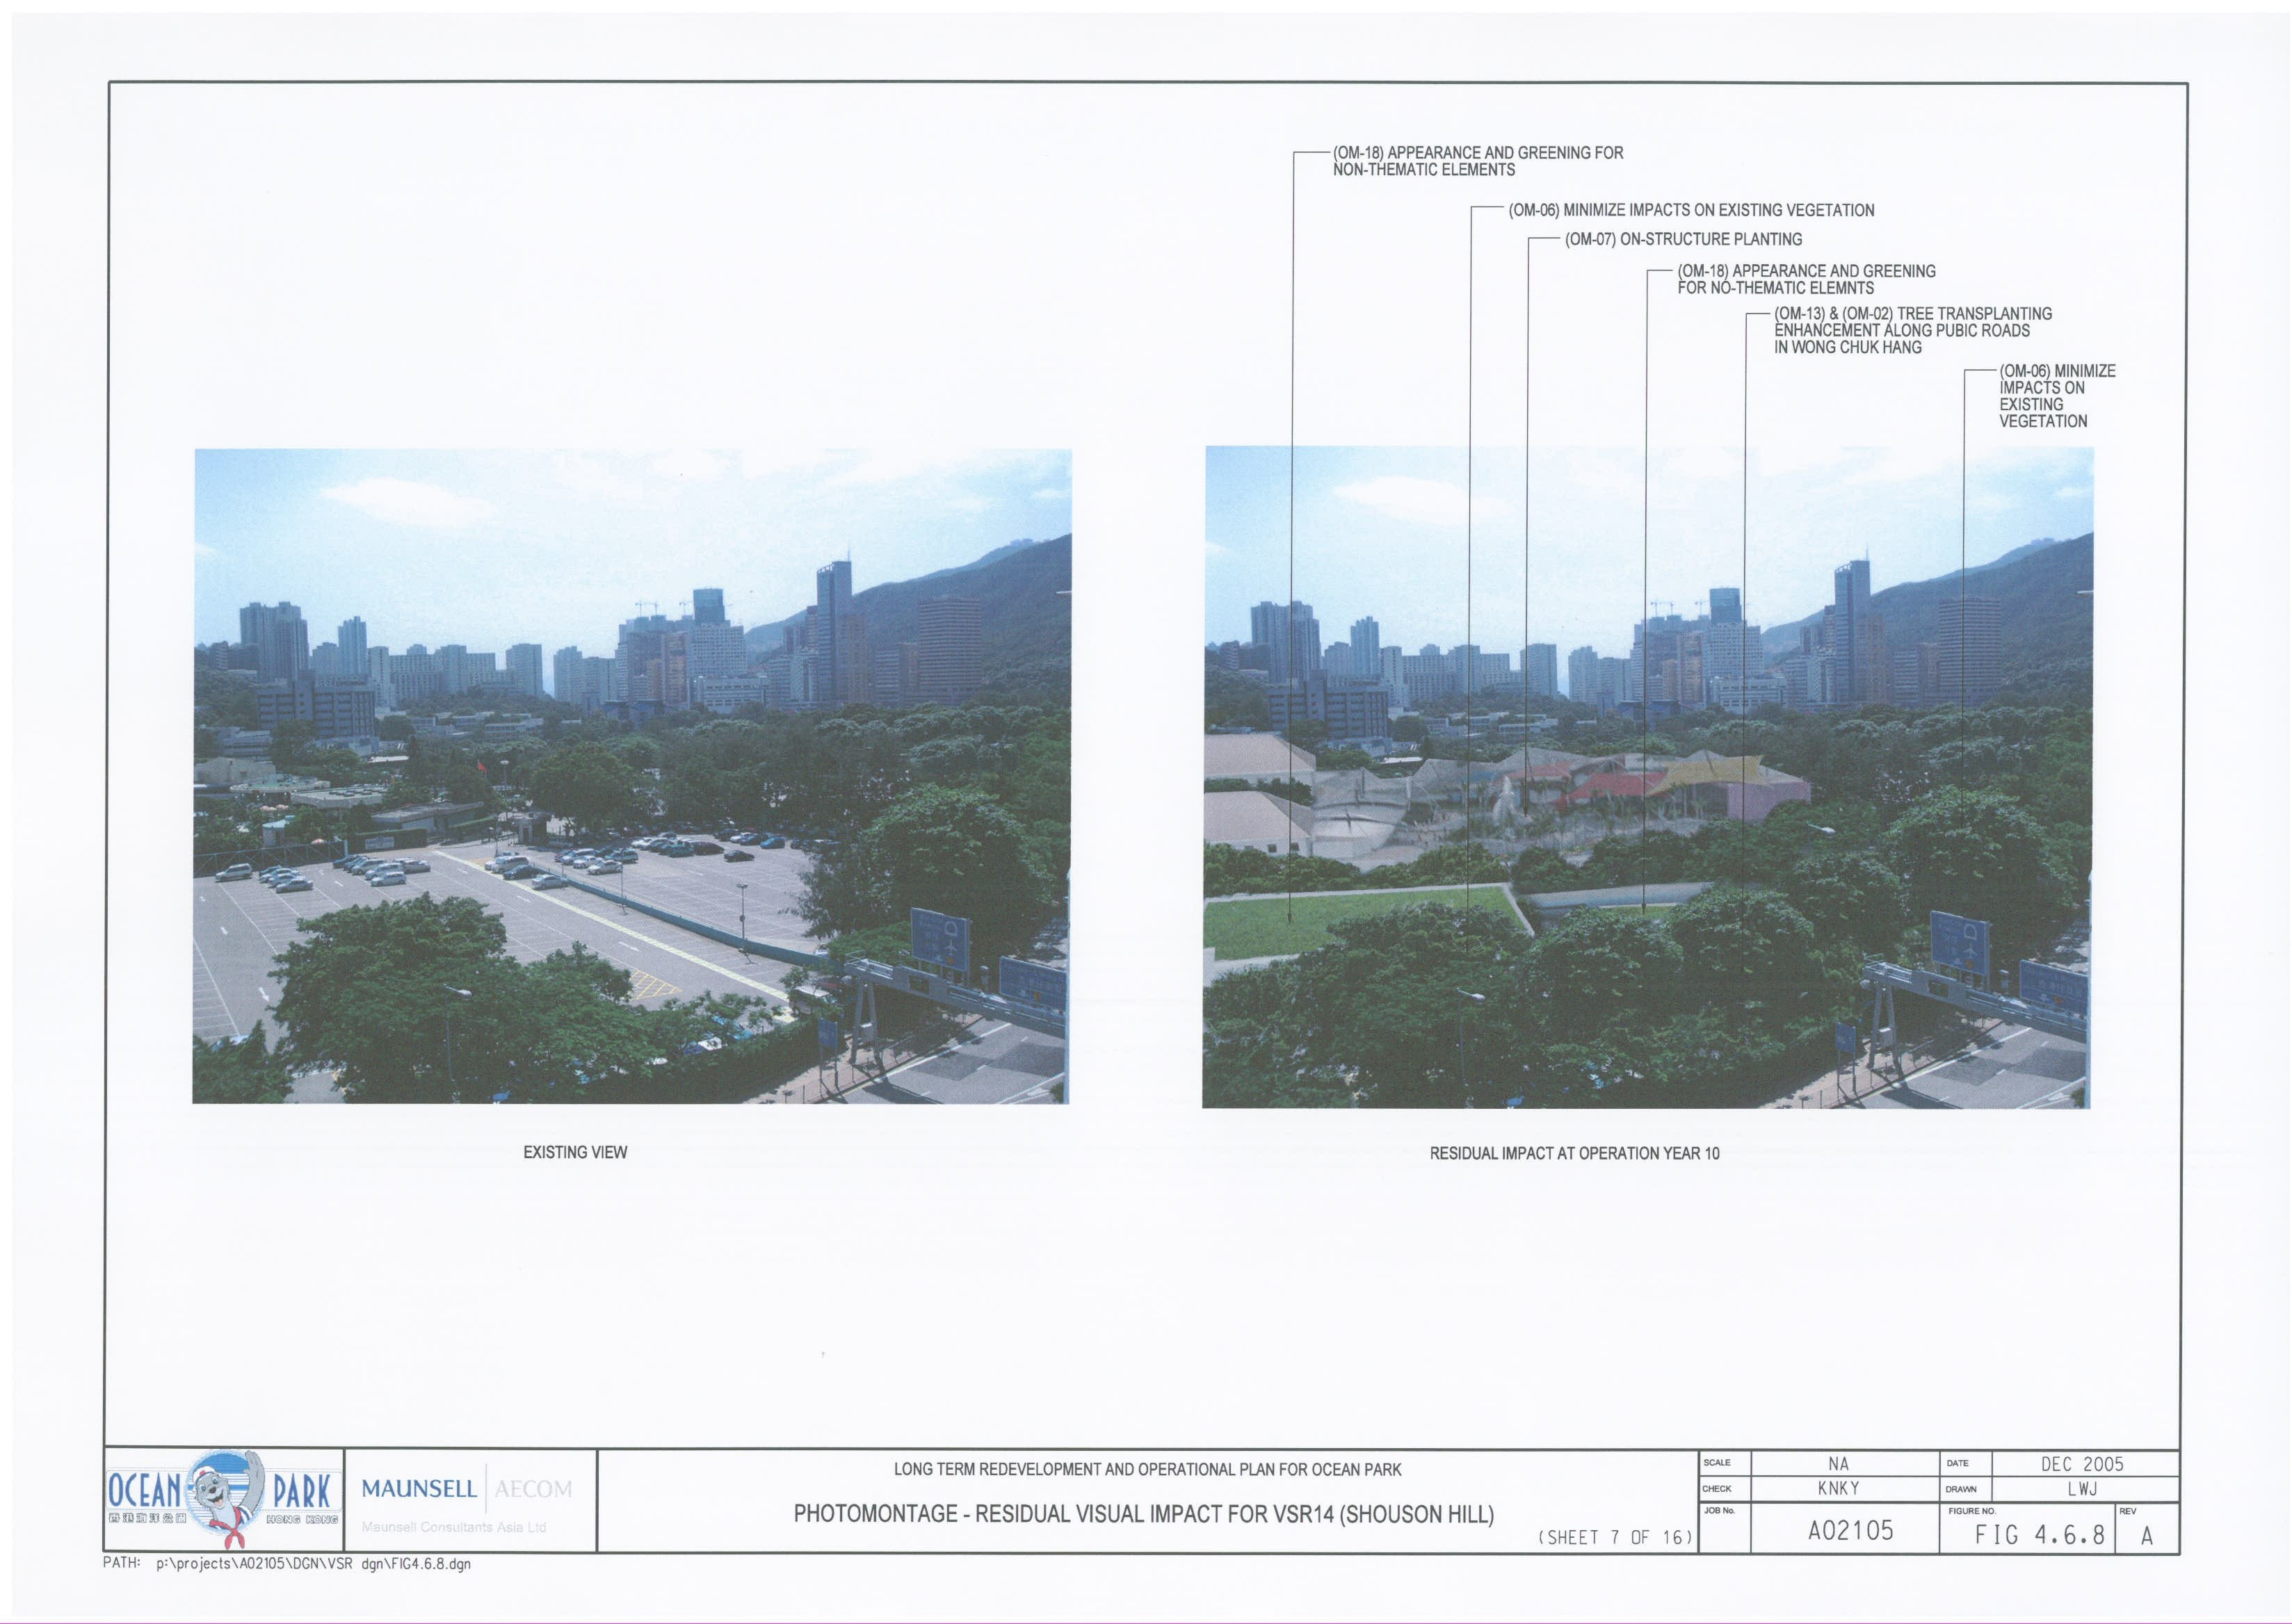
Figure
4.6.8 Photomontage
– Residual Visual Impact for VSR14 (Shouson Hill) – Sheet 7 of 16
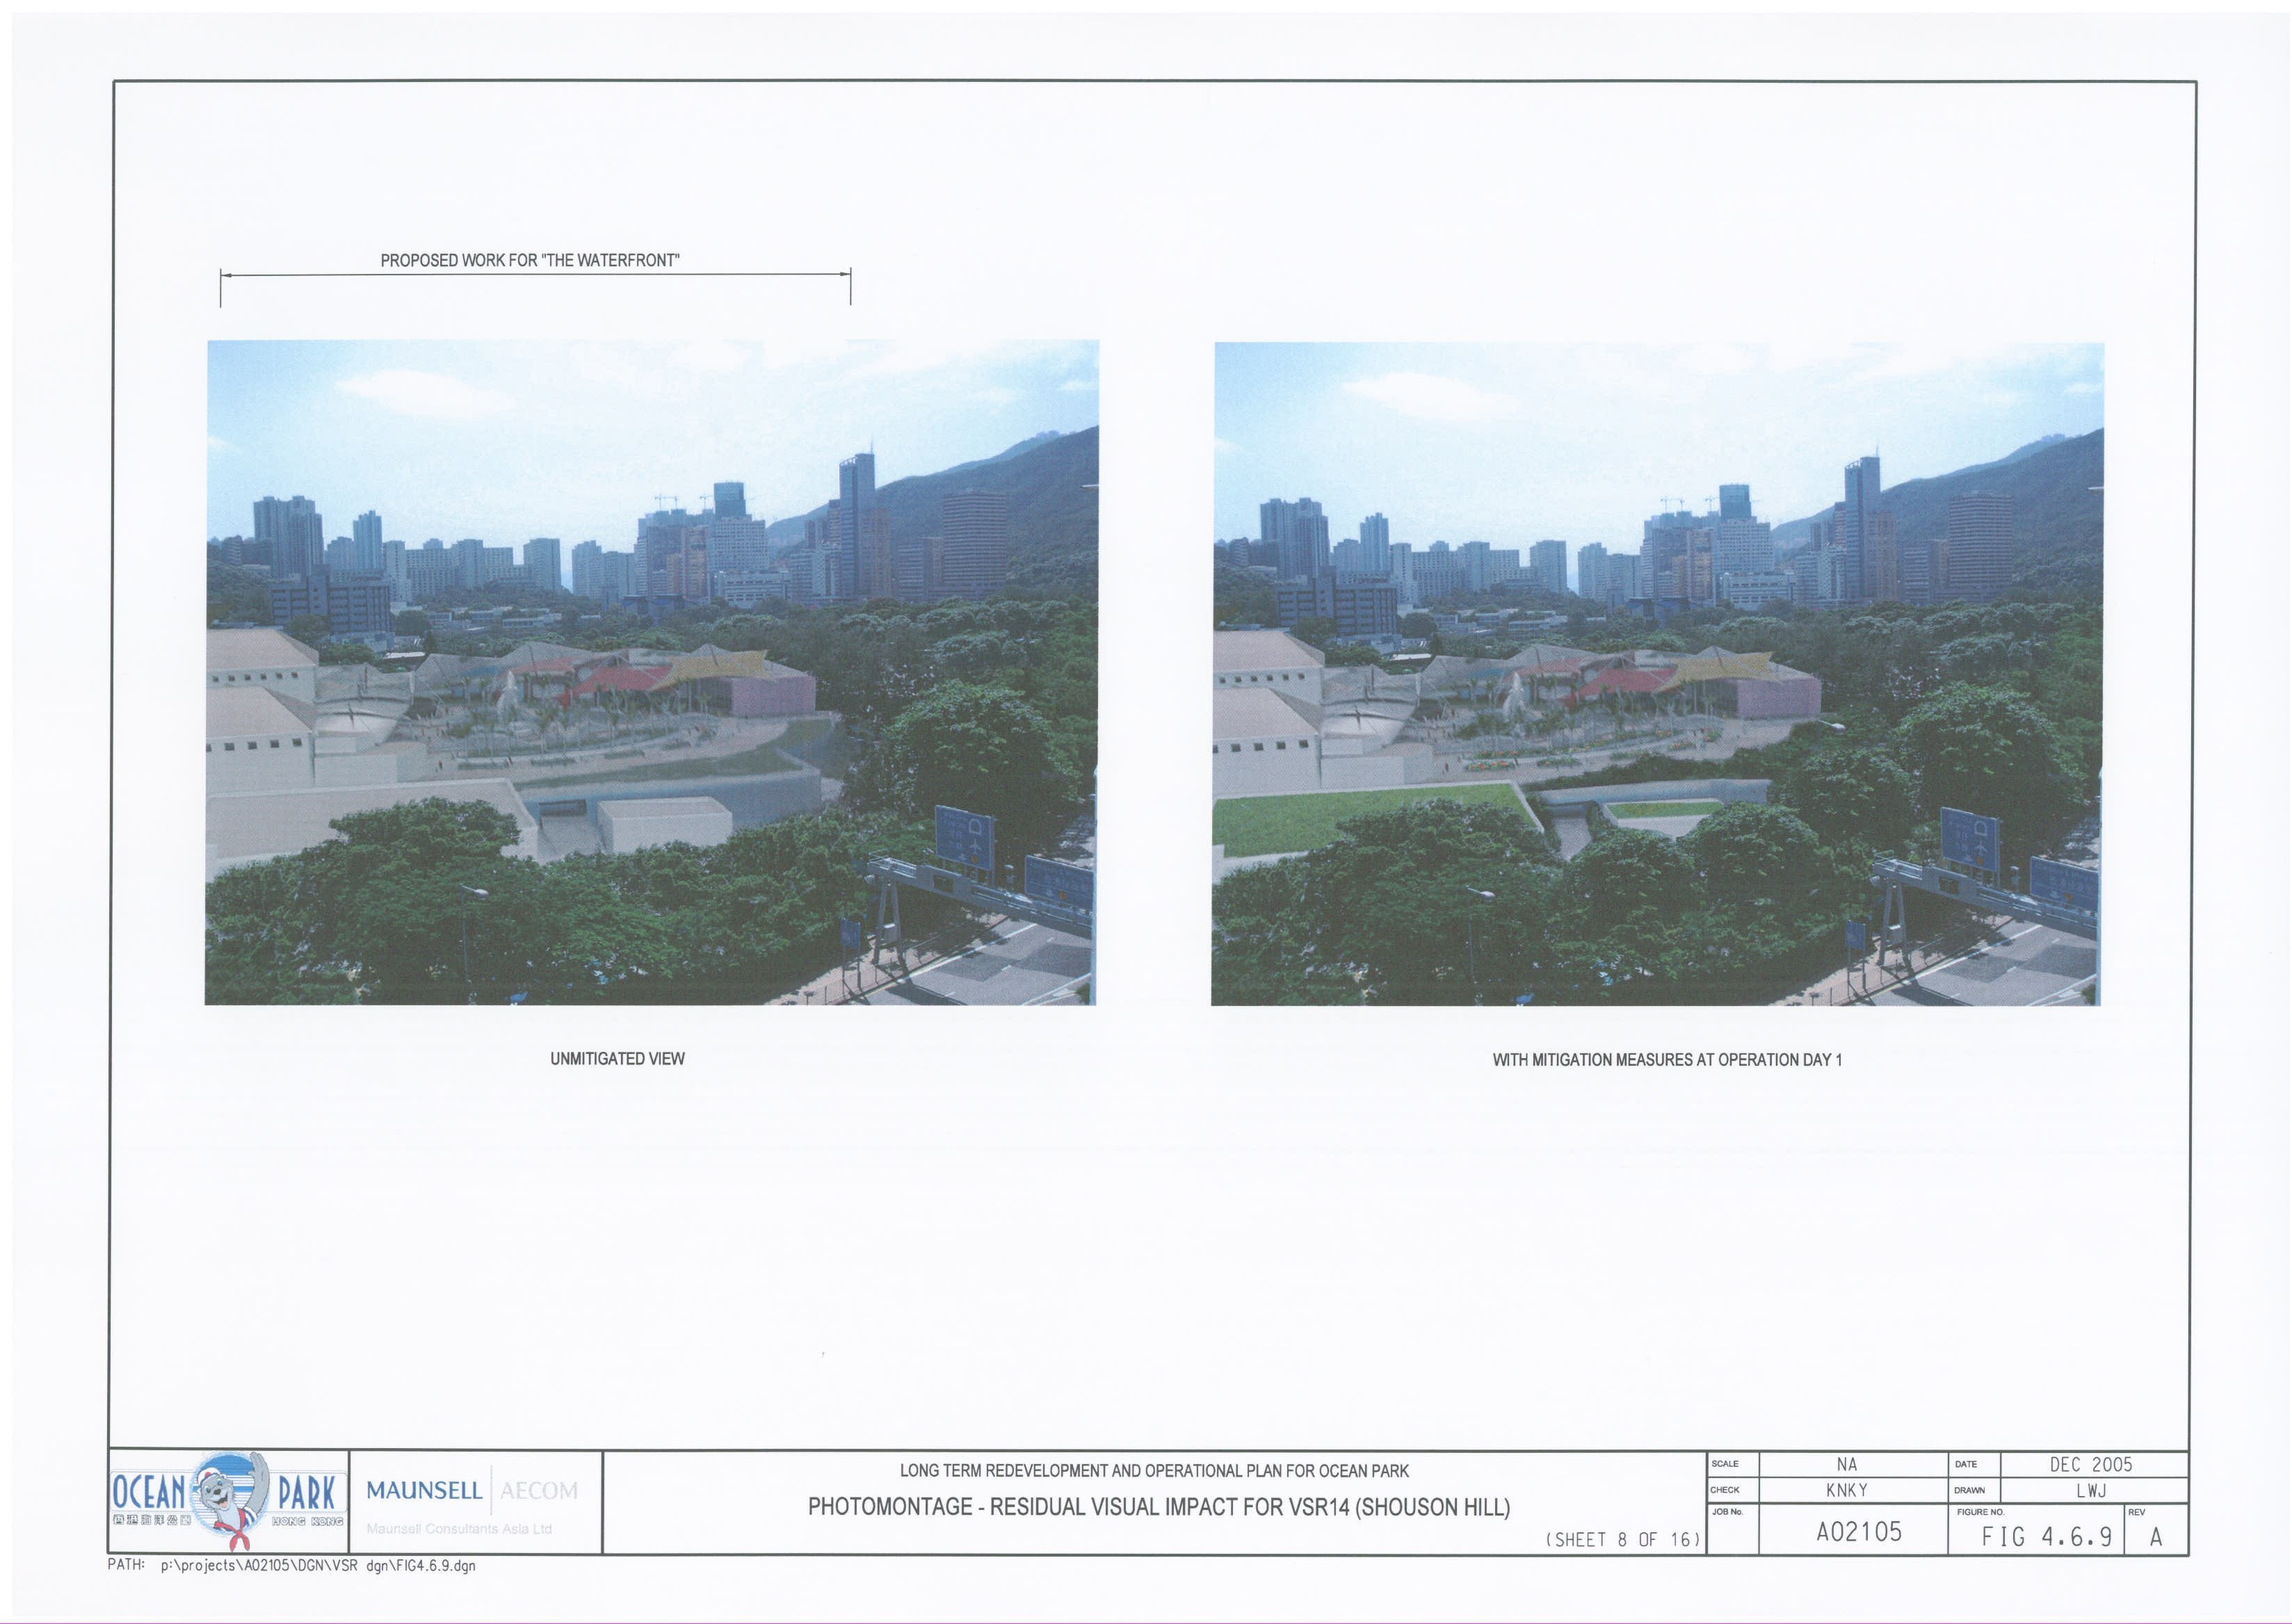
Figure
4.6.9 Photomontage
– Residual Visual Impact for VSR14 (Shouson Hill) – Sheet 8 of 16
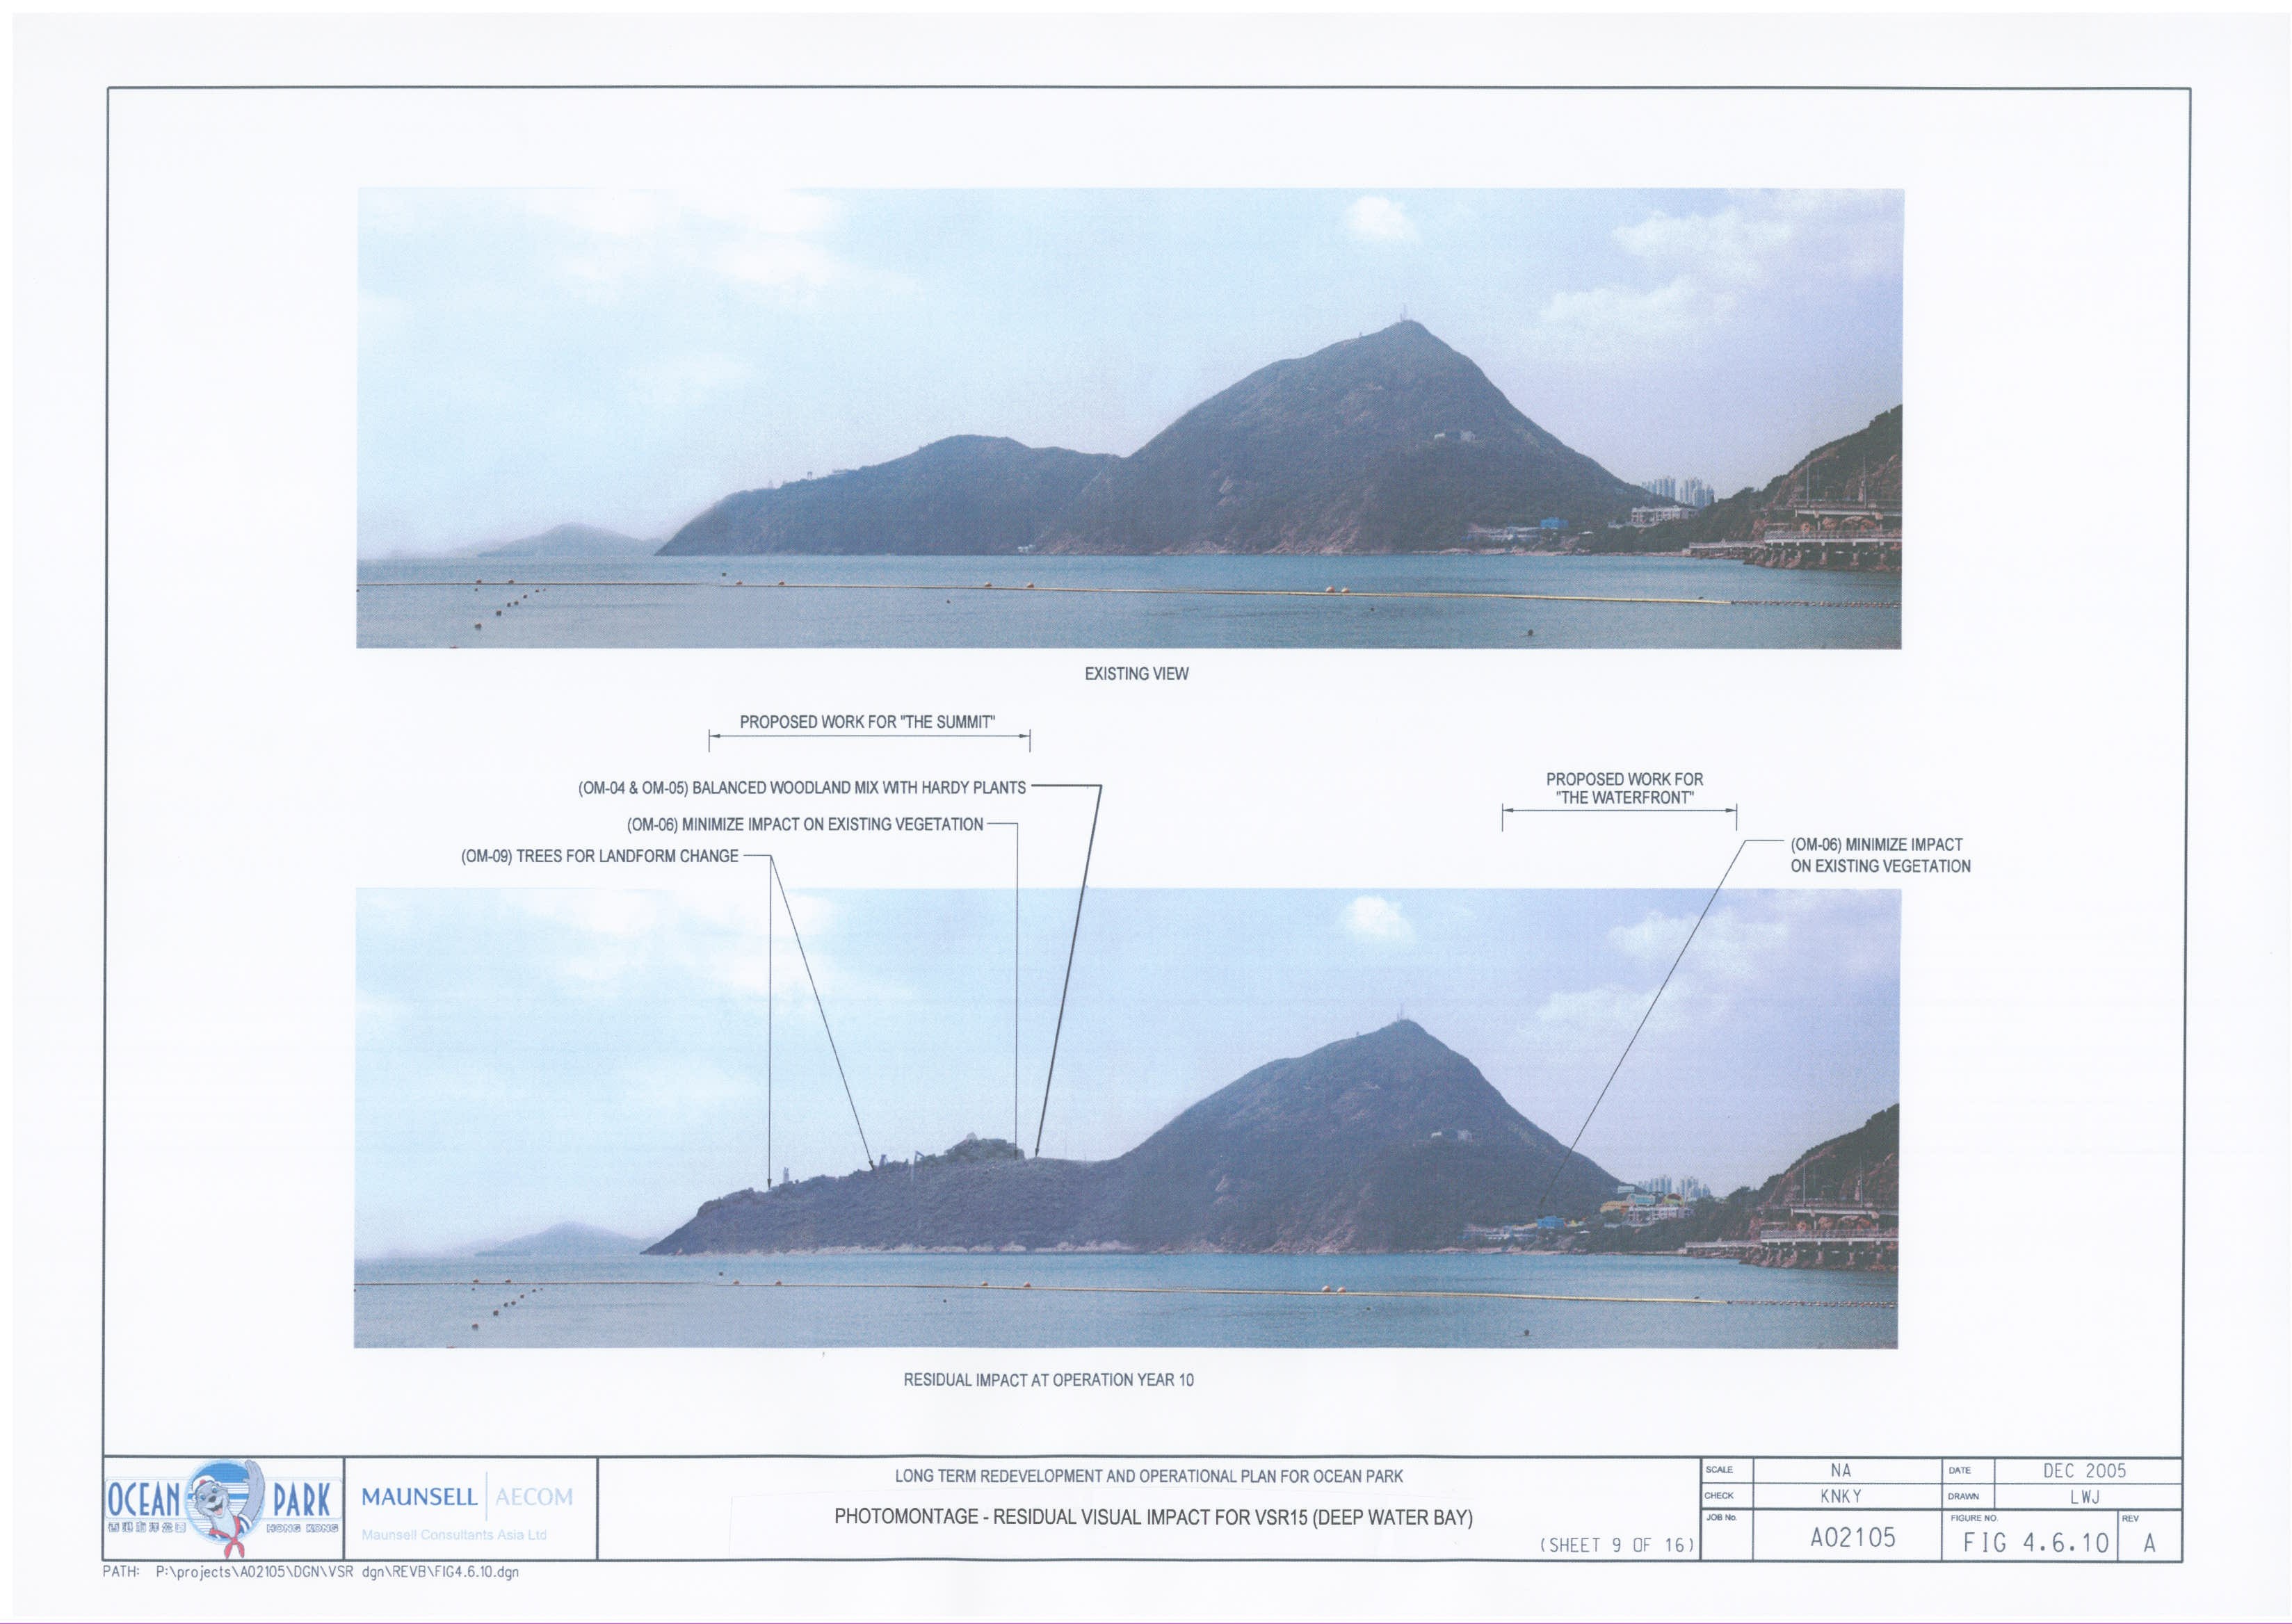
Figure
4.6.10 Photomontage
– Residual Visual Impact for VSR15 (Deep Water Bay) – Sheet 9 of 16
Figure
4.6.11 Photomontage
– Residual Visual Impact for VSR15
(Deep Water Bay) – Sheet 10 of 16
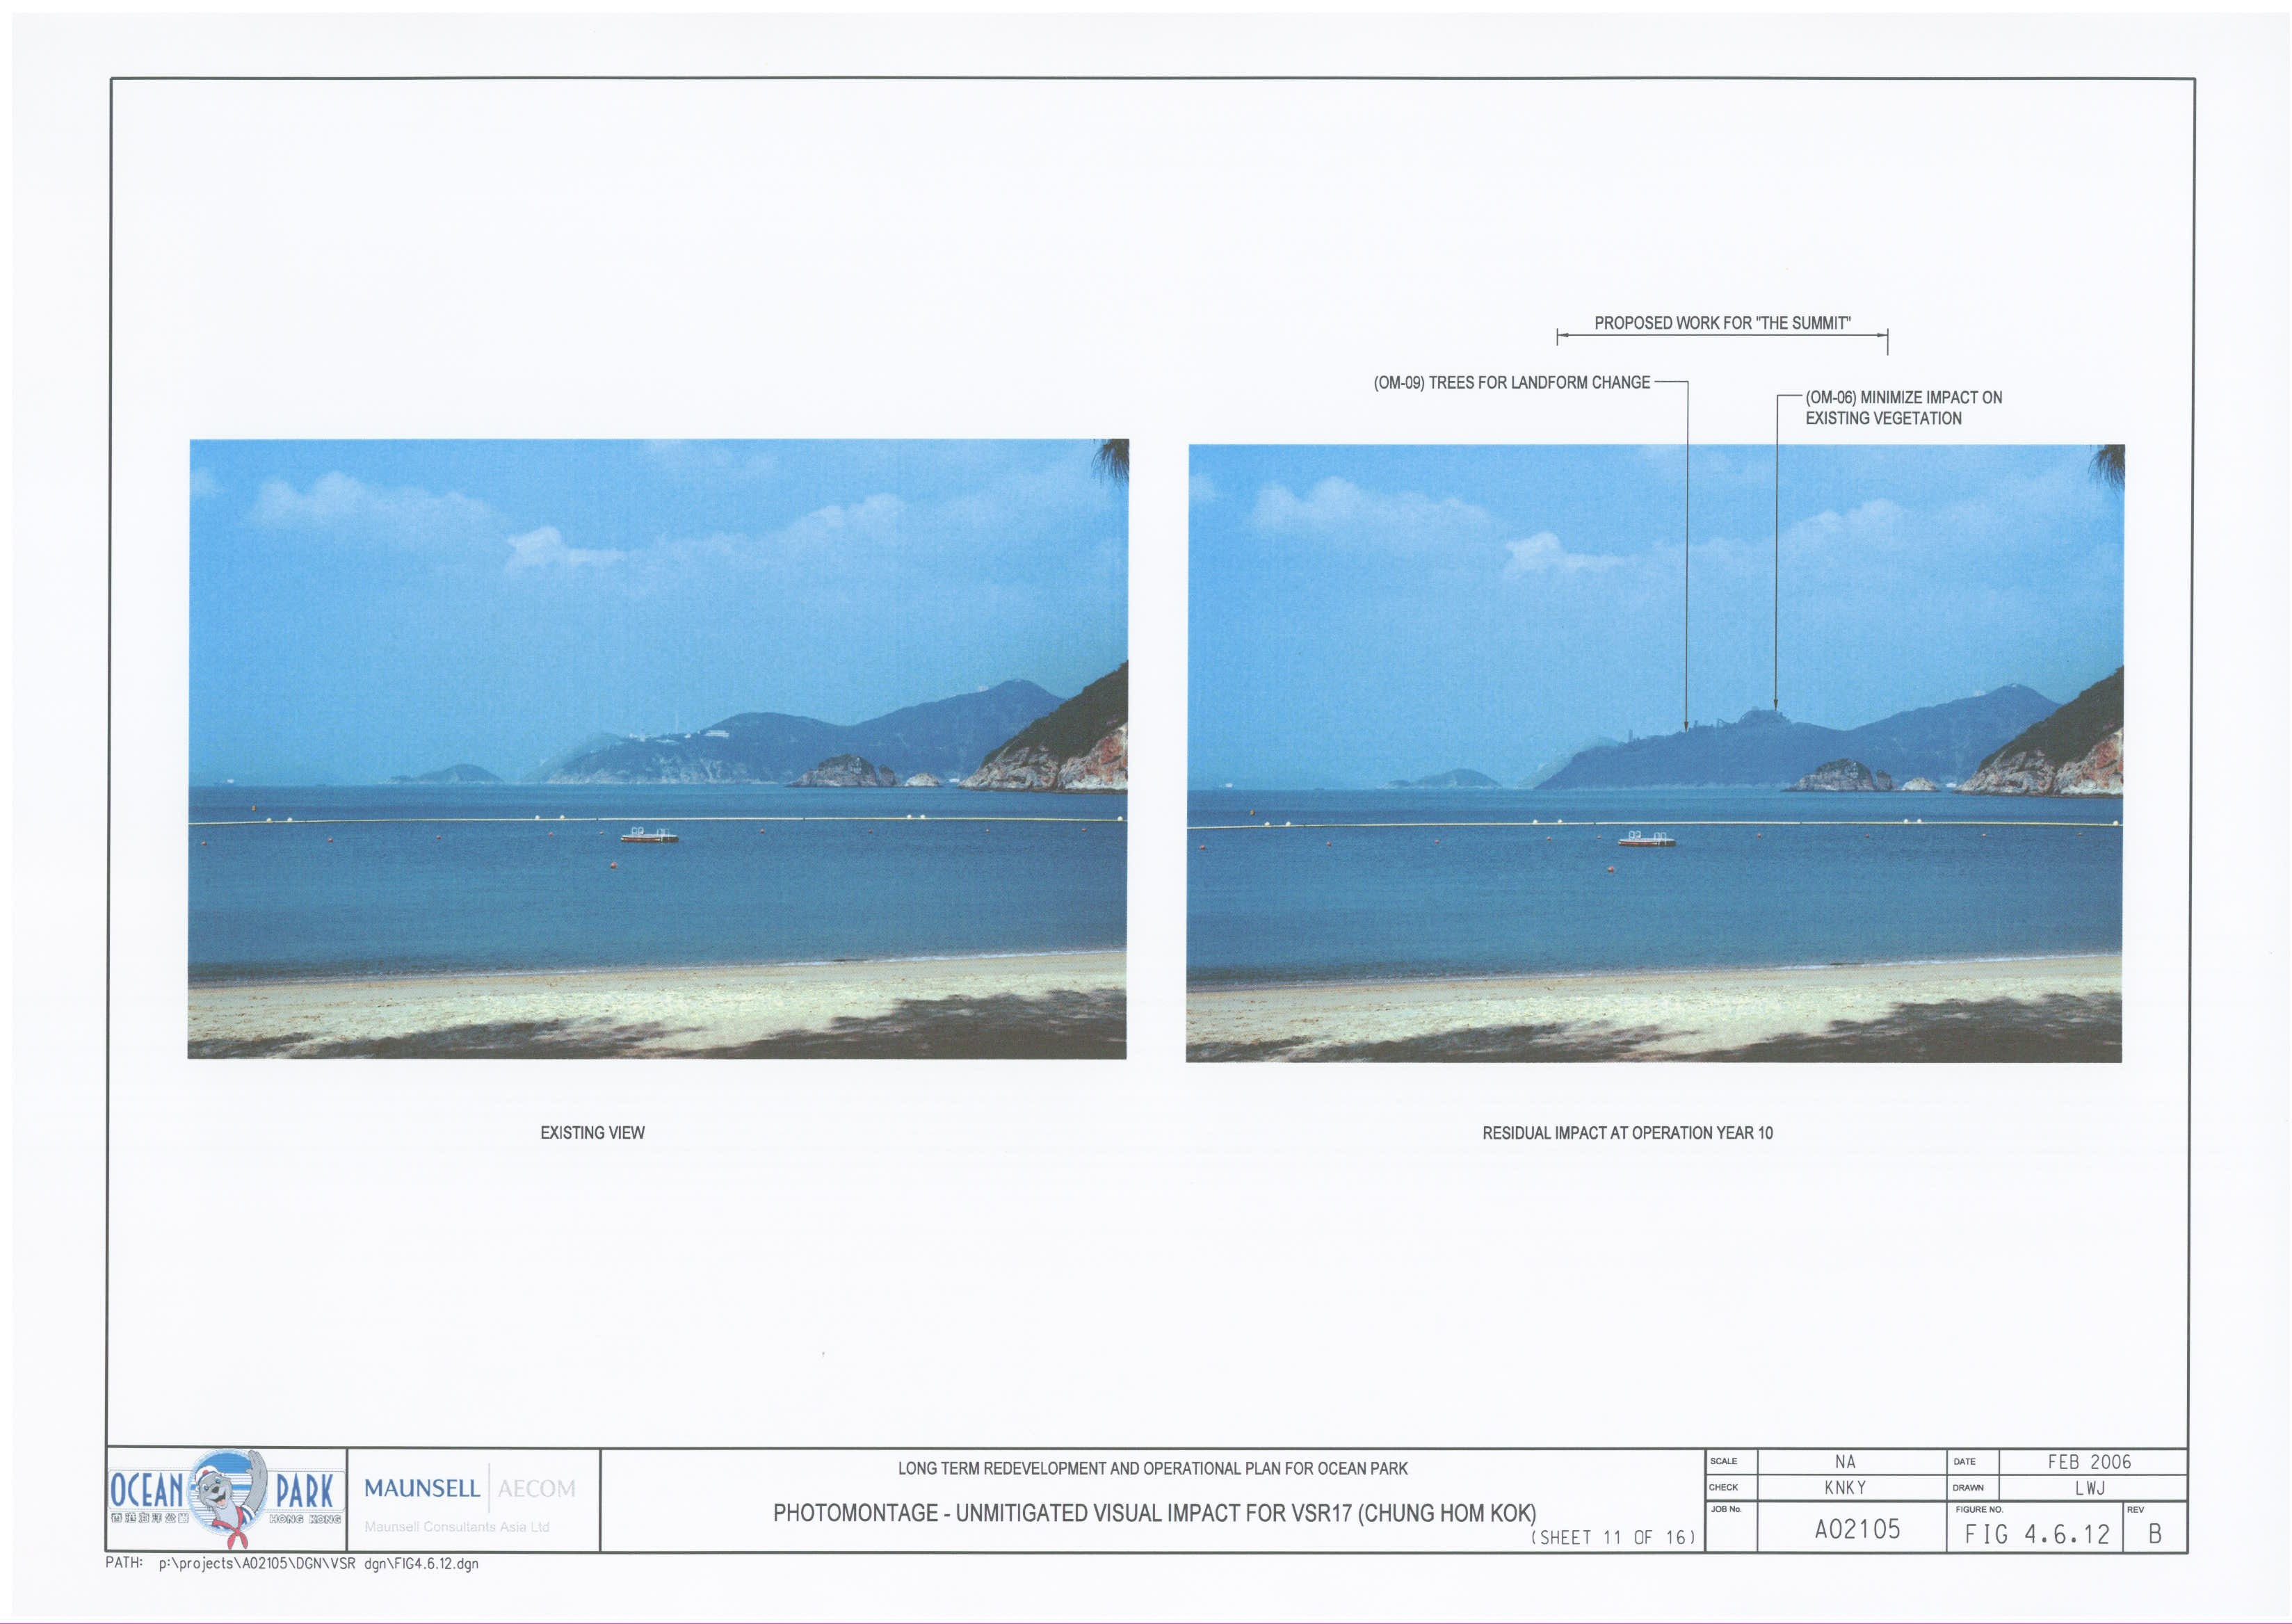
Figure
4.6.12 Photomontage
– Residual Visual Impact for VSR17 (Chung Hom Kok) – Sheet 11 of 16
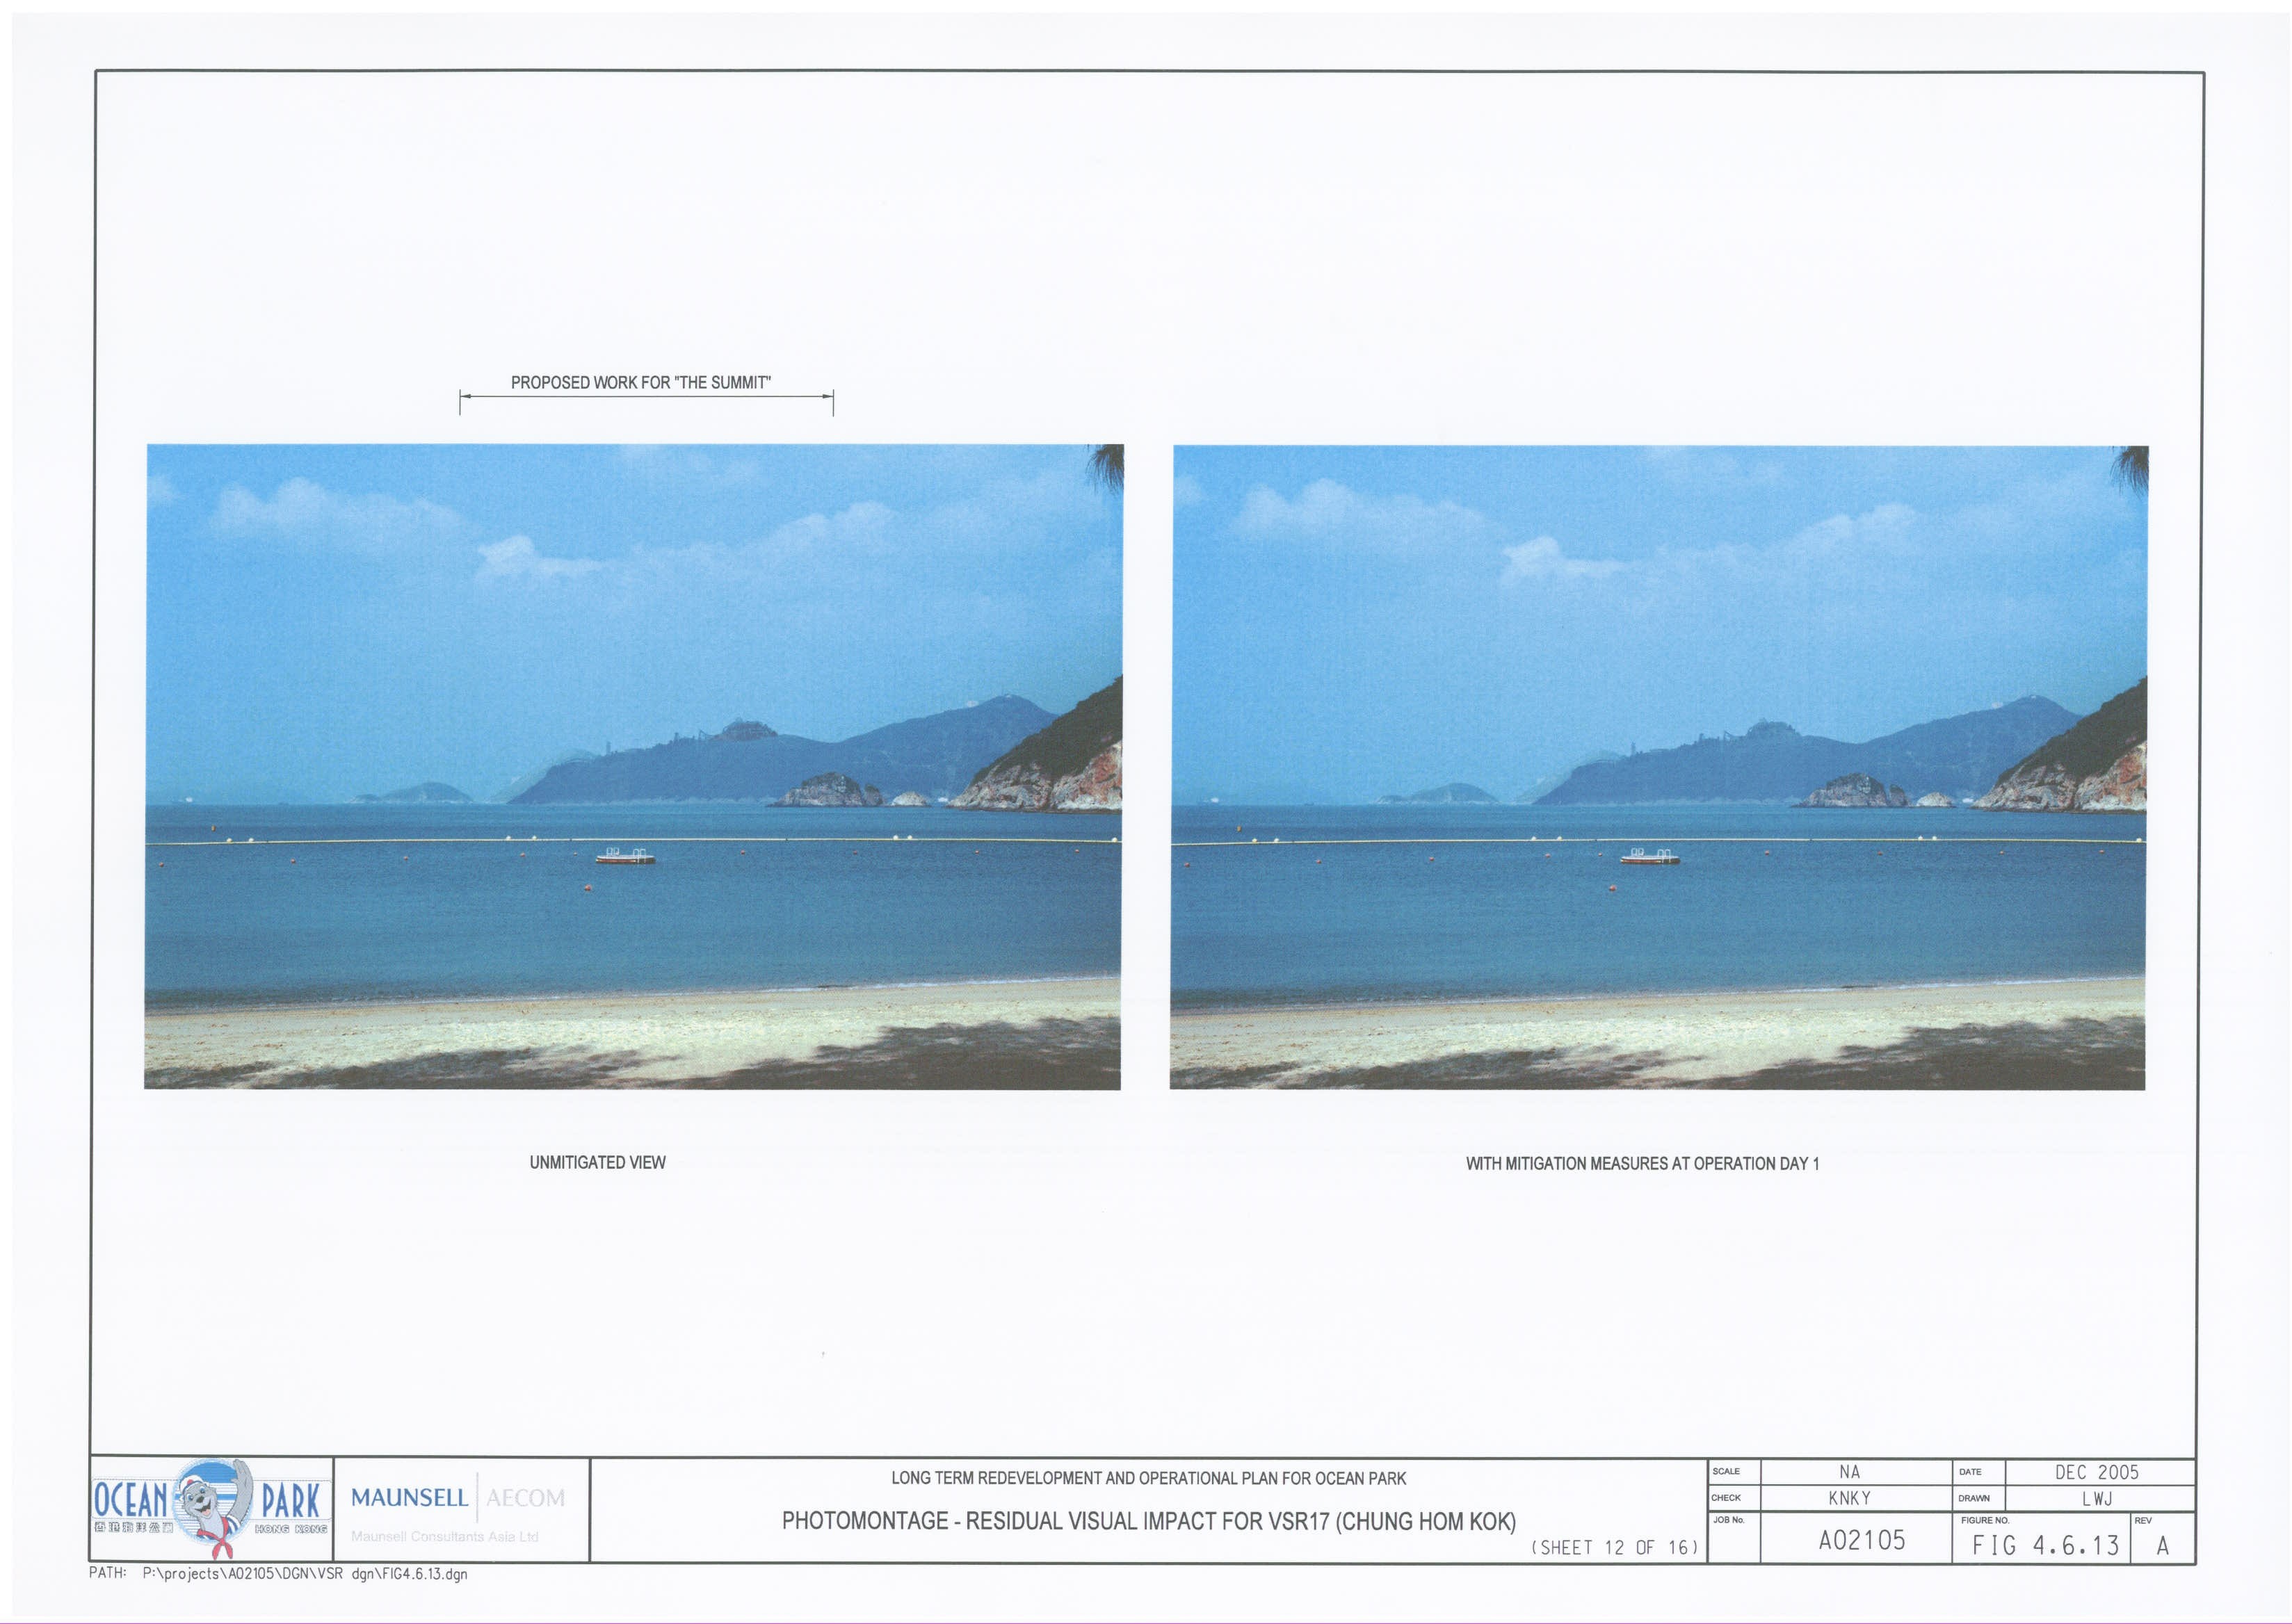
Figure
4.6.13 Photomontage
– Residual Visual Impact for VSR17 (Chung Hom Kok) – Sheet 12 of 16
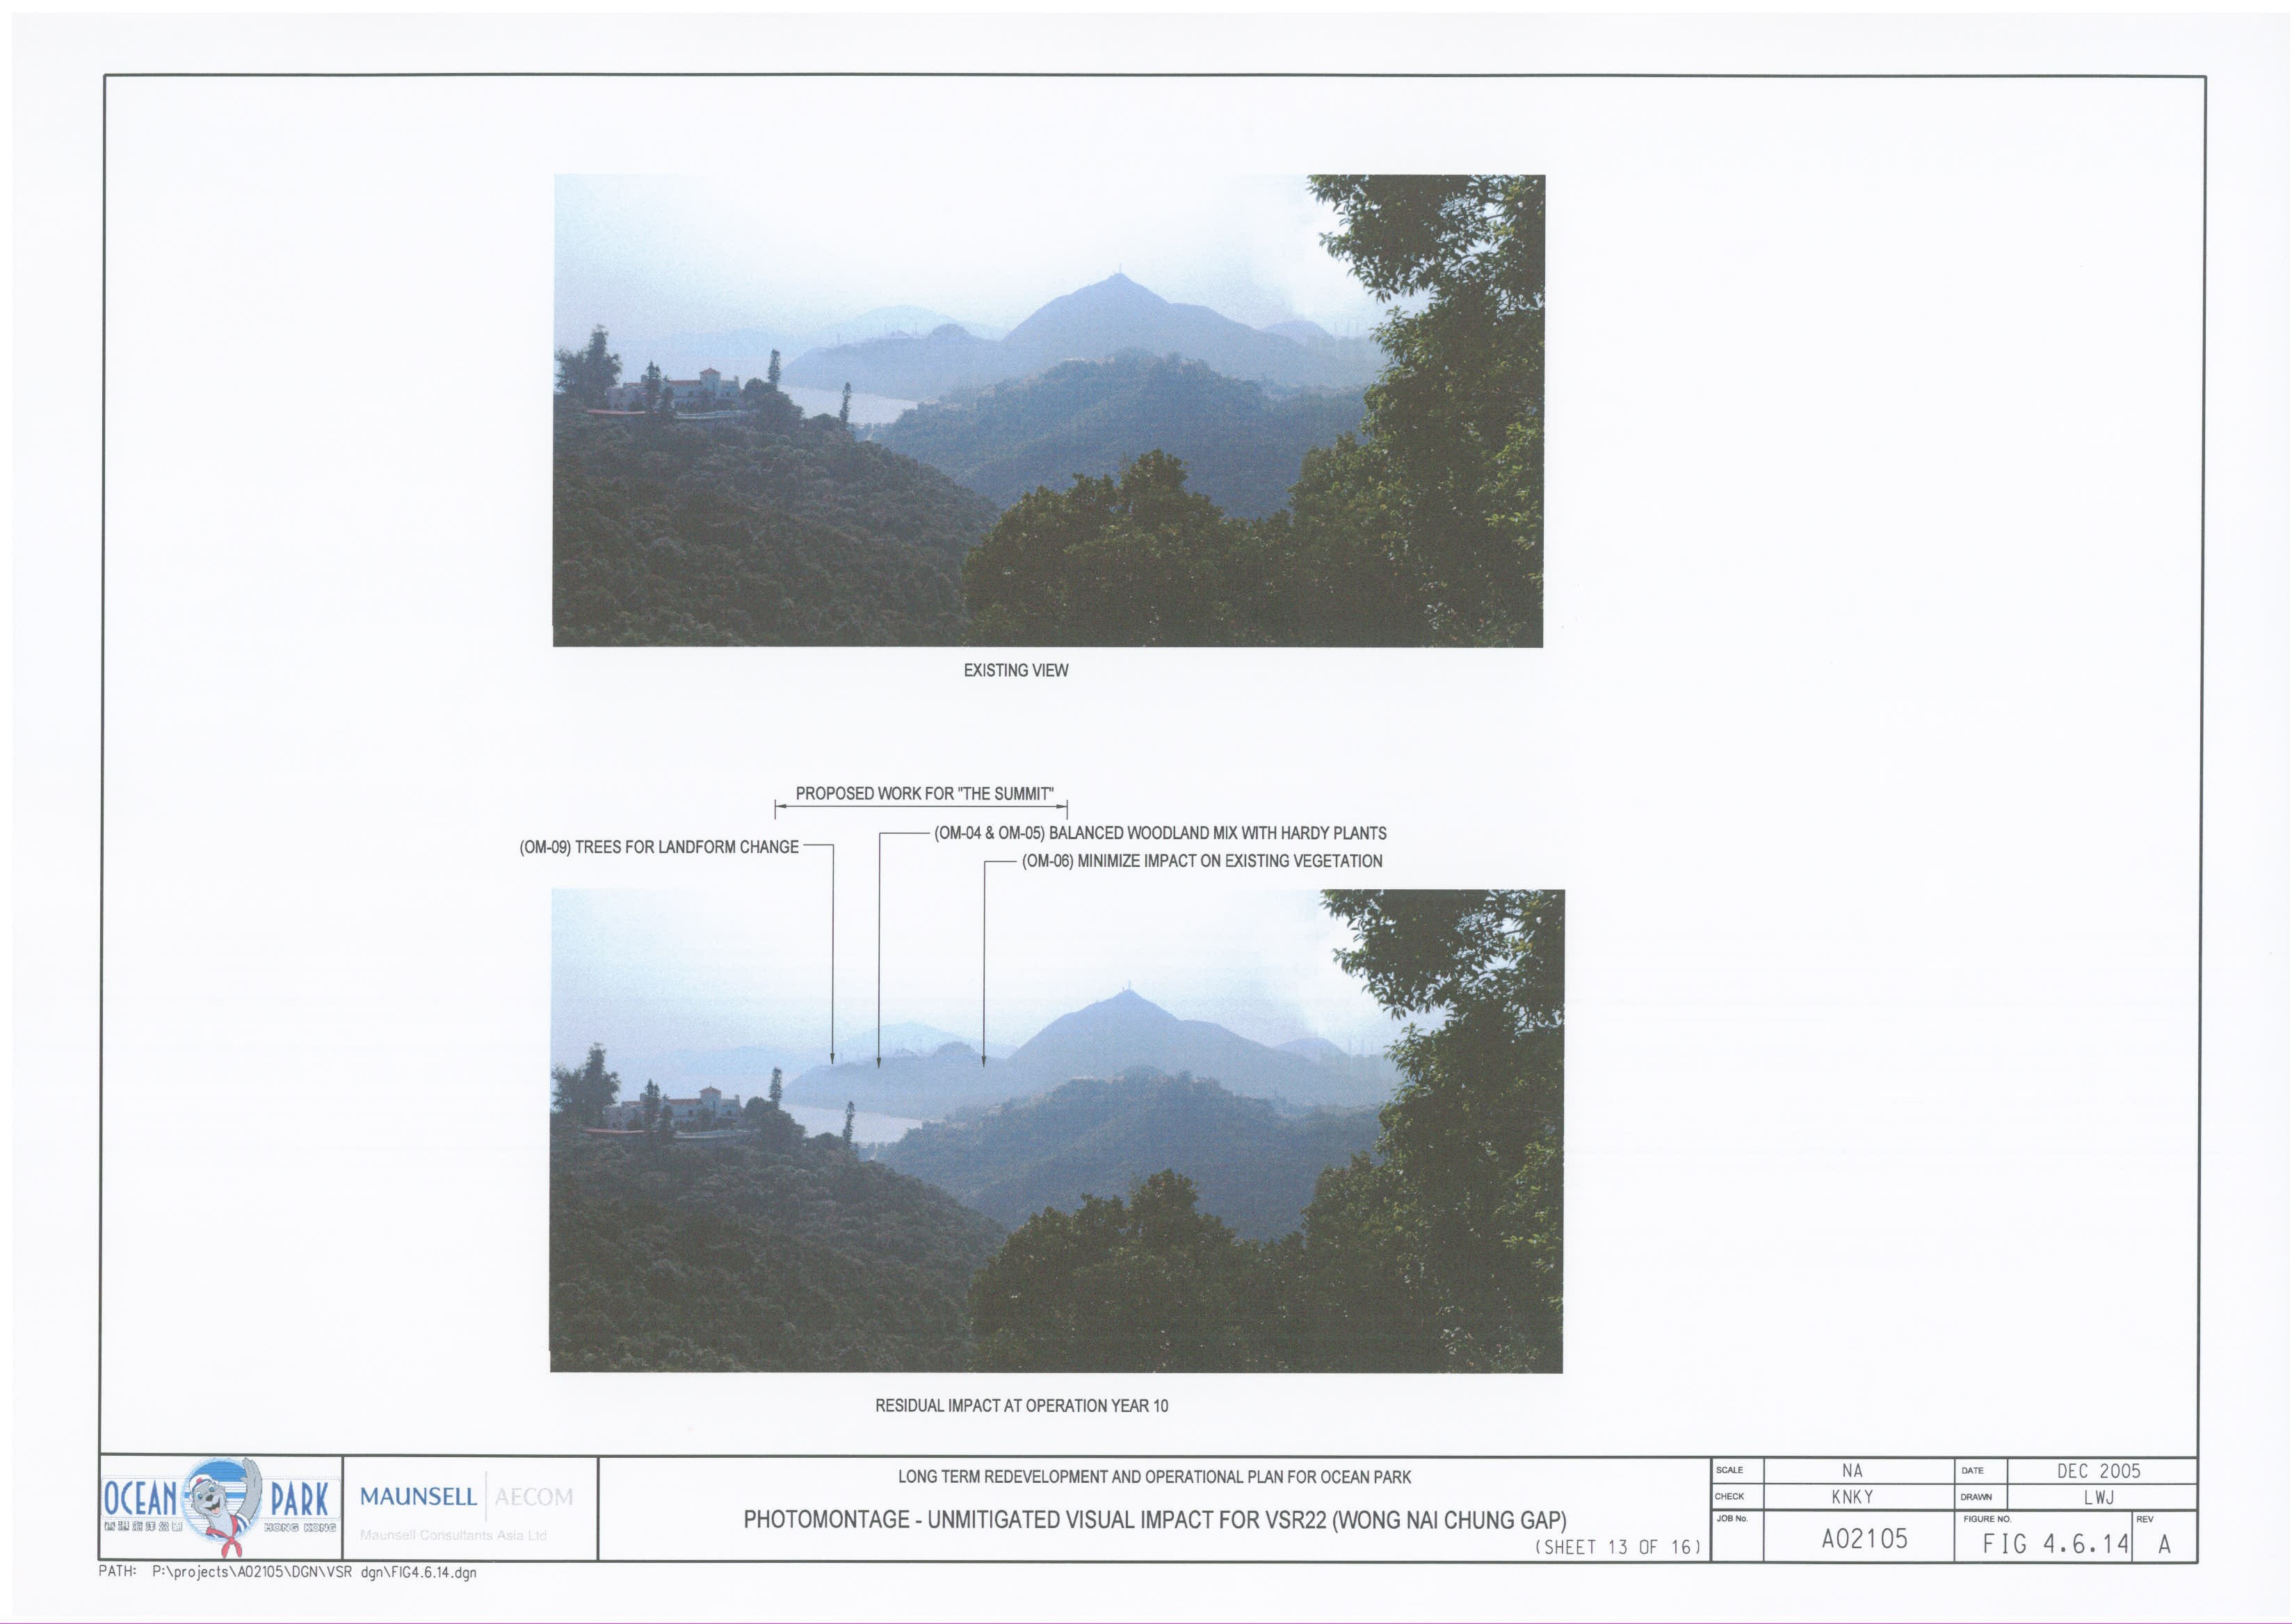
Figure 4.6.14 Photomontage
– Residual Visual Impact for VSR22 (Wong Nai Chung Gap) – Sheet 13 of 16
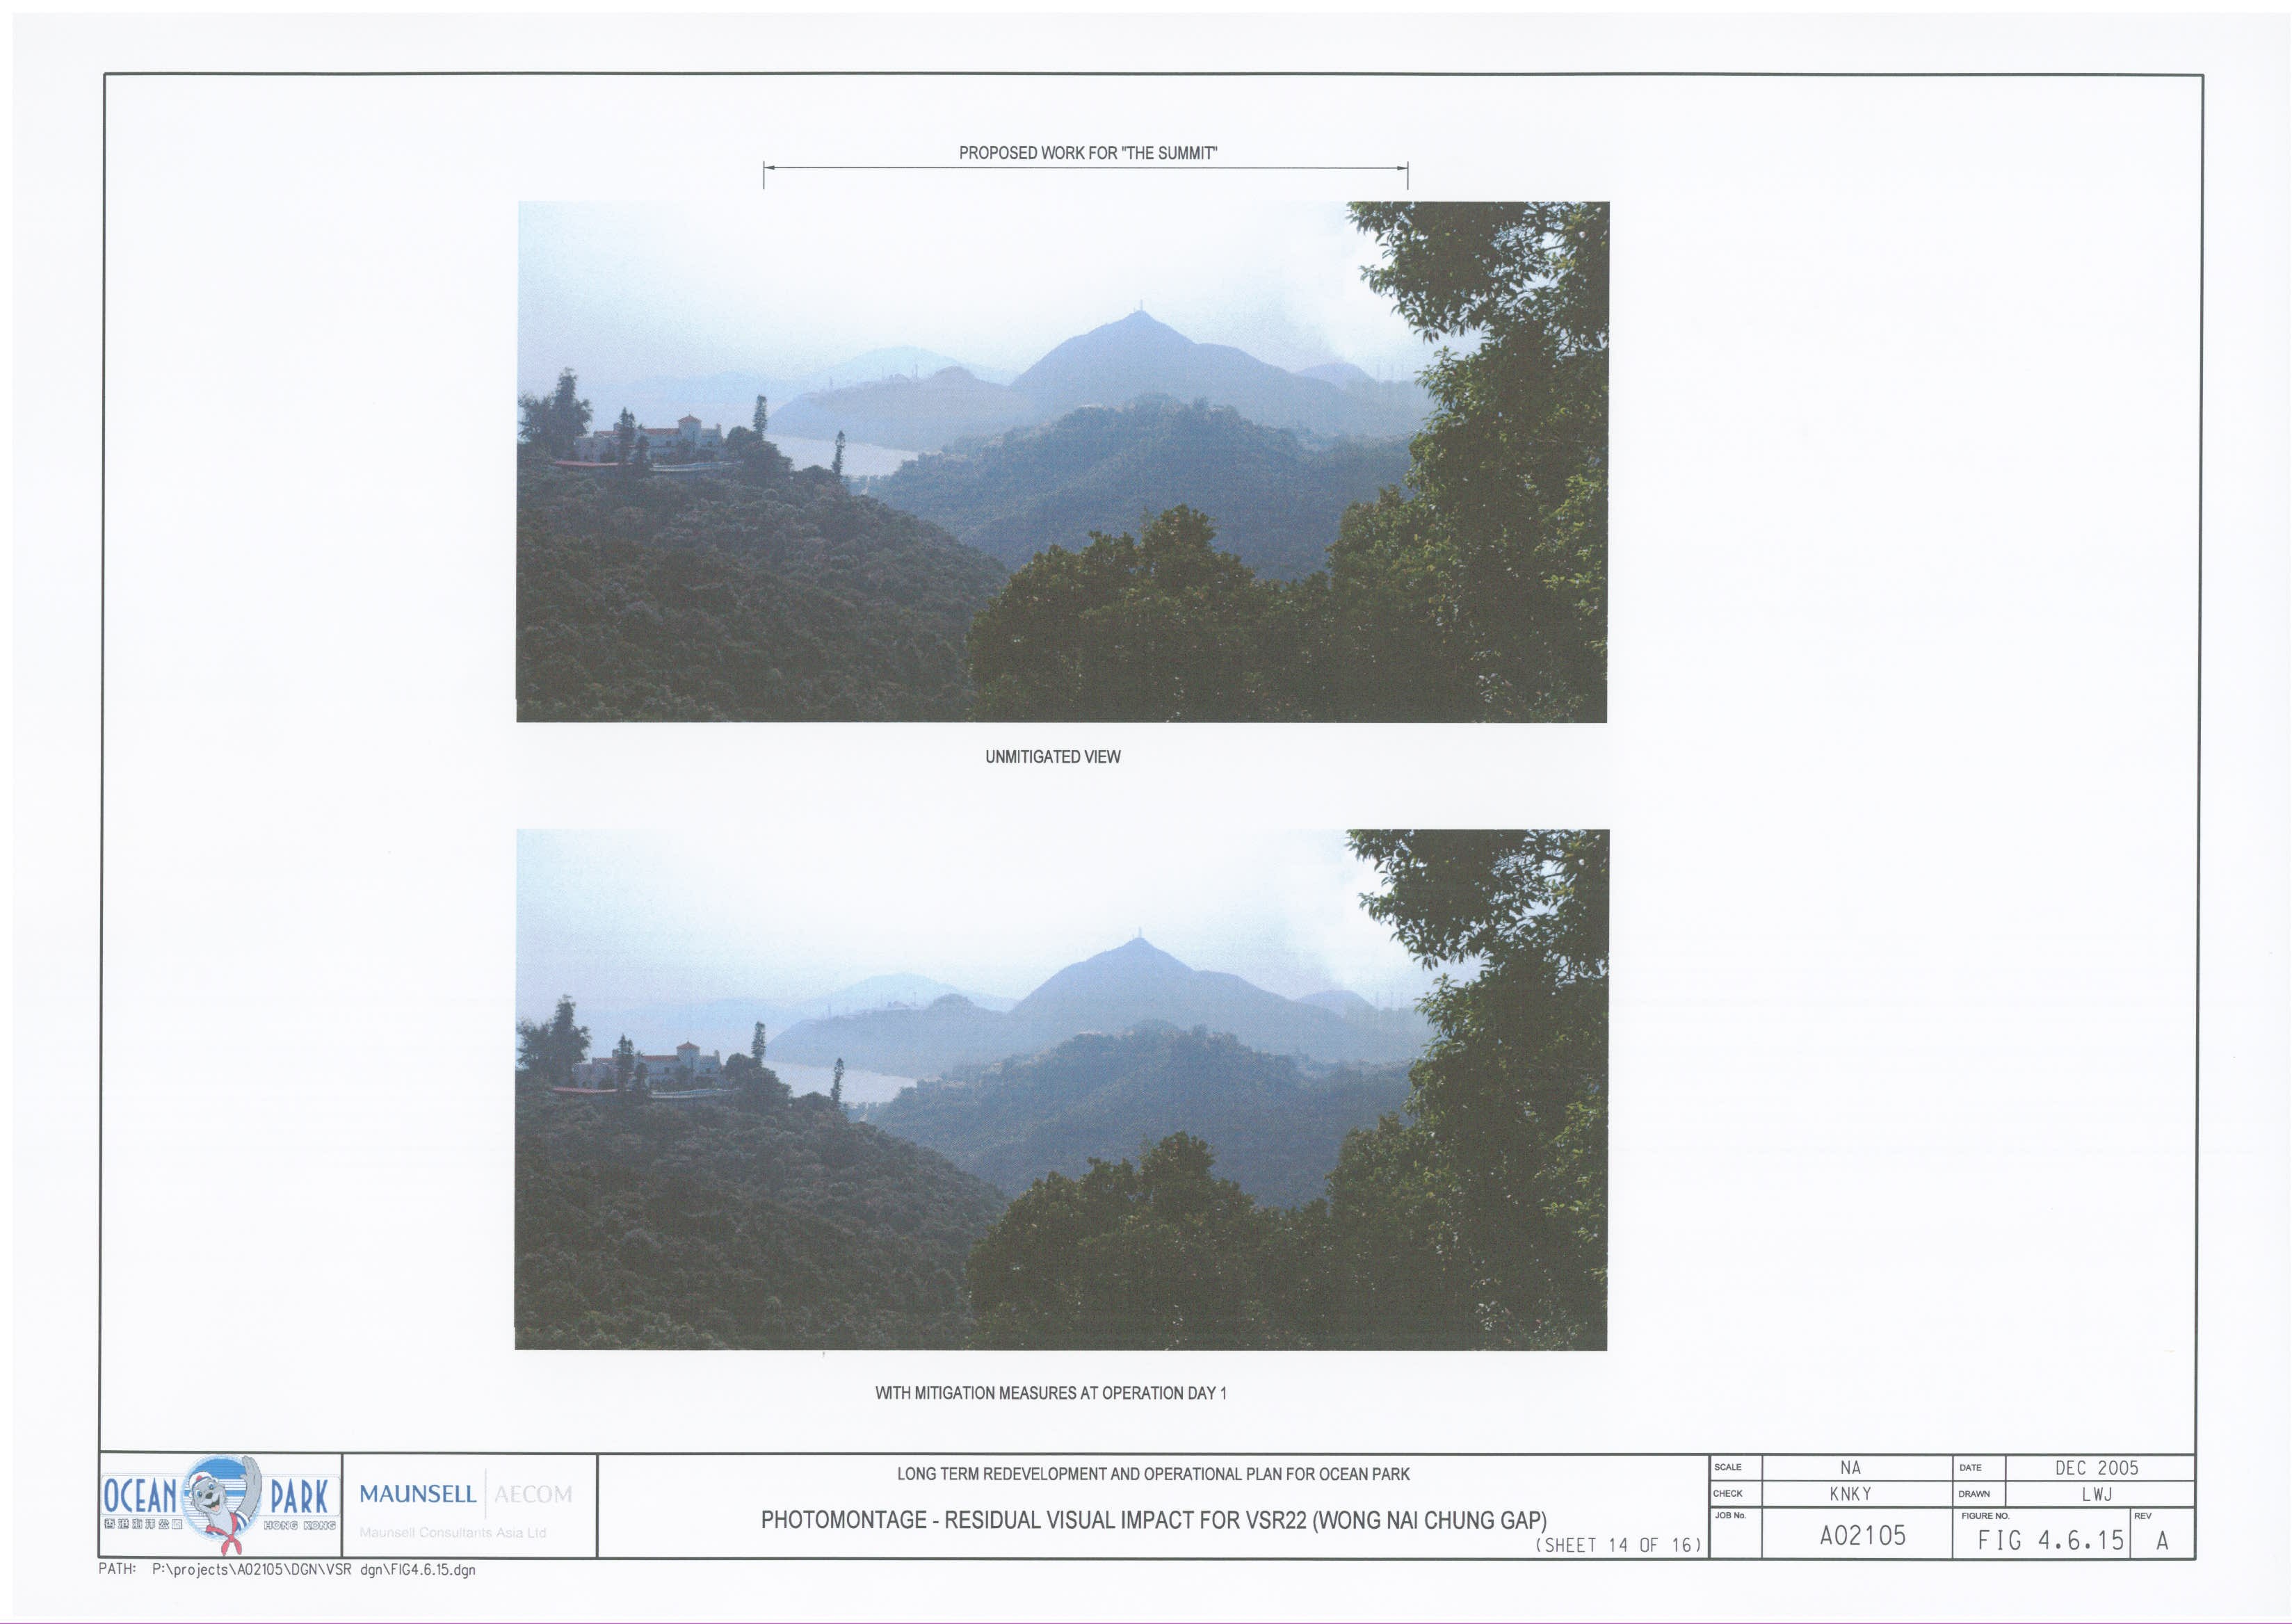
Figure 4.6.15 Photomontage
– Residual Visual Impact for VSR22 (Wong Nai Chung Gap) – Sheet 14 of 16
Figure
4.6.16 Photomontage
– Residual Visual Impact for VSR28 (Manly Villa) – Sheet 15 of 16
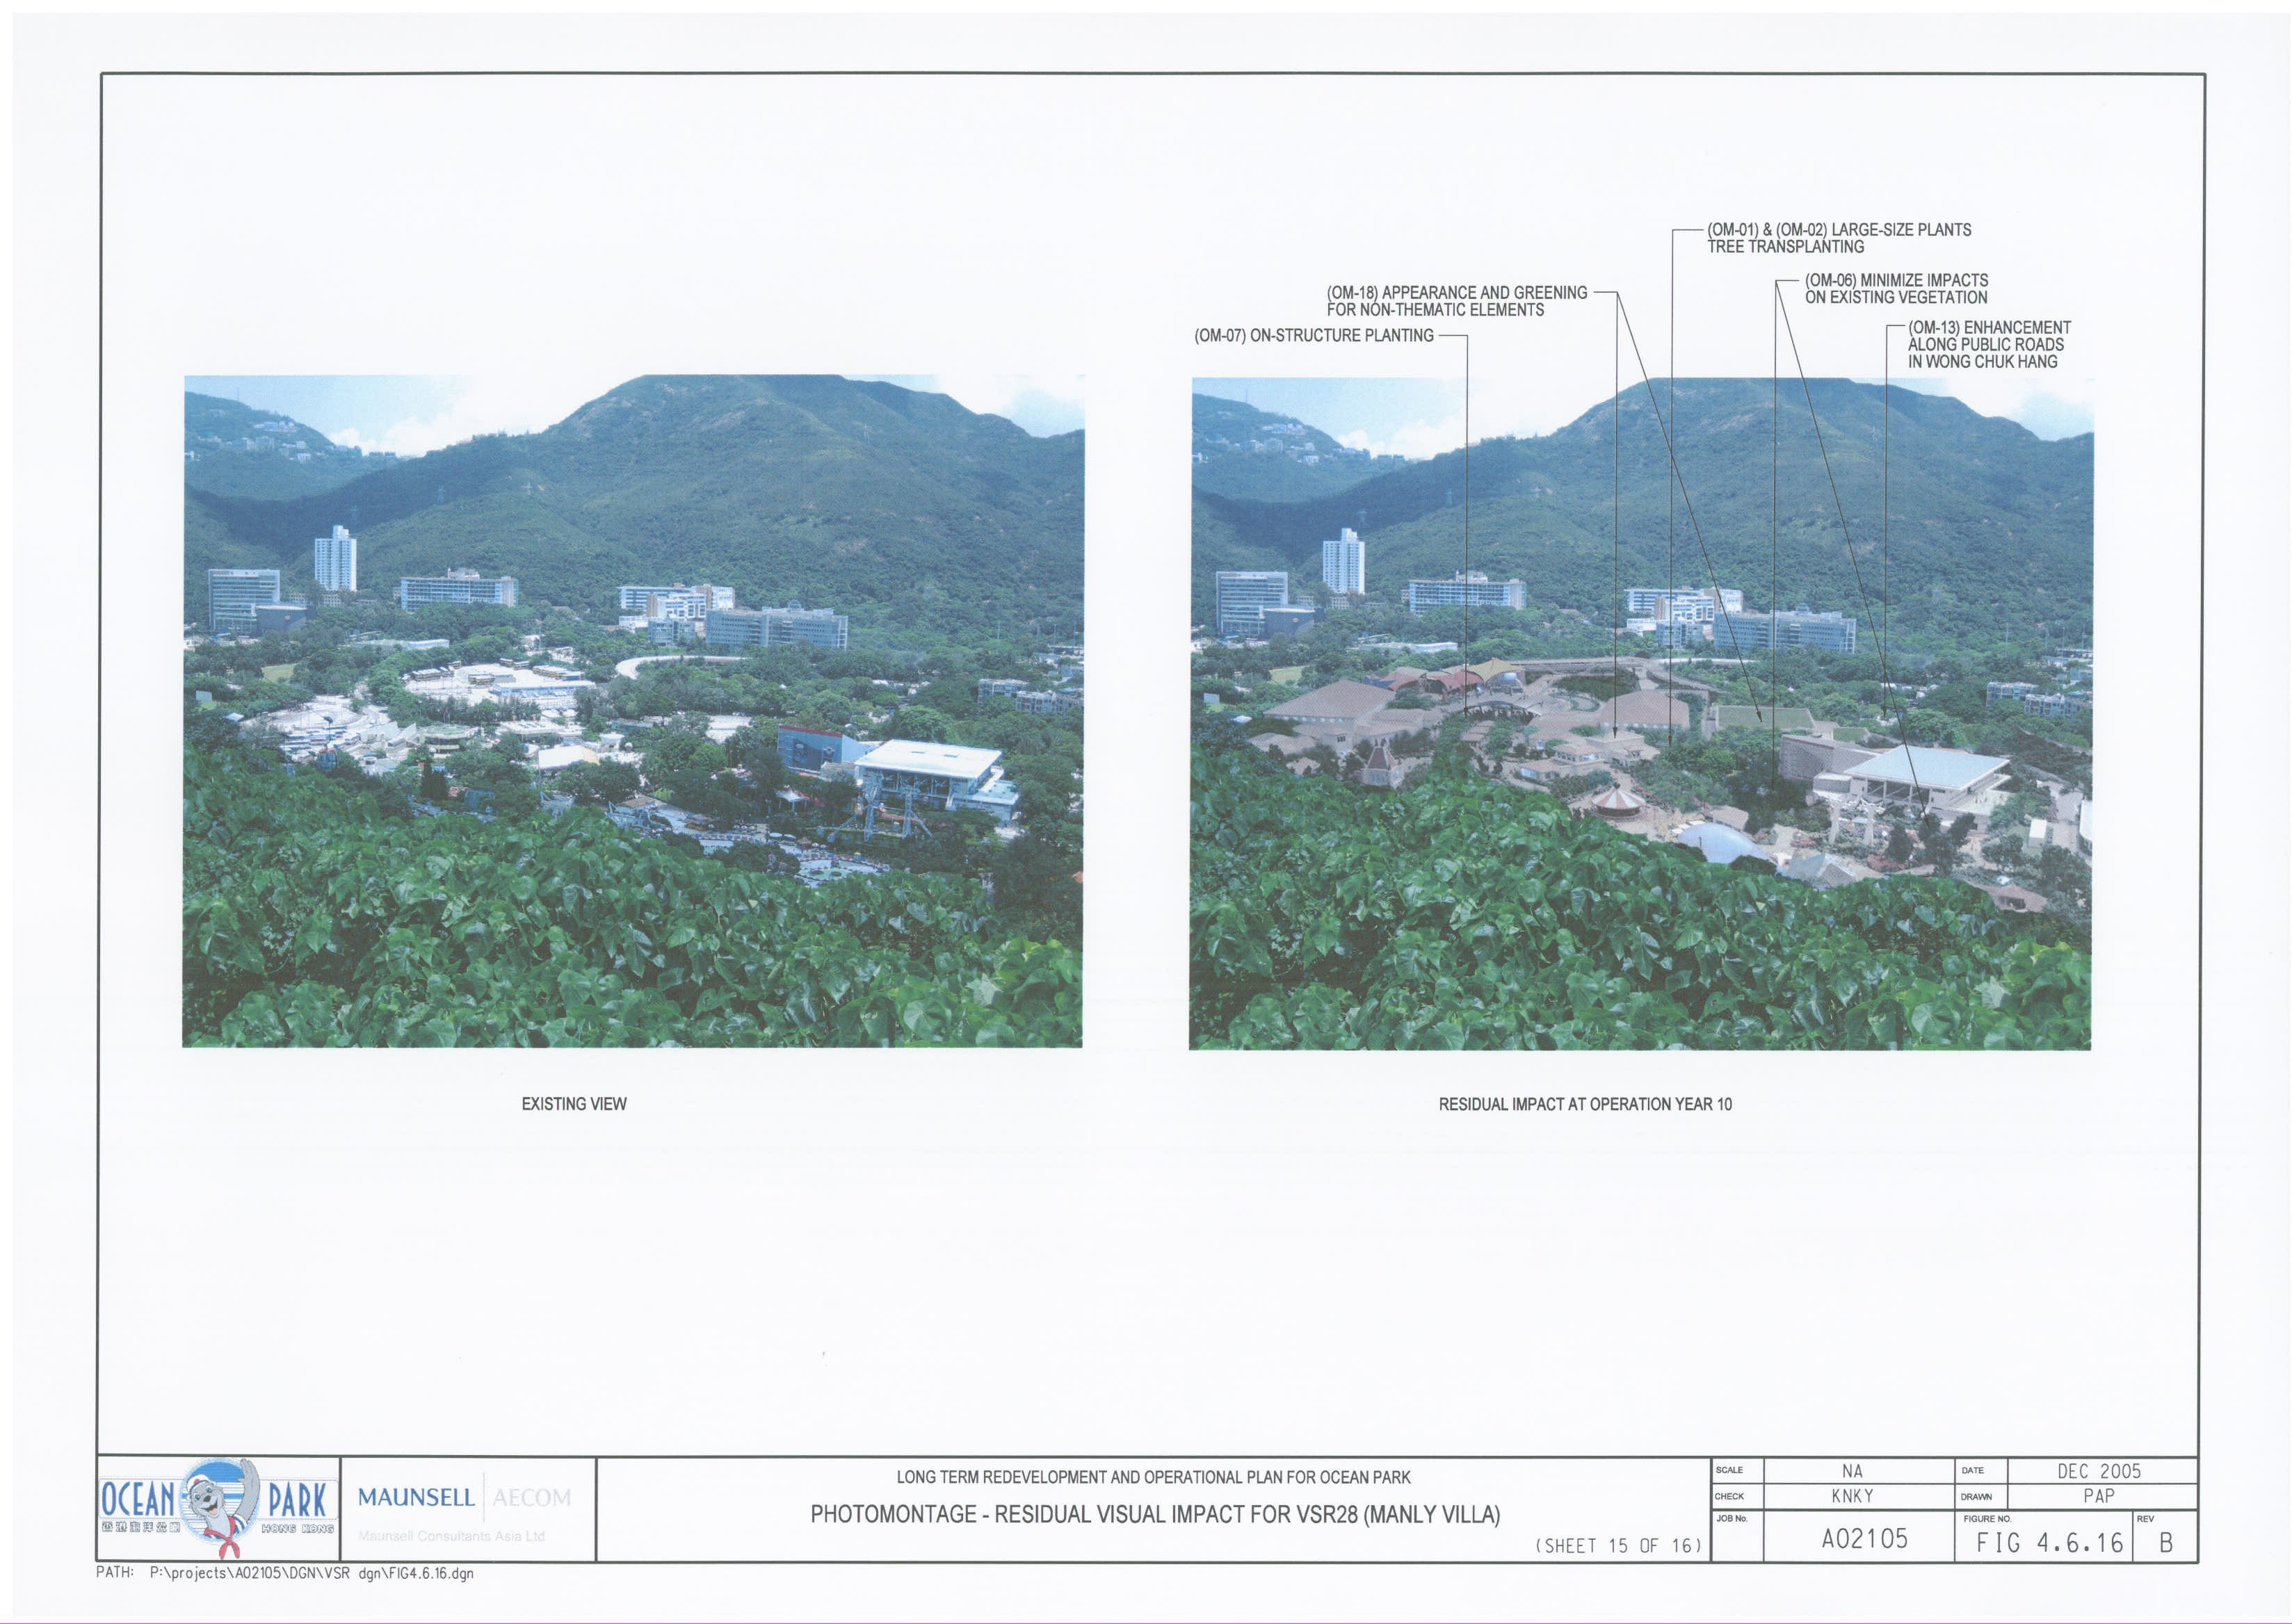
Figure
4.6.17 Photomontage
– Residual Visual Impact for VSR28 (Manly Villa) – Sheet 16 of 16
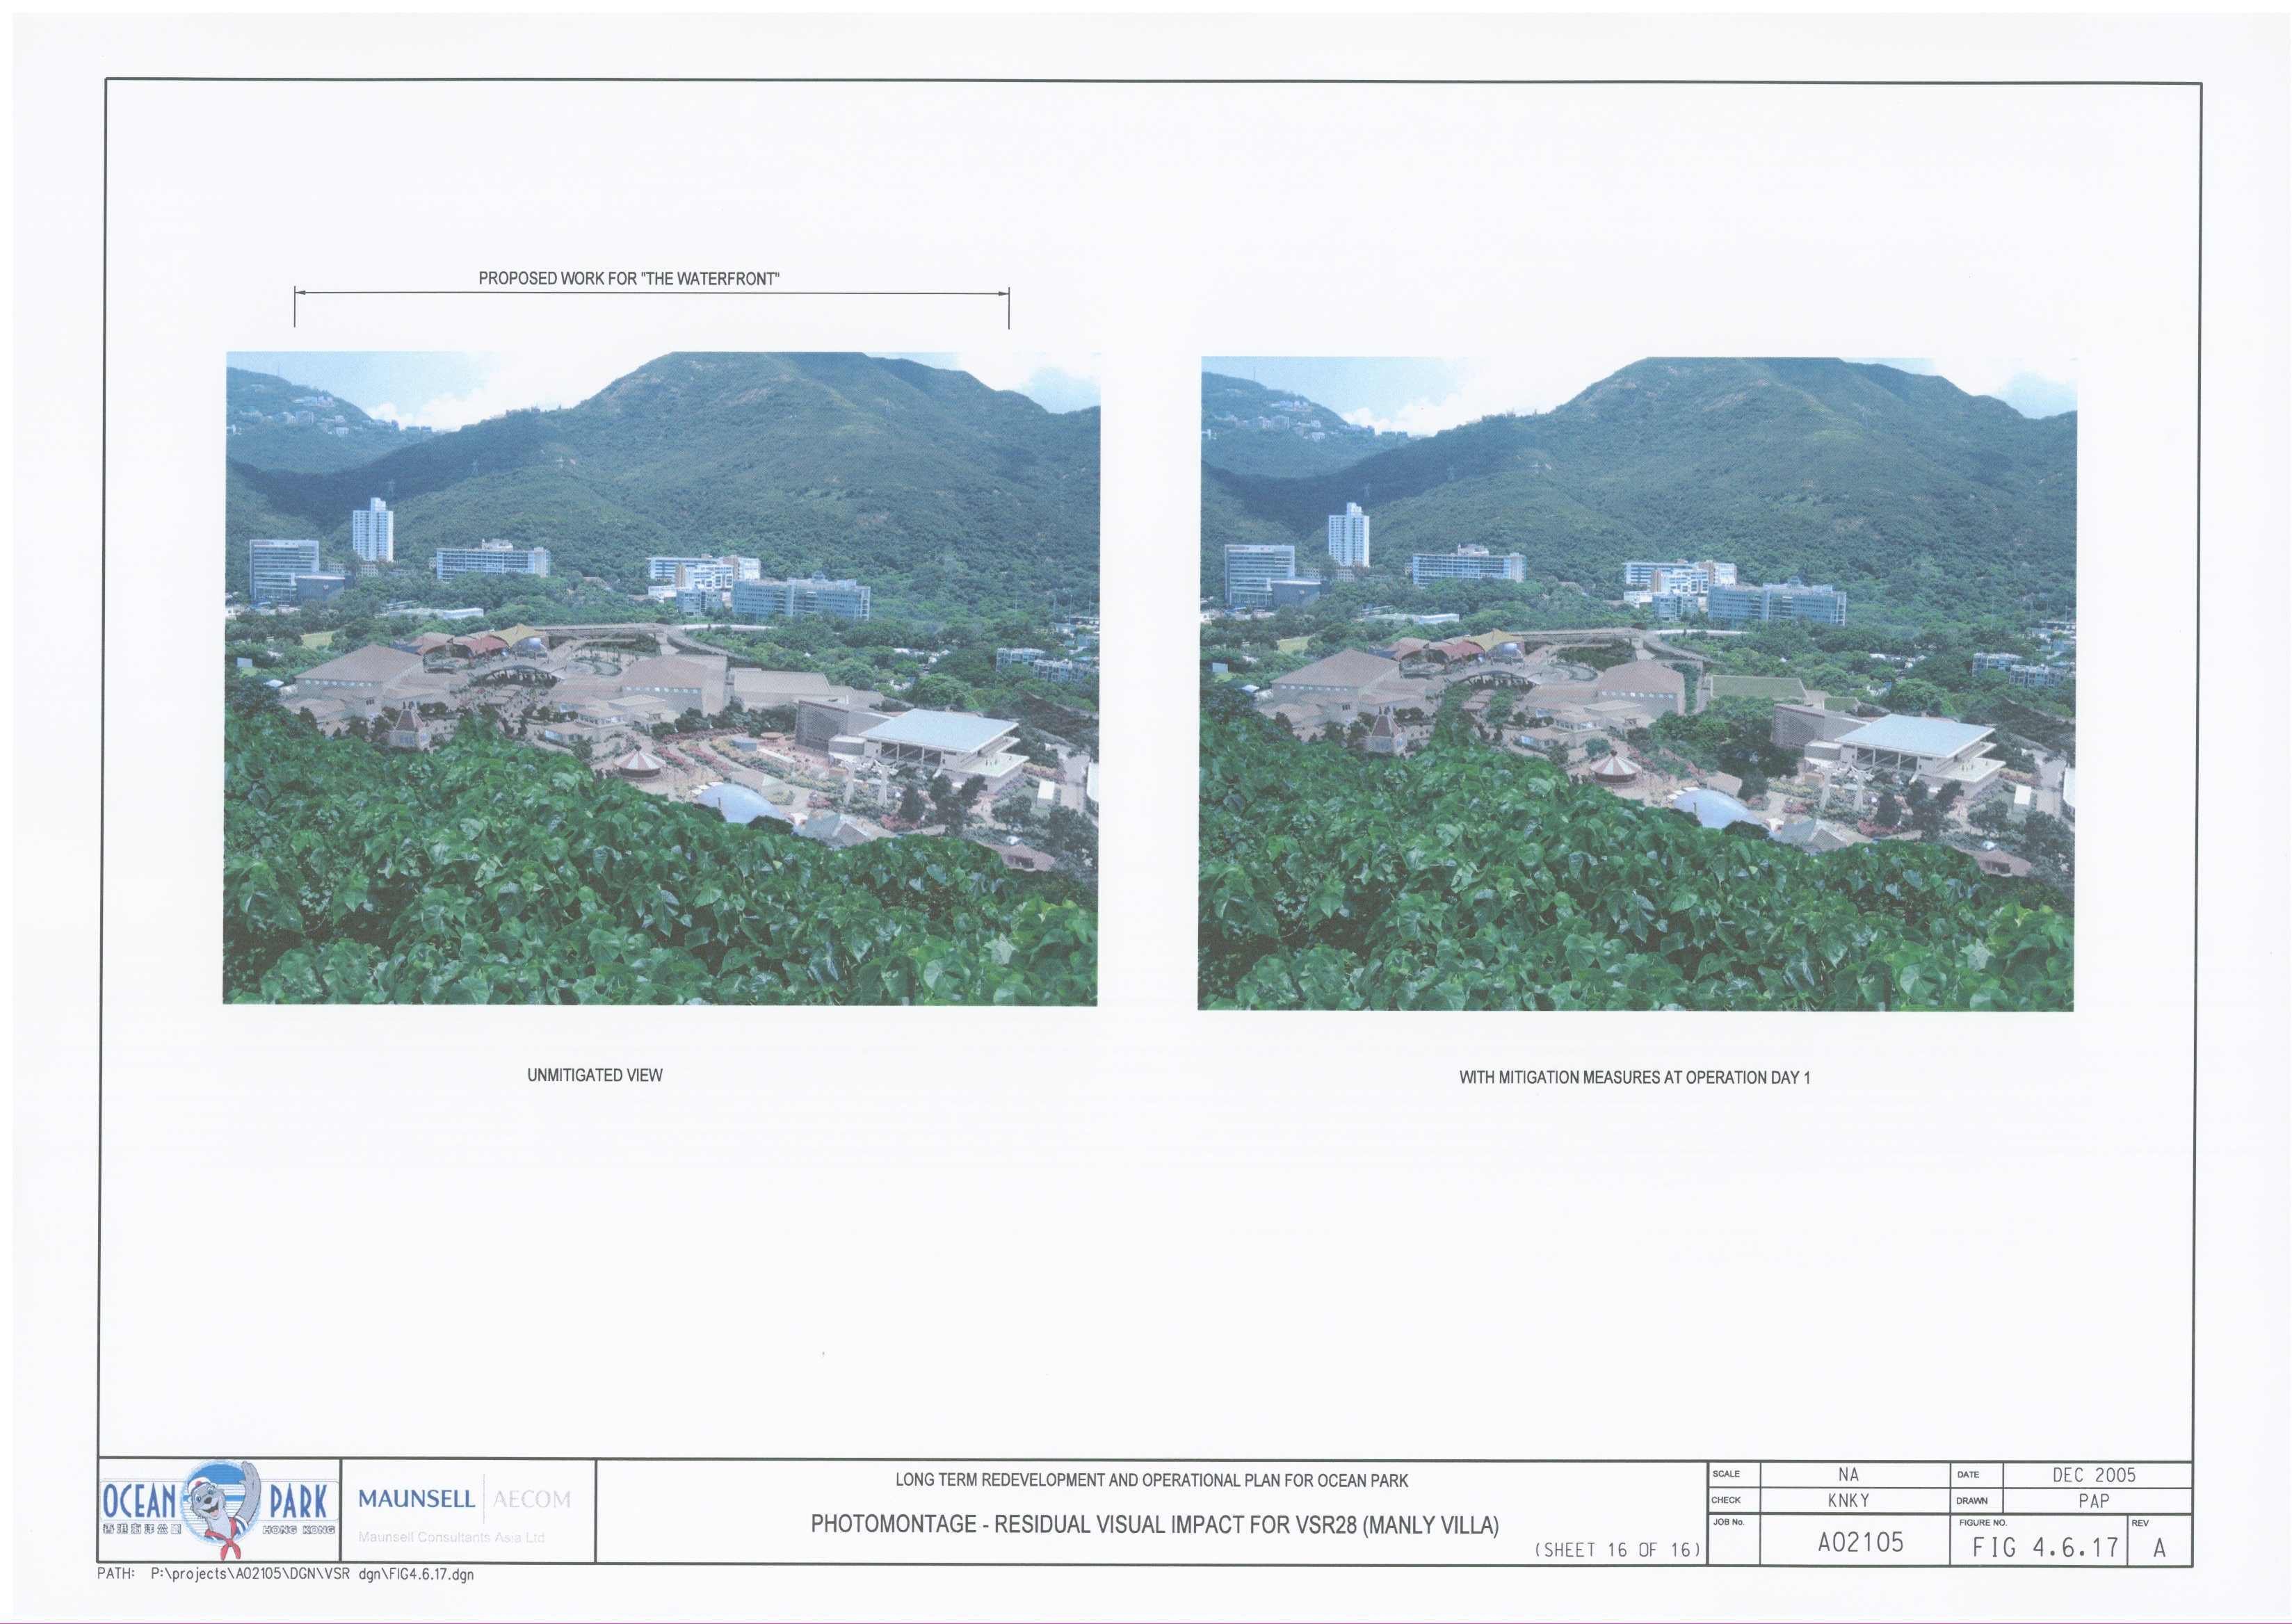
Figure
4.6.18 Photomontage
– Residual Visual Impact for VSR14 (Shouson Hill) – Sheet 1 of 4
Figure
4.6.19 Photomontage
– Residual Visual Impact for VSR14 (Shouson Hill) – Sheet 2 of 4
Figure
4.6.20 Photomontage
– Residual Visual Impact for VSR15 (Deep Water Bay) – Sheet 3 of 4
Figure
4.6.21 Photomontage
– Residual Visual Impact for VSR15 – Sheet 4 of 4
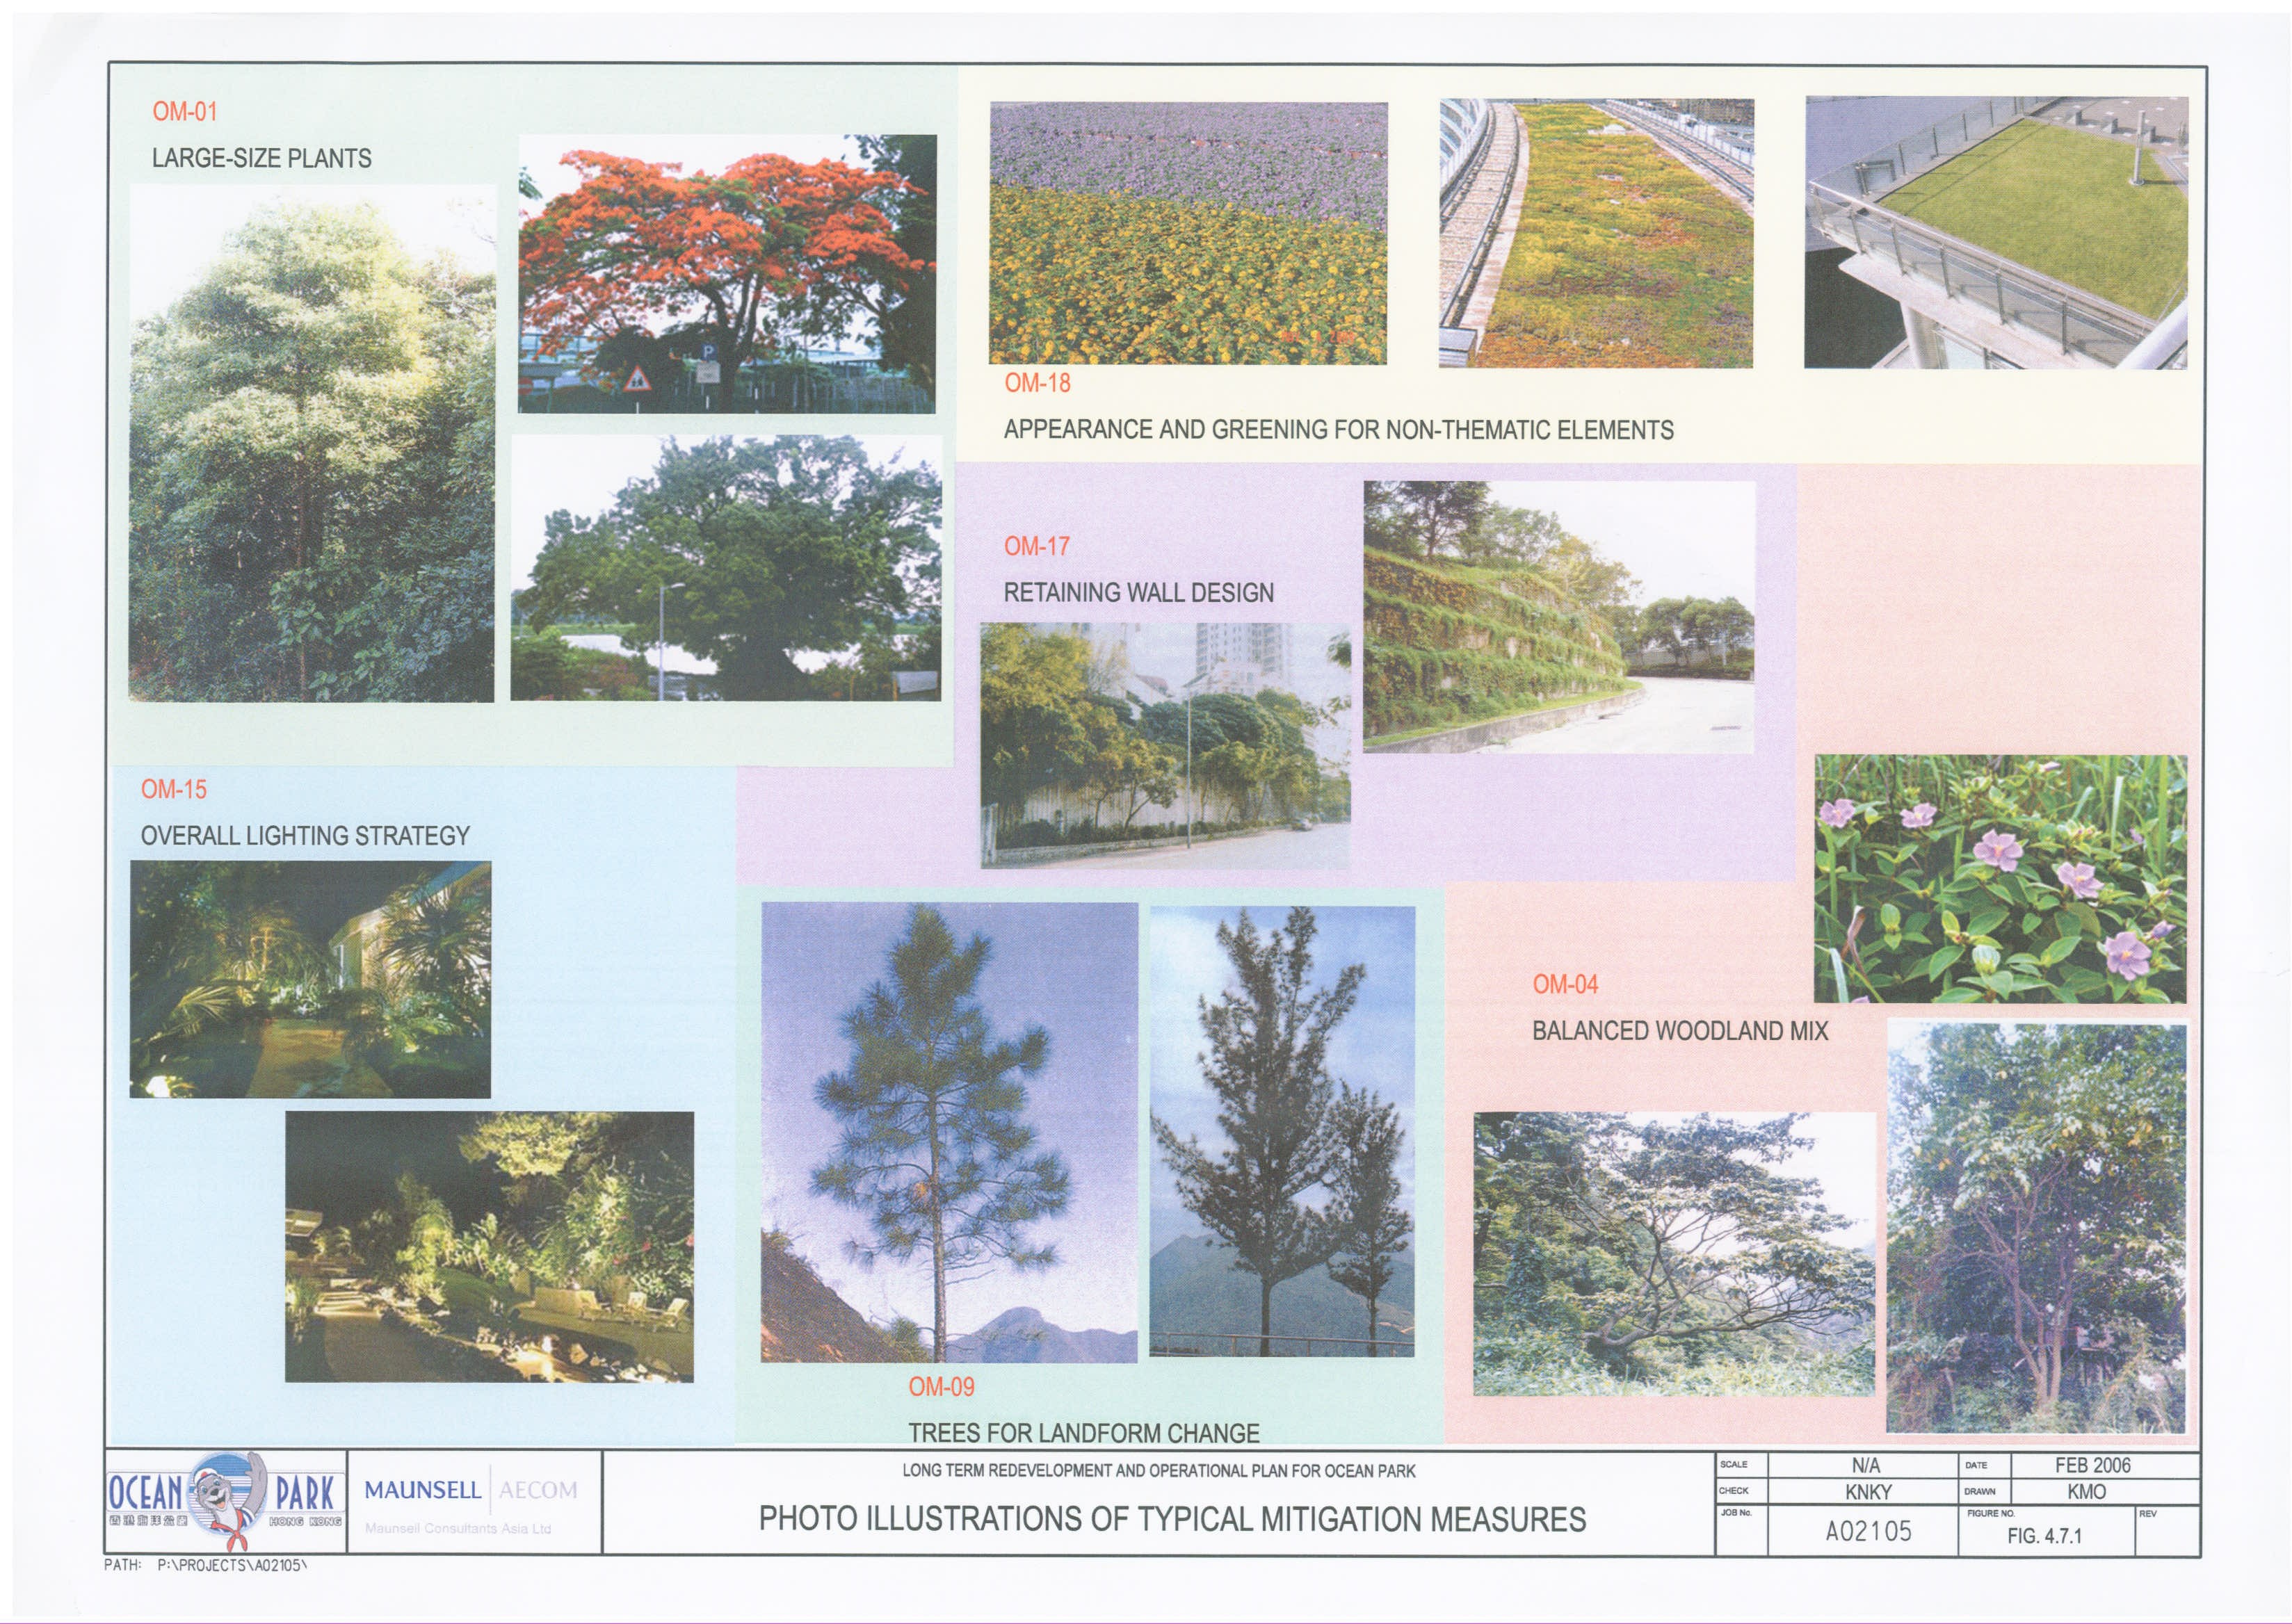
Figure
4.7.1 Photo
Illustrations of Typical Mitigation Measures
Figure 5.2 General
Walk Transect of Avifaunal and Location of Macroinvertebrate Survey
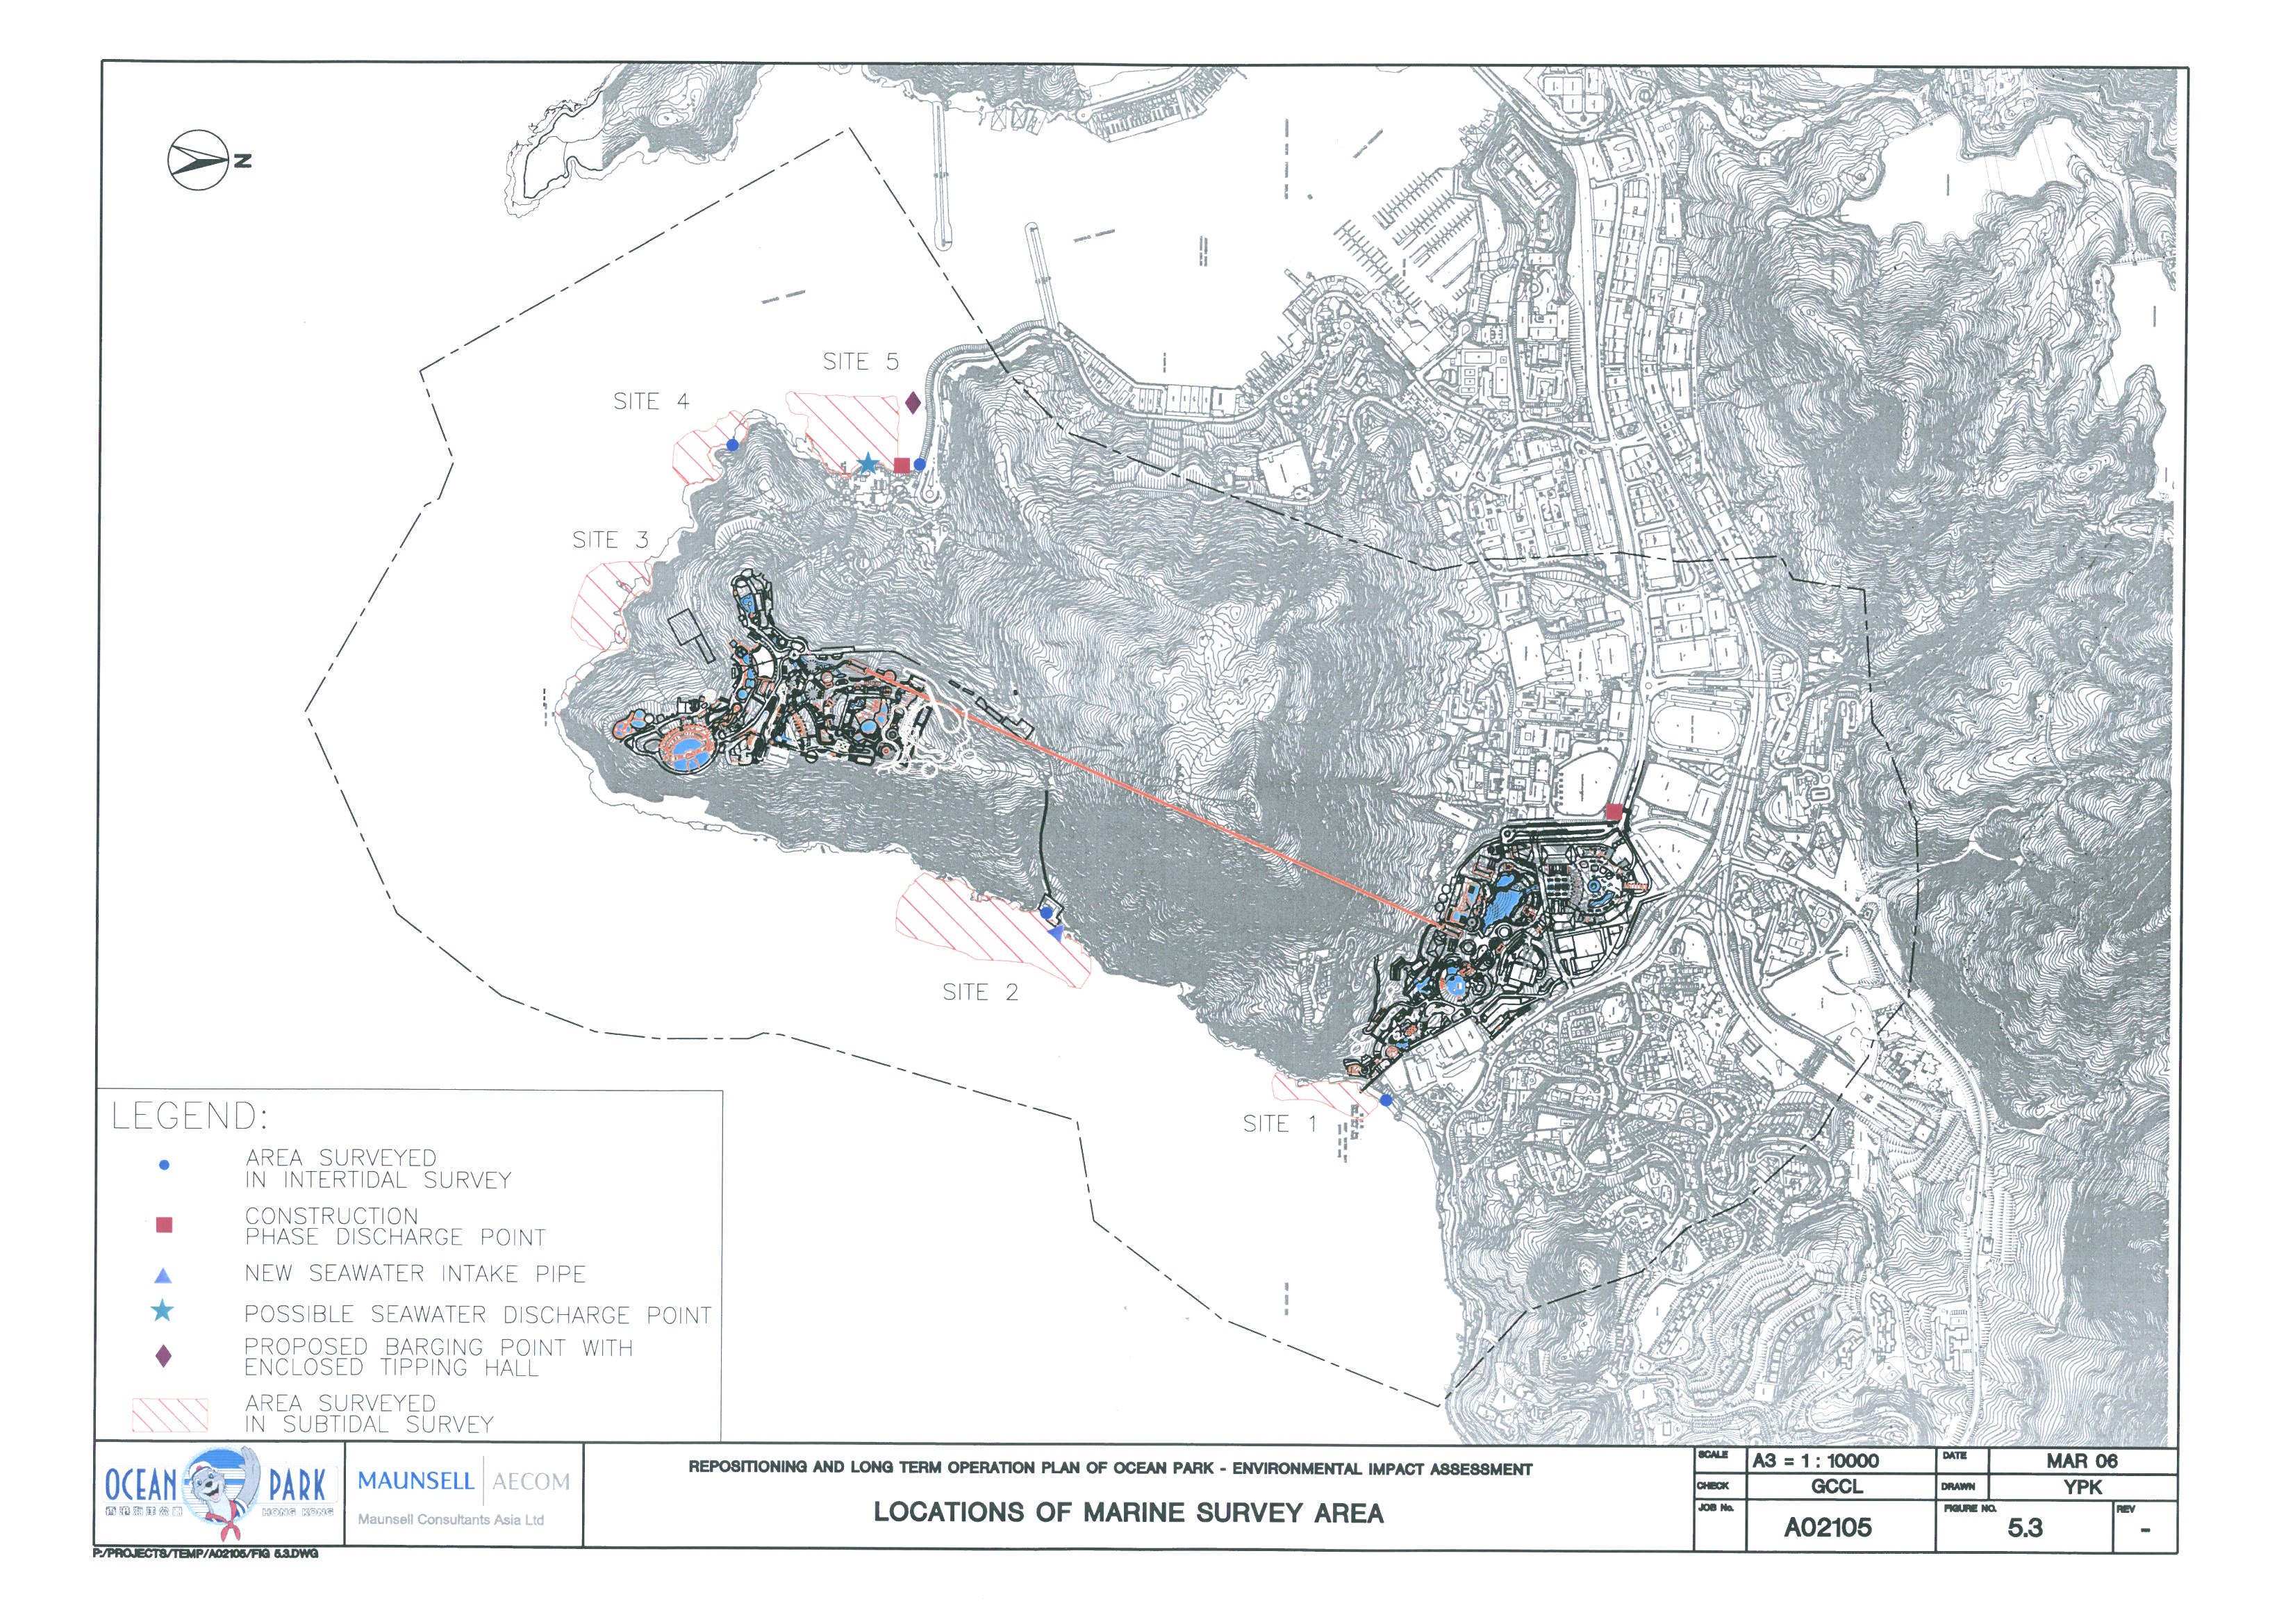
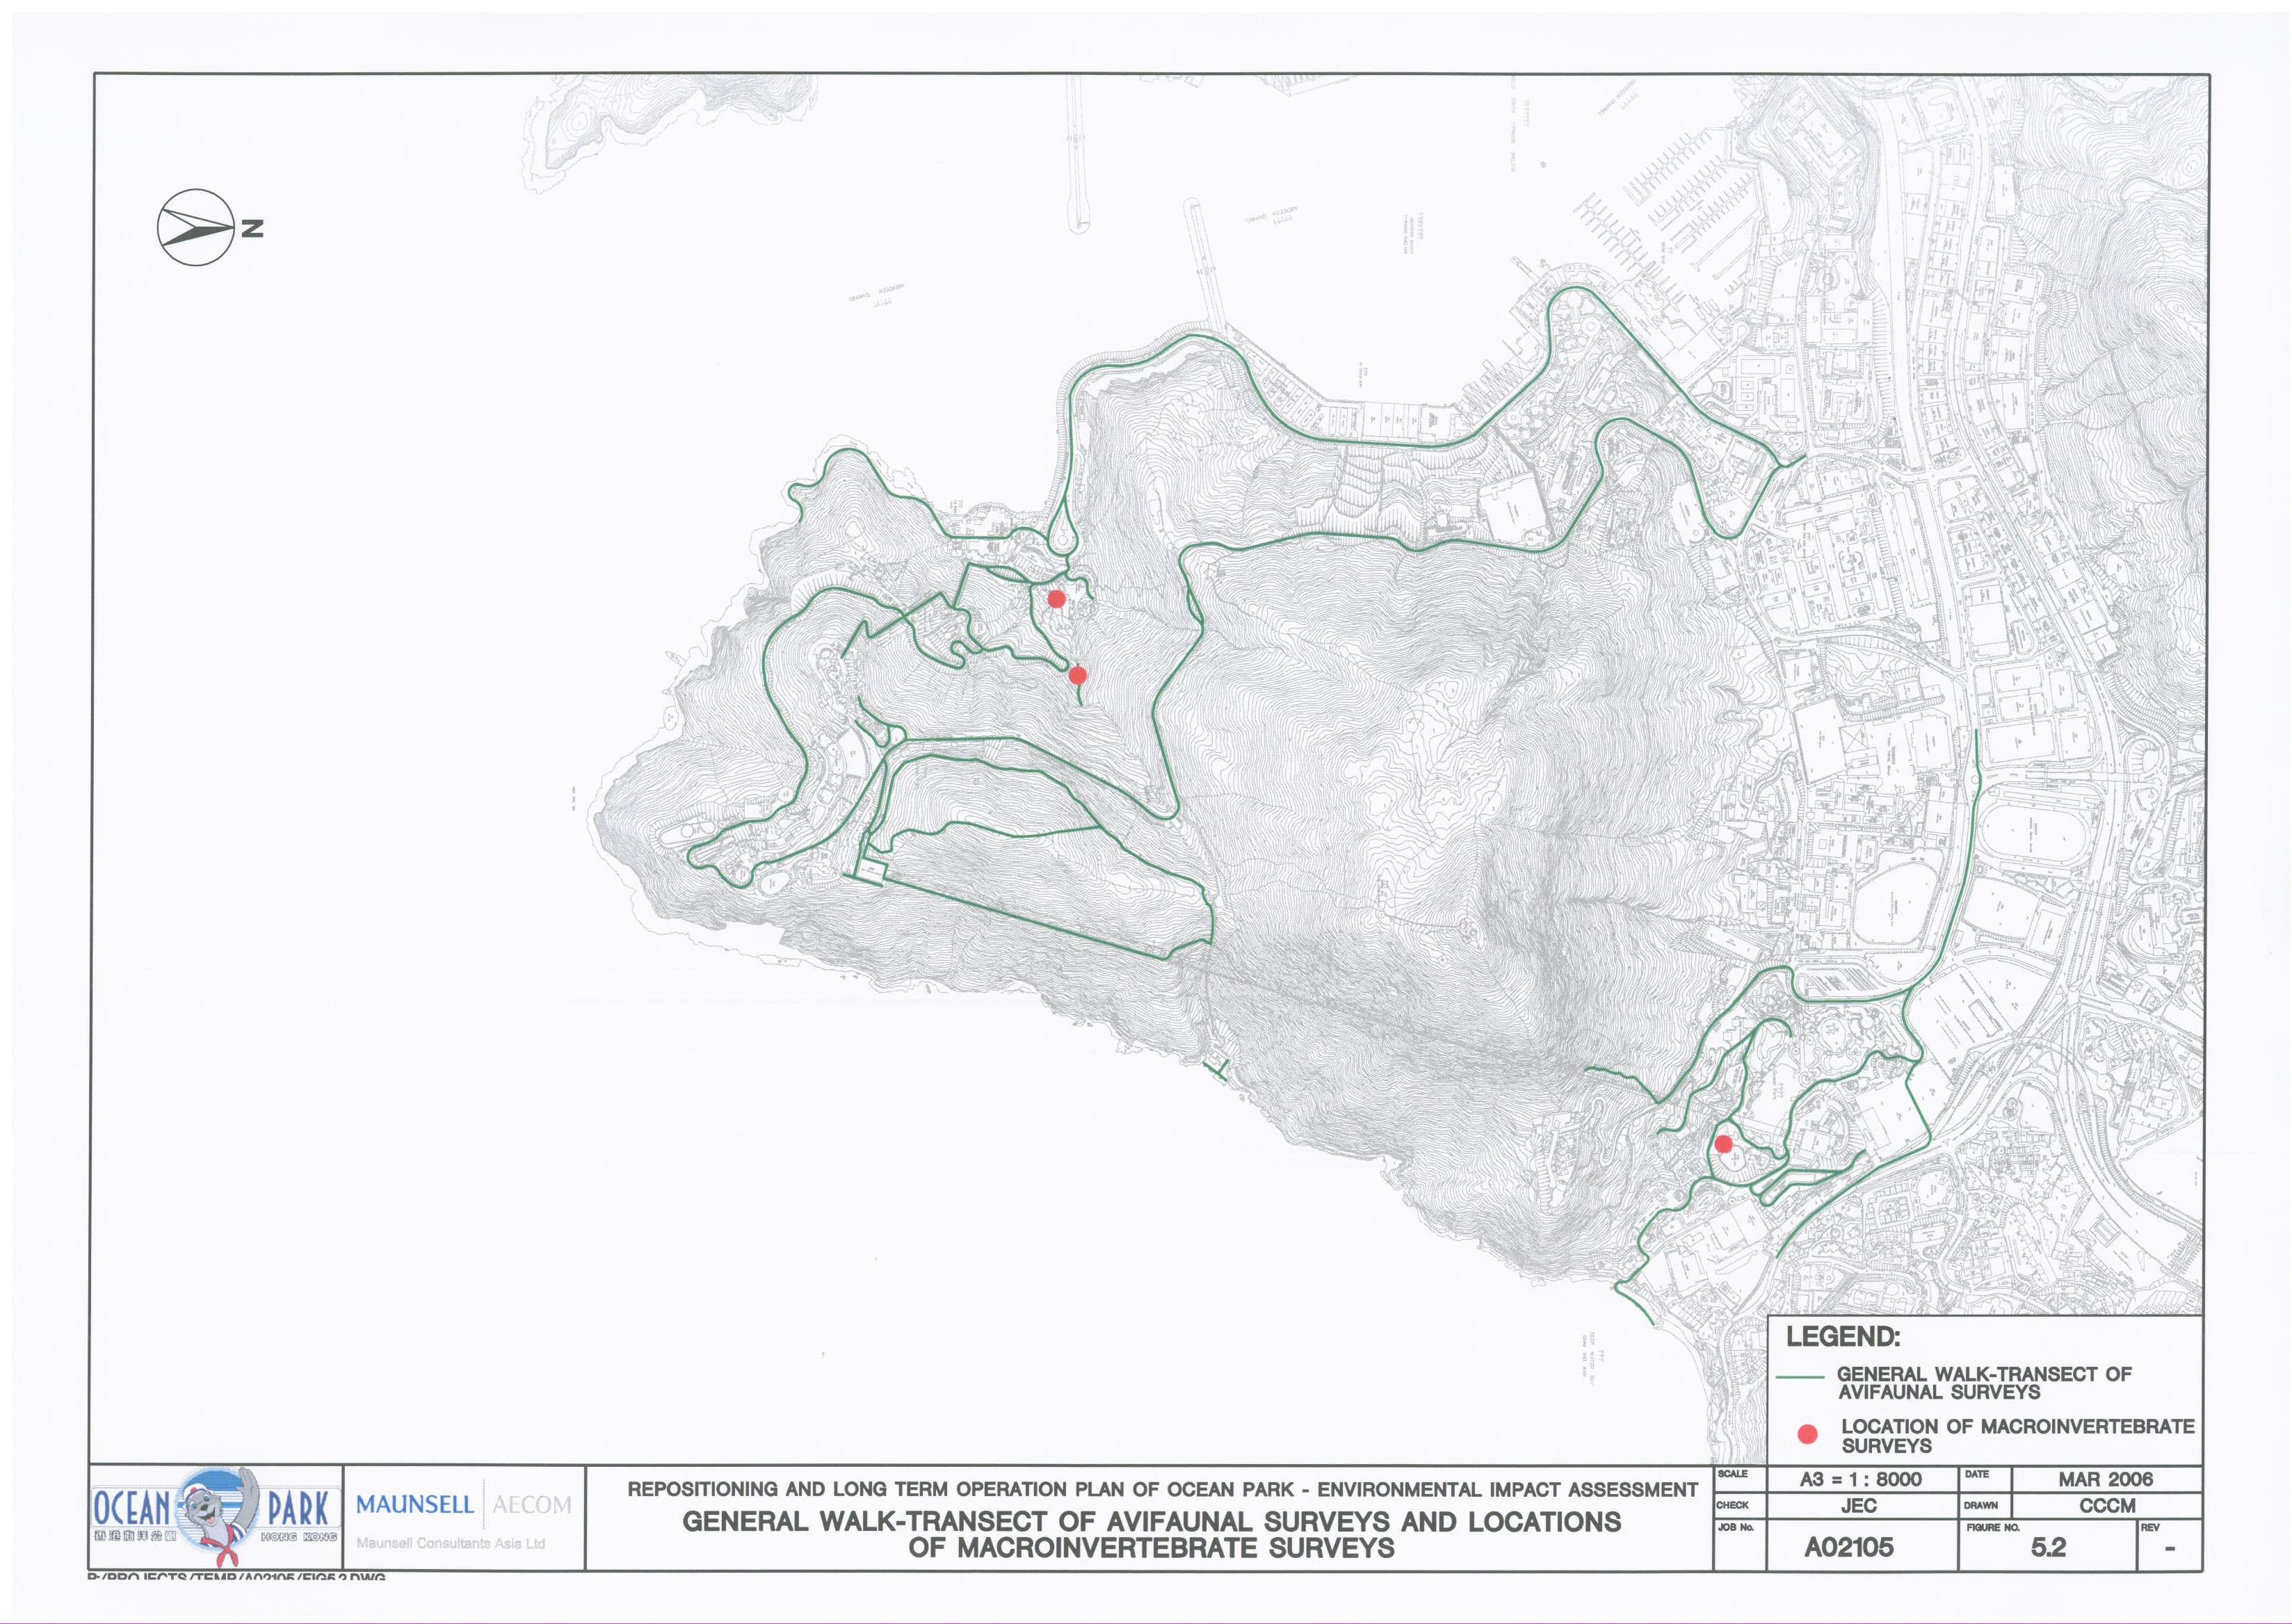
Figure 5.3 Locations
of Marine Survey Area
Figure 5.4 Proposed
Location of Compensatory Planting
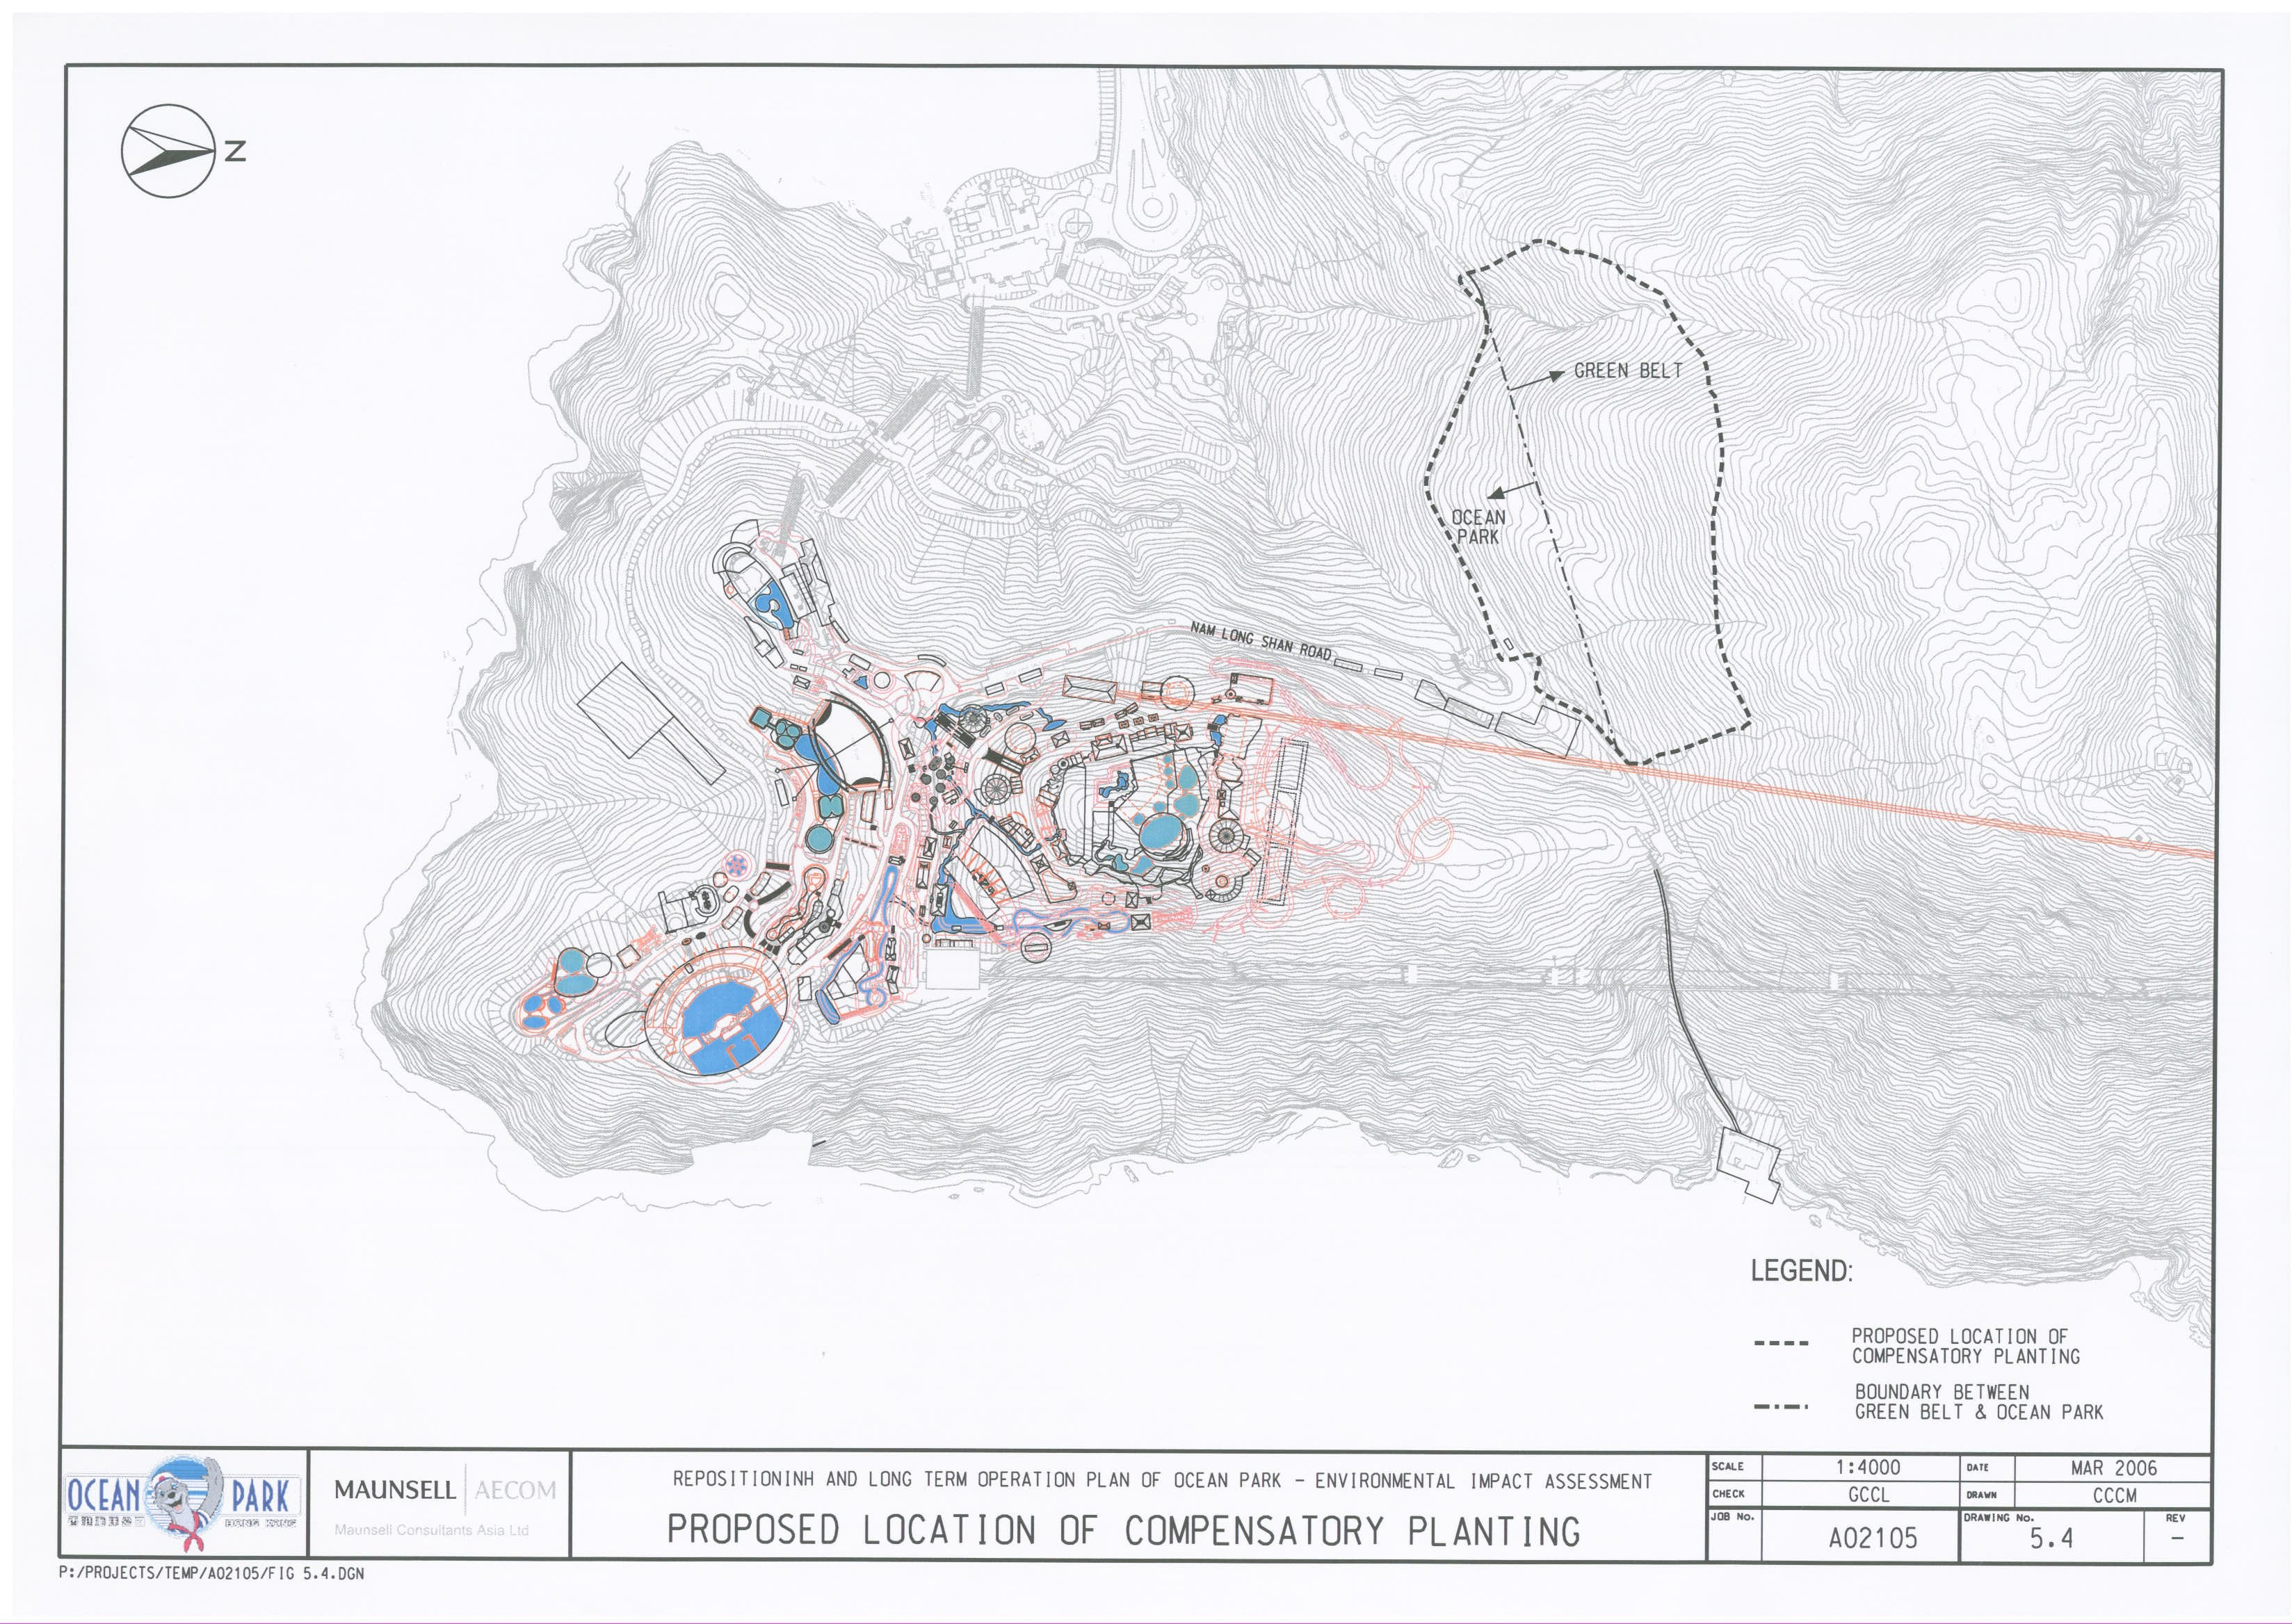
Figure 7.1 Potential
Contaminated Areas Inspected in the Hong Kong School of Motoring
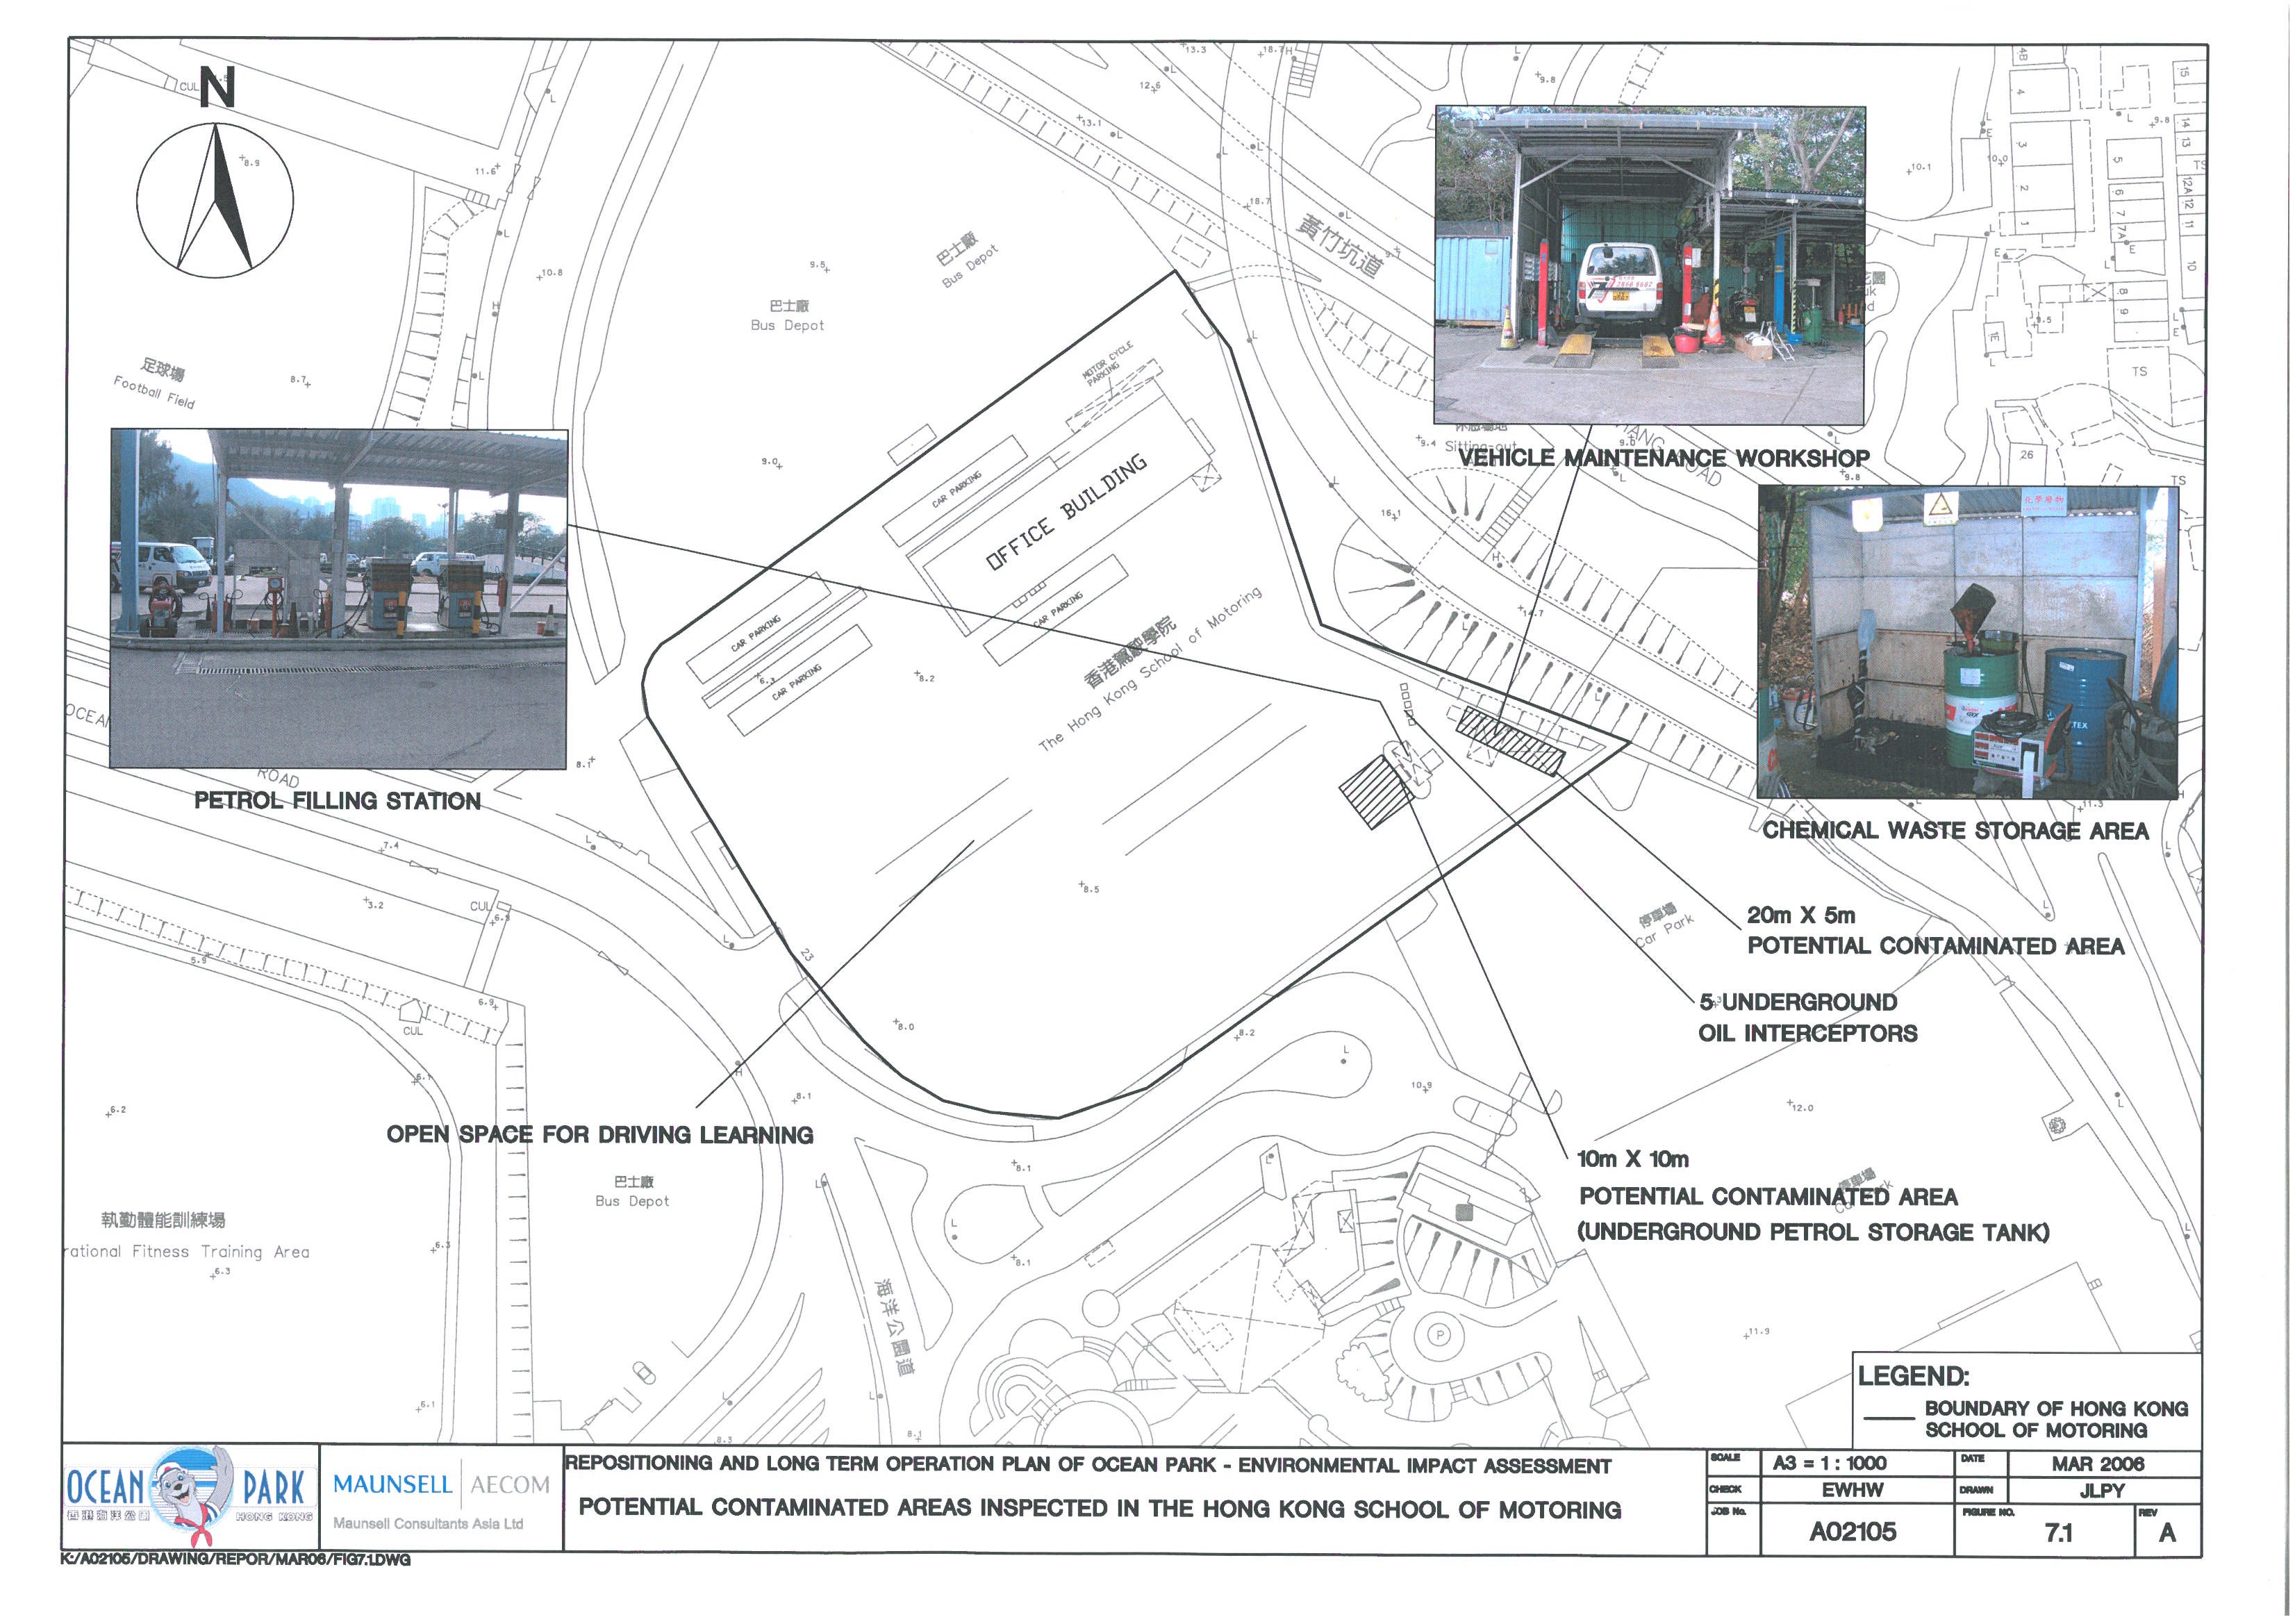
Figure 7.2 Potential
Contaminated Areas Inspected in the Citybus Depot
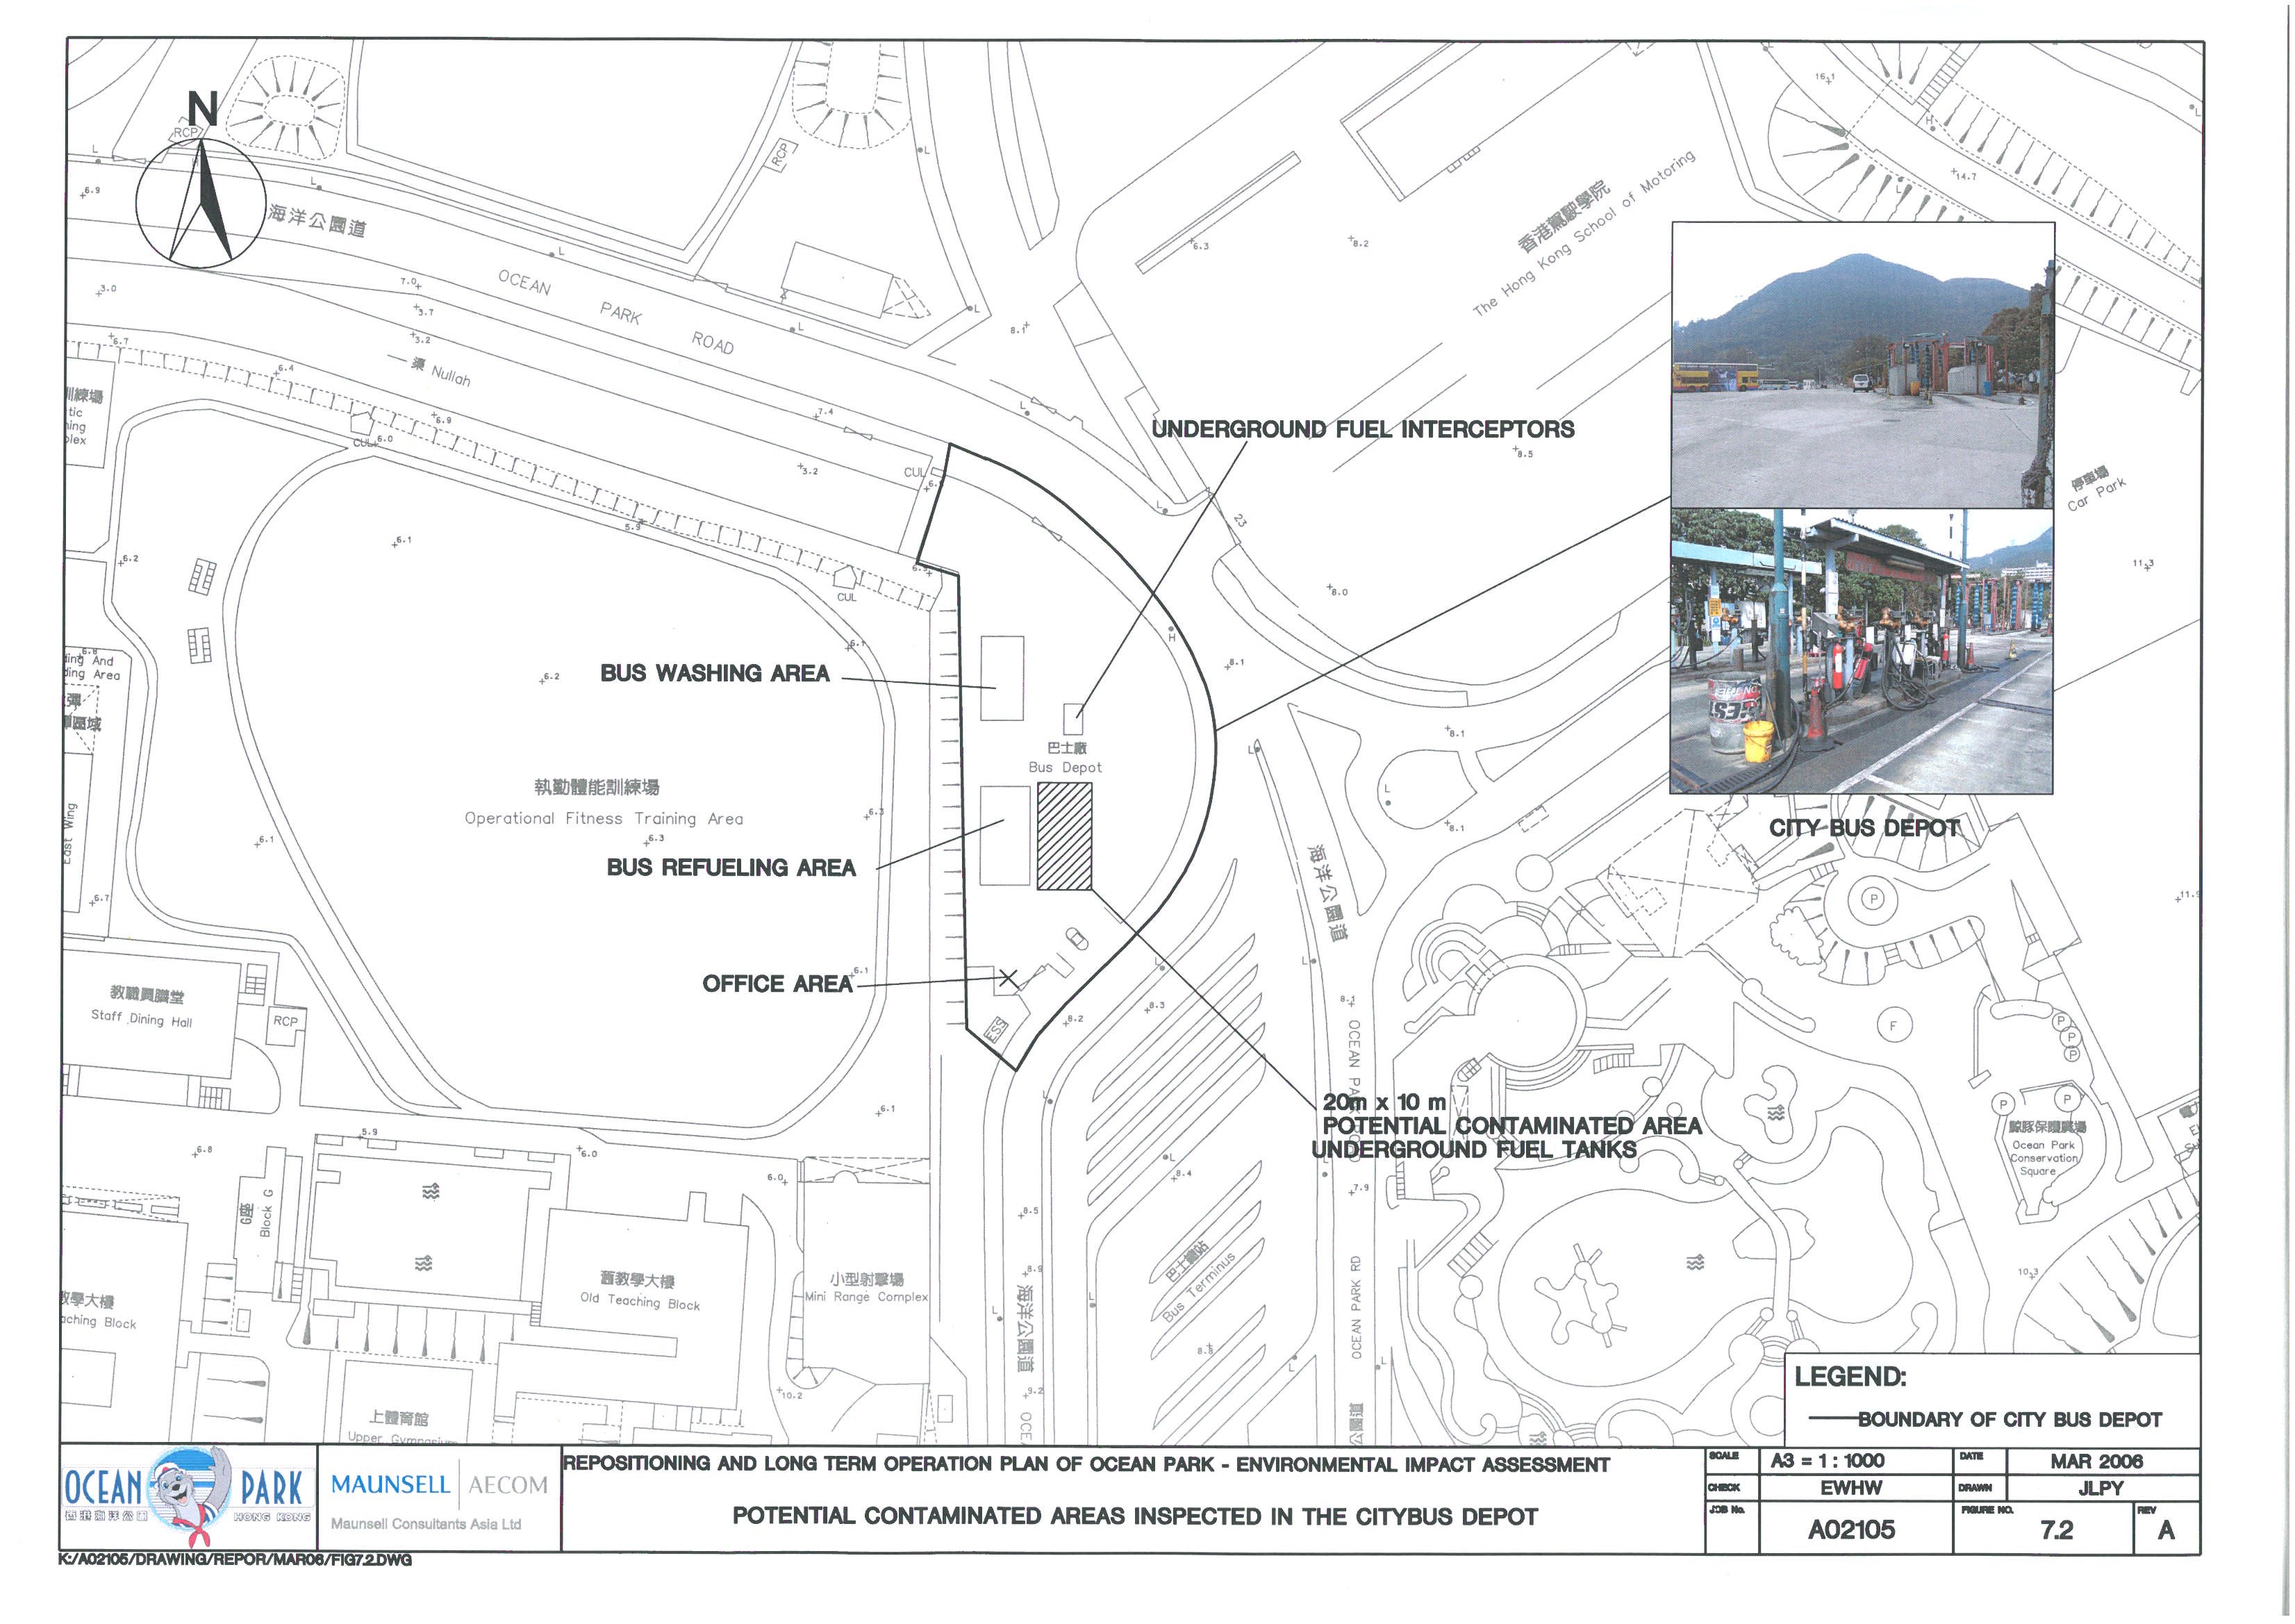
Figure 7.3a Potential
Contaminated Areas Inspected in the Existing Ocean Park - Lowland
Figure 7.3b Potential
Contaminated Areas Inspected in the Existing Ocean Park - Headland
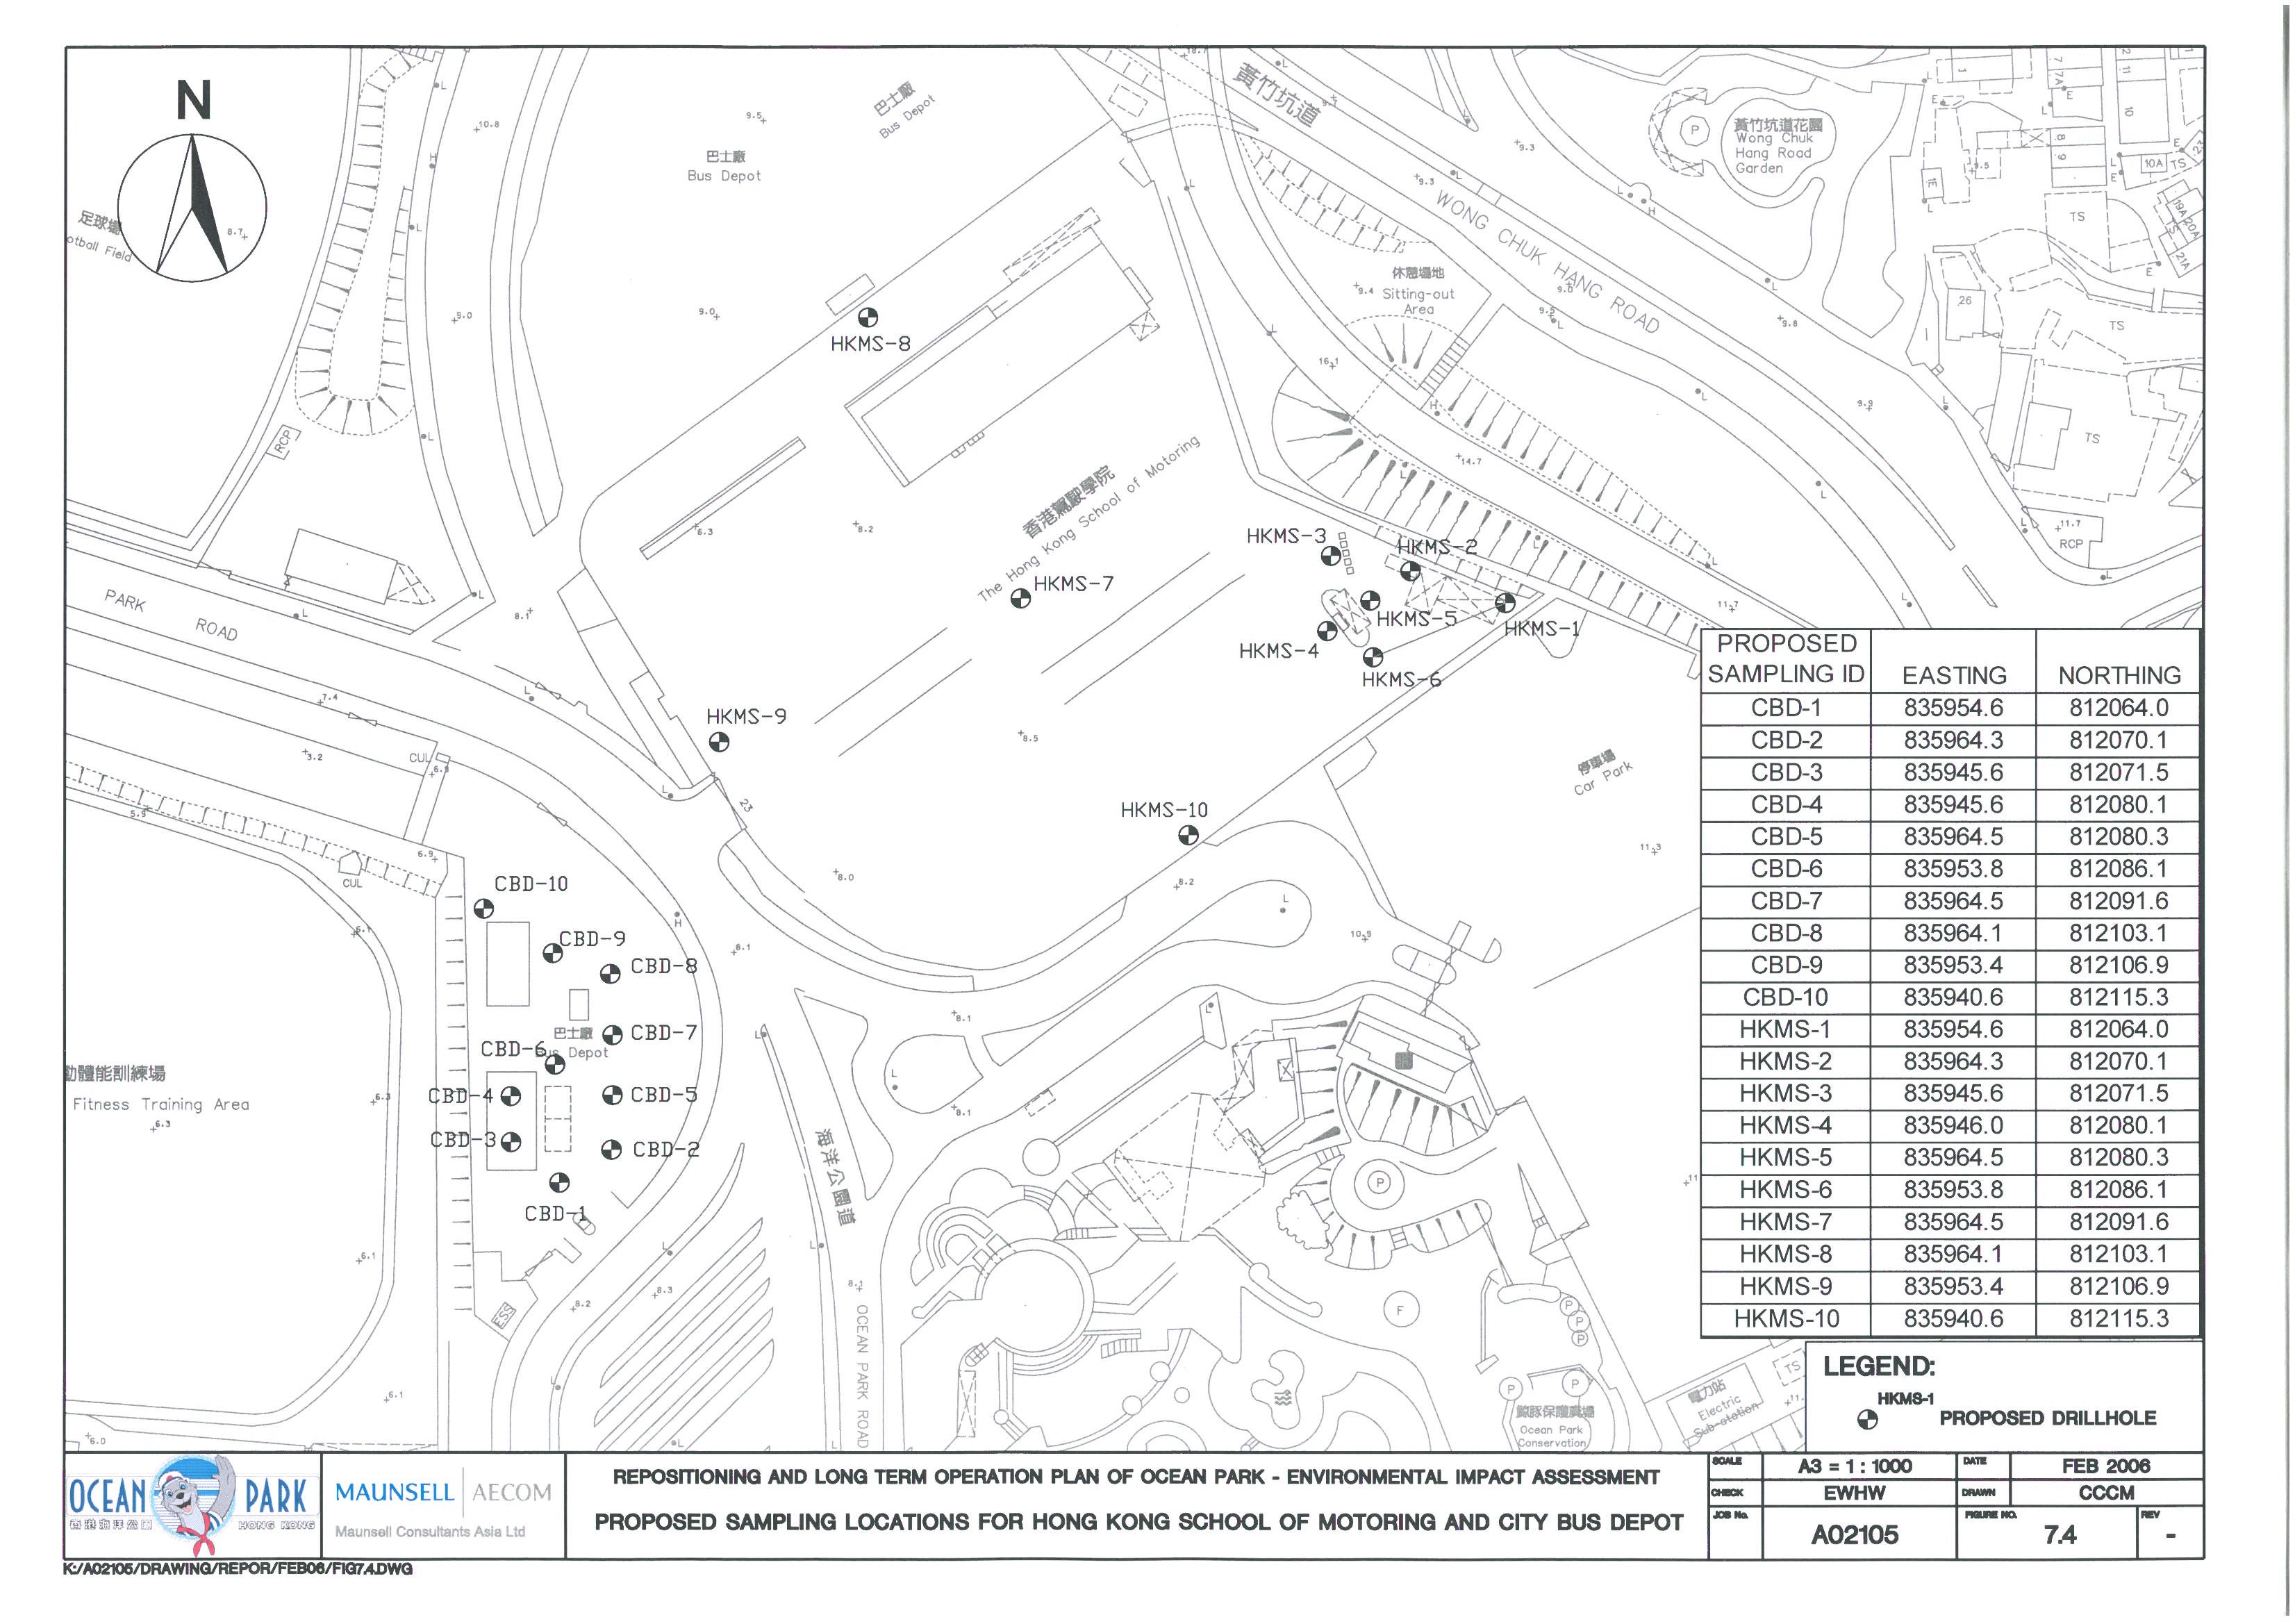
Figure 7.4 Proposed
Sampling Locations for Hong Kong School of Motoring and City Bus Depot
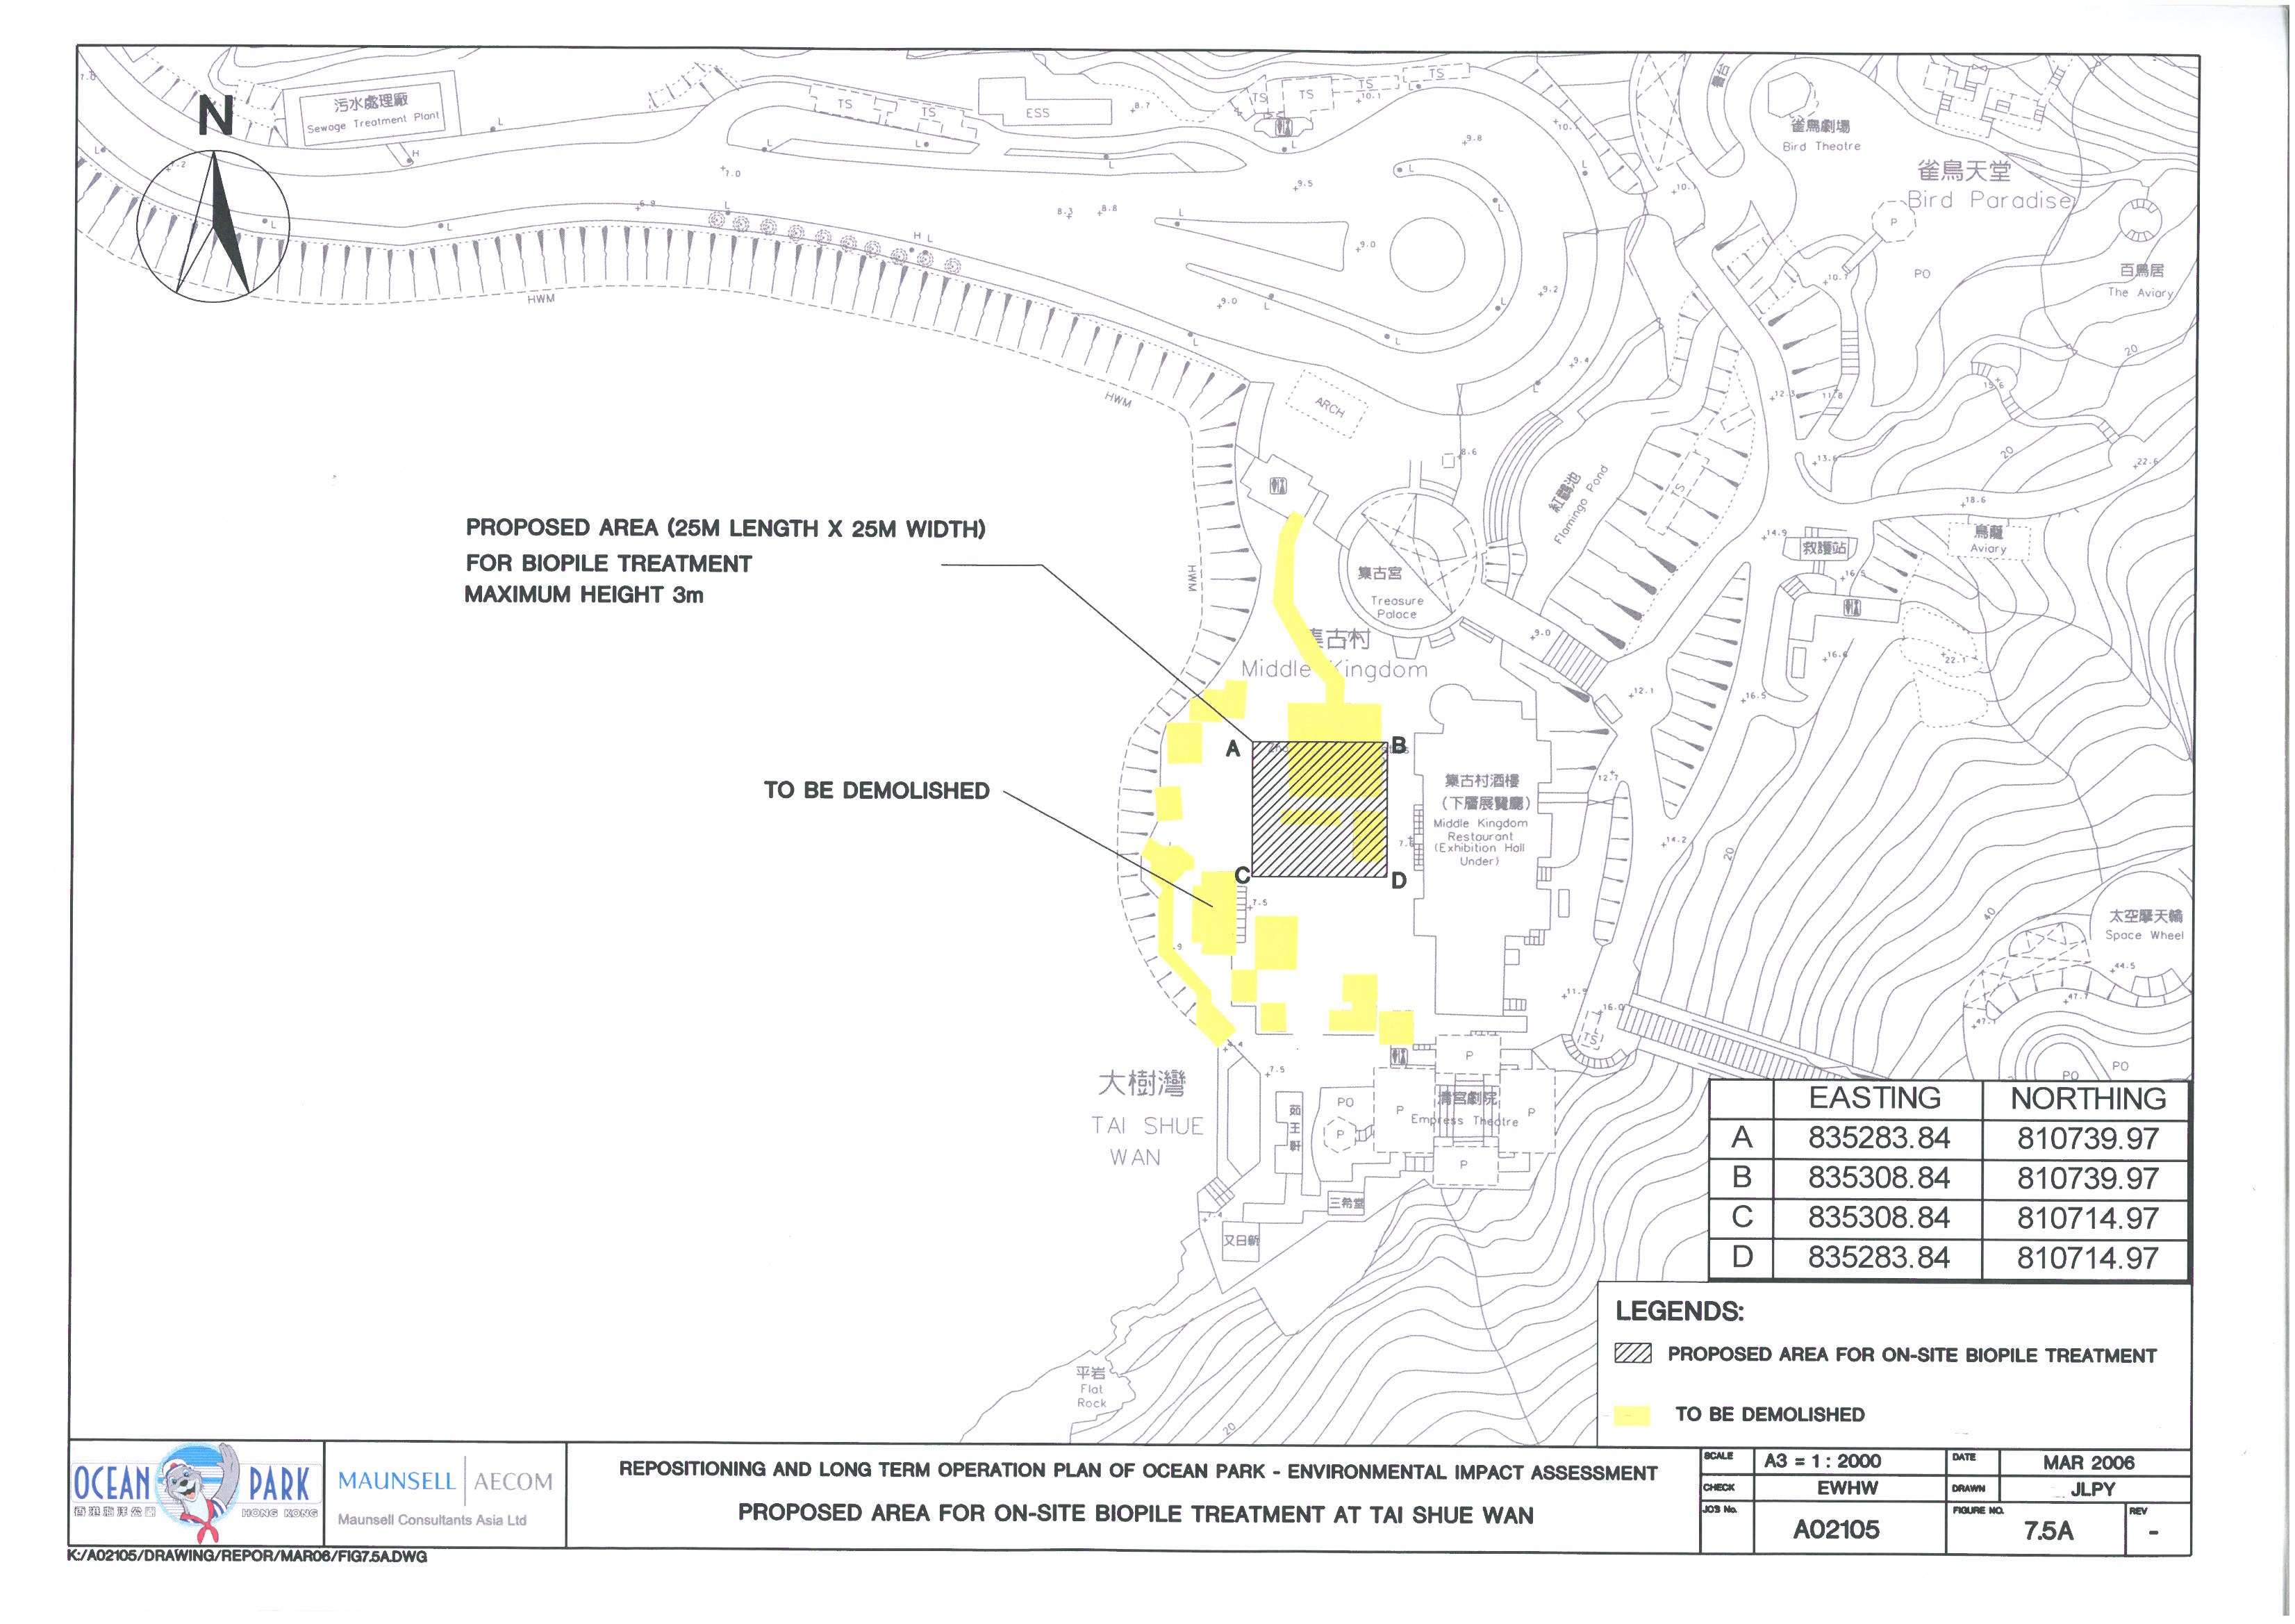
Figure 7.5a Proposed
Area for On-Site Biopile Treatment at Tai Shue Wan
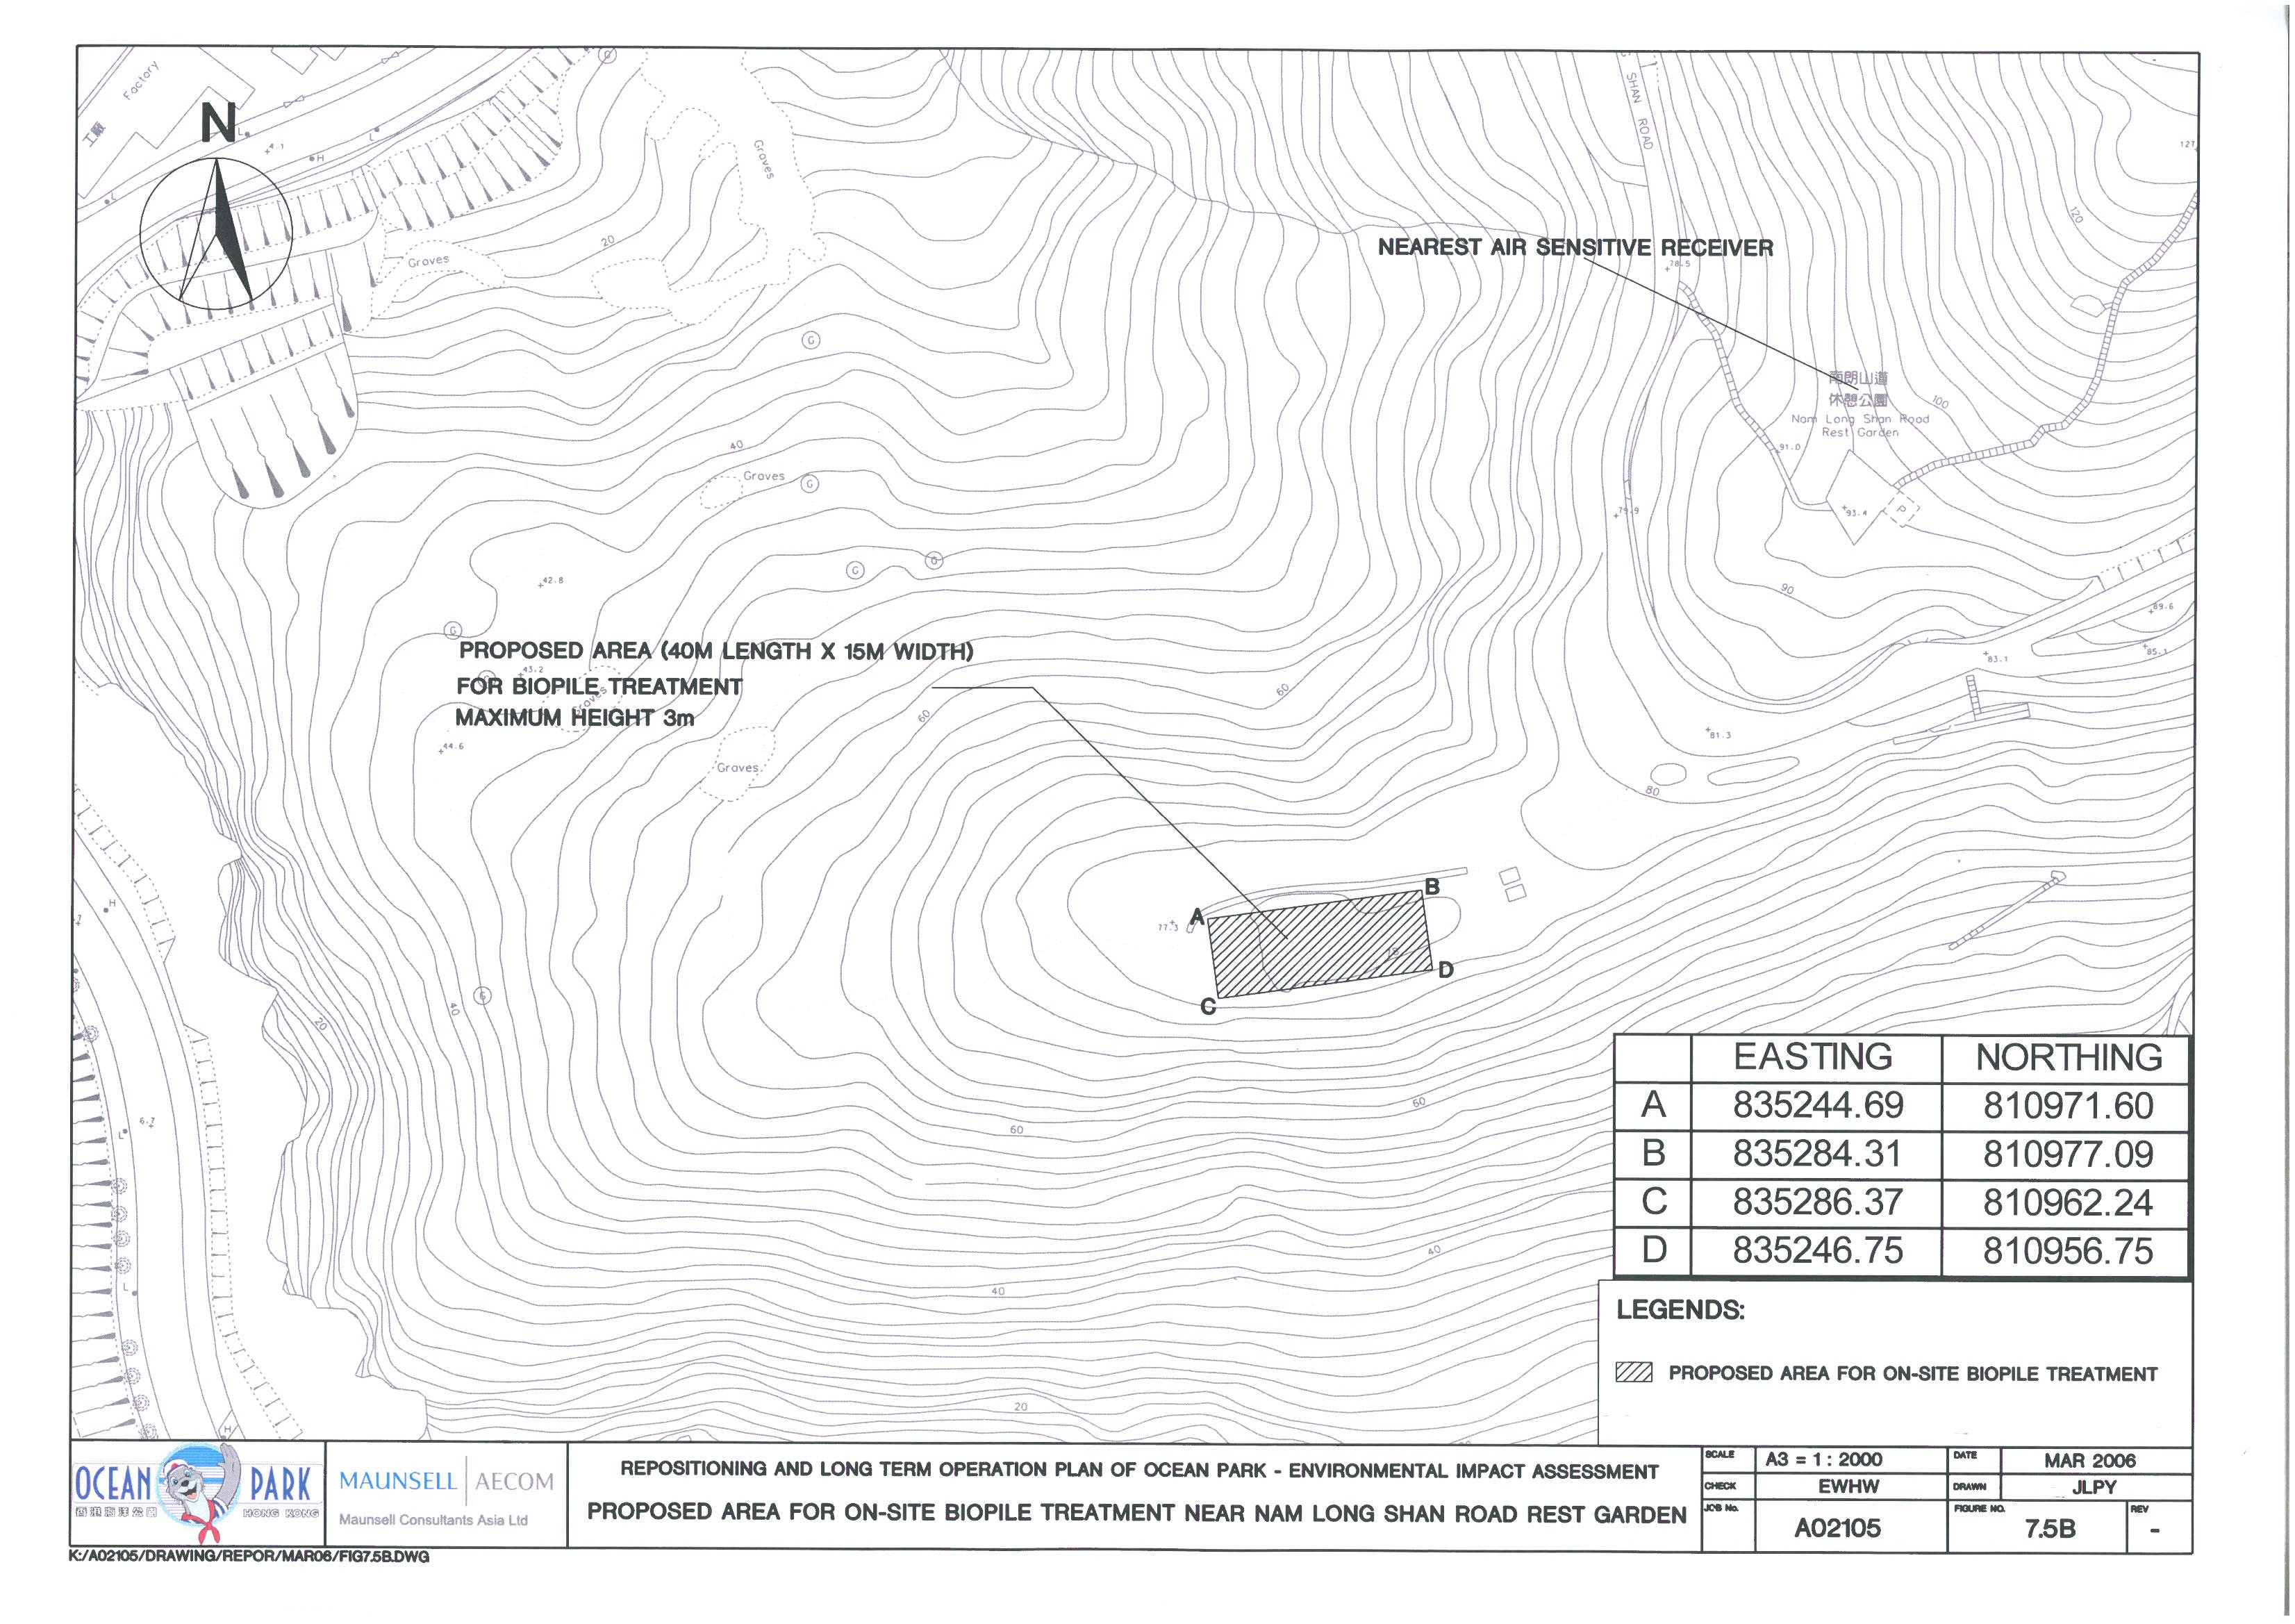
Figure 7.5b Proposed
Area for On-Site Biopile Treatment Near Nam Long Shan Road Rest Garden
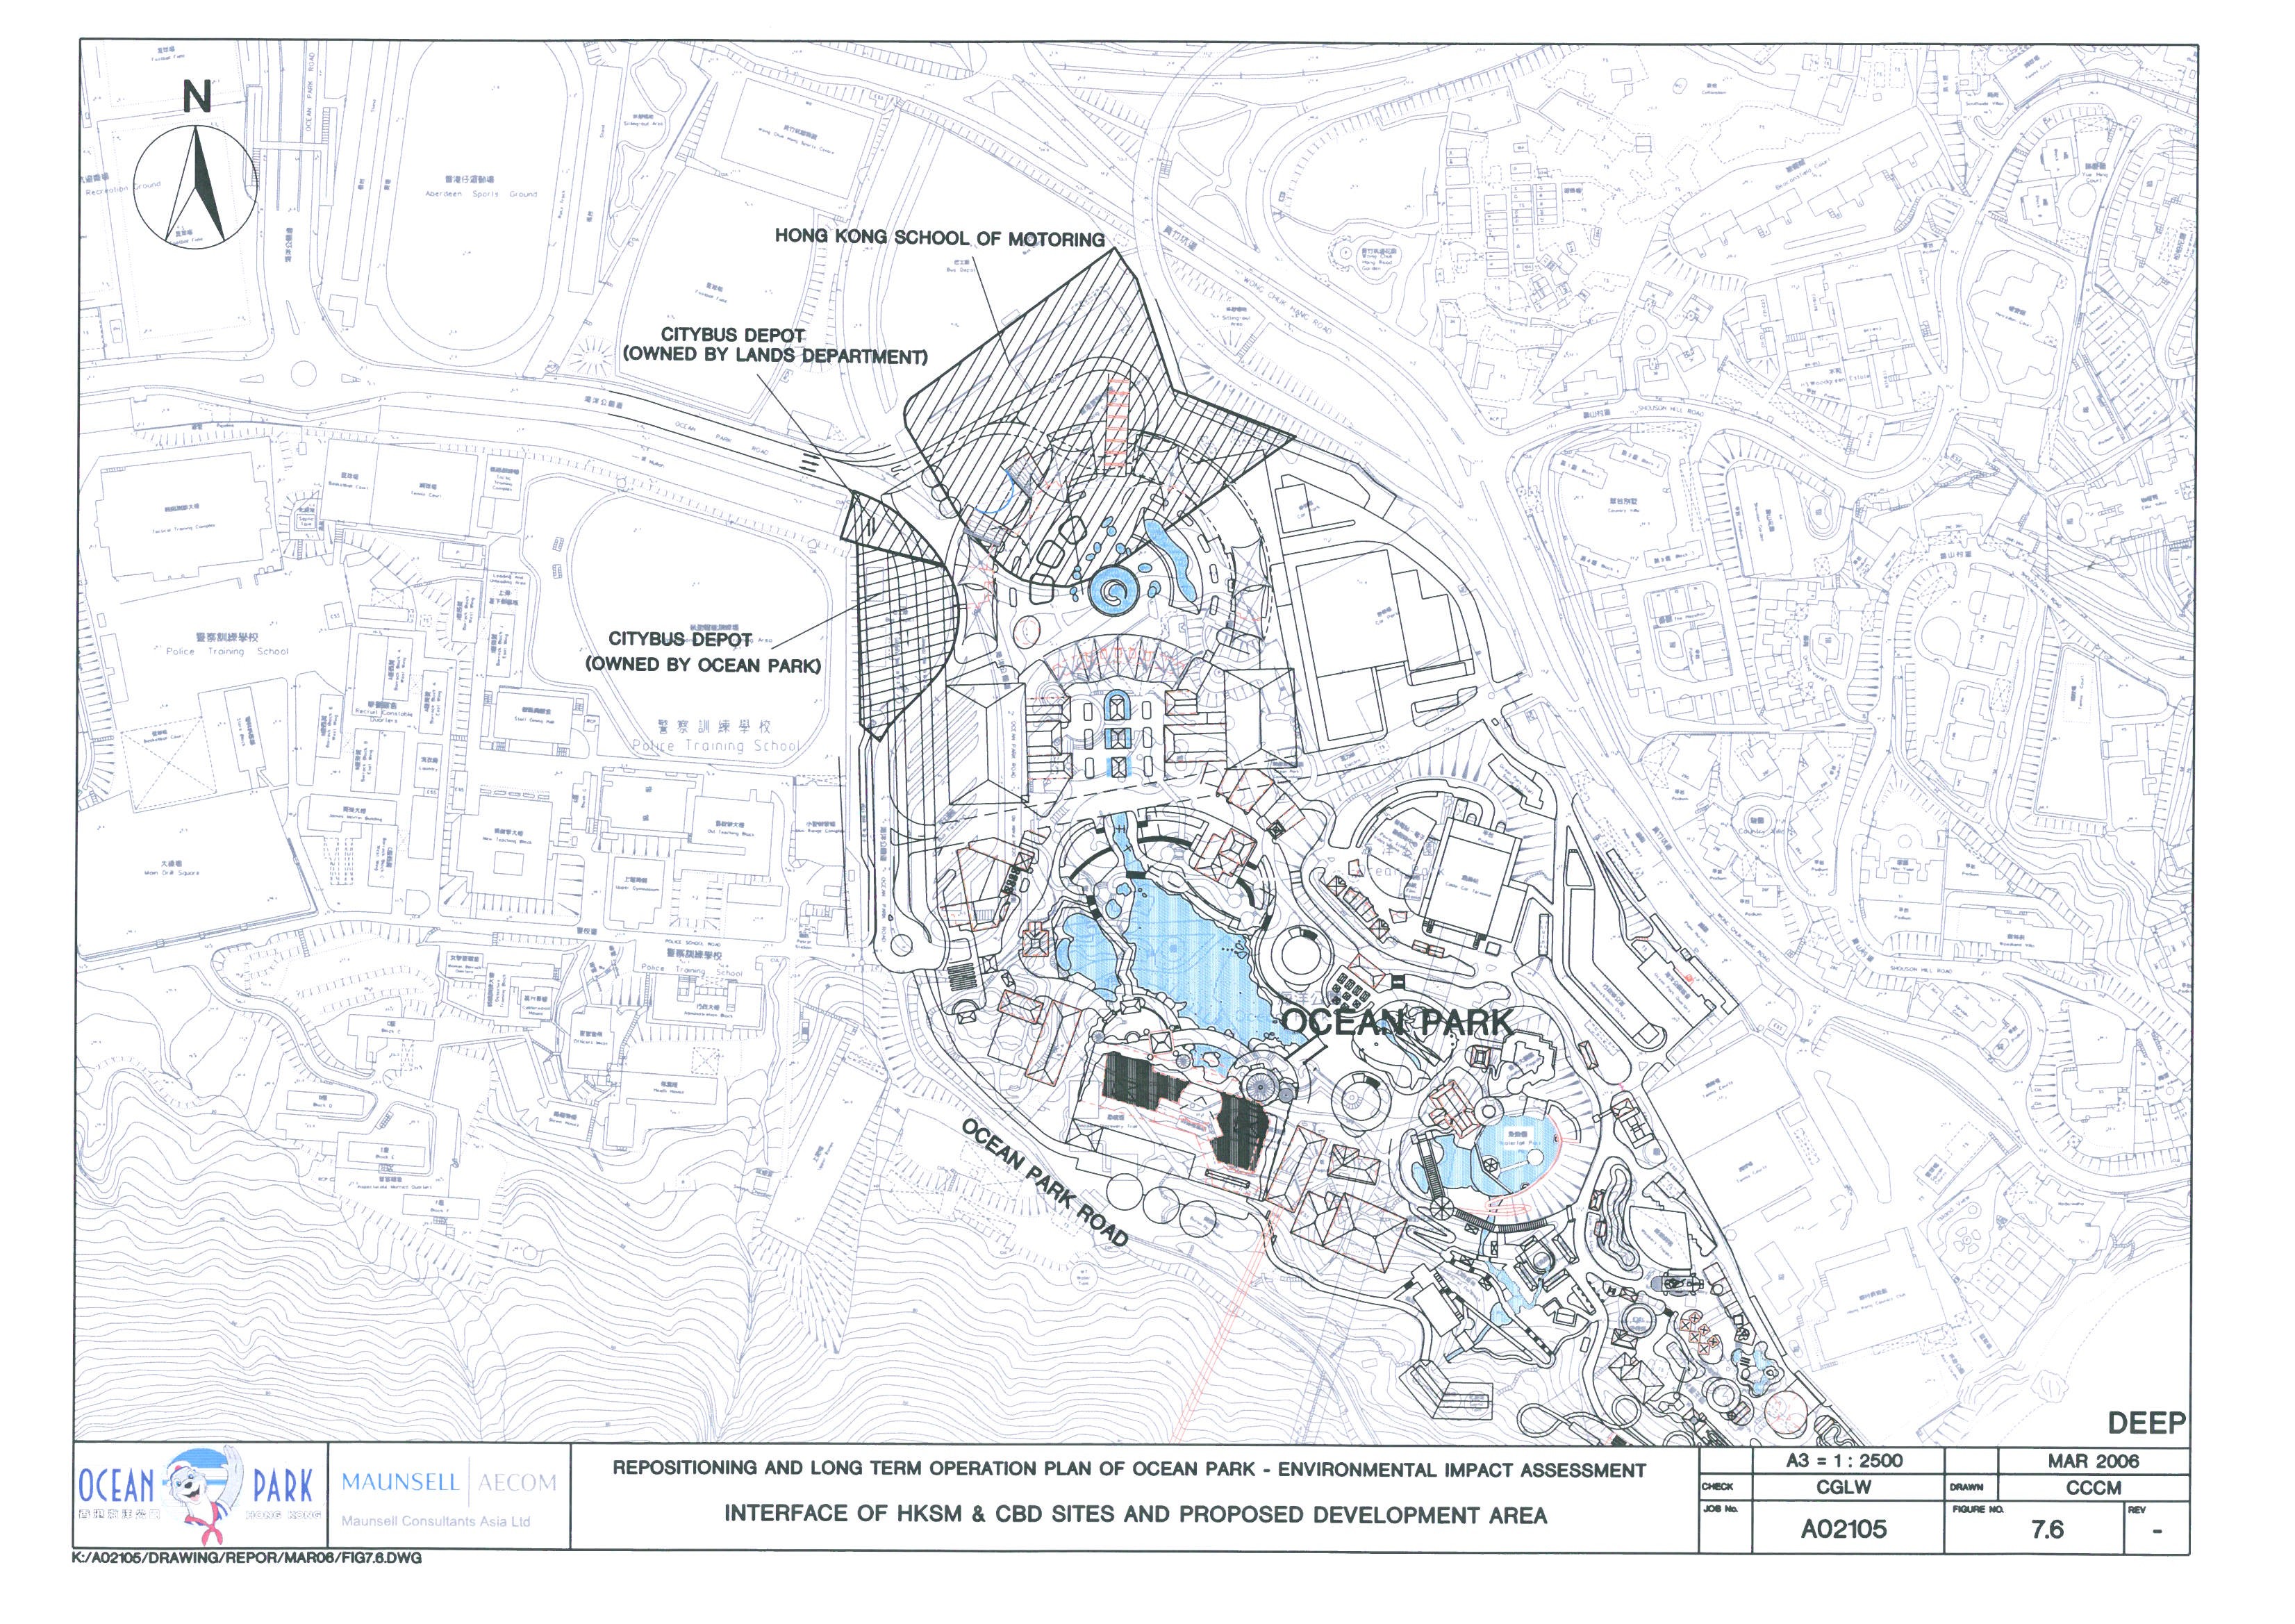
Figure 7.6 Interface
of HKSM & CBD Sites and Proposed Development Area
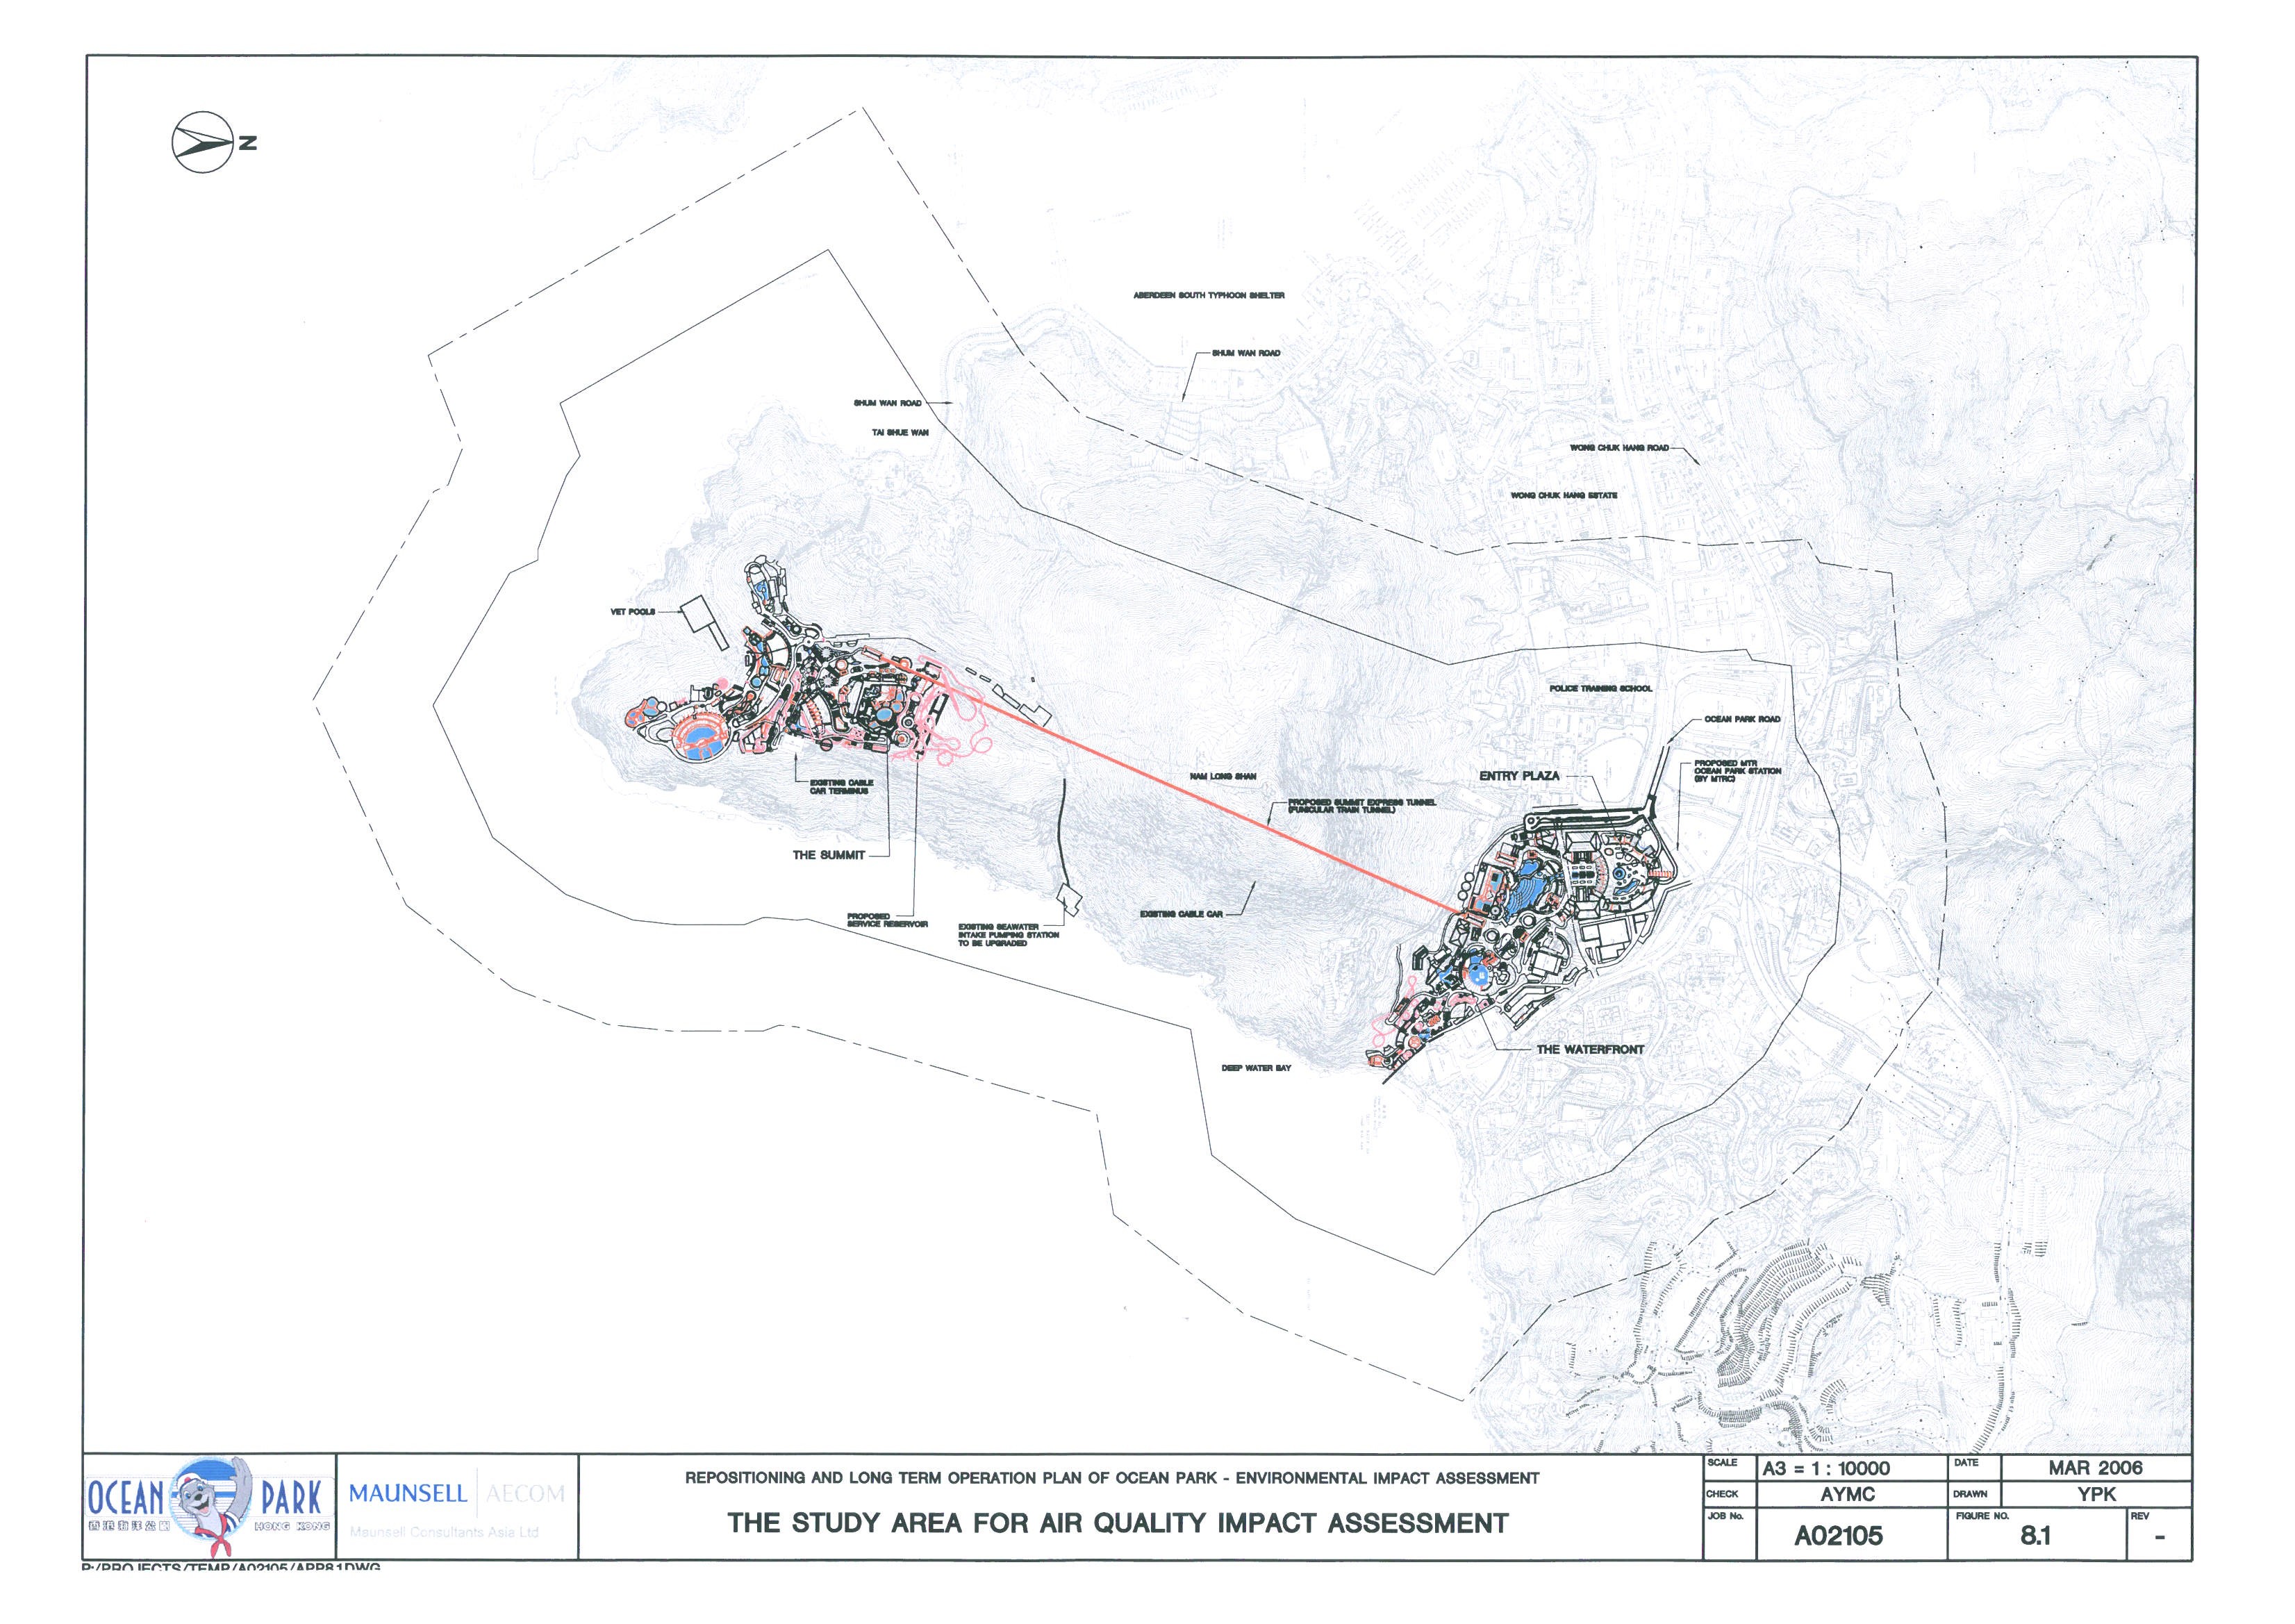
Figure 8.1 The
Study Area for Air Quality Impact Assessment
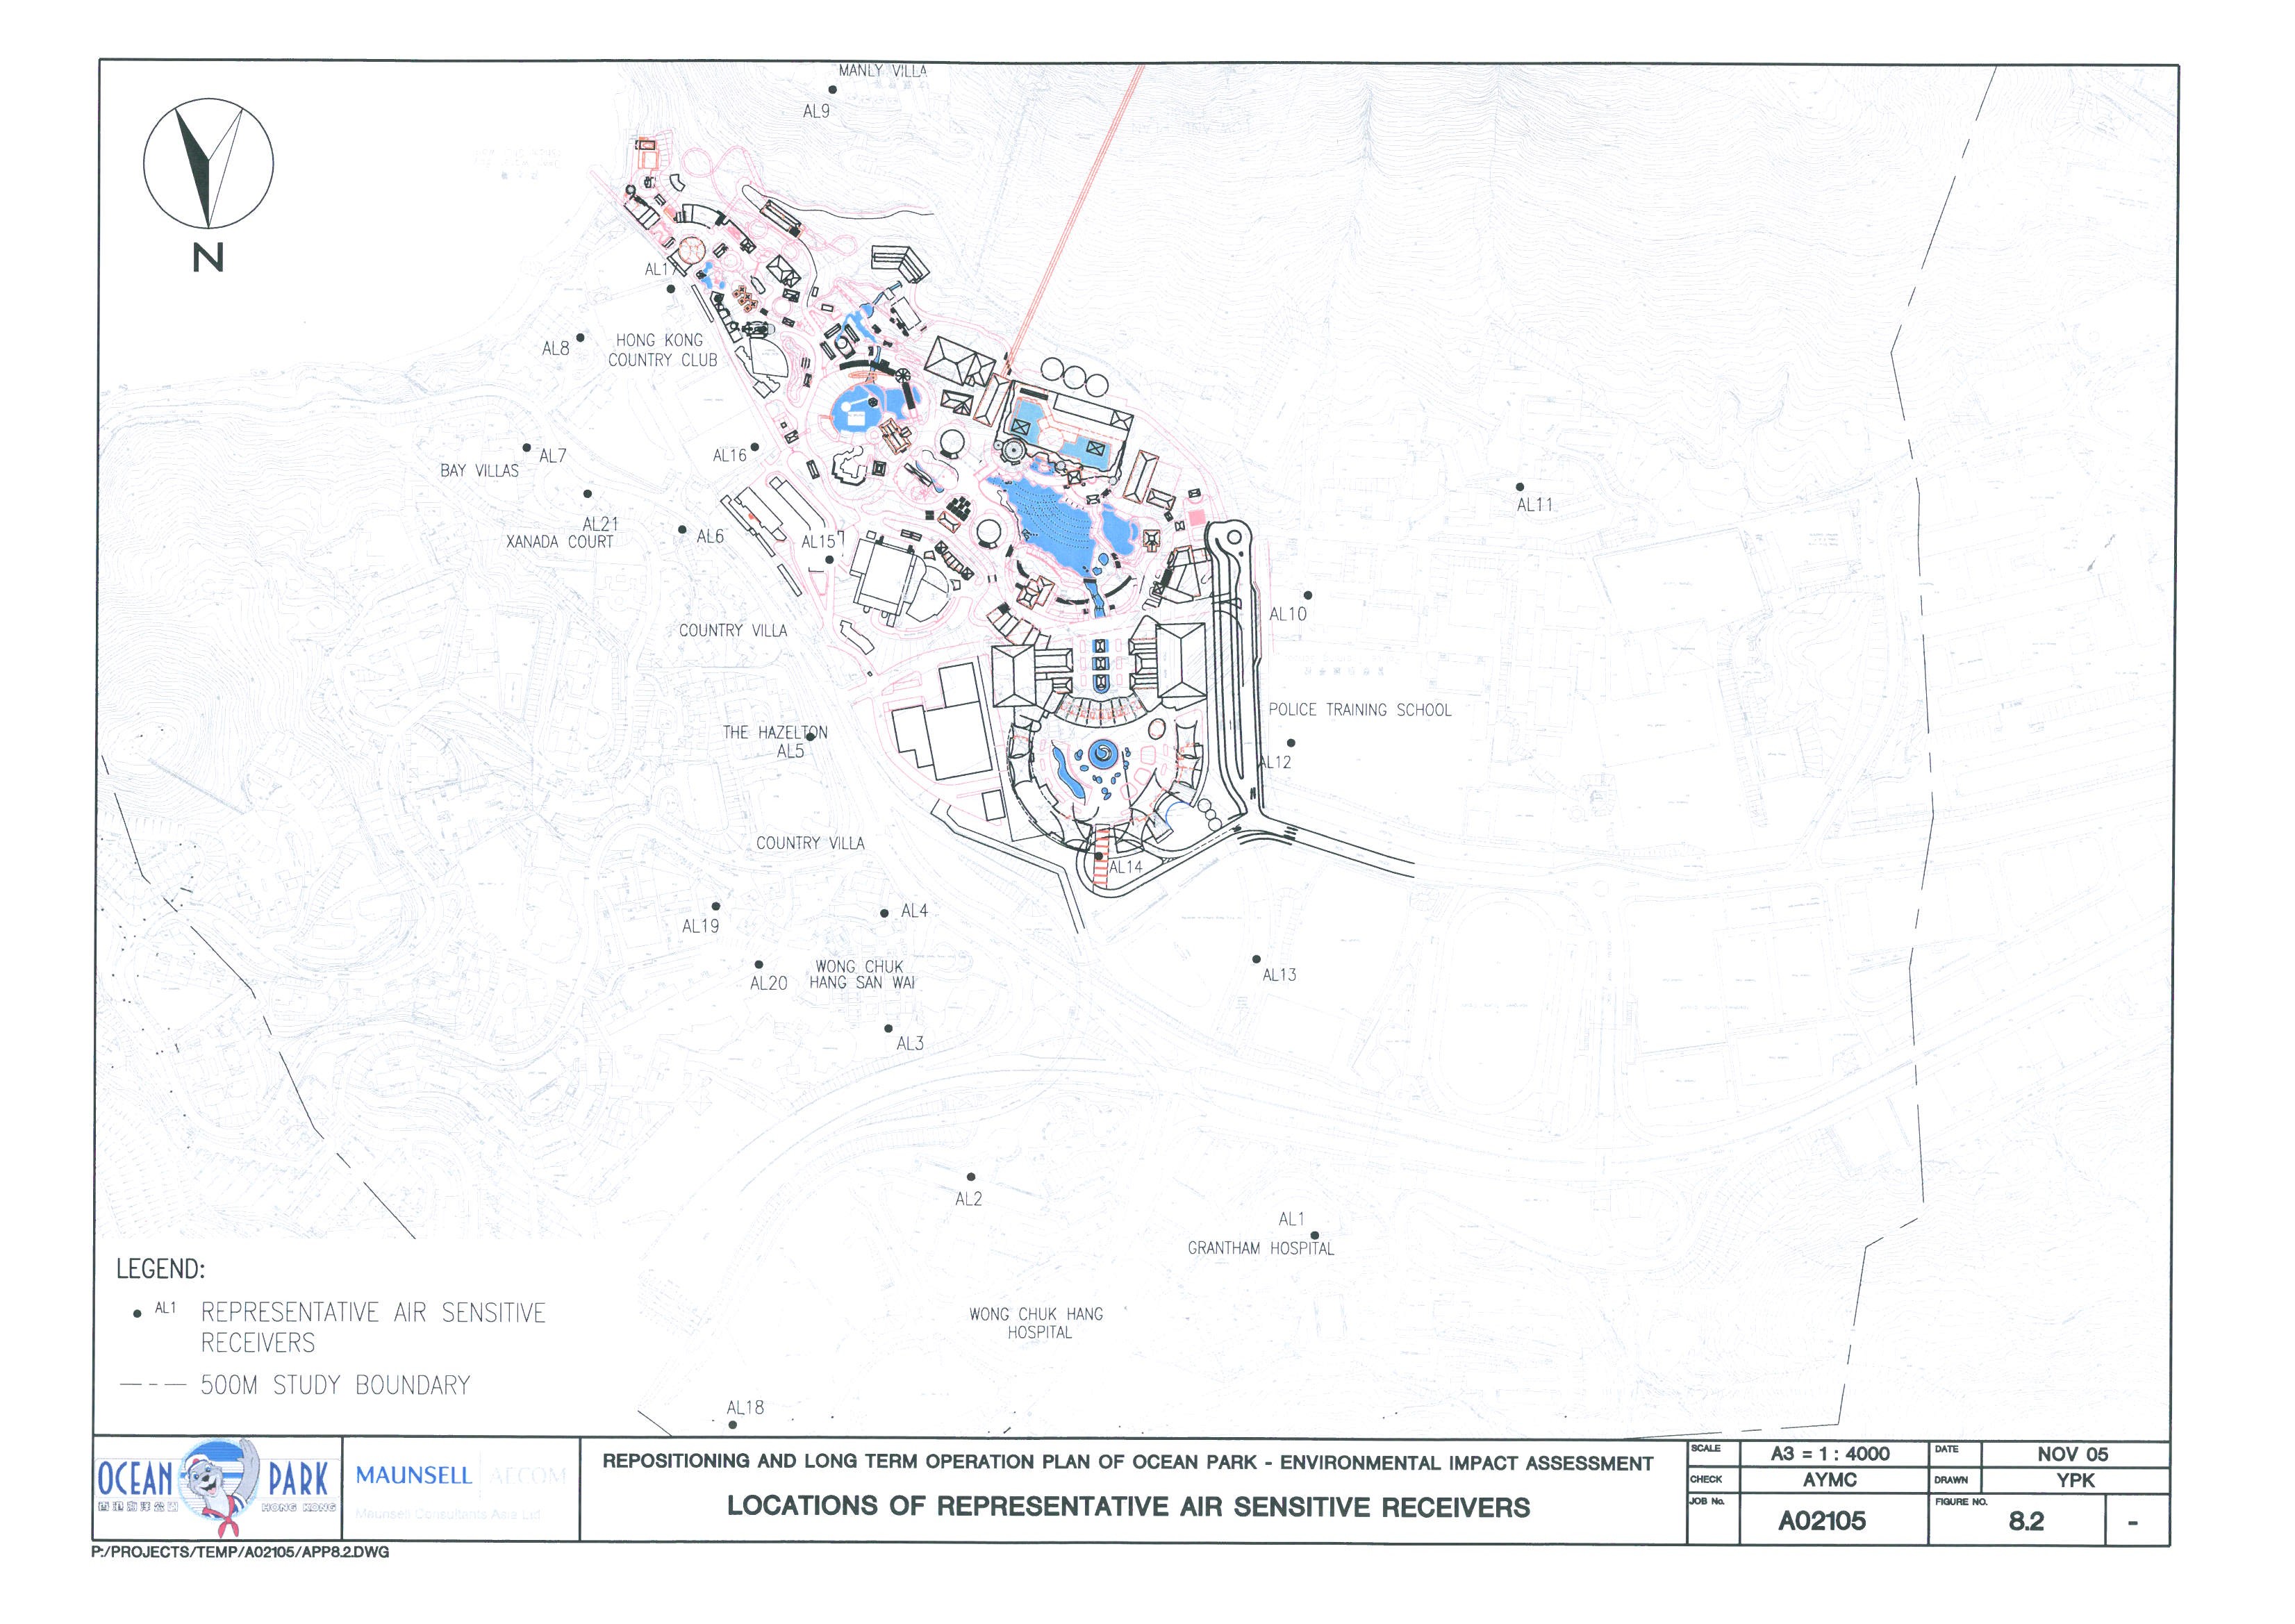
Figure 8.2 Locations
of Representative Air Sensitive Receivers
Figure 9.1 Location
of EPD Water Quality Monitoring Station
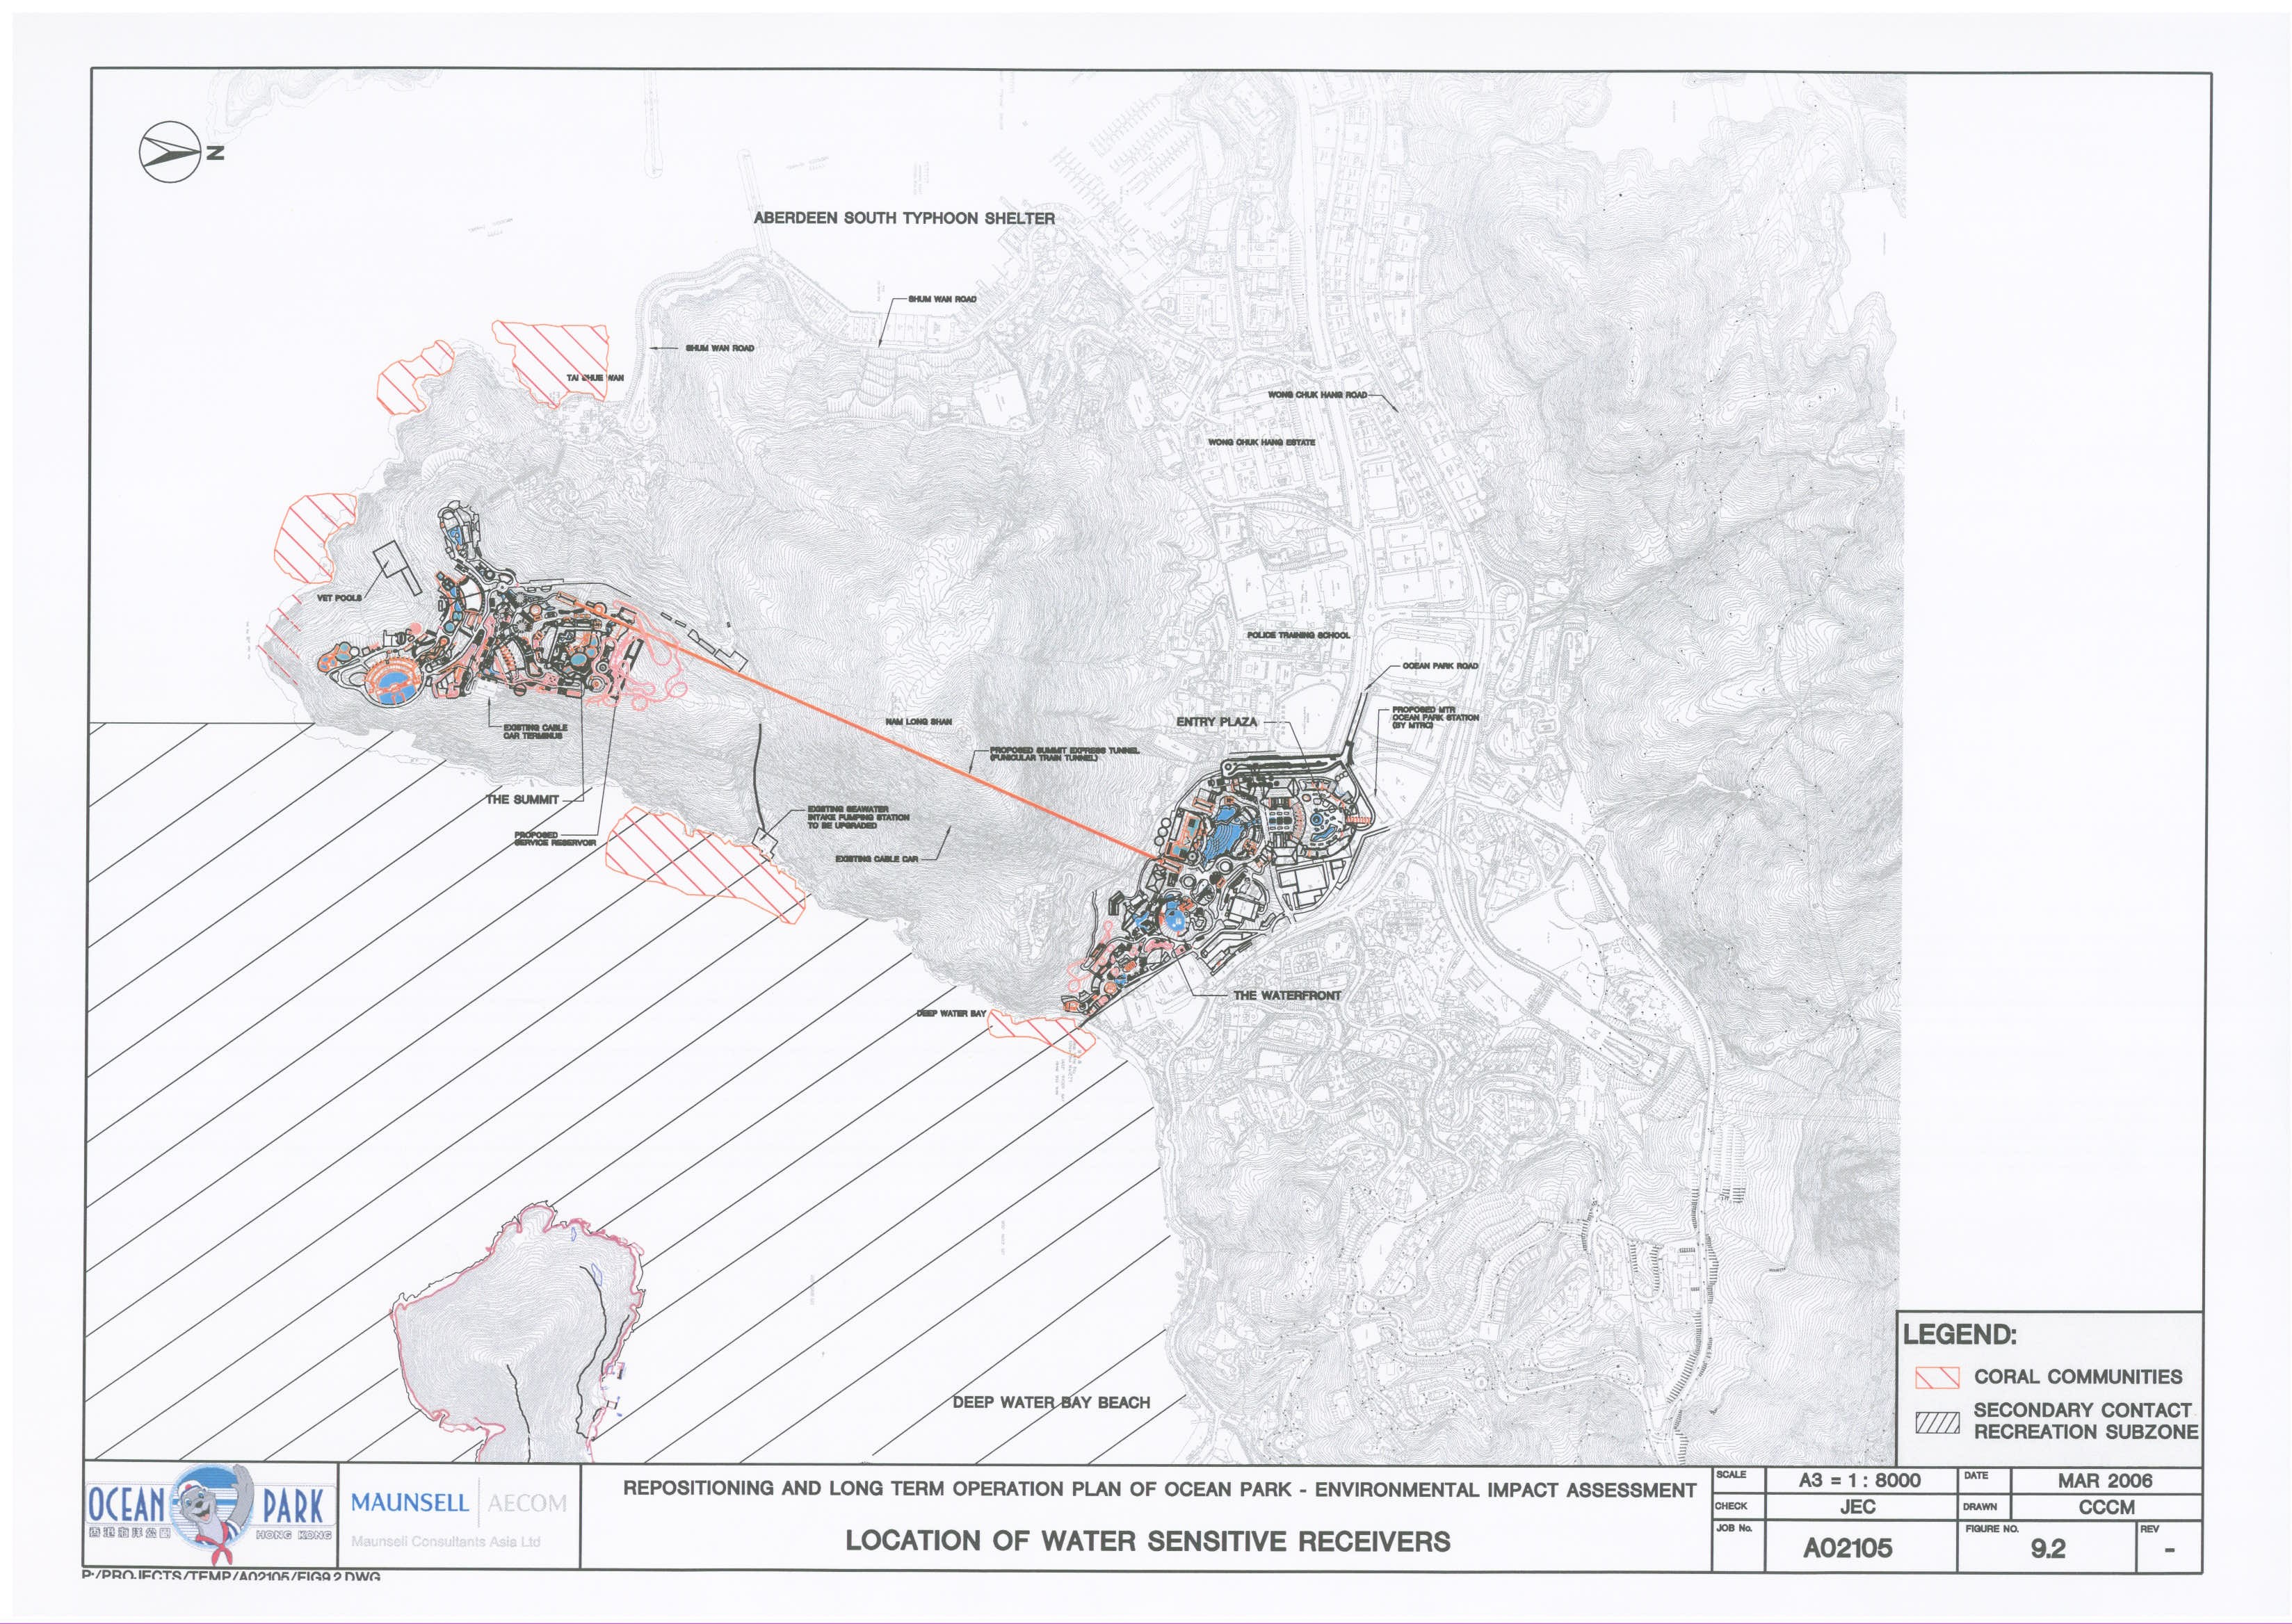
Figure 9.2 Location
of Water Sensitive Receivers
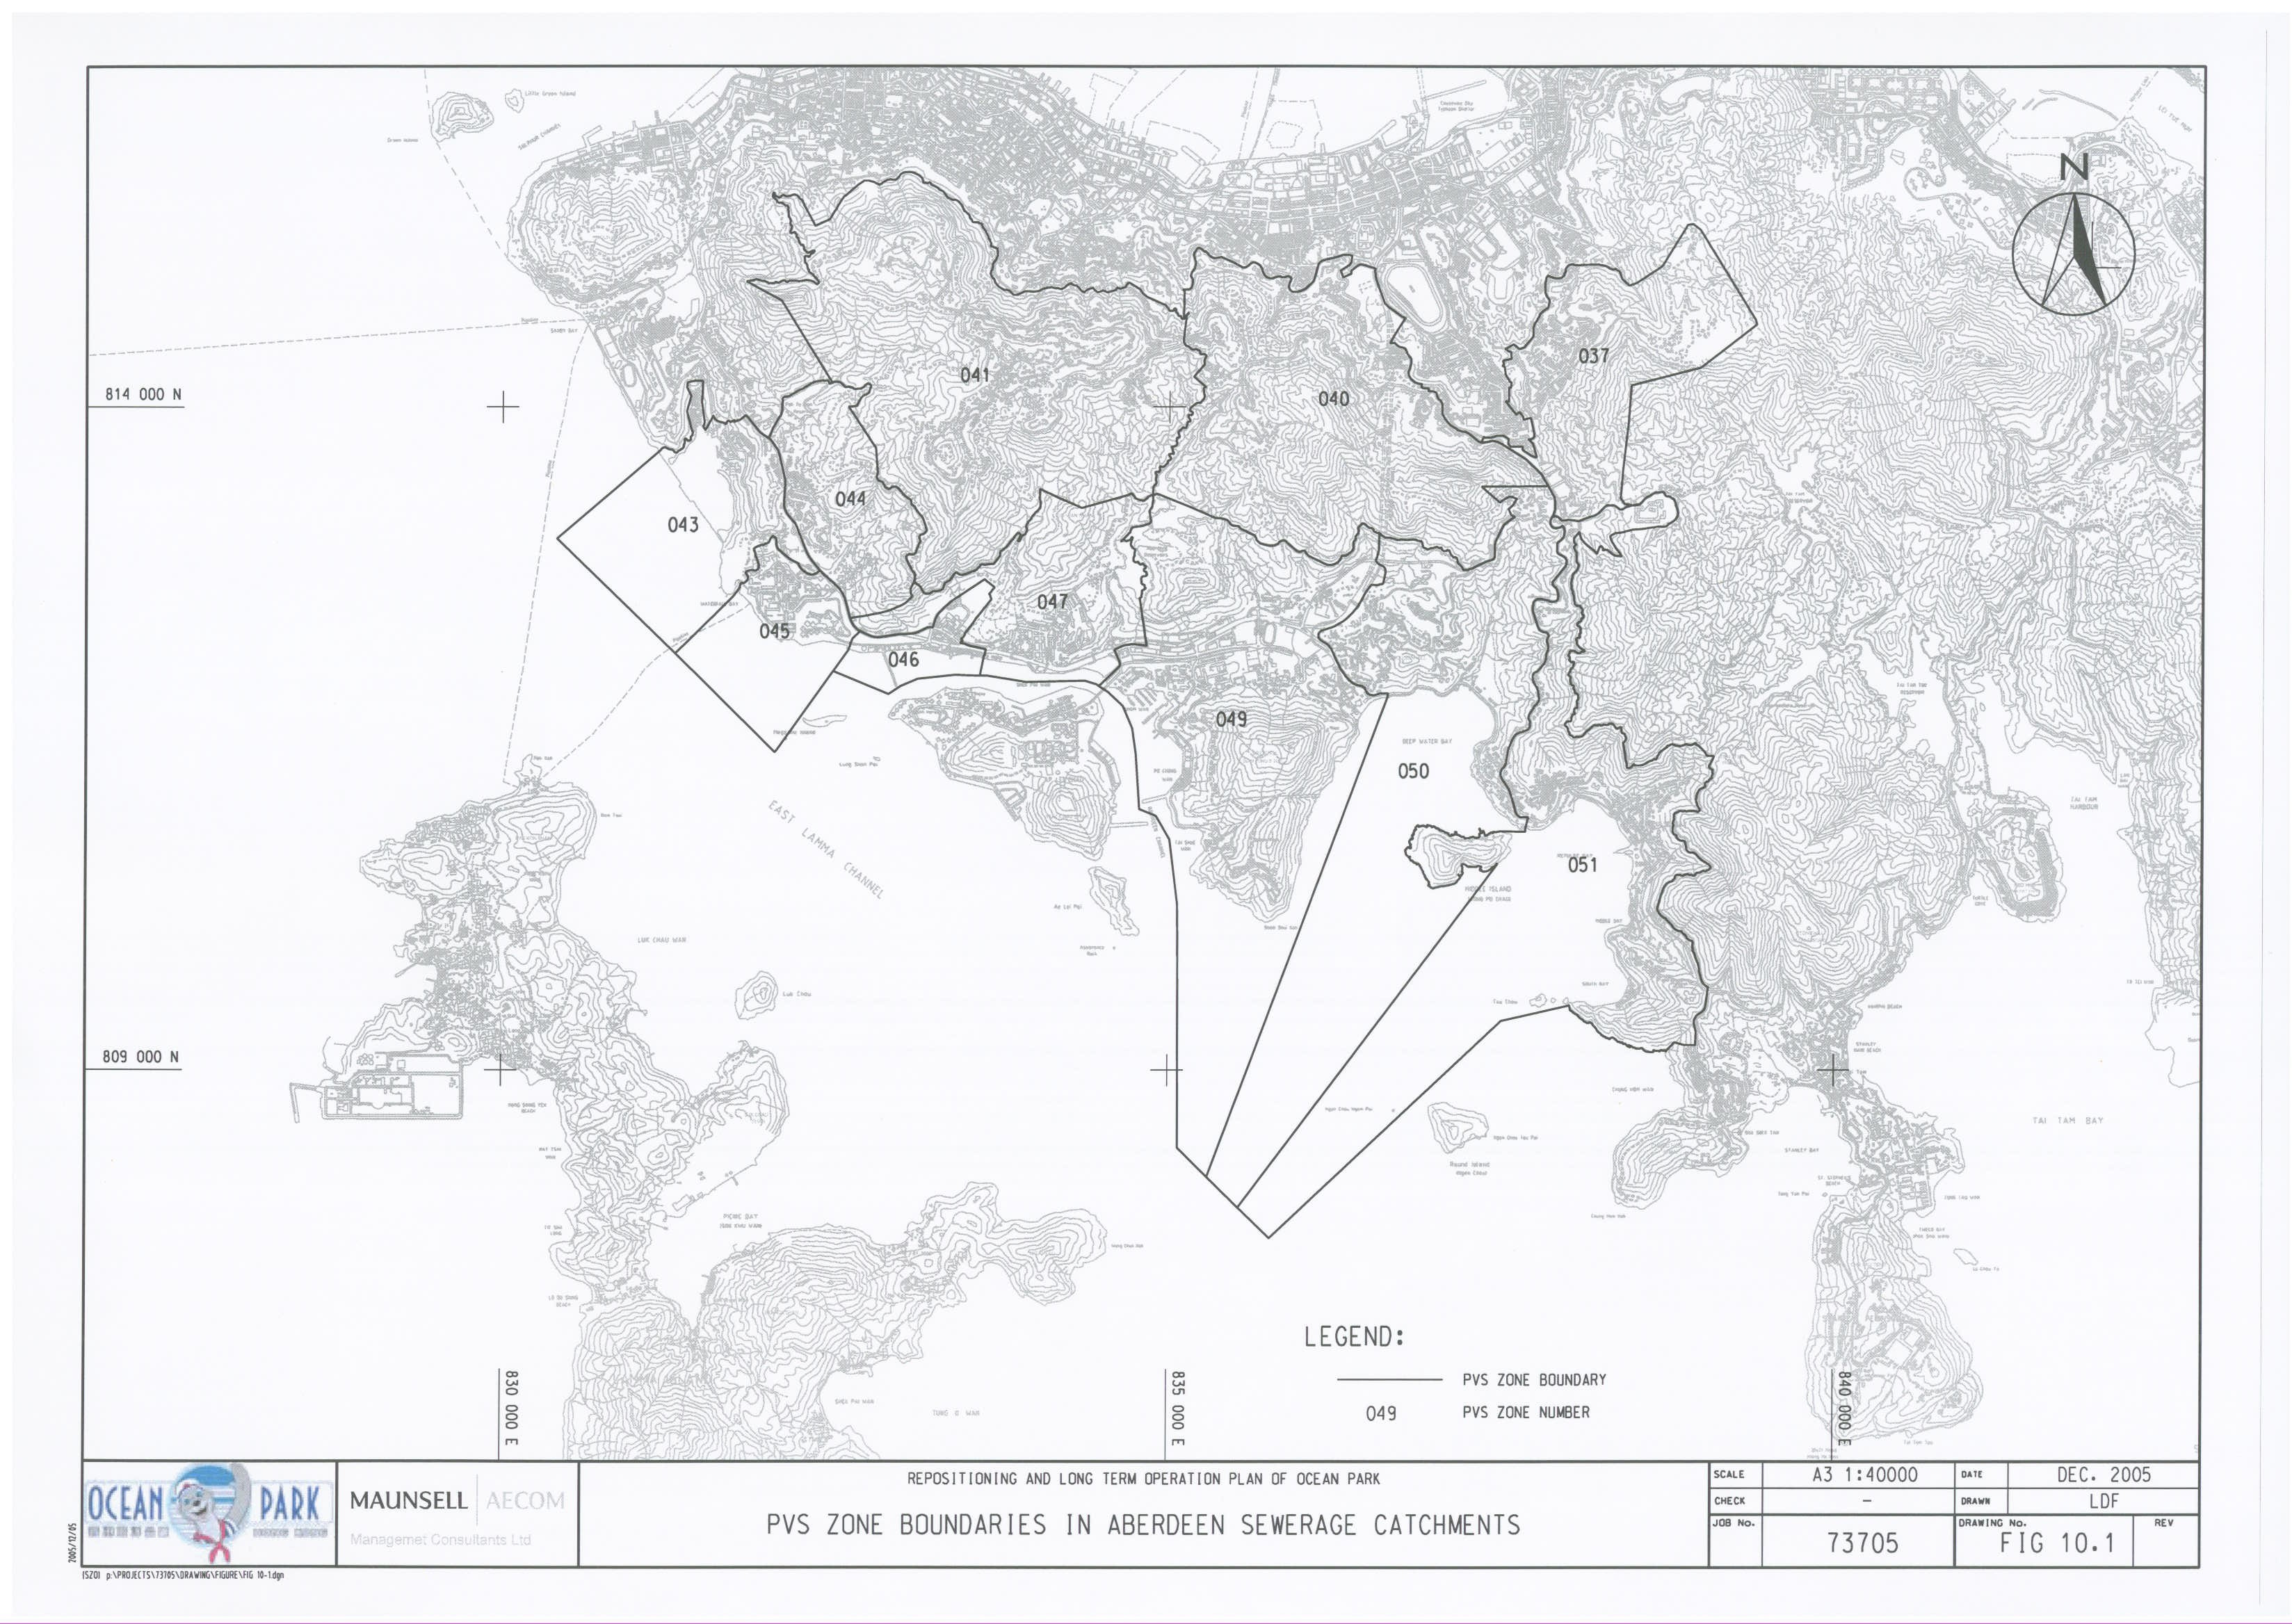
Figure 10.1 PVS
Zone Boundaries in Aberdeen Sewerage Catchment
Figure 10.2 Existing
Sewerage Infrastructure in Aberdeen Sewerage Catchment
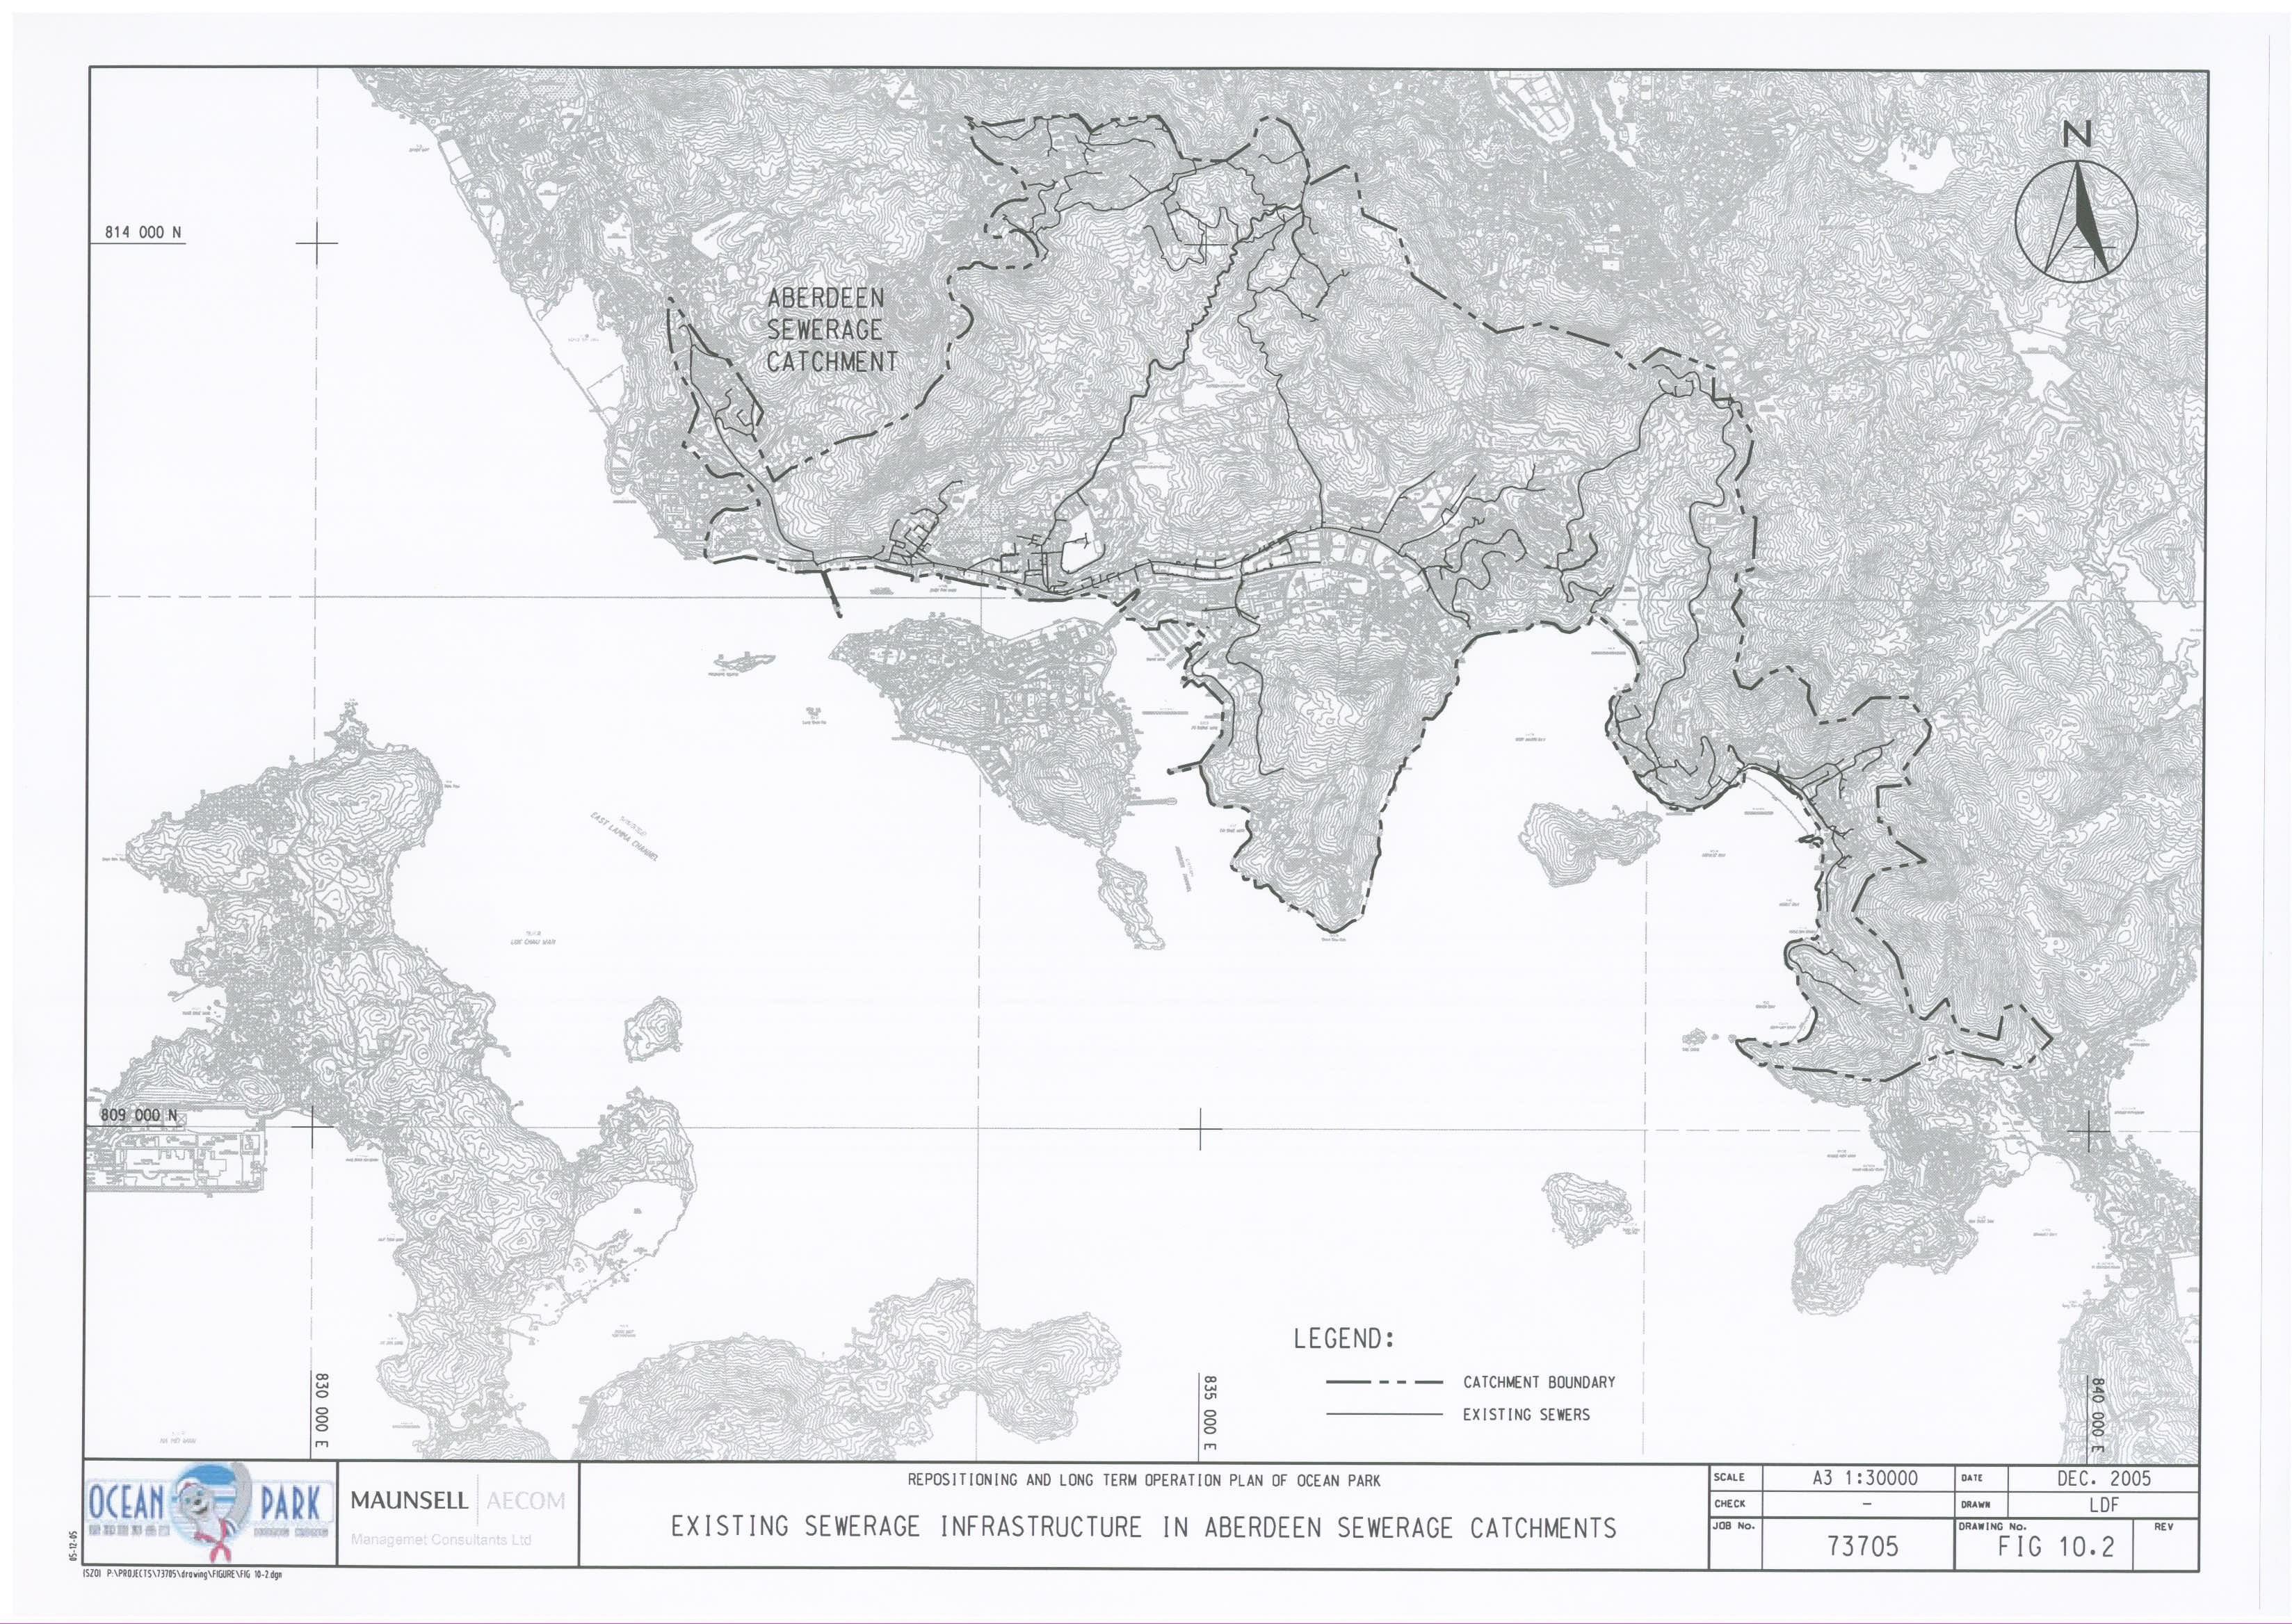
Figure 10.3 Existing
Sewerage Infrastructure in Study Area
Figure 10.4a-c Existing Sewerage Network
Figure 10.5a-c Surcharged Sewers in Baseline
Condition
Figure 10.6a-c Surcharged Sewers in Additional
Flow Condition
Figure 10.7a-c Upgrading Works
Figure 11.2 Location of School of Motoring
Figure 11.3 Aerial
Photograph Taken in 1924 of the Wong Chuk Hang Area
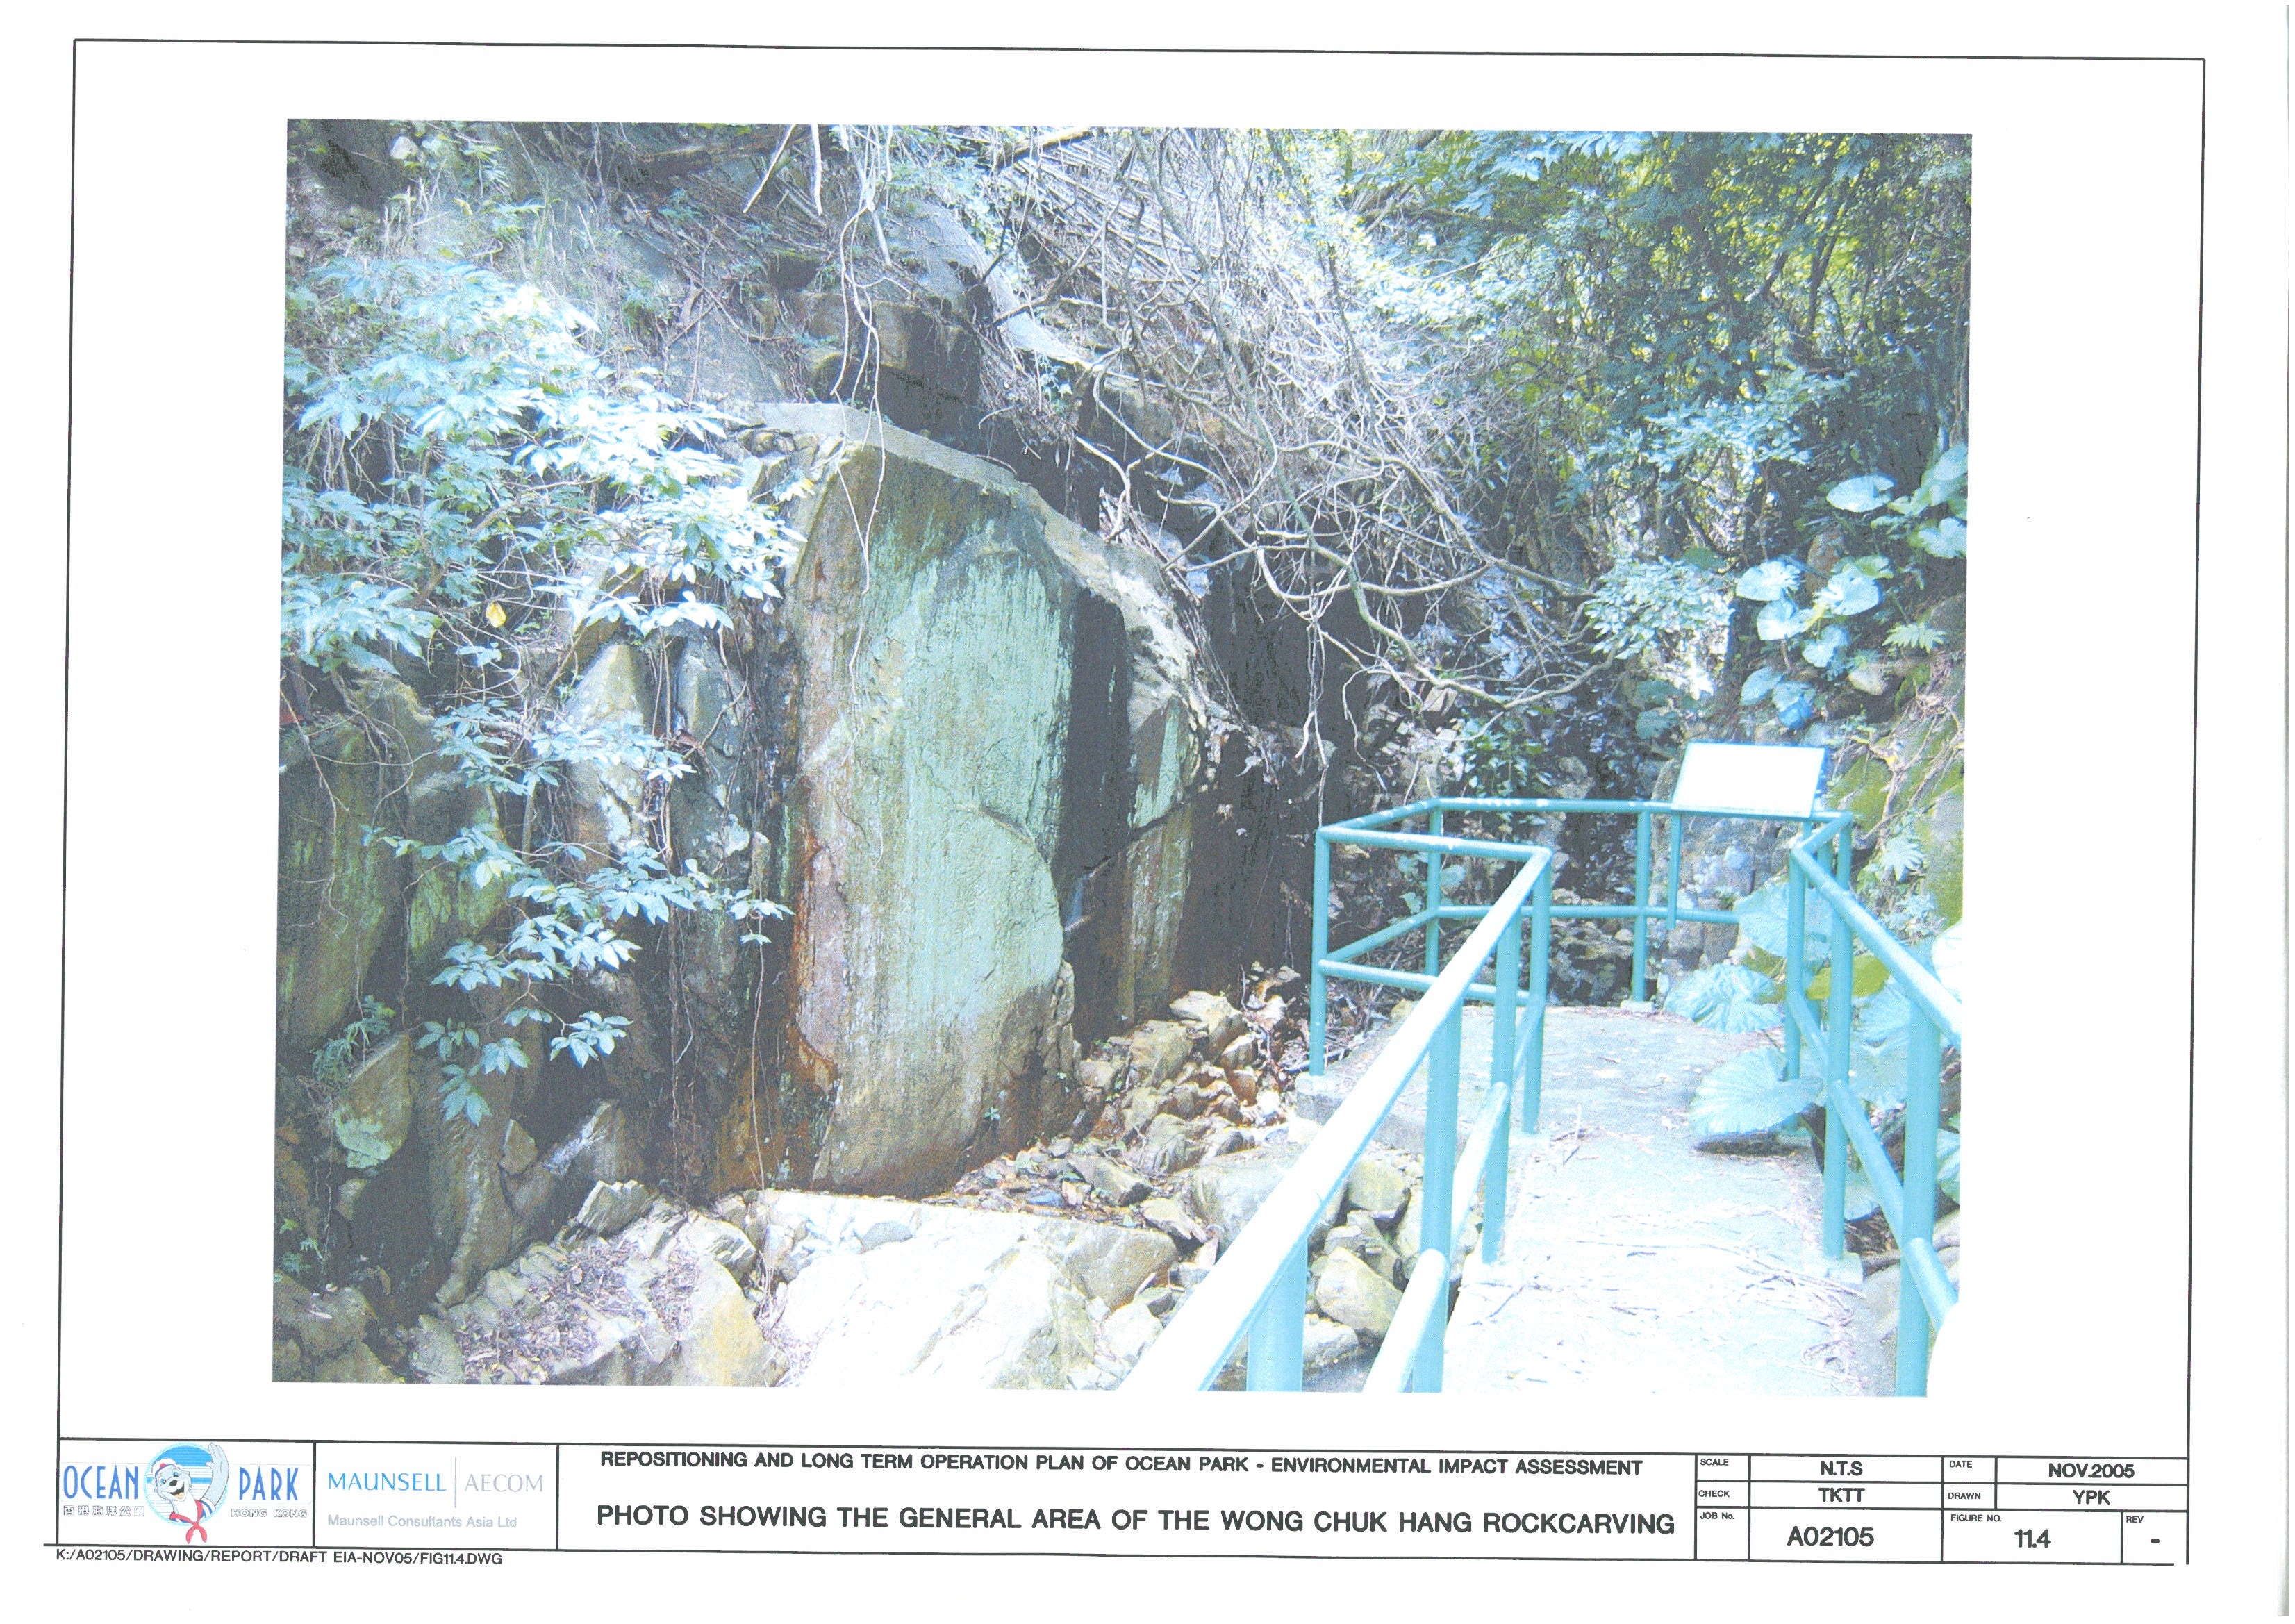
Figure 11.4 Photo
Showing
the General
Area
of the Wong Chuk Hang Rockcarving
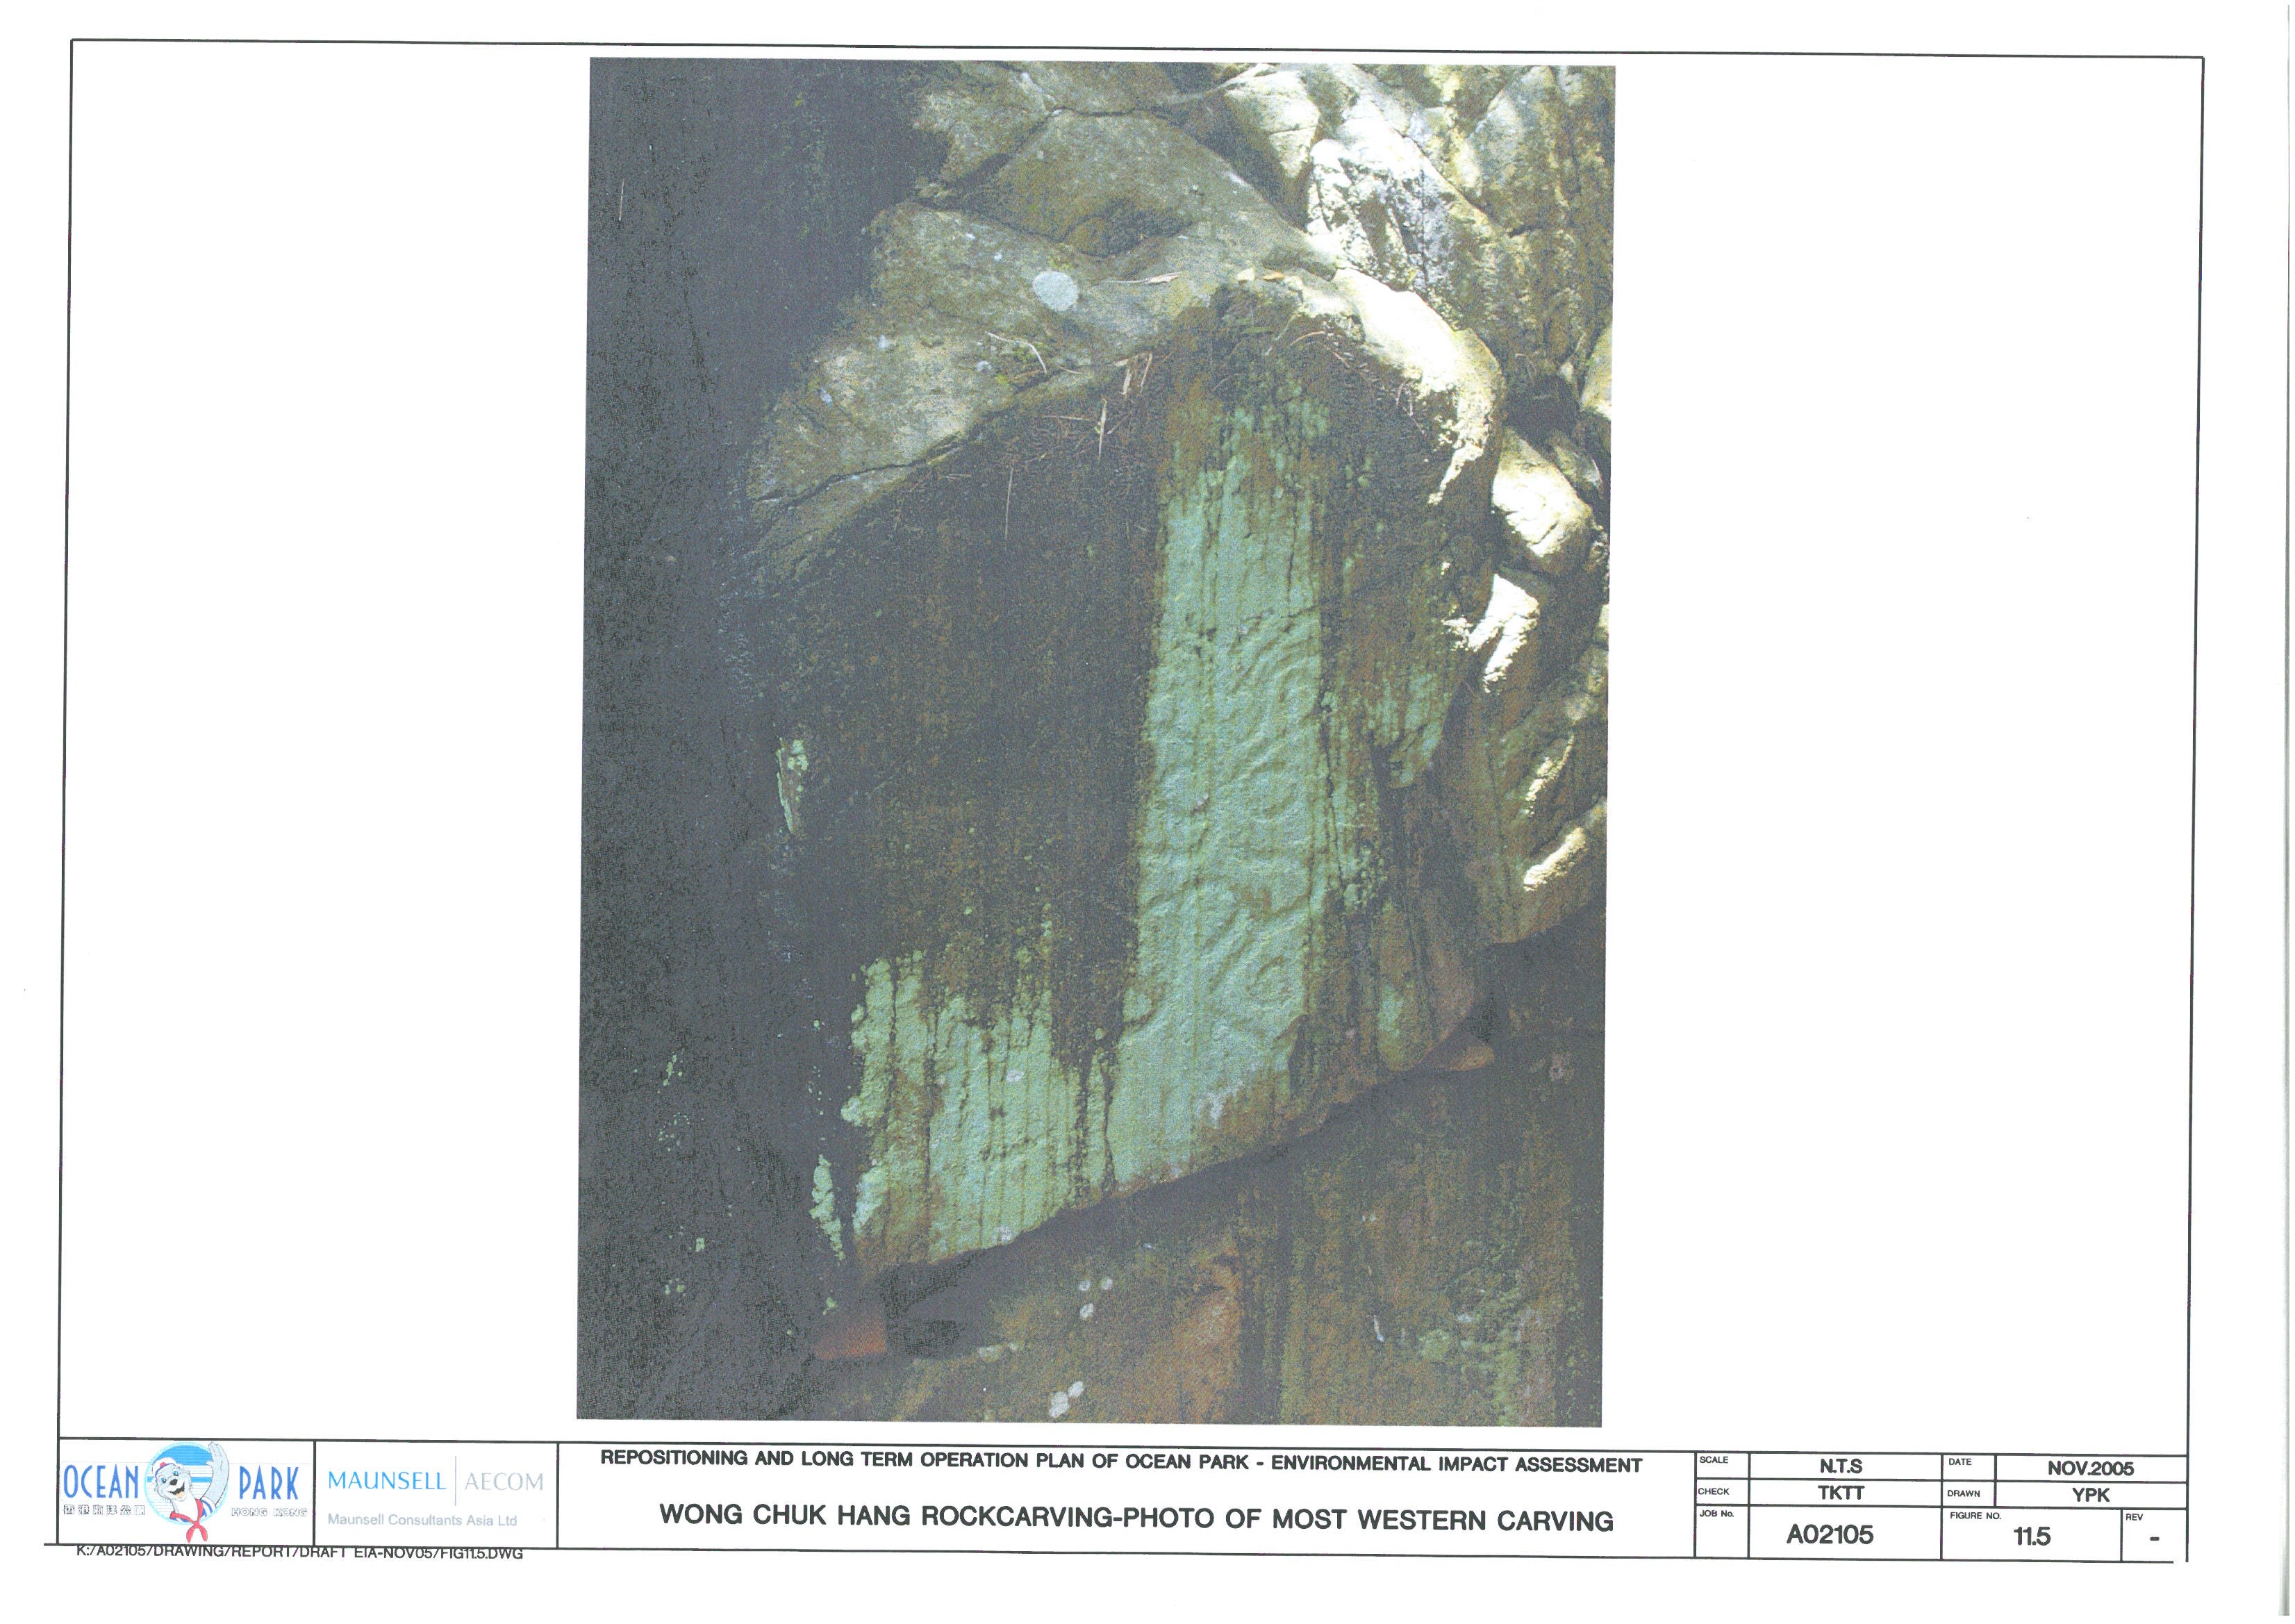
Figure 11.5 Wong
Chuk Hang Rockcarving - Photo of Most Western Carving
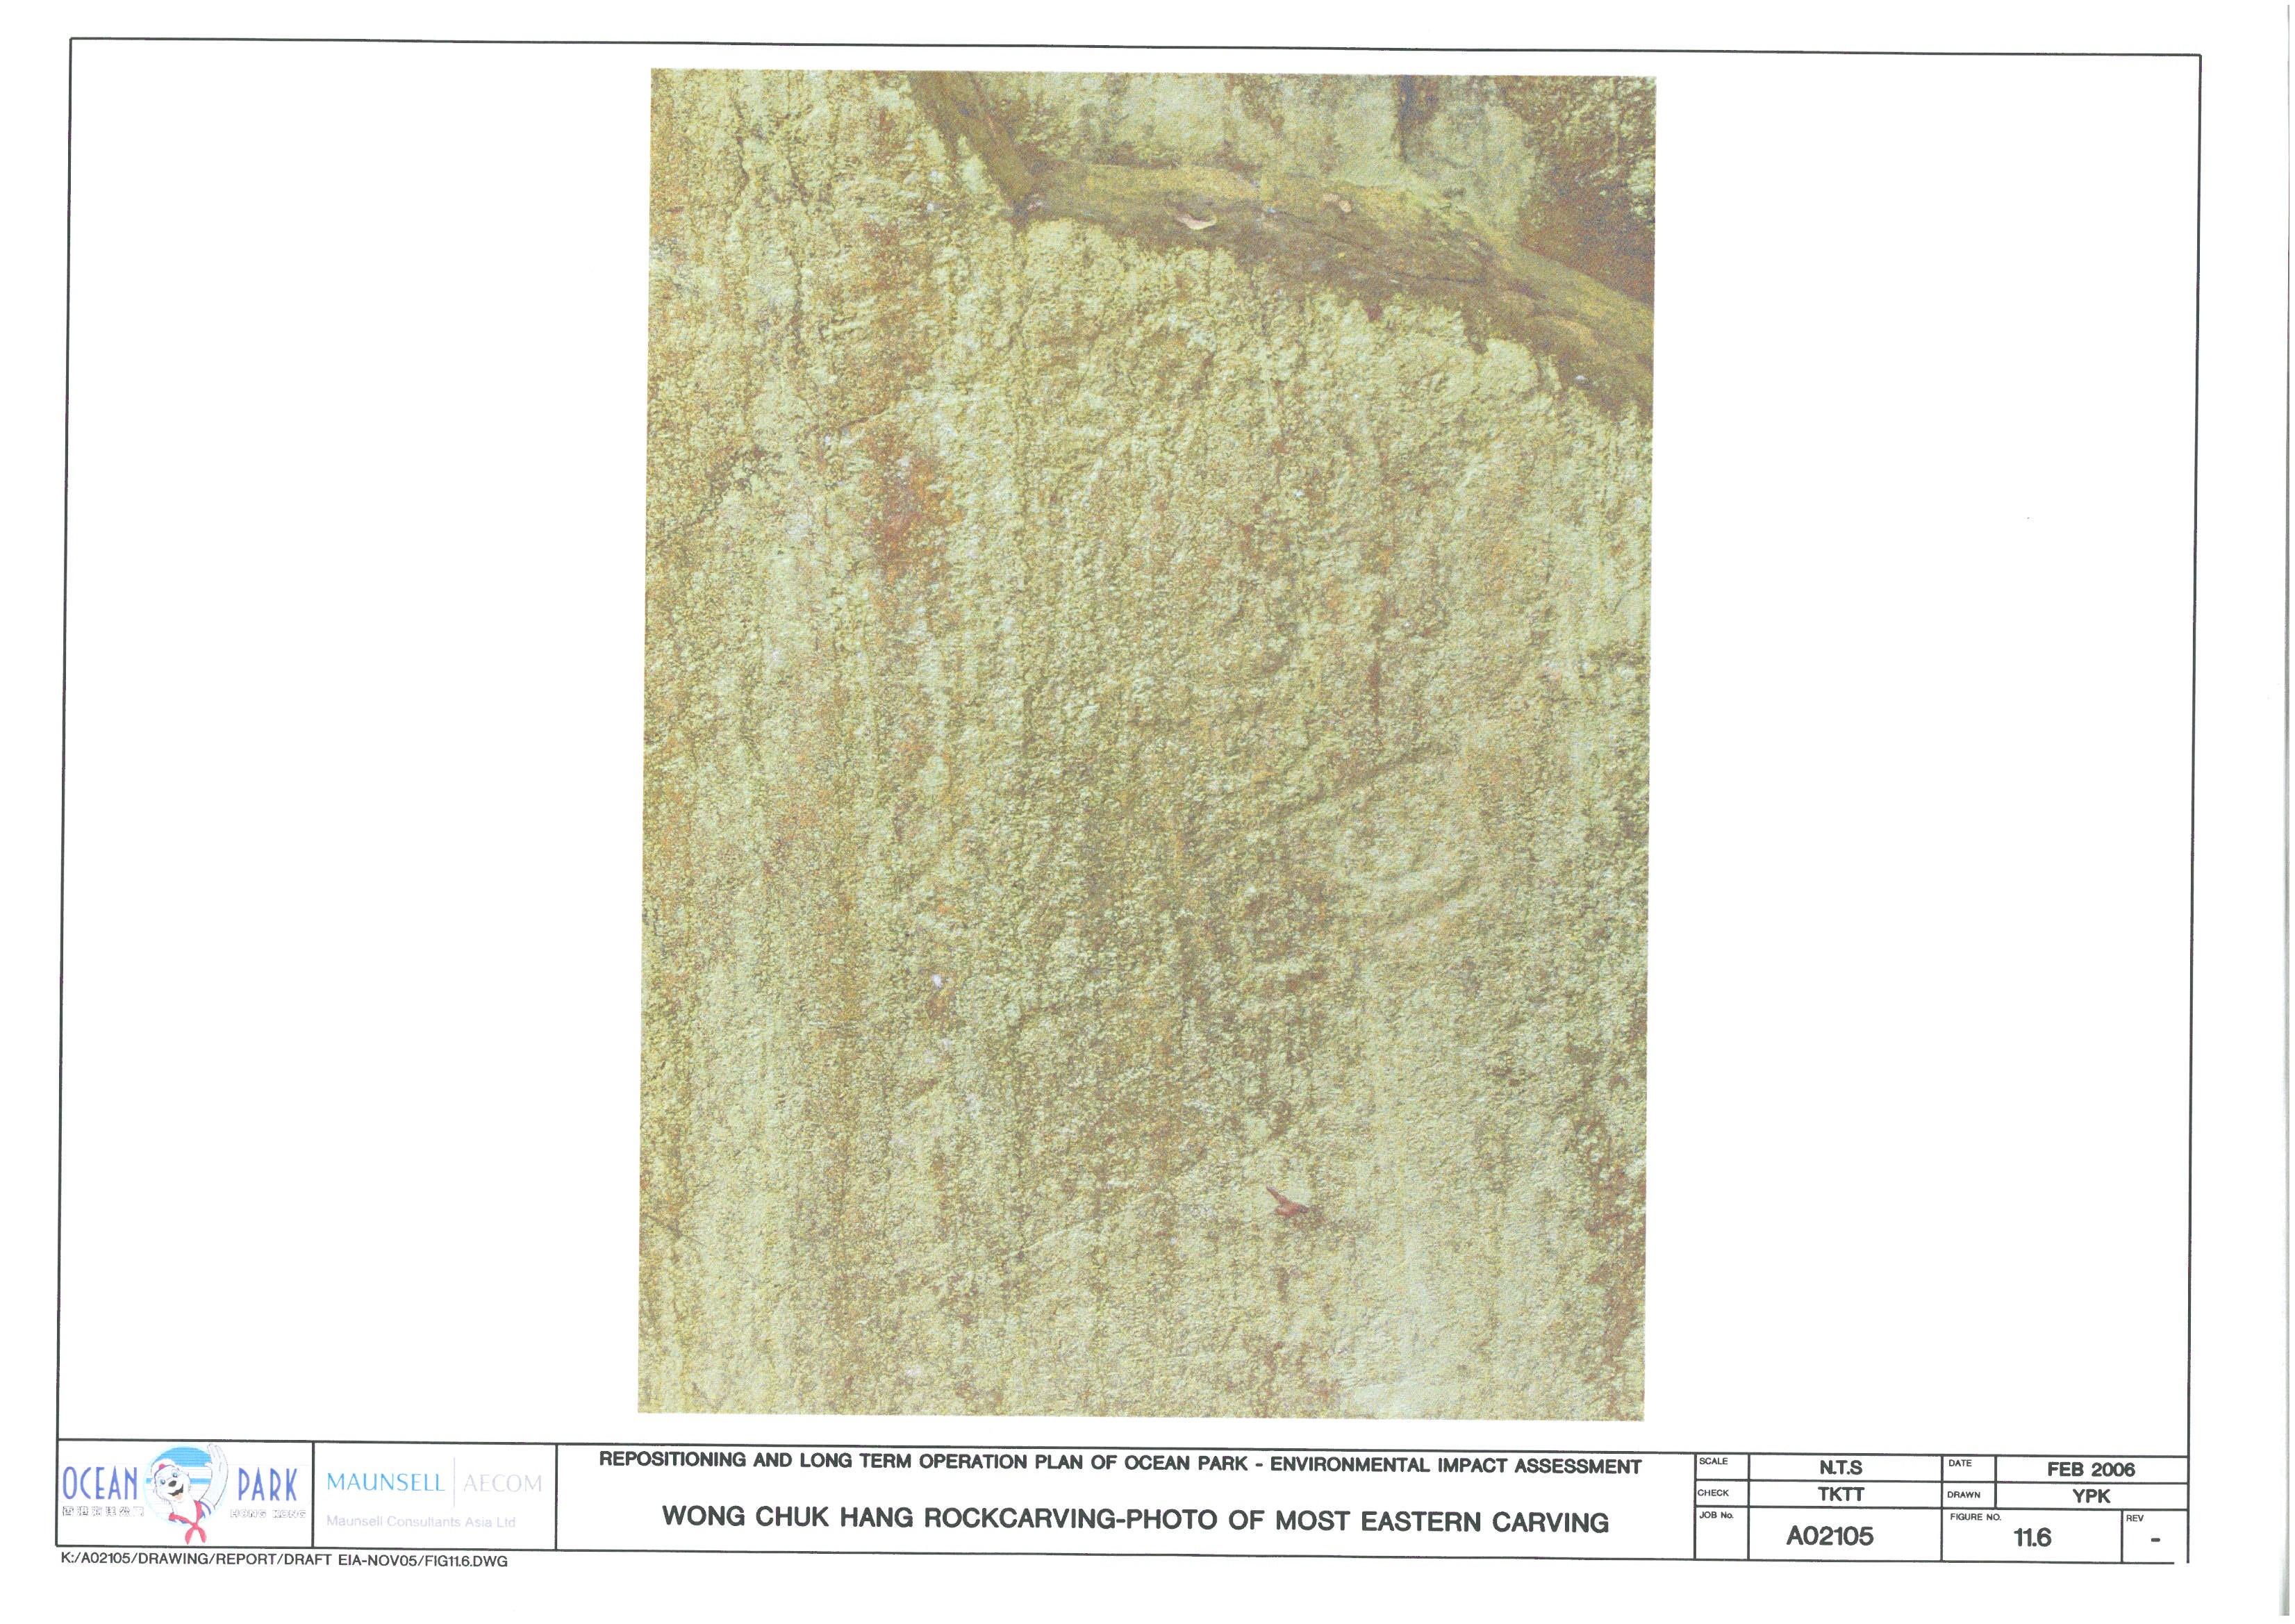
Figure 11.6 Wong
Chuk Hang Rockcarving - Photo of Most Eastern Carving
Figure 11.7 Wong Chuk
Hang Rockcarving - Photo of Centre Carving
Figure 11.8 Previous
Testing Near Wong Chuk Hang San Wai
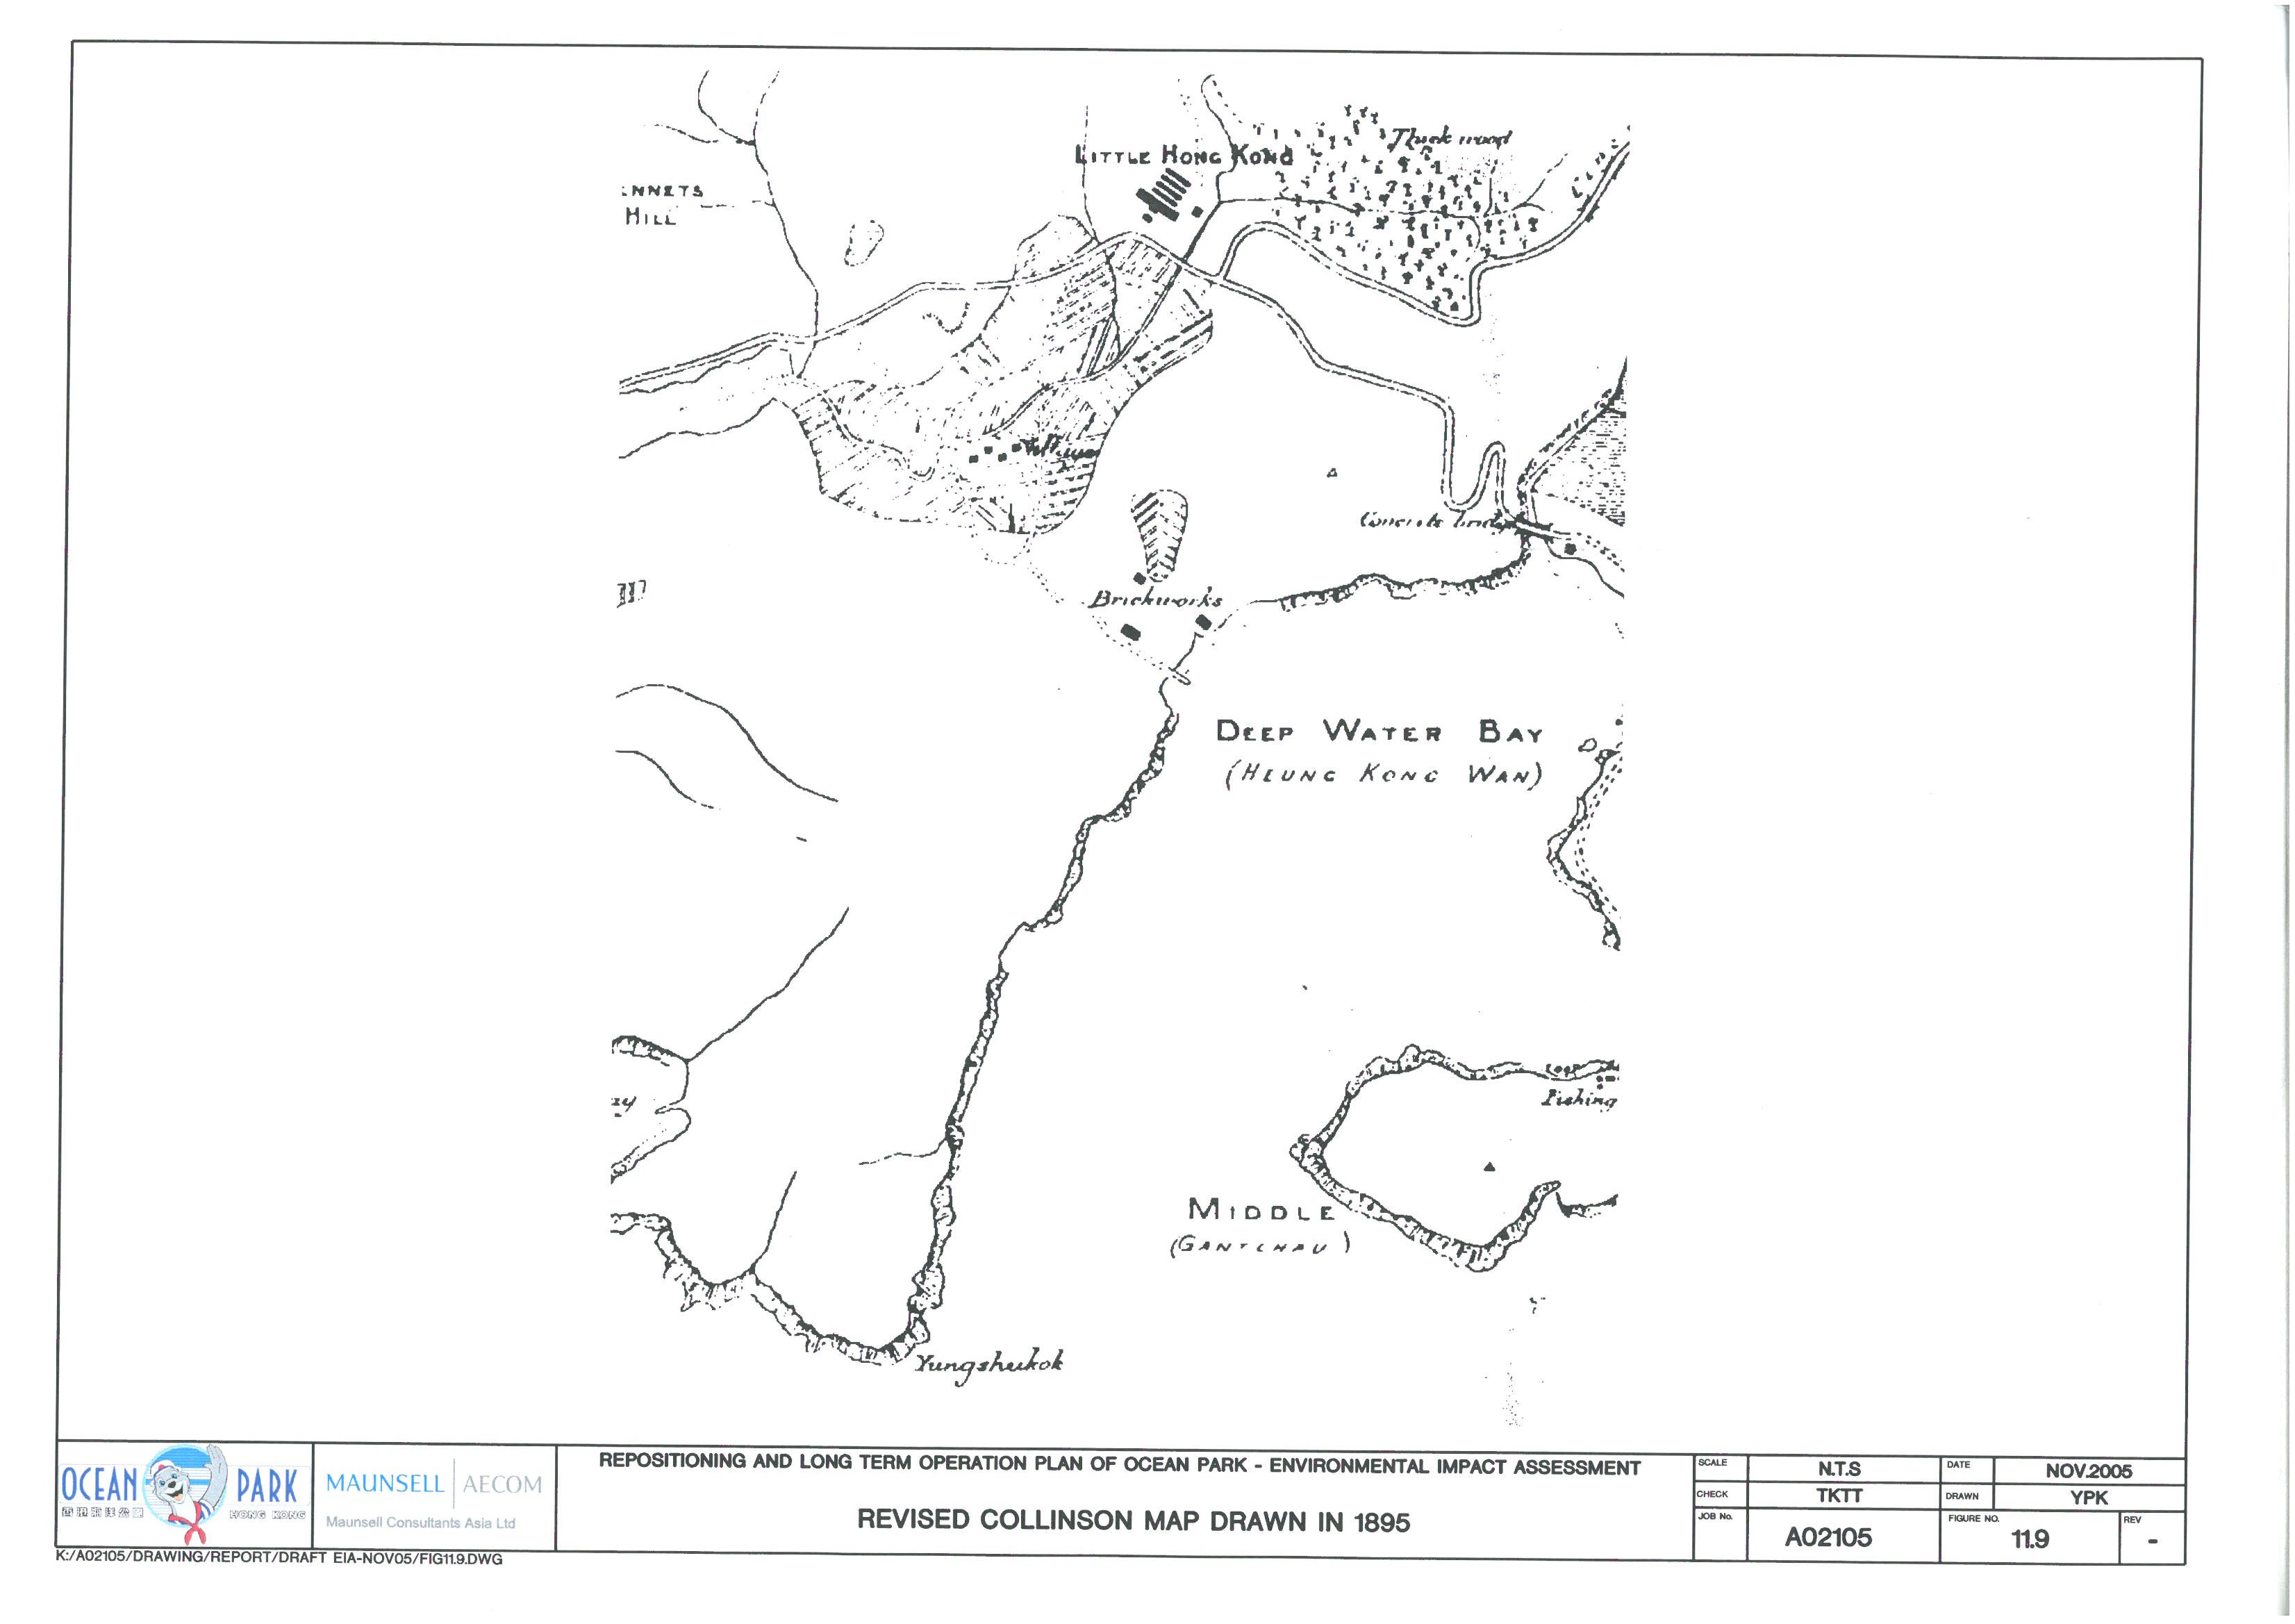
Figure 11.9 Revised
Collinson Map Drawn in 1895
Figure 11.10 Map
Drawn in 1945 within the Study Area
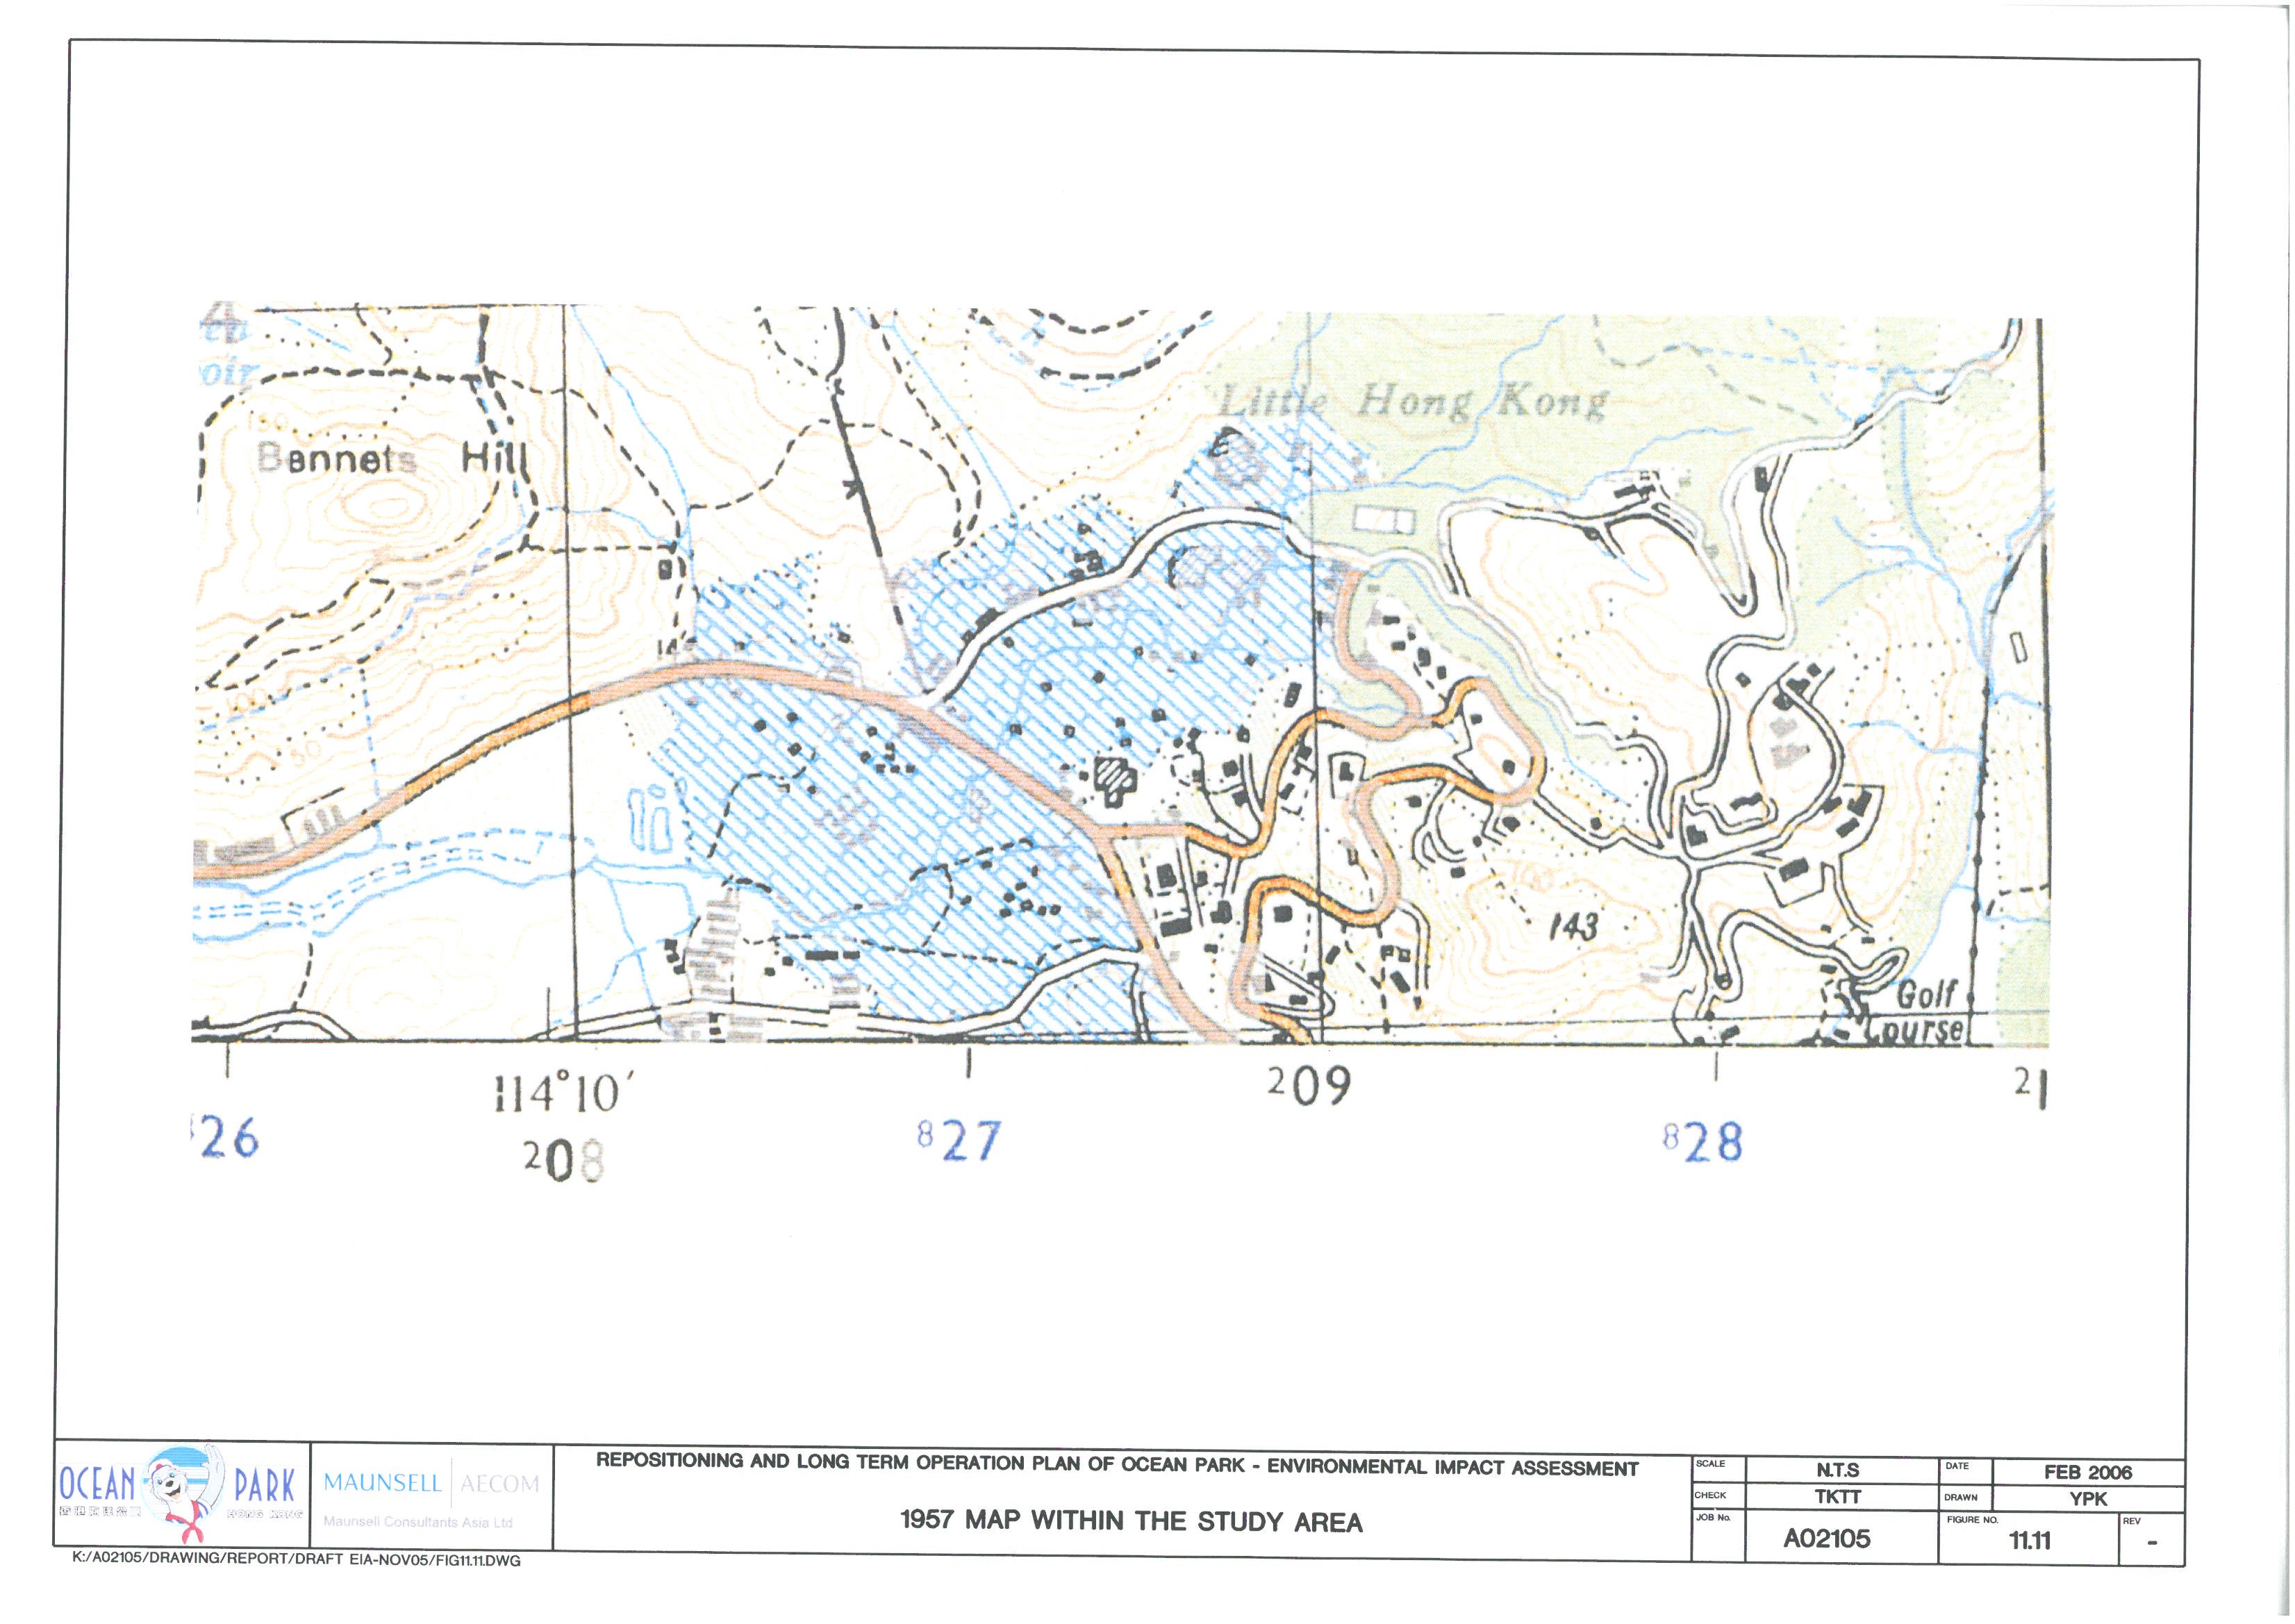
Figure 11.11 1957
Map within the Study Area
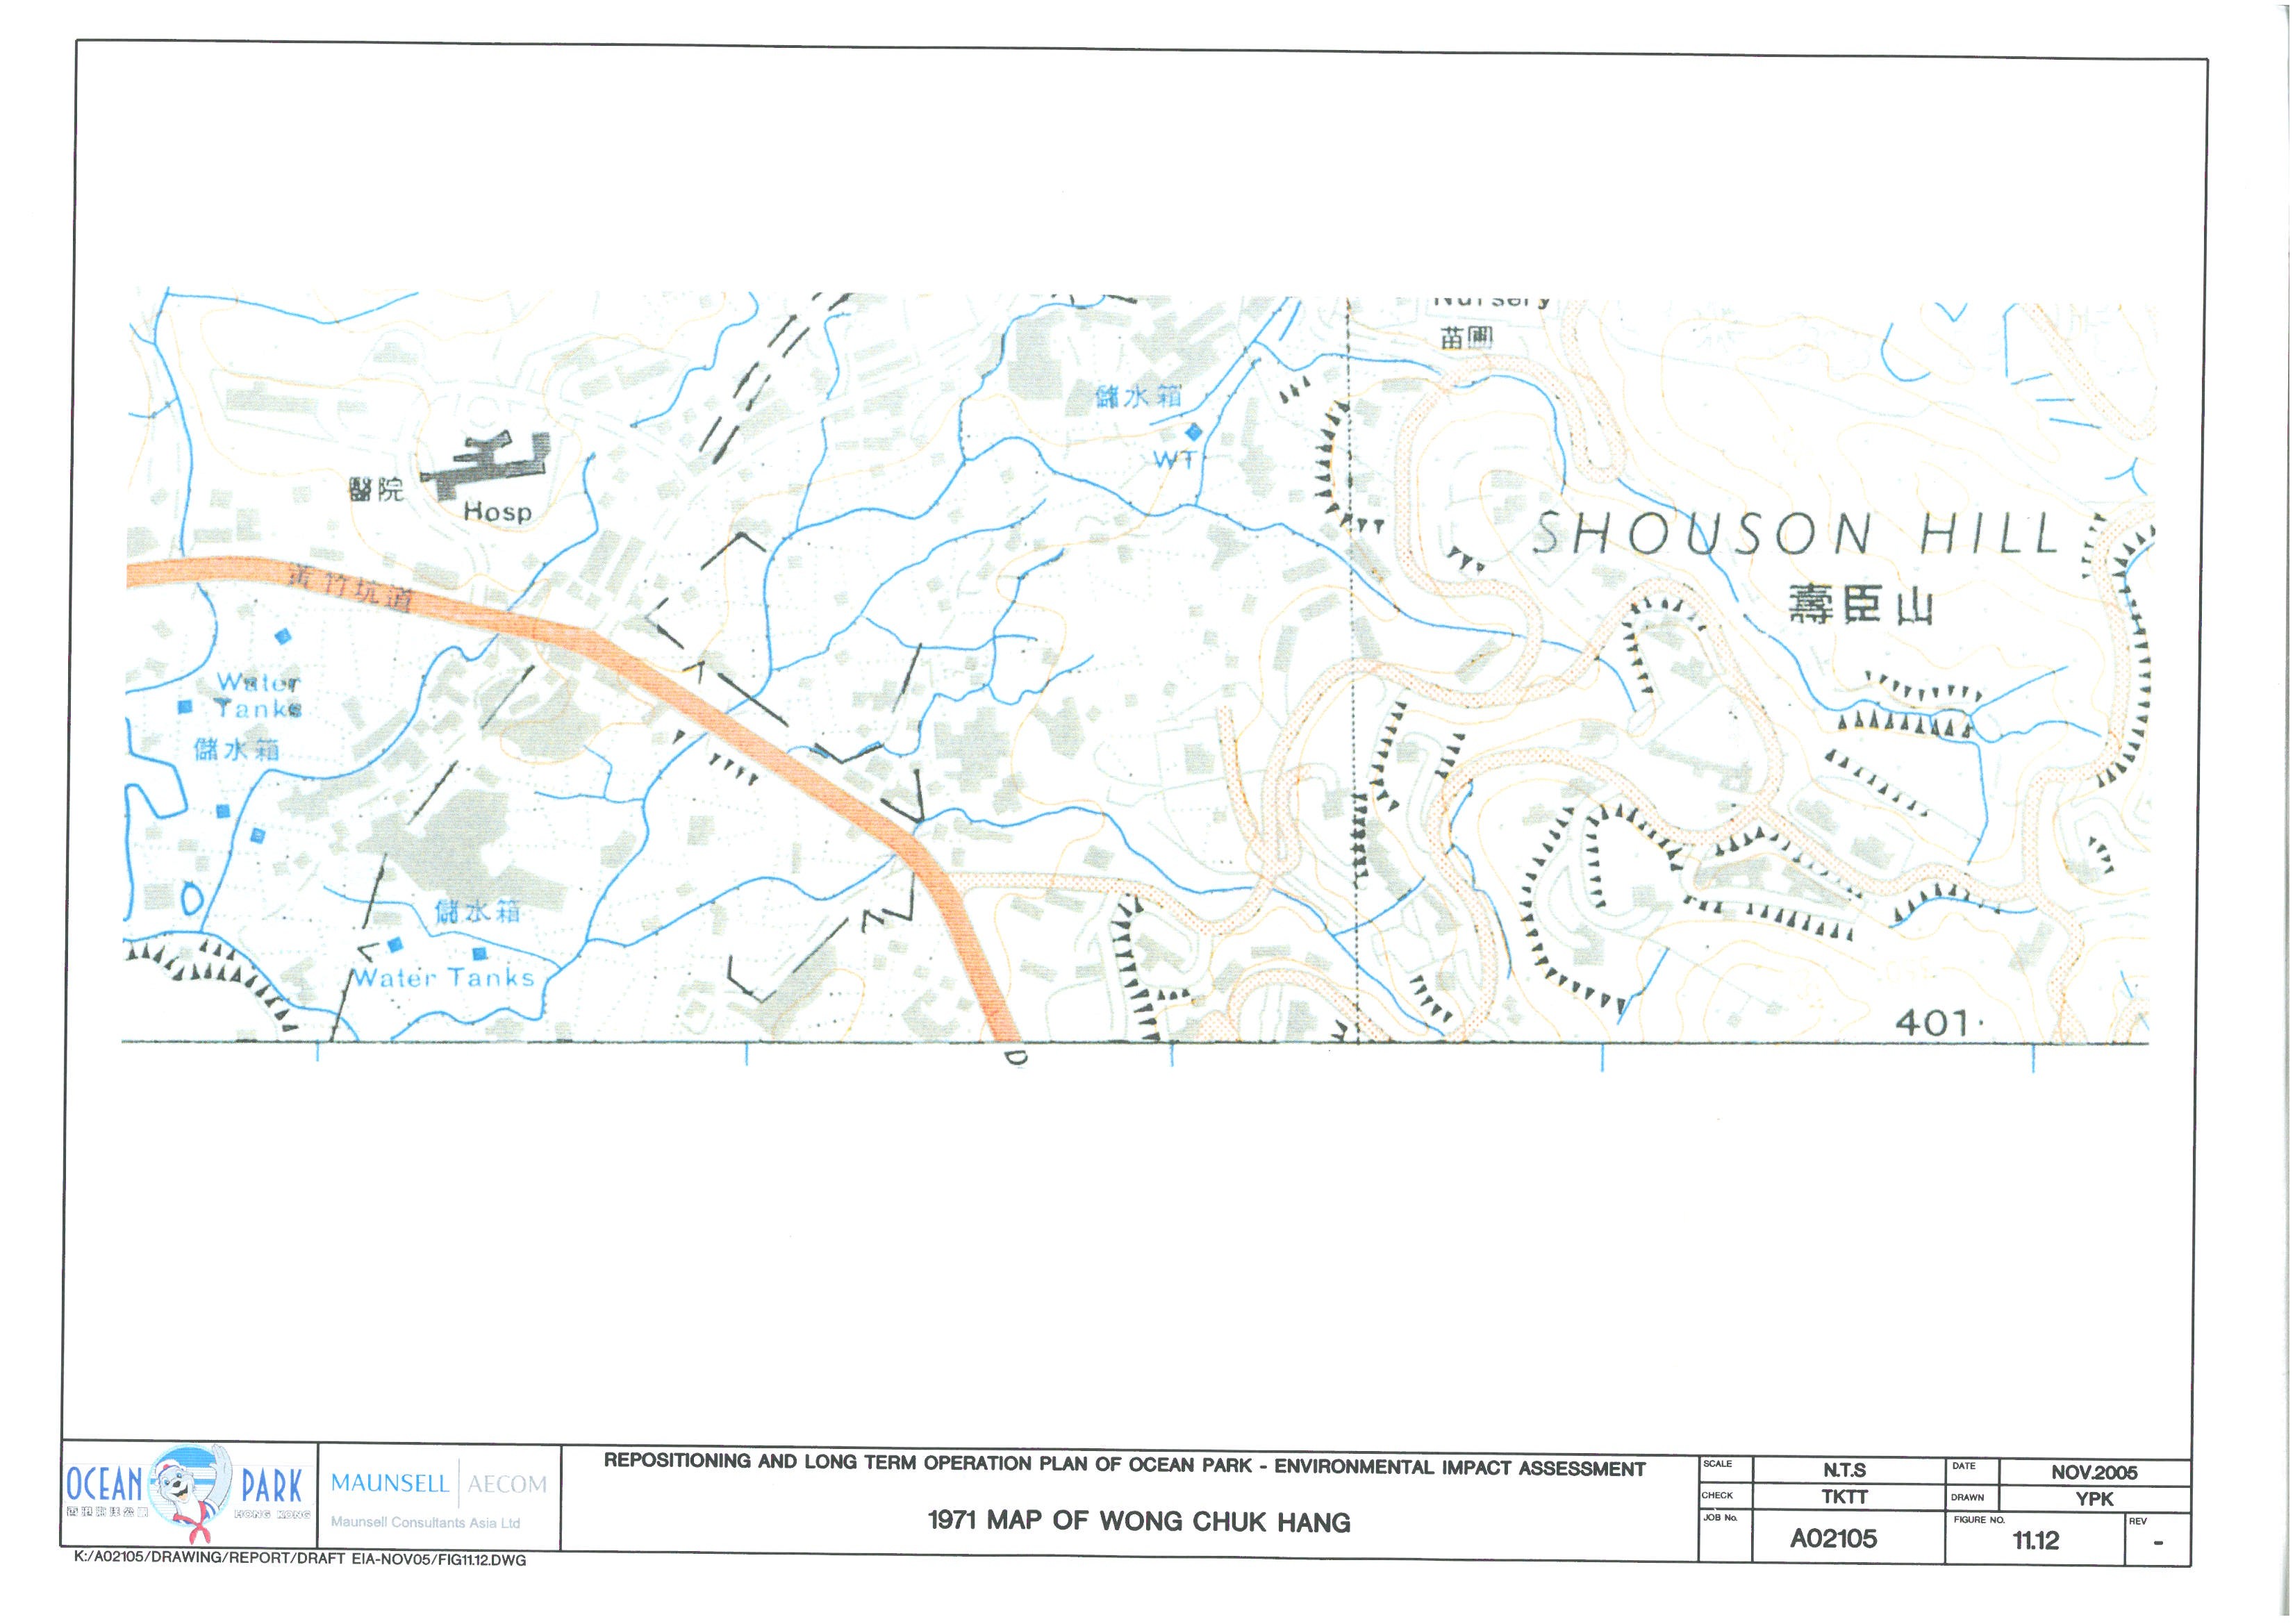
Figure 11.12 1971 Map of Wong
Chuk Hang
Figure 11.13 Map
of 1975 Showing Large River in the SoM Area
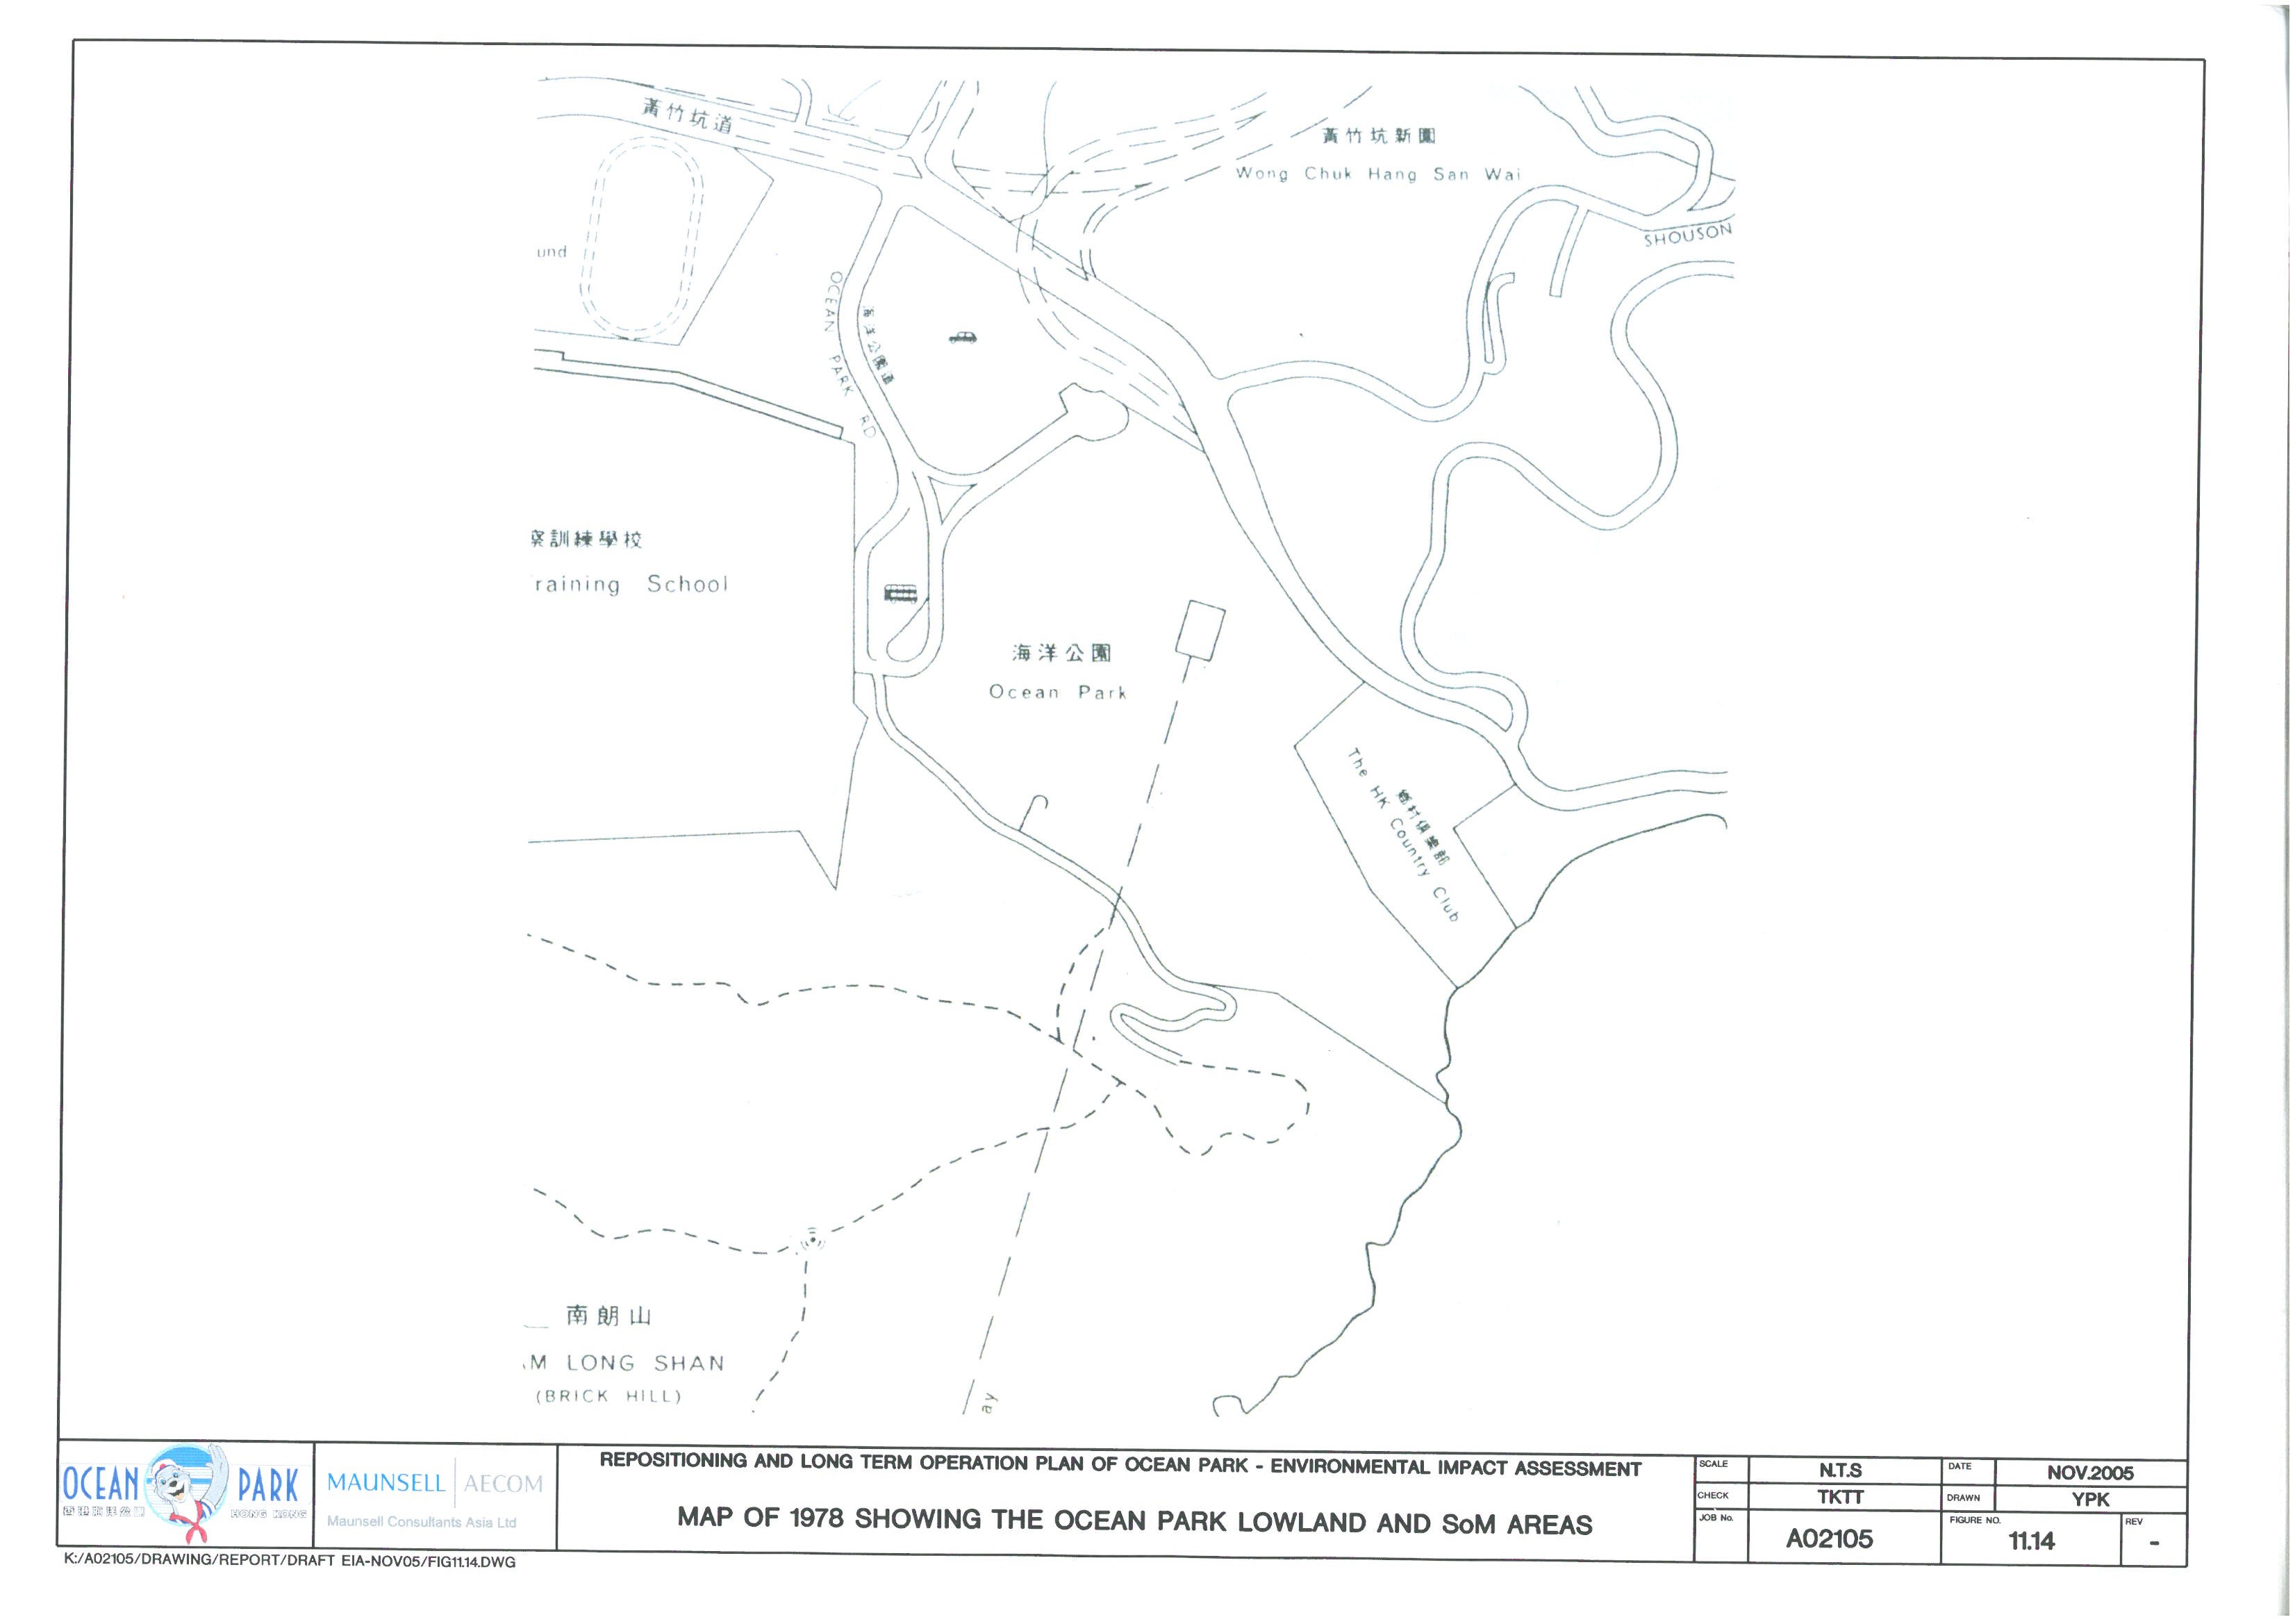
Figure 11.14 Map
of 1978 Showing the Ocean Park Lowland and SoM Areas
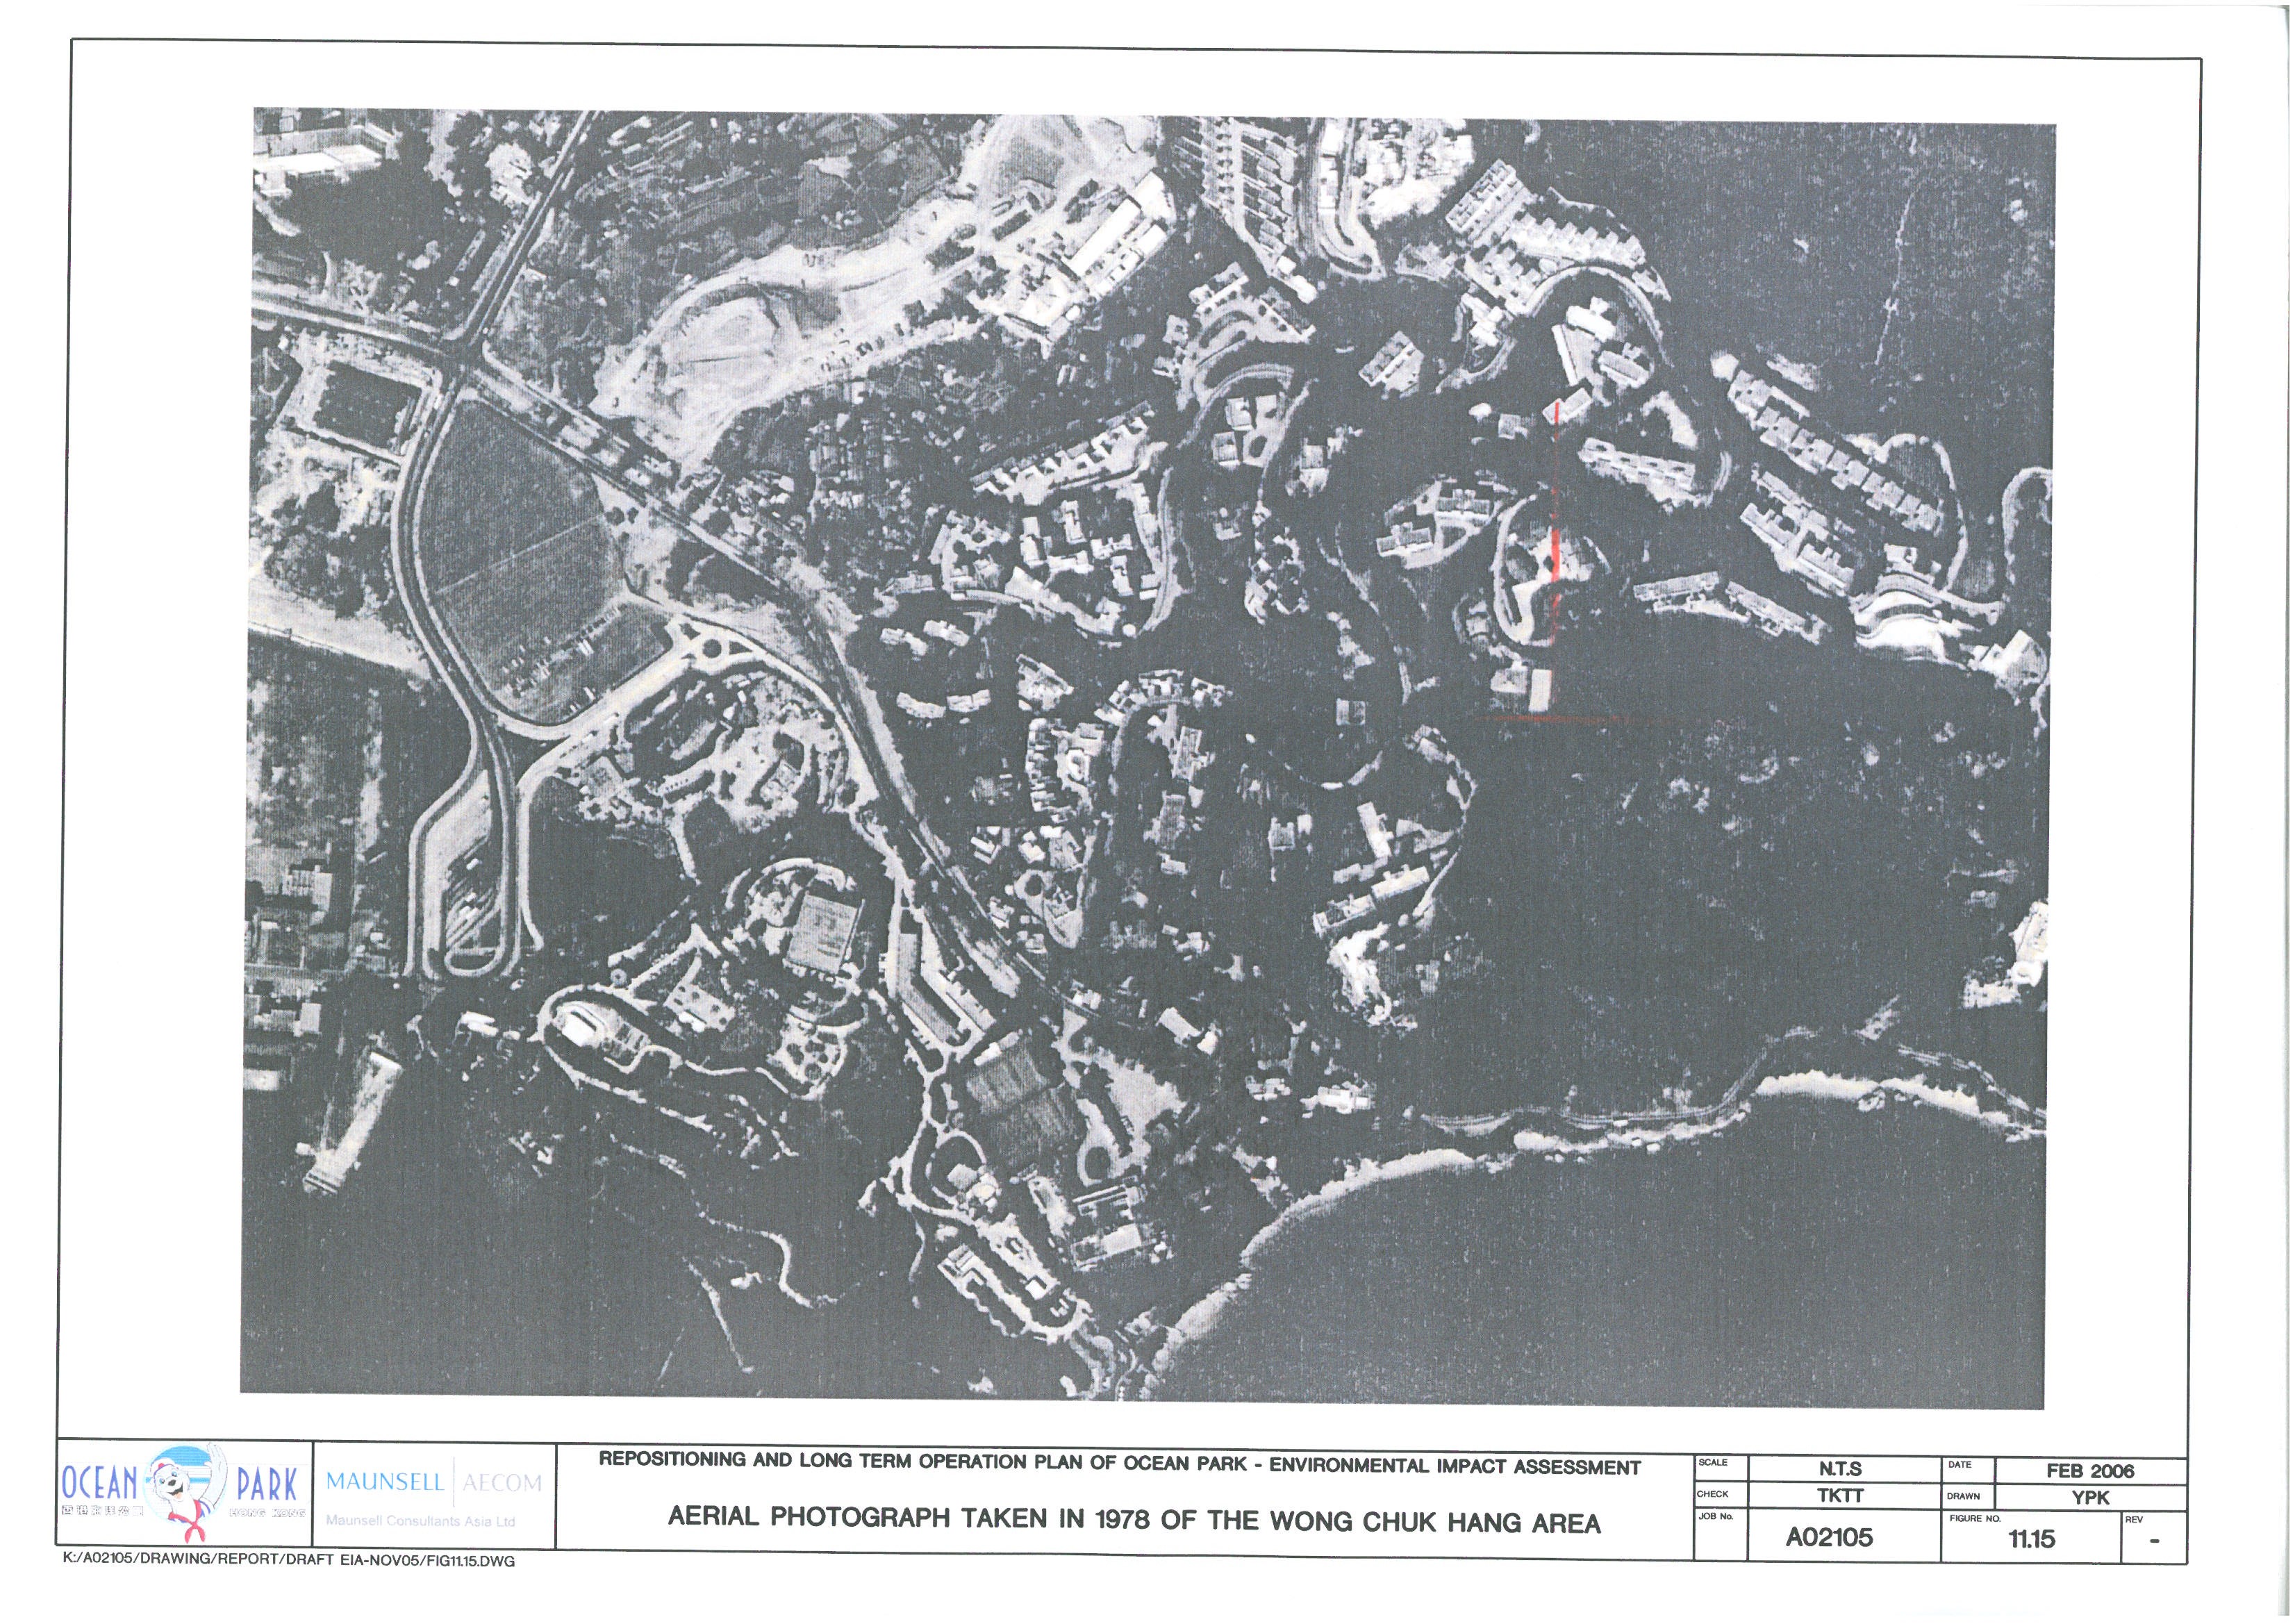
Figure 11.15 Aerial Photograph
Taken in 1978 of the Wong Chuk Hang Area
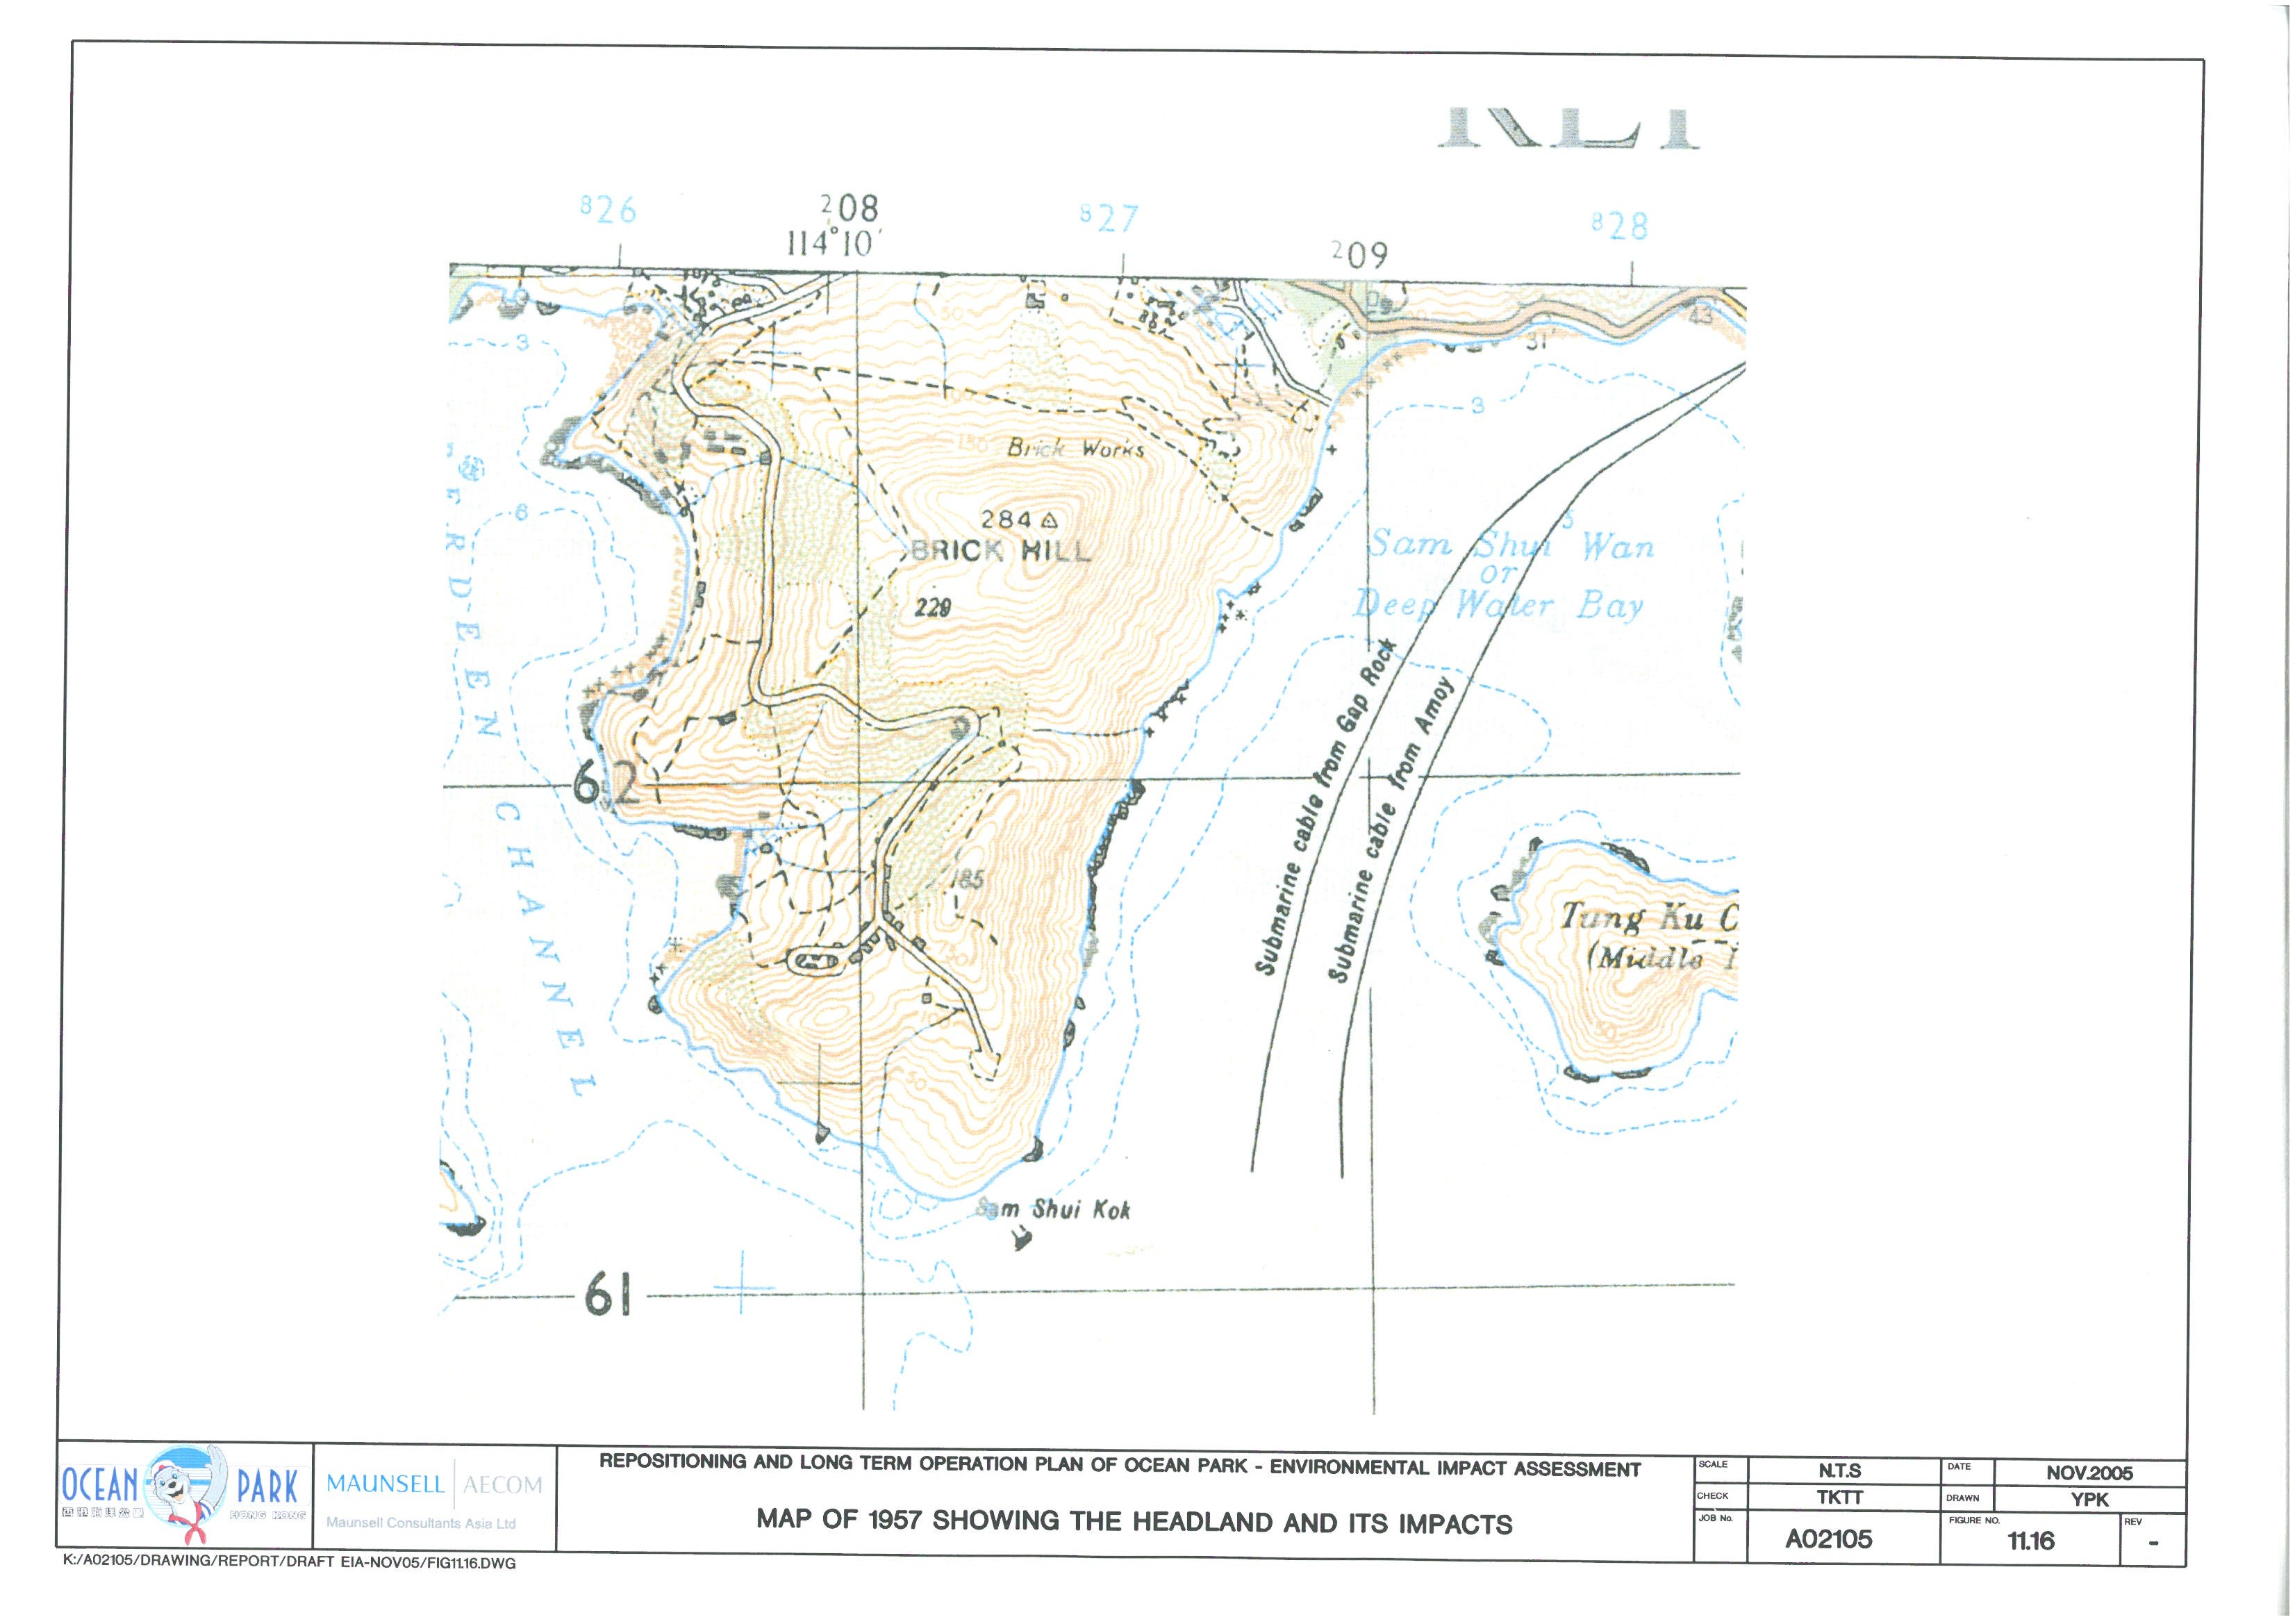
Figure 11.16 Map
of 1957 Showing the Headland and its Impacts
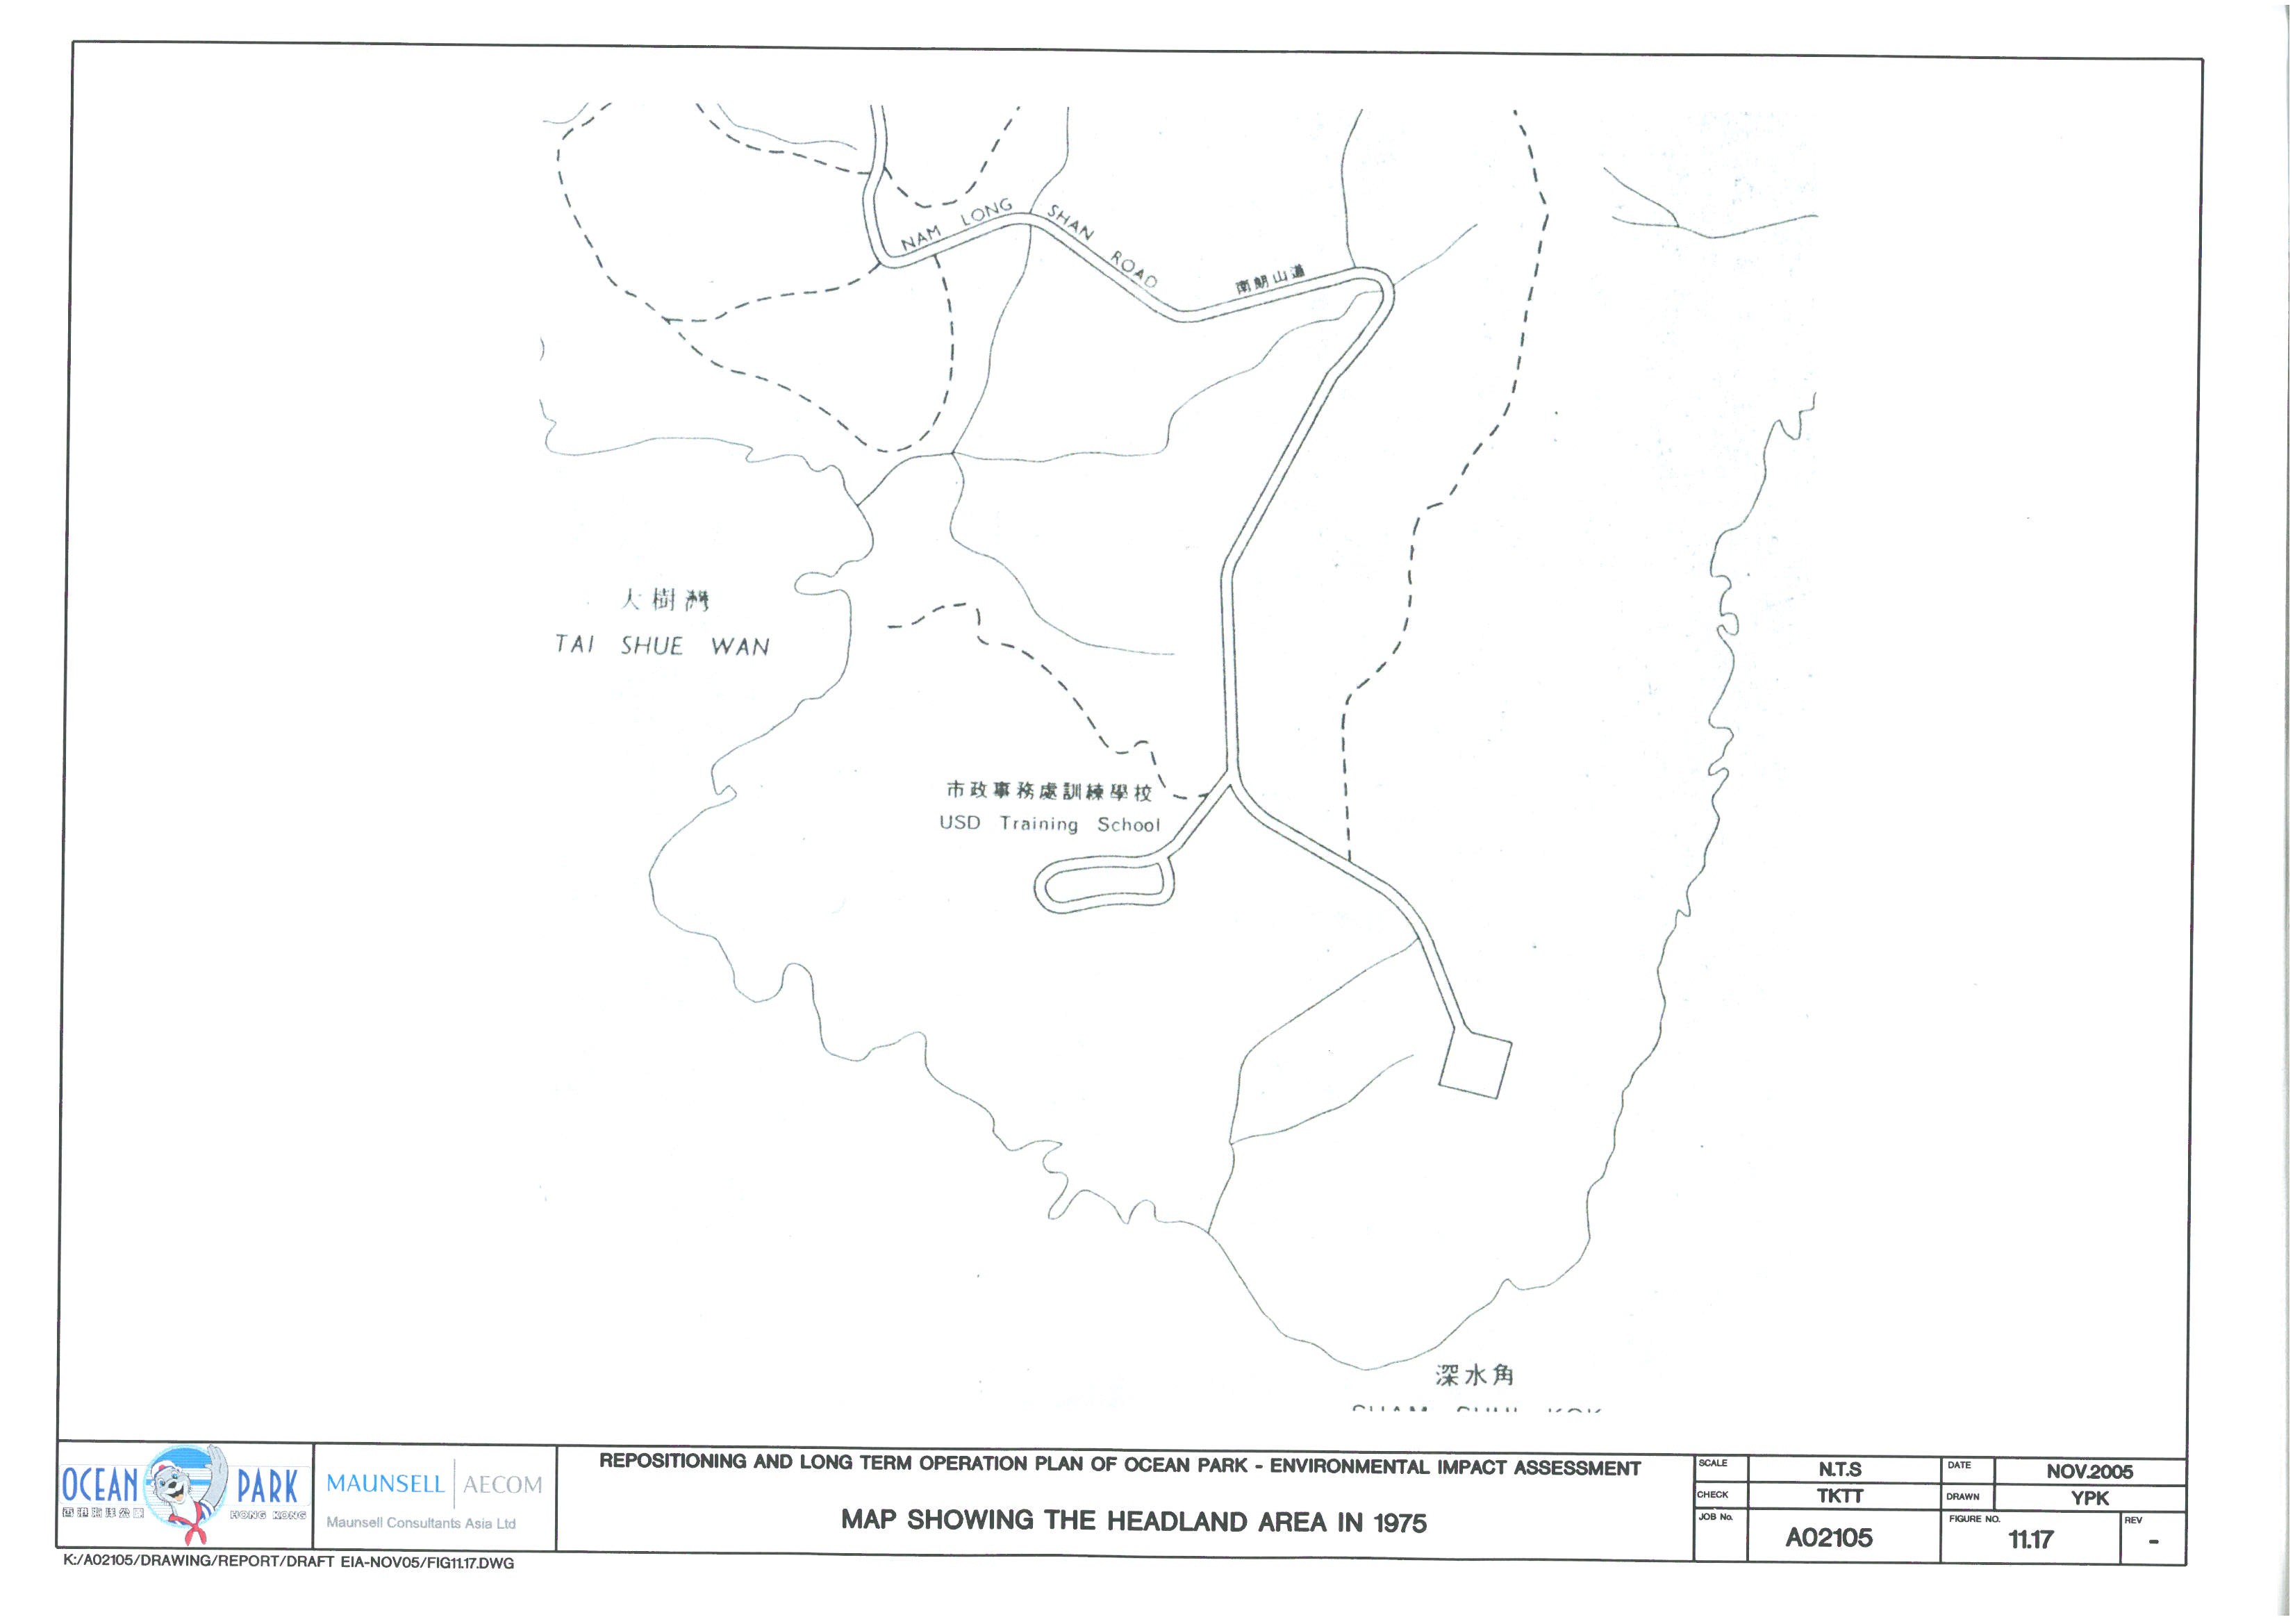
Figure 11.17 Map
Showing the Headland area in 1975
Figure 11.18 Photo
Taken of the Site Formation at Headland
Figure 11.19 Area
Proposed for Archaeological Survey
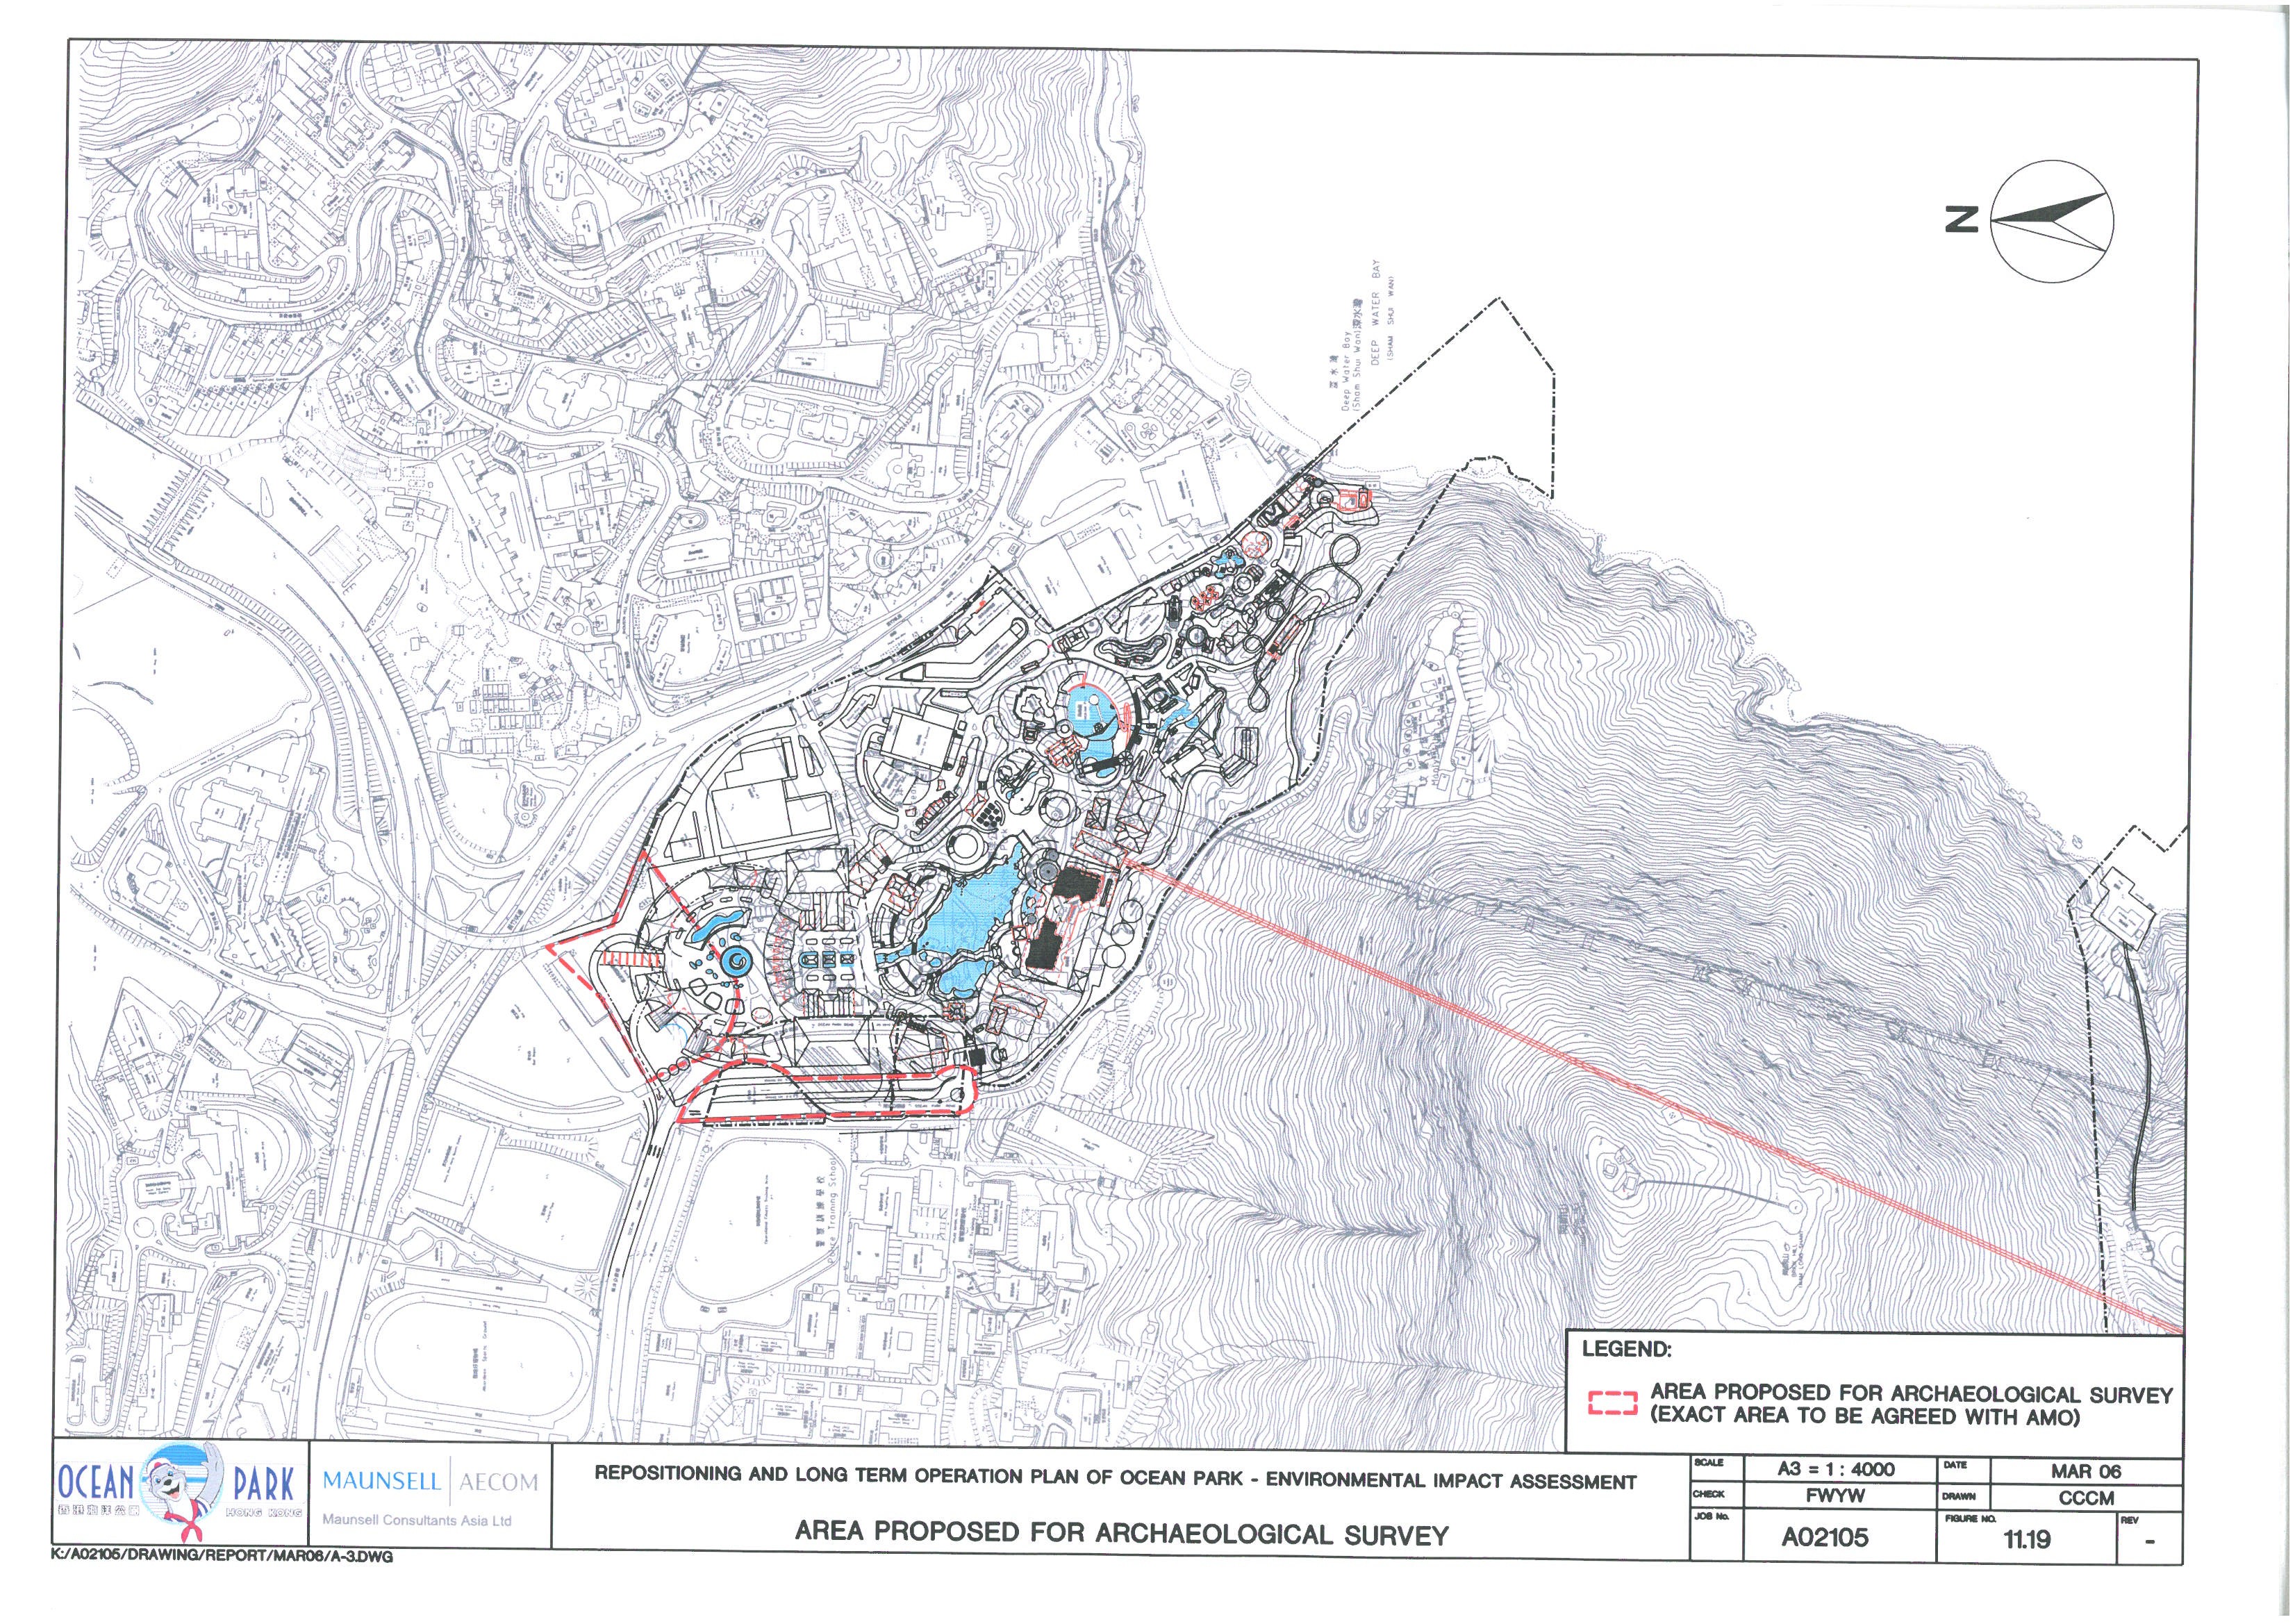
Figure 11.20 The
Study Area as seen on the Collinson Ordnance Map of Hong Kong (1845)
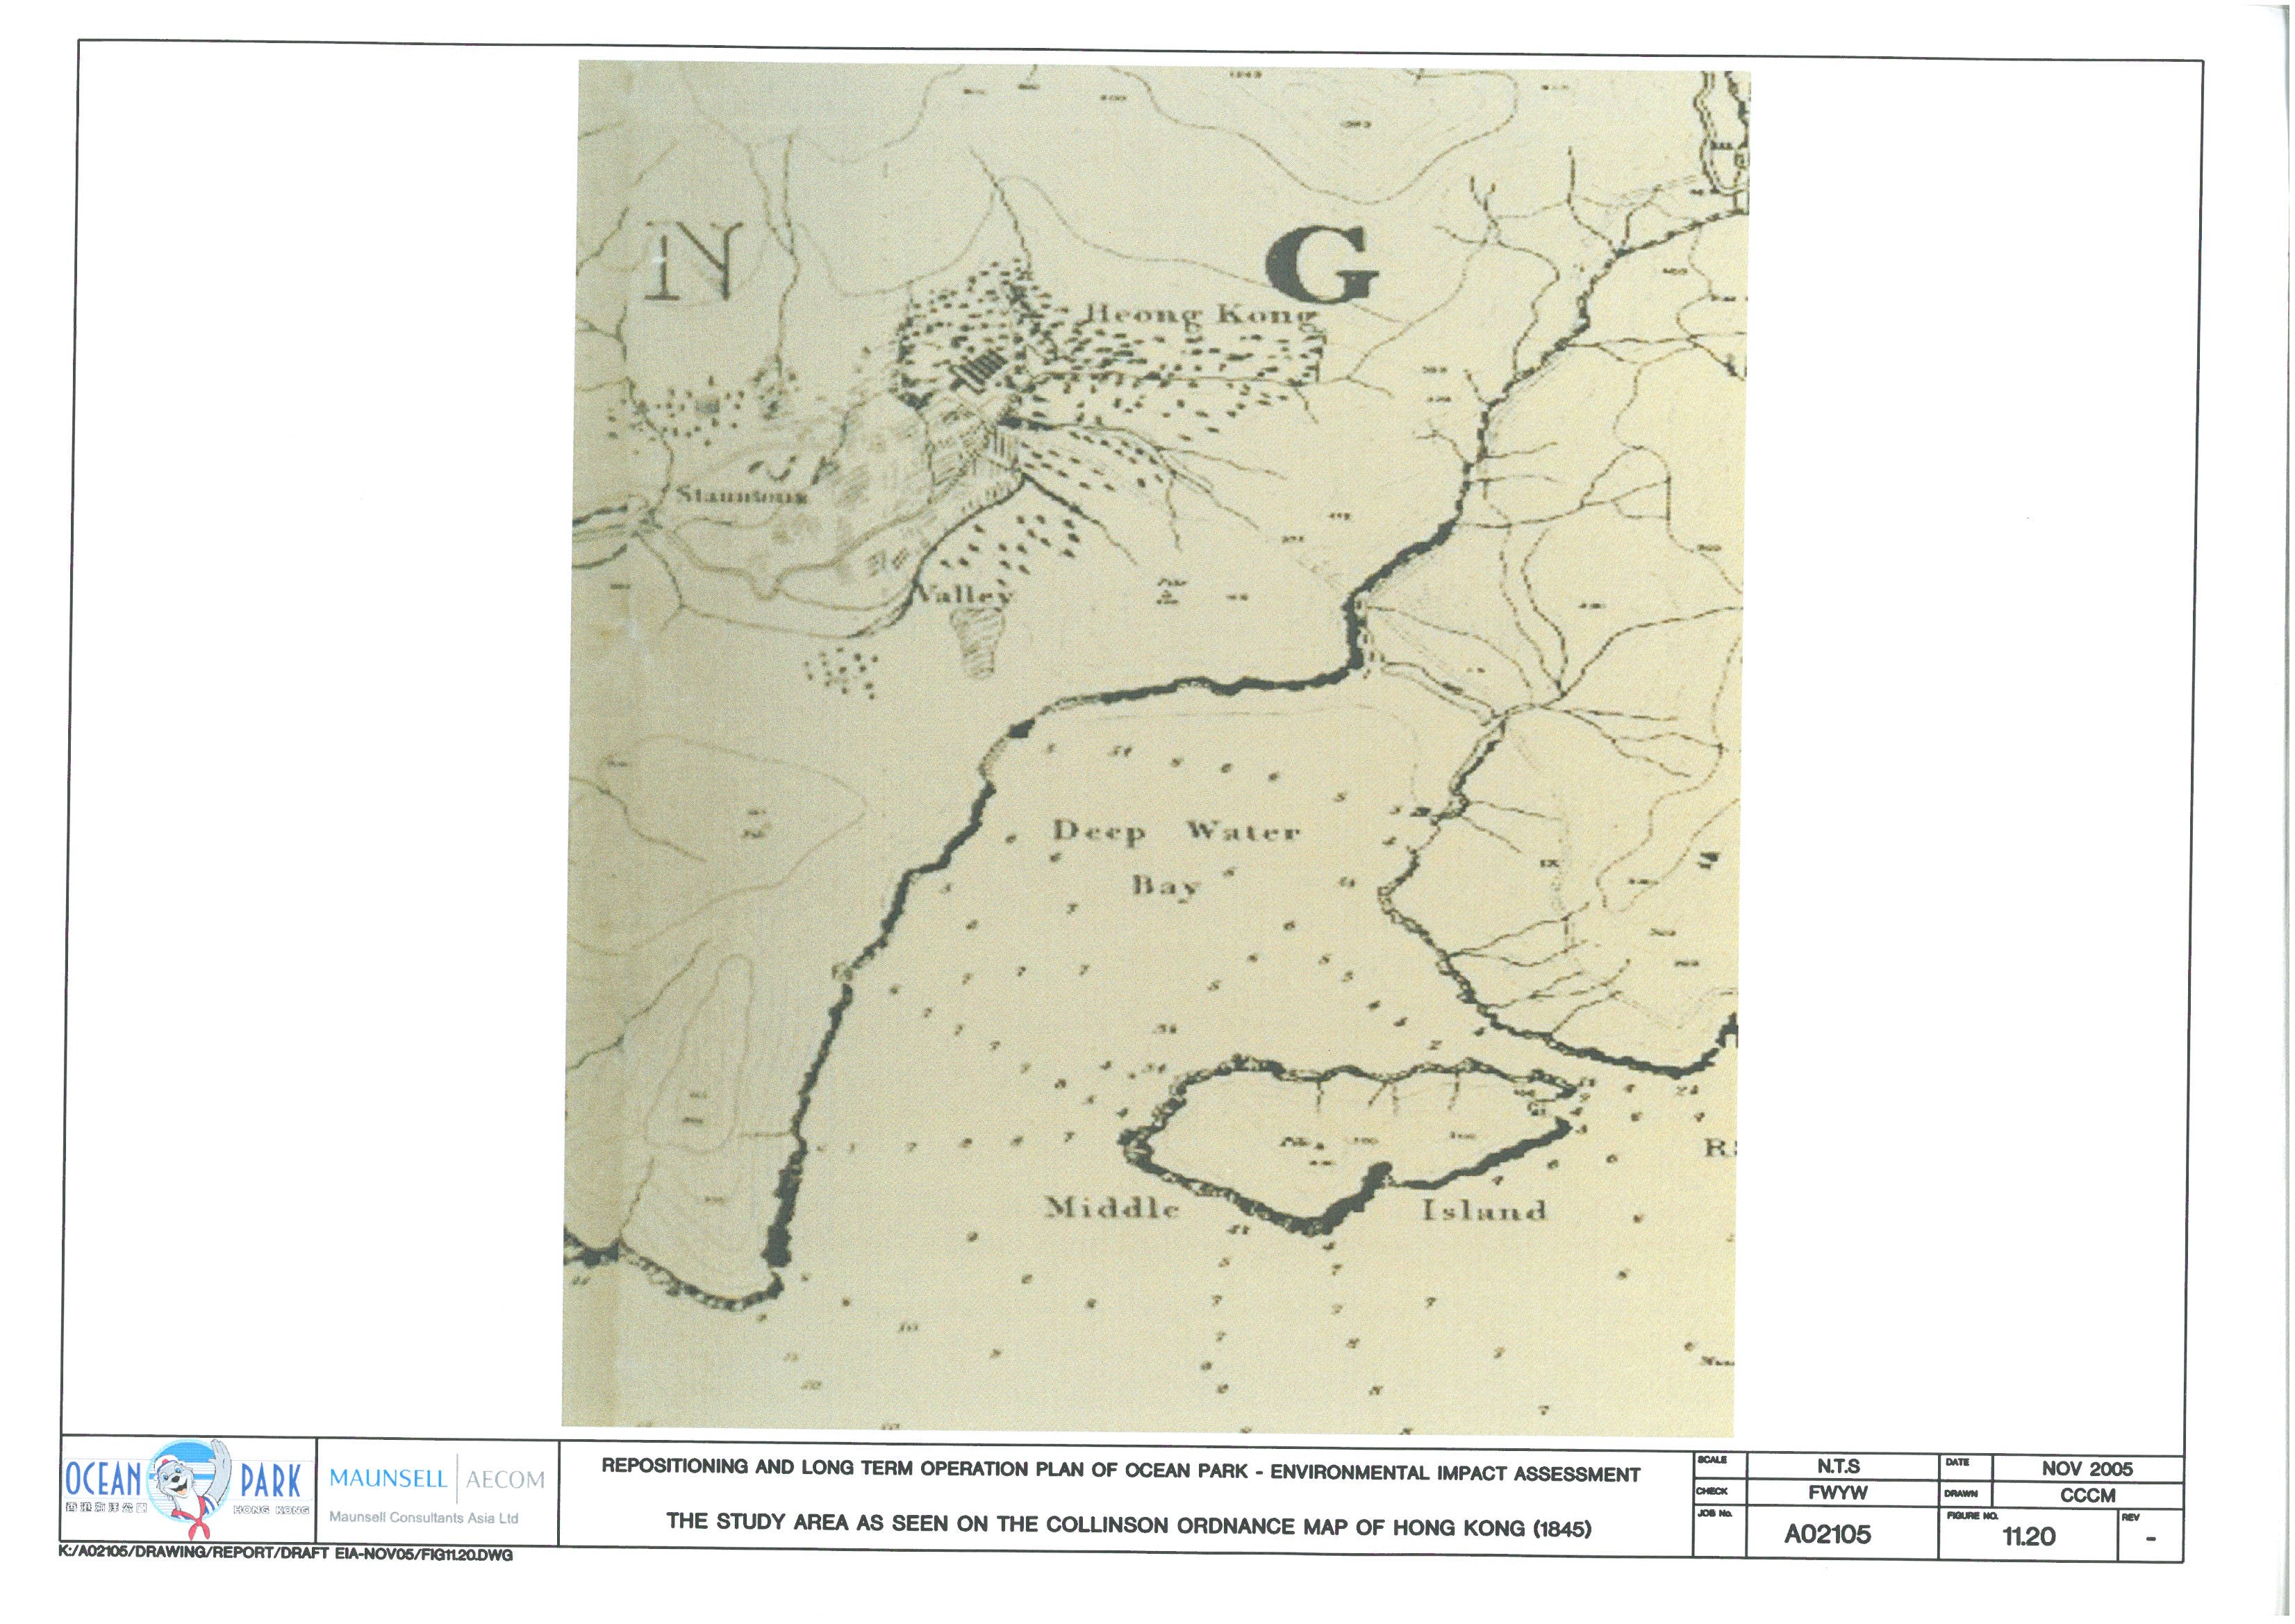
Figure 11.21 The Study Area as seen
on the revised Collinson Ordnance Map of Hong Kong (1895)
Figure 11.22 Map
Showing the Recorded Heritage Resources in Wong Chuk Hang San Wai (AAHB-900 to
916)
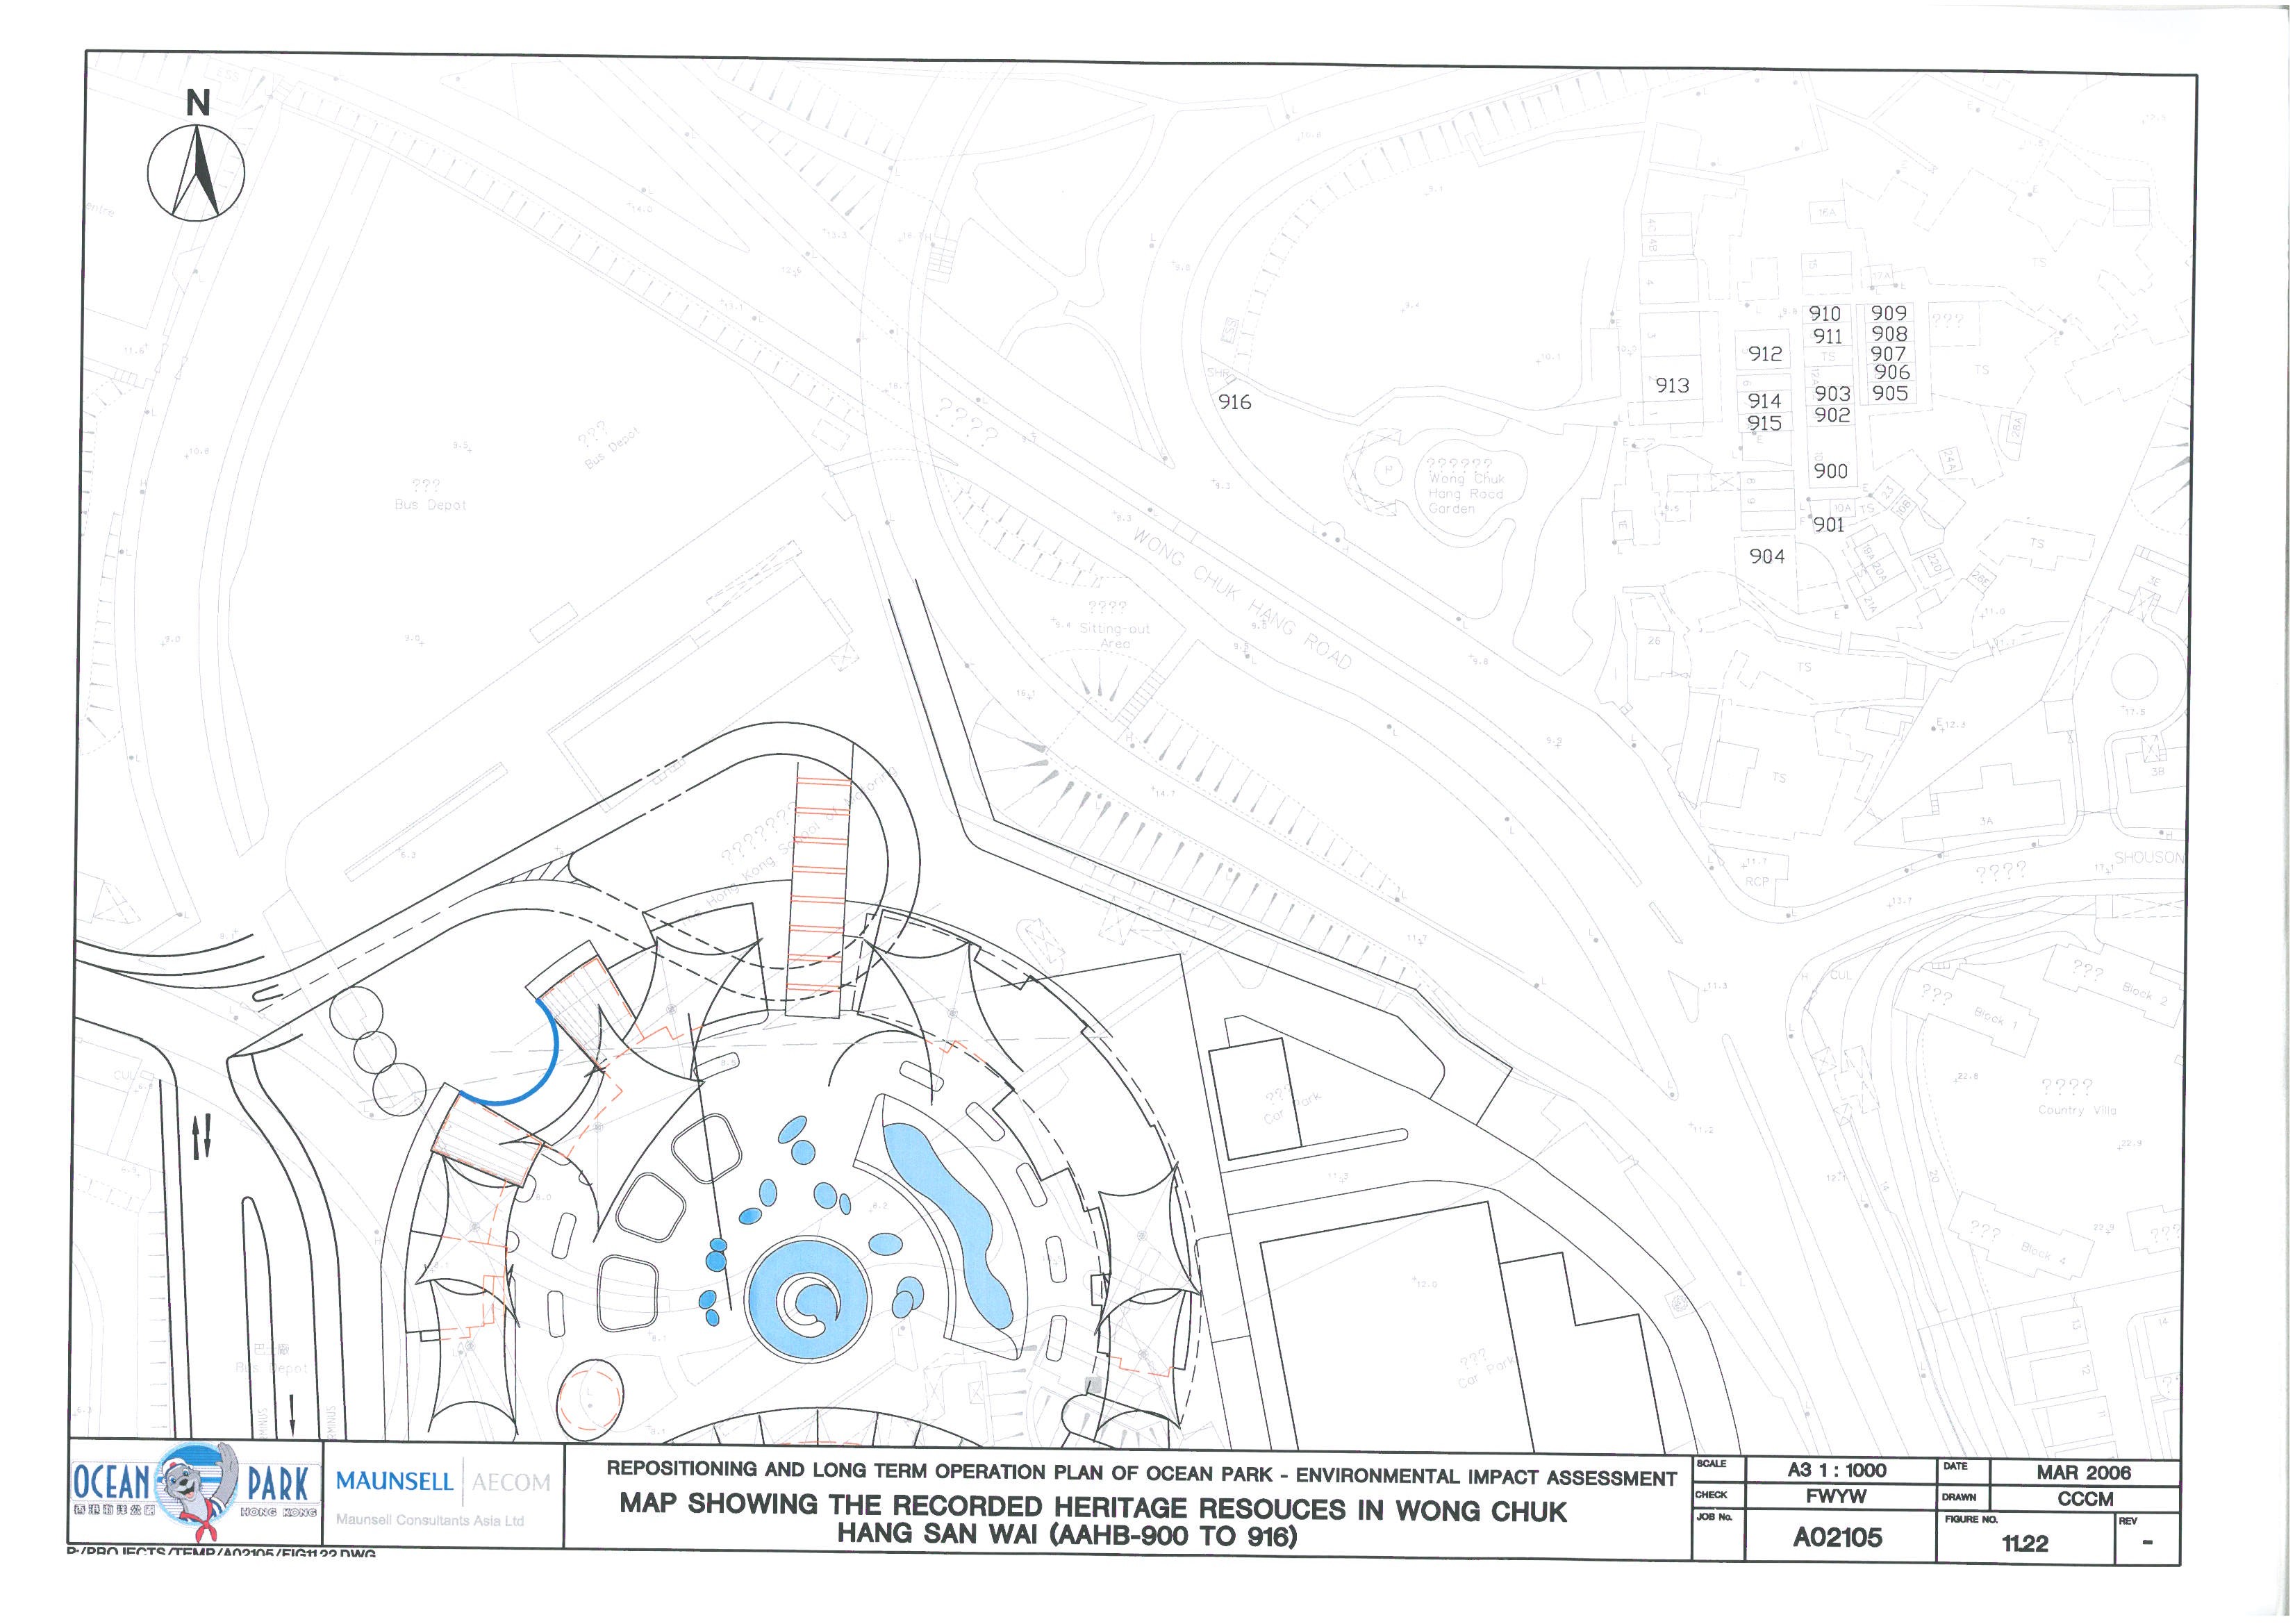
Figure 11.23 Map
Showing the Recorded Heritage Resources on Nam Long Shan Road (AAHB-917 to 920)
Figure 11.24 Location
of the Historical Grave
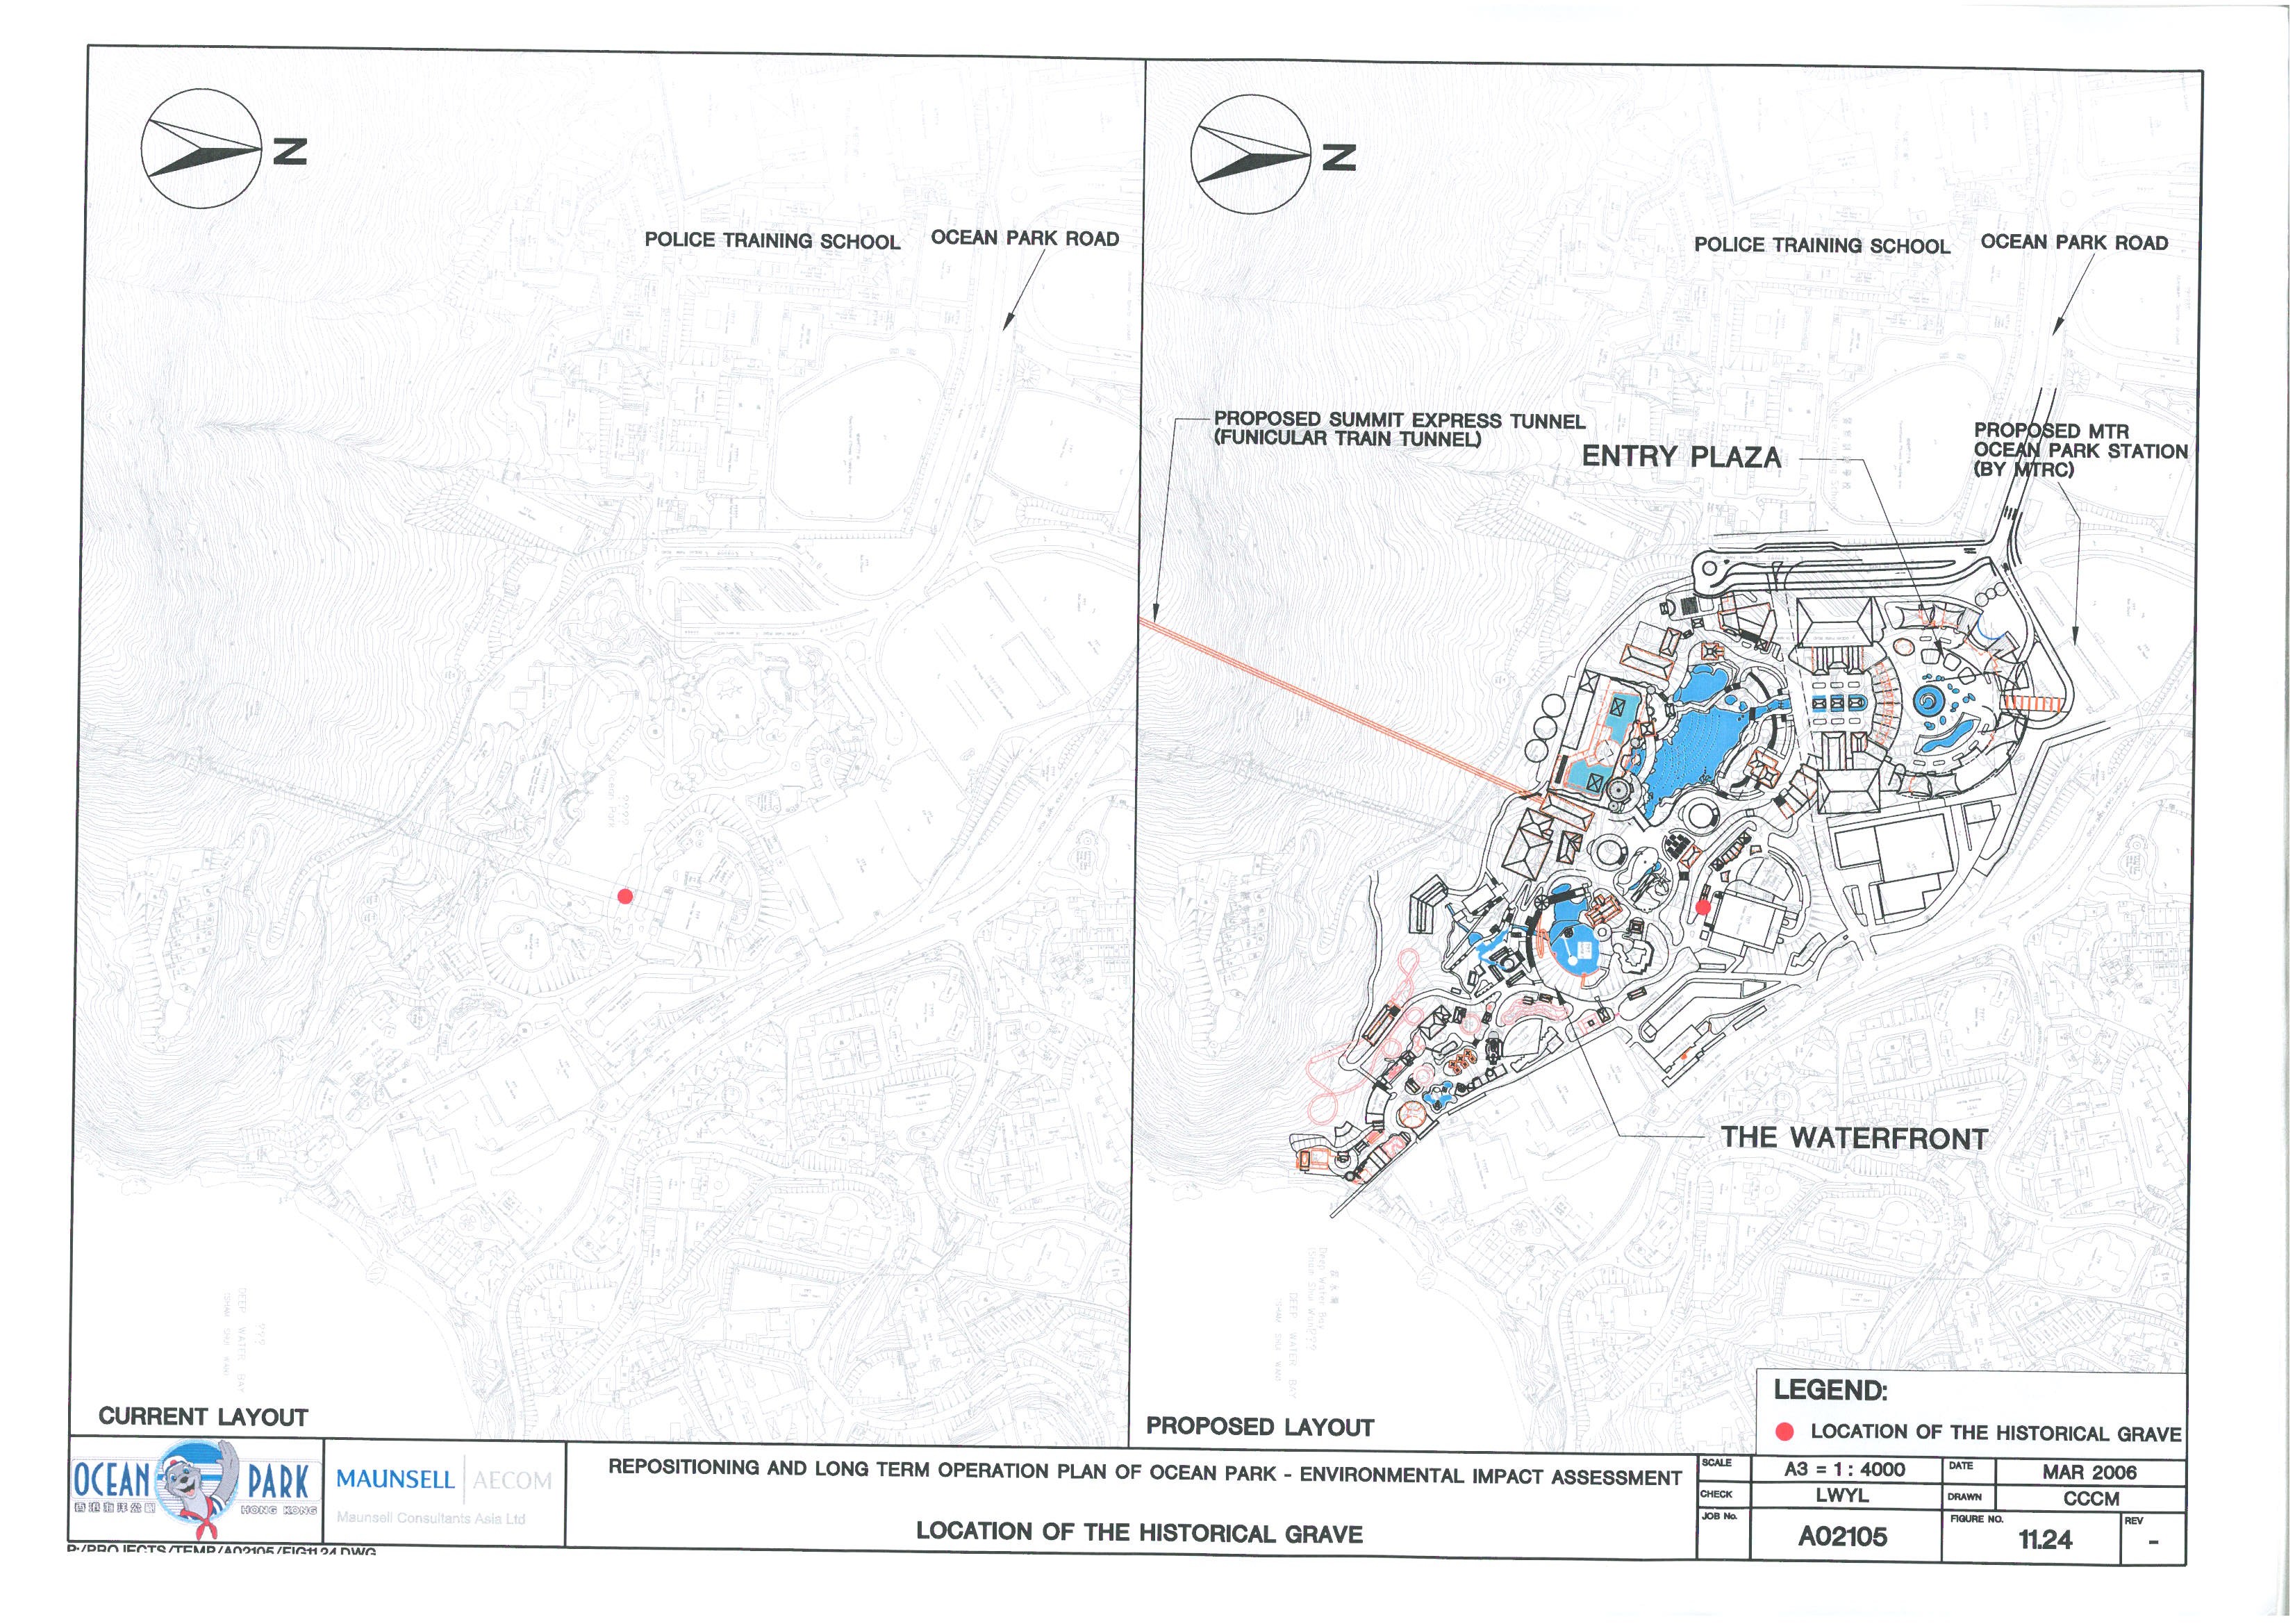
Volume III – Appendices
List of Appendices
Appendix 2.1 The Original Scheme Presented in the Project
Profile
Appendix 2.2 Preliminary
Construction Programme
Appendix 2.3 Traffic Forecast for
Years 2005 and 2026
Appendix 3.1 Assumed Area
Sensitivity Ratings of the Representative NSRs
Appendix 3.2 Photographs of the Representative
NSRs
Appendix 3.3 Construction Noise Impact Assessment
(Unmitigated Scenario)
Appendix 3.4 Fixed Plant Noise
Impact Assessment
Appendix 3.5 Entertainment Noise
Impact Assessment
Appendix 3.6 Construction Noise
Impact Assessment (Mitigated Scenario)
Appendix 4.1 Broad Tree Survey Report for “The
Waterfront” & “The Summit”
Appendix 5.1 Representative
Photographs of Habitats
Appendix 5.2 Plant Species of
Conservation Interest
Appendix 5.3 Plant Species Recorded
On or Adjacent to Features
Appendix 5.4 Fauna Recorded Within
the Assessment Area
Appendix 5.6 Coral Species and
Abundance recorded during Rapid Ecological Assessment (REA)
Appendix 5.7 Representative
photographs of Coral Species
Appendix 7.1a Contamination Assessment Plan – Hong Kong School of
Motoring
Appendix
7.1b Contamination Assessment
Plan – City Bus Depot
Appendix 7.2 Contamination Assessment Report – City Bus Depot
Appendix 7.3 Remediation Action Plan – City Bus Depot
Appendix 8.1 Sensitivity Test for Emission Rates
Appendix 8.2 Details for the Calculations of the Composite
Emission Factors for each Road Link
Appendix 8.3 Details for the Calculations of Portal Emission
Appendix 8.4 Details for the Calculation of Chimney Emission
Factor
Appendix 10.1 Breakdown of Population in Aberdeen Sewerage Catchment and Flow Build-up
Appendix 10.2 Breakdown of Estimated Sewage Flow from Ocean Park after Redevelopment
Appendix 10.3 Capacity Performance
of Existing Trunk Sewers in 2016 and Proposed Upgrading Works
Appendix 10.4 Estimated
Sewage Flow to Aberdeen Preliminary Treatment Works
Appendix 11.1 Location of
Ground Investigation undertaken at the Lowland
Appendix 11.3 Built
Heritage Catalogue
Appendix 11.4 Built Heritage
Plates
Volume IV – Appendices
Appendix 12.1 Detailed QRA Assessment
for Explosives Related Activities