1
Tables
of Assumptions
Table 1‑1 HAZID LNG Transit Route Segments

While
the HAZID reviewed the LNG’s carriers approach with respect to distinctive sections
of channel, the MQRA risk analysis will use the segment approach presented in
Table I-2 in order to provide the results of the analysis over a consistent
length (in this case 7.3 km segment length minimum, as required by HK
Government, a length consistent with prior risk studies at Ma Wan)..
Table 1‑2 LNG Transit Route Segments

Table 1‑3 LNG Carrier Operation Basis

Table 1‑4
Meteorological Data

Table 1‑5
|
Wind Direction |
Stability and Windspeed (m/s) Category |
|||
|
B - 2.9 |
F - 2.2 |
D - 3.3 |
D - 7 |
|
|
N |
0.75% |
0.45% |
1.24% |
8.91% |
|
NNE |
2.87% |
0.89% |
3.27% |
7.71% |
|
ENE |
4.08% |
0.50% |
2.12% |
20.78% |
|
E |
4.17% |
0.56% |
2.09% |
10.81% |
|
ESE |
1.85% |
0.27% |
1.06% |
1.31% |
|
SSE |
1.28% |
0.14% |
0.90% |
1.11% |
|
S |
1.08% |
0.18% |
0.80% |
1.89% |
|
SSW |
1.96% |
0.15% |
0.98% |
3.30% |
|
WSW |
1.12% |
0.16% |
0.77% |
4.42% |
|
W |
0.58% |
0.19% |
0.46% |
0.94% |
|
WNW |
0.28% |
0.19% |
0.40% |
0.21% |
|
NNW |
0.21% |
0.19% |
0.25% |
0.17% |
|
Total |
20.24% |
3.87% |
14.35% |
61.54% |
Table 1‑6
|
Wind Direction |
Stability and Windspeed (m/s) Category |
|||
|
B - 2.8 |
F - 2.1 |
D - 3.3 |
D - 7.0 |
|
|
N |
0.61% |
0.35% |
1.20% |
1.57% |
|
NNE |
1.20% |
0.82% |
2.22% |
4.38% |
|
ENE |
2.32% |
0.76% |
2.45% |
20.43% |
|
E |
1.52% |
0.37% |
1.28% |
12.67% |
|
ESE |
0.33% |
0.23% |
0.40% |
0.73% |
|
SSE |
0.24% |
0.25% |
0.33% |
0.19% |
|
S |
6.38% |
0.81% |
3.24% |
8.32% |
|
SSW |
3.25% |
0.56% |
1.62% |
4.16% |
|
WSW |
1.54% |
0.27% |
0.70% |
1.47% |
|
W |
1.46% |
0.17% |
0.52% |
0.87% |
|
WNW |
1.27% |
0.23% |
0.76% |
1.67% |
|
NNW |
0.71% |
0.29% |
0.93% |
1.97% |
|
Total |
20.83% |
5.09% |
15.64% |
58.44% |
Table 1‑7 Ching Pak House (CPH) Station
Meteorological Data (Daytime only)
|
Wind Direction |
Stability and Windspeed (m/s) Category |
|||
|
B - 3.1 |
F - 2.2 |
D - 3.3 |
D - 7.0 |
|
|
N |
0.97% |
0.67% |
0.95% |
0.51% |
|
NNE |
1.37% |
0.94% |
2.37% |
1.15% |
|
ENE |
1.96% |
0.99% |
3.89% |
3.81% |
|
E |
1.28% |
0.64% |
2.79% |
3.18% |
|
ESE |
2.35% |
0.85% |
4.39% |
9.61% |
|
SSE |
5.50% |
1.05% |
4.02% |
5.97% |
|
S |
7.44% |
0.77% |
4.28% |
5.46% |
|
SSW |
1.63% |
0.38% |
1.39% |
0.33% |
|
WSW |
0.58% |
0.14% |
0.30% |
0.03% |
|
W |
1.78% |
0.38% |
1.13% |
0.62% |
|
WNW |
1.26% |
0.71% |
1.77% |
0.41% |
|
NNW |
2.13% |
1.25% |
3.02% |
1.58% |
|
Total |
28.25% |
8.78% |
30.30% |
32.67% |
Table 1‑8 Tai Mo To Station
(TMT) Meteorological Data (Daytime only)
|
Wind Direction |
Stability and Windspeed (m/s) Category |
|||
|
B - 3.0 |
F - 2.3 |
D - 3.3 |
D - 7 |
|
|
N |
2.49% |
0.61% |
3.01% |
2.72% |
|
NNE |
1.90% |
1.05% |
2.69% |
1.87% |
|
ENE |
1.36% |
1.27% |
2.64% |
0.55% |
|
E |
2.26% |
1.21% |
3.49% |
4.63% |
|
ESE |
3.52% |
0.79% |
3.93% |
15.54% |
|
SSE |
1.89% |
0.65% |
1.94% |
4.41% |
|
S |
1.08% |
0.51% |
1.13% |
1.63% |
|
SSW |
1.40% |
0.30% |
1.01% |
1.74% |
|
WSW |
1.24% |
0.33% |
1.06% |
1.05% |
|
W |
4.20% |
0.36% |
1.51% |
1.06% |
|
WNW |
5.83% |
0.30% |
1.79% |
2.33% |
|
NNW |
1.26% |
0.35% |
1.23% |
0.86% |
|
Total |
28.44% |
7.72% |
25.44% |
38.39% |
Table 1‑9 Black
Point (Shau Chau Station)
Meteorological Data
|
Wind Direction |
Stability and Windspeed (m/s) Category |
||||||
|
Day |
Night |
||||||
|
B - 2.5 |
F - 2.0 |
D - 3.0 |
D - 7.0 |
F - 2.0 |
D - 3.0 |
D - 7.0 |
|
|
N |
2.48% |
0.92% |
1.37% |
13.75% |
2.08% |
0.89% |
9.93% |
|
NNE |
0.72% |
0.61% |
0.76% |
4.38% |
1.78% |
0.84% |
7.12% |
|
ENE |
0.55% |
0.61% |
0.59% |
0.55% |
1.89% |
0.76% |
0.95% |
|
E |
2.00% |
1.57% |
2.43% |
6.07% |
6.69% |
2.97% |
9.53% |
|
ESE |
1.68% |
0.90% |
1.32% |
15.98% |
3.82% |
1.84% |
20.08% |
|
SSE |
1.06% |
0.61% |
0.36% |
3.12% |
2.28% |
0.60% |
3.83% |
|
S |
2.43% |
0.71% |
0.65% |
3.64% |
1.81% |
0.74% |
3.88% |
|
SSW |
3.35% |
0.86% |
1.39% |
9.04% |
2.06% |
1.01% |
6.91% |
|
WSW |
0.07% |
0.16% |
0.05% |
0.02% |
0.23% |
0.02% |
0.04% |
|
W |
0.08% |
0.09% |
0.01% |
0.01% |
0.11% |
0.00% |
0.01% |
|
WNW |
1.58% |
0.35% |
0.21% |
0.07% |
0.62% |
0.04% |
0.05% |
|
NNW |
3.78% |
0.74% |
1.09% |
5.22% |
1.59% |
0.53% |
2.45% |
|
Total |
19.79% |
8.12% |
10.23% |
61.85% |
24.95% |
10.24% |
64.81% |
Table 1‑10
|
Wind Direction |
Stability and Windspeed (m/s) Category |
||||||
|
Day |
Night |
||||||
|
B - 2.5 |
F - 2.0 |
D - 3.0 |
D - 7.0 |
F - 2.0 |
D - 3.0 |
D - 7.0 |
|
|
N |
1.57% |
1.92% |
1.31% |
11.42% |
6.05% |
1.31% |
13.14% |
|
NNE |
1.60% |
0.94% |
1.34% |
4.21% |
3.02% |
1.20% |
4.36% |
|
ENE |
0.81% |
0.68% |
0.92% |
3.05% |
3.26% |
1.56% |
5.02% |
|
E |
0.87% |
0.65% |
1.39% |
14.86% |
3.57% |
2.19% |
19.48% |
|
ESE |
3.18% |
0.62% |
1.38% |
18.32% |
2.02% |
0.75% |
9.32% |
|
SSE |
2.10% |
0.44% |
0.93% |
2.92% |
1.21% |
0.36% |
2.29% |
|
S |
2.41% |
0.35% |
0.72% |
2.77% |
1.35% |
0.53% |
3.47% |
|
SSW |
1.78% |
0.27% |
0.67% |
4.97% |
1.40% |
0.58% |
4.13% |
|
WSW |
0.89% |
0.23% |
0.44% |
2.10% |
1.20% |
0.54% |
1.80% |
|
W |
0.40% |
0.27% |
0.28% |
0.79% |
1.27% |
0.41% |
0.83% |
|
WNW |
0.22% |
0.17% |
0.09% |
0.30% |
0.61% |
0.10% |
0.25% |
|
NNW |
0.47% |
0.22% |
0.21% |
1.57% |
0.65% |
0.18% |
0.59% |
|
Total |
16.30% |
6.74% |
9.68% |
67.28% |
25.63% |
9.70% |
64.67% |

Figure 1‑1
Wind Rose Data for Six Weather Stations Considered
Table 1‑11
ERM Time Period Classification
|
Time Period |
Definition |
Hours in a week |
Time Fraction |
|
Night |
7pm – 7am |
84 |
0.500 |
|
Peak |
Monday-Friday 7am-9am, 5pm-7pm Saturday 7am-9am, 1pm-3pm |
24 |
0.143 |
|
Weekday |
9am – 5pm (including Sat 9am-1pm) |
44 |
0.262 |
|
Weekend Day |
Saturday 3pm-7pm Sunday 7am-7pm |
16 |
0.095 |
|
|
Total |
168 |
|
Table 1‑12
|
PVS Zone |
Provided by |
ERM Analysis |
||
|
2011 |
2021 |
2011 |
2021 |
|
|
001 |
51,726 |
53,849 |
77,838 |
72,514 |
|
002 |
0 |
0 |
0 |
0 |
|
003 |
48,603 |
48,741 |
54,077 |
50,547 |
|
012 |
7,082 |
7,201 |
14,230 |
13,899 |
|
041 |
2,668 |
3,128 |
3,257 |
3,670 |
|
042 |
6,433 |
6,778 |
36,534 |
35,168 |
|
043 |
15,188 |
14,976 |
21,964 |
20,806 |
|
044 |
14,795 |
14,483 |
16,783 |
16,265 |
|
045 |
43,132 |
39,040 |
53,699 |
48,012 |
|
046 |
17,001 |
15,412 |
28,705 |
18,170 |
|
047 |
43,839 |
40,772 |
64,495 |
55,575 |
|
048 |
50,432 |
47,949 |
66,764 |
60,242 |
|
049 |
13,625 |
42,751 |
98,333 |
129,589 |
|
051 |
6,299 |
6,155 |
3,250 |
3,183 |
|
052 |
5,393 |
5,163 |
9,941 |
8,600 |
|
151 |
45,871 |
47,058 |
44,332 |
45,326 |
|
152 |
72,859 |
69,752 |
71,805 |
67,744 |
|
153 |
37,541 |
36,048 |
32,253 |
30,854 |
|
154 |
56,491 |
53,018 |
55,057 |
51,589 |
|
155 |
222 |
91 |
11,039 |
3,594 |
|
156 |
31,361 |
33,270 |
58,770 |
60,775 |
|
157 |
9,316 |
10,426 |
41,702 |
41,077 |
|
158 |
15,182 |
14,718 |
29,793 |
26,597 |
|
161 |
6,068 |
5,979 |
10,637 |
8,992 |
|
162 |
35,407 |
33,673 |
34,738 |
33,032 |
|
163 |
0 |
0 |
30 |
30 |
|
227 |
9 |
16 |
0 |
27 |
|
230 |
34,645 |
33,980 |
28,451 |
27,544 |
|
233 |
0 |
0 |
0 |
0 |
|
234 |
0 |
0 |
936 |
720 |
|
239 |
2 |
1 |
1,129 |
435 |
|
240 |
0 |
0 |
374 |
288 |
|
247 |
0 |
0 |
5 |
5 |
|
251 |
4,094 |
4,212 |
8,835 |
8,622 |
|
258 |
0 |
0 |
16,946 |
13,254 |
|
259 |
969 |
1,669 |
7,140 |
10,054 |
|
284 |
5 |
5 |
5 |
5 |
|
327 |
3 |
3 |
554 |
468 |
|
338 |
9,999 |
8,599 |
20,190 |
16,277 |
|
TOTAL |
686,260 |
698,916 |
1,024,592 |
983,547 |
Table 1‑13 Probabilities
of Weather Conditions
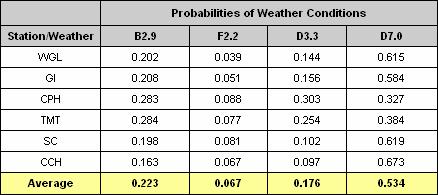
Table 1‑14 Calculation
of Cloud Height Weighted Average (m)
|
Distance Downwind (m): |
Cloud Height (m) |
Weighted Average (m) |
|||
|
B 2.9 |
F 2.2 |
D 3.3 |
D 7.0 |
||
|
50 |
16 |
15 |
15 |
13 |
14.2 |
|
100 |
15 |
13 |
13 |
12 |
12.9 |
|
150 |
22 |
13 |
13 |
13 |
15.0 |
|
200 |
32 |
24 |
22 |
19 |
22.8 |
|
250 |
33 |
30 |
32 |
24 |
27.8 |
|
300 |
30 |
30 |
35 |
28 |
29.8 |
|
350 |
24 |
26 |
35 |
31 |
29.8 |
|
400 |
18 |
23 |
33 |
32 |
28.4 |
|
450 |
11 |
20 |
32 |
33 |
27.0 |
|
500 |
0 |
18 |
30 |
33 |
24.1 |
|
550 |
0 |
17 |
28 |
32 |
23.1 |
|
600 |
0 |
16 |
26 |
31 |
22.2 |
|
650 |
0 |
15 |
24 |
30 |
21.2 |
|
700 |
0 |
14 |
21 |
29 |
20.1 |
|
750 |
0 |
13 |
18 |
28 |
19.0 |
|
800 |
0 |
12 |
12 |
26 |
16.8 |
|
850 |
0 |
10 |
4 |
24 |
14.2 |
|
900 |
0 |
0 |
8 |
22 |
13.1 |
|
950 |
0 |
0 |
6 |
19 |
11.2 |
|
1000 |
0 |
0 |
1 |
14 |
7.6 |
|
1050 |
0 |
0 |
0 |
7 |
7.0 |
|
1100 |
0 |
0 |
0 |
0 |
0.0 |
|
Average cloud height (m) |
22.3 |
18.2 |
20.4 |
23.8 |
22.5 |
Table 1‑15 Land Daytime Population Data
|
SAFETI
Indoor PVS sub-area |
2011
Day Indoor Population |
2021
Day Indoor Population |
SAFETI
Outdoor PVS sub-area |
2011
Day Outdoor Population |
2021
Day Outdoor Population |
|
001 |
13530 |
14547 |
001 |
6335 |
5365 |
|
002 |
0 |
0 |
002 |
0 |
0 |
|
003-a |
55 |
55 |
003 |
3940 |
3741 |
|
003-b |
8179 |
7551 |
|
|
|
|
012-1a |
909 |
988 |
012-1 |
1283 |
1268 |
|
012-1b |
19 |
19 |
|
|
|
|
012-1c |
0 |
0 |
|
|
|
|
012-1d |
2205 |
2161 |
|
|
|
|
012-1e |
23 |
24 |
|
|
|
|
012-1f |
1464 |
1448 |
|
|
|
|
012-1g |
0 |
0 |
|
|
|
|
012-2 |
0 |
0 |
012-2 |
0 |
0 |
|
012-3 |
0 |
0 |
012-3 |
29 |
30 |
|
041-1a |
423 |
438 |
041-1 |
350 |
371 |
|
041-1b |
124 |
111 |
|
|
|
|
041-2a |
0 |
0 |
041-2a |
0 |
0 |
|
041-2b |
3 |
3 |
041-2b |
30 |
35 |
|
041-2c |
14 |
16 |
041-2c |
41 |
48 |
|
041-2d |
1 |
1 |
041-2d |
0 |
0 |
|
042-a |
612 |
625 |
042 |
5001 |
4179 |
|
042-b |
0 |
0 |
|
|
|
|
042-c |
31 |
11 |
|
|
|
|
042-d |
0 |
0 |
|
|
|
|
042-e |
47 |
38 |
|
|
|
|
042-f |
868 |
815 |
|
|
|
|
042-g |
0 |
0 |
|
|
|
|
042-h |
0 |
0 |
|
|
|
|
042-i |
46 |
17 |
|
|
|
|
042-j |
58 |
20 |
|
|
|
|
042-k |
10 |
10 |
|
|
|
|
042-l |
96 |
101 |
|
|
|
|
042-m |
5364 |
4938 |
|
|
|
|
042-n |
200 |
159 |
|
|
|
|
042-o |
10 |
10 |
|
|
|
|
042-p |
5 |
5 |
|
|
|
|
042-q |
0 |
0 |
|
|
|
|
042-r |
8458 |
7696 |
|
|
|
|
042-s |
32 |
12 |
|
|
|
|
042-t |
0 |
0 |
|
|
|
|
042-u |
82 |
45 |
|
|
|
|
042-v |
8 |
3 |
|
|
|
|
043-a |
108 |
104 |
043 |
1694 |
1587 |
|
043-b |
668 |
640 |
|
|
|
|
043-c |
304 |
294 |
|
|
|
|
043-d |
20 |
20 |
|
|
|
|
043-e |
581 |
572 |
|
|
|
|
043-f |
405 |
399 |
|
|
|
|
043-g |
82 |
78 |
|
|
|
|
043-h |
561 |
553 |
|
|
|
|
043-i |
426 |
331 |
|
|
|
|
043-j |
771 |
585 |
|
|
|
|
043-k |
770 |
584 |
|
|
|
|
044-a |
207 |
156 |
044-a |
84 |
76 |
|
044-b |
69 |
52 |
044-b |
8 |
6 |
|
044-c |
2327 |
1702 |
044-c |
1362 |
818 |
|
044-d |
2 |
1 |
044-d |
0 |
0 |
|
044-e |
2 |
1 |
044-e |
0 |
0 |
|
044-f |
0 |
0 |
044-f |
0 |
0 |
|
044-g |
0 |
0 |
044-g |
0 |
0 |
|
044-h |
0 |
0 |
044-h |
0 |
0 |
|
044-i |
0 |
0 |
044-i |
0 |
0 |
|
045 |
9266 |
8229 |
045 |
4372 |
3898 |
|
046-a |
5164 |
3606 |
046 |
2175 |
1360 |
|
046-b |
259 |
181 |
|
|
|
|
046-c |
0 |
0 |
|
|
|
|
046-d |
3 |
3 |
|
|
|
|
047-1a |
11446 |
10381 |
047-1 |
5146 |
4439 |
|
047-1b |
164 |
127 |
|
|
|
|
047-2 |
385 |
276 |
047-2 |
43 |
31 |
|
048-1a |
7148 |
6437 |
048-1 |
5456 |
4966 |
|
048-1b |
32 |
30 |
|
|
|
|
048-1c |
5 |
5 |
|
|
|
|
048-1d |
1410 |
1051 |
|
|
|
|
048-2 |
45 |
42 |
048-2 |
52 |
49 |
|
049-1a |
14060 |
18859 |
049-1 |
10468 |
13506 |
|
049-1b |
6478 |
6478 |
|
|
|
|
049-1c |
153 |
390 |
|
|
|
|
049-1d |
10 |
32 |
|
|
|
|
049-2 |
0 |
0 |
049-2 |
0 |
0 |
|
049-3 |
0 |
0 |
049-3 |
0 |
0 |
|
049-4 |
8 |
8 |
049-4 |
14051 |
14414 |
|
051-1a |
527 |
516 |
051-1 |
340 |
333 |
|
051-1b |
403 |
395 |
|
|
|
|
051-2 |
0 |
0 |
051-2 |
88 |
86 |
|
052-1a |
1 |
1 |
052-1 |
837 |
789 |
|
052-1b |
0 |
0 |
|
|
|
|
052-1c |
0 |
0 |
|
|
|
|
052-1d |
0 |
0 |
|
|
|
|
052-1e |
9 |
9 |
|
|
|
|
052-1f |
0 |
0 |
|
|
|
|
052-1g |
1324 |
1165 |
|
|
|
|
052-1h |
0 |
0 |
|
|
|
|
052-2a |
3 |
3 |
052-2 |
119 |
101 |
|
052-2b |
187 |
177 |
|
|
|
|
052-2c |
2 |
2 |
|
|
|
|
052-2d |
3 |
3 |
|
|
|
|
052-2e |
0 |
0 |
|
|
|
|
052-2f |
0 |
0 |
|
|
|
|
052-3a |
2038 |
1501 |
052-3 |
0 |
0 |
|
052-3b |
174 |
128 |
|
|
|
|
052-3c |
174 |
128 |
|
|
|
|
052-4 |
20 |
19 |
052-4 |
23 |
22 |
|
151-a |
3608 |
3615 |
151 |
3718 |
3800 |
|
151-b |
253 |
260 |
|
|
|
|
151-c |
253 |
260 |
|
|
|
|
151-d |
506 |
519 |
|
|
|
|
152-a |
0 |
0 |
152 |
5763 |
5452 |
|
152-b |
283 |
228 |
|
|
|
|
152-c |
193 |
142 |
|
|
|
|
152-d |
730 |
537 |
|
|
|
|
152-e |
0 |
0 |
|
|
|
|
152-f |
0 |
0 |
|
|
|
|
152-g |
561 |
537 |
|
|
|
|
152-h |
0 |
0 |
|
|
|
|
152-i |
620 |
508 |
|
|
|
|
152-j |
11 |
10 |
|
|
|
|
152-k |
5 |
5 |
|
|
|
|
152-l |
977 |
893 |
|
|
|
|
152-m |
5173 |
4826 |
|
|
|
|
152-n |
1518 |
1410 |
|
|
|
|
152-o |
0 |
0 |
|
|
|
|
153-a |
4360 |
4129 |
153 |
2681 |
2557 |
|
153-b |
1126 |
1081 |
|
|
|
|
154-1a |
1184 |
1111 |
154-1 |
635 |
596 |
|
154-1b |
84 |
79 |
|
|
|
|
154-2a |
4501 |
4186 |
154-2 |
3892 |
3639 |
|
154-2b |
84 |
79 |
|
|
|
|
155-1a |
1429 |
471 |
155-1 |
1015 |
331 |
|
155-1b |
16 |
7 |
|
|
|
|
155-1c |
2 |
1 |
|
|
|
|
155-1d |
43 |
18 |
|
|
|
|
155-1e |
13 |
5 |
|
|
|
|
155-1f |
16 |
7 |
|
|
|
|
155-1g |
194 |
61 |
|
|
|
|
155-1h |
198 |
63 |
|
|
|
|
155-1i |
578 |
182 |
|
|
|
|
155-1j |
227 |
72 |
|
|
|
|
155-1k |
0 |
0 |
|
|
|
|
155-1l |
5 |
2 |
|
|
|
|
155-1m |
0 |
0 |
|
|
|
|
155-1n |
1452 |
465 |
|
|
|
|
155-1o |
65 |
21 |
|
|
|
|
155-1p |
0 |
0 |
|
|
|
|
155-1q |
5 |
2 |
|
|
|
|
155-1r |
11 |
4 |
|
|
|
|
155-1s |
5 |
2 |
|
|
|
|
155-1t |
177 |
61 |
|
|
|
|
155-1u |
5 |
2 |
|
|
|
|
155-1v |
973 |
308 |
|
|
|
|
155-2 |
1 |
0 |
155-2 |
1 |
0 |
|
156-1a |
51 |
52 |
156-1a |
26 |
27 |
|
156-1b |
168 |
147 |
156-1b |
90 |
81 |
|
156-1c |
211 |
223 |
156-1c |
23 |
24 |
|
156-1d |
4002 |
4100 |
156-1d |
1195 |
1184 |
|
156-1f |
703 |
603 |
156-1f |
187 |
175 |
|
156-1g |
949 |
784 |
156-1g |
200 |
171 |
|
156-1h |
1325 |
1298 |
156-1h |
639 |
651 |
|
156-1i |
172 |
141 |
156-1i |
21 |
17 |
|
156-1j |
70 |
71 |
156-1j |
56 |
57 |
|
156-1k |
2189 |
2903 |
156-1k |
1047 |
1140 |
|
156-1m |
131 |
133 |
156-1m |
111 |
110 |
|
156-1n |
243 |
249 |
156-1n |
167 |
170 |
|
156-1o |
527 |
446 |
156-1o |
240 |
226 |
|
156-1p |
3761 |
3529 |
156-1p |
1573 |
1590 |
|
156-1z |
22 |
22 |
156-1z |
23 |
24 |
|
156-2 |
93 |
94 |
156-2 |
104 |
107 |
|
156-3 |
215 |
180 |
156-3 |
40 |
36 |
|
156-4 |
215 |
180 |
156-4 |
40 |
36 |
|
156-5 |
193 |
157 |
156-5 |
21 |
17 |
|
156-6 |
0 |
0 |
156-6 |
3 |
2 |
|
156-7t |
0 |
0 |
156-7 |
0 |
0 |
|
156-8u |
0 |
0 |
156-8 |
3 |
2 |
|
157-1a |
3321 |
2911 |
157-1 |
3487 |
3020 |
|
157-1b |
193 |
166 |
|
|
|
|
157-1c |
6678 |
6633 |
|
|
|
|
157-1d |
0 |
0 |
|
|
|
|
157-1e |
5 |
5 |
|
|
|
|
157-1f |
2 |
1 |
|
|
|
|
157-1g |
215 |
172 |
|
|
|
|
157-1h |
227 |
178 |
|
|
|
|
157-1i |
2554 |
2254 |
|
|
|
|
157-1j |
2744 |
2401 |
|
|
|
|
157-1k |
7 |
4 |
|
|
|
|
157-1l |
0 |
0 |
|
|
|
|
157-2 |
0 |
0 |
157-2 |
0 |
0 |
|
158-a |
472 |
414 |
158 |
3037 |
2760 |
|
158-b |
33 |
32 |
|
|
|
|
158-c |
102 |
89 |
|
|
|
|
158-d |
217 |
167 |
|
|
|
|
158-e |
880 |
660 |
|
|
|
|
158-f |
3113 |
2930 |
|
|
|
|
158-g |
0 |
0 |
|
|
|
|
158-h |
5931 |
4788 |
|
|
|
|
158-i |
1 |
1 |
|
|
|
|
158-j |
1 |
1 |
|
|
|
|
161-a |
230 |
202 |
161 |
895 |
775 |
|
161-b |
0 |
0 |
|
|
|
|
161-c |
2347 |
1873 |
|
|
|
|
161-d |
5 |
5 |
|
|
|
|
161-e |
5 |
5 |
|
|
|
|
162 |
3231 |
3072 |
162 |
2886 |
2744 |
|
163-1 |
5 |
5 |
163-1 |
0 |
0 |
|
163-2 |
5 |
5 |
163-2 |
0 |
0 |
|
163-3 |
5 |
5 |
163-3 |
0 |
0 |
|
227-1a |
0 |
5 |
227-1 |
0 |
2 |
|
227-1b |
0 |
3 |
|
|
|
|
227-1c |
0 |
1 |
|
|
|
|
227-2 |
0 |
0 |
227-2 |
0 |
0 |
|
227-3 |
0 |
0 |
227-3 |
0 |
0 |
|
230 |
6138 |
5858 |
230 |
2163 |
2093 |
|
233-a |
0 |
0 |
233 |
0 |
0 |
|
233-b |
0 |
0 |
|
|
|
|
233-c |
0 |
0 |
|
|
|
|
234-a |
0 |
0 |
234 |
53 |
41 |
|
234-b |
257 |
197 |
|
|
|
|
234-c |
0 |
0 |
|
|
|
|
239-1 |
54 |
21 |
239-1 |
4 |
2 |
|
239-10 |
172 |
66 |
239-10 |
21 |
8 |
|
239-11 |
0 |
0 |
239-11 |
0 |
0 |
|
239-12 |
0 |
0 |
239-12 |
0 |
0 |
|
239-13 |
0 |
0 |
239-13 |
0 |
0 |
|
239-14 |
0 |
0 |
|
|
|
|
239-2 |
172 |
66 |
239-2 |
21 |
8 |
|
239-3 |
345 |
133 |
239-3 |
42 |
16 |
|
239-4 |
0 |
0 |
239-4 |
0 |
0 |
|
239-5 |
0 |
0 |
239-5 |
0 |
0 |
|
239-6 |
0 |
0 |
239-6 |
0 |
0 |
|
239-7 |
5 |
3 |
239-7 |
0 |
0 |
|
239-8 |
0 |
0 |
239-8 |
0 |
0 |
|
239-9 |
0 |
0 |
239-9 |
0 |
0 |
|
240 |
193 |
148 |
240 |
21 |
16 |
|
247-1 |
3 |
3 |
247-1 |
0 |
0 |
|
247-2a |
0 |
0 |
247-2 |
0 |
0 |
|
247-2b |
0 |
0 |
|
|
|
|
251-10 |
0 |
0 |
251-10 |
0 |
0 |
|
251-11 |
405 |
417 |
251-11 |
41 |
42 |
|
251-12 |
405 |
417 |
251-12 |
41 |
42 |
|
251-1a |
62 |
55 |
251-1 |
389 |
350 |
|
251-1b |
13 |
12 |
|
|
|
|
251-1c |
20 |
17 |
|
|
|
|
251-1d |
1 |
1 |
|
|
|
|
251-1e |
33 |
29 |
|
|
|
|
251-1f |
1 |
1 |
|
|
|
|
251-1g |
1 |
1 |
|
|
|
|
251-1h |
1 |
1 |
|
|
|
|
251-1i |
10 |
9 |
|
|
|
|
251-1j |
17 |
15 |
|
|
|
|
251-1k |
6 |
5 |
|
|
|
|
251-1l |
4 |
3 |
|
|
|
|
251-1m |
1 |
1 |
|
|
|
|
251-1n |
1337 |
1222 |
|
|
|
|
251-1o |
147 |
125 |
|
|
|
|
251-1p |
6 |
5 |
|
|
|
|
251-1q |
4 |
3 |
|
|
|
|
251-1r |
2 |
2 |
|
|
|
|
251-1s |
0 |
0 |
|
|
|
|
251-2 |
7 |
6 |
251-2 |
2 |
2 |
|
251-3 |
1 |
1 |
251-3 |
0 |
0 |
|
251-4a |
1 |
1 |
251-4 |
11 |
10 |
|
251-4b |
6 |
5 |
|
|
|
|
251-4c |
24 |
21 |
|
|
|
|
251-4d |
6 |
5 |
|
|
|
|
251-4e |
5 |
4 |
|
|
|
|
251-5a |
0 |
0 |
251-5 |
11 |
9 |
|
251-5b |
21 |
18 |
|
|
|
|
251-5c |
1 |
1 |
|
|
|
|
251-5d |
39 |
38 |
|
|
|
|
251-5e |
4 |
3 |
|
|
|
|
251-6 |
47 |
37 |
251-6 |
5 |
4 |
|
251-7a |
0 |
0 |
251-7 |
86 |
68 |
|
251-7b |
193 |
152 |
|
|
|
|
251-7c |
4 |
4 |
|
|
|
|
251-7d |
582 |
462 |
|
|
|
|
251-8a |
0 |
0 |
251-8 |
197 |
199 |
|
251-8b |
0 |
0 |
|
|
|
|
251-8c |
32 |
28 |
|
|
|
|
251-8d |
21 |
18 |
|
|
|
|
251-8e |
28 |
25 |
|
|
|
|
251-8f |
0 |
0 |
|
|
|
|
251-9 |
0 |
0 |
251-9 |
0 |
0 |
|
258-a |
241 |
186 |
258 |
986 |
769 |
|
258-b |
178 |
138 |
|
|
|
|
258-c |
5 |
5 |
|
|
|
|
258-d |
0 |
0 |
|
|
|
|
258-e |
0 |
0 |
|
|
|
|
258-f |
0 |
0 |
|
|
|
|
258-g |
11 |
11 |
|
|
|
|
258-h |
7254 |
5688 |
|
|
|
|
258-i |
0 |
0 |
|
|
|
|
258-j |
193 |
148 |
|
|
|
|
258-k |
385 |
296 |
|
|
|
|
258-l |
193 |
148 |
|
|
|
|
258-m |
193 |
148 |
|
|
|
|
258-n |
193 |
148 |
|
|
|
|
259-1a |
2965 |
3967 |
259-1 |
715 |
1116 |
|
259-1b |
0 |
0 |
|
|
|
|
259-1c |
11 |
11 |
|
|
|
|
259-2a |
6 |
6 |
259-2 |
0 |
0 |
|
259-2b |
6 |
6 |
|
|
|
|
259-2c |
6 |
6 |
|
|
|
|
259-2d |
26 |
26 |
|
|
|
|
259-3 |
3 |
3 |
259-3 |
0 |
0 |
|
259-4a |
100 |
100 |
259-4 |
0 |
0 |
|
259-4b |
6 |
6 |
|
|
|
|
259-5 |
3 |
3 |
259-5 |
0 |
0 |
|
259-6 |
3 |
3 |
259-6 |
0 |
0 |
|
259-7a |
37 |
64 |
259-7 |
0 |
0 |
|
259-7b |
11 |
18 |
|
|
|
|
259-7c |
5 |
9 |
|
|
|
|
259-7d |
5 |
9 |
|
|
|
|
284-1 |
3 |
3 |
284-1 |
0 |
0 |
|
284-2 |
0 |
0 |
284-2 |
0 |
0 |
|
327-1a |
48 |
48 |
327-1 |
0 |
0 |
|
327-1b |
5 |
5 |
|
|
|
|
327-1c |
42 |
42 |
|
|
|
|
327-2a |
0 |
0 |
327-2 |
0 |
0 |
|
327-2b |
0 |
0 |
|
|
|
|
327-3 |
193 |
148 |
327-3 |
21 |
16 |
|
327-4c |
0 |
0 |
327-4 |
0 |
0 |
|
327-4d |
0 |
0 |
|
|
|
|
338-1a |
12 |
10 |
338-1 |
1509 |
1184 |
|
338-1b |
1 |
1 |
|
|
|
|
338-1c |
5372 |
4214 |
|
|
|
|
338-1d |
1 |
1 |
|
|
|
|
338-1e |
5 |
4 |
|
|
|
|
338-1f |
3 |
2 |
|
|
|
|
338-1g |
0 |
0 |
|
|
|
|
338-1h |
5 |
4 |
|
|
|
|
338-1i |
6 |
5 |
|
|
|
|
338-1j |
0 |
0 |
|
|
|
|
338-2 |
578 |
382 |
338-2 |
64 |
42 |
|
338-3 |
34 |
23 |
338-3 |
4 |
3 |
|
FD10 |
|
4 |
FD10 |
|
5 |
|
FD14 |
|
41 |
FD14 |
|
48 |
|
FD15 |
|
36 |
FD15 |
|
41 |
|
FD2 |
|
90 |
FD2 |
|
105 |
|
FD23 |
|
180 |
FD23 |
|
209 |
|
FD24 |
|
59 |
FD24 |
|
68 |
|
FD25 |
|
12 |
FD25 |
|
14 |
|
FD26 |
|
23 |
FD26 |
|
27 |
|
FD27 |
|
2 |
FD27 |
|
3 |
|
FD28 |
|
1 |
FD28 |
|
1 |
|
FD29 |
|
1 |
FD29 |
|
1 |
|
FD3 |
|
159 |
FD3 |
|
184 |
|
FD30 |
|
356 |
FD30 |
|
412 |
|
FD4 |
|
71 |
FD4 |
|
82 |
|
FD5 |
|
29 |
FD5 |
|
34 |
|
FD6 |
|
94 |
FD6 |
|
109 |
|
FD7 |
|
345 |
FD7 |
|
400 |
Table 1‑16 Road
Traffic Population Data
|
Highway |
2011 & 2021 Population |
|
|
1448 |
|
Cheung
Tsing Tunnel |
448 |
|
Lantau
Link |
1729 |
|
|
984 |
|
Tsing Long
Highway |
2929 |
|
|
8891 |
Table 1‑17 Marine Population Vessel Classes
|
Vessel Class |
Assumed Velocity (m/s) |
Assumed Population |
Exposure Factor |
|
Small Craft & Fast Launches |
6 |
5 |
0.9 |
|
Fast Ferries |
15 |
180 |
0.3 |
|
Tug & Tow |
2.5 |
5 |
0.9 |
|
River trade vessels |
6 |
5 |
0.3 |
|
Ocean-going vessels |
6 |
21 |
0.1 |
Table 1‑18 Fast Ferry Population Data

Table 1‑19 Marine
Population Data for Underway Vessels Provided in the MIA Report
(adjusted for Fast Ferry Populations)
|
Y |
X |
SAFETI Marine Population Area |
2011
Population at Risk (per km2) |
2021
Population at Risk (per km2) |
|
D |
1 |
M1-1 |
0 |
0 |
|
D |
2 |
M1-2 |
0.08 |
0.10 |
|
D |
3 |
M1-3 |
0.08 |
0.10 |
|
E |
1 |
M2-1 |
0.03 |
0.04 |
|
E |
2 |
M2-2 |
1.86 |
2.17 |
|
E |
3 |
M2-3 |
8.03 |
8.98 |
|
E |
4 |
M2-4 |
0.39 |
0.43 |
|
F |
1 |
M3-1 |
0.10 |
0.11 |
|
F |
2 |
M3-2 |
0.30 |
0.33 |
|
F |
3 |
M3-3 |
7.43 |
8.45 |
|
F |
4 |
M3-4 |
3.32 |
3.68 |
|
G |
1 |
M4-1 |
0.10 |
0.11 |
|
G |
2 |
M4-2 |
0.19 |
0.21 |
|
G |
3 |
M4-3 |
0.72 |
0.84 |
|
G |
4 |
M4-4 |
7.41 |
8.34 |
|
G |
5 |
M4-5 |
6.98 |
7.86 |
|
G |
6 |
M4-6 |
5.11 |
5.76 |
|
G |
7 |
M4-7 |
3.70 |
4.19 |
|
G |
8 |
M4-8 |
3.14 |
3.59 |
|
G |
9 |
M4-9 |
3.26 |
3.77 |
|
H |
1 |
M5-1 |
0.02 |
0.03 |
|
H |
2 |
M5-2 |
0.02 |
0.03 |
|
H |
3 |
M5-3 |
3.08 |
3.62 |
|
H |
4 |
M5-4 |
5.14 |
6.04 |
|
H |
5 |
M5-5 |
10.65 |
12.42 |
|
H |
6 |
M5-6 |
0.74 |
0.87 |
|
H |
7 |
M5-7 |
1.61 |
1.86 |
|
H |
8 |
M5-8 |
2.33 |
2.66 |
|
H |
9 |
M5-9 |
8.96 |
10.35 |
|
H |
10 |
M5-10 |
3.55 |
4.05 |
|
I |
1 |
M6-1 |
0.85 |
0.97 |
|
I |
2 |
M6-2 |
3.11 |
3.66 |
|
I |
3 |
M6-3 |
5.59 |
6.59 |
|
I |
5 |
M6-5 |
5.90 |
6.80 |
|
I |
7 |
M6-7 |
0.48 |
0.57 |
|
I |
8 |
M6-8 |
2.92 |
3.43 |
|
I |
9 |
M6-9 |
7.68 |
8.94 |
|
I |
10 |
M6-10 |
21.87 |
25.47 |
|
I |
12 |
M6-12 |
0.31 |
0.34 |
|
J |
1 |
M7-1 |
0.73 |
0.84 |
|
J |
2 |
M7-2 |
5.53 |
6.52 |
|
J |
3 |
M7-3 |
0.03 |
0.04 |
|
J |
7 |
M7-7 |
0.60 |
0.70 |
|
J |
8 |
M7-8 |
3.85 |
4.51 |
|
J |
9 |
M7-9 |
12.78 |
15.02 |
|
J |
10 |
M7-10 |
3.91 |
4.42 |
|
K |
1 |
M8-1 |
3.09 |
3.63 |
|
K |
7 |
M8-7 |
5.54 |
6.52 |
|
K |
8 |
M8-8 |
7.21 |
8.48 |
|
K |
9 |
M8-9 |
0.71 |
0.78 |
|
K |
10 |
M8-10 |
1.54 |
1.76 |
|
K |
11 |
M8-11 |
1.91 |
2.16 |
|
K |
12 |
M8-12 |
0.45 |
0.49 |
|
L |
1 |
M9-1 |
9.62 |
11.24 |
|
L |
2 |
M9-2 |
5.25 |
6.13 |
|
L |
3 |
M9-3 |
5.82 |
6.83 |
|
L |
4 |
M9-4 |
6.91 |
8.11 |
|
L |
5 |
M9-5 |
5.95 |
6.97 |
|
L |
6 |
M9-6 |
5.95 |
6.97 |
|
L |
7 |
M9-7 |
5.17 |
6.03 |
|
L |
8 |
M9-8 |
0.13 |
0.14 |
|
L |
9 |
M9-9 |
0.61 |
0.67 |
|
L |
10 |
M9-10 |
0.03 |
0.04 |
|
L |
11 |
M9-11 |
1.15 |
1.34 |
|
L |
12 |
M9-12 |
2.19 |
2.51 |
|
L |
13 |
M9-13 |
0.32 |
0.35 |
|
M |
1 |
M10-1 |
0.30 |
0.33 |
|
M |
2 |
M10-2 |
0.82 |
0.90 |
|
M |
3 |
M10-3 |
0.47 |
0.52 |
|
M |
4 |
M10-4 |
0.03 |
0.04 |
|
M |
5 |
M10-5 |
0.03 |
0.04 |
|
M |
6 |
M10-6 |
0.03 |
0.04 |
|
M |
7 |
M10-7 |
0.58 |
0.64 |
|
M |
8 |
M10-8 |
0.58 |
0.63 |
|
M |
9 |
M10-9 |
0.25 |
0.27 |
|
M |
10 |
M10-10 |
0.18 |
0.20 |
|
M |
11 |
M10-11 |
0.18 |
0.19 |
|
M |
12 |
M10-12 |
0.76 |
0.87 |
|
M |
13 |
M10-13 |
1.40 |
1.61 |
|
M |
14 |
M10-14 |
0.06 |
0.07 |
Table
1‑20 Daytime
and Nighttime Marine Population Data for Underway Vessels
|
SAFETI Marine Population Area |
2011
Daytime Population at Risk (per km2) |
2011
Nighttime Population at Risk (per km2) |
2021
Daytime Population at Risk (per km2) |
2021
Nighttime Population at Risk (per km2) |
|
M1-1 |
0 |
0 |
0 |
0 |
|
M1-2 |
0.12 |
0.04 |
0.15 |
0.05 |
|
M1-3 |
0.12 |
0.04 |
0.15 |
0.05 |
|
M2-1 |
0.05 |
0.02 |
0.05 |
0.02 |
|
M2-2 |
2.80 |
0.93 |
3.25 |
1.08 |
|
M2-3 |
12.05 |
4.02 |
13.47 |
4.49 |
|
M2-4 |
0.59 |
0.20 |
0.65 |
0.22 |
|
M3-1 |
0.15 |
0.05 |
0.17 |
0.06 |
|
M3-2 |
0.45 |
0.15 |
0.49 |
0.16 |
|
M3-3 |
11.14 |
3.71 |
12.67 |
4.22 |
|
M3-4 |
4.98 |
1.66 |
5.52 |
1.84 |
|
M4-1 |
0.14 |
0.05 |
0.16 |
0.05 |
|
M4-2 |
0.28 |
0.09 |
0.31 |
0.10 |
|
M4-3 |
1.08 |
0.36 |
1.26 |
0.42 |
|
M4-4 |
11.12 |
3.71 |
12.51 |
4.17 |
|
M4-5 |
10.46 |
3.49 |
11.79 |
3.93 |
|
M4-6 |
7.66 |
2.55 |
8.64 |
2.88 |
|
M4-7 |
5.55 |
1.85 |
6.29 |
2.10 |
|
M4-8 |
4.71 |
1.57 |
5.39 |
1.80 |
|
M4-9 |
4.88 |
1.63 |
5.66 |
1.89 |
|
M5-1 |
0.04 |
0.01 |
0.04 |
0.01 |
|
M5-2 |
0.04 |
0.01 |
0.04 |
0.01 |
|
M5-3 |
4.62 |
1.54 |
5.43 |
1.81 |
|
M5-4 |
7.70 |
2.57 |
9.06 |
3.02 |
|
M5-5 |
15.97 |
5.32 |
18.64 |
6.21 |
|
M5-6 |
1.12 |
0.37 |
1.31 |
0.44 |
|
M5-7 |
2.41 |
0.80 |
2.79 |
0.93 |
|
M5-8 |
3.50 |
1.17 |
3.98 |
1.33 |
|
M5-9 |
13.45 |
4.48 |
15.52 |
5.17 |
|
M5-10 |
5.32 |
1.77 |
6.07 |
2.02 |
|
M6-1 |
1.28 |
0.43 |
1.46 |
0.49 |
|
M6-2 |
4.66 |
1.55 |
5.48 |
1.83 |
|
M6-3 |
8.39 |
2.80 |
9.88 |
3.29 |
|
M6-5 |
8.86 |
2.95 |
10.20 |
3.40 |
|
M6-7 |
0.72 |
0.24 |
0.86 |
0.29 |
|
M6-8 |
4.39 |
1.46 |
5.14 |
1.71 |
|
M6-9 |
11.52 |
3.84 |
13.41 |
4.47 |
|
M6-10 |
32.80 |
10.93 |
38.21 |
12.74 |
|
M6-12 |
0.47 |
0.16 |
0.51 |
0.17 |
|
M7-1 |
1.10 |
0.37 |
1.26 |
0.42 |
|
M7-2 |
8.29 |
2.76 |
9.77 |
3.26 |
|
M7-3 |
0.05 |
0.02 |
0.05 |
0.02 |
|
M7-7 |
0.90 |
0.30 |
1.05 |
0.35 |
|
M7-8 |
5.77 |
1.92 |
6.76 |
2.25 |
|
M7-9 |
19.17 |
6.39 |
22.53 |
7.51 |
|
M7-10 |
5.86 |
1.95 |
6.63 |
2.21 |
|
M8-1 |
4.63 |
1.54 |
5.45 |
1.82 |
|
M8-7 |
8.31 |
2.77 |
9.79 |
3.26 |
|
M8-8 |
10.81 |
3.60 |
12.72 |
4.24 |
|
M8-9 |
1.06 |
0.35 |
1.16 |
0.39 |
|
M8-10 |
2.32 |
0.77 |
2.63 |
0.88 |
|
M8-11 |
2.87 |
0.96 |
3.25 |
1.08 |
|
M8-12 |
0.67 |
0.22 |
0.74 |
0.25 |
|
M9-1 |
14.43 |
4.81 |
16.87 |
5.62 |
|
M9-2 |
7.88 |
2.63 |
9.19 |
3.06 |
|
M9-3 |
8.73 |
2.91 |
10.25 |
3.42 |
|
M9-4 |
10.36 |
3.45 |
12.17 |
4.06 |
|
M9-5 |
8.92 |
2.97 |
10.46 |
3.49 |
|
M9-6 |
8.92 |
2.97 |
10.46 |
3.49 |
|
M9-7 |
7.75 |
2.58 |
9.05 |
3.02 |
|
M9-8 |
0.19 |
0.06 |
0.21 |
0.07 |
|
M9-9 |
0.91 |
0.30 |
1.00 |
0.33 |
|
M9-10 |
0.05 |
0.02 |
0.05 |
0.02 |
|
M9-11 |
1.73 |
0.58 |
2.01 |
0.67 |
|
M9-12 |
3.29 |
1.10 |
3.76 |
1.25 |
|
M9-13 |
0.48 |
0.16 |
0.53 |
0.18 |
|
M10-1 |
0.45 |
0.15 |
0.49 |
0.16 |
|
M10-2 |
1.24 |
0.41 |
1.36 |
0.45 |
|
M10-3 |
0.71 |
0.24 |
0.78 |
0.26 |
|
M10-4 |
0.05 |
0.02 |
0.05 |
0.02 |
|
M10-5 |
0.05 |
0.02 |
0.05 |
0.02 |
|
M10-6 |
0.05 |
0.02 |
0.05 |
0.02 |
|
M10-7 |
0.87 |
0.29 |
0.95 |
0.32 |
|
M10-8 |
0.86 |
0.29 |
0.95 |
0.32 |
|
M10-9 |
0.37 |
0.12 |
0.41 |
0.14 |
|
M10-10 |
0.27 |
0.09 |
0.30 |
0.10 |
|
M10-11 |
0.26 |
0.09 |
0.29 |
0.10 |
|
M10-12 |
1.14 |
0.38 |
1.31 |
0.44 |
|
M10-13 |
2.09 |
0.70 |
2.41 |
0.80 |
|
M10-14 |
0.10 |
0.03 |
0.11 |
0.04 |
Table 1‑21 Marine
Population Data for Stationary Vessels Provided in the MIA Report
|
Y |
X |
SAFETI Marine Population Area |
2011
Population at Risk (per km2) |
2021
Population at Risk (per km2) |
|
F |
2 |
M3-2 |
6.08 |
6.29 |
|
G |
3 |
M4-3 |
37.79 |
41.18 |
|
G |
4 |
M4-4 |
10.85 |
11.79 |
|
G |
5 |
M4-5 |
28.20 |
27.44 |
|
H |
7 |
M5-7 |
6.38 |
7.28 |
|
H |
8 |
M5-8 |
37.55 |
39.70 |
|
I |
7 |
M6-7 |
2.95 |
3.16 |
|
I |
8 |
M6-8 |
40.03 |
42.71 |
|
I |
9 |
M6-9 |
35.76 |
38.30 |
|
J |
7 |
M7-7 |
3.38 |
3.64 |
|
J |
8 |
M7-8 |
3.38 |
3.64 |
|
J |
9 |
M7-9 |
10.58 |
11.28 |
|
K |
8 |
M8-8 |
13.73 |
14.69 |
|
K |
9 |
M8-9 |
11.61 |
12.13 |
|
K |
10 |
M8-10 |
76.67 |
71.10 |
Table 1‑22 Daytime
and Nighttime Marine Population Data for Stationary Vessels
|
SAFETI Marine Population Area |
2011
Daytime Population at Risk (per km2) |
2011
Nighttime Population at Risk (per km2) |
2021
Daytime Population at Risk (per km2) |
2021
Nighttime Population at Risk (per km2) |
|
M3-2 |
6.08 |
1.82 |
6.29 |
1.89 |
|
M4-3 |
37.79 |
11.34 |
41.18 |
12.36 |
|
M4-4 |
10.85 |
3.25 |
11.79 |
3.54 |
|
M4-5 |
28.20 |
8.46 |
27.44 |
8.23 |
|
M5-7 |
6.38 |
1.91 |
7.28 |
2.19 |
|
M5-8 |
37.55 |
11.26 |
39.70 |
11.91 |
|
M6-7 |
2.95 |
0.89 |
3.16 |
0.95 |
|
M6-8 |
40.03 |
12.01 |
42.71 |
12.81 |
|
M6-9 |
35.76 |
10.73 |
38.30 |
11.49 |
|
M7-7 |
3.38 |
1.01 |
3.64 |
1.09 |
|
M7-8 |
3.38 |
1.01 |
3.64 |
1.09 |
|
M7-9 |
10.58 |
3.17 |
11.28 |
3.38 |
|
M8-8 |
13.73 |
4.12 |
14.69 |
4.41 |
|
M8-9 |
11.61 |
3.48 |
12.13 |
3.64 |
|
M8-10 |
76.67 |
23.00 |
71.10 |
21.33 |
Table 1‑23 Total Marine Population Data without Fast
Ferries during Daytime

Note: It is assumed that the population is 100% outdoors.
Table 1‑24
Fast Ferry Probabilities of Occurrence, 2011 Large Carrier

Table 1‑25 Final Fast Ferry Point
Location Probability of Occurrence, 2011 Large Carrier

Table
1‑26

Table 1‑27 Total
Marine Population Data without Fast Ferries during Nighttime

Table 1‑28 Marine Vessel Traffic Classes

Table 1‑29 Daytime Marine Ignition Source Data
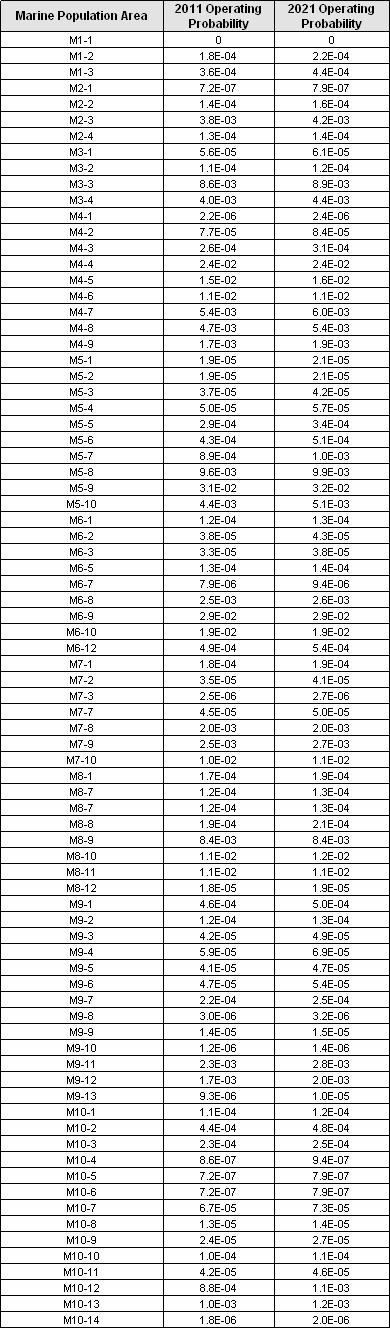
Table 1‑30 Night Marine Ignition Source Data

Table 1‑31 Road
Traffic Ignition Sources

Table 1‑32 MQRA Scenarios

Note: Although the Sandia Report suggests that grounding events do not
pose public risk and there have been no existing loss of containment for
grounding, this report includes grounding events in the analysis. The most credible scenario in the
analysis was determined to be a small hole in the cargo tank (250mm) as the
result of grounding event.
Table 1‑33 Modeled Scenarios

Table 1‑34
Study LNG Carrier Dimensions

Table 1‑35
Release Scenario Model Input


Figure 1‑2 Pool Fire Flame Shape
Note: The height of the fire plume is listed
as a “fundamental assumption” in the Study Brief, section 3.7.9.4. This data is
not an input assumption or parameter in SAFETI but instead is a data point
generated as a result of the consequence modeling. The height of the fire
plume, and the resulting radiation from it, is then considered in SAFETI when
estimating the consequence impact and hazard to life in terms of individual
risk and the EIAO FN curve.
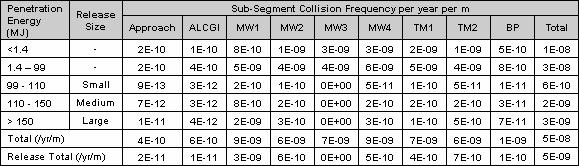
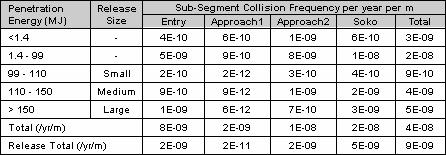
Table 1‑36 Black Point Route Collision Frequency Data
– 2011C – Large Carrier (215,000
m3)

Table 1‑37 Black Point Route Collision Frequency Data
– 2011C – Small Carrier (145,000
m3)
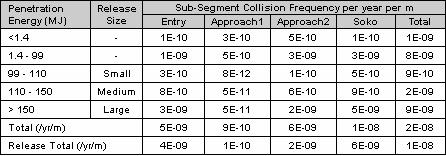
Table
1‑38 South Soko Route Collision Frequency Data –
2011C – Large Carrier (215,000
m3)
Table
1‑39 South Soko Route Collision Frequency Data –
2011C – Small Carrier (145,000
m3)

Table 1‑40 Black Point Route Collision Frequency Data
– 2021E – Large Carrier (215,000
m3)

Table
1‑41 Black Point Route Collision Frequency Data –
2021E – Small Carrier (145,000
m3)

Table 1‑42 South Soko Route Collision Frequency Data –
2021E – Large Carrier (215,000
m3)
Table
1‑43 South Soko Route Collision Frequency Data –
2021E – Small Carrier (145,000
m3)

Table 1‑44 Black Point Route Collision Frequency Data
– 2021F – Large Carrier (215,000
m3)

Table
1‑45 Black Point Route Collision Frequency Data
– 2021F – Small Carrier (145,000
m3)
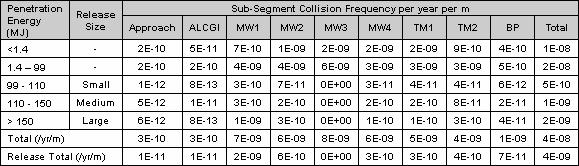
Table 1‑46 South Soko Route Collision Frequency Data –
2021F – Large Carrier (215,000
m3)

Table
1‑47 South Soko Route Collision Frequency Data –
2021F – Small Carrier (145,000
m3)

A variable factor ranging from 0 (for bow-on collisions) to 0.65 (for
beam-on collisions) was included in the release frequencies presented in the above
tables to account for the exposure of the cargo tanks in the event of a
collision.
Table 1‑48
Black Point Route Relation of Frequency and Risk Analysis Segmentations

Table 1‑49
South Soko Route Relation of Frequency and Risk Analysis Segmentations

The following table presents the grounding analysis performed by BMT, developed
from a review of historic local grounding incidents for vessels of 200m length
or greater.
Table 1‑50 Route Node Grounding Frequencies

Table
1‑51 Route Node Grounding Release Frequencies –
Large Carrier (215,000
m3)

Table 1‑52 Route Node Grounding Release Frequencies –
Small Carrier (145,000
m3)

Table 1‑53 Black Point Grounding Release Frequency
Input – Large Carrier (215,000
m3)

Table 1‑54 Black Point Grounding Release Frequency
Input – Small Carrier (145,000
m3)

Table 1‑55

Table 1‑56

BMT also performed an analysis
to evaluate the risk of a passing vessel colliding with the carrier, while the
carrier is at berth at Black Point or
Table 1‑57 SAFETI Parameters for 2011C Case
