1 Introduction
Castle Peak Power Company Limited (CAPCO), a
joint venture between CLP Power Hong Kong Limited (CLP) and ExxonMobil
Energy Limited (EMEL), is planning to develop a Liquefied Natural Gas (LNG)
Receiving Terminal in Hong Kong. Two sites are under consideration: a site at
Black Point and one at South Soko.
Det Norske Veritas (DNV) has been
commissioned to carry out a Marine Quantitative Risk Assessment (MQRA) for the
LNG carrier transit associated with both options, as part of the requirements
of the Environmental Impact Assessment (EIA) stipulated by the Government of
Hong Kong.
2 Study Approach
A Marine Quantitative Risk Assessment (MQRA) has been conducted for Hong Kong to determine the risks to land-based and marine populations along the carrier routes. This analysis is based upon site specific assumptions and the methodology has been developed to comply with the requirements of the Hong Kong government. These risks are then compared to the Hong Kong EIA Ordinance (EIAO) risk criteria. The Hong Kong EIAO risk criteria exist for both Societal Risk and Individual Risk as presented in Annex 4 of the Technical Memorandum on Environmental Impact Assessment Process (ref. 01). The Hong Kong EIAO Societal Risk criteria are illustrated in Figure 2‑1, displaying the Acceptable, ALARP (As Low As Reasonably Practicable), and Unacceptable criteria regions. The Hong Kong EIAO Individual Risk criterion is 1x10⁻⁵ per year, for the maximum offsite individual risk. This MQRA is conducted in compliance with the Study Brief entitled "ESB-126/2005 Liquefied Natural Gas (LNG) Receiving Terminal and Associated Facilities” dated June 2005 (ref. 02).
Figure 2‑1 Hong Kong EIA Ordinance Societal Risk Criteria
The MQRA methodology involved four main components – scenario identification, release frequency analysis, consequence analysis and risk assessment.
The purpose of this phase was to determine the scenarios that should be included in the MQRA analysis. A Hazard Identification (HAZID) workshop was facilitated and recorded by DNV on 14 November 2005 to develop the list of potential scenarios. Representatives from CAPCO, BMT Asia Pacific Limited and Hong Kong pilots participated in the HAZID process. The team strove to identify all potential hazardous scenarios based on the transit route and the Hong Kong environment.
These potential accident scenarios were grouped into hazard categories and further evaluated to identify which scenarios could credibly lead to a release of the LNG cargo. It is the potential loss of cargo containment and subsequent consequences that pose a potential hazard to life. These “credible scenarios” were then carried forward into the MQRA.
"Credible scenarios", as hereinafter
referred to, shall include all scenarios that were determined to potentially
result in an off-site fatality and have a probability greater than or equal to
1x10⁻⁹ per year. When a scenario is referred to as
"non-credible" or "not credible", this shall hereinafter
mean that the scenario would either result in no fatalities, or the probability
was determined to be less than 1x10⁻⁹ per year, and therefore falls
below the lower bound of the EIAO and Annex 4 of the TM criteria. The credible accidental scenarios that could
lead to potential LNG cargo loss are grounding and collision of the LNG
carrier.
The risks from potential intentional acts
were analyzed through a Security Assessment that was conducted in April 2006
(ref. 03). The approach of conducting this Security Assessment
separate from the MQRA was supported by the Hong Kong Security Bureau. It
followed a recognized risk assessment methodology, included a multi-disciplinary
team, and addressed the risk in a qualitative manner. A quantitative assessment approach was
not considered viable given that the frequency of intentional act scenarios
could not be defensibly quantified.
The Security Assessment results indicated no intentional acts led to
risk levels that would compromise the project. Potential risk mitigation measures were
identified and will be progressed as the Project details are developed.
Review of the LNG carrier hazard zone impact on the Black Point Power Plant, Castle Peak Power Station in Tap Shek Kok, Permanent Aviation Fuel facility, Eco Park and future CRC LPG terminal show that with the carrier transiting its normal route, the hazard zones do not impact these areas.
2.2
Release
Frequency Analysis
Hong Kong harbor marine traffic simulations were conducted by BMT to predict the collision and grounding frequencies for the LNG carrier along the routes and at the berths at Black Point and South Soko.
The traffic and navigation environment of the LNG carriers during approaches impacts the key hazards of collision and grounding risk. As such they are very site specific, and related to the particular characteristics of the waterways within Hong Kong. For this reason, it was inappropriate to develop the risks on the basis of world-wide data and these risks have not been explicitly examined, except as they were specifically relevant to this particular study. Three separate approaches were taken:
· Collision Risk – marine traffic simulation
· Grounding Risk – review of local historic incidence for large vessel transits.
· Collision at Berth - review of local historic incidence for grounding of large vessel transits and its extension to address berth vulnerability.
Collision risk was developed through the application of BMT’s “DYMITRI” (Dynamic Marine Traffic Simulation) risk model. The model has been extensively applied in Hong Kong, Singapore and Korea, and represents each vessel as an autonomous agent within the model, constantly scanning the water space ahead of its intended course. Should another vessel be navigating on a course with the potential to cause a collision, avoidance maneuver is taken. The number and nature of avoiding actions have been identified as directly proportional to the frequency of collision incidents.
This model was developed from a foundation of vessel route structures and speed profiles developed during an extensive investigation for Marine Department conducted in 2003 (http://www.mardep.gov.hk/en/publication/pdf/marars.pdf). Traffic levels were benchmarked for 2003 levels and forecast to 2011 and 2021 on the basis of anticipated port developments and cargo flows, and new vessel routes. Marine traffic activity associated with vessels of length (LOA) greater than 75m were represented in the model, having identified that smaller vessels than that would not be able to generate sufficient collision energy to hazard a cargo release.
Prior to use, the model was validated against data covering the last 5 years so that confidence could be held in its use for predictive purposes. The LNG carriers were then introduced into the marine traffic simulation for all arrivals associated with daylight transits; in total almost 25 years of operation were simulated in order to develop a robust data base from which collision frequency predictions could be made.
Each interaction of a vessel within the traffic model and the LNG carrier was recorded, covering the nature of the vessel, its speed, size (displacement), and heading. The energy that could be transferred to an LNG carrier, should a collision occur, was then calculated. The frequency of events that may lead to high energy collisions was captured and used to develop the key frequency input for releases modeled by DNV.
The anticipated grounding rates for LNG carriers during transit to the berth has been developed from a review of historic incidents in Hong Kong waters associated with vessels over 200m LOA. This has allowed the identification of the historic grounding risk on a per vessel, per km basis. This result has been used to develop the baseline risk for LNG transits that has been developed for the 2011 and 2021 timeframes, while including allowance for the multiple tug escorts that will be associated with the carrier arrivals.
The collision at berth analysis has been based on the frequency of vessels that run aground in the vicinity of the proposed LNG terminal, and the identification of the risk associated with a wayward vessel diverting from its course to such an extent that it creates hazards to the LNG carrier at the jetty. Base frequencies have been developed from historic data, and developed for the 2011 and 2021 time frames.
The
consequence of the potential groundings and collisions was calculated by DNV
using PHAST V6.51 (Process Hazard Analysis Software Tool). PHAST is the
consequence module of the SAFETI (Suite for Assessment of Flammable, Explosive,
and Toxic Impact) software package, and is the most widely used consequence
modeling software in the oil and gas industry. The parameters and assumptions
that might affect the MQRA conclusions are presented in table form in Appendix
I.
SAFETI
was then used to combine the consequences with data about population, weather
conditions and ignition sources to determine the potential impact of the
credible scenarios.
SAFETI
was used to calculate the individual risk contours and societal FN curves based
on the consequence and release frequency analyses. These risk calculations took
into account the population, weather and ignition data to determine the overall
risk which was compared to the Hong Kong EIA Ordinance (EIAO) risk criteria.
Results
were analyzed in order to determine the main contributors to risk, including
the most potentially affected populations and key route segments.
3 Scenario Identification
3.1
Table
3‑1
and Figure 3‑1
present the LNG carrier transit routes to the Black Point and South Soko sites. An
alternative approach to Black Point via the western side of Lantau
Island was not considered due to insufficient water depth to accommodate the
LNG carrier draft requirement.
Although a project to dredge the Tonggu
Channel to a sufficient depth to accommodate the LNG carrier has been
speculated, there remains sufficient uncertainty associated with the Tonggu Project venture that it cannot be included as a
viable alternative in a project basis at this time. However, given the potential
for the Tonggu Waterway, it has been included in the
MQRA as a variation in the marine traffic data set as identified in Section
4.1.
Table 3‑1 LNG Transit Carrier Route Segments
|
BLACK
POINT ROUTE |
|
|
Name |
Description |
|
BP7 |
From
the point where the LNG carrier enters Hong Kong waters to the end of BP6,
10.17 km along the carrier transit route |
|
BP6 |
7.51
km from end of BP5 along the carrier transit route |
|
BP5 |
7.32
km from the end of BP4 along the carrier transit route |
|
BP4 |
7.31
km from the end of BP3 along the carrier transit route |
|
BP3 |
7.39
km from the end of BP2 along the carrier transit route |
|
BP2 |
7.51
km from the end of BP1 along the carrier transit route |
|
BP1 |
To
Black Point terminal, 7.42 km
along the carrier transit route |
|
SOUTH
SOKO ROUTE |
|
|
Name |
Description |
|
SK4 |
From
the point where the LNG carrier enters Hong Kong waters to the end of SK3,
12.59 km along the carrier transit route |
|
SK3 |
7.42
km from the end of SK2 along the carrier transit route |
|
SK2 |
9.43
km from the end of SK1 along the carrier transit route |
|
SK1 |
To
South Soko terminal, 8.90 km along the carrier
transit route |
Figure 3‑1 LNG Shipping Routes to Black Point and South Soko Terminals
The MQRA modeled arrivals at Black Point and South Soko for two sizes of LNG carrier. Per the project design basis, the MQRA assumes the day-time only passage of the LNG carrier in Hong Kong waters. Two tugs will be in attendance at the LNG carrier’s arrival into Hong Kong waters and boarding of local Pilot, with an additional two tugs joining the carrier as it enters the harbor and transits onwards around Ma Wan (for Black Point), and prior to the final approach (for South Soko).
The
study was based on two sizes of LNG carrier of the membrane design with five
cargo tanks. Fifty-one arrivals per year were considered for a class of 215,000
m3 carrier (maximum cargo tank size of 43,000 m3).
Seventy-five arrivals per year were modeled for a smaller 145,000 m3
LNG carrier (maximum cargo tank size 29,000 m3). Modeling five cargo tanks maximizes the
typical potential inventory of one tank, thereby using a conservative
approach. Where referenced in the
document, 215,000 m3 represents “Large Carrier”, and 145,000 m3 represents “Small Carrier”.
The
typical safeguards that are present in LNG carrier design and operation are as
follows:
· Design in accordance with International Gas Carrier regulations and classification requirements
· Double hull and double bottom
· Forward collision bulkhead
· Independent separated cargo area (five tanks)
· Cargo tanks located away from the engine room
· Slow speed diesel engines – engine contingency
· Double wall piping for fuel supply lines in engine room
· Double wall bunker oil tank
· Water spray on deck and sides of carrier
· Fire protection
· Maximum transit speed of 4 – 12 knots within HK waters
· Two pilots on board
· Tug assist (as described previously)
In the history of LNG
shipping, LNG carriers have rarely been involved in collisions and groundings
and none of these collisions and groundings led to a breach of an LNG
tank. Because of the design of LNG
carriers (e.g. double hulls), breach of containment
from a collision is a risk only if an LNG carrier collided with another vessel
of a large enough size, going at or above a certain speed and striking the LNG
carrier at a specific angle. In
summary, collisions and groundings involving an LNG carrier are expected to be
very rare events and collisions and groundings that lead to the piercing of two
hulls and the tank walls of an LNG carrier are expected to be even rarer.
3.3
Modeled
Release Hole Sizes
The
HAZID workshop and subsequent evaluation identified that a collision or grounding
of the LNG carrier could potentially lead to a potential breach of cargo
containment and should be considered credible scenarios. The release sizes
selected for modeling are 250mm small releases, 750mm medium releases and
1500mm large releases. This approach is in line with recent LNG studies carried
out by Sandia National Laboratories and DNV (ref. 04, 05). It
is also in line with other DNV LNG studies that have been carried out the world
over.
The
maximum hole size from DNV (ref. 05) is 1500mm which is an equivalent hole area
of 1.8m2 which is defined as the maximum credible event predicted by
the International Maritime Organization (IMO) and operational experience. The Sandia report (ref. 04) defines the credible scenario for high
speed collisions to be up to 1.5m2. By applying the DNV maximum
credible hole size, a conservative approach is taken.
The
following energy thresholds were used in the MQRA to determine consequence hole sizes:
§ E0 = Range of penetration energies to cause a hole in carrier’s outer hull = 1.4 to 99 MJ
§ E1 = Range of penetration energies to cause 250mm hole = 100 to 110 MJ
§ E2 = Range of penetration energies to cause 750mm hole = 111 to 150 MJ
§ E3
= Range of penetration energies to cause 1500mm hole = more than 150 MJ
4 Release Frequency Analysis
Section 4.0 was provided by BMT.
4.1
Collision
Analysis
In the 40 year history of LNG carrier operations, there have been no recorded incidents of a cargo release due to a collision, or prior experience with such vessels transiting Hong Kong waters. Therefore, in order to develop a valid basis for future prediction of local LNG carrier collision risk and release frequency, it was first necessary to develop a model that could accurately represent the “genus” of LNG carriers; i.e. large ocean-going vessels transiting within Hong Kong waters. The specific circumstances required to develop a loss of containment from an LNG carrier could then be applied following identification of the base frequencies.
BMT’s DYMTRI (Dynamic Marine Traffic simulation) model was adopted as the platform for the traffic simulation having been widely applied in Hong Kong, in particular the 2003 territory-wide “MARA Study” (www.mardep.gov.hk/en/publication/pdf/marars.pdf). The model is a numerical simulation whereby vessels transit along prescribed routes and identify key data associated with any vessel encounter situations where an avoidance maneuver is required. Extensive application and validation has identified that a clear link can be established between the frequency of encounters (opportunities for a mistake to be made) and collisions (events where a mistake has been made).
The key steps associated with assessment are outlined below:
· Identification of Baseline Traffic – All vessel activity associated with ships with Length (LOA) greater than 75m, and transits within 2.5km of the LNG carrier route were extracted from the MARA database of radar records, and full-year statistics for 2003 verified to ensure a comprehensive representation of traffic activity at that timeframe. Traffic data were organized into a series of representative routes with a variety of ship classes.
· Hazard Identification – The distribution of collision incidents within fairways for all “ocean-going” vessels with LOA > 75m was mapped for Hong Kong Special Administrative Region (HKSAR) waters for a 5 year period.
· Model Validation – The model was run for the 2003 traffic activity, and the linkage between model output of “encounters” and historic collisions within fairways (as applicable to LNG carrier transits) confirmed.
· Traffic Forecasts – An extensive forecasting exercise was conducted, with particular focus on large ocean-going vessels. “Stochastic” forecast techniques were adopted so that a representative upper-bound scenario could be developed for the 2011 and 2021 timeframes. Key elements considered included:
- Historic Cargo Trends and Traffic Growth
- HK Port Master Plan 2020 Study Cargo Forecasts
- LOA Distribution of Ocean-going Vessels (World-wide, Hong Kong and Shenzhen)
- Ocean-going and Rivertrade Passenger Vessel activity
- Non-Container Ocean-going Traffic Forecasts
- Future Marine Facilities including :
§ Tonggu Waterway
§ Container Terminal 10 (CT10)
§ Local terminals (i.e. Permanent Aviation Fuel Facility, CRC LPG berth at Tsing Yi)
· Scenario Development – A series of scenarios “A” to “J” were developed to examine traffic activity at 2011 and 2021 taking into account the presence and location of the Tonggu waterway (which has the potential to divert future traffic growth at Ma Wan away from Hong Kong waters, and CT10 at either Tsing Yi or NW Lantau). The scenarios adopted for consequence examination were those that considered the initial operation of the terminal in 2011, and a span of traffic possibilities for 2021:
- 2011C – Year 2011, no CT10, or Tonggu Waterway
- 2021E – Year 2021, no CT10, or Tonggu Waterway
- 2021F – Year 2021, no CT10, includes Tonggu Waterway
· Collision Frequency Assessment – The DYMITRI model was run for all scenarios with the LNG carrier introduced into the simulation almost 2,000 times in order to ensure that transits were conducted across the full spectrum of daylight arrivals, and providing the LNG carrier the opportunity to interact with all ships within the traffic “mix”. The following key data were output:
- Anticipated collision location
- Vessel details, including:
§ Route and vessel class identifier
§ Vessel speed at point that avoidance maneuver is initiated
§ Vessel headings & encounter type (i.e. Overtaking, Crossing, or Headings)
§ Encounter Time.
· The collision data was then processed to ensure that local marine traffic regulations (such as one-way traffic for large Ocean-going vessels within the Ma Wan Channel) were being correctly implemented. The encounter data were rationalized and the total collision frequency identified on a per transit basis, for each individual route segment.
· Collision Energy Distribution – Having identified the collision frequency associated with the LNG carrier transit (which at this stage was representative of the transit of any large vessel), it was then necessary to characterize the collision energy associated with each encounter. The detailed data extracted for scenarios C, E & F took account of:
- The colliding vessel’s displacement (assuming an upper-bound envelope of vessel size)
- The potential for the vessels to collide at a series of angles deviated from the initial encounter angle
- Impact energy absorbed by the colliding vessel during collision with the double hulled LNG carrier
- Nominal reduction in speed by the colliding vessel prior to impact
- Perpendicular penetration energy component into the LNG carrier hull.
· Vessel Size Modification – The Model Validation had been conducted on the basis of average traffic activity and collision incidents. Review of the historic record identified that larger vessels (such as the LNG carriers) were relatively safer - undoubtedly encompassing a number of factors such as Pilotage and Vessel Traffic Control. A safety factor of at least 2 was assumed for large vessel transits based on worldwide data. Further analysis would be required to demonstrate the appropriate safety factor adjustment for Vessel Size that would be applicable to specific characteristics of Hong Kong harbor.
· Impact Frequency on LNG Containment –The geometry of an LNG carrier is such that cargo tanks are not located along the entire length of the carrier. There is space in the bow and the stern as well as between the tanks. If a collision were to occur in a location not occupied by a cargo tank, then no loss of containment will result. Having identified the impact frequency on a large vessel transiting the LNG carrier’s route the frequency of impact on an LNG containment tank was developed with reference to this tank geometry and location.
· Safety Zone Implementation – The impact of safety zones around the carrier was investigated by examination of the removal of close-quarters risk, and the increase in average stand-off distances to a collision. A safety factor in the order of at least 10 was identified.
Each encounter event was reported with a frequency-energy couple allowing the cumulative frequency of different energy thresholds to be assessed, on a per transit basis, for each route segment. These data were then carried forward by DNV in their analysis.
The anticipated grounding rates for LNG carriers during transit to the berth have been developed from a review of historic incidents in Hong Kong waters associated with vessels over 200m LOA. This has allowed the identification of the historic grounding risk on a per vessel, per km basis.
This result has been used to develop the
baseline risk for LNG transits that has been directly applied to the 2011 and
2021 timeframes, with a nominal and conservative improvement factor of 2.0 to
account for the escort of up to four tugs that will be associated with the
carrier arrivals.
The collision at berth has been based on the frequency of vessels that run aground in the vicinity of the LNG terminal, and the identification of the risk associated with a wayward vessel diverting from its course to such an extent that it hazards the LNG carrier at the jetty. Base frequencies have been developed from historic grounding data and directly applied to the 2011 and 2021 traffic environment and time frames.
5 Consequence Analysis
5.1
Modeling
Hole Sizes
The hole sizes modeled
in the MQRA are summarized in Table
5‑1.
Table 5‑1 Hole Sizes Used in the MQRA
|
Scenario |
Release Hole Diameter |
Equivalent Release Size
in Area |
Location |
|
Small |
250 mm |
0.05 m2 |
Above and Below waterline |
|
Medium |
750 mm |
0.4 m2 |
Above waterline |
|
Large |
1,500 mm |
1.8 m2 |
Above waterline |
5.2
Potential
Consequences and Impact
The more likely outcome of an LNG release,
especially given that the main cause of such a leak would be a ship collision
involving friction and heat, is that the release ignites immediately. No gas cloud would be anticipated, but the
pool fire grows on the sea surface to its sustainable size. The sustainable size is governed by the
balance between the rate at which the LNG is vaporized and the rate at which
the fire consumes the vapor.
In the
unlikely event of an unignited LNG release onto the
sea’s surface, temperature differential will cause the LNG to vaporize and form
a natural gas cloud. The cloud of natural gas that is initially formed is cold
and heavier than air. The gas warms up and the vapor cloud disperses downwind.
Regions in the cloud that are within the flammability limits of natural gas may
then come into contact with an ignition source, ignite, and form a flash fire. This fire would then burn back to the
LNG pool, ignite the pool and form a pool fire. This will be a thin pool, due
to gravitational spreading, which cannot sustain the initial burning rate for
long, and the pool diameter will shrink to a sustainable size (ref. 06).
Although such a fire is a highly unlikely scenario,
the potential human impact of concern is thermal radiation impact. For pool fires, personal injury due to
heat radiation is determined by the radiation exposure level and duration. A probit
equation was used to calculate the probability of fatality from the thermal
exposure. For flash fires, a vulnerable
person located within the flash fire envelope (as defined by 0.85 times the
Lower Flammability Limit (LFL) extent of the gas cloud) is assumed to be
fatally injured.
Vulnerability parameters were used to calculate the fraction of potential fatalities among the people exposed to various types of hazardous events at a certain location. Indoor and outdoor populations have different vulnerability fractions depending on the degree of protection provided by buildings and other shielding. In addition, the vulnerability fraction varies for whether the hazard is a flash fire or pool fire.
The
complete list of parameters and fundamental assumptions that might affect the
MQRA conclusions is presented in table form in Appendix I.
The
consequence hazard results produced by the modeled cases along the transit
routes for two carrier sizes are presented in Table 5‑2. The results consist of distances to
the 0.85 LFL and LFL concentrations of the vapor cloud along with the pool fire
diameter and distance to thermal radiation hazard levels. The largest
dispersion consequence distance for the scenarios generally occurs with F2m/s
or D7m/s weather conditions. The largest thermal radiation consequence distance
occurs with the D7m/s weather condition.
Table 5‑2 Consequence Hazard Results
|
Carrier |
Accident |
Release Size |
Weather Condition |
Distance (m) |
Pool Diameter (m) |
Radiation (m) |
|||
|
0.85 LFL |
1.0 LFL |
5 kW/m2 |
12.5 kW/m2 |
35 kW/m2 |
|||||
|
Small Carrier |
Collision |
Small |
B2.5 |
197 |
168 |
28 |
179 |
120 |
61 |
|
F2.0 |
431 |
255 |
28 |
176 |
115 |
58 |
|||
|
D3.0 |
283 |
229 |
28 |
181 |
124 |
64 |
|||
|
D7.0 |
318 |
273 |
28 |
192 |
138 |
81 |
|||
|
Medium |
B2.5 |
402 |
326 |
83 |
419 |
277 |
144 |
||
|
F2.0 |
581 |
258 |
83 |
412 |
266 |
136 |
|||
|
D3.0 |
623 |
469 |
83 |
424 |
285 |
151 |
|||
|
D7.0 |
748 |
624 |
83 |
448 |
317 |
192 |
|||
|
Large |
B2.5 |
641 |
502 |
167 |
708 |
464 |
244 |
||
|
F2.0 |
2187 |
1217 |
167 |
696 |
449 |
232 |
|||
|
D3.0 |
1119 |
811 |
167 |
717 |
478 |
256 |
|||
|
D7.0 |
1269 |
1009 |
167 |
755 |
534 |
324 |
|||
|
Grounding |
Small |
B2.5 |
139 |
119 |
23 |
150 |
99 |
48 |
|
|
F2.0 |
157 |
70 |
23 |
147 |
95 |
45 |
|||
|
D3.0 |
216 |
170 |
23 |
151 |
103 |
51 |
|||
|
D7.0 |
212 |
183 |
23 |
161 |
115 |
65 |
|||
|
Large Carrier |
Collision |
Small |
B2.5 |
203 |
172 |
28 |
183 |
122 |
62 |
|
F2.0 |
446 |
265 |
28 |
180 |
117 |
59 |
|||
|
D3.0 |
281 |
223 |
28 |
185 |
126 |
65 |
|||
|
D7.0 |
324 |
275 |
28 |
195 |
140 |
83 |
|||
|
Medium |
B2.5 |
401 |
323 |
85 |
426 |
281 |
146 |
||
|
F2.0 |
590 |
261 |
85 |
419 |
270 |
138 |
|||
|
D3.0 |
680 |
522 |
85 |
432 |
290 |
154 |
|||
|
D7.0 |
751 |
621 |
85 |
456 |
323 |
195 |
|||
|
Large |
B2.5 |
652 |
510 |
170 |
720 |
472 |
249 |
||
|
F2.0 |
1716 |
817 |
170 |
708 |
456 |
236 |
|||
|
D3.0 |
1144 |
829 |
170 |
729 |
485 |
260 |
|||
|
D7.0 |
1287 |
1023 |
170 |
769 |
545 |
331 |
|||
|
Grounding |
Small |
B2.5 |
145 |
121 |
24 |
156 |
103 |
50 |
|
|
F2.0 |
170 |
75 |
24 |
153 |
99 |
47 |
|||
|
D3.0 |
225 |
177 |
24 |
157 |
107 |
53 |
|||
|
D7.0 |
220 |
190 |
24 |
167 |
119 |
68 |
|||
5.4
Potential
Tsing Ma Bridge Impacts
The Tsing Ma Bridge links Tsing Yi
Island on the east to Ma Wan Island on the west over Ma Wan Channel. The risk to the population crossing the bridge
has been considered in the risk calculations. The consequence impacts to the bridge
structure itself are the topic of this section.
It is a
suspension bridge with two deck levels and carries both road and railway
traffic. There are two towers with one located on Wok Tai Wan on the Tsing Yi side and the other on a man-made island 120 meters
from the coast of Ma Wan Island. Since both towers are located on land, it is
not possible for the LNG carrier to collide with the bridge towers. Both towers
are comprised of two legs constructed with high strength concrete. The decks
are constructed of steel.
The scenario that
may impact the bridge is an LNG pool fire due to grounding of an LNG carrier or
LNG carrier collisions. The grounding
and collision scenarios are analyzed through fire consequence modeling. For the
potential pool fire caused by grounding scenario, the flame height is not of
sufficient height to reach the bridge lower deck as defined by the shipping
clearance of the bridge. Thus, the bridge is not expected to be exposed to
direct flame impingement. The potential damage on the bridge is assessed based
on thermal radiation calculation and structure damage analysis. Some
assumptions are made in the assessment due to the lack of the information on
bridge structure. The analysis results show that the thermal radiation caused
by the pool fire is not high enough to cause the lower deck of the bridge to
reach its failure temperature. Therefore, the bridge could not be structurally
damaged by the potential pool fire caused by grounding of an LNG carrier.
The potential damage of the pool fire caused by LNG carrier collisions is assessed in the same way. For the pool fire caused by small collision scenario, the bridge is not expected to be exposed to direct flame impingement, but the thermal radiation of the pool fire could cause the lower level of the bridge reach its failure temperature after 1.6 hours exposure to the pool fire. For the potential pool fire caused by medium or large collision scenario, the flame height is assessed to be higher than the clearance height of the bridge, and the direct flame impingement would cause the lower level of the bridge to reach its failure temperature in a short time.
The nature of large LNG pool fire flame has not been explored completely, and some conservative assumptions are made in the flame height and thermal radiation calculations; thus, the assessment on bridge damage must be viewed as conservative and further analysis would be required to fully evaluate the potential risks to the Tsing Ma bridge. Further details regarding the potential impact to the Tsing Ma Bridge are presented in Appendix III.
6 Risk Assessment Results
The MQRA determined the risks to land-based and
marine populations along the LNG carrier routes based on the consequence and release
frequency analyses. The risk assessment results are presented in terms of
Individual Risk and Societal Risk.
Every
quantitative answer contains some level of uncertainty associated with its
result. For the risk assessment
results presented in the following section, the uncertainty is contributed to
by the frequency analysis, consequence hazard modeling and risk analysis. Considering many factors contribute to the
uncertainty, accurate quantification of the uncertainty would be
impractical. However the
conservative modeling and approaches within the analysis counteract any
possible under prediction of the risks.
Individual
Risk (IR) is expressed as a line of equal risk or iso-risk
contours, shown on a map. The contour is a combination of risks from all
credible scenarios identified for the project.
IR
contours indicate the probability of potential fatality for an individual situated
along the risk contour continuously (24 hours a day, 7 days a week) for a
year. The contours are marked in
decades starting from a risk level of 1x10⁻⁷ per year (one fatality
per 10 million years). For example, a person situated on the 1x10⁻⁷
IR contour will be potentially exposed to fatal accidents once per 10 million
years. If no risk contour appears for part of the transit route, it implies
that the maximum individual risk from this part of the transit route is less
than 1x10⁻⁷ per year. While individual risk contours
are traditionally used in risk analysis, it should be kept in mind that they
are most useful as a comparison tool only as it is very unlikely that any
individual would remain in a single location for a whole year.
This
“large carrier case” and “small carrier case” used extensively hereafter are
defined in Section 3.2. In all
cases, for both terminal locations and for the traffic scenario at 2011 and two
cases at 2021, the individual risk levels are under the individual risk criteria
set out in Annex 4 of the Hong Kong EPD Technical Memorandum on the
Environmental Impact Assessment Process (ref. 01), which is a level of 10-5 per year (one in 100,000 years).
6.1.1 Black Point Transit Route
The large
LNG carrier case individual risk results for the Black Point terminal location
are presented in Figure 6‑1, Figure 6‑2, and Figure 6‑3 for 2011C, 2021E, and 2021F, respectively. The small LNG carrier case individual
risk results for the Black Point terminal location are presented in Figure 6‑4, Figure 6‑5, and Figure 6‑6 for 2011C, 2021E, and 2021F,
respectively. The results show that
the 1x10⁻⁶ per year and 1x10⁻⁷ per year IR contour are
displayed and thus 1x10⁻⁶ per year is the highest IR risk level for the
Black Point route. This is one
order of magnitude below the Hong Kong EIAO individual risk criteria.
Figure 6‑1 IR Contour of Black Point Route, 2011C (Large Carrier)
Figure 6‑2 IR Contour of Black Point Route, 2021E (Large Carrier)
Figure 6‑3 IR Contour of Black Point Route, 2021F (Large Carrier)
Figure 6‑4 IR Contour of Black Point Route, 2011C (Small Carrier)
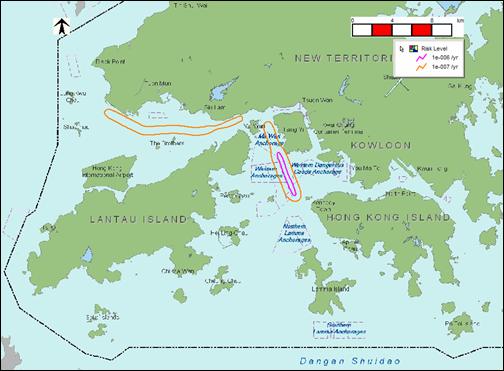
Figure 6‑5 IR Contour of Black Point Route, 2021E (Small Carrier)
Figure 6‑6 IR Contour of Black Point Route, 2021F (Small Carrier)
6.1.2 South Soko Transit Route
The
large LNG carrier case individual risk results for the South Soko terminal location are presented in Figure 6‑7, Figure 6‑8, and Figure 6‑9 for 2011C, 2021E, and 2021F,
respectively. The small LNG carrier
case individual risk results for the South Soko
terminal location are presented in Figure 6‑10, Figure 6‑11, and Figure 6‑12 for 2011C, 2021E, and 2021F,
respectively. The results mostly
show that the 1x10⁻⁶ per year and 1x10⁻⁷ per year contour are displayed and thus
1x10⁻⁶ per year is the maximum for the South Soko route. As with the Black Point route, this is one
order of magnitude below the Hong Kong EIAO individual risk criteria. There is
a small point in the South Soko 2021F (Figure 6‑12) contour where the Individual Risk is 1x10⁻⁵
per year. This point is almost imperceptible and resides over the water;
therefore, the risk criteria is maintained. It is important to also remember that
the point represents the risk to someone residing at that location for 24
hours, every day, for an entire year.
Figure 6‑7 IR Contour of South Soko Route, 2011C (Large Carrier)
Figure 6‑8 IR Contours of South Soko Route, 2021E (Large Carrier)
Figure 6‑9 IR Contours of South Soko Route, 2021F (Large Carrier)
Figure 6‑10 IR Contour of South Soko Route, 2011C (Small Carrier)
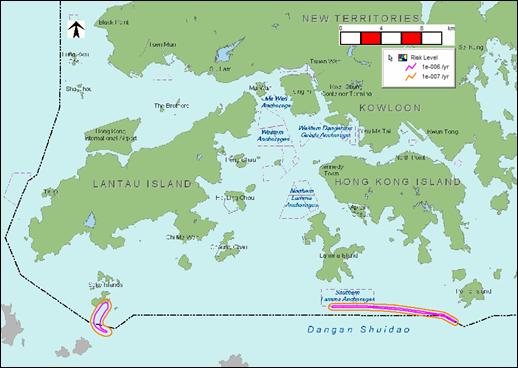
Figure 6‑11 IR Contours of South Soko Route, 2021E (Small Carrier)
1E-05/yr point![]()
Figure 6‑12 IR Contours of South Soko Route, 2021F (Small Carrier)
Societal
Risk is calculated and expressed in terms of FN curves – the cumulative
frequency (F) of N or more potential fatalities occurring. Cumulative frequency
is on the vertical axis, while number of potential fatalities is shown on the
horizontal axis.
The Societal Risk for each segment is shown in relation to the Hong Kong EIAO societal risk criteria. The segments are each of a length of at least 7.3km as requested by the Hong Kong Government. This minimum length ensures that each segment is treated in a consistent manner. Refer to Table 3‑1 and Figure 3‑1 for segment details. In most cases, for both terminal locations and for the traffic scenario at 2011 and two cases at 2021, the FN curves are within the Hong Kong EIAO societal risk criteria acceptable region. For the Black Point segments BP4 and BP5, parts of the curves are within the EIAO societal risk criteria ALARP region.
6.2.1 Black Point Transit Route
The large LNG carrier case FN curves for the Black Point terminal location are presented in Figure 6‑13, Figure 6‑14, and Figure 6‑15 for the 2011C, 2021E and 2021F cases, respectively. The small LNG carrier case FN curves for the Black Point terminal location are presented in Figure 6‑16, Figure 6‑17, and Figure 6‑18 for the 2011C, 2021E and 2021F cases, respectively.
Figure 6‑13 FN Curve for Black Point Route Segments, 2011C (Large Carrier)
Figure 6‑14 FN Curve for Black Point Route Segments, 2021E (Large Carrier)

Figure 6‑15 FN Curve for Black Point Route Segments,
2021F (Large Carrier)
Figure 6‑16 FN Curve for Black Point Route Segments, 2011C (Small Carrier)
Figure 6‑17 FN Curve for Black Point Route Segments, 2021E (Small Carrier)
Figure 6‑18 FN Curve for Black Point Route Segments, 2021F (Small Carrier)
6.2.2 South Soko Transit Route
The large LNG carrier case FN curves for the
South Soko terminal location are presented in Figure 6‑19, Figure 6‑20, and Figure
6‑21 for the 2011C, 2021E and 2021F cases,
respectively. The small LNG carrier
case FN curves for the
Figure 6‑19 FN Curves for South Soko Route Segments, 2011C (Large Carrier)
Figure 6‑20 FN Curve for South Soko Route Segments, 2021E (Large Carrier)
Figure 6‑21 FN Curve for South Soko Route Segments, 2021F (Large Carrier)
Figure 6‑22 FN Curves for South Soko Route Segments, 2011C (Small Carrier)
Figure 6‑23 FN Curve for South Soko Route Segments, 2021E (Small Carrier)
Figure 6‑24 FN Curve for South Soko Route Segments, 2021F (Small Carrier)
6.3
Mitigation
Cases for Black Point
The FN curves for the Black Point segments in all cases (2011 and 2021, large and small carriers) shows some of the route segments in the EIAO Ordinance ALARP region. This means that mitigation measures must be considered and applied in order to reduce the risk into the acceptable range. Several mitigation measures were considered that have been implemented at other ports around the world that receive LNG carriers and would involve restrictions on other marine traffic in the Ma Wan Channel. Implementation of these measures are beyond CAPCO’s control. On the advice of the relevant authority, due to uncertainties regarding the level of safety improvement, the estimated impact to other port users, and the practicality of implementing these measures in the busy marine environment of Hong Kong, these measures are not considered implementable at this time.
7 Existing Risk Level at the Ma Wan Channel
The Ma Wan Channel is a strategic waterway linking Hong Kong and the Pearl River Delta. Incidents within this waterway are of key concern. The Study Brief entitled "ESB-126/2005 Liquefied Natural Gas (LNG) Receiving Terminal and Associated Facilities” dated June 2005 (ref. 02) stipulates that for the evaluation of the Black Point transit route, the existing risk of the Ma Wan Channel must also be assessed. The Study Brief stipulates in Section 3.7.9.2, the following regarding the existing risk study:
“For
carrying out hazard assessment relating to marine transportation of the LNG,
the Applicant shall assess the existing risk level at the Ma Wan Channel, among
others, and identify practicable mitigation measures to avoid and eliminate the
additional risk to the areas along the transportation route of the LNG carrier”
DNV
evaluated the existing risk of dangerous goods transits through the Ma Wan
Channel. This evaluation was undertaken to examine the
relative importance of the additional risks associated with LNG
transits versus the current risk levels. There are many unknown factors
and uncertainties with regard to the assumptions employed in the study. More extensive analysis using the data
that is currently not available to CAPCO would be needed to more accurately
determine the existing risk levels at Ma Wan Channel. Based on the traffic records of the Marine
Department, the transit of six dangerous cargos through the Ma Wan Channel was
evaluated following the same procedure applied to the LNG MQRA but evaluated
with 2006 traffic data. The
dangerous goods cargos evaluated included the following:
· Oil
· Aviation Fuel
· Liquefied Petroleum Gases (LPG)
· Ammonia
· Toluene
· Chlorine
The
study also evaluated the risk imposed by transiting the LNG carrier in the Ma
Wan Channel with 2006 traffic data. Figure 7‑1 presents the individual risk results for
the DG vessel traffic in the Ma Wan Channel. The study concluded that the
maximum individual risk from DG vessel traffic in the Ma Wan Channel is 1x10-05
per year. Figure 7‑2 presents the societal risk profile
generated for the combined DG and LNG carrier traffic, together with the
societal risk profile of the DG and LNG carrier.
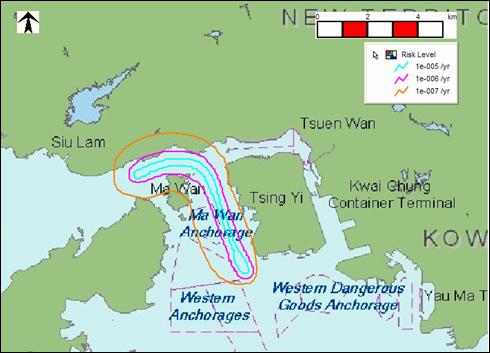
Figure 7‑1 Individual Risk Contour for 2006 Existing Ma Wan Channel Dangerous Goods Traffic
Figure 7‑2 FN Curve for 2006 Existing Dangerous Goods Traffic and LNG Carrier Traffic in Ma Wan Channel
8 Conclusions and Recommendations
The individual
risk results for the transit routes to both the Black Point and South Soko terminal locations, for the traffic scenario at 2011
and two cases at 2021, are in the acceptable region per the individual risk
criterion set out in Annex 4 of the Technical Memorandum on the Environmental
Impact Assessment Process (Hong Kong EPD), which is a level of 10-5 per
year (one in 100,000 years) or less.
The societal
risk results for the transit route segments to the South Soko
terminal location, for the traffic scenario at 2011 and two cases at 2021, and for
every sensitivity evaluated in Appendix III, lie in the acceptable region of
the societal risk criteria curve defined in Annex 4 of the Hong Kong EPD
Technical Memorandum on the Environmental Impact Assessment Process.
The societal
risk results for the transit route segments to the Black Point terminal, for
the traffic scenario at 2011 and two cases at 2021, mostly lie in the
acceptable region of the societal risk criteria curve, as defined in Annex 4
with the exception of segments BP4 and BP5 which lie in the ALARP region. The
difference in risk in these segments is due to busy marine traffic and high
density population on the edge of the Ma Wan Channel. For the Ma Wan segments, ocean
going vessel traffic is expected to grow from 19,000 vessels per year in 2005
to up to 60,000 vessels per year in 2021.
In addition to ocean going vessels, river trade traffic exceeds 100,000
vessels per year. The population
located along the Ma Wan channel is projected to approach 200,000 persons
within 3 km of the transit route.
Several mitigation measures were
considered that have been implemented at other ports around the world that
receive LNG carriers. However,
these measures would involve restrictions on other marine traffic in the Ma Wan
Channel and implementation of these measures is beyond CAPCO’s
control. On the advice of the
relevant authority, due to uncertainties regarding the level of safety
improvement, the estimated impact to other port users, and the practicality of
implementing these measures in the busy marine environment of Hong Kong, these
measures are not considered implementable at this
time.
The existing risk of dangerous goods transits
through the Ma Wan Channel was evaluated using the best available data. There are many unknown factors and
uncertainties with regard to the assumptions employed in the study. More
extensive analysis using data that is currently not available to CAPCO would be
needed to more accurately determine the existing risk levels at Ma Wan Channel.
Mitigating the marine societal risk through the Ma
Wan Channel from ALARP to Acceptable is considered not implementable
at this time due to the impact on busy marine traffic in the Hong Kong
environment. The incremental risk
of LNG transit through the Ma Wan Channel is avoided by the selection of the
South Soko site, where the risk of the marine transit
has been assessed as Acceptable along the entire route.
References
|
Hong Kong
Environmental Protection Department, “Environmental
Impact Assessment Ordinance, Technical Memorandum on Environmental Impact
Assessment Process.” |
|
|
Study Brief “ESB-126/2005 Liquefied Natural Gas
(LNG) Receiving Terminal and Associated Facilities” June 2005. |
|
|
CAPCO LNG PROJECT – Safeguards & Security
Qualitative Risk Assessment,
April 2006. |
|
|
“Guidance
on Risk Analysis and Safety Implications of a Large Liquefied Natural Gas
(LNG) Spill Over Water,” Sandia National Laboratories, December 2004. |
|
|
“LNG Marine
Release Consequence Assessment,” DNV Report, Joint Sponsorship Project, April
2004. |
|
|
“Consequences
of LNG Marine Incidents”, Pitblado, R., et. al., DNV, 19th Annual CCPS International
Conference, Orlando, July 2004. |