Figure 1.2 Population
in Vicinity of
This
section describes the methodology employed to determine the population in the
vicinity of the proposed site at
The
proposed site for the LNG Terminal on 1.2
depict
A
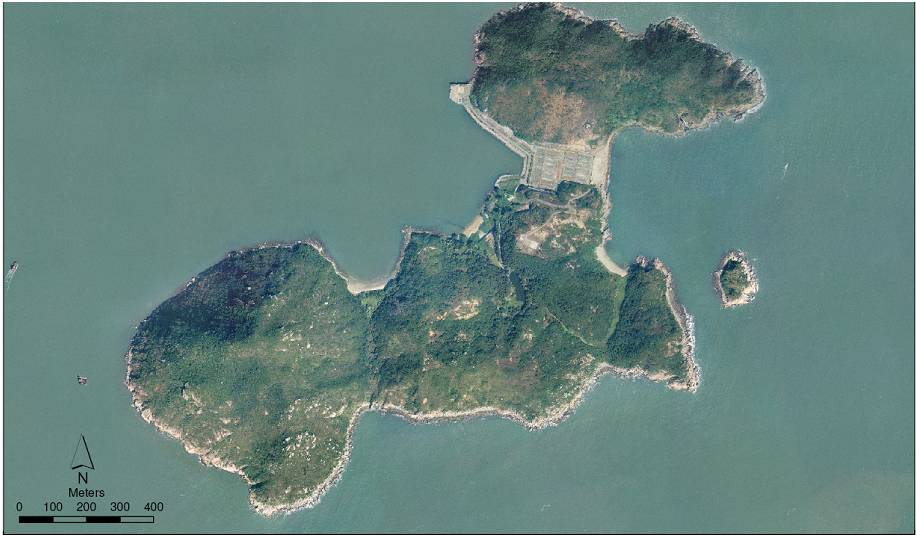
number of Private Lots and derelict buildings are present on the Island as well
as the recently refurbished
1.3
Land Population Estimation
The
following information sources were referred to for population estimation:
·
Site Survey Data
·
Census Data [1]
·
Land Records from Lands Department
·
Road Traffic Data [2]
·
Data on Key Individual Developments
·
Marine Traffic Data [3-5]
1.3.1
Residential Population
Figure 1.1 Aerial Photo of the
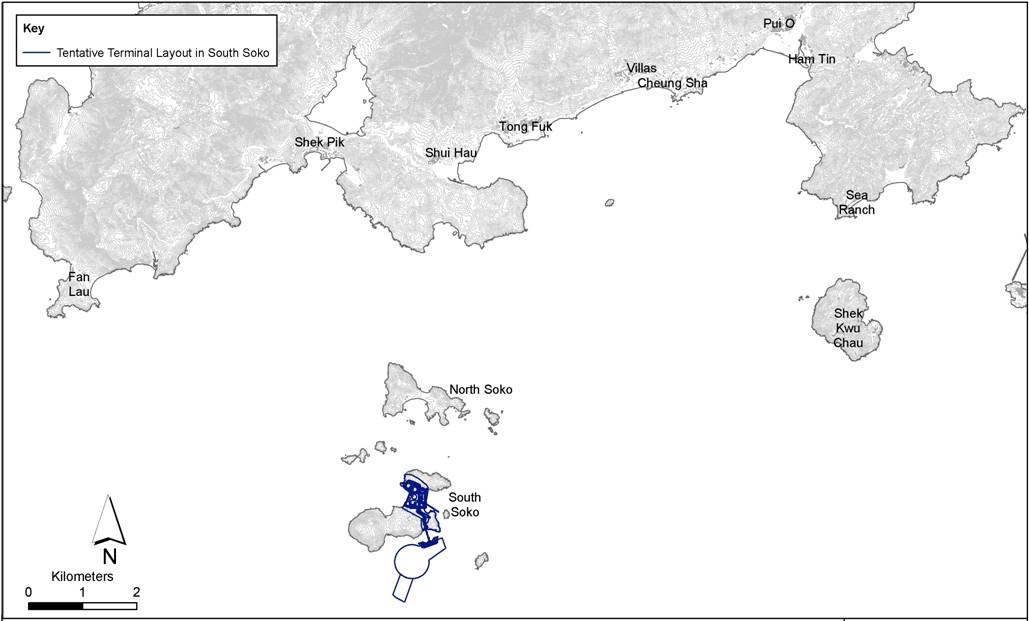
Figure 1.2 Population
in Vicinity of
The population in villages along the
southern coast of
Table 1.1 Estimated
Residential Population Data
|
Location |
Approx. Distance from Terminal Site |
2011 Population |
2021 Population |
|
Fan
Lau Tai
Long Wan Tseun Shek Pik Prison Tung
Wan School Shui Hau Ma
Po Ping Prison Tong
Fuk Cheung
Sha Villas Cheung
Sha San
Shek Wan Pui Wo Ham
Tin Mong Tung Wan Sea
Ranch Tai
Long Shek Kwu Chau |
7km 7km 7km 6km 6km 6km 7km 9km 9km 10km 11km 11km 11km 10km 11km 8km 9km |
52 293 824 152 375 1,728 1,133 665 597 156 2,628 859 43 313 34 43 90 |
52 293 824 152 375 1,728 1,133 665 597 156 2,628 859 43 313 34 43 90 |
1.3.2
Industrial Population
A low level radioactive waste storage
facility is located on
1.3.3
Road Traffic Population
There is only
one road running along the southern edge of
No. of persons = (AADT x Vehicle Occupancy / 24 / Speed)
= 2,170 x 3 / 24 / 50 = 5 persons/km
The traffic along this section of road has
decreased in recent year as more convenient modes of access to
1.3.4
Occupancy and Indoor/Outdoor Fractions
The land population is categorised further
into 4 time periods: night time, weekday, peak hours and weekend day. These are
defined in Table 1.2.
Table 1.2 Population
Time Periods
|
Time Period |
Description |
|
Night time Weekday Peak hours Weekend
day |
7:00pm to 7:00am 9:00am to 5:00pm Monday through Friday, and 9:00am to 1:00pm Saturday 7:00am to 9:00am and 5:00pm to 7:00pm, Monday to Friday 7:00am to 9:00am and 1:00pm to 3:00pm, Saturdays 3:00pm to 7:00pm Saturdays, and 7:00am
to 7:00pm Sundays |
The occupancy assumed [8] during these
time periods is given in Table 1.3.
Different occupancy figures are assumed for each category of land population.
The proportion of the population outdoors is also assumed to vary according to
type of population and time period (Table
1.3).
The hazards that can potentially affect
offsite population are flash fires and thermal radiation from pool fires.
Buildings are assumed to offer protection to its occupants for these events. The
protection factor used is 90%, or equivalently the exposure factor is 10%.
Scenarios are therefore assumed to affect 100% of the outdoor population and
10% of the indoor population.
Road vehicles are also assumed to offer
some protection, although less than a building. An exposure factor of 50% is
used for vehicles.
Table 1.3 Land
Population Occupancy and Indoor/Outdoor Fractions
|
Population |
Occupancy |
% Outdoors |
||||||
|
Type |
Night |
Peak |
Weekday |
Weekend
day |
Night |
Peak |
Weekday |
Weekend
day |
|
Residential Prison Hospital School Road |
100 % 100 % 100 % 0 % 10 % |
50 % 110 % 120 % 10 % 100 % |
20 % 100 % 110 % 100 % 50 % |
80 % 110 % 120 % 10 % 20 % |
0 % 5 % 0 % 0 % 0 % |
30 % 100 % 30 % 100 % 0 % |
10 % 50 % 10 % 20 % 0 % |
20 % 50 % 30 % 20 % 0 % |
1.4
Marine Population Estimation
1.4.1
Vessel Population
The vessel population used in this study
are as given in Table 1.4. The
figures are based on BMT’s Marine Impact Assessment
report [4] except those for fast ferries. The maximum population of fast
ferries is assumed to be 450, based on the maximum capacity of the largest
ferry operating in the Adamasta Channel. However, the
average load factors for fast ferries to Macau and
Table
1.4 Vessel Population
|
Type of Vessel |
Average Population per Vessel |
% of Trips |
|
Ocean-Going Vessel Rivertrade
Coastal vessel Fast Ferries Tug and Tow Others |
21 5 450 (largest ferries with max
population) 350 (typical ferry with max
population) 280 (typical ferry at 80% capacity) 175 (typical ferry at 50% capacity) 105 (typical ferry at 30% capacity) 35 (typical ferry at 10% capacity) 5 5 |
3.75 3.75 22.5 52.5 12.5 5.00 |
1.4.2
Marine Vessel Protection Factors
The population on marine vessels is assumed
to be offered some protection by the vessel structure, in a similar way that
buildings offer protection to their occupants. The degree of protection offered
depends on factors such as:
·
Size
of vessel
·
Construction
material and likelihood of secondary fires
·
Speed
of vessel and hence its exposure time to the flammable cloud
·
The
proportion of passengers likely to be on deck or in the interior of the vessel
·
The
ability of gas to penetrate into the interior of the vessel and achieve a
flammable mixture.
Small vessels such as fishing boats will
provide little protection but larger vessels such as ocean-going vessels will
provide greater protection. Fast ferries are air conditioned and have a limited
rate of air exchange with the outside. Based on these considerations, the
fatality probabilities assumed for each type of vessel are as given in Table 1.5.
Table
1.5 Population at Risk
|
Marine Vessel Type |
Population |
Fatality Probability |
Population at Risk |
|
Ocean-Going Vessel Rivertrade
Coastal Vessel Fast Ferries Tug and Tow Others |
21 5 450 350 280 175 105 35 5 5 |
0.1 0.3 0.3 0.3 0.3 0.3 0.3 0.3 0.9 0.9 |
2 2 135 105 84 53 32 11 5 5 |
1.4.3
Methodology
In this study, the marine traffic population
in the vicinity of
The
marine area around
Table 1.6 Average
Speed and Transit Time of Different Vessel Type [5]
|
Type of Vessel |
Assumed Speed (m/s) |
Transit Time (min) |
|
Ocean-going vessel |
6.0 |
9.9 |
|
Rivertrade Coastal vessel |
6.0 |
9.9 |
|
Fast Ferries |
15.0 |
4.0 |
|
Tug and Tow |
2.5 |
23.7 |
|
Others |
6.0 |
9.9 |
|
|
|
|
The number of vessels traversing each grid
daily was provided by the marine consultant [3]. These are provided in Table 1.7, where the grid cell reference
numbers are defined according to Figure
1.3. The number of marine vessels present within each grid cell at any
instant in time is then calculated from:
Number of vessels = No. of vessels per day x grid
length / 86400 / Speed (1)
![]()
This was
calculated for each type of vessel, for each grid and for years 2011 and 2021.
The values obtained represent the number of vessels present within a grid cell
at any instant in time. Values of less than one are interpreted as the probability
of a vessel being present.
Figure
1.3 Grid Cell Numbering Scheme
Table 1.7 Number of Marine Vessels Per Day
|
Grid No. |
Average Number of Vessels Per Day |
|||||||||
|
2011 |
2021 |
|||||||||
|
OG |
RT |
TT |
FF |
OTH |
OG |
RT |
TT |
FF |
OTH |
|
|
1 2 3 4 5 6 7 8 9 10 11 12 |
0 0 0 0 0 0 0 0 0 0 0 0 |
21 0 0 0 0 21 84 63 0 0 0 0 |
0 0 0 0 0 21 53 21 0 0 0 11 |
99 121 143 121 121 99 0 0 0 0 0 0 |
284 168 210 210 210 210 95 63 11 11 11 168 |
0 0 0 0 0 0 0 0 0 0 0 0 |
23 0 0 0 0 23 92 69 0 0 0 0 |
0 0 0 0 0 23 58 23 0 0 0 12 |
117 143 169 143 143 117 0 0 0 0 0 0 |
311 184 230 230 230 230 104 69 12 12 12 184 |
OG = Ocean-going vessels
RT = Rivertrade
coastal vessels
TT = Tug & tow vessels
FF = Fast ferries
OTH = others
Average
Density Approach
The average marine population for each grid is
calculated by combining the number of vessels in each grid (from Equation 1)
with the population at risk for each vessel (Table 1.6). The results are
shown in Figures 1.4 and 1.5.
This grid population is assumed to apply to all time periods. Note however that
fast ferries are excluded since ferries are treated separately in the analysis
(see below).
When simulating a possible release scenario, the
impact area is calculated from dispersion modelling. In general, only a
fraction of the grid area is affected and hence the number of fatalities within
a grid is calculated from:
Number of
fatalities = grid population x impact area / grid
area (2)
![]()
Figure
1.4 Marine Population at Risk by
Grid, Year 2011
Figure 1.5 Marine
Population at Risk by Grid, Year 2021
Point Receptor
Approach
The average density approach, described
above, effectively dilutes the population over the area of the grid. Given that
ferries have a much higher population than other classes of vessel, combined
with a relatively low presence factor due to their higher speed, the average
density approach would not adequately highlight the impact of fast ferries on
the FN curves. Fast ferries
are therefore treated a little differently in the analysis.
In
reality, if a fast ferry is affected by an accident scenario, the whole ferry
will likely be affected. The likelihood that the ferry is affected, however,
depends on the size of the hazard area and the number density of ferry vessels.
To model this, the population is treated as a concentrated point receptor i.e.
the entire population of the ferry is assumed to remain focused at the ferry
location. The ferry density is calculated the same way as described above (Equation 1), giving the number of
ferries per grid at any instant in time, or equivalently a “presence factor”. A
hazard scenario, however, will not affect a whole grid, but some fraction
determined by the area ratio of the hazard footprint area and the grid area.
The presence factor, corrected by this area ratio is then used to modify the
frequency of the hazard scenario:
Prob. that ferry is affected = presence factor x impact area
/ grid area (3)
![]()
The
fast ferry population distribution adopted was described in Table 1.5. Information from the main
ferry operators suggests that 25% of ferry trips take place at night time,
while 75% occur during daytime. Day and night ferries are therefore assessed
separately in the analysis. The distribution assumed is given in Table 1.8.
Table 1.8 Fast
Ferry Population Distribution for Day and Night Time
Periods
|
Population |
Population at Risk |
% of Day Trips |
% of Night Trips |
% of All Trips (= 0.75 x day + 0.25 x night) |
|
450 350 280 175 105 35 |
135 105 84 53 32 11 |
5 5 30 60 - - |
- - - 30 50 20 |
3.75 3.75 22.5 52.5 12.5 5.0 |
The
ferry presence factor (Equation 1)
and probability that a ferry is affected by a release scenario (Equation 2) are calculated for each
ferry occupancy category and each time period.
Helicopters
shuttling to and from Macau pass fairly close to the
Helicopters
were analysed the same way as fast ferries, namely as mobile receptors with a
presence factor, or probability of being within a grid cell when an accident occurs.
The cruising speed of the
Presence factor = No. of flights per hour x grid
length / 3600 / Speed = 0.028 (4)
![]()
This
presence factor is applied to all grid cells in Figure 1.3. Westbound flights are assumed to pass through the upper
row of grids (cells 1-6) while the return eastbound flights pass through the
lower row of grid cells (7-12). This presence factor is applied to the daytime
period while night time is assumed to have no flights. Each helicopter is
assumed to be full with 12 passengers and crew.
The
presence factor is further modified by the size of the impact area for each
scenario by applying Equation 3.
It
should be noted that this treatment of helicopters is very conservative.
Effectively, the population are treated as being at ground level. In reality,
these helicopters fly at 500 feet and so few release scenarios will be able to
impact on them. However, helicopters are not expected to make a significant
contribution in the results and hence this simplistic approach is regarded as
sufficient.
Marine
vessels and road vehicles were assumed to offer some protection to their
occupants. The same assumption was not applied to helicopters since they will
likely crash if they are impacted by an LNG release. 100% fatality is assumed.
[2] The Annual
Traffic Census 2005, Transport Department, Hong Kong SAR, Jun 2006.
[3] BMT
Asia Pacific Ltd., personal communication, 2006
[4] BMT
Asia Pacific Ltd, Marine Impact Assessment for Black Point & Sokos Islands LNG Receiving Terminal & Associated
facilities, Pipeline Issues, Working Paper #3, Issue 8, Sep 2006
[5] Passenger
Arrivals/Departures and Passenger Load Factors at Cross-Boundary Ferry
Terminals, January to December 2005, Marine Department, Hong Kong SAR.
[6] Projected
Hong Kong Resident Population by TPU, Planning Department, Hong Kong SAR, 2004
[7] Hong Kong
2030, Planning Vision and Strategy, Planning Department, Hong Kong SAR.
[8] ERM,
Liquefied Natural Gas (LNG) Terminal and Associated Facilities – Marine
Quantitative Risk Assessment, Population Survey Report, Jun 2006.