1
introduction
In May 2005,
the Castle Peak Power Company Limited submitted an application for an
Environmental Impact Assessment (EIA) Study Brief (No. ESB-126/2005) to be undertaken on a Liquefied Natural Gas (LNG)
Terminal and Associated Facilities at Black Point (Figure
1.1). As the proposed
development involves marine works (see Part
2 – Section 3.2.1, 3.2.2, 3.2.4, 3.2.5, 3.2.6 and 3.3.3 for details of marine works required), potential impact on
marine archaeological resources would be a concern. Thus, a Marine
Archaeological Investigation (MAI),in accordance with Clause 3.7.8.2(ii) of
the Study Brief, a Marine
Archaeological Investigation (MAI) was required during the Review Phase of the
Project. This report was prepared
by
1.2
Objectives of the Marine Archaeological Investigation
The objectives
of the MAI were to include a phased review/investigation of the Study Areas in
accordance with the MAI Guidelines as stated in ESB-126/2005, which should include the following:
·
Baseline Review on known sources of
archive data as stated in Section 1.2 of the MAI Guideline;
·
Review of Geophysical Survey Raw Data
prepared by CAPCO’s Geophysical Contractor EGS (
·
Review of Magnetic Survey Data prepared
by CAPCO’s Geophysical Contractor EGS (
·
Remote Operated Vehicle Survey prepared
by CAPCO’s Geophysical Contractor EGS (
·
Establish Archaeological Potential; and
·
Provide a Report on these aspects.
This report
represents the MAI results.
Following this
introductory section, the remainder of the report has been structured as
follows:
Section
2 The
legislative framework for the marine archaeological assessments in
Section
3 The methodology used in this survey;
Section
4 The
findings of the baseline conditions (desktop and geophysical surveys) for the
Study Areas;
Section
5 Establish
archaeological potential of the Study Areas; and
Section
6 Assessment
of the impact on the archaeological resources and recommendations.
2
Legislative Requirements and Evaluation Criteria
The
following legislation and guidelines are applicable to the assessment of marine
archaeological sites in
· Environmental
Impact Assessment Ordinance (Cap. 499) and the associated Technical Memorandum
on the EIA Process (EIAO-TM);
·
Antiquities
and Monuments Ordinance (Cap. 53) (AM Ordinance);
·
Land
(Miscellaneous Provisions) Ordinance (Cap. 28);
·
·
Guidelines for Marine Archaeological
Investigation prepared by AMO.
2.1
Environmental Impact Assessment Ordinance Technical
Me
The EIAO-TM
outlines the approaches required in investigating and assessing the impacts on
marine archaeological sites. The
following sections of the EIAO – TM are applicable:
Annex 19: “There is no quantitative standard in
deciding the relative importance of these sites, but in general, sites of
unique archaeological, historical or architectural value will be considered as
highly significant. A baseline
study shall be conducted: (a) to compile a comprehensive inventory of places,
buildings, sites and structures of architectural, archaeological and historical
value within the proposed project area; and (b) to identify possible threats
of, and their physical extent, destruction in whole or in part of sites of
cultural heritage arising from the proposed project.”
The EIAO –
TM also outlines the criteria for assessment of impact on sites of cultural
heritage as follows:
Annex 10: “The criteria for evaluating impact on
sites of cultural heritage includes:
(a) The general presumption in favour of the protection and conservation
of all sites of cultural heritage because they provide an essential, finite and
irreplaceable link between the past and the future and are points of reference
and identity for
The EIAO –
TM also outlines the approach in regard to the preservation in totality;
and in part to cultural resources:
Annex
19: “Preservation in totality will
be a beneficial impact and will enhance the cultural and socio-economical
environment if suitable measures to integrate the sites of cultural heritage
into the proposed project are carried out.
If, due to site constraints and
other factors, only preservation in part is possible, this must be fully
justified with alternative proposals or layout designs, which confirm the
impracticability of total preservation.”
2.2
Antiquities and
The Antiquities and Monuments Ordinance (Cap.
53) (AM Ordinance) provides statutory
protection against the threat of development on
“This Ordinance provides for the
preservation of objects of historical, archaeological and palaeontological
interest…”
The
Ordinance defines an antiquity as a relic (a movable object made before 1800)
and a place, building, site or structure erected, formed or built by human
agency before the year 1800. The
Ordinance also states,
amongst other things, that the discovery of an antiquity shall be reported to
the Authority (Secretary for Home Affairs); that ownership of all relics
discovered after 1976 shall be vested in the Government; that the Authority can
declare a place, building, site or structure to be a monument, historical
building or archaeological or palaeontological site or structure (and therefore
introducing certain additional controls for these sites); and that licences and
permits can be granted for excavation and for other work.
Over the
years, surveys have been undertaken to identify archaeological sites in
Section
11 of the AM Ordinance
requires any person who discovers an antiquity, or supposed antiquity, to
report the discovery to the Antiquities Authority. By implication, construction projects
need to ensure that the Antiquities Authority, the Antiquities Advisory Board
(AAB) ([1]),
is formally notified of archaeological resource which are discovered during the
assessment or construction of a project.
2.3
Land (Miscellaneous Provisions) Ordinance (Cap. 28)
Under this Ordinance, it is required that a permit
should be obtained for any excavation within the Government land prior to any
excavation work commencing.
2.4
The Chapter 10, Conservation, of the HKPSG provides general guidelines and
measures for the conservation of historical buildings, archaeological sites and
other antiquities.
2.5
Marine Archaeological Investigation (MAI) Guidelines
Guidelines for
MAI which detail the standard practice, procedures and methodology which must
be undertaken in determining the marine archaeological potential, presence of
archaeological artefacts and defining suitable mitigation measures were provided in Appendix D of the EIA Study Brief No. ESB-126/2005. Baseline review, geophysical
survey and establishing archaeological potential are considered the first stage
of a MAI. Subject to the results of
the first stage MAI, further investigation may or may not be required.
3
Assessment
Methodology & Scope of work
The methodology
used in this assessment followed the Guidelines for MAIs as prepared by AMO and
comprised the following tasks.
3.1.1
Establish
Baseline Conditions
·
Implement Desktop Research, comprising
a review of geotechnical survey data, historical documents and United Kingdom
Hydrographic Office ‘Wreck’ files to establish the potential for marine
archaeological sites in the Study Area (Black Point terminal, gas pipeline,
watermain and submarine cable);
·
Examination of the seabed and below
seabed using geophysical survey equipment in order to locate and define any
sites of archaeological potential in the Study Areas.
3.1.2
Establish
Archaeological
Potential
The synthesis
and analysis of the baseline conditions were used to establish if there were
any marine archaeological sites in the Study Areas.
3.1.3
Impact
Assessment
Based on the
findings and analysis of the baseline conditions, an assessment was made of the
potential impact of the project on the marine archaeological sites, and
recommendations made to mitigate any impact.
4
Baseline
Conditions
4.1.1
Geotechnical
Data
Generally, the submarine deposits in the
The Chek Lap
Kok Formations, the lowest part of the Quaternary succession are considered to
be Middle to Late Pleistocene in age and consists of colluvium, alluvium and
lacustrine sediments. The marine
sediments on top of this formation are sediments related to the Holocene period
(from about 13,000 BP to the present day) and referred to as the Hang Hau
Formations consisting of clayey silt sediments and some sand.
The Sham Wat
Formation, found between Chek Lap Kok Formations and Hang Hau Formations is
considered to be the Eemian deposit with uncertain age and consists of soft to
firm silty clays with yellowish mottling.
This formation is presently not widespread but only in subcrops beneath
the Hang Hau Formation ([2]).
More modern sediments
are related to the discharge from the Pearl River, (and which would have an
effect on the project area, being located down stream from the mouth of the
Fyfe([4])
further explains the rate of sedimentation:
“In
general, present day sedimentation rates in
During the
late Pleistocene period (18,000BP) sea levels began to rise until about 6,000
years BP to levels similar to the present day. “The extent of the rise could be as
great as perhaps 140 metres in parts”([5]).
The sediments
of the Late Holocene period, considered to be relatively homogenous very soft
to soft silty clay and with high moisture content, offers the greatest
potential to include well preserved remains associated with the occupation and
use of the islands in
4.1.2
Review
of Historical Documents
The water between Shekou (situated in Shenzhen) and Black Point was in
use as a war junk anchorage since the 8th century. In the 8th century (Tang
Dynasty), Black Point was within the military division area of Tunmen Bing Zhen
(屯門兵鎮) where 2,000 soldiers were under the command of one Defence
Commissioner. The headquarters of
this division was situated in the present Nantou (南頭) walled city
of Shenzhen and its military division area also covered the HKSAR, as well as
the Huizhou (惠州) and Chaozhou (潮州) areas ([6]). The military division was
serving the same area until the Yuan Dynasty (A.D.1279-1368).
In the late 16th century (Ming Dynasty), China was facing
more frequent disturbance from coastal invaders and more forts and beacon
towers were set up to protect the key locations from Japanese pirates. The Nantou Military Division (南頭寨) was set
up in 1565. It commanded 53 war
junks and 1,486 soldiers ([7]) . The military force was
increased to 1,659 soldiers in 1645.
During this period, the Portuguese explorer, Jorge Alvares was permitted
to land on
A review of a
historical chart of the mouth of the Pearl River dated 1658 ([10]), also indicated that the waters between Black Point and
During the Ming
to Qing Dynasties (A.D.1368 -1911), Imperial Junks sailing from Guangdong to
Southeast Asian countries were required to anchor at a bay known as Chiwan (赤灣) of Nantou
peninsula, located to the west of Shenzhen City (located some 9km north of
Black Point). A
Based on the
historical development review, it is considered that Black Point is located in
the vicinity of a busy marine sea route.
The water area at Black Point,
Marine archaeology is still a new area in
4.1.3
The United
Kingdom Hydrographic Office (UKHO) in
The Hong Kong
Marine Department could not provide any additional information beyond what was
provided by the UKHO. However,
discussion with the Marine Department noted that a wreck adjacent to Sha Chau/Lung
Kwu Cha had been lifted in March 2006.
The wreck is a Chinese engineering vessel mostly damaged and
approximately 10 m x 3 m x 2 m in size.
It is estimated that the wreck was about 30 years old (see Figure 4.10 for location and Figure 4.19 for a description).
4.2.1
Introduction
The objective
of the geophysical survey was to define the areas/sites of greatest
archaeological potential by establishing the depth and nature of the seabed
sediments and mapping any seabed and sub-bottom anomalies which may be
archaeological material. This
information is provided below.
4.2.2
Survey
Scope
The survey
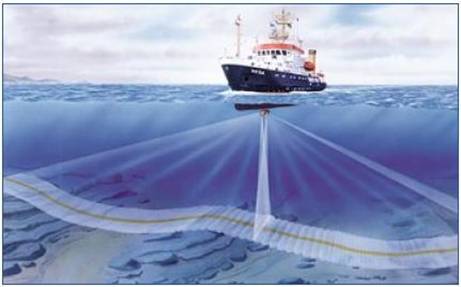
scope (see Figure 1.1) of the Geophysical
Survey covers the proposed Approach Channel,
4.2.3
Survey
Methodology
Geophysical
Surveys were undertaken by CAPCO contractor, EGS (
·
Multi-Beam EchoSounder (Seabeam 1180
multi-beam system, 180
kHz transducer and cable, Anschutz Raytheon Gyrostar II gyrocompass, Seatronix
MRU 5, Valeport Model 600 temperature/salinity profiler)
·
Single-Beam EchoSounder (Knudsen Model
320 survey echo sounder, Dual frequency transducer, Bar Check);
·
Navigation & Positioning (C-Nav
DGPS System w/ 50m cables, C-Nav Antenna Stand, Navigation PC, Navigation
Monitor, Marine Radio, Hand Held Radio Set w/ Charger);
·
Subbottom Profiler (C-Boom low voltage
boomer system, EGS TVG Processor, C-Phone hydrophone system, 120/138 Waverley
Recorder);
·
Side Scan
Sonar System (Klein 3000 side scan sonar system);
·
Measurement of Currents (RD Instruments
acoustic Doppler current profiler (ADCP))
·
Magnetometer ("SeaSPY",
manufactured by Marine Magnetic Ltd); and
·
Other Computer facilities (C-View
Logging System & monitors, C-View Int. System, Printers (B/W), UPS for
computer systems).
4.2.5
Review
of Geophysical Survey Results
The geophysical survey data
obtained by EGS were processed by in house geophysicists and reviewed by the
marine archaeologist. The
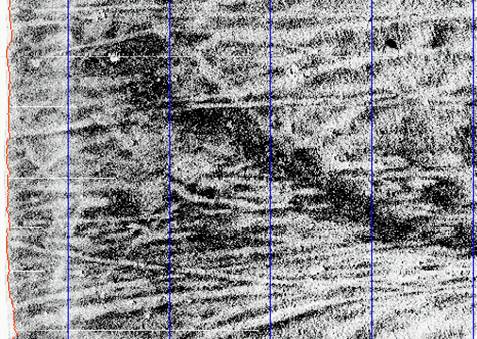
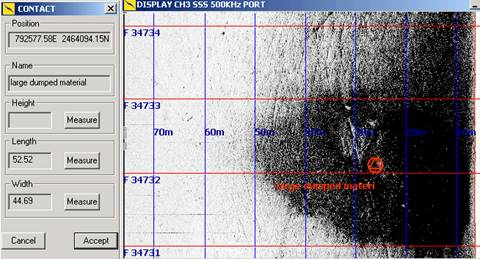
geophysical survey showed how the seabed in the Survey Area had been impacted
by anchoring, trawling (Figure 4.2)
and the dumping of materials (Figure 4.3). Anchoring and trawling will reduce the
archaeological potential of the seabed in these areas as will the dumping of
materials, although this activity can also enhance the archaeological potential
by providing a protective covering over sites (it can also interfere/damage
sites through this activity). It
makes it very difficult, potentially impossible to assess the archaeological
potential of these parts of the seabed.
In addition, it located Sonar Contacts comprising natural features,
dumped materials, shipwrecks, linear debris, anchor marks and fishing devices. In a further review of the Sonar
Contacts identified a site (Figure 4.4) as
possible wrecks off Black Point area (Table
4.1). The Sonar Contact
discounted as possible wreck based on a combination of factors, which included
the interpretation and a comparison of the geophysical signatures with those
signatures that were clearly wrecks (and possibly wrecks), debris and dumped
materials. Wrecks as seen in the
side scan sonar images have identifiable relief (as seen in the shadows they
develop on the side scan sonar images) and features that could be considered
not-natural, such as straight lines delineating its boundaries. In comparison
debris could show relief but it is characterised by natural, rounded features
and boundaries. Dumped materials
and some debris were characterised by areas of a darker/black section of the seabed
on the side scan sonar images consisting of coarser materials/sediments with
little or no relief. The assessment
also included the context of the Sonar Contact with its surrounding seabed
environment, where identifiable dumped materials/debris was found to be in the
very near vicinity. The raw data for all the Sonar Contacts was reviewed by the
marine archaeologist using the above criteria.
|
|
Figure
4.2 Geophysical
Survey Showing How the Seabed Was Impacted By Anchoring & Trawling
|
|
Figure
4.3 Geophysical
Survey Showing How the Seabed Was Impacted By The Dumping Of Materials
Table 4.1 Sonar Contact
Located off Black Point
|
Contact number |
Latitude Longitude |
Easting Northing |
KP RPL offset |
Dimensions (m) |
Description |
|
SC086 |
22° 24.388' N 113° 54.072' E |
798693.9E 2480702.4N |
39.148 1572m SW |
10.77m x 3.31m x 2.03m |
Possible wreck |
|
|
|
|
|
|
|
The above
anomaly is sitting on the seabed. A
review of the boomer data failed to identify any sub-bottom anomalies.
Based on the
side scan sonar image there was a degree of doubt if SC086 was a shipwrecks
(see Figures 4.4 and 4.5).
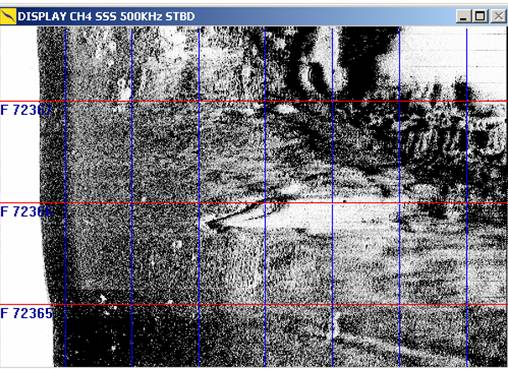
Figure 4.5 Possible
Wreck (SC086)
It was this
degree of doubt in some of the sites as well as the possibility that the
recognisable shipwrecks could be modern sites, i.e., post-1800 (the date which
Antiquities and Monuments Ordinance defines an antiquity as a relic) that
prompted the recommendation that a Magnetic Survey be conducted on the above
sites to ascertain how much ferrous material remains on the anomalies. While
pre-1800 ships would have carried ferrous equipment and used ferrous material
in their construction, later ships could potentially be modern ferrous barges
or timber vessels with larger amounts of ferrous material and used today in and
around
4.3.1
Survey
Scope and Methodology
For the purpose
of the MAI, a Magnetic Survey covering the 3 Sonar Contacts as presented in Table 4.1 was undertaken by EGS from 2
to 4 September 2005([14]). Survey lines around 100m long were
surveyed for the Contact, with a line spacing of 5 m (see Figure 4.6). The 100m line lengths were selected to
allow time for the magnetic sensor to be deployed close to the seabed and
moving smoothly at a fixed level by the time it passed across the feature. The line interval of 5m was selected as
magnetic anomalies decay rapidly with distance from the ferrous material
(usually an inverse cube relationship), and a wider spacing risked completely
missing a magnetic anomaly.
Magnetometers
have been used in maritime archaeology for about 40 years to locate and map
shipwrecks, both iron shipwrecks and non-ferrous shipwrecks (Green, 2004:
62-73)([15]).
Ferrous material (such as anchors, cannons, nails, chain, etc.) contained in a
shipwreck will change the intensity of the earth’s magnetic field and this
change in intensity can be measured with a magnetometer sensor towed behind a
boat. For a typical object (such as a shipwreck) the intensity of the magnetic
anomaly varies as the inverse of the cube of the distance from the anomaly and
the unit of measurements is known as a nano Tesla (nT). The SeaSPY magnetometer
used in this survey can detect changes in intensity of less than 1 nT. A 5 nT
change in intensity will detect a 10 tonne shipwreck at 45 metres, a 10kg
cannon ball at 3 m and a 2 tonne cannon at 27 m (Green, 2004: 63). Conversely,
a 10kg cannon ball will produce a change in intensity of c.2-3 nT at 5 m
(distance from sensor to seabed in this survey) and a 2 tonne cannon will be
produce a change in intensity of c.600 nT at 5 m.
When searching
for shipwrecks, magnetometers use wide search lanes, perhaps 50, 100 or
hundreds of metres depending on the size of the anomaly to provide an exact
location, with little detailed information about the nature of the anomaly. In
this survey, the SeaSPY magnetometer was used to implement close-plot surveys
over small areas of a number of sites, using a maximum of 5 m search lanes and
with the instrument capable of taking a reading every 0.25 second. This enabled
detailed magnetic contour plans to be developed which in association with other
surveys, such as other remote sensing surveys can assist in ascertaining the
nature of a site. These accurate contour plans can help to locate discreet
anomalies such as cannons, anchors, even iron fittings used in wooden hull
construction.([16])
Large intensity anomalies without many discreet anomalies could be single
objects, such as a cannon, an anchor, an engine, dumped materials and the ship
itself if constructed of ferrous material.
It is highly
unlikely that timber vessels of any size from small sampans to large junks
would not contain some ferrous material.
Iron nails have been found in use on Chinese ships dating back to 220BC,
together with the use of iron adzes and chisels used in their construction and
maintenance ([17]). Some pieces of iron equipment in the
form of anchors, grapnels, guns, machinery have also been used on Chinese junks
for over 1000 years. The quantity and distribution of the ferrous material
(found through an analysis of the intensity of the anomaly and an examination
of the close-plot contour plans) will in association with the other surveys
help to identify the nature of the site and was the major objective of the
magnetic survey.
4.3.2
Turbidity
and Visibility
A vertical profile
of turbidity was recorded for the Sonar Contact, with closely spaced readings
close to the seabed and wider spacing close to the sea surface. The turbidity sensor was attached to a
Secchi disc, so that the greatest depth that visible objects could be seen from
the survey boat was also recorded.
4.3.3
Magnetometer
The
magnetometer was deployed 15m behind the survey vessel, to separate the
magnetometer sensor from the magnetic effect of the vessel’s steel engine. In shallow water close to coastlines, in
less than around 5m of water, the sensor and cable were buoyed with floatation
material to keep them close to the sea surface. In deeper waters away from the shore,
non magnetic (brass) weights were attached to the sensor so that it would sink
down close to the seabed. The
position and quantity of these weights was adjusted until the pressure sensor
attached to the magnetometer
showed that the magnetometer sensor was within 5m of the seabed,
without striking the seabed.
The magnetic
field strength measured in the sensor was transmitted up the towing cable to
the survey vessel, where the values were logged together with the navigation
information on a computer logging system.
4.3.4
Positioning
and Navigation
Surface
positioning was provided by GcGPS during all of the work: C-Nav provided
primary positioning with a one sigma standard deviation of 0.5m for this
project. A C-Nav antenna provides
the GcGPS position of the vessel on a C-Nav decoder. For each position update, an NMEA string
(GGA, VTG) was sent from the C-Nav decoder directly to the computer logging the
navigation and magnetometer information.
4.3.5
Magnetic
Survey Results
The regional
gradient and diurnal variability was subtracted from the measured values using
proprietary EGS software, leaving the background geological magnetic field; in
The results
are summarised in Section 4.3.6 below
in the description of the magnetic surveys and in Figures 4.8 and 4.9.
The vertical
profile of turbidity measurements and the Secchi disc depths are presented in Annex
12-B-A.
The turbidity
readings and Secchi disc depths suggest that visibility near the seabed will be
less than 1m for much of the route, so it is likely to be difficult for divers
to make a visual inspection of these features.
4.3.6
Description
of the Magnetic Surveys
M11 West
of Black Point. >1,000nT anomaly associated with sonar contact SC086 (11m
long wreck) confirms presence of ferrous material.
4.3.7
Interpretation
of the Magnetic Anomalies
The magnetic
sensor was within 5 m of the seabed/sonar contact. If a Sonar Contact was timber vessel
with no or little ferrous fastenings, equipment, stores or cargo then they may
not produce any addition to the 1-2nT variation. However, it is considered that
a vessel of pre-1800 would contain some ferrous fittings, equipment, stores or
cargo that would provide a significant change (greater than 1-2nT) in the
earth’s magnetic field given the magnetic sensor was within 5 metres of the
Sonar Contact. Another possibility
is that these anomalies are very old, pre Iron Age vessels, but given their
location, i.e., exposed on the seabed, this is not realistic. SC086 is considered to be a vessel of some sort. Given the relatively low magnetic
signals for the size of the anomaly and at the distance of the magnetic sensor
to the anomaly that it is not solely made of iron, but is of a composite
material, possibly timber and iron/steel.
4.4
Remote Operated Video (ROV)
One
possible wreck (SC086) was identified and has been presented in Table 4.2 and Figure 4.4. In order to identify its nature and age,
an inspection of the sites was undertaken on the 15th February 2006,
carried out by EGS using their Remote
Operated Vehicle (ROV) from their work-boat and employing EGS
staff (six in total) to operate the ROV, the positioning equipment (DGPS) and
boats. The ROV is a small piece of equipment that contains a video
with lights and is controlled by an operator on the boat. It can be propelled (using a surface
generator attached with a cable to the ROV) to move about in the water. However this model (Titan) cannot
operate against much current and needs to be used as a ‘drop camera’, i.e. to
be simply dropped onto the site to be inspected and to be moved by operators
with ropes from the Figures 4.8(i) and 4.8(ii)). The ROV was dropped on some of the sites
from the work-boat (Figure 4.8(iii)) and the sampan
depending on current and site location (Figures 4.8(iv)).
Table
4.2 Identified
Archaeological Potential Site
|
Contact
number |
Latitude Longitude |
Easting Northing |
KP RPL
offset |
Dimensions
(m) |
Description |
|
SC086 |
22° 24.388' N 113° 54.072' E |
798693.9E 2480702.4N |
39.148 1572m SW |
10.77m x 3.31m x 2.03m |
Possible wreck |
Most videos will work in low lux (amount of luminosity)
values of 5-15 lux (10 lux is early twilight or light from 60 watt bulb from 3 metres
away; 1 lux is late twilight; and 0.1 lux is light from a full moon). It was
anticipated that the water in the vicinity of the sites would be turbid (from
suspended sediments) and most likely with a very low lux value.
Tides during
the day were 0.5m at 0505; 1.5m at 1117; 1.0m at 1607; and 2.1m at 2239. The
weather was overcast, either fog, pollution or a combination and which would
have only contributed slightly to the underwater visibility.
4.4.1
ROV
Results
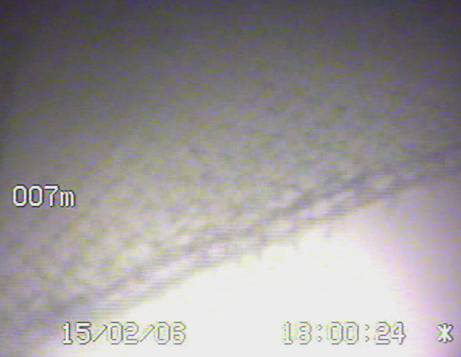
SC086 (5:35pm) (Figure 4.9)
This site is
located about 20m from the rocks at Black Point in 7 m of water and was not
found during the ROV survey. The visibility was zero, the water had a very
muddy appearance on the surface. There was a slight breeze and given the busy
shipping activity in the vicinity, there was at times a choppy sea. The ROV Video camera did show what was
most likely rocks (or possibly wreckage) and the remains of some fishing nets
(see Figure 4.10 for the clip of
video record).
Due to the
lack of visibility, the nature and age of SC086 could not be determined. The presence of fishing nets found on
SC086 also makes diver surveys hazardous for this and the other sites that
could contain nets, given their prominence on the seabed and the likelihood of
entrapment.
It was
recommended that more detailed remote sensing work incorporating multibeam
sonar and side scan sonar data be undertaken for the site so that the sonar
data can be used to develop three dimensional models that can be rotated and
viewed at different angles. These
very accurate virtual models are the closest thing to viewing the real site and
are currently the best system that can be used in nil visibility situations. In combination with more detailed side
scan sonar surveys and the existing magnetometer data (or closer plot
magnetometer survey data) it may be possible to identify rope or other modern
artefact/equipment that will confirm the nature and age of the sites.
It is
problematic if diver surveys would be more useful in determining the nature of
the sites. The ROV with its low lux values can ‘see’ better than human eyes and
while a diver can feel objects, he/she may not be able to produce objective
results in the form of drawings as they would be reliant on their memory or the
translation of their surface, diving supervisor when noting their descriptions.
It was considered more useful to implement a multi beam survey which produces
objective and recordable results and in combination with the other remote
sensing surveys provides for more comprehensive and independent assessments.
|
|

Figure 4.9 Area at
SC086
Figure
4.10 Video Clips Showing
SC086
4.5
Side Scan Sonar and Multi Beam Sonar Survey
Further to the ROV result, a further detailed Side Scan
Sonar and Multi Beam Sonar Surveys was undertaken by EGS in April 2006 for the
Sonar Contact SC086. The
survey track plot is shown in Figures 4.11.
The main
equipment used for the survey is shown in Table
4.3.
Table 4.3 Equipment
Used for the Side Scan Sonar and Multi Beam Sonar Surveys
|
Survey System |
Manufacturer |
Model Number |
|
Swath Bathymetry |
Reson A.s. |
400 kHz 8125 |
|
Side Scan Sonar |
Klein Associates Inc |
System 3000 |
|
Positioning |
C&C Technologies Inc |
C-Nav GcDGPS |
|
Navigation |
C-Products Ltd |
C-View Nav |
The navigation
receiver was placed vertically above the swath transducer mounted on the side
of the survey vessel. As the vessel
travelled along the survey traverses, the system transmitted a fan of echo
sounder beams down into the water column to map the shape of the sea bed in
great detail. The geometry is
illustrated in Figure 4.12.
Figure
4.12 Illustrations of Swath
Bathymetry Systems
At each
location, the survey vessel sailed along four traverses around the artefact,
“boxing in” and isonifying the sonar contact from each side. The measurements from each side were
combined into a single image using the QinSys processing software supplied with
the swath system. The level of each
sounding has been colour coded, using a spectrum of colours to represent the
range of levels found at each location.
To give the impression of looking at the sonar contact from different
directions, the image has been rotated in three dimensions before capturing the
image. The images are presented in the results.
At each
location, the survey boat sailed along four traverses to box in the sonar
contact and isonify it from each direction, as for the swath measurements. The side scan sonar fish was towed
behind the survey vessel a few metres above the sea bed. As it travelled along the survey
traverse, the transducers emitted sound pulses to either side and measured the
echoes from features on the sea bed.
The arrangement is illustrated in Figure
4.13.
|
|
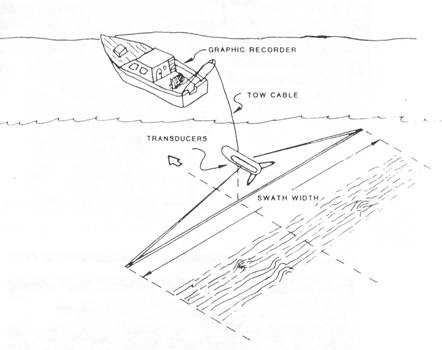
Figure
4.13 Schematic Illustration
of Side Scan Sonar System Operation
A dual
frequency (100 kHz and 500 kHz) system was used. The echoes for each frequency were
recorded separately using the C-View acquisition system. Amplifier gains were applied to
compensate for geometrical dispersion of the wave intensity with distance: no
other processing was applied.
The images for
each pass were examined and the clearest images for each contact were selected
for printing in the results.
4.5.4
Side
Scan Sonar and Multi Beam Sonar Surveys Findings
After EGS
completed the Side Scan Sonar and Multi Beam Sonar Surveys, an analysis of this
new data in context with the earlier survey work (side scan sonar survey and
magnetometer data) was carried out by the marine archaeologist. The result is presented below.
SC086
In the side scan sonar survey in 2005, the following
assessment was made of this anomaly.
A vessel 10.77m x 3.31m x 2.03m in dimensions and located at 798694E,
2480702N (see Figure 4.5).
The magnetometer survey found this anomaly to contain in
excess of 1,000nt more that the surrounding area. This was estimated to be in excess
of 2-3 tons of ferrous material and given the size of the anomaly, this site
was interpreted as a wooden vessel containing a reasonable amount of
iron/steel.
On the 6th and 7th April 2006 the area
was surveyed with the multi beam sonar and the side scan sonar and better
images of the vessel were obtained (See Figure
4.14.
|
|
|
|
|
|
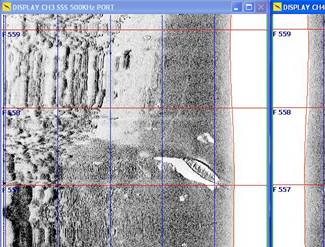
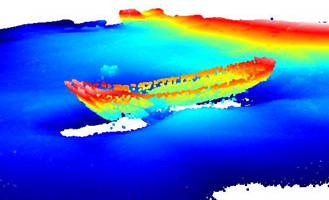
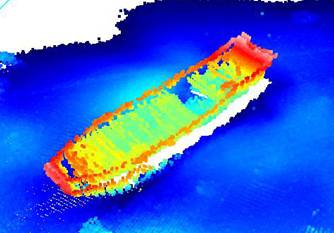
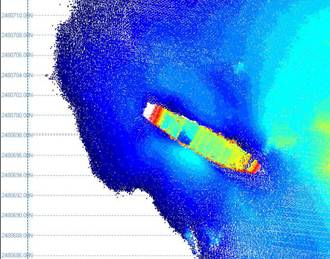
Figure 4.14 Top Left: Side Scan Sonar Image of SC086
UNDERTAKEN in April 2006 (Centre)
Top
Right :General View of the Vessel by the Multi Beam Sonar
Bottom
Left: Sampan with What Looks Like a Hole Towards One End of the Vessel
Bottom
Right: Plan View of Sampan Confirming Damage in the
The vessel and its location has all the appearances of a
‘recent’ motorised wooden sampan (see Figure
4.15). Located close to the
rocks at Black Point and effected by the swells breaking over it, and the
continual sea traffic, the vessel could not be expected to maintain its
integrity for very long (perhaps months or just a year or so). Seats can be seen in the vessel and it
shows damage to its hull which is considered to have been caused from its
continual movement. A vessel of
pre-1800 age would not be in this condition in this location. The Marine Department salvaged a similar
looking sampan on the 22 March 2006 (see Figures 4.4 and 16) which they reported was about 30
years old. SC086 is probably of a
similar vintage.
Figure 4.15 A Motorised Sampan of about the Size of
SC086
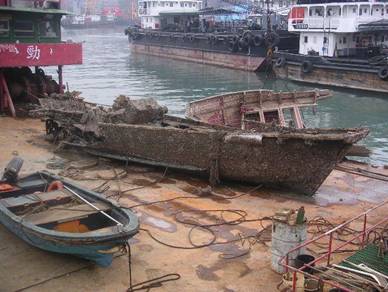
Figure 4.16 Recently Recovered by Marine Department with
Dimensions Similar to SC086 (Source: Marine Department)
5
Impact
Assessment
Literature review supplemented by Geophysical Survey,
Magnetic Survey and further detailed side scan sonar and multi beam sonar
survey identified one shipwreck (SC086) within the Study area. However, based on the survey data, the
result indicated that SC086 is considered to be a motorised sampan. In the context with the AM Ordinance (Cap. 53), the site is not
an antiquity or relic and of no archaeological value. Thus, due to the lack of archaeological
value of the site, impact to it is considered acceptable.
6
Conclusions
and Recommendations
Literature review supplemented by Geophysical Survey,
Magnetic Survey and further detailed side scan sonar and multi beam sonar
survey identified one shipwreck (SC086) within the Study area. However, based on the survey data, the
result indicated that SC086 is considered to be a motorised sampan. In the context with the A M Ordinance (Cap. 53), the site is not
an antiquity or relic and of no archaeological value. Thus, due to the lack of archaeological
value of the site, impact to it is considered acceptable. No mitigation measure is considered
necessary.