9.1
Introduction
This
Annex presents the findings of ecological studies of Black Point and the
surrounding Study Area. Marine ecological
habitats and resources have been identified and the ecological value of the
Study Area evaluated. The assessment has
been based on a review of the currently available literature, as well as
detailed field surveys to provide the most up-to-date information on existing
conditions. Rationales for the surveys
are presented, followed by the methodologies employed, results obtained and a
discussion of the results and comparison with other similar studies. The findings of this report will form the basis
of establishing the ecological importance of Black Point.
9.1.1
Ecological Study Area
The
Study Area for the ecological assessment is 500m from the boundary of the
proposed LNG terminal at Black Point.
The Black Point LNG
terminal is proposed to be located on the north face of the Black Point
headland, as presented in Figure 9.1.
Due to the steep slopes on the existing headland, some reclamation will
be required to provide sufficient land for development. The jetty for the LNG carrier extends
northwest, perpendicular to the coastline.
To allow navigation for the LNG carrier, an approach channel and turning
circle is required.
The
Study Area for the terrestrial ecology baseline has included the footprint of
the proposed LNG terminal at Black Point and the surrounding land-based
habitats (500m from the Project Area).
The Study Area for the marine ecology baseline has incorporated the
proposed approach channel and turning circle as well as the reclamation area.
9.2
Legislative
Requirements and Evaluation Criteria
9.2.1
Introduction
This section summarizes all legislative
requirements and evaluation criteria for the protection of species and habitats
of marine ecological importance.
9.2.2
Legislative Requirements and Evaluation
Criteria
Legislative requirements and evaluation
criteria relevant to the study are as follows:
1.
Marine Parks Ordinance (Cap 476);
2.
Wild Animals Protection Ordinance (Cap
170);
3.
Protection of Endangered Species of
Animals and Plants Ordinance (Cap 586);
4.
Town Planning Ordinance (Cap 131);
5.
Hong Kong Planning
Standards and Guidelines Chapter 10 (HKPSG);
6.
The Technical Memorandum on Environmental
Impact Assessment Process under the Environmental Impact Assessment Ordinance
(EIAOTM);
7.
United Nations Convention on Biodiversity
(1992);
8.
Convention on Wetlands of International
Importance Especially as Waterfowl Habitat (the Ramseur Convention);
9.
PRC Regulations and Guidelines; and,
10. City University of Hong Kong
(2001). Agreement No. CE 62/98, Consultancy Study on Fisheries and Marine
Ecological Criteria for Impact Assessment, AFCD, Final Report July 2001.
9.2.3
Marine Parks Ordinance (Cap 476)
The Marine Parks Ordinance (Cap 476)
provides for the designation, control and management of marine parks and marine
reserves. It also stipulates the
Director of Agriculture and Fisheries as the Country and Marine Parks Authority
which is advised by the Country and Marine Parks Board. The Marine Parks
and Marine Reserves Regulation was enacted in July 1996 to provide for the
prohibition and control certain activities in marine parks or marine reserves.
9.2.4
Wild Animals Protection Ordinance (Cap
170)
Under the Wild Animals Protection Ordinance (Cap 170), designated wild
animals are protected from being hunted, whilst their nests and eggs are
protected from destruction and removal.
All birds and most mammals including all cetaceans are protected under
this Ordinance, as well as certain reptiles (including all sea turtles),
amphibians and invertebrates. The Second
Schedule of the Ordinance that lists all the animals protected was last revised
in June 1997.
9.2.5
Protection of Endangered Species of
Animals and Plants Ordinance (Cap 586)
The Protection
of Endangered Species of Animals and Plants Ordinance (Cap 586) was enacted
to align Hong Kong’s control regime with the
Convention on International Trade in Endangered Species of Wild Fauna and Flora
(CITES). With effect from 1 July 2006, it replaces the Animals and Plants (Protection of Endangered Species) Ordinance
(Cap 187). The purpose of the Protection of Endangered Species of Animals
and Plants Ordinance is to restrict the import and export of species listed
in CITES Appendices so as to protect wildlife from overexploitation or
extinction. The Ordinance is primarily related to controlling trade in
threatened and endangered species and restricting the local possession of them.
Certain types of corals are CITES listed, including Blue coral (Heliopora coerulea),
Organ pipe corals (family Tubiporidae), Black corals
(order Antipatharia), Stony coral (order Scleractinia), Fire corals (family Milleporidae)
and Lace corals (family Stylasteridae). The import,
export and possession of listed species, no matter dead or living, is
restricted.
9.2.6
Town Planning Ordinance (Cap 131)
The recently amended Town Planning Ordinance (Cap 131) provides for the designation of
areas such as “Coastal Protection Areas”, “Sites of Special Scientific Interest
(SSSIs)”, “Green Belt” and "Conservation Area”
to promote conservation or protection or protect significant habitat.
9.2.7
Hong Kong
Planning Standards and Guidelines Chapter 10
Chapter
10 of
the HKPSG covers planning
considerations relevant to conservation.
This chapter details the principles of conservation, the conservation of
natural landscape and habitats, historic buildings, archaeological sites and
other antiquities. It also addresses the
issue of enforcement. The appendices
list the legislation and administrative controls for conservation, other
conservation related measures in Hong Kong,
and Government departments involved in conservation.
9.2.8
Technical Memorandum on Environmental
Impact Assessment Process under the Environmental Impact Assessment Ordinance
Annex
16
of the EIAOTM sets out the general
approach and methodology for assessment of ecological impacts arising from a
project or proposal, to allow a complete and objective identification,
prediction and evaluation of the potential ecological impacts. Annex 8
recommends the criteria that can be used for evaluating ecological impacts.
9.2.9
Other Relevant Legislation
The Peoples’ Republic of China (PRC) is a
Contracting Party to the United Nations
Convention on Biological Diversity of 1992.
The Convention requires signatories to make active efforts to protect
and manage their biodiversity resources.
The Government of the Hong Kong Special Administrative Region has stated
that it will be “committed to meeting the environmental objectives” of the
Convention ([1]).
The Convention
on Wetlands of International Importance Especially as Waterfowl Habitat
(the Ramseur Convention) applies in the HKSAR.
The Convention requires parties to conserve and make wise use of wetland
areas, particularly those supporting waterfowl populations. Article 1 of the Convention defines wetlands
as "areas of marsh, fen, peatland or water,
whether natural or artificial, permanent or temporary, with water that is
static or flowing, fresh, brackish or salt, including areas of marine water the
depth of which at low tide does not exceed six meters." The Mai Po/Inner Deep Bay wetland was
declared a Wetland of International Importance (“Ramseur site”) under the
Convention in 1995.
The PRC in 1988 ratified the Wild Animal Protection Law of the PRC,
which lays down basic principles for protecting wild animals. The Law prohibits killing of protected
animals, controls hunting, and protects the habitats of wild animals, both
protected and non-protected. The Law
also provides for the creation of lists of animals protected at the state
level, under Class I and Class II. There
are 96 animal species in Class I and 156 in Class II. Class I provides a higher level of protection
for animals considered to be more threatened.
9.3
Marine Ecological
Resources
9.3.1
Introduction
This section of the report describes the
baseline conditions of the marine ecological resources at Black Point and the
Study Area. Baseline conditions have
been assessed based on a review of the findings of relevant studies and the
collation of available information regarding the marine ecological resources of
this part of Hong Kong.
Based on this review, an evaluation of the
information collected was conducted to identify any gaps that need to be filled
in order to conduct an assessment of ecological importance of the marine
habitats. Where information gaps were
identified, or where certain habitats or species were considered to warrant
further attention, field surveys have been conducted.
9.3.2
Site History
The site for the proposed LNG terminal at
Black Point is in close proximity to the existing Black Point Power Station
near the northern reaches of the Urmston
Road and at outer Deep Bay. Black Point is located in the northwestern waters of the Hong Kong Special Administrative
Region (SAR). The surrounding waters are
relatively shallow, often less than –5mPD.
9.3.3
Literature Review
Based on the literature review the following
habitats and/or organisms of ecological interest have been identified at Black
Point:
·
Hard
Bottom Habitats; and
·
Soft
Bottom Habitats;
·
Marine
Mammals.
The existing conditions of each of the
above habitats/organisms based on available literature are presented in the
following sections.
9.3.4
Hard Bottom Habitats
Approximately 80% of Hong
Kong’s complex shorelines and many islands are composed of rocky
outcrops. Shores in Hong
Kong display characteristic zonation
patterns, with a progression of different species along the vertical gradient
from terrestrial to marine environments.
For the purposes of this review, information will be presented on
assemblages that occur along the full gradient from the essentially marine, subtidal area, to the semi-terrestrial, intertidal
area.
Intertidal Hard Bottom Habitats
No recent studies have been conducted
on the shoreline at Black Point, a study in the early 1990’s to the south of
the headland indicated that the intertidal hard
bottom communities contained species that were typical of semi-exposed shores
in Hong Kong ([2]).
Prior to the construction of the Black
Point Power Station, shoreline surveys were conducted along the Black Point headland. The results recorded that the rocky shoreline
did not possess a diverse intertidal community nor habitats of significance in comparison to those found in southern
and eastern Hong Kong ([3]).
A more recent study reported that the
majority of intertidal species recorded in the
northern part of Lung Kwu Tan Bay were common in Hong
Kong and of generally low abundance and diversity ([4]).
No species of conservation value were recorded.
Subtidal Hard Bottom Habitats
Coral reefs support a range of species
providing shelter, feeding, spawning and nursery areas, resulting in the large
and diverse community for which they are renowned. The coral reef system has been shown to be
sensitive to pollution and impacts from development can cause the ecosystem to
collapse, resulting in widespread mortality of coral and the numerous
associated organisms. Natural
fluctuations in water quality can also regulate coral communities.
The Agriculture, Fisheries and
Conservation Department report that there are over 80 species of corals
recorded in Hong Kong waters ([5]).
It appears that coral distribution in Hong Kong is primarily controlled
by hydrodynamic conditions as Hong Kong’s western
waters are influenced by the Pearl River Estuary, which lowers salinities. The greatest diversity and abundances of
corals are generally found in the northeastern waters
of Hong Kong due to the optimal environmental
conditions for settlement, growth and survival found in these waters. The western and southern waters of Hong Kong are influenced by the Pearl River Estuary,
greatly reducing salinities, increasing turbidity and therefore reducing light
penetration. Ahermatypic
octocorals, including soft and black corals, which
unlike the hermatypic hard corals do not require
light for zooxanthellae photosynthesis, are more
widely distributed and often occur at greater depths.
As part of a study for the EIA of the
Aviation Fuel Receiving Facility at Sha Chau, dive surveys were undertaken at Sha
Chau in order to investigate the hard bottom
communities ([6]).
The surveys found that only a few hermatypic
hard corals (Family Faviidae) were recorded within
the subtidal of the survey area.
Although these surveys were conducted at
some distance from Black Point, the results of these surveys are deemed
applicable due to similar environmental conditions. As such, coral communities of ecological
value are not predicted to occur within the Study Area. Whilst it is possible that solitary
gorgonians and sea pens may be present within the subtidal
areas, large or important communities of hermatypic
hard corals are not expected due to the unfavourable conditions imposed by the
water quality.
9.3.5
Soft Bottom Habitats
Subtidal Soft Bottom Habitats
Epifaunal Assemblages
Subtidal soft bottom habitats, as well as
supporting infaunal species, commonly support
macro-benthic epifauna. These organisms are generally greater than
1mm in size and live either on or within the surface sediments.
A review of 10 years of data on fisheries
resources collected from demersal trawls conducted as
part of the ongoing marine monitoring of contaminated mud disposal at the East
of Sha Chau Contaminated
Mud Pits provides data on epifaunal assemblages in
the vicinity of the Lung Kwu Chau
and Sha Chau Marine Park ([7]).
As these areas are in relatively close proximity to Black Point, these
data can be considered to be representative of the epifaunal
assemblages in this area.
These data indicate that epifaunal assemblages are dominated by gastropods (eg Turritella terebra),
crabs and mantis shrimps. Abundance and
species composition was considered to be relatively low in comparison to other
areas in Hong Kong. No species that were considered to be rare in
Hong Kong were found.
Based on the above, the epifaunal assemblages in the proposed Study Area are
considered to be of low abundance, diversity and biomass in comparison to other
areas of Hong Kong and have, thus, not been
identified of conservation interest.
Infaunal Assemblages
Soft sediments consisting of silt, clay
and sand dominate the seabed of Hong Kong. These soft bottom habitats support infaunal assemblages that act as a food source for Hong Kong’s inshore commercial fisheries resources. Due to the general dominance of these habitats
in Hong Kong’s subtidal marine environment, extensive
studies have been conducted on infaunal assemblages
throughout Hong Kong. However, the majority of these studies have
focussed on providing a “snapshot” of infaunal
assemblages either within or in close proximity to a proposed area for
development, or as part of a specific monitoring programme. In order to provide an indication of the
potential ecological value of the infaunal
assemblages at the LNG terminal location, it is considered useful to review
studies that have investigated infaunal assemblages
in Hong Kong on a wide scale. Where considered useful, studies of infaunal assemblages at specific locations have also been
included in the review.
Both the waters around the proposed
terminal site were surveyed as part of a Hong Kong wide study conducted in
1976, however, the findings of this study are considered to be no longer
applicable due to the extensive development in both Hong
Kong and the Pearl River Estuary that has since occurred. This is supported by the findings of a
recent, second, Hong Kong wide study on infaunal assemblages undertaken in 2001 ([8]).
The most up-to-date study on
the soft bottom assemblages has revealed that the benthic communities in Hong
Kong can be divided into the following broad types: a relatively similar
benthic community covering the majority of Hong Kong waters; an impoverished
community in the northeastern waters; a coarser sediment benthic group in
Victoria Harbour; and a distinct benthic group in
Deep Bay ([9]). Deep
Bay, where the proposed terminal site
situated, has its own distinct infaunal assemblages
group resulting from the influence of freshwater discharges from the Pearl
River Estuary and the Shenzhen
River. These conditions lead to seasonal changes in
the assemblages between the summer and winter months.
A comparison of the results of the 1976
study and the 2001 study found that changes in benthic communities,
particularly species composition had occurred. This was reported as being primarily a result
of a wider distribution and increase in abundance of pollution tolerant species
such as Prionospio
spp and Mediomastus spp. The
benthic biota consisted mainly of soft, muddy bottom species, but the diversity
was less than those reported in South Lantau, Lamma and waters to the east of Hong
Kong.
In addition to the above, a recent study
in the Tuen Mun area found
that the benthic infauna near Lung Kwu Tan, in the vicinity of Black Point has a generally
mid-range total biomass and relatively high total number of individuals in
comparison to other areas of Hong Kong ([10]).
The fauna was found to be primarily polychaetes,
which is typical for Hong Kong. The species richness was high compared to
other sites surveyed using the same techniques.
Overall the site was found to exhibit the same characteristics and
ecological structure as other areas in the north Lantau
and NWNT areas.
9.3.6
Marine Mammals
A total of 16 (and possibly up to 18)
species of marine mammals, or cetaceans, have been recorded in Hong Kong waters ([11]).
The Indo-Pacific Humpback Dolphin, Sousa
chinensis, and the Finless Porpoise, Neophocaena phocaenoides,
are the only two species of marine mammals regularly sighted in Hong Kong
waters ([12]) ([13]).
Studies on the distribution, abundance,
habitat use, and life history of humpback dolphins within Hong Kong have been
undertaken since 1995 ([14])
([15]) ([16]).
The results of these ongoing studies indicated in 2004 that
approximately 1,300 individual dolphins are estimated to utilise the waters of
the Pearl River Estuary. Of these
individual dolphins, approximately 360 are thought to include waters within Hong Kong as part of their range.
Historically, marine mammal data have been
presented in terms of sightings ([17]).
Recent analysis adopted in the marine mammals monitoring study ([18]) has allowed data to be standardised to
reflect numbers of sightings in terms of survey effort. Such data are considered to be closer to a
direct indication of abundance and habitat usage than raw observational
data. In order to utilise the most
up-to-date data, yet still allow comparison with previous studies to be made,
both types of data will be discussed.
Abundance of humpback dolphins in Hong Kong waters is highest in the north and west Lantau areas (Figures 9.2 & 9.3). North Lantau and West Lantau are
considered to be the major habitats for humpback dolphins in Hong
Kong waters where individuals of humpback dolphins have been consistently sighted throughout
the year.
Humpback dolphins exhibit a seasonal
shifting in abundance and density and thus a seasonal variation of abundance in
different locations. The variation is
thought to be due to the increased input of freshwater from the discharge of the
Pearl River Estuary and the subsequent movements of estuarine prey
species ([19]) ([20]) ([21]) .
Recently published information indicates
that the abundance of dolphins in Hong Kong
ranges from 78 in spring to 217 in winter ([22]).
Present estimates for the Pearl River Estuary population range from 731
in summer to 1,504 in winter ([23]).
Data on the utilisation of the waters around the proposed LNG terminal
at Black Point have been reported ([24])
([25]).
From October 1995 to November 2004, there were 29 sightings of humpback
dolphins (20 from vessels and 9 from a helicopter) in Deep Bay
([26]). Deep Bay
is found to be used by a small number of humpback dolphins (3-6) throughout the
year. Dolphins were found almost
exclusively in the southern portion of Deep Bay,
mostly near Black Point. Average group
size for humpback dolphins near Black Point was 2.9 ± 2.06 (range = 1-8, n =
29), which contained a smaller average group size than other areas in Hong Kong ([27]).
Composition of humpback dolphin groups in Deep Bay, particularly near
Black Point appeared to contain a higher proportion of calves and juveniles (SAs and UAs) but a lower
proportion of mottled animals (which are probably mostly young males) among the
small number of recorded individuals ([28]).
The recent studies on marine mammals in Hong Kong have attempted to conduct quantitative analysis
of habitat use ([29]).
Sighting densities have been calculated in terms of number of on-effort
sightings per km2, with the survey area mapped using a 1 km by 1 km
grid. These data are presented as
Sightings Per Survey Effort (SPSE) values.
The average SPSE per grid in West Lantau (most
of the grids has SPSE value >20) is the highest (15.55) compared with the
average in Northwest Lantau
of 5.30. The grids around Black Point
have SPSE values ranging between 0 – 12.
The results indicate that the area around Black Point has low density
for dolphins ([30]), and the nearest high density area is
along the east coast of Lung Kwu
Chau (5 km away).
In contrast to humpback dolphins, studies on the finless porpoise
indicate that the majority of sightings have been recorded in the southern and
eastern waters of Hong Kong. Few sightings have been recorded in the
waters surrounding the proposed LNG terminal at Black Point and the Study Area([31])([32]).
Based on the results of the information
available from the long-term studies on marine mammals in the waters of Hong
Kong, it appears that of Hong Kong’s resident
cetacean species, only humpback dolphins were
recorded within the waters surrounding the proposed LNG terminal at Black
Point.
9.3.7
Baseline Marine Ecological Surveys
The literature
review of the marine ecological habitats and resources of the waters within,
and in close proximity to, the proposed LNG terminal at Black Point has
provided an indication of their ecological importance. However, in order to provide up-to-date
information on the marine ecological baseline conditions the following field
surveys were considered necessary (Table
9.1).
Table 9.1 Marine
Ecology Baseline Surveys at Black Point
|
Survey Type
|
Methodology
|
Date
|
|
Intertidal
Assemblages
|
Quantitative (belt
transects at 6 locations) survey, three 100 m belt transects (at high, mid and
low intertidal zones) for each location, covered
both wet and dry seasons.
|
22 & 23 March
and 15 & 30 July 2004
|
|
Subtidal
Benthic Assemblages
|
Quantitative grab
sampling survey; covered both wet and dry seasons. Six stations sampled in
each of 3 locations (BP1, BP2 and UR).
|
25 & 26 February
and 5 & 6 July 2004.
|
|
Marine Mammal
|
Land-based visual
survey during daytime, 5 days per month and 6 hours per day, covered four
seasons (12 months).
|
16, 17, 18, 19 &
26 February, 19, 22, 23, 25 & 26 March, 6, 7, 13, 14 & 15 April, 11,
13, 17, 18 & 20 May, 11, 15, 24, 25 & 29 June 2004, 9, 14, 15, 20
& 25 July 2004, 25, 26, 27, 30 & 31 August, 15, 16, 17, 20 & 21
September 2004, 27, 28, 29, 30 & 31 October 2004, 24, 25, 27, 29 & 30
November 2004, 7, 8, 9, 13 & 14 December 2004, 21, 24, 25, 26 & 27
January 2005.
|
|
|
Quantitative vessel
based survey using line transect methods spanning Hong Kong western waters
(Deep Bay, Southwest Lantau, Northwest Lantau and West Lantau) 3 days,
2 times per month.
|
18, 19, 20,,21, 22,
25, 26, 27 July 2005, 3, 4, 5,15, 22, 23, 24, 25, 26 August 2005, 5, 6, 7,15,
16 & 20 September 2005, 5, 6, 7, 17, 18 & 19 October 2005, 22, 24,
25, 28, 29 & 30 November 2005, 1, 2, 6,7,8 & 22 December 2005, 13,
16, 17, 19, 20 & 24 January 2006, 1, 2, 3, 7, 8 & 9 February 2006,
17, 23, 28, 29, 31 March 2006, 3, 6, 18, 25, 26, 27 April 2006, 2, 4, 8, 9,
10, 11 May 2006.
|
No
surveys were considered necessary for subtidal hard
bottom habitats and epifaunal assemblages as a review
of the available literature provided sufficient evidence of low ecological
importance habitats in the waters surrounding the proposed LNG terminal at
Black Point.
Survey
methodologies have been selected to follow standard and accepted techniques for
marine ecological surveys. In addition,
each methodology has been previously conducted as part of other Environmental
Impact Assessments (EIA) studies, accepted under the Hong Kong Environmental
Protection Department Environmental
Impact Assessment Ordinance (EIAO).
Survey schedules were undertaken in
accordance with the Environmental Impact
Assessment Ordinance, Cap.499 Guidance Note – Ecological Baseline Survey For
Ecological Assessment, specifically in terms of the following:
·
Duration
of Survey;
·
Seasonality;
·
Types
of Survey Period; and
·
Survey
Effort.
The following sections present the
methodology and results for each marine ecological survey undertaken as part of
the assessment of marine ecological baseline conditions.
9.3.8
Intertidal
Habitats
Methodology
Survey Locations
Six quantitative rocky shore surveys were
conducted on the shores of Black Point, of which two were on natural rocky
coastline and four on artificial rocky coastline (Figure 9.4).
Survey Methodology
Rocky Shore and Artificial Shoreline
A 100m transect tape was laid horizontally along
the rocky and artificial shoreline at 2 metres above chart datum (CD). When tidal height was below 1m, transects
could be started, local tide tables were used to assess tidal height at the
site and times of surveys were adjusted accordingly. Random numbers between 1 and 100 were
generated before the survey and these numbers corresponded to metres along the
transect at which quadrats should be placed. Three sets of random numbers were generated
per transect to represent upper, mid and low transects.
A 50cm x 50cm quadrat was
used to assess abundance and distribution of flora and fauna. All fauna found within the quadrat were recorded to species level to allow density per
square metre to be calculated. Sessile
fauna such as barnacles and oysters recorded in samples were not counted but
estimated as percentage cover on the rock surface. Species of algae (encrusting, foliose and
filamentous) were also identified and recorded by estimating the percentage
cover within the sample quadrat.
Results
Intertidal surveys have been conducted over two
seasons, wet and dry. The date of each
survey at each location is presented in Table 9.2. There
were two types of coastal habitats, including natural rocky shore and
artificial shoreline, recorded within the Study Area (Figure 9.5).
Table 9.2 Description
of the Survey Transects and Survey Dates for Intertidal
Hard Bottom Surveys at Black Point
|
Transect
|
Site Description
|
Date of Survey
|
|
|
|
Dry Season
|
Wet Season
|
|
Natural Shoreline
|
|
|
|
T1
|
Transect
1 is the furthest south of the rocky shore transects at Black Point and is a
very steep natural shoreline made up of bedrock and the occasional boulder.
|
23
Mar 2004
|
15 July 2004
|
|
T2
|
Bedrock
interspersed with a few large boulders and ranges from very steep to
moderately steep sloping rock faces.
|
3
Mar 2004
|
15 July 2004
|
|
Artificial Shoreline
|
|
|
|
T3
|
Southernmost
artificial shoreline to the power stations cooling water outlet. Site consisted of steep large boulders.
|
23
Mar 2004
|
15 July 2004
|
|
T4
|
South
of the power stations cooling water outlet.
Steep artificial seawall consisting of large boulders.
|
22
Mar 2004
|
30 July 2004
|
|
T5
|
Adjacent
to the power stations cooling water outlet.
Steep artificial seawall consisting of large boulders.
|
22
Mar 2004
|
30 July 2004
|
|
T6
|
Located
on the artificial shoreline on northern shore of Black
Point power station. Steep artificial seawall
consisting of large boulders.
|
22
Mar 2004
|
30 July 2004
|
Dry Season
The littorinid
snails, including Nodilittorina radiata, N. vidua and Littoraria articulata, were
the dominant species in the high intertidal zone on
the rocky shore and artificial shoreline during the dry season at Black Point (Tables 1 and 3 of Annex 9-A). The predatory gastropod Thais clavigera (the common dogwhelk), limpets (ie Nipponacmea concinna and Siphonaria
japonica) and snail (Monodonta labio and Planaxis sulcatus) were recorded in the mid and low shore
region. Sessile filter-feeding organisms
such as the rock oyster (Saccostrea cucullata)
and barnacles (Capitulum mitella, Tetraclita japonica, Tetraclita
squamosa, Balanus amphitrite) were also recorded on the shores (Tables 1 and 3 of Annex 9-A). There were only 2 types of algae, including Ulva sp. and
encrusting algae, of low coverage recorded at Black Point during the dry season
surveys.
In total, there were 21 species recorded
on the natural and artificial shores. 12
species recorded on natural shoreline were also found on artificial shoreline (Tables 3 and 4 of Annex 9-A). Except littorinid
snails, all of the recorded species were in low abundances.
Wet Season
The species composition of the intertidal organisms during the wet season was similar to
that of the dry season, with a total of 15 species on artificial shore and 12
species on natural shoreline (Tables 2 and
4 of Annex 9-A). The major
differences between the seasons were the abundance of littorinid
snails and rock oyster. The abundance of
littorinid snails recorded during the wet season was
much lower than those recorded during dry season, and vice versa for rock
oyster. The total abundance of the intertidal organisms recorded in wet season was generally
lower than the dry season.
9.3.9
Comparison of Black Point Intertidal Habitats With Other Hong
Kong Sites
The intertidal
organisms found at Black Point are distinct due to the influence of freshwater
influx from the Pearl River Estuary and the Shenzhen River. The intertidal
communities were not as diverse as those recorded in the eastern waters.
In comparison to other sites, species
diversity of intertidal organisms recorded at Black
Point was low. At Fa
Peng and Pa Tau Kwu on Lantau Island
to the East where 44 species were found in the dry season ([33]),
only 12 and 21 species of flora and fauna were recorded at Black Point during
the wet and dry seasons (Figure 9.6). During a study on the west coast of Lamma
Island, 37 species were
recorded.
Figure 9.6 Comparison of Intertidal Fauna and
Flora at Various Sites in Hong Kong (Sources:
# ERM 2000b, * ERM 1998 and o Babtie BMT
1999) ([34])([35])([36])
9.3.10
Infaunal
Assemblages (Benthos)
Survey Methodology
Sampling Locations
Benthic samples were collected at three
sites representative of subtidal soft bottom habitats
in the vicinity of the proposed LNG terminal at Black Point (Figure 9.7). Sampling sites were as follows:
·
Black
Point (BP1 and BP2) and,
·
Urmston Road (UR).
Field Sampling
Methodology
In each survey site, six stations
approximately 50 m apart were established and one grab sample was collected
from each station. Stations were sampled
using a modified Van Veen grab sampler (960 cm2
sampling area; 11,000 cm3 capacity) with a supporting frame attached
to a swivelling hydraulic winch cable.
Sediment from the grab samples were sieved
on board the survey vessel.. The
sediments were washed onto a sieve stack (comprising 1 mm and 500 mm meshes) and gently rinsed with seawater
to remove all fine material. Material
remaining on the two screens following rinsing was combined and carefully
rinsed using a minimal volume of seawater into pre-labelled thick triple-bagged
ziplock plastic bags.
A 20% solution of buffered formalin containing rose bengal
in seawater was then added to the bag to ensure tissue preservation. Samples were sealed in plastic containers for
shipment to the taxonomy laboratory for sorting and identification.
Laboratory Techniques
The benthic laboratory performed sample
re-screening after the samples had been held in formalin for a minimum of 24
hours to ensure adequate fixation of the organisms. Individual samples from the 500 mm and 1 mm2
mesh sieves were gently rinsed with fresh water into a 250 mm sieve to remove
the formalin from the sediments. Sieves
were partially filled while rinsing a specific sample to maximize washing
efficiency and prevent loss of material.
All material retained on the sieve was placed in a labelled plastic jar,
covered with 70% ethanol, and lightly agitated to ensure complete mixing of the
alcohol with the sediments. Original
labels were retained with the re-screened sample material.
Standard and accepted techniques were used
for sorting organisms from the sediments.
Small fractions of a sample were placed in a petri
dish under a 10-power magnification dissecting microscope and scanned
systematically with all animals and fragments removed using forceps. Each petri dish was
sorted at least twice to ensure removal of all animals. Organisms representing major taxonomic groups
including Polychaeta, Arthropoda,
Mollusca, and miscellaneous taxa
were sorted into separate, labelled vials containing 70% ethanol.
Taxonomic identifications were performed
using stereo dissecting and high-power compound microscopes. These were generally to the family level
except for dominant taxa, which were identified to
species. The careful sampling procedure
employed minimizes fragmentation of organisms.
If breakage of soft-bodied organisms occurs, only anterior portions of
fragments were counted, although all fragments were retained and weighed for
biomass determinations (wet weight).
Survey Results
Survey Dates and
Conditions
Grab samples were collected in each site
in both the dry (25-26th February 2004) and wet (5-6th
July 2004) seasons. In general,
conditions during surveys were fine with relatively calm sampling conditions
throughout.
Dry Season Survey
Results
A total of 674 individual organisms were
collected from the 18 grab sampling stations in the vicinity of Black Point and
the Study Area during the dry season survey in 2004. The specimens belong to 6 Phyla with a total
of 37 families and 50 genera identified.
Table
9.3 presents information on the number of identified
families, number of identified genera, number of individuals and biomass for
each Phyla. A
complete set of raw data is presented in Table
5 of Annex 9-A.
A breakdown of dry season 2004 benthic
data by site revealed relatively large differences in terms of number of
individuals, biomass and taxonomic richness (here represented by number of
families of infaunal organisms) (refer to Table 5 of Annex 9-A). The Black Point
site (BP2) recorded the highest number of individuals with mean of 63.3
individuals grab-1 (± 47.8 SD) recorded, equating to 657.0 m-2
(± 497.7 SD). In comparison, Urmston
Road (UR) recorded the lowest mean numbers of individuals (15.2 (± 13.7 SD)
grab-1). The Black Point site
BP1 recorded comparatively medium numbers, with 33.8 grab-1 (± 39.3
SD) recorded. As can be seen from the
standard deviation at each site, the numbers varied greatly between stations,
particularly at the site with high numbers of individuals (BP2).
The highest total biomass in the wet season 2004 was
recorded at the Black Point (BP2) site, with 376.6 g wet weight (Table
9.4). The
Black Point Station (BP1) and the Urmston Road (UR) site also recorded
comparatively high biomass, with a total biomass of 161.4 and 174.5 g wet
weight, respectively.
The Black Point (BP1) site recorded the
highest diversity in the wet season 2004, with a mean number of 10.0 (± 3.7 SD)
families and 6.0 (± 5.9 SD) genera grab-1. Both the Black Point (BP2) and Urmston Road
(UR) sites recorded slightly lower diversity under the wet season survey.
Overall, the majority (81.5%) of organisms
recorded were Mollusca. The remainder were
representatives from the Phyla Annelida (16.6%), Arthropoda (1.3%), or Echinodermata
(0.6%).
The estuarine clam Potamocorbula laevis, from the family Corbulidae, was the most abundant species from the surveys
owing to high numbers in samples from Urmston Road (UR). No rare or uncommon species were recorded in
the wet season 2004 survey at Black Point and the Study Area.
The distribution of the mean number of
individuals collected at each site during the wet season 2004 survey, according
to class level, is presented in Figure
9.10
The distribution of mean biomass of infaunal organisms at each site according to class level is
presented in Figure 9.11. The biomass of organisms is mainly
contributed by the class Bivalvia at the Urmston Road
(UR) site and Polychaeta at the Black Points sites
(BP1 and BP2).
Figure 9.10 Mean numbers of individuals of infaunal organisms (Class level) from benthic samples
collected at Black Point and the Study Area during the Wet Season Surveys 2004
Figure 9.11 Mean biomass grab-1 infaunal organisms (Class level) from benthic samples
collected at Black Point and the Study Area during the Wet Season Surveys 2004
9.3.11
Comparison of Black Point Benthic Fauna
With Other Sites in Hong Kong
A comparison with similar sites in Hong
Kong puts the ecological value of the study site in perspective with the
ecology of the surrounding area and also other sites that may share the same
physical attributes such as outlying islands around Hong
Kong. Sources of information
that were used in compiling this comparative data were the Seabed Ecology
studies conducted by ERM ([37]), the study on marine benthic communities
conducted by City U Professional Services Ltd ([38]) along with other EIAs
and reports conducted by ERM.
The benthic biomass of comparable areas in
Hong Kong varies greatly including across
seasons (Figure 9.12). Compared with results of the previous
surveys, biomass recorded during this survey at Black Point (BP1 and BP2) and
at Urmston Road (UR) was comparatively higher than all other areas during the
wet season while the biomass at Black Point (BP1 and BP2) was similar to or
slightly lower than Western Lantau during the dry
season. The biomass at Urmston Road (UR)
was similar to areas such as Lung Kwu Chau & Sha Chau, Peng Chau
and South West of Po Toi during the dry season.
Figure 9.12 Comparison of mean biomass of benthic
communities around Hong Kong (Sources:
+Present Study, *City U 2002, ºERM 1998 and #ERM 2000) ([39])([40])([41])
The species diversity of the benthic
community at Black Point and Urmston Road (UR) was recorded similar to most of
the locations in Hong Kong ([42]).
The number of species of the benthic organisms in Black Point and
Urmston Road were recorded in the range of 26 to 31 species per 0.576 m2 during
wet season and 20 to 35 species per 0.576 m2 during dry season, in
which the mean number of species of the 120 stations surveyed by CityU ([43]) were 32.9 per 0.5 m2 (wet
season) and 33.7 per 0.5 m2 (dry season) respectively.
9.3.12
Marine Mammals
Methodology
Land-based Visual Survey
Land-based
visual surveys were conducted in the Study Area to qualitatively estimate
marine mammal use of habitats in the vicinity of Black Point and nearshore areas. The
results yielded from the land-based survey are qualitative in nature and were
not intended for quantitative determination of marine mammal abundance. Land-based surveys were conducted to provide
additional information to supplement the quantitative vessel-based surveys
results. The
observation site was on the natural rocky shore located at a distance of
approximately 60 metres from Black Point Power
Station. The 180° view
of the existing environment around the observation site is shown in Figure 9.13. The location of the observation point was
selected to allow the greatest visual coverage of the proposed reclamation and
dredging area. In this way, the chosen
site for the observation point was relatively close to the shoreline since this
allowed visual coverage of the whole of the reclamation area of the proposed
LNG terminal. However, any dolphin
sightings located at a far distance (beyond approximately beyond 800 m) from
the observation point may not be identified clearly due to the low elevation of
the observer’s position on the shoreline.
During
the survey period, one of the paired observers scanned the survey area
continuously with Olympus 10 x 42 hand-held marine binoculars while the other
used naked eye and occasional binocular scans to identify, estimate group size,
and study behaviour of the any marine mammals observed in the Study Area. The role of observers rotated every 30
minutes. Each survey was 6 hours in length. Survey times shifted to record marine mammal
activity during all possible daylight hours during the survey period.
Monitoring
surveys were conducted for five days of each month. Surveys have been conducted monthly,
commencing in February 2004, for a full calendar year up to end January
2005.
Data Collected
The
locations of all marine mammals sighted within 800 m of the sighting point were
recorded on a data sheet (Table 7 of Annex 9-A). The species and number of marine mammals,
number of sightings and age classes were recorded, together with observed
behaviours at the times of sightings. If
fifteen minutes had passed with no sightings after an initial sighting was
made, any observed marine mammals were then considered to be a new group or
individual. As such, the
"sighting" data recorded represents first count data, or the location
where the marine mammals were first observed.
Distinguishing Features
Only
the Indo-Pacific Humpback Dolphin was observed during the surveys. The Indo-Pacific Humpback Dolphin (Sousa
chinensis) is distinguished by its wide-based,
slightly falcate dorsal fin, located at mid-back. They have a long slender rostrum, with a
shallow groove between the melon and the beak.
Adults are white to pink in colour, and often have a variable degree of
black spotting or mottling.
Age Classes
Age
class of humpback dolphins was
identified in accordance with the six age classes defined by Jefferson
([44]). The classification of their age class was
mainly based on their body size and length, skin colouring pattern, and density
of spotting. Their skin colour pattern changes
dramatically throughout their lifespan, whitening increases as age
increases. The spot patterns on
juveniles and subadults disappear gradually as they
get older, as presented in Table 9.5 ([45]).
Table
9.5 Age
Classes of Sousa chinensis
|
Age Class
|
Body Length (m)
|
Colour Pattern
|
Spotted Pattern
|
Behaviour
|
|
Unspotted Calf (UC)
|
1 m to 1.3 m (approximately
half length of adults); up to 6-8 months of age
|
Uniform black to
dark grey
|
No spots
|
Swim dependently of
adult, presumably the mother
|
|
Unspotted Juvenile
(UJ)
|
Approximately 1.5 m
to 2 m (two-third of the adult length)
|
Uniform light grey
|
No spots
|
Occur in the
vicinity of adults
|
|
Mottled (MO)
|
Approximately
similar length as SAs and UAs
|
Light pinkish grey
|
Heaving spotting
|
Same as SAs and UAs
|
|
Speckled (SP)
|
With same size as SAs and UAs
|
Pale pink to white
|
Less spotting
pattern than MO
|
Full independence of
movement and association; hard to distinguish from SA
|
|
Spotted Adult (SA)
|
Same as UA
|
Purely pink to white
|
Less spotting
pattern than MO or SP
|
Same as SPs
|
|
Unspotted Adult (UA)
|
Up to 2.6 m
|
Purely pink to white
|
Essentially no
spotting pattern but may have a few tiny spots
|
Same as SAs and SPs
|
Only
three classes, adult (include MO, SP, SA and UA), juvenile (UJ) and calf (UC), can
be identified during the land-based visual survey due to the distant
observation.
Behaviour
Marine
mammals exhibit certain behaviour and for humpback dolphins this has been previously characterised based on ongoing studies ([46]) ([47]). These are presented in Table 9.6.
Table 9.6 A
Summary and Description of Specific Types of Behaviour and Activities exhibited
by Indo-Pacific Humpback Dolphin Sousa chinensis
|
Type
of Social Behaviours and Activities
|
Descriptions
|
|
Activities
|
|
|
Free Travelling
|
Directional motion, swimming fast,
taking regular breaths on water surface.
|
|
Feeding/Foraging
|
Long jumping and high-speed chasing while
hunting fish; On sea surface, swimming slowly rising intermittently before
commencing the next dive. They may
display certain behaviours such as feeding rushes, fish whacking, carousels,
and fluking dives.
|
|
Boat chasing/ Feeding behind trawlers
|
Following behind trawlers as a sign of
feeding, they catch fish through the net or escaping from it.
|
|
Milling/Resting
|
Remaining in one area without any sign
of feeding or social interaction; move slowly with a drifting or gliding motion,
rising slowly, or breathing while circling over the same area.
|
|
Socializing
|
Extensive bodily contact, inverted
swimming, somersaulting, leaping and chasing with aerial activity; group
activities centred on animate or inanimate objects; two to three individuals
form a group.
|
|
Spot
Behaviour
|
|
|
Breaching
|
A behavioural pattern also known as body
slamming or a "log" jump.
The animal rises out of the water at an angle between 90°
to 45°
to the sea surface. When exiting the water
the dolphin’s flippers, its abdomen or peduncle may clear the surface.
|
|
Spyhopping
|
Raising the head vertically out of the
water, then sinking below the water without a splash. Used to check an area for hazards.
|
|
Tail slapping
|
The act of slapping the tail against the
sea surface.
|
|
Porpoising
|
Fast, shallow, arching leaps with the
dolphin coming either partially or entirely out of the water. It was only observed when the dolphins were
boat chasing and allows the animals to combine shallow dives for fish with a
fast rate of travel. The adults will
show noticeable colour changes, turning from white to a deep pink. This is probably due to vascular dilation
in the blubber layer and is, possibly, a flush response to prevent
overheating.
|
|
Nursing
|
An act of nursing a calf by a mother.
|
Site and Weather Conditions
Site
conditions including sea state, weather and visibility were also recorded along
with any changes in environmental conditions if they occurred during the
duration of a survey. Surveys were only
conducted under acceptable sighting and weather conditions. Acceptable sighting conditions were defined
as days with sea state conditions of Beaufort 0 – 5, and visibility of at least
2 km from the observation point. No
surveys were conducted during unacceptable weather conditions, such as during
low visibility or during typhoons, thunderstorms or heavy rainstorm warnings
reported by the Hong Kong Observatory.
Vessel Based Visual Survey
Survey Subareas and General
Approach
Vessel-based surveys were undertaken to provide the
scientific basis for calculating all quantitative estimates of dolphin
abundance around Black Point and nearby waters for this EIA Study. Surveys were conducted in two subareas. General characteristics of the two survey subareas are listed in Table
9.7. Northwest Lantau
(40 km2) is a narrow strip along the western border of Hong Kong,
and it includes waters of the Sha Chau
and Lung Kwu Chau Marine
Park. The survey area for this project represents
only the western portion of the Northwest Lantau area of the long-term study ([48]) ([49]).
The very
northern edge of the area would be affected by the LNG terminal, approach channel
and turning basin.
Table
9.7 Summary of Characteristics of the
Two Survey Subareas in Hong Kong
|
Survey Area
|
Area (km2)
|
Effort (km) (1)
|
Description
|
|
Deep Bay
(DB)
|
30
(2)
|
1,679
|
Very
shallow enclosed bay with extensive mudflats and mangroves; influenced by the
Pearl River (high turbidity)
|
|
Northwest Lantau
(NWL)
|
38
|
530
|
Strong
influence from Pearl River; location of Sha Chau/Lung Kwu Chau Marine Park; Urmston Road
shipping channel goes through north end
|
Note: (1) Total survey effort conducted during this study
is presented here, but the survey effort (L) presented in Table 9.17 is only that used in calculation of the abundance
estimates (i.e., Beaufort 0-3 data).
(2) The total area of Deep Bay
is about 97 km2, but the portion that is within the Hong Kong SAR
boundary is 60 km2. However, only half of this area could be
surveyed, due to the northern portion of the bay being too shallow for our
vessel to operate. Thus, abundance was only estimated for the surveyed area of
30 km2.
The Deep Bay
subarea contains the Black Point site at its southern
boundary. The Black Point Power Station
is the ultimate destination of the gas pipeline. Deep
Bay itself is actually
about 97 km2, but it is bisected by the Hong Kong SAR/Guangdong
boundary. The portion that occurs within
the Hong Kong SAR is only 60 km2. However, the northern portion of Deep Bay
is very shallow, with mud flats often exposed at low tides. Due to this fact, as well as the confounding
presence of the Crosslinks
Bridge (Deep Bay Link) and several
oyster rafts, survey vessel were unable to safely navigate into the northern
portion of Deep Bay.
As a consequence, the vessel-based surveys were conducted only in the
southern portion of Deep
Bay (30 km2).
The seasons
were defined as follows: Winter (December-February), Spring (March-May), Summer
(June-August), and Autumn (September-November).
This is the same as in the long-term study.
The survey
transect lines were presented in Figure 9.14.
Survey Methods
Vessel
surveys were conducted from two survey vessels, the King Dragon and the Tsun Wing (both ca. 12-15 m length, with similar
configuration), weather permitting (Beaufort 0-6, no heavy rain, and visibility
> 1,200 m). However, only data
collected in calm conditions of Beaufort 0-3 are useable in calculating line
transect estimates of density and abundance ([50]) ([51]).
The vessel had an open upper deck, affording relatively unrestricted
visibility. The observer team conducted
searches and observations from the flying bridge area, 4-5 m eye height above
the water's surface. Two observers made
up the on-effort survey team. As the
vessel transited the survey lines at a relatively constant speed of
approximately 15 km/hr, the primary observer searched for dolphins and
porpoises continuously through 7 X 50 Brunton marine
binoculars. The data recorder searched
with unaided eye and filled-out the data sheets. Both observers searched ahead of the vessel,
between 270° and 90° (in relation to the bow, which is defined as 0°). On most surveys, there were three observers,
and one auditor. Observers rotated
positions after approximately 30 minutes of effort, to give them a rest after
each hour of search effort, thereby minimizing fatigue. Observers had undergone a 3-day training
program before the start of data collection, which included detailed classroom
instruction and a day of at-sea training.
Only two species of small cetaceans regularly occur in Hong
Kong, the humpback dolphin and finless porpoise ([52]) ([53]).
These two species are radically different in appearance and behavior,
and so all sightings (even those seen briefly or from a distance) could be
identified to species.
Effort data
collected during on-effort survey periods included time and position for the
start and end of search effort, vessel speed, sea state (Beaufort scale),
visibility, and distance traveled in each series (a continuous period of search
effort). When dolphins or porpoises were
sighted, the data recorder filled out a sighting sheet, and generally the team
was taken off-effort and the vessel diverted from its course to approach the
dolphin group for group size estimation, assessment of group composition,
behavioral observations, and collection of identification photos. The sighting sheet included information on
initial sighting angle and distance, position of initial sighting, sea state,
group size and composition, and behavior, such as response to the survey vessel
and associations with fishing vessels (Tables
9 and 10 of Annex 9-A). Position, distance traveled, and vessel speed
were obtained from a hand-held Global Positioning System (a Garmin
Gecko GPS unit).
Observers
were trained and calibrated in distance estimation, by asking them to make
distance estimates to various objects (e.g., other boats, specific points on
shore, floating debris, etc.).
Simultaneously, a distance reading was taken with a laser rangefinder (Leica 800 or Bushnell Yardage Pro 800 model). Plots of measured vs. estimated distance were
shown to observers occasionally, so they could see if they needed to refine
their distance estimates. This procedure
resulted in increased accuracy of observer distance estimates, and previous efforts
have shown that significant bias is not caused by the remaining inaccuracy in
distance estimation ([54]) ([55]) ([56]).
When
dolphins were sighted, the observers typically went off-effort and the vessel
approached the dolphin group for accurate estimation of group size/composition
and for photo-identification.
Photographs were taken with Canon 35-mm SLR autofocus
cameras (EOS 20D digital model). Cameras
were equipped with digital data recorders and date and time were associated
with each frame, allowing it to be correlated with a particular sighting. The primary lens used was a Canon L series
300 mm / f4.0 image stabilizer telephoto.
Usually, the lens was used with a 1.4 X teleconverter,
thereby increasing its effective focal length. Images were shot at the highest
available resolution (8.2 megapixels) and stored on
Compact Flash cards (mostly 1.0 GB).
For
photo-identification, generally, dolphin groups were approached slowly from the
side and behind ([57]). Maneuvering the boat to within
15-40 m, directly alongside a moving group of dolphins resulted in the best
shots. Every attempt was made to
photograph each dolphin in the group, even those that appeared to have no
unique markings. If possible, both sides
of the dolphins were photographed, since the coloration markings are not
completely symmetrical.
Data Analysis Methods
Line
Transect Analysis
One day’s
survey effort was used as the sample for analyses. For estimation of density and abundance, only
surveys with at least 2.0 km of useable effort were included. Estimates were calculated from sighting and
effort data collected during conditions of Beaufort 0-3 ([58]) ([59]) ([60]), using line transect methods([61]).
The estimates were made using the computer program DISTANCE Version 2.2
(Laake et al.
1994) ([62]). The following formulae were used
to estimate density, abundance, and their associated coefficient of variation:
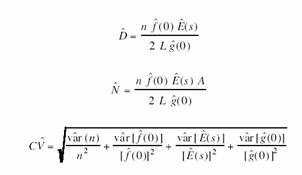
where D =
density (of individuals),
n = number
of on-effort sightings,
f(0) = trackline probability density at zero distance,
E(s) = unbiased
estimate of average group size,
L = length
of transect lines surveyed on effort,
g(0) = trackline detection probability,
N =
abundance,
A = size of
the survey area,
CV =
coefficient of variation, and
var = variance.
For the
Northwest Lantau area, because the current study did
not survey the entire survey area used in the long-term study, individual
encounter rates for each season were calculated as a basis for comparison. This is largely equivalent to calculating
densities, but it does not explicitly take into account variations in sightability of the dolphins. However, despite this, it provides a useful
basis for comparison with future surveys.
The encounter rates were calculated by dividing the number of individual
dolphins observed on a particular day by the amount of effort conducted on that
day. Seasonal averages and their
standard deviations were then computed.
Only data collected during Beaufort 0-3 conditions were used for this.
Pooling and
Stratification Strategies
A strategy
of selective pooling and stratification was used, in order to minimize bias and
maximize precision in making the estimates of density and abundance ([63]).
Data from the long-term database were pooled with data from the present
study to increase sample sizes and improve the robustness of the analyses. It was applied directly to the Deep Bay
areas. The Northwest
Lantau area of the current study was
defined specifically for this project, and this subarea
was not used in the long-term study.
Different strategies were used for various line transect components, and
these are described below:
Sighting
Rate [n/L] - Sighting rate varies strongly with season and area ([64]) ([65]), and thus a fully-stratified
analysis (full stratification by both season and survey area) was used. Clearly, sighting rate is one of the major
parameters affecting density and abundance estimates, and although sample sizes
were small for some strata (n < 5), pooling of data was not deemed
justified.
Trackline Probability Density [f(0)] - Because biases associated
with small sample sizes can strongly affect the accuracy of density and
abundance estimates, Buckland et al.'s
([66]) guidelines
regarding minimal sample sizes for estimation of the trackline
probability density were followed. They
suggested a minimum sample size of 60 sightings for modeling of this
parameter. Several mathematical models
were fitted to the data (hazard-rate, half-normal, and uniform), and the model
with the lowest value of the Akaike’s Information
Criterion was automatically chosen by DISTANCE for estimation of f(0). Because most seasons within a phase did not
have adequate numbers of sightings, all the data (from all four seasons and the
three main survey subareas) were pooled to calculate
a single humpback dolphin trackline probability
density, and then used this in all the estimates of density and abundance. This strategy ensured sample sizes of >
100 for humpback dolphins.
Average
Group Size [E(s)] - Because of indications that group size varies by geographic region and
season ([67]) ([68]), a fully-stratified analysis was
used. DISTANCE computed both the
arithmetic mean and a size-bias corrected mean; the lesser of these two values
was used in the calculations (in order to avoid size-bias generally caused by
missing smaller groups at large perpendicular distances).
Trackline Detection Probability [g(0)] - For Hong Kong
humpback dolphins, Jefferson ([69]) reported group dive
time data and collected 71.8 hours of independent observer data, and from this
estimated that the detection probability is unity for that study. The present study was an extension of Jefferson's study ([70]), with all survey techniques held
constant. Therefore the previously
estimated value of g(0) = 1.0 was used for all density and abundance
calculations.
Coefficient of
Variation [CV] – The variance component for the appropriate estimate of each component
of the line transect equation was used in calculating the overall CV of the
estimated density and abundance (see formula above). This resulted in more precise estimates for
some areas and seasons than would have been the case with a fully-stratified
analysis. However, this came at the
expense of some slight potential for increase in bias.
Photo-identification
and Age Class Composition
Photographs of
dolphins taken during surveys were first examined and sorted into those that
contained a potentially identifiable individual. Then, those photos were again examined in
detail and any identifiable individuals were compared to the photo-ID catalog
accumulated over the last 10+ years of dolphin research in Hong
Kong and the Pearl River Estuary.
Any new individuals were given a new identification number and their
data were added to the catalog. Most of
the analyses used data from the long-term database.
Observers
attempted to classify dolphins observed into the six age classes identified in
the long-term study on humpback dolphins in Hong Kong
(see Table 9.5). However, many animals were not seen at close
enough range to place them into an age class, and therefore only data on groups
from which the age class composition of the entire group was determined were
analyzed.
Grid
Analysis of Habitat Use
For the
quantitative grid analysis of habitat use of humpback dolphins and finless porpoises,
positions of on-effort sightings were plotted onto 1 km2 grids
within the two survey subareas. Sighting densities (number of on-effort
sightings per km2) were calculated for each grid. Sighting density grids were then further
normalized with the amount of survey effort conducted within each grid. The survey effort spent in each grid for each
survey day was examined in detail (i.e., when the survey boat traversed through
a specific grid once, one unit of survey effort was counted for that grid), and
then the amount of survey effort per grid was calculated for all sighting
density grids. After normalizing the
original sighting density grids by survey effort, a new sighting density data
were generated. The new density unit is
termed “SPSE”, representing the number of on-effort sightings per unit of
survey effort. This sighting density
information was further elaborated to look at actual dolphin densities (exact
number of dolphins from on-effort sightings per km2). The new unit for this approach was termed
“DPSE”, which is the number of individual dolphins per unit of survey effort. Plotting the DPSE values of
surveyed grid squares on maps allows areas where the most dense sightings of
dolphins occur to be identified.
Ranging
Pattern Analysis
Location
data were obtained from the long-term sighting database and photoidentification
catalog, and only those individuals sighted ten times or more were included for
analysis of individual home ranges ([71]). A desktop GIS (ArcView© 3.1) with the Animal Movement Extension was used
to examine individual ranging patterns.
Using the Animal Movement Extension for ArcView©,
a polygon joining the outermost sighting positions was formed, indicating the
area used by an individual dolphin during the long-term study period. Range dimensions of the dolphin were then
calculated by GIS with land masses excluded.
Behavioural Data
Analysis
When
dolphins were sighted during vessel surveys, their behaviors were recorded
through direct observations and by digital video system. Different activities were categorized (i.e.,
feeding, milling/resting, traveling, socializing) and recorded on the sighting
datasheets, and the dolphin behaviors were taped by a digital video recorder. These data were input into a separate
database with sighting information, which was then used to determine the
distribution of behaviors with desktop GIS.
Survey
Results
Landbased Visual Survey
Seasonal Records
During February 2004 to January 2005,
there were a total of 60 marine mammal surveys undertaken (a total of 360
hours). Over this period, only one of
the two resident marine mammals in Hong Kong,
the Indo-Pacific Humpback Dolphin Sousa chinensis, was observed and recorded at Black
Point. There were 74 sighting records of
humpback dolphins (a total of 141 individuals), and no sighting records of
finless porpoise reported during the surveys.
Seasonal records of marine mammal sightings are presented in Table 8 of Annex 9-A. Humpback dolphins were recorded in all four seasons. The
locations of sightings within the 0.8km radius survey area were plotted in
relation to season, and are presented in Figure 9.15 ([72]).
Corrected for effort sightings and number
of individuals of marine mammals are presented in Figure 9.16.
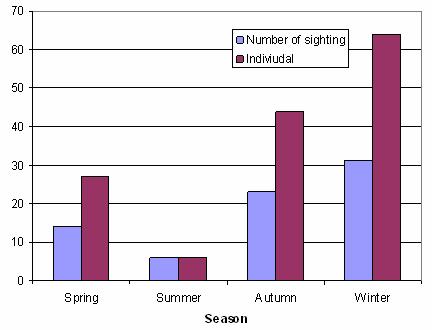
Figure 9.16 Number of Sightings and Individuals of Indo-Pacific Humpback
Dolphin Sousa chinensis at Black Point (Data collected from
February to January 2005)
Humpback dolphins exhibited a seasonal pattern at Black Point. The majority of dolphins (seasonal average) were
recorded in winter (with 31 sightings and 64 individuals) and autumn (with 23
sightings and 44 individuals) (Figure
9.16). Only a few sightings of Sousa chinensis
were recorded during summer and spring months ([73]) .
Marine Mammal Age Class
The majority of humpback dolphins recorded during the land-based surveys
were identified as Adults (SA/ UA/ SP/ MO) (109 individuals). Juveniles (UJ) (25 individuals) and Calves
(UC) (7 individuals) were also recorded(Table
8 of Annex 9-A).
Vessel
Based Visual Survey
Data
Collected
In the 11 months (July 2005 to May 2006)
of this study, 70 days of survey have been conducted. During this time, a total of 1,561 km of
transect lines were surveyed. Of this, 1,291
km (83% of the total) were done during relatively calm sea conditions of
Beaufort 0-3, and therefore were useable in the estimation of density and
abundance. Of the effort conducted in
Beaufort 0-3 conditions, 385 km was in Northwest Lantau,
and 906 km was in Deep
Bay.
There were a total of 87 sightings of
Indo-Pacific Humpback Dolphins during the LNG surveys. Most sightings took place in Northwest Lantau (n = 62), and fewer in Deep Bay
(n = 25).
Distribution
It is important to recognize that, due to
differential survey effort in various survey subareas,
it is not possible to compare densities of dolphins by examining maps of
distribution. The distribution maps are
only useful for determining where animals do and do not occur, and for
comparing use of the area on a small scale (within a survey subarea). Comparisons of density or habitat use on a
larger scale should make use of numerical density estimates or the results of
the grid analyses (discuss below).
Dolphins were observed throughout both of
the surveyed areas, and sightings occurred in nearly all areas except directly
south of the Sha Chau/ Lung Kwu
Chau Marine Park
and at the very northern end of the Deep
Bay survey area (Figure 9.17). To date, there appears to be no strong
seasonal differences in distribution of dolphins between the different survey subareas, except there are fewer dolphins around in the
spring months (Figures 9.18 & 9.19).
The distribution of young dolphins
(Unspotted Calves and Unspotted Juveniles) (Figures 9.20 & 9.21) indicated that they were
concentrated in two areas: (1) southern Deep Bay,
and (2) around Lung Kwu Chau. If the analysis focuses at Unspotted Calves,
then Deep Bay drops-out, and only the latter area
looks to be important. One further point
of interest is the strong tendency for any Unspotted Calves and Unspotted
Juveniles in the Northwest Lantau area to be found
close to (within a few hundred meters of) Lung Kwu Chau – consistent with previous indications that the waters
around Lung Kwu Chau may be
a “nursery area.”
The distribution of dolphins engaged in
feeding and socializing behaviours are shown in Figures 9.22 & 9.23,
respectively. These will be discussed in
more detail under the Behaviour section below.
Abundance and Density
Estimates of density and abundance, and
their associated parameters are presented for Deep Bay
in Table 9.8. For humpback dolphins, Deep Bay
had low densities (0.08 - 0.23 dolphins km-2) and low estimates of
abundance (<10 dolphins in all seasons).
It is clear that dolphins use the mouth of Deep Bay
at a low level throughout the year. Northwest Lantau
had higher levels of dolphin density (0.57-0.94) and abundance (49-82) than Deep Bay.
Table 9.8 Estimates
of Abundance and Associated Parameters for Humpback Dolphins in Deep Bay
Survey Subareas (NWL is discussed in the text).
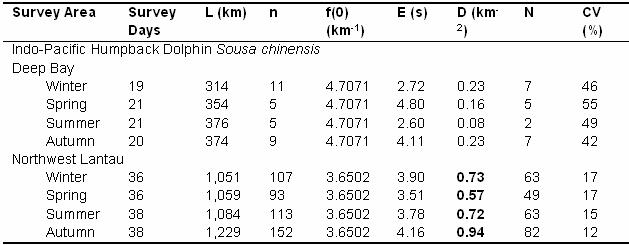
Note: (1)
L=total length of transect surveyed; n=number of on-effort sightings; f(0)=trackline probability density; E(s)=unbiased mean group
size; D=individual density; N=individual abundance; and CV=coefficient of
variation.
(2) Only
data collected in Beau 0-3 conditions are included here.
(3) As explained
previously, the individual density value (D) represents an estimate of the number
of individual dolphins in a 1 km2 grid square area.
For the Northwest Lantau area, the seasonal estimates of average
individual encounter rate are also shown in Table 9.9. Encounter
rates increased from summer to autumn and then increased again from autumn to
winter, finally decreasing dramatically in spring months ([74]).
Table 9.9 Individual
Encounter Rate Information for Dolphins in Northwest Lantau (Analysis Uses only Data Collected
during Beaufort 0-3 Conditions)
|
Season
|
No. Surveys
|
Individuals
|
Encounter Rate
|
Std. Dev.
|
|
Summer
|
7
|
36
|
24.9
|
31.7
|
|
Autumn
|
6
|
53
|
46.5
|
20.6
|
|
Winter
|
3
|
65
|
166.3
|
52.6
|
|
Spring
|
6
|
18
|
17.1
|
20.9
|
Grid Analysis of Habitat
Use (July 2005 – 2006)
Grid analysis of habitat use provides the
best way to compare dolphin use of specific areas, especially on a small
scale. Because the data are standardized
for differential survey effort, it is possible to compare density of two grids,
even if they are in different survey subareas.
Using the line-transect survey data from
the 11 months of the study, combined with AFCD data collected during the same
period, survey effort data and dolphin sighting data were retrieved to
calculate DPSE values for 158 grids among the four study subareas. The map of dolphin density (DPSE) with
corrected survey effort per km2 of the two areas is shown in Figure 9.24.
The western end of Northwest
Lantau indicated high dolphin usage,
with average DPSE values and 0.443 respectively. However, Deep Bay
was only used to a small extent (Table
9.10).
Table
9.10 Average
DPSE for Different Survey Subareas during the Study
|
|
# grids
|
Ave. DPSE
|
# grids w/ DPSE>1
|
|
Deep Bay
|
26
|
0.06 ± 0.12
|
0
|
|
Northwest Lantau
|
28
|
0.44 ± 0.54
|
2
|
Habitat use of humpback dolphins was very
uneven among the 1 km2 grids in the two areas. In Deep
Bay, dolphin usage was
higher toward the south western end of the survey area, and the highest
densities occurred near the Black Point Power Station (Grids H5, I5 &
J5). In Northwest Lantau, dolphin usage was higher around Lung Kwu Chau, especially at the
eastern sides of the island. Dolphin
densities were also higher around the small island of Pak Chau (Grid G13). On the contrary, the southern portion of Northwest Lantau was less
heavily used by dolphins, especially the waters just west and northwest of the
airport platform.
Grid Analysis of Habitat
Use (Seasonal)
To
examine the seasonal habitat use patterns of humpback dolphins quantitatively
in recent years, survey effort and dolphin sighting data from the long-term monitoring
database and the additional LNG survey data were stratified by season to
calculate DPSE values (total number of dolphin/porpoises per unit of survey
effort) within 1 km2 grids in the survey subareas. For humpback dolphins, line-transect data collected
during 2003-06 was used, and DPSE values for grid squares in Deep Bay,
Northwest Lantau and Northeast Lantau
were examined (see Figure 9.25).
Seasonal habitat use patterns were less obvious in Northwest Lantau, and dolphins
appeared to use this area as their important habitats with very high densities
throughout the four seasons. Several
areas were heavily used by dolphins in all four seasons, including the northern
waters of Lung Kwu Chau
(G9-10 & H9-10).
In Northeast Lantau,
dolphin densities were moderately high in summer, autumn and winter months, but
were generally low in spring months. Off Black Point (I7), dolphin density was
highest in autumn. Similarly, the waters around the Brothers Islands
were used consistently throughout the year, with higher dolphin densities in
summer and autumn months.
In
Deep Bay, dolphin usage was very low in
spring and summer months, but was more intensified in autumn and winter
months. In these two seasons, dolphins
appeared to have preference to use the waters near the mouth of Deep Bay
(H5, I5 & J55).
Individual Movements and
Patterns of Use
During the study period, a number of
individual dolphins in both of the study subareas
were successfully identified. The
individuals identified so far are listed in Table
9.11, along with an assessment of the importance of the subarea
as part of the dolphin’s home range.
The subarea was considered an important part
of the dolphin’s range if
>25% of the sightings of that individual occurred in the area.
Table 9.11 Individual
Humpback Dolphins Observed during the LNG Study (July 2005 – May 2006)
|
Dolphin’s ID
|
Total sightings (1)
|
EIA Study sightings (2)
|
DB (3) (4)
|
West NWL (3) (4)
|
HR Study?
|
|
CH03
|
18
|
1
|
|
4 (22%)
|
Yes
|
|
CH37
|
7
|
1
|
|
1 (14%)
|
|
|
DB02
|
2
|
2
|
2
(100%)
|
|
|
|
DB03
|
1
|
1
|
1
(100%)
|
|
|
|
EL01
|
43
|
1
|
|
6 (14%)
|
Yes
|
|
EL03
|
5
|
1
|
|
1 (20%)
|
|
|
EL07
|
57
|
1
|
|
2 (4%)
|
Yes
|
|
NL11
|
45
|
3
|
1 (2%)
|
16
(36%)
|
Yes
|
|
NL24
|
95
|
2
|
|
18 (19%)
|
Yes
|
|
NL37
|
35
|
1
|
|
5 (14%)
|
Yes
|
|
NL46
|
15
|
1
|
|
8
(53%)
|
Yes
|
|
NL59
|
18
|
1
|
|
3 (17%)
|
Yes
|
|
NL60
|
16
|
1
|
|
8
(50%)
|
Yes
|
|
NL76
|
10
|
1
|
|
6
(60%)
|
Yes
|
|
NL98
|
47
|
1
|
|
6 (13%)
|
Yes
|
|
NL123
|
43
|
5
|
|
11
(26%)
|
Yes
|
|
NL128
|
10
|
1
|
|
1 (10%)
|
Yes
|
|
NL136
|
8
|
1
|
|
5
(63%)
|
|
|
NL139
|
42
|
1
|
|
5 (12%)
|
Yes
|
|
NL141
|
31
|
1
|
|
6 (19%)
|
Yes
|
|
NL150
|
7
|
1
|
1 (14%)
|
6
(86%)
|
|
|
NL169
|
10
|
3
|
3
(30%)
|
6
(60%)
|
Yes
|
|
NL170
|
4
|
1
|
|
2
(50%)
|
|
|
NL181
|
14
|
5
|
4
(29%)
|
9
(64%)
|
Yes
|
|
NL191
|
9
|
1
|
|
2 (22%)
|
|
|
NL202
|
6
|
1
|
|
4
(67%)
|
|
|
SL07
|
13
|
2
|
|
|
Yes
|
|
WL11
|
16
|
2
|
|
6
(38%)
|
Yes
|
|
WL25
|
22
|
2
|
|
1 (5%)
|
Yes
|
|
WL30
|
2
|
1
|
1
(50%)
|
|
|
Note: (1) Total
sightings in the long-term database.
(2) Sightings in ERM’s
surveys (July 2005 – May 2006) for this EIA Study.
(3) Number of sightings in each of the LNG
survey areas (along with the proportion of the total in parentheses).
(4) Areas with >25% of the total
sightings are in bold.
Twenty-six dolphins were observed in
Northwest Lantau during the LNG surveys, and there appear
to be at least 12 different dolphins that used Northwest Lantau as part of their range during the study
period.
The Deep Bay subarea
contains the Black Point site at its southern boundary. Only seven dolphins in Deep Bay
were identified during the LNG study.
However, of these, five (DB02, DB03, WL26, NL169 and NL181) appeared to
use Deep Bay as a portion of their home range
during the study period (although the sample sizes were small). In addition, two other dolphins were
identified in Deep
Bay in previous surveys,
and both of them used it as a part of their home range.
The ranging patterns of 18 individual
dolphins identified during the 11-month surveys are shown in Figures 9.28
& 9.29. Of these individuals, 18 were identified in
Northwest Lantau, and three in Deep Bay.
Currently, among the 398 individuals
identified in Hong Kong and Chinese waters of
the Pearl River Estuary, 59 individuals (15%) were re-sighted 10 or more times,
which were used in the ranging pattern analysis. Among them, 51 individuals (86%) had home
ranges covering the western end of Northwest Lantau.
On the contrary, only one (NL11) had range covering Deep Bay. The large proportion of identified
individuals sighted in Northwest Lantau
strongly suggested the importance of this habitat to dolphins residing in the
Pearl River Estuary.
Group Size and Composition
Humpback dolphin average group size was
smaller for the Deep Bay than for the Northwest Lantau subarea (Table
9.12).
Table 9.12 Average Group Size for Dolphins and Porpoises among the Different Survey
Subareas
|
Species
|
Subarea
|
N
|
Mean
|
±Sd
|
Range
|
|
Humpback dolphin
|
Deep Bay
|
55
|
3.0
|
2.37
|
1 to 12
|
|
|
Northwest Lantau
|
62
|
3.7
|
2.89
|
1 to 17
|
Due to the need to observe dolphin groups
for extended periods at close range (which somewhat conflicted with the goal of
completing all the transect lines), the surveys
were only able to accurately record
complete age class composition for a portion of the groups observed in each
area (Table
9.13). In this subsample, no Unspotted Calves were found in Northwest Lantau. However, as
discussed previously, Unspotted Calves are seen in Northwest
Lantau waters with sightings clustered
within a few hundred meters of Lung Kwu Chau.
Table 9.13 Age Class Composition of Groups of Dolphins among the Two Survey Subareas (Percentage of Total Given in Parentheses). Note that only groups in which the
composition of the entire group was determined are presented
|
Area
|
No. of Groups
|
UC
|
UJ
|
SJ
|
SS
|
SA
|
UA
|
|
Deep Bay
|
19
|
4 (7%)
|
8 (14%)
|
13 (24%)
|
14 (25%)
|
13 (23%)
|
4 (7%)
|
|
Northwest Lantau
|
16
|
0 (0%)
|
5 (11%)
|
6 (13%)
|
12 (26%)
|
18 (39%)
|
5 (11%)
|
Besides that mentioned above, there were
no dramatic differences in group composition among the different subareas, but there were some differences in the age
classes most represented (i.e., those with greater than 20% of the total).
Behaviour
Dolphin sightings associated with
different types of activities were examined on GIS to determine important areas
for certain types of dolphin activity.
In Northwest Lantau,
most of the feeding activities occurred around Lung Kwu
Chau and Sha Chau (Figures 9.22 & 9.23). Feeding activities were
rarely observed in Deep
Bay.
Dolphins were occasionally observed
socializing during the study period, and there was no particular area where
sightings associated with socializing activities were frequently observed. These socializing sightings were sparsely
made around Lung Kwu Chau
and within Deep Bay (Figures 9.22 & 9.23).
9.4
Evaluation of
Ecological Importance of the Study Area
The existing conditions of the marine
ecological habitats and resources in the waters of the proposed LNG terminal at
Black Point have been assessed. These
baseline conditions have been based on available literature and, where
considered necessary, detailed field surveys to update and supplement the
data. Based on this information, the
ecological importance of each habitat has been determined according to the EIAO-TM Annex 8 criteria, as follows:
9.4.1
Intertidal
Habitats
The criteria listed below have been
applied to the information gathered or reviewed on the marine ecology of the intertidal habitats at Black Point in order to determine
the ecological value. The application of
these criteria has led the artificial shoreline and natural rocky shore to be
classified as low ecological importance (Table 9.13).
Table 9.14 Ecological
Importance of Intertidal Habitats at Black Point
|
Criteria
|
Rocky Shore
|
Artificial Shorelines
|
|
Naturalness
|
|
Artificial,
constructed habitat.
|
|
Size
|
Large. Within
the Study Area, rocky shore habitat are approximately 600 m in total length
and are predominant habitat on Black Point headland.
|
Large.
The total length of the artificial shore in the Study Area at Black Point is
approximately 120 m and are predominant habitat to the north of the power
station.
|
|
Diversity
|
Low. The intertidal communities are composed of typical biota of
semi-exposed rocky shores in Hong Kong, but
with low diversity.
|
Records indicate
that sloping artificial shores support similar assemblages to natural intertidal shores.
|
|
Rarity
|
No
species recorded are considered rare or of recognised conservation interest.
|
No species
recorded are considered rare or of recognised conservation interest.
|
|
Re-creatability
|
The
habitat can be re-created.
|
n/a.
|
|
Fragmentation
|
Low. The
surrounding environment contains similar intertidal
habitats.
|
Low. The surrounding
coastlines are composed of a mixture of natural and artificial intertidal shores.
|
|
Ecological
Linkage
|
The
habitat is not functionally linked to any high value habitat in a significant
way.
|
The
habitat is not functionally linked to any high value habitat in a significant
way.
|
|
Potential
Value
|
Unlikely
that the site can develop conservation interest.
|
Unlikely
to become an area of conservation value
|
|
Nursery
Area
|
No significant
records identified during the literature review or field surveys.
|
No
significant records identified during the literature review or surveys.
|
|
Age
|
n/a for
these assemblages as the life cycle of the fauna and flora is very short.
|
The artificial
seawall has been in place since the site access of Black Point Power Station
was obtained in March 1993.
|
|
Abundance
|
Typical
of other semi exposed shores in Hong Kong.
|
Lower
abundance than natural rocky shore habitat.
|
|
SUMMARY
|
The fauna
of the intertidal region appears to be typical of
semi exposed shores in Hong Kong, but with
low diversity. The sites appear to
have suffered some human disturbance.
Ecological Importance - Low.
|
The fauna
of the intertidal region of the artificial shores
is reported to support a similar diversity and abundance of intertidal organisms as natural shores.
Ecological Importance - Low.
|
9.4.2
Subtidal
Habitats
The criteria listed above have
been applied to the information gathered or reviewed on the marine ecology of
the subtidal soft bottom benthic habitat at Black
Point in order to determine the ecological importance. The application of these criteria has led the
habitat to be classified as of low - moderate ecological importance (Table
9.15).
Table
9.15 Ecological
Importance of the Subtidal Soft Benthos Assemblages
at Black Point and the Study Area
|
Criteria
|
Subtidal Soft Benthos at Black Point (BP1, BP2
and UR)
|
|
Naturalness
|
Habitat disturbed to some extent by fisheries vessel trawling
activities and is influenced by discharges from the Pearl River and Shenzhen River.
|
|
Size
|
Large in extent.
|
|
Diversity
|
|
|
Rarity
|
No
organisms were found that are considered as rare or of conservation interest.
|
|
Re-creatability
|
Benthic
organisms may recolonise disturbed seabed area.
|
|
Fragmentation
|
The
habitat is not fragmented.
|
|
Ecological
Linkage
|
The
habitat is not functionally linked to any high value habitat in a significant
way.
|
|
Potential
Value
|
Unlikely
that the site can develop conservation interest.
|
|
Nursery
Area
|
No
significant record identified in the review or surveys.
|
|
Age
|
The fauna
appear to be typical of those present in Hong Kong's
soft benthos. The sediments in the
habitat are constantly accreting and eroding and the fauna present there are
typically short lived.
|
|
Abundance
|
In
comparison to parts of the southern and western waters the assemblages are of
moderate abundance.
|
|
SUMMARY
|
The
sediments support moderate diversity and abundance of benthic organisms that
are typical of Hong Kong's benthos.
Ecological Importance – Low – Moderate.
|
9.4.3
Marine Waters off Black Point
The same assessment criteria have been
applied to the marine waters within the Study Area with regard to the usage of
the area by marine mammals. This habitat
has been classified as of medium importance on the use of the area by
Indo-Pacific Humpback Dolphins Sousa chinensis (Table 9.16).
Table 9.16 Ecological
Importance of the Marine Waters off Black Point
|
Criteria
|
Marine Waters off Black Point and the Study Area
|
|
Naturalness
|
|
|
Rarity
|
Indo-Pacific
humpback dolphin Sousa chinensis has been recorded in coastal waters near Lan Kok Tsui
and off Black Point Power Station.
|
|
Re-creatability
|
n/a
|
|
Ecological
Linkage
|
Preferred
marine mammal habitat occurs to the south (north-western and west Lantau) for humpback dolphin. Based on
photo-identification studies, identified individual dolphins sighted near
Black Point have extensive home ranges which span large areas of North Lantau waters and beyond (see Figures
9.28 and 9.29). In this context, Black Point
waters form only a small portion of individual dolphin’s home range.
|
|
Potential
Value
|
Limited
value due to fishing activities and marine traffic of the area.
|
|
Nursery
Area
|
|
|
Abundance
|
Seasonal changes
in the distribution patterns of dolphins were observed near the areas of the
proposed LNG terminal, with comparatively higher densities in autumn and
winter months. Analysis of dolphin density data indicates these animals occur
in moderate densities in waters in proximity to the proposed reclamation.
|
|
SUMMARY
|
Sightings
of humpback dolphin have been made in these waters in all seasons in spite of
significant vessel traffic, and dolphin density (DPSE) levels in waters in proximity
to the proposed reclamation are considered to be moderate compared to
preferred habitat elsewhere in Northwest Lantau and
West Lantau.
Ecological Importance – Medium for humpback
dolphin at Black Point.
|
9.4.4
Species of Conservation Interest
In accordance with EIAO-TM Annex 8 criteria, an evaluation of species of conservation
value recorded from the Study Area is presented in Table
9.17.
Table 9.17 Species
of Conservation Interest within the Study Area
9.5
Summary
The findings from the literature review and
field surveys on marine ecological conditions are detailed above and are
summarized as follows.
The key finding of the literature review
was the recorded presence in the waters in outer Deep Bay
of the Indo-Pacific humpback dolphin Sousa
chinensis.
The review highlighted that the waters around Black Point reported
sightings occurred throughout the year.
No recent studies of the subtidal
hard bottom habitats in vicinity to the proposed Black Point
LNG terminal have been
conducted.
Due to the limited literature available
for some components of the marine environment, field surveys were necessary to
fill the information gaps identified for the baseline conditions of the
habitats. The baseline surveys commenced
in February 2004 and have included both the dry and wet seasons. Detailed and comprehensive seasonal surveys
were conducted examining the major habitats and species surrounding Black Point
and the Study Area. The details of the
baseline surveys are summarized in Table
9.18.
Table 9.18 Marine
Ecology Baseline Surveys
|
Survey Type
|
Methodology
|
Date
|
|
Intertidal Assemblages
|
Quantitative
(belt transects at 4 locations) survey, three 100 m belt transects (at high,
mid and low intertidal zones) for each location,
covered both wet and dry seasons.
|
22
& 23 March and 15 & 30 July 2004
|
|
Subtidal Benthic Assemblages
|
Quantitative
grab sampling survey; covered both wet and dry seasons. Six stations sampled
in each of 3 locations (BP1, BP2 and UR).
|
25
& 26 February and 5 & 6 July 2004.
|
|
Marine
Mammal
|
Land-based
visual survey during daytime, 5 days per month and 6 hours per day, covered
four seasons (12 months).
|
16,
17, 18, 19 & 26 February, 19, 22, 23, 25 & 26 March, 6, 7, 13, 14
& 15 April, 11, 13, 17, 18 & 20 May, 11, 15, 24, 25 & 29 June
2004, 9, 14, 15, 20 & 25 July 2004, 25, 26, 27, 30 & 31 August, 15,
16, 17, 20 & 21 September 2004, 27, 28, 29, 30 & 31 October 2004, 24,
25, 27, 29 & 30 November 2004, 7, 8, 9, 13 & 14 December 2004, 21,
24, 25, 26 & 27 January 2005.
|
|
|
Quantitative
vessel based survey using line transect methods spanning Hong Kong western
waters (Deep Bay, Southwest Lantau, Northwest Lantau and West Lantau) 3 days,
2 times per month.
|
18,
19, 20,,21, 22, 25, 26, 27 July 2005, 3, 4, 5,15, 23, 24, 25 & 26 August
2005, 5, 6, 7,15, 16 & 20 September 2005, 5, 6, 7, 17, 18 & 19
October 2005, 22, 24, 25, 28, 29 & 30 November 2005, 1, 2, 6,7,8 & 22
December 2005, 13, 16, 17, 19, 20 & 24 January 2006, 1, 2, 3, 7, 8 &
9 February 2006, 17, 23, 28, 29, 31 March 2006, 3, 6, 18, 25, 26, 27 April
2006, 2, 4, 8, 9, 10, 11 May 2006.
|
The ecological importance
of the habitats was determined through reference to the following:
The information on marine ecological resources
presented in this report has not identified any habitats of high ecological
value. Humpback dolphins have been sighted in the area. Although the waters do not support high
number of sightings in comparison to other areas in Hong Kong, such as West and
Northwest Lantau,
marine waters around Black Point were regarded as of medium importance to the
humpback dolphins. The majority of other marine habitats were
considered to be of low ecological importance.