10 Hazard To Life Assessment
10.1.1.1 This is an update of the hazard to life assessment previously submitted as part of the EIA for the PAFF facility in May 2002 [1]. Following that submission, an Environmental Permit EP-139/2002 was granted on the 28th August 2002. However, the decision to grant the Environmental Permit was subject to a Judicial Review and the Court of Final Appeal quashed the Permit in its judgment of July 2006 [2] (reversing the previous judgements [3], [4]). The project now needs to once again go through the statutory procedures in order to obtain a new environmental permit.
10.1.1.2 The judgement [2] did not envisage going back to square one for the hazard to life assessment, but did require the inclusion of a quantitative assessment of the instantaneous loss of a 100% of the tank’s content (see Paragraph 10.1.3.4).
10.1.1.3 The hazard to life assessment has been updated to address this issue and also to allow for revisions to the design and operation of the PAFF since the original EIA was submitted. At the same time, the opportunity has been taken to reorganise the report to increase clarity and to improve the assessments where appropriate.
10.1.2 Overview of PAFF Hazards
10.1.2.1 The Permanent Aviation Fuel Facility (PAFF) is designed to receive
Jet A1 aviation fuel by ship, store it in tanks and export it to
10.1.2.2 Historically, major accidents in supply depots have been dominated by the presence of gasoline storage, where explosive mixtures can form in a tank, and where flammable clouds can evaporate from spills and catch fire.
10.1.2.3 Fuels like gasoline give off a vapour that you notice as a smell when you fill up a car at a filling station. If the concentration of the vapour in the air is very low, then it can be smelt, but will not ignite. If the concentration is high enough (but not too high), it can be ignited (perhaps by a flame, or the engine of a passing car). If ignited, then the vapour can burn back to its source, and ignite the liquid fuel. This is why filling stations and pumps are carefully designed so that the operation is safe.
10.1.2.4 Under normal conditions, fuels like diesel and Jet A1 might smell a bit, but do not give off flammable vapour. This is because diesel and Jet A1 are less volatile than gasoline and give off less vapours. At ambient temperatures, the vapour above a pool of gasoline will be flammable, whilst the vapour above a pool for Jet A1 will not be flammable.
10.1.2.5 Hydrocarbons (including Jet A1) as a liquid do not self-ignite or burn. In a burning liquid fire, the heat from the fire raises the temperature of the surface of the pool so that vapour boils off, and it is the vapour mixture with air that burns. The same mechanism applies to the burning of liquid droplet sprays in a car engine; the liquid does not burn, only the vapour that has boiled off the droplets.
10.1.2.6 So a spill of Jet A1 is very hard to ignite, whereas a spill of gasoline is relatively easy to ignite, although an ignition source still has to be present. This distinction (based on flash point – see Section 10.2.1) is incorporated into international codes for storing fuel.
10.1.2.7 Jet A1 is essentially the same as kerosene which is widely used all
over the world for domestic heating and cooking because it can be handled safely.
Jet A1 is made to the same specification all over the world, and stored in
tanks of the same design to those proposed for the PAFF, even in places where
the ambient temperature is such that the vapour above the fuel surface may be
flammable (e.g.
10.1.2.8 The PAFF will be built to internationally recognised standards and best practices for fuel storage. Cylindrical steel storage tanks with conical roofs (to API 650) are used throughout the world for storage of liquid hydrocarbon fuels. The same types of tanks are also used to store more volatile fuels such as gasoline, although internal floating roofs are now standard for gasoline to reduce environmental emissions of vapour. Bund walls, will surround the tanks so that, in the case of leaks, any fuel leak is collected and can be cleaned up. The containment capacities of the bunds at the PAFF greatly exceed international standards. The PAFF design also has two additional impervious security walls as well as the more usual single bund wall and fence. This will further reduce the chance of any spill affecting off-site areas.
10.1.2.9 The PAFF design exceeds international standards on the spacing between the storage tanks and the boundary fence, including exceeding the relevant spacing recommendation from the Hong Kong Code of Practice for Oil Installations [5] by a factor of nearly three (see Section 10.2.2). A typical international standard for safety distance of 15 m, is applied in refineries, where hot process equipment and furnaces co-exist with the tank farms, as well as storage terminals where heavy industry and other developments may be immediately outside the fence. This safety distance also applies to storage of more hazardous products such as gasoline, but the distance to the boundary at the PAFF (28.5 m) still exceeds this distance.
10.1.2.10 It is common for fuel terminal facilities to co-exist close to residential areas and other industries, involving large populations and potential ignition sources outside the site, as they are not generally seen as presenting a high risk. A range of examples of this are given in the recent independent risk study for the PAFF conducted for Tuen Mun District Council and the Airport Authority Hong Kong [6]. In contrast, the selected location for the PAFF is in an area zoned as a “Special Industrial Area” and is well away from residential developments.
10.1.2.11 Jet A1 is routinely handled safely in large quantities around airports for refuelling purposes, directly adjacent to potential ignition sources such as aero engines and in the vicinity of large numbers of passengers. For example, a 747 aircraft has 4 large jet engines and may typically carry ~200 m3 of Jet A1 and ~400 passengers.
10.1.2.12 The PAFF involves a simple, single client operation handling only a single fuel. Many other oil terminal facilities have more complex operations including multiple fuels, clients and import and export routes. The simplicity of the PAFF operation reduces the likelihood of operational errors when compared with typical oil storage sites.
10.1.2.13 Based on the operations undertaken, materials handled, facility design and location, the PAFF would be expected to be at the low end of the spectrum of risks presented by hazardous installations world-wide. This is confirmed by the results of this assessment for the PAFF which identifies a risk to individuals on the roads outside the PAFF boundary as significantly less than the risk of them being struck by lightning elsewhere.
10.1.2.14 The operation of the PAFF will reduce the level of marine traffic in the region and the vessels delivering to the PAFF will be of improved design to those currently delivering to the aviation fuel receiving facility (AFRF) at Sha Chau. Currently there are about 1000 barges per annum each delivering 5000 dwt of fuel to the airport via the AFRF. This would increase to ~1100 /yr by the time the PAFF becomes operational in 2009. The vessels delivering to the AFRF are single hulled and the majority transit without pilots or tug boats. With the PAFF in operation, there would be 150‑200 tankers varying from 10,000 to 80,000 dwt delivering fuel to the airport via the jetty at the PAFF instead of the barges delivering to the AFRF. These tankers will be double hulled and use marine pilots and tug boats. Thus with the commencement of the operation of the PAFF and with the reversion of the AFRF at Sha Chau to an emergency back-up facility, the likelihood of an incident in the Ma Wan Channel and in Urmston Channel, and associated collision risk, will be reduced.
10.1.3.1 This section of the Environmental Impact Assessment (EIA) report deals with the hazards to life that may be posed by the Permanent Aviation Fuel Facility (PAFF), as required in the Hazard to Life Assessment Section of the Study Brief [7] which reads:
“3.3.10 Hazard To Life
3.3.10.1 The risk to the life, including the workers of nearby plants, due
to marine transport, jetty transfer, tank farm storage and pipeline transfer of
aviation fuel shall be assessed. The Applicant shall follow the criteria for
evaluating hazard to life as stated in Annexes 4 and 22 of the TM in conducting
hazard assessment and include the following in the assessment:
(i) identification of all hazardous scenarios associated with the
marine transport, jetty transfer, tank farm storage and pipeline transfer of
aviation fuel, which may cause fatalities;
(ii) execution of a Quantitative Risk Assessment expressing population
risks in both individual and societal terms;
(iii) comparison of individual and societal risks with the Criteria for
Evaluating Hazard to Life stipulated in Annex 4 of the TM; and
(iv) identification and assessment of practicable and cost effective
risk mitigation measures as appropriate.”
10.1.3.3 The hazard to life assessment developed by ERM in the previously submitted EIA [1] has now been completely reviewed and updated by ESR Technology (ESR), formerly the Engineering, Safety & Risk Business of AEA Technology, following the recent judgement in the Court of Final Appeal [2] (reversing previous judgements [3], [4]).
10.1.3.4 The judgement [2]
does not envisage ‘going back to square
one’ for the hazard to life assessment, noting that ‘issues other than the QRA for “all hazardous scenarios” have already
been addressed, comments have been obtained and evaluated’ (
10.1.3.5 Much of the information in the original hazard to life assessment [1] therefore remains applicable and has simply been re-ordered, although updates for changes to the design and improved quantification of some scenarios have been included, together with a detailed assessment of the instantaneous release from a tank.
10.1.3.6 As part of the process of updating this assessment the earlier reports by Macinnis [8] and McBride [9] have been reviewed and the issues raised addressed.
10.1.4 PAFF Location and Facilities
10.1.4.1 The PAFF will be located at an undeveloped reclaimed shoreline site at Tuen Mun Area 38. It will consist of the following major elements:
· a jetty with two berths, which together will accommodate a full range of vessels from 10,000 to 80,000 dwt vessels;
· a tank farm with gross aviation fuel capacity of 264,000m3 for the initial development and an ultimate capacity of about 388,000m3 as well as pumps and associated facilities;
· on site operational facilities including offices;
· 500mm diameter twin sub sea pipelines from the tank farm to the existing Aviation Fuel Receiving Facility (AFRF) at Sha Chau for onward transfer of the fuel to the aviation fuel system at the airport.
10.1.4.2 Approximately 6.75 ha of land will be required to locate the
aviation fuel tank farm and associated facilities. The proposed site for the tank farm at Tuen
Mun Area 38 was reclaimed by Government and is zoned as a Special Industrial
Area (SIA). The site is situated at Siu
Lang Shui just southeast of the
10.1.4.3
No residential developments are
present in the area and the closest substantial development,
10.1.4.4 The tank farm storage will consist of two bunds each containing six tanks. Initially, only four of the tanks in each bund will be built to be operational in 2009 (tanks 2, 4, 5, 6, 8, 10, 11, 12). The remaining two tanks in each bund (tanks 1, 3, 7 and 9 to the north-west of the site adjacent to SWS - at the top of Figure 10.1) are anticipated to be built in about 20 years to provide the full site storage capacity of 388,000m3. These are referred to as the “initial development” and “final development” cases.
10.1.4.5 Although this hazard to life assessment covers the final development, it is the intention of the Airport Authority to review the EIA if appropriate, prior to the final development, to take account of any changes in standards, technology and statutory requirements at that time.
10.1.4.6 The proposed layout of the tank farm is shown in Figure 10.1 and a cross-section of one tank and the bund wall is shown in Figure 10.2. These are based on the Variation of the Environmental Permit for the PAFF [11].
Figure 10.1: PAFF Tank Farm Layout
10.1.4.7 The tank bund design is such that the total capacity of the bund significantly exceeds the usual 110% of the capacity of the largest tank. The bund containment capacities are 166% and 156% of the capacity of the largest tank for the bunds nearest to the sea and furthest from the sea respectively, with all tanks constructed [12]. Initially, with only four of the tanks in each bund constructed, the bund capacities will be 195% and 188% of the capacity of the largest tank [12].
Figure 10.2: PAFF Tank and Bund
Cross-Sectional Layouts
10.1.5.1 The Emergency Shutdown (ESD) control philosophy at the facility provides for the shutdown of the following:
· receipt of fuel from the jetty;
· tank farm facility; and
· delivery lines.
10.1.5.2 There are two ESD valves on the inlet to the tank farm (from the jetty) and two on the outlet of the tank farm (to the AFRF at Sha Chau). These valves are operated via motorized electric actuators during normal operation and will be closed by pneumatic power during an interruption to the facility’s main power.
10.1.5.3 Each of the above systems has different means of initiating the system. Manual push-buttons provide the primary mode of initiation. However, other initiating devices such as the actuation of the fire alarm system, fuel tank high-high level and a sudden drop in pressure in the delivery pipelines can also activate the ESD system. A leak detection system is provided for the delivery pipeline.
10.1.5.4 The fire fighting facilities at the PAFF include dedicated sea water pumps to provide fire water for tank cooling, foam injection and fire hydrants. Four pumps each of 15,000 litres/min capacity are provided for tank cooling, foam injection and fire hydrants. In addition, one pump with 24,000 litres/min capacity is also provided for the FSD foam canon.
10.1.5.5 The storage tanks are provided with water spray to cool the tank shell. The fire water system is designed to provide for cooling of the tank on fire as well as cooling of adjacent tanks.
10.1.5.6 Foam injection facilities are provided for injecting foam into the base of the tank (in the event of a tank being on fire).
10.1.5.7 Remotely operated foam monitors will be installed, each mounted about 1 m above the top of the external bund, with a minimum discharge rate of 4,200 litres/min.
10.1.5.8 A drencher system and a foam monitor system are provided at the jetty.
10.1.5.9 An automatic fire alarm system is provided for the tank farm as well as the jetty.
10.1.5.10 Emergency access/egress arrangements will be constructed including staircases around the internal bund wall.
10.1.5.11 External fire fighting resources, including fireboats, will be provided by the Fire Services Department. The Pillar Point Fire Station, which has both fire trucks and foam trucks, is the nearest to the PAFF facility and could be reached within the graded response time for the area of 6 minutes under normal traffic conditions. The Fire Services will take immediate measures to extinguish the fire using foam. Foam pourers and foam tanks are also provided on site. Also, in the event of any tank fire or bund fire, the on-site and off-site emergency plan will be activated which will include evacuation of people in the neighbouring sites as well as mobilisation of additional resources including foam stocks within Hong Kong.
10.1.5.12 The storage tanks will be located within a bund, which is designed to contain any spills from the tank or tank piping. The bund is designed to hold much more than the required 110% of the contents of the largest tank in the bund. The bund will be provided with a drain, which will be discharged by a manually operated valve to the sea through an oil interceptor. Drainage from unbunded areas onsite will be discharged through the storm water drain to the sea. The storm water drain will be provided with a remotely operated block valve to contain any oil spill on site.
10.1.5.13 The principal code of practice applicable to the PAFF is the Hong Kong Code of Practice for Oil Installations [5]. This Code makes reference to international codes such as API 650 for the design of tanks and additional standards are specified in the design premise [14].
10.1.5.14 The following fire services installations will be provided to the tank farm and jetty to the satisfaction of the Fire Services Department (FSD) and other relevant standards [15]:
· Fire hydrant / ring main
· Water spray cooling system
· Manual fire alarm system
· Automatic detection and fire alarm systems
· Fixed foam systems
· Emergency lighting
· Fire control centre
· Exit signs and directional signs
· Emergency generators
· Portable hand-operated appliances
· Street fire hydrants
· Drencher system
· Fireboat berthing facilities
· Emergency vehicle access
· Remotely operated foam monitors
· Additional access and egress points around bund
· Ring main for FSD foam cannon
10.1.5.15 The PAFF facility will be provided with a number of security measures including double security fences/walls, with CCTV and microwave intruder detection between them, and security guards on duty 24 hours per day. The PAFF will be considered as a restricted area and a stringent access procedure will be imposed similar to the existing tank farm facility at the airport.
10.1.6 Safety Features of PAFF Tanks
10.1.6.1 The PAFF will adopt the current codes and practices, in its design and construction, as specified in [14] and [16]. Specific features of note include:
· A weak shell to roof connection (specified in API 650) that is designed to fail in the event of an overpressure within the tank. [16].
· Welding procedures, in compliance with API 650. The safeguards are summarised in the Affirmation of The PAFF Contractor [16] as follows, “the welding procedures in API 650 are designed to ensure that there are no out of tolerance defects in the weld, such as voids, inclusions, lack of fusion of the welded metal with the metal being joined or cracks. No weld is to be performed upon the tank unless it is to a specified welding procedure. Welds are radiographed in accordance with API 650 to confirm that the welds produced are sound. The welder qualification tests include testing of welded joints undertaken by the welder to show that the welds meet or exceed the specified requirements, which include any propensity to brittle fracture. All welding personnel are required to be qualified and to demonstrate that they can weld satisfactorily to the relevant welding procedure.”
· Construction materials will be chosen and tested to avoid brittle fracture of the PAFF tanks, as per API 650. The safeguards are summarised in the Affirmation of The PAFF Contractor [16] as follows: “the materials specified in API 650 have been chosen and tested to avoid properties that lead to brittle fracture. The specification for the steel grades ensures that problems experienced historically in the fabrication of tanks are avoided. Plates are tested for chemical composition and mechanical properties to show that they can meet or exceed the specification requirements which include any propensity to brittle fracture;”
· The PAFF tanks will have a full height hydrotest (as required under API 650) and settlement will be monitored for up to 12 weeks [14]. Water is more dense than Jet A1 and places a higher load on the tank structure than the maximum operating load of the tank (about 119% of maximum operating load) [16].
· “Plates of the tanks are staggered so that a single continuous line of welding from top to bottom does not occur” [14].
· The tanks are provided with vents designed to API standard 2000, “Venting Atmospheric and Low Pressure Storage Tanks- Non-refrigerated and Refrigerated”, Fifth Edition 1998.
· The tanks will be protected against static, stray currents and lightning as per API RP 2003 – Protection Against Ignition Arising Out of Static, Lightning, and Stray Current, Fifth Edition, December 1991 [16].
· The PAFF tanks will incorporate fire fighting systems including fixed base foam injection and shell cooling systems on the tanks [16].
· Corrosion and settlement will be monitored [14]. Corrosion allowances are included in the design, the tank base is elevated relative to the bund floor, and the tanks will be inspected as specified in API 653 [16].
· The site will be provided with “security measures such as a double security fencing, CCTV’s within the security fence, and security guards on 24 hours duty” (Affirmation of The PAFF Contractor [16]).
10.1.6.2 In addition, the fuel stored at the PAFF will be Jet A1. Jet A1 will
not produce a flammable vapour at ambient temperatures in
10.1.7 Note on Quantitative Risk Assessment
10.1.7.1 When assessing the level of risk it is normal that there will be uncertainties present. In undertaking these risk calculations, ESR apply a cautious best estimate approach. The cautious best estimate approach ensures that every attempt is made to use realistic best estimate assumptions, but where there is difficulty in justifying an assumption (for example, due to lack of appropriate data) a pessimistic approach is used. A cautious best estimate is cited as the approach used by the UK HSE in the report “Risk criteria for land-use planning in the vicinity of major industrial hazards” (paragraph 26 of [17]). This approach is widely used in QRA and is consistent with Section 4.4.3 of the Technical Memorandum [18] which says:
“When evaluating the residual environmental impacts (the net impacts
with the mitigation measures in place), the following factors shall be
considered: ...
(x) both the likelihood and degree of uncertainty of adverse
environmental impacts: If the adverse environmental impacts are uncertain,
they shall be treated more cautiously than impacts for which the effects are
certain and the precautionary principle shall apply.”
10.1.7.2 The criteria for hazard to human life assessment under the EIAO [19] are provided in the Technical Memorandum [20]. These are reproduced in Appendix H1.
10.1.7.3 The three regions in Figure H1.1 refer to risks which would be considered unacceptable, risks which would be considered acceptable without any further mitigation and risks where there is a requirement to consider mitigation measures to ensure the risks are as low as reasonably practicable (ALARP), under the Technical Memorandum criteria [2].
10.1.8.1 Population data for the areas surrounding the PAFF, that could be impacted by an incident, is provided in Appendix H8. This includes current and future populations at SWS, as identified by Maylor [21] and the expected population in the EcoPark. There is no residential development in the area around the tank farm, with the closest residential properties being about 2km away at Lung Kwu Tan. There is a holiday camp planned on the hillside about 600m from the PAFF. This is elevated relative to the PAFF and will be partially screened by the hill.
10.2 Identification of Hazardous Scenarios
10.2.1 Hazardous Substances and Properties
10.2.1.1 The PAFF is designed to store Jet A1. No other hazardous substances will be stored on site in significant quantities. The principal hazard from Jet A1 is a liquid pool fire.
10.2.1.2 Jet A1 is a Class 2 product according to the Hong Kong Code of Practice for Oil Installations [5]. Class 2 products have a flash point of or exceeding 23oC but not exceeding 66oC [5]. Class 1 and Class 3 products have flash points below and above these limits respectively.
10.2.1.3
Jet A1 is a flammable liquid
with a flash point greater than 38oC (the flash point is
approximately the temperature at which the vapour pressure of the flammable
substance is sufficient to give a concentration of vapour in the air that
corresponds to the lower flammability limit). The minimum flash point is part
of the Jet A1 fuel specification and may be higher in practice. The maximum and
minimum recorded temperatures in
10.2.1.4 Different types of aviation fuel have different characteristics; for example Jet A1 and JP8 are similar and are manufactured from the kerosene cut of crude oil, whilst gasoline based aviation fuels such as Jet B and JP4 have significantly different properties, including significantly lower flash points.
10.2.1.5 This makes Jet A1 much more difficult to ignite than liquids classed as highly flammable (e.g. JP4 and gasoline) or liquefied gases (e.g. butane), which produce flammable vapours that can be directly ignited by a spark and may lead to drifting flammable gas clouds. Jet A1 may be ignited by a strong ignition source such as a fire, but will not be ignited by a simple low energy ignition source such as a spark at the liquid surface, unless heated above 38oC.
10.2.1.6 Jet A1 may be toxic by ingestion, but there is no acute toxic hazard of relevance to major accident scenarios considered here.
10.2.1.7 Physical and chemical properties of Jet A1 are summarised below. Note that the precise composition of Jet A1 can vary, so some variation in the figures is expected.
Table 10.1: Properties of Jet A1
|
Property |
Value |
|
Liquid density |
775-820 kg/m3 @15oC [24] 840 kg/m3 [14] |
|
Boiling Point |
150oC Initial [24] |
|
Minimum Flash Point |
38oC (40oC Test) [24] |
|
Flammable Limits |
1-6% vol [24] |
|
Burning Rate |
0.053 kg/m2/s [1] |
|
Pool rate of flame spread |
<0.5 m/s [24] |
|
Auto-ignition Temperature |
220oC1 [24] |
|
Minimum ignition energy |
0.2mJ [24] |
|
Vapour pressure |
<0.1 kPa @ 20oC kPa [24] |
|
Viscosity |
1.4×10‑3 kgm‑1s‑1
[24] |
|
Latent heat of vaporisation |
291 kJ/kg (based on kerosene Table C.1 of [25]) |
|
Specific heat |
2.19 kJ/kg (based on n-decane Table C.2 of [25]) |
|
1.
Under less ideal circumstances, the auto-ignition temperature may be
substantially higher than 220oC. HSL have measured auto-ignition
temperatures of 690oC and 540oC for tests using sprays
of Jet A1 onto heated surfaces [24],
but Jet A1 has also been ignited when sprayed onto hot engines with probable
maximum temperatures of 420oC [24].
In many circumstances, surface temperatures much higher than 220oC
may therefore be required to ignite Jet A1. |
|
10.2.1.8 In terms of common comparisons, Jet A1 has similar flow properties to water, due to similar viscosity and density (however, Jet A1 is less dense than water), but has a considerably higher boiling point than water. Jet A1 is much more difficult to ignite than gasoline and a flame is predicted to spread less quickly across the surface of a Jet A1 pool if it is ignited.
10.2.2 Safety Distances and Ignition Source Control
10.2.2.1 Jet A1, as stored at the PAFF, is a Class 2 product according to the Hong Kong Code of Practice for Oil Installations [5]. The code states that “it is unnecessary to space tanks for the storage of Class 2 petroleum products at a distance greater than required for constructional and operational convenience.” [5]. It also states that “tanks for the storage of Class 2 petroleum products should be spaced ... at a distance not less than 10 m from the outer boundary of the storage facility.” [5]. For storage of a Class 1 product (e.g. gasoline, but not Jet A1), the recommended distance between a tank and outer boundary of storage facility or any fixed source of ignition is 15 m [5].
10.2.2.2 The distance from the nearest tank wall to the PAFF boundary is 28.5 m (Figure 10.2) which considerably exceeds the recommended distance for both Class 2 and Class 1 products. The distance from the bund wall to the site fence (Figure 10.2) also exceeds these safety distances, so the PAFF design considerably exceeds the recommendations for spacing between the tank walls and the site boundary in the Hong Kong Code of Practice for Oil Installations [5].
10.2.2.3 Other international codes and standards also provide recommended minimum separation distances from a site boundary or other installations: 15m “between a tank outer boundary or installation...” [26]; half the tank diameter (21.75 m) to the “property line that is or can be built upon including the opposite side of a public way” [27]; one sixth of the tank diameter (7.25 m) from the “nearest side of any public way or from the nearest important building on the same property” [27]. Although some of these separation distances also apply to more hazardous Class 1 products, the PAFF exceeds all these recommendations for separation between the tank wall and the site boundary.
10.2.2.4 For practical purposes, ignition sources are normally controlled based on an area classification system; for example, the Institute of Petroleum Model Code of Safe Practice (MCSP [28] Section 1.6.3) defines a hazardous area as “... a three-dimensional space in which a flammable atmosphere may be expected to be present at such frequencies as to require special precautions for the control of potential ignition sources including fixed electrical equipment.” The Jet A1 stored at the PAFF would be classified as a Class II(1) petroleum liquid in the MCSP (Class 2 in the Hong Kong Code of Practice for Oil Installations [5]), for which Section 3.2 of the MCSP [28] states “liquids that are stored under Class II(1) or III(1) conditions will not normally entail a surrounding external hazard zone requirement”. For more volatile liquids (not Jet A1) the hazardous area would usually be considered to extend to the bund wall (e.g. Figure 3.1a [28] or Figure 3‑8.19 of NFPA 497 [29]). Whilst area classification was originally developed for selection and location of fixed electrical equipment, the MCSP Part 15 [28] also provides guidance on its use to aid the location and control of other sources of ignition (e.g. fired heaters, flares, vehicles). The hazardous areas associated with the PAFF, are contained well within the PAFF boundary fence.
10.2.3 Potential Hazardous Scenarios
10.2.3.1 The hazardous scenarios considered in this report are associated with the receiving, storage and export of Jet A1, for the facilities identified within the scope of the project in the Study Brief (Section 3.2 and sections 1.3 to 1.5 of [7]), that is:
· the jetties,
· the fuel tankage,
· pumps and associated facilities and,
· pipelines to transfer the fuel to the airport.
10.2.3.2 The tankers used to transport aviation fuel to the PAFF and the transport route to the PAFF do not fall within the scope of the project identified in the Study Brief [7], for which an EIA is required.
10.2.3.3 However, the risks associated with marine transport of Jet A1 to the PAFF have been assessed elsewhere, to address the administrative constraints imposed on the transport of aviation fuel through the Ma Wan Channel, rather than to meet a statutory requirement [30]. A Marine Traffic Impact Assessment (MTIA) has also been carried out separately to demonstrate that tankers can safely operate at the PAFF jetties, ensure PAFF operations are not impacted by marine traffic within adjacent waterways and identify that the PAFF operations do not unduly impact local marine activity [31].
10.2.3.4 Hazardous scenarios associated with the marine transport of aviation fuel due to manoeuvring of the tankers close to the jetties, and berthing at the jetties, have been identified and are assessed. The identified scenarios due to marine transport are therefore restricted to within ~500m of the PAFF jetty, consistent with the previous EIA (Para 10.4.4.1 of [1])) and also with typical manoeuvring distances out from the jetty identified in the recent MTIA [31]. Beyond this manoeuvring distance, the operation of the PAFF will reduce the risk due to transport of aviation fuel in the region, as noted in Section 10.3.1.
10.2.3.5 A hazardous scenario can have many different causes that all lead to the same basic initial hazardous event (e.g. a bund fire). The initial hazardous scenario may then have a number of different consequences, depending on the specific location of the hazardous scenario, the time it occurs, etc. The facilities have been reviewed to identify the potential hazardous scenarios, based on historical experience (principally the MHIDAS database [32]) and relevant industry guidelines (UK Safety Report Assessment Guidelines (SRAG) for highly flammable liquids [33] and Dutch “Purple Book” [34]).
10.2.3.6 Additional sources of information have been consulted to ensure that all hazardous scenarios in the history of projects of the same genus as the PAFF are covered by the identified scenarios, including: the initial report of the Buncefield investigation [35]; relevant EPA alerts ([51], [61]); marine tanker incident statistics [41]; marine transport risk assessment studies for aviation fuel in Hong Kong waters ([38][30][37]); a study of marine incidents in ports and harbours [60]; a database of offshore pipeline incidents [56]; previous studies undertaken by ESR.
10.2.3.7 The following additional documents have also been specifically reviewed to ensure that a complete set of relevant hazardous scenarios previously identified in relation to the PAFF have been included:
· The previously submitted EIA Hazard to Life Assessment [1].
· The independent review of the above by HSL [9].
· The independent review of the exposure of Shiu Wing Steel Mill from possible fire and explosion incidents at the PAFF by Macinnis Engineering Associates Ltd [8].
10.2.3.8 The following potential hazardous scenarios have been identified:
Table 10.2: Potential Hazardous Scenarios for the PAFF
|
ID |
Scenario |
|
|
|
Marine Transport (Within ~500m of
the Jetty) |
|
|
M1 |
Fire due to rupture/leak of Jet A1 from loaded vessel |
|
|
M2 |
Vessel collision involving tanker with subsequent fire and sinking |
|
|
M3 |
Cargo explosion on tanker |
|
|
|
Jetty Transfer |
|
|
J1 |
Fire due to rupture/leak of Jet A1 from loaded vessel |
|
|
J2 |
Fire due to rupture/leak of loading arm during unloading |
|
|
J3 |
Fire due to rupture/leak of jetty equipment |
|
|
J4 |
Fire due to rupture/leak of jetty riser |
|
|
J5 |
Fire due to rupture/leak of submarine pipeline from jetty to Tank Farm ESDV |
|
|
|
Tank Farm Storage |
|
|
T1 |
Fire due to discharge from tank vent |
|
|
T2 |
Tank head fire / explosion in tank head space |
|
|
T3 |
Multiple tank head fires |
|
|
T4 |
Tank failure due to overpressure |
|
|
T5 |
Explosion in empty tank (under maintenance) |
|
|
T6 |
Bund fire |
|
|
T7 |
Fire outside bund due to rupture/leak of pumps, pipework and fittings |
|
|
T8 |
Fire on sea due to release through drainage |
|
|
T9 |
Fire due to instantaneous tank wall failure, subdivided as follows: |
|
|
|
T9As |
Instantaneous release from bottom seam failure with tank 90-100% full |
|
|
T9Bs |
Instantaneous release from bottom seam failure with tank 60-90% full |
|
|
T9Cs |
Instantaneous release from bottom seam failure with tank 35-60% full |
|
|
T9Ds |
Instantaneous release from bottom seam failure with tank <35% full |
|
|
T9Az |
Instantaneous release from tank unzipping with tank 90-100% full |
|
|
T9Bz |
Instantaneous release from tank unzipping with tank 60-90% full |
|
|
T9Cz |
Instantaneous release from tank unzipping with tank 35-60% full |
|
|
T9Dz |
Instantaneous release from tank unzipping with tank <35% full |
|
|
T9Aa |
Instantaneous release due to aircraft impact with tank 90-100% full |
|
|
T9Ba |
Instantaneous release due to aircraft impact with tank 60-90% full |
|
|
T9Ca |
Instantaneous release due to aircraft impact with tank 35-60% full |
|
|
T9Da |
Instantaneous release due to aircraft impact with tank <35% full |
|
T10 |
Fire due to multiple tank failure |
|
|
T11 |
Boilover |
|
|
T12 |
Fire due to release from top of tank due to overfilling |
|
|
T13 |
Vapour cloud explosion / flash fire |
|
|
T14 |
Fire due to 10% instantaneous release from the top of a tank |
|
|
|
Pipeline Transfer |
|
|
P1 |
Fire on sea due to release/leak from submarine pipeline |
|
10.2.3.9 It should be noted that the SRAG is specifically for highly flammable liquids [33] (no equivalent SRAG exists for flammable liquids such as Jet A1 which are generally less hazardous than highly flammable liquids) and contains some types of event (BLEVEs and Jet fires) which are not applicable to atmospheric pressure storage and are therefore not identified scenarios for the PAFF.
10.2.3.10 A number of the potential hazardous scenarios identified,
particularly boilover, vapour cloud explosions and flash fires and
instantaneous release from a tank, have occurred for storage of oil at
atmospheric pressure and temperature, but may not be applicable to the storage
of Jet A1 at the PAFF due to the properties of Jet A1 and the climate of
10.2.3.11 The scenarios have been selected based on events that have the potential for significantly different consequences. For example, a vapour cloud explosion would produce an overpressure hazard, a bund fire will produce a thermal radiation hazard, a boilover would produce a hazard due to ejection of burning liquid from the top of a tank on fire and an instantaneous release from a tank may produce momentum overtopping of the bund wall resulting in a potentially wider hazard area than a bund fire.
10.2.3.12 Some scenarios have many causes; e.g. a bund fire could result from a large variety of different initial releases, and a fire on the sea due to a release through the drainage may result from initial releases in many different areas of the site. Some scenarios, e.g. boilover, have very specific causes. Each scenario however has a potentially different outcome.
10.2.3.13 Some scenarios have been identified because they have the potential to produce different hazards in general (e.g. fire due to release from the top of a tank due to overfilling) but simply contribute to the other scenarios in the case of the PAFF. It could be argued that these would be best included with the scenarios they contribute to for the PAFF, but they are separated here for clarity.
10.2.3.14 The potential causes, and consequences of each of these potential hazardous scenarios are discussed and the scenario frequency and potential numbers of fatalities are quantified in Sections 10.3 to 10.6.
10.2.3.15 Any workplace may also give rise to occupational hazards such as slips, trips and falls for the workers at the plant. These hazards are not generally quantified in a hazard to life assessment such as this. However, the fatal accident rate per year is typically around 5 per 100,000 workers for the extractive and utility supply industries [36]; i.e. an occupational accident individual risk level of ~5 × 10‑5 /year. This is an on-site individual risk level, not covered by the risk criteria in the Technical Memorandum [20] and is not included further in the assessment.
10.2.4.1 As noted in Section 10.2.1, Jet A1 is stored below its flash point at the PAFF and is more difficult to ignite than lower flash point materials. The distribution of ignition sources surrounding the PAFF and the probability of ignition for Jet A1 in different areas is specifically addressed in Appendix H5. This concentrates on potentially large releases spreading outside the PAFF.
10.2.5.1 The surface emissive power of Jet A1 pool fires is low and the distance to potential lethality is well approximated by the edge of the flame (see Appendix H6).
10.2.5.2 For a pool fire with a fixed pool edge (e.g. a bund fire) the hazard range is taken as the edge of the flame envelope predicted due to flame drag in a range of different wind conditions from 0 m/s to 10 m/s. The drag distance, which varies with pool size and wind speed, is added to the bund edge. This only affects areas downwind of the fire and the hazard radius in upwind and cross-wind directions are taken as equal to the pool radius. The hazard range is taken to correspond to 100% fatality.
10.2.5.3 For an unrestricted pool (e.g. on the sea or having overtopped the bunds), the hazard range is taken as the edge of the predicted pool and is taken to correspond to 100% fatality. This is consistent with previous environmental impact assessments with similar issues for the Hong Kong Administrative region in which “the effect distance was considered to be approximately the same as the pool radius” [37]. The uncertainty in accurately identifying the burning pool edge for these fires means there is no advantage in providing any more complex modelling. There is also a clear opportunity for escape prior to the fire fully developing for an unconfined pool which will be clearly visible to anyone adjacent to it (see Appendix H6).
10.2.5.4 In the previous EIA submission for the PAFF [1] a hazard range of 3m beyond the pool radius was adopted. This analysis has been improved upon for fixed edge pools by allowing for the flame drag effects directly and has been simplified for unconfined pools to reflect the uncertainty in identifying the edge of the burning pool and for consistency with previous assessments ([37], [38]). The simplification for unconfined pools makes no significant change to the results of the assessment, whilst the inclusion of flame drag for confined pools allows more reasonably for potential effects downwind beyond the edge of the pool.
10.2.5.5 Further discussion on the effects of potential Jet A1 pool fires at the PAFF is provided in Appendix H6.
10.2.6.1 The combustion products of aviation fuel include carbon dioxide, nitrogen oxides and sulphur oxides. Incomplete combustion will generate thick black smoke and potentially hazardous gases including carbon monoxide. In the case of fire involving heavier hydrocarbons such as Jet A1 and for large diameter tank/bund fires, smoke production is high. However smoke from such fires is buoyant and does not tend to seriously impact people on the ground in the open air; this was the case in the recent Buncefield tank farm fire for example [35].
10.2.6.2 The occupants of any high-rise buildings in the vicinity of the tank farm could be exposed to potentially toxic smoke effects following a tank or bund fire at the tank farm. The occupants could be incapacitated due to the combined effects of CO2 (causing hyperventilation) and CO (toxic narcosis). The composition of smoke plume of heavy hydrocarbons is estimated as about 11.8% CO2 and 800ppm of CO [1]. At 800 ppm, the time required for incapacitation is about 48 seconds and at 300ppm, the time required is 20 minutes [1]. These times are estimated for persons caught within the smoke plume. For persons away from the fire, the effects will be limited due to the smoke plume rise. However, there are no high rise buildings in the vicinity of the PAFF so the frequency and impact of fatalities from this hazard is assessed as zero.
10.2.6.3 It is assumed that any future buildings immediately opposite the site boundary will not be high rise to avoid the impact of any smoke ingress into buildings. The on-site and off-site evacuation plans should consider the potential for smoke drift from a large fire at the PAFF.
10.2.6.4 The impact of smoke plumes at elevated locations is considered in Section H6.8. Tank head fires only have effects at high elevations because the fire base is well above ground level. Based on the potential frequencies of smoke impact, the smoke plume envelope from a bund fire at the PAFF in a 5 m/s wind is suggested for planning purposes to limit the height of buildings near to the PAFF and maintain risk levels for up to 10 fatalities within the acceptable envelope of the Technical Memorandum criteria [20]. This gives the following building height restrictions:
Table 10.3: Proposed Building Height Restrictions Adjacent to the PAFF
|
Distance
of Building from closest PAFF Boundary (m) |
Proposed
Maximum Height (H) of Building (where
workers may be at elevated levels) (m) |
|
0 |
0 |
|
5 |
6 |
|
10 |
13 |
|
20 |
26 |
|
30 |
39 |
|
40 |
52 |
|
50 |
66 |
10.2.6.5 In each case, the identified heights are greater than those identified in the EcoPark EIA [10] and the prevailing wind direction is not over this area. Should high occupancy buildings, or building heights in excess of these proposed limits be desired then it would be appropriate to consider the risk levels in more detail. For buildings which are specifically designed against smoke ingress (for example by effective sealing and automatically actuated fire dampers in the air intakes) escape at ground level would be expected to be practical, even in the event of such a smoke impact. However, this would need to be assessed on an individual basis for any proposed buildings.
10.2.7.1 Jet A1 at the PAFF will be stored below its flash point and will not give off a flammable vapour unless heated. Ignition of dispersing vapour is therefore not considered as a hazard from the storage of Jet A1 at the PAFF, except in specific circumstances where it may heated above its flash point (see Section H5.3.2).
10.2.7.2 The peak concentration of Jet A1 vapour identified outside the PAFF (in the EcoPark) during normal operations is 0.34 odour units (1 odour unit 5.4 mg/m3) – see Air Quality assessment in this EIA (Section 4.6). This corresponds to a molar vapour concentration of 0.34 × 5.4×10‑6 kg/m3 × 29/156 / 1.2 kg/m3 = 3 × 10‑7 (the last three factors are the molecular weight of air and Jet A1 and the density of air). This is less than 1 ppm, which is a factor of 10,000 below the lower flammability limit.
10.2.7.3 There is therefore no possibility of flammable Jet A1 vapour flowing into neighbouring properties during normal operations at the PAFF.
10.3 Risks due to Marine Transport (Within ~500m of the Jetty)
10.3.1.1 This section presents the quantitative risk assessment carried out
for the identified hazardous scenarios associated with Marine Transport at the
PAFF. As noted in Section 10.2.3,
the tankers used to transport aviation fuel to the PAFF and the transport route
to the PAFF do not fall within the scope of this assessment. The identified
scenarios are therefore restricted to the region related directly to the jetty
operations only (within ~500m of the PAFF jetty, consistent with the previous EIA (
10.3.1.2 Beyond this manoeuvring distance, the operation of the PAFF will reduce the level of marine transport collision risk in the region because ~1100 single hulled barges to Sha Chau per year will be replaced by 150-200 double hulled tankers travelling a shorter route to the PAFF (see 10.1.2.14).
10.3.1.3 The risks associated with marine transport of Jet A1 to the PAFF have also been assessed elsewhere and a range of risk reduction measures already identified [30], including:
·
The operation of the now
established Vessel Traffic System (VTS) by the Vessel Traffic Centre (VTC) of
the Marine Department to control vessel movements within
· Use of double hulled in place of single hulled tankers.
· Stopping double handling of fuel with unloading at Tsing Yi.
10.3.1.4 It was concluded [30] that “Since all practical and cost effective risk mitigation measures have been implemented the level of risk identified is considered ALARP and therefore is acceptable”.
10.3.1.5 A separate Marine Traffic Impact Assessment (MTIA) has been carried
out for the PAFF jetties and tankers [31].
This included a comprehensive ship navigation simulation study for the PAFF
tanker operations and navigation at the adjacent Shiu Wing jetty which showed
that the tankers could safely operate at the PAFF jetty in the prevailing
conditions and that arrivals/departures at Shiu Wing would not be adversely
affected by the PAFF jetty under normal operations. The study concluded that “The PAFF may be constructed, commissioned
and operated with no adverse impact on the marine safety environment within
HKSAR western waters. Indeed, cessation of the operation at Sha Chau will
reduce the frequency of movement of aviation fuel tankers in
10.3.1.6 The relevant hazardous scenarios considered within ~500 m of the jetty are:
· Fire due to rupture/leak of Jet A1 from loaded tanker (M1)
· Vessel collision involving tanker with subsequent fire and sinking (M2)
· Cargo explosion on tanker (M3)
10.3.1.7 The likelihood and consequences of each of these scenarios is assessed below, based on an average population density of 0.15 /ha (Section H8.2) in the Urmston Road Channel post 2011 [38] and excluding the occupants of the tanker itself.
10.3.2 Summary of release size distributions and spill probabilities
10.3.2.1 The table below summarises the release size distributions assumed for releases from sub sea pipelines (see Section 10.7), aviation fuel tankers, and the new jetty (Section 10.4).
Table 10.4: Release Size Distributions From Pipelines, Tankers and Jetty
|
Hazard Source |
Cause |
Size of Leak |
Size Probability |
|
Pipeline Transfer |
All Causes |
Small (20mm) |
0.57 |
|
|
|
Medium (50mm) |
0.15 |
|
|
|
Rupture (500mm) |
0.28 |
|
Marine Transport |
Collisions |
Small (0.3% of dwt) |
0.2 |
|
|
|
Medium (1% of dwt) |
0.2 |
|
|
|
Rupture (7% of dwt) |
0.58 |
|
|
|
Multiple Rupture (100%
dwt) |
0.02 |
|
|
Grounding |
Small (0.3% of dwt) |
0.2 |
|
|
|
Medium (1% of dwt) |
0.2 |
|
|
|
Rupture (7% of dwt) |
0.58 |
|
|
|
Multiple Rupture (100%
dwt) |
0.02 |
|
|
Fire/Explosion |
N/A |
N/A |
|
Jetty Transfer |
Impact |
Small (0.3% of dwt) |
0.2 |
|
|
|
Medium (1% of dwt) |
0.2 |
|
|
|
Rupture (7% of dwt) |
0.58 |
|
|
|
Multiple Rupture (100%
dwt) |
0.02 |
|
|
Strikings |
Small (0.3% of dwt) |
0.2 |
|
|
|
Medium (1% of dwt) |
0.2 |
|
|
|
Rupture (7% of dwt) |
0.58 |
|
|
|
Multiple Rupture (100%
dwt) |
0.02 |
|
|
Loading Arm |
Rupture |
1.0 |
|
Submarine Pipeline |
|
Small (20mm) |
0.57 |
|
|
|
Medium (50mm) |
0.15 |
|
|
|
Rupture (500mm) |
0.28 |
Table 10.5: Release Probabilities for Marine Incidents
|
Cause |
Double
|
|
|
|
<
20,000 dwt |
>
20,000 dwt |
|
Collisions |
0.015 |
0.0075 |
|
Striking |
0.015 |
0.0075 |
|
Grounding |
0.03 |
0.015 |
|
Impact |
0.015 |
0.0075 |
10.3.3 Fire due to rupture/leak of Jet A1 from loaded vessel (M1)
10.3.3.1 Scenario M1 relates to large spills of Jet A1 within ~500m of the new jetty due to ruptures or leaks of loaded tanker, which ignite on the sea surface and spread to boats and other marine traffic in the vicinity. Ruptures/leaks of Jet A1 from loaded tankers whilst underway may be caused by either collisions or groundings.
10.3.3.2 Collision is defined as a contact between the tanker and another vessel underway, drifting, on tow or otherwise untethered. This event is largely related to the level of marine traffic in the channel.
10.3.3.3 Grounding is defined as a tanker coming into unintended contact with a seabed or shore.
10.3.3.4 The frequency of collisions will depend upon the number of ship visits and encounters.
10.3.3.5 The collision frequency is estimated as 3.5 × 10⁻⁵ per encounter [38]. The encounter frequency is given as 0.69 per km. This is used for the initial and final development phases of the PAFF. The interaction distance is 0.5 km as only marine transport within 0.5 km of the jetty is considered for this scenario. Therefore the collision frequency is given as 3.5 × 10-5 × 0.69 × 0.5 = 1.2 × 10⁻⁵ per visit. The frequencies of collisions have been allocated based on visits of different tanker sizes. These values are presented in the tables for the years 2016 and 2040 respectively.
Table 10.6: Collision Frequency for Initial Development
|
Tanker Size (dwt) |
Base Frequency per visit |
No of visits/year |
Frequency per year |
|
20,000 |
1.2 × 10⁻⁵ |
60 |
7.20 × 10⁻⁴ |
|
45,000 |
1.2 × 10⁻⁵ |
64 |
7.68 × 10⁻⁴ |
|
60,000 |
1.2 × 10⁻⁵ |
32 |
3.84 × 10⁻⁴ |
Table 10.7: Collision Frequency for Final Development
|
Tanker Size (dwt) |
Base Frequency per visit |
No of visits/year |
Frequency per year |
|
30,000 |
1.2 × 10⁻⁵ |
70 |
8.40 × 10⁻⁴ |
|
45,000 |
1.2 × 10⁻⁵ |
80 |
9.60 × 10⁻⁴ |
|
80,000 |
1.2 × 10⁻⁵ |
38 |
4.56 × 10⁻⁴ |
10.3.3.6 The frequency of grounding is influenced by the following factors:
· distance travelled by the tanker in restricted water;
· the draft of the vessel in relation to the available depth of water;
· competency and experience of ships’ masters and human error;
· availability of pilotage service and tug assistance;
· width of navigable water;
· nature of shoreline and seabed (whether smooth or complex);
· weather conditions including sea, tide, wind and likelihood of poor visibility;
· reliability of machinery on the ships;
· density of marine traffic in the area; and
· availability of VTS to provide guidance, etc.
10.3.3.7 The typical draft of the fully laden tankers visiting the PAFF is 11.5 m for the 40,000 dwt tankers and 13.5m for the 80,000 dwt tankers [31]. Soundings in the vicinity of the PAFF jetty are approximately 18.4m below chart datum [31].
10.3.3.8 The frequency of grounding is expressed on a per km basis. The value adopted is 4.3 × 10⁻⁶ per km travelled [38].
10.3.3.9 The distance travelled by tankers within the vicinity of the jetty is 0.5km. Therefore the frequency of grounding per year is calculated to be 4.3 × 10-6 × 0.5 × 156 = 3.4 × 10‑4 per year (initial development). For the final development, the frequency of grounding per year is 4.04 × 10‑4 per year.
10.3.3.10 The allocation of the total grounding frequency for different tanker sizes is based on the number of visits. This is presented in the tables below.
Table 10.8: Grounding Frequency for Different Size Tankers (Initial Development)
|
Tanker
Size (dwt) |
Base
Frequency (per km) |
Interaction
Distance (km) |
No
of visits/year |
Frequency
per year |
|
20,000 |
4.3 × 10⁻⁶ |
0.5 |
60 |
1.29 × 10⁻⁴ |
|
45,000 |
4.3 × 10⁻⁶ |
0.5 |
64 |
1.38 × 10⁻⁴ |
|
60,000 |
4.3 × 10⁻⁶ |
0.5 |
32 |
6.88 × 10⁻⁵ |
Table 10.9: Grounding Frequency for Different Size Tankers (Final Development)
|
Tanker
Size (dwt) |
Base
Frequency (per km) |
Interaction
Distance (km) |
No
of visits/year |
Frequency
per year |
|
30,000 |
4.3 × 10⁻⁶ |
0.5 |
70 |
1.51 × 10⁻⁴ |
|
45,000 |
4.3 × 10⁻⁶ |
0.5 |
80 |
1.72 × 10⁻⁴ |
|
80,000 |
4.3 × 10⁻⁶ |
0.5 |
38 |
8.17 × 10⁻⁵ |
10.3.3.11 Not all grounding or collision incidents will result in a pool fire. In order for Scenario M1 to be realised, the incident must be followed by a spill, which may vary in size, and then by ignition. The probabilities assumed for this study are summarised below.
Table 10.10: Frequency of Scenario M1 (Initial Development)
|
Cause |
Vessel Size (dwt) |
Frequency, /yr |
Spill Prob. |
Leak Size |
Size Prob. |
Ignition Prob. |
Outcome Frequency, /yr |
|
Grounding |
20000 |
1.29×10⁻⁴ |
0.03 |
Small |
0.2 |
0.001 |
7.74×10⁻¹⁰ |
|
Grounding |
20000 |
1.29×10⁻⁴ |
0.03 |
Large |
0.2 |
0.003 |
2.32×10⁻⁹ |
|
Grounding |
20000 |
1.29×10⁻⁴ |
0.03 |
Rupture |
0.58 |
0.008 |
1.80×10⁻⁸ |
|
Grounding |
20000 |
1.29×10⁻⁴ |
0.03 |
Multiple
Rupture |
0.02 |
0.008 |
6.19×10⁻¹⁰ |
|
Grounding |
45000 |
1.38×10⁻⁴ |
0.015 |
Small |
0.2 |
0.001 |
4.14×10⁻¹⁰ |
|
Grounding |
45000 |
1.38×10⁻⁴ |
0.015 |
Large |
0.2 |
0.003 |
1.24×10⁻⁹ |
|
Grounding |
45000 |
1.38×10⁻⁴ |
0.015 |
Rupture |
0.58 |
0.008 |
9.60×10⁻⁹ |
|
Grounding |
45000 |
1.38×10⁻⁴ |
0.015 |
Multiple
Rupture |
0.02 |
0.008 |
3.31×10⁻¹⁰ |
|
Grounding |
60000 |
6.88×10⁻⁵ |
0.015 |
Small |
0.2 |
0.001 |
2.06×10⁻¹⁰ |
|
Grounding |
60000 |
6.88×10⁻⁵ |
0.015 |
Large |
0.2 |
0.003 |
6.19×10⁻¹⁰ |
|
Grounding |
60000 |
6.88×10⁻⁵ |
0.015 |
Rupture |
0.58 |
0.008 |
4.79×10⁻⁹ |
|
Grounding |
60000 |
6.88×10⁻⁵ |
0.015 |
Multiple
Rupture |
0.02 |
0.008 |
1.65×10⁻¹⁰ |
|
Collision |
20000 |
7.20×10⁻⁴ |
0.015 |
Small |
0.2 |
0.001 |
2.16×10⁻⁹ |
|
Collision |
20000 |
7.20×10⁻⁴ |
0.015 |
Large |
0.2 |
0.003 |
6.48×10⁻⁹ |
|
Collision |
20000 |
7.20×10⁻⁴ |
0.015 |
Rupture |
0.58 |
0.008 |
5.01×10⁻⁸ |
|
Collision |
20000 |
7.20×10⁻⁴ |
0.015 |
Multiple
Rupture |
0.02 |
0.008 |
1.73×10⁻⁹ |
|
Collision |
45000 |
7.68×10⁻⁴ |
0.0075 |
Small |
0.2 |
0.001 |
1.15×10⁻⁹ |
|
Collision |
45000 |
7.68×10⁻⁴ |
0.0075 |
Large |
0.2 |
0.003 |
3.46×10⁻⁹ |
|
Collision |
45000 |
7.68×10⁻⁴ |
0.0075 |
Rupture |
0.58 |
0.008 |
2.67×10⁻⁸ |
|
Collision |
45000 |
7.68×10⁻⁴ |
0.0075 |
Multiple
Rupture |
0.02 |
0.008 |
9.22×10⁻¹⁰ |
|
Collision |
60000 |
3.84×10⁻⁴ |
0.0075 |
Small |
0.2 |
0.001 |
5.76×10⁻¹⁰ |
|
Collision |
60000 |
3.84×10⁻⁴ |
0.0075 |
Large |
0.2 |
0.003 |
1.73×10⁻⁹ |
|
Collision |
60000 |
3.84×10⁻⁴ |
0.0075 |
Rupture |
0.58 |
0.008 |
1.34×10⁻⁸ |
|
Collision |
60000 |
3.84×10⁻⁴ |
0.0075 |
Multiple
Rupture |
0.02 |
0.008 |
4.61×10⁻¹⁰ |
Table 10.11: Frequency of Scenario M1 (Final Development)
|
Cause |
Vessel Size
(dwt) |
Frequency, /yr |
Spill Prob. |
Leak Size |
Size Prob. |
Ignition Prob. |
Outcome
Frequency, /yr |
|
Grounding |
30000 |
1.51×10⁻⁴ |
0.015 |
Small |
0.2 |
0.001 |
4.53×10⁻¹⁰ |
|
Grounding |
30000 |
1.51×10⁻⁴ |
0.015 |
Large |
0.2 |
0.003 |
1.36×10⁻⁹ |
|
Grounding |
30000 |
1.51×10⁻⁴ |
0.015 |
Rupture |
0.58 |
0.008 |
1.05×10⁻⁸ |
|
Grounding |
30000 |
1.51×10⁻⁴ |
0.015 |
Multiple
Rupture |
0.02 |
0.008 |
3.62×10⁻¹⁰ |
|
Grounding |
45000 |
1.72×10⁻⁴ |
0.015 |
Small |
0.2 |
0.001 |
5.16×10⁻¹⁰ |
|
Grounding |
45000 |
1.72×10⁻⁴ |
0.015 |
Large |
0.2 |
0.003 |
1.55×10⁻⁹ |
|
Grounding |
45000 |
1.72×10⁻⁴ |
0.015 |
Rupture |
0.58 |
0.008 |
1.20×10⁻⁸ |
|
Grounding |
45000 |
1.72×10⁻⁴ |
0.015 |
Multiple
Rupture |
0.02 |
0.008 |
4.13×10⁻¹⁰ |
|
Grounding |
80000 |
8.17×10⁻⁵ |
0.015 |
Small |
0.2 |
0.001 |
2.45×10⁻¹⁰ |
|
Grounding |
80000 |
8.17×10⁻⁵ |
0.015 |
Large |
0.2 |
0.003 |
7.35×10⁻¹⁰ |
|
Grounding |
80000 |
8.17×10⁻⁵ |
0.015 |
Rupture |
0.58 |
0.008 |
5.69×10⁻⁹ |
|
Grounding |
80000 |
8.17×10⁻⁵ |
0.015 |
Multiple
Rupture |
0.02 |
0.008 |
1.96×10⁻¹⁰ |
|
Collision |
30000 |
8.40×10⁻⁴ |
0.0075 |
Small |
0.2 |
0.001 |
1.26×10⁻⁹ |
|
Collision |
30000 |
8.40×10⁻⁴ |
0.0075 |
Large |
0.2 |
0.003 |
3.78×10⁻⁹ |
|
Collision |
30000 |
8.40×10⁻⁴ |
0.0075 |
Rupture |
0.58 |
0.008 |
2.92×10⁻⁸ |
|
Collision |
30000 |
8.40×10⁻⁴ |
0.0075 |
Multiple
Rupture |
0.02 |
0.008 |
1.01×10⁻⁹ |
|
Collision |
45000 |
9.60×10⁻⁴ |
0.0075 |
Small |
0.2 |
0.001 |
1.44×10⁻⁹ |
|
Collision |
45000 |
9.60×10⁻⁴ |
0.0075 |
Large |
0.2 |
0.003 |
4.32×10⁻⁹ |
|
Collision |
45000 |
9.60×10⁻⁴ |
0.0075 |
Rupture |
0.58 |
0.008 |
3.34×10⁻⁸ |
|
Collision |
45000 |
9.60×10⁻⁴ |
0.0075 |
Multiple
Rupture |
0.02 |
0.008 |
1.15×10⁻⁹ |
|
Collision |
80000 |
4.56×10⁻⁴ |
0.0075 |
Small |
0.2 |
0.001 |
6.84×10⁻¹⁰ |
|
Collision |
80000 |
4.56×10⁻⁴ |
0.0075 |
Large |
0.2 |
0.003 |
2.05×10⁻⁹ |
|
Collision |
80000 |
4.56×10⁻⁴ |
0.0075 |
Rupture |
0.58 |
0.008 |
1.59×10⁻⁸ |
|
Collision |
80000 |
4.56×10⁻⁴ |
0.0075 |
Multiple
Rupture |
0.02 |
0.008 |
5.47×10⁻¹⁰ |
10.3.3.12 The consequence of a fire resulting from a rupture/leak of Jet A1 from a loaded vessel depends on the size of spill.
10.3.3.14 Each tanker has between 12 and 18 cargo tanks, positioned in pairs along the length of the vessel. This longitudinal division of the cargo space is known to almost halve the average amount of oil released in accidents [39], since the damage is almost always restricted to either the port or starboard cargo tanks. Transverse divisions of the cargo space also reduce the chances of the whole cargo being lost. In particular, the proportion of groundings inflicting bottom damage along the full length of the cargo space is of the order of 15%, according to probability density functions taken from IMO Guidelines [39]. Probability distribution functions [40] also indicate the low probability of damage extending the full length of a tanker. Based on collision data for single and double hulled tankers, the mean longitudinal extent of damage is only about 7% of the length between perpendiculars. However, not all of these incidents would be associated with actual spills, since the cargo tanks may not necessarily be penetrated.
10.3.3.15 The International Tanker Owners Pollution Federation Ltd (ITOPF) has published oil tanker spill statistics for the period 1970 to 2005 [41], which indicate a continuing reduction in the number of spills per year. In particular, the number of spills over 700 tonnes has fallen from an average of 17 per year between 1970 and 1989 to only 7 per year between 1990 and 2005.
10.3.3.16 This improvement in safety can be largely attributed to the fact that, in 1992, the MARPOL Convention was amended to make it mandatory for tankers of 5,000 dwt and above ordered after 6 July 1993 to be fitted with double hulls, or an alternative design approved by IMO. The requirement for double hulls that applies to new tankers has also been applied to existing ships under a programme that began in 1995. All tankers have to be converted (or taken out of service) when they reach a certain age (up to 30 years old). Following the Erika incident in 1999, the phasing out of old single hull tankers was accelerated. The final phasing-out date for Category 1 tankers (pre-MARPOL tankers) was 2005, and the final phasing-out date for category 2 and 3 tankers (MARPOL tankers and smaller tankers) has been brought forward to 2010, from 2015. By 2002, 50% of VLCC’s (³200,000 dwt) were already double hulled.
10.3.3.17 In addition, the International Safety Management (ISM) Code was adopted in 1994, and became mandatory for tankers in 1998. The ISM Code imposes strict safety management standards on shipping companies. Other recent regulations, such as the Condition Assessment Scheme (CAS) and mandatory ship reporting, have also contributed to the reduction in spills since the 1990s.
10.3.3.19 Spill size assessment is based mainly on the DNV 2000 Study [38]. The DNV study made the reasonable assumption that only one cargo tank was damaged at any one time, as is generally the case. In order to take into account the remote possibility of all of the tanks within the tanker being ruptured, the DNV study has been extended, using ITOPF data [41]. As a conservative estimate, it is assumed that 2% of spills involve multiple ruptures (100% release). The probability of single tank ruptures (7% release) has been reduced accordingly from 60% to 58%.
10.3.3.20 The resulting spill quantities modelled from the tankers supplying the PAFF are:
· Small Leak - 0.3% of dwt
· Large Leak - 1% of dwt
· Rupture (single tank) - 7% of dwt
· Multiple rupture (all tanks) - 100% of dwt
10.3.3.21 The extent of the fire hazard from a pool of Jet A1 on the sea is assessed based on the predicted area of a spill to a depth where ignition remains possible and stable flame could propagate. The details of the modelling, which varies for different spill sizes, is given in Appendix H2, Section H2.3. The treatment of a release due to multiple tank rupture and evaluation of the hazard area is described in sections H2.4 and H2.5.
10.3.3.22 The effects distances based on an equivalent radius of a circular pool are given below.
Table 10.12: Effect Distances for Sea Surface Pool Fires (M1 and J1)
|
Size
of Release |
Effect
Distance (m) |
Probability |
||||
|
20,000
dwt |
30,000
dwt |
45,000
dwt |
60,000
dwt |
80,000
dwt |
of
Death |
|
|
Small Leak |
17.3 |
21.2 |
26.0 |
30.0 |
34.7 |
1 |
|
Large Leak |
31.7 |
38.7 |
47.5 |
54.8 |
63.3 |
1 |
|
Rupture- 1 tank |
236 |
289 |
354 |
409 |
472 |
1 |
|
Rupture-
all tanks |
236 |
289 |
354 |
409 |
472 |
1 |
10.3.3.23 Fatalities are estimated based on the area of pool fire (pR2) and the averaged population density of 0.15 /ha (Section H8.2). Although the pool may disperse and people may escape before ignition, a fatality probability of one has been used for caution.
Table 10.13: Fatalities for Sea Surface Pool Fires (M1 and J1)
|
Size
of Release |
Estimated
Fatalities |
||||
|
20,000
dwt |
30,000
dwt |
45,000
dwt |
60,000
dwt |
80,000
dwt |
|
|
Small Leak |
0.01 |
0.02 |
0.03 |
0.04 |
0.06 |
|
Large Leak |
0.05 |
0.07 |
0.11 |
0.14 |
0.19 |
|
Rupture- 1 tank |
2.63 |
3.94 |
5.91 |
7.88 |
10.5 |
|
Rupture-
all tanks |
2.63 |
3.94 |
5.91 |
7.88 |
10.5 |
10.3.3.24 The identified risk levels are summarised below:
Table 10.14: Scenario M1 Risk Summary (Initial Development)
|
Cause |
Vessel
Size (dwt) |
Leak
Size |
Outcome
Frequency, /yr |
Fatalities |
|
Grounding |
20,000 |
Small |
7.74×10⁻¹⁰ |
0.01 |
|
Grounding |
20,000 |
Large |
2.32×10⁻⁹ |
0.05 |
|
Grounding |
20,000 |
Rupture |
1.80×10⁻⁸ |
2.63 |
|
Grounding |
20,000 |
Multiple Rupture |
6.19×10⁻¹⁰ |
2.63 |
|
Grounding |
45,000 |
Small |
4.14×10⁻¹⁰ |
0.03 |
|
Grounding |
45,000 |
Large |
1.24×10⁻⁹ |
0.11 |
|
Grounding |
45,000 |
Rupture |
9.60×10⁻⁹ |
5.91 |
|
Grounding |
45,000 |
Multiple Rupture |
3.31×10⁻¹⁰ |
5.91 |
|
Grounding |
60,000 |
Small |
2.06×10⁻¹⁰ |
0.04 |
|
Grounding |
60,000 |
Large |
6.19×10⁻¹⁰ |
0.14 |
|
Grounding |
60,000 |
Rupture |
4.79×10⁻⁹ |
7.88 |
|
Grounding |
60,000 |
Multiple Rupture |
1.65×10⁻¹⁰ |
7.88 |
|
Collision |
20,000 |
Small |
2.16×10⁻⁹ |
0.01 |
|
Collision |
20,000 |
Large |
6.48×10⁻⁹ |
0.05 |
|
Collision |
20,000 |
Rupture |
5.01×10⁻⁸ |
2.63 |
|
Collision |
20,000 |
Multiple Rupture |
1.73×10⁻⁹ |
2.63 |
|
Collision |
45,000 |
Small |
1.15×10⁻⁹ |
0.03 |
|
Collision |
45,000 |
Large |
3.46×10⁻⁹ |
0.11 |
|
Collision |
45,000 |
Rupture |
2.67×10⁻⁸ |
5.91 |
|
Collision |
45,000 |
Multiple Rupture |
9.22×10⁻¹⁰ |
5.91 |
|
Collision |
60,000 |
Small |
5.76×10⁻¹⁰ |
0.04 |
|
Collision |
60,000 |
Large |
1.73×10⁻⁹ |
0.14 |
|
Collision |
60,000 |
Rupture |
1.34×10⁻⁸ |
7.88 |
|
Collision |
60,000 |
Multiple Rupture |
4.61×10⁻¹⁰ |
7.88 |
Table 10.15: Scenario M1 Risk Summary (Final Development)
|
Cause |
Vessel
Size (dwt) |
Leak
Size |
Outcome
Frequency, /yr |
Fatalities |
|
Grounding |
30,000 |
Small |
4.53×10⁻¹⁰ |
0.02 |
|
Grounding |
30,000 |
Large |
1.36×10⁻⁹ |
0.07 |
|
Grounding |
30,000 |
Rupture |
1.05×10⁻⁸ |
3.94 |
|
Grounding |
30,000 |
Multiple Rupture |
3.62×10⁻¹⁰ |
3.94 |
|
Grounding |
45,000 |
Small |
5.16×10⁻¹⁰ |
0.03 |
|
Grounding |
45,000 |
Large |
1.55×10⁻⁹ |
0.11 |
|
Grounding |
45,000 |
Rupture |
1.20×10⁻⁸ |
5.91 |
|
Grounding |
45,000 |
Multiple Rupture |
4.13×10⁻¹⁰ |
5.91 |
|
Grounding |
80,000 |
Small |
2.45×10⁻¹⁰ |
0.06 |
|
Grounding |
80,000 |
Large |
7.35×10⁻¹⁰ |
0.19 |
|
Grounding |
80,000 |
Rupture |
5.69×10⁻⁹ |
10.50 |
|
Grounding |
80,000 |
Multiple Rupture |
1.96×10⁻¹⁰ |
10.50 |
|
Collision |
30,000 |
Small |
1.26×10⁻⁹ |
0.02 |
|
Collision |
30,000 |
Large |
3.78×10⁻⁹ |
0.07 |
|
Collision |
30,000 |
Rupture |
2.92×10⁻⁸ |
3.94 |
|
Collision |
30,000 |
Multiple Rupture |
1.01×10⁻⁹ |
3.94 |
|
Collision |
45,000 |
Small |
1.44×10⁻⁹ |
0.03 |
|
Collision |
45,000 |
Large |
4.32×10⁻⁹ |
0.11 |
|
Collision |
45,000 |
Rupture |
3.34×10⁻⁸ |
5.91 |
|
Collision |
45,000 |
Multiple Rupture |
1.15×10⁻⁹ |
5.91 |
|
Collision |
80,000 |
Small |
6.84×10⁻¹⁰ |
0.06 |
|
Collision |
80,000 |
Large |
2.05×10⁻⁹ |
0.19 |
|
Collision |
80,000 |
Rupture |
1.59×10⁻⁸ |
10.5 |
|
Collision |
80,000 |
Multiple Rupture |
5.47×10⁻¹⁰ |
10.5 |
10.3.4 Vessel collision involving tanker with subsequent fire and sinking (M2)
10.3.4.1 Scenario M2 is included to take account of collision between a tanker and another vessel involving a release of Jet A1, a fire and subsequent sinking of the vessel. Although collision is considered as part of Scenario M1, the consequences are based on the average population density and do not adequately account for the larger numbers of fatalities that could occur in the case where the other vessel involved in the collision also carries a large crew or passenger load. Although unlikely, it is possible that the fire could completely engulf the vessel, also setting the vessel itself on fire, and lead to the loss of all passengers and crew in the worst case.
10.3.4.2 The impact on a large vessel from a spill at a distance (i.e. one not involved in the collision) would be expected to be much less significant, with the vessel providing protection for the passengers from a transient fire (the identified 10mm thickness of Jet A1 would take only 2.5 minutes to burn off at the nominal burning rate of 4mm/min) and also allow time for escape by the vessel. Only the case where there is a direct collision between a PAFF tanker and a vessel carrying many passengers and crew is therefore relevant to this scenario.
10.3.4.3 The frequency of a collision followed by a large fire is assessed based on the total for all collisions identified in Scenario M1: 1.09 × 10‑7 /yr for the initial development and 0.95 × 10‑7 /yr for the final development. The reduction in frequency, despite the larger numbers of vessels for the final development, is due to the use of larger vessels that are less likely to cause a release following a collision (see 10.3.2.2).
10.3.4.4 The average numbers of fatalities due to these incidents in Scenario M1 is 3.75 for the initial development and 5.24 for the final development, so this scenario is only concerned with cases that could significantly increase these numbers of fatalities.
10.3.4.5 The largest number of passengers on a vessel that the PAFF tankers
would be likely to encounter within ~500 m of the jetty would be on a
fast ferry that operates about 40 times per day in both directions across the
Urmston Channel between Tuen Mun Ferry Pier and Tung Chung on Lantau Island.
This ferry route should pass more than ~500 m from the jetty, but operates
close by, and the passenger numbers are amongst the highest for the ferries in
nearby areas [31].
This ferry carries a maximum load of approximately 235 passengers plus crew.
The only other vessels with large populations that could be present in the
vicinity, would be regular high-speed passenger craft services between the
Mainland and
10.3.4.6 Based on data in the MTIA (Table 4.3 of [31]), the fast ferries represent ~3% of the local traffic, whilst most other vessels are likely to be have between 5 and 15 crew and passengers.
10.3.4.7 To obtain a representative distribution of event outcomes it is assumed, based on judgement from the above information, that:
· 75% of collision incidents are completely covered by the estimates for Scenario M1.
· 1.5% of incidents will involve the whole population on a fast ferry or high-speed passenger craft. In 80% of these cases (1.2% of the total) this is assumed to involve 235 people on a fast ferry and in 20% of these cases (0.3% of the total) this is assumed to involve 400 people on a high-speed passenger craft. A 100% fatality probability is taken for caution although this may be very pessimistic.
· 1.5% of incidents will involve 100 passengers and crew on a fast ferry or high-speed passenger craft.
· 2% of incidents will involve 30 passengers and crew on a vessel.
· The remaining 20% of incidents will involve a vessel carrying 10 people.
10.3.4.8 The distribution function for the number of fatalities due to this incident is given below.
Table 10.16: Frequency Distribution of Scenario M2
|
Number of |
Frequency, /yr |
|
|
Fatalities |
Initial Development |
Final Development |
|
10 |
2.19×10⁻⁸ |
1.90×10⁻⁸ |
|
30 |
2.19×10⁻⁹ |
1.90×10⁻⁹ |
|
100 |
1.64×10⁻⁹ |
1.42×10⁻⁹ |
|
235 |
1.31×10⁻⁹ |
1.14×10⁻⁹ |
|
400 |
3.27×10‑10 |
2.84×10‑10 |
10.3.4.9 It may be noted that the distance from Tsing Yi to the new jetty at Tuen Mun is actually about 2 km shorter than the existing journey from Tsing Yi to the AFRF at Sha Chau, and the numbers of vessels will also reduce, so the overall risk from this type of incident is expected to be reduced by the provision of the new jetty at Tuen Mun, as noted in Paragraph 10.1.2.14.
10.3.5 Cargo explosion on tanker (M3)
10.3.5.1 Scenario M3 relates to explosions of ship tanks containing fuel vapour, causing blast and debris damage. Fires resulting from grounding or impact are covered under Scenario M1. Explosion onboard a tanker may occur as a result of the combustion of a mixture of air and hydrocarbon inside a nominally empty tank, including both cargo and fuel tanks. Jet A1 is transported below its flash point and so flammable vapour is unlikely to be present in the ships’ cargo tanks.
10.3.5.2 Explosion/fire frequencies in the channel within ~500m from the jetty depend mainly on the following factors:
· time spent by the ship in harbour;
· cargo carried;
· operations permitted (such as tank cleaning);
· standard of operational safety on ship;
· design of tanks and equipment on ships; and
· probability of lightning storms (for ignition).
10.3.5.3 The frequency of explosion due to fire on board has been taken as 1.2 × 10⁻⁸ per km. This value is consistent with that adopted in the DNV 2000 report [38]. The distance considered is ~500m and therefore this frequency is 1.2 × 10-8 × 0.5 × number of visits per year. The allocation of the total fire/explosion frequency for different tanker sizes is based on the number of visits. This is presented in the tables below.
Table 10.17: Marine Fire and Explosion Frequencies (Initial Development)
|
Tanker
Size (dwt) |
Base
Frequency (per km) |
Interaction
Distance (km) |
No
of visits/year |
Frequency
per year |
|
20,000 |
1.2 × 10⁻⁸ |
0.5 |
60 |
3.6 × 10⁻⁷ |
|
45,000 |
1.2 × 10⁻⁸ |
0.5 |
64 |
3.8 × 10⁻⁷ |
|
60,000 |
1.2
× 10-8 |
0.5 |
32 |
1.9
× 10-7 |
Table 10.18: Marine Fire and Explosion Frequencies (Final Development)
|
Tanker
Size (dwt) |
Base
Frequency (per km) |
Interaction
Distance (km) |
No
of visits/year |
Frequency
per year |
|
30,000 |
1.2 × 10⁻⁸ |
0.5 |
70 |
4.2 × 10⁻⁷ |
|
45,000 |
1.2 × 10⁻⁸ |
0.5 |
80 |
4.8 × 10⁻⁷ |
|
80,000 |
1.2
× 10-8 |
0.5 |
38 |
2.3
× 10-7 |
10.3.5.4 The explosion hazards on marine tankers normally consist of the combustion of a mixture of air and hydrocarbon inside a nominally empty tank. Although it is difficult to form a flammable mixture within a Jet A1 storage tank, the frequency and effects for this scenario are considered based on the DNV 2000 Report [38].
10.3.5.5 The consequence distances and estimated fatalities for two explosions are given below. For the purposes of this assessment, the higher fatality figure used previously [1] has been used for all tanker sizes.
Table 10.19: Effect Distances and Estimated Fatalities for Marine Explosion Scenario (M3)
|
Causes |
Effect
Distance (m) |
Probability
of Death |
Fatalities |
|
Explosion – Repairable Damage |
50 |
0.3 |
3.5×10⁻² |
|
Explosion – Fragments |
500 |
3 × 10⁻⁵ |
3.5×10⁻⁴ |
10.4 Risks Due to Jetty Transfer
10.4.1.1 The PAFF will include a new two berth jetty dedicated to receipt of fuel from tankers. The jetty will be an island structure about 200m offshore, south of the tank farm. The northern berth will receive vessels in the range 10,000 dwt to 40,000 dwt, and the southern berth will receive vessels in the range 10,000 dwt to 80,000 dwt. Each berth will a have a central loading platform fitted with loading arms and remotely operated foam monitors located on dedicated towers. The flow rate through each loading platform, for all loading arms, will be 3500 m3/hr (780kg/s). The two berths will be connected by a single sub sea DN 500 pipeline, and each berth will be connected to the new tank farm by DN 500 sub sea pipeline.
10.4.1.2 This section presents the quantitative risk assessment carried out for the identified hazardous scenarios associated with Jetty Transfer. The relevant scenarios are:
· Fire due to rupture/leak of Jet A1 from loaded vessel (J1)
· Fire due to rupture/leak of Jet A1 from loading arm during unloading (J2)
· Fire due to rupture/leak of jetty equipment (J3)
· Fire due to rupture/leak of jetty riser (J4)
· Fire due to rupture/leak of submarine pipeline from jetty to tank farm ESDV (J5)
10.4.2 Fire due to rupture/leak of Jet A1 from loaded vessel (J1)
10.4.2.1 Scenario J1 may be caused by either “striking” or “impact”. Striking involves a drifting vessel (which probably lost control while in the channel) impacting the aviation fuel tanker while it is berthed.
10.4.2.2 Impact is defined as a tanker running into a dock wall or a jetty. This event depends upon the number of floating objects to be encountered and the space available to take avoiding action. The effect on the vessel will depend on the size of the obstruction; in the context of this study, it is considered that the strength of the impact is very unlikely to result in rupture. The tankers arriving at the jetty will be navigated at slow speed, under pilotage and tug assistance and will be of double hull construction which should therefore contain the fuel to an extent following any impact.
10.4.2.3 The frequency of strikings will depend upon the number of ship visits, and is estimated as 8 × 10⁻⁶ per movement (struck when berthed). The frequencies of strikings have been allocated based on visits of different tanker sizes. These values are presented below.
Table 10.20: Frequency of Strikings (Initial Development)
|
Tanker Size (dwt) |
Base Frequency (per
visit) |
No of visits/year |
Frequency per year |
|
20,000 |
8 × 10⁻⁶ |
60 |
4.8 × 10⁻⁴ |
|
45,000 |
8 × 10⁻⁶ |
64 |
5.12 × 10⁻⁴ |
|
60,000 |
8 × 10⁻⁶ |
32 |
2.56 × 10⁻⁴ |
Table 10.21: Frequency of Strikings (Final Development)
|
Tanker Size (dwt) |
Base Frequency(per
visit) |
No of visits/year |
Frequency per year |
|
30,000 |
8 × 10⁻⁶ |
70 |
5.6 × 10⁻⁴ |
|
45,000 |
8 × 10⁻⁶ |
80 |
6.4 × 10⁻⁴ |
|
80,000 |
8 × 10⁻⁶ |
38 |
3.04 × 10⁻⁴ |
10.4.2.4 The berthing impact frequency has been taken from the Caltex Safety Case ([1], [42]). The value is taken as 7.4 × 10⁻⁵ per visit. Based on the number of visits to the jetty, the failure frequencies due to impact are presented below.
Table 10.22: Frequency of Impacts With Jetty (Initial Development)
|
Tanker Size (dwt) |
Base Frequency (per visit) |
No of visits/year |
Frequency per year |
|
20,000 |
7.40 × 10⁻⁵ |
60 |
4.44 × 10⁻³ |
|
45,000 |
7.40 × 10⁻⁵ |
64 |
4.74 × 10⁻³ |
|
60,000 |
7.40 × 10⁻⁵ |
32 |
2.37 × 10⁻³ |
Table 10.23: Frequency of Impacts With Jetty (Final Development)
|
Tanker Size (dwt) |
Base Frequency (per visit) |
No of visits/year |
Frequency per year |
|
30,000 |
7.40 × 10⁻⁵ |
70 |
5.18 × 10⁻³ |
|
45,000 |
7.40 × 10⁻⁵ |
80 |
5.92 × 10⁻³ |
|
80,000 |
7.40 × 10⁻⁵ |
38 |
2.81 × 10⁻³ |
10.4.2.6 Not all strikes or impacts will result in a pool fire. In order for Scenario J1 to be realised, the incident must be followed by a spill, which may vary in size, and then by ignition. The probabilities assumed for this study are summarised below.
Table 10.24: Frequency of Scenario J1 (Initial Development)
|
Cause |
Vessel Size (dwt) |
Frequency per year |
Spill Prob. |
Leak Size |
Size Prob. |
Ignition Prob. |
Outcome Frequency |
|
Striking |
20000 |
4.80×10⁻⁴ |
0.015 |
Small |
0.2 |
0.001 |
1.44×10⁻⁹ |
|
Striking |
20000 |
4.80×10⁻⁴ |
0.015 |
Large |
0.2 |
0.003 |
4.32×10⁻⁹ |
|
Striking |
20000 |
4.80×10⁻⁴ |
0.015 |
Rupture |
0.58 |
0.008 |
3.34×10⁻⁸ |
|
Striking |
20000 |
4.80×10⁻⁴ |
0.015 |
Multiple
Rupture |
0.02 |
0.008 |
1.15×10⁻⁹ |
|
Striking |
45000 |
5.12×10⁻⁴ |
0.0075 |
Small |
0.2 |
0.001 |
7.68×10⁻¹⁰ |
|
Striking |
45000 |
5.12×10⁻⁴ |
0.0075 |
Large |
0.2 |
0.003 |
2.30×10⁻⁹ |
|
Striking |
45000 |
5.12×10⁻⁴ |
0.0075 |
Rupture |
0.58 |
0.008 |
1.78×10⁻⁸ |
|
Striking |
45000 |
5.12×10⁻⁴ |
0.0075 |
Multiple
Rupture |
0.02 |
0.008 |
6.14×10⁻¹⁰ |
|
Striking |
60000 |
2.56×10⁻⁴ |
0.0075 |
Small |
0.2 |
0.001 |
3.84×10⁻¹⁰ |
|
Striking |
60000 |
2.56×10⁻⁴ |
0.0075 |
Large |
0.2 |
0.003 |
1.15×10⁻⁹ |
|
Striking |
60000 |
2.56×10⁻⁴ |
0.0075 |
Rupture |
0.58 |
0.008 |
8.91×10⁻⁹ |
|
Striking |
60000 |
2.56×10⁻⁴ |
0.0075 |
Multiple
Rupture |
0.02 |
0.008 |
3.07×10⁻¹⁰ |
|
Impact |
20000 |
4.44×10⁻³ |
0.015 |
Small |
0.2 |
0.001 |
1.33×10⁻⁸ |
|
Impact |
20000 |
4.44×10⁻³ |
0.015 |
Large |
0.2 |
0.003 |
4.00×10⁻⁸ |
|
Impact |
20000 |
4.44×10⁻³ |
0.015 |
Rupture |
0.58 |
0.008 |
3.09×10⁻⁷ |
|
Impact |
20000 |
4.44×10⁻³ |
0.015 |
Multiple
Rupture |
0.02 |
0.008 |
1.07×10⁻⁸ |
|
Impact |
45000 |
4.74×10⁻³ |
0.0075 |
Small |
0.2 |
0.001 |
7.11×10⁻⁹ |
|
Impact |
45000 |
4.74×10⁻³ |
0.0075 |
Large |
0.2 |
0.003 |
2.13×10⁻⁸ |
|
Impact |
45000 |
4.74×10⁻³ |
0.0075 |
Rupture |
0.58 |
0.008 |
1.65×10⁻⁷ |
|
Impact |
45000 |
4.74×10⁻³ |
0.0075 |
Multiple
Rupture |
0.02 |
0.008 |
5.69×10⁻⁹ |
|
Impact |
60000 |
2.37×10⁻³ |
0.0075 |
Small |
0.2 |
0.001 |
3.56×10⁻⁹ |
|
Impact |
60000 |
2.37×10⁻³ |
0.0075 |
Large |
0.2 |
0.003 |
1.07×10⁻⁸ |
|
Impact |
60000 |
2.37×10⁻³ |
0.0075 |
Rupture |
0.58 |
0.008 |
8.25×10⁻⁸ |
|
Impact |
60000 |
2.37×10⁻³ |
0.0075 |
Multiple
Rupture |
0.02 |
0.008 |
2.84×10⁻⁹ |
Table 10.25: Frequency of Scenario J1 (Final Development)
|
Cause |
Vessel Size (dwt) |
Frequency per year |
Spill Prob. |
Leak Size |
Size Prob. |
Ignition Prob. |
Outcome Frequency |
|
Striking |
30000 |
5.60×10⁻⁴ |
0.0075 |
Small |
0.2 |
0.001 |
8.40×10⁻¹⁰ |
|
Striking |
30000 |
5.60×10⁻⁴ |
0.0075 |
Large |
0.2 |
0.003 |
2.52×10⁻⁹ |
|
Striking |
30000 |
5.60×10⁻⁴ |
0.0075 |
Rupture |
0.58 |
0.008 |
1.95×10⁻⁸ |
|
Striking |
30000 |
5.60×10⁻⁴ |
0.0075 |
Multiple Rupture |
0.02 |
0.008 |
6.72×10⁻¹⁰ |
|
Striking |
45000 |
6.40×10⁻⁴ |
0.0075 |
Small |
0.2 |
0.001 |
9.60×10⁻¹⁰ |
|
Striking |
45000 |
6.40×10⁻⁴ |
0.0075 |
Large |
0.2 |
0.003 |
2.88×10⁻⁹ |
|
Striking |
45000 |
6.40×10⁻⁴ |
0.0075 |
Rupture |
0.58 |
0.008 |
2.23×10⁻⁸ |
|
Striking |
45000 |
6.40×10⁻⁴ |
0.0075 |
Multiple Rupture |
0.02 |
0.008 |
7.68×10⁻¹⁰ |
|
Striking |
80000 |
3.04×10⁻⁴ |
0.0075 |
Small |
0.2 |
0.001 |
4.56×10⁻¹⁰ |
|
Striking |
80000 |
3.04×10⁻⁴ |
0.0075 |
Large |
0.2 |
0.003 |
1.37×10⁻⁹ |
|
Striking |
80000 |
3.04×10⁻⁴ |
0.0075 |
Rupture |
0.58 |
0.008 |
1.06×10⁻⁸ |
|
Striking |
80000 |
3.04×10⁻⁴ |
0.0075 |
Multiple Rupture |
0.02 |
0.008 |
3.65×10⁻¹⁰ |
|
Impact |
30000 |
5.18×10⁻³ |
0.0075 |
Small |
0.2 |
0.001 |
7.77×10⁻⁹ |
|
Impact |
30000 |
5.18×10⁻³ |
0.0075 |
Large |
0.2 |
0.003 |
2.33×10⁻⁸ |
|
Impact |
30000 |
5.18×10⁻³ |
0.0075 |
Rupture |
0.58 |
0.008 |
1.80×10⁻⁷ |
|
Impact |
30000 |
5.18×10⁻³ |
0.0075 |
Multiple
Rupture |
0.02 |
0.008 |
6.22×10⁻⁹ |
|
Impact |
45000 |
5.92×10⁻³ |
0.0075 |
Small |
0.2 |
0.001 |
8.88×10⁻⁹ |
|
Impact |
45000 |
5.92×10⁻³ |
0.0075 |
Large |
0.2 |
0.003 |
2.66×10⁻⁸ |
|
Impact |
45000 |
5.92×10⁻³ |
0.0075 |
Rupture |
0.58 |
0.008 |
2.06×10⁻⁷ |
|
Impact |
45000 |
5.92×10⁻³ |
0.0075 |
Multiple
Rupture |
0.02 |
0.008 |
7.10×10⁻⁹ |
|
Impact |
80000 |
2.81×10⁻³ |
0.0075 |
Small |
0.2 |
0.001 |
4.22×10⁻⁹ |
|
Impact |
80000 |
2.81×10⁻³ |
0.0075 |
Large |
0.2 |
0.003 |
1.26×10⁻⁸ |
|
Impact |
80000 |
2.81×10⁻³ |
0.0075 |
Rupture |
0.58 |
0.008 |
9.78×10⁻⁸ |
|
Impact |
80000 |
2.81×10⁻³ |
0.0075 |
Multiple
Rupture |
0.02 |
0.008 |
3.37×10⁻⁹ |
10.4.2.7 The consequences of striking and impact of vessels are assumed to be the same as those of collisions and groundings in Scenario M1 (see Section 10.3.3), leading to the following risks.
Table 10.26: Risk Summary for Scenario J1 (Initial Development)
|
Cause |
Vessel Size (dwt) |
Leak Size |
Outcome Frequency ,/yr |
Fatalities |
|
Striking |
20,000 |
Small |
1.44×10⁻⁹ |
0.01 |
|
Striking |
20,000 |
Large |
4.32×10⁻⁹ |
0.05 |
|
Striking |
20,000 |
Rupture |
3.34×10⁻⁸ |
2.63 |
|
Striking |
20,000 |
Multiple Rupture |
1.15×10⁻⁹ |
2.63 |
|
Striking |
45,000 |
Small |
7.68×10⁻¹⁰ |
0.03 |
|
Striking |
45,000 |
Large |
2.30×10⁻⁹ |
0.11 |
|
Striking |
45,000 |
Rupture |
1.78×10⁻⁸ |
5.91 |
|
Striking |
45,000 |
Multiple Rupture |
6.14×10⁻¹⁰ |
5.91 |
|
Striking |
60,000 |
Small |
3.84×10⁻¹⁰ |
0.04 |
|
Striking |
60,000 |
Large |
1.15×10⁻⁹ |
0.14 |
|
Striking |
60,000 |
Rupture |
8.91×10⁻⁹ |
7.88 |
|
Striking |
60,000 |
Multiple Rupture |
3.07×10⁻¹⁰ |
7.88 |
|
Impact |
20,000 |
Small |
1.33×10⁻⁸ |
0.01 |
|
Impact |
20,000 |
Large |
4.00×10⁻⁸ |
0.05 |
|
Impact |
20,000 |
Rupture |
3.09×10⁻⁷ |
2.63 |
|
Impact |
20,000 |
Multiple Rupture |
1.07×10⁻⁸ |
2.63 |
|
Impact |
45,000 |
Small |
7.11×10⁻⁹ |
0.03 |
|
Impact |
45,000 |
Large |
2.13×10⁻⁸ |
0.11 |
|
Impact |
45,000 |
Rupture |
1.65×10⁻⁷ |
5.91 |
|
Impact |
45,000 |
Multiple Rupture |
5.69×10⁻⁹ |
5.91 |
|
Impact |
60,000 |
Small |
3.56×10⁻⁹ |
0.04 |
|
Impact |
60,000 |
Large |
1.07×10⁻⁸ |
0.14 |
|
Impact |
60,000 |
Rupture |
8.25×10⁻⁸ |
7.88 |
|
Impact |
60,000 |
Multiple Rupture |
2.84×10⁻⁹ |
7.88 |
Table 10.27: Risk Summary for Scenario J1 (Final Development)
|
Cause |
Vessel Size (dwt) |
Leak Size |
Outcome Frequency ,/yr |
Fatalities |
|
Striking |
30,000 |
Small |
8.40×10⁻¹⁰ |
0.01 |
|
Striking |
30,000 |
Large |
2.52×10⁻⁹ |
0.05 |
|
Striking |
30,000 |
Rupture |
1.95×10⁻⁸ |
2.63 |
|
Striking |
30,000 |
Multiple Rupture |
6.72×10⁻¹⁰ |
2.63 |
|
Striking |
45,000 |
Small |
9.60×10⁻¹⁰ |
0.03 |
|
Striking |
45,000 |
Large |
2.88×10⁻⁹ |
0.11 |
|
Striking |
45,000 |
Rupture |
2.23×10⁻⁸ |
5.91 |
|
Striking |
45,000 |
Multiple Rupture |
7.68×10⁻¹⁰ |
5.91 |
|
Striking |
80,000 |
Small |
4.56×10⁻¹⁰ |
0.06 |
|
Striking |
80,000 |
Large |
1.37×10⁻⁹ |
0.19 |
|
Striking |
80,000 |
Rupture |
1.06×10⁻⁸ |
10.50 |
|
Striking |
80,000 |
Multiple Rupture |
3.65×10⁻¹⁰ |
10.50 |
|
Impact |
30,000 |
Small |
7.77×10⁻⁹ |
0.01 |
|
Impact |
30,000 |
Large |
2.33×10⁻⁸ |
0.05 |
|
Impact |
30,000 |
Rupture |
1.80×10⁻⁷ |
2.63 |
|
Impact |
30,000 |
Multiple Rupture |
6.22×10⁻⁹ |
2.63 |
|
Impact |
45,000 |
Small |
8.88×10⁻⁹ |
0.03 |
|
Impact |
45,000 |
Large |
2.66×10⁻⁸ |
0.11 |
|
Impact |
45,000 |
Rupture |
2.06×10⁻⁷ |
5.91 |
|
Impact |
45,000 |
Multiple Rupture |
7.10×10⁻⁹ |
5.91 |
|
Impact |
80,000 |
Small |
4.22×10⁻⁹ |
0.06 |
|
Impact |
80,000 |
Large |
1.26×10⁻⁸ |
0.19 |
|
Impact |
80,000 |
Rupture |
9.78×10⁻⁸ |
10.5 |
|
Impact |
80,000 |
Multiple Rupture |
3.37×10⁻⁹ |
10.5 |
10.4.2.8 Due to the presence of the sea wall at about 200m from the jetty, the actual effect distance for some spills on sea will not correspond to circular pools, rather the spills will spread along the sea wall in irregular shapes. A simplistic semi-circular pool of equivalent diameter has been assumed to model the effect of spreading due to sea wall.
10.4.3 Fire due to rupture/leak of loading arm during unloading (J2)
10.4.3.1 A loading arm leak may occur as a result of either the loading arm being incorrectly connected, the purge valve being left open during delivery, or liquid still being in the line when the purge valve is opened. These events could lead to only a relatively small leak of aviation fuel.
10.4.3.2 The loading arm could rupture due to a variety of reasons, including excessive movement, corrosion and material or construction defects. Weather conditions may influence the likelihood of failure, as discussed in Paragraph 10.4.2.5. The rupture could result in a large amount of Jet A1 being released, particularly if loading is not stopped immediately.
10.4.3.3 The frequency of loading hose failure is derived as 9 × 10⁻⁸ per hour of operation (EMSD studies [1]). The frequency of loading arm ruptures have been considered to occur at an order of magnitude lower than loading hoses i.e. 9 × 10⁻⁹ per hour [1]. Each transfer operation is assumed to take 20 hours on average, which gives a failure frequency of 1.8 × 10‑7 per port visit. This is in line with other ESR experience of hard arm rupture frequencies releasing over 100 tonnes of material.
10.4.3.4 There are 156 visits to the jetty per year for the initial development and 188 visits for the final development. Therefore, the rupture frequency of the loading arms is calculated as 1.8 × 10‑7 × 156 = 2.81 × 10‑5 /yr (Initial Development) and 1.8 × 10‑7 × 188 = 3.38 × 10‑5 /yr (Final Development).
10.4.3.5 Based on an ignition probability of 0.008 (Appendix H5), the pool fire frequency following a rupture of the loading arm is estimated as 2.25 × 10‑7 /yr (Initial Development) and 2.71 × 10‑7 /yr (Final Development).
10.4.3.6 The maximum pumping rate through the loading arm is 3500 m3/hr. Should a rupture occur, rapid isolation would be expected because people will be present during unloading to see the failure and operate the emergency shutdown systems promptly. Isolation is assumed to occur in 3 minutes, consistent with the isolation times used elsewhere, giving a release of 175 m3. In the event that rapid isolation at the jetty fails, then the release will still be isolatable from the Control Room. The probability of rapid isolation failure is cautiously taken as 0.1 to allow for both human error and system/equipment failures. It is estimated that a maximum of 10 minutes will be taken to isolate the release in the event of rapid isolation failure, leading to a release of 583 m3. All the fuel will spill on to the sea and following ignition will result in a pool fire in much the same fashion as the cases for marine transport.
10.4.3.7 The effect distance of both spills has been modelled based on a continuous release of 778 kg/s since this limits burning pool size for this release (the 175 m3 release would give a similar hazard range of 75 m based on an instantaneous release model). The radius of the pool, and therefore the effect distance, is calculated to be 68.4 m. The numbers of fatalities are calculated based on the area affected of p(68.4)2 times the population density of 0.15/ha (Section H8.2) times the fatality probability of 1, to give 0.22 off-site fatalities.
Table 10.28: Risk Summary for Scenario J2
|
|
Outcome Frequency ,/yr |
Fatalities |
|
|
Loading arm rupture |
Initial Development |
2.25×10⁻⁷ |
0.22 |
|
Loading arm rupture |
Final Development |
2.71×10⁻⁷ |
0.22 |
10.4.4 Fire due to rupture/leak of jetty equipment (J3)
10.4.4.1 Apart from the loading arm, jetty riser and pipeline to tank farm, there is also the potential for leaks from other pipework and valves on the jetty itself. The parts count covering this area based on the PAFF P&IDs [43] is shown below:
Table 10.29: Parts Count for Jetty Area
|
Parts
Count |
Actuated Valves |
Manual Valves |
Flanges |
Small Bores |
Vessels |
Pumps |
Pipe (m) |
|
Jetty Head |
10 |
23 |
84 |
43 |
0 |
0 |
611 |
10.4.4.2 Based on generic equipment release frequency data (see Section 10.5.7) the following releases and large fire frequencies are derived:
Table 10.30: Release and Fire Frequencies for Jetty Area
|
|
Release Frequency (per
year) |
Probability not rapidly
isolated |
Ignition Prob |
Large fire freq (per year) |
|
|
Small |
Large (>2") |
||||
|
Jetty Head |
1×10⁻¹ |
8.3×10⁻³ |
0.1 |
0.008 |
6.6×10⁻⁶ |
10.4.4.3 The maximum flow rate on the jetty is 3500 m3/hr, corresponding to the 80,000 dwt berth. The consequences of a continuous release at this rate have already been considered, in connection with loading arm rupture (see Section 10.4.3). The risks are summarised below.
Table 10.31: Risk Summary for Scenario J3
|
Risk
Summary for J3 |
Outcome Frequency /yr |
Fatalities |
|
|
Jetty equipment rupture/leak |
Initial Development |
6.6 × 10‑6 |
0.22 |
|
Jetty equipment rupture/leak |
Final Development |
6.6 × 10‑6 |
0.22 |
10.4.5 Fire due to rupture/leak of jetty riser (J4)
10.4.5.1 There is a potential for the jetty riser to rupture in the event of a vessel impacting the jetty or a passing vessel striking a berthed vessel. However, the riser is built into the jetty structure and the maximum spill quantity will be limited to the inventory in the pipeline to the tank farm from the jetty, which is approximately 270m long.
10.4.5.2 The frequency of a tanker being struck while berthed or impacting the jetty is presented in Section 10.4.2. Not all such incidents will result in the jetty riser being damaged. For the purposes of this assessment, we will assume that the jetty riser will leak if the strike or impact is energetic enough to cause a large leak of Jet A1 from the tanker, and will rupture if the strike or impact is energetic enough to rupture one or more cargo tanks. The resulting frequencies for the causes of this scenario are summarised below.
Table 10.32: Frequency of Scenario J4 (Initial Development)
|
Cause |
Vessel Size (dwt) |
Frequency per year |
Spill Prob. |
Riser Leak Size |
Size Prob. |
Ignition Prob. |
Outcome Frequency |
|
Striking |
20000 |
4.80×10⁻⁴ |
0.015 |
Large |
0.2 |
0.003 |
4.32×10⁻⁹ |
|
Striking |
20000 |
4.80×10⁻⁴ |
0.015 |
Rupture |
0.58 |
0.008 |
3.34×10⁻⁸ |
|
Striking |
45000 |
5.12×10⁻⁴ |
0.0075 |
Large |
0.2 |
0.003 |
2.30×10⁻⁹ |
|
Striking |
45000 |
5.12×10⁻⁴ |
0.0075 |
Rupture |
0.58 |
0.008 |
1.78×10⁻⁸ |
|
Striking |
60000 |
2.56×10⁻⁴ |
0.0075 |
Large |
0.2 |
0.003 |
1.15×10⁻⁹ |
|
Striking |
60000 |
2.56×10⁻⁴ |
0.0075 |
Rupture |
0.58 |
0.008 |
8.91×10⁻⁹ |
|
Impact |
20000 |
4.44×10⁻³ |
0.015 |
Large |
0.2 |
0.003 |
4.00×10⁻⁸ |
|
Impact |
20000 |
4.44×10⁻³ |
0.015 |
Rupture |
0.58 |
0.008 |
3.09×10⁻⁷ |
|
Impact |
45000 |
4.74×10⁻³ |
0.0075 |
Large |
0.2 |
0.003 |
2.13×10⁻⁸ |
|
Impact |
45000 |
4.74×10⁻³ |
0.0075 |
Rupture |
0.58 |
0.008 |
1.65×10⁻⁷ |
|
Impact |
60000 |
2.37×10⁻³ |
0.0075 |
Large |
0.2 |
0.003 |
1.07×10⁻⁸ |
|
Impact |
60000 |
2.37×10⁻³ |
0.0075 |
Rupture |
0.58 |
0.008 |
8.25×10⁻⁸ |
Table 10.33: Frequency of Scenario J4 (Final Development)
|
Cause |
Vessel Size (dwt) |
Frequency per year |
Spill Prob. |
Riser Leak Size |
Size Prob. |
Ignition Prob. |
Outcome Frequency |
|
Striking |
30000 |
5.60×10⁻⁴ |
0.0075 |
Large |
0.2 |
0.003 |
2.52×10⁻⁹ |
|
Striking |
30000 |
5.60×10⁻⁴ |
0.0075 |
Rupture |
0.6 |
0.008 |
1.95×10⁻⁸ |
|
Striking |
45000 |
6.40×10⁻⁴ |
0.0075 |
Large |
0.2 |
0.003 |
2.88×10⁻⁹ |
|
Striking |
45000 |
6.40×10⁻⁴ |
0.0075 |
Rupture |
0.6 |
0.008 |
2.23×10⁻⁸ |
|
Striking |
80000 |
3.04×10⁻⁴ |
0.0075 |
Large |
0.2 |
0.003 |
1.37×10⁻⁹ |
|
Striking |
80000 |
3.04×10⁻⁴ |
0.0075 |
Rupture |
0.6 |
0.008 |
1.06×10⁻⁸ |
|
Impact |
30000 |
5.18×10⁻³ |
0.0075 |
Large |
0.2 |
0.003 |
2.33×10⁻⁸ |
|
Impact |
30000 |
5.18×10⁻³ |
0.0075 |
Rupture |
0.6 |
0.008 |
1.80×10⁻⁷ |
|
Impact |
45000 |
5.92×10⁻³ |
0.0075 |
Large |
0.2 |
0.003 |
2.66×10⁻⁸ |
|
Impact |
45000 |
5.92×10⁻³ |
0.0075 |
Rupture |
0.6 |
0.008 |
2.06×10⁻⁷ |
|
Impact |
80000 |
2.81×10⁻³ |
0.0075 |
Large |
0.2 |
0.003 |
1.26×10⁻⁸ |
|
Impact |
80000 |
2.81×10⁻³ |
0.0075 |
Rupture |
0.6 |
0.008 |
9.78×10⁻⁸ |
10.4.5.3 The consequences of this scenario are taken as the same as J2 (see Section 10.4.2.8).
Table 10.34: Risk Summary for Scenario J4 (Initial Development)
|
Cause |
Vessel Size (dwt) |
Riser Leak Size |
Outcome Frequency /yr |
Fatalities |
|
Striking |
20,000 |
Large |
4.32×10⁻⁹ |
0.22 |
|
Striking |
20,000 |
Rupture |
3.34×10⁻⁸ |
0.22 |
|
Striking |
45,000 |
Large |
2.30×10⁻⁹ |
0.22 |
|
Striking |
45,000 |
Rupture |
1.78×10⁻⁸ |
0.22 |
|
Striking |
60,000 |
Large |
1.15×10⁻⁹ |
0.22 |
|
Striking |
60,000 |
Rupture |
8.91×10⁻⁹ |
0.22 |
|
Impact |
20,000 |
Large |
4.00×10⁻⁸ |
0.22 |
|
Impact |
20,000 |
Rupture |
3.09×10⁻⁷ |
0.22 |
|
Impact |
45,000 |
Large |
2.13×10⁻⁸ |
0.22 |
|
Impact |
45,000 |
Rupture |
1.65×10⁻⁷ |
0.22 |
|
Impact |
60,000 |
Large |
1.07×10⁻⁸ |
0.22 |
|
Impact |
60,000 |
Rupture |
8.25×10⁻⁸ |
0.22 |
Table 10.35: Risk Summary for Scenario J4 (Final Development)
|
Cause |
Vessel Size (dwt) |
Riser Leak Size |
Outcome Frequency /yr |
Fatalities |
|
Striking |
30,000 |
Large |
2.52×10⁻⁹ |
0.22 |
|
Striking |
30,000 |
Rupture |
1.95×10⁻⁸ |
0.22 |
|
Striking |
45,000 |
Large |
2.88×10⁻⁹ |
0.22 |
|
Striking |
45,000 |
Rupture |
2.23×10⁻⁸ |
0.22 |
|
Striking |
80,000 |
Large |
1.37×10⁻⁹ |
0.22 |
|
Striking |
80,000 |
Rupture |
1.06×10⁻⁸ |
0.22 |
|
Impact |
30,000 |
Large |
2.33×10⁻⁸ |
0.22 |
|
Impact |
30,000 |
Rupture |
1.80×10⁻⁷ |
0.22 |
|
Impact |
45,000 |
Large |
2.66×10⁻⁸ |
0.22 |
|
Impact |
45,000 |
Rupture |
2.06×10⁻⁷ |
0.22 |
|
Impact |
80,000 |
Large |
1.26×10⁻⁸ |
0.22 |
|
Impact |
80,000 |
Rupture |
9.78×10⁻⁸ |
0.22 |
10.4.6 Fire due to rupture/leak of submarine pipeline from jetty to Tank Farm ESDV (J5)
10.4.6.1 The submarine pipeline from the loading arm to the tank farm could leak or rupture due to material defect, corrosion or impact. However, compared to the sub sea pipeline from the tank farm to the AFRF, this section will be less exposed to impact from marine vessels.
10.4.6.2 The 270m submarine pipelines from the loading arm to the tank farm
are treated in a similar manner to the 4.8 km submarine pipelines from the
tank farm to the AFRF. This is discussed
in
Table 10.36: Frequency of Scenario J5
|
Release Size |
Release Frequency per km /yr |
Length, km |
Freq, /yr |
Ignition probability |
Outcome Frequency, /yr |
|
Small |
3.88×10⁻⁶ |
0.54 |
2.10×10⁻⁶ |
0.001 |
2.10×10⁻⁹ |
|
Medium |
1.02×10⁻⁶ |
0.54 |
5.51×10⁻⁷ |
0.003 |
1.65×10⁻⁹ |
|
Rupture |
1.9×10⁻⁶ |
0.54 |
1.03×10⁻⁶ |
0.008 |
8.21×10⁻⁹ |
10.4.6.3 For Scenario P1, only the rupture frequency is used, since smaller releases would break up before forming a pool on the sea surface. However, in this scenario, the pipeline depth is less, so the small (20mm) and medium (50mm) leaks are taken into account as well.
10.4.6.4 The pipeline volume is ~106 m3 and the maximum pumping rate is 3500 m3 /hr. For a rupture release, the total volume release is assessed based on the pipeline inventory plus full flow until the release is isolated. Isolation is assumed to take 3 minutes to allow for the time to detect the release and actuate the shutdown system. People will be present during unloading and the area is also covered by CCTV from the control room so rapid detection and isolation would be expected. However, to allow for failures in both of detection and in the isolation systems, including the valves, a probability of rapid isolation failure of 0.1 is included. In this case full flow for 10 minutes is assumed, before isolation is assumed to have occurred. This leads to a release 281 m3 for the rapidly isolated case and 689 m3 where rapid isolation fails. Based on rapid release (see Section H2.3), this gives a hazard radii of 95 m and 148 m for the two isolation cases. For the marine population density of 0.15 /ha (Section H8.2), this leads to estimates of 0.43 and 1 fatalities with frequencies of 7.39 × 10‑9 /yr and 8.21×10⁻¹⁰ /yr for rapid and late isolation cases respectively.
10.4.6.5 For small and medium release sizes, the assessment is based on continuous releases at 13 kg/s, giving a hazard range of 8.6 m (234 m2) and 79 kg/s, giving a hazard range of 22 m (1460 m2). At a population density of 0.15 /ha (Section H8.2) these lead to 0.003 and 0.02 fatalities respectively.
Table 10.37: Risk Summary for Sub-sea Jetty Pipeline Releases (Scenario J5)
|
Leak Size |
Isolation |
Outcome Frequency, /yr |
Hazard Radius, m |
Fatalities |
|
Small |
Continuous Release |
2.10×10⁻⁹ |
8.6 |
0.003 |
|
Medium |
Continuous Release |
1.65×10⁻⁹ |
22 |
0.02 |
|
Rupture |
Rapid (3 mins) |
7.39 × 10‑9 |
95 |
0.43 |
|
|
Late (10 mins) |
8.21×10⁻¹⁰ |
148 |
1.0 |
10.5 Risks Due to Tank Farm Storage
10.5.1.1 The proposed tanks will be of a fixed roof design and will store Jet A1 below its flash point. Under normal operations Jet A1 will not form a flammable vapour above its surface and generally poses less hazard than the storage of highly flammable liquids, such as gasoline, in similar tanks.
10.5.1.2 The following hazardous scenarios were identified in Section 10.2.3:
· Fire due to discharge from tank vent (T1)
· Tank head fire / explosion in tank head space (T2)
· Multiple tank head fires (T3)
· Tank failure due to overpressure (T4)
· Explosion in empty tank (under maintenance) (T5)
· Bund fire (T6)
· Fire outside bund due to rupture/leak of pumps, pipework and fittings (T7)
· Fire on sea due to release through drainage (T8)
· Fire due to instantaneous release from a tank (T9)
· Fire due to multiple tank failure (T10)
· Boilover (T11)
· Fire due to release from top of tank due to overfilling (T12)
· Vapour cloud explosion / flash fire (T13)
· Fire due to 10% instantaneous release from the top of a tank (T14)
10.5.1.3 The risk levels due to each scenario are quantified in the following sections. Some of the potential scenarios have been included for completeness, although it is concluded that they are either not applicable to the PAFF tanks or fall completely within other scenarios. This is in line with the identification of hazardous scenarios from previous experience of similar fixed roof atmospheric pressure tank farms, many of which stored hazardous substances other than Jet A1.
10.5.2 Fire due to discharge from tank vent (T1)
10.5.2.1 Unlike the PAFF tanks, many atmospheric pressure and temperature storage tanks store liquids above their flash point. For these tanks the vapour in the head space of the tank will generally be above the lower flammability limit and, depending on the conditions, may also be above the upper flammability limit. A discharge of this vapour from a tank vent, although in a remote location, could be ignited leading to a tank vent fire.
10.5.2.2 Lightning is a relatively common ignition source for tank fires. For
example, there was an incident in 1997 in
10.5.2.3 Jet A1 in the PAFF tanks is stored below its flash point (see Section 10.2.1) so any vapour discharged from the vents will be below its lower flammability limit and will therefore not pose a fire hazard. The frequency of the event is therefore quantified as zero for this facility and, if a vent fire were to occur, the consequences also amount to zero off-site fatalities.
10.5.3 Tank head fire / explosion in tank head space (T2)
10.5.3.1 One of the hazards of atmospheric pressure fuel storage in tanks is the failure of the roof and ignition of the fuel surface leading to a tank head fire. The tank may buckle above the liquid level due to exposure to the flame, but the liquid provides cooling to the tank shell below the liquid surface level so that distortion here would be minimal and failure below the liquid level is not an issue.
10.5.3.2 Tank head fires can be initiated by the presence of an ignition
source with a flammable vapour present in the tank ullage space. This would be
expected to fail the weak tank roof to wall seal, exposing the surface of the
fuel. Potential ignition sources of concern include lightning strike, static
electricity, hot work and instrument electrical faults. Under normal operation
there will be no ignition sources present at tank top level, all the mechanical
and all the electrical installations within the tanks will be rated for
operation in flammable atmospheres and the bulk vapour in the tank will not be
within the flammable range. It is possible for localised areas to exceed the
lower flammability limit within the tank head space even for Jet A1 under
ambient
10.5.3.5 An explosion in the tank head space would not be expected to have any off site consequences directly, in addition to a tank head fire. There exists a possibility that, if the weak shell to roof joint does not fail, the tank may fail at the bottom seam instead leading to the tank rocketing. This is highly unlikely for a tank containing Jet A1, but is considered further as part of the instantaneous release scenario in Section 10.6.
10.5.3.6 The flame from a tank head fire would be exposed above the rim of the tank (24.7 m, except for the smaller Tank 9 which is 23 m high) and the thermal radiation would provide only a local hazard a few metres from the edge of the flame. The thermal flux levels and effects this could generate are quantified in Appendix H6. A tank head fire would not be expected to cause any significant off-site risk to life, although precautionary evacuation of the surrounding area would be recommended to reduce the exposure of off-site populations to any subsequent escalation of the incident. The number of off-site fatalities for this scenario is therefore quantified as zero.
10.5.4 Multiple tank head fires (T3)
10.5.4.1 A tank head fire has the potential to impact an adjacent tank, which may result in an adjacent tank fire. It is possible for such fires to spread from tank to tank leading to many or all of the tanks in a bund, or an adjacent bund, catching fire.
10.5.4.2 For the tank separation distances at the PAFF, it is estimated that tank to tank escalation could occur if there is a wind blowing directly from one tank to another. However, it would be expected to take many hours allowing ample time for evacuation of the surrounding areas. Based on a review of the tank farm layout and wind direction information available, this is expected to occur at most 50% of the time.
10.5.4.3 However, the storage tanks have a cooling system installed and the adjacent tanks (in the sector opposite the tank on fire) will be cooled in the event of a tank fire. As a cautious estimate, the failure probability of tank cooling is taken as 10% with the fixed system installed. Typically, such systems would be expected to be at least this reliable.
10.5.4.4 An overall estimate of the multiple tank head fire frequency is therefore taken as 5% of the individual tank head fire frequency (see 10.5.3.4); 7 × 10‑5 /yr for the final development, and 4.8 × 10‑5 /yr for the initial development with only 8 tanks.
10.5.4.5 A multiple tank head fire could also be initiated by a prolonged bund fire around the tank. However this is not considered as a separate scenario, since the hazard to life is dominated by the thermal radiation from the larger bund fire at ground level.
10.5.4.6 27 multiple tank fire incidents are listed by McBride [9] up to
2002. Eight of the incidents, which also involved explosions or fires starting
outside tank bunded areas, involved fatalities. A recent major incident also
occurred at Buncefield in the
10.5.4.7 Owing to the time available for evacuation prior to the establishment of a multiple tank head fire scenario at the PAFF, the hazard to life from this scenario is considered minimal compared to that from the initial tank head fire or external fire that initiated the incident. The thermal radiation levels adjacent to any single tank would be slightly increased by the additional heat flux from adjacent fires, but the number of off-site fatalities for this scenario is still quantified as zero for the PAFF.
10.5.4.8 Response to such a scenario, including evacuation arrangements should however be included in the PAFF emergency response plan.
10.5.5 Tank failure due to overpressure (T4)
10.5.5.1 The PAFF tanks are of an open vented design including at least one redundant vent [14]. The tanks will also be provided with a weak shell to roof connection (specified in API 650) that is designed to fail in the event of an overpressure within the tank [16]. Apart from filling of the tanks with liquid from the jetty, there is nothing to lead to an overpressure inside the PAFF tanks, except an explosion.
10.5.5.2 An overpressure within the tanks would be discharged by the tank vents or the weak shell to roof seam and would not be expected to have any offsite consequences. The frequency of this event is therefore assessed as zero, leading to zero fatalities. Overfilling and vapour space explosions are considered separately.
10.5.6 Explosion in empty tank (under maintenance) (T5)
10.5.6.1 Explosions have occurred in nominally empty tanks during maintenance work, particularly during hot work. Small quantities of Jet A1 could be present after the tank has been initially cleaned and could potentially be ignited. Procedures will be in place to avoid such an incident occurring during confined space entry and Jet A1, being below its flash point could generate only a very small quantity of flammable vapour close to the source of heat. The explosion overpressures produced if this were ignited would be small. Even allowing for a flammable volume of several cubic metres, ignition in a 35,000 m3 tank would generate an overpressure of less than 1 mb which would be too low to cause any damage to the tank structure or the weak shell to roof joint. Although injuries/fatalities could occur to workers in the immediate area inside the tank, there would be no damage outside the tank and no possibility of off-site fatalities as a result. This scenario is therefore assessed as having a zero frequency for producing off-site fatalities.
10.5.7.2 Davies [46] et al suggests a bund fire frequency in a common bund of 1.2 × 10⁻⁵ per year for a flammable liquid. This frequency includes all causes such as tank failure, overfilling, pipework failure, external fire impact on equipment, etc.
10.5.7.3
A simple analysis has been made
for the predicted large fire frequency based on available data for release
frequencies for different types of equipment and the quantities of equipment
present. The frequencies used are from
Table 10.38: Component Release Frequencies for Small and Large Hole Sizes
|
Component |
Actuated Valves |
Manual Valves |
Flanges |
Small Bores |
Vessels |
Pumps |
Pipe (m) |
|
Freq/yr |
8.8×10⁻⁴ |
5.5×10⁻⁴ |
1.1×10⁻⁴ |
7.2×10⁻⁴ |
2.5×10⁻³ |
9.7×10⁻³ |
7.3×10⁻⁵ |
|
Fraction >2" |
1.1×10⁻¹ |
1.1×10⁻¹ |
1.1×10⁻¹ |
0.0 |
1.8×10⁻¹ |
2.0×10⁻² |
1.1×10⁻¹ |
|
Small (/yr) |
7.8×10⁻⁴ |
4.9×10⁻⁴ |
9.6×10⁻⁵ |
7.2×10⁻⁴ |
2.1×10⁻³ |
9.5×10⁻³ |
6.5×10⁻⁵ |
|
Large (/yr) |
9.7×10⁻⁵ |
6.1×10⁻⁵ |
1.2×10⁻⁵ |
0.0 |
4.5×10⁻⁴ |
1.9×10⁻⁴ |
8.1×10⁻⁶ |
10.5.7.4 A typical probability of failure to isolate the release quickly of 0.1 is included since only releases that could result in a large continuous release to the bund could result in a major bund fire. This is significantly greater than the failure probability typically assessed for a valve to allow for both human error and that the valves are motor operated rather than spring return.
10.5.7.5 The parts count covering both bunds, based on the PAFF P&IDs [43], is shown below:
Table 10.39: Parts Count for Tank Bunds
|
Parts Count |
Actuated
Valves |
Manual
Valves |
Flanges |
Small
Bores |
Vessels |
Pumps |
Pipe
(m) |
|
Tank Bunds |
48 |
108 |
357 |
89 |
12 |
0 |
1406 |
10.5.7.7 Combining the component counts, isolation probability and release frequencies with an ignition probability of 0.004 (Appendix H5), gives an overall large bund fire frequency of 1.3 × 10‑5 /yr covering both bunds for the final development case. The value identified by Davies (10.5.7.1) is slightly higher, and is therefore used for a cautious best estimate.
10.5.7.9 If such a fire occurs in a wind speed of 5 m/s or less, the effect is expected to be confined to within the PAFF fence, since the flame drag is expected to cover less than this distance and people would be predicted to escape unless directly impinged by flame. In high wind speed conditions (10m/s, occurring 0.3% of the time (see H6.9)), the flame drag may extend about 18m over the fence. This could lead to the potential for fatalities over an area of ~2000 m2, outside the PAFF. With the identified wind direction at high wind speeds (15-45o, Section H6.9) this would be over the EcoPark area between the PAFF and the sea or the PAFF pump platform area for the bund closest to the sea. There would be no offsite impact from the other bund. Although any people in this area would be expected to be able to escape (see Appendix H6), we conservatively assess the impact based on the EcoPark population density of 3842 /km2 (daytime – 9hrs) and 384 /km2 (night-time – 15hrs) (see Section H8.2). The resulting quantified risk level from a bund fire is:
· Daytime: 7.7 fatalities with a frequency of 1.35× 10⁻⁸ /yr.
· Night-time: 0.77 fatalities with a frequency of 2.25×10‑8 /yr (or 1 fatality, 1.7×10‑8 /yr)
10.5.7.10 The above estimates are used in the assessment, although in practice they may be pessimistic due to the slow flame spread and the ability to escape.
10.5.8 Fire outside tank bund due to rupture/leak of pumps, pipework and fittings (T7)
10.5.8.1 The PAFF includes a pump platform and connecting pipework outside the tank bunds. This equipment could lead to a release of Jet A1 which could subsequently be ignited. The quantities of connecting pipework outside the bunds is very limited since the pipework mostly runs through the bunds until it crosses the road to the pump platform, which is also bunded. The parts count covering these areas, based on the PAFF P&IDs [43], is shown below:
Table 10.40: Parts Count for Pump Platform and Pipework Outside Bunds
|
Parts Count |
Actuated
Valves |
Manual
Valves |
Flanges |
Small
Bores |
Vessels |
Pumps |
Pipe
(m) |
|
Pump Platform (Upstream) |
13 |
17 |
79 |
33 |
0 |
0 |
434 |
|
Pump Platform (Downstream) |
21 |
36 |
139 |
32 |
0 |
6 |
34 |
|
Outside Bunds |
0 |
0 |
6 |
6 |
0 |
0 |
45 |
Table 10.41: Component Release Frequencies for Pump Platform and Pipework Outside Bunds
|
|
Release
Frequency (per
year) |
Probability
not rapidly isolated |
Ignition
Prob |
Large
fire freq (/yr) |
|
|
Small |
Large
(>2") |
||||
|
Pump Platform
(Upstream) |
8×10⁻² |
6.7×10⁻³ |
0.1 |
0.004 |
2.7×10⁻⁶ |
|
Pump Platform
(Downstream) |
1.3×10⁻¹ |
7.3×10⁻³ |
0.1 |
0.004 |
2.9×10⁻⁶ |
|
Outside Bunds |
8×10⁻³ |
4.3×10⁻⁴ |
0.1 |
0.004 |
1.7×10⁻⁷ |
10.5.8.3 The pump platform lies between the tank bund and the administration building. The platform is at least 1.8 m below grade and has a concrete base and wall extending 2.1-2.3m above the platform base and a containment volume of 1950m3 [49] (area approximately 886 m2).
10.5.8.4 It is possible to get small leaks from pump seals, flanges, etc. from the high-pressure side of a pump, that may atomise into a flammable spray. However, such sprays do not permeate more than a few metres from the source and present no off-site hazard. A large release in the pump platform area could form a pool fire in this area if ignited and could discharge to the sea via the site drainage system (via an interceptor).
10.5.8.5 A large release from the limited pipework connecting the tank bund to the pump platform could only occur under the site road between the two and would release either into the tank or pump containment volumes or onto the EVA road. These areas are all contained and the consequences are considered to be adequately included within the pump platform fire scenario, so the additional frequency is included here. A release onto the EVA road could drain to the sea via the storm water drain and this is covered in Section 10.5.9.
10.5.8.6 The maximum discharge rate would be at the pump transfer rate to the airport of 1,500 m3 /hr [14]. A fire from such a release would be expected to lead to major damage to the pump platform equipment, but the fuel supply could be shut off remotely at the tanks supplying the pumps even if the local equipment was damaged. Such a running fire is therefore not expected to last more than 30 minutes, by which time the fire service should be on site and responding, even if the operators have been unable to isolate the source of liquid. This would amount to a release of up to 750 m3 of Jet A1. The containment capacity is 2½ times this volume, so loss outside the area is not considered and the specific assumption on isolation time makes no difference to the results providing it is more than about 20 seconds and not much greater than 1 hour, due to the containment present.
10.5.8.7 For a 36 m diameter pool fire (886 m2 area) the flame drag would be predicted to be 4m in a 2m/s wind, 9m in a 5m/s wind and 14m in a 10 m/s wind. There is a 10m spacing between the pump platform bund and the fence so the off site impact would be around 4m in a 10m/s wind. This would only occur adjacent to the fence next to the pump platform between the PAFF and the EcoPark towards the sea, over around a 25m length of fence, with the wind in a northerly direction, giving an off-site impact area of 100 m2. All other impacts from the flame would be contained within the site.
10.5.8.8 Winds of 10m/s or greater occur about 0.3% of the time, with the wind coming from the north around 0.1% of the time (see H6.9), so the predicted frequency of this impact is 5.8 × 10‑6 × 0.001 = 5.8 × 10‑9 /yr.
10.5.8.9 The impact is based on the EcoPark population density of 3842 /km2 (daytime – 9hrs) and 384 /km2 (night-time – 15hrs) (see Section H8.2). The resulting quantified risk level for off site fatalities from a pump platform fire is:
· Daytime: 0.38 fatalities with a frequency of 2.2×10‑9 /yr.
· Night-time: 0.038 fatalities with a frequency of 3.6×10‑9 /yr.
10.5.8.10 The above estimates are used in the assessment, although in practice they may be pessimistic since people in this area would be expected to be able to escape (see Appendix H6) and the population is likely to be low so close to the PAFF fence.
10.5.8.11 Fire due to drainage to the sea is considered in Section 10.5.9.
10.5.9 Fire on sea due to release through drainage (T8)
10.5.9.1 It is possible that Jet A1 could drain to the sea via the site drainage system for the contained areas or via the storm water drains for the roads and drainage ditch between the two security walls. This could result in a fire on the sea due to a release from the tank farm which could have different impacts. Where this forms part of the impact of a specific scenario (multiple simultaneous tank failure – Section 10.5.11, 10% instantaneous release from the top of the tank – Section 10.5.15, instantaneous release – Section 10.6) it is included with that scenario. However three other initial releases could result in a release through the drainage system which would then be separate from the original release:
· A release in a tank bund.
· A release from the pump platform.
· A release from the pipe areas outside the bund draining via the EVA road.
10.5.9.2 The tank bunds and the pump platform are contained areas and drain to the interceptor via bund drain valves which should normally be closed (opened only to drain accumulated water). Drainage from the EVA road would however drain directly to the storm water drain, without isolation. ESR estimate that bund valves may be left open up to 10% of the time on a site. The large release frequency to the two tank bunds is estimated at 3.2 × 10‑2 /yr (see Section 10.5.7), and for the pump platform is estimated at 1.4 × 10‑2 /yr (see Section 10.5.8). So the total frequency of a large release to the interceptor is 4.6 × 10‑3 /yr.
10.5.9.3 Whilst the interceptor would remove small quantities of Jet A1 released through the drainage system, it is not designed to contain large quantities, which would overflow to the sea. The interceptor has two alarms, high level (HL) and high-high level (HHL) and there is a final “fail safe” remotely operated valve (XV 6001) at the drainage outlet [49]. If the HL is reached an alarm is sent to the control room, the operators can then decide whether to close XV 6001 or not, if they choose not to and the level reaches the HHL then the valve is closed automatically. The volume of Jet A1 in the interceptor at HL is 4.6 m3 and at HHL is approx. 8.9 m3 [49]. Additionally, the 300 mm pipe to the outlet is around 150m long and would contain a further ~10 m3 of liquid upstream of the outlet and provide an additional delay of typically up to 1 minute to close XV 6001 before Jet A1 was discharged to the sea after the interceptor overflowed.
10.5.9.4 A large release from the limited pipework connecting the tank bund to the pump platform could only occur under the site road between the tank and pump platform bunds. It is most likely that a release from this area would drain into the pump platform bund. However, as a cautious approach we consider half of these releases going onto the EVA road where they could drain to the sea via the storm water system. The direct large release frequency to the storm water drain from uncontained areas is estimated at 0.5 × 4.3 × 10‑4 /yr (see Section 10.5.8) = 2.2 × 10‑4 /yr
10.5.9.5 With a 24 hour manned operation including CCTV coverage of the site any large release would be expected to be stopped promptly leading to a minimal release that could be contained within the drainage system. Additionally, manual valves can be used to isolate the tank bunds and the pump platform from the interceptor if they were not already closed and the pipes outside these bunded areas can be isolated at the tanks and pumps, limiting the inventory to release.
10.5.9.6 Allowing for a 5 minute delay in isolation could lead to a maximum discharge of ~100 m3 at the export flow rate. Failure to detect and isolate a large release within about 5 minutes is considered unlikely, but not impossible. In this case, a release of up to 750 m3 is considered, equal to the full export flow rate for half an hour.
10.5.9.7 For releases via the interceptor, failure of immediate isolation is estimated to have a probability of around 0.1 based on the automated system closing the outlet valve XV 6001 before Jet A1 is discharged to the sea. The probability of failure to isolate the flow at the source, at the valve upstream of the interceptor and at the final outlet valve is assessed based on three failures with nominal probabilities of 0.1 for failure to close a valve, but with a common mode failure factor of 0.1, giving an overall failure probability of 0.01. This is expected to be pessimistic.
10.5.9.8 For the releases via the storm water outlet, isolation of the release relies on manual detection only (including CCTV and observation of process instrumentation readings) and isolation at XV 6001. There is some probability of isolation within the time it would take for the release to flow down the drains to the outlet, and this is assigned a probability of 0.5. For isolation within ~5 minutes, we take a typical isolation failure probability of 0.1.
10.5.9.9 This results in two hazardous discharge causes for this scenario:
· A fire due to a release of ~100 m3 of Jet A1 to the sea resulting in a nominal spill area of 10,000 m2 for a minimum thickness of 10mm which is required for flame spread. Based on the average marine population density of 0.15 /ha (Section H8.2), an indicative number of fatalities (not allowing for escape) would be 0.15. The release frequency is estimated as 4.6 × 10‑3 releases per year times immediate isolation failure of 0.1 for releases via the interceptor and 2.2 × 10‑4 releases per year times immediate isolation failure of 0.5 for releases outside the contained areas. The resulting pool fire frequency is obtained by multiplying by the marine ignition probability of 0.008, giving an overall frequency of 4.6 × 10‑6 /yr for 0.15 fatalities or 6.8 × 10‑7 /yr for 1 fatality.
· A fire due to a release of ~750 m3 of Jet A1 to the sea resulting in a nominal spill area of 75,000 m2 for a minimum thickness of 10mm which is required for flame spread. Based on the average marine population density of 0.15 /ha (Section H8.2), an indicative number of fatalities (not allowing for escape) would be 1.1. The release frequency is estimated as 4.3 × 10‑3 releases per year times delayed isolation failure of 0.01 for releases via the interceptor and 2.2 × 10‑4 releases per year times delayed isolation failure of 0.1 for releases outside the contained areas. The resulting pool fire frequency is obtained by multiplying by the marine ignition probability of 0.008, giving an overall frequency of 5.2 × 10‑7 /yr for 1.1 fatalities.
10.5.10 Fire due to instantaneous release from of a tank (T9)
10.5.10.1 The issue of concern to the court of final appeal [2]
was that the previous EIA [1]
did not contain a quantitative risk assessment of an instantaneous release from
a storage tank (see 10.1.3.3).
This issue has therefore been specifically addressed in a separate section
(Section 10.6).
10.5.11 Fire due to multiple tank failure (T10)
10.5.11.2 In the initial development, each bund will contain 4 tanks and will be capable of holding either 195% or 188% of the capacity of the largest tank in each bund [12]. For the final development, each bund will contain 6 tanks and the bund capacities will be 166% and 156% of the capacity of the largest tank for the bunds nearest to the sea and furthest from the sea respectively, with all tanks constructed [12].
10.5.11.3 A release of fuel from up to three tanks would therefore lead to a similar situation as a release from a single tank, except that both tank bunds may become involved in this case. The potential consequences are adequately covered by the bund fire scenario (Section 10.5.7). The frequency would however be expected to be lower. Failure of four or more tanks may lead to overtopping of the bund wall and the flow of Jet A1 within the PAFF and onto the sea.
10.5.11.4 For this scenario to occur, the failures must occur over the same time frame, rather than failures occurring late in a fire incident due to fire impingement after much fuel has been burned off. Also tanks are not expected to fail below the liquid level under external fire attack, due to the cooling effect of the liquid. A large release from the tank itself is estimated to have a frequency of 4.5 × 10‑4 /yr (10.5.7.3), so an independent release from 2 of the 12 tanks (within ~3 days so the release may not have been cleaned up or burnt out) would have a frequency of 12 × 4.5 × 10‑4 × 11 × 4.5 × 10‑4 × 3/365 = 2 × 10‑7 /yr. Combining this with the ignition probability inside the PAFF of 0.004, leads to a bund fire frequency of 9 × 10‑10 /yr involving independent releases from 2 tanks. For 3 out of 12 tanks failing independently, this reduces to 4 × 10‑12 /yr. Clearly multiple independent failures of the tanks will not dominate the frequency of this scenario.
10.5.11.5 The most credible means would be a large release from the connecting pipes while tank valves are open. This is unlikely, since the valves on tanks not receiving or delivering product would normally be closed and, whilst failure to close an open valve may be reasonably common (taken conservatively as 0.1 per demand), the spurious opening of a closed valve is much less common. It is possible that up to three tanks’ valves would be open in service in the event of a large release from the connecting pipe-work, meaning that a fourth tank’s valve would need to be spuriously opened in order for the bund to be over topped. The overall frequency is estimated as follows:
· The frequency of a large release from the pipe-work in one of the bunds is estimated to be 3.2 × 10‑2 /yr (10.5.7.6).
· For failure to isolate multiple tanks the probability for three independent failures would be 0.1 × 0.1 × 0.1 = 0.001. For multiple failures, it is usual to allow a common mode failure factor of 0.1 or lower, so for three tanks’ valves open in service (which is possible) the failure probability would be ~0.01.
· The frequency of one additional valve spuriously opening is based on a frequency of critical spurious valve operation of 0.61 per million hours given in Oreda 2002 (taxonomy 4.3 [50]). For a nominal 3 day period, the probability is estimated as 4.4 × 10‑5 per valve. Given that this would need to be in addition to failing to isolate the three tank valves and that there would only be one valve per tank connected to the same pipework, the probability of spuriously opening one of the other 9 tank valves would be estimated as 4 × 10‑4.
10.5.11.6 Combining these together, the estimated frequency of a release that could overfill the bunds due to a pipework release and multiple tank isolation failures is 3.2 × 10‑2 ×0.01 × 4 × 10‑4 = 1.3 × 10‑7/yr.
10.5.11.7 The release overtopping the bund could flow around the PAFF between the bund and security wall which gives an additional containment volume of around 15,000 m3 to add to the two bund containment volumes of (156%+166%) × 35,000 m3 = 112,700 m3, not allowing for the additional tank failure in each bund [12]. The bund wall is 3.3 m above the tank base, so based on a tank area of 1486m2, a further volume of 1486 × 3.3 × 2 = 9800 m3 would be retained within the additional two tank areas. This gives an overall containment volume of ~137,500 m3, so the excess spill that would be expected to flow to the sea would be 4 × 35,000 – 137,500 = 2,500 m3 in the case of 4 full tanks releasing their entire contents when full.
10.5.11.8 The ignition probability is estimated (see Appendix H5) as 0.004 on the PAFF plus 0.008 on the sea, giving an overall ignition probability of 0.012 and a fire frequency of 1.6 × 10‑9 /yr. Unlike Scenario T14 (10% instantaneous release from the top of a tank), the on-site and off-site fires are treated together due to extent of the fuel spread around the site and no allowance is made for closing the storm water outlet.
10.5.11.9 Offsite fatalities would be predicted to come from the spill to the sea, resulting in a nominal spill area of 250,000 m2 for a minimum thickness of 10mm which is required for flame spread for the final development case. Based on the average marine population density of 0.15 /ha (Section H8.2), an indicative number of fatalities (not allowing for escape) would be 3.75.
10.5.11.10 A fire covering the tank bund(s) and also the EVA road would be 10m from the public access areas outside the site boundary and, in unfavourable wind conditions, the flame drag could lead to fatalities off-site. The pool fire is modelled as 160 m diameter (20m larger than the bund fire to account for the road), and the resulting estimates of flame drag are 18m (8m offsite) in a 5 m/s wind and 38m (28m offsite) in a 10 m/s wind. At lower wind speeds, the flame drag is expected to cover less than the distance to the site fence and people would be predicted to escape unless directly impinged by flame.
10.5.11.11 In high wind speed conditions (10m/s, occurring 0.3% of the time (see H6.9)), the flame drag may extend about 28m over the fence. This could lead to the potential for fatalities over an area of ~5600 m2, along ~200m outside the PAFF. With the identified wind direction at high wind speeds (15-45o, Section H6.9) this would be over the EcoPark area between the PAFF and the sea or the PAFF pump platform area for the bund closest to the sea.
10.5.11.12 For a 5 m/s/ wind speed (occurring 21.1% of the time (see H6.9)), the flame drag may extend about 10m over the fence. This could lead to the potential for fatalities over an area of ~2000 m2, outside the PAFF.
10.5.11.13 Although any people in this area would be expected to be able to escape (see Appendix H6), we conservatively assess the impact based on the EcoPark population density of 3842 /km2 (daytime – 9hrs) and 384 /km2 (night-time – 15hrs) (see Section H8.2. The population on the access road is lower (530 /km2) so this is conservative. The resulting quantified risk levels (including the on-sea fatalities) are therefore:
Table 10.42: Scenario T10 (Multiple Tank Failure) Risks – Final Development
|
Conditions |
Frequency (/yr) |
Fatalities |
|
|
Day/night |
Low wind |
1.3 × 10‑9 |
3.75 |
|
Daytime |
5 m/s wind |
1.3 × 10‑10 |
11.4 |
|
10 m/s wind |
2 × 10‑12 |
25.3 |
|
|
Night-time |
5 m/s wind |
2.1 × 10‑10 |
4.5 |
|
10 m/s wind |
3 × 10‑12 |
5.9 |
|
10.5.11.14 The above estimates are used in the assessment, although in practice they may be pessimistic due to the slow flame spread and the ability to escape.
10.5.11.15 For the initial development case, a further 9800 m3 could be retained within each of the bunds due to the absence of two tanks, leading to retention of the entire spill within the bunds on site for a 4 tank release. The effects are therefore limited to a bund fire which is assessed under Scenario T6 (Section 10.5.7). Given that, the tanks are expected to be full 40% of the time and being filled or emptied 20% of the time (See Section H3.7), the average expected total storage on site with 8 tanks present is only expected to be equivalent to 4 full tanks, so no additional consequence is assessed for this case. The associated event frequency is 9 × 10‑10 /yr (a valve on 1 out of 5 additional tanks needs to spuriously open rather than 1 out of 9 for the final development), which is insignificant compared to the bund fire frequency considered for Scenario T6 (Section 10.5.7).
10.5.12.1 A boilover is a potentially hazardous scenario which can occur late in a tank fire incident and result in flaming liquid being ejected from the tank over large areas. However, this phenomenon has never been observed in a fuel as light as Jet A1 and boilover is not relevant to the storage of aviation fuel in the tanks at the PAFF. The cause of a boilover is usually associated with heavy hot residues from combustion of wide boiling range mixtures sinking below the surface and encountering a water layer or other more volatile oil layer. The cause of boilover is therefore not relevant to light refined product storage at all unless there is a significant level of water in the storage tanks. Even with significant quantities of water present, the lower viscosity and narrower boiling range of Jet A1 would mean that such an incident would be very much less dramatic than for crude oil or fuel oil. Even if such an event were to occur at the PAFF it would result in a “froth over” into the bund rather than the long range hazards associated with an explosive boilover and would occur many hours or days into a tank fire incident. During normal operation, there will not be a significant level of water because specific provision is made in the tank design via a sump and siphon pipe to remove water [14]. The term slopover is also sometimes used synonymously with boilover, or for a less violent event when firewater is applied to the surface of a burning tank fire. As the applied water sinks into the hot heavy oil layer, that can form at the surface of a burning wide boiling range mixture such as crude oil, it vaporises and entrains burning oil in the process. Even with the addition of firewater as part of fire fighting efforts, ESR are not aware of any case in which such an event was a significant part of the accident progression of a fire on an aviation fuel tank. Nonetheless, the fire service should be aware that some fuel could slop over the tank top into the bund during a tank head fire incident and response distances should be planned accordingly.
10.5.12.2 The additional hazard from this type of event for the PAFF is assessed as leading to zero off-site fatalities. The frequency would be significantly lower than the tank fire frequency and all resulting consequences are represented within the bund and tank fire frequencies.
10.5.13 Fire due to release from top of tank due to overfilling (T12)
10.5.13.1 Overfilling of atmospheric pressure storage tanks has occurred on
many occasions in the past, including the recent major incident initiated by
overfilling of a gasoline tank at Buncefield in the
10.5.13.2 The maximum flow rate into a PAFF tank is 3,500 m3 /hr from an 80,000 dwt vessel. The full contents of the vessel could easily overfill the tank and the total time for filling an empty tank will be 10 hours or more. Control will be available to shut off the supply both at the PAFF control room and at the vessel.
10.5.13.3 The PAFF tanks will include a servo level gauge or suitably reviewed radar level gauge and a high-high level gauge on a separate nozzle [14]. Emergency shutdown valves will be provided on the pipelines from the jetty [14] and the site will be manned 24 hours per day.
10.5.13.4 The PAFF tanks have similar instrumentation present to many other tanks. In the event that overfilling occurs, the excess Jet A1 would discharge through the tank vents and/or through the frangible shell to roof seam. The fuel would flow down the tank walls, possibly generating some local fuel aerosol, but would not be expected to generate any significant flammable vapour cloud. The most likely outcome is a release which is retained within the bund, and this is covered adequately within the quantification of the bund fire scenario (see Section 10.5.7).
10.5.13.5 A cross section of the tank, the bund wall and the boundary fence is shown in Figure 10.2. The tank height is 24.7 m and its diameter is 43.5 m. The distance from the nearest tank shell to bund wall is 10m. The height of the proposed bund wall is 4.8m with respect to the bund floor and includes a wave deflector. The site roads around the bund wall (which form the general site area) are raised to about 3.2 m with respect to the bund floor, i.e. the bund wall is not free standing but will act as a retaining wall. A security wall (of breeze block type) 2m high from road level is provided at the far side of the road (8.5 m away), which will act as a secondary containment in the event of overtopping of the bund. The roads around the tank bund will be provided with storm water drains, which will collect any liquid overtopping the bund. A further 4 m beyond this security wall is a further impervious security wall ~2.4m high before a 1.5 m landscaped bund planted with trees and the site fence. A drainage ditch with a sloping catchment will be provided in the 4m strip between the security wall and the further impervious security wall to trap any liquid splashed over the first security wall and the gate. This ditch will be designed to handle 35 m3 of liquid and will discharge via a drainage outlet in the sea wall to the sea. Also, the security gate will be provided with a 1m ramp as well as a leak tight seal at the bottom of the gate up to the first hinge to contain any spill within the site.
10.5.13.6 For overfilling, the maximum discharge rate at the top of the tank will be 3,500 m3 /hr. Although some fragmentation may occur and some splashing of the liquid impacting on the bund floor may occur over the bund wall, this would be expected to be retained within the inner site road. It is highly unlikely that any significant quantities of liquid would splash over the security wall as well and any that did would be expected to be retained within the storm water drains.
10.5.13.7 The storm water drain consists of a 750mm diameter pipe and is designed to discharge more than 1000 m3/hr (~30% of the total overfilling flow). This is double the proportion of the tank contents identified as potentially measured between the primary and tertiary walls in any of the instantaneous release experiments conducted (see Section 10.6.7) so the storm drain would easily handle any flow due to splashing over the bund and security wall from a tank overfilling incident.
10.5.13.8 The incident could release a small volume of Jet A1 to the sea via the drains and lead to a possible fire or a bund fire. The quantification of these incidents is covered in Sections 10.5.7 and 10.5.9.
10.5.14 Vapour cloud explosion / flash fire (T13)
10.5.14.1 Vapour cloud explosions and flash fires are not normally considered
in a risk assessment for storage of Jet A1 since it is stored below its flash
point. However, a recent incident on a tank farm storing Jet A1 as well as
gasoline and diesel at Buncefield in the
10.5.14.2 The incident involved overfilling of a gasoline tank resulting in a large flow of gasoline down the side of the tank. The vapour cloud is understood to have formed due to fragmentation of the flow into droplets and the increased evaporation of the lighter components as a result (H4.8.1.8).
10.5.14.3 There are a number of important differences between the storage of Jet A1 at the PAFF and the overflow of gasoline at Buncefield that started the incident:
· The fuel released was gasoline containing about 10% butane and having a vapour pressure close to 100 kPa. This may be compared to the vapour pressure of Jet A1 of <0.1 kPa at 20oC (see section 10.2.1); the fuel released at Buncefield would produce a mixture greatly above the lower flammability limit whilst Jet A1 at the PAFF would produce a mixture well below the lower flammability limit. An overflow of Jet A1 could not therefore support the generation of a flammable vapour cloud in the same way as the overflow of gasoline at Buncefield.
· The weather conditions were calm, cold and stable which would promote flammable gas dispersion over longer distances. These conditions are unlikely at the PAFF.
· A water/ice mist was formed due to the evaporative cooling from the gasoline vaporisation and the high humidity (~99% RH) and low temperature (~0oC). This may have enhanced the explosion overpressure. These conditions are reasonably common around Buncefield, but not applicable at the PAFF.
· Ignition of the vapour cloud probably occurred within a building, which may have enhanced the overpressure. Formation of a significant flammable vapour cloud in the open and its ingress into a building at flammable levels would not occur with Jet A1 at the PAFF (heating of Jet A1 liquid within a furnace and its ignition is possible but would not provide a flammable cloud outside to propagate the explosion).
10.5.14.4 The first factor identified is the most important to the applicability of this type of incident to the PAFF. The gasoline released at Buncefield is capable of forming a flammable vapour cloud that could drift over some distance and be ignited. Jet A1 stored at the PAFF would not form a flammable vapour cloud under the same release from the top of the tank. Some spray may be formed that could burn, but no flammable cloud would be formed that could drift off site.
10.5.14.5 The frequency of a vapour cloud explosion for the PAFF is therefore assessed as zero and the off-site fatalities from such an event are also assessed as zero for Jet A1 in the circumstances at the PAFF.
10.5.15 Fire due to 10% instantaneous release from the top of a tank (T14)
10.5.15.1 Consistent with the previous EIA [1], a scenario involving a release of ~10% of the tank contents due to failure of the top most plates of the tank, causing splashing of liquid over the bund wall, is evaluated here. The causes of the scenario are identified as due to a fire or explosion failing the weak shell to roof seam, which may also fail the top most plates of the tank. The assessment here has been updated from the previous EIA [1] to allow for changes to the PAFF design.
10.5.15.2 The PAFF bunds are designed to hold more that 110% of the largest tank capacity (see 10.1.4.7). The drain valve from the bund is normally kept closed and releases of spills in bunded areas to sea directly via the site drainage system are considered separately in Scenario T8 (Section 10.5.9).
10.5.15.3 A tank head fire/explosion frequency of 1.2 × 10‑4 /yr per tank is identified in Section 10.5.3, and a frequency of 6.6 × 10‑6 /yr per tank was identified for this 10% release scenario in the previous EIA [1]. This is consistent with approximately 5% of the tank explosion/head fire incidents resulting in a 10% release from the top of the tank, which is not unreasonable. The frequency of this scenario is therefore taken as 6.6 × 10‑6 /yr per tank, consistent with the previous EIA [1].
10.5.15.4 A cross section of the tank, the bund wall and the boundary fence is shown in Figure 10.2. The tank height is 24.7 m and its diameter is 43.5 m. The distance from the nearest tank shell to bund wall is 10m. The height of the bund wall is 4.8 m with respect to the bund floor and the bund floor is sunken by 3.2 m relative to the surrounding site roads, so two thirds of the bund wall is a retaining wall below the surrounding ground level. A security wall 2 m high from road level is provided at 8.5 m from the bund wall, which will act as a secondary containment in the event of overtopping of the bund. The roads around the tank bund will be provided with storm water drains, which will collect any liquid overtopping the bund. There is a further separation of 4 m beyond the security wall to a further security wall, and a further 6 m, incorporating a 1.5 m high landscape bund planted with trees, to the boundary fence. A drainage ditch with a sloping catchment will be provided in the 4 m strip between the two security walls to trap any liquid splashed over the security wall and the gate. This ditch will be designed to handle 39 m3 of liquid over a 100 m length and will be connected to the storm water drains, which discharge to the sea. The security gate will be provided with a 1m ramp as well as a leak tight seal at the bottom of the gate up to the first hinge to contain any spill within the site.
10.5.15.5 A release of ~10% of the tank contents (3,500 m3) from the top of a tank would fall vertically into the bund and form a pool inside the bund an average of 25-35 cm deep. The bund wall will easily contain this static liquid pool. However, vertical momentum from the release of 3,500 m3 at a height of 23 to 26 m above the bund floor could result in splashing of some liquid over the bund wall. This is estimated to be 10% or less of the spilt liquid.
10.5.15.6 The splashed liquid (350 m3) could approximately spread over a 100 m length of the site inner road (of width 8.5 m) to a depth of about 0.4 m which will be contained by the 2 m high security wall and the 1 m ramp provided up to the security gate.
10.5.15.7 Most of the fluid would enter the storm water drain provided on site for the PAFF. The storm water drain is designed to discharge more than 1000 m3/hr. Therefore most of the liquid (assumed as 90% of liquid splashed over the bund, i.e. 315m3) will be drained to the sea through the storm water drains provided for the inner road.
10.5.15.8 Some portion of the liquid splashed over the bund on to the inner road (assumed to be 10%, i.e. 35 m3) may further splash over the security wall and the gate over a length of about 100 m along the security wall. This will enter the drainage ditch which is also connected to the storm water drains that discharge to the sea.
10.5.15.9 Based on the above, it can be seen that the structural integrity of the bund, security wall and the security gate will not be compromised since the quantity splashing over the bund is limited to 350m3 (due to the water fall effect rather than a tidal wave). Furthermore, this splashed liquid will drain into the sea through the storm water drains on the site inner road and through the gulley between the security walls. Due to these specific drainage arrangements on site, the liquid spill from this scenario is expected to be well contained within the site boundary and not extend off-site on land.
10.5.15.10 Ignition of the spill could result in a pool fire, both within the PAFF and on the sea. The liquid (total of 350 m3) draining to the sea through the storm water drain on the site inner road and the drain gulley along the security wall is modelled as a continuous release on sea over a duration of 20 minutes (245 kg/s) (see Section H2.3), giving a pool fire area on the sea of 4622 m2 (nominal diameter 77 m). Based on a maximum marine population density of 0.15 /ha (Section H8.2) this event gives 0.069 fatalities.
10.5.15.11 There is an isolation valve on the storm water outlet (XV 6001) which would contain the release to the PAFF if closed. The pipe to the storm water outlet will provide a hold-up of 1 minute or more to close XV 6001 before Jet A1 is discharged to the sea. The site is manned 24 hours per day and the event should be obvious to the operators, however, the storm water outlet may not be an obvious first priority. The probability that the storm water outlet is not isolated before Jet A1 starts flowing to the sea is therefore assigned a cautious probability of 0.5.
10.5.15.12 The ignition probability is estimated (see Appendix H5) as 0.008 on the sea, giving an overall frequency of the pool fire event on the sea of 2.1 × 10‑7 /yr for the initial development (8 tanks) and 3.2 × 10‑7 /yr for the final development (12 tanks), each resulting in 0.069 fatalities (i.e. a single fatality with a frequency of 2.2 × 10‑8 /yr for the final development case).
10.5.15.13 The spill on site is treated separately, with an on-site ignition probability of 0.004 (see Appendix H5), giving an on site fire due to this scenario with a frequency of 2.1 × 10‑7 /yr for the initial development (8 tanks) and 3.2 × 10‑7 /yr for the final development (12 tanks).
10.5.15.14 A fire covering the tank bund(s) and also the EVA road would be 10m from the public access areas outside the site boundary and in unfavourable wind conditions, the flame drag could lead to fatalities off-site. The pool fire is modelled as 160 m diameter (20m larger than the bund fire to account for the road), and the resulting estimates of flame drag are 18m (8m offsite) in a 5 m/s wind and 38m (28m offsite) in a 10 m/s wind. At lower wind speeds, the flame drag is expected to cover less than the distance to the site fence and people would be predicted to escape unless directly impinged by flame.
10.5.15.15 In high wind speed conditions (10m/s, occurring 0.3% of the time (see H6.9)), the flame drag may extend about 28m over the fence. This could lead to the potential for fatalities over an area of ~4480 m2, outside the PAFF. With the identified wind direction at high wind speeds (15-45o, Section H6.9) this would be over the EcoPark area between the PAFF and the sea or the PAFF pump platform area for the bund closest to the sea.
10.5.15.16 For a 5 m/s/ wind speed (occurring 21.1% of the time(see H6.9)), the flame drag may extend about 10m over the fence. This could lead to the potential for fatalities over an area of ~1600 m2, outside the PAFF.
10.5.15.17 Although any people in this area would be expected to be able to escape (see Appendix H6), we conservatively assess the impact based on the EcoPark population density of 3842 /km2 (daytime – 9hrs) and 384 /km2 (night-time – 15hrs) (see Section H8.2). The population on the access road is lower so this is conservative. The resulting quantified risk levels from a fire on the bund and EVA road are:
Table 10.43: Summary of Risks for Scenario T14
|
|
Frequency (/yr) |
Fatalities |
||
|
Conditions |
Initial Development |
Final Development |
||
|
Daytime |
5 m/s |
1.67 × 10‑8 |
2.49 × 10‑8 |
6.1 |
|
10 m/s |
2.38 × 10‑10 |
3.56 × 10‑10 |
17.2 |
|
|
Night-time |
5 m/s |
2.77 × 10‑8 |
4.16 × 10‑8 |
0.6 |
|
10 m/s |
3.96 × 10‑10 |
5.94 × 10‑10 |
1.7 |
|
10.5.15.18 The above estimates are used in the assessment, although in practice they may be pessimistic due to the slow flame spread and the ability to escape.
10.6 Instantaneous Tank Wall Failure and Subsequent Fire (T9)
10.6.1.1 The issue of concern to the Court of Final Appeal [2]
was that the previous EIA [1]
did not contain a quantitative risk assessment of a 100% instantaneous release
from a storage tank (see 10.1.3.3).
The issue of instantaneous, or near instantaneous, releases from storage tanks
with a range of fill levels is specifically addressed here.
10.6.1.3 The failures of concern in this section are therefore restricted to a sudden unzipping of the tank due to the rapid propagation of a crack, or an incident capable of directly resulting in rapid loss of the tank wall or a major part of it.
10.6.1.4 The failures considered are sub-divided as follows, based on the different potential impacts:
|
· T9As |
Instantaneous release from bottom seam failure with tank 90-100% full |
|
· T9Bs |
Instantaneous release from bottom seam failure with tank 60-90% full |
|
· T9Cs |
Instantaneous release from bottom seam failure with tank 35-60% full |
|
· T9Ds |
Instantaneous release from bottom seam failure with tank <35% full |
|
· T9Az |
Instantaneous release from tank unzipping with tank 90-100% full |
|
· T9Bz |
Instantaneous release from tank unzipping with tank 60-90% full |
|
· T9Cz |
Instantaneous release from tank unzipping with tank 35-60% full |
|
· T9Dz |
Instantaneous release from tank unzipping with tank <35% full |
|
· T9Aa |
Instantaneous release due to aircraft impact with tank 90-100% full |
|
· T9Ba |
Instantaneous release due to aircraft impact with tank 60-90% full |
|
· T9Ca |
Instantaneous release due to aircraft impact with tank 35-60% full |
|
· T9Da |
Instantaneous release due to aircraft impact with tank <35% full |
10.6.2.1 The failure causes identified from the incidents in Appendix H4 are summarised below together with a comment on their applicability to instantaneous failure of a generic tank with generic contents in a generic location:
Table 10.44: Applicability of Failure Causes Identified to Instantaneous Failures
|
Failure Cause |
Applicability
to Instantaneous Failure of Generic Tank |
|
1. Brittle fracture/mechanical failure of tank material/weld |
Yes - addressed in API 650 |
|
2. Defective welds due to poor construction |
Yes - addressed in API 650 |
|
3. Corrosion |
No - holes too small unless associated with brittle failure |
|
4. Internal explosion resulting in failure of shell to base seam and tank “rocketing” |
Yes - addressed in API 650 |
|
5. Internal overpressure resulting in failure of shell to base seam |
Potentially but not for vented tank such as the PAFF tanks |
|
6. Overfilling |
No - limited flow |
|
7. Snow loading |
No - pipe or roof failure |
|
8. Valves left open |
No - flow too small |
|
9. External fire attack |
No - failure occurs late in incident after evacuation |
|
10. Natural causes such as earthquake |
Yes - may not give instantaneous failure |
|
11. External causes such as vandalism, sabotage, terrorist attack, acts of war. |
Possible for some types of tank. |
|
12. Aircraft impact. |
Yes – although the PAFF is not located adjacent to the airport or flight path. |
10.6.2.3 The incidents that have been identified are reviewed in Appendix H4 to evaluate whether they are relevant to an instantaneous release from a storage tank (but not necessarily the PAFF tanks). Those identified as potentially relevant are considered further in Appendix H3, Section H3.2 and include only brittle mechanical failures (Cause 1), internal explosions resulting in failure of the shell to base seam and rocketing of the tank (Cause 4), and earthquake (Cause 10).
10.6.2.4 The applicability to the PAFF tanks of the causes potentially applicable to an instantaneous failure of a generic tank is considered below. The causes considered are: brittle failure (Cause 1), defective welds (Cause 2), internal explosion (Cause 4), earthquake (Cause 10) and external causes including sabotage/terrorist attack (Cause 11) and aircraft impact (Cause 12).
Brittle Material Failure
10.6.2.6 Design standards have been improved to avoid these types of failure
occurring in future. The PAFF tanks will be designed to API 650, in line with
current practice, which requires that tanks are manufactured from materials
designed to avoid brittle fracture [16].
Even without this, brittle fracture would be extremely unlikely in
10.6.2.8 Low temperature embrittlement is not considered a relevant failure mechanism for the PAFF tanks.
10.6.2.9 A number of recent failures have been reported by EPA in fertiliser solution tanks caused by weld failure [51]. The failures involved two specific tank manufacturers, liquids with significantly different characteristics to Jet A1, and were not built to the same standards as the PAFF tanks (see Appendix H4 Section H4.7). To avoid future failures, constructing tanks to API 650 and API 653 was recommended (both standards applying to the PAFF tanks [16]).
10.6.2.10 A number of other failure causes in Appendix H4 are simply identified as mechanical failure or unknown. These failures could also have been caused by defects but there is also no information that these incidents had resulted in near-instantaneous failures.
10.6.2.11 Whilst all welds will contain defects, only large, out of tolerance defects could have a significant impact on the structural integrity of the tank. Welding procedures and inspections, in particular those in API 650 relevant to the PAFF, are designed to ensure that out of tolerance defects are avoided. The safeguards are summarised in the Affirmation of The PAFF Contractor [16] as follows, “the welding procedures in API 650 are designed to ensure that there are no out of tolerance defects in the weld, such as voids, inclusions, lack of fusion of the welded metal with the metal being joined or cracks. No weld is to be performed upon the tank unless it is to a specified welding procedure. Welds are radiographed in accordance with API 650 to confirm that the welds produced are sound. The welder qualification tests include testing of welded joints undertaken by the welder to show that the welds meet or exceed the specified requirements, which include any propensity to brittle fracture. All welding personnel are required to be qualified and to demonstrate that they can weld satisfactorily to the relevant welding procedure.”
10.6.2.12 The improved welding procedures, compared to cases where weld defects have caused failures, greatly reduce the chance of any weld defect causing a major failure in one of the PAFF tanks. Since the material of the PAFF tanks will behave in a ductile manner a very large continuous defect would be required in the welds to cause an instantaneous failure. This would be very difficult to miss in the radiographic testing and would be unlikely to survive the prescribed hydrotest (see Paragraph 10.6.2.7). The welds between the plates in the PAFF tank wall are also staggered [14], so a continuous vertical weld is not present - to follow the weld, a crack would need also to propagate horizontally which is less likely because the applied stresses are lower.
10.6.2.13 A number of incidents are reported (see Appendix H4) where an explosion has occurred in the vapour space within the tank resulting in the failure of the shell to floor seam of a tank and the tank “rocketing”. This scenario results in the near-instantaneous removal of the tank shell as modelled in physical model Test A (see Section 10.6.7).
10.6.2.14 Tanks built to API 650 include a weak shell to roof connection that is designed to fail in the event of an overpressure within the tank. If the shell to roof seam fails, rather than the shell to floor seam, then the Jet A1 will be retained. This feature is confirmed in the Affirmation of the PAFF Contractor [16]. In older tanks, without this feature, it was possible for the shell to floor seam to be weakened by corrosion such that it would fail before the shell to roof seam, particularly if the tank contents included a corrosive water layer at the bottom, or water was retained around the joint externally. Jet A1 product delivered to the PAFF should not contain significant water and the PAFF tanks are elevated above the floor of the bund, which assists external drainage. A failure of the wall or shell to floor seam would therefore be highly unlikely for one of the PAFF tanks if an explosion occurred in the vapour space.
10.6.2.15 API 650 covers installations where tanks will contain liquids above their flash points and where a flammable mixture is likely to be present in the vapour space. The bulk vapour within the PAFF tanks will not be in the flammable range because the Jet A1 is stored below its flash point and so cannot normally be ignited. Therefore, the storage of Jet A1 at the PAFF will represent a significantly lower risk of an internal explosion than for the average API 650 tank population.
Natural Hazards – Earthquake, Typhoon, Flooding, Lightning, Subsidence, Landslide,
Tsunami
10.6.2.17 Within the incident data reviewed in Appendix H4 only two
catastrophic tank failures due to earthquake are noted. One (US 1978) simply
refers to three tanks failing catastrophically in an earthquake. In the other (
10.6.2.18 Information supplied to ESR, provides that the inferred rate of
earthquake activity in the vicinity of Hong Kong is considered similar to that
of areas of Central Europe and the Eastern areas of the
10.6.2.19 A further point of comparison is that nuclear installations and LNG storage tanks, both representing a far higher hazard than Jet A1 on loss of containment, are generally designed to a safe shutdown earthquake (SSE - no loss of containment) with a recurrence period of 10,000 years (i.e. a frequency ~10‑4 /yr). The historical experience for storage tanks suggests that the catastrophic failure frequency due to earthquakes is much lower than this criterion.
10.6.2.20 Catastrophic failure of one of the PAFF tanks is not impossible in a large enough earthquake. Lesser failures in an earthquake do not represent instantaneous failures and are therefore included within the analysis of other releases and fires on the PAFF site (e.g. sections 10.5.7 and 10.5.8). There remains a small possibility that an earthquake could lead to an instantaneous failure of the tank, but this would be at a much lower frequency than indicated by the two earthquake failures reviewed in Appendix H4. Also, from ESR’s experience, the magnitude of the ground acceleration would need to be sufficient that the level of damage elsewhere in the vicinity would also be massive.
10.6.2.21 The design basis for the PAFF tanks [14] includes typhoon
conditions, lightning protection standards and an extended (12 week) hydrotest
to monitor settlement of the ground. Lightning may result in ignition of a vent
(Section 10.5.2)
or vapour space (Section 10.5.3
and 10.6.2.16).
The PAFF tanks will be built on reclaimed land which has had time for initial
settlement to occur. The immediate surroundings are flat, and the
10.6.2.22 The historical experience for tanks of similar, or weaker, design to the PAFF tanks (see Section 10.6.3) is sufficiently large to have confidence that any significant susceptibility to natural hazards would already have been seen in the historical population. For designs where much less relevant experience is available, or novel design changes have been made, a mechanistic assessment may be appropriate for each cause (e.g. for LNG tank designs [53]) to ensure that important failure modes have not occurred historically have not been missed. However, this is not the case for the PAFF tanks and all of these potential natural causes of instantaneous failures (or lesser failures) are adequately covered within the assessment of frequency based on historical experience.
External
Causes – Vandalism, Sabotage, Terrorist Attack, Acts of War
10.6.2.23 Any facility may be the subject of vandalism, sabotage or terrorism. The PAFF has a number of security measures to limit the chances of this occurring: “PAFF will be contained with a double perimeter security fence with intruder detection and is monitored by remotely operated TV cameras. The facility will be manned 24 hours per day 7 days per week. The security measures will, as far as practical, preclude the possibility of vandalism and sabotage.” [16].
10.6.2.24 The PAFF tank walls are not brittle and the Jet A1 vapour within the tank is not within the flammable range, so there is no mechanism to lead to an instantaneous failure of the tank if it is attacked with explosives, for example. Such an attack may well be able to generate a large hole in the tank or fail a connection that could lead to a large release and fire inside the bund - this is covered elsewhere (see Section 10.5.7). ESR are not aware of any instantaneous failures of this type of tank initiated by terrorist attack and the frequency of these external causes is considered adequately represented within the historical failure frequencies identified.
Aircraft Impact
10.6.2.25 One of the identified potential hazards associated with the PAFF is fire/explosion following an aircraft crash onto the facility. The PAFF is located on reclaimed land in the New Territories (see Figure 3.1) over 5 km north of the nearest airport runway, and well away from the standard flight paths, which take into account the hilly terrain behind the PAFF.
10.6.2.26
In the event that an aircraft
crashed onto the PAFF, the number of tanks affected would depend on the
dimensions of the aircraft relative to the facility area (234.65m ´ 278m),
the impact point and whether the aircraft had significant horizontal momentum
at the time of impact. The types of aircraft using
10.6.2.27 The impact may also lead to further releases of aviation fuel and escalation of a bund fire to include all of the PAFF tanks. However, the frequency associated with this is significantly lower than for the major bund fire itself, so the effect considered is that of an instantaneous failure of a PAFF tank. The failure is taken as a complete loss of the tank wall, rather than an unzipping failure, since the impacting aircraft would cross the tank diameter in a much shorter time than the fuel would take to be released.
10.6.2.28 The aircraft may also cause damage to the bund wall, but there are two further security walls to retain a release and 2/3 of the PAFF bund is below the road level (see Figure 10.2). Given the bund capacities of 166% and 156% (Paragraph 10.1.4.7), the full contents of one tank could still be retained with the above grade wall badly damaged so no further effects of bund wall failure are considered beyond the overtopping due to the assumed instantaneous failure.
10.6.2.29 It is clear that catastrophic failures of tanks have occurred, resulting in either complete removal of the tank wall when the tank rockets due to an explosion in the vapour space, or an “unzipping” due to rapid brittle fracture initiated at a defect. Failures have also occurred in earthquakes, although probably not instantaneously.
10.6.2.30 The brittle failures and rocketing of tanks due to internal explosions have all occurred in older tanks and design standards have improved, largely in response to these types of failures. In particular tanks designed to API 650, such as the PAFF tanks: are manufactured from materials designed to avoid brittle fracture; include welding procedures, radiographic inspection and qualification of welders to avoid out of tolerance defects; and include a frangible shell to roof seam to relieve overpressure by failing the top of the tank rather than the bottom [16].
10.6.2.31 None of the instantaneous failures identified from historical records are directly applicable to tanks designed and operated in an equivalent way to the PAFF tanks (see Appendix H3). Nonetheless, instantaneous failure of a tank is not completely impossible and is assessed further, including the possibility of aircraft impact.
10.6.3 Frequency of Instantaneous Tank Failure
10.6.3.1 Historical data relating to catastrophic tank failures is reviewed in Appendix H4. Tank failures termed “catastrophic” may include failures releasing liquid slowly into a bund as well as instantaneous failures. Even very major failures involving a 1m high failure at the base of one of the PAFF tanks would not result in major flows outside the PAFF boundary (see Section 10.6.7). It is therefore important to differentiate the instantaneous release scenario from other “catastrophic” failures that may be included in catastrophic failure frequencies cited in the literature.
10.6.3.2 Estimates of numbers of applicable failures, tank populations and the period over which they apply have therefore been made, to derive the failure frequency directly. These are discussed in detail in Appendix H3.
10.6.3.3 Based on a review of the incidents identified in Appendix H4 there are no historical incidents relevant to an instantaneous failure of a PAFF tank. For the cautious best estimate, a number of incidents of 0.35 is taken corresponding to a 30% chance of not having seen such an incident in the experience period (see Section H3.5).
10.6.3.4 For a lower estimate, we take a nominal estimate of 0.1 incidents corresponding to 90% chance of not having seen such an incident in the experience period. For the upper estimate, we assume that the additional factors and safeguards identified above have a 20% chance of failure (a high figure for human error), giving approximately 2 incidents in the experience period.
10.6.3.5 The relevant tank population to which the incidents refer is discussed in Appendix H3 section H3.4. The estimates are summarised below.
Table 10.45: Tank Population Estimates
|
Estimate |
Tanks |
Basis |
|
Lower Estimate* |
2,400,000 |
Prokop [54] times 4 based on US having ¼ of world oil consumption |
|
Cautious Best Estimate |
2,400,000 |
|
|
Upper Estimate* |
6,000,000 |
Prokop [54] times 10 based on US having 10% of world oil production |
|
* Note lower and upper estimates are reversed in the calculation of failure frequency |
||
10.6.3.6 The failures in Section H3.2 and Appendix H4 cover a period from 1924 to 2000 (i.e. 77 years), however, incident reporting is likely to have been more reliable since around 1970. 30 years is therefore taken as the cautious best estimate for the experience period. A number of incidents are recorded in the 1970’s, so it would be unreasonable to take a period of less than 30 years, so this is also taken as a lower limit.
10.6.3.7 Upper and lower estimates of the instantaneous release frequency for a PAFF tank are summarised below:
Table 10.46: Estimates of Instantaneous Release Frequency for PAFF Tanks
|
Data Applicable to PAFF tank |
Lower
Estimate* |
Cautious Best
Estimate |
Upper
Estimate* |
|
|
Tank Population (A) * |
6,000,000 |
2,400,000 |
2,400,000 |
|
|
Applicable experience years (B) * |
77 |
30 |
30 |
|
|
Applicable number of incidents (C) |
0.1 |
0.35 |
2 |
|
|
Instantaneous release frequency per PAFF tank year (C/A/B) |
2 × 10‑10 |
5 × 10‑9 |
3 × 10‑8 |
|
|
* |
Note lower and upper estimates for tank population and experience years are reversed in the calculation of failure frequency. |
|||
10.6.3.8 It is appropriate that the estimates for the instantaneous release frequency are all less than estimated by Davies/Wilkinson/Prokop ([46], [55], [54]) since the Davies/Wilkinson/Prokop estimate makes no allowance for improvements in tank design or for the specific characteristics of the PAFF tanks, which make them much less likely to experience brittle failure or failure of the floor to shell joint due to an internal explosion than an average atmospheric storage tank.
10.6.3.9 Other, higher, estimates (see Section H3.3) identified for catastrophic failure frequencies were not made specifically for the instantaneous release scenario on this type of tank and are not appropriate to use directly in this analysis.
10.6.3.10 Based on the data in Section H3.2, approximately half of the failures (5 out of 11) involved failures of the shell to bottom seam and the other half involved an unzipping scenario. The instantaneous release scenarios for the PAFF tanks are therefore divided equally between these two cases.
10.6.3.11 No incidents in which an aircraft impact leads to an instantaneous failure of a large tank, or any failure considered as catastrophic, are noted in the data reviewed in Appendix H4. However, the predicted aircraft impact frequency has been separately assessed. An instantaneous failure of one of the tanks is assessed to have a frequency of 2.5×10‑11 /yr (initial development) and 4.5×10‑11 /yr (final development), based on differing numbers of aircraft movements in 2016 and 2040 (see Appendix H3, Section H3.6). This is treated separately from the instantaneous failure above, since the aircraft impact is also assumed to result in ignition of the release.
10.6.4.1 Four separate fill ranges are considered based on the fill levels predicted to give different spill areas (see Section H7.1). Each tank is estimated to spend ~20% of the time being filled or emptied and the remaining time split between full and nominally empty (a level sufficient to cover the bund floor is still assumed for an empty tank). The proportion of the time at different fill levels is estimated in Section H3.7 and differences in consequences are discussed in Appendix H7. These are summarised below.
Table 10.47: Summary of Probability of Fill Level and Spill Extent for Instantaneous Failures
|
Nominal fill
level |
Probability |
Spill Extent |
|
90%-100% |
42% |
Based on physical model tests A and B for 100% fill level. |
|
60-90% |
6% |
50% of the flow area identified in Test A for bottom seam failure and the results of Test C (80% fill) directly for unzipping. |
|
35-60% |
5% |
Confined to the PAFF tertiary bund. |
|
<35% |
47% |
Confined to the PAFF primary bund. |
10.6.5.1 A number of estimates are available for ignition probabilities;
these are reviewed in Appendix
H5. Most of the available ignition probability estimates apply to the
ignition of a gas cloud that is within its flammable range. At the PAFF, Jet A1
under ambient conditions in
10.6.5.2 The ignition probability in the case of an aircraft impact causing the instantaneous failure is taken as 1.
10.6.6
10.6.6.1 The hazard range is based on the edge of an unconfined pool fire or the edge plus flame drag for a contained (bunded) pool fire (Section 10.2.5). No allowance is made in this assessment for escape from Jet A1 pool fires for people within these areas although a fraction of people may escape before ignition occurs or whilst the flame is spreading across the pool surface since flame spread speeds for Jet A1 are slow (Section H6.3). An escape probability is not included since there are other factors for the releases considered that may make escape more difficult (see Section H6.3).
10.6.7 Effects of an Instantaneous Tank Failure
10.6.7.1 Physical modelling of instantaneous release scenarios for the PAFF tanks have been undertaken at 1/30th scale by HR Wallingford. Figure 10.3 shows a plan view of the physical model layout, identifying the different regions where liquid volumes were measured.
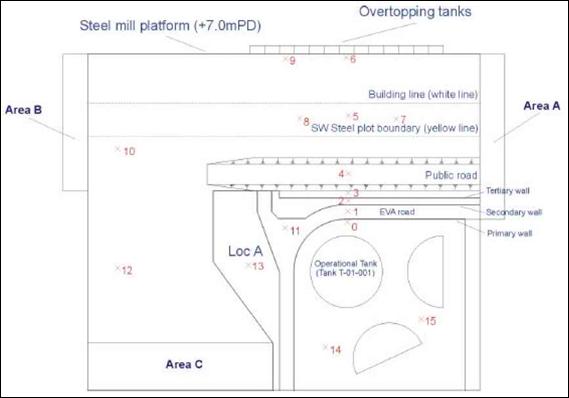
Figure 10.3: Plan Layout of HR Wallingford Tests for instantaneous Releases
10.6.7.2 The following tests were conducted for Tank 001, with unzipping scenarios being directed towards the bund wall adjacent to SWS.
Table 10.48: Summary of Instantaneous Release Experiments
|
Test |
Description |
|
A |
Instantaneous tank removal (100% fill level) |
|
B |
Unzipping (100% fill level) |
|
C |
Unzipping (80% fill level) |
|
D |
Panel failure of 1m high by 10m wide (100% fill level) |
|
E |
Panel failure of 1m high by whole perimeter (100% fill level) |
10.6.7.3 Although tests A to C represent instantaneous release scenarios, for the purposes of evaluating the theoretical potential impact, this does not necessarily mean that such failure scenarios could occur in practice for the PAFF tanks and even the cautious estimates of the likelihood made are extremely remote. Results, in terms of percentages of the initial liquid content of the tank that ended up in different locations, are summarised below.
Table 10.49: Summary Results From Instantaneous Release Experiments
|
Measured Location1 |
|
Percentage of Initial Liquid for Test |
||||
|
Test |
A |
B |
C |
D |
E |
|
|
Retained in primary bund |
75 |
73 |
78 |
98 |
93 |
|
|
Between primary and tertiary wall (Area A2) |
11 |
14 |
14 |
0 |
3 |
|
|
Drainage from EVA Road3 |
1 |
1 |
1 |
1 |
1 |
|
|
Overtopping onto public road & beyond (Area B3) |
5 |
9 |
6.7 |
1 |
2 |
|
|
Overtopping secondary containment towards Sea (Loc A and Area C) |
8 |
0.5 |
0.1 |
0 |
1 |
|
|
Overtopping step within the SWS building |
0 |
2.5 |
0.2 |
0 |
0 |
|
|
1 Locations are defined in Figure 10.3. |
||||||
|
2 These areas drain to the sump marked Area A in Figure 10.3. Area A was included in the physical model to catch the liquid from these areas for measurement. |
||||||
|
3 Area B is a sump included in the physical model to catch liquid for measurement. Less than <2% of the liquid in the sump marked Area B in Figure 10.3 is estimated to be from the EVA Road - 1% is assumed here. The rest is from the overtopping onto the public road & beyond. |
||||||
10.6.7.5 The percentage of liquid retained in the primary bund is similar for tests A and B and it is mainly the direction of the flow that changes between the instantaneous tank removal scenario (Test A) and the unzipping scenario (Test B). Both tests are, however, designed to give worst case results. In the most famous instantaneous failure scenario (Ashland, Floreffe), the tank split open (like Test B), but the tank was also propelled backwards 100 feet off its foundations [54], so the liquid would not have been as well constrained to flow only in the direction of the split. Given the forces involved, any large tank involved in an unzipping scenario is unlikely to constrain the liquid to flow only in the direction of the split as well as modelled in Test B, so Test B represents a conservative assessment of the release.
10.6.7.6 If the fill height of the tank is only 80% (Test C) then the proportion of the release retained within the bund increases a little, but Jet A1 still overtops onto the public road and beyond. The extent of the flow is predicted to be similar (up to the step in the SWS building) but the quantities likely to overtop the step in SWS are more than a factor of ten lower.
10.6.7.7 For fill heights between 35 and 60% (see Section H3.7) the predicted result is a spill contained within the security wall. If this is ignited, the consequences are evaluated based on the assessment for multiple tank failures (Section 10.5.11). For fill heights below 35%, the spill is predicted to be retained within the bund and the consequences are evaluated based on the assessment for a bund fire (Section 10.5.7). The hazard areas, based on flame drag effects, are summarised below:
Table 10.50: Hazard Areas from Instantaneous Release Fires Contained on Site
|
Fill Level |
Wind (m/s) |
35-60% Fill |
<35% Fill |
||
|
Affected Length (m) |
|
200 |
160 |
||
|
Off-site effect distance (m) |
0 |
0 |
0 |
||
|
2 |
0 |
0 |
|||
|
5 |
10 |
0 |
|||
|
10 |
28 |
18 |
|||
|
Time (Day = 9 hrs) |
|
Day |
Night |
Day |
Night |
|
Fatalities |
0 |
3.75 |
3.75 |
0 |
0 |
|
2 |
3.75 |
3.75 |
0 |
0 |
|
|
5 |
11.4 |
4.5 |
0 |
0 |
|
|
10 |
25.3 |
5.9 |
7.7 |
0.77 |
|
10.6.7.8 For all wind speeds for the 35-60% fill level, 3.75 fatalities are on the sea (other). In a 5m/s wind, the fatalities are split in the ratio of the population densities between the EcoPark (3842 /km2) and other areas (public access road with population density 530 /km2); 88% EcoPark, 12% Other. In a 10m/s wind speed the remainder of the effect is always taken to be over the EcoPark due to the wind direction.
10.6.7.9 For instantaneous tank removal (Test A), the liquid flow crosses the SWS plot boundary and impacts on the lorry parking areas and the storage areas within the SWS building. However, it does not lead to liquid overtopping the step within the SWS building.
10.6.7.10 For the unzipping scenario with 100% fill level directed towards SWS (Test B), the liquid flow crosses the SWS plot boundary and impacts on the lorry parking areas and the storage areas within the SWS building. It also results in a fraction of the initial tank contents (2.5%, 875 m3) splashing over the step within the SWS building. For the unzipping scenario at 80% fill level, the spread is reduced and the quantity overtopping the step is reduced to 56 m3. The modelling of the spread of these flows overtopping the step is discussed in Section H7.1.
10.6.7.11 Physical modelling was only performed for Tank 001 with unzipping towards SWS. The extent of the flows from instantaneous failures of other tanks and with unzipping in other directions have been estimated based on interpretation of these results as discussed in Section H7.2.
10.6.7.12 The prediction that the flow could reach a certain location does not mean that this is likely. The individual and societal risk results in Section 10.9 include the frequencies of the spill and ignition to give a more appropriate measure both for comparison with criteria and decision making.
10.6.8.1 Two specific scenarios are considered: the instantaneous removal of the whole tank wall by a failure of the tank floor seam; an unzipping of the tank wall vertically. For each case, a range of tank fill levels are considered based on the potentially different outcomes they may generate. These events are applied to each of the 12 tanks that will be present at the PAFF for the final development and the different potential consequences are evaluated using an event tree. For each tank, the failure frequency is split equally between the two scenarios.
10.6.8.2 The extent of spread for instantaneous tank removal and unzipping are estimated in Appendix H7.
10.6.8.3 Figure 10.4 shows the event tree used for instantaneous wall removal for each tank. The outcomes are dependent on the fill level, whether the release is ignited and (for confined spills) the wind speed. The probability of ignition is evaluated separately, depending on the spill area covered (see Appendix H7) and the different ignition sources present in different directions (see Appendix H5). For unconfined spills, the effect of the wind speed on the actual impact area is within the uncertainty of the spill area.
|
|
Floor
Seam |
Fill
Level |
Ignition |
Wind
speed |
Outcome |
|
|
|
|
|
|
|
|
|
|
|
|
90-100% |
Yes |
|
T9As
– Pool fire |
|
|
|
|
|
No |
|
Unignited |
|
|
|
|
60-90% |
Yes |
|
T9Bs
– Pool fire |
|
|
|
Instantaneous |
|
No |
|
Unignited |
|
|
|
Failure |
35-60% |
Yes |
10m/s |
T9Cs
- Pool fire within Security Wall in given conditions |
|
|
|
Frequency |
|
|
5m/s |
|
|
|
|
per year |
|
|
2m/s |
|
|
|
|
|
|
|
0m/s |
|
|
|
|
|
|
No |
|
Unignited |
|
|
|
|
<35% |
Yes |
10m/s |
T9Ds
- Pool fire within Bund in given conditions |
|
|
|
|
|
|
5m/s |
|
|
|
|
|
|
|
2m/s |
|
|
|
|
|
|
|
0m/s |
|
|
|
|
|
|
No |
|
Unignited |
|
|
|
|
|
|
|
|
|
Figure 10.4:
Event Tree for Evaluating Consequences of an Instantaneous Release Due to Floor
Seam Failure of One of the PAFF Tanks
10.6.8.4 For the unzipping case, the evaluation is similar, except that the effects depend on the direction of the release. A different evaluation is made for releases at different angles relative to the direction of SWS. Forty-five degree sectors have been chosen for this, based on the differences in the results expected at different angles. Ignition probabilities are evaluated separately depending on the area the release is predicted to cover.
|
|
Unzipping
Failure |
Fill
Level |
Direction
Clockwise from SWS |
Ignition |
Wind
speed |
Outcome |
|
|
|
|
|
|
|
|
|
|
|
|
|
90-100% |
0 -
SWS |
Yes |
|
T9Az
– Pool fire |
|
|
|
|
|
|
No |
|
Unignited |
|
|
|
|
|
+45 |
Yes |
|
T9Az
– Pool fire |
|
|
|
|
|
|
No |
|
Unignited |
|
|
|
|
|
+90 |
Yes |
|
T9Az
– Pool fire |
|
|
|
|
|
|
No |
|
Unignited |
|
|
|
|
|
+135to-135 |
Yes |
|
T9Az
– Pool fire |
|
|
|
|
|
|
No |
|
Unignited |
|
|
|
|
|
-90 |
Yes |
|
T9Az
– Pool fire |
|
|
|
|
|
|
No |
|
Unignited |
|
|
|
|
|
-45 |
Yes |
|
T9Az
– Pool fire |
|
|
|
Instant |
|
|
No |
|
Unignited |
|
|
|
Failure |
60-90% |
0 -
SWS |
Yes |
|
T9Bz–
Pool fire |
|
|
|
Frequency |
|
|
No |
|
Unignited |
|
|
|
per year |
|
+45 |
Yes |
|
T9Bz–
Pool fire |
|
|
|
|
|
|
No |
|
Unignited |
|
|
|
|
|
+90 |
Yes |
|
T9Bz–
Pool fire |
|
|
|
|
|
|
No |
|
Unignited |
|
|
|
|
|
+135to-135 |
Yes |
|
T9Bz–
Pool fire |
|
|
|
|
|
|
No |
|
Unignited |
|
|
|
|
|
-90 |
Yes |
|
T9Bz–
Pool fire |
|
|
|
|
|
|
No |
|
Unignited |
|
|
|
|
|
-45 |
Yes |
|
T9Bz–
Pool fire |
|
|
|
|
|
|
No |
|
Unignited |
|
|
|
|
35-60% |
|
Yes |
10m/s |
T9Cz
– Pool fire within Security Wall in given conditions |
|
|
|
|
|
|
|
5m/s |
|
|
|
|
|
|
|
|
2m/s |
|
|
|
|
|
|
|
|
0m/s |
|
|
|
|
|
|
|
No |
|
Unignited |
|
|
|
|
<35% |
|
Yes |
10m/s |
T9Dz
- Pool fire within Bund in given conditions |
|
|
|
|
|
|
|
5m/s |
|
|
|
|
|
|
|
|
2m/s |
|
|
|
|
|
|
|
|
0m/s |
|
|
|
|
|
|
|
No |
|
Unignited |
|
|
|
|
|
|
|
|
|
|
Figure 10.5: Event Tree for Evaluating Consequences of an Instantaneous Release Due
to Unzipping of One of the PAFF Tanks
10.6.8.5 For ignited releases, the off-site populations affected are also estimated, based on the predicted area that each release would cover (see Appendix H7) and the populations present (see Appendix H8). Different populations are considered depending on whether the release occurs during the day, when the peak numbers of lorries are expected within SWS, and during the night. No allowance in the analysis has been made for escape from the subsequent fire for people caught within the area of the release, to provide a conservative estimate of fatalities.
10.6.8.6 A separate evaluation is made for the aircraft impact case for each tank based on the event tree in Figure 10.4, except that the ignition probability is always taken to be 1 due to the aircraft impact. These cases are denoted T9Aa, T9Ba, T9Ca and T9Da.
10.6.8.7 The result is a set of outcome frequencies for each tank covering a range of fatality estimates depending on the direction of the release and the time at which it occurs. The details of this analysis are shown in Appendix H9 for a cautious best estimate.
10.6.8.8 To generate a societal risk (FN) curve, all of the frequencies and fatality estimates from all of the tanks are combined. The FN curve is a cumulative plot that shows the frequency of events leading to N or more fatalities.
10.6.8.9 An estimate of the Potential Loss of Life (PLL) is also generated. This is useful in cost benefit analysis. The PLL is simply the sum of the product of the frequency and number of fatalities over all events. It provides an estimate of the predicted average number of fatalities per year, although the average in this case is skewed towards very infrequent large events.
10.7 Risks Due to Pipeline Transfer of Aviation Fuel
10.7.1.1 Aviation fuel will be transported from PAFF to the existing Aviation Fuel Receiving Facility (AFRF) at Sha Chau by two new 500mm diameter sub sea pipelines, each pumping 1500 m3/hour (330 kg/s). These pipelines are each approximately 4.8 km long. An existing pipeline (which lies outside the scope of the present study) will transfer the fuel from the AFRF to the airport.
10.7.1.2 This section presents the quantitative risk assessment carried out for the identified hazardous scenarios associated with pipeline transfer of aviation fuel. The relevant scenario is:
· Fire on sea due to release/leak from submarine pipeline (P1)
10.7.1.3 Loss of containment could be due to various causes such as corrosion or material/weld defect but is largely dominated by marine traffic impact, as explained below.
10.7.2 Fire on sea due to release/leak from submarine pipeline (P1)
10.7.2.1 Scenario P1 is a pool fire on the sea surface as a result of a release from one of the submarine pipelines and ignition either by a passing vessel or the vessel which caused the pipeline damage. Loss of containment of the pipeline may be caused by:
· Anchor Drop/Drag
· Vessel Sinking
· Accidental Dropping of Containers
· Fishing Activity
· Dredging Activities
· Corrosion
· Construction Damage
· Natural Hazards
These are explained in more detail below.
10.7.2.2 Anchor drop/drag is the dominant cause of failure or damage to a submarine pipeline. This occurs when a ship's anchor is set off inadvertently or due to an emergency. When an anchor is dropped, it undergoes a free fall, reaches the bottom with a known velocity, penetrates the soil and may cause damage to any pipeline in its path. The type of damage that could be caused will vary depending on the size of anchor and other factors such as whether the pipeline is buried etc. Generally, it could damage the concrete coating, cause a dent or cause the pipe to tear open.
10.7.2.3 The potential for anchor drop depends on the proximity of the pipeline route to port/harbour areas, fairways and anchorage areas.
10.7.2.4 In the fairways, vessels will be on the move and if any vessel drops anchor it is more likely to collide with other passing vessels and hence the frequency of such an event is expected to be low. Also, since the pipeline will be marked on nautical charts, it is expected that passing vessels will be aware of the presence of the pipeline and therefore will not drop anchor in the vicinity.
10.7.2.5 Nevertheless, anchor drop incidents may occur due to emergency conditions or due to human error. Emergency situations may include ship machinery failure, collision or poor weather (adverse wind, typhoon, fog etc.). Emergency anchoring due to poor weather conditions does not usually occur since all ocean-going vessels have advanced navigation systems on board.
10.7.2.6 Anchor drag occurs when a moving vessel drops anchor and therefore the anchor gets dragged over some distance. The drag distance could be assumed as about 50m although it could be higher if the anchor is dropped at high vessel speed. If there is a submarine pipeline along the anchor drag path, anchor dragging onto the pipeline may result in localised buckling or denting of the pipeline, or over-stressing from bending, if the tension on the anchor is sufficient to laterally displace the pipeline. A dragged anchor may also hook onto a pipeline during retrieval causing damage as a result of lifting the pipeline.
10.7.2.7 It is to be noted that an anchor dropped vertically will penetrate deeper than anchor drag. However, the probability of a direct hit on a pipeline from an anchor drop is generally low compared to damage due to drag.
10.7.2.8 Not all types of vessels have the potential to cause anchor damage to the pipeline since the rock armour protection is designed for 22 tonne anchors across Urmston Road (12 tonne protection in waters shallower than 10 m and 6 tonne between the jetty and seawall where vessel access is restricted) [14]. Anchor sizes are broadly related to vessel sizes and conform to international standards. The estimated average anchor sizes based on the commonly used US stockless anchor for typical vessel sizes are given as 4.2 tonnes for 25,000 dwt vessel, 6.8 tonnes for 50,000 dwt vessel and 11.6 tonnes for 100,000 dwt vessel. Hence an anchor size of 22 tonnes corresponds to vessel sizes much greater than 100,000 dwt.
10.7.2.9 Along the proposed route, in the section crossing the Urmston Road Channel (it is to be noted that it is not a designated channel), there is a significant amount of river trade vessels. However, these vessels range from less than 1000 dwt to about 5000 dwt and very rarely greater than 10,000 dwt. Only ~1% of ocean-going vessels are greater than 100,000 dwt ([1], [57]) so only a very small fraction <<1% of vessels in the vicinity of the pipeline will have anchors that could penetrate the pipeline if dropped.
10.7.2.10 An analysis of incidents of vessel sinking/grounding in Hong Kong
waters for the years 1997 and 1998 showed that these incidents occurred mostly
in
10.7.2.11 The pipeline will be trenched 3m below sea bed (more than 6m below
sea bed in some sections such as
10.7.2.12 Freight containers may be dropped accidentally due to collision, vessel sinking or improper stowage. These containers typically weigh about 10 tonnes and would not cause damage to the pipeline if they were to land on top of the pipe.
10.7.2.13 Stern trawlers, with lengths up to 30m, could also be of concern. Trawl gear operation is unlikely to involve penetration depths greater than 1m. In the present case, where the pipeline will be laid to 3m below the seabed, potential for damage due to fishing is not expected.
10.7.2.14 Dredging vessels could cause damage due to dredging operations that involve cutting heads. They could also cause damage to the pipeline by anchoring.
10.7.2.15 Deep maintenance dredging activities currently occur along the pipeline route for a coal berth for CLP. Therefore, in this section, the pipeline will be lowered to around 6-7m below seabed. It is assumed that dredging operations by others will be closely monitored and controlled and therefore potential for damage due to dredging is considered to be low.
10.7.2.16 The proposed pipeline will be protected against external corrosion by sacrificial anodes. However, ineffective corrosion protection due to a failure or breakdown of the system could cause external corrosion resulting in general or local loss of wall thickness leading to failure.
10.7.2.17 Damage to the pipeline during construction is recognised as a potential hazard. For example, during pipe lay, the pipeline will be laid by barge or bottom pulled into position to 3m below seabed followed by installation of additional rock armour protection. During this transient phase, where the pipeline lies in the trench unprotected, damage due to anchoring is a threat.
10.7.2.18 There are a number of procedural measures that can be adopted such as deployment of mooring buoys or patrol boats to warn passing ships and thereby prevent potential incidents. However, if damage were to occur, this will be revealed during hydrotest and pigging and accordingly rectified. The only consequence is the costs for repair and therefore this is not considered further in the risk assessment.
10.7.2.19 Natural hazards such as subsidence, earthquake and typhoon, environmental loads (currents and waves) etc. may cause varying degrees of damage to the pipeline. The pipeline will be designed to suitable standards taking into account prevailing local conditions.
10.7.2.20 The most comprehensive failure database for submarine pipelines is
described in the report published by UK Health and Safety Executive titled
'PARLOC 96’ [56],
which covers incidents until year 1995 (minor changes only are present in the
most recent issue PARLOC 2001 [56]
which contains 542 incidents rather than 483). The information in this database
is based on data obtained from regulatory authorities in the
10.7.2.21 The PARLOC database [56] contains 65 incidents involving loss of containment from operating offshore steel pipelines, which are mostly subsea. Of these, 17 involved anchoring or other impact, 26 were due to corrosion, 10 were due to material defects and 12 were due to other or unreported causes [56].
10.7.2.22 A review of the database was conducted in a previous study ([1], [57]) and the failure frequency has been derived for a submarine pipeline considering only those failures relevant to the pipeline under consideration.
10.7.2.23 The failure frequency has been derived separately for mid-line and pipelines within platform safety zone (500m). The higher failure rate in the safety zone (an order of magnitude higher than mid-line) is due to the effect of increased ship/barge movements in the vicinity and the potential for anchor damage as a result. The generic failure frequency values identified ([1], [57]) are given below.
Table 10.51: Generic Pipeline Failure Frequencies
|
Cause |
Failure Rate (per km per year) Based on Level
of Marine Activity |
||
|
|
High |
Moderate |
Low |
|
Anchor/ Impact |
5 × 10⁻⁴ |
8.4 × 10⁻⁵ (a) |
2.8 × 10⁻⁵ |
|
Corrosion/ Others |
1.6 × 10⁻⁵ |
1.6 × 10⁻⁵ |
1.6 × 10⁻⁵ |
|
Total |
5.2 × 10⁻⁴ |
1 × 10⁻⁴ |
4.4 × 10⁻⁵ |
Note: (a) Value assumed 3 times the value for mid-line,
i.e. 3 times 'low' value.
10.7.2.24 The submarine pipeline from the proposed new jetty to the airport
via Sha Chau passes through
10.7.2.25 Three leak sizes are assumed. The sizes and their proportions are given below:
Table 10.52: Pipeline Leak Sizes, Proportions and Frequencies
|
Size |
Hole Size (mm) |
Proportion of Leaks |
Frequency (per km- year) |
|
Small Leak |
20 |
57% |
3.88 × 10⁻⁶ |
|
Medium Leak |
50 |
15% |
1.02 × 10⁻⁶ |
|
Rupture |
500 |
28% |
1.90 × 10⁻⁶ |
|
|
|
Total |
6.8 × 10⁻⁶ |
10.7.2.26 It is considered that only rupture of the pipeline will result in sufficient fuel to reach the sea surface and ignite, given the emulsification of fuel with water following a submarine release. Details of the behaviour of submarine release of aviation fuel are discussed below. An ignition probability of 0.008 is taken (see Appendix H5) for the sub sea release due to rupture of the pipeline, which may be very conservative.
10.7.2.27 Therefore, the resultant scenario frequency of the pool fire on the sea surface following rupture of the pipeline is calculated as 1.9 × 10-6 × 0.008 = 1.52 × 10⁻⁸ per km per year. For 4.8 km of twin pipeline, the frequency per year is calculated as 1.46 × 10⁻⁷ per year.
10.7.2.28 The submarine pipeline is operating at a pressure of approximately 15 barg and has a water table of 25m above it. In the event of a rupture, it is assumed that a response time of 3 minutes will be required to affect a shutdown. Hence, following an initial release, the pressure will quickly fall and consequently the release rate from the pipeline will drop. Upon achieving shutdown, the relaxation volume of the fuel in the pipe (which is approximately 1-2% of the pipe inventory) will be released. The water head (approximately 2 bar) and rock armour is likely to prevent any further release from the pipeline, although the spill may continue at a very low level due to diffusion.
10.7.2.29 Therefore, following an initial high release rate, the release rate will drop quickly and the residual inventory of the pipe will be released slowly against a 2 barg water head.
10.7.2.30 Various models simulating the behaviour of a sub sea release of oil (or other petroleum products) have been proposed. However, these models are difficult to verify against actual field data. Experimental studies have also been conducted to study the behaviour of underwater plumes.
10.7.2.31 The twin submarine pipeline system will be laid in a trench to at
least 3m below the seabed and covered with rock armour protection. In order to provide further protection
against future proposed CLP coal vessel access in the
10.7.2.32 Due to the depth of the pipeline and rock armour protection, the initial momentum of the fuel release will be diminished. The fuel is likely to seep/percolate through the rock armour and will lose all its momentum in the process. Thereafter, the fuel will rise under its own buoyancy. As described above, the entrainment of water into the fuel droplets will create a water fuel emulsion, which will eventually reach the sea surface. However, it is expected that due to the weathering and tidal motions of the sea, by the time the fuel reaches the sea surface, it will not remain as one large pool. Rather, the fuel would have broken up into a number of small pools. The thickness of these pools is also likely to be very small (<< 10mm), and flame spread will be limited (see Appendix H6, Section H6.3).
10.7.2.33 Even without this additional entrainment of water in the fuel droplets, Jet A1 would not form a flammable mixture above its surface and would be difficult to ignite.
10.7.2.35 Although the pipeline isolation system should limit the volume released as described above, all such systems have a possibility of failure. An automatic isolation failure probability of 0.1 is assumed to allow for failures in the detection, control and isolation systems. The frequency of the automatically isolated release is therefore (1 ‑ 0.1) × 1.46 × 10‑7 = 1.31 × 10‑7 /yr. The corresponding late isolation frequency is 0.1 × 1.46 × 10‑7 = 1.46 × 10‑8 /yr.
10.7.2.36 If automatic isolation fails, a delay of 60 minutes is assumed before isolation to cautiously allow for late detection, investigation and manual intervention. This will result in a release of 1500 m3 of fuel which is assumed to cover 15 ha at a thickness of 10 mm (equivalent effects radius of 219 m). This release is approximately 80% of the combined inventory of the twin pipelines to the AFRF. The results are summarised below, based on the average population density of 0.15 /ha (Section H8.2).
Table 10.53: Risk Summary for Pipeline Rupture Scenario (P1)
|
Isolation |
Frequency (/yr) |
Effect Distance (m) |
Probability of Death |
Fatalities |
|
Automatic (3 mins) |
1.31 × 10‑7 |
49 |
1 |
0.11 |
|
Late (60 mins) |
1.46 × 10⁻⁸ |
219 |
1 |
2.25 |
10.7.2.37 Risks due to the existing pipeline from the AFRF to the airport are not predicted to change due to the operation of the PAFF. The frequency per kilometre, hazard ranges and individual risk levels are the same as identified above.
10.8.1.1 The values for event frequency and numbers of potential fatalities are summarised below, excluding instantaneous tank failure, for initial and final developments, for reference. Where scenarios have been sub-divided for evaluation, the conditions for the sub-division are also noted.
Table 10.54: Event Frequencies and Potential Fatalities Excluding Instantaneous Tank Failure (Initial Development)
|
Scenario
and Conditions (Initial Development) |
Freq (/yr) |
Fatalities |
|
M1, Grounding, 20000, Small |
7.7×10⁻¹⁰ |
1.4×10⁻² |
|
M1, Grounding, 20000, Large |
2.3×10⁻⁹ |
4.7×10⁻² |
|
M1, Grounding, 20000, Rupture |
1.8×10⁻⁸ |
2.6 |
|
M1, Grounding, 20000, Multiple Rupture |
6.2×10⁻¹⁰ |
2.6 |
|
M1, Grounding, 45000, Small |
4.1×10⁻¹⁰ |
3.2×10⁻² |
|
M1, Grounding, 45000, Large |
1.2×10⁻⁹ |
1.1×10⁻¹ |
|
M1, Grounding, 45000, Rupture |
9.6×10⁻⁹ |
5.9 |
|
M1, Grounding, 45000, Multiple Rupture |
3.3×10⁻¹⁰ |
5.9 |
|
M1, Grounding, 60000, Small |
2.1×10⁻¹⁰ |
4.2×10⁻² |
|
M1, Grounding, 60000, Large |
6.2×10⁻¹⁰ |
1.4×10⁻¹ |
|
M1, Grounding, 60000, Rupture |
4.8×10⁻⁹ |
7.9 |
|
M1, Grounding, 60000, Multiple Rupture |
1.7×10⁻¹⁰ |
7.9 |
|
M1, Collision, 20000, Small |
2.2×10⁻⁹ |
1.4×10⁻² |
|
M1, Collision, 20000, Large |
6.5×10⁻⁹ |
4.7×10⁻² |
|
M1, Collision, 20000, Rupture |
5.0×10⁻⁸ |
2.6 |
|
M1, Collision, 20000, Multiple Rupture |
1.7×10⁻⁹ |
2.6 |
|
M1, Collision, 45000, Small |
1.2×10⁻⁹ |
3.2×10⁻² |
|
M1, Collision, 45000, Large |
3.5×10⁻⁹ |
1.1×10⁻¹ |
|
M1, Collision, 45000, Rupture |
2.7×10⁻⁸ |
5.9 |
|
M1, Collision, 45000, Multiple Rupture |
9.2×10⁻¹⁰ |
5.9 |
|
M1, Collision, 60000, Small |
5.8×10⁻¹⁰ |
4.2×10⁻² |
|
M1, Collision, 60000, Large |
1.7×10⁻⁹ |
1.4×10⁻¹ |
|
M1, Collision, 60000, Rupture |
1.3×10⁻⁸ |
7.9 |
|
M1, Collision, 60000, Multiple Rupture |
4.6×10⁻¹⁰ |
7.9 |
|
M2, Collision, 10 fatalities |
2.2×10⁻⁸ |
1.0×101 |
|
M2, Collision, 30 fatalities |
2.2×10⁻⁹ |
3.0×101 |
|
M2, Collision, 100 fatalities |
1.6×10⁻⁹ |
1.0×10² |
|
M2, Collision, 235 fatalities |
1.3×10⁻⁹ |
2.4×10² |
|
M2, Collision, 400 fatalities |
3.3×10⁻¹⁰ |
4.0×10² |
|
M3, Explosion, 20000, |
3.6×10⁻⁷ |
3.5×10⁻² |
|
M3, Explosion, 45000, |
3.8×10⁻⁷ |
3.5×10⁻² |
|
M3, Explosion, 60000, |
1.9×10⁻⁷ |
3.5×10⁻² |
|
J1, Striking, 20000, Small |
1.4×10⁻⁹ |
1.4×10⁻² |
|
J1, Striking, 20000, Large |
4.3×10⁻⁹ |
4.7×10⁻² |
|
J1, Striking, 20000, Rupture |
3.3×10⁻⁸ |
2.6 |
|
J1, Striking, 20000, Multiple Rupture |
1.2×10⁻⁹ |
2.6 |
|
J1, Striking, 45000, Small |
7.7×10⁻¹⁰ |
3.2×10⁻² |
|
J1, Striking, 45000, Large |
2.3×10⁻⁹ |
1.1×10⁻¹ |
|
J1, Striking, 45000, Rupture |
1.8×10⁻⁸ |
5.9 |
|
J1, Striking, 45000, Multiple Rupture |
6.1×10⁻¹⁰ |
5.9 |
|
J1, Striking, 60000, Small |
3.8×10⁻¹⁰ |
4.2×10⁻² |
|
J1, Striking, 60000, Large |
1.2×10⁻⁹ |
1.4×10⁻¹ |
|
J1, Striking, 60000, Rupture |
8.9×10⁻⁹ |
7.9 |
|
J1, Striking, 60000, Multiple Rupture |
3.1×10⁻¹⁰ |
7.9 |
|
J1, Impact, 20000, Small |
1.3×10⁻⁸ |
1.4×10⁻² |
|
J1, Impact, 20000, Large |
4.0×10⁻⁸ |
4.7×10⁻² |
|
J1, Impact, 20000, Rupture |
3.1×10⁻⁷ |
2.6 |
|
J1, Impact, 20000, Multiple Rupture |
1.1×10⁻⁸ |
2.6 |
|
J1, Impact, 45000, Small |
7.1×10⁻⁹ |
3.2×10⁻² |
|
J1, Impact, 45000, Large |
2.1×10⁻⁸ |
1.1×10⁻¹ |
|
J1, Impact, 45000, Rupture |
1.6×10⁻⁷ |
5.9 |
|
J1, Impact, 45000, Multiple Rupture |
5.7×10⁻⁹ |
5.9 |
|
J1, Impact, 60000, Small |
3.6×10⁻⁹ |
4.2×10⁻² |
|
J1, Impact, 60000, Large |
1.1×10⁻⁸ |
1.4×10⁻¹ |
|
J1, Impact, 60000, Rupture |
8.2×10⁻⁸ |
7.9 |
|
J1, Impact, 60000, Multiple Rupture |
2.8×10⁻⁹ |
7.9 |
|
J2, Loading arm rupture, Rupture |
2.2×10⁻⁷ |
2.2×10⁻¹ |
|
J3, Valve/pipework failure, Small |
0.0 |
0.0 |
|
J3, Valve/pipework failure, Large |
6.6×10⁻⁶ |
2.2×10⁻¹ |
|
J3, Valve/pipework failure, Rupture |
0.0 |
0.0 |
|
J4, Striking, 20000, Large |
4.3×10⁻⁹ |
2.2×10⁻¹ |
|
J4, Striking, 20000, Rupture |
3.3×10⁻⁸ |
2.2×10⁻¹ |
|
J4, Striking, 45000, Large |
2.3×10⁻⁹ |
2.2×10⁻¹ |
|
J4, Striking, 45000, Rupture |
1.8×10⁻⁸ |
2.2×10⁻¹ |
|
J4, Striking, 60000, Large |
1.2×10⁻⁹ |
2.2×10⁻¹ |
|
J4, Striking, 60000, Rupture |
8.9×10⁻⁹ |
2.2×10⁻¹ |
|
J4, Impact, 20000, Large |
4.0×10⁻⁸ |
2.2×10⁻¹ |
|
J4, Impact, 20000, Rupture |
3.1×10⁻⁷ |
2.2×10⁻¹ |
|
J4, Impact, 45000, Large |
2.1×10⁻⁸ |
2.2×10⁻¹ |
|
J4, Impact, 45000, Rupture |
1.6×10⁻⁷ |
2.2×10⁻¹ |
|
J4, Impact, 60000, Large |
1.1×10⁻⁸ |
2.2×10⁻¹ |
|
J4, Impact, 60000, Rupture |
8.2×10⁻⁸ |
2.2×10⁻¹ |
|
J5, Pipeline failure, Small |
2.1×10⁻⁹ |
3.5×10⁻³ |
|
J5, Pipeline failure, Medium |
1.7×10⁻⁹ |
2.3×10⁻² |
|
J5, Pipeline failure, Rupture auto isol |
7.4×10⁻⁹ |
4.3×10⁻¹ |
|
J5, Pipeline failure, Rupture - late isol |
8.2×10⁻¹⁰ |
1.0 |
|
T1, Fire due to discharge from tank vent |
0.0 |
0.0 |
|
T2, Tank head fire / explosion in tank head space |
9.6×10⁻⁴ |
0.0 |
|
T3, Multiple tank head fires |
4.8×10⁻⁵ |
0.0 |
|
T4, Tank failure due to overpressure |
0.0 |
0.0 |
|
T5, Explosion in empty tank (under maintenance) |
0.0 |
0.0 |
|
T6, Bund fire daytime |
1.4×10⁻⁸ |
7.7 |
|
T6, Bund fire nighttime |
2.3×10⁻⁸ |
7.7×10⁻¹ |
|
T7, Fire outside bund due to rupture/leak of pumps, pipework and fittings daytime |
2.2×10⁻⁹ |
3.8×10⁻¹ |
|
T7, Fire outside bund due to rupture/leak of pumps, pipework and fittings nighttime |
3.6×10⁻⁹ |
3.8×10⁻² |
|
T8, Fire on sea due to release through drainage - 5 mins isolation |
4.6×10⁻⁶ |
1.5×10⁻¹ |
|
T9, Fire on sea due to release through drainage - late isolation (30 mins) |
5.2×10⁻⁷ |
1.1 |
|
T10, Fire due to multiple tank failure - Day/night low wind speed |
9.0×10⁻¹⁰ |
0.0 |
|
T10, Fire due to multiple tank failure - Day 5m/s |
0.0 |
0.0 |
|
T10, Fire due to multiple tank failure - Day 10m/s |
0.0 |
0.0 |
|
T10, Fire due to multiple tank failure - Night 5m/s |
0.0 |
0.0 |
|
T10, Fire due to multiple tank failure - Night 10m/s |
0.0 |
0.0 |
|
T11, Boilover |
0.0 |
0.0 |
|
T12, Fire due to release from top of tank due to overfilling |
0.0 |
0.0 |
|
T13, Vapour cloud explosion / flash fire |
0.0 |
0.0 |
|
T14, Fire due to 10% instantaneous release from the top of a tank on sea |
2.1×10⁻⁷ |
6.9×10⁻² |
|
T14, Fire due to 10% instantaneous release from the top of a tank - On Land Day 5m/s |
1.7×10⁻⁸ |
6.1 |
|
T14, Fire due to 10% instantaneous release from the top of a tank - On Land Day 10m/s |
2.4×10⁻¹⁰ |
1.7×101 |
|
T14, Fire due to 10% instantaneous release from the top of a tank - On Land Night 5m/s |
2.8×10⁻⁸ |
6.0×10⁻¹ |
|
T14, Fire due to 10% instantaneous release from the top of a tank - On Land Night 10m/s |
4.0×10⁻¹⁰ |
1.7 |
|
P1, Subsea release, Small |
0.0 |
0.0 |
|
P1, Subsea release, Medium |
0.0 |
0.0 |
|
P1, Subsea release, Rupture auto isol |
1.3×10⁻⁷ |
1.1×10⁻¹ |
|
P1, Subsea release, Rupture - late isol |
1.5×10⁻⁸ |
2.3 |
Table 10.55: Event Frequencies and Potential Fatalities Excluding Instantaneous Tank Failure (Final Development)
|
Scenario
and Conditions (Final Development) |
Freq (/yr) |
Fatalities |
|
M1, Grounding, 30000, Small |
4.5×10⁻¹⁰ |
2.1×10⁻² |
|
M1, Grounding, 30000, Large |
1.4×10⁻⁹ |
7.1×10⁻² |
|
M1, Grounding, 30000, Rupture |
1.1×10⁻⁸ |
3.9 |
|
M1, Grounding, 30000, Multiple Rupture |
3.6×10⁻¹⁰ |
3.9 |
|
M1, Grounding, 45000, Small |
5.2×10⁻¹⁰ |
3.2×10⁻² |
|
M1, Grounding, 45000, Large |
1.5×10⁻⁹ |
1.1×10⁻¹ |
|
M1, Grounding, 45000, Rupture |
1.2×10⁻⁸ |
5.9 |
|
M1, Grounding, 45000, Multiple Rupture |
4.1×10⁻¹⁰ |
5.9 |
|
M1, Grounding, 80000, Small |
2.5×10⁻¹⁰ |
5.7×10⁻² |
|
M1, Grounding, 80000, Large |
7.4×10⁻¹⁰ |
1.9×10⁻¹ |
|
M1, Grounding, 80000, Rupture |
5.7×10⁻⁹ |
1.1×101 |
|
M1, Grounding, 80000, Multiple Rupture |
2.0×10⁻¹⁰ |
1.1×101 |
|
M1, Collision, 30000, Small |
1.3×10⁻⁹ |
2.1×10⁻² |
|
M1, Collision, 30000, Large |
3.8×10⁻⁹ |
7.1×10⁻² |
|
M1, Collision, 30000, Rupture |
2.9×10⁻⁸ |
3.9 |
|
M1, Collision, 30000, Multiple Rupture |
1.0×10⁻⁹ |
3.9 |
|
M1, Collision, 45000, Small |
1.4×10⁻⁹ |
3.2×10⁻² |
|
M1, Collision, 45000, Large |
4.3×10⁻⁹ |
1.1×10⁻¹ |
|
M1, Collision, 45000, Rupture |
3.3×10⁻⁸ |
5.9 |
|
M1, Collision, 45000, Multiple Rupture |
1.2×10⁻⁹ |
5.9 |
|
M1, Collision, 80000, Small |
6.8×10⁻¹⁰ |
5.7×10⁻² |
|
M1, Collision, 80000, Large |
2.1×10⁻⁹ |
1.9×10⁻¹ |
|
M1, Collision, 80000, Rupture |
1.6×10⁻⁸ |
1.1×101 |
|
M1, Collision, 80000, Multiple Rupture |
5.5×10⁻¹⁰ |
1.1×101 |
|
M2, Collision, 10 fatalities |
1.9×10⁻⁸ |
1.0×101 |
|
M2, Collision, 30 fatalities |
1.9×10⁻⁹ |
3.0×101 |
|
M2, Collision, 100 fatalities |
1.4×10⁻⁹ |
1.0×10² |
|
M2, Collision, 235 fatalities |
1.1×10⁻⁹ |
2.4×10² |
|
M2, Collision, 400 fatalities |
2.8×10⁻¹⁰ |
4.0×10² |
|
M3, Explosion, 30000, |
4.2×10⁻⁷ |
3.5×10⁻² |
|
M3, Explosion, 45000, |
4.8×10⁻⁷ |
3.5×10⁻² |
|
M3, Explosion, 80000, |
2.3×10⁻⁷ |
3.5×10⁻² |
|
J1, Striking, 30000, Small |
8.4×10⁻¹⁰ |
1.4×10⁻² |
|
J1, Striking, 30000, Large |
2.5×10⁻⁹ |
4.7×10⁻² |
|
J1, Striking, 30000, Rupture |
1.9×10⁻⁸ |
2.6 |
|
J1, Striking, 30000, Multiple Rupture |
6.7×10⁻¹⁰ |
2.6 |
|
J1, Striking, 45000, Small |
9.6×10⁻¹⁰ |
3.2×10⁻² |
|
J1, Striking, 45000, Large |
2.9×10⁻⁹ |
1.1×10⁻¹ |
|
J1, Striking, 45000, Rupture |
2.2×10⁻⁸ |
5.9 |
|
J1, Striking, 45000, Multiple Rupture |
7.7×10⁻¹⁰ |
5.9 |
|
J1, Striking, 80000, Small |
4.6×10⁻¹⁰ |
5.7×10⁻² |
|
J1, Striking, 80000, Large |
1.4×10⁻⁹ |
1.9×10⁻¹ |
|
J1, Striking, 80000, Rupture |
1.1×10⁻⁸ |
1.1×101 |
|
J1, Striking, 80000, Multiple Rupture |
3.6×10⁻¹⁰ |
1.1×101 |
|
J1, Impact, 30000, Small |
7.8×10⁻⁹ |
1.4×10⁻² |
|
J1, Impact, 30000, Large |
2.3×10⁻⁸ |
4.7×10⁻² |
|
J1, Impact, 30000, Rupture |
1.8×10⁻⁷ |
2.6 |
|
J1, Impact, 30000, Multiple Rupture |
6.2×10⁻⁹ |
2.6 |
|
J1, Impact, 45000, Small |
8.9×10⁻⁹ |
3.2×10⁻² |
|
J1, Impact, 45000, Large |
2.7×10⁻⁸ |
1.1×10⁻¹ |
|
J1, Impact, 45000, Rupture |
2.1×10⁻⁷ |
5.9 |
|
J1, Impact, 45000, Multiple Rupture |
7.1×10⁻⁹ |
5.9 |
|
J1, Impact, 80000, Small |
4.2×10⁻⁹ |
5.7×10⁻² |
|
J1, Impact, 80000, Large |
1.3×10⁻⁸ |
1.9×10⁻¹ |
|
J1, Impact, 80000, Rupture |
9.8×10⁻⁸ |
1.1×101 |
|
J1, Impact, 80000, Multiple Rupture |
3.4×10⁻⁹ |
1.1×101 |
|
J2, Loading arm rupture, Rupture |
2.7×10⁻⁷ |
2.2×10⁻¹ |
|
J3, Valve/pipework failure, Small |
0.0 |
0.0 |
|
J3, Valve/pipework failure, Large |
6.6×10⁻⁶ |
2.2×10⁻¹ |
|
J3, Valve/pipework failure, Rupture |
0.0 |
0.0 |
|
J4, Striking, 30000, Large |
2.5×10⁻⁹ |
2.2×10⁻¹ |
|
J4, Striking, 30000, Rupture |
1.9×10⁻⁸ |
2.2×10⁻¹ |
|
J4, Striking, 45000, Large |
2.9×10⁻⁹ |
2.2×10⁻¹ |
|
J4, Striking, 45000, Rupture |
2.2×10⁻⁸ |
2.2×10⁻¹ |
|
J4, Striking, 80000, Large |
1.4×10⁻⁹ |
2.2×10⁻¹ |
|
J4, Striking, 80000, Rupture |
1.1×10⁻⁸ |
2.2×10⁻¹ |
|
J4, Impact, 30000, Large |
2.3×10⁻⁸ |
2.2×10⁻¹ |
|
J4, Impact, 30000, Rupture |
1.8×10⁻⁷ |
2.2×10⁻¹ |
|
J4, Impact, 45000, Large |
2.7×10⁻⁸ |
2.2×10⁻¹ |
|
J4, Impact, 45000, Rupture |
2.1×10⁻⁷ |
2.2×10⁻¹ |
|
J4, Impact, 80000, Large |
1.3×10⁻⁸ |
2.2×10⁻¹ |
|
J4, Impact, 80000, Rupture |
9.8×10⁻⁸ |
2.2×10⁻¹ |
|
J5, Pipeline failure, Small |
2.1×10⁻⁹ |
3.5×10⁻³ |
|
J5, Pipeline failure, Medium |
1.7×10⁻⁹ |
2.3×10⁻² |
|
J5, Pipeline failure, Rupture auto isol |
7.4×10⁻⁹ |
4.3×10⁻¹ |
|
J5, Pipeline failure, Rupture - late isol |
8.2×10⁻¹⁰ |
1.0 |
|
T1, Fire due to discharge from tank vent |
0.0 |
0.0 |
|
T2, Tank head fire / explosion in tank head space |
1.4×10⁻³ |
0.0 |
|
T3, Multiple tank head fires |
7.0×10⁻⁵ |
0.0 |
|
T4, Tank failure due to overpressure |
0.0 |
0.0 |
|
T5, Explosion in empty tank (under maintenance) |
0.0 |
0.0 |
|
T6, Bund fire daytime |
1.4×10⁻⁸ |
7.7 |
|
T6, Bund fire nighttime |
2.3×10⁻⁸ |
7.7×10⁻¹ |
|
T7, Fire outside bund due to rupture/leak of pumps, pipework and fittings daytime |
2.2×10⁻⁹ |
3.8×10⁻¹ |
|
T7, Fire outside bund due to rupture/leak of pumps, pipework and fittings nighttime |
3.6×10⁻⁹ |
3.8×10⁻² |
|
T8, Fire on sea due to release through drainage - 5 mins isolation |
4.6×10⁻⁶ |
1.5×10⁻¹ |
|
T9, Fire on sea due to release through drainage - late isolation (30 mins) |
5.2×10⁻⁷ |
1.1 |
|
T10, Fire due to multiple tank failure - Day/night low wind speed |
1.3×10⁻⁹ |
3.8 |
|
T10, Fire due to multiple tank failure - Day 5m/s |
1.3×10⁻¹⁰ |
1.1×101 |
|
T10, Fire due to multiple tank failure - Day 10m/s |
2.0×10⁻¹² |
2.5×101 |
|
T10, Fire due to multiple tank failure - Night 5m/s |
2.1×10⁻¹⁰ |
4.5 |
|
T10, Fire due to multiple tank failure - Night 10m/s |
3.0×10⁻¹² |
5.9 |
|
T11, Boilover |
0.0 |
0.0 |
|
T12, Fire due to release from top of tank due to overfilling |
0.0 |
0.0 |
|
T13, Vapour cloud explosion / flash fire |
0.0 |
0.0 |
|
T14, Fire due to 10% instantaneous release from the top of a tank on sea |
3.2×10⁻⁷ |
6.9×10⁻² |
|
T14, Fire due to 10% instantaneous release from the top of a tank - On Land Day 5m/s |
2.5×10⁻⁸ |
6.1 |
|
T14, Fire due to 10% instantaneous release from the top of a tank - On Land Day 10m/s |
3.6×10⁻¹⁰ |
1.7×101 |
|
T14, Fire due to 10% instantaneous release from the top of a tank - On Land Night 5m/s |
4.2×10⁻⁸ |
6.0×10⁻¹ |
|
T14, Fire due to 10% instantaneous release from the top of a tank - On Land Night 10m/s |
5.9×10⁻¹⁰ |
1.7 |
|
P1, Subsea release, Small |
0.0 |
0.0 |
|
P1, Subsea release, Medium |
0.0 |
0.0 |
|
P1, Subsea release, Rupture auto isol |
1.3×10⁻⁷ |
1.1×10⁻¹ |
|
P1, Subsea release, Rupture - late isol |
1.5×10⁻⁸ |
2.3 |
10.8.1.2 For instantaneous failure of each tank, a range of conditions under which the main scenarios of seam failure, unzipping or aircraft impact may occur are considered. These are given in detail in the event trees in Appendix H9. An example covering all the outcomes with non-zero fatalities is provided for Tank 001 (present only for the final development) below:
Table 10.56: Event Frequencies and Potential Fatalities for Instantaneous Failure of Tank 001
|
Instantaneous
Tank Failure Scenario and Conditions |
Freq (/yr) |
N (total) |
|
Seam Failure 90-100% Fill in Peak Hours (T9As) |
1.9×10⁻¹² |
98 |
|
Seam Failure
60-90% Fill in Peak Hours (T9Bs) |
2.8×10⁻¹³ |
60 |
|
Seam Failure
35-60% Fill in 10m/s wind in Peak Hours (T9Cs) |
5.6×10⁻¹⁶ |
25 |
|
Seam Failure
35-60% Fill in 5m/s wind in Peak Hours (T9Cs) |
4.0×10⁻¹⁴ |
11 |
|
Seam Failure 35-60%
Fill in 2m/s wind in Peak Hours (T9Cs) |
1.4×10⁻¹³ |
3.8 |
|
Seam Failure
35-60% Fill in 0m/s wind in Peak Hours (T9Cs) |
5.1×10⁻¹⁵ |
3.8 |
|
Seam Failure
<35% Fill in 10m/s wind in Peak Hours (T9Ds) |
1.8×10⁻¹⁵ |
7.7 |
|
Seam Failure
90-100% Fill During the Day (T9As) |
3.7×10⁻¹² |
59 |
|
Seam Failure
60-90% Fill During the Day (T9Bs) |
5.5×10⁻¹³ |
33 |
|
Seam Failure
35-60% Fill in 10m/s wind During the Day (T9Cs) |
1.1×10⁻¹⁵ |
25 |
|
Seam Failure
35-60% Fill in 5m/s wind During the Day (T9Cs) |
7.9×10⁻¹⁴ |
11 |
|
Seam Failure
35-60% Fill in 2m/s wind During the Day (T9Cs) |
2.8×10⁻¹³ |
3.8 |
|
Seam Failure
35-60% Fill in 0m/s wind During the Day (T9Cs) |
1.0×10⁻¹⁴ |
3.8 |
|
Seam Failure
<35% Fill in 10m/s wind During the Day (T9Ds) |
3.5×10⁻¹⁵ |
7.7 |
|
Seam Failure
90-100% Fill at Night (T9As) |
9.3×10⁻¹² |
3.2 |
|
Seam Failure
60-90% Fill at Night (T9Bs) |
1.4×10⁻¹² |
0.82 |
|
Seam Failure
35-60% Fill in 10m/s wind at Night (T9Cs) |
2.8×10⁻¹⁵ |
5.9 |
|
Seam Failure 35-60%
Fill in 5m/s wind at Night (T9Cs) |
2.0×10⁻¹³ |
4.5 |
|
Seam Failure
35-60% Fill in 2m/s wind at Night (T9Cs) |
7.1×10⁻¹³ |
3.8 |
|
Seam Failure
35-60% Fill in 0m/s wind at Night (T9Cs) |
2.5×10⁻¹⁴ |
3.8 |
|
Seam Failure
<35% Fill in 10m/s wind at Night (T9Ds) |
8.8×10⁻¹⁵ |
0.77 |
|
Unzipping
90-100% Fill at 0o to SWS in Peak Hours (T9Az) |
1.6×10⁻¹¹ |
166 |
|
Unzipping
90-100% Fill at +45o to SWS in Peak Hours (T9Az) |
8.6×10⁻¹² |
166 |
|
Unzipping
90-100% Fill at +90o to SWS in Peak Hours (T9Az) |
6.9×10⁻¹³ |
151 |
|
Unzipping
90-100% Fill at -90o to SWS in Peak Hours (T9Az) |
1.0×10⁻¹² |
110 |
|
Unzipping
90-100% Fill at -45o to SWS in Peak Hours (T9Az) |
1.6×10⁻¹¹ |
159 |
|
Unzipping 60-90%
Fill at 0o to SWS in Peak Hours (T9Bz) |
2.3×10⁻¹² |
130 |
|
Unzipping 60-90%
Fill at +45o to SWS in Peak Hours (T9Bz) |
1.2×10⁻¹² |
125 |
|
Unzipping 60-90%
Fill at +90o to SWS in Peak Hours (T9Bz) |
3.7×10⁻¹⁴ |
111 |
|
Unzipping 60-90%
Fill at -90o to SWS in Peak Hours (T9Bz) |
1.3×10⁻¹³ |
69 |
|
Unzipping 60-90%
Fill at -45o to SWS in Peak Hours (T9Bz) |
2.3×10⁻¹² |
133 |
|
Unzipping 35-60%
Fill in 10m/s wind in Peak Hours (T9Cz) |
5.6×10⁻¹⁶ |
25 |
|
Unzipping 35-60%
Fill in 5m/s wind in Peak Hours (T9Cz) |
4.0×10⁻¹⁴ |
11 |
|
Unzipping 35-60%
Fill in 2m/s wind in Peak Hours (T9Cz) |
1.4×10⁻¹³ |
3.8 |
|
Unzipping 35-60%
Fill in 0m/s wind in Peak Hours (T9Cz) |
5.1×10⁻¹⁵ |
3.8 |
|
Unzipping <35%Fill
in 10m/s wind in Peak Hours (T9Dz) |
1.8×10⁻¹⁵ |
7.7 |
|
Unzipping
90-100% Fill at 0o to SWS During the Day (T9Az) |
3.3×10⁻¹¹ |
110 |
|
Unzipping
90-100% Fill at +45o to SWS During the Day (T9Az) |
1.7×10⁻¹¹ |
111 |
|
Unzipping
90-100% Fill at +90o to SWS During the Day (T9Az) |
1.4×10⁻¹² |
104 |
|
Unzipping
90-100% Fill at -90o to SWS During the Day (T9Az) |
2.0×10⁻¹² |
74 |
|
Unzipping
90-100% Fill at -45o to SWS During the Day (T9Az) |
3.3×10⁻¹¹ |
109 |
|
Unzipping 60-90%
Fill at 0o to SWS During the Day (T9Bz) |
4.7×10⁻¹² |
86 |
|
Unzipping 60-90%
Fill at +45o to SWS During the Day (T9Bz) |
2.4×10⁻¹² |
81 |
|
Unzipping 60-90%
Fill at +90o to SWS During the Day (T9Bz) |
7.5×10⁻¹⁴ |
67 |
|
Unzipping 60-90%
Fill at -90o to SWS During the Day (T9Bz) |
2.5×10⁻¹³ |
46 |
|
Unzipping 60-90%
Fill at -45o to SWS During the Day (T9Bz) |
4.7×10⁻¹² |
83 |
|
Unzipping 35-60%
Fill in 10m/s wind During the Day (T9Cz) |
1.1×10⁻¹⁵ |
25 |
|
Unzipping 35-60%
Fill in 5m/s wind During the Day (T9Cz) |
7.9×10⁻¹⁴ |
11 |
|
Unzipping 35-60%
Fill in 2m/s wind During the Day (T9Cz) |
2.8×10⁻¹³ |
3.8 |
|
Unzipping 35-60%
Fill‑0m/s During the Day (T9Cz) |
1.0×10⁻¹⁴ |
3.8 |
|
Unzipping <35%Fill
in 10m/s wind During the Day (T9Dz) |
3.5×10⁻¹⁵ |
7.7 |
|
Unzipping
90-100% Fill at 0o to SWS at Night (T9Az) |
8.2×10⁻¹¹ |
11 |
|
Unzipping
90-100% Fill at +45o to SWS at Night (T9Az) |
4.3×10⁻¹¹ |
11 |
|
Unzipping
90-100% Fill at +90o to SWS at Night (T9Az) |
3.4×10⁻¹² |
31 |
|
Unzipping
90-100% Fill at -90o to SWS at Night (T9Az) |
5.0×10⁻¹² |
3.0 |
|
Unzipping
90-100% Fill at -45o to SWS at Night (T9Az) |
8.2×10⁻¹¹ |
13 |
|
Unzipping 60-90%
Fill at 0o to SWS at Night (T9Bz) |
1.2×10⁻¹¹ |
7.2 |
|
Unzipping 60-90%
Fill at +45o to SWS at Night (T9Bz) |
6.0×10⁻¹² |
6.7 |
|
Unzipping 60-90%
Fill at +90o to SWS at Night (T9Bz) |
1.9×10⁻¹³ |
2.7 |
|
Unzipping 60-90%
Fill at -90o to SWS at Night (T9Bz) |
6.3×10⁻¹³ |
2.4 |
|
Unzipping 60-90%
Fill at -45o to SWS at Night (T9Bz) |
1.2×10⁻¹¹ |
4.6 |
|
Unzipping 35-60% Fill in 10m/s wind at Night
(T9Cz) |
2.8×10⁻¹⁵ |
5.9 |
|
Unzipping 35-60% Fill in 5m/s wind at Night
(T9Cz) |
2.0×10⁻¹³ |
4.5 |
|
Unzipping 35-60% Fill in 2m/s wind at Night
(T9Cz) |
7.1×10⁻¹³ |
3.8 |
|
Unzipping 35-60% Fill‑0m/s at Night
(T9Cz) |
2.5×10⁻¹⁴ |
3.8 |
|
Unzipping <35%Fill in 10m/s wind at Night
(T9Dz) |
8.8×10⁻¹⁵ |
0.77 |
|
Aircraft Impact
90-100% Fill in Peak Hours (T9Aa) |
2.4×10⁻¹² |
98 |
|
Aircraft Impact
60-90% Fill in Peak Hours (T9Ba) |
3.4×10⁻¹³ |
60 |
|
Aircraft Impact
35-60% Fill in 10m/s wind in Peak Hours (T9Ca) |
8.4×10⁻¹⁶ |
25 |
|
Aircraft Impact
35-60% Fill in 5m/s wind in Peak Hours (T9Ca) |
5.9×10⁻¹⁴ |
11 |
|
Aircraft Impact 35-60%
Fill in 2m/s wind in Peak Hours (T9Ca) |
2.1×10⁻¹³ |
3.8 |
|
Aircraft Impact
35-60% Fill 0m/s in Peak Hours (T9Ca) |
7.6×10⁻¹⁵ |
3.8 |
|
Aircraft Impact
<35% Fill in 10m/s wind in Peak Hours (T9Da) |
7.9×10⁻¹⁵ |
7.7 |
|
Aircraft Impact
90-100% Fill During the Day (T9Aa) |
4.7×10⁻¹² |
59 |
|
Aircraft Impact
60-90% Fill During the Day (T9Ba) |
6.8×10⁻¹³ |
33 |
|
Aircraft Impact
35-60% Fill in 10m/s wind During the Day (T9Ca) |
1.7×10⁻¹⁵ |
25 |
|
Aircraft Impact 35-60%
Fill in 5m/s wind During the Day (T9Ca) |
1.2×10⁻¹³ |
11 |
|
Aircraft Impact
35-60% Fill in 2m/s wind During the Day (T9Ca) |
4.3×10⁻¹³ |
3.8 |
|
Aircraft Impact
35-60% Fill in 0m/s wind During the Day (T9Ca) |
1.5×10⁻¹⁴ |
3.8 |
|
Aircraft Impact
<35% Fill in 10m/s wind During the Day (T9Da) |
1.6×10⁻¹⁴ |
7.7 |
|
Aircraft Impact
90-100% Fill at Night (T9Aa) |
1.2×10⁻¹¹ |
3.2 |
|
Aircraft Impact
60-90% Fill at Night (T9Ba) |
1.7×10⁻¹² |
0.82 |
|
Aircraft Impact
35-60% Fill in 10m/s wind at Night (T9Ca) |
4.2×10⁻¹⁵ |
5.9 |
|
Aircraft Impact
35-60% Fill in 5m/s wind at Night (T9Ca) |
3.0×10⁻¹³ |
4.5 |
|
Aircraft Impact
35-60% Fill in 2m/s wind at Night (T9Ca) |
1.1×10⁻¹² |
3.75 |
|
Aircraft Impact
35-60% Fill in 0m/s wind at Night (T9Ca) |
3.8×10⁻¹⁴ |
3.75 |
|
Aircraft Impact
<35% Fill in 10m/s wind at Night (T9Da) |
4.0×10⁻¹⁴ |
0.77 |
10.8.1.3 Note that, for the societal risk criteria in the Technical Memorandum [20], the frequency to be plotted is cumulative (for N or more fatalities), so care must be taken in comparing any individual outcome directly with the criteria.
10.9 Comparison of Risk Levels With Criteria
10.9.1.1 Risk levels in terms of identified potential numbers of fatalities and frequencies have been summed for comparison with the criteria in the Technical Memorandum [20], as reproduced in Appendix H1. These cover both individual risk and societal risk criteria.
10.9.2.1 Location specific individual risk (LSIR) levels have been evaluated using the ESR Rifle risk contouring package. LSIR contours make no allowance for the amount of time someone would be present at the location and risk levels for any individual or group (sometimes referred to as Individual Risk Per Annum or IRPA) will always be less than the LSIR.
10.9.2.2 An overview of the LSIR for the PAFF is shown in Figure 10.6. This shows no off-site risk levels that exceed the criterion of 1 × 10‑5 /yr in the Technical Memorandum [20]. The highest identified risk levels are on the sea, associated with the jetty and the storm water outlet, peaking at 6 × 10‑6 /yr.
Figure 10.6: Location Specific
Individual Risk Levels for the PAFF Showing All Identified Scenarios for the
Final Development (12 Tanks)
10.9.2.3 The LSIR levels around the submarine pipeline are included in Figure 10.6 and contribute to the straight 10‑9 /yr contour extending out along the pipe route to the West. The risk levels for the submarine pipeline to the AFRF at Sha Chau are shown on their own in Figure 10.7. These peak at 4 × 10‑9 /yr immediately above the pipeline.
10.9.2.4 Individual risk levels from the existing pipeline from the AFRF to the airport will be similar to the those identified for the pipeline to the AFRF. They are not predicted to change due to the operation of the PAFF and are therefore not plotted in Figure 10.7.
10.9.2.5 The predicted LSIR values on land around the tank farm are much lower than for the jetty and storm water outlet, as shown in more detail in Figure 10.8.
Figure 10.7: Location Specific Individual
Risk Levels for the Submarine Pipeline to the AFRF at Sha Chau for the Final
Development (12 Tanks)
Figure 10.8: Location Specific
Individual Risk Levels Around the Tank Farm From All Tank Farm Scenarios for
the Final Development (12 Tanks)
10.9.2.6 Peak LSIR values on the PAFF boundary on land are predicted to be 4 × 10‑8 /yr, with risk levels dropping to below 1 × 10‑8 /yr on the public access road and a similar distance into the EcoPark areas. These risks are due primarily to Jet A1 releases retained within the site boundary, but where flame drag may impinge areas off-site. Since no allowance for escape is made in these areas, to avoid being optimistic, the risk here may in practice be overstated. However, the risk levels are well below the criterion of 1 × 10‑5 /yr in the Technical Memorandum [20].
10.9.2.7 Although the LSIR is predicted to be finite over the SWS mill building and Phase I of the EcoPark, the risk levels predicted are extremely small. None of the off-site risks on land, for example, exceed typical estimates for the individual risk due to being struck by lightning (~10‑7 /yr).
10.9.2.8 Off-site LSIR levels are summarised below for the final development (figures are similar or lower for the initial development):
Table 10.57: Summary of Location Specific Individual Risk (LSIR) Levels for Final Development
|
Location Specific
Individual Risk for Final Development |
LSIR (/yr) |
|
On PAFF Tank Farm Boundary |
4 × 10‑8 |
|
Storm water Outlet |
6 × 10⁻⁶ |
|
Jetty |
5 × 10⁻⁶ |
|
Marine Transport |
5 × 10⁻⁷ |
|
Submarine Pipeline |
4 × 10‑9 |
10.9.2.9 The highest identified LSIR values off-site are estimated at 6 × 10‑6 /yr near the storm water outlet due to releases through the drainage system and 5 × 10‑6 /yr at the jetty due to releases from incidents at the jetty. The marine individual risk levels are more than a factor of 10 less than the criterion. The LSIR values around the tank farm boundary are predicted to be more than a factor of 100 below the criterion and the risks from the submarine pipeline are even lower.
10.9.2.10 No off-site risk levels are identified that exceed the criterion of 1 × 10‑5 /yr in the Technical Memorandum [20]. The only area of any concern for individual risk is therefore between the jetty and the shore near the storm water/drainage outlet and this is still below the criterion.
10.9.2.11 For comparison, the annual risk of death during "normal" life is of the order of 10-2 per year over an entire life span; the risk is high as a young infant, declines significantly during early adulthood to around 5 × 10‑4 per year, but then increases with age. Some approximate examples of events, which relate to various frequencies, are given below.
Table 10.58: Some Examples of Events Associated With Various Frequencies
|
Frequency (/yr) |
Comments |
|
1 |
Expected to occur once per year (e.g. Christmas but less regular). |
|
10-1 |
Once in ten years – for example an event with this frequency would be expected to occur 3-4 times during the PAFF lifetime of 36 years. |
|
3 ´ 10-2 |
Would be expected to occur approximately once in the PAFF lifetime. |
|
10-2 |
An event more likely not to occur than to occur in the PAFF lifetime (36 years). Average individual risk of fatality over a lifetime. |
|
10-3 |
Typical frequency of death for an individual aged 25 to 45. |
|
10-4 |
Individual risk of death in a traffic accident. |
|
10-5 |
Approximately once during the period that
modern man has been on the Earth. |
|
10-6 |
Individual risk of death in air transport accidents, gas explosions, etc. |
|
10-7 |
Individual frequency of death due to lightning strike. |
|
10-9 - 10-10 |
Once during the age of the Earth (~4.5 billion years). |
10.9.2.12 The individual risk levels assessed for the PAFF, lie in the region of 10‑6 /yr for the marine risk and close to 10‑9 /yr for the instantaneous failure of a tank.
10.9.3.1 Societal risk is expressed in the form of an F-N curve, which represents the cumulative frequency (F) of all event outcomes leading to N or more fatalities. The societal risk levels from the identified scenarios have been assessed for both the initial development and final development cases and are plotted in Figure 10.9 and Figure 10.10 respectively, together with the criteria from the Technical Memorandum (see Appendix H1).
10.9.3.2 The identified risk levels lie well within the acceptable region identified in the Technical Memorandum. The overall results lie between half and two orders of magnitude below the acceptable criterion line. The results for individual fatality are associated with fires due to releases on the jetty and due to releases to the sea from the site drainage system.
10.9.3.3 The overall FN curve is dominated by incidents on the jetty, up to the 10 fatality level, as one would normally expect for an oil import facility. However, even these risks are low due to the difficulty in igniting a spill of Jet A1. Risks due to marine transport and tank farm storage are generally much lower, except for very high fatality levels at low frequencies where the possibility of a collision with a ferry carrying many passengers, and the subsequent effects of a release and fire, dominate.
10.9.3.4 Risks from the submarine pipeline to the AFRF at Sha Chau make little contribution and the risks from instantaneous tank failures are well below the other risks identified for the PAFF.
Figure 10.9: Societal Risk From The
PAFF For Initial Development (8 Tanks)
Figure 10.10: Societal Risk From The
PAFF For Final Development (12 Tanks in 2025-30)
Figure 10.11: Breakdown of Societal
Risk From Instantaneous Tank Failures Between Affected Populations For Initial
Development (8 Tanks)
Figure 10.12: Breakdown of Societal
Risk From Instantaneous Tank Failures Between Affected Populations For Final
Development (12 Tanks in 2025-30)
Figure 10.13: Sensitivity of Societal Risk
From Instantaneous Tank Failures to Basis of Assessment For Final Development
(12 Tanks in 2025-30)
10.9.3.5 This hazard to life assessment has been updated to include a detailed analysis of a instantaneous failure of a tank following a judgement in favour of SWS [2]. These specific scenarios are shown separately in Figure 10.11 (Initial Development) and Figure 10.12 (Final Development), broken down between the affected populations.
10.9.3.6 All the risks identified for the instantaneous tank release scenario are well below the acceptable criterion in the Technical Memorandum, by at least a factor of 100.
10.9.3.7 For the Initial Development, including only the 8 tanks nearest the EcoPark (Figure 10.11), the small residual risk is almost entirely to populations on the EcoPark. The identified risks to workers at SWS are over 2 orders of magnitude below the axis of societal risk criteria in the Technical Memorandum and over 5 orders of magnitude below the acceptable risk criteria.
10.9.3.8 For the final development, including all 12 tanks (Figure 10.12) the risk levels from instantaneous failure are predicted to be similar for the workers at the EcoPark and at SWS, and to remain well within the acceptable region, by at least a factor of 100.
10.9.3.9 The cautious best estimate used in this assessment is intended to provide a result which is above the real risk level, due to the caution inherent in some of the constituent figures, including:
· The frequency estimate assumes that an instantaneous release from a PAFF tank can occur, although no direct historical evidence has been found that such a scenario is credible for tanks designed and operated in an equivalent way to the PAFF tanks.
·
The aircraft impact frequencies
are derived consistently with previous assessments in
· No allowance for escape from a Jet A1 pool fire is made for anyone within the predicted area of the pool or flame drag.
· Ignition probabilities do not take full account of the potential reduction identified due to the high flash point of Jet A1.
· The lower limit estimate for historical tank population has been used to estimate the instantaneous failure frequency, giving the highest predicted frequency.
10.9.3.10 Figure 10.13 shows the effects of removing some of this caution by using the lower frequency and ignition probability estimates, but still assuming that a instantaneous release from a PAFF tank can occur and that people within the predicted pool area have no chance of escape. Allowing for these factors would reduce the predicted risk levels further. However, even without this, the lower estimate for the entire FN curve for the instantaneous tank failure at the PAFF lies well below the baseline value of the criteria in the Technical Memorandum [2].
10.9.3.11 The upper estimate in Figure 10.13 is included to show the effects of adding a significantly increased degree of caution into the calculations, including a more pessimistic instantaneous failure frequency and the upper estimate ignition probabilities. ESR consider that it is extremely unlikely that the actual risk from instantaneous tank failure at the PAFF could lie above this line. This estimate lies entirely within the acceptable region of the criteria in the Technical Memorandum [2]. It is always possible to produce even higher risk estimates based on extremely pessimistic assumptions. However, ESR do not consider that such higher estimates would be consistent with information available and the proposed design, location and operation of the PAFF.
10.9.3.12 A simple sensitivity has been conducted to examine the effect of construction work in the PAFF bund during the construction of the remaining tanks for the final development (see Paragraph 10.1.4.8). This is likely to introduce additional ignition sources within the overall bund that could increase the probability of ignition for an instantaneous tank failure or other event involving overtopping of this bund. The effects on other scenarios (T10 and T14) are not considered significant since they would only apply to releases overtopping into the remaining bund area rather than off-site and would not dominate the overall bund fire frequency. The sensitivity uses a simple increase of the ignition probability in the PAFF bund to a high value of 0.1 for Jet A1 (a factor of 25 increase) to account for this. This approximately doubles the predicted off-site societal risk levels for the instantaneous tank failures only during the initial development, resulting in a societal risk level for instantaneous tank failures very similar to that when the final development is complete. The effect is greater for events affecting lower numbers of fatalities than those affecting higher numbers of fatalities, where off-site ignition sources dominate. The effects of the construction work for the remaining tanks on the overall off-site societal risk curve is not significant, but care should nonetheless be taken in planning and executing this construction activity.
10.9.3.13 Estimates for the potential loss of life (PLL) are also made as these are useful in cost benefit analysis. The PLL simply represents the sum over all the incidents identified of the product of the numbers of fatalities and the frequency. It is an estimate of the equivalent number of fatalities per year.
Table 10.59: Potential Loss of Life (PLL) and Breakdown Between Areas
|
PLL (/yr) |
Development
Phase |
|
|
Initial |
Final |
|
|
Marine Transport |
1.5×10⁻⁶ |
1.5×10⁻⁶ |
|
Jetty Operations |
4.5×10⁻⁶ |
4.8×10⁻⁶ |
|
Tank Farm Storage: |
|
|
|
· Instantaneous failures (excluding aircraft impact) |
3.3×10⁻⁸ |
8.2×10⁻⁸ |
|
· Instantaneous failures due to aircraft impact |
1.5×10⁻⁹ |
4.8×10⁻⁹ |
|
· Release from site drainage |
1.3×10⁻⁶ |
1.3×10⁻⁶ |
|
· Other incidents |
2.4×10⁻⁷ |
3.1×10⁻⁷ |
|
Total for Tank Farm |
1.6×10⁻⁶ |
1.7×10⁻⁶ |
|
Submarine Pipeline |
4.8×10⁻⁸ |
4.8×10⁻⁸ |
|
Total for PAFF |
7.5×10⁻⁶ |
8.0×10⁻⁶ |
10.9.3.14 60% of the PLL is predicted to come from the jetty operations and the marine operations contribute almost 20%. The majority of the remaining PLL is due to releases from the site drainage. Instantaneous tank failures contribute ~1% to the PLL.
10.9.3.15 Following the interest raised in the Court of Final Appeal [2], the PLL estimates are broken down between the potentially affected populations, for the instantaneous failure scenario, below:
Table 10.60: PLL for Population Affected due to Instantaneous Tank Failure
|
Population Affected |
PLL (/yr) for Development Phase |
|
|
Initial |
Final |
|
|
SWS population only |
4.5×10⁻¹¹ |
4.9×10⁻⁸ |
|
EcoPark population only |
3.3×10⁻⁸ |
3.4×10⁻⁸ |
|
Other populations only |
1.3×10⁻⁹ |
3.4×10⁻⁹ |
|
Total for all populations |
3.4×10⁻⁸ |
8.7×10⁻⁸ |
10.10 Risk Mitigation Measures
10.10.1.1 Based on the results presented in Figure 10.10, the overall risks lie well within the acceptable region of the criteria in the Technical Memorandum [2] and therefore no further mitigation is necessary.
10.10.1.2 However, it is still possible to evaluate potential measures to reduce the risk levels further and to estimate the costs and benefits associated with them to assess if they are reasonable investments.
10.10.1.3 The Value of a Statistical Life (VOSL) can be considered as the
price an organisation is willing to pay to avoid the death of an unknown
individual. The value adopted for the VOSL in similar studies in
10.10.1.4 To assess if a potential mitigation measure can be justified on cost-benefit grounds, an Implied Cost of Averting a Fatality (ICAF) can be calculated and compared with the VOSL value. ICAF may be calculated as COST OF MEASURE / PLL REDUCTION / LIFETIME. The ICAF is the monetary value that, by implication, is placed on a statistical life by adopting, or failing to adopt, a risk reduction measure.
10.10.1.5 As an example, the lowest cost risk reduction measure identified for the overall risks from the instantaneous tank failure scenario would be to increase the proportion of welds inspected by x-ray to 100% of those practical. The cost of this is estimated at HKD 250,000 per tank. A nominal risk reduction of 50% of the identified PLL for instantaneous failures (excluding aircraft impact) is included to provide an indicative estimate of the ICAF. The actual effectiveness of this measure is difficult to determine but must lie between 0% and 100%; the 50% estimate cannot lead to an overestimate of the ICAF by more than a factor of 2, but could lead to a serious underestimate. If the measure appeared justifiable with a 50% risk reduction it would be worth investigating further the level of risk reduction that could be achieved in practice. For 12 tanks, this provides an ICAF of 12×250,000/4.1×10‑8/36 = HKD 2 trillion[1]. This is 60,000 times the identified VOSL and is clearly not justified.
10.10.1.6 A large part of the predicted PLL is associated with releases to the sea via the site drainage system. The system includes isolation valves, but it may be possible to improve on the probability that a spill will be detected quickly. This is not simple because it requires that an oil spill can be quickly and easily differentiated from an oil spill in the drainage system. Even if a way could be found to improve on the detection probability it is likely to involve large catchment/settling areas and cost well in excess of HKD 1,000,000. At this level of expenditure, even if it could completely eliminate the PLL via the drainage system, it would give an ICAF of 1,000,000/1.3×10‑6/36 = HKD 20 billion and would not be justified.
10.10.1.7 Part of the predicted PLL due to releases to the sea via the site drainage system is associated with releases from the limited pipework between the tank bund and the pump platform bund which goes under the site road. A release from this area could drain via the storm water drains rather than the interceptor. Ensuring this limited area drained via the interceptor (e.g. ensuring that any release would drain via the pump platform area) would reduce the PLL for this scenario by ~2.8 × 10‑7 /yr (see 10.5.9.9). Assuming this could be achieved at limited cost of around HKD 30,000, then the ICAF would be 30,000/2.8×10‑7/36 = HKD 3 billion. Whilst this cannot be justified in these terms, it would also make a reduction in the peak off-site individual risk level by ~1 × 10 ‑6 /yr, which may be considered worthwhile if it can be achieved at very limited cost.
10.10.1.8 The PAFF tank bunds are already surrounded by a further two impervious security walls (see Figure 10.2). It has been suggested that the site fence could be turned into a further security wall to reduce any off-site flow due to an instantaneous failure of the tank. However, this fence is only a further 6m from the outer security wall and a review of the physical test results for instantaneous releases suggests that a wall at this location would only make a small impact on the flow outside the PAFF boundary; most of the overtopping liquid would vault this wall in addition to the current security walls. It is estimated that this could reduce the potential volume of Jet A1 escaping from the PAFF by 10-20% at most, so a nominal 15% reduction in the PLL from instantaneous failures is assumed. Assuming a nominal cost of HKD 10 million, the ICAF would be 10,000,000/1.3×10‑8/36 = HKD 20 trillion. This is 600,000 times the identified VOSL and is clearly not justified.
10.10.2.1 Based on the assessed levels of risk, no specific risk reduction recommendations are considered necessary for the PAFF.
10.10.2.2 Recommendations are therefore limited to best practice measures including those identified in the previous EIA [1], as follow:
· The marine jetty risk is dominated by impact, i.e. caused by the approaching vessel striking the jetty resulting in spill and fire. A number of measures are already proposed in the design - fenders designed for impact loads, use of tugs, use of pilots aboard every vessel, restriction on maximum velocity for approach, etc. Further measures to minimise the risks from impact events should be examined. These may include the use of a berthing aid system as a good practice measure. Under this system, two radar sensors located on the jetty would provide continuous information (ships position relative to the jetty, speed of ship and angle of ship related to berthing line) about the ships. Such advanced berthing aid systems are known to reduce the likelihood of berthing impact incidents.
· The storm water drainage system for the PAFF site includes a fail safe final shutdown valve at the outlet that is actuated automatically on high-high level in the interceptor. The reliability of this system should be checked to ensure it complies with at least a SIL 1 specification (maximum probability of failure on demand 0.1) and this system should be included in the regular testing programme for safety critical systems.
· It should be ensured in the final design, if practical at negligible cost, that the limited area of pipework between the tank and pump platform bunds is contained and drains via the interceptor, rather than the storm water system.
· A regular checking procedure should be developed to ensure that bund valves for all contained areas are normally kept closed and only opened specifically to drain accumulated water and closed promptly afterwards.
· The operational procedures for storm water drainage should be prepared in the case of any spill or fire incident at the tank farm.
· If practical, the access road to the PAFF should be designated a no waiting/parking area to facilitate fire service access and evacuation of the area in an emergency.
· The onsite and offsite Emergency Plans for PAFF should be developed and tested on a regular basis. Offsite emergency plans including evacuation plans and communication arrangements should be developed in conjunction with the Fire Services Department (FSD), Police, Marine Department and other agencies. Offsite emergency plans for the neighbouring sites will be prepared in order to have an effective evacuation within a short period of time. These will be submitted by the project proponent during detailed design of the facility.
· The off-site emergency plan should include procedures for the Police including the Marine Police, including cordoning-off the access roads, evacuating the neighbouring sites, and cordoning-off the sea lanes adjoining the site.
· The onsite and off-site emergency plans should consider tank to tank fire escalation, bund fire escalation and smoke effects from fires in developing suitable emergency response measures.
· The operating procedures for unloading fuel from tankers at the jetty and for tank farm operations should include procedures in the event of thunderstorm warning, typhoon and lightning. Onsite emergency procedures should include actions to be taken in the unlikely event of ignition of vents due to lightning.
· Since the tank farm will be constructed in phases, suitable measures should be adopted for ignition control, for restricting access to operating areas and for tie-in with operating facilities. In particular, leak tight bund segregation between operational and construction areas (see 10.1.4.7) will be necessary.
· It is assumed that any future buildings immediately adjacent to the site boundary will not be high rise to avoid the impact of any smoke ingress. Should high rise buildings be proposed in these areas in the future, incorporation of appropriate mitigation measures and an assessment of the residual risks would be recommended.
·
Following the Buncefield
incident in the
10.11.1.1 The potential hazardous scenarios from the initial development and final development phases of the PAFF have been identified and quantitatively assessed.
10.11.1.2 The Jet A1 stored at the PAFF is much less hazardous than fuels such
as gasoline stored at many tank farms because of its low flash point; this
makes even a large release of Jet A1 difficult to ignite without additional
heating. Jet A1 under ambient conditions in
10.11.1.3 Apart from the extremely unlikely event of instantaneous tank rupture, the hazard ranges from the tank farm itself do not extend beyond the site boundary on land except in unfavourable wind conditions. In these cases the hazard ranges extend between a few metres and 30 m beyond the site boundary in the very worst conditions, based on a cautious assessment. The hazards to the neighbouring populations on land are therefore limited to short range flame impingement hazards due to a tank bund fire, or other fire contained within the PAFF site, and the extremely unlikely possibility of a fire due to a major Jet A1 release over the site boundary due to instantaneous tank failure and subsequent ignition.
10.11.1.4 No historical incidents have been identified that are relevant to a instantaneous failure of a PAFF tank and a review of potential causes also reveals that instantaneous failure is extremely unlikely for the PAFF tanks. Nevertheless, an instantaneous release was an issue of concern to the Court of Final Appeal [2] and has therefore been quantitatively assessed. Both instantaneous loss of the complete tank wall and unzipping of one side of the tank have been included for completeness, although McBride only specifically assessed the former in his review (Paragraphs 66 to 69 of [9]).
10.11.1.5 The hazard ranges from instantaneous rupture events have been assessed based on physical modelling specifically conducted for the PAFF for the scenarios of most concern that may extend a significant distance into the adjacent areas of SWS and EcoPark. Based on the assessment, the risk levels for instantaneous failures of PAFF tanks fall well within the acceptable range of the criteria in the Technical Memorandum [20].
10.11.1.6 The highest individual risk levels are predicted at the jetty and immediately adjacent to the storm water / drainage outlet from the tank farm. These individual risk levels lie within the criteria of the Technical Memorandum [20]. Individual risk levels on land outside the fence of the PAFF, and at sea from the marine activities and submarine pipeline, lie well within the acceptable criteria of the Technical Memorandum [20].
10.11.1.7 The societal risks from all the identified scenarios lie entirely within the acceptable region of the criteria of the Technical Memorandum [20].
10.11.1.8 Based on the analysis presented in this section, it is concluded that the offsite individual and societal risks posed by the PAFF tank farm and associated marine activities environment are acceptable according to the criteria set out in Annex 4 of the Technical Memorandum [20].
10.12.1.1 The hazard assessment has predicted that the risks from the operation of the PAFF and any associated hazards to life are acceptable according to the criteria in the Technical Memorandum [20], without any additional mitigation measures, beyond those already planned. The limited recommendations above are therefore only a matter of good practice and no adverse residual impacts are predicted even without their implementation
10.13 Environmental Monitoring and Audit
10.13.1.1 The risks from the operation of the PAFF have been shown to be acceptable based upon the integration of various detection, control and containment measures into the design of the facility. Based upon this, while construction and operational phase EM&A is not recommended over and above the regular programme of inspections that will be specified in the response plan, design phase audit of the spill response plan to ensure it includes the necessary elements and of the design of the pipelines, tanks and jetty to ensure key spill detection and control equipment are included is recommended. Further details are provided in Section 15 of this report and in the EM&A Manual.
[1] Section 10 “Hazard to Life Assessment” of the Permanent Aviation Fuel Facility for Hong Kong International Airport Environmental Impact Assessment Report (http://www.epd.gov.hk/epd/eia/register/report/eiareport/eia_0772002/EIA%20hyper/Sect10-hazard%20rev1.htm#S10) (accessed 28/11/02 – now superseded).
[2] Judgement in the Court of Final Appeal of the Hong Kong Special Administrative Region, Final Appeal No. 28 of 2005 (Civil) (on appeal from CACV No. 350 of 2003), Between Shiu Wing Steel Limited (Appellant) and Director of Environmental Protection Respondent), Airport Authority Hong Kong (Interested Party), 17 July 2006.
[3]
Judgement in the court of the
Hong Kong Special Administrative Region Court of First Instance, Constitutional and
Administrative Law List No.184 of 2002, Between Shiu Wing Steel Limited
(Appellant) and Director of Environmental Protection Respondent), Airport
Authority
[4] Judgement in the court of the Hong Kong Special Administrative Region Court of Appeal, Civil Appeal No. 350 2003 (On appeal from HCAL No.184 of 2002), Between Shiu Wing Steel Limited (Appellant) and Director of Environmental Protection Respondent), Airport Authority Hong Kong (Interested Party), 18 March 2005.
[5]
Code of practice for oil storage installations 1992, Building
Authority,
[6] The Permanent Aviation Fuel Facility Independent Safety and Risk Study, Final Report, Document No. 208150/01, Mott Connell Limited, 10 December 2003.
[7]
Environmental impact assessment
study brief No. ESB – 072/2001, Permanent Aviation
Fuel Facility for
[8] Exposure of the Shiu Wing Steel Mill from possible fire and explosion incidents at the permanent aviation fuel facility proposed at Tuen Mun Area 38, Prepared by Macinnis Engineering Associates Ltd., October 16, 2002.
[9]
Independent Review of Hazard
Assessment of Proposed Permanent Aviation Fuel Facility for
[10] Environmental Impact Assessment for Development of an EcoPark in Tuen Mun Area 38. Scott Wilson Ltd., Final EIA Report. April 2005
[11] Application for Variation of an Environmental Permit, filed by Airport Authority Hong Kong, 28th January 2004, in relation to Environmental Permit No. AEP-139/2002.
[12] Bund capacity calculations, Tank Capacity cal Area A & B _ 4 and 6 tk rev.0.xls, Leighton Contractors, Asia Limited.
[13] Steel formed temporary bund wall, PAFF/LC/02/DWG/G/0113/A, Leighton Contractors, Asia Limited.
[14]
Permanent Aviation Fuel
Facility Design, PAFF/LC/01/DSG/G/0201 Rev.D,
Leighton Contractors (
[15] Development Calculation, Block Plan, General Notes & Schedule No. PAFF/RJ/01/DWG/G/3001(IN) (Rev K)
[16]
Affirmation of Brian Robert Gillon, in the
High Court of The
[17] Risk criteria for land-use planning in the vicinity of major industrial hazards, HSE 1989. Specifically paragraph 26.
[18] The Hong Kong EIAO Technical Memorandum (http://www.epd.gov.hk/epd/eia/english/legis/memorandum) (accessed 4/12/02).
[19] The Hong Kong EIA Ordinance (http://www.epd.gov.hk/epd/eia/english/legis/index1.html) (accessed 4/12/02).
[20] The Hong Kong EIAO Technical Memorandum Annex 4: Criteria for evaluating air quality impact and hazard to life (http://www.epd.gov.hk/epd/eia/english/legis/memorandum/annex4.html) (accessed 4/12/02).
[21]
Affirmation of Thomas George Maylor, in the High Court of The
[22]
Extreme Values and Dates of
Occurrence of Extremes of Meteorological
Elements between 1884-1939 and 1947-2005 for
[23] Number of Very Hot days observed at the Hong Kong Observatory since 1885, exclude 1940-1946 (criteria: daily maximum temperature >= 33.0 degrees C). http://www.weather.gov.hk/cis/statistic/vhotday_statistic_e.htm (accessed 7/9/06)
[24] Quantified risk assessment of aircraft fuelling operations, HSE Contract Research Report CRR 288, P Fewtrell, A Petrie, I Lines, N Cowell, A Livingston, C Jones, W S Atkins, July 2000.
[25] The SFPE Handbook of Fire Protection Engineering, Third Edition, NFPA, 2002. Specifically pages 2‑300 to 2‑306.
[26] Fire precautions at petroleum refineries and bulk storage installations, Part 19 of the Institute of Petroleum Model Code of Safe Practice in the Petroleum Industry, 2nd Edition, October 1993.
[27] Flammable and combustible liquids code, NFPA 30, 2000 Edition.
[28] Area classification code for installations handling flammable fluids, Part 15 of the Institute of Petroleum Model Code of Safe Practice in the Petroleum Industry, 2nd Edition, August 2002.
[29] Recommended practice for the classification of flammable liquids, gases or vapors and of hazardous (classified) locations for electrical installations in chemical process areas, NFPA 497, 1997.
[30]
Environmental assessment
services for Permanent Aviation Fuel Facility. Revised aviation fuel transport
risk assessment. Final Report, Contract M811 for Airport Authority
[31]
[32] MHIDAS March 2005. Major Hazards Incidents Data Service developed by AEA Technology plc on behalf of the Major Hazards Assessment Unit of the United Kingdom Health and Safety Executive (HSE).
[33] HSE. Hazardous Installations Directorate, Safety Report Assessment Guide - Highly Flammable Liquids (available at www.hse.gov.uk/hid).
[34] Guideline for quantitative risk assessment, ’Purple book’, CPR 18E, Publication Series on Dangerous Substances (PGS 3).
[35]
Buncefield Major Incident Investigation.
Initial Report to the Health and Safety Commission and the Environment Agency
of the investigation into the explosions and fires at the Buncefield oil
storage and transfer depot,
[36] Injuries and ill health in extractive and utility supply industries, http://www.hse.gov.uk/statistics/industry/extractive.htm (accessed 8/9/06).
[37] Review of QRAs of aviation fuel supply to Chek Lap Kok, DNV Technical, April 1998, for Aviation Fuel Supply Company.
[38]
Airport Authority
[39] J. Sirkar et al “A framework for assessing the environmental performance of tankers in accidental groundings and collisions”, SNAME Annual Meeting, 1998.
[40] A. Brown & J. Sajdak “Predicting probabilistic collision damage extents for tanker outflow assessment and regulation”, SNAME Annual Meeting, 2004.
[41] Oil Tanker Spill Statistics:2005, International Tanker Owners Pollution Federation Ltd, 2006, http://www.itopf.com/
[42] Caltex Safety Case, 1996, ERM Hong Kong.
[43] PAFF P&IDs - PAFF/LC/02/DWG/M/0203, G, Receipt P&ID; PAFF/LC/02/DWG/M/0204, I, Product storage P&ID (NO. 1 OF 3); PAFF/LC/02/DWG/M/0205, G, Product storage P&ID (NO. 2 OF 3); PAFF/LC/02/DWG/M/0206, H, Product storage P&ID (NO. 3 OF 3); PAFF/LC/02/DWG/M/0207, G, Transfer pump PAFF/LC/02/DWG/M/0208, C, Delivery system P&ID; PAFF/LC/02/DWG/M/0231, J, ISSPR, Receipt platform plan; PAFF/LC/02/DWG/M/0232, K, Tank farm product piping plan SHEET 1 OF 3; PAFF/LC/02/DWG/M/0233, L, Tank farm product piping plan SHEET 2 OF 3; PAFF/LC/02/DWG/M/0234, B, Tank farm product piping plan sheet 3 OF 3; PAFF/LC/03/DWG/M/0202, G, Jetty P&ID
[44] Loss prevention in the process industries, second edition, F P Lees, 1996. Specifically pages 16/152‑153 and Appendix 1/60.
[45] The Buncefield Investigation Progress report, Buncefield Major Incident Investigation.
[46] Bund effectiveness in preventing escalation of tank farm fires, T Davies, A B Harding, I P McKay, R G J Robinson, A Wilkinson, Process Safety and Environmental protection, 74, Part B, 88-93, May 1996. (Note: the authors of this paper are listed alphabetically - the address for correspondence is Dr A Wilkinson).
[47] Offshore Hydrocarbon Release Data, HSE OSD, 2005, from HSE on-line database, https://www.hse.gov.uk/hcr3/, July 2005.
[48] AEA Technology Report for UKOOA, 'An Analysis of the OIR12 Data and its use in QRA', AEAT/NOIL/27564001/002(R) Issue 1, 6 February 2001.
[49] Drainage information: email from S.K. Tsang to Amin Ebrahim, September 27, 2006, titled “oil interceptor” including G.A. of oil-water interceptor (PAFF/LC/02/DWG/C/0007, D), oil-water drainage tank farm utility flow diagram (PAFF/LC/02/DWG/M/0213, E), tank farm pump platform G.A. & R.C details (PAFF/LC/02/DWG/M/0262, D).
[50] Offshore Reliability Data 4th Edition, 2002.
[51] Rupture Hazards from Liquid Storage Tanks, EPA Chemical Safety Alert, EPA 550-F-01-001 January 2001.
[52] Based on Geotechnical Engineering Office (1991), Review of Earthquake Data for the Hong Kong Region, Publication No. 1/91, Civil Engineering Department, The Hong Kong Special Administrative Region, and Scott D N, Pappin J W, Kwok M K Y (1994), Seismic Design of Buildings in Hong Kong, Hong Kong Institution of Engineers, Transactions, Vol 1, No. 2, p37-50. Information supplied by ERM for QRA of 100% Instantaneous Scenario for PAFF.
[53]
N Ketchell, R Robinson and P
Genoud, Quantification and comparison of the risks of LNG storage concepts –
membrane and full containment, LNG12,
[54] The Ashland Tank Collapse, Prokop, J., Hydrocarbon Processing, 1988, Vol 67, Part 5, pp105-108.
[55] Bund overtopping - the consequence following catastrophic failure of large volume liquid storage vessels, A Wilkinson, SRD/HSE R530, October 1991.
[56] PARLOC 96 and 2001, The Update of Loss of Containment Data for Offshore Pipelines.
[57] Hong Kong Electric, QRA of Proposed Sub sea Gas Pipeline and associated Launcher/Receiving Stations, ERM, 2000.
[58] MTR Corporation Ltd, Tung Chung Cable Car Project, Environmental Impact Assessment (Final), Document No. 203842/01/A, March 2003, Section 10, Hazard to Life Assessment http://www.epd.gov.hk/eia/register/report/eiareport/eia_0902003/Figuresrev1/TOCrev1.htm
[59] Buncefield Standards Task Group, Initial report - recommendations requiring immediate action, 12/10/06,
[60]
Marine incidents in ports and harbours in Great Britain, 1988-1992,
R G J Robinson and A
[61] Catastrophic Failure of Storage Tanks, EPA Chemical Safety Alert, EPA 550-F-97-002b, May 1997
[62] Where has our petroleum storage capacity gone?, Wayne Geyer, Steel Tank Institute, available at http://www.steeltank.com/library/pubs/petroleum.html
[63] Energy Information Administration/Petroleum Supply Annual 2003, Volume 1, Table 1. U.S. Petroleum Balance, 2003, Available at http://www.eia.doe.gov/pub/oil_gas/petroleum/data_publications/petroleum_supply_annual/psa_volume1/current/pdf/table_01.pdf
[64] D.W. Phillips “Criteria for the rapid assessment of the aircraft crash rate onto major hazard installations according to their location””, United Kingdom Atomic Energy Report SRD/HSE R 435, 1987.
[65] P.G. Cowell et al “A methodology for calculating individual risk due to aircraft accidents near airports”.
[66]
Email from Amin Ebrahim (AAHK)
to
[67] Dwg No. PAFF/RJ/01/DWG/G/3002(IN), Rev I, May 2006.
[68] A.W. Evans et al “Third party risk near airports and public safety zone policy: NATS R&D Report 9636, 1997.
[69] Effects of secondary containment on source term modelling, HSE Contract Research Report CRR 324/2001, S O Clark, D M Deaves, I G Lines and L C Henson, W S Atkins, Appendix C, Incident I‑13.
[70] Ignition probability of flammable gases, H Spencer and P J Rew, Contract Research report 146/1997, prepared by WS Atkins for HSE.
[71] A model for the ignition probability of flammable gases, Phase 2, H Spencer, J H Daycock and P J Rew, Contract Research report 203/1998, prepared by WS Atkins for HSE.
[72] Development of a method for the determination of on-site ignition probabilities, J H Daycock and P J Rew, Contract Research report 266/2004, prepared by WS Atkins for HSE.
[73] Fire in bunds, A B Harding, AEA/CS/HSE R1004/R, February 1994.
[74] Classification of Hazardous Locations, Cox, Lees and Ang, Institute of Chemical Engineers, May 1991, ISBN 0 85295 258 9.
[75]
Large Scale LNG and LPG pool
fires, G A Mizner and J A Eyre. in The Assessment of
Major Hazards,
[76] Development of pool fire thermal radiation model, P J Rew and W G Hulbert, HSE Contract Research Report 96/1996.
[77] Advisory Committee on Dangerous Substances, Major hazard aspects of the transport of dangerous substances, Page 188, HMSO.
[78] A description of and user’s guide to the pool fire computer code PFIRE2, CMT/01/91, K Kinsella, D Jones, AEA Technology, 1991.
[79] http://www.shellglobalsolutions.com/hse/software/pdfs/PIPA.pdf
[80]
Results of calculations using
BP Cirrus pool fire model previously seen by
[81] Thermal radiation hazard ranges from large hydrocarbon pool fires, M Considine, SRD R 297, October 1984.
[82]
Scaling factors for pool fires
derived from large scale experiments, J Moorhouse. in The
Assessment of Major Hazards,
[83] Permanent Aviation Fuel Facility – Wind Speeds at Tuen Mun from Hong Kong Observatory’s database, provided by Airport Authority by fax on 9th January 2003.
[84] Bund overtopping – the consequence of catastrophic tank failure, A M Thyer, I L Hirst, S F Jagger, Journal of Loss Prevention in the Process Industries 15 (2002) 357-363.
[85] An experimental study of flow over an impounding dike, H P Greenspan and A V Johansson, Studies in Applied Mathematics 64:211-223 (1981).
[86] Flow over a containment dyke, H P Greenspan, R E Young, J Fluid Mech (1978) Vol 87 Part 1 pp 179-192.
[87] “An experimental investigation of bund overtopping and dynamic pressures on the bund wall following catastrophic failure of a storage vessel”, William Atherton, Prepared by Liverpool John Moores University for the Health and Safety Executive, Research Report 333, 2005.
[88] Reply given by a spokesman for the Environmental Protection Department to an enquiry by a reporter of "the Standard" in Feb 2006, as cited in email from Mathew Chan (EPD to Amin Ebrahim (AAHK) entitled “Population of EcoPark”, August 24, 2006.
[89] Project Profile for Expansion and Extension of Fill Bank at Tuen Mun Area 38, R260.04.V6.DOC, December 2004.