6 WATER QUALITY IMPACT ASSESSMENT
This Section describes the impacts on water quality associated
with the construction and the operation of the Proposed Beach Development. The sediment transport and sedimentation
resulting from dredging and sandfilling for the beach have been simulated
through computer modelling. The purpose
of the assessment is to evaluate the acceptability of predicted impacts to
water quality from the construction and operation of the Proposed Beach
Development. Impacts have been assessed
with reference to the relevant environmental legislation and standards.
The following relevant pieces of legislation and associated
guidance are applicable to the evaluation of water quality impacts associated
with the Proposed Beach Development.
·
Water
Pollution Control Ordinance (WPCO);
·
Environmental
Impact Assessment Ordinance (Cap.
499. S.16), Technical Memorandum on
Environmental Impact Assessment Process (EIAO-TM), Annexes 6 and 14;
and,
·
Practice Note
for Professional Persons, Construction Site Drainage (ProPECC PN 1/94).
6.2.1 Water Pollution
Control Ordinance (WPCO)
Under the WPCO, Hong Kong
waters are divided into 10 Water Control Zones (WCZs) each of which has a
designated set of statutory Water Quality Objectives (WQOs) designed to protect
the marine environment and its users.
The Proposed Beach Development is located within the Buffer Subzone
of the Tolo Harbour and Channel WCZ (which is
divided into three sub-zones, Harbour, Buffer and Channel). The applicable WQOs associated with the
Proposed Beach Development are presented in Table
6.1.
Apart from the parameters shown in Table 6.1, WQOs are also provided for temperature, pH and
salinity. However, construction of the
beach area, ie dredging and backfilling, will only result in elevation of
suspended solids (SS) concentration but will not change temperature, pH and
salinity. In addition, there will not be
any sewage discharges from the Proposed Beach Development to the marine water
in the WCZ during its construction and operation, the criteria for these
parameters are therefore not considered applicable and are not discussed
further.
Table 6.1: Relevant Water Quality
Objectives for Tolo Harbour and Channel WCZ (Buffer Subzone)
|
Parameter
|
Tolo Harbour and Channel WCZ
|
|
Buffer Subzone
|
|
Suspended Solids (SS)
|
No criteria established
|
|
Dissolved Oxygen (DO)
|
2
m above the seabed
|
Not
less than 4 mg L-1
|
|
within
2 m above the seabed
|
Not
less than 3 mg L-1
|
|
Fish
Culture Zone (a)
|
At
Fish Culture Zones the DO levels should not be less than 5 mg L-1
|
|
Nutrients (measured as inorganic
nitrogen)
|
No
criteria established
|
|
Unionised Ammonia (UIA)
|
No criteria established
|
|
Chlorophyll-a
|
Not
exceed 10 mg L-1 (mg m-3)
(calculated as a running arithmetic mean of 5 daily measurements for any
location and depth) (b)
|
|
Toxicants
|
Toxicants are not to be present at levels producing
significant toxic effect
|
|
E. coli
|
Not exceed 610 cfu per 100 mL, calculated as annual
geometric mean
|
Notes:
(a)
DO level of 5 mg L-1 is
WQO parameter generally applied for FCZ at other WCZs but there is no specific
DO level established for FCZ for Tolo
Harbour and Channel WCZ.
(b)
Chlorophyll-a WQOs at Tolo Habour and Tolo Channel
Subzones are 20 µg L-1
and 6 µg L-1 respectively.
Besides
the WQOs stipulated for the WCZ, a WQO for bathing beaches has been set under
the WPCO. The WQO states that the level of E. coli should not exceed 180 cfu per 100 mL, calculated as the
geometric mean for all samples collected from March to October inclusive. Samples have to be taken at least 3 times a
month at intervals of between 3 and 14 days.
This WQO applies to all bathing beaches in Hong
Kong waters.
6.2.2
Technical
Memorandum on Environmental Impact Assessment Process (EIAO-TM)
Annexes 6 and 14 of the EIAO-TM provide general guidelines and criteria to be used in
assessing water quality issues.
The EIAO-TM recognises
that, in the application of the above water quality criteria, it may not be
possible to achieve the WQOs at the source as there are areas which are
subjected to greater impacts (which are termed by EPD as the mixing zones)
where the initial dilution of a pollution input takes place. The definition of this area is determined on
a case-by-case basis. In general, the
criteria for acceptance of the initial dilution area is that it must not impair
the integrity of the water body as a whole and must not damage the ecosystem or
impact marine sensitive receivers (including migratory pathways of important species,
beaches, breeding grounds or other beneficial uses).
6.2.3
Practice Note
for Professional Persons, Construction Site Drainage (ProPECC PN 1/94)
Apart from the above statutory requirements, ProPECC PN 1/94 was issued by ProPECC in 1994 and it provides useful
guidance on the management of construction site drainage and the prevention of
water pollution associated with construction activities.
The construction method and sequence as described in Section 3 were reviewed to assess the remoteness
of the construction works of the Proposed Beach Development to existing and
committed Water Sensitive Receivers (WSRs).
The WSRs were identified according to guidance provided in the EIAO-TM.
The design of the beach, construction sequence, duration and
activities, and the operation activities were reviewed to identify activities
likely to impact upon identified WSRs and other water courses during
construction and operation phases. Following the identification of WSRs and potential water quality
impacts, the scale, extent and severity of potential net (ie unmitigated)
construction, operation impacts were evaluated against the assessment criteria
defined for this Proposed Beach Development, as discussed in the following
section. The evaluation was also taken
into account all potential cumulative effects including those of adjacent
projects, with reference to the WPCO criteria.
Where net water quality impacts exceed the appropriate WPCO
criteria, practical water pollution control measures/mitigation proposals were
identified to ensure compliance with reference to the WPCO criteria. Water quality monitoring and audit
requirements were developed, if necessary, to ensure the effectiveness of the
water pollution control and mitigation measures.
6.3.1
Defined
Assessment Criteria
The
WQO for the Tolo Harbour and Channel WCZ has been
discussed in Section 6.2.1. The WQO has stipulated criteria for pH,
temperature, salinity, DO, chlorophyll-a
and toxicants. As discussed before, no
sewage will be discharged into the marine water within the WCZ and hence it is
not necessary to define assessment criteria for pH, temperature and
salinity. There is, however, no WQO for
SS, Total Inorganic Nitrogen (TIN) and unionised ammonia (UIA) in the WCZ.
Assessment
Criteria for Suspended Solids and Dissolved Oxygen
In
view of the low background concentrations in the north eastern waters of Hong Kong (see discussion in Section 6.4), an alternate assessment criterion of allowable
increases in SS concentrations of 10 mg
L-1 has been adopted in previous projects. These projects included the EIAs for sand
dredging at the proposed Eastern Waters Marine Borrow Area (),
for uncontaminated mud disposal at the exhausted East Tung Lung Chau MBA (),
for jetting and dredging carried out in Tolo
Harbour and Channel and Mirs Bay
(). In addition, a 10 mg L-1 criterion
was used as the limit level in the EM&A programme for SS impacts to coral
areas during sand dredging at the West Po Toi MBA () and the dredging for a gas pipeline in
Tolo Harbour and Channel ().
There
are several fish culture zones (FCZ) located within the Study area and they are
considered to be sensitive receivers.
The FCZs within the area of expected influence of the Proposed Beach Development include Yim Tin Tsai West
and Yim Tin Tsai East. The only WQO that
is specific to FCZs is for dissolved oxygen.
However, there is no specific DO level established for FCZs for Tolo Harbour
and Channel WCZ. In addition to
dissolved oxygen there is a general water quality protection guideline for SS,
which has been proposed by AFCD. The
guideline requires that SS levels remain below 50 mg L-1. With
regard to the water quality modelling, the FCZs were included as discrete
points for evaluation in the assessment against the above criteria and
guideline. This criterion has been
adopted in the EIA for dredging for Towngas gas pipeline ().
It
is particularly relevant to make use of the abovementioned assessment criteria
for this Study because these previous projects were primarily concerned with
the potential for impacts to ecologically sensitive areas (ie areas of high
coral coverage, fish spawning areas, fish culture zones), which are the main
concern with regard to SS impacts during the construction phase.
Assessment
Criteria for Sediment Deposition
A
coral site has been identified at Pak Sha Tau (Figure 6.1) and it was evaluated as of medium ecological value in
the approved EIA for Towngas gas pipeline (). Coral communities have been identified in the
vicinity of the Project Site during the dive surveys conducted for this Proposed Beach Development. Sediment deposition is the key parameter to
evaluate the impacts to these corals.
Hard
or hermatypic corals are susceptible to increased rates of deposition, with the
species sensitivities to sedimentation being determined largely by the
particle-trapping properties of the colony and ability of individual polyps to
reject settled materials. Horizontal
platelike colonies and massive growth forms present large stable surfaces for
the interception and retention of settling solids while vertical plates and
upright branching forms are less likely to retain sediments. Tall polyps and convex colonies are also less
susceptible to sediment accumulation than other growth forms. It is also acknowledged that sensitivities to
sediment loads can also vary markedly between species within the same genus ().
Information
presented by Pastorok and Bilyard (1985) ()
has been regarded as the aforementioned when discussing the effects of sedimentation
on corals. Pastorok and Bilyard have
suggested the following criteria:
* 10 - 100 g m-2
day-1
slight to moderate impacts
* 100 - 500 g m-2
day-1 moderate to severe impacts
* > 500 g m-2
day-1 severe to catastrophic impacts
Fringing
and inshore reefal environments, however, are known to experience sedimentation
events in exceedance of the 500 g m-2 day-1 criterion and
support flourishing coral communities (). It is clear from the above that the adoption
of strict criteria for impact assessment based on Pastorok & Bilyard's
system of assessment for open water communities may well be overly protective
in an environment such as Hong Kong. However, using a precautionary approach, it
is proposed to adopt a value of 100 g m-2
day-1 as the assessment criterion for deposition, which is at
the lower end of the range for moderate to severe impacts specified above, for
the purposes of this Study. This
criterion has been utilised in Hong Kong (Eastern Waters, West Po Toi) before
and deemed to be sufficiently protective during EM&A ()
()
(). It should be noted that exceedance of this
value should trigger further assessment and should not be deemed to imply that
damage would necessarily occur. The
results from EM&A programmes in Hong Kong
that have adopted 100 g m-2 day-1 have indicated that no
adverse impacts to corals have occurred.
Assessment Criteria for E. coli
In
accordance with Study Brief Conditions 3.4.3.5 (xv), it is necessary to assess
the suitability of Lung Mei Beach to be operated as a gazetted bathing
beach. In this regard, the WQO for
bathing beach, ie E. coli levels less
than 180 cfu per 100 mL (calculated as the geometric mean for all samples
collected from March to October inclusive), is used for this purpose.
Assessment Criteria for Seawater
Intakes
Seawater
intakes at WSD Tai Po Industrial Estate and at the Marine Science Laboratory
(MSL) of Chinese University have their specific standards
and these are presented in Table 6.2. With respect to SS, 5-day Biological Oxygen
Demand (BOD5) and E. coli,
target quality standards for MSL seawater intake are more stringent than those
of WSD due to the reported purpose of the MSL intake which supplies the MSL
fish and invertebrate stock holding, culture and experimental facilities. The SS concentration for WSD and MSL intakes
should not be more than 10 mg L-1 (with an upper tolerance level of
20 mg L-1) and 5 mg L-1 respectively.
Table 6.2: Water Quality
Criteria for Seawater to be used by MSL and WSD (for Flushing
Water) Intakes
|
Parameter
|
MSL Target Limit
|
WSD Flushing Target
Limit
|
|
Colour
(HU)
|
-
|
<20
|
|
Secchi
Disc Depth (m)
|
>2
|
-
|
|
Salinity
(ppt)
|
>25
|
-
|
|
pH
|
>7.5
|
-
|
|
Turbidity
(NTU)
|
-
|
<10
|
|
Threshold
Odour Number
|
-
|
<100
|
|
Ammoniacal
Nitrogen (mg L-1)
|
-
|
<1
|
|
Total
Nitrogen (mg L-1)
|
<1
|
-
|
|
Total
Phosphate (mg L-1)
|
<0.1
|
-
|
|
Suspended
Solids (mg L-1)
|
<5
|
<10 (20 – upper threshold)
|
|
Dissolved
Oxygen (mg L-1)
|
-
|
>2
|
|
Dissolved
Oxygen (% saturation)
|
>10-30
|
-
|
|
Biochemical Oxygen Demand (mg L-1)
|
<5
|
<10
|
|
Synthetic
Detergents (mg L-1)
|
-
|
<5
|
|
Chlorophyll-a
(mg L-1)
|
<10-50
|
-
|
|
E. coli (cfu 100 mL-1)
|
<100-1,000
|
<20,000
|
Assessment Criteria for Dissolved
Metals and Organic Compounds
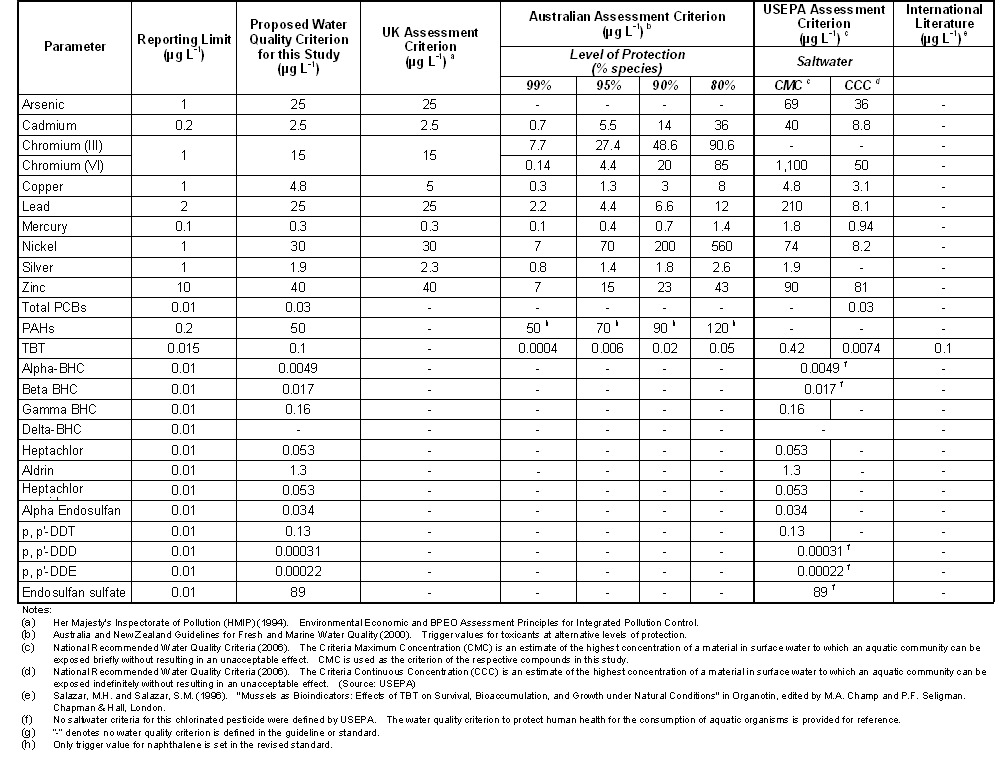
There
are no existing legislative standards or guidelines for dissolved metals and
organic compounds in the marine waters of Hong Kong. It is thus proposed to make reference to the
relevant water quality standards in the UK,
Australia
and USEPA. The proposed assessment
criteria are summarised in Table 6.3
and these values are total concentrations of the pollutants which takes the
ambient concentrations into account.
In
general, the proposed criterion is taken as the most stringent value among the
nation’s standards. When compared with
the Australian Assessment Criterion, it is noted that such criteria are broken
down into four categories, according to the level of protection desired (% of
species). It is unclear, however, which
of the above Australian criterion would be appropriate for application to Hong Kong. With
exception of Polychlorinated Aromatic Hydrocarbons (PAHs), for which only
Australian criterion is available, the UK and US standards are more
appropriate to be adopted as the assessment criterion.
Criterion
for Tributyltin (TBT) which was suggested in an international literature (see Table 6.3) is proposed to be used in
this Study. This value has been adopted
in the previous approved EIAs such as EIA for Decommissioning of Cheoy Lee
Shipyard at Penny’s Bay(),
EIA for Disposal of Contaminated Mud in the East Sha Chau Marine Borrow Pit (),
EIA for Wanchai Development Phase II ()
and EIA for Emissions Control Project at Castle Peak Power Station
"B" Units ().
It
is also considered important to note that the assessment criteria presented in Table 6.3 are based on long term
exposure. Works associated with the
construction of the Proposed Beach Development are,
however, relatively short term and in localised areas. Hence USEPA’s Criteria Maximum Concentration
(CMC) criteria are considered to be more suitable than Criteria Continuous
Concentration (CCC) since CCC is designed for the long term exposure.
Table 6.3: Proposed
Assessment Criteria for Dissolved Metals and Micro-Pollutants with Reference to
Standards Adopted by Other Countries
6.4.1
Water
Sensitive Receivers
The
Project Site is located in the Tolo Harbour, near Ting Kok Sites of Special Scientific
Interest (SSSI) & Coastal Protection Areas, Yim Tin Tsai East & West
Fish Culture Zones, Sha Lan Non-gazetted
Beach, Lung Mei & Yim Tin Tsai
Mangroves, Pak Sha Tau coral, WSD Seawater Intakes for Tai Po Industrial Estate
and Chinese University. Table
6.4 shows the identified water sensitive receivers (WSRs) (including
ecological sensitive receivers) in the vicinity of the Project Site and gives
the WSRs’ shortest distance to the Project Site. The water sensitive receivers have been
identified in reference with the Tai Po
Outline Zoning Plan (No. S/TP/19 – Tai Po), gazetted on 18th
November 2005, Outline Development and Layout Plan and relevant published
landuse plans. Figure 6.1 illustrates the surrounding environment for the
WSRs. These WSRs are regarded as the
output points in the water quality modelling in order to quantify the impacts
to these WSRs.
As
aforementioned, Pak Sha Tau coral was classified as medium ecological values in
the approved EIA (). Marine ecological dive surveys for this
Proposed Beach Development were undertaken in October 2006 and the results are
presented in Section 8 – Ecological
Impact Assessment. Very low number
of coral colonies was found during the marine ecological study area and all of
the identified coral species (totally 3 species) are either common or abundant
in Hong Kong waters and they are considered to
be low ecological value. Hence no
specific output points are designated for these coral communities in the water
quality model. However these coral
communities will also be assessed by examining the contour plots of the water
quality modelling results.
The
WSRs, SR 8 to SR12, are marked in
Figure
6.1. They represent the corners of
the Proposed Land Requirement Boundary (SR8, SR9, SR11 and SR12) and the middle
of the Project Site (SR10). The Project
Site itself is not a sensitive area and hence is not defined as the WSR for
construction phase impact assessment.
However, the WSRs are used to predict the water quality during the
operation phase of the Proposed Beach Development and to determine the
suitability of being a gazetted bathing beach.
Table 6.4: Water Sensitive Receivers (WSRs) in the Vicinity of the
Beach
|
Sensitive Receiver
|
Name
|
ID
|
Shortest Distance to the Project Site (km)
|
|
Fisheries Resources
|
|
Fish Culture Zone
|
Yim Tin Tsai West Fish Culture Zone
|
SR1
|
2.8
|
|
Yim Tin Tsai East Fish Culture Zone
|
SR2
|
1.5
|
|
Marine Ecological Resources
|
|
SSSI/Coastal Protection Area
|
Ting Kok SSSI, near Ting Kok
|
SR3
|
0.5
|
|
|
Ting Kok SSSI, near Shuen Wan
|
SR4
|
1.6
|
|
Mangrove
|
Ting Kok
|
SR5 (a)
|
0.5
|
|
|
Yim Tin Tsai, next to Yim Tin Tsai West Fish Culture Zone
|
SR6
|
1.9
|
|
Coral
|
Pak Sha Tau
|
SR7
|
3
|
|
Water Resources
|
|
Non-gazetted Beaches
|
Sha Lan
|
SR13
|
2.1
|
|
Seawater Intakes
|
MSL of Chinese
University
|
SR14
|
4.4
|
|
WSD at Tai Po Industrial
Estate
|
SR15
|
4.3
|
|
Other Recreational Areas
|
Tai Mei Tuk Water Sports Centre
|
SR16
|
immediate vicinity
|
|
EPD Monitoring Stations
|
Tolo Harbour & Channel WCZ
|
TM3, TM5, TM6
|
3.5, 1.4, 3.1
|
|
Notes:
(a) The modelling station
shown in
Figure 6.1 for SR5 is taken
the same as SR3 which is approximately 100m offshore.
|
6.4.2
Hydrodynamics
Tolo
Harbour
is a long narrow tidal inlet, which expands to form a large bay at the landward
end, into which a number of rivers and streams discharge. Shan
Liu River
and Lo Tsz River are adjacent to the Project Site. Tidal currents are generally low, 0.1 to 0.2
ms-1, within Tolo
Harbour, particularly
towards the landward end. Along the
outer, channel section, of the harbour the tidal currents are generally aligned
parallel with the channel, while in the bay at the landward end large
circulation patterns form. As a result
of the low current speeds the flushing rate of the Tolo Harbour
is low and residence times for the waters are long. Wave activity within Tolo
Harbour is not significant as the
waters are sheltered by the surrounding hills and because waves from the open
sea are not able to propagate up the Tolo
Harbour, due to the
narrow seaward entrance.
6.4.3
Water Quality
EPD monitoring results (1998-2005) indicate that there
is a gradient of improving water quality from the inner Tolo
Harbour Subzone
through to the outer Tolo
Channel Subzone. Three monitoring stations are located in the
vicinity of the Project Site, namely TM3, TM5 and TM6 (Figure 6.1). Among these
three stations, TM5 is the closest to the Project Site and hence has similar
characteristics to the baseline conditions in the Study Area. The water body in the vicinity of TM5 is
reported as having water quality in-between TM3 and TM6 (Table 6.5).
At
TM5, DO level at the bottom layer (2m above the seabed) has exceeded the WQO
once in 1999 whereas the annual mean value was above the WQO. EPD data (1998-2005) also indicates that
chlorophyll-a levels occasionally
exceeded the WQO but no non-compliances were recorded during 2005. As mentioned above, there is no WQO for SS
for the Tolo Harbour and Channel WCZ. The EPD data indicate that mean SS
concentrations ranged between ~1 and 8 mg L-1. Full compliance with the WQO was achieved for
E. coli and relatively low E. coli levels (maximum 56 cfu 100mL-1)
were recorded.
Table 6.5: EPD Routine Water Quality Monitoring Data (1998-2005) in
the Vicinity of the Project Area
|
WQ Parameter
|
Harbour
Subzone
|
Buffer
Subzone
|
Buffer
Subzone
|
|
TM3
|
TM5
|
TM6
|
|
Temperature (oC)
|
24.1
|
24.4
|
23.5
|
|
(14.2-32.0)
|
(14.2-31.7)
|
(14.0-30.9)
|
|
Salinity (ppt)
|
31.2
|
31.1
|
31.8
|
|
(25.7-34.6)
|
(25.2-34.3)
|
(25.0-35.6)
|
|
Dissolved Oxygen (Surface to 2m above Bottom)
(mg L-1)
|
7.3
|
6.5
|
6.7
|
|
(3.7-12.3)
|
(4.0-9.9)
|
(2.3-11.4)
|
|
Dissolved Oxygen (Bottom) (mg L-1)
|
6.3
|
6.7
|
5.3
|
|
(0.7-11.7)
|
(2.9-13.3)
|
(0.6-11.9)
|
|
5-Day Biochemical Oxygen Demand (mg L-1)
|
2.1
|
1.9
|
1.5
|
|
(0.2-5.6)
|
(0.6-5.6)
|
(0.1-5.5)
|
|
Suspended Solids (mg L-1)
|
2.5
|
2.8
|
2.1
|
|
(0.5-8.0)
|
(0.6-8.0)
|
(0.5-8.2)
|
|
Total Inorganic Nitrogen (mg L-1)
|
0.10
|
0.07
|
0.08
|
|
(0.01-0.34)
|
(0.01-0.37)
|
(0.01-0.34)
|
|
Unionised Ammonia (mg L-1)
|
0.005
|
0.004
|
0.003
|
|
(0.000-0.017)
|
(0.000-0.017)
|
(0.000-0.016)
|
|
Chlorophyll a (µg L-1)
|
8.3
|
6.3
|
5.5
|
|
(0.2-27.0)
|
(0.6-25.0)
|
(0.3-23.0)
|
|
E. coli (cfu 100mL-1)
|
3
|
3
|
1
|
|
(1-58)
|
(1-56)
|
(1-53)
|
|
Notes:
1. Data presented are depth averaged, except as
specified.
2. Data presented are annual arithmetic mean
except for E. coli, which are
geometric means.
3. Data enclosed in brackets indicate the
ranges.
4. Bolded numbers indicate non-compliance with
the WQOs.
5. Outliers have been removed.
|
6.4.4
Beach Water
Quality
Although
Lung Mei Beach is a non-gazetted beach, EPD routinely monitors the beach water
quality at least twice per month during bathing seasons (March to October) and
once per month during non-bathing season.
During each beach monitoring visit, beach water samples are collected at
three locations (see
Figure 6.2)
where the water depth is between thigh to waist depth, ie about 0.6 to 1 metre
depth, for analysis of E. coli.
The
monitoring data obtained between 2000 and 2006 are summarised in Table 6.6. The data showed that there is an overall
increasing trend in E. coli concentrations
throughout 2000-2005. In 2005, the level
reached its highest in record but remained below the beach WQO, ie 180 cfu per
100mL. A slight decrease in E. coli concentrations has been recorded
in 2006. According
to EPD’s annual ranking system, the rank of Lung Mei throughout 2000 – 2006 was
classified as ‘Fair’, which refers to the geometric mean of E. coli between 25 and 180 cfu per
100mL.
Table 6.6: EPD
Routine Beach
Quality Monitoring Data (2000-2006) at Lung Mei Beach
|
Year
|
Geometric
Mean of E. coli
(counts/100mL)
during March to October
|
|
2000
|
26.5
|
|
2001
|
64.1
|
|
2002
|
47.4
|
|
2003
|
91.4
|
|
2004
|
80.1
|
|
2005
|
164.6
|
|
2006
|
147.9
|
Further routine monitoring data for 2007 (up to September) was
obtained from EPD. Since it does not cover the
whole bathing season at the time of completion of this EIA Report, the annual geometric
mean is not able to be derived and hence is not presented in Table 6.6. The geometric mean during March 2007 to
September 2007 was calculated as 345 cfu per
100mL.
6.4.5
Existing
Watercourses and Drainage System
Within
the Study Area, there are several stormwater drainage outfalls along the coast
of Lung Mei.
The locations of these drains are shown in Figure 6.3.
There
are two box culverts just beside the Project Site. One of them is a single cell box culvert,
which is located at the western side of the Project Site and aligned underneath
Ting Kok Road,
carries surface runoff from the existing natural stream, Lo Tze River (W1-W3)
and eventually discharges into the sea.
Another single cell box culvert (W4), which is situated at the eastern
side of the Project Site, collects surface runoff from Ting Kok Road and the natural hillside at
Lung Mei.
In
order to characterise the water quality of the drains and watercourses, the
water from the stormwater drains (W4-W6), Lo Tsz River (W3) and upstream/midstream
(W1 and W2) of Lo Tsz River has been sampled and tested. Water sampling surveys were conducted on 28
December 2006, and 4, 11, 16, 23, 31 January 2007 to measure the flow rate,
temperature, pH and E. coli of the
effluents. During these site surveys,
the water in W4-W6 were found dirty and having some sewage odour. The water sampling results are summarised in Table 6.7. In the case that the flow could not be
measured (it was too little and slow), the flow rate was recorded as less than
0.01 m s-1.
Table 6.7: Water Sampling Results for the Existing Drains and
Watercourses measured between December 2006 and January 2007
|
ID
|
Location
|
Purity
|
Odour
|
Averaged Flow Velocity
(a)
(m s-1)
|
Temperature
(°C)
|
pH
|
Geometric Mean of E. coli
(counts per 100mL)
|
|
W1
|
Upstream of Lo Tsz River
|
Clear
|
No
|
<0.01
|
22.0
|
6.8
|
6.9E+02
|
|
W2
|
Midstream of Lo Tsz River
|
Mostly clear but found dirty during
one survey
|
Mostly without odour but with
sewage smell during one survey
|
0.49
|
22.1
|
7.3
|
7.2E+03
|
|
W3
|
Downstream of Lo Tsz River
|
Clear
|
No
|
0.03
|
21.9
|
6.9
|
9.1E+02
|
|
W4
|
Box culvert at the immediate east
of the Project Site
|
Dirty
|
With sewage smell
|
0.03
|
21.5
|
7.1
|
2.3E+04
|
|
W5
|
Box
culvert from Lung Mei village
|
Dirty
|
With sewage smell
|
0.01
|
22.0
|
8.1
|
5.9E+03
|
|
W6
|
Box culvert
from Tai Mei Tuk
|
Dirty
|
With sewage smell
|
<0.01
|
22.1
|
7.7
|
6.0E+01
|
|
Notes:
(a)
The averaged flow velocity is taken as the mean of measured data during all
surveys.
|
Based
on the water quality sampling results, there is a potential that the identified
watercourses may have contributed to E.
coli concentrations in the existing Lung Mei Beach. As such, the beach water quality monitoring
data obtained by EPD during the same period, ie from December 2006 to January
2007, have been reviewed. The EPD monitoring
results are taken as geometric mean of E.
coli data at three sampling stations within Lung Mei Beach and the E. coli concentrations are 3.4E+02 and
1.9E+02 counts per 100 mL in December 2006 and January 2007 respectively. These concentrations are found less than the
geometric mean of E. coli at the two
nearby drains, ie W3 and W4. This
indicates that the discharges from the drains may be diluted by the seawater
before reaching Lung Mei Beach.
6.4.6
Sediment
Quality
EPD Monitoring
EPD collects sediment quality data as part of the
marine water quality monitoring programme.
There are two monitoring stations in the vicinity of Lung Mei Beach,
namely TS3 and TS4 (see
Figure 6.1),
whereas TS4 is the closest to the Project Site.
Monitoring data obtained during 1998 to 2005 for these stations have
been published and are summarised in Table
6.8.
The
routine EPD sediment quality monitoring data do not include values for
TBT. The values for metals, PAHs and
Total Polychlorinated Biphenyls (PCBs) can be compared to the relevant sediment
quality criteria specified in Environment
Transport & Works Bureau Technical Circular No 34/2002 Management of
Dredged/Excavated Sediment (ETWBTC
34/2002), in order to determine whether the concentrations of these
parameters is a cause for concern.
The
EPD monitoring results indicate that few parameters have exceeded the Lower
Chemical Exceedance Level (LCEL) in the reporting period (see Table 6.8). They include arsenic at TS3, chromium at
TS4, copper at TS3, nickel at TS4 and lead, zinc and total PCBs at both
stations. Among these, the maximum
values of lead and zinc at TS3 and nickel at TS4 have exceeded Upper Chemical
Exceedance Level (UCEL).
Table 6.8: EPD Routine Sediment Quality
Monitoring Data (1998-2005) in the Vicinity of the Project Area
|
Parameters
|
Lower Chemical Exceedance Level
(LCEL)
|
Upper Chemical Exceedance Level
(UCEL)
|
Harbour Subzone
TS3
|
Buffer Subzone
TS4
|
|
Chemical Oxygen Demand
|
-
|
-
|
22,118
|
21,029
|
|
(mg/kg)
|
|
|
(15,000-28,000)
|
(15,000-26,000)
|
|
Ammoniacal Nitrogen
|
-
|
-
|
5.8
|
10.7
|
|
(mg kg-1)
|
|
|
(0.0-23.0)
|
(0.0-24.0)
|
|
Total Kjeldahl Nitrogen
|
-
|
-
|
527
|
643
|
|
(mg kg-1)
|
|
|
(330-640)
|
(370-850)
|
|
Total Phosphorus
|
-
|
-
|
162
|
185
|
|
(mg kg-1)
|
|
|
(140-200)
|
(140-230)
|
|
Total Sulphide
|
-
|
-
|
122
|
130
|
|
(mg kg-1)
|
|
|
(1-320)
|
(4-330)
|
|
Arsenic
|
12
|
42
|
10.3
|
9.2
|
|
(mg kg-1)
|
|
|
(5.9-15.0)
|
(6.6-12.0)
|
|
Cadmium
|
1.5
|
4
|
0.5
|
0.4
|
|
(mg kg-1)
|
|
|
(0.2-0.7)
|
(0.1-0.7)
|
|
Chromium
|
80
|
160
|
26
|
32
|
|
(mg kg-1)
|
|
|
(14-36)
|
(19-81)
|
|
Copper
|
65
|
110
|
47
|
32
|
|
(mg kg-1)
|
|
|
(22-97)
|
(15-42)
|
|
Lead
|
75
|
110
|
105
|
77
|
|
(mg kg-1)
|
|
|
(75-130)
|
(55-93)
|
|
Mercury
|
0.5
|
1
|
0.07
|
0.07
|
|
(mg kg-1)
|
|
|
(0.03-0.17)
|
(0.03-0.15)
|
|
Nickel
|
40
|
40
|
16
|
21
|
|
(mg kg-1)
|
|
|
(8-28)
|
(13-46)
|
|
Silver
|
1
|
2
|
0.6
|
0.3
|
|
(mg kg-1)
|
|
|
(0.0-1.0)
|
(0.0-0.5)
|
|
Zinc
|
200
|
270
|
233
|
168
|
|
(mg kg-1)
|
|
|
(170-380)
|
(75-240)
|
|
Total PCBs
|
23
|
180
|
10
|
8
|
|
(µg kg-1) (e)
|
|
|
(3-52)
|
(3-36)
|
|
Low
Molecular Wt PAHs
|
550
|
3,160
|
86
|
85
|
|
(µg kg-1)
(f)
|
|
|
(60-185)
|
(60-191)
|
|
High
Molecular Wt PAHs
|
1,700
|
9,600
|
47
|
56
|
|
(µg kg-1)
(g)
|
|
|
(21-100)
|
(20-137)
|
|
Notes:
(a)
Data
presented are arithmetic mean.
(b)
Data
enclosed in brackets indicate the ranges.
(c)
The
shaded cell indicates exceedance of LCEL.
(d)
The
bolded text indicates exceedance of UCEL
(e)
The
Total PCBs results only cover 2002-2005 since the ETWB (W) No. 34/2002 was
issued in 2002. If the value is below
the reporting limit (RL), it will be taken as 0.5 x RL in the calculation.
(f)
Low
Molecular Wt PAHs include acenaphthene, acenaphthylene, anthracene, fluorine
and phenanthrene. If the value is
below the reporting limit (RL), it will be taken as 0.5 x RL in the calculation.
(g)
High
Molecular Wt PAHs include benzo[a]anthracene, benzo[a]pyrene, chrysene,
dibenzo[a,h]anthracene, fluoranthene, pyrene, benzo[b]fluoranthene, benzo[k]fluoranthene, indeno[1,2,3-c,d]pyrene
and benzo[g,h,I]perylene. If the value is below the reporting limit
(RL), it will be taken as 0.5 x RL in the calculation.
|
Marine
Sediment Sampling
Sediment sampling has been undertaken to examine the
quality of the sediment within the proposed dredging area. Section
7 details the sampling programme and the sediment testing results.
Vibrocores were taken from nine sampling locations
(SS1 – SS9) for chemical analysis. The
locations of the sampling locations are illustrated in Figure 7.2. Chemical testing
results indicate that all the contaminants contained in the sediment were found
below the LCEL, with exception of arsenic.
Arsenic concentrations in the sediment samples taken from locations SS1,
SS2, SS4, SS7 and SS8 exceeded the LCEL but remained below the UCEL. These samples were classified as Category M
and required biological screening. The
biological tests were performed and all the sediment samples passed the
biological test, with exception of SS1.
6.5.1
Construction
Phase
Construction methods and sequence of the Proposed
Beach Development has been reviewed.
During the construction phase, the following water impacts will
potentially arise:
·
Increase in SS, sediment deposition,
and release of heavy metals and toxic chemicals from the sediment may result
from dredging at the proposed beach area, two groynes and proposed new eastern
box culvert;
·
Increase in SS and sediment
deposition may be resulted due to sandfilling at the proposed beach area;
·
Change in chlorophyll-a levels due to dredging operations;
·
Construction site runoff, if
uncontrolled, may enter nearby watercourses; and
·
Sewage generated from the workforce,
if uncontrolled, may affect the quality of the surrounding water.
Impacts from the dispersion of fine sediment in
suspension from the dredging and sandfilling have been simulated using Delft 3D Model. The construction sequence and construction
methods were reviewed to work out the modelling assumptions. Working Paper 2.0 – Methodology for Water
Quality Modelling, as enclosed in Appendix
E, details modelling methodology and key model assumptions. The results are presented and discussed in
the following sections.
Note that, “pre-development”, thereinafter, refers to
the existing baseline conditions, ie there is no proposed Lung Mei beach
development. “Operation phase”,
thereinafter, refers to the situation that the proposed Lung Mei beach
development and the bathing beach that will be operated by Leisure and Cultural
Services Department (LCSD).
SS
Elevations due to Dredging and Sandfilling Operations
Minimization of dredging quantities has been
considered in the preliminary design of the proposed Bathing Beach
Development. The rationale of the
dredging requirements is elaborated in Section
2.5.2. The proposed dredging depth
at the groynes is around 0.5 m to 1 m, which is for the levelling of the groyne
foundation and ensuring groyne stability.
It is assumed that one dredger will be used at a time during the
dredging work.
Dredging for the beach, two groynes and the eastern
box culvert will be conducted by a closed grab dredger. Half of the beach will then be filled by
marine sand which will be spread out via a conveyor belt of a barge onto the
filling area. The dredging and
sandfilling operations were defined as two scenarios and were simulated by Delft 3D. The model results are presented in Table 6.9. Note that both scenarios were taken as the
worst case, in which it assumed no mitigation measures have been applied. In reality a standing type silt curtain will
enclose the sandfilling area whereas a cage type/ metal frame type silt curtain
will enclose the dredging area, in order to reduce the maximum extent of
visually intrusive sediment plume. In
addition, the sandfilling works were assumed to be undertaken without any
groynes in place. This is a highly
conservative approach since in reality sandfilling will be conducted between
the two groynes which will form a physical barrier to prohibit the transport of
fine material to the surrounding from area.
It is assumed that one sandfilling barge will be used at a time during
the sandfilling work.
The scenarios were simulated based on the assumptions
as described in Appendix E. The dredging was assumed to be operated at a
maximum rate of 31 m3 hr-1 for 8 working hours per day
and 6 working days per week. The filling
was assumed to be operated at a maximum rate of 1,000 m3 day-1
with continuous filling operations of 3 hours per day.
Modelling results indicate that SS elevations will be
compliant with the assessment criterion for all WSRs in the dry and wet seasons
under both two scenarios (Table 6.9). Table 6.10 shows
the absolute values of the SS concentrations by adding the predicted SS
elevations (from the model results) to the ambient level (the latest published
EPD routine marine water monitoring data at the closest monitoring stations to
the WSRs).
As
mentioned in Section 6.3.1, AFCD’s
guideline requires that the SS level remains below 50 mg L-1 at the
FCZs. Table 6.10 shows that the SS concentrations at SR1 (Yim Tin Tsai
West FCZ) and SR2 (Yim Tin Tsai East FCZ) are predicted to be lower than the
assessment criterion of 50 mg L-1 in both dry and wet seasons. It is hence anticipated that the dredging and
sandfilling operations are unlikely to impact the two FCZs.
Table 6.9: Predicted SS Elevations at WSRs due
to Dredging or Sandfilling Operations
|
WSR
|
Depth (a)
|
Assessment Criterion (mg L-1)
|
Elevations in Suspended Solids
(mg L-1)
|
|
Dredging
|
Sandfilling
|
|
Dry season
|
Wet season
|
Dry season
|
Wet season
|
|
Average over spring-neap
|
Maximum during spring-neap
|
Average over spring-neap
|
Maximum during spring-neap
|
Average over spring-neap
|
Maximum during spring-neap
|
Average over spring-neap
|
Maximum during spring-neap
|
|
SR1
(Yim Tin Tsai West Fish
Culture Zone)
|
S
|
10
|
0.0
|
0.0
|
0.0
|
0.0
|
0.0
|
0.0
|
0.0
|
0.0
|
|
M
|
10
|
0.0
|
0.0
|
0.0
|
0.0
|
0.0
|
0.0
|
0.0
|
0.0
|
|
B
|
10
|
0.0
|
0.0
|
0.0
|
0.0
|
0.0
|
0.0
|
0.0
|
0.0
|
|
DA
|
10
|
0.0
|
0.0
|
0.0
|
0.0
|
0.0
|
0.0
|
0.0
|
0.0
|
|
SR2
(Yim Tin Tsai East Fish
Culture Zone)
|
S
|
10
|
0.0
|
0.0
|
0.0
|
0.0
|
0.0
|
0.0
|
0.0
|
0.0
|
|
M
|
10
|
0.0
|
0.0
|
0.0
|
0.0
|
0.0
|
0.0
|
0.0
|
0.0
|
|
B
|
10
|
0.0
|
0.0
|
0.0
|
0.0
|
0.0
|
0.0
|
0.0
|
0.0
|
|
DA
|
10
|
0.0
|
0.0
|
0.0
|
0.0
|
0.0
|
0.0
|
0.0
|
0.0
|
|
SR3
(Ting Kok
SSSI, near Ting Kok) /SR5 (Ting Kok)
|
S
|
10
|
0.0
|
0.1
|
0.0
|
0.0
|
0.0
|
0.1
|
0.0
|
0.0
|
|
M
|
10
|
0.0
|
0.1
|
0.0
|
0.0
|
0.0
|
0.1
|
0.0
|
0.0
|
|
B
|
10
|
0.0
|
0.2
|
0.0
|
0.0
|
0.0
|
0.1
|
0.0
|
0.0
|
|
DA
|
10
|
0.0
|
0.2
|
0.0
|
0.0
|
0.0
|
0.1
|
0.0
|
0.0
|
|
SR4
(Ting Kok SSSI, near
Shuen Wan)
|
S
|
10
|
0.0
|
0.0
|
0.0
|
0.0
|
0.0
|
0.0
|
0.0
|
0.0
|
|
M
|
10
|
0.0
|
0.0
|
0.0
|
0.0
|
0.0
|
0.0
|
0.0
|
0.0
|
|
B
|
10
|
0.0
|
0.0
|
0.0
|
0.0
|
0.0
|
0.0
|
0.0
|
0.0
|
|
DA
|
10
|
0.0
|
0.0
|
0.0
|
0.0
|
0.0
|
0.0
|
0.0
|
0.0
|
|
SR6
(Yim Tin Tsai, next to Yim
Tin Tsai West Fish Culture Zone)
|
S
|
10
|
0.0
|
0.0
|
0.0
|
0.0
|
0.0
|
0.0
|
0.0
|
0.0
|
|
M
|
10
|
0.0
|
0.0
|
0.0
|
0.0
|
0.0
|
0.0
|
0.0
|
0.0
|
|
B
|
10
|
0.0
|
0.0
|
0.0
|
0.0
|
0.0
|
0.0
|
0.0
|
0.0
|
|
DA
|
10
|
0.0
|
0.0
|
0.0
|
0.0
|
0.0
|
0.0
|
0.0
|
0.0
|
|
SR7
(Pak Sha Tau)
|
S
|
10
|
0.0
|
0.0
|
0.0
|
0.0
|
0.0
|
0.0
|
0.0
|
0.0
|
|
M
|
10
|
0.0
|
0.0
|
0.0
|
0.0
|
0.0
|
0.0
|
0.0
|
0.0
|
|
B
|
10
|
0.0
|
0.0
|
0.0
|
0.0
|
0.0
|
0.0
|
0.0
|
0.0
|
|
DA
|
10
|
0.0
|
0.0
|
0.0
|
0.0
|
0.0
|
0.0
|
0.0
|
0.0
|
|
SR13
(Sha Lan)
|
S
|
10
|
0.0
|
0.0
|
0.0
|
0.0
|
0.0
|
0.0
|
0.0
|
0.0
|
|
M
|
10
|
0.0
|
0.0
|
0.0
|
0.0
|
0.0
|
0.0
|
0.0
|
0.0
|
|
B
|
10
|
0.0
|
0.0
|
0.0
|
0.0
|
0.0
|
0.0
|
0.0
|
0.0
|
|
DA
|
10
|
0.0
|
0.0
|
0.0
|
0.0
|
0.0
|
0.0
|
0.0
|
0.0
|
|
SR14
(MSL of Chinese University)
|
S
|
10
|
0.0
|
0.0
|
0.0
|
0.0
|
0.0
|
0.0
|
0.0
|
0.0
|
|
M
|
10
|
0.0
|
0.0
|
0.0
|
0.0
|
0.0
|
0.0
|
0.0
|
0.0
|
|
B
|
10
|
0.0
|
0.0
|
0.0
|
0.0
|
0.0
|
0.0
|
0.0
|
0.0
|
|
DA
|
10
|
0.0
|
0.0
|
0.0
|
0.0
|
0.0
|
0.0
|
0.0
|
0.0
|
|
SR15
(WSD at Tai Po Industrial Estate)
|
S
|
10
|
0.0
|
0.0
|
0.0
|
0.0
|
0.0
|
0.0
|
0.0
|
0.0
|
|
M
|
10
|
0.0
|
0.0
|
0.0
|
0.0
|
0.0
|
0.0
|
0.0
|
0.0
|
|
B
|
10
|
0.0
|
0.0
|
0.0
|
0.0
|
0.0
|
0.0
|
0.0
|
0.0
|
|
DA
|
10
|
0.0
|
0.0
|
0.0
|
0.0
|
0.0
|
0.0
|
0.0
|
0.0
|
|
SR16
(Tai Mei Tuk
Water Sports Centre)
|
S
|
10
|
0.0
|
0.0
|
0.0
|
0.0
|
0.0
|
0.0
|
0.0
|
0.0
|
|
M
|
10
|
0.0
|
0.1
|
0.0
|
0.2
|
0.0
|
0.1
|
0.0
|
0.1
|
|
B
|
10
|
0.0
|
0.3
|
0.0
|
0.5
|
0.1
|
0.3
|
0.0
|
0.3
|
|
DA
|
10
|
0.0
|
0.1
|
0.0
|
0.2
|
0.0
|
0.1
|
0.0
|
0.1
|
|
TM3
(Tolo Harbour
& Channel WCZ)
|
S
|
10
|
0.0
|
0.0
|
0.0
|
0.0
|
0.0
|
0.0
|
0.0
|
0.0
|
|
M
|
10
|
0.0
|
0.0
|
0.0
|
0.0
|
0.0
|
0.0
|
0.0
|
0.0
|
|
B
|
10
|
0.0
|
0.0
|
0.0
|
0.0
|
0.0
|
0.0
|
0.0
|
0.0
|
|
DA
|
10
|
0.0
|
0.0
|
0.0
|
0.0
|
0.0
|
0.0
|
0.0
|
0.0
|
|
TM5
(Tolo Harbour
& Channel WCZ)
|
S
|
10
|
0.0
|
0.0
|
0.0
|
0.0
|
0.0
|
0.0
|
0.0
|
0.0
|
|
M
|
10
|
0.0
|
0.0
|
0.0
|
0.0
|
0.0
|
0.0
|
0.0
|
0.0
|
|
B
|
10
|
0.0
|
0.0
|
0.0
|
0.0
|
0.0
|
0.0
|
0.0
|
0.0
|
|
DA
|
10
|
0.0
|
0.0
|
0.0
|
0.0
|
0.0
|
0.0
|
0.0
|
0.0
|
|
TM6
(Tolo Harbour
& Channel WCZ)
|
S
|
10
|
0.0
|
0.0
|
0.0
|
0.0
|
0.0
|
0.0
|
0.0
|
0.0
|
|
M
|
10
|
0.0
|
0.0
|
0.0
|
0.0
|
0.0
|
0.0
|
0.0
|
0.0
|
|
B
|
10
|
0.0
|
0.0
|
0.0
|
0.0
|
0.0
|
0.0
|
0.0
|
0.0
|
|
DA
|
10
|
0.0
|
0.0
|
0.0
|
0.0
|
0.0
|
0.0
|
0.0
|
0.0
|
|
Notes:
(a) For
Depth, S = near water surface, M = mid-depth, B = near seabed, DA =
depth-averaged
|
Table 6.10: Predicted Absolute SS Concentrations
at WSRs due to Dredging or Sandfilling Operations
|
WSR
|
Depth (a)
|
Respect-ive EPD Monito-ring
Station
|
Ambient Level (b)
(mg L-1)
|
Suspended Solids Concentration
(mg L-1)
|
|
Dredging
|
Sandfilling
|
|
Dry season
|
Wet season
|
Dry season
|
Wet season
|
|
Average over spring-neap
|
Maximum during spring-neap
|
Average over spring-neap
|
Maximum during spring-neap
|
Average over spring-neap
|
Maximum during spring-neap
|
Average over spring-neap
|
Maximum during spring-neap
|
|
SR1
(Yim Tin Tsai West Fish
Culture Zone)
|
S
|
TM5
|
2.7
|
2.7
|
2.7
|
2.7
|
2.7
|
2.7
|
2.7
|
2.7
|
2.7
|
|
M
|
nr
|
nd
|
nd
|
nd
|
nd
|
nd
|
nd
|
nd
|
nd
|
|
B
|
2.8
|
2.8
|
2.8
|
2.8
|
2.8
|
2.8
|
2.8
|
2.8
|
2.8
|
|
DA
|
2.8
|
2.8
|
2.8
|
2.8
|
2.8
|
2.8
|
2.8
|
2.8
|
2.8
|
|
SR2
(Yim Tin Tsai East Fish
Culture Zone)
|
S
|
TM5
|
2.7
|
2.7
|
2.7
|
2.7
|
2.7
|
2.7
|
2.7
|
2.7
|
2.7
|
|
M
|
nr
|
nd
|
nd
|
nd
|
nd
|
nd
|
nd
|
nd
|
nd
|
|
B
|
2.8
|
2.8
|
2.8
|
2.8
|
2.8
|
2.8
|
2.8
|
2.8
|
2.8
|
|
DA
|
2.8
|
2.8
|
2.8
|
2.8
|
2.8
|
2.8
|
2.8
|
2.8
|
2.8
|
|
SR3
(Ting Kok
SSSI, near Ting Kok) /SR5 (Ting Kok)
|
S
|
TM5
|
2.7
|
2.7
|
2.8
|
2.7
|
2.7
|
2.7
|
2.8
|
2.7
|
2.7
|
|
M
|
nr
|
nd
|
nd
|
nd
|
nd
|
nd
|
nd
|
nd
|
nd
|
|
B
|
2.8
|
2.8
|
3.0
|
2.8
|
2.8
|
2.8
|
2.9
|
2.8
|
2.8
|
|
DA
|
2.8
|
2.8
|
3.0
|
2.8
|
2.8
|
2.8
|
2.9
|
2.8
|
2.8
|
|
SR4
(Ting Kok SSSI, near
Shuen Wan)
|
S
|
TM5
|
2.7
|
2.7
|
2.7
|
2.7
|
2.7
|
2.7
|
2.7
|
2.7
|
2.7
|
|
M
|
nr
|
nd
|
nd
|
nd
|
nd
|
nd
|
nd
|
nd
|
nd
|
|
B
|
2.8
|
2.8
|
2.8
|
2.8
|
2.8
|
2.8
|
2.8
|
2.8
|
2.8
|
|
DA
|
2.8
|
2.8
|
2.8
|
2.8
|
2.8
|
2.8
|
2.8
|
2.8
|
2.8
|
|
SR6
(Yim Tin Tsai, next to
Yim Tin Tsai West Fish Culture Zone)
|
S
|
TM5
|
2.7
|
2.7
|
2.7
|
2.7
|
2.7
|
2.7
|
2.7
|
2.7
|
2.7
|
|
M
|
nr
|
nd
|
nd
|
nd
|
nd
|
nd
|
nd
|
nd
|
nd
|
|
B
|
2.8
|
2.8
|
2.8
|
2.8
|
2.8
|
2.8
|
2.8
|
2.8
|
2.8
|
|
DA
|
2.8
|
2.8
|
2.8
|
2.8
|
2.8
|
2.8
|
2.8
|
2.8
|
2.8
|
|
SR7
(Pak Sha Tau)
|
S
|
TM6
|
2.2
|
2.2
|
2.2
|
2.2
|
2.2
|
2.2
|
2.2
|
2.2
|
2.2
|
|
M
|
1.8
|
1.8
|
1.8
|
1.8
|
1.8
|
1.8
|
1.8
|
1.8
|
1.8
|
|
B
|
2.3
|
2.3
|
2.3
|
2.3
|
2.3
|
2.3
|
2.3
|
2.3
|
2.3
|
|
DA
|
2.1
|
2.1
|
2.1
|
2.1
|
2.1
|
2.1
|
2.1
|
2.1
|
2.1
|
|
SR13
(Sha Lan)
|
S
|
TM5
|
2.7
|
2.7
|
2.7
|
2.7
|
2.7
|
2.7
|
2.7
|
2.7
|
2.7
|
|
M
|
nr
|
nd
|
nd
|
nd
|
nd
|
nd
|
nd
|
nd
|
nd
|
|
B
|
2.8
|
2.8
|
2.8
|
2.8
|
2.8
|
2.8
|
2.8
|
2.8
|
2.8
|
|
DA
|
2.8
|
2.8
|
2.8
|
2.8
|
2.8
|
2.8
|
2.8
|
2.8
|
2.8
|
|
SR14
(MSL of Chinese University)
|
S
|
TM3
|
2.7
|
2.7
|
2.7
|
2.7
|
2.7
|
2.7
|
2.7
|
2.7
|
2.7
|
|
M
|
2.2
|
2.2
|
2.2
|
2.2
|
2.2
|
2.2
|
2.2
|
2.2
|
2.2
|
|
B
|
2.5
|
2.5
|
2.5
|
2.5
|
2.5
|
2.5
|
2.5
|
2.5
|
2.5
|
|
DA
|
2.5
|
2.5
|
2.5
|
2.5
|
2.5
|
2.5
|
2.5
|
2.5
|
2.5
|
|
SR15
(WSD at Tai Po Industrial Estate)
|
S
|
TM3
|
2.7
|
2.7
|
2.7
|
2.7
|
2.7
|
2.7
|
2.7
|
2.7
|
2.7
|
|
M
|
2.2
|
2.2
|
2.2
|
2.2
|
2.2
|
2.2
|
2.2
|
2.2
|
2.2
|
|
B
|
2.5
|
2.5
|
2.5
|
2.5
|
2.5
|
2.5
|
2.5
|
2.5
|
2.5
|
|
DA
|
2.5
|
2.5
|
2.5
|
2.5
|
2.5
|
2.5
|
2.5
|
2.5
|
2.5
|
|
SR16
(Tai Mei Tuk
Water Sports Centre)
|
S
|
TM5
|
2.7
|
2.7
|
2.7
|
2.7
|
2.7
|
2.7
|
2.7
|
2.7
|
2.7
|
|
M
|
nr
|
nd
|
nd
|
nd
|
nd
|
nd
|
nd
|
nd
|
nd
|
|
B
|
2.8
|
2.8
|
3.1
|
2.8
|
3.3
|
2.9
|
3.1
|
2.8
|
3.1
|
|
DA
|
2.8
|
2.8
|
2.9
|
2.8
|
3.0
|
2.8
|
2.9
|
2.8
|
2.9
|
|
TM3
(Tolo Harbour
& Channel WCZ)
|
S
|
-
|
2.7
|
2.7
|
2.7
|
2.7
|
2.7
|
2.7
|
2.7
|
2.7
|
2.7
|
|
M
|
2.2
|
2.2
|
2.2
|
2.2
|
2.2
|
2.2
|
2.2
|
2.2
|
2.2
|
|
B
|
2.5
|
2.5
|
2.5
|
2.5
|
2.5
|
2.5
|
2.5
|
2.5
|
2.5
|
|
DA
|
2.5
|
2.5
|
2.5
|
2.5
|
2.5
|
2.5
|
2.5
|
2.5
|
2.5
|
|
TM5
(Tolo Harbour
& Channel WCZ)
|
S
|
-
|
2.7
|
2.7
|
2.7
|
2.7
|
2.7
|
2.7
|
2.7
|
2.7
|
2.7
|
|
M
|
nr
|
nd
|
nd
|
nd
|
nd
|
nd
|
nd
|
nd
|
nd
|
|
B
|
2.8
|
2.8
|
2.8
|
2.8
|
2.8
|
2.8
|
2.8
|
2.8
|
2.8
|
|
DA
|
2.8
|
2.8
|
2.8
|
2.8
|
2.8
|
2.8
|
2.8
|
2.8
|
2.8
|
|
TM6
(Tolo Harbour
& Channel WCZ)
|
S
|
-
|
2.2
|
2.2
|
2.2
|
2.2
|
2.2
|
2.2
|
2.2
|
2.2
|
2.2
|
|
M
|
1.8
|
1.8
|
1.8
|
1.8
|
1.8
|
1.8
|
1.8
|
1.8
|
1.8
|
|
B
|
2.3
|
2.3
|
2.3
|
2.3
|
2.3
|
2.3
|
2.3
|
2.3
|
2.3
|
|
DA
|
2.1
|
2.1
|
2.1
|
2.1
|
2.1
|
2.1
|
2.1
|
2.1
|
2.1
|
|
Notes:
(a)
For Depth, S = near water surface,
M = mid-depth, B = near seabed, DA = depth-averaged
(b)
Ambient levels are determined
based on the latest published EPD routine marine water monitoring data
(1998-2005).
(c)
“nr” denotes no record.
(d)
“nd” denotes not determinable
|
|
|
|
|
|
|
|
|
|
|
|
|
|
|
The
contour plots of the SS elevations during the dry and wet seasons are presented
in Figures 6.4 to 6.7 respectively. The mean contours over time for the surface
layer and the bottom layer are shown on the top of the figures. The maximum contours over time for the
surface and the bottom layer are shown in the middle of Figure 6.4 to 6.7. The
surface layer represents the first tenth layer near to the water surface,
whereas the bottom layer represents the last tenth layer near to the
seabed.
The
maximum SS plots for both seasons suggest that plumes over 10 mg L-1
(refers to the contour in green of <15 mg L-1) are likely to be
confined to the works area and will not reach the closest eastward WSR, ie SR16
– Tai Mei Tuk Water Sports Centre, and the nearby identified coral
colonies. The estimated maximum
extension of the sediment plume (maximum values over 10 mg L-1) is
summarised in Table 6.11.
Table 6.11: Predicted Maximum Extension of the Sediment Plume
|
Season
|
Depth
|
Plume
Size (m)
|
|
Dredging
|
Sandfilling
|
|
NW-to-SE
Direction
|
NE-to-SW
Direction
|
NW-to-SE
Direction
|
NE-to-SW
Direction
|
|
Dry
|
Surface
|
154
|
385
|
146
|
354
|
|
Bottom
|
169
|
570
|
162
|
554
|
|
Wet
|
Surface
|
146
|
454
|
146
|
423
|
|
Bottom
|
192
|
500
|
177
|
562
|
Due to the relatively limited spread of SS and no
exceedances of the WQOs or tolerance criterion at sensitive receivers, no
unacceptable elevations of SS would be expected to occur.
Sediment
Deposition due to Dredging and Sandfilling Operations
Contour
plots, which were illustrated in Figures
6.4 to 6.7, of sediment
deposition as a result of dredging operations indicate that the majority of
sediment settles either within or within relatively close proximity to the
Project Site. This is expected given the
very low current velocities present at the site. Table
6.12 summarises the predicted sediment deposition rate (less than 0.00001 g
m-2 day-1) at a coral site at Pak Sha Tau (SR7) due to
the grab dredging and sandfilling operations.
Based on the results, the predicted sedimentation rate will be compliant
with the assessment criterion of 100 g m-2 day-1. This indicates the marine works is unlikely to
cause any unacceptable impacts to the WSRs, especially the coral site at Pak
Sha Tau.
For
the coral colonies identified in the dive survey, the sedimentation rate would
be much less than the assessment criterion (refer to
Figures 6.4 to 6.7). Therefore it is expected that the dredging
and sandfilling works would not adversely affect those corals.
Table 6.12: Predicted Sediment Deposition Rate at WSRs due to
Dredging or Sandfilling Operations
|
WSR
|
Assessment Criterion
(g m-2 day-1)
|
Sedimentation rate (g m-2
day-1)
|
|
Dredging
|
Sandfilling
|
|
Dry season
|
Wet season
|
Dry season
|
Wet season
|
|
Average over spring-neap
|
Average over spring-neap
|
Average over spring-neap
|
Average over spring-neap
|
|
SR7
(Pak Sha Tau)
|
100
|
<
0.00001
|
<
0.00001
|
<
0.00001
|
<
0.00001
|
Dissolved
Oxygen Depletion due to Dredging and Sandfilling Operations
The degree of oxygen
depletion exerted by a sediment plume is a function of the sediment oxygen
demand of the sediment, its concentration in the water column and the rate of
oxygen replenishment.
The impact of the sediment oxygen demand (SOD) on
dissolved oxygen concentrations has been calculated based on the following
equation ():
DODep = C * SOD * K * 10-6
where DODep =
Dissolved oxygen depletion (mg L-1)
C = Suspended solids concentration (mg L-1)
SOD = Sediment oxygen demand (mg kg-1)
K = Daily oxygen uptake factor (set as 1
())
K was set to be 1, which
means instantaneous oxidation of the sediment oxygen demand. This was a more conservative prediction of DO
depletion than this study since oxygen depletion is not instantaneous and will
depend on tidally averaged SS concentrations.
It is worth noting that
the above equation does not account for re-aeration which would tend to reduce
impacts of the SS on the DO concentrations in the water column. The proposed analysis, which is on the
conservative side, will not, therefore, underestimate the DO depletion.
SOD values of the
sediment within the dredging area were obtained from the sediment testing for
this Proposed Beach Development.
These values range between <100 and 600 mg kg-1. The maximum value 600 mg kg-1 is
used for the calculation in order to investigate the worst case.
Based on the above, the
calculated DO depletion at the WSRs will be less than 0.01 mg L-1. With respect to the ambient DO concentrations
of approximately 6.5 mg L-1 (annual mean recorded at EPD monitoring
station TM5), it is expected that the dredging and sandfilling works are
unlikely to attribute to the non-compliance of DO at the WSRs.
As
discussed in Section 6.3.1, there is
no specific DO level established for FCZs for the Tolo Harbour
and Channel WCZ. DO level of 5 mg L-1
is a WQO parameter generally applied for FCZs at other WCZs. Since the DO depletion is predicted to be
less than 0.01 mg L-1 with the ambient DO concentrations of
approximately 6.5 mg L-1, the DO concentrations at SR1 (Yim Tin Tsai
West FCZ) and SR2 (Yim Tin Tsai East FCZ) are predicted to be in compliance
with the assessment criterion. It is
hence no adverse impacts on the DO levels at two FCZs are expected.
Release
of Contaminants due to Dredging and Sandfilling Operations
Elutriate
tests were undertaken to investigate whether dredging would cause the release
of contaminants contained in the sediment.
Samples were taken from the sampling locations as shown in Figure 7.2.
The
elutriate test results indicate that concentrations of PAHs, total PCBs, TBT
and all chlorinated pesticides were found below the reporting limits for all
sampling locations. This suggests that
the leaching potential of these contaminants would be low.
The
elutriate test results of the dissolved metals are presented in Table 6.13. The results show that the concentrations of
dissolved metals in most of the samples are below the reporting limits and all
of them are compliant with the assessment criteria. This indicates that dredging the sediments is
unlikely to cause a detectable increase in contaminant levels in the
surrounding water. Note that the values
shown in the table include the background concentrations.
Therefore,
it is expected that dredging at the proposed Project Site is unlikely to cause
unacceptable levels of contaminant release from the dredged sediment to the
surrounding water.
The
potential source of sand will be imported from Mainland China (see
details in Section 3.8). Consideration
of the source will make reference to the past completed projects and concurrent
projects, for example, Peng Chau Sand Replenishment Project which imported the
sand from Shajiao, Zhujiang
estuary. The imported
sand shall comply with the requirements as promulgated in WBTC No. 10/1995. In
addition, the sand quality will be based on similar requirements in respect to
sand for a recreational beach as set out in Section
3.6 of the Port Works Design Manual:
Part 5 – Guide to Design of Beaches (). It specifies that there should be no organic
content and contaminated materials. It
is hence anticipated that the sand used for filling will not impact surrounding
water.
Table 6.13: Summary of Elutriate Test Results (Dissolved Metals)
|
Sample
Reference
|
Heavy
Metals
|
|
Sampling
Locations
|
Depth
|
Cadmium
(Cd)
|
Chromium
(Cr)
|
Copper
(Cu)
|
Nickel
(Ni)
|
Lead (Pb)
|
Zinc (Zn)
|
Mercury
(Hg)
|
Arsenic
(As)
|
Silver
(Ag)
|
|
From To
|
ug/L
|
ug/L
|
ug/L
|
ug/L
|
ug/L
|
ug/L
|
ug/L
|
ug/L
|
ug/L
|
|
Report
Limit
|
0.2
|
1.0
|
1.0
|
1.0
|
1.0
|
10
|
0.1
|
1.0
|
1.0
|
|
Assessment
Criterion
|
2.5
|
15
|
4.8
|
30
|
25
|
40
|
0.3
|
25
|
1.9
|
|
SS1
|
0.2-0.9m
|
<0.2
|
<1
|
<1
|
1.7
|
<1
|
<10
|
<0.1
|
<1
|
<1
|
|
SS1
|
0.9-1.2m
|
<0.2
|
<1
|
2.2
|
<1
|
<1
|
<10
|
<0.1
|
<1
|
<1
|
|
SS2
|
0.5-0.9m
|
<0.2
|
<1
|
<1
|
2.2
|
<1
|
<10
|
<0.1
|
<1
|
<1
|
|
SS2
|
0.9-1.9m
|
<0.2
|
<1
|
<1
|
2.3
|
<1
|
<10
|
<0.1
|
<1
|
<1
|
|
SS2
|
1.9-2.5m
|
<0.2
|
<1
|
<1
|
1.4
|
<1
|
<10
|
<0.1
|
<1
|
<1
|
|
SS3
|
0.0-0.9m
|
<0.2
|
<1
|
1.1
|
1.6
|
<1
|
<10
|
<0.1
|
4.5
|
<1
|
|
SS3
|
0.9-1.9m
|
<0.2
|
<1
|
1.3
|
1.8
|
<1
|
10
|
<0.1
|
<1
|
<1
|
|
SS3
|
1.9-2.8m
|
<0.2
|
<1
|
2.1
|
1.5
|
<1
|
<10
|
<0.1
|
<1
|
<1
|
|
SS4
|
0.0-0.9m
|
<0.2
|
<1
|
<1
|
1.1
|
<1
|
<10
|
<0.1
|
<1
|
<1
|
|
SS4
|
0.9-1.3m
|
<0.2
|
<1
|
<1
|
<1
|
<1
|
<10
|
<0.1
|
<1
|
<1
|
|
SS5
|
0.0-0.9m
|
<0.2
|
<1
|
<1
|
<1
|
1.4
|
<10
|
<0.1
|
<1
|
<1
|
|
SS6
|
0.0-0.9m
|
<0.2
|
<1
|
<1
|
<1
|
<1
|
<10
|
<0.1
|
1.9
|
<1
|
|
SS6
|
0.9-1.6m
|
0.3
|
<1
|
1.2
|
1.3
|
1.4
|
10
|
<0.1
|
5.2
|
<1
|
|
SS7
|
0.0-0.9m
|
<0.2
|
<1
|
<1
|
1.5
|
1.6
|
<10
|
<0.1
|
<1
|
<1
|
|
SS7
|
0.9-1.3m
|
<0.2
|
<1
|
<1
|
<1
|
<1
|
<10
|
<0.1
|
<1
|
<1
|
|
SS8
|
0.0-0.9m
|
<0.2
|
<1
|
<1
|
1.4
|
<1
|
<10
|
<0.1
|
<1
|
<1
|
|
SS8
|
0.9-1.7m
|
<0.2
|
<1
|
<1
|
<1
|
<1
|
<10
|
<0.1
|
1.8
|
<1
|
|
SS9
|
0.0-0.9m
|
<0.2
|
<1
|
<1
|
<1
|
<1
|
<10
|
<0.1
|
<1
|
<1
|
|
SS9
|
0.9-1.9m
|
0.3
|
<1
|
2.2
|
<1
|
<1
|
23
|
<0.1
|
<1
|
<1
|
Release of
Nutrients due to Dredging Operations
By reviewing the sediment sampling results, the
concentrations of nitrite and nitrate in the sampled sediments were below the
reporting limits and the ammoniacal nitrogen levels were below 1.8 mg kg-1. Total Kjeldahl Nitrogen (TKN) concentrations
in the sediment ranged between <50 and 210 mg kg-1. The maximum value of TKN in the sample
sediment is about one-third of the ambient concentrations (annul mean recorded
at EPD monitoring station TS4). This
indicates that the nutrient level in the sediment within the dredging area is
relatively low compared to other areas in the WCZ.
As discussed previously, the SS elevations at the WSRs
would be less than 0.5 mg L-1 and the sediment plume is predicted to
be confined to the dredging site. It is
hence expected that the nutrient elevation in the water as a result of the
sediment plume due to unmitigated dredging works would be minimal. As a consequence of this prediction it is
not expected that algal blooms are likely to occur.
Effect
on Chlorophyll-a Level
due to Dredging Operations
During dredging operations, the suspension of sediment
and subsequent release of nutrients may affect the chlorophyll-a level in the vicinity of the Project
Area. Chlorophyll-a was hence modelled directly and the model results are presented
in Tables 6.14 and 6.15 as well as in Figures 6.8 and
6.9.
Model results show that during the dredging operations
the relative change in chlorophyll-a
levels (pre-development phase minus dredging phase) is very small and ranges
between -0.092 µg L-1 (reduction) and 0.004 µg L-1
(increment) -2.786% to 0.046% (Table 6.14). The modeling also indicates that the relative
percentage change (increase in chlorophyll-a)
is less than 0.07%. This demonstrates
that the dredging works are unlikely to significantly elevate chlorophyll-a levels at WSRs or to cause any adverse
impacts. Chlorophyll-a concentrations may decrease as a
result of the dredging activity during which the light availability will be
reduced. In other words, less light will
be available for primary production and hence chlorophyll-a concentrations will tend to decrease. It is anticipated that the very small change
in chlorophyll-a concentrations will
be transient and the chlorophyll-a
level will return to pre-dredging conditions after the completion of dredging
works.
The predicted chlorophyll-a levels at the WSRs within or in the vicinity of the Project Site
area, are checked for compliance with the assessment criterion (the WQO of
chlorophyll-a for the buffer subzone
of Tolo Harbour and Channel WCZ) ().
The model results are determined in the same way as the WQO. Table
6.15 presents the maximum 5-day arithmetic mean of chlorophyll-a concentrations at each water depth of
the near-field WSRs.
Based on the model results, it is therefore concluded
that the dredging works would not cause any WQO non-compliances for
chlorophyll-a.
Table 6.14:
Predicted Absolute and Relative Change in Chlorophyll-a Concentrations at WSRs due to Dredging Operations
|
WSR
|
Depth
|
Absolute Difference (a)
in Chlorophyll-a (ug L-1)
|
Relative Change (%) (b)
|
|
Dry Season
|
Wet Season
|
Dry Season
|
Wet Season
|
|
Avg (c)
|
Max (d)
|
Avg (c)
|
Max (d)
|
Avg (c)
|
Max (d)
|
Avg (c)
|
Max (d)
|
|
SR1
(Yim Tin Tsai West Fish
Culture Zone)
|
S
|
0.000
|
0.000
|
0.000
|
0.000
|
0.000%
|
0.000%
|
0.000%
|
0.000%
|
|
M
|
0.000
|
0.000
|
0.000
|
0.000
|
0.000%
|
0.000%
|
0.003%
|
0.003%
|
|
B
|
0.000
|
0.000
|
0.000
|
0.000
|
0.000%
|
0.000%
|
0.001%
|
0.009%
|
|
DA
|
0.000
|
0.000
|
0.000
|
0.000
|
0.000%
|
0.000%
|
0.000%
|
0.002%
|
|
SR2
(Yim Tin Tsai East Fish
Culture Zone)
|
S
|
-0.002
|
-0.005
|
0.001
|
0.002
|
-0.059%
|
-0.046%
|
0.028%
|
0.035%
|
|
M
|
-0.002
|
-0.005
|
0.001
|
0.003
|
-0.056%
|
-0.046%
|
0.028%
|
0.038%
|
|
B
|
-0.002
|
-0.005
|
0.000
|
0.001
|
-0.057%
|
-0.047%
|
0.012%
|
0.015%
|
|
DA
|
-0.002
|
-0.005
|
0.001
|
0.002
|
-0.059%
|
-0.046%
|
0.024%
|
0.032%
|
|
SR3
(Ting Kok
SSSI, near Ting Kok)
/SR5 (Ting
Kok)
|
S
|
-0.013
|
-0.043
|
-0.013
|
-0.006
|
-0.324%
|
-0.380%
|
-0.257%
|
-0.063%
|
|
M
|
-0.013
|
-0.043
|
-0.014
|
-0.007
|
-0.323%
|
-0.378%
|
-0.265%
|
-0.072%
|
|
B
|
-0.013
|
-0.043
|
-0.015
|
-0.008
|
-0.323%
|
-0.377%
|
-0.283%
|
-0.079%
|
|
DA
|
-0.012
|
-0.043
|
-0.014
|
-0.007
|
-0.323%
|
-0.378%
|
-0.268%
|
-0.071%
|
|
SR4
(Ting Kok SSSI, near
Shuen Wan)
|
S
|
-0.003
|
-0.008
|
0.002
|
0.002
|
-0.075%
|
-0.060%
|
0.037%
|
0.031%
|
|
M
|
-0.003
|
-0.008
|
0.002
|
0.003
|
-0.075%
|
-0.060%
|
0.037%
|
0.039%
|
|
B
|
-0.003
|
-0.008
|
0.002
|
0.004
|
-0.075%
|
-0.060%
|
0.037%
|
0.061%
|
|
DA
|
-0.004
|
-0.008
|
0.002
|
0.003
|
-0.077%
|
-0.060%
|
0.037%
|
0.045%
|
|
SR6
(Yim Tin Tsai, next to
Yim Tin Tsai West Fish Culture Zone)
|
S
|
-0.001
|
-0.002
|
0.001
|
0.003
|
-0.026%
|
-0.019%
|
0.038%
|
0.044%
|
|
M
|
-0.001
|
-0.002
|
0.001
|
0.003
|
-0.029%
|
-0.018%
|
0.035%
|
0.044%
|
|
B
|
-0.001
|
-0.002
|
0.001
|
0.003
|
-0.026%
|
-0.018%
|
0.030%
|
0.041%
|
|
DA
|
-0.001
|
-0.002
|
0.001
|
0.003
|
-0.026%
|
-0.018%
|
0.035%
|
0.043%
|
|
SR7
(Pak Sha Tau)
|
S
|
0.000
|
0.000
|
0.000
|
0.000
|
-0.007%
|
-0.003%
|
0.004%
|
0.009%
|
|
M
|
0.000
|
0.000
|
0.000
|
0.000
|
-0.006%
|
-0.005%
|
0.000%
|
0.006%
|
|
B
|
0.000
|
0.000
|
0.000
|
0.000
|
-0.006%
|
-0.005%
|
0.002%
|
0.000%
|
|
DA
|
0.000
|
0.000
|
0.000
|
0.000
|
-0.006%
|
-0.006%
|
0.007%
|
0.006%
|
|
SR13
(Sha Lan)
|
S
|
-0.002
|
-0.006
|
0.002
|
0.004
|
-0.055%
|
-0.049%
|
0.036%
|
0.054%
|
|
M
|
-0.002
|
-0.005
|
0.002
|
0.004
|
-0.055%
|
-0.040%
|
0.036%
|
0.057%
|
|
B
|
-0.002
|
-0.006
|
0.002
|
0.004
|
-0.053%
|
-0.049%
|
0.037%
|
0.054%
|
|
DA
|
-0.002
|
-0.006
|
0.002
|
0.004
|
-0.055%
|
-0.049%
|
0.039%
|
0.056%
|
|
SR14
(MSL of Chinese University)
|
S
|
0.000
|
0.000
|
0.000
|
0.000
|
0.001%
|
0.000%
|
0.000%
|
0.000%
|
|
M
|
0.000
|
0.001
|
0.000
|
0.000
|
0.001%
|
0.005%
|
0.003%
|
0.002%
|
|
B
|
0.000
|
0.000
|
0.000
|
0.000
|
0.000%
|
0.000%
|
0.002%
|
0.000%
|
|
DA
|
0.000
|
0.000
|
0.000
|
0.000
|
0.002%
|
0.000%
|
0.000%
|
0.002%
|
|
SR15
(WSD at Tai Po Industrial Estate)
|
S
|
0.000
|
0.001
|
0.000
|
0.001
|
0.000%
|
0.003%
|
0.000%
|
0.004%
|
|
M
|
0.000
|
0.000
|
0.000
|
0.000
|
0.001%
|
0.000%
|
0.002%
|
0.000%
|
|
B
|
0.000
|
0.000
|
0.000
|
0.000
|
0.004%
|
0.000%
|
0.006%
|
0.004%
|
|
DA
|
0.000
|
0.000
|
0.000
|
0.001
|
0.000%
|
0.000%
|
0.000%
|
0.008%
|
|
SR16
(Tai Mei Tuk
Water Sports Centre)
|
S
|
-0.012
|
-0.034
|
-0.004
|
-0.023
|
-0.330%
|
-0.325%
|
-0.096%
|
-0.311%
|
|
M
|
-0.015
|
-0.058
|
-0.028
|
-0.049
|
-0.441%
|
-0.588%
|
-0.608%
|
-0.648%
|
|
B
|
-0.017
|
-0.092
|
-0.021
|
-0.058
|
-0.571%
|
-1.161%
|
-0.845%
|
-1.316%
|
|
DA
|
-0.015
|
-0.065
|
-0.018
|
-0.047
|
-0.451%
|
-0.689%
|
-0.466%
|
-0.711%
|
|
TM3
(Tolo Harbour
& Channel WCZ)
|
S
|
0.000
|
0.000
|
0.000
|
0.000
|
0.000%
|
0.000%
|
0.001%
|
0.000%
|
|
M
|
0.000
|
0.000
|
0.000
|
0.000
|
0.000%
|
0.000%
|
0.003%
|
0.001%
|
|
B
|
0.000
|
0.000
|
0.000
|
0.000
|
0.000%
|
0.005%
|
0.003%
|
0.003%
|
|
DA
|
0.000
|
0.001
|
0.000
|
0.000
|
0.000%
|
0.009%
|
0.003%
|
0.003%
|
|
TM5
(Tolo Harbour
& Channel WCZ)
|
S
|
-0.002
|
-0.005
|
0.001
|
0.003
|
-0.062%
|
-0.046%
|
0.028%
|
0.047%
|
|
M
|
-0.002
|
-0.005
|
0.001
|
0.003
|
-0.062%
|
-0.046%
|
0.031%
|
0.049%
|
|
B
|
-0.002
|
-0.005
|
0.000
|
0.000
|
-0.063%
|
-0.048%
|
0.000%
|
-0.002%
|
|
DA
|
-0.002
|
-0.005
|
0.001
|
0.002
|
-0.062%
|
-0.047%
|
0.025%
|
0.036%
|
|
TM6
(Tolo Harbour
& Channel WCZ)
|
S
|
0.000
|
0.001
|
0.000
|
0.001
|
-0.005%
|
0.007%
|
0.006%
|
0.006%
|
|
M
|
0.000
|
0.000
|
0.000
|
0.000
|
-0.016%
|
-0.002%
|
0.000%
|
0.000%
|
|
B
|
0.000
|
0.000
|
0.000
|
0.000
|
-0.013%
|
-0.011%
|
0.000%
|
0.000%
|
|
DA
|
0.000
|
0.000
|
0.000
|
0.000
|
-0.010%
|
-0.003%
|
0.006%
|
0.006%
|
Notes:
(a)
Absolute difference
is calculated as values obtained from dredging scenario minus baseline scenario. The values were rounded up to 3 decimal
places.
(b)
Relative change is
calculated as absolute difference divided by baseline scenario. The values were rounded up to 3 decimal
places.
(c)
Avg denotes the
mean value over a spring-neap cycle.
Max denotes the maximum value over a spring-neap
cycle.
Table 6.15:
Predicted Chlorophyll-a
Concentrations (µg L-1) at WSRs during Pre-development and Dredging
Operations
|
WSR
|
Layer
|
Predicted
Chlorophyll-a Concentrations (in ug/L, calculated as maximum 5-day
arithmetic average) (a)
|
|
WQO
|
Pre-development
|
Dredging
Operations
|
|
Dry
|
Wet
|
Dry
|
Wet
|
|
SR2
(Yim Tin Tsai East Fish
Culture Zone)
|
1 (surface)
|
10
|
6.10
|
5.69
|
6.09
|
5.70
|
|
2
|
10
|
6.10
|
5.71
|
6.10
|
5.71
|
|
3
|
10
|
6.11
|
5.72
|
6.10
|
5.72
|
|
4
|
10
|
6.11
|
5.73
|
6.11
|
5.74
|
|
5
|
10
|
6.11
|
5.70
|
6.10
|
5.70
|
|
6
|
10
|
6.10
|
5.57
|
6.10
|
5.58
|
|
7
|
10
|
6.09
|
5.30
|
6.09
|
5.30
|
|
8
|
10
|
6.08
|
5.02
|
6.08
|
5.02
|
|
9
|
10
|
6.07
|
4.82
|
6.06
|
4.82
|
|
10 (bottom)
|
10
|
6.05
|
4.81
|
6.05
|
4.81
|
|
SR3
(Ting Kok
SSSI, near Ting Kok)
/SR5 (Ting
Kok)
|
1 (surface)
|
10
|
6.64
|
7.13
|
6.62
|
7.12
|
|
2
|
10
|
6.64
|
7.13
|
6.63
|
7.12
|
|
3
|
10
|
6.65
|
7.14
|
6.63
|
7.12
|
|
4
|
10
|
6.65
|
7.15
|
6.64
|
7.13
|
|
5
|
10
|
6.65
|
7.15
|
6.64
|
7.14
|
|
6
|
10
|
6.65
|
7.16
|
6.64
|
7.14
|
|
7
|
10
|
6.65
|
7.16
|
6.64
|
7.15
|
|
8
|
10
|
6.66
|
7.17
|
6.64
|
7.15
|
|
9
|
10
|
6.66
|
7.16
|
6.64
|
7.15
|
|
10 (bottom)
|
10
|
6.66
|
7.16
|
6.64
|
7.15
|
|
SR4
(Ting Kok SSSI, near
Shuen Wan)
|
1 (surface)
|
10
|
7.56
|
6.27
|
7.55
|
6.28
|
|
2
|
10
|
7.57
|
6.28
|
7.56
|
6.28
|
|
3
|
10
|
7.58
|
6.28
|
7.57
|
6.28
|
|
4
|
10
|
7.59
|
6.28
|
7.58
|
6.29
|
|
5
|
10
|
7.59
|
6.28
|
7.59
|
6.28
|
|
6
|
10
|
7.60
|
6.28
|
7.59
|
6.28
|
|
7
|
10
|
7.60
|
6.28
|
7.60
|
6.28
|
|
8
|
10
|
7.61
|
6.27
|
7.60
|
6.28
|
|
9
|
10
|
7.61
|
6.27
|
7.60
|
6.27
|
|
10 (bottom)
|
10
|
7.61
|
6.26
|
7.61
|
6.27
|
|
SR6
(Yim Tin Tsai, next to
Yim Tin Tsai West Fish Culture Zone)
|
1 (surface)
|
10
|
6.15
|
5.34
|
6.15
|
5.34
|
|
2
|
10
|
6.17
|
5.35
|
6.17
|
5.35
|
|
3
|
10
|
6.19
|
5.35
|
6.18
|
5.35
|
|
4
|
10
|
6.19
|
5.34
|
6.19
|
5.34
|
|
5
|
10
|
6.20
|
5.34
|
6.20
|
5.34
|
|
6
|
10
|
6.21
|
5.33
|
6.20
|
5.33
|
|
7
|
10
|
6.21
|
5.31
|
6.21
|
5.32
|
|
8
|
10
|
6.22
|
5.25
|
6.21
|
5.25
|
|
9
|
10
|
6.22
|
5.15
|
6.22
|
5.15
|
|
10 (bottom)
|
10
|
6.23
|
5.12
|
6.23
|
5.12
|
|
SR13
(Sha Lan)
|
1 (surface)
|
10
|
7.06
|
5.78
|
7.05
|
5.78
|
|
2
|
10
|
7.07
|
5.79
|
7.07
|
5.79
|
|
3
|
10
|
7.08
|
5.78
|
7.08
|
5.79
|
|
4
|
10
|
7.09
|
5.78
|
7.08
|
5.78
|
|
5
|
10
|
7.09
|
5.77
|
7.09
|
5.77
|
|
6
|
10
|
7.10
|
5.76
|
7.09
|
5.76
|
|
7
|
10
|
7.10
|
5.74
|
7.09
|
5.75
|
|
8
|
10
|
7.10
|
5.72
|
7.10
|
5.73
|
|
9
|
10
|
7.10
|
5.70
|
7.09
|
5.70
|
|
10 (bottom)
|
10
|
7.10
|
5.67
|
7.09
|
5.68
|
|
SR16
(Tai Mei Tuk
Water Sports Centre)
|
1 (surface)
|
10
|
5.95
|
5.83
|
5.93
|
5.82
|
|
2
|
10
|
5.97
|
6.05
|
5.95
|
6.04
|
|
3
|
10
|
5.95
|
6.57
|
5.93
|
6.55
|
|
4
|
10
|
5.90
|
6.86
|
5.88
|
6.83
|
|
5
|
10
|
5.81
|
6.72
|
5.78
|
6.68
|
|
6
|
10
|
5.70
|
6.03
|
5.67
|
5.99
|
|
7
|
10
|
5.59
|
5.29
|
5.57
|
5.25
|
|
8
|
10
|
5.50
|
4.57
|
5.48
|
4.54
|
|
9
|
10
|
5.43
|
3.88
|
5.40
|
3.84
|
|
10 (bottom)
|
10
|
5.41
|
3.72
|
5.38
|
3.68
|
|
TM5
(buffer subzone, Tolo Harbour &
Channel WCZ)
|
1 (surface)
|
10
|
6.02
|
5.71
|
6.01
|
5.72
|
|
2
|
10
|
6.03
|
5.73
|
6.02
|
5.73
|
|
3
|
10
|
6.03
|
5.74
|
6.02
|
5.74
|
|
4
|
10
|
6.03
|
5.74
|
6.02
|
5.75
|
|
5
|
10
|
6.02
|
5.67
|
6.02
|
5.67
|
|
6
|
10
|
6.01
|
5.48
|
6.01
|
5.48
|
|
7
|
10
|
6.00
|
5.18
|
5.99
|
5.18
|
|
8
|
10
|
5.97
|
4.83
|
5.97
|
4.83
|
|
9
|
10
|
5.94
|
4.52
|
5.94
|
4.52
|
|
10 (bottom)
|
10
|
5.91
|
4.49
|
5.90
|
4.49
|
Notes:
(a)
Model results were calculated as a running arithmetic
mean of 5 daily measurements for any single location and depth for the last 15
days of simulation and the maximum values of the 5-day mean over fifteen days
were taken for the presentation. The
values were corrected to 3 significant figures.
(b) Bolded values, if
any, indicate non-compliance with the WQO and assessment criterion.
Construction
Site Runoff
During land based construction activities for the
Proposed Beach Development, impacts to water quality may occur from pollutants,
mainly SS, in site runoff which may enter marine waters, if the runoff is not
adequately controlled.
Design features and methods that will be used to
control surface runoff, reduce the potential for erosion, and prevent offsite
siltation to receiving waters will be adopted.
Prior to construction of the drainage diversion at Lo Tsz River, the
upstream river water will be diverted.
This indicates no river water will pass through the works area and hence
the construction works will not affect the water quality of Lo Tze River. Although no unacceptable water quality
impacts are predicted due to the drainage diversion works, the excavation works
will be carried out to minimize any seawater influx entering the works area and
hence to keep the works area dry as much as possible. To avoid any adverse water quality impacts
resulting from the site runoff due to heavy rainfall, it is recommended to
deploy silt curtains at the inshore waters enclosing the works area before the
commencement of the excavation works for two drainage diversions until the
completion of the diversions. Details of
the mitigation measures are shown in Section
6.6.
Site inspections will be undertaken to ensure the
ongoing suitability and good repair of the adopted erosion control
measures. In particular, inspections
will be undertaken before and after heavy rainfall events. The site runoff will be treated, if required,
and checked for compliance with the appropriate standards prior to being
discharged.
As construction runoff is expected to be managed
through good site practice, no unacceptable impacts to sensitive receivers are
predicted.
Sewage
Generated by Workforce
Sewage will arise from the construction workforce and
site office’s sanitary facilities. It is
estimated that up to 100 construction workers will be on site at the peak of
the construction programme. It is
expected that portable toilets will be provided for the site workers. The maximum volume of the collected sewage is
estimated to be 0.1 m3 per day.
Portable toilet wastewater should be disposed of by a licensed chemical
waste collector.
As sewage discharges to the marine environment or
neighboring streams are not expected to occur, no unacceptable water quality
impacts to sensitive receivers are predicted.
6.5.2
Operation
Phase
The potential impacts that may arise from the
operation of the Proposed Beach Development include the following:
· Sewage generated from the
visitors and employees, if uncontrolled, may deteriorate the surrounding water
quality;
· Presence of the Proposed
Beach Development, especially the diversion of box culvert may change the
chlorophyll-a levels;
· Presence of the groynes,
especially at the eastern part of the site, may affect the flushing
circulation;
· Sediment/Sand loss due to
the maintenance dredging and sandfilling;
· Surface runoff from the
Project Site (car park) that may contain oil/petroleum chemicals, if
uncontrolled may enter the nearby watercourses; and
· Unsewered sewage from the
nearby villages that may deteriorate the beach water quality.
The above potential impacts are evaluated in the following
sections.
In addition, it is
also necessary to assess whether Lung Mei bathing beach is suitable to become a
gazetted beach. The effect on the beach
water quality arising from the discharges of the nearby drains and watercourses
will be addressed.
Sewage Generated from the Visitors
and Employees
It is estimated
that there will be approximately 4,000 visitors per day during peak
season. The peak design sewage and
wastewater flow generated from the beach facilities (fast food kiosk and shower
area included) is 30 L s-1.
To avoid any possible
future
overloading of the existing sewerage system caused by the beach development, a
holding tank is proposed with a capacity of around 10m³ (the estimated total
volume of sewage per day generated from the Proposed Beach Development). Sewage
will be stored in the sewage holding tank during the high flow hours and
gradually released to the existing sewerage system by pumps in the low flow
hours at night within the time between 12:00pm and 4:00am with approximate pump
rate of 5 l/s. The proposed sewerage pipeline under the Project will be
connected to the existing trunk sewer located along the existing cycle track and
the collected sewage will be eventually treated at Tai Po Sewage Treatment Works.
Since no sewage will be
directly discharged into the beach from the beach facilities
and the sewage discharge will be compliant with the standards stipulated in the
TM, no unacceptable water quality impacts are expected.
Surface Runoff from the Project Site
The
Drainage Impact Assessment ()
for this Proposed Beach
Development indicated that the paving area for beach facilities would
potentially increase the surface runoff.
This surface runoff will be collected by the proposed western
gabion.
The
surface runoff from the car park may contain some oil or petroleum
chemicals. In this regard, a petrol
interceptor will be put at the connection point of the proposed western gabion
and the outlet of the drains inside the carpark area.
As
aforementioned, the gabion embankments in the proposed western gabion would
allow vegetation. This would also
enhance screening and filtering of silts or other particulates in the discharge
before entering the sea.
With
good maintenance of the diversion systems and full implementation of
recommended mitigation measures (see Section
6.6), no unacceptable water quality impacts are expected.
Effect
on Chlorophyll-a Level
due to Operation of Bathing
Beach
The Proposed Beach Development which will involve
drainage diversion that could potentially affect the chlorophyll-a levels in the surrounding area through
a change in dispersion patterns of nutrients in the run-off from the diverted
drainage channels. Hence, water quality
modelling was carried out to investigate the situation with the diverted flows
in place. The model results are shown in
Tables 6.16(a)-(c) and 6.17 as well as in Figures 6.10(a)-(c) and
6.11(a)-(c).
Model results show that the chlorophyll-a levels during the operation phase, as
compared with the pre-development phase, will change within a very narrow range
for all three difference scenarios, as shown below (the values were corrected
to 4 decimal places):
·
60% sewerage connection rate scenario: absolute
difference (operation phase minus pre-development phase) between -0.6574 µg L-1
(reduction) and 0.0128 µg L-1 (increment) (Table 6.16(a));
·
40% sewerage connection rate scenario: absolute
difference (operation phase minus pre-development phase) between -0.4428 µg L-1
(reduction) and 0.0129 µg L-1 (increment) (Table 6.16(b));
·
20% sewerage connection rate scenario: absolute
difference (operation phase minus pre-development phase) between -0.2230 µg L-1
(reduction) and 0.0132 µg L-1 (increment) (Table 6.16(c));
Reduction in chlorophyll-a
levels is predicted to occur mainly within the beach area or in close proximity
of the beach (Tables 6.16 (a) - (c)). The reduction is likely due to the drainage
diversion and the provision of two groynes at both sides of the beach which
would change the hydrodynamic regime in the near-field area and induce a
beneficial effect on the water quality in terms of chlorophyll-a concentrations.
The above results indicate that alteration of the two
drainage channels’ discharge locations would not cause a relative change with
respect to the pre-development condition of more than 0.35% in either
near-field or far-field areas for all three scenarios. It is hence not expected the Proposed Beach
Development would cause a significant increase in chlorophyll-a levels at WSRs.
In order to investigate whether the chlorophyll-a levels within or in the vicinity of
the beach area are in compliance with the assessment criterion, the predicted
chlorophyll-a levels at the
near-field WSRs were compared against the WQO of chlorophyll-a for the buffer subzone of Tolo Harbour
and Channel WCZ (). The model results were calculated in the same
way as the WQO. Table 6.17 presents the maximum 5-day arithmetic mean of
chlorophyll-a concentrations at each
water depth of the near-field WSRs.
Based on the model results, it is anticipated that WQO
non-compliances of chlorophyll-a are
not expected to occur during the operation phase of the Proposed Beach
Development.
Table 6.16(a): Predicted Absolute Difference and Relative Change in
Chlorophyll-a Concentrations at WSRs
during Operation Phase – 60% Sewerage Connection Rate
|
WSR |
Depth (a)
|
Absolute Difference (a)
in Chlorophyll-a (ug L-1)
|
Relative Change (%) (b)
|
|
Dry Season
|
Wet Season
|
Dry Season
|
Wet Season
|
|
Avg (b)
|
Max (c)
|
Avg (b)
|
Max (c)
|
Avg (b)
|
Max (c)
|
Avg (b)
|
Max (c)
|
|
SR1
(Yim Tin Tsai West Fish
Culture Zone) |
S
|
-0.0037 |
-0.0020 |
-0.0015 |
-0.0160 |
-0.056% |
-0.012% |
-0.023% |
-0.135% |
|
M
|
-0.0019 |
-0.0020 |
-0.0016 |
0.0080 |
-0.036% |
-0.015% |
-0.049% |
0.131% |
|
B
|
0.0002 |
0.0032 |
0.0000 |
0.0010 |
0.015% |
0.119% |
-0.006% |
0.088% |
|
DA
|
-0.0016 |
0.0000 |
-0.0008 |
0.0007 |
-0.038% |
0.000% |
-0.024% |
0.012% |
|
SR2
(Yim Tin Tsai East Fish
Culture Zone)
|
S
|
-0.0173 |
-0.0520 |
-0.0709 |
-0.1342 |
-0.464% |
-0.481% |
-1.811% |
-1.964% |
|
M
|
-0.0171 |
-0.0510 |
-0.0703 |
-0.1354 |
-0.458% |
-0.471% |
-1.821% |
-1.975% |
|
B
|
-0.0167 |
-0.0500 |
-0.0446 |
-0.1207 |
-0.450% |
-0.469% |
-1.380% |
-2.021% |
|
DA
|
-0.0170 |
-0.0510 |
-0.0630 |
-0.1340 |
-0.456% |
-0.473% |
-1.713% |
-2.029% |
|
SR3
(Ting Kok
SSSI, near Ting Kok)
/SR5 (Ting
Kok)
|
S
|
-0.0286 |
-0.1300 |
-0.1871 |
-0.3263 |
-0.741% |
-1.148% |
-3.616% |
-3.330% |
|
M
|
-0.0286 |
-0.1300 |
-0.1875 |
-0.3146 |
-0.739% |
-1.142% |
-3.630% |
-3.322% |
|
B
|
-0.0286 |
-0.1310 |
-0.1873 |
-0.3300 |
-0.738% |
-1.147% |
-3.650% |
-3.356% |
|
DA
|
-0.0287 |
-0.1300 |
-0.1874 |
-0.3173 |
-0.742% |
-1.142% |
-3.634% |
-3.326% |
|
SR4
(Ting Kok SSSI, near
Shuen Wan)
|
S
|
-0.0310 |
-0.1000 |
-0.1073 |
-0.2197 |
-0.666% |
-0.752% |
-2.344% |
-3.049% |
|
M
|
-0.0310 |
-0.1000 |
-0.1072 |
-0.2188 |
-0.664% |
-0.749% |
-2.339% |
-3.044% |
|
B
|
-0.0310 |
-0.1000 |
-0.1062 |
-0.2177 |
-0.663% |
-0.747% |
-2.325% |
-3.036% |
|
DA
|
-0.0310 |
-0.1000 |
-0.1070 |
-0.2185 |
-0.664% |
-0.749% |
-2.337% |
-3.041% |
|
SR6
(Yim Tin Tsai, next to
Yim Tin Tsai West Fish Culture Zone) |
S
|
-0.0172 |
-0.0430 |
-0.0620 |
-0.1282 |
-0.453% |
-0.398% |
-1.665% |
-2.022% |
|
M
|
-0.0174 |
-0.0440 |
-0.0621 |
-0.1285 |
-0.455% |
-0.403% |
-1.667% |
-2.023% |
|
B
|
-0.0173 |
-0.0430 |
-0.0592 |
-0.1271 |
-0.451% |
-0.393% |
-1.631% |
-2.013% |
|
DA
|
-0.0173 |
-0.0440 |
-0.0614 |
-0.1282 |
-0.453% |
-0.404% |
-1.658% |
-2.022% |
|
SR7
(Pak Sha Tau)
|
S
|
-0.0002 |
-0.0011 |
-0.0049 |
-0.0087 |
-0.007% |
-0.012% |
-0.213% |
-0.200% |
|
M
|
-0.0023 |
0.0128 |
-0.0058 |
-0.0133 |
-0.134% |
0.200% |
-0.409% |
-0.426% |
|
B
|
0.0000 |
-0.0008 |
-0.0021 |
-0.0057 |
0.003% |
-0.097% |
-0.356% |
-0.424% |
|
DA
|
-0.0007 |
0.0010 |
-0.0044 |
-0.0081 |
-0.041% |
0.019% |
-0.314% |
-0.259% |
|
SR8
(Proposed Land Requirement
Boundary) |
S
|
-0.0377 |
-0.1980 |
-0.2475 |
-0.5273 |
-1.030% |
-1.820% |
-5.282% |
-6.831% |
|
M
|
-0.0361 |
-0.1930 |
-0.2818 |
-0.4958 |
-0.988% |
-1.778% |
-5.892% |
-6.295% |
|
B
|
-0.0362 |
-0.1880 |
-0.2218 |
-0.3256 |
-1.006% |
-1.789% |
-5.927% |
-5.273% |
|
DA
|
-0.0364 |
-0.1920 |
-0.2495 |
-0.4441 |
-1.000% |
-1.782% |
-5.653% |
-6.078% |
|
SR9
(Proposed Land Requirement
Boundary) |
S
|
-0.0424 |
-0.2140 |
-0.2979 |
-0.6308 |
-1.178% |
-1.999% |
-6.243% |
-8.117% |
|
M
|
-0.0399 |
-0.2040 |
-0.3184 |
-0.5099 |
-1.115% |
-1.918% |
-6.628% |
-6.525% |
|
B
|
-0.0354 |
-0.1665 |
-0.2389 |
-0.3860 |
-1.030% |
-1.713% |
-6.826% |
-6.758% |
|
DA
|
-0.0390 |
-0.1950 |
-0.2840 |
-0.4994 |
-1.100% |
-1.877% |
-6.503% |
-6.984% |
|
SR10
(Proposed Land Requirement
Boundary)
|
S
|
-0.0478 |
-0.2490 |
-0.3248 |
-0.5541 |
-1.316% |
-2.303% |
-6.821% |
-7.271% |
|
M
|
-0.0472 |
-0.2480 |
-0.3338 |
-0.5465 |
-1.299% |
-2.294% |
-7.077% |
-7.176% |
|
B
|
-0.0477 |
-0.2550 |
-0.3407 |
-0.4916 |
-1.317% |
-2.381% |
-7.904% |
-6.967% |
|
DA
|
-0.0474 |
-0.2500 |
-0.3345 |
-0.5264 |
-1.305% |
-2.318% |
-7.247% |
-7.066% |
|
SR11
(Proposed Land Requirement
Boundary) |
S
|
-0.0498 |
-0.2680 |
-0.3285 |
-0.5257 |
-1.355% |
-2.443% |
-6.805% |
-6.818% |
|
M
|
-0.0484 |
-0.2630 |
-0.3341 |
-0.5214 |
-1.312% |
-2.387% |
-6.953% |
-6.787% |
|
B
|
-0.0498 |
-0.2720 |
-0.3527 |
-0.5100 |
-1.349% |
-2.468% |
-7.606% |
-6.812% |
|
DA
|
-0.0490 |
-0.2670 |
-0.3393 |
-0.5202 |
-1.329% |
-2.425% |
-7.114% |
-6.811% |
|
SR12
(Proposed Land Requirement
Boundary) |
S
|
-0.0638 |
-0.3240 |
-0.3515 |
-0.5873 |
-1.760% |
-2.994% |
-7.103% |
-7.542% |
|
M
|
-0.0577 |
-0.2930 |
-0.3465 |
-0.5852 |
-1.587% |
-2.700% |
-7.044% |
-7.533% |
|
B
|
-0.0619 |
-0.3280 |
-0.3789 |
-0.4945 |
-1.702% |
-3.028% |
-8.036% |
-6.615% |
|
DA
|
-0.0601 |
-0.3090 |
-0.3521 |
-0.5614 |
-1.654% |
-2.850% |
-7.223% |
-7.298% |
|
SR13
(Sha Lan)
|
S
|
-0.0250 |
-0.0720 |
-0.0948 |
-0.2025 |
-0.575% |
-0.584% |
-2.298% |
-3.049% |
|
M
|
-0.0249 |
-0.0720 |
-0.0941 |
-0.2032 |
-0.570% |
-0.581% |
-2.288% |
-3.053% |
|
B
|
-0.0247 |
-0.0710 |
-0.0917 |
-0.2019 |
-0.566% |
-0.574% |
-2.270% |
-3.039% |
|
DA
|
-0.0248 |
-0.0720 |
-0.0936 |
-0.2028 |
-0.568% |
-0.582% |
-2.284% |
-3.050% |
|
SR14
(MSL of
Chinese
University)
|
S
|
-0.0011 |
-0.0020 |
-0.0050 |
-0.0150 |
-0.013% |
-0.008% |
-0.064% |
-0.085% |
|
M
|
-0.0040 |
0.0020 |
-0.0050 |
-0.0033 |
-0.054% |
0.010% |
-0.134% |
-0.034% |
|
B
|
0.0001 |
0.0007 |
-0.0006 |
-0.0069 |
0.006% |
0.023% |
-0.063% |
-0.444% |
|
DA
|
-0.0012 |
0.0020 |
-0.0037 |
-0.0029 |
-0.021% |
0.013% |
-0.095% |
-0.032% |
|
SR15
(WSD at Tai
Po Industrial Estate)
|
S
|
-0.0050 |
-0.0120 |
-0.0030 |
-0.0070 |
-0.040% |
-0.035% |
-0.022% |
-0.029% |
|
M
|
-0.0042 |
-0.0040 |
-0.0019 |
-0.0060 |
-0.047% |
-0.015% |
-0.031% |
-0.051% |
|
B
|
-0.0004 |
-0.0020 |
-0.0003 |
0.0000 |
-0.016% |
-0.039% |
-0.019% |
0.000% |
|
DA
|
-0.0030 |
-0.0060 |
-0.0013 |
0.0000 |
-0.038% |
-0.028% |
-0.020% |
0.000% |
|
SR16
(Tai Mei Tuk
Water Sports Centre) |
S
|
-0.0306 |
-0.1230 |
-0.1913 |
-0.5913 |
-0.855% |
-1.177% |
-4.382% |
-7.933% |
|
M
|
-0.0245 |
-0.1094 |
-0.2800 |
-0.6574 |
-0.715% |
-1.109% |
-6.163% |
-8.690% |
|
B
|
-0.0182 |
-0.0807 |
-0.1286 |
-0.2251 |
-0.597% |
-1.017% |
-5.079% |
-5.090% |
|
DA
|
-0.0242 |
-0.1043 |
-0.2130 |
-0.4369 |
-0.723% |
-1.109% |
-5.489% |
-6.651% |
|
TM3
(Tolo
Harbour
& Channel WCZ) |
S
|
-0.0047 |
-0.0050 |
-0.0014 |
-0.0130 |
-0.057% |
-0.025% |
-0.018% |
-0.077% |
|
M
|
-0.0008 |
0.0000 |
-0.0039 |
-0.0050 |
-0.015% |
0.000% |
-0.124% |
-0.075% |
|
B
|
0.0008 |
0.0070 |
-0.0002 |
0.0003 |
0.062% |
0.328% |
-0.035% |
0.031% |
|
DA
|
-0.0015 |
0.0000 |
-0.0018 |
-0.0001 |
-0.032% |
0.000% |
-0.053% |
-0.002% |
|
TM5
(Tolo
Harbour
& Channel WCZ) |
S
|
-0.0174 |
-0.0510 |
-0.0799 |
-0.1583 |
-0.469% |
-0.473% |
-2.004% |
-2.341% |
|
M
|
-0.0172 |
-0.0510 |
-0.0780 |
-0.1603 |
-0.463% |
-0.473% |
-2.014% |
-2.364% |
|
B
|
-0.0165 |
-0.0460 |
-0.0451 |
-0.1140 |
-0.450% |
-0.444% |
-1.494% |
-2.030% |
|
DA
|
-0.0170 |
-0.0490 |
-0.0690 |
-0.1490 |
-0.459% |
-0.458% |
-1.897% |
-2.308% |
|
TM6
(Tolo
Harbour
& Channel WCZ) |
S
|
-0.0010 |
0.0040 |
-0.0117 |
-0.0148 |
-0.023% |
0.027% |
-0.249% |
-0.164% |
|
M
|
-0.0014 |
0.0024 |
-0.0095 |
-0.0171 |
-0.075% |
0.047% |
-0.617% |
-0.537% |
|
B
|
0.0000 |
-0.0012 |
-0.0025 |
-0.0050 |
-0.001% |
-0.130% |
-0.458% |
-0.511% |
|
DA
|
-0.0010 |
-0.0010 |
-0.0093 |
-0.0143 |
-0.048% |
-0.016% |
-0.525% |
-0.414% |
Notes:
(a)
Absolute difference
is calculated as values obtained from dredging scenario minus baseline
scenario. The values were rounded up to
4 decimal places.
(b)
Relative change is
calculated as absolute difference divided by baseline scenario. The values were rounded up to 3 decimal
places.
(c)
Avg denotes the
mean value over a spring-neap cycle.
(d)
Max denotes the
maximum value over a spring-neap cycle.
Table 6.16(b): Predicted
Absolute Difference and Relative Change in Chlorophyll-a Concentrations at WSRs during Operation Phase – 40% Sewerage
Connection Rate
|
WSR |
Depth (a)
|
Absolute Difference (a)
in Chlorophyll-a (ug L-1)
|
Relative Change (%) (b)
|
|
Dry Season
|
Wet Season
|
Dry Season
|
Wet Season
|
|
Avg (b)
|
Max (c)
|
Avg (b)
|
Max (c)
|
Avg (b)
|
Max (c)
|
Avg (b)
|
Max (c)
|
|
SR1
(Yim Tin Tsai West Fish
Culture Zone) |
S
|
-0.0041 |
-0.0030 |
-0.0019 |
-0.0160 |
-0.062% |
-0.019% |
-0.029% |
-0.135% |
|
M
|
-0.0022 |
-0.0030 |
-0.0016 |
0.0083 |
-0.042% |
-0.022% |
-0.049% |
0.136% |
|
B
|
0.0002 |
0.0028 |
0.0000 |
0.0011 |
0.015% |
0.104% |
-0.007% |
0.097% |
|
DA
|
-0.0018 |
-0.0010 |
-0.0009 |
0.0008 |
-0.043% |
-0.010% |
-0.027% |
0.013% |
|
SR2
(Yim Tin Tsai East Fish
Culture Zone)
|
S
|
-0.0130 |
-0.0400 |
-0.0474 |
-0.0882 |
-0.349% |
-0.370% |
-1.211% |
-1.291% |
|
M
|
-0.0128 |
-0.0400 |
-0.0470 |
-0.0890 |
-0.343% |
-0.369% |
-1.217% |
-1.298% |
|
B
|
-0.0126 |
-0.0390 |
-0.0301 |
-0.0819 |
-0.340% |
-0.366% |
-0.931% |
-1.371% |
|
DA
|
-0.0128 |
-0.0400 |
-0.0422 |
-0.0884 |
-0.344% |
-0.371% |
-1.148% |
-1.338% |
|
SR3
(Ting Kok
SSSI, near Ting Kok)
/SR5 (Ting
Kok)
|
S
|
-0.0203 |
-0.0900 |
-0.1240 |
-0.2145 |
-0.526% |
-0.795% |
-2.397% |
-2.189% |
|
M
|
-0.0203 |
-0.0910 |
-0.1242 |
-0.2070 |
-0.525% |
-0.799% |
-2.404% |
-2.186% |
|
B
|
-0.0204 |
-0.0910 |
-0.1242 |
-0.2173 |
-0.527% |
-0.797% |
-2.421% |
-2.210% |
|
DA
|
-0.0204 |
-0.0900 |
-0.1242 |
-0.2088 |
-0.527% |
-0.791% |
-2.408% |
-2.189% |
|
SR4
(Ting Kok SSSI, near
Shuen Wan)
|
S
|
-0.0229 |
-0.0760 |
-0.0726 |
-0.1482 |
-0.492% |
-0.572% |
-1.586% |
-2.057% |
|
M
|
-0.0230 |
-0.0760 |
-0.0725 |
-0.1475 |
-0.493% |
-0.569% |
-1.582% |
-2.052% |
|
B
|
-0.0230 |
-0.0760 |
-0.0719 |
-0.1465 |
-0.492% |
-0.568% |
-1.574% |
-2.043% |
|
DA
|
-0.0230 |
-0.0760 |
-0.0725 |
-0.1472 |
-0.493% |
-0.569% |
-1.583% |
-2.049% |
|
SR6
(Yim Tin Tsai, next to
Yim Tin Tsai West Fish Culture Zone) |
S
|
-0.0129 |
-0.0350 |
-0.0416 |
-0.0849 |
-0.340% |
-0.324% |
-1.117% |
-1.339% |
|
M
|
-0.0131 |
-0.0350 |
-0.0417 |
-0.0851 |
-0.343% |
-0.321% |
-1.120% |
-1.340% |
|
B
|
-0.0131 |
-0.0350 |
-0.0398 |
-0.0843 |
-0.342% |
-0.320% |
-1.097% |
-1.335% |
|
DA
|
-0.0130 |
-0.0350 |
-0.0412 |
-0.0849 |
-0.340% |
-0.321% |
-1.113% |
-1.339% |
|
SR7
(Pak Sha Tau)
|
S
|
0.0001 |
-0.0003 |
-0.0029 |
-0.0014 |
0.003% |
-0.003% |
-0.126% |
-0.032% |
|
M
|
-0.0021 |
0.0129 |
-0.0041 |
-0.0082 |
-0.123% |
0.202% |
-0.289% |
-0.263% |
|
B
|
0.0001 |
-0.0006 |
-0.0016 |
-0.0039 |
0.014% |
-0.070% |
-0.270% |
-0.290% |
|
DA
|
-0.0005 |
0.0013 |
-0.0029 |
-0.0032 |
-0.029% |
0.025% |
-0.207% |
-0.102% |
|
SR8
(Proposed Land Requirement
Boundary) |
S
|
-0.0250 |
-0.1330 |
-0.1635 |
-0.3438 |
-0.683% |
-1.223% |
-3.489% |
-4.454% |
|
M
|
-0.0238 |
-0.1290 |
-0.1894 |
-0.3256 |
-0.651% |
-1.189% |
-3.960% |
-4.134% |
|
B
|
-0.0247 |
-0.1280 |
-0.1543 |
-0.2180 |
-0.686% |
-1.218% |
-4.124% |
-3.531% |
|
DA
|
-0.0243 |
-0.1290 |
-0.1687 |
-0.2934 |
-0.667% |
-1.197% |
-3.822% |
-4.016% |
|
SR9
(Proposed Land Requirement
Boundary) |
S
|
-0.0276 |
-0.1380 |
-0.1946 |
-0.4087 |
-0.767% |
-1.289% |
-4.078% |
-5.259% |
|
M
|
-0.0259 |
-0.1320 |
-0.2079 |
-0.3313 |
-0.723% |
-1.241% |
-4.327% |
-4.240% |
|
B
|
-0.0233 |
-0.1051 |
-0.1661 |
-0.2518 |
-0.678% |
-1.081% |
-4.746% |
-4.408% |
|
DA
|
-0.0254 |
-0.1250 |
-0.1885 |
-0.3276 |
-0.716% |
-1.203% |
-4.316% |
-4.581% |
|
SR10
(Proposed Land Requirement
Boundary)
|
S
|
-0.0329 |
-0.1710 |
-0.2246 |
-0.3657 |
-0.906% |
-1.581% |
-4.717% |
-4.799% |
|
M
|
-0.0325 |
-0.1710 |
-0.2347 |
-0.3667 |
-0.894% |
-1.582% |
-4.976% |
-4.815% |
|
B
|
-0.0335 |
-0.1820 |
-0.2526 |
-0.3372 |
-0.925% |
-1.699% |
-5.860% |
-4.779% |
|
DA
|
-0.0327 |
-0.1730 |
-0.2383 |
-0.3535 |
-0.901% |
-1.604% |
-5.162% |
-4.745% |
|
SR11
(Proposed Land Requirement
Boundary) |
S
|
-0.0351 |
-0.1910 |
-0.2322 |
-0.3498 |
-0.955% |
-1.741% |
-4.810% |
-4.537% |
|
M
|
-0.0338 |
-0.1860 |
-0.2384 |
-0.3518 |
-0.916% |
-1.688% |
-4.961% |
-4.580% |
|
B
|
-0.0354 |
-0.1960 |
-0.2612 |
-0.3526 |
-0.959% |
-1.779% |
-5.633% |
-4.709% |
|
DA
|
-0.0344 |
-0.1890 |
-0.2446 |
-0.3526 |
-0.933% |
-1.717% |
-5.129% |
-4.617% |
|
SR12
(Proposed Land Requirement
Boundary) |
S
|
-0.0452 |
-0.2270 |
-0.2296 |
-0.3801 |
-1.247% |
-2.098% |
-4.640% |
-4.881% |
|
M
|
-0.0391 |
-0.1960 |
-0.2246 |
-0.3823 |
-1.075% |
-1.806% |
-4.566% |
-4.921% |
|
B
|
-0.0431 |
-0.2300 |
-0.2606 |
-0.3024 |
-1.185% |
-2.123% |
-5.527% |
-4.045% |
|
DA
|
-0.0415 |
-0.2110 |
-0.2308 |
-0.3604 |
-1.142% |
-1.946% |
-4.735% |
-4.685% |
|
SR13
(Sha Lan)
|
S
|
-0.0189 |
-0.0570 |
-0.0642 |
-0.1366 |
-0.434% |
-0.462% |
-1.557% |
-2.057% |
|
M
|
-0.0188 |
-0.0560 |
-0.0638 |
-0.1370 |
-0.430% |
-0.452% |
-1.552% |
-2.058% |
|
B
|
-0.0187 |
-0.0560 |
-0.0622 |
-0.1361 |
-0.428% |
-0.453% |
-1.540% |
-2.049% |
|
DA
|
-0.0188 |
-0.0560 |
-0.0634 |
-0.1367 |
-0.431% |
-0.453% |
-1.547% |
-2.056% |
|
SR14
(MSL of
Chinese
University)
|
S
|
-0.0014 |
-0.0030 |
-0.0038 |
-0.0120 |
-0.016% |
-0.012% |
-0.049% |
-0.068% |
|
M
|
-0.0044 |
0.0010 |
-0.0042 |
0.0002 |
-0.060% |
0.005% |
-0.112% |
0.002% |
|
B
|
0.0000 |
0.0002 |
-0.0005 |
-0.0067 |
0.000% |
0.007% |
-0.058% |
-0.431% |
|
DA
|
-0.0014 |
0.0010 |
-0.0031 |
-0.0007 |
-0.024% |
0.006% |
-0.079% |
-0.008% |
|
SR15
(WSD at Tai
Po Industrial Estate)
|
S
|
-0.0050 |
-0.0130 |
-0.0020 |
-0.0050 |
-0.040% |
-0.038% |
-0.015% |
-0.021% |
|
M
|
-0.0045 |
-0.0050 |
-0.0017 |
-0.0050 |
-0.050% |
-0.019% |
-0.028% |
-0.042% |
|
B
|
-0.0006 |
-0.0025 |
-0.0003 |
0.0002 |
-0.024% |
-0.049% |
-0.019% |
0.007% |
|
DA
|
-0.0032 |
-0.0060 |
-0.0010 |
0.0010 |
-0.040% |
-0.028% |
-0.015% |
0.008% |
|
SR16
(Tai Mei Tuk
Water Sports Centre) |
S
|
-0.0202 |
-0.0800 |
-0.1270 |
-0.4428 |
-0.565% |
-0.766% |
-2.909% |
-5.941% |
|
M
|
-0.0157 |
-0.0679 |
-0.1805 |
-0.3252 |
-0.458% |
-0.688% |
-3.973% |
-4.299% |
|
B
|
-0.0116 |
-0.0490 |
-0.0871 |
-0.1472 |
-0.381% |
-0.618% |
-3.440% |
-3.329% |
|
DA
|
-0.0156 |
-0.0649 |
-0.1398 |
-0.2855 |
-0.466% |
-0.690% |
-3.602% |
-4.346% |
|
TM3
(Tolo
Harbour
& Channel WCZ) |
S
|
-0.0051 |
-0.0060 |
-0.0011 |
-0.0120 |
-0.062% |
-0.030% |
-0.014% |
-0.071% |
|
M
|
-0.0011 |
-0.0010 |
-0.0034 |
-0.0032 |
-0.021% |
-0.008% |
-0.108% |
-0.048% |
|
B
|
0.0008 |
0.0066 |
-0.0002 |
0.0004 |
0.062% |
0.309% |
-0.031% |
0.042% |
|
DA
|
-0.0018 |
-0.0010 |
-0.0015 |
0.0009 |
-0.038% |
-0.009% |
-0.044% |
0.014% |
|
TM5
(Tolo
Harbour
& Channel WCZ) |
S
|
-0.0132 |
-0.0400 |
-0.0534 |
-0.1045 |
-0.356% |
-0.371% |
-1.339% |
-1.545% |
|
M
|
-0.0130 |
-0.0400 |
-0.0523 |
-0.1060 |
-0.350% |
-0.371% |
-1.350% |
-1.563% |
|
B
|
-0.0125 |
-0.0370 |
-0.0305 |
-0.0764 |
-0.341% |
-0.357% |
-1.010% |
-1.361% |
|
DA
|
-0.0129 |
-0.0390 |
-0.0463 |
-0.0987 |
-0.348% |
-0.365% |
-1.273% |
-1.529% |
|
TM6
(Tolo
Harbour
& Channel WCZ) |
S
|
-0.0008 |
0.0030 |
-0.0076 |
-0.0051 |
-0.018% |
0.021% |
-0.161% |
-0.057% |
|
M
|
-0.0013 |
0.0035 |
-0.0065 |
-0.0105 |
-0.070% |
0.068% |
-0.422% |
-0.330% |
|
B
|
0.0001 |
-0.0008 |
-0.0018 |
-0.0037 |
0.013% |
-0.085% |
-0.327% |
-0.378% |
|
DA
|
-0.0009 |
-0.0012 |
-0.0063 |
-0.0083 |
-0.043% |
-0.019% |
-0.356% |
-0.240% |
Notes:
(a)
Absolute difference is calculated as values obtained
from dredging scenario minus baseline scenario.
The values were rounded up to 4 decimal places.
(b)
Relative change is calculated as absolute difference
divided by baseline scenario. The values
were rounded up to 3 decimal places.
(c)
Avg denotes the mean value over a spring-neap cycle.
(d)
Max denotes the maximum value over a spring-neap
cycle.
Table 6.16(c): Predicted
Absolute Difference and Relative Change in Chlorophyll-a Concentrations at WSRs during Operation Phase – 20% Sewerage
Connection Rate
|
WSR |
Depth (a)
|
Absolute Difference (a)
in Chlorophyll-a (ug L-1)
|
Relative Change (%) (b)
|
|
Dry Season
|
Wet Season
|
Dry Season
|
Wet Season
|
|
Avg (b)
|
Max (c)
|
Avg (b)
|
Max (c)
|
Avg (b)
|
Max (c)
|
Avg (b)
|
Max (c)
|
|
SR1
(Yim Tin Tsai West Fish
Culture Zone) |
S
|
-0.0044 |
-0.0040 |
-0.0023 |
-0.0160 |
-0.067% |
-0.025% |
-0.035% |
-0.135% |
|
M
|
-0.0025 |
-0.0040 |
-0.0017 |
0.0087 |
-0.048% |
-0.029% |
-0.052% |
0.142% |
|
B
|
0.0001 |
0.0023 |
-0.0001 |
0.0011 |
0.007% |
0.085% |
-0.010% |
0.097% |
|
DA
|
-0.0020 |
-0.0020 |
-0.0011 |
0.0010 |
-0.048% |
-0.020% |
-0.034% |
0.017% |
|
SR2
(Yim Tin Tsai East Fish Culture
Zone)
|
S
|
-0.0082 |
-0.0260 |
-0.0238 |
-0.0425 |
-0.220% |
-0.241% |
-0.608% |
-0.622% |
|
M
|
-0.0081 |
-0.0260 |
-0.0237 |
-0.0431 |
-0.217% |
-0.240% |
-0.614% |
-0.629% |
|
B
|
-0.0080 |
-0.0270 |
-0.0157 |
-0.0429 |
-0.216% |
-0.253% |
-0.486% |
-0.718% |
|
DA
|
-0.0081 |
-0.0260 |
-0.0214 |
-0.0432 |
-0.217% |
-0.241% |
-0.582% |
-0.654% |
|
SR3
(Ting Kok
SSSI, near Ting Kok)
/SR5 (Ting
Kok)
|
S
|
-0.0117 |
-0.0480 |
-0.0619 |
-0.1039 |
-0.303% |
-0.424% |
-1.196% |
-1.060% |
|
M
|
-0.0117 |
-0.0490 |
-0.0621 |
-0.1005 |
-0.302% |
-0.430% |
-1.202% |
-1.061% |
|
B
|
-0.0118 |
-0.0490 |
-0.0622 |
-0.1057 |
-0.305% |
-0.429% |
-1.212% |
-1.075% |
|
DA
|
-0.0118 |
-0.0480 |
-0.0621 |
-0.1014 |
-0.305% |
-0.422% |
-1.204% |
-1.063% |
|
SR4
(Ting Kok SSSI, near
Shuen Wan)
|
S
|
-0.0141 |
-0.0490 |
-0.0378 |
-0.0767 |
-0.303% |
-0.369% |
-0.826% |
-1.065% |
|
M
|
-0.0141 |
-0.0490 |
-0.0378 |
-0.0760 |
-0.302% |
-0.367% |
-0.825% |
-1.057% |
|
B
|
-0.0141 |
-0.0490 |
-0.0375 |
-0.0747 |
-0.301% |
-0.366% |
-0.821% |
-1.042% |
|
DA
|
-0.0141 |
-0.0490 |
-0.0377 |
-0.0756 |
-0.302% |
-0.367% |
-0.823% |
-1.052% |
|
SR6
(Yim Tin Tsai, next to
Yim Tin Tsai West Fish Culture Zone) |
S
|
-0.0081 |
-0.0230 |
-0.0211 |
-0.0418 |
-0.213% |
-0.213% |
-0.567% |
-0.659% |
|
M
|
-0.0082 |
-0.0240 |
-0.0212 |
-0.0420 |
-0.215% |
-0.220% |
-0.569% |
-0.661% |
|
B
|
-0.0082 |
-0.0230 |
-0.0204 |
-0.0417 |
-0.214% |
-0.210% |
-0.562% |
-0.660% |
|
DA
|
-0.0081 |
-0.0240 |
-0.0210 |
-0.0419 |
-0.212% |
-0.220% |
-0.567% |
-0.661% |
|
SR7
(Pak Sha Tau)
|
S
|
0.0006 |
0.0010 |
-0.0009 |
0.0058 |
0.020% |
0.011% |
-0.039% |
0.134% |
|
M
|
-0.0018 |
0.0132 |
-0.0023 |
-0.0032 |
-0.105% |
0.207% |
-0.162% |
-0.103% |
|
B
|
0.0001 |
-0.0003 |
-0.0011 |
-0.0021 |
0.024% |
-0.042% |
-0.182% |
-0.156% |
|
DA
|
-0.0002 |
0.0018 |
-0.0015 |
0.0017 |
-0.012% |
0.035% |
-0.107% |
0.054% |
|
SR8
(Proposed Land Requirement
Boundary) |
S
|
-0.0123 |
-0.0650 |
-0.0821 |
-0.1726 |
-0.336% |
-0.598% |
-1.752% |
-2.236% |
|
M
|
-0.0116 |
-0.0630 |
-0.1008 |
-0.1656 |
-0.317% |
-0.580% |
-2.108% |
-2.103% |
|
B
|
-0.0132 |
-0.0660 |
-0.0892 |
-0.1154 |
-0.367% |
-0.628% |
-2.384% |
-1.869% |
|
DA
|
-0.0121 |
-0.0640 |
-0.0908 |
-0.1515 |
-0.332% |
-0.594% |
-2.057% |
-2.074% |
|
SR9
(Proposed Land Requirement
Boundary) |
S
|
-0.0129 |
-0.0600 |
-0.0949 |
-0.2023 |
-0.358% |
-0.560% |
-1.989% |
-2.603% |
|
M
|
-0.0121 |
-0.0580 |
-0.1027 |
-0.1639 |
-0.338% |
-0.545% |
-2.138% |
-2.097% |
|
B
|
-0.0114 |
-0.0426 |
-0.0959 |
-0.1237 |
-0.332% |
-0.438% |
-2.740% |
-2.166% |
|
DA
|
-0.0119 |
-0.0530 |
-0.0966 |
-0.1663 |
-0.336% |
-0.510% |
-2.212% |
-2.326% |
|
SR10
(Proposed Land Requirement
Boundary)
|
S
|
-0.0180 |
-0.0910 |
-0.1284 |
-0.1886 |
-0.496% |
-0.842% |
-2.697% |
-2.475% |
|
M
|
-0.0179 |
-0.0920 |
-0.1395 |
-0.1974 |
-0.493% |
-0.851% |
-2.957% |
-2.592% |
|
B
|
-0.0194 |
-0.1060 |
-0.1677 |
-0.1910 |
-0.536% |
-0.990% |
-3.890% |
-2.707% |
|
DA
|
-0.0182 |
-0.0950 |
-0.1459 |
-0.1905 |
-0.501% |
-0.881% |
-3.161% |
-2.557% |
|
SR11
(Proposed Land Requirement
Boundary) |
S
|
-0.0204 |
-0.1120 |
-0.1394 |
-0.1835 |
-0.555% |
-1.021% |
-2.888% |
-2.380% |
|
M
|
-0.0191 |
-0.1070 |
-0.1463 |
-0.1908 |
-0.518% |
-0.971% |
-3.044% |
-2.484% |
|
B
|
-0.0210 |
-0.1180 |
-0.1730 |
-0.2033 |
-0.569% |
-1.071% |
-3.731% |
-2.715% |
|
DA
|
-0.0198 |
-0.1110 |
-0.1533 |
-0.1938 |
-0.537% |
-1.008% |
-3.214% |
-2.537% |
|
SR12
(Proposed Land Requirement
Boundary) |
S
|
-0.0269 |
-0.1300 |
-0.1121 |
-0.1836 |
-0.742% |
-1.201% |
-2.265% |
-2.358% |
|
M
|
-0.0208 |
-0.0980 |
-0.1071 |
-0.1901 |
-0.572% |
-0.903% |
-2.177% |
-2.447% |
|
B
|
-0.0246 |
-0.1310 |
-0.1465 |
-0.1205 |
-0.677% |
-1.209% |
-3.107% |
-1.612% |
|
DA
|
-0.0231 |
-0.1120 |
-0.1138 |
-0.1701 |
-0.636% |
-1.033% |
-2.335% |
-2.211% |
|
SR13
(Sha Lan)
|
S
|
-0.0121 |
-0.0380 |
-0.0335 |
-0.0703 |
-0.278% |
-0.308% |
-0.812% |
-1.058% |
|
M
|
-0.0120 |
-0.0380 |
-0.0333 |
-0.0703 |
-0.275% |
-0.307% |
-0.810% |
-1.056% |
|
B
|
-0.0119 |
-0.0380 |
-0.0326 |
-0.0699 |
-0.273% |
-0.307% |
-0.807% |
-1.052% |
|
DA
|
-0.0120 |
-0.0380 |
-0.0331 |
-0.0702 |
-0.275% |
-0.307% |
-0.808% |
-1.056% |
|
SR14
(MSL of
Chinese
University)
|
S
|
-0.0018 |
-0.0040 |
-0.0026 |
-0.0080 |
-0.021% |
-0.016% |
-0.034% |
-0.045% |
|
M
|
-0.0047 |
0.0000 |
-0.0034 |
0.0037 |
-0.064% |
0.000% |
-0.091% |
0.038% |
|
B
|
-0.0001 |
-0.0002 |
-0.0005 |
-0.0066 |
-0.006% |
-0.007% |
-0.052% |
-0.425% |
|
DA
|
-0.0017 |
0.0000 |
-0.0024 |
0.0016 |
-0.030% |
0.000% |
-0.061% |
0.018% |
|
SR15
(WSD at Tai
Po Industrial Estate)
|
S
|
-0.0050 |
-0.0140 |
-0.0010 |
-0.0030 |
-0.040% |
-0.041% |
-0.007% |
-0.012% |
|
M
|
-0.0048 |
-0.0060 |
-0.0016 |
-0.0040 |
-0.054% |
-0.022% |
-0.026% |
-0.034% |
|
B
|
-0.0007 |
-0.0030 |
-0.0003 |
0.0004 |
-0.027% |
-0.059% |
-0.019% |
0.015% |
|
DA
|
-0.0034 |
-0.0070 |
-0.0007 |
0.0020 |
-0.043% |
-0.032% |
-0.011% |
0.016% |
|
SR16
(Tai Mei Tuk
Water Sports Centre) |
S
|
-0.0097 |
-0.0340 |
-0.0642 |
-0.2230 |
-0.271% |
-0.325% |
-1.471% |
-2.992% |
|
M
|
-0.0068 |
-0.0250 |
-0.0865 |
-0.1489 |
-0.198% |
-0.253% |
-1.904% |
-1.968% |
|
B
|
-0.0051 |
-0.0164 |
-0.0469 |
-0.0728 |
-0.167% |
-0.207% |
-1.852% |
-1.646% |
|
DA
|
-0.0070 |
-0.0241 |
-0.0694 |
-0.1377 |
-0.209% |
-0.256% |
-1.788% |
-2.096% |
|
TM3
(Tolo
Harbour
& Channel WCZ) |
S
|
-0.0054 |
-0.0070 |
-0.0009 |
-0.0100 |
-0.066% |
-0.035% |
-0.011% |
-0.059% |
|
M
|
-0.0014 |
-0.0020 |
-0.0028 |
-0.0015 |
-0.027% |
-0.015% |
-0.089% |
-0.022% |
|
B
|
0.0007 |
0.0062 |
-0.0002 |
0.0005 |
0.054% |
0.290% |
-0.025% |
0.053% |
|
DA
|
-0.0020 |
-0.0020 |
-0.0012 |
0.0019 |
-0.043% |
-0.018% |
-0.035% |
0.029% |
|
TM5
(Tolo
Harbour
& Channel WCZ) |
S
|
-0.0084 |
-0.0260 |
-0.0269 |
-0.0507 |
-0.226% |
-0.241% |
-0.675% |
-0.750% |
|
M
|
-0.0083 |
-0.0260 |
-0.0264 |
-0.0513 |
-0.223% |
-0.241% |
-0.682% |
-0.757% |
|
B
|
-0.0081 |
-0.0260 |
-0.0159 |
-0.0390 |
-0.221% |
-0.251% |
-0.527% |
-0.695% |
|
DA
|
-0.0083 |
-0.0260 |
-0.0234 |
-0.0483 |
-0.224% |
-0.243% |
-0.643% |
-0.748% |
|
TM6
(Tolo
Harbour
& Channel WCZ) |
S
|
-0.0005 |
0.0030 |
-0.0032 |
0.0046 |
-0.011% |
0.021% |
-0.068% |
0.051% |
|
M
|
-0.0011 |
0.0045 |
-0.0034 |
-0.0039 |
-0.059% |
0.088% |
-0.221% |
-0.123% |
|
B
|
0.0002 |
-0.0004 |
-0.0011 |
-0.0024 |
0.027% |
-0.039% |
-0.197% |
-0.246% |
|
DA
|
-0.0007 |
-0.0012 |
-0.0032 |
-0.0023 |
-0.033% |
-0.019% |
-0.181% |
-0.067% |
Notes:
(a)
Absolute difference is calculated as values obtained
from dredging scenario minus baseline scenario.
The values were rounded up to 4 decimal places.
(b)
Relative change is calculated as absolute difference
divided by baseline scenario. The values
were rounded up to 3 decimal places.
(c)
Avg denotes the mean value over a spring-neap cycle.
Max denotes the maximum value over a spring-neap cycle.
Table 6.17: Predicted Chlorophyll-a Concentrations at Near-field WSRs
during Operation Phase
|
WSR
|
Vertical
Layer
of Water Column |
Predicted
Chlorophyll-a Concentrations (in µg/L, calculated as maximum 5-day
arithmetic average) (a) |
|
WQO
|
Pre-development
|
Operation
Phase
60%
Sewerage Connection |
Operation
Phase
40%
Sewerage Connection |
Operation
Phase
20%
Sewerage Connection |
|
Dry
|
Wet
|
Dry
|
Wet
|
Dry
|
Wet
|
Dry
|
Wet
|
|
SR2
(Yim Tin Tsai East Fish
Culture Zone)
|
1 (surface)
|
10
|
6.10
|
5.69
|
6.07
|
5.59
|
6.08
|
5.63
|
6.08
|
5.66
|
|
2
|
10
|
6.10
|
5.71
|
6.08
|
5.60
|
6.09
|
5.64
|
6.09
|
5.67
|
|
3
|
10
|
6.11
|
5.72
|
6.08
|
5.61
|
6.09
|
5.65
|
6.10
|
5.68
|
|
4
|
10
|
6.11
|
5.73
|
6.09
|
5.63
|
6.09
|
5.66
|
6.10
|
5.70
|
|
5
|
10
|
6.11
|
5.70
|
6.08
|
5.59
|
6.09
|
5.63
|
6.09
|
5.66
|
|
6
|
10
|
6.10
|
5.57
|
6.08
|
5.47
|
6.08
|
5.51
|
6.09
|
5.54
|
|
7
|
10
|
6.09
|
5.30
|
6.07
|
5.20
|
6.08
|
5.23
|
6.08
|
5.27
|
|
8
|
10
|
6.08
|
5.02
|
6.06
|
4.94
|
6.06
|
4.96
|
6.07
|
4.99
|
|
9
|
10
|
6.07
|
4.82
|
6.04
|
4.74
|
6.05
|
4.77
|
6.05
|
4.79
|
|
10 (bottom)
|
10
|
6.05
|
4.81
|
6.03
|
4.73
|
6.03
|
4.76
|
6.04
|
4.79
|
|
SR3
(Ting Kok
SSSI, near Ting Kok)
/SR5 (Ting
Kok)
|
1 (surface)
|
10
|
6.64
|
7.13
|
6.52
|
6.81
|
6.56
|
6.92
|
6.60
|
7.03
|
|
2
|
10
|
6.64
|
7.13
|
6.53
|
6.81
|
6.57
|
6.92
|
6.60
|
7.03
|
|
3
|
10
|
6.65
|
7.14
|
6.53
|
6.82
|
6.57
|
6.93
|
6.61
|
7.04
|
|
4
|
10
|
6.65
|
7.15
|
6.54
|
6.82
|
6.57
|
6.93
|
6.61
|
7.04
|
|
5
|
10
|
6.65
|
7.15
|
6.54
|
6.83
|
6.58
|
6.94
|
6.61
|
7.05
|
|
6
|
10
|
6.65
|
7.16
|
6.54
|
6.83
|
6.58
|
6.95
|
6.62
|
7.06
|
|
7
|
10
|
6.65
|
7.16
|
6.54
|
6.84
|
6.58
|
6.95
|
6.62
|
7.06
|
|
8
|
10
|
6.66
|
7.17
|
6.54
|
6.84
|
6.58
|
6.95
|
6.62
|
7.06
|
|
9
|
10
|
6.66
|
7.16
|
6.54
|
6.84
|
6.58
|
6.95
|
6.62
|
7.06
|
|
10 (bottom)
|
10
|
6.66
|
7.16
|
6.54
|
6.84
|
6.58
|
6.95
|
6.62
|
7.06
|
|
SR4
(Ting Kok SSSI, near
Shuen Wan)
|
1 (surface)
|
10
|
7.56
|
6.27
|
7.51
|
6.11
|
7.52
|
6.16
|
7.54
|
6.22
|
|
2
|
10
|
7.57
|
6.28
|
7.52
|
6.11
|
7.53
|
6.17
|
7.55
|
6.22
|
|
3
|
10
|
7.58
|
6.28
|
7.53
|
6.11
|
7.54
|
6.17
|
7.56
|
6.22
|
|
4
|
10
|
7.59
|
6.28
|
7.54
|
6.11
|
7.55
|
6.17
|
7.56
|
6.23
|
|
5
|
10
|
7.59
|
6.28
|
7.55
|
6.11
|
7.56
|
6.17
|
7.57
|
6.22
|
|
6
|
10
|
7.60
|
6.28
|
7.55
|
6.11
|
7.56
|
6.17
|
7.58
|
6.22
|
|
7
|
10
|
7.60
|
6.28
|
7.55
|
6.11
|
7.57
|
6.16
|
7.58
|
6.22
|
|
8
|
10
|
7.61
|
6.27
|
7.56
|
6.11
|
7.57
|
6.16
|
7.58
|
6.22
|
|
9
|
10
|
7.61
|
6.27
|
7.56
|
6.10
|
7.57
|
6.16
|
7.59
|
6.21
|
|
10 (bottom)
|
10
|
7.61
|
6.26
|
7.57
|
6.10
|
7.58
|
6.15
|
7.59
|
6.21
|
|
SR6
(Yim Tin Tsai, next to
Yim Tin Tsai West Fish Culture Zone) |
1 (surface)
|
10
|
6.15
|
5.34
|
6.13
|
5.24
|
6.14
|
5.27
|
6.14
|
5.31
|
|
2
|
10
|
6.17
|
5.35
|
6.15
|
5.24
|
6.15
|
5.28
|
6.16
|
5.31
|
|
3
|
10
|
6.19
|
5.35
|
6.16
|
5.24
|
6.17
|
5.28
|
6.17
|
5.31
|
|
4
|
10
|
6.19
|
5.34
|
6.17
|
5.24
|
6.18
|
5.27
|
6.18
|
5.31
|
|
5
|
10
|
6.20
|
5.34
|
6.18
|
5.23
|
6.18
|
5.27
|
6.19
|
5.30
|
|
6
|
10
|
6.21
|
5.33
|
6.19
|
5.23
|
6.19
|
5.26
|
6.19
|
5.29
|
|
7
|
10
|
6.21
|
5.31
|
6.19
|
5.21
|
6.19
|
5.25
|
6.20
|
5.28
|
|
8
|
10
|
6.22
|
5.25
|
6.19
|
5.15
|
6.20
|
5.18
|
6.20
|
5.21
|
|
9
|
10
|
6.22
|
5.15
|
6.20
|
5.05
|
6.20
|
5.08
|
6.21
|
5.12
|
|
10 (bottom)
|
10
|
6.23
|
5.12
|
6.21
|
5.02
|
6.21
|
5.06
|
6.22
|
5.09
|
|
SR8
(Proposed Land
Requirement Boundary) |
1 (surface)
|
10
|
6.22
|
6.26
|
6.07
|
5.95
|
6.13
|
6.06
|
6.17
|
6.16
|
|
2
|
10
|
6.22
|
6.29
|
6.08
|
5.97
|
6.13
|
6.08
|
6.18
|
6.19
|
|
3
|
10
|
6.22
|
6.35
|
6.08
|
6.02
|
6.13
|
6.14
|
6.18
|
6.25
|
|
4
|
10
|
6.22
|
6.49
|
6.08
|
6.14
|
6.13
|
6.26
|
6.18
|
6.38
|
|
5
|
10
|
6.21
|
6.56
|
6.07
|
6.16
|
6.12
|
6.28
|
6.17
|
6.39
|
|
6
|
10
|
6.21
|
6.48
|
6.06
|
5.99
|
6.11
|
6.16
|
6.16
|
6.31
|
|
7
|
10
|
6.20
|
6.17
|
6.06
|
5.73
|
6.11
|
5.88
|
6.16
|
6.02
|
|
8
|
10
|
6.19
|
5.83
|
6.05
|
5.42
|
6.10
|
5.56
|
6.15
|
5.69
|
|
9
|
10
|
6.18
|
5.45
|
6.04
|
5.06
|
6.09
|
5.19
|
6.14
|
5.31
|
|
10 (bottom)
|
10
|
6.18
|
5.39
|
6.03
|
5.00
|
6.08
|
5.13
|
6.13
|
5.25
|
|
SR9
(Proposed Land
Requirement Boundary) |
1 (surface)
|
10
|
6.12
|
6.41
|
5.96
|
6.02
|
6.02
|
6.15
|
6.07
|
6.28
|
|
2
|
10
|
6.12
|
6.45
|
5.96
|
6.05
|
6.02
|
6.19
|
6.07
|
6.32
|
|
3
|
10
|
6.11
|
6.60
|
5.96
|
6.17
|
6.01
|
6.32
|
6.07
|
6.46
|
|
4
|
10
|
6.10
|
6.74
|
5.95
|
6.29
|
6.00
|
6.45
|
6.06
|
6.59
|
|
5
|
10
|
6.09
|
6.82
|
5.94
|
6.21
|
5.99
|
6.43
|
6.05
|
6.63
|
|
6
|
10
|
6.07
|
6.52
|
5.92
|
5.99
|
5.98
|
6.18
|
6.03
|
6.36
|
|
7
|
10
|
6.05
|
6.09
|
5.90
|
5.63
|
5.95
|
5.79
|
6.01
|
5.95
|
|
8
|
10
|
6.02
|
5.64
|
5.87
|
5.21
|
5.93
|
5.36
|
5.98
|
5.50
|
|
9
|
10
|
5.99
|
5.17
|
5.84
|
4.78
|
5.90
|
4.91
|
5.95
|
5.04
|
|
10 (bottom)
|
10
|
5.97
|
5.11
|
5.82
|
4.72
|
5.87
|
4.85
|
5.93
|
4.98
|
|
SR10
(Proposed Land Requirement
Boundary)
|
1 (surface)
|
10
|
6.20
|
6.38
|
6.03
|
5.97
|
6.09
|
6.10
|
6.14
|
6.22
|
|
2
|
10
|
6.21
|
6.38
|
6.04
|
5.97
|
6.09
|
6.10
|
6.15
|
6.23
|
|
3
|
10
|
6.21
|
6.38
|
6.04
|
5.97
|
6.10
|
6.10
|
6.15
|
6.22
|
|
4
|
10
|
6.21
|
6.40
|
6.04
|
5.95
|
6.10
|
6.08
|
6.15
|
6.20
|
|
5
|
10
|
6.21
|
6.42
|
6.04
|
5.92
|
6.10
|
6.05
|
6.15
|
6.18
|
|
6
|
10
|
6.21
|
6.41
|
6.04
|
5.86
|
6.09
|
6.00
|
6.15
|
6.18
|
|
7
|
10
|
6.21
|
6.37
|
6.03
|
5.78
|
6.09
|
5.96
|
6.15
|
6.13
|
|
8
|
10
|
6.21
|
6.28
|
6.03
|
5.69
|
6.09
|
5.86
|
6.15
|
6.03
|
|
9
|
10
|
6.20
|
6.13
|
6.03
|
5.55
|
6.09
|
5.72
|
6.14
|
5.88
|
|
10 (bottom)
|
10
|
6.20
|
6.08
|
6.03
|
5.50
|
6.08
|
5.67
|
6.14
|
5.83
|
|
SR11
(Proposed Land Requirement
Boundary) |
1 (surface)
|
10
|
6.29
|
6.50
|
6.12
|
6.05
|
6.17
|
6.17
|
6.23
|
6.29
|
|
2
|
10
|
6.30
|
6.52
|
6.13
|
6.05
|
6.18
|
6.18
|
6.24
|
6.29
|
|
3
|
10
|
6.31
|
6.53
|
6.13
|
6.05
|
6.19
|
6.17
|
6.25
|
6.29
|
|
4
|
10
|
6.31
|
6.54
|
6.14
|
6.04
|
6.19
|
6.16
|
6.25
|
6.30
|
|
5
|
10
|
6.31
|
6.55
|
6.14
|
6.02
|
6.20
|
6.14
|
6.25
|
6.30
|
|
6
|
10
|
6.32
|
6.55
|
6.14
|
5.98
|
6.20
|
6.13
|
6.25
|
6.30
|
|
7
|
10
|
6.32
|
6.54
|
6.14
|
5.94
|
6.20
|
6.12
|
6.25
|
6.29
|
|
8
|
10
|
6.32
|
6.53
|
6.14
|
5.92
|
6.20
|
6.10
|
6.25
|
6.27
|
|
9
|
10
|
6.32
|
6.50
|
6.14
|
5.89
|
6.19
|
6.07
|
6.25
|
6.23
|
|
10 (bottom)
|
10
|
6.32
|
6.47
|
6.14
|
5.86
|
6.19
|
6.04
|
6.25
|
6.20
|
|
SR12
(Proposed Land Requirement
Boundary) |
1 (surface)
|
10
|
6.23
|
6.78
|
6.02
|
6.20
|
6.09
|
6.35
|
6.16
|
6.56
|
|
2
|
10
|
6.24
|
6.80
|
6.03
|
6.20
|
6.10
|
6.36
|
6.17
|
6.58
|
|
3
|
10
|
6.24
|
6.80
|
6.04
|
6.20
|
6.11
|
6.38
|
6.18
|
6.60
|
|
4
|
10
|
6.24
|
6.81
|
6.05
|
6.18
|
6.11
|
6.39
|
6.18
|
6.61
|
|
5
|
10
|
6.24
|
6.81
|
6.05
|
6.17
|
6.12
|
6.40
|
6.18
|
6.62
|
|
6
|
10
|
6.24
|
6.80
|
6.05
|
6.19
|
6.12
|
6.42
|
6.18
|
6.64
|
|
7
|
10
|
6.24
|
6.78
|
6.05
|
6.19
|
6.11
|
6.42
|
6.18
|
6.64
|
|
8
|
10
|
6.24
|
6.75
|
6.04
|
6.17
|
6.11
|
6.40
|
6.18
|
6.62
|
|
9
|
10
|
6.24
|
6.69
|
6.04
|
6.11
|
6.11
|
6.34
|
6.18
|
6.55
|
|
10 (bottom)
|
10
|
6.24
|
6.66
|
6.04
|
6.07
|
6.11
|
6.29
|
6.17
|
6.50
|
|
SR13
(Sha Lan)
|
1 (surface)
|
10
|
7.06
|
5.78
|
7.02
|
5.63
|
7.03
|
5.68
|
7.04
|
5.73
|
|
2
|
10
|
7.07
|
5.79
|
7.04
|
5.64
|
7.04
|
5.69
|
7.05
|
5.74
|
|
3
|
10
|
7.08
|
5.78
|
7.05
|
5.64
|
7.05
|
5.68
|
7.06
|
5.73
|
|
4
|
10
|
7.09
|
5.78
|
7.05
|
5.63
|
7.06
|
5.68
|
7.07
|
5.73
|
|
5
|
10
|
7.09
|
5.77
|
7.06
|
5.62
|
7.07
|
5.67
|
7.07
|
5.72
|
|
6
|
10
|
7.10
|
5.76
|
7.06
|
5.61
|
7.07
|
5.66
|
7.08
|
5.71
|
|
7
|
10
|
7.10
|
5.74
|
7.06
|
5.60
|
7.07
|
5.65
|
7.08
|
5.69
|
|
8
|
10
|
7.10
|
5.72
|
7.07
|
5.58
|
7.07
|
5.63
|
7.08
|
5.67
|
|
9
|
10
|
7.10
|
5.70
|
7.06
|
5.56
|
7.07
|
5.60
|
7.08
|
5.65
|
|
10 (bottom)
|
10
|
7.10
|
5.67
|
7.06
|
5.53
|
7.07
|
5.58
|
7.08
|
5.62
|
|
SR16
(Tai Mei Tuk
Water Sports Centre) |
1 (surface)
|
10
|
5.95
|
5.83
|
5.83
|
5.54
|
5.88
|
5.64
|
5.92
|
5.73
|
|
2
|
10
|
5.97
|
6.05
|
5.86
|
5.72
|
5.89
|
5.83
|
5.93
|
5.94
|
|
3
|
10
|
5.95
|
6.57
|
5.86
|
6.14
|
5.88
|
6.29
|
5.92
|
6.43
|
|
4
|
10
|
5.90
|
6.86
|
5.78
|
6.27
|
5.82
|
6.45
|
5.87
|
6.67
|
|
5
|
10
|
5.81
|
6.72
|
5.69
|
6.15
|
5.73
|
6.35
|
5.78
|
6.55
|
|
6
|
10
|
5.70
|
6.03
|
5.58
|
5.62
|
5.63
|
5.77
|
5.67
|
5.91
|
|
7
|
10
|
5.59
|
5.29
|
5.48
|
4.97
|
5.52
|
5.08
|
5.56
|
5.20
|
|
8
|
10
|
5.50
|
4.57
|
5.39
|
4.32
|
5.43
|
4.41
|
5.47
|
4.50
|
|
9
|
10
|
5.43
|
3.88
|
5.32
|
3.68
|
5.36
|
3.75
|
5.40
|
3.82
|
|
10 (bottom)
|
10
|
5.41
|
3.72
|
5.30
|
3.52
|
5.34
|
3.59
|
5.38
|
3.66
|
|
TM5
(buffer subzone, Tolo Harbour &
Channel WCZ) |
1 (surface)
|
10
|
6.02
|
5.71
|
5.99
|
5.59
|
6.00
|
5.63
|
6.00
|
5.68
|
|
2
|
10
|
6.03
|
5.73
|
6.00
|
5.61
|
6.01
|
5.65
|
6.01
|
5.69
|
|
3
|
10
|
6.03
|
5.74
|
6.01
|
5.62
|
6.01
|
5.66
|
6.02
|
5.70
|
|
4
|
10
|
6.03
|
5.74
|
6.00
|
5.62
|
6.01
|
5.66
|
6.01
|
5.70
|
|
5
|
10
|
6.02
|
5.67
|
6.00
|
5.55
|
6.00
|
5.59
|
6.01
|
5.63
|
|
6
|
10
|
6.01
|
5.48
|
5.99
|
5.36
|
5.99
|
5.40
|
6.00
|
5.44
|
|
7
|
10
|
6.00
|
5.18
|
5.97
|
5.07
|
5.98
|
5.11
|
5.98
|
5.15
|
|
8
|
10
|
5.97
|
4.83
|
5.95
|
4.74
|
5.95
|
4.77
|
5.96
|
4.80
|
|
9
|
10
|
5.94
|
4.52
|
5.92
|
4.44
|
5.93
|
4.47
|
5.93
|
4.50
|
|
10 (bottom)
|
10
|
5.91
|
4.49
|
5.89
|
4.41
|
5.89
|
4.44
|
5.90
|
4.47
|
Notes:
(a)
Model results were calculated as a running arithmetic
mean of 5 daily measurements for any single location and depth for the last 15
days of simulation and the maximum values of the 5-day mean over fifteen days
were taken for the presentation. The
values were corrected to 3 significant figures.
(b)
Bolded values, if any, indicate non-compliance with
the WQO and assessment criterion.
Effect
on Flushing Circulation
Presence of two groynes may potentially affect the
circulation of the water inside the bay, especially at the area in-between the
eastern groyne and the drainage division.
As mentioned above, the chlorophyll-a concentrations would not significantly
increase in the surrounding area during the operation phase.
Figures
6.10 (a)-(c) and
6.11(a)-(c) show
the chlorophyll-a concentrations during
the pre-development phase and the operation phase and the chlorophyll-a level is unlikely to be built up at
the area of concern. Contour plots, as
shown in
Figures 6.12(a)-(c) and 6.13(a)-(c) show negligible differences
of DO levels between pre-development and operation phases and hence this
further reveals that the water quality would not be deteriorated by the
presence of the project-related structures and no significant adverse effect on
flushing circulation is expected.
Maintenance Dredging and
Sandfilling
Maintenance
dredging is not anticipated during the operation of the beach. Maintenance sandfilling will be carried out,
if necessary, during the operation of the beach. The sandfilling works will only be carried
out on the beach above the high water mark (HWM). As a result,
impacts to water quality are not anticipated.
Suitability of the Site for a
Gazetted Bathing Beach Development
Through
communication with the Drainage Services Department (DSD), there is a plan to
establish a new sewerage system (under The Tolo
Harbour Sewerage of Unsewered Areas Stage I Phase IIC (Agreement No. CE 18/94))
which allows
the residents in Lung Mei to connect their sewers to the public sewer. This public sewer will deliver the sewage to
the Tai Po STW for further treatment. It
is anticipated that the sewerage system will be completed prior to the
operation of the Proposed Beach Development and approximately 60% of
the private sewers would be connected to the public sewer.
Sewerage improvement works are in progress in the Ting Kok
area and existing residents have been encouraged to connect their sewerage
system to the public sewers. For any new
development, a connection to the public sewer is compulsory. As connections for existing households to the
public sewer are voluntary, it is unlikely that a 100% connection rate will be
achieved. However, according to DSD’s
information provided, although the connection rate varies from village to
village, high percentages have been achieved in many villages. A 60% connection rate that would be more
likely to be implemented is considered representable to be used in the water
quality impact assessment.
Nevertheless, reasonable conservative assumptions of 20% and
40% connection rates are also used as the pollution inventories for this study
to assess the E. coli concentrations
to further verify the suitability of Lung Mei for use as a bathing beach. Tables
6.18-6.20 present the pollution inventories for the connection rate of 60%,
40% and 20% respectively.
The water quality in the nearby existing watercourses has
been characterised in Section 6.4.5. As discussed in Section 6.4.5, these watercourses, may contribute to elevated E. coli counts at the existing Lung Mei
Beach. It is expected that the new
sewerage system combining with the diversion of the western gabion and eastern
box culvert would be beneficial to the proposed beach. In order to investigate how these would
improve the water quality at the proposed beach, a quantitative assessment has
been conducted to compare the E. coli concentrations
in the beach area during pre-development stage and operation phase. The water quality sampling results, as
presented in Table 6.7, have been
input in the water quality model as the pollution loads. Model inputs for the two stages are the same
except the sewage flows from the nearby villages are reduced by 60%, 40% and
20% for the operation phase under three scenarios, as shown in Tables 6.18-6.20.
Table 6.18:
Pollution Inventories during the Operation Phase, assuming 60% Sewerage
Connection Rates
|
Location
|
Flow
Rate
(m3
s-1) (a)
|
Geometric Mean of E.coli
(cfu 100mL-1) (c)
|
|
Pre-Development
|
Operation
(60%
Sewerage Connection)
|
|
Dry
|
Wet
|
Dry
|
Wet
(b)
|
Pre-
and
Post-
(d)
|
|
W3 (e)
|
0.056
|
0.105
|
0.0224
|
0.0714
|
9.1E+02
|
|
W4 (f)
|
0.056
|
0.105
|
0.0224
|
0.0714
|
2.3E+04
|
|
W5 (g)
|
0.056
|
0.105
|
0.0224
|
0.0714
|
5.9E+03
|
|
W6 (g)
|
0.056
|
0.105
|
0.0224
|
0.0714
|
6.0E+01
|
Notes:
(a) The flow rate was
small and could not be measured during the survey. The mean value of on the EPD River Monitoring
Data of TR4 (Shan
Liu River)
between 1998-2005 is used for the assessment purpose.
(b) Flow rate for wet season during
operation phase calculated as “Reduced Dry Flow + (0.105-0.056)”
(c) Data obtained from the water
sampling surveys in Dec 2006 - Jan 2007.
(d) “Pre-“ denotes pre-development
phase; “Post-“ denotes operation phase.
(e) Diverted to western side by a
gabion after development.
(f) Diverted to eastern side by a box
culvert after development.
(g) Discharge location is
the same before and after development.
Table 6.19:
Pollution Inventories during the Operational Phase, assuming 40% Sewerage
Connection Rates
|
Location
|
Flow
Rate
(m3
s-1) (a)
|
Geometric Mean of E. coli
(cfu 100mL-1) (c)
|
|
Pre-Development
|
Post-development
(40%
Sewerage Connection)
|
|
Dry
|
Wet
|
Dry
|
Wet
(b)
|
Pre-
and
Post-
(d)
|
|
W3 (e)
|
0.056
|
0.105
|
0.0336
|
0.0826
|
9.1E+02
|
|
W4 (f)
|
0.056
|
0.105
|
0.0336
|
0.0826
|
2.3E+04
|
|
W5 (g)
|
0.056
|
0.105
|
0.0336
|
0.0826
|
5.9E+03
|
|
W6 (g)
|
0.056
|
0.105
|
0.0336
|
0.0826
|
6.0E+01
|
Notes:
(a) The flow rate was
small and could not be measured during the survey. The mean value of on the EPD River Monitoring
Data of TR4 (Shan
Liu River)
between 1998-2005 is used for the assessment purpose.
(b) Flow rate for wet season during
post-development calculated as “Reduced Dry Flow + (0.105-0.056)”
(c) Data obtained from the water
sampling surveys in Dec 2006 - Jan 2007.
(d) “Pre-“ denotes pre-development
phase; “Post-“ denotes post-development phase.
(e) Diverted to western side by a
gabion after development.
(f) Diverted to eastern side by a box
culvert after development.
(g) Discharge location is
the same before and after development.
Table 6.20:
Pollution Inventories during the Operational Phase, assuming 20% Sewerage
Connection Rates
|
Location
|
Flow
Rate
(m3
s-1) (a)
|
Geometric Mean of E. coli
(cfu 100mL-1) (c)
|
|
Pre-Development
|
Post-development
(20%
Sewerage Connection)
|
|
Dry
|
Wet
|
Dry
|
Wet
(b)
|
Pre-
and
Post-
(d)
|
|
W3 (e)
|
0.056
|
0.105
|
0.0448
|
0.0938
|
9.1E+02
|
|
W4 (f)
|
0.056
|
0.105
|
0.0448
|
0.0938
|
2.3E+04
|
|
W5 (g)
|
0.056
|
0.105
|
0.0448
|
0.0938
|
5.9E+03
|
|
W6 (g)
|
0.056
|
0.105
|
0.0448
|
0.0938
|
6.0E+01
|
Notes:
(a) The flow rate was
small and could not be measured during the survey. The mean value of on the EPD River Monitoring
Data of TR4 (Shan
Liu River)
between 1998-2005 is used for the assessment purpose.
(b) Flow rate for wet season during
post-development calculated as “Reduced Dry Flow + (0.105-0.056)”
(c) Data obtained from the water
sampling surveys in Dec 2006 - Jan 2007.
(d) “Pre-“ denotes pre-development
phase; “Post-“ denotes post-development phase.
(e) Diverted to western side by
gabion after development.
(f) Diverted to eastern side by a box
culvert after development.
(g) Discharge location is the same
before and after development.
Note that the data were taken from December 2006 and January
2007 and did not cover peak flow season and the bathing season during which E. coli concentrations may differ. The data were hence used for comparison
purpose only but not for predicting the absolute E. coli counts at the proposed beach during the bathing season at
its operation phase. The most
appropriate method is to find out the relative change in E. coli concentrations between the pre-development stage and the
operation phase and then apply this relative change to EPD’s long-term
monitoring for the bathing season to determine whether the predicted value
would exceed the WQO for bathing beach.
The
modelling results (the change of absolute E.
coli concentrations as well as the calculation of the relative percentage
change) are shown in Tables 6.21-6.23 and Figures 6.14 - 6.19. Note that the E.coli concentrations presented in Tables 6.21-6.23 are the geometric mean over a spring-neap cycle
but not the geometric mean over a whole bathing season. Therefore it should not be directly compared
to the EPD monitoring data as shown in Table
6.6.
SR8
to SR12 are the four corners and the middle point of the Project Site and hence
are representative points to evaluate the beach’s operation performance. Note that the proposed area of the Proposed
Bathing Beach Development, ie the Permanent Government Land Allocation under
LCSD’s control during operation phase, is depicted in Figure 6.22.
Table 6.21: Comparison of Relative Change in E. coli Concentrations
between Pre-development and Operation Phase – 60% Sewerage Connection Rate
(Note that the E.coli concentrations
presented in this table are the geometric mean over a spring-neap cycle but not
the geometric mean over a whole bathing season.
Therefore it should not be directly compared to the EPD monitoring data
as shown in Table 6.6 and beach WQO,
ie 180 cfu per 100mL)
|
Modelling
Assessment Points
|
Depth
|
Predicted E. coli Concentrations (no./100mL)
Geometric Mean over a
Spring-Neap Cycle
|
Percentage of Relative
Change
|
|
Pre-development
|
Operation Phase
|
|
Dry Season
|
Wet Season
|
Dry Season
|
Wet Season
|
Dry Season
|
Wet Season
|
|
SR8
(Proposed Land
Requirement Boundary)
|
S
|
9
|
3
|
2
|
<d.l.
|
-81%
|
<n.d.
|
|
M
|
9
|
5
|
2
|
1
|
-81%
|
-76%
|
|
B
|
10
|
7
|
2
|
2
|
-82%
|
-72%
|
|
DA
|
9
|
5
|
2
|
1
|
-81%
|
-75%
|
|
SR9
(Proposed Land Requirement
Boundary)
|
S
|
15
|
7
|
7
|
5
|
-53%
|
-29%
|
|
M
|
17
|
16
|
8
|
11
|
-55%
|
-34%
|
|
B
|
21
|
21
|
9
|
15
|
-57%
|
-27%
|
|
DA
|
18
|
15
|
8
|
11
|
-55%
|
-30%
|
|
SR10
(Proposed Land Requirement
Boundary)
|
S
|
40
|
32
|
7
|
7
|
-82%
|
-79%
|
|
M
|
41
|
36
|
7
|
7
|
-83%
|
-79%
|
|
B
|
42
|
43
|
7
|
9
|
-84%
|
-80%
|
|
DA
|
41
|
37
|
7
|
8
|
-83%
|
-79%
|
|
SR11
(Proposed Land Requirement
Boundary)
|
S
|
30
|
22
|
3
|
3
|
-89%
|
-87%
|
|
M
|
30
|
23
|
3
|
3
|
-89%
|
-87%
|
|
B
|
30
|
25
|
3
|
3
|
-89%
|
-87%
|
|
DA
|
30
|
23
|
3
|
3
|
-89%
|
-87%
|
|
SR12
(Proposed Land Requirement
Boundary)
|
S
|
135
|
179
|
41
|
72
|
-70%
|
-60%
|
|
M
|
141
|
195
|
43
|
84
|
-69%
|
-57%
|
|
B
|
146
|
216
|
54
|
120
|
-63%
|
-44%
|
|
DA
|
141
|
197
|
46
|
92
|
-67%
|
-53%
|
|
Notes:
1.
S =
near to the water surface; M = mid-depth; B = near to the seabed; DA = depth
averaged
2.
The
relative change is calculated as 100% * (Operation Phase - Pre-development) /
Pre-development
3.
“<d.l.”
denotes less than detection limit.
4.
“n.d.”
denotes not determinable.
5.
Note
that the E.coli concentrations
presented in this table are the geometric mean over a spring-neap cycle but
not the geometric mean over a whole bathing season. Therefore it should not be directly
compared to the EPD monitoring data as shown in Table 6.6 and
beach
WQO, ie 180 cfu per 100mL.
|
Table 6.22: Comparison of Relative Change in E. coli Concentrations
between Pre-development and Operation Phase – 40% Sewerage Connection Rate
(Note that the E.coli concentrations
presented in this table are the geometric mean over a spring-neap cycle but not
the geometric mean over a whole bathing season.
Therefore it should not be directly compared to the EPD monitoring data
as shown in Table 6.6 and beach WQO,
ie 180 cfu per 100mL)
|
Modelling
Assessment Points
|
Depth
|
Predicted E. coli Concentrations (no./100mL)
Geometric Mean over a
Spring-Neap Cycle
|
Percentage of Relative
Change
|
|
Pre-development
|
Operation Phase
|
|
Dry Season
|
Wet Season
|
Dry Season
|
Wet Season
|
Dry Season
|
Wet Season
|
|
SR8
(Proposed Land
Requirement Boundary)
|
S
|
9
|
3
|
2
|
<d.l.
|
-71%
|
<n.d.
|
|
M
|
9
|
5
|
3
|
1
|
-72%
|
-73%
|
|
B
|
10
|
7
|
3
|
2
|
-72%
|
-68%
|
|
DA
|
9
|
5
|
3
|
2
|
-72%
|
-71%
|
|
SR9
(Proposed Land Requirement
Boundary)
|
S
|
15
|
7
|
10
|
6
|
-29%
|
-18%
|
|
M
|
17
|
16
|
12
|
13
|
-32%
|
-24%
|
|
B
|
21
|
21
|
13
|
18
|
-35%
|
-15%
|
|
DA
|
18
|
15
|
12
|
12
|
-33%
|
-19%
|
|
SR10
(Proposed Land Requirement
Boundary)
|
S
|
40
|
32
|
11
|
8
|
-73%
|
-76%
|
|
M
|
41
|
36
|
11
|
9
|
-74%
|
-76%
|
|
B
|
42
|
43
|
10
|
10
|
-76%
|
-77%
|
|
DA
|
41
|
37
|
11
|
9
|
-74%
|
-76%
|
|
SR11
(Proposed Land Requirement
Boundary)
|
S
|
30
|
22
|
5
|
3
|
-83%
|
-85%
|
|
M
|
30
|
23
|
5
|
3
|
-83%
|
-85%
|
|
B
|
30
|
25
|
5
|
4
|
-83%
|
-85%
|
|
DA
|
30
|
23
|
5
|
3
|
-83%
|
-85%
|
|
SR12
(Proposed Land Requirement
Boundary)
|
S
|
135
|
179
|
61
|
83
|
-55%
|
-54%
|
|
M
|
141
|
195
|
65
|
97
|
-54%
|
-50%
|
|
B
|
146
|
216
|
82
|
139
|
-44%
|
-35%
|
|
DA
|
141
|
197
|
70
|
106
|
-51%
|
-46%
|
|
Notes:
1.
S =
near to the water surface; M = mid-depth; B = near to the seabed; DA = depth
averaged
2.
The
relative change is calculated as 100% * (Operation Phase - Pre-development) /
Pre-development
3.
“<d.l.”
denotes less than detection limit.
4.
“n.d.”
denotes not determinable.
5.
Note
that the E.coli concentrations
presented in this table are the geometric mean over a spring-neap cycle but
not the geometric mean over a whole bathing season. Therefore it should not be directly
compared to the EPD monitoring data as shown in Table 6.6 and beach WQO, ie 180 cfu per 100mL.
|
Table 6.23: Comparison of Relative Change in E. coli Concentrations
between Pre-development and Operation Phase – 20% Sewerage Connection Rate
(Note that the E.coli concentrations
presented in this table are the geometric mean over a spring-neap cycle but not
the geometric mean over a whole bathing season.
Therefore it should not be directly compared to the EPD monitoring data
as shown in Table 6.6 and beach WQO,
ie 180 cfu per 100mL)
|
Modelling
Assessment Points
|
Depth
|
Predicted E. coli Concentrations (no./100mL)
Geometric Mean over a
Spring-Neap Cycle
|
Percentage of Relative
Change
|
|
Pre-development
|
Operation Phase
|
|
Dry Season
|
Wet Season
|
Dry Season
|
Wet Season
|
Dry Season
|
Wet Season
|
|
SR8
(Proposed Land
Requirement Boundary)
|
S
|
9
|
3
|
3
|
<d.l.
|
-62%
|
<n.d.
|
|
M
|
9
|
5
|
3
|
2
|
-63%
|
-69%
|
|
B
|
10
|
7
|
4
|
3
|
-63%
|
-63%
|
|
DA
|
9
|
5
|
3
|
2
|
-63%
|
-67%
|
|
SR9
(Proposed Land Requirement
Boundary)
|
S
|
15
|
7
|
14
|
7
|
-6%
|
-7%
|
|
M
|
17
|
16
|
15
|
14
|
-10%
|
-13%
|
|
B
|
21
|
21
|
18
|
20
|
-14%
|
-4%
|
|
DA
|
18
|
15
|
16
|
14
|
-10%
|
-8%
|
|
SR10
(Proposed Land Requirement
Boundary)
|
S
|
40
|
32
|
14
|
9
|
-64%
|
-73%
|
|
M
|
41
|
36
|
14
|
10
|
-66%
|
-73%
|
|
B
|
42
|
43
|
14
|
11
|
-67%
|
-73%
|
|
DA
|
41
|
37
|
14
|
10
|
-66%
|
-73%
|
|
SR11
(Proposed Land Requirement
Boundary)
|
S
|
30
|
22
|
7
|
4
|
-77%
|
-84%
|
|
M
|
30
|
23
|
7
|
4
|
-77%
|
-83%
|
|
B
|
30
|
25
|
7
|
4
|
-77%
|
-83%
|
|
DA
|
30
|
23
|
7
|
4
|
-77%
|
-83%
|
|
SR12
(Proposed Land Requirement
Boundary)
|
S
|
135
|
179
|
81
|
94
|
-40%
|
-47%
|
|
M
|
141
|
195
|
87
|
110
|
-38%
|
-44%
|
|
B
|
146
|
216
|
109
|
158
|
-25%
|
-27%
|
|
DA
|
141
|
197
|
93
|
121
|
-34%
|
-39%
|
|
Notes:
1.
S =
near to the water surface; M = mid-depth; B = near to the seabed; DA = depth
averaged
2.
The
relative change is calculated as 100% * (Operation Phase - Pre-development) /
Pre-development
3.
“<d.l.”
denotes less than detection limit.
4.
“n.d.”
denotes not determinable.
5.
Note
that the E.coli concentrations
presented in this table are the geometric mean over a spring-neap cycle but
not the geometric mean over a whole bathing season. Therefore it should not be directly
compared to the EPD monitoring data as shown in Table 6.6 and beach WQO, ie 180 cfu per 100mL.
|
Figures 6.14 – 6.19 show that the E. coli plume of 180 counts per 100mL
(WQO criterion) would be outside the groynes and the beach area in
general. It is predicted that the E. coli plume of 180 counts per 100mL
would not be formed to the west of the western groyne whereas the plume would
be formed to the east of the eastern groyne but would be outside the groyne. To
get an insight whether that E. coli
plume will flow over the inclined groynes, the results are compared with the
historical tidal data collected at Tai Po Kau at where the tidal gauge for the
whole Tai Po District is located.
Table 6.24 presents the sea level
data at Tai Po Kau under normal conditions whilst Table 6.25 depicts the sea level under five extreme conditions, ie
return periods of 2, 5, 10, 20 and 50 years.
The maximum horizontal extent of E.
coli plume of 180 counts per 100mL near the water surface was predicted
from
Figures 6.14 – 6.19. Based on this, the corresponding
elevation of groyne was estimated. The corresponding elevation of groyne in
addition to the height of the planter (at least 1.5 m high, on the top of the
groyne) was then compared to the sea level under both normal and extreme
conditions. As seen from Table 6.26, the overflow of the E. coli would be unlikely to occur since
the groyne as well as the planter will effectively prevent the plume from
entering the beach area.
Table 6.24: Sea Level at Tai Po Kau under Normal Conditions
|
Sea
Levels at Tai Po Kau under Normal Conditions
(1)
|
|
|
Elevation
(mPD)
|
|
Mean Sea
Level
|
+1.2
|
|
Mean Higher
High Water (MHHW) (2)
|
+2.0
|
|
Mean Lower
Low Water (MLLW)
|
+0.4
|
|
Note:
|
|
(1)
Civil Engineering Department, HKSAR (2002).
Ports Works Manual Part 1 - General Design Considerations for Marine
Works. Table 2. Period of data:
1981-1999
|
|
(2)
Higher High Water (HHW): The higher of the two high waters of any tidal day.
The single high water occurring daily during periods when the tide is diurnal
is considered to be Higher High Water.
|
Table 6.25: Sea Level at Tai Po
Kau under Extreme Conditions
|
Sea
Levels at Tai Po Kau under Extreme
Conditions (1)
|
|
Return
Period
|
Elevation
(mPD)
|
|
1 in 2
years
|
+2.90
|
|
1 in 5
years
|
+3.30
|
|
1 in 10
years
|
+3.60
|
|
1 in 20
years
|
+3.80
|
|
1 in 50
years
|
+4.10
|
|
Note:
|
|
(1)
Civil Engineering Department, HKSAR (2002).
Ports Works Manual Part 1 - General Design Considerations for Marine
Works. Table 5. Period of data: 1962-1999
|
Table 6.26: Possibility of Overflow of E. coli plume under both Normal
Conditions and Extreme Conditions
|
Scenarios
|
Predicted
E.coli Plume of 180 cfu/100mL (1)
|
Top
Level of Groyne with Planter
(planter
height = at least 1.5m)
|
Possibility
of Overflow under Normal Conditions
|
Possibility
of Overflow under Extreme Conditions
(1 in 2 years return period)
|
Possibility
of Overflow under Extreme Conditions
(1 in 5 years return period)
|
Possibility
of Overflow under Extreme Conditions
(1 in 10 years return period)
|
Possibility
of Overflow under Extreme Conditions
(1 in 20 years return period)
|
Possibility
of Overflow under Extreme Conditions
(1 in 50 years return period)
|
|
(Sewerage
Connection Rate)
|
Max.
Horiz. Distance from the Vert. Seawall (m)
|
Corres.
Elevation of Groyne (mPD)
|
(mPD)
|
Overflow
occurs if the top level of the groyne with planter is lower than the MHHW of
+2.0mPD
|
Overflow
occurs if the top level of the groyne with planter is lower than the Sea
Level of +2.9mPD
|
Overflow
occurs if the top level of the groyne with planter is lower than the Sea
Level of +3.3mPD
|
Overflow occurs if the top level
of the groyne with planter is lower than the Sea Level of +3.6mPD
|
Overflow
occurs if the top level of the groyne with planter is lower than the Sea
Level of +3.8mPD
|
Overflow
occurs if the top level of the groyne with planter is lower than the Sea
Level of +4.1mPD
|
|
|
|
|
|
|
60%
|
36
|
+3.36
|
+4.86
|
Unlikely
|
Unlikely
|
Unlikely
|
Unlikely
|
Unlikely
|
Unlikely
|
|
40%
|
45
|
+3.00
|
+4.50
|
Unlikely
|
Unlikely
|
Unlikely
|
Unlikely
|
Unlikely
|
Unlikely
|
|
20%
|
50
|
+2.80
|
+4.30
|
Unlikely
|
Unlikely
|
Unlikely
|
Unlikely
|
Unlikely
|
Unlikely
|
|
Notes:
|
|
(1)
Refers to E.coli plume near water surface during the wet season
predicted by water quality modelling for this Study.
|
To assess whether Lung
Mei Beach would be environmentally suitable for swimming and other recreational
uses, the following has been considered:
·
Water Quality Objective (WQO) for bathing beaches has been
set under the Water Pollution Control
Ordinance (WPCO). The WQO states that the level of E. coli should not exceed 180 per 100mL,
calculated as the geometric mean for all samples collected from March to
October inclusive. During bathing
seasons, all gazetted beaches are monitored at least three times per month,
while the non-gazetted beaches are monitored at least twice per month. This WQO applies to all bathing beaches in Hong Kong waters.
· The current government’s policy of opening a gazetted beach
was referenced.
Leisure and Cultural Services Department (LCSD)
confirmed that the decision to open or close a beach depends on a dual system,
namely beach annual ranking system and beach weekly grading system.
o Beach annual
ranking system - Annual geometric mean E.coli
concentration, calculated as the geometric mean for all samples collected from
March to October inclusive. There are
totally four ranks, which are Good (≤24 counts per 100 mL), Fair (25-180
counts per 100 mL), Poor (181-610 counts per 100 mL) and Very Poor (>610
counts per 100 mL). LCSD will consider
closing the “Very Poor” gazetted beaches in the next bathing season. EPD will
assist to continue monitoring of the beach water quality and provide LCSD the
monitoring results. LCSD will consider re-opening these gazetted beaches when the
water quality becomes suitable for swimming.
o
Beach weekly
grading system - Geometric mean E.coli
concentration of the 5 most recent sampling occasions. There are totally four grades, which are
Grade 1 (≤24 counts per 100 mL), Grade 2 (25-180 counts per 100 mL),
Grade 3 (181-610 counts per 100 mL) and Grade 4 (>610 counts per 100 mL or
last reading exceeds 1,600 counts). LCSD
will consider closing the gazetted beach when the weekly grading reaches Grade
4. EPD will assist to continue monitoring of the beach water quality and provide
LCSD the monitoring results. LCSD will consider re-opening its gazetted beaches when the
water quality becomes suitable for swimming.
Assessment based on WQO
(Beach) and Beach Annual Ranking System
·
In regard with the beach annual ranking system, the beach
water at Lung Mei was all ranked as “Fair” throughout year 2000 to 2006. Annual rank has not been assigned to 2007 at
the completion of the EIA Report since the monitoring data for October 2007 is
pending.
· With the combination of DSD’s new sewerage system, it is
mandatory for new developments to connect to the public sewer whereas connections
to the sewer for existing households are subject to various factors such as
technical feasibility. From information provided by DSD, overall the
connection rate is relatively high for the villages which have installed with
new sewers. It is anticipated that over
60% connection rate can be achieved.
Thus, over 60% of the effluents from the village will be sewered to the
system and thus it is expected that this would improve the water quality at
Lung Mei.
·
The predicted E. coli
concentrations in the beach water during the operation phase are calculated by
multiplying the relative percentage change with the annual geometric mean
(bathing season only):
o Relative Percentage Change: Relative
change will give an indication of how much better (or worse) after the
implementation of sewerage improvement at various locations of the beach during
the operational phase. The predicted
values in both dry and wet season under three scenarios are shown in Table 6.27. It shows that the overall reduction (mean
relative change) in E. coli
concentrations within the beach area is over 50%.
o
Annual Geometric Mean: The EPD routine beach
water quality monitoring E. coli data
(up to September 2007) was reviewed. The
data for 2007 were used for the assessment since it is the latest available
information and the most conservative case as compared with the other
years. The E. coli level at Lung Mei beach is 345 cfu per 100 mL, calculated
as the geometric mean for all samples collected from March 2007 to September
2007 inclusive.
o
Predicted E.
coli Concentrations: It indicates that the water quality of the proposed
beach is expected to be significantly improved and the mean E. coli concentrations to be compliant
with the WQO, ie 180 counts per 100 mL.
Table
6.27:
Predicted Mean E.coli
Concentrations
in
Beach Water during Operation Phase
|
Proposed Improvement Works
|
Dry Season
|
Wet Season
|
|
Proposed Bathing Beach
Development
|
DSD’s Sewerage System
Connection Rate
|
Relative Percentage Change (a)
|
Predicted E.coli Concentration
(counts/100mL) (b)
|
Relative Percentage Change (a)
|
Predicted E.coli Concentration
(counts/100mL) (b)
|
|
Drainage diversions and groynes in place
|
60%
|
-75%
|
86
|
-65%
|
121
|
|
Drainage diversions and groynes in place
|
40%
|
-63%
|
128
|
-59%
|
141
|
|
Drainage diversions and groynes in place
|
20%
|
-50%
|
173
|
-54%
|
159
|
Notes:
(a)
Mean was calculated as the
average of the modelling results at the model output points, SR8 to SR12.
(b)
345 counts per 100mL multiplied
by relative percentage change.
Assessment based on Beach
Weekly Grading System
·
The existing condition was reviewed and the weekly grading
of Lung Mei Beach between March and September 2007 is summarised in
Table 6.28. It shows that with 62% of time throughout
March and September 2007 Lung Mei Beach was graded as Grade 2 or Grade 3.
·
Prediction of percentage of weekly gradings for the
operation phase was made based on the modelling results. By applying the mean relative percentage
changes, as shown in
Table 6.27 to
EPD monitoring beach water quality data (year 2007), the percentages of weekly grading for three
operational scenarios are calculated and presented in
Table 6.28. A
conservative assumption of a 60% sewerage connection rate was assumed in this
assessment. In long term, a higher sewerage connection rate may be achievable.
Since the modelling results show that a higher sewerage connection rate is
likely to increase the frequency of occurrence of Grade 2 at Lung Mei Beach, it
is anticipated that the frequency of Grade 1 or Grade 2 would be increased in
case a higher sewerage connection rate of >60% could be achieved.
Table 6.28: Lung Mei Beach – Percentage of Weekly
Gradings in 2007 and Predicted Percentage of Weekly Gradings during Operation
Phase
|
Beach
Grade
|
%
of Time throughout Bathing Season
|
|
Pre-development
(Year 2007)*
|
Operation
Phase
|
|
60%
Sewerage Connection**
|
40%
Sewerage Connection**
|
20%
Sewerage Connection**
|
|
Grade
1
|
0
|
0
|
0
|
0
|
|
Grade
2
|
19
|
62
|
53
|
53
|
|
Grade
3
|
43
|
24
|
33
|
33
|
|
Grade
4
|
38
|
14
|
14
|
14
|
|
Beach Open or Close
|
62% of time Open
|
86% of time Open
|
86% of time Open
|
86% of time Open
|
Source: EPD
Routine Beach Water Quality Monitoring data (March 2007 to September 2007)
· The
findings summarized in
Table 6.28
depicts that with most of the time (over 86%) bathing beach in operation phase,
the weekly beach
gradings of Lung Mei Beach
will be of Grade
2 or Grade 3 which LCSD considers to be acceptable. This suggests that the water
quality at Lung Mei Beach during the operation phase will be
significantly improved, provided that both the Proposed Bathing Beach
Development (especially the drainage diversions and groynes are completed) and
DSD's
new sewerage
system will be in place.
Further Discussion on Assessment the Suitability for
Gazetted Beach Development
The above
assessment has predicted that the beach water quality during the operation phase
of the beach will be in compliance with standards including WQO (beach).The
following continuous effort to be paid by the operator should also be taken
into account whilst assessing the suitability of Lung Mei being a gazetted bathing
beach.
· DSD’s new sewerage system will form part of
the proposed improvement works for the Proposed Beach Development. It is hence recommended that the project
proponent and the operator should closely liaise with DSD to monitor the
implementation programme of the village sewerage projects to achieve the target
sewerage connection rate to communal sewers before the beach is put into
operation.
· EPD has well
established a comprehensive water quality monitoring programme for all gazetted
beaches to detect any deterioration of beach water quality, which will also be
implemented for this Lung Mei bathing beach.
In case the beach water quality at Lung Mei tends to be
deterioriated and becomes not desirable for swimming, LCSD will close the beach
temporarily until
the beach water quality becomes suitable for swimming. EPD will continue
monitoring the beach water quality and provide LCSD the monitoring results.
· Under the abnormal conditions, for example accidental leakage from
unsewered septic tanks, sewage may flow via the drains and eventually enter the
sea. This domestic sewage may contain
SS, nutrients and BOD and as a result the beach water quality may have
deterioration. However, it is anticipated
that the leakage will be of small amount and deterioration of water quality
will be transient. In this special
case, similar to the practice adopted for other gazetted beaches by LCSD, Lung
Mei Beach may be closed to swimmers in accordance with the above-mentioned relevant
procedures until the beach water quality resumes normal. Bathers are usually advised to avoid swimming
at the beach during the closure.
In view that the
improvement works, including the diversion of drains, the provision of groynes
and DSD’s new sewerage system to be in place, the beach water quality is
expected to be significantly improved.
The proposed site is suitable to operate as a bathing beach with regard
to the compliance with the WQO for E.
coli and high likelihood of achieving Beach Grade 2 (Fair) standard during
its operation phase. In addition to the
improvement works, the operator will pay best effort to provide the greatest
protection for the bathers. It
is also noted that the the Tolo Harbour Sewerage of Unsewered Areas Stage I
Phase IIC (Agreement No. CE 18/94) including Lung Mei area, as part of the
Sewerage Master Plan (SMP) Works, is expected to be gazetted prior to the
operation of the Proposed Beach Development. This
will further improve the water quality in the Lung Mei region since
it is mandatory for new developments to connect to the public
sewer. CEDD and LCSD will
closely monitor the implementation programme of the village sewerage projects to
achieve the target sewerage connection rate to communal sewers before the beach
is put into operation.
In addition to the compliance with water quality standards, Lung Mei is
considered to be the best location for the proposed beach development in view of
the community demand and accessibility:
· Community
Demand: There is no beach
facility in the east region of the New Territories, except in
the Sai Kung District, which is very far from Tai Po District. Moreover, the
existing and future swimming facilities in the Tai Po areas could not satisfy
the demand for a bathing beach. Therefore, the public has been requesting
repeatedly to the LCSD for a beach development in the Tai Po District.
Consequently, the Feasibility Study was carried out and identified in 2001 that
the current project site as a feasible location for developing a bathing beach.
In light of the above, the Tai Po District Council (TPDC) strongly requested
the development of a bathing beach at Lung Mei and members of the TPDC urged for
early implementation of the Project. In a Legislative Council case conference on
20 April 2004, Members requested the Government to accord priority to this
Assignment. This project was one of the 25 projects identified for priority
implementation in the Chief Executive’s 2005 Policy Address and has the support
of Home Affairs Bureau. It is considered that this Proposed Beach Development
at Lung Mei will meet the increasing demand for swimming facilities. Moreover,
the beach can serve a recreational function even during non-bathing season, ie
playing in the sand, sunbathing and other beach activities.
· Accessibilty:
Lung Mei is located next to the existing road (Ting Kok Road) and at the sea
front. The proposed Lung Mei beach facilities and carpark area will be highly
accessible.
6.6
Mitigation
Measures and Residual Impacts
6.6.1
Mitigation
Measures for Construction Phase
Dredging and Sandfilling Operations
The impacts arising from
the dredging and sandfilling works to the surrounding water quality have been
assessed in Section 6.5.1. It is predicted that the sediment plume and
the sediment deposition will not be large in extent and no unacceptable water
impacts including DO depletion, release of contaminants and nutrients are
expected.
Although no unacceptable
water quality impacts would result, the following good construction site
practice and proactive precautionary measures are recommended to ensure
dredging and sandfilling operations would be undertaken in such a manner as to
avoid any uncontrolled or unexpected incidents during the marine works:
·
Sandfilling works should be carried out after the completion
of groyne construction.
·
A movable cage type / metal frame type silt curtain, as
shown in
Figure 6.20 will be deployed around the dredging area
next to the grab dredger prior to commencement of dredging works;
·
Standing type silt curtains, as shown in Figure 6.21, will be deployed around the
proposed sandfilling extent prior to commencement of sandfilling works;
·
A hourly dredging rate of a closed grab dredger (with a
minimum grab size of 3 m3) should be less than 31 m3 hr-1,
with reference to the maximum rate for dredging, which was derived in the EIA;
·
A daily filling rate should be less than 1,000 m3
day-1, which was defined in the EIA;
·
Mechanical grabs should be designed and maintained to avoid
spillage and should seal tightly while being lifted;
·
Barges or hoppers should have tight fitting seals to their
bottom openings to prevent leakage of material;
·
Loading of barges or hoppers shall be controlled to prevent
splashing of dredged material to the surrounding water;
·
Barges or hoppers should not be filled to a level which will
cause overflow of materials or pollution of water during loading or
transportation;
·
Excess material should be cleaned from the decks and exposed
fittings of barges or hoppers before the vessel is moved;
·
Adequate freeboard should be maintained on barges to reduce
the likelihood of decks being washed by wave action;
·
All vessels should be sized such that adequate clearance is
maintained between vessels and the seabed at all states of the tide to ensure
that undue turbidity is not generated by turbulence from vessel movement or
propeller wash; and
·
The works should not cause foam, oil, grease, litter or
other objectionable matter to be present in the water within and adjacent to
the Project Site.
Construction Site Runoff
·
The excavation
works for the drainage diversions should be carried out to minimize any
seawater influx entering the works area and hence to keep the works area dry as
much as possible.
· Silt curtains at
the inshore waters should be deployed to enclose the works area before the
commencement of the excavation works for two drainage diversions until the
completion of the diversions. The
indicative locations of silt curtains are shown in Figure 6.21.
·
At the start of Proposed Beach Development establishment, perimeter
cut-off drains to direct off-site water around the site should be constructed
and internal drainage works and erosion and sedimentation control facilities
implemented. Channels, earth bunds or
sand bag barriers should be provided on site to direct stormwater to silt
removal facilities. The design of
efficient silt removal facilities should be based on the guidelines in Appendix A1 of ProPECC PN 1/94.
· All the surface runoff should be collected by the on-site
drainage system and diverted through the silt traps prior to discharge into
storm drain.
· All exposed earth areas should be completed as soon as
possible after earthworks have been completed, or alternatively, within 14 days
of the cessation of earthworks, where practicable. If excavation of soil cannot be avoided
during the rainy season, or at any time of year when rainstorms are likely,
exposed slope surfaces should be covered by tarpaulin or by other means.
· All drainage facilities and erosion and sediment control
structures should be regularly inspected and maintained to ensure proper and
efficient operation at all times and particularly following rainstorms. Deposited silt and grit should be removed
regularly and disposed of by spreading evenly over stable, vegetated areas.
· Measures should be taken to reduce the ingress of site
drainage into excavations. If the
excavation of trenches in wet periods is necessary, they should be dug and
backfilled in short sections wherever practicable. Water pumped out from trenches or foundation
excavations should be discharged into storm drains via silt removal facilities.
· Open stockpiles of construction materials (for example,
aggregates, sand and fill material) of more than 50 m3 should be
covered with tarpaulin or similar fabric during rainstorms. Measures should be taken to prevent the
washing away of construction materials, soil, silt or debris into any drainage
system.
·
Manholes (including newly constructed ones) should always be
adequately covered and temporarily sealed so as to prevent silt, construction materials or debris being washed
into the drainage system.
·
Precautions to be taken at any time of year when rainstorms
are likely, actions to be taken when a rainstorm is imminent or forecasted, and
actions to be taken during or after rainstorms are summarised in Appendix A2 of ProPECC PN 1/94. Particular
attention should be paid to the control of silty surface runoff during storm
events, especially for areas located near steep slopes.
·
Oil interceptors should be provided in the drainage system
and regularly emptied to prevent the release of oil and grease into the storm
water drainage system after accidental spillages. The interceptor should have a bypass to
prevent flushing during periods of heavy rain.
Typical design of the oil interceptors could make reference to Appendix D of ProPECC PN 1/94.
·
All temporary and permanent drainage pipes and culverts
provided to facilitate runoff discharge should be adequately designed for the
controlled release of storm flows. All
sediment traps should be regularly cleaned and maintained. The temporary diverted drainage should be
reinstated to the original condition when the construction work has finished or
the temporary diversion is no longer required.
Sewage Generated by Workforce
·
Sewage from toilets should
be collected by a licensed waste collector.
Storage and Handling of Oil, Other
Petroleum Products and Chemicals
·
Waste streams classifiable as chemical wastes should be
properly stored, collected and treated for compliance with Waste Disposal Ordinance or Disposal (Chemical Waste) (General)
Regulation requirements.
·
All fuel tanks and chemical storage areas should be provided
with locks and be sited on paved areas.
·
The storage areas should be surrounded by bunds with a
capacity equal to 110% of the storage capacity of the largest tank to prevent
spilled oil, fuel and chemicals from reaching the receiving waters.
·
Oil leakage or spillage should be contained and cleaned up
immediately. Waste oil should be
collected and stored for recycling or disposal, in accordance with the Waste Disposal Ordinance. The Contractors should prepare guidelines and
procedures for immediate clean-up actions following any spillages of oil, fuel
or chemicals.
·
Vehicle and plant servicing areas, vehicle wash bays and
lubrication bays should, as far as possible, be located within roofed
areas. The drainage in these covered
areas should be connected to foul sewers via a petrol interceptor.
6.6.2
Mitigation
Measures for Operation Phase
Although no unacceptable water quality impact is anticipated
during the operation phase, the following measures are recommended:
Surface Runoff from
Project Site
·
A petrol interceptor should be provided in the drainage
system and regularly emptied to prevent the release of oil and grease into the
storm water drainage system after accidental spillages. The interceptor should have a bypass to
prevent flushing during periods of heavy rain.
· Oil
leakage or spillage should be contained and cleaned up immediately. Waste oil should be collected and stored for
recycling or disposal in accordance with the Waste Disposal Ordinance.
It has been predicted in
the previous section that there would not be any unacceptable environmental
impacts, provided the mitigation measures are properly and fully
implemented. Hence no residual water
quality impacts were predicted to occur due to construction of the Proposed
Beach Development provided the above described mitigation measures are implemented. Similarly, no residual water quality impacts
were predicted to occur during the operation of the Proposed
Beach Development.
The
Tolo Harbour Sewerage of Unsewered Areas
Stage I Phase IIC (Agreement No. CE 18/94) will carry out works connecting the
unsewered areas from Ting Kok village to Lung Mei village, which are in the
vicinity of the bathing beach development. The current programme for the
sewerage construction works is November 2008 to November 2010, which
coincidently will be concurrent with the anticipated construction period for
this Proposed Bathing Beach Development project.
Apart from the tentative
timeline, details of the construction works of this sewerage project are not
available.
In general, the
construction works of similar kind of sewerage projects include the trenching
works, lying of pipes and backfilling of trenches. The potential water quality impact of key
concern is the site runoff although it is not anticipated that these minor land
based works would general substantial site runoff.
Normally, the contractor
will have a good practice on controlling the site runoff, for example, by
deploying the sandbags besides the trenches in order to avoid overflowing and
divert the natural runoff to the rainstorm drains. The site runoff will be minimal if good
practices are applied during its construction phase.
It has been discussed in Section 6.5.1 that the site runoff from
the Proposed Beach Development will not cause unacceptable water quality
impacts, with the full implementation of site practices and mitigation
measures. Therefore, no adverse
cumulative impacts are predicted.
6.9.1 Construction Phase
Although no unacceptable
impacts have been predicted to occur during the operation of dredging and sandfilling,
monitoring of marine water quality during the construction phase is considered
necessary to evaluate whether any impacts would be posed by these marine works
on the surrounding waters during the operation of dredging and filling
works. The details of the EM&A programme are presented in Section
11.
6.9.2
Post-Construction Phase
The Post-Construction
Phase is defined as after completion of construction works but before operation
of the beach. Within six
weeks after the completion of the construction of the Proposed Beach
Development, E. coli monitoring will
be carried out twice per week at two diverted drains and EPD routine monitoring
stations to examine the correlation of the pollution loading and the beach
water quality (details refer to Section
11.6 and the EM&A Manual). This information will be reviewed by LCSD to
ensure the beach water quality is suitable for recreational purpose before the
beach is put into operation.
6.9.3 Operation Phase
As no unacceptable
impacts have been predicted to occur during the operation of the Proposed
Beach Development, monitoring of marine water quality during the operation phase is not
considered necessary.
EPD has well established a
comprehensive water quality monitoring programme for all gazetted beaches to detect
any deterioration of beach water quality, which will also be implemented for
this Lung Mei bathing beach. In case the
beach water quality at Lung Mei tends to be deterioriated and becomes not
desirable for swimming, LCSD will close the beach temporarily in consultation
with EPD according to established procedures until the beach water quality
becomes suitable for swimming whilst EPD will continue monitoring the beach
water quality and explore further measure to improve the water quality in the
locality.
This Section has dealt
with the assessment of the impacts on water quality of the construction and
operation of Lung Mei bathing beach.
Construction Phase
The water quality
modelling works have indicated that for both the dry and wet seasons, no
exceedances of the WQO and the evaluation criterion are predicted to occur
during the dredging and sandfilling operations.
The impact assessment has also shown that other land-based construction
works, if properly controlled, are not expected to cause any adverse impacts to
the surrounding waters and the sensitive receivers. Mitigation measures were described, which
would provide a series of good site management options to minimise the impacts.
Operation Phase
No
operational impacts to water quality are expected to occur if mitigation
measures are fully implemented. Considering that the improvement works,
including the diversion of drains, the provision of groynes and with DSD’s new
sewerage system to be in place, the beach water quality is expected to be
significantly improved. The proposed
site is suitable to operate as a bathing beach with regard to the compliance
with the WQO for E. coli and high
likelihood of achieving Beach Grade 2 (Fair) standard during its operation
phase. In addition to the improvement
works, the operator will pay best effort to provide the greatest protection for
the bathers.
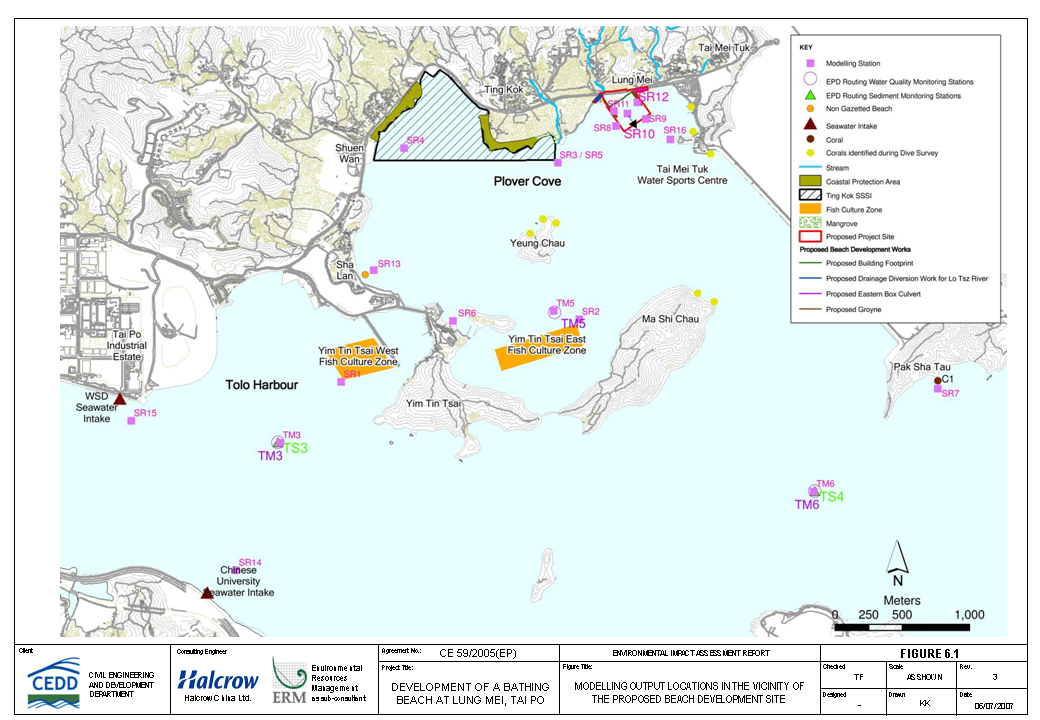
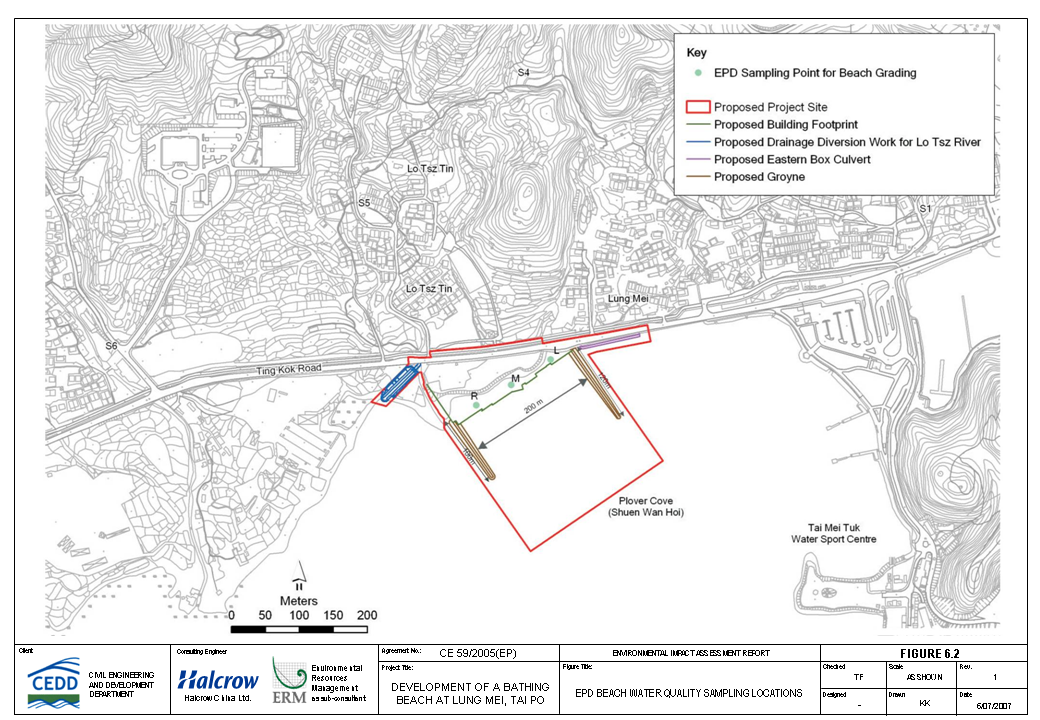
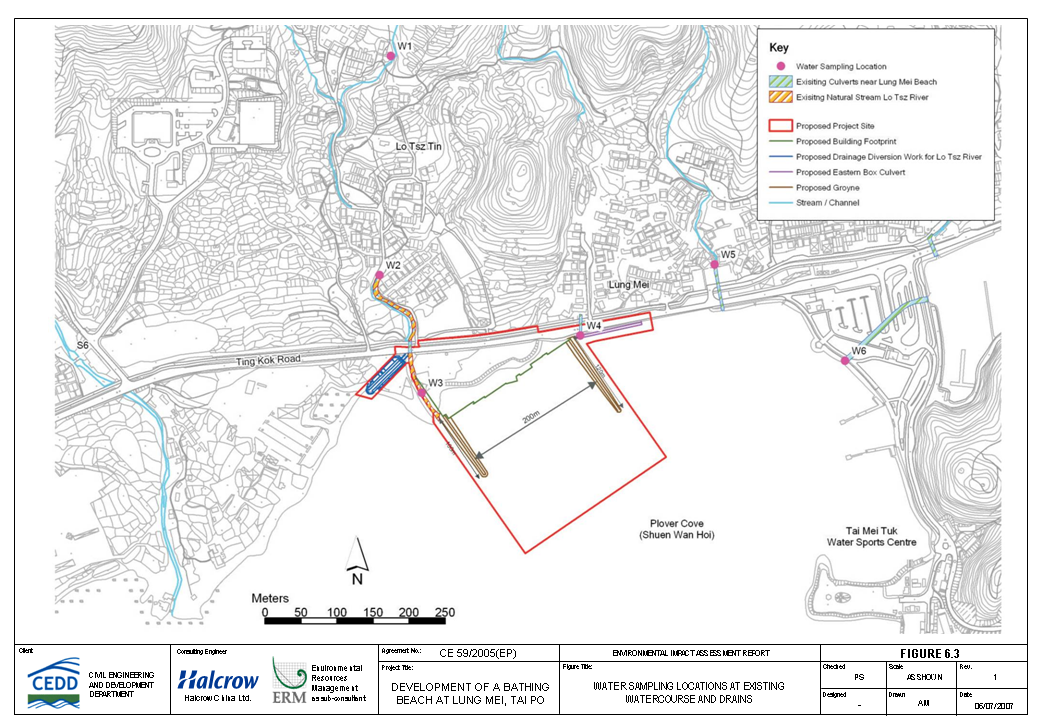
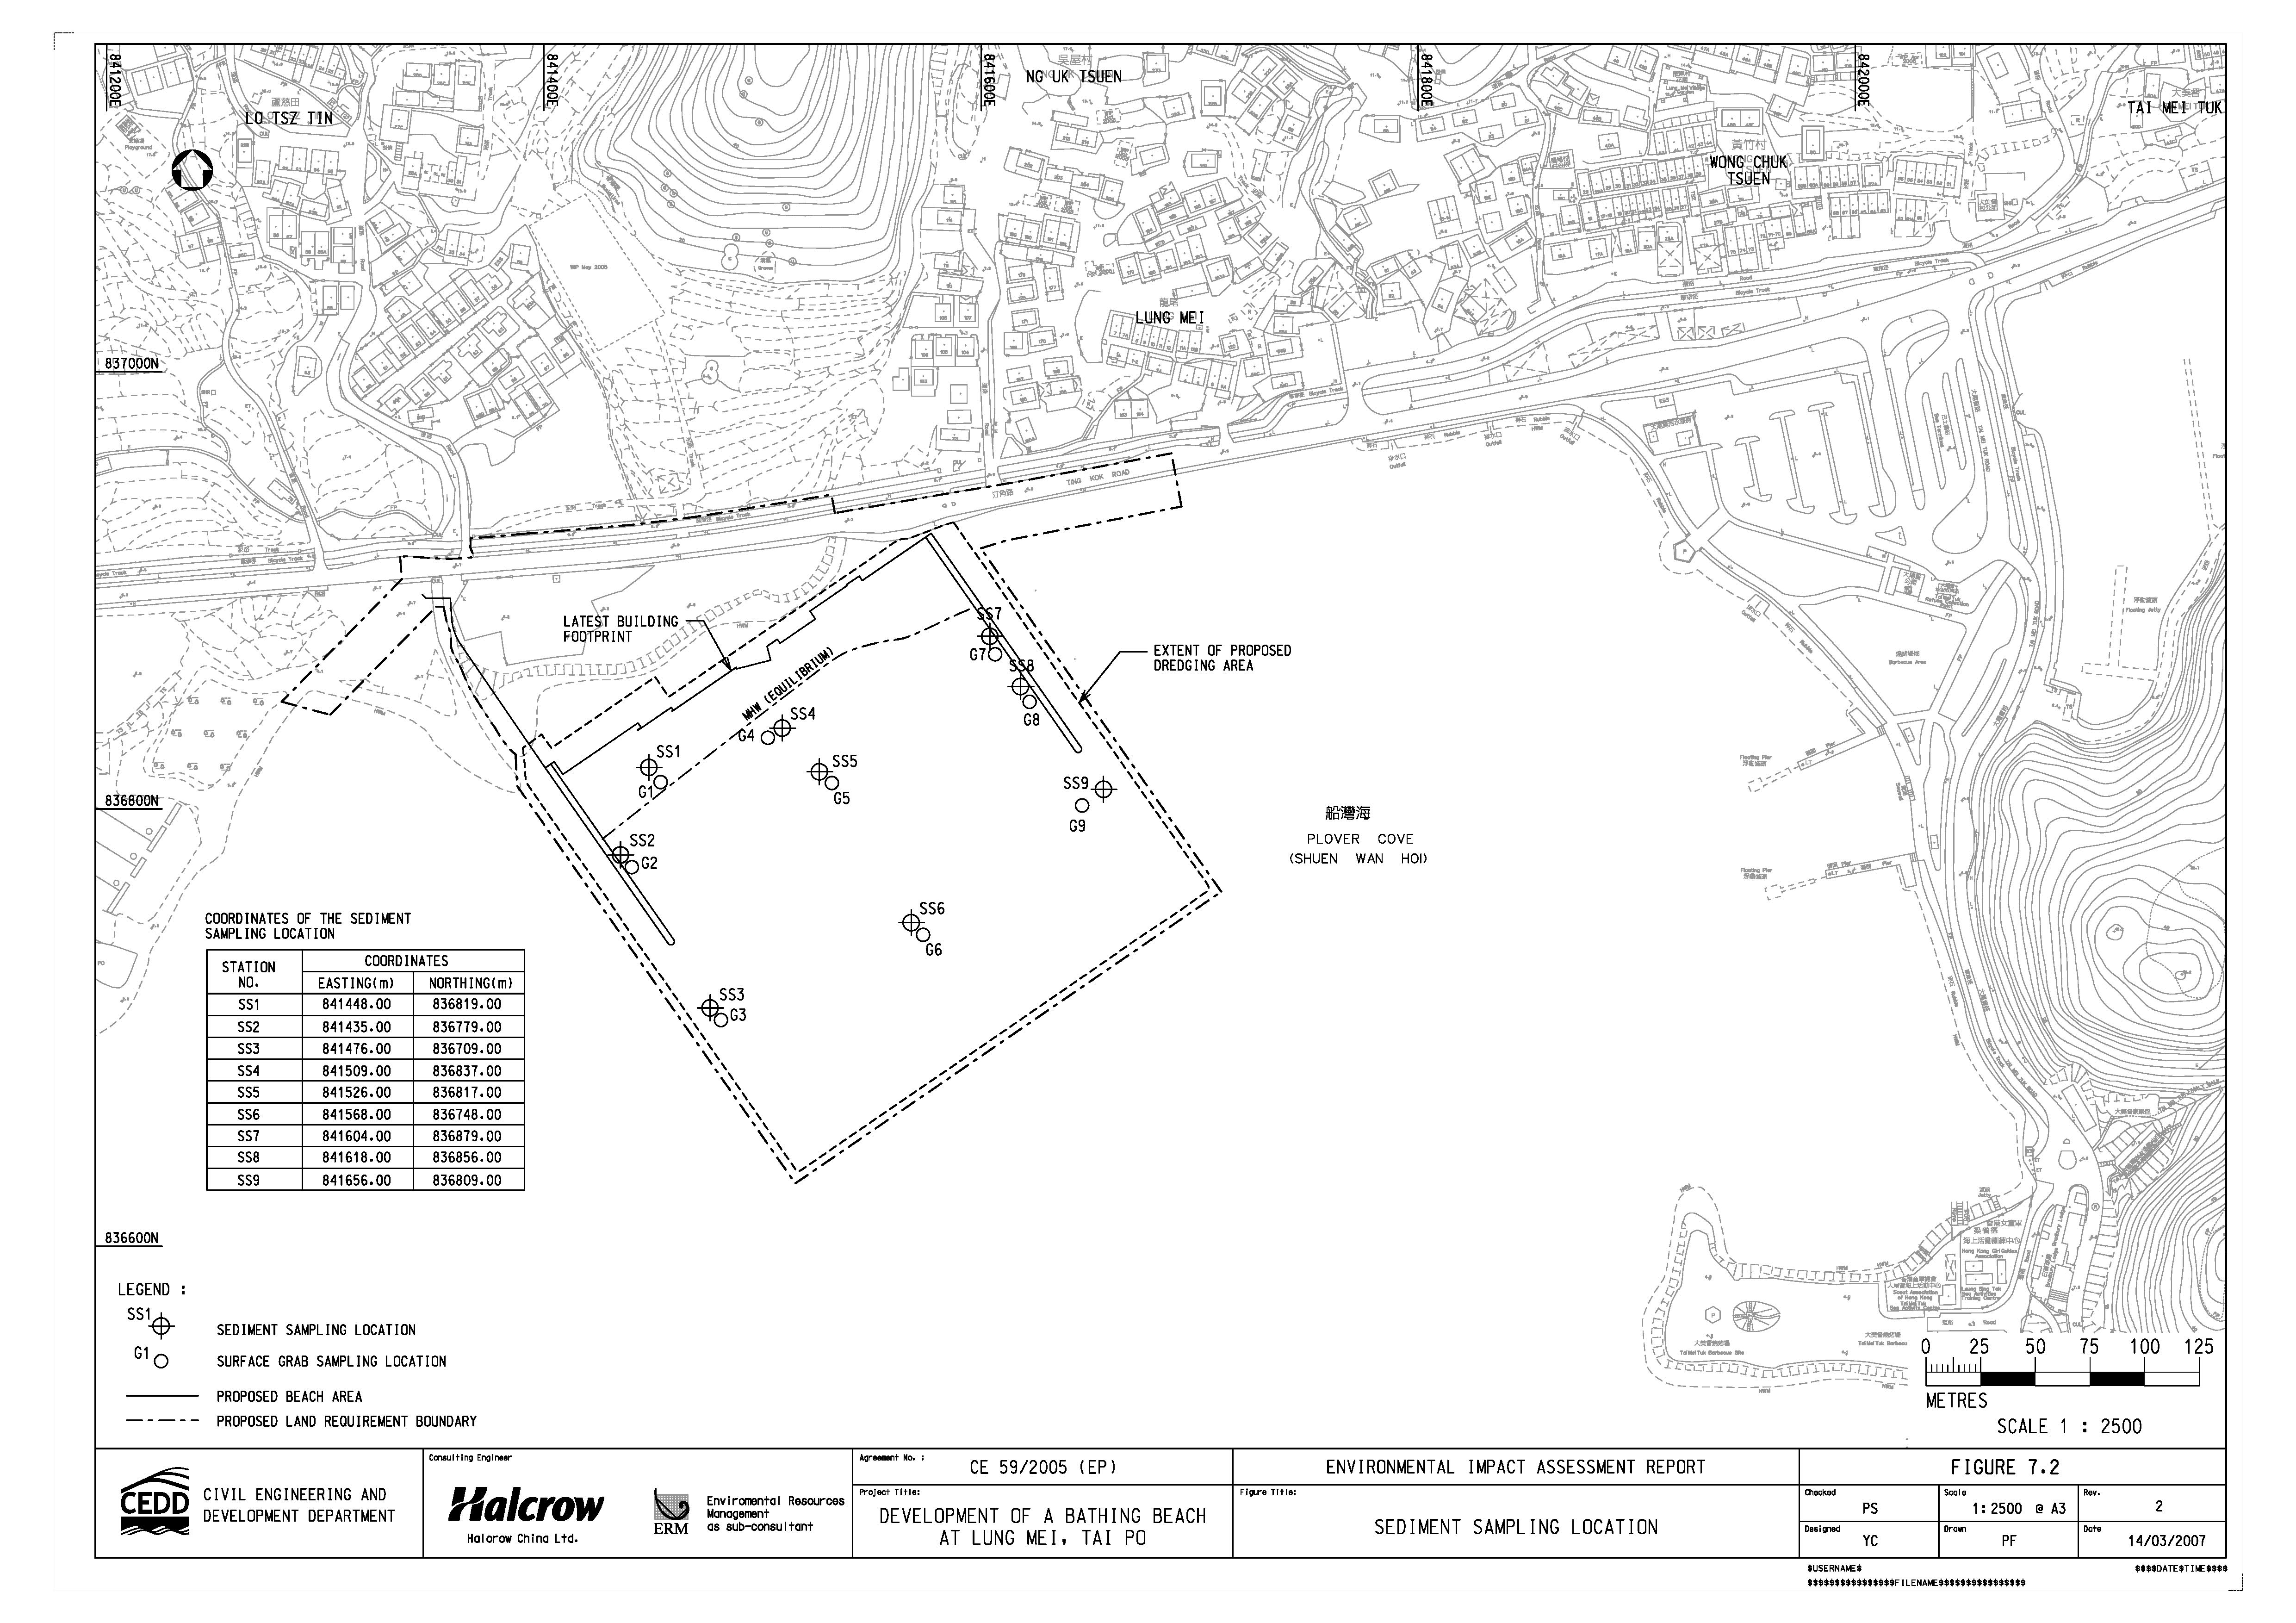
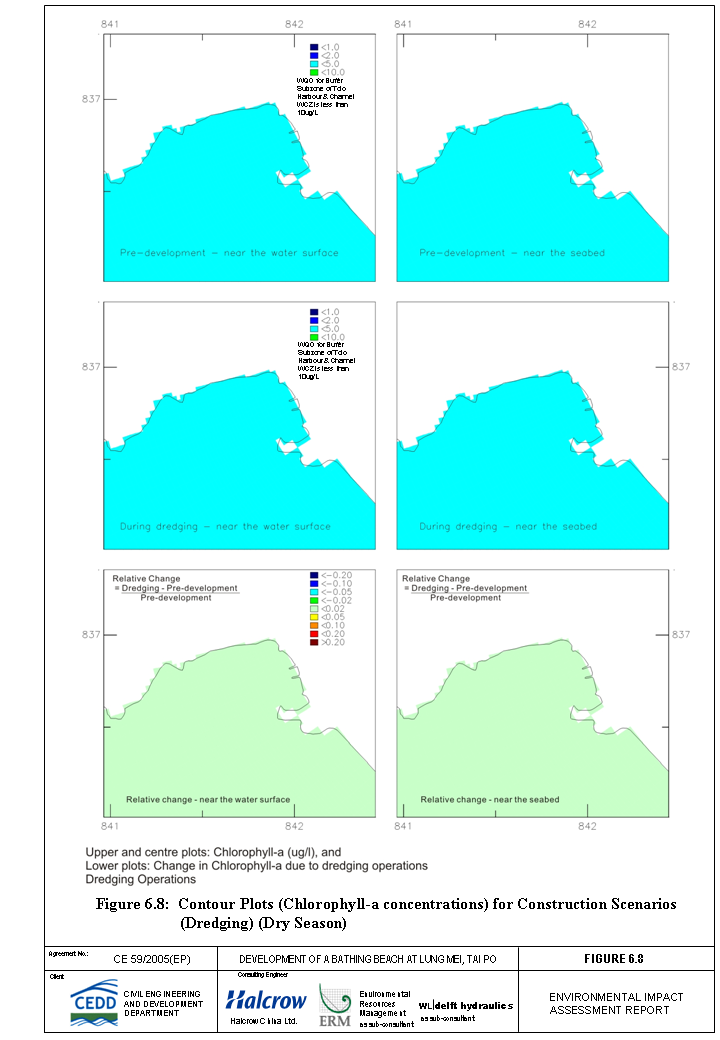
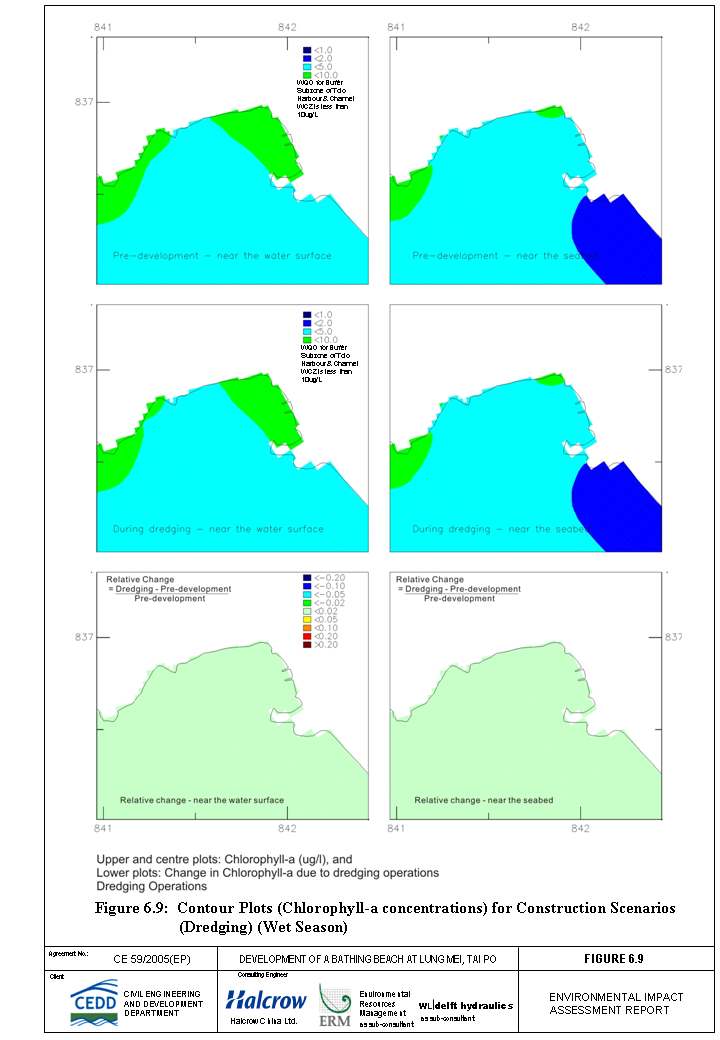
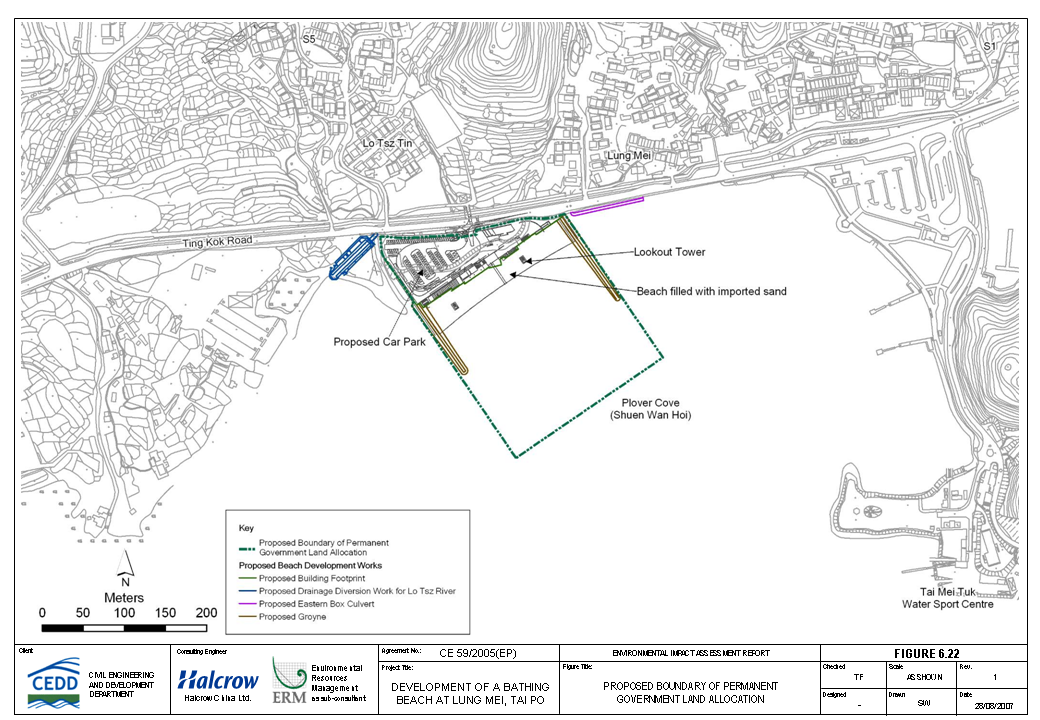
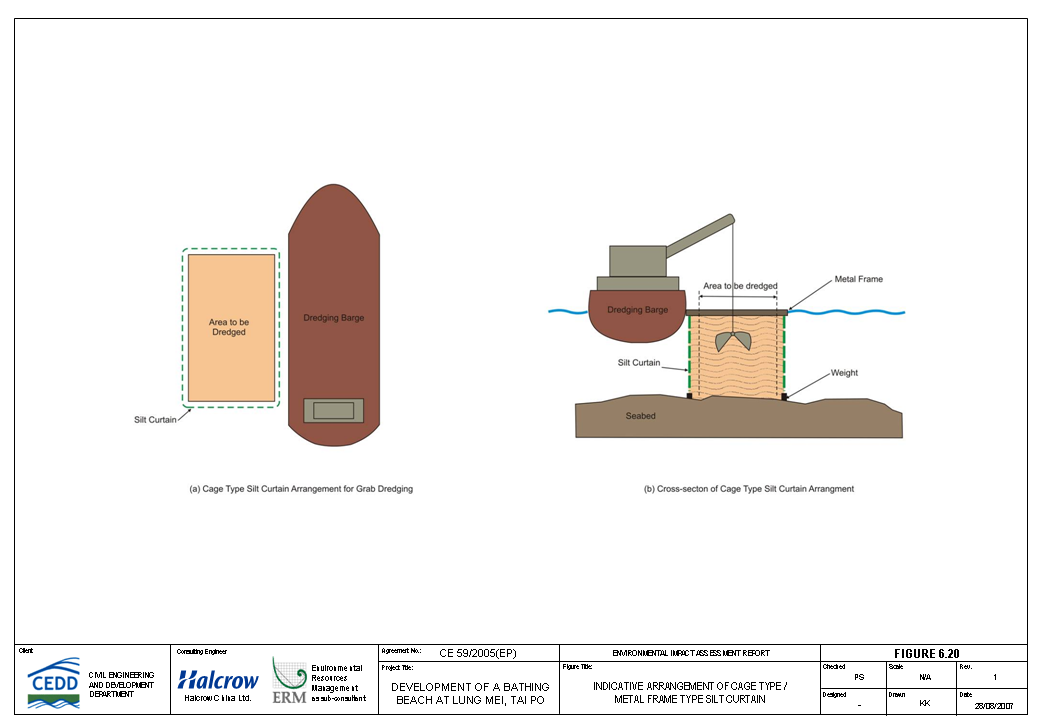
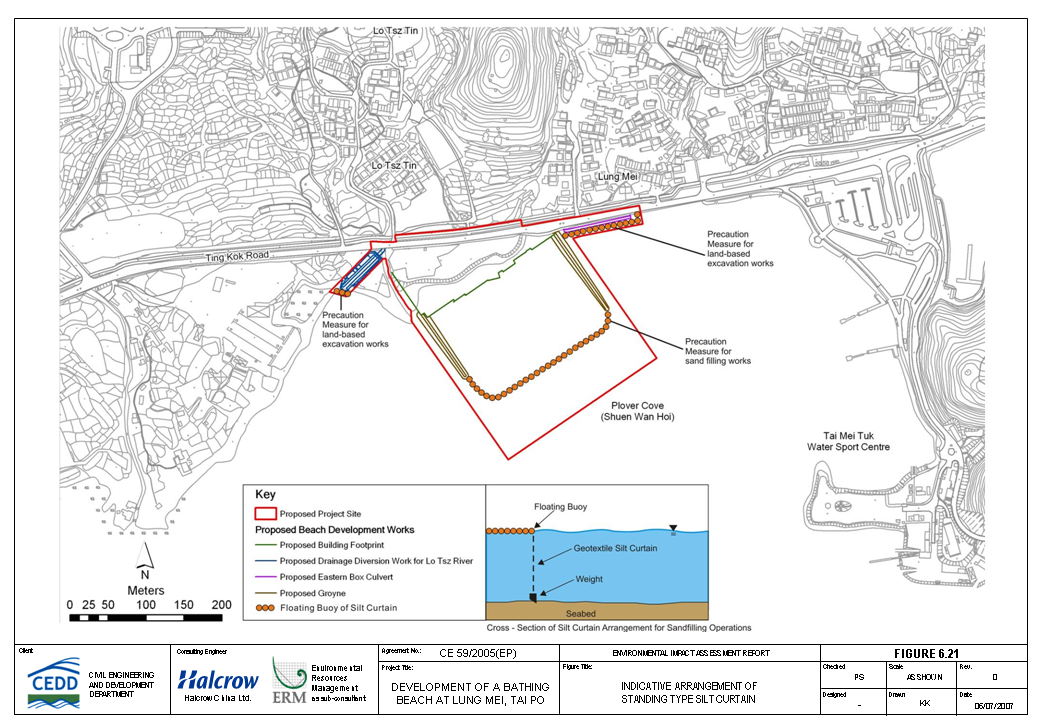