Environmental Impact Assessment Report - Volume I
TABLE OF CONTENTS
Chapter
Title
1.
INTRODUCTION
2.
Consideration of Alternatives
3.
description of the extension
4.
AIR QUALITY IMPACT ASSESSMENT
5.
NOISE
6.
WATER QUALITY ASSESSMENT
7.
WASTE MANAGEMENT ASSESSMENT
8.
LANDFILL GAS HAZARDS
9
ECOLOGY
10.
LANDSCAPE AND VISUAL IMPACTS
11.
ENVIRONMENTAL MONITORING AND AUDIT REQUIREMENTS
12
CONCLUSION AND SUMMARY OF ENVIRONMENTAL OUTCOMES
Figure List
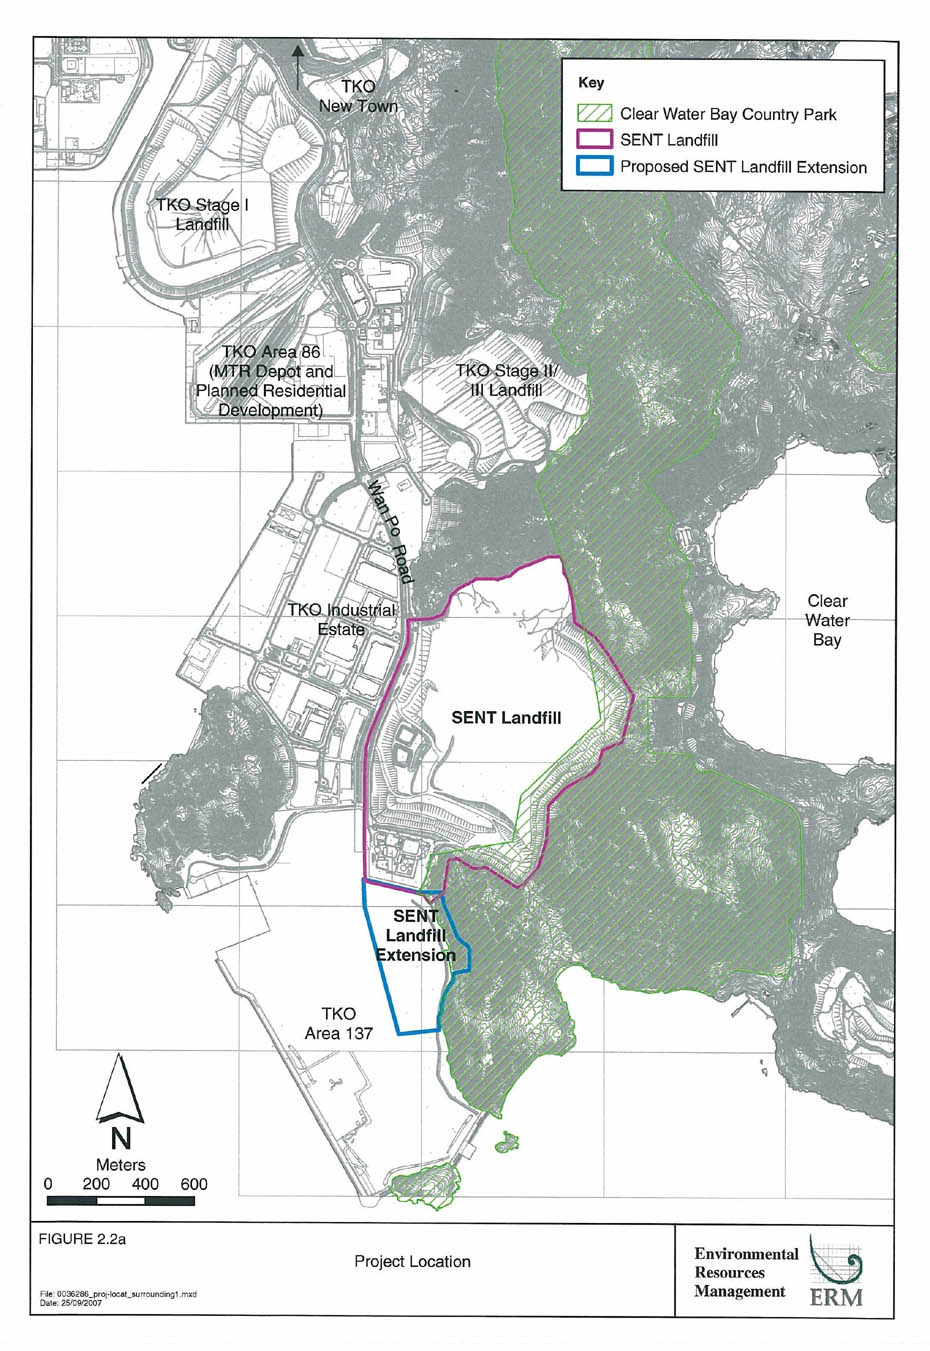
Figure 2.2a
Project Location
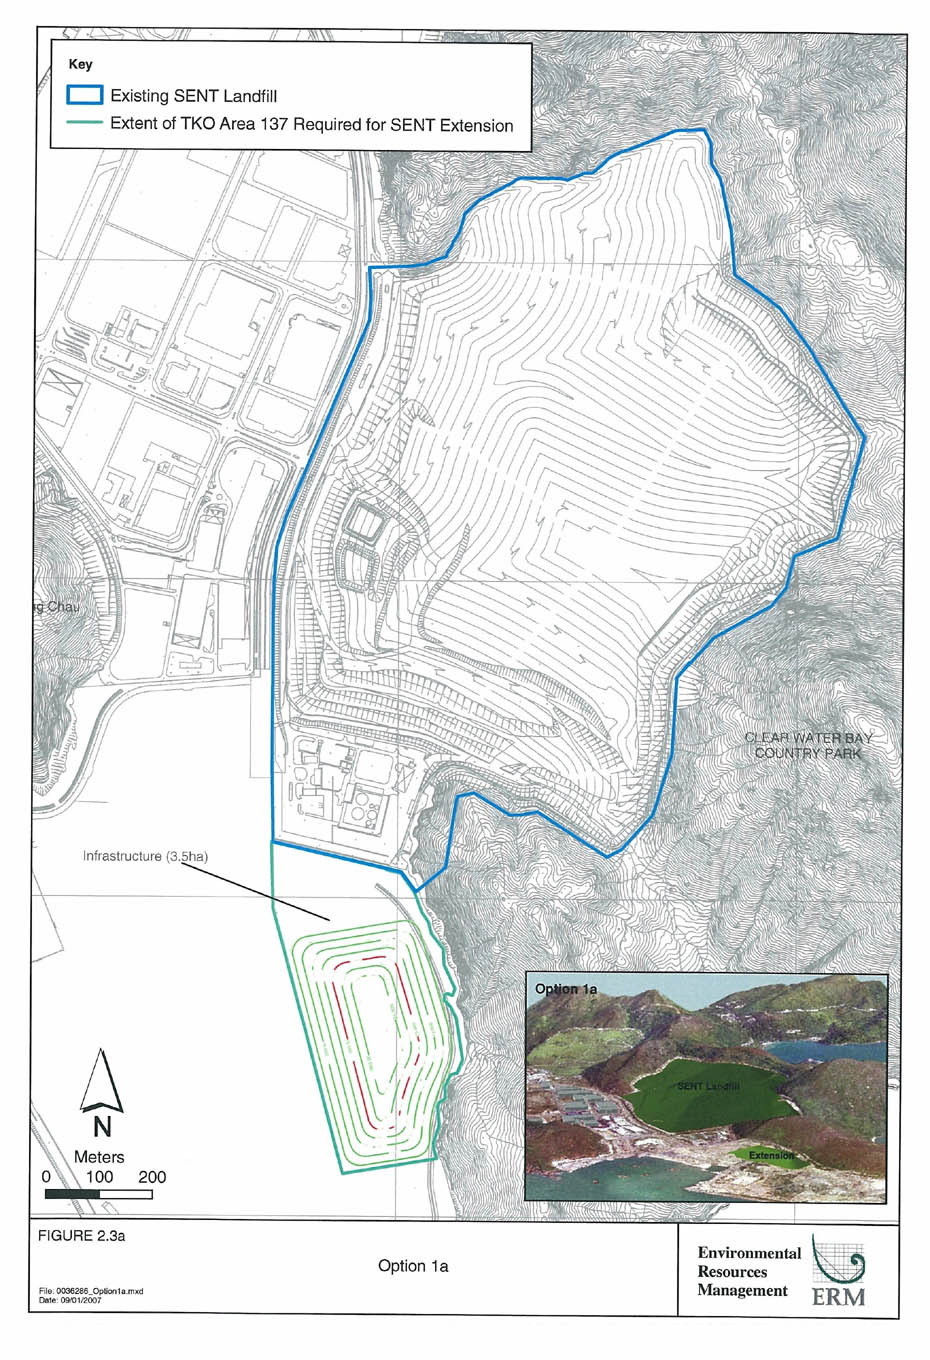
Figure 2.3a
Option 1a
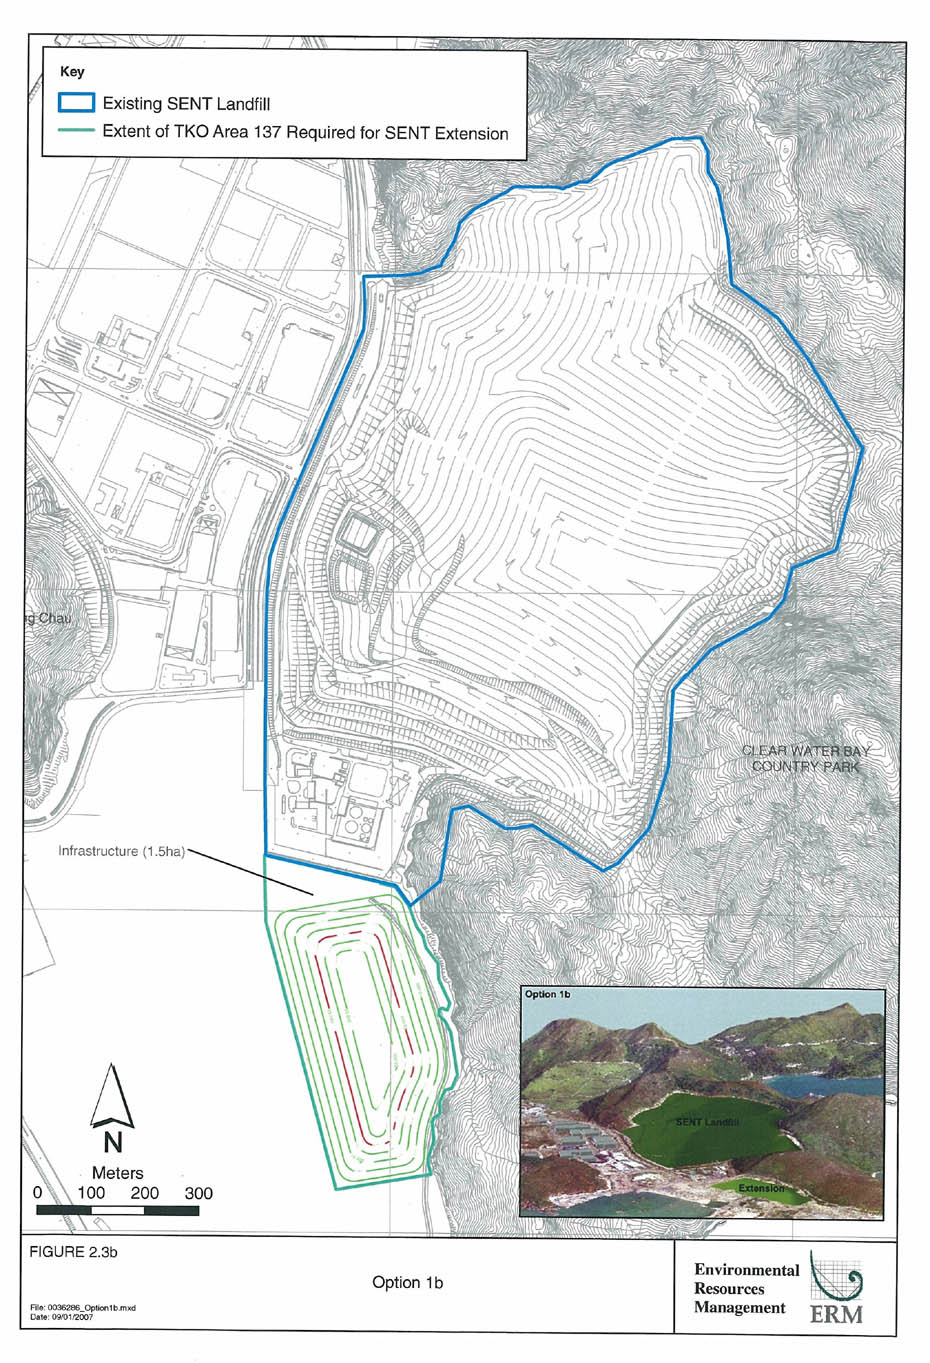
Figure 2.3b
Option 1b
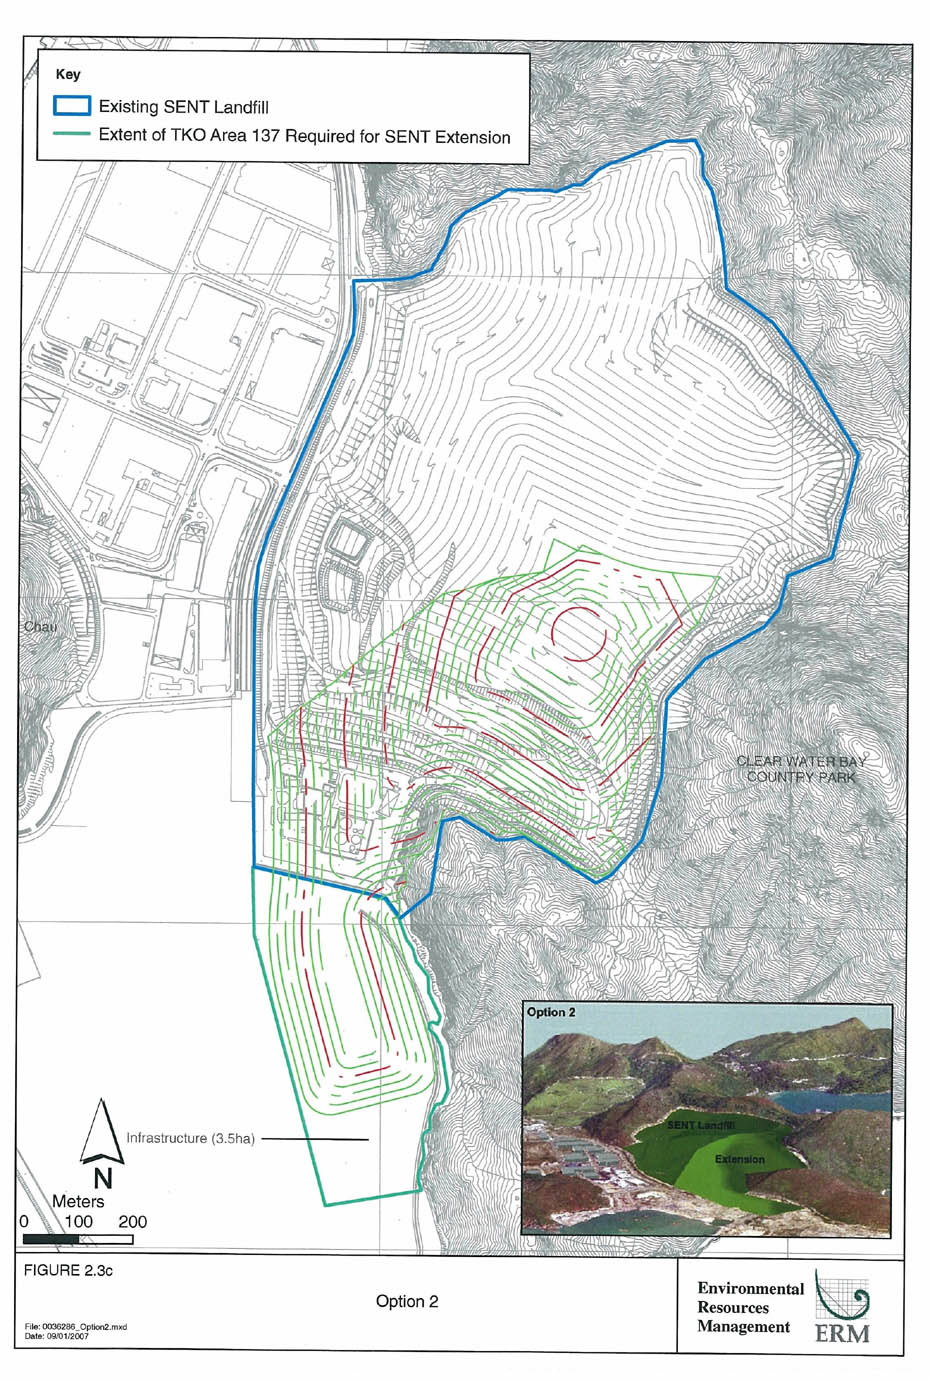
Figure 2.3c
Option 2
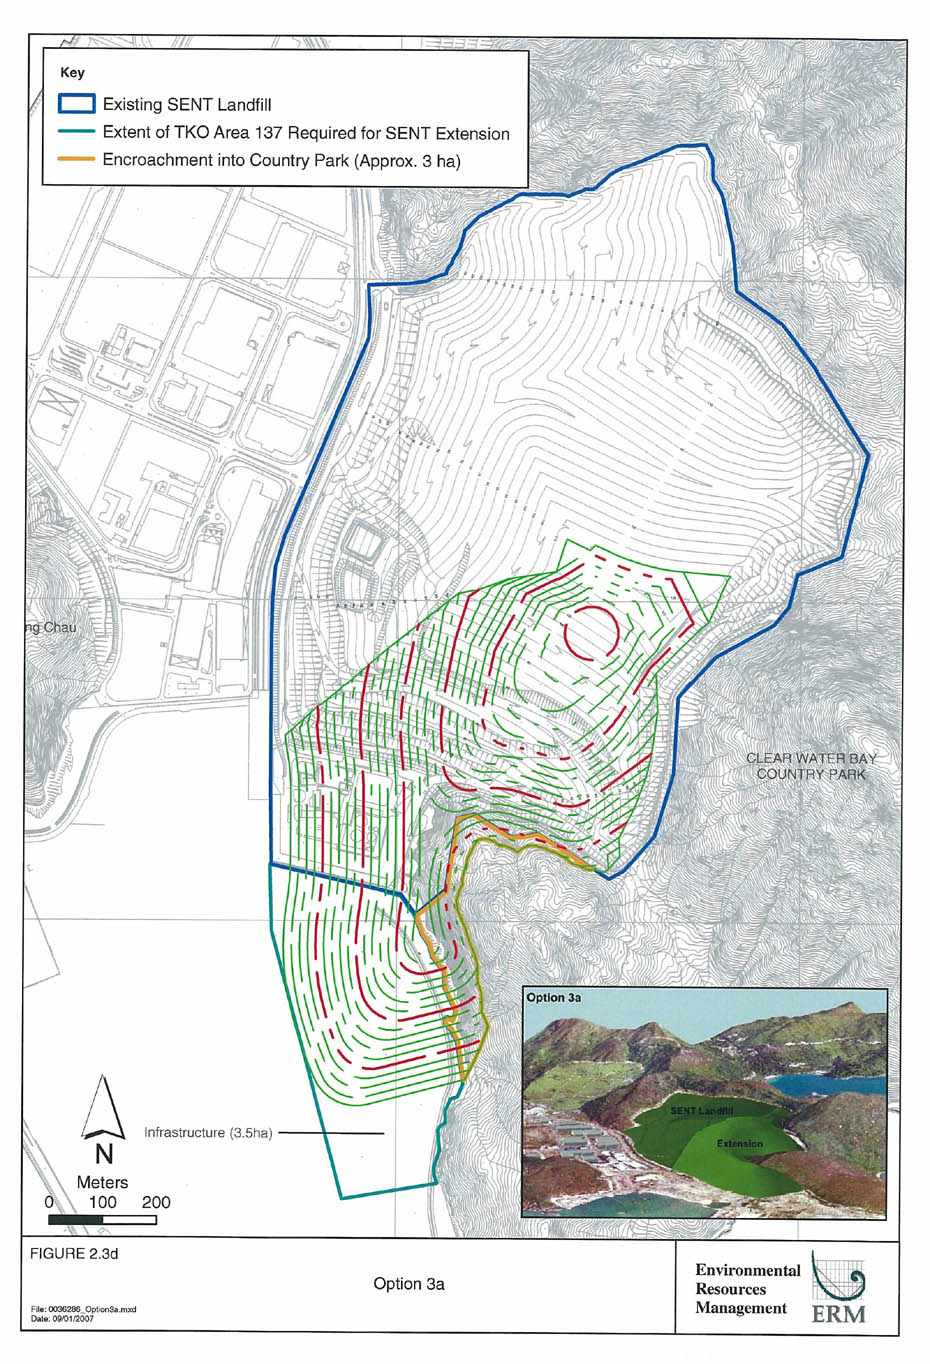
Figure 2.3d
Option 3a
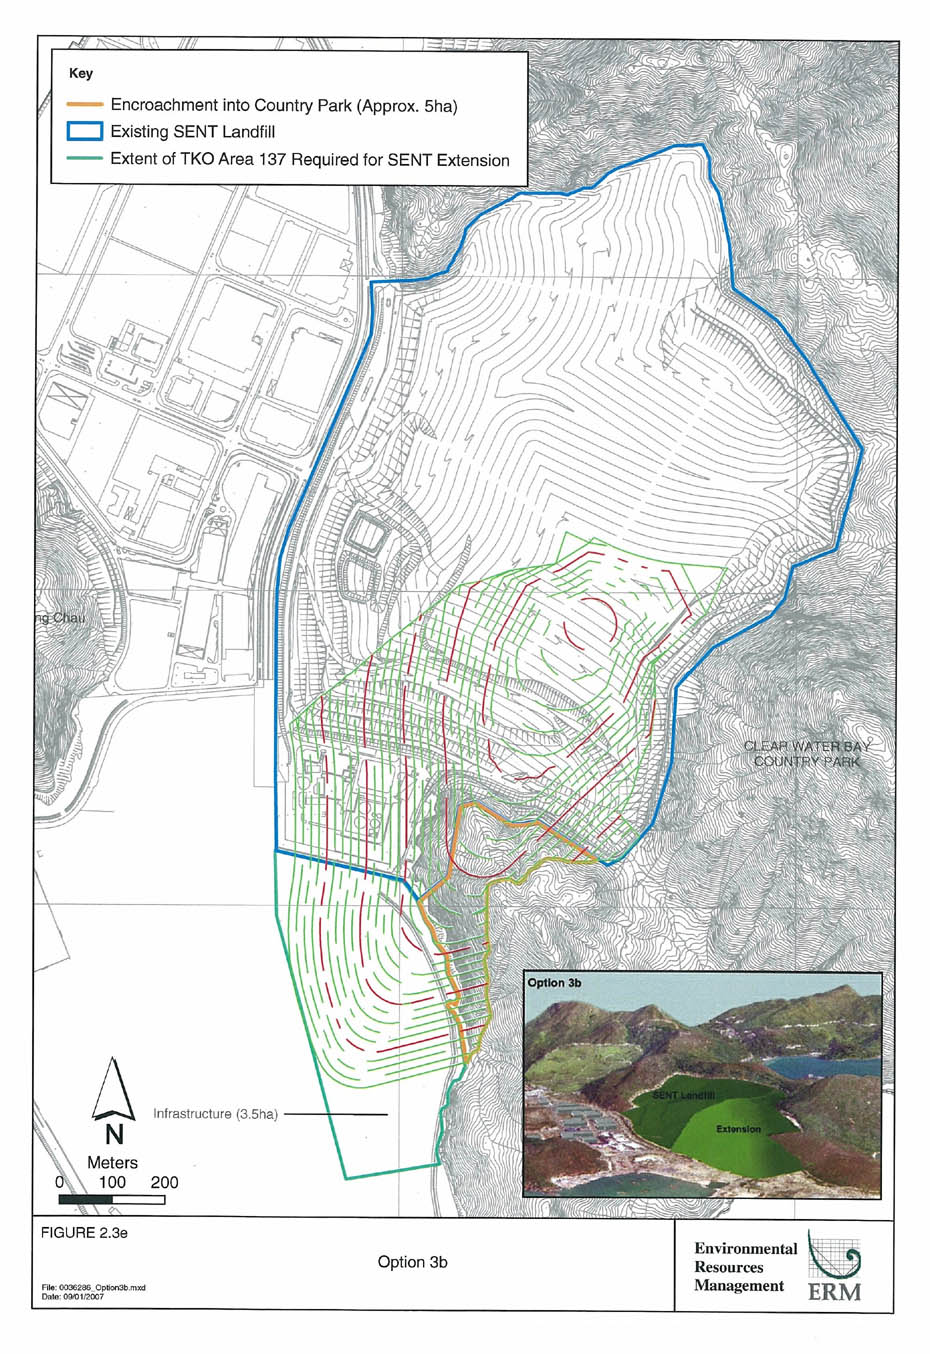
Figure 2.3e
Option 3b
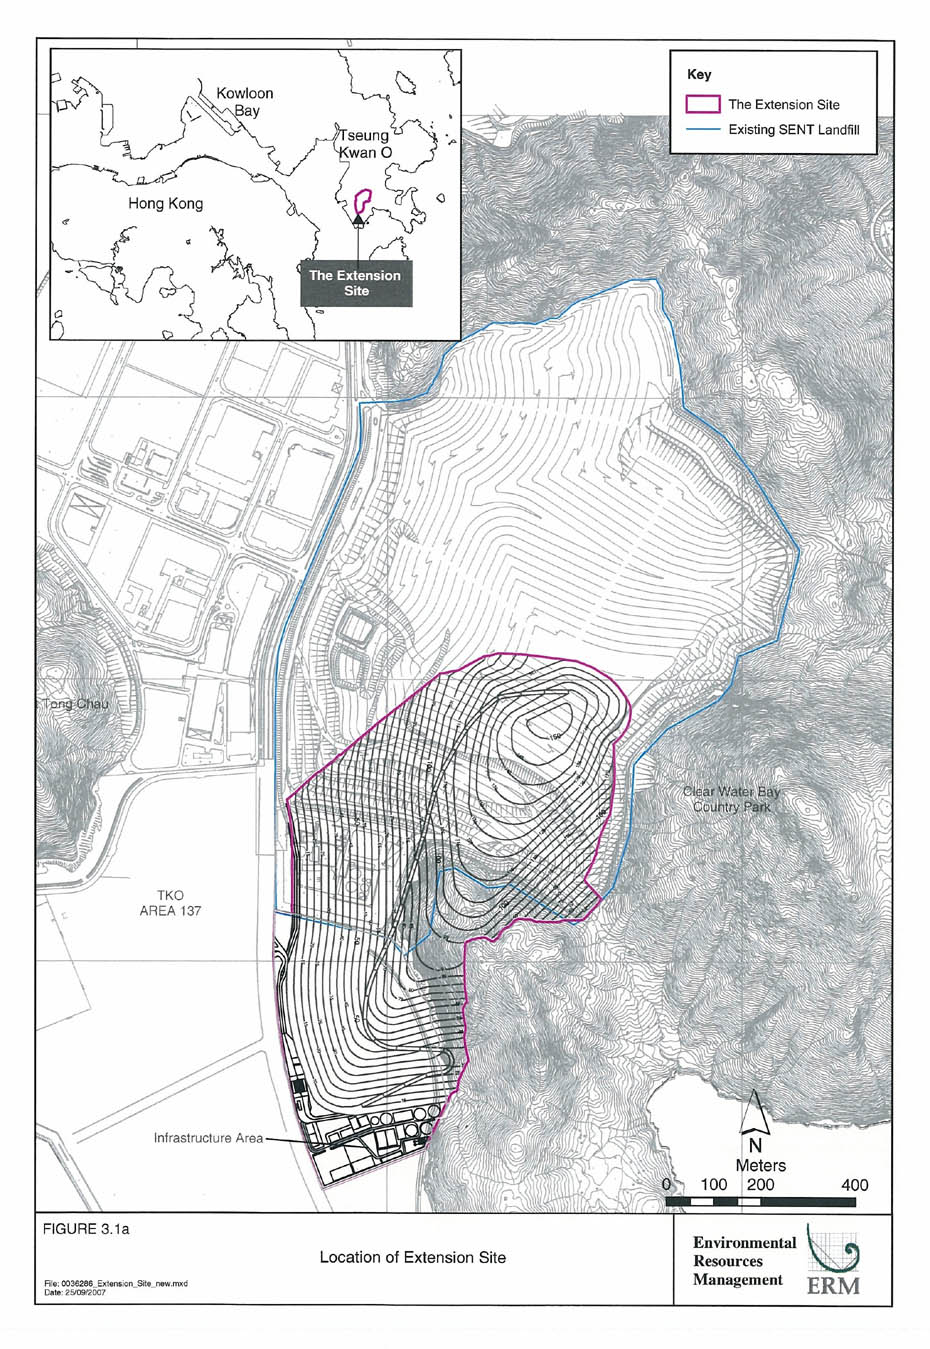
Figure 3.1a
Location of Extension Site
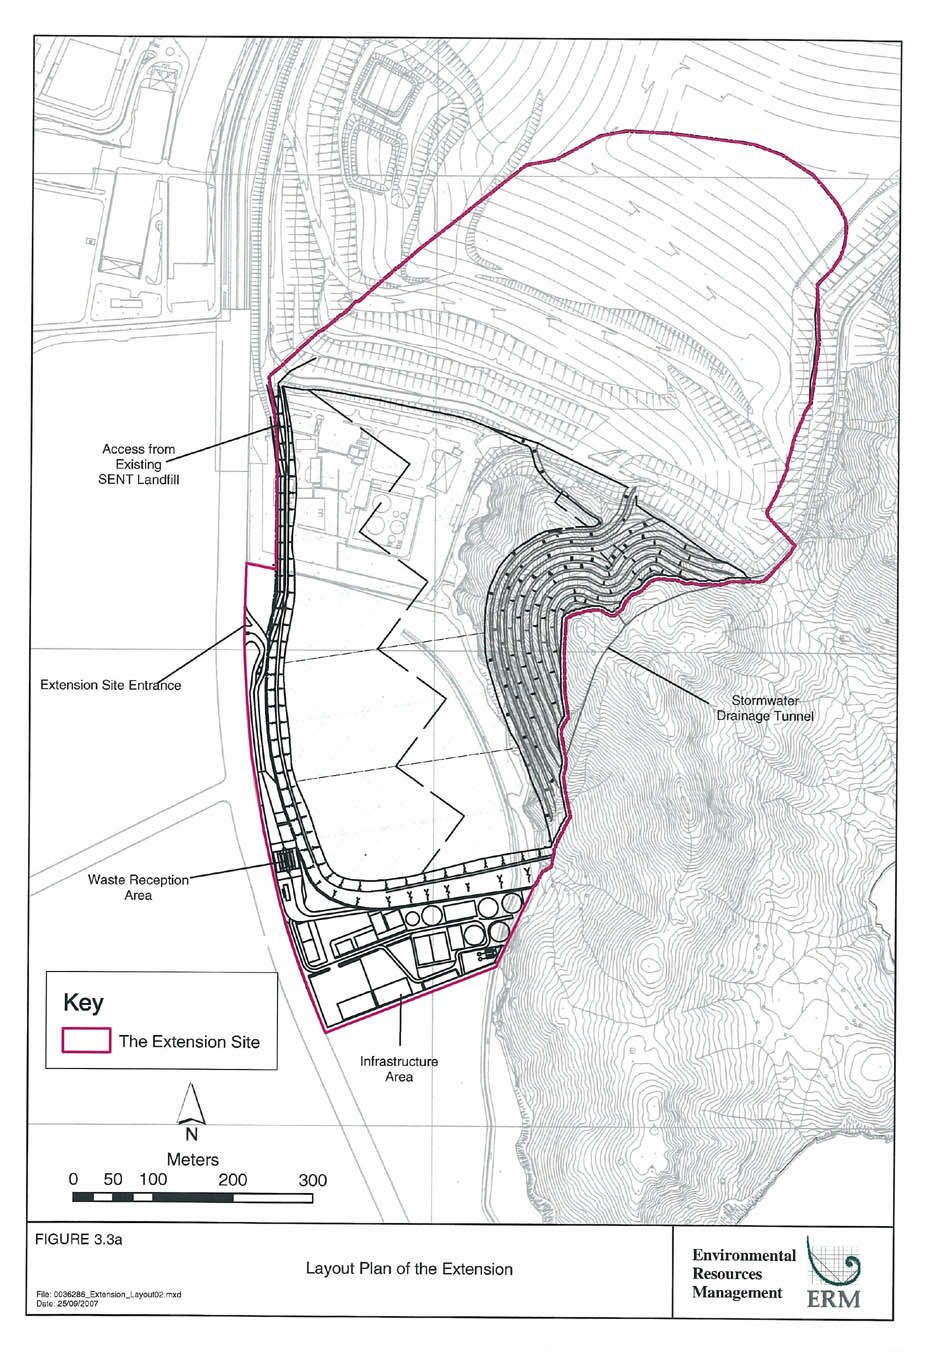
Figure 3.3a
Layout Plan of the Extension
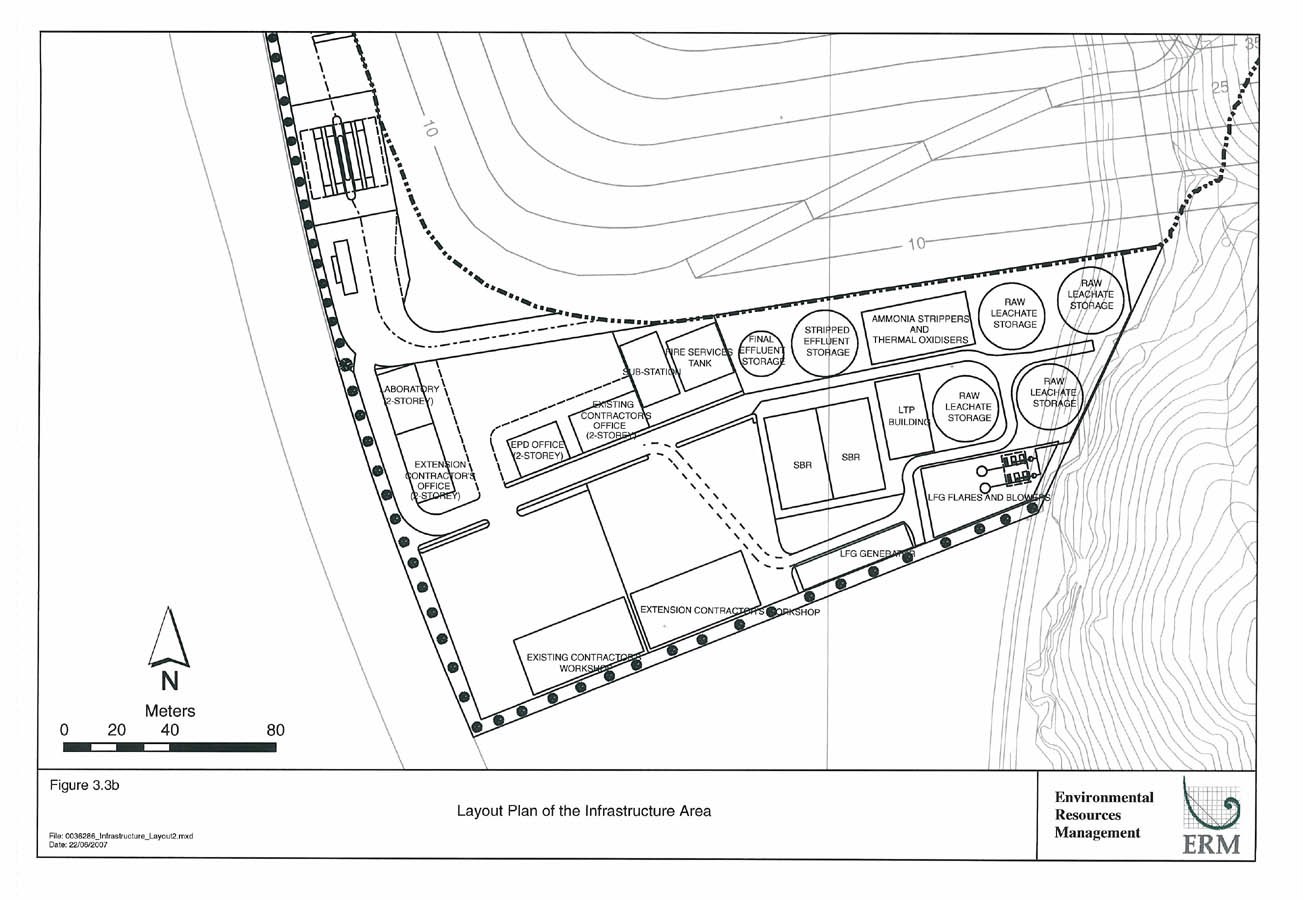
Figure 3.3b
Layout Plan of the Infrastructure Area
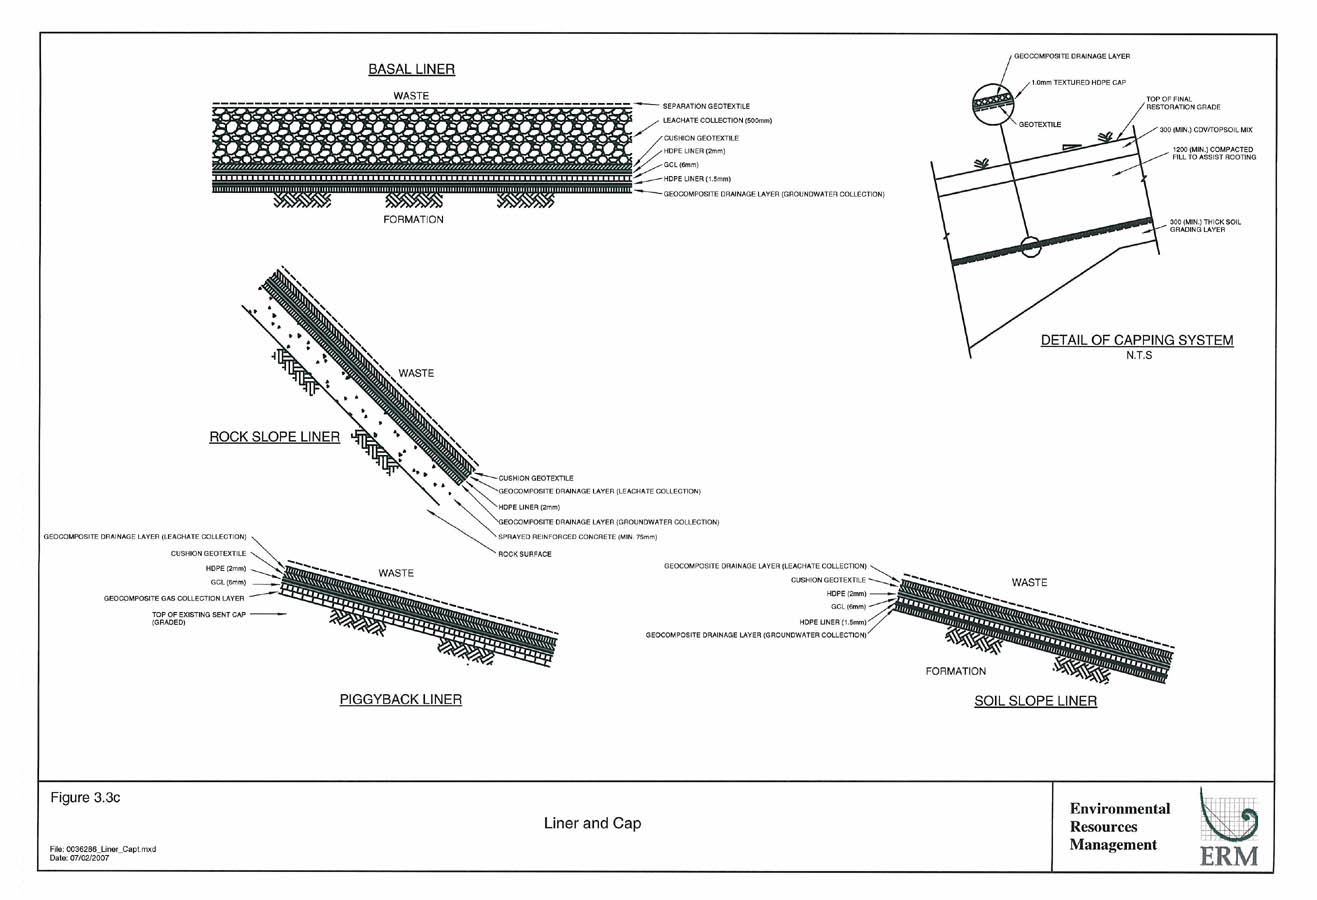
Figure 3.3c
Liner and Cap
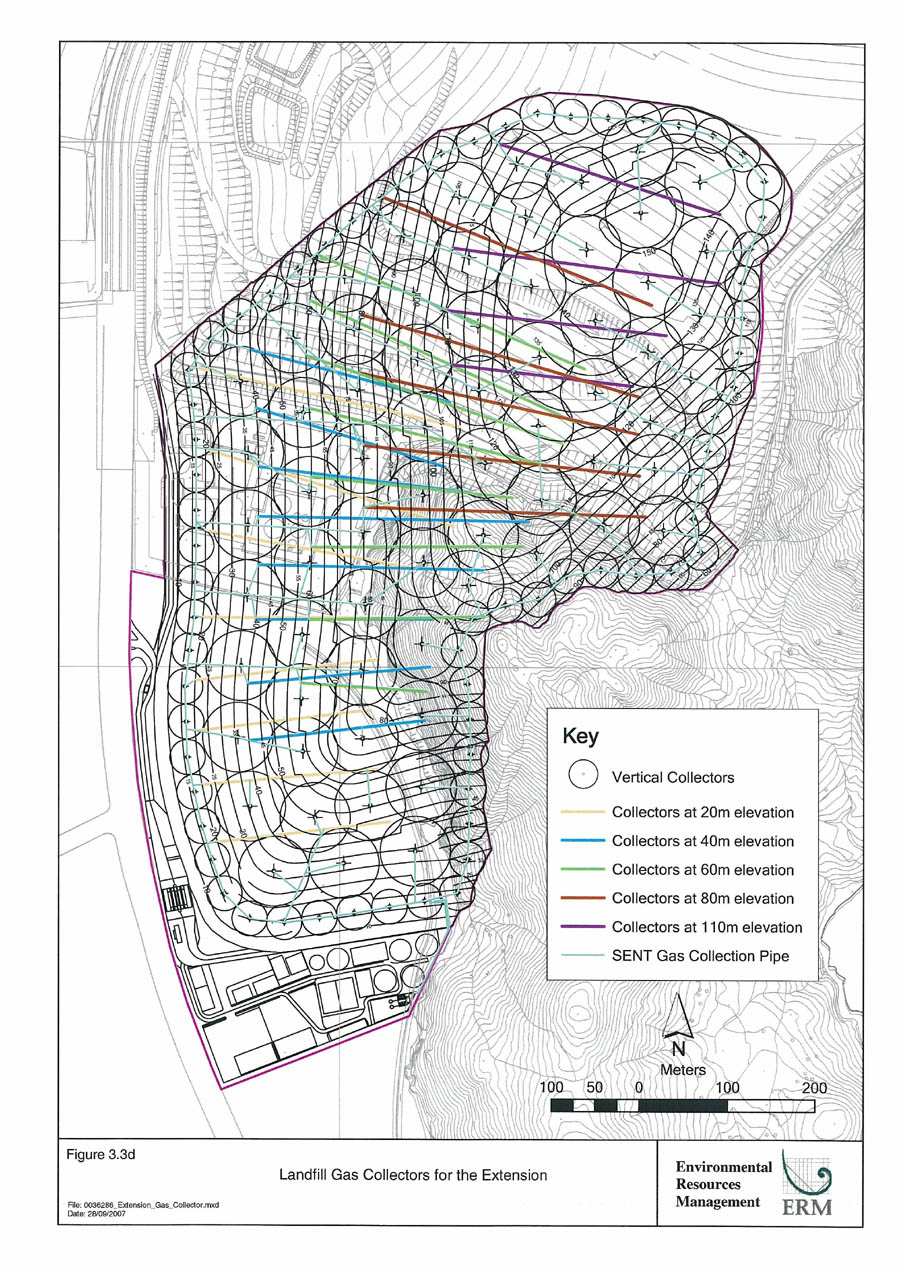
Figure 3.3d
Landfill Gas Collectors for the Extension
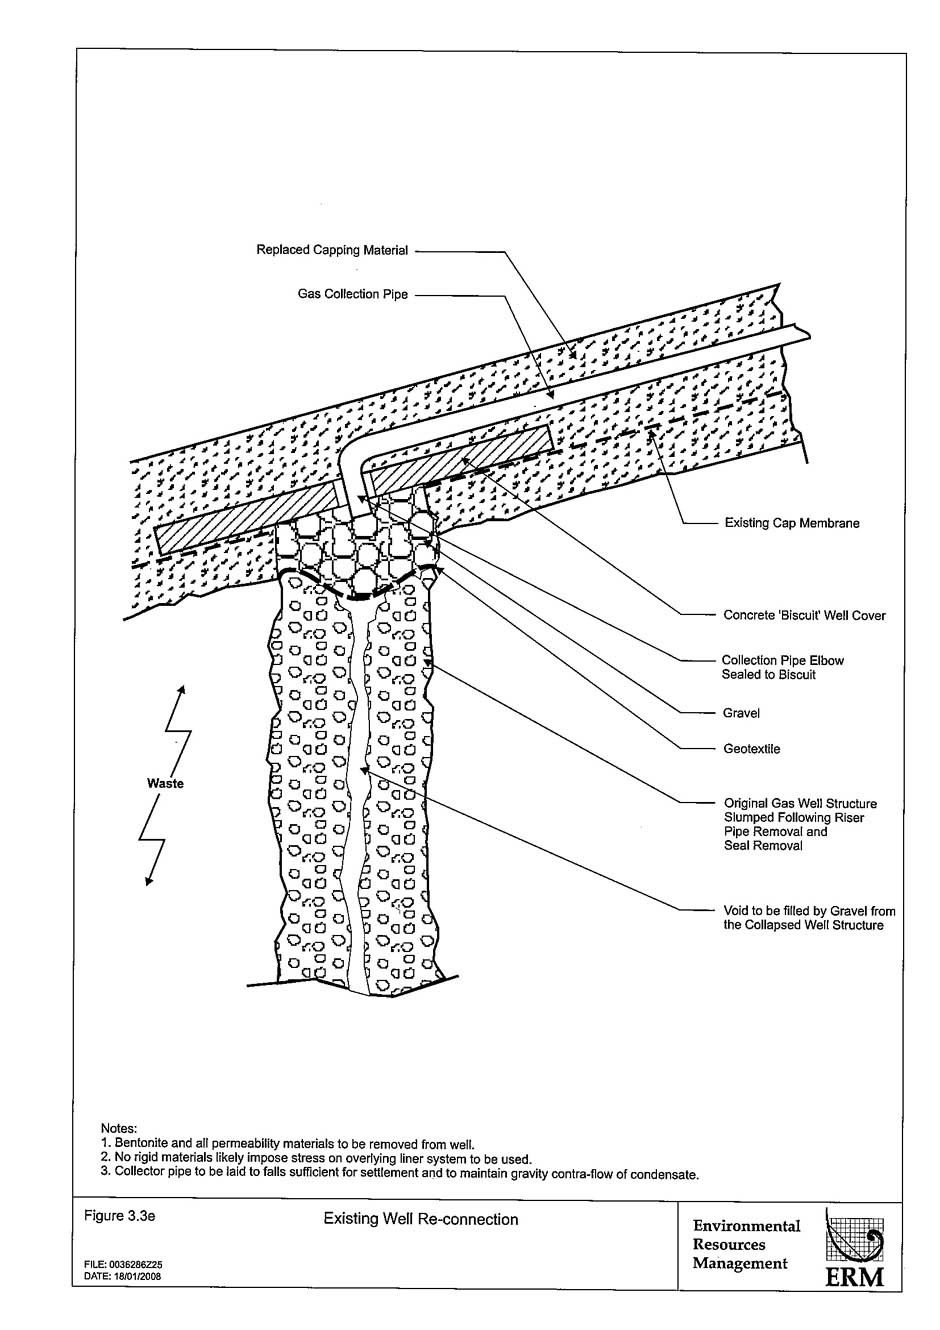
Figure 3.3e
Existing Well Re-connection
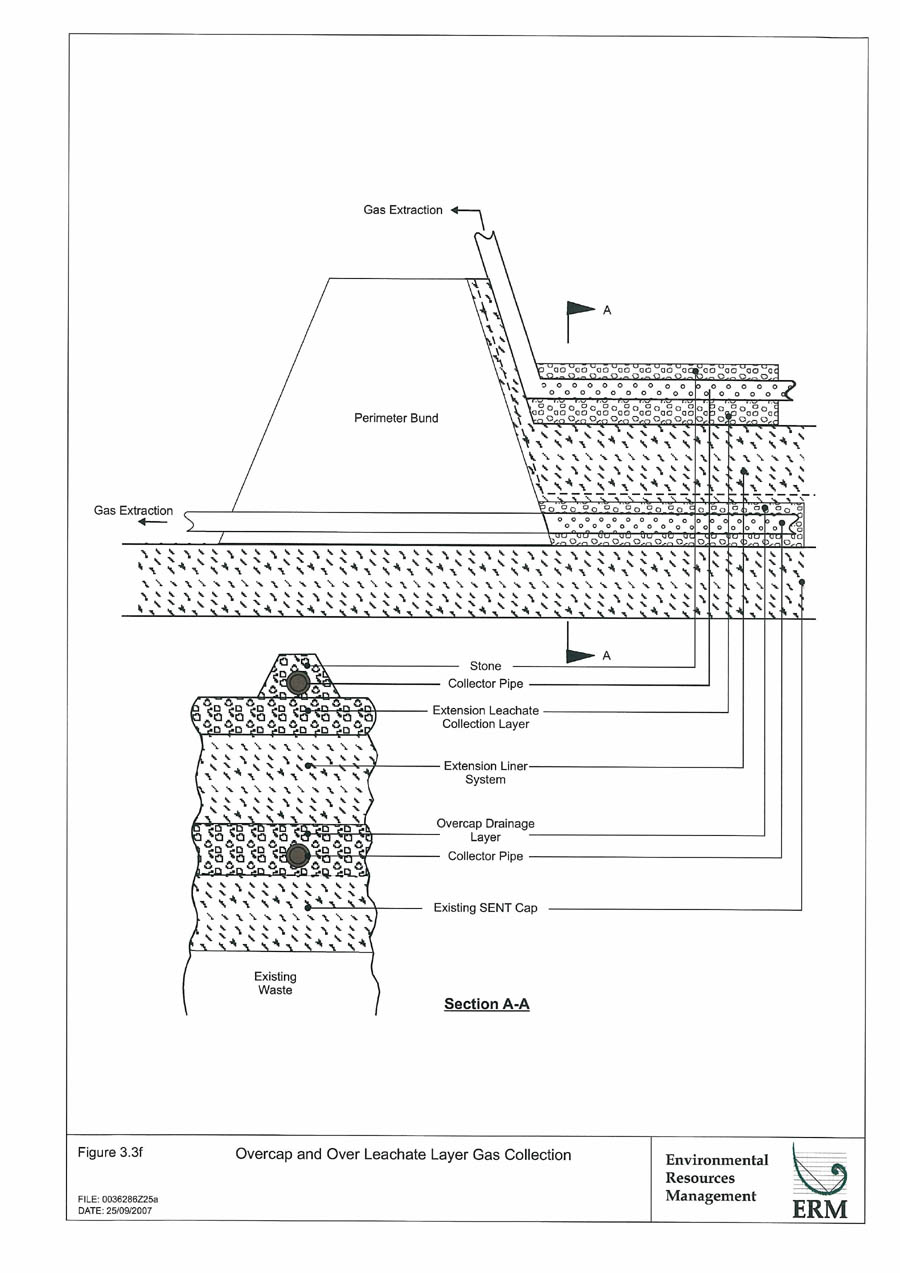
Figure 3.3f
Overcap and Over Leachate Layer Gas Collection
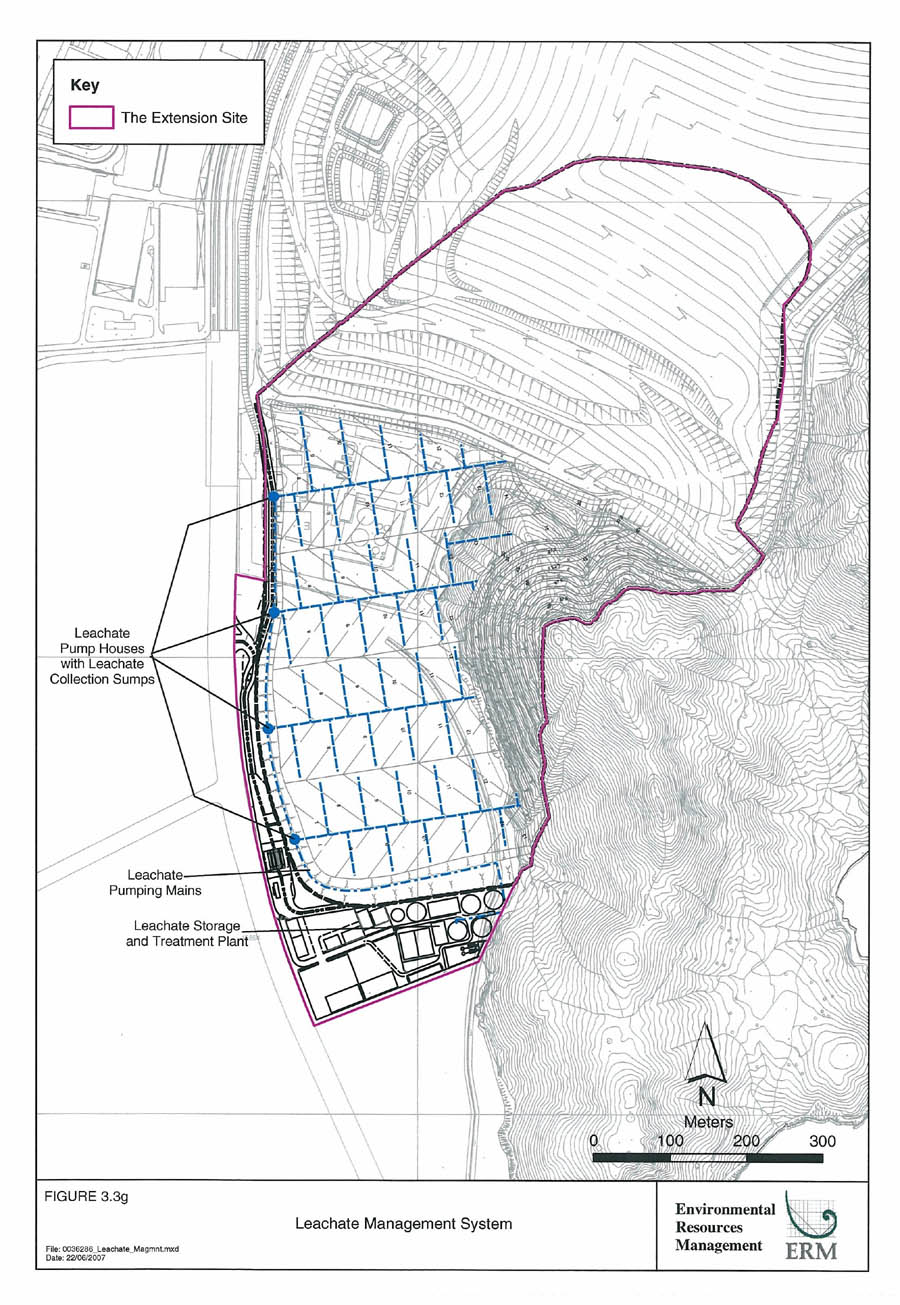
Figure 3.3g
Leachate Management System
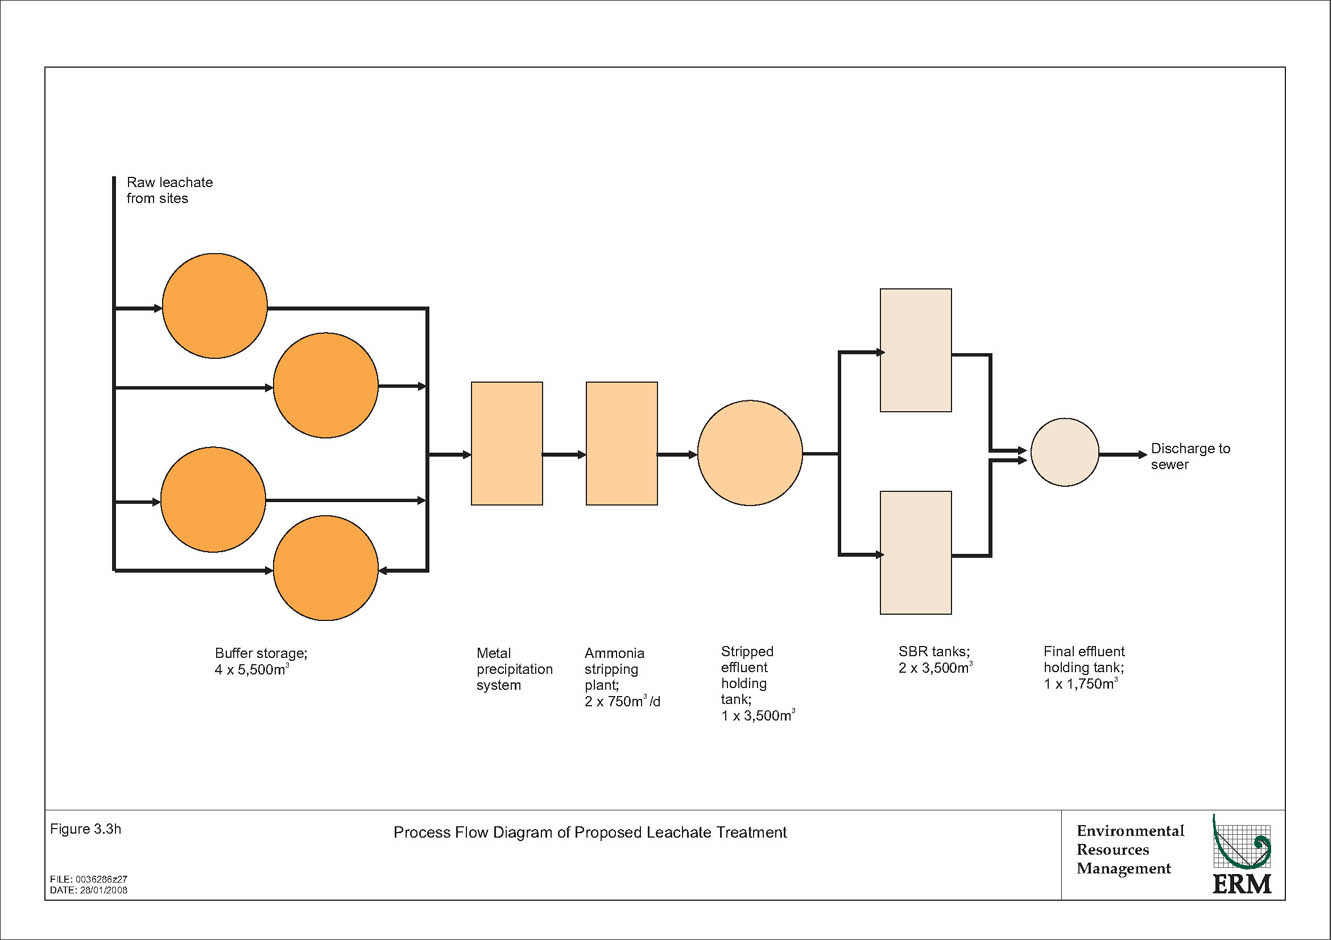
Figure 3.3h
Process Flow Diagram of Proposed Leachate Treatment
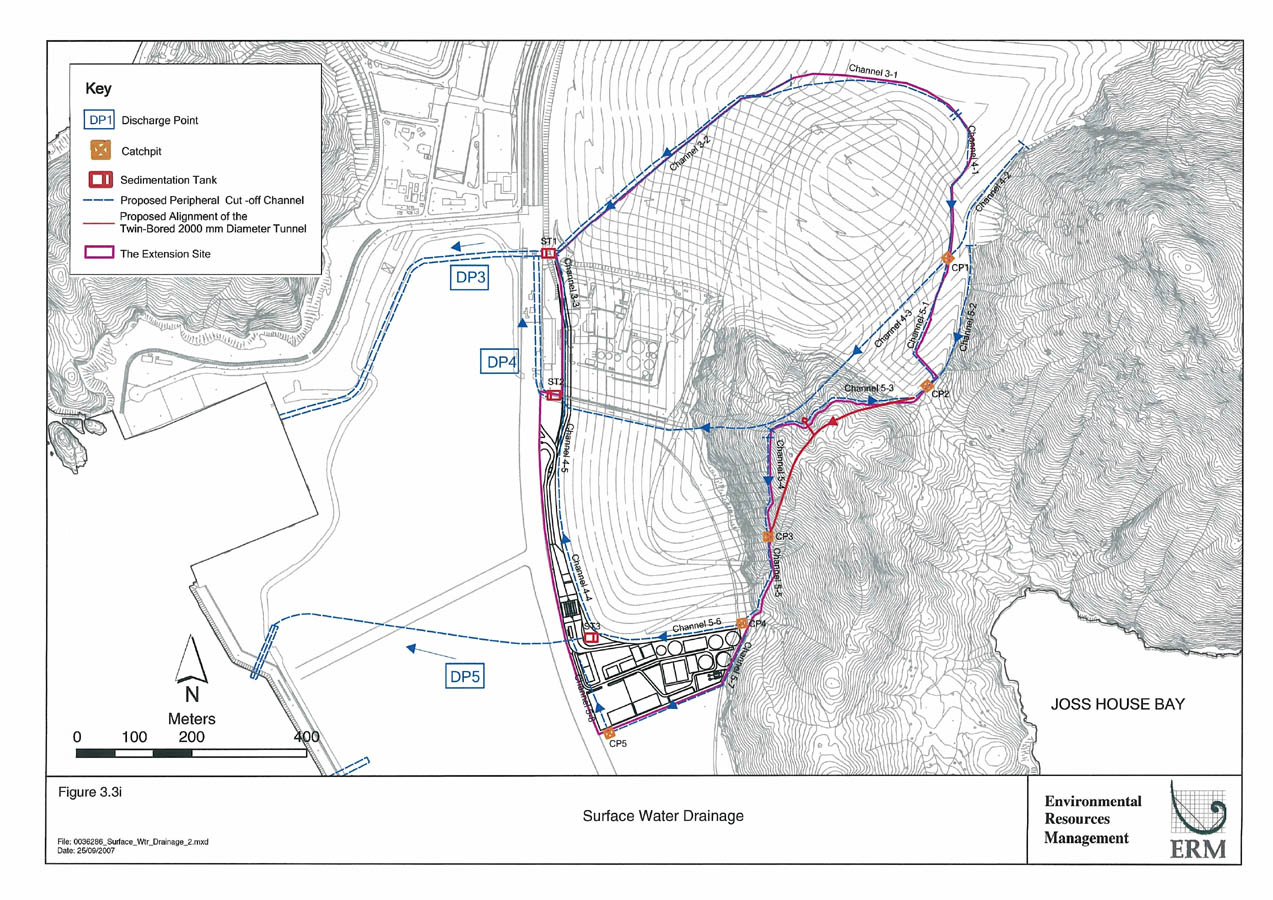
Figure 3.3i
Surface Water Drainage
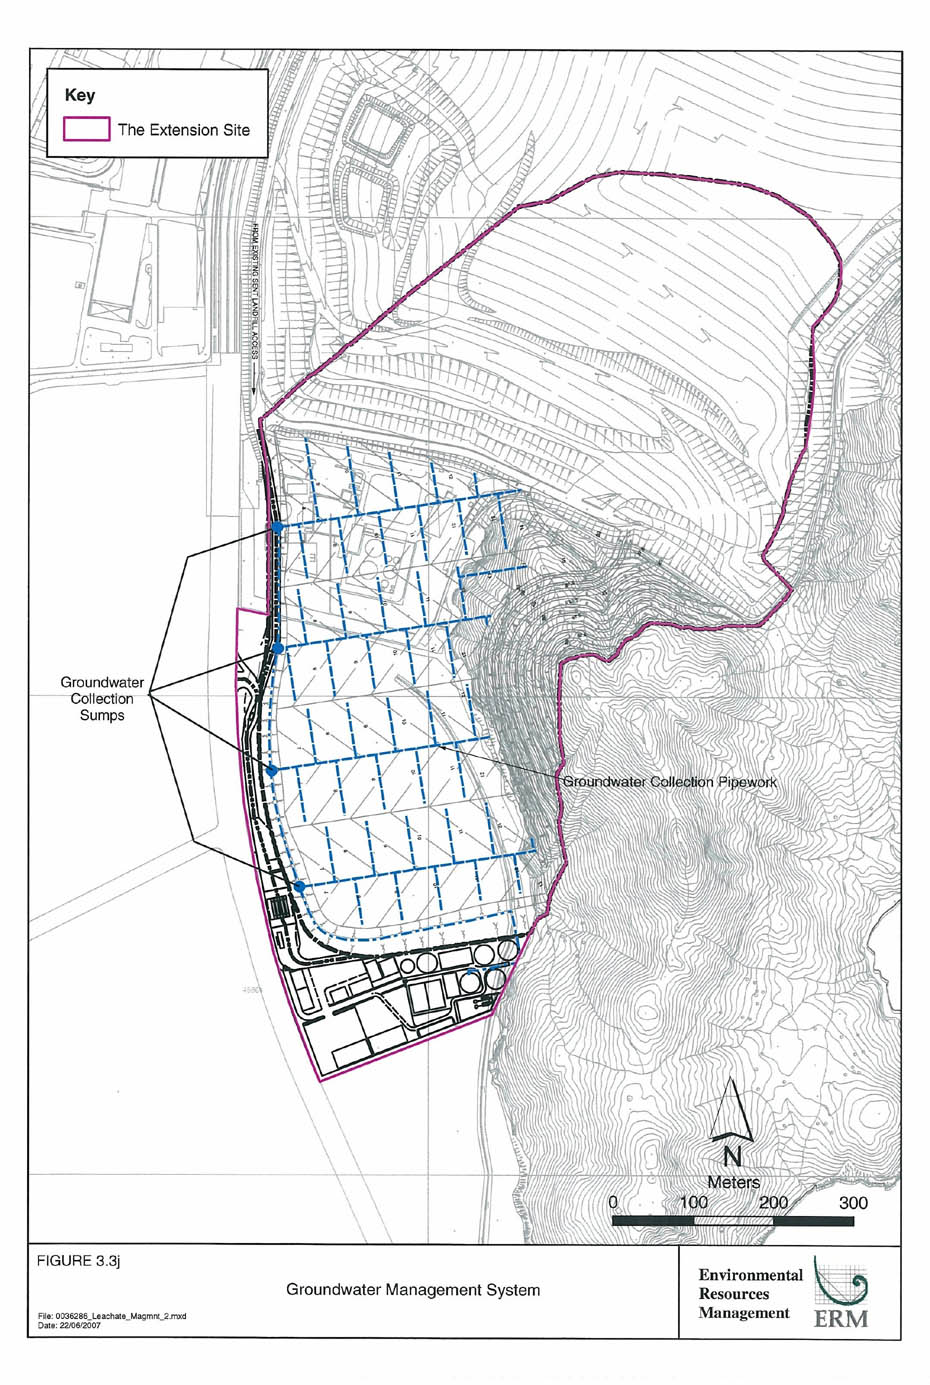
Figure 3.3j
Groundwater Management System
Figure 3.4a
Project Programme
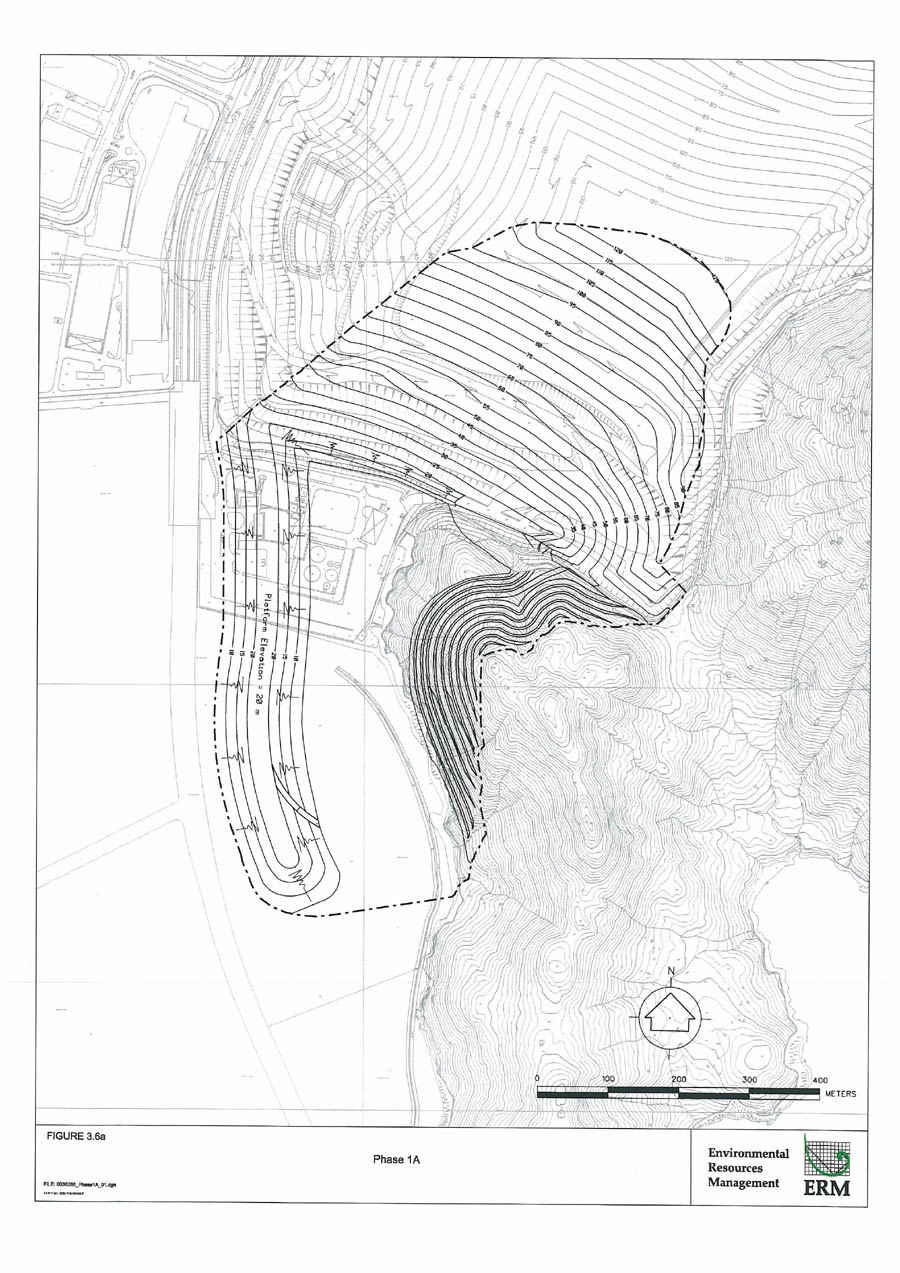
Figure 3.6a
Phase 1A
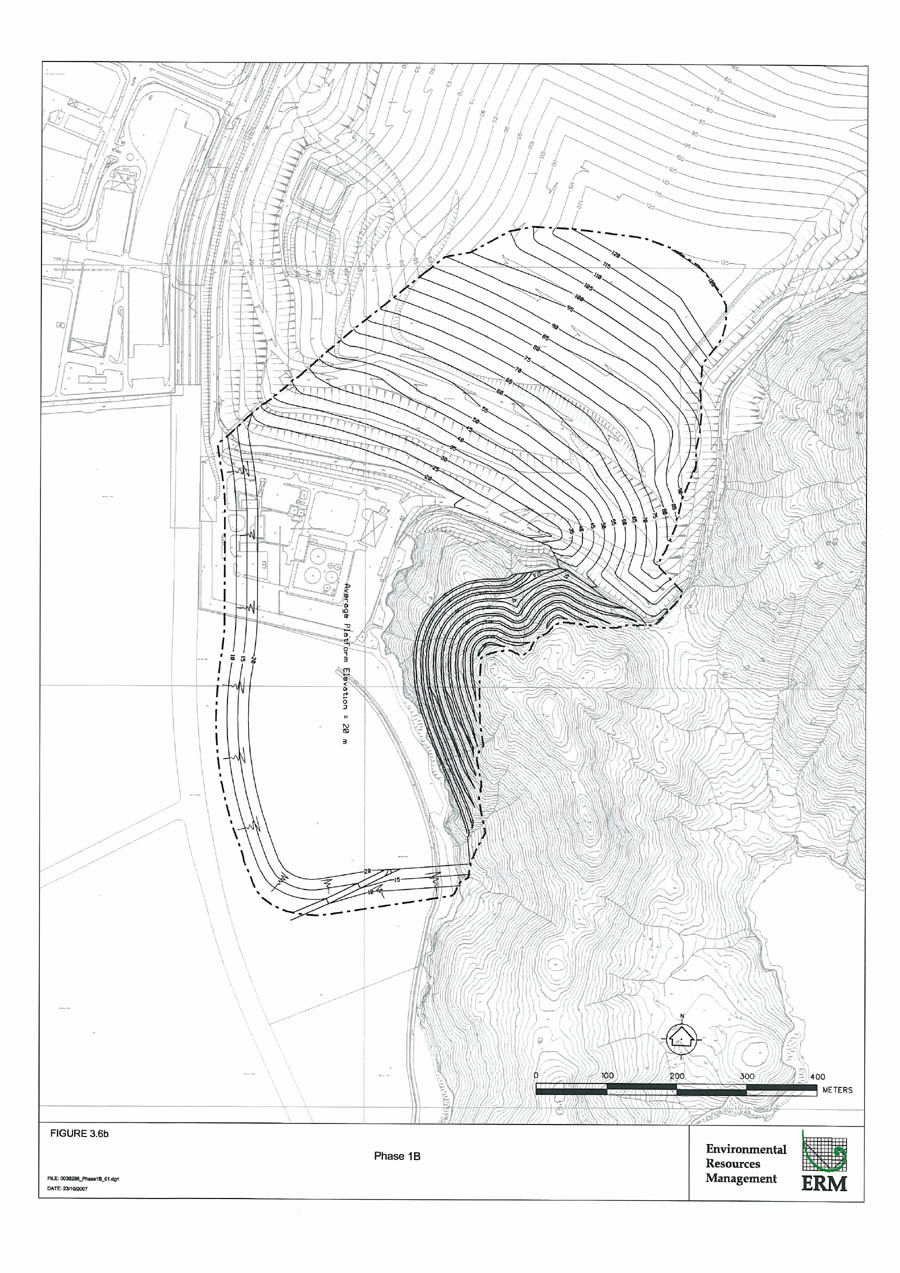
Figure 3.6b
Phase 1B
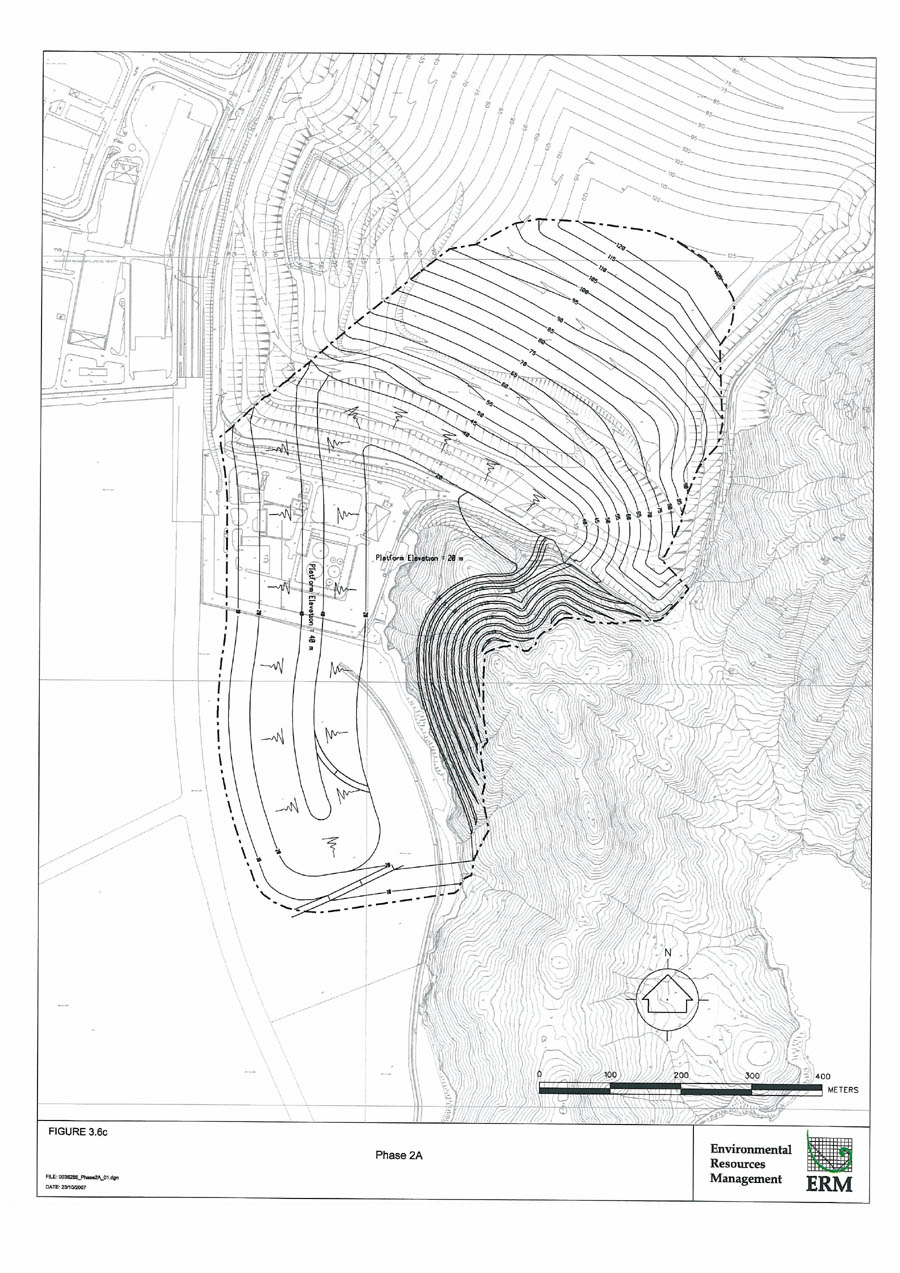
Figure 3.6c
Phase 2A
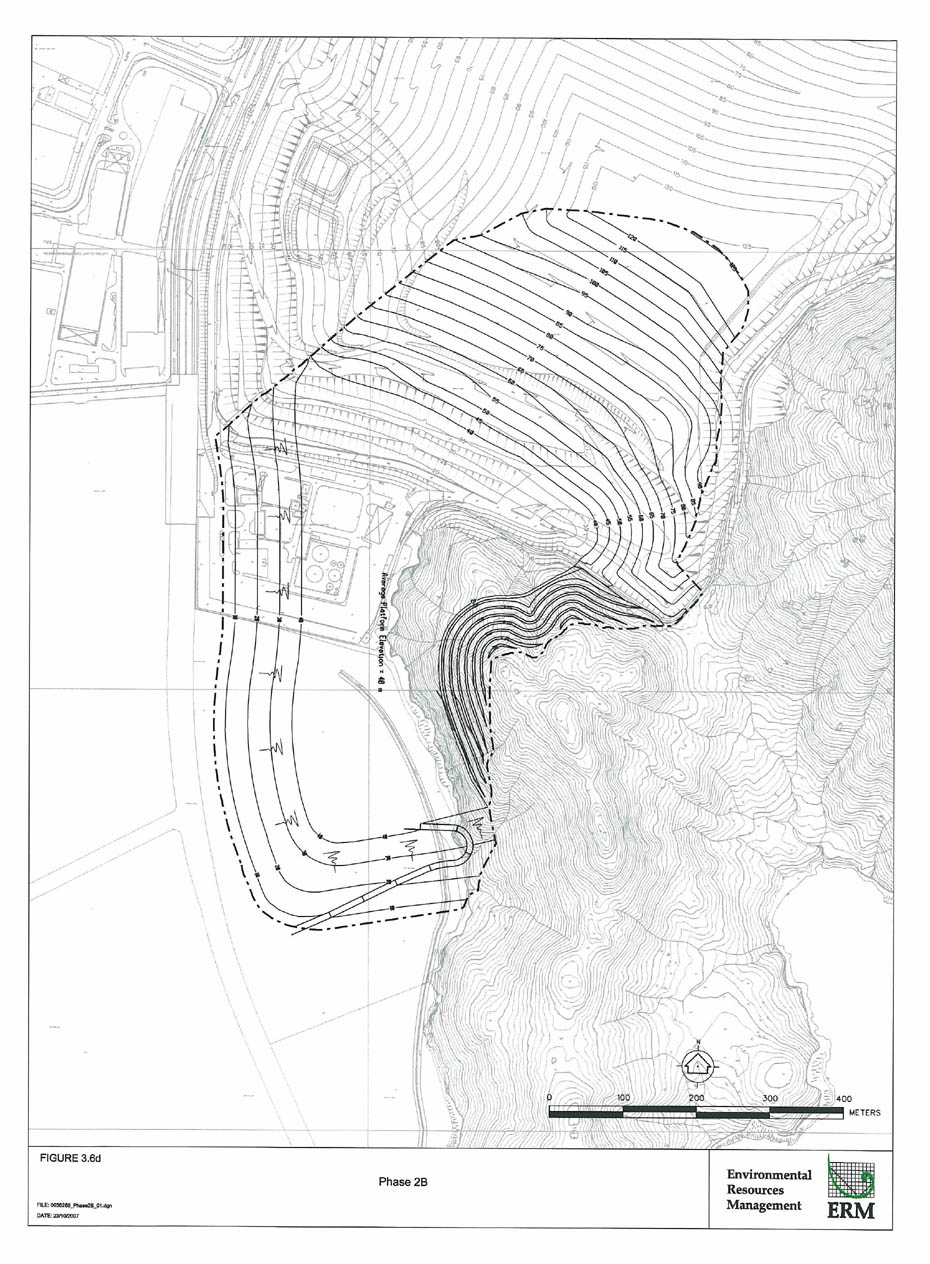
Figure 3.6d
Phase 2B
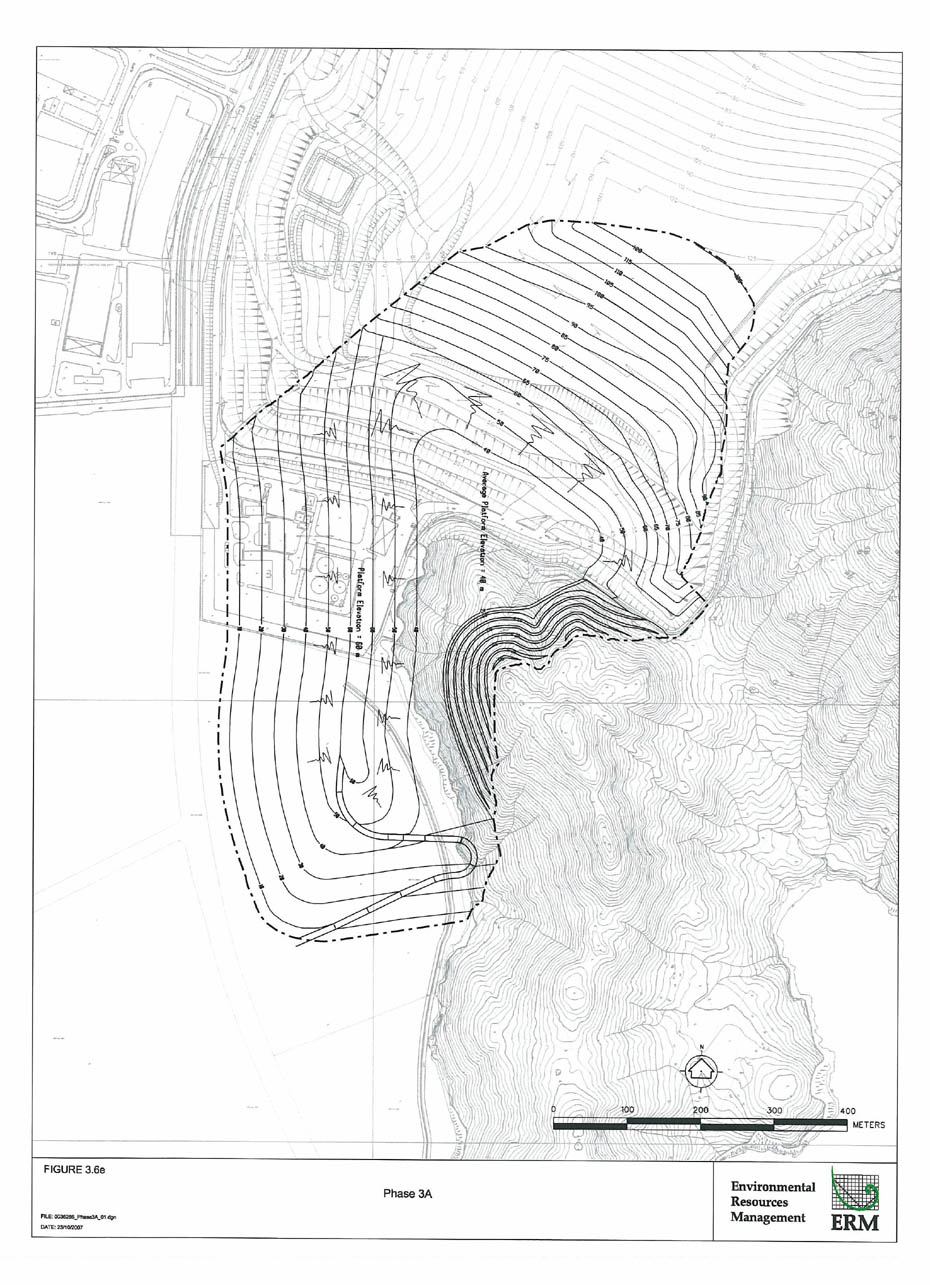
Figure 3.6e
Phase 3A
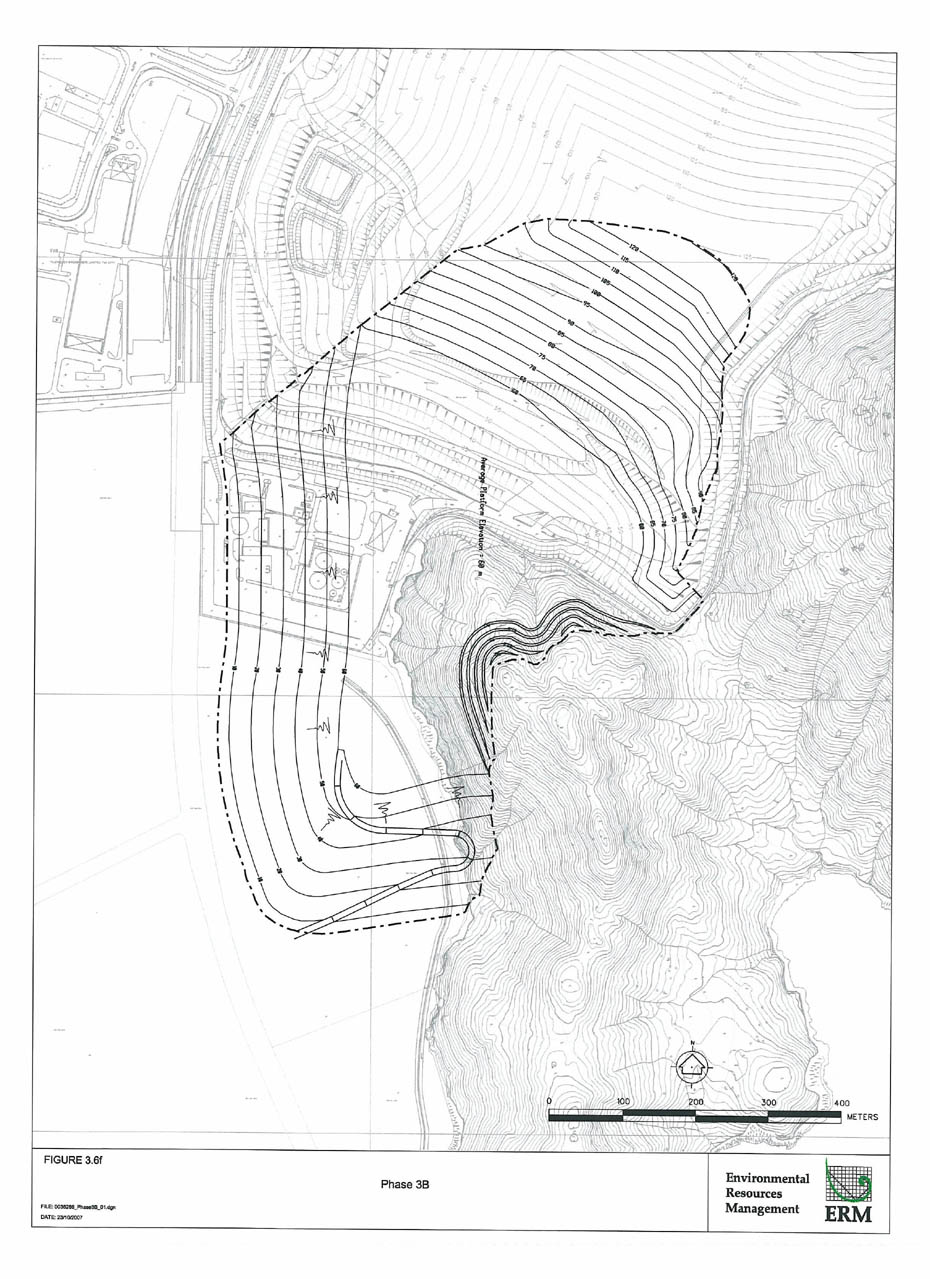
Figure 3.6f
Phase 3B
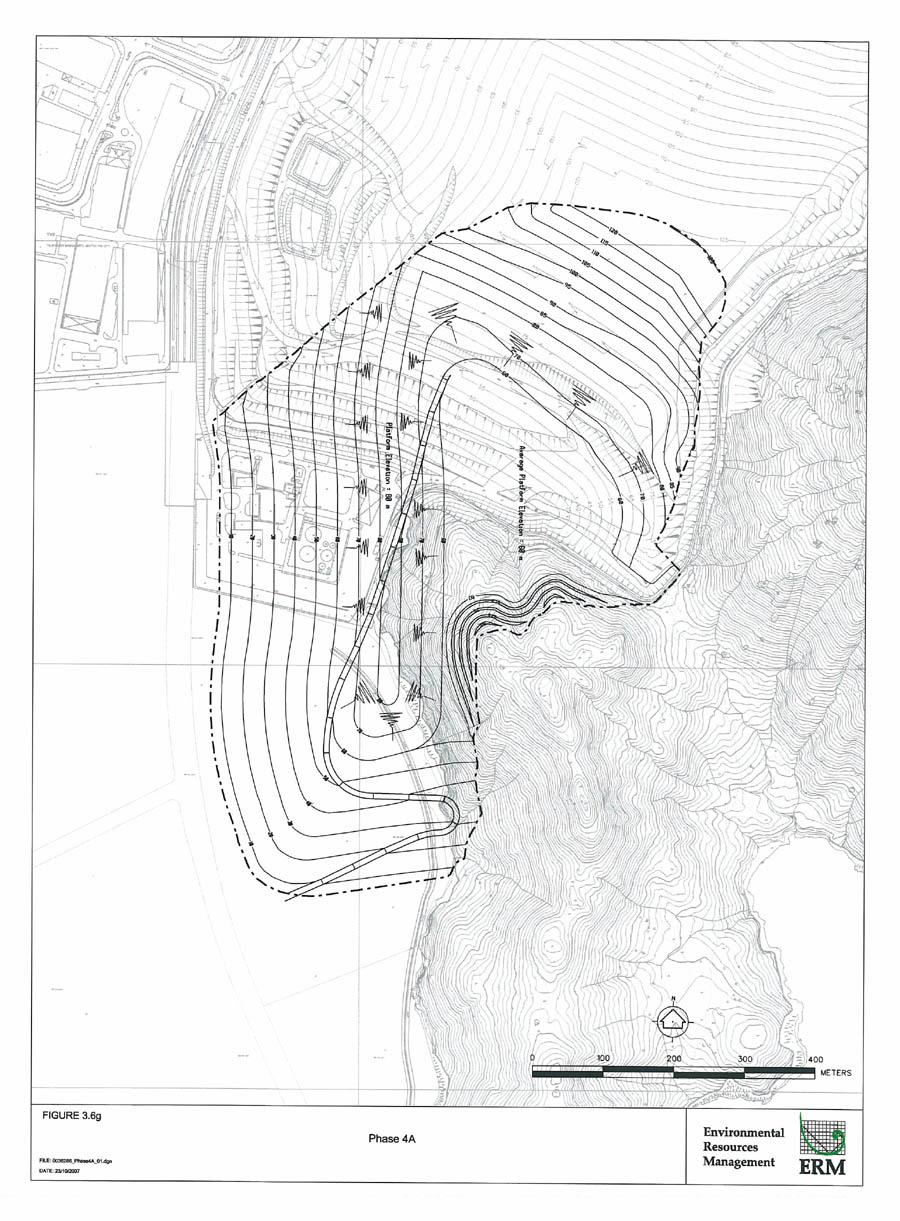
Figure 3.6g
Phase 4A
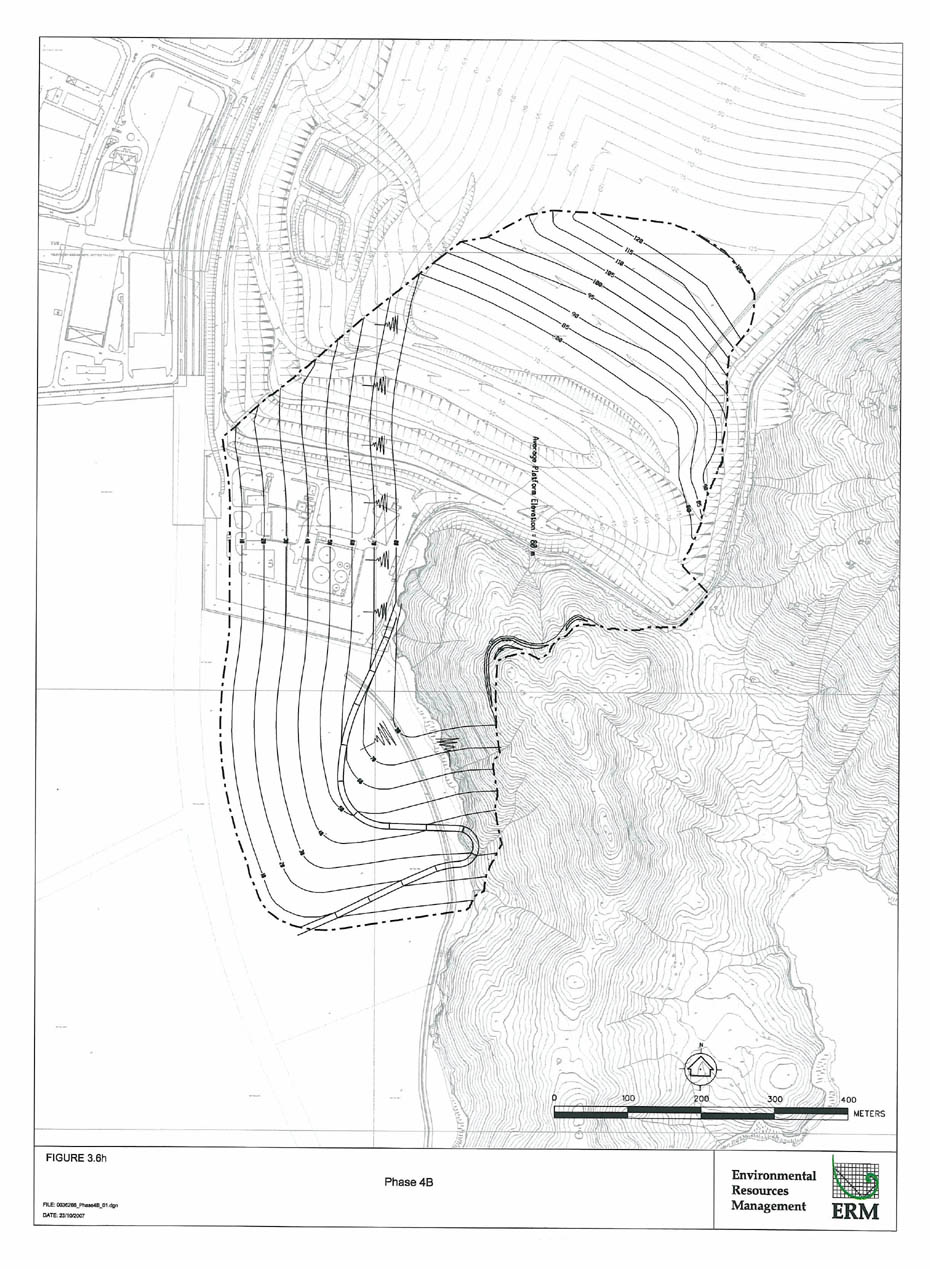
Figure 3.6h
Phase 4B
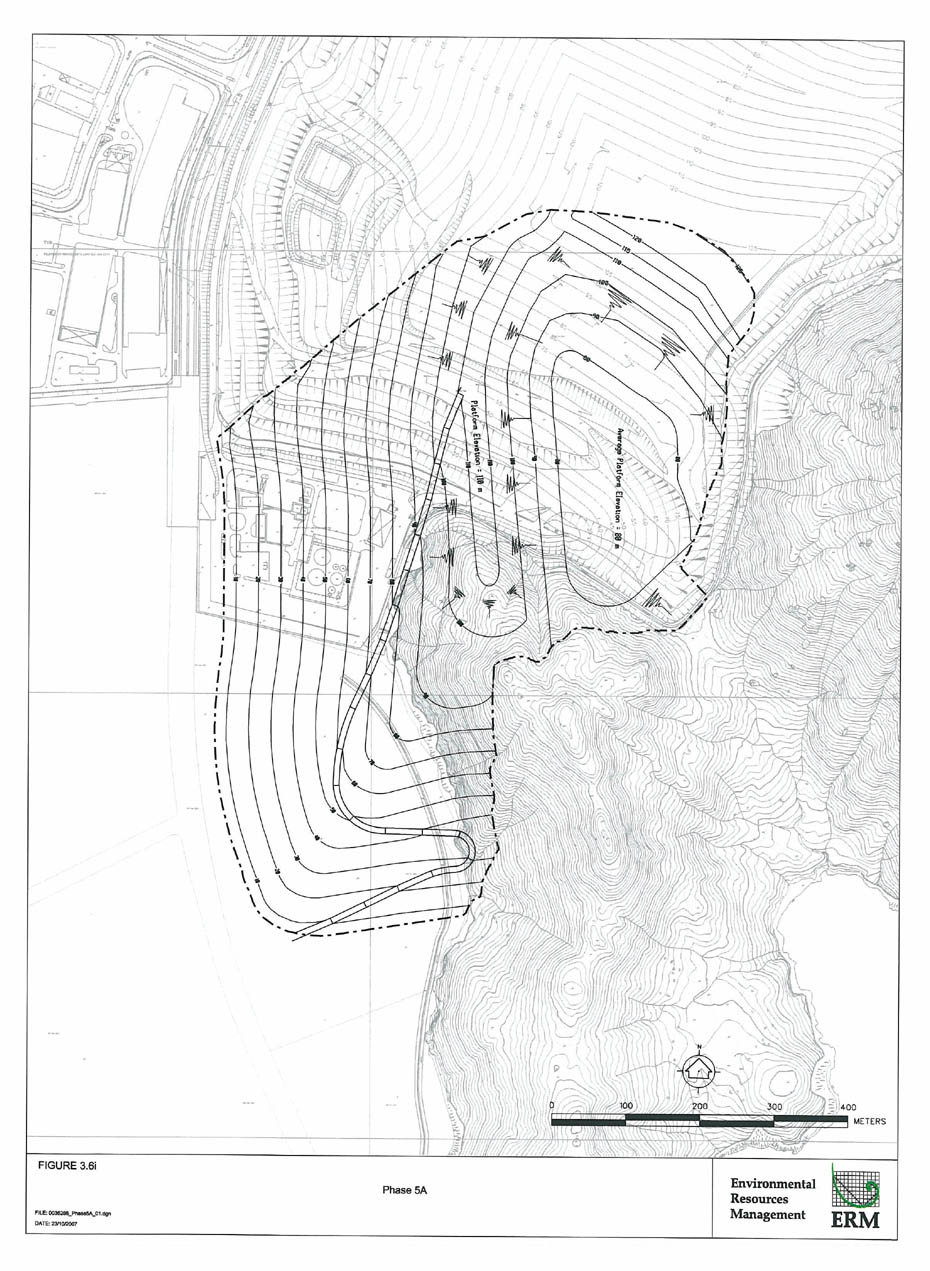
Figure 3.6i
Phase 5A
Figure 3.6j
Phase 5B
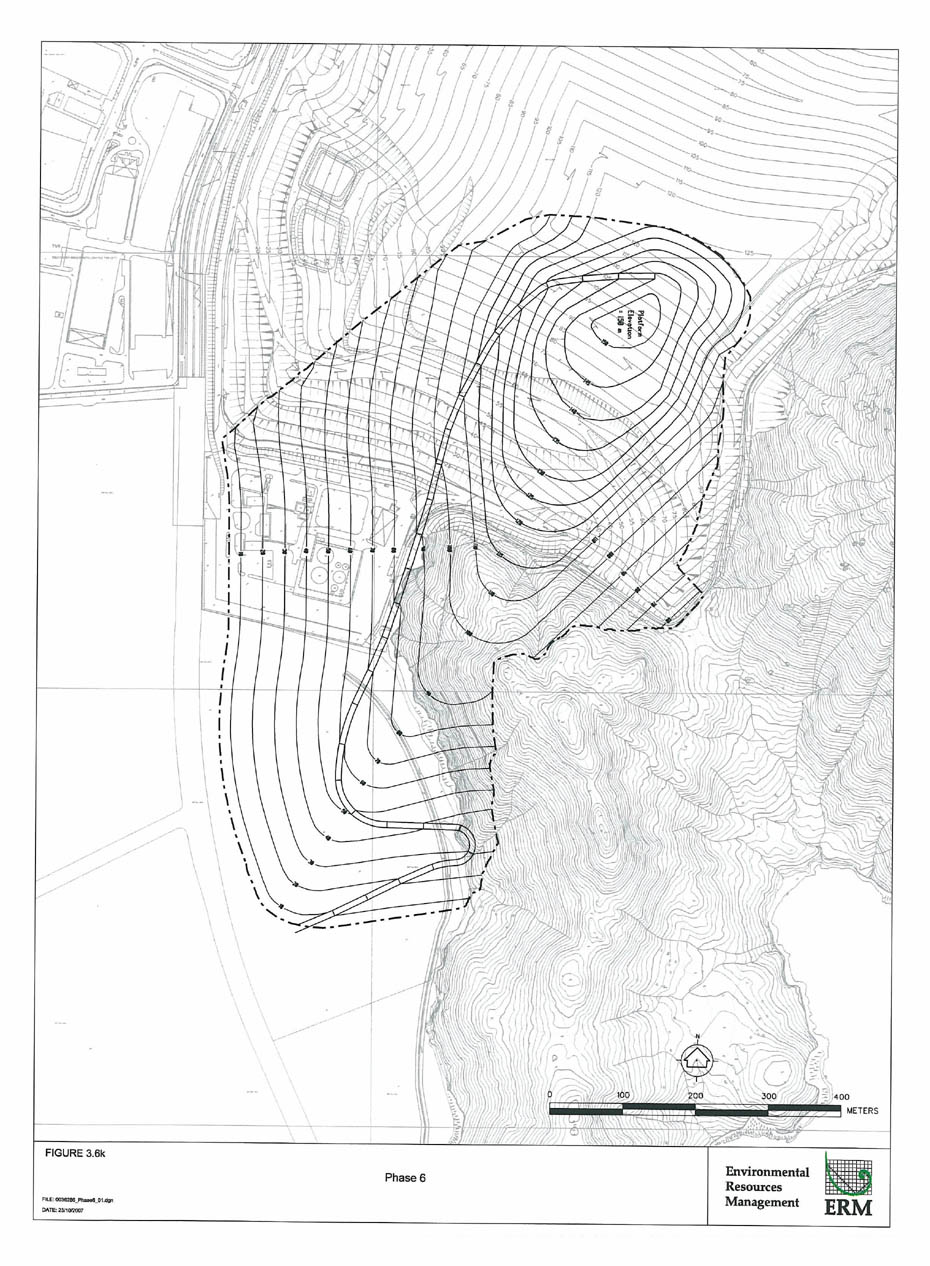
Figure 3.6k
Phase 6
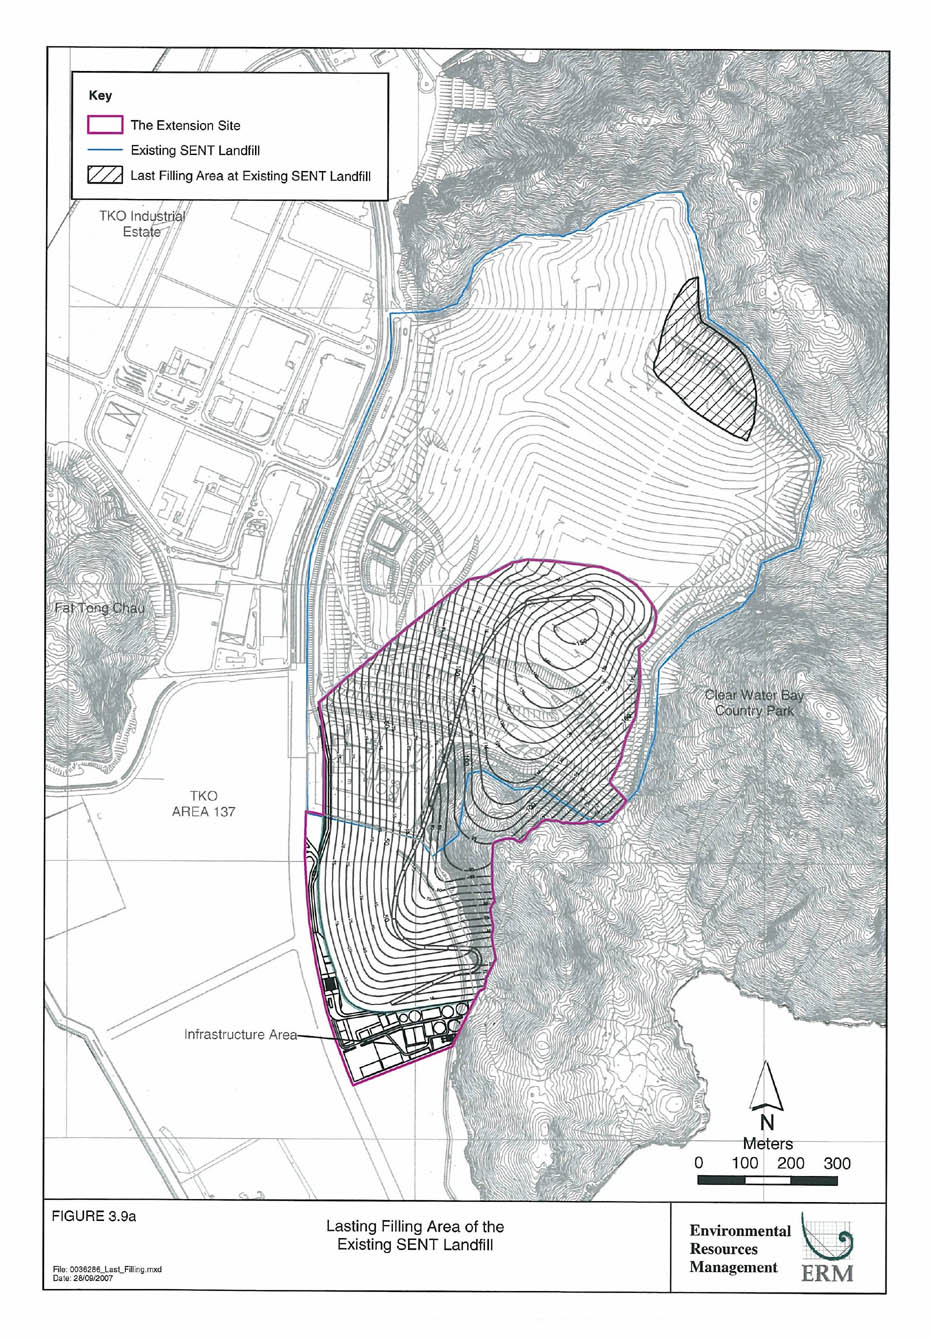
Figure 3.9a
Lasting Filling Area of the Existing SENT Landfill
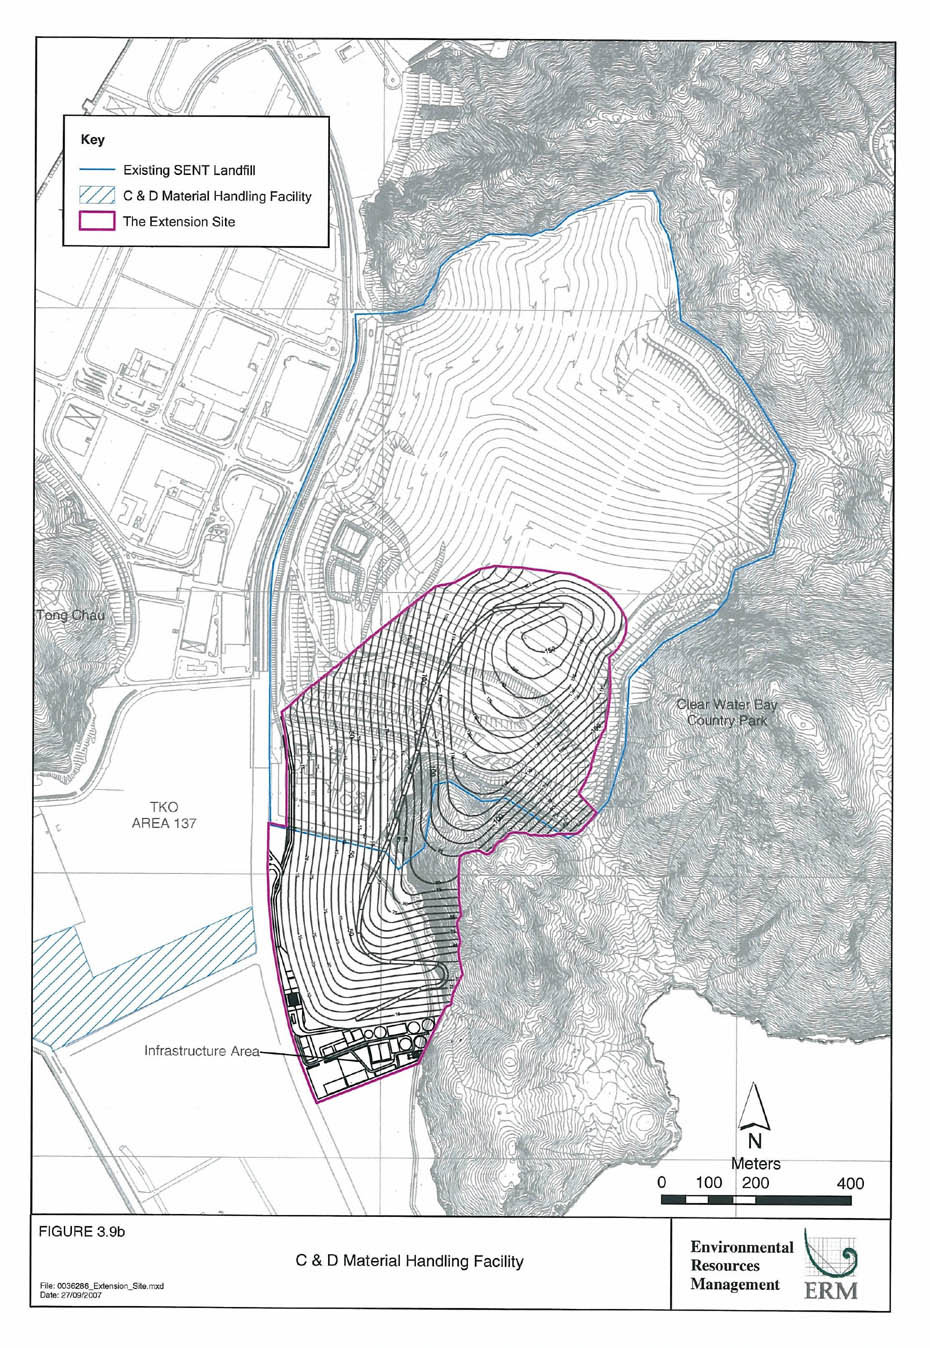
Figure 3.9b
C&D Material Handing Facility
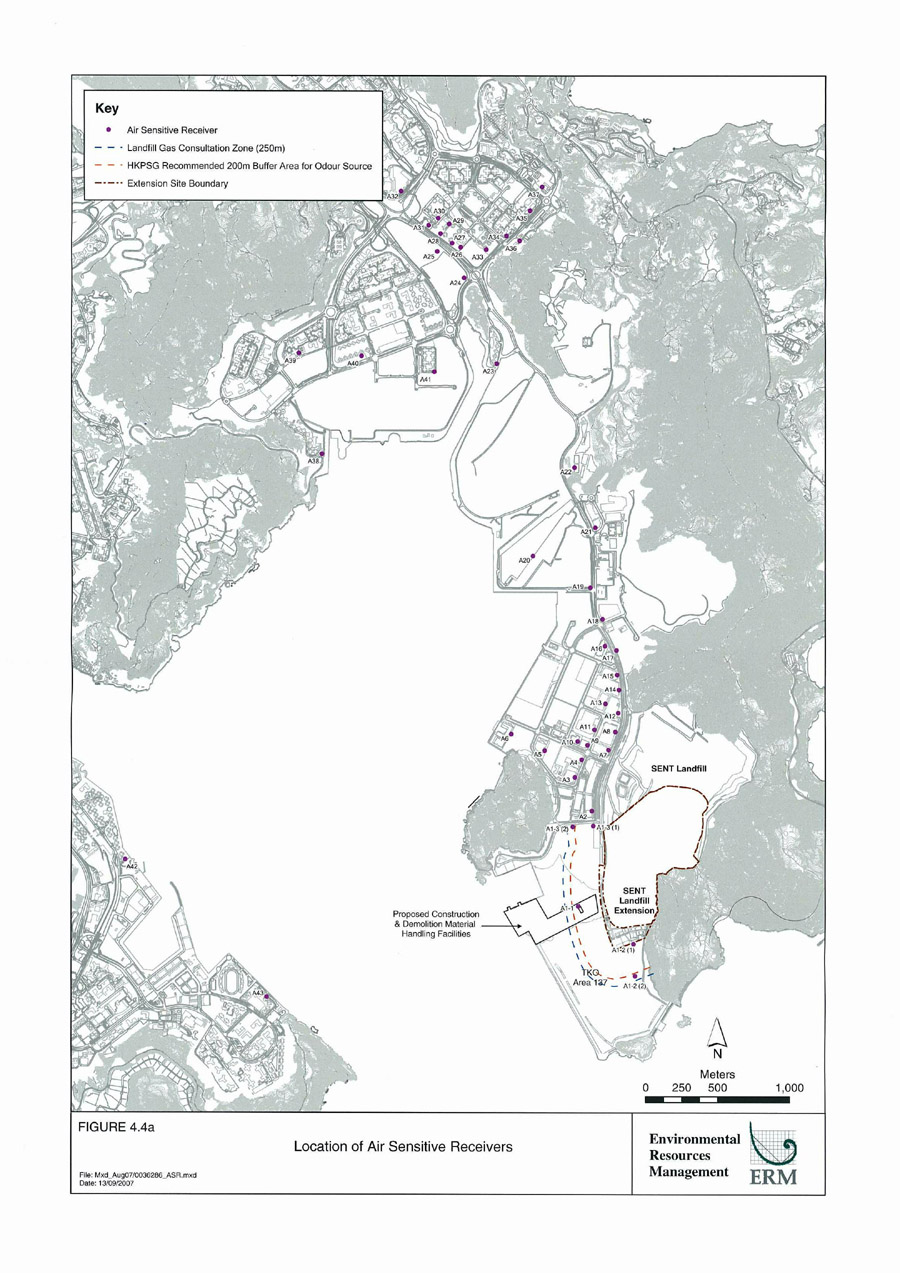
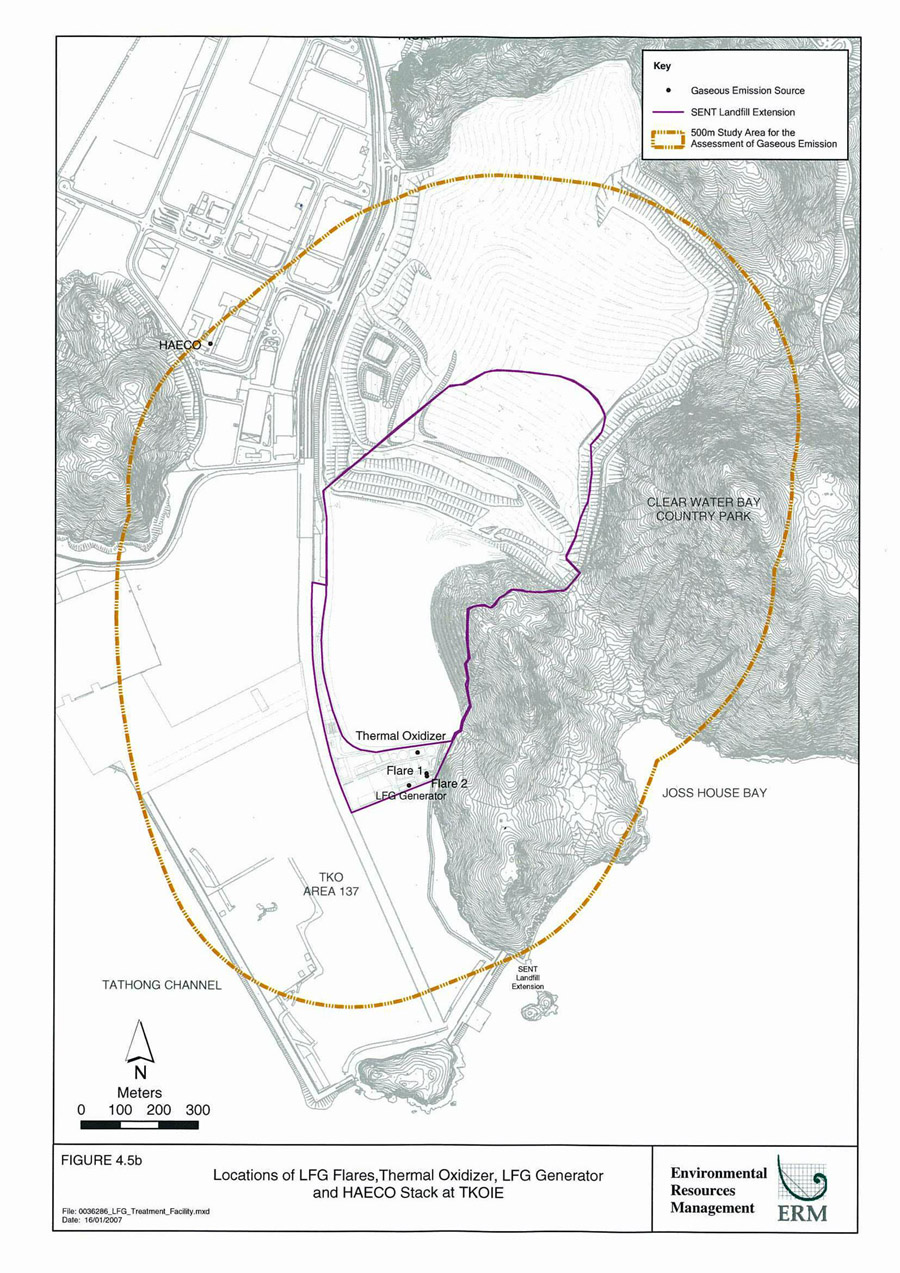
Figure 4.4a
Location of Air Sensitive Receivers
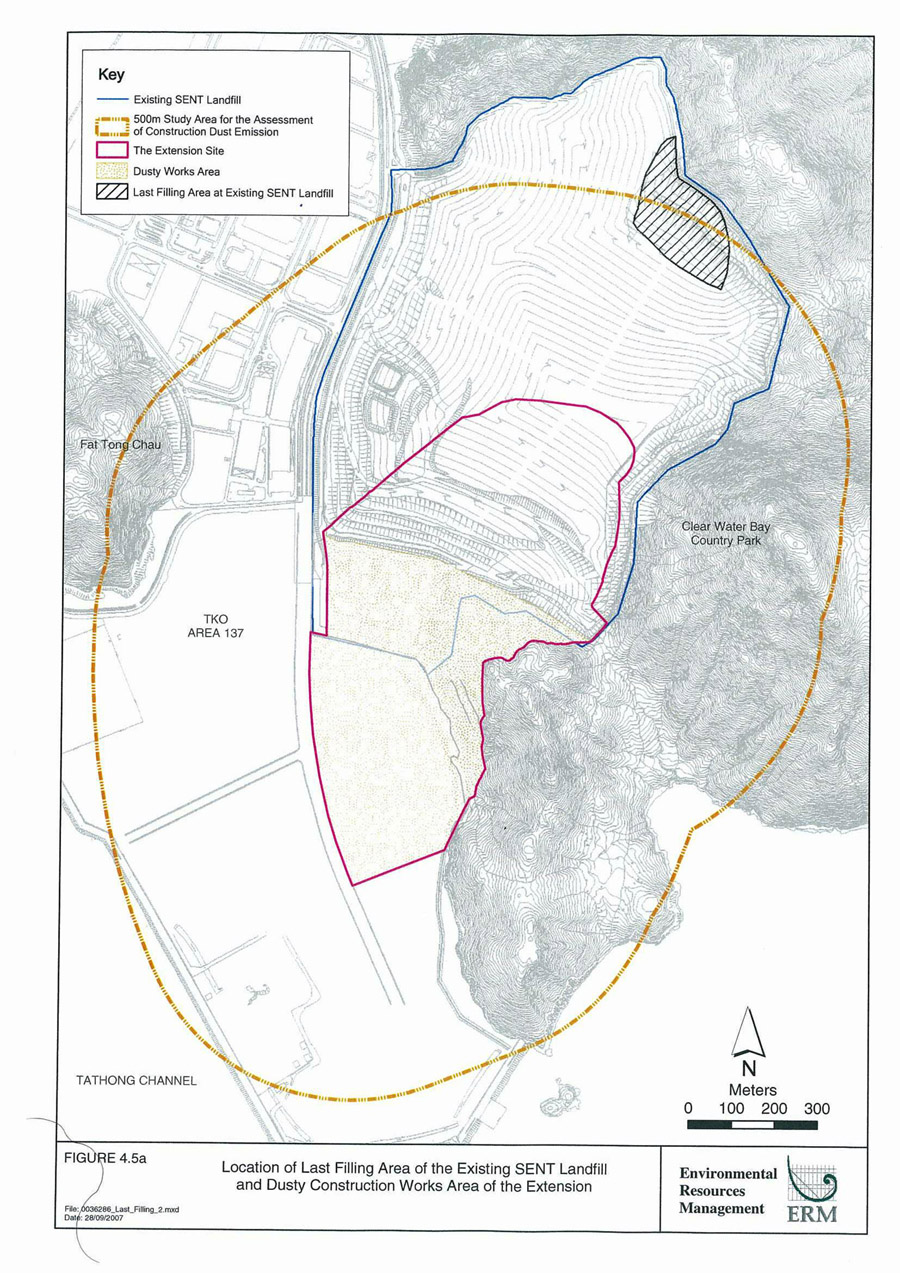
Figure 4.5a
Location of Last Filling Area of the Existing SENT Landfill and Dusty Construction Works Area of the Extension
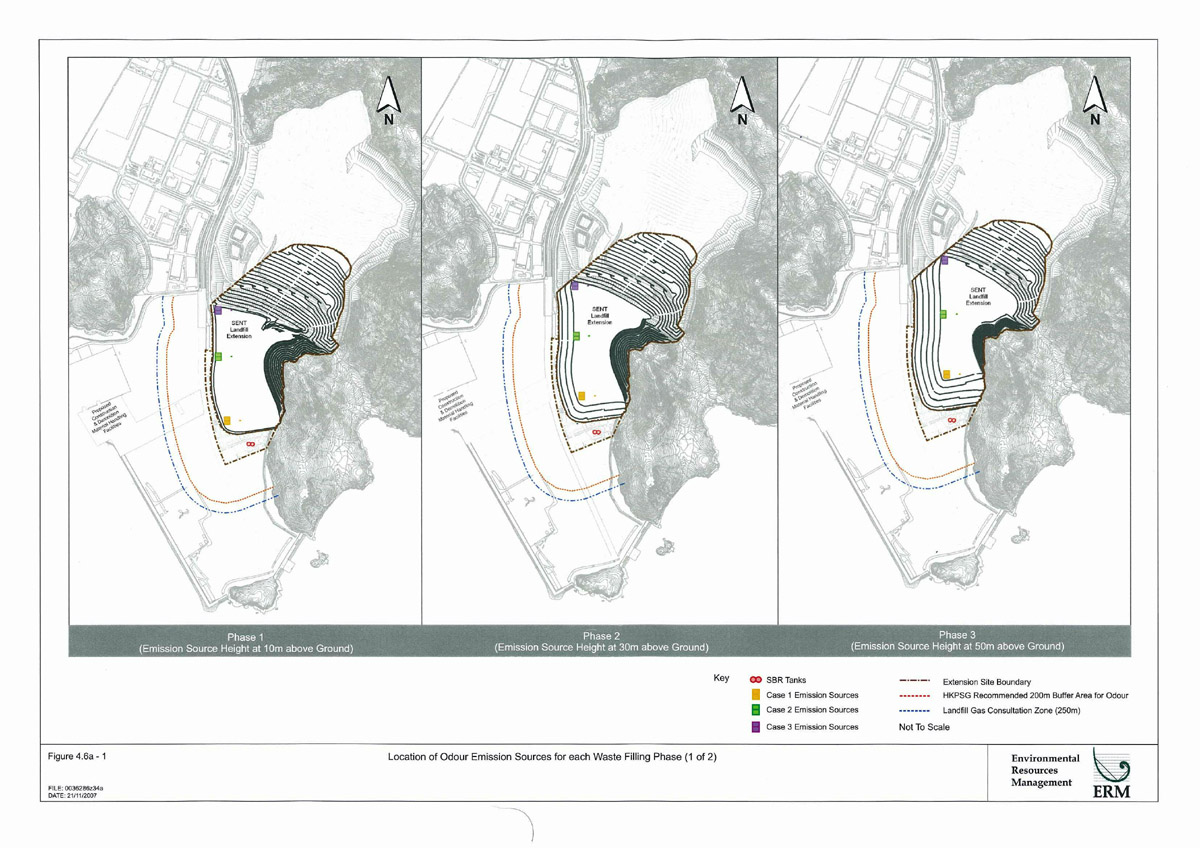
Figure 4.6a -1
Location of Odour Emission Sources for each Waste Filling Phase (1 of 2)
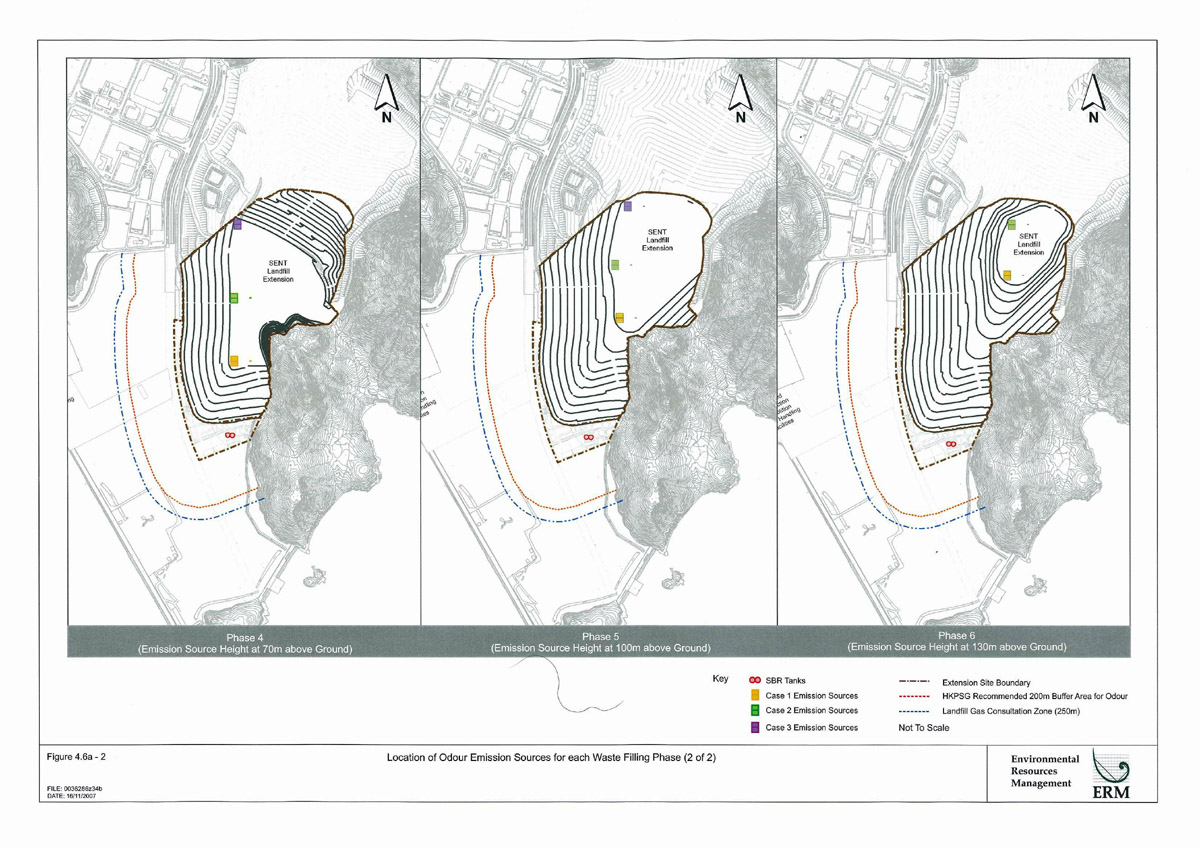
Figure 4.6a -2
Location of Odour Emission Sources for each Waste Filling Phase (2 of 2)
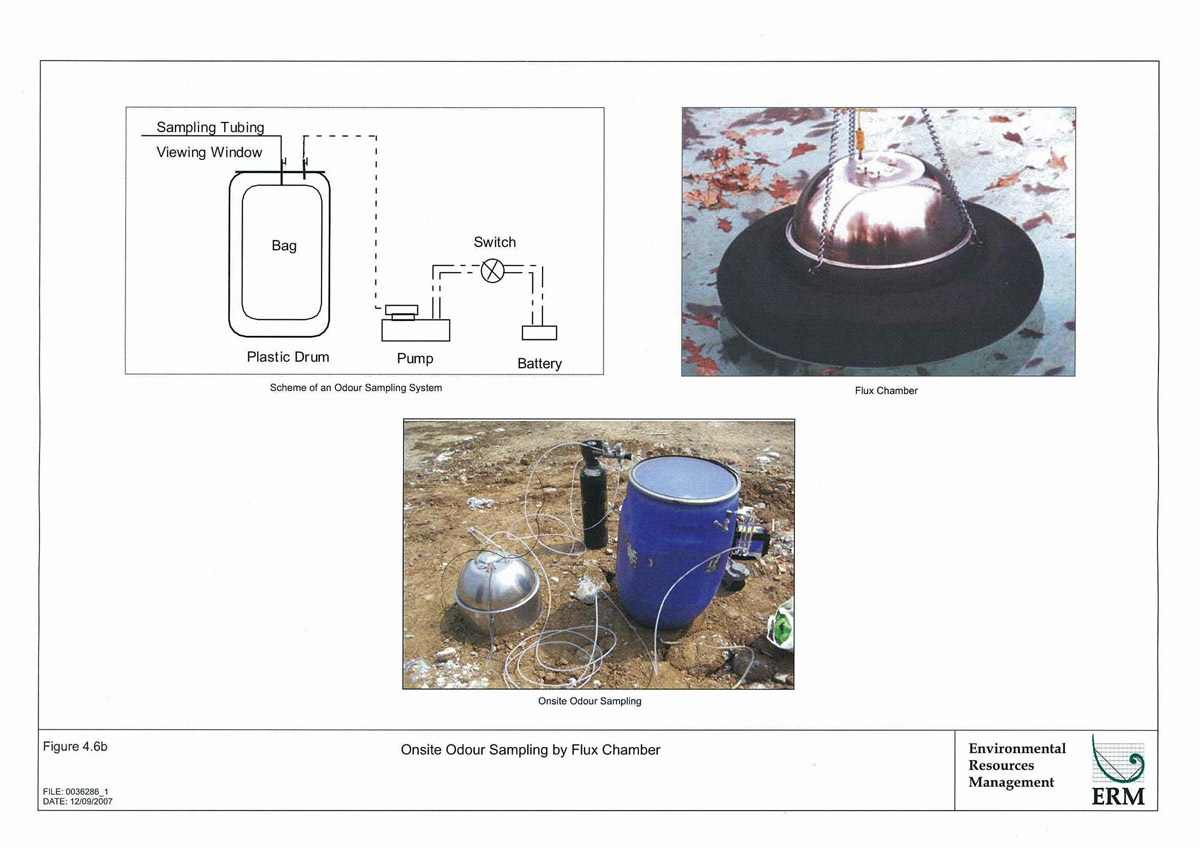
Figure 4.6b
Onsite Odour Sampling by Flux Chamber
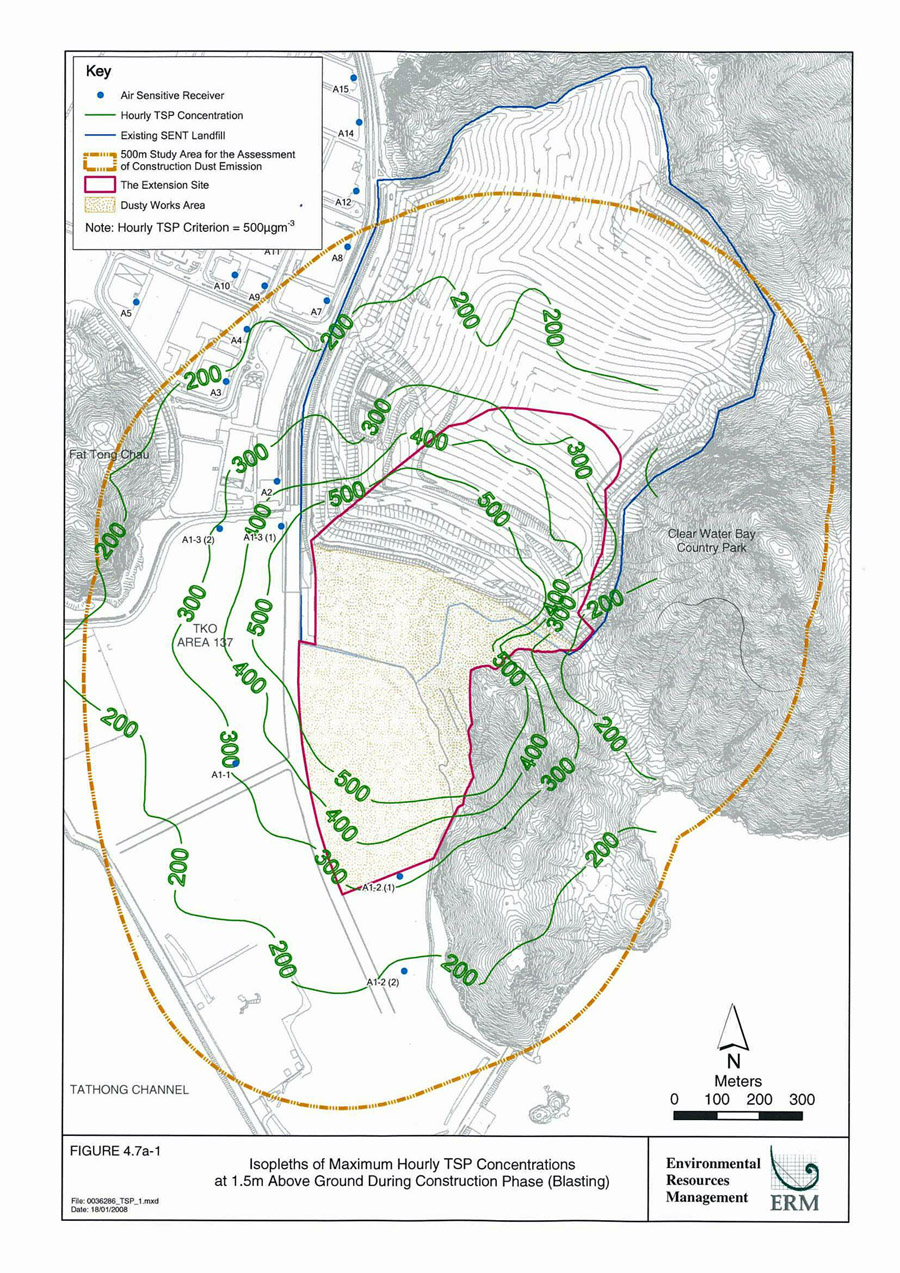
Figure 4.7a-1
Isopleths of Maximum Hourly TSP Concentration at 1.5m Above Ground During Construction Phase (Blasting)
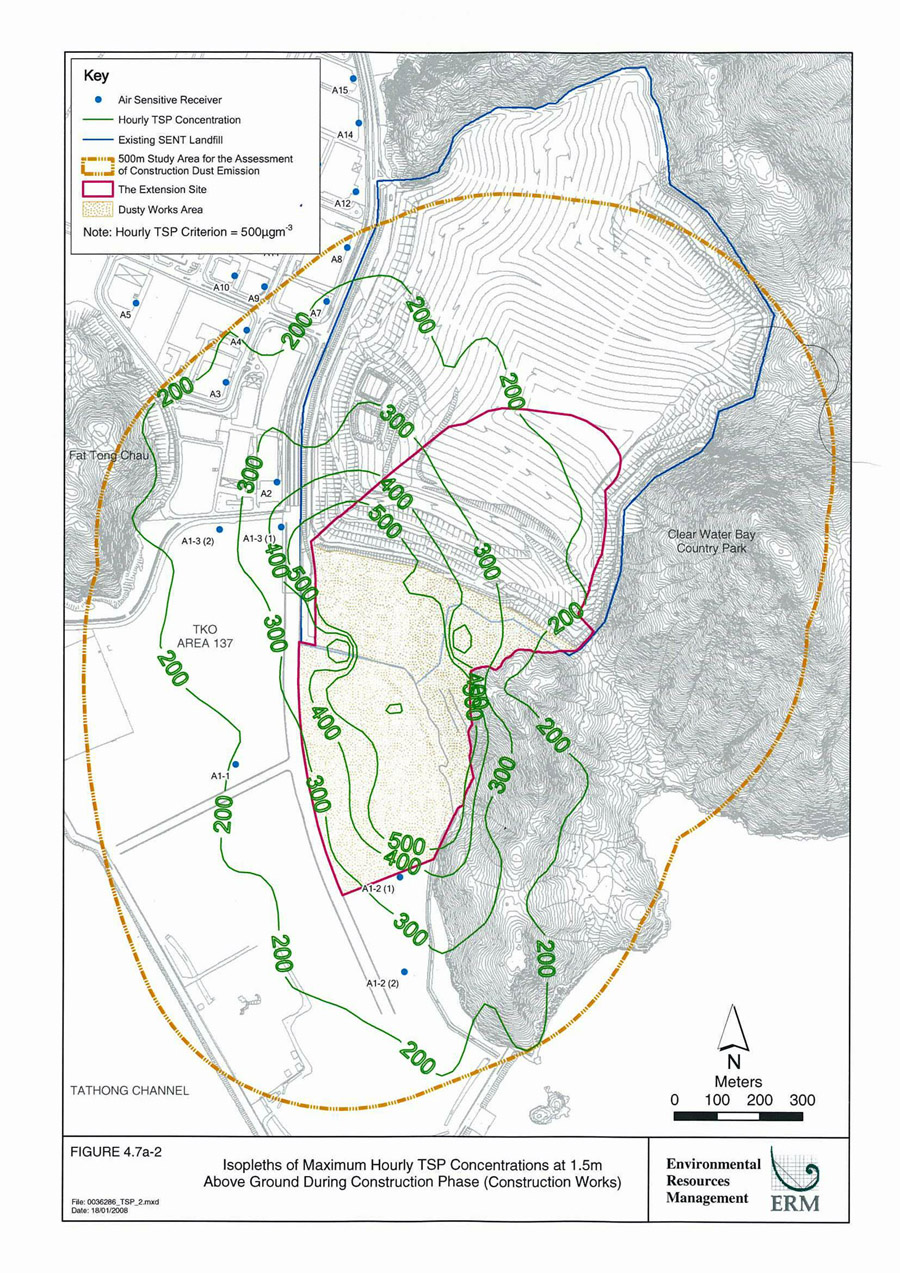
Figure 4.7a-2
Isopleths of Cumulative Maximum TSP Concentration at 1.5m Above Ground During Construction Phase (Construction Works)
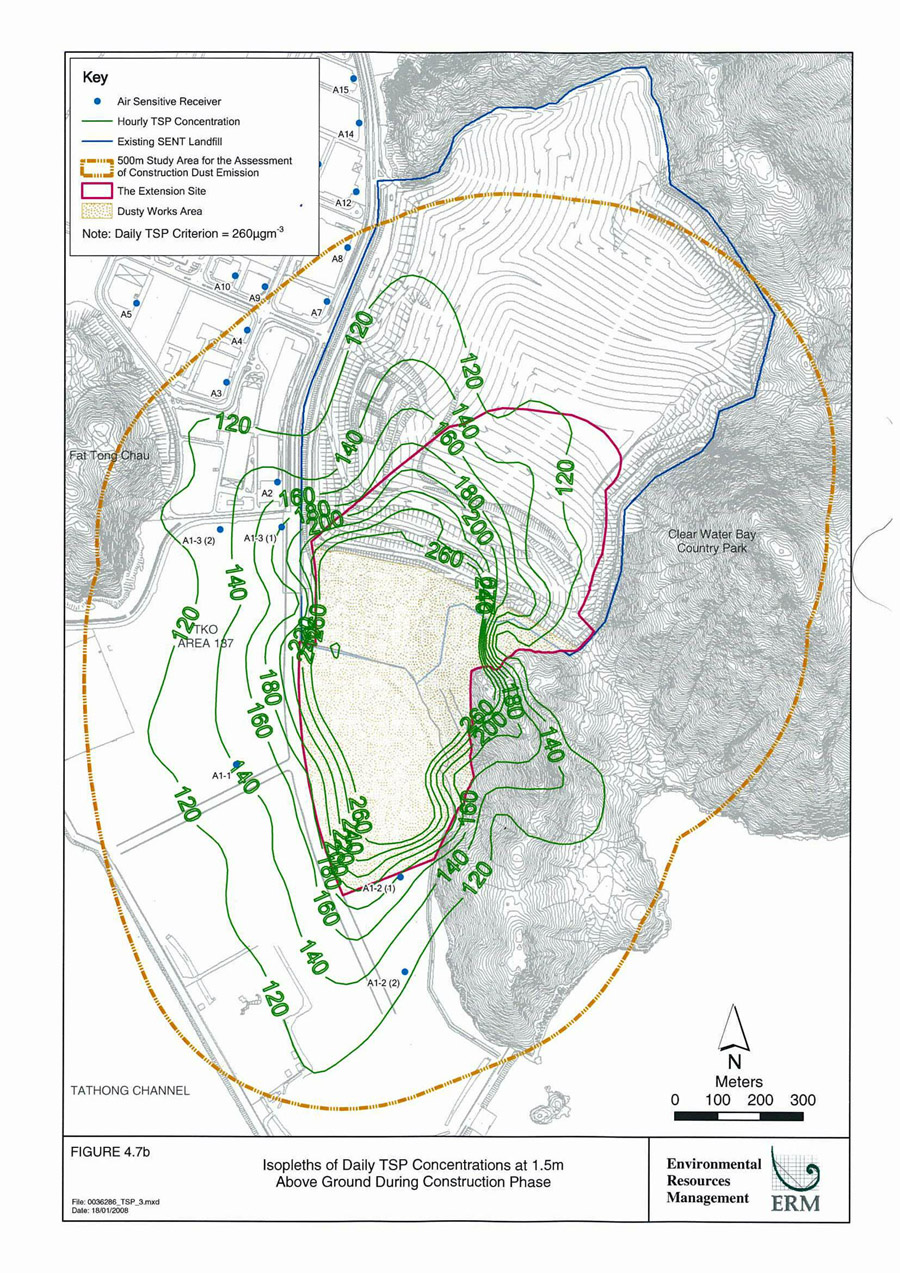
Figure 4.7b
Isopleths of Daily Concentration at 1.5m above ground during Construction Phase
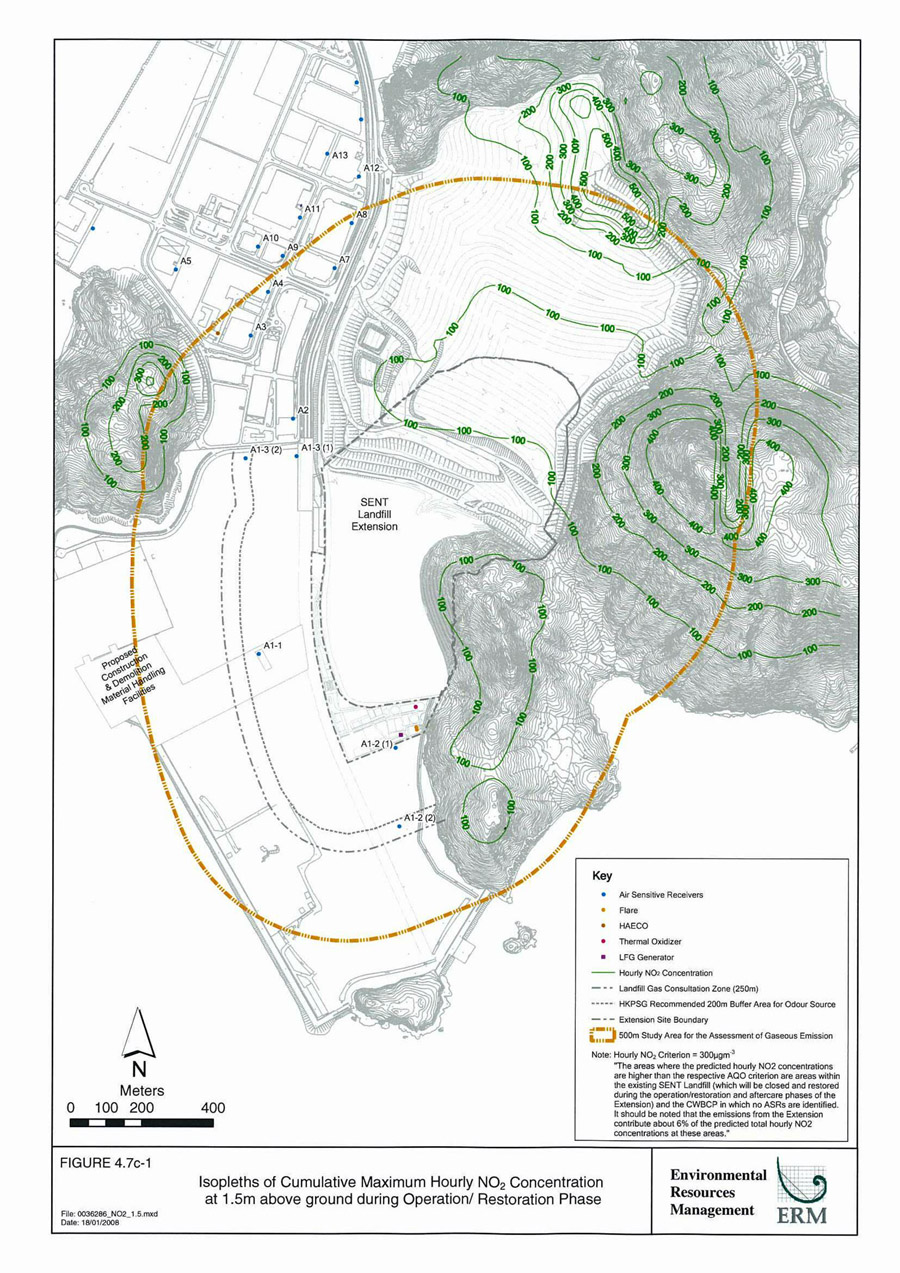
Figure 4.7c-1
Isopleths of Cumulative Maximum Hourly NO2 Concentration at 1.5m above ground during Operation/Restoration Phase
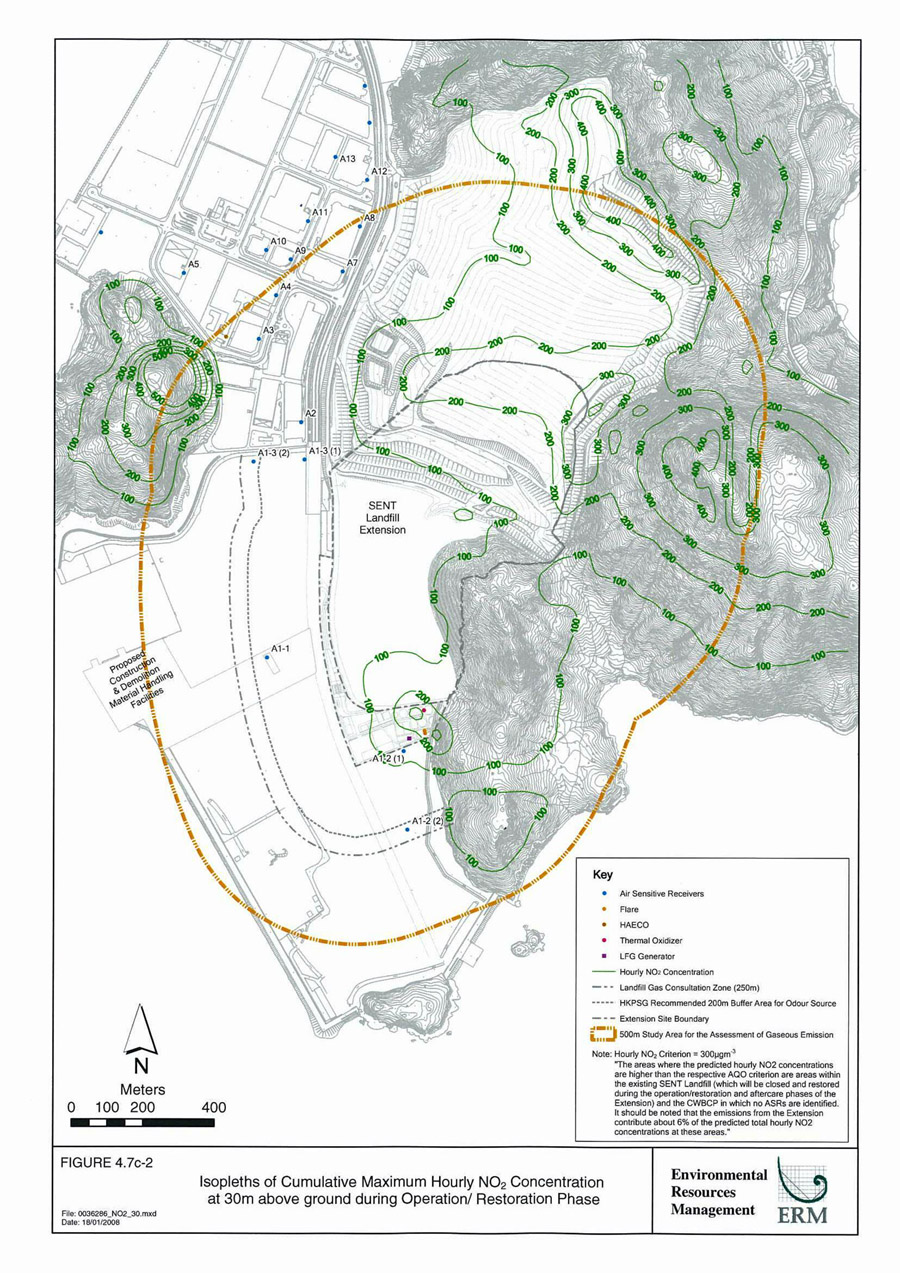
Figure 4.7c-2
Isopleths of Cumulative Maximum Hourly NO2 Concentration at 30m above ground during Operation/Restoration Phase
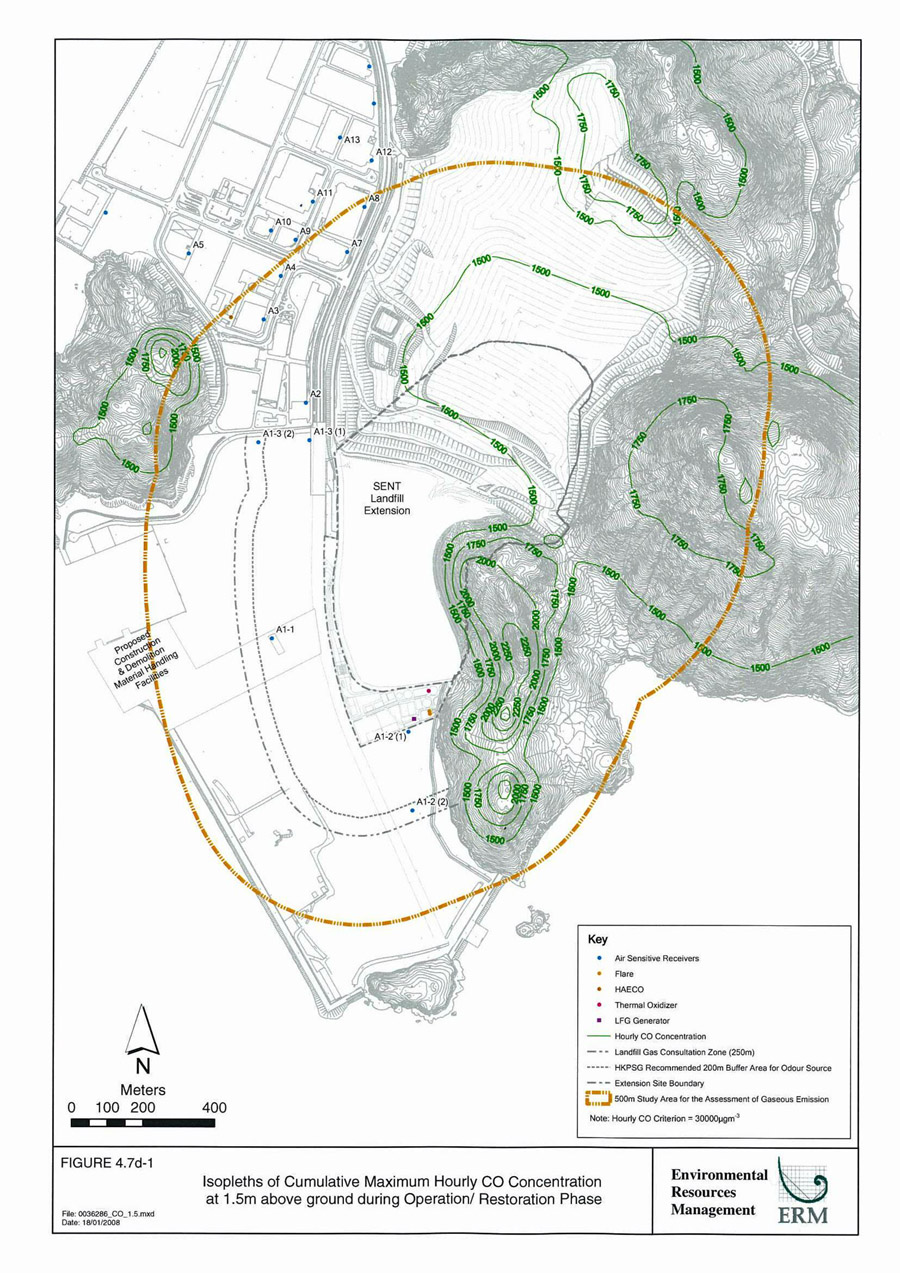
Figure 4.7d-1
Isopleths of Cumulative Maximum Hourly CO Concentration at 1.5m above ground during Operation/Restoration Phase
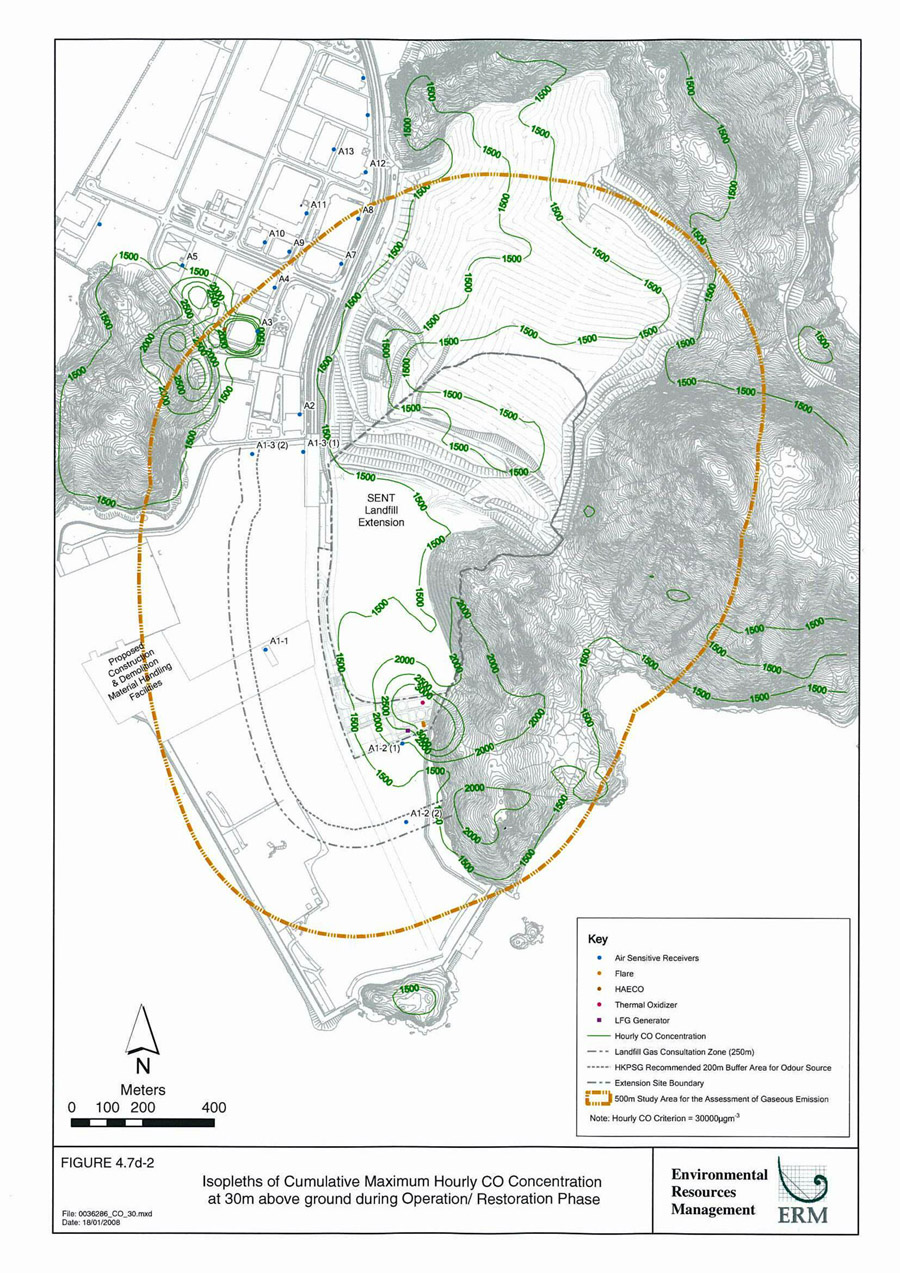
Figure 4.7d-2
Isopleths of Cumulative Maximum Hourly CO Concentration at 30m above ground during Operation/Restoration Phase
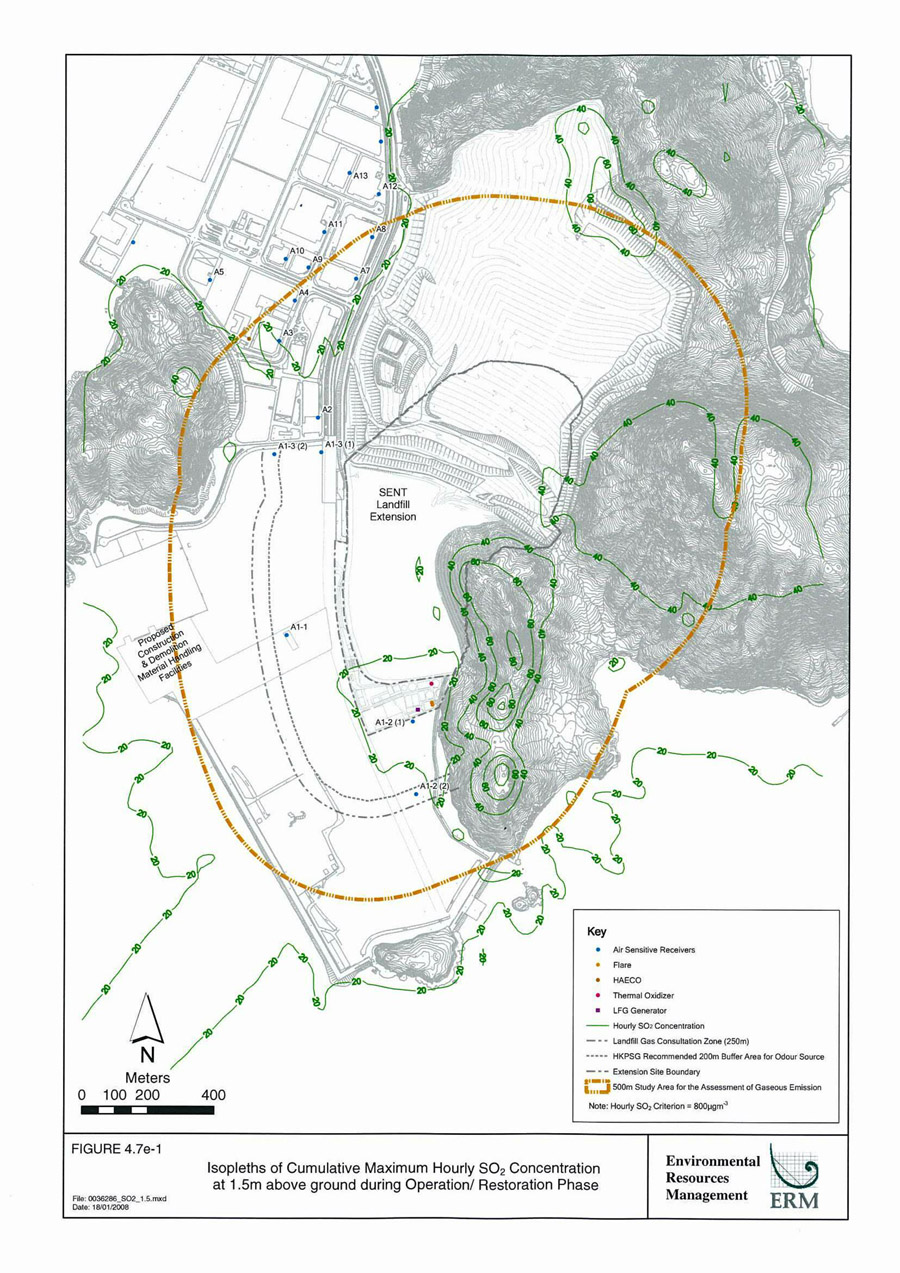
Figure 4.7e-1
Isopleths of Cumulative Maximum Hourly SO2 Concentration at 1.5m above ground during Operation/Restoration Phase
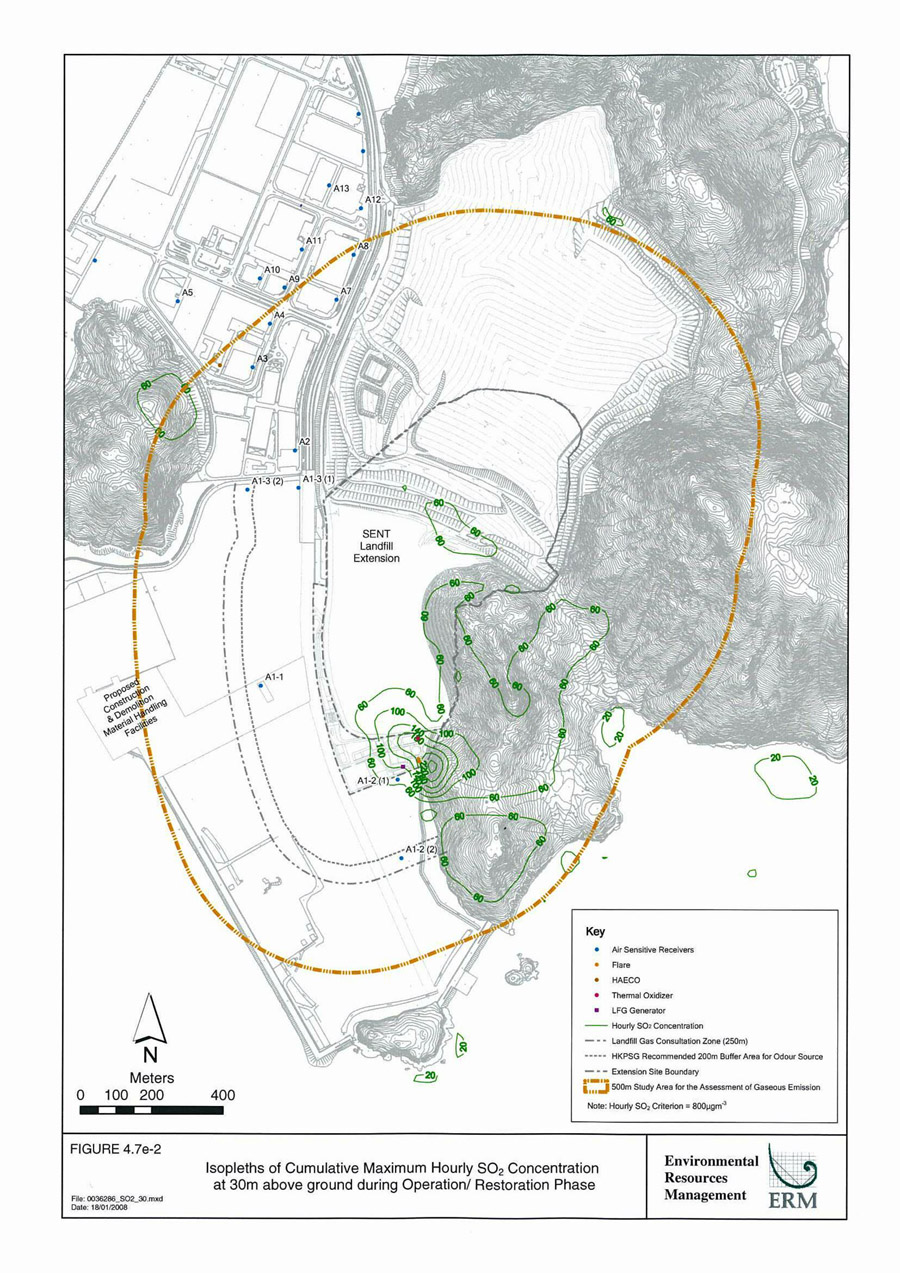
Figure 4.7e-2
Isopleths of Cumulative Maximum Hourly SO2 Concentration at 30m above ground during Operation/Restoration Phase
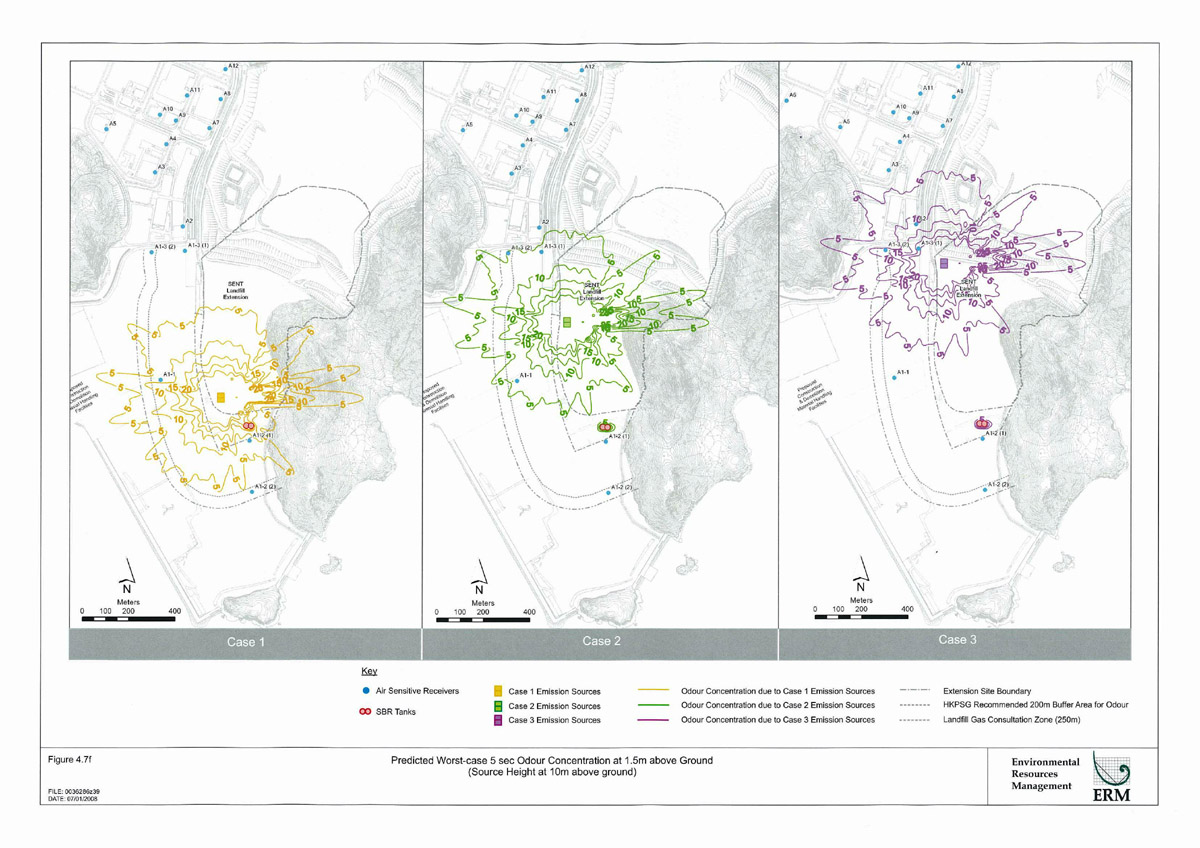
Figure 4.7f
Predicted Worse-case 5 sec Odour Concentration at 1.5m above ground (Source Height at 10m above ground)
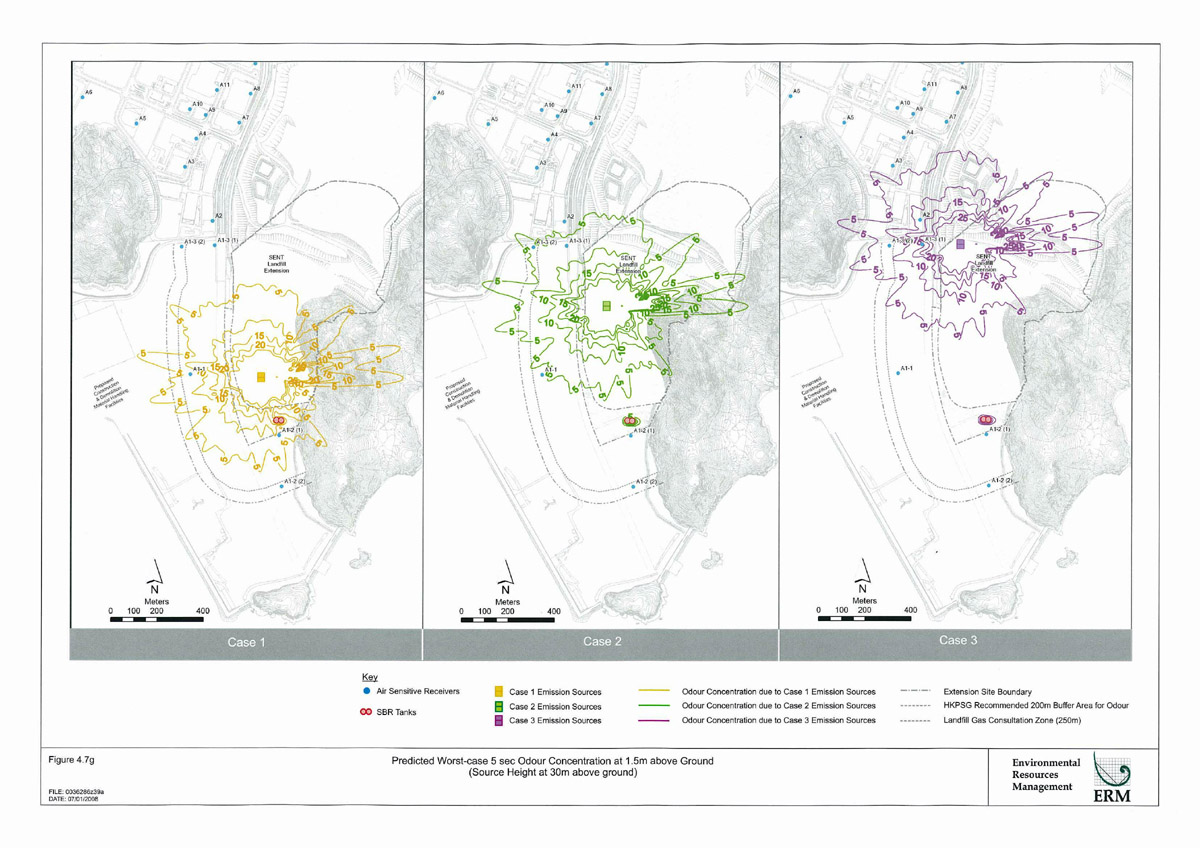
Figure 4.7g
Predicted Worse-case 5 sec Odour Concentration at 1.5m above ground (Source Height at 30m above ground)
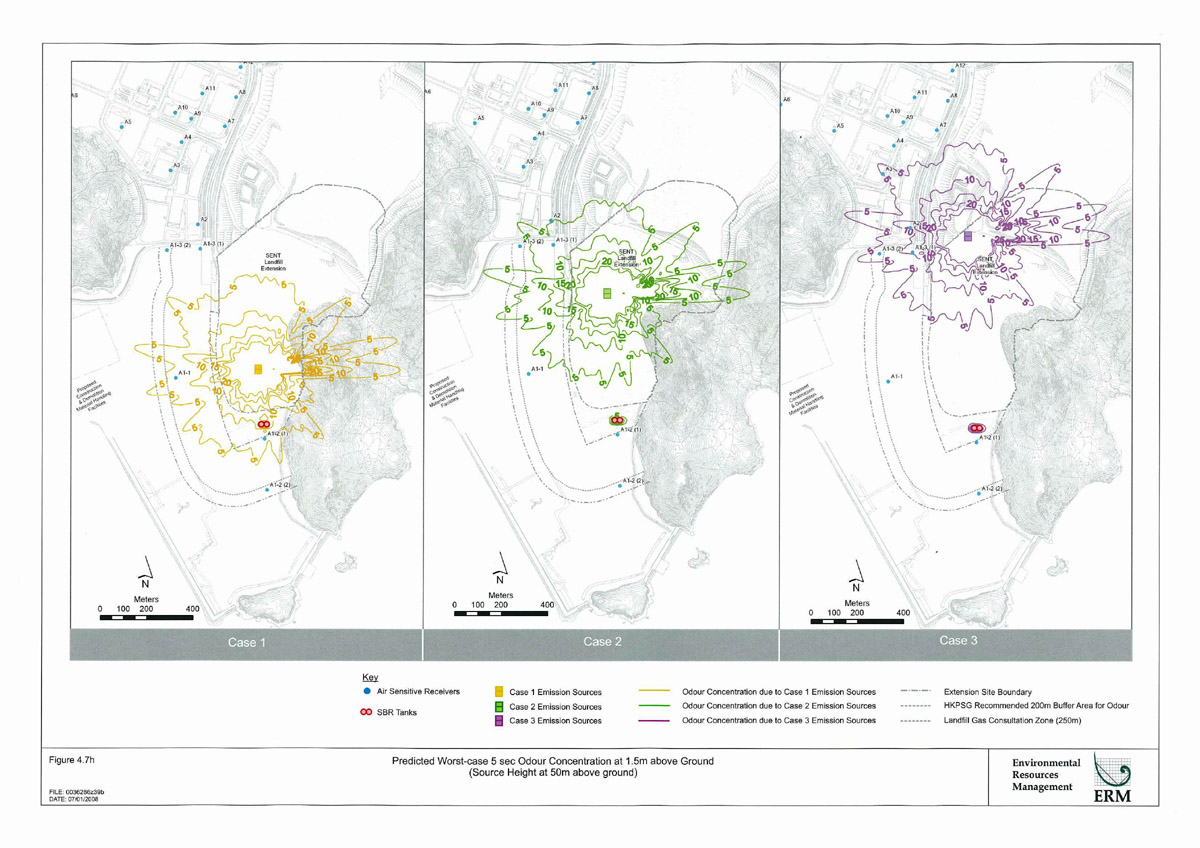
Figure 4.7h
Predicted Worst-case 5 sec Odour Concentration at 1.5m above Ground (Source Height at 50m above ground)
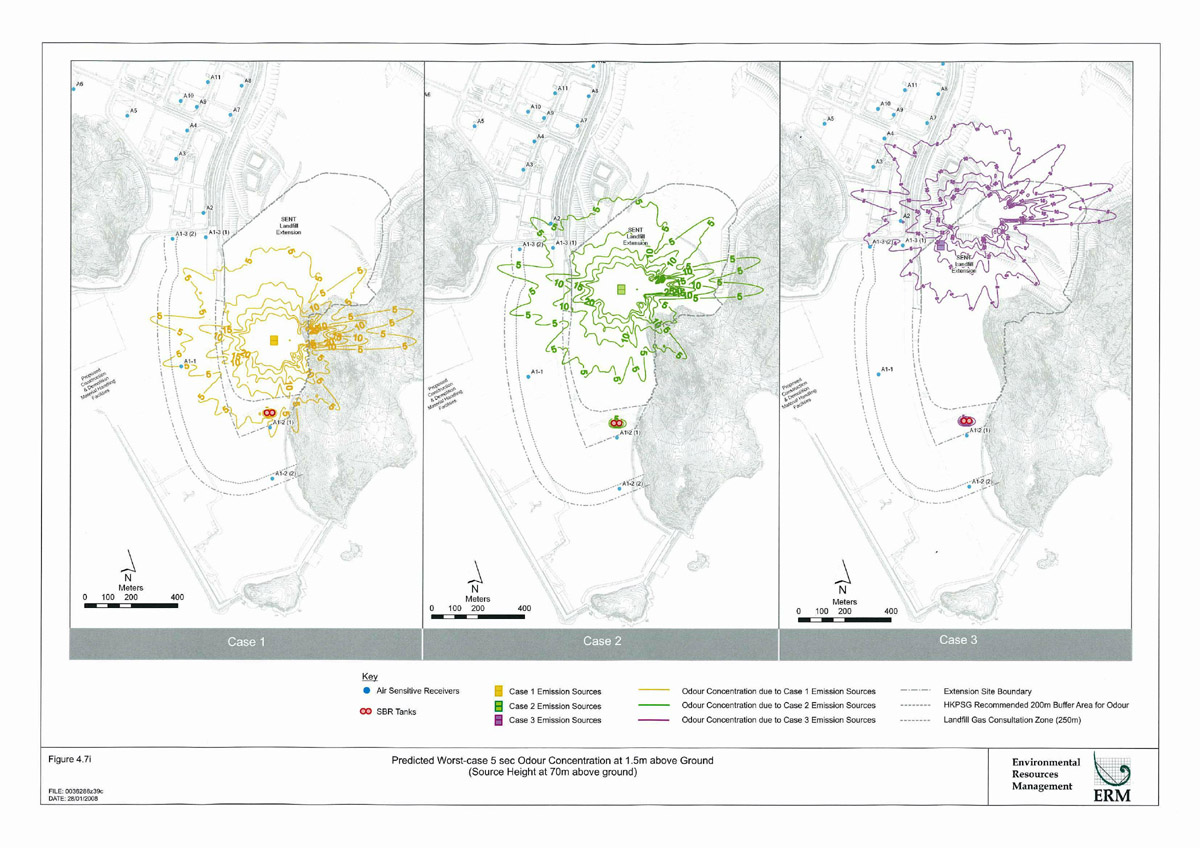
Figure 4.7i
Predicted Worst-case 5 sec Odour Concentration at 1.5m above Ground (Source Height at 70m above ground)
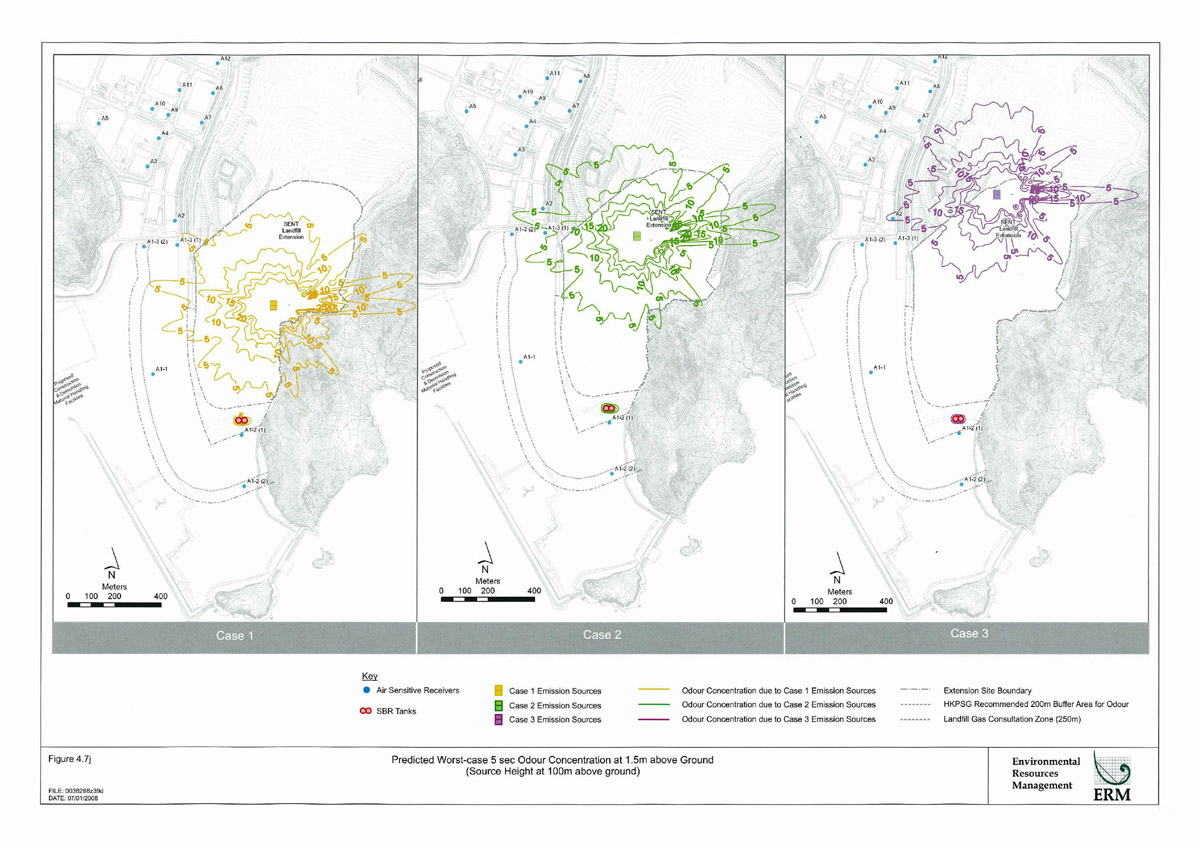
Figure 4.7j
Predicted Worst-case 5 sec Odour Concentration at 1.5m above Ground (Source Height at 100m above ground)
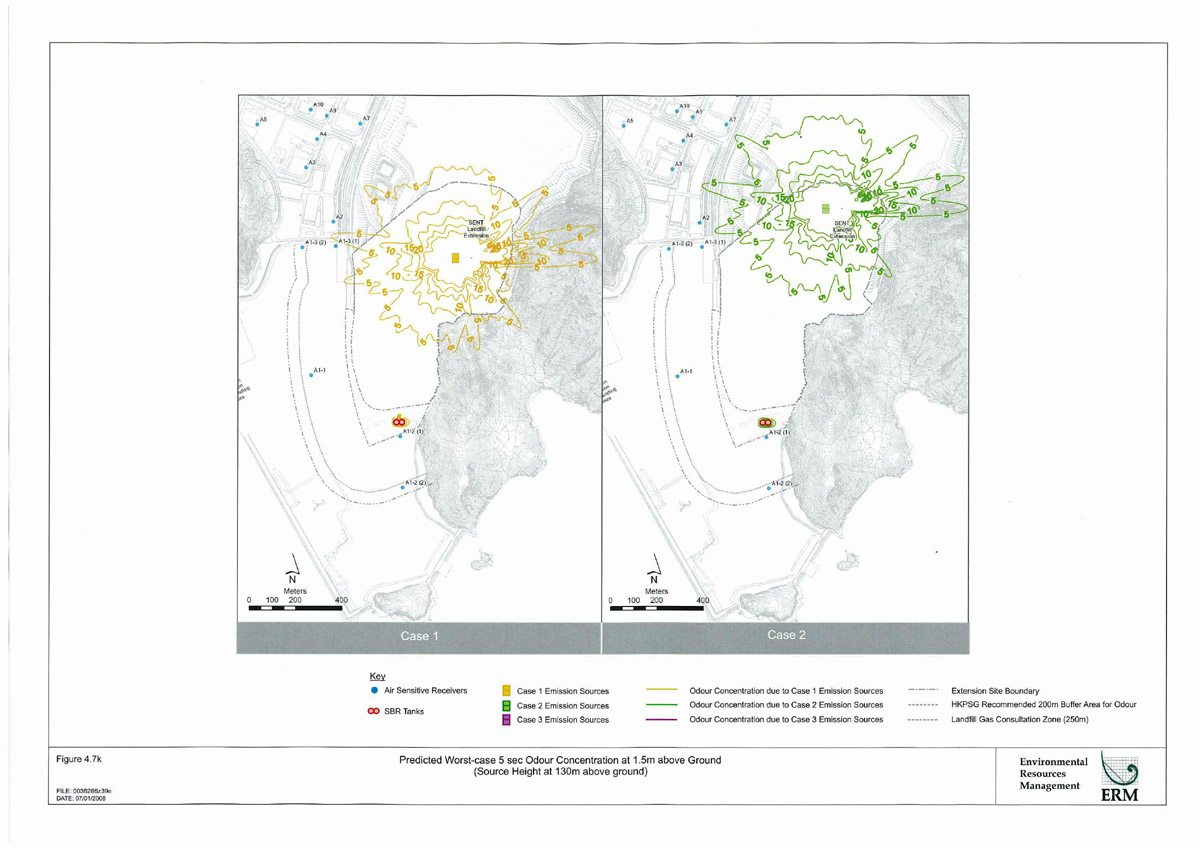
Figure 4.7k
Predicted Worst-case 5 sec Odour Concentration at 1.5m above Ground (Source Height at 130m above ground)
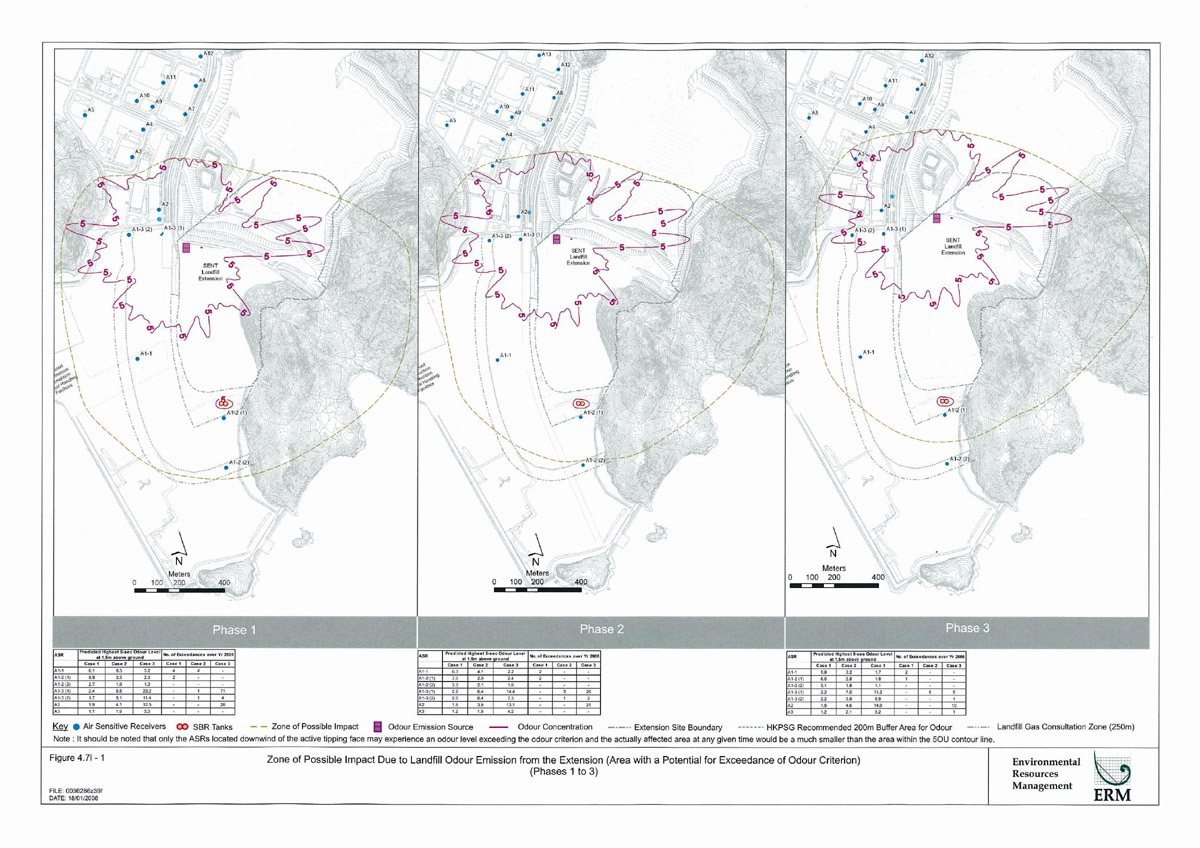
Figure 4.7l-1
Zone of Possible Impact Due to Landfill Odour Emission from the Extension ( Area with a Potential for Exceedance of Odour Criterion) (Phases 1 to 3)
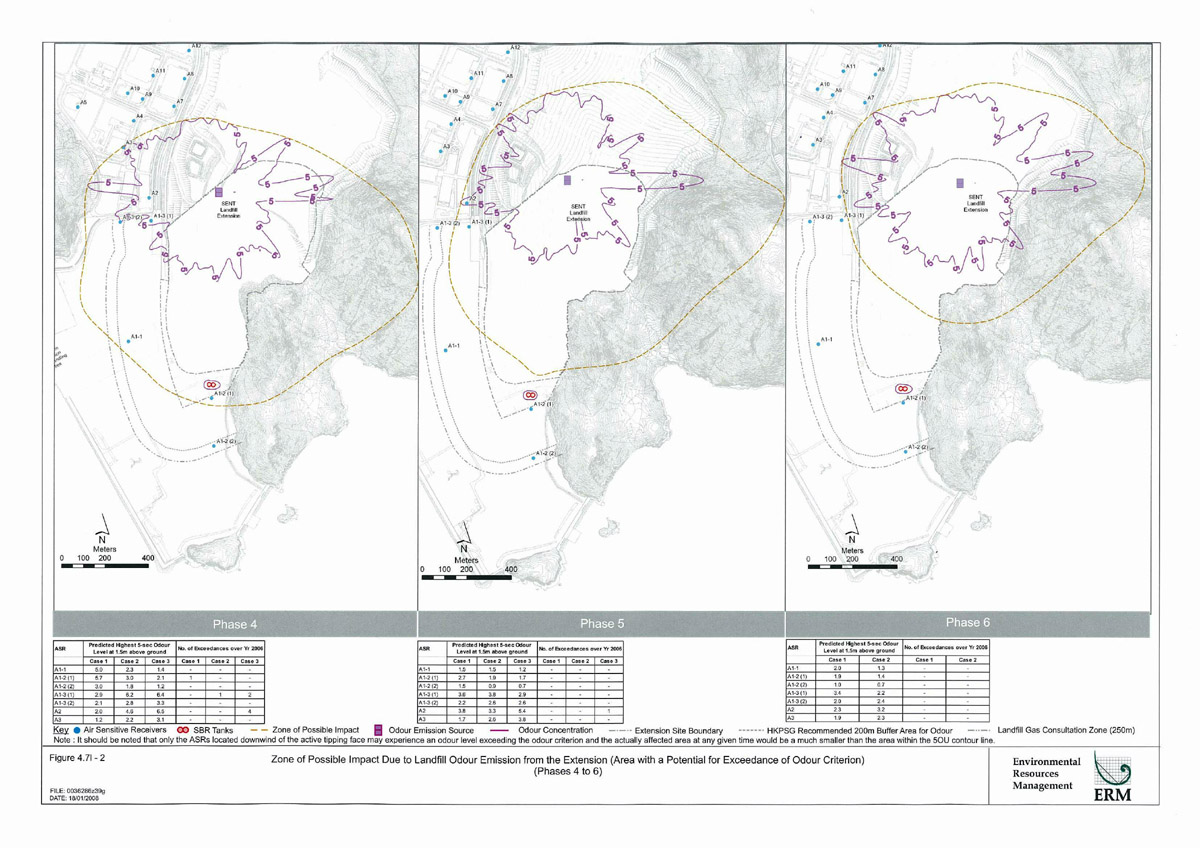
Figure 4.7l-2
Zone of Possible Impact Due to Landfill Odour Emission from the Extension ( Area with a Potential for Exceedance of Odour Criterion) (Phases 4 to 6)
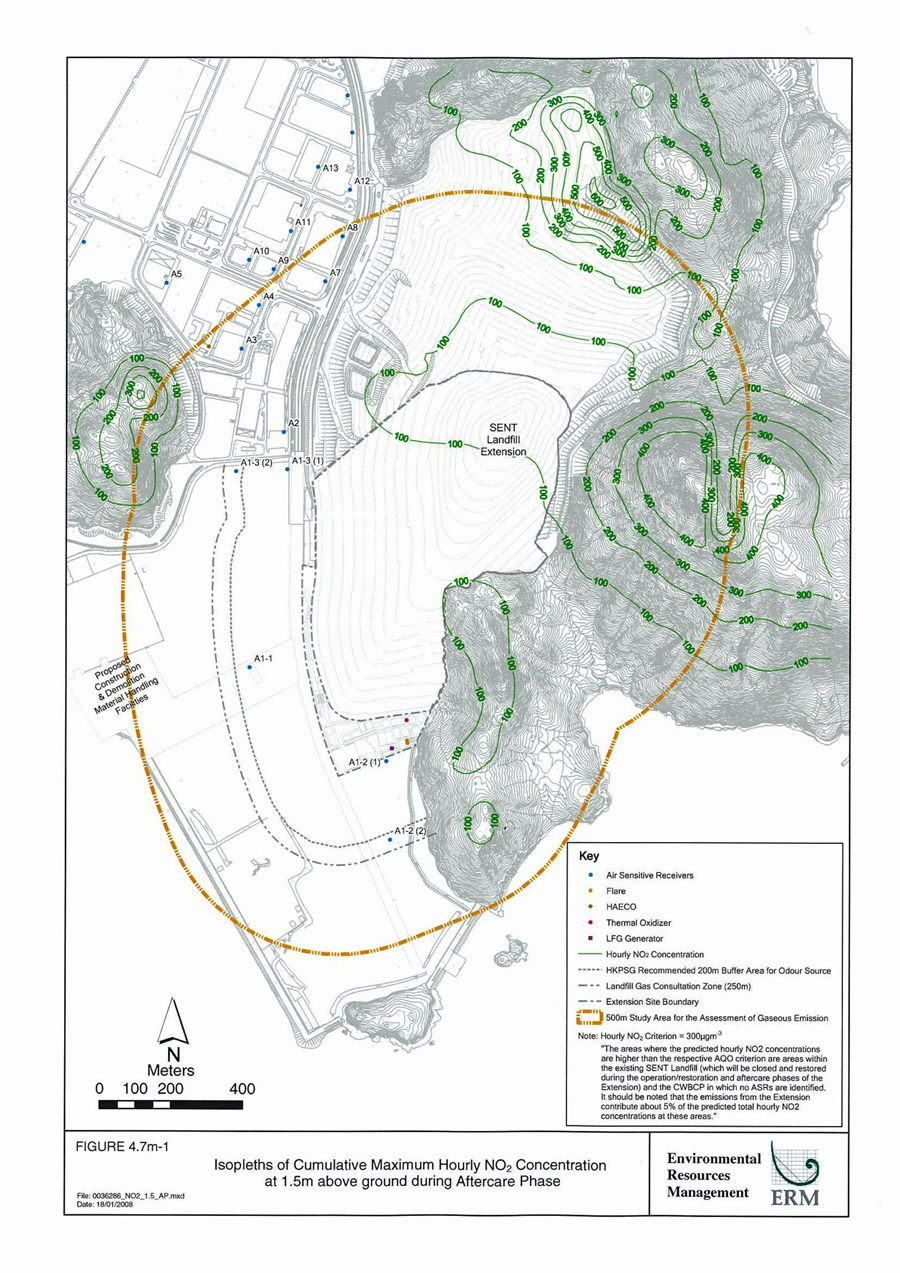
Figure 4.7m-1
Isopleths of Cumulative Maximum Hourly NO2 Concentration at 1.5m above ground during Aftercare Phase
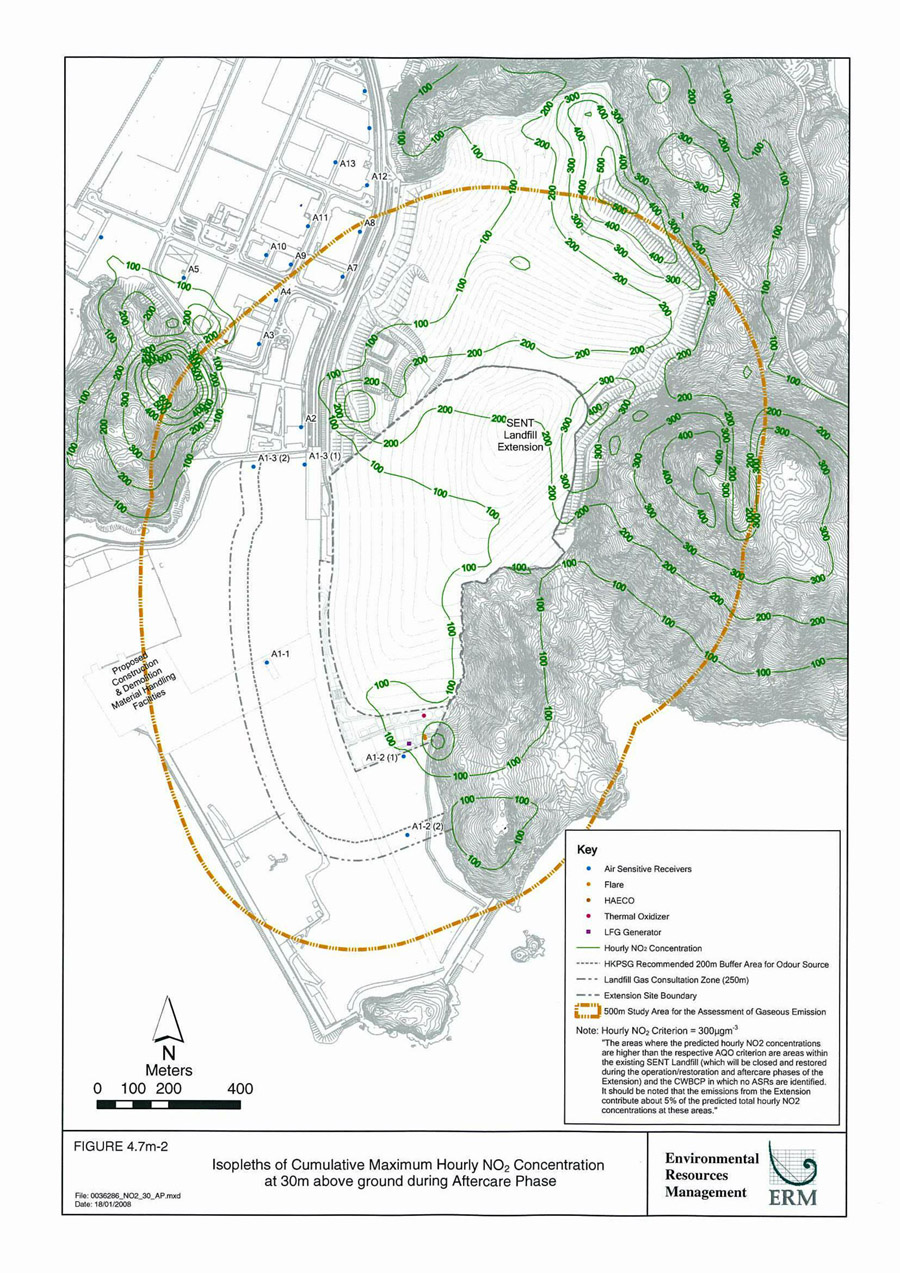
Figure 4.7m-2
Isopleths of Cumulative Maximum Hourly NO2 Concentration at 30m above ground during Aftercare Phase
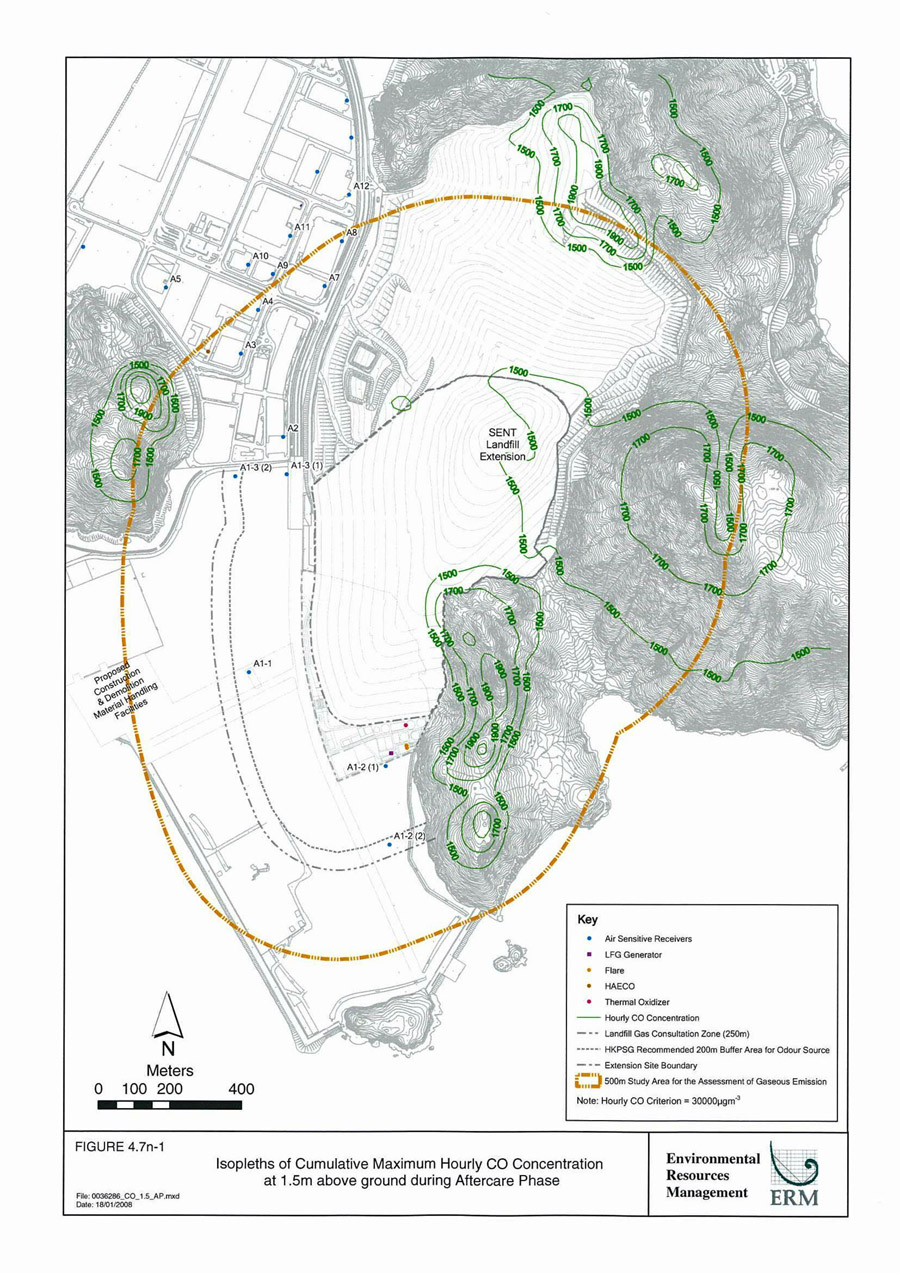
Figure 4.7n-1
Isopleths of Cumulative Maximum Hourly CO Concentration at 1.5m above ground during Aftercare Phase
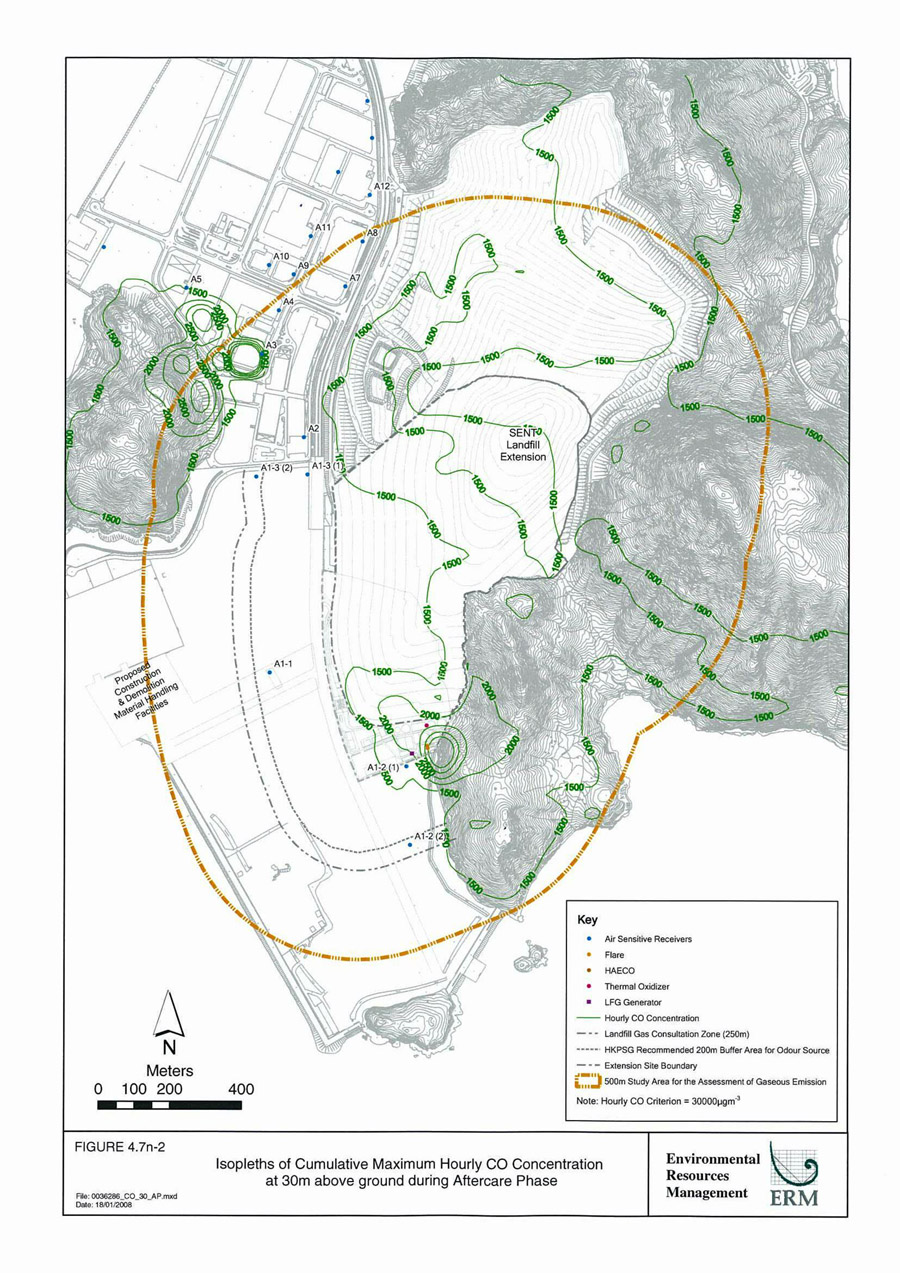
Figure 4.7n-2
Isopleths of Cumulative Maximum Hourly CO Concentration at 30m above ground during Aftercare Phase
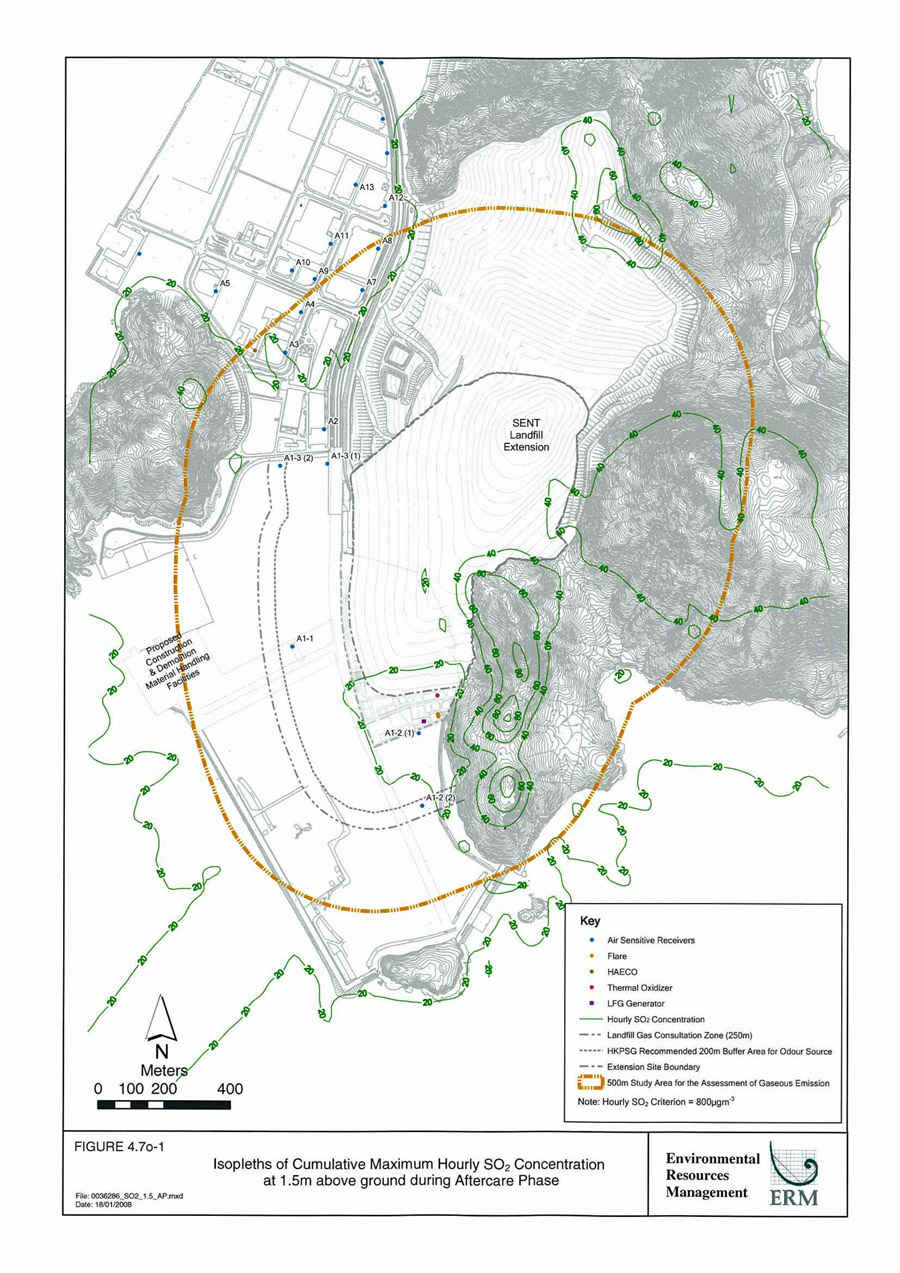
Figure 4.7o-1
Isopleths of Cumulative Maximum Hourly SO2 Concentration at 1.5m above ground during Aftercare Phase
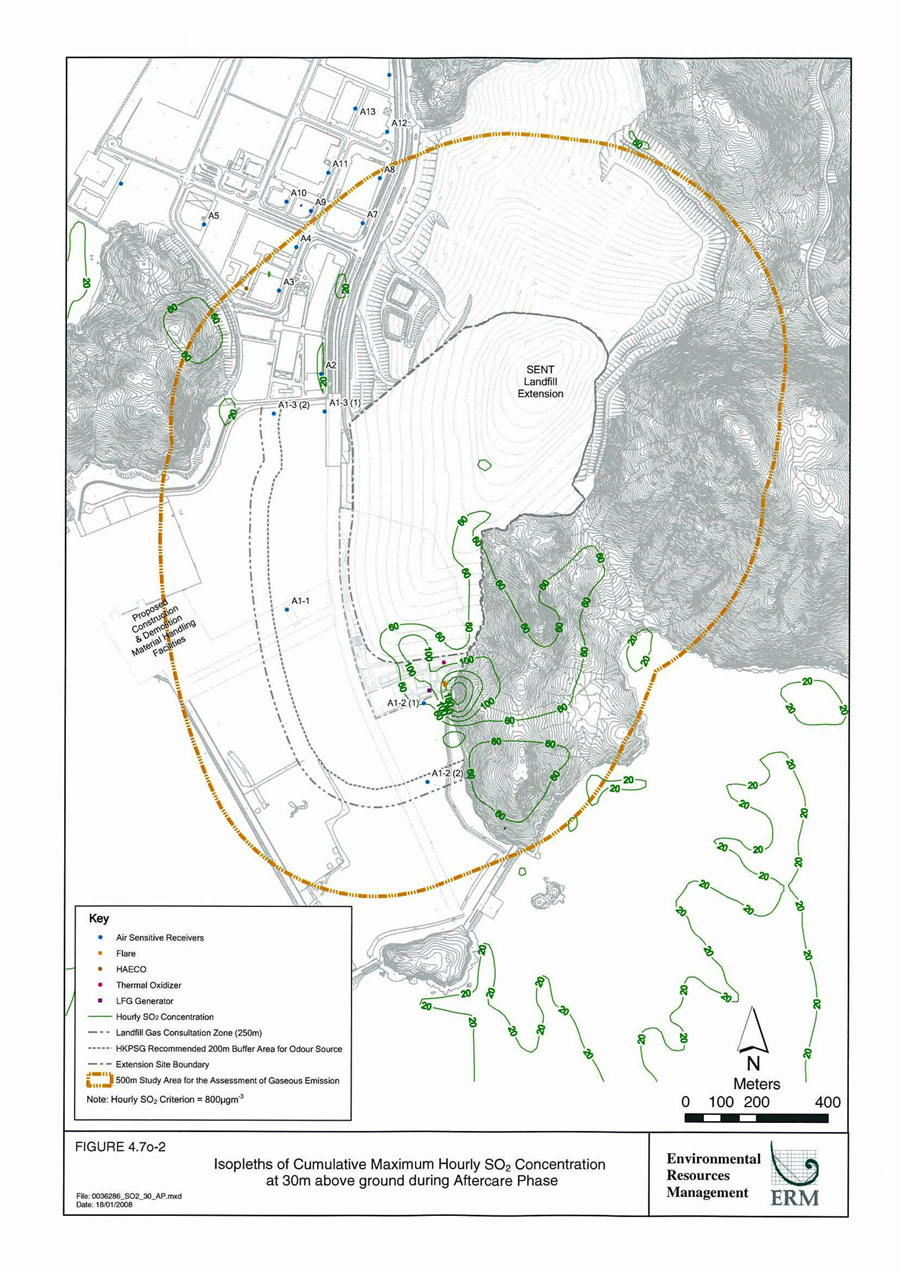
Figure 4.7o-2
Isopleths of Cumulative Maximum Hourly SO2 Concentration at 30m above ground during Aftercare Phase
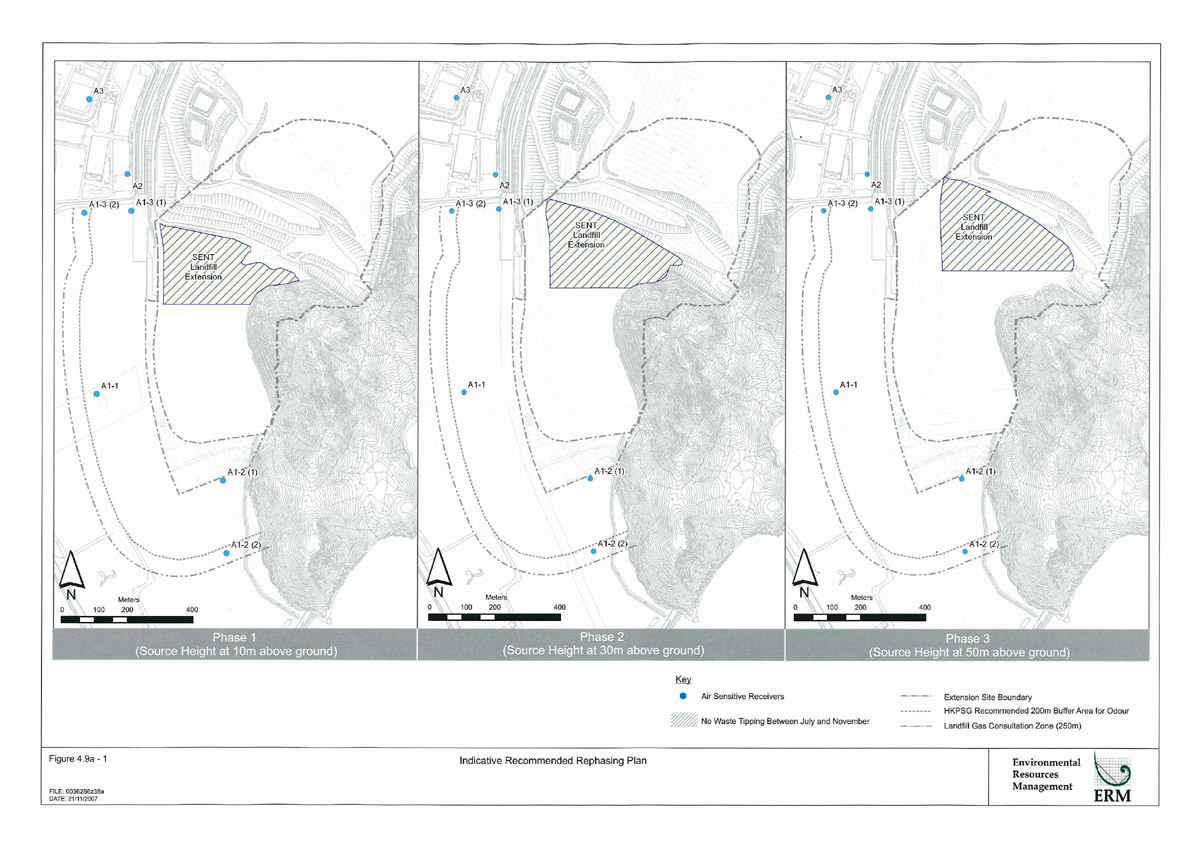
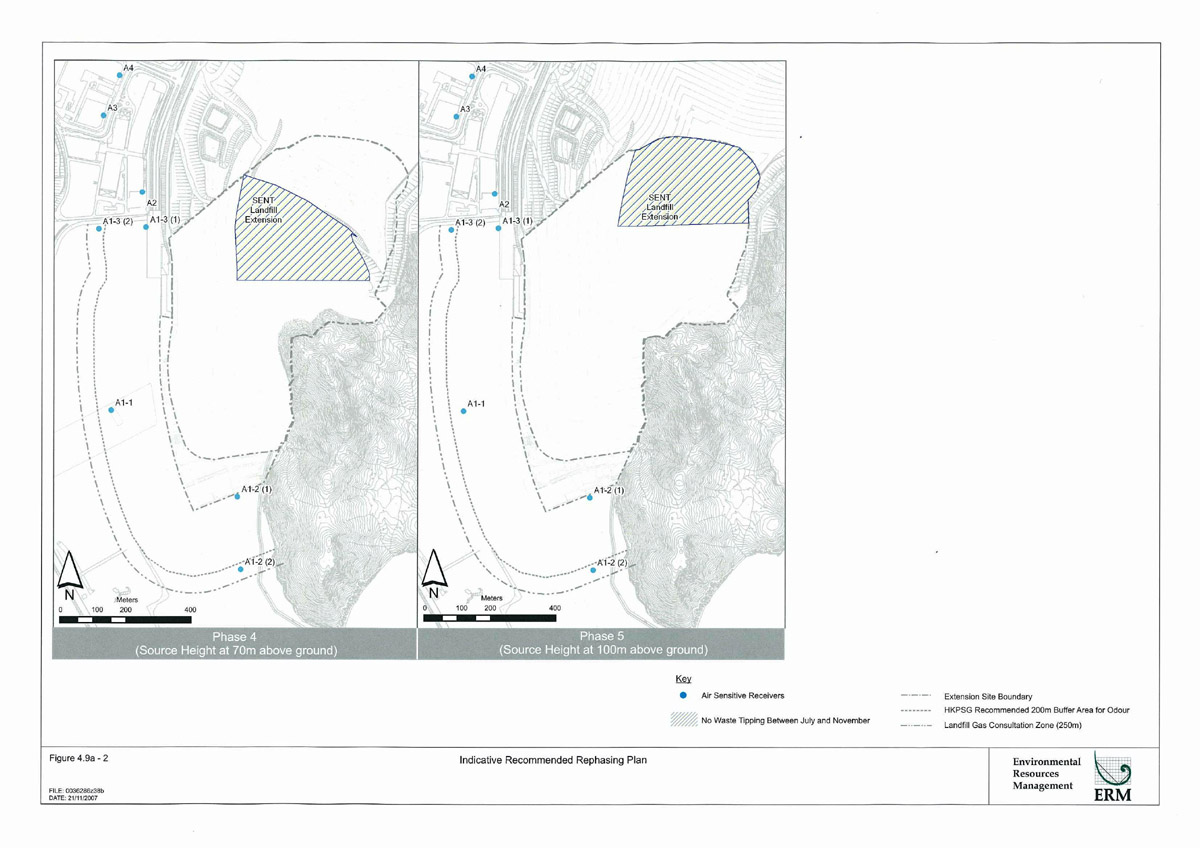
Figure 4.9a - 1
Indicative Recommended Rephasing Plan
Figure 4.9a - 2
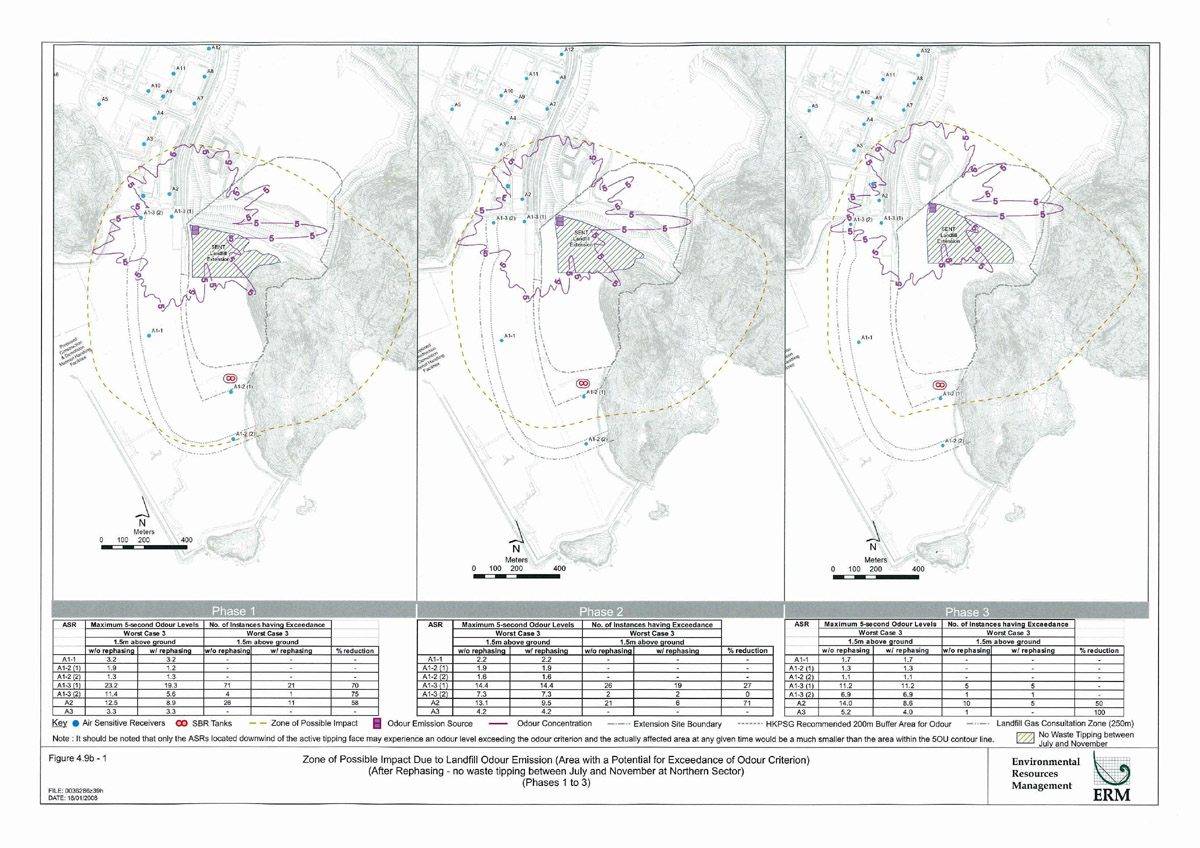
Figure 4.9b - 1
Zone of Possible Impact Due to Landfill Odour Emission (Area with a Potential for Exceedance of Odour Criterion) (After Rephasing - no waste tipping between July and November at Northern Sector) (Phases 1 to 3)
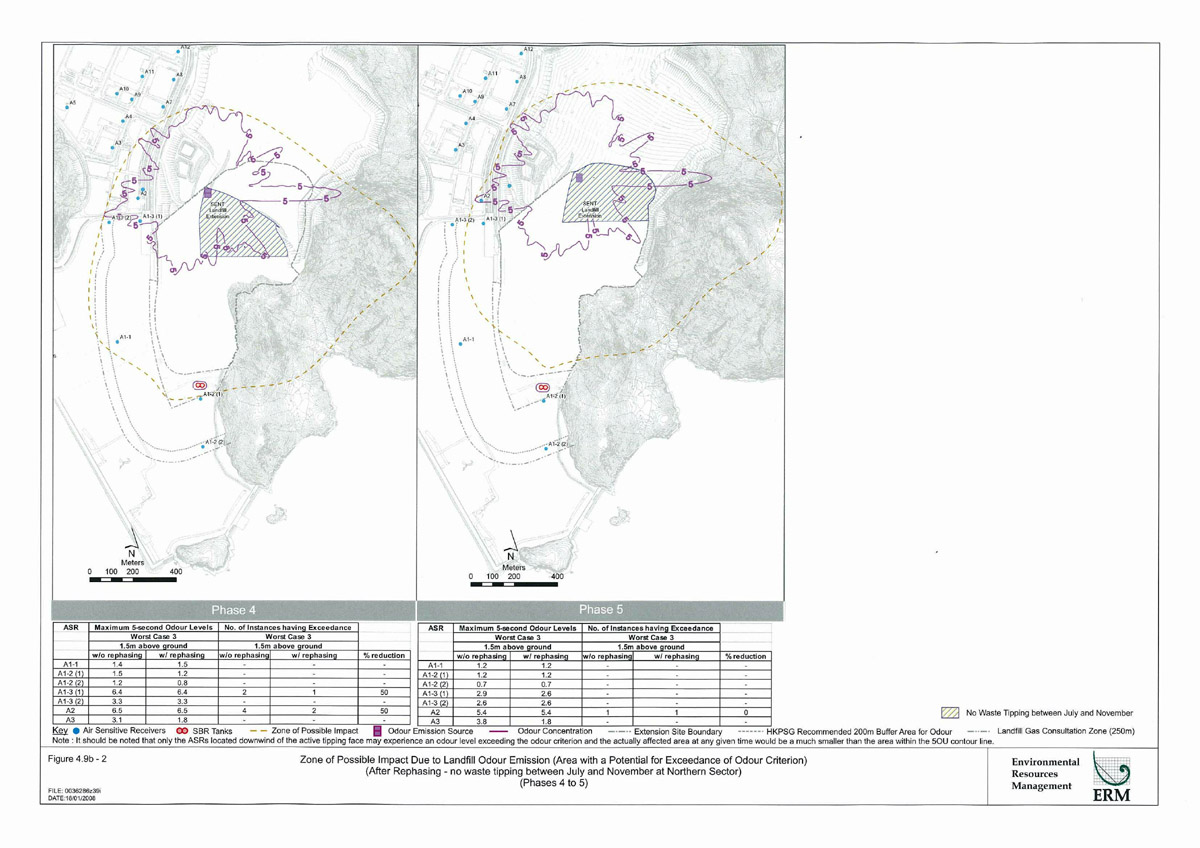
Figure 4.9b - 2
Zone of Possible Impact Due to Landfill Odour Emission (Area with a Potential for Exceedance of Odour Criterion) (After Rephasing - no waste tipping between July and November at Northern Sector) (Phases 4 to 5)
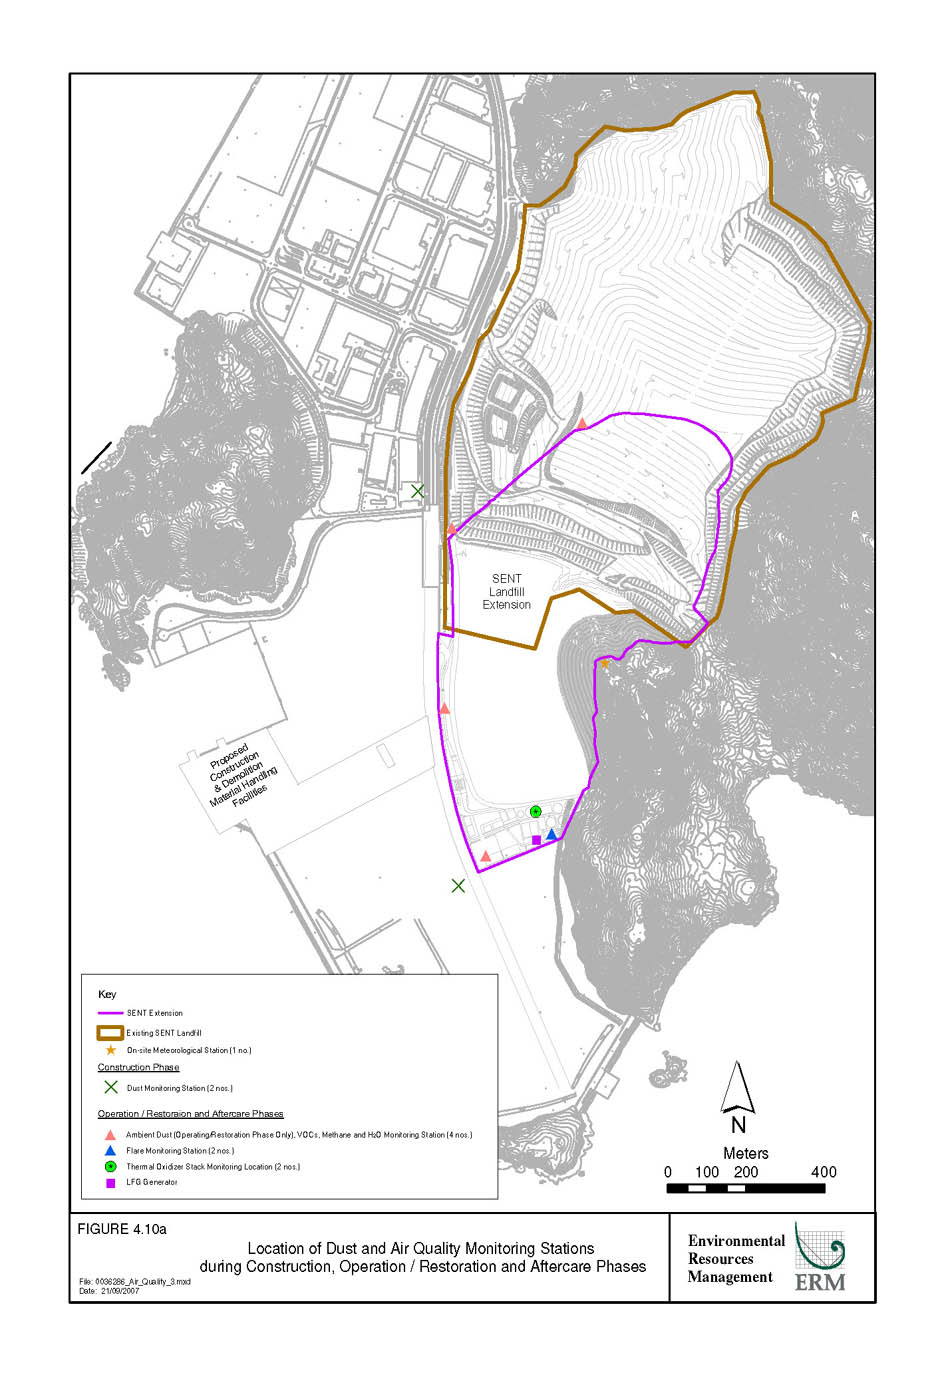
Figure 4.10a
Location of Dust and Ambient Air Quality Monitoring Stations during Construction, Operation/Restoration and Aftercare Phases
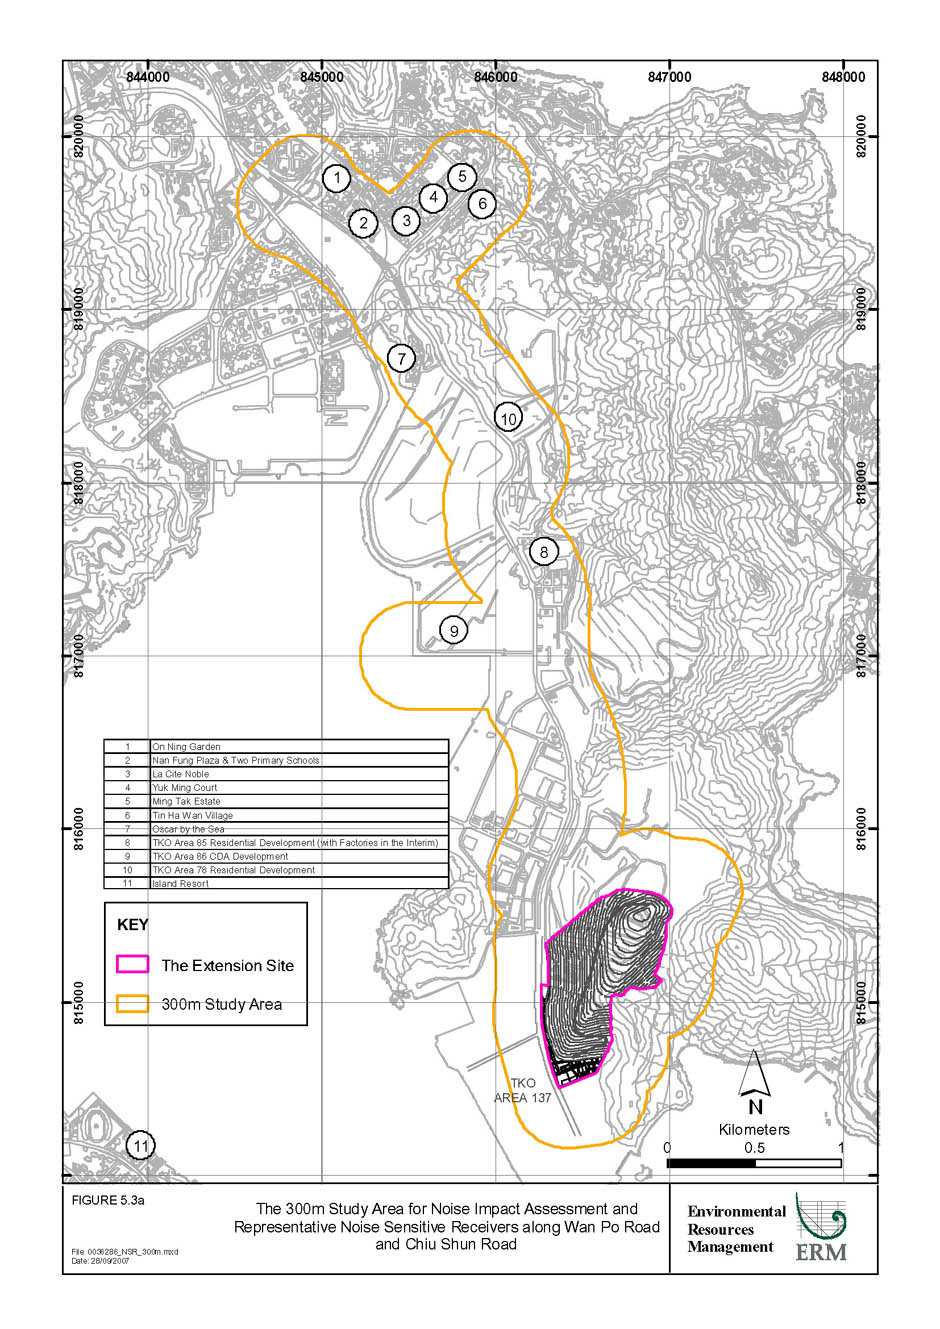
Figure 5.3a
The 300m Study Area for Noise Impact Assessment and Noise Sensitive Receivers along Wan Po Road and Chiu Shun Road
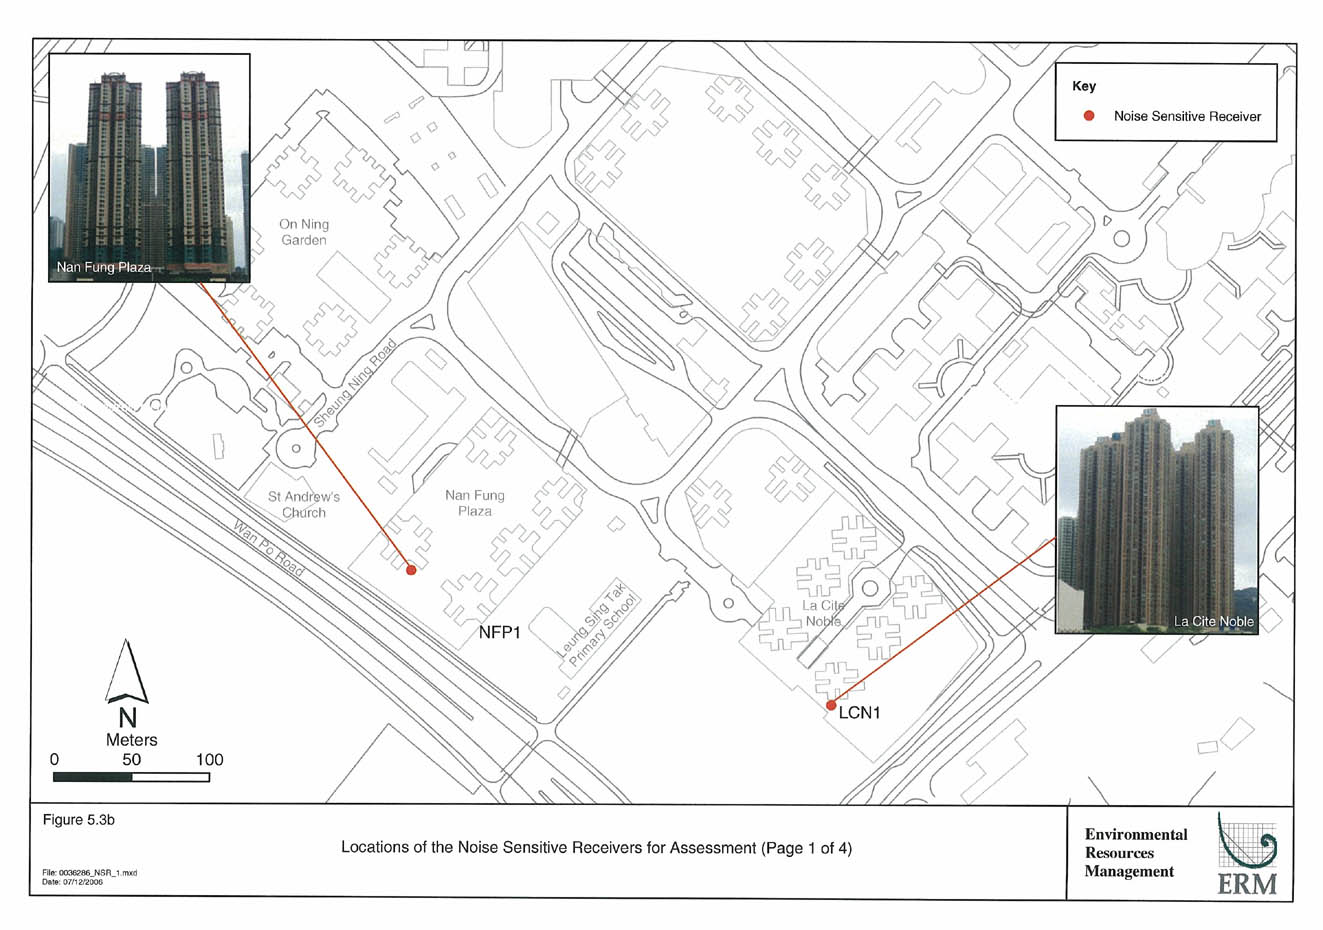
Figure 5.3b
Locations of the Noise Sensitive Receivers for Assessment (Page 1 of 4)
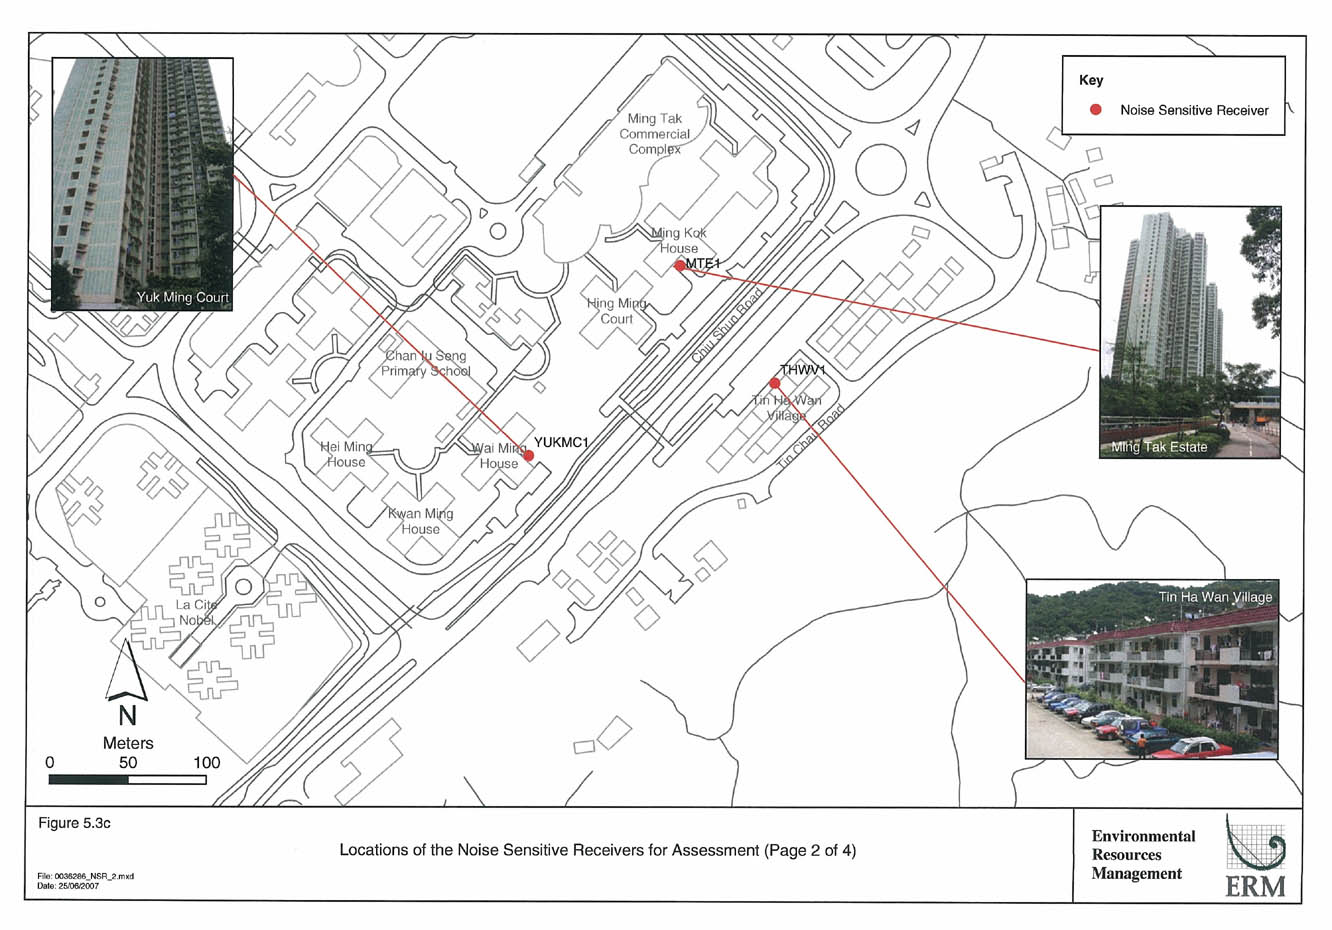
Figure 5.3c
Locations of the Noise Sensitive Receivers for Assessment (Page 2 of 4)
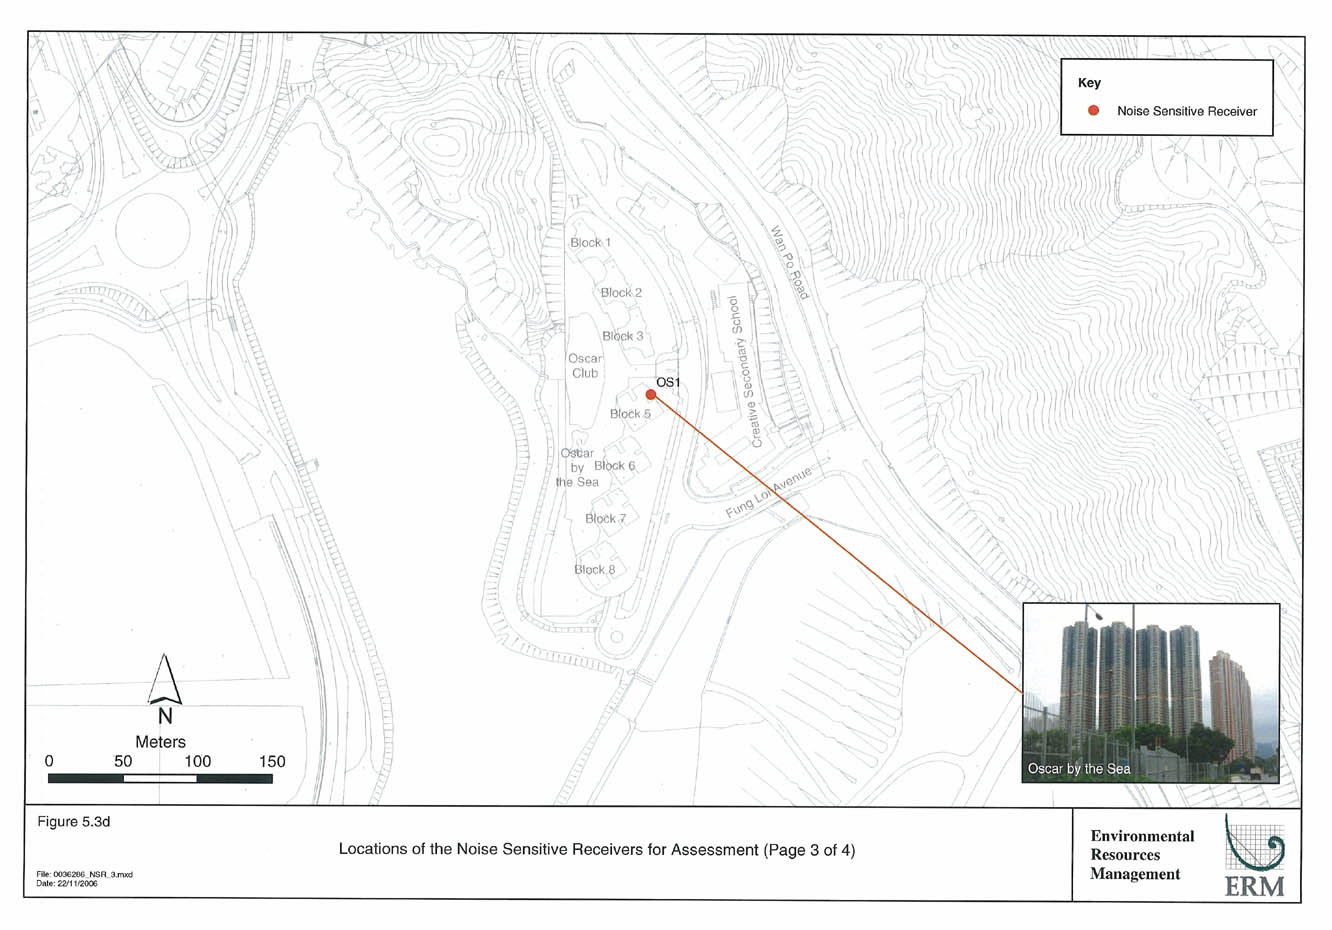
Figure 5.3d
Locations of the Noise Sensitive Receivers for Assessment (Page 3 of 4)
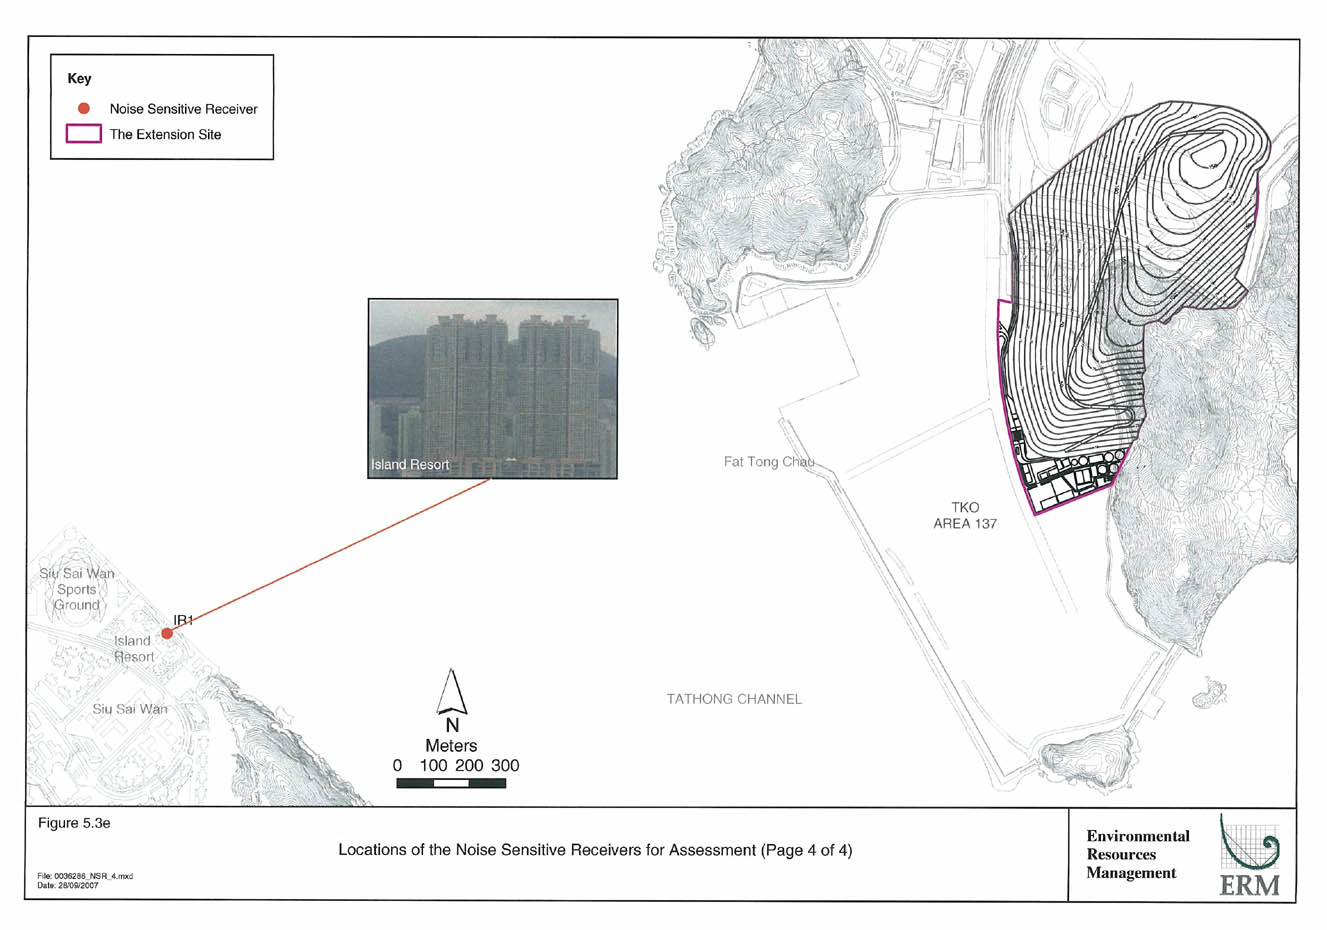
Figure 5.3e
Locations of the Noise Sensitive Receivers for Assessment (Page 4 of 4)
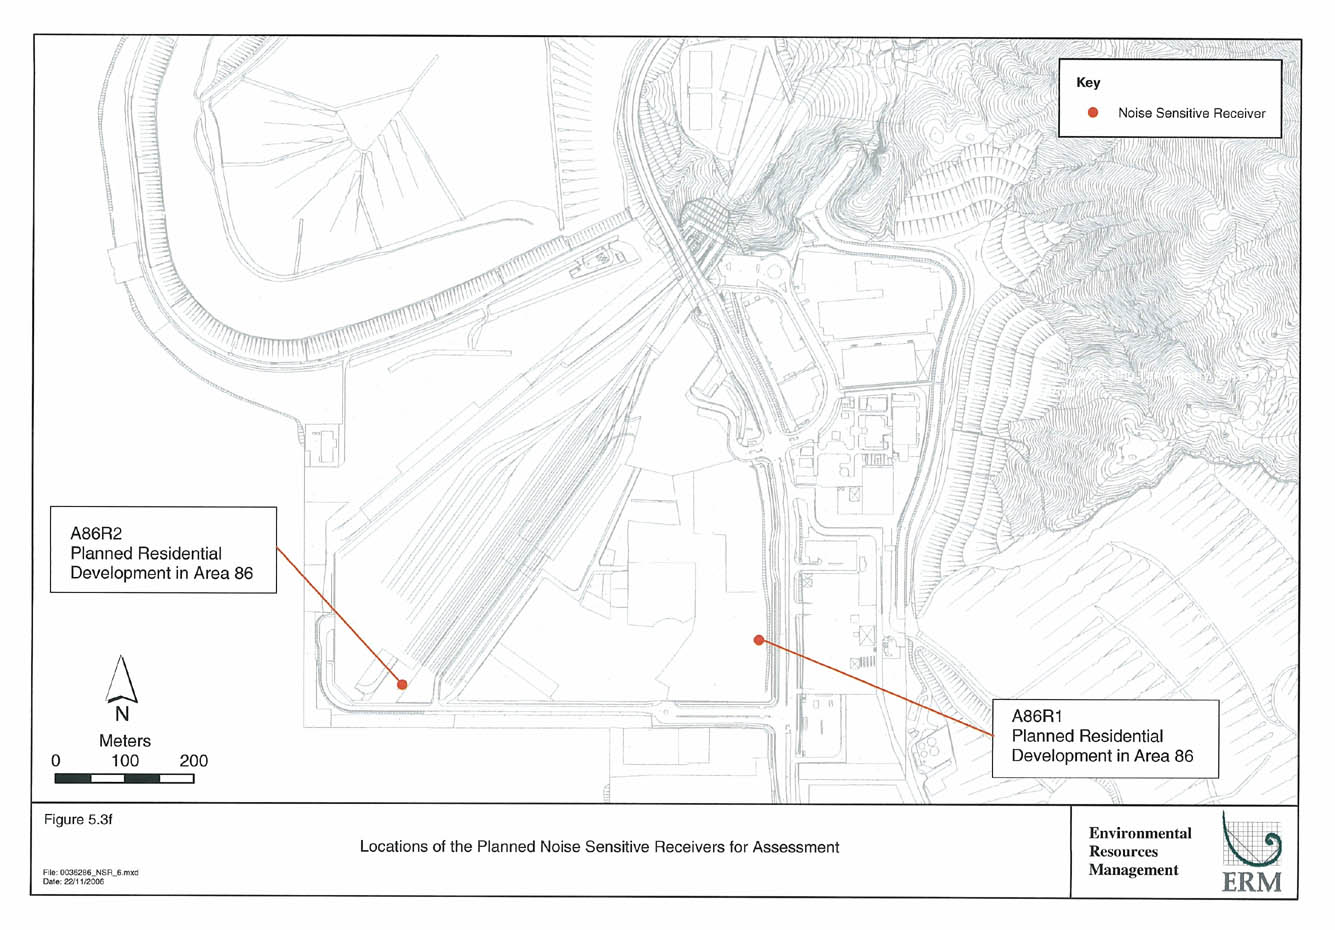
Figure 5.3f
Locations of the Planned Noise Sensitive Receivers for Assessment
Figure 5.3g
Proposed Infrastructure Area of the Extension
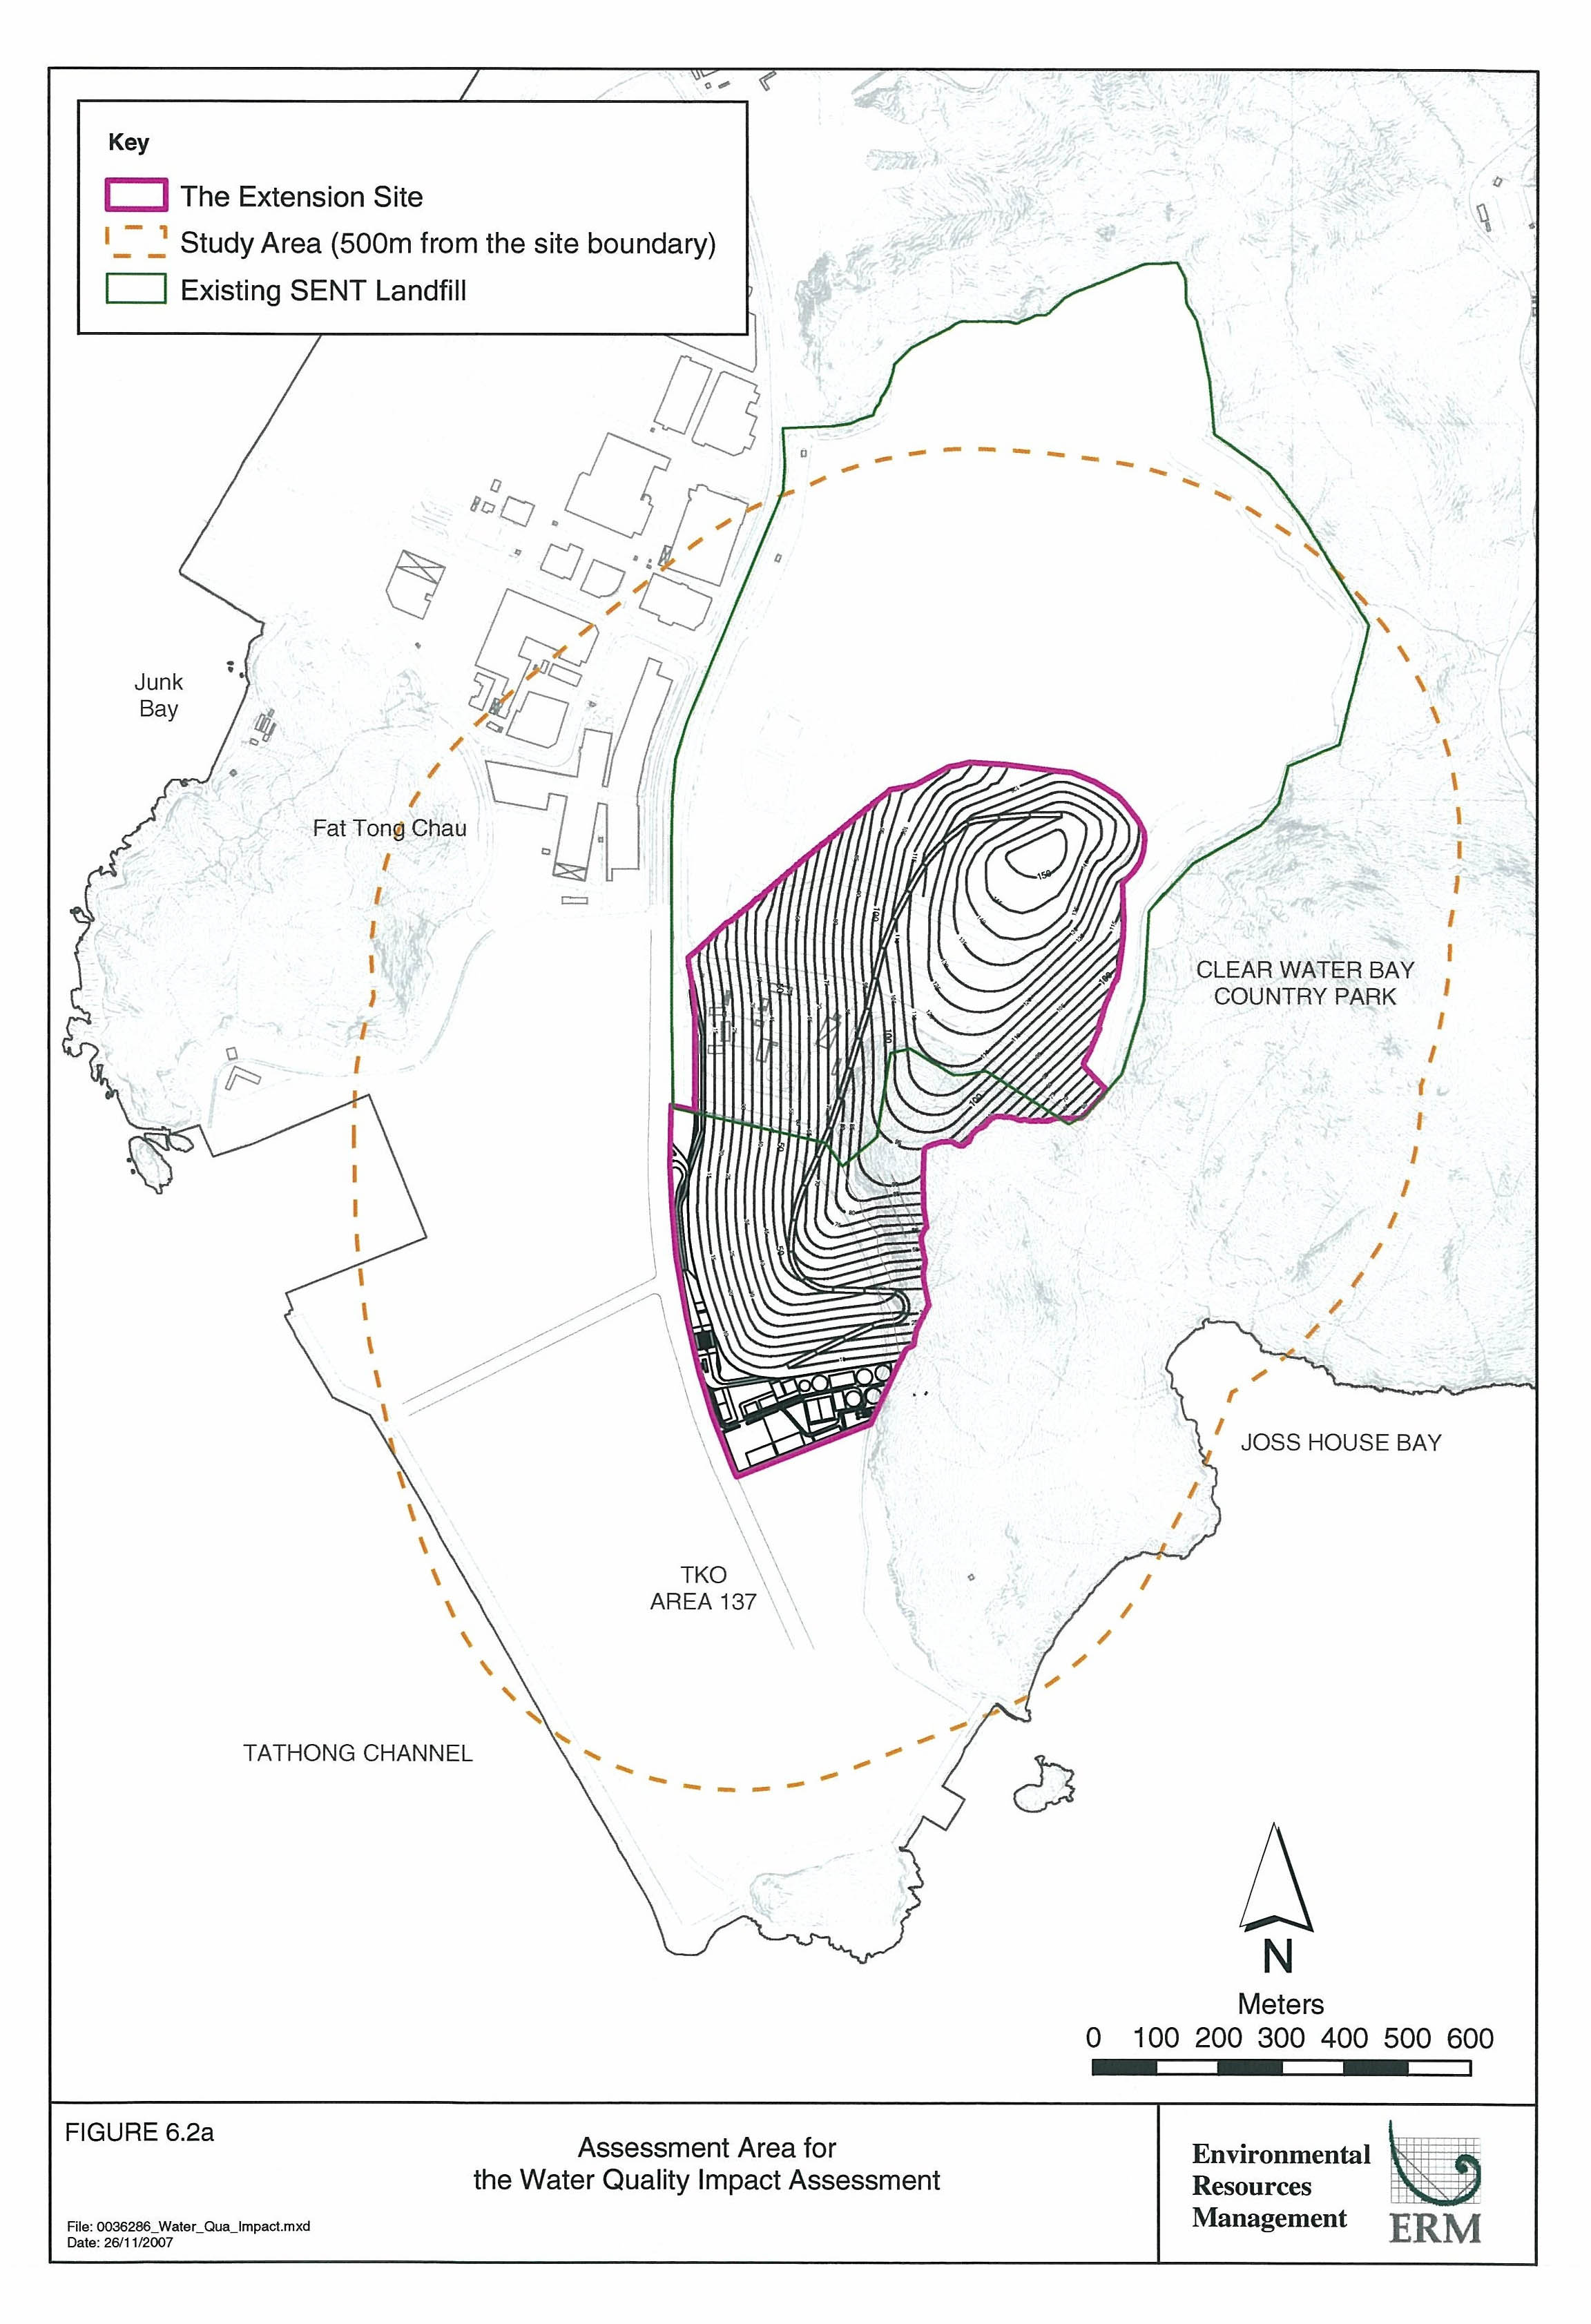
Figure 6.2a
Assessment Area for the Water Quality Impact Assessment
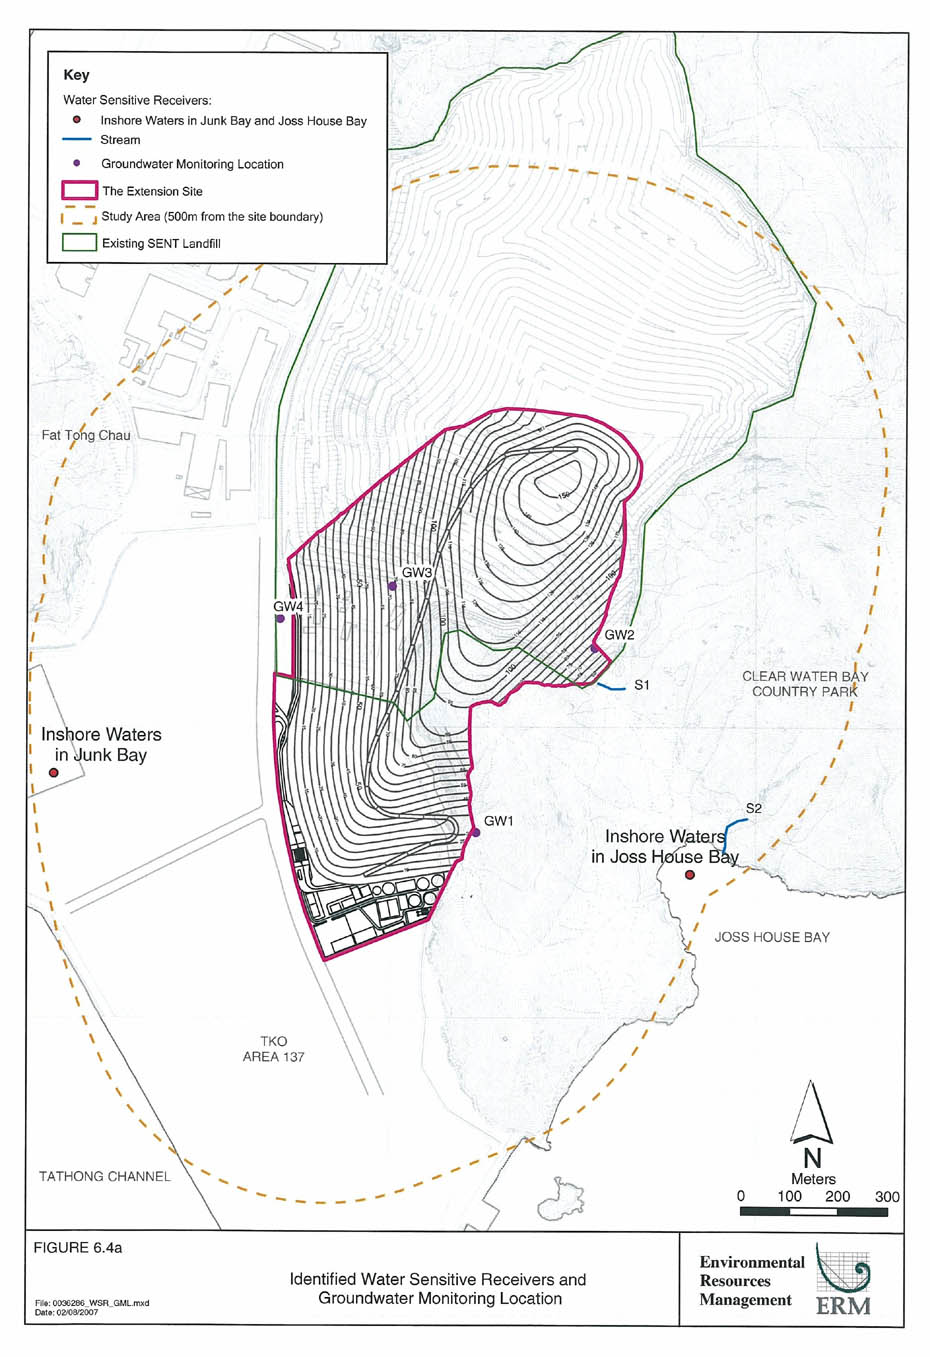
Figure 6.4a
Identified Water Sensitive Receivers and Groundwater Monitoring Location
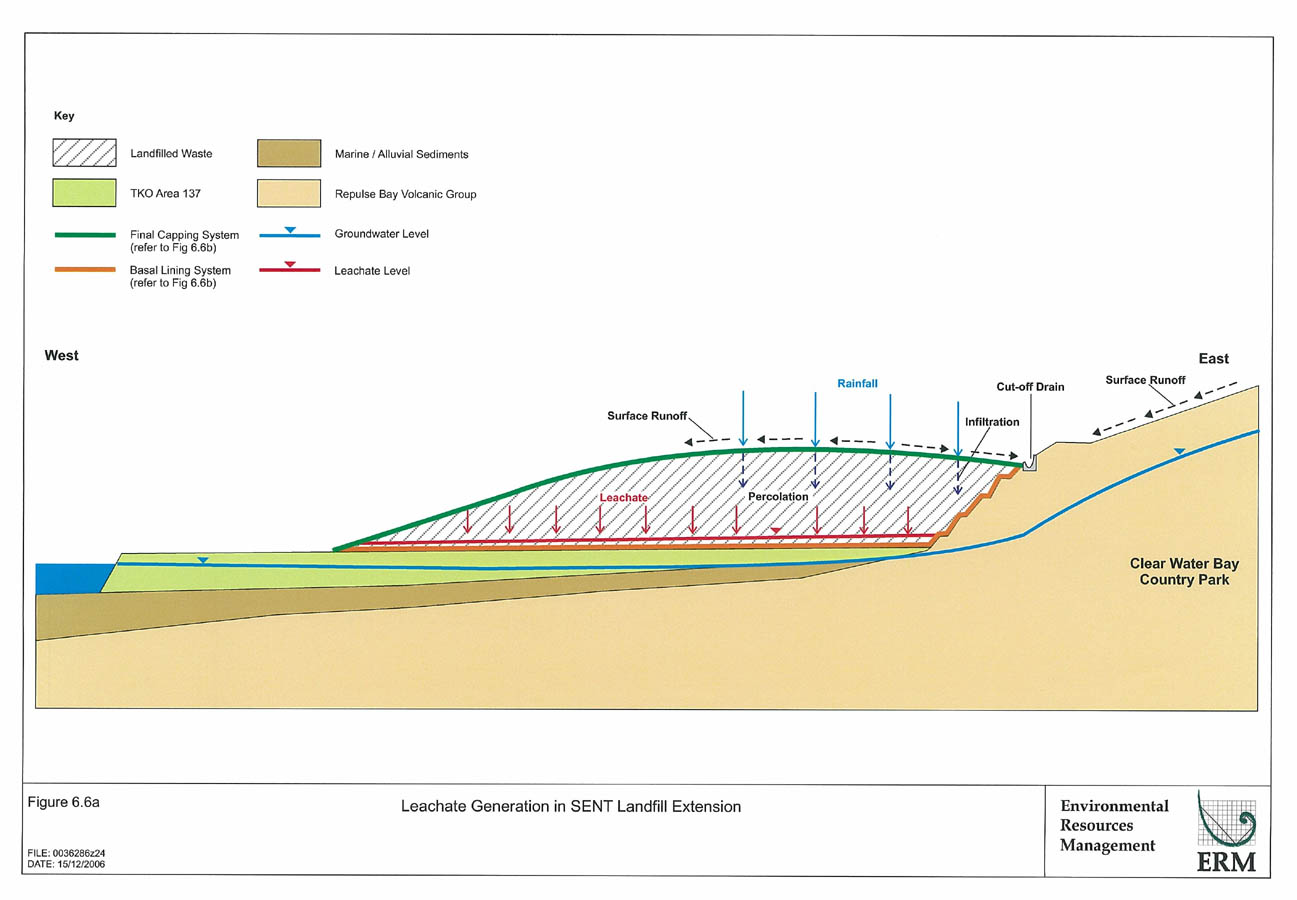
Figure 6.6a
Leachate Generation in SENT Landfill Extension
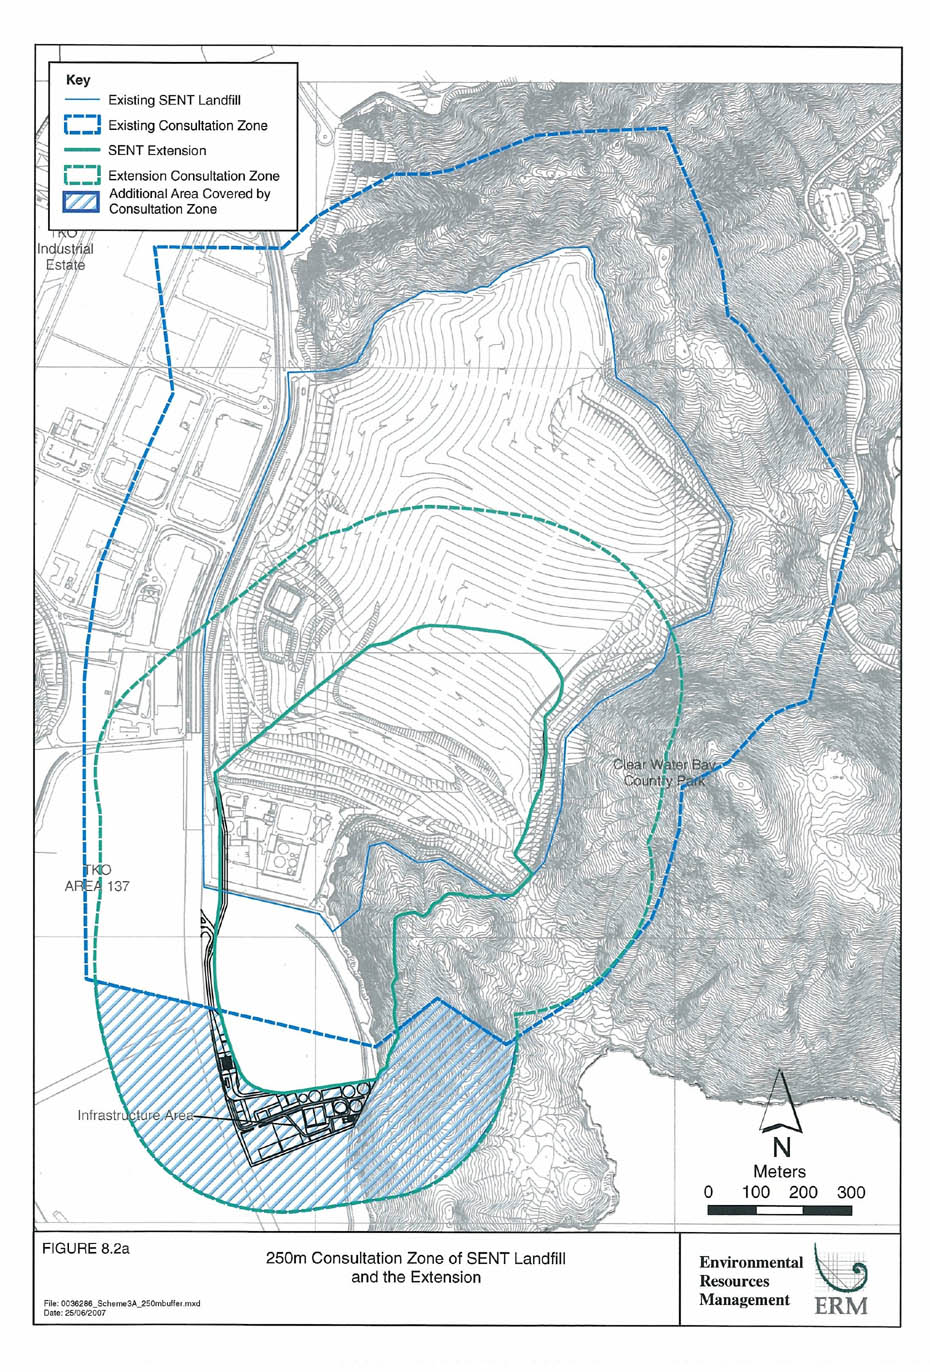
Figure 8.2a
250m Consultation Zone of SENT Landfill and the Extension
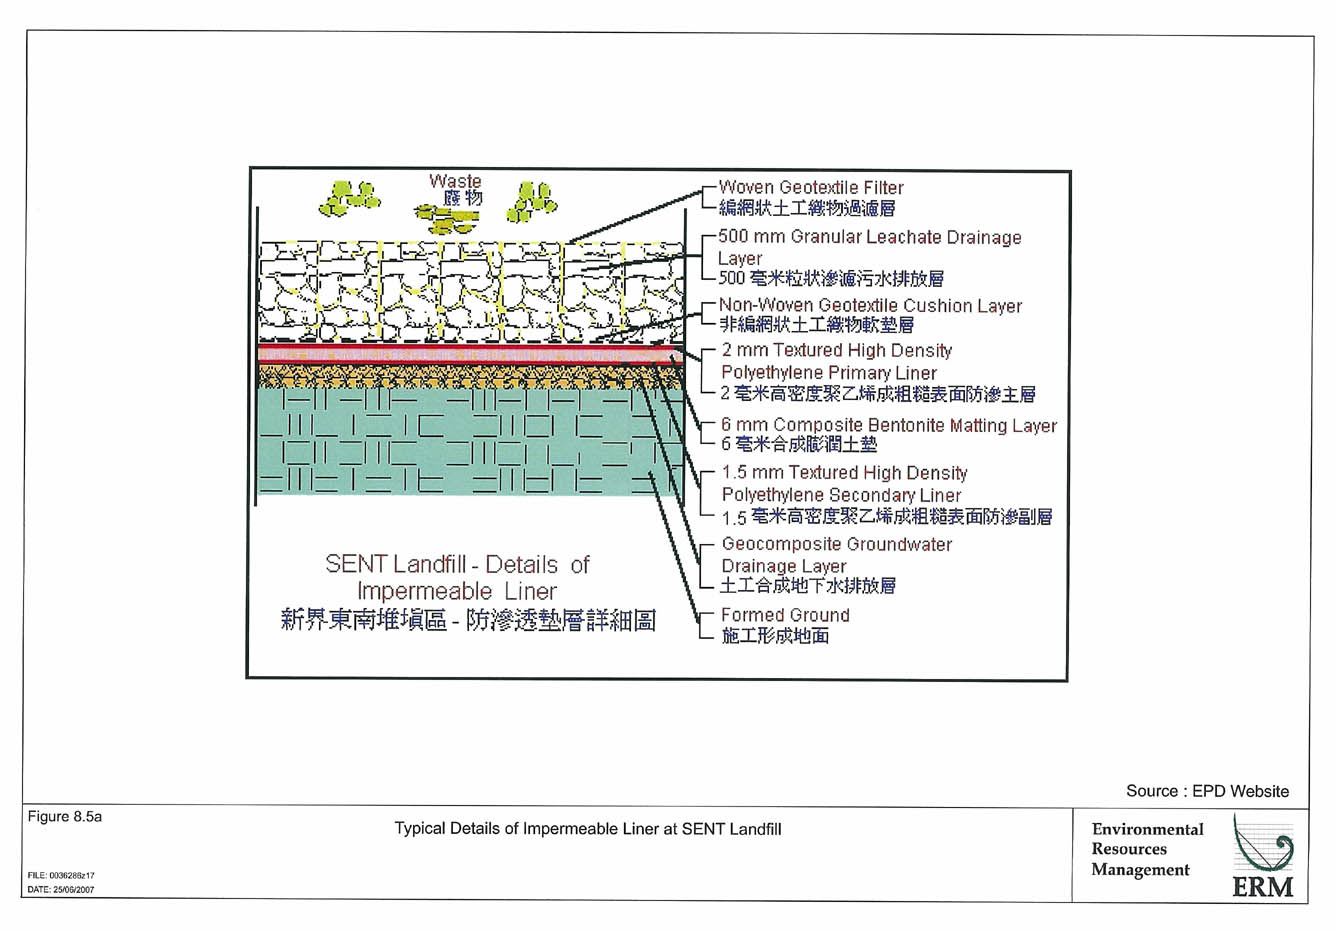
Figure 8.5a
Typical Details of Impermeable Liner at SENT Landfill
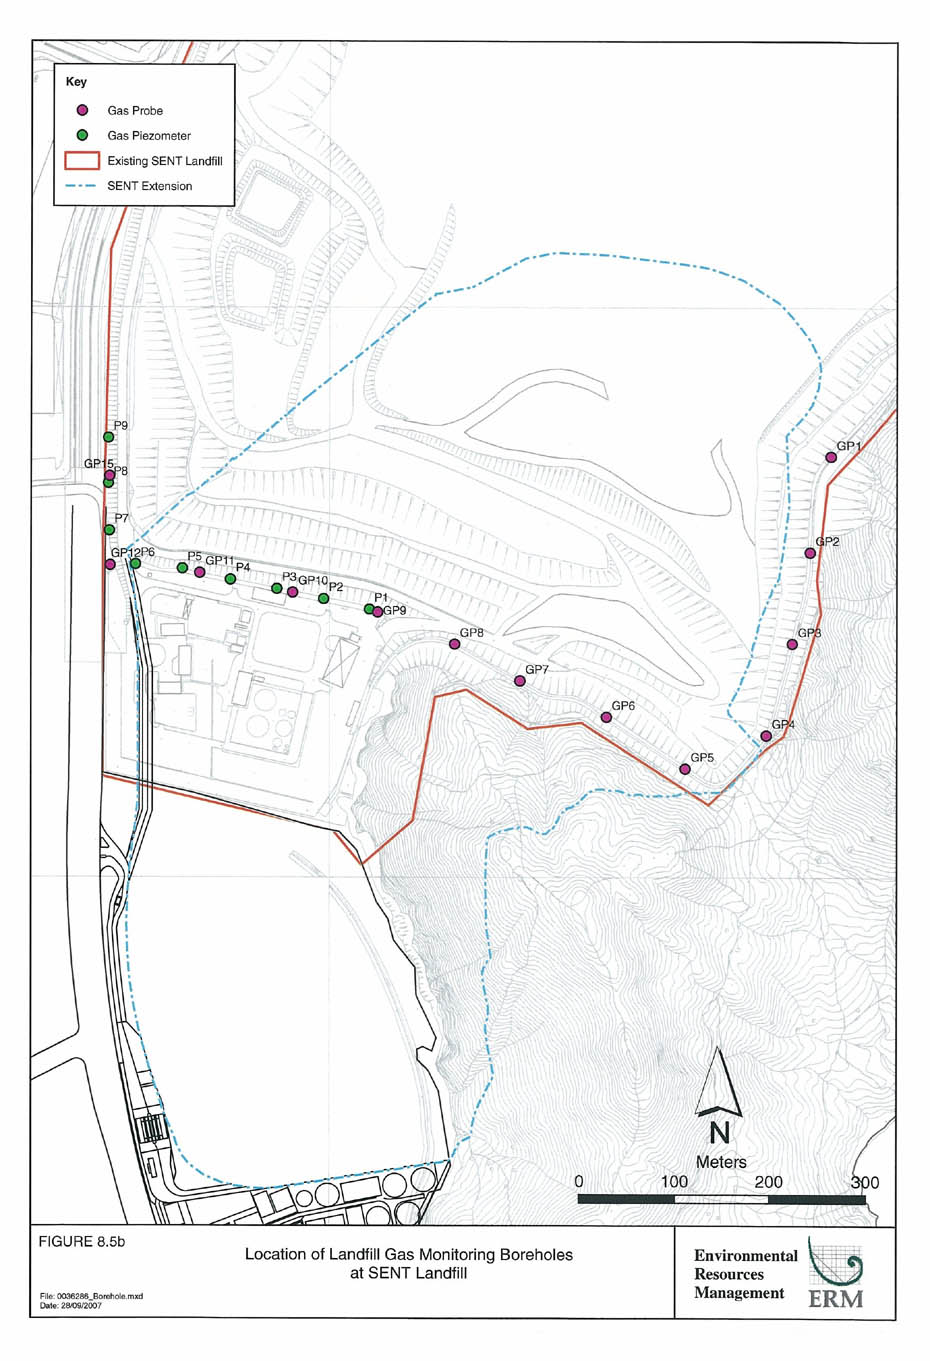
Figure 8.5b
Location of Landfill Gas Monitoring Boreholes at SENT Landfill
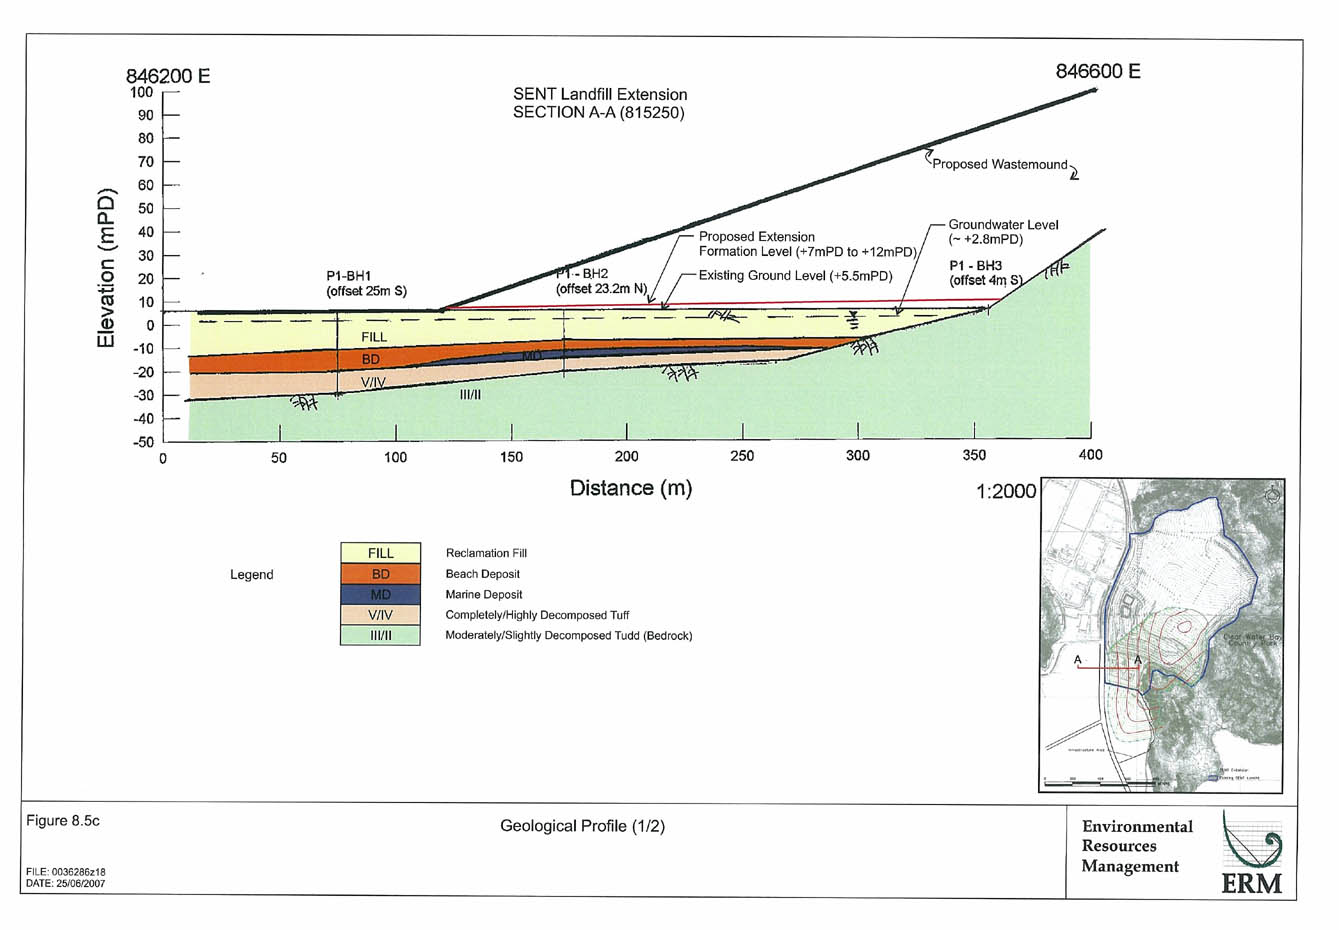
Figure 8.5c
Geological Profile (1/2)
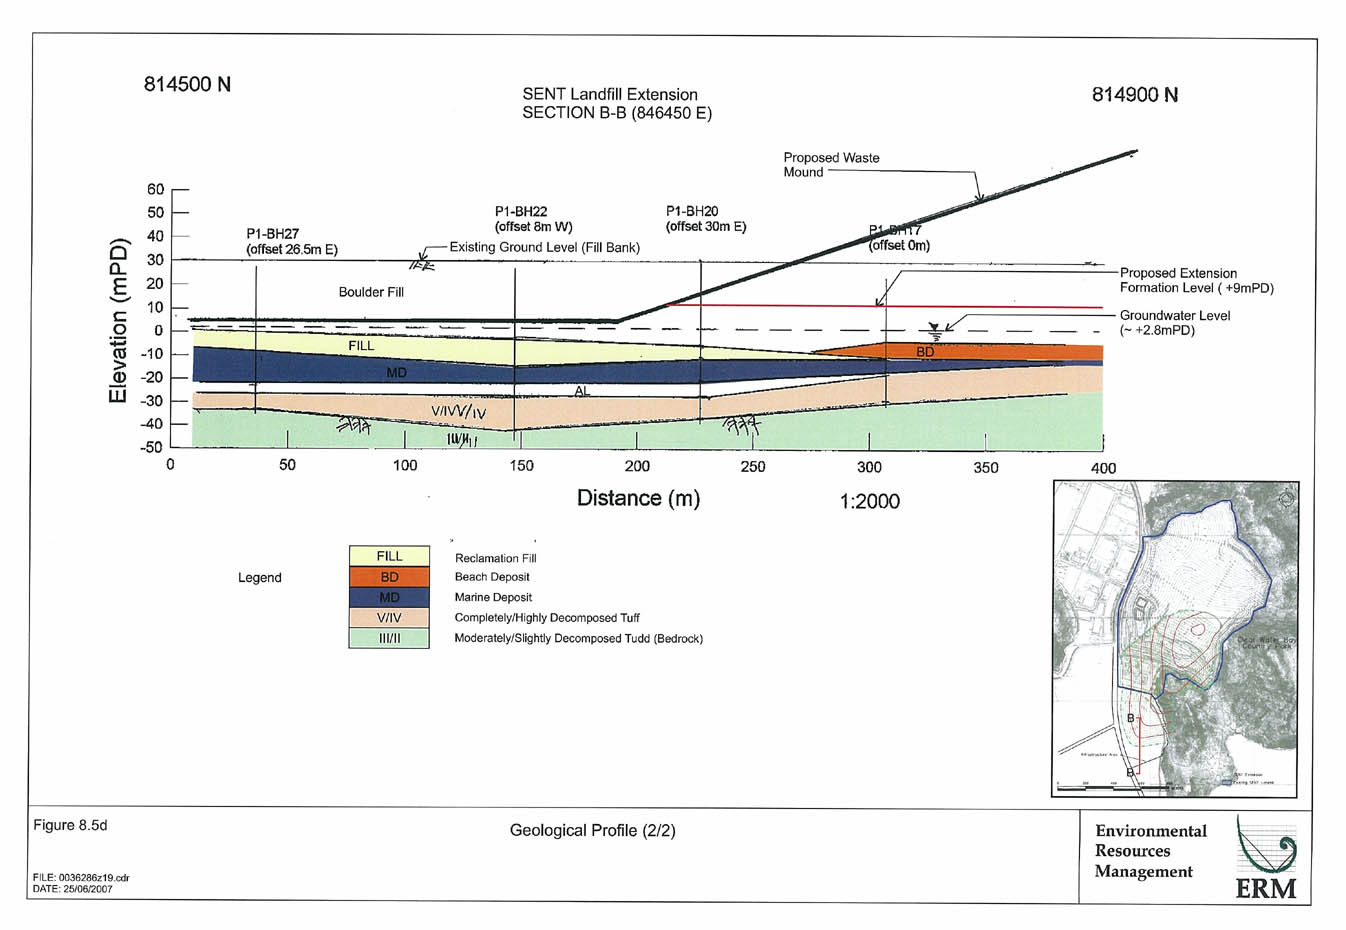
Figure 8.5d
Geological Profile (2/2)
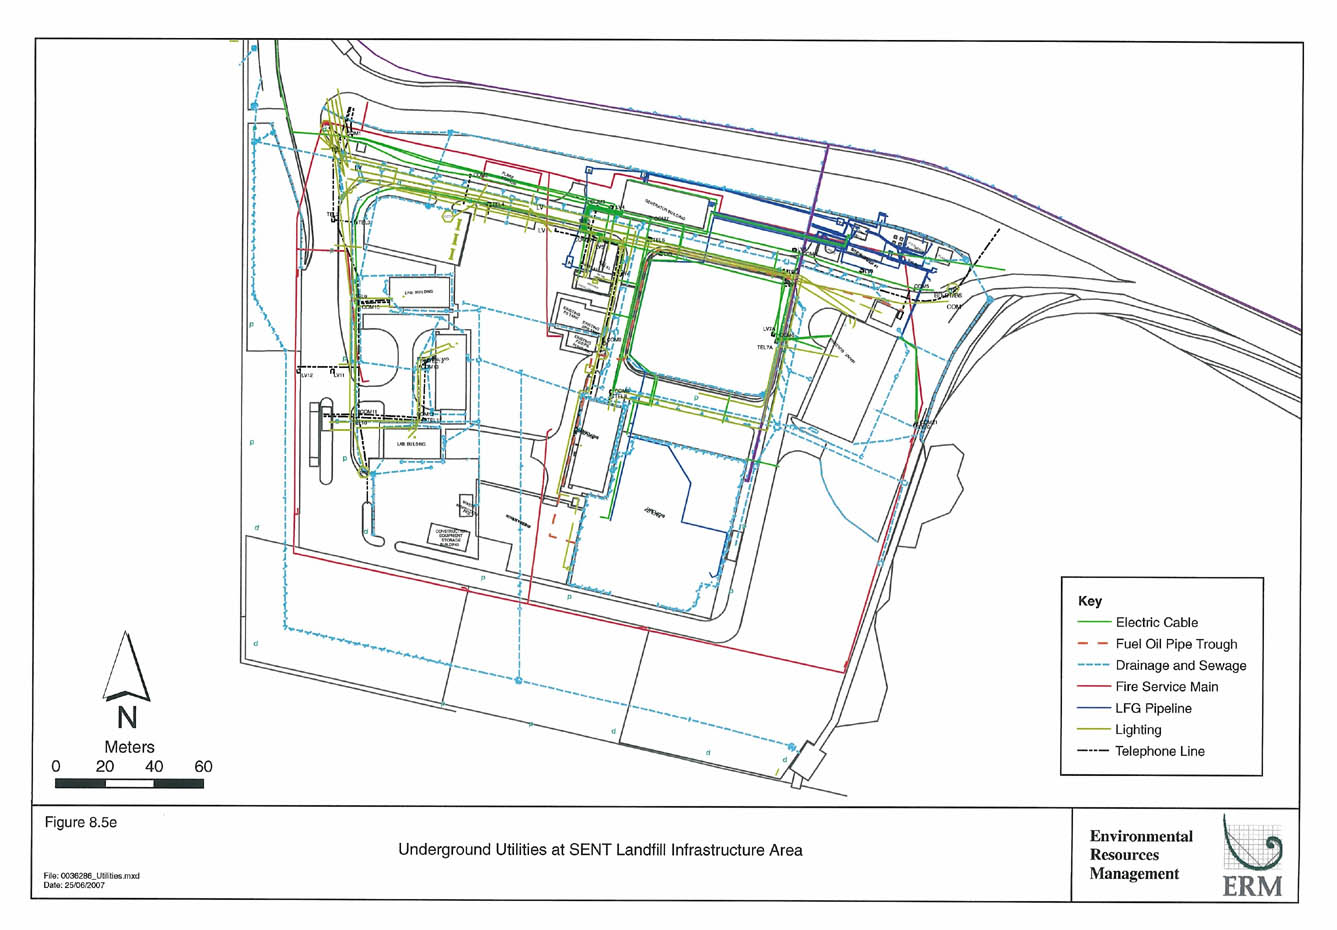
Figure 8.5e
Underground Utilities at SENT Landfill Infrastructure Area
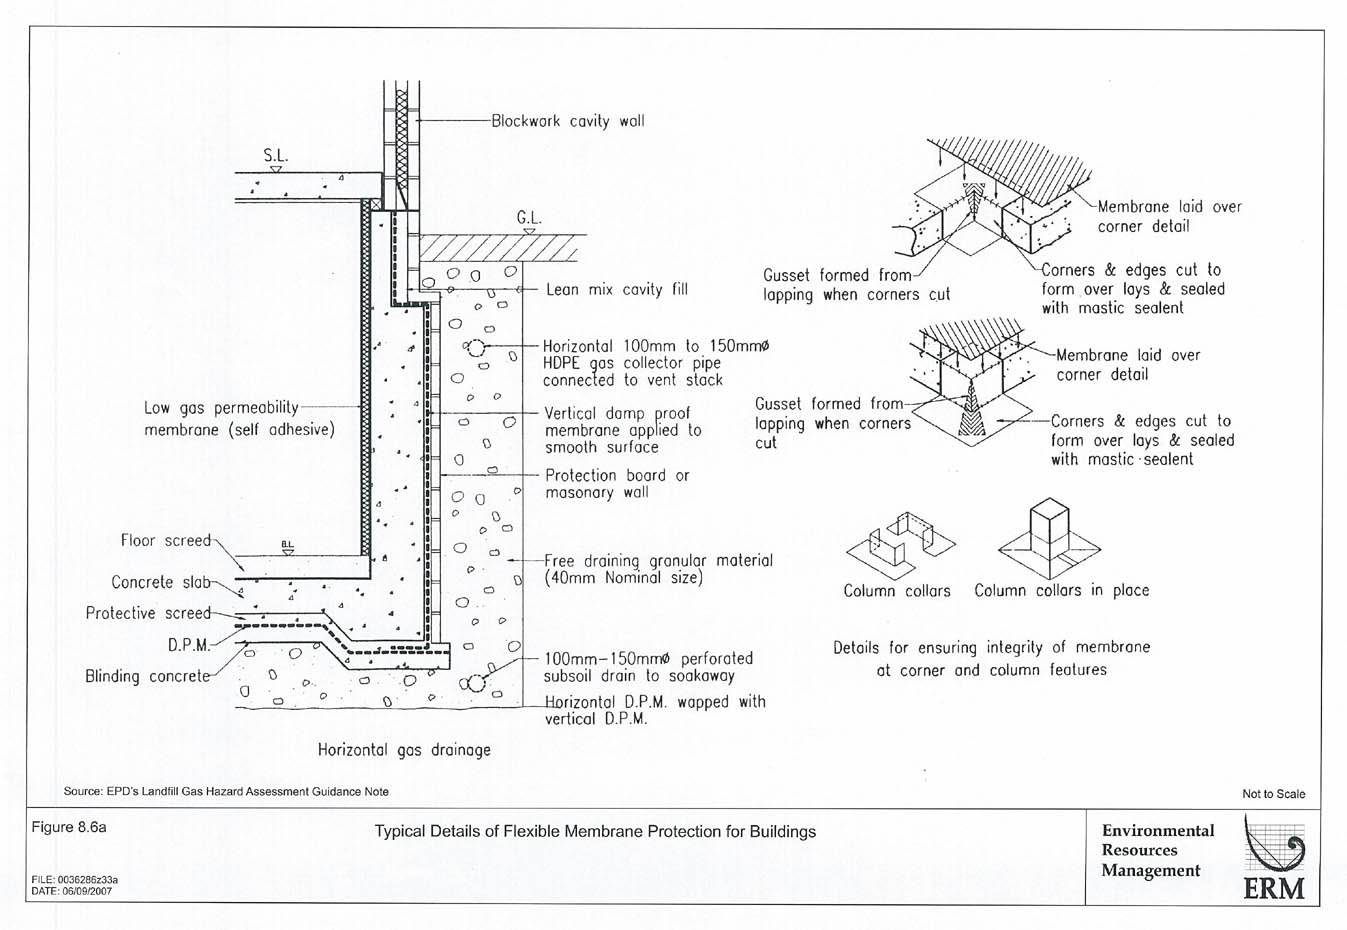
Figure 8.6a
Typical Details of Flexible Membrane Protection for Buildings
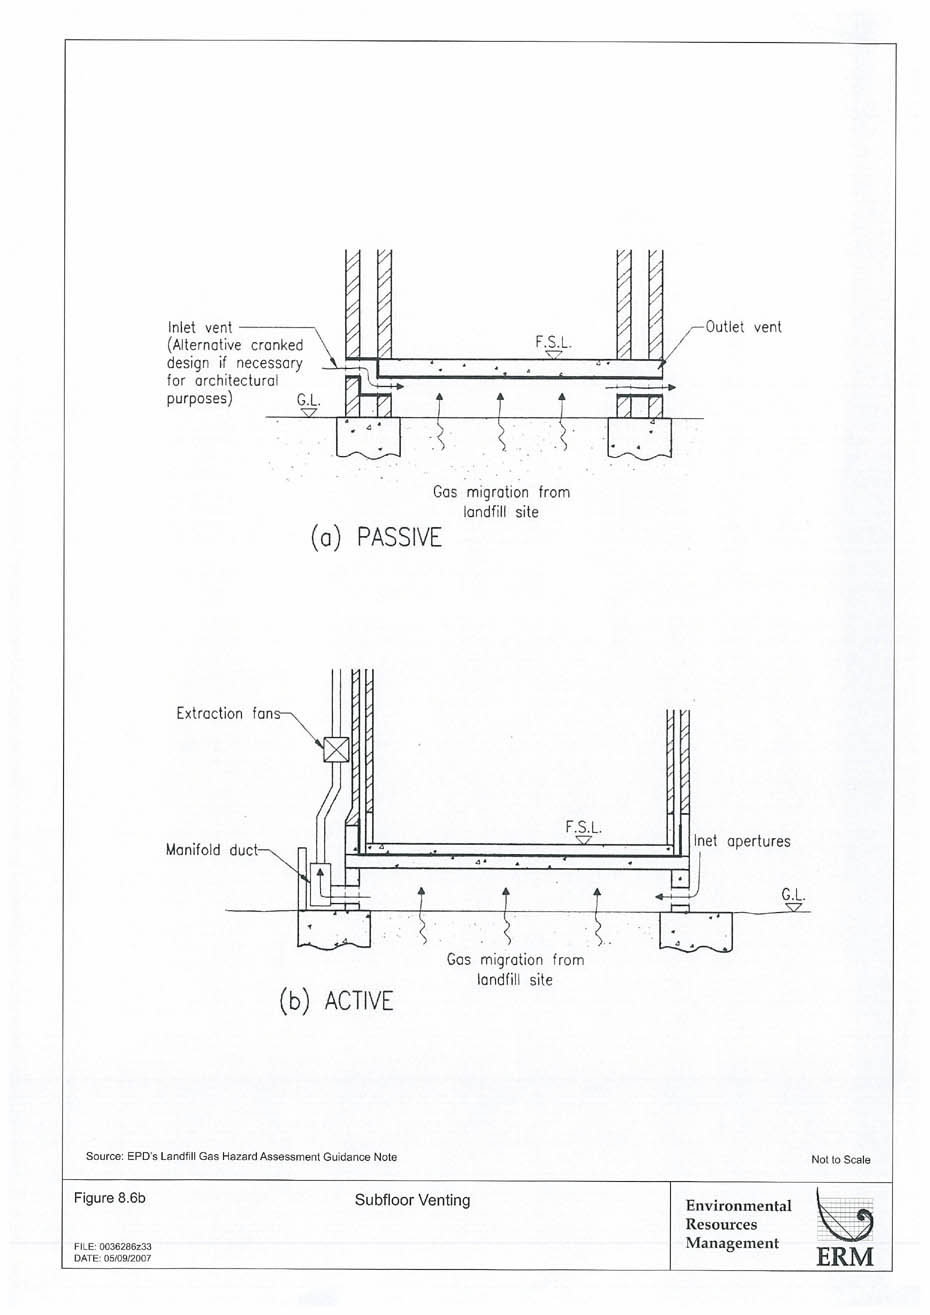
Figure 8.6b
Subfloor Venting
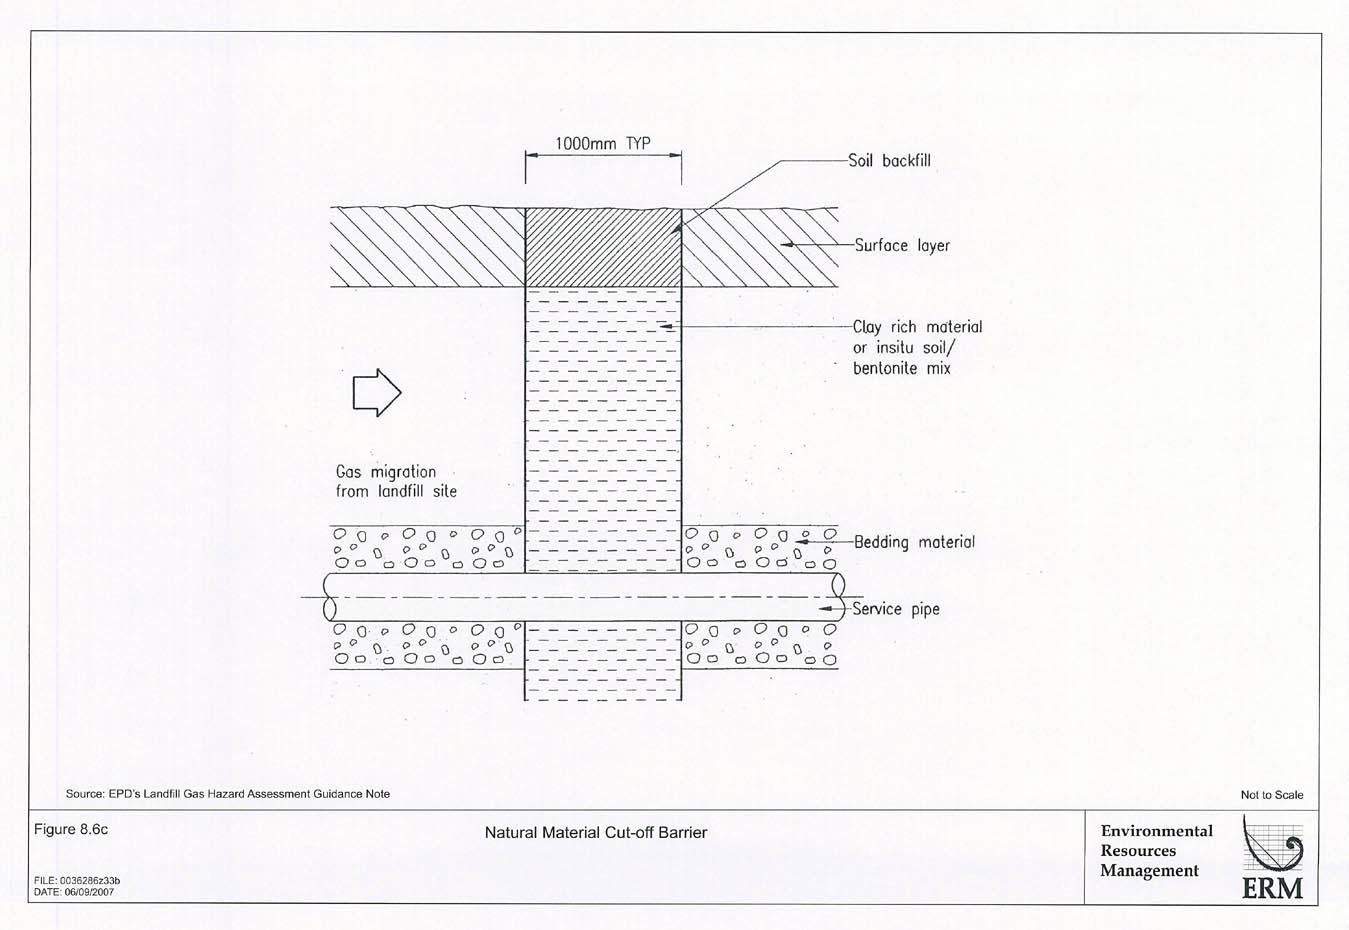
Figure 8.6c
Natural Material Cut-off Barrier
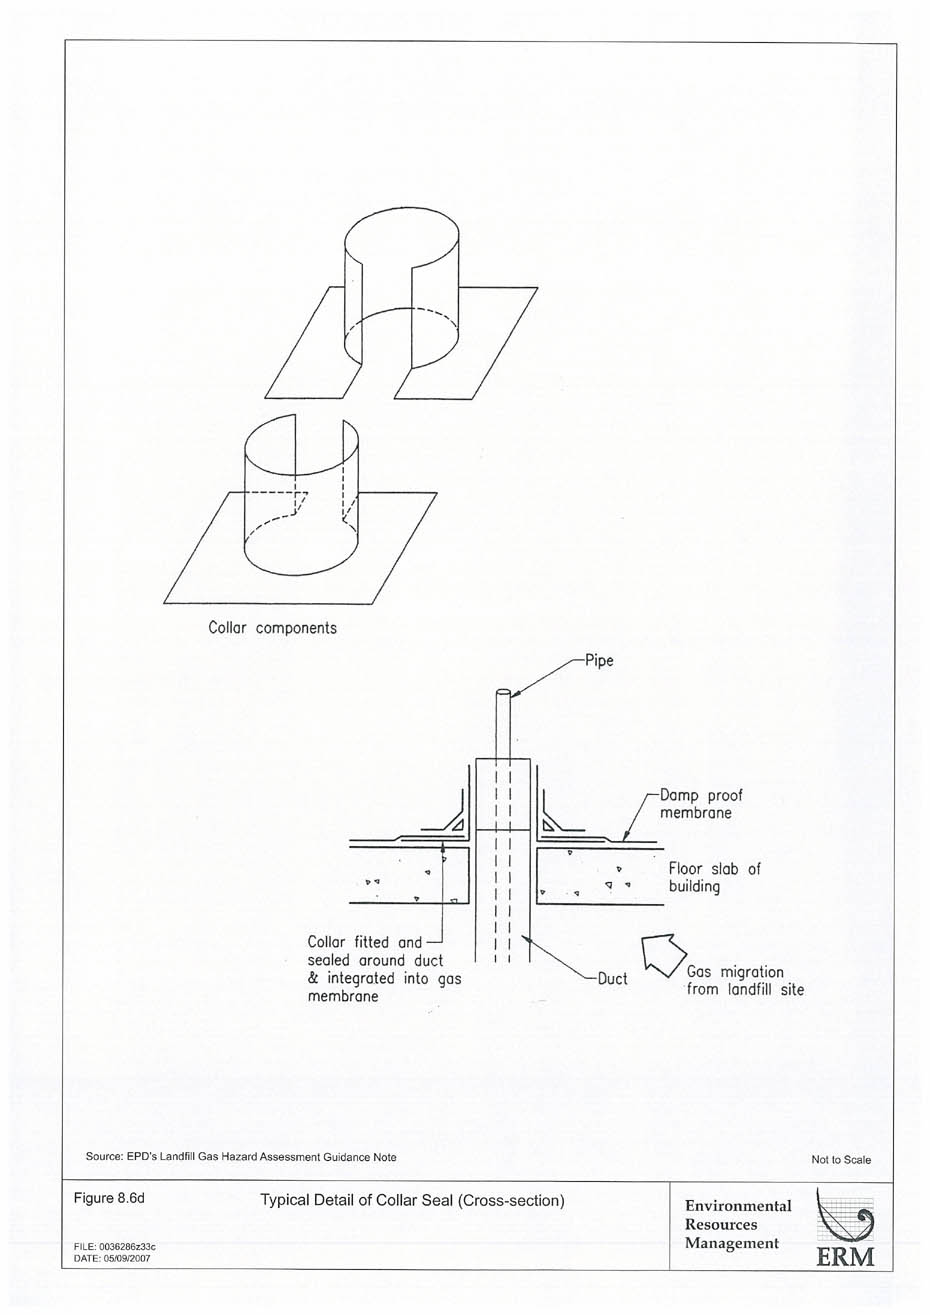
Figure 8.6d
Typical Detail of Collar Seal (Cross-section)
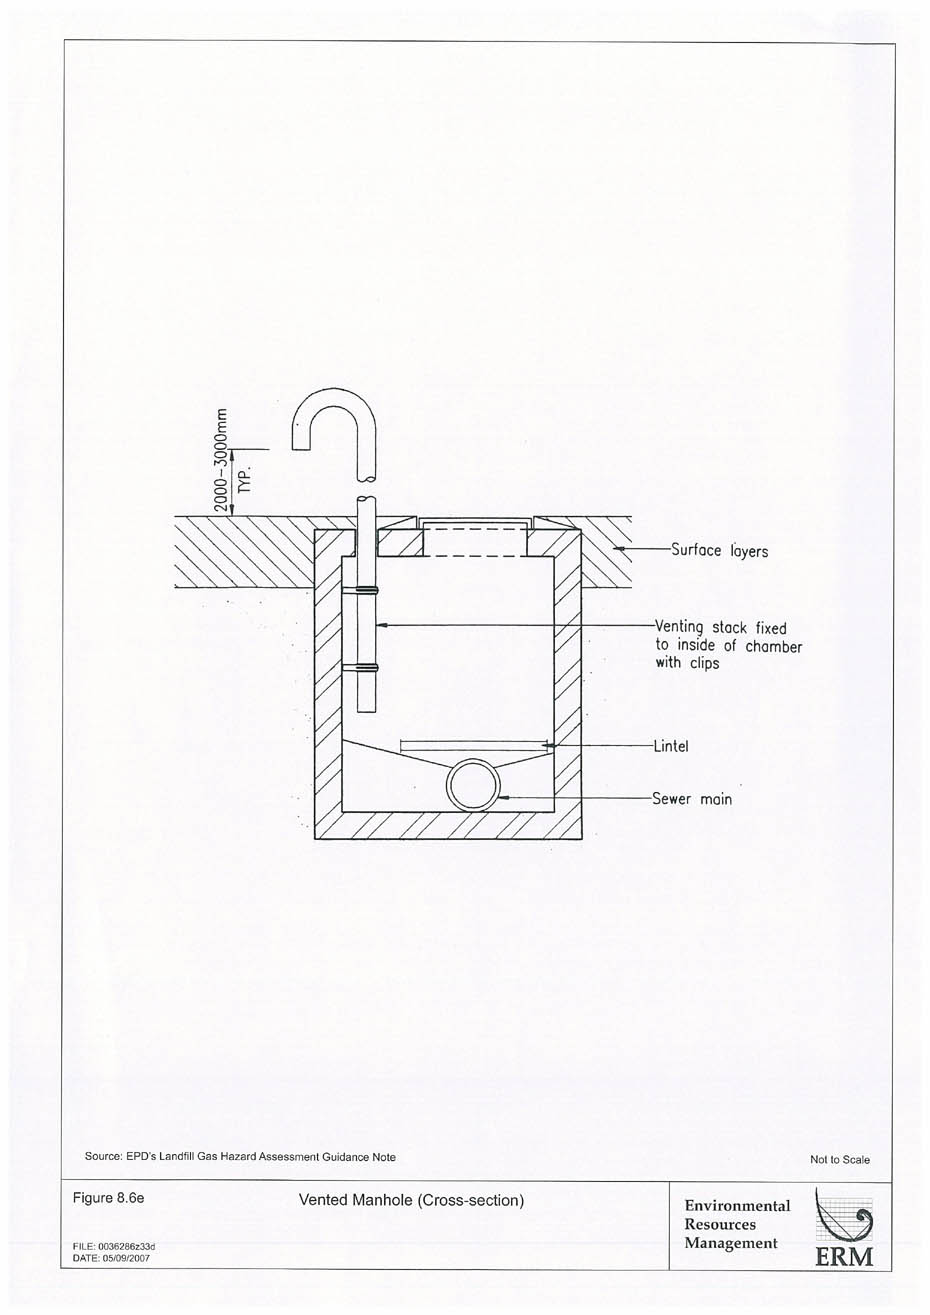
Figure 8.6e
Vented Manhole (Cross-section)
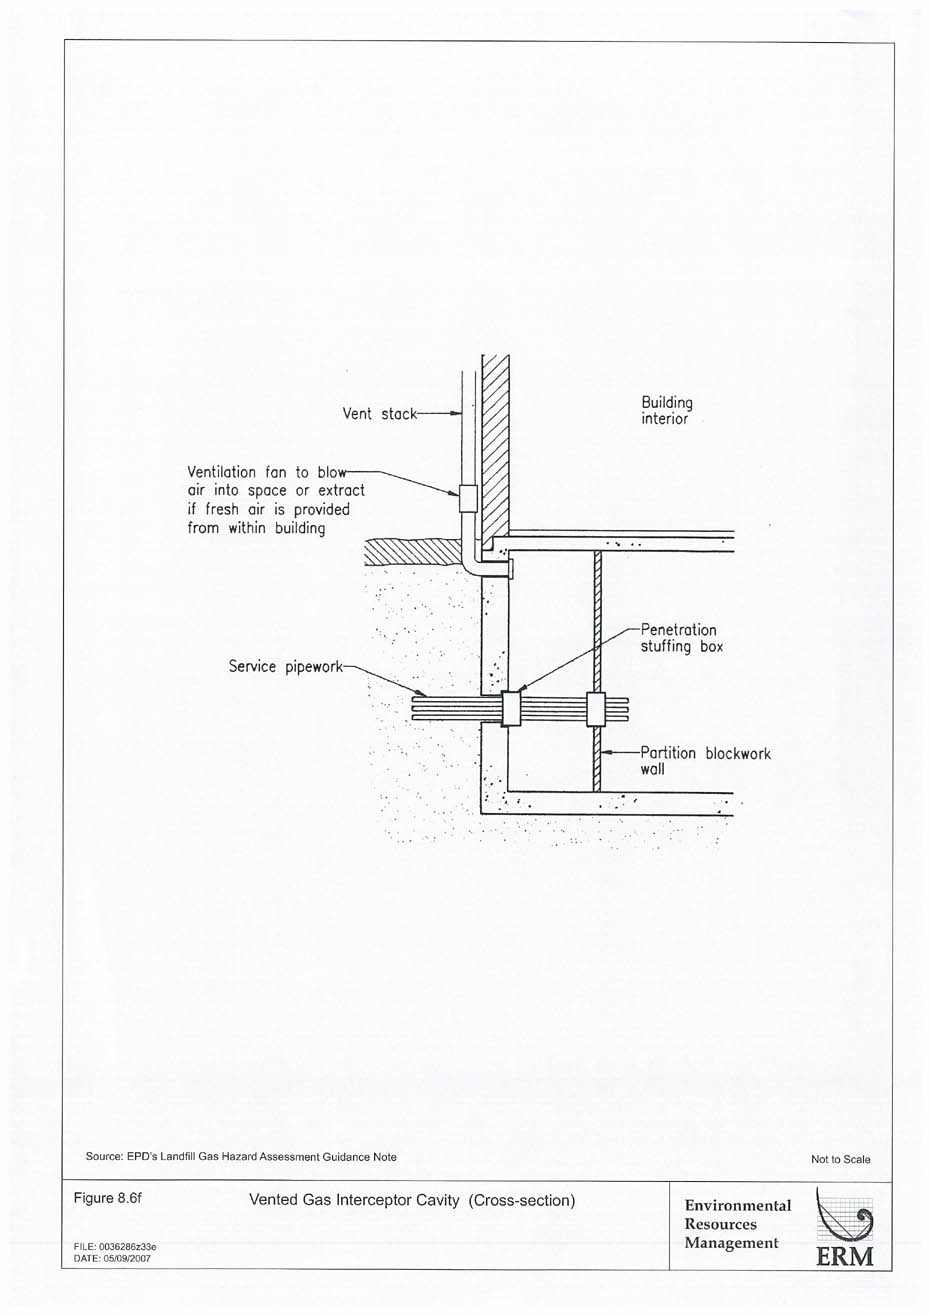
Figure 8.6f
Vented Gas Interceptor Cavity (Cross-section)
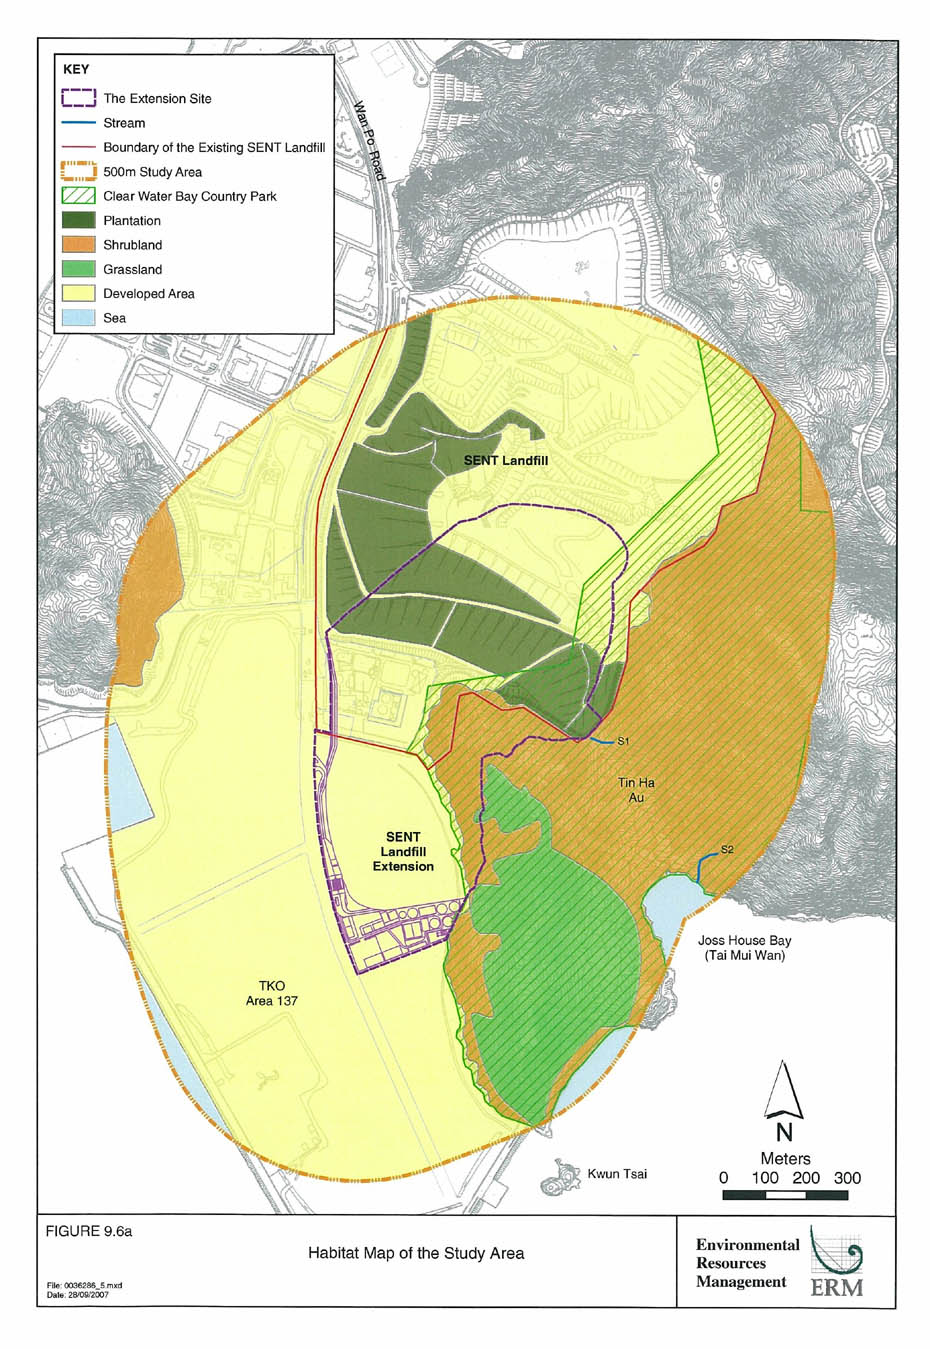
Figure 9.6a
Habitat Map of the Study Area
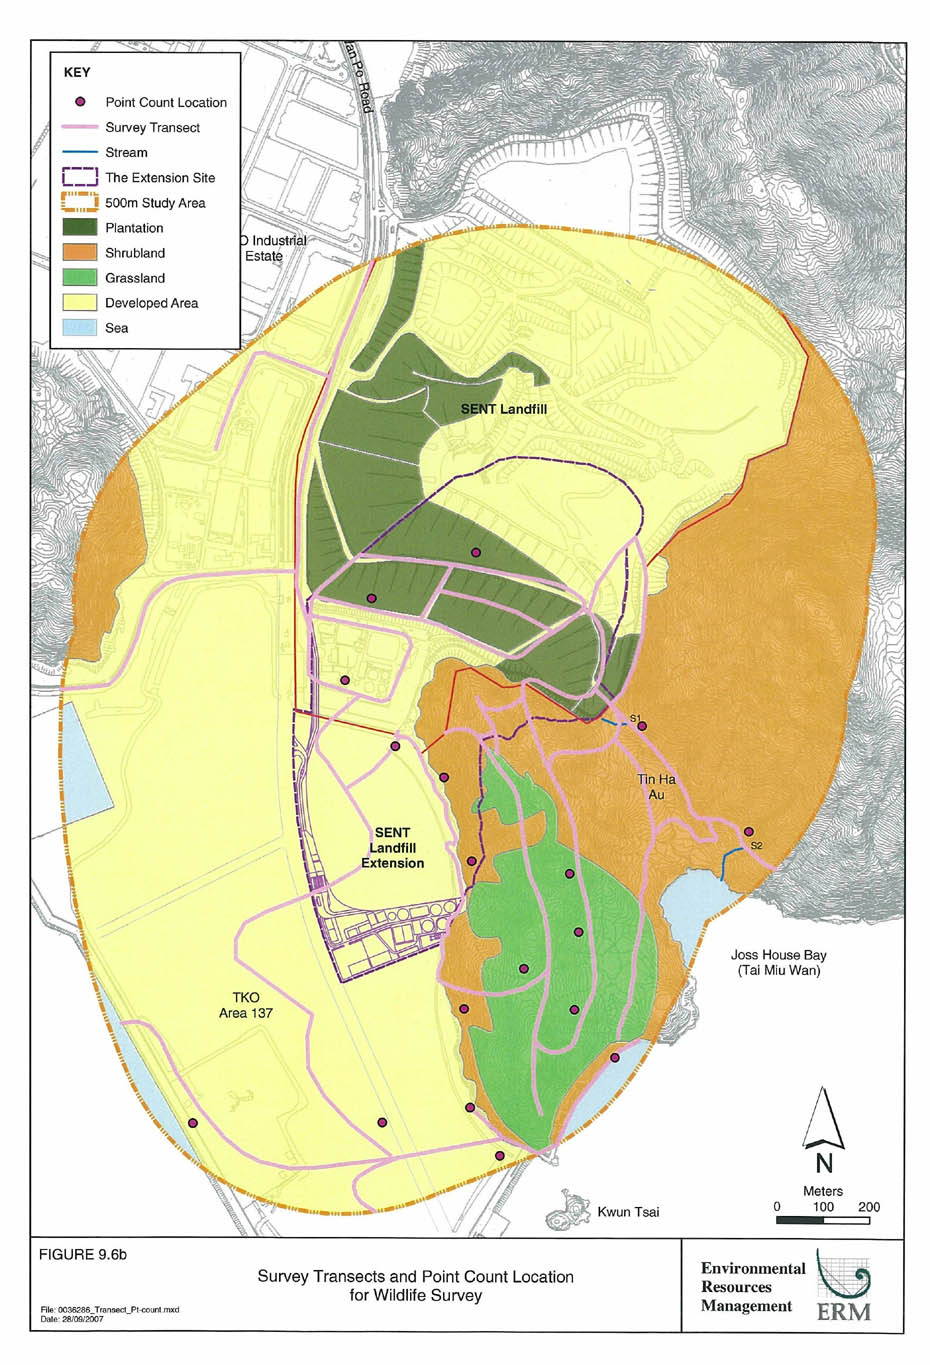
Figure 9.6b
Survey Transects and Point Count Location for Wildlife Survey
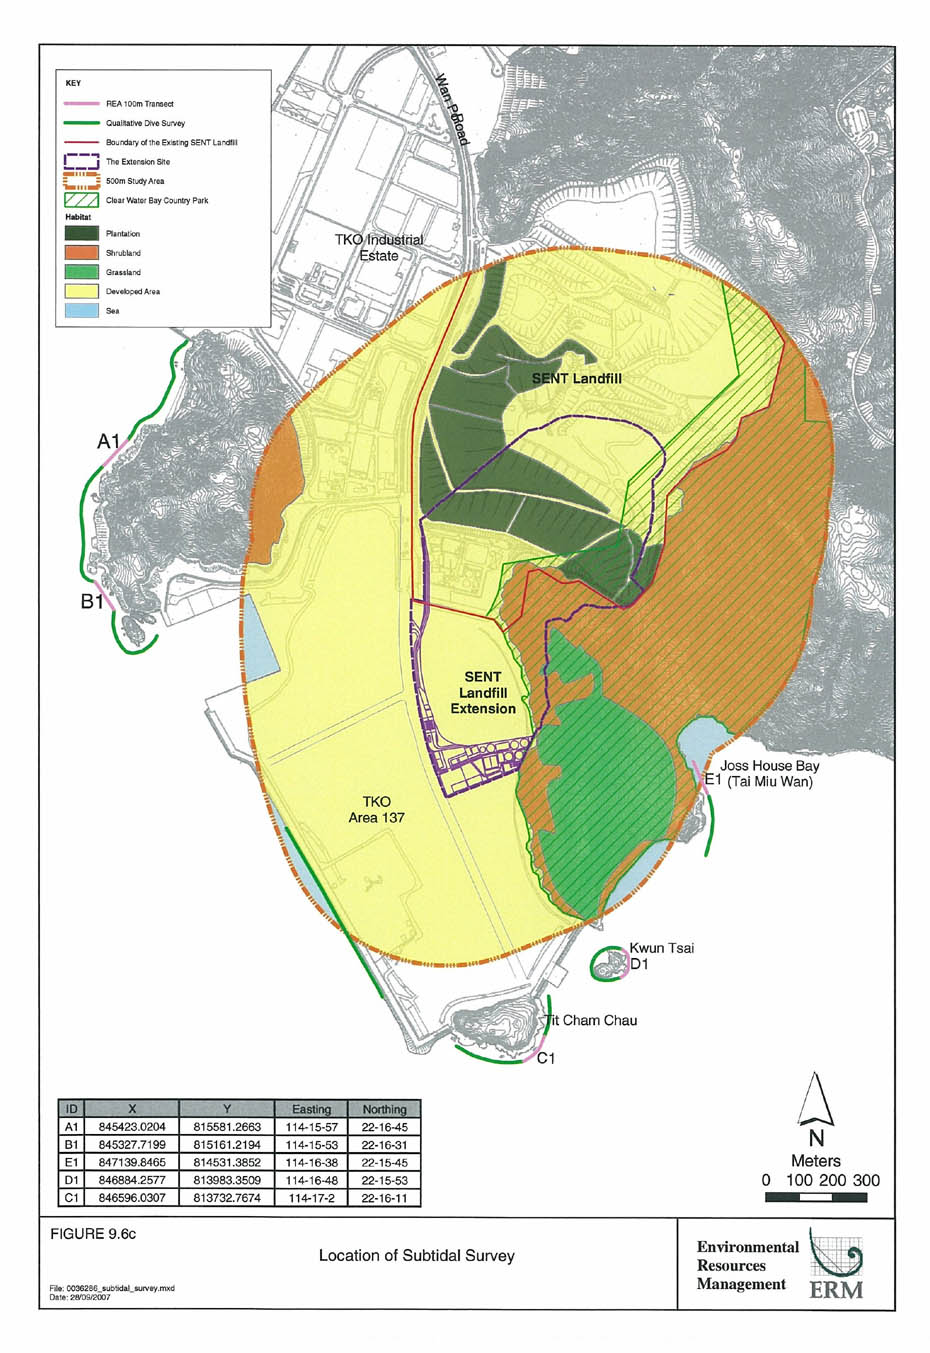
Figure 9.6c
Location of Subtidal Survey
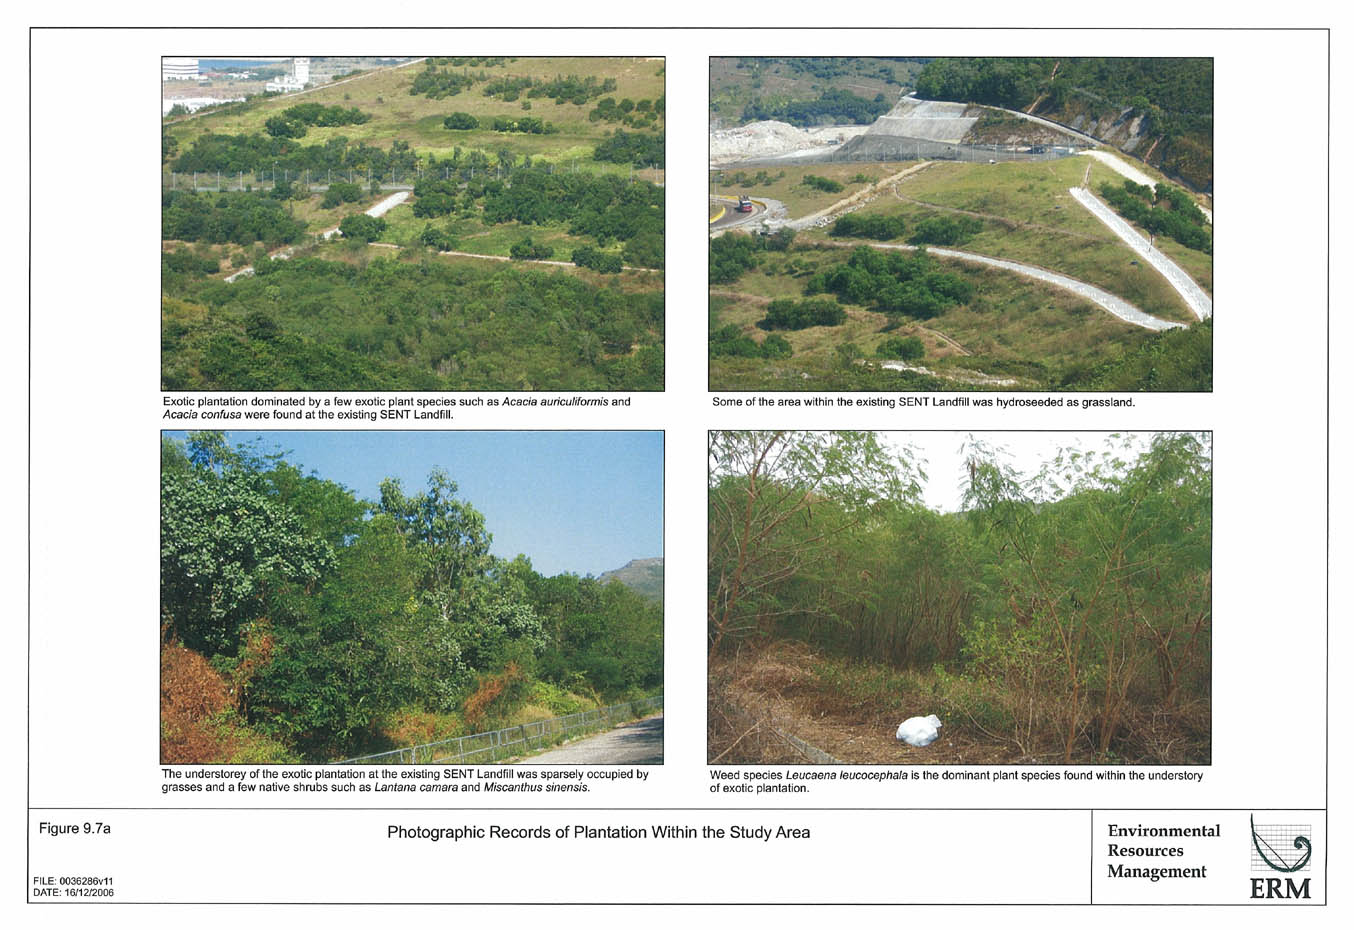
Figure 9.7a
Photographic Records of Plantation Within the Study Area
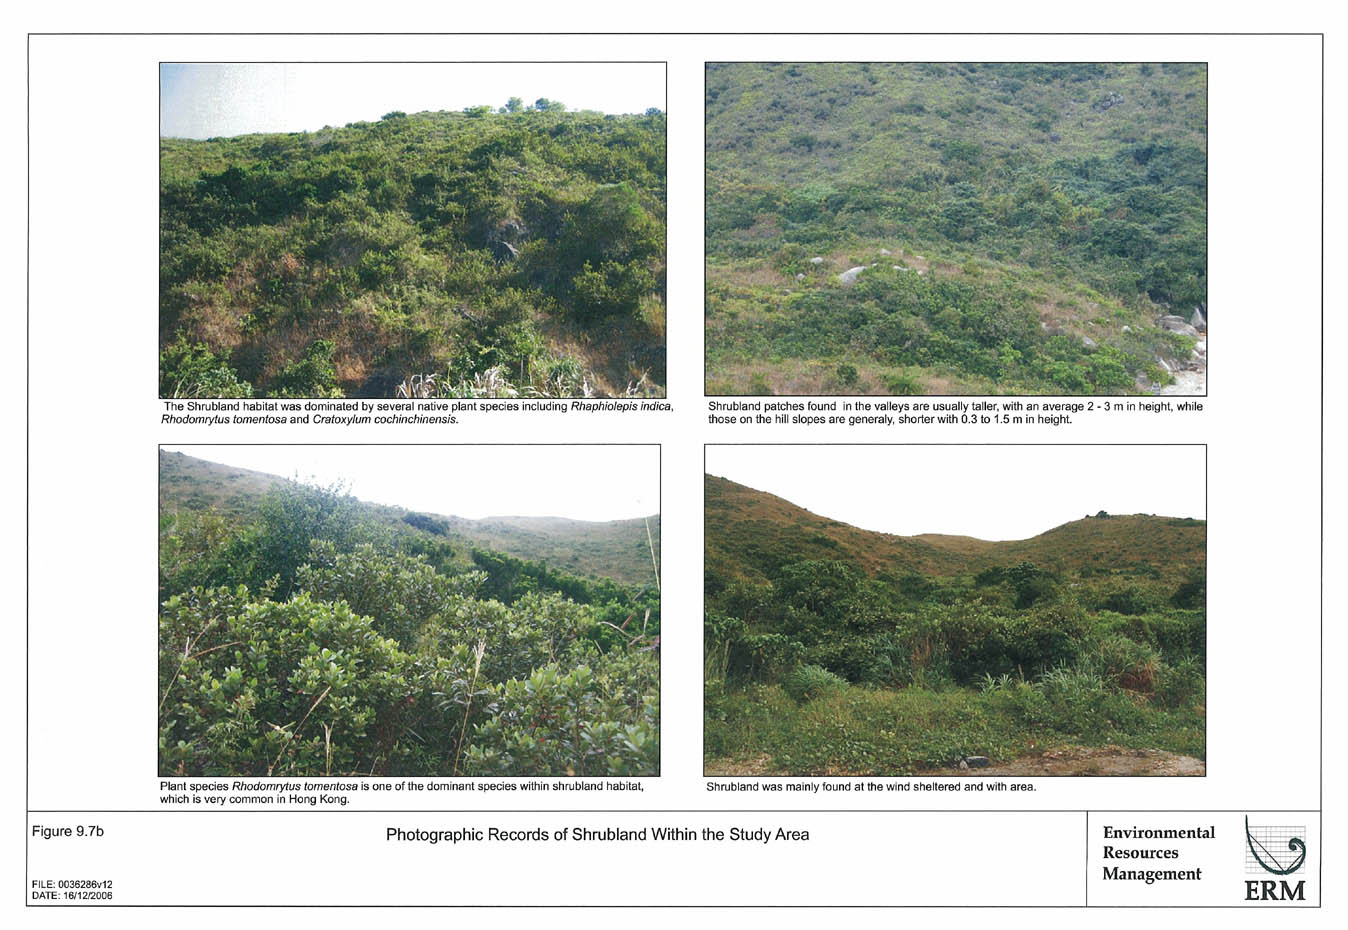
Figure 9.7b
Photographic Records of Shruland Within the Study Area
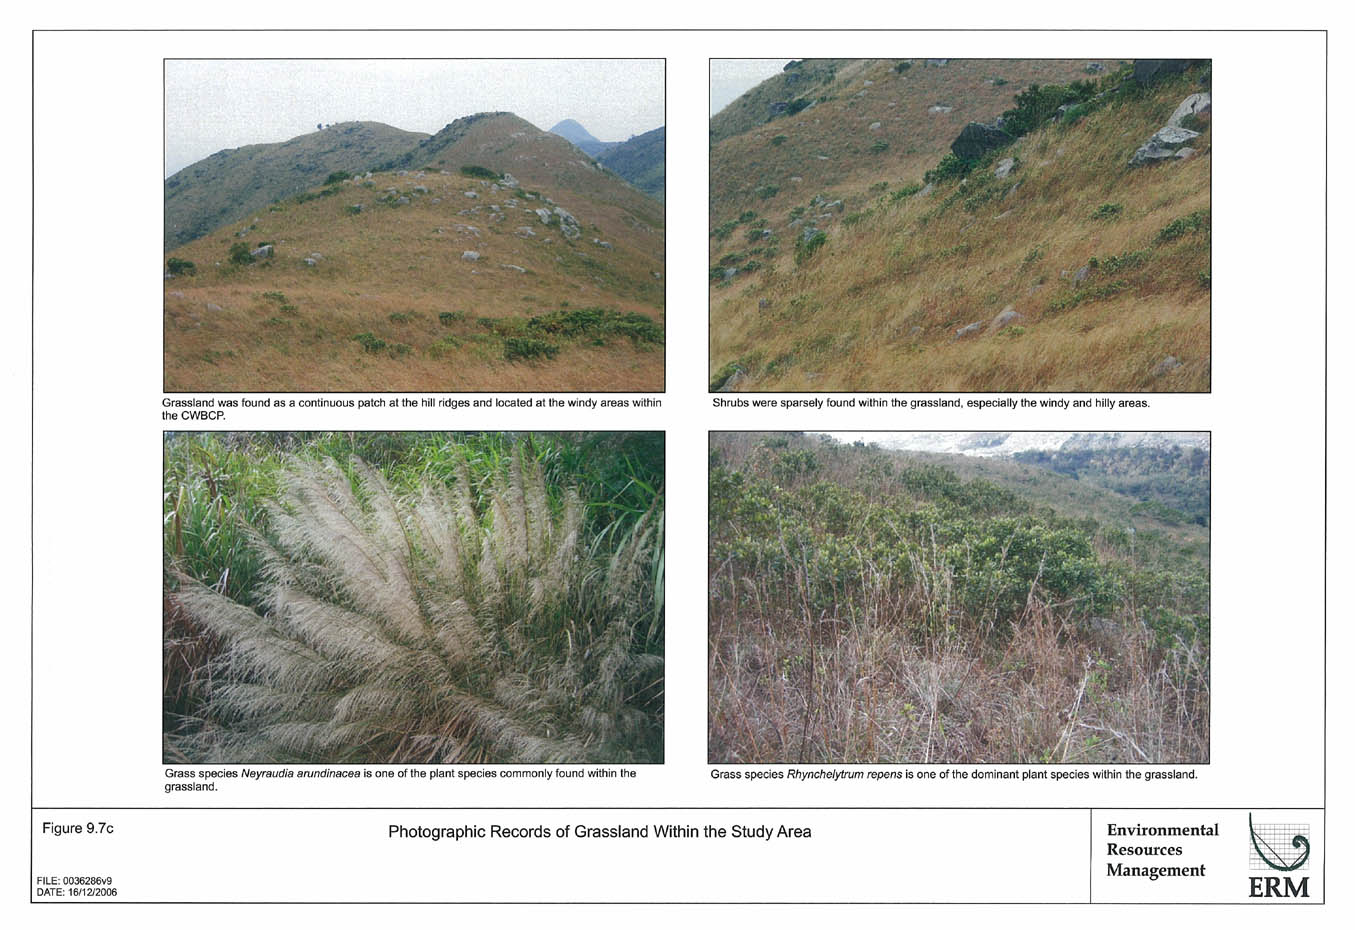
Figure 9.7c
Photographic Records of Grassland Within the Study Area
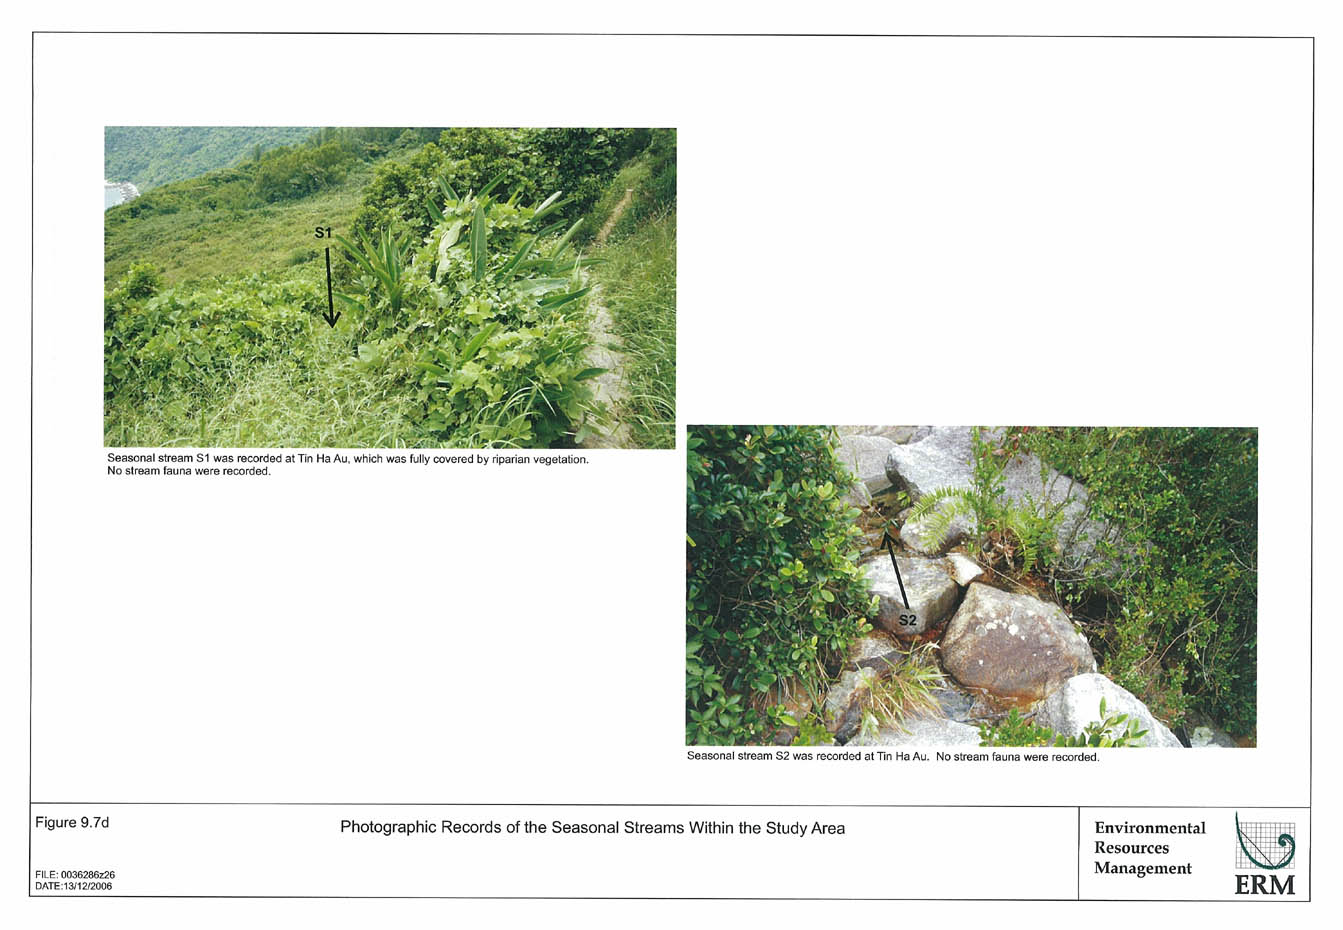
Figure 9.7d
Photographic Records of Seasonal Streams Within the Study Area
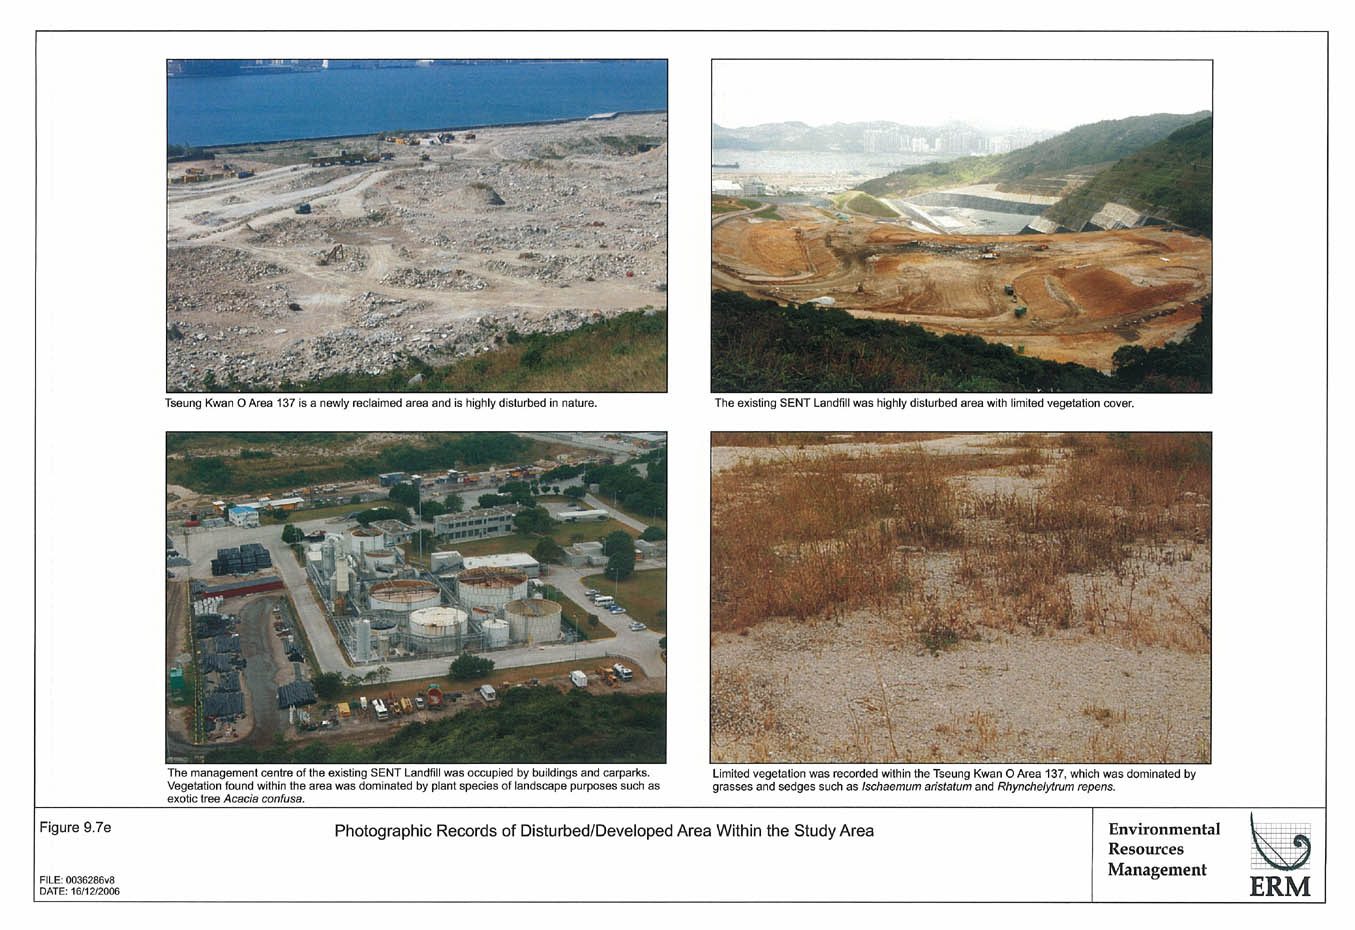
Figure 9.7e
Photographic Records of Disturbed/Developed Area Within the Study Area
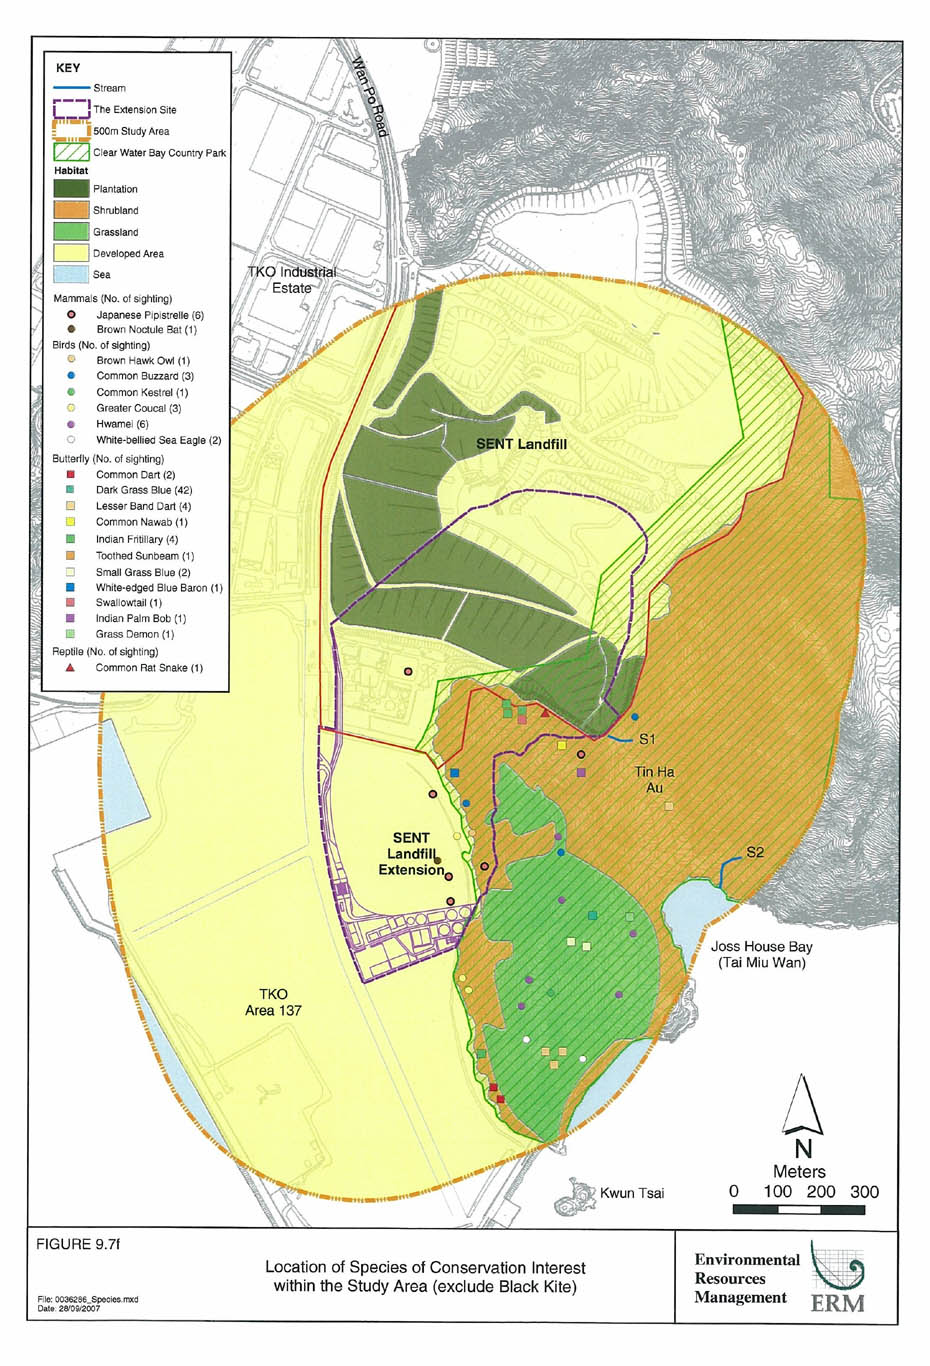
Figure 9.7f
Location of Species of Conservation Interest within the Study Area (exclude Black Kite)
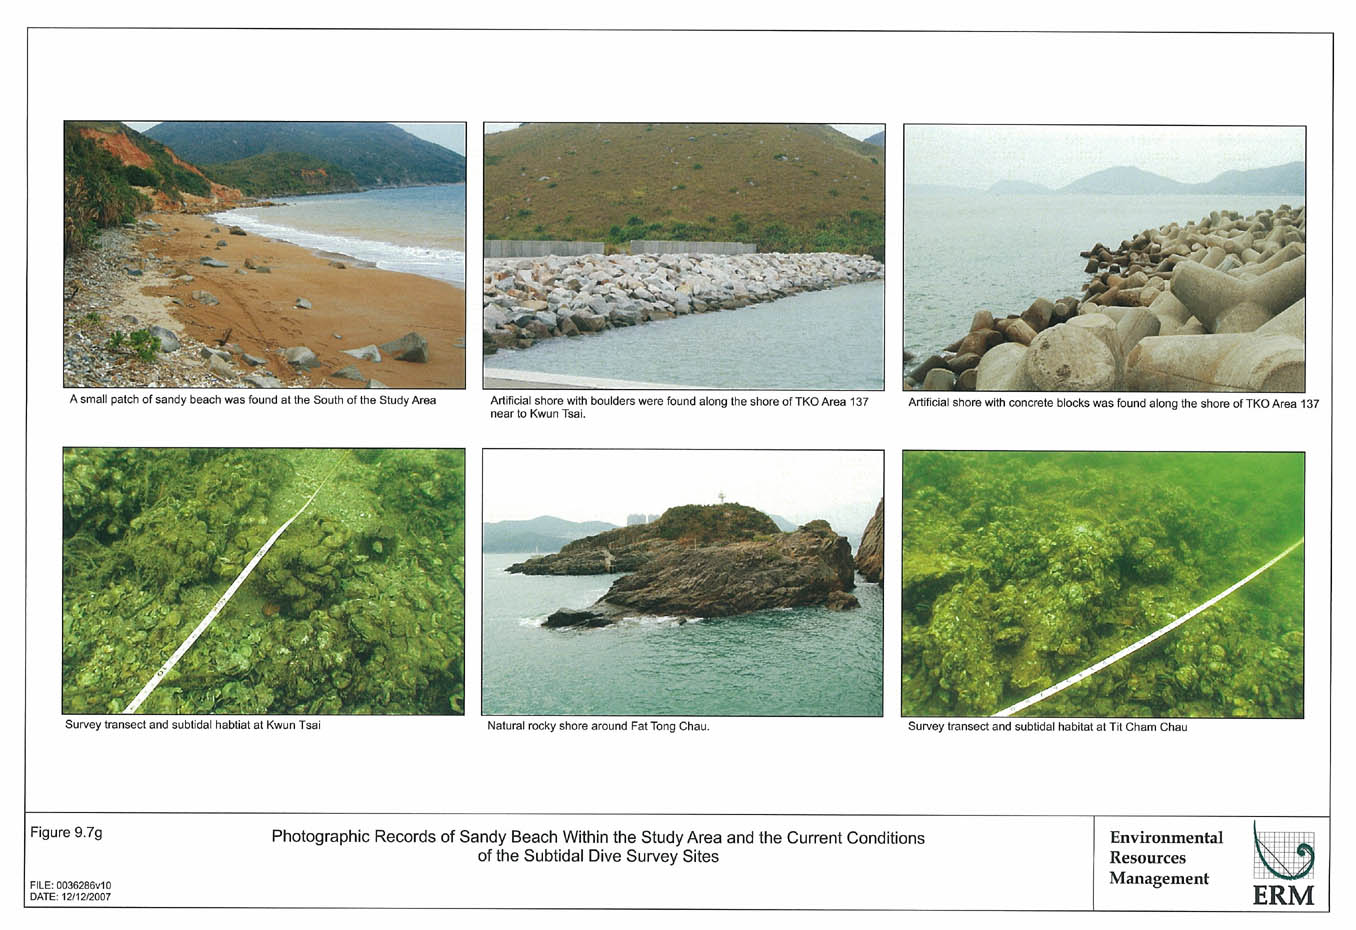
Figure 9.7g
Photographic Records of Sandy Beach Within the Study Area and the Current Conditions of the Subtidal Dive Survey Sites
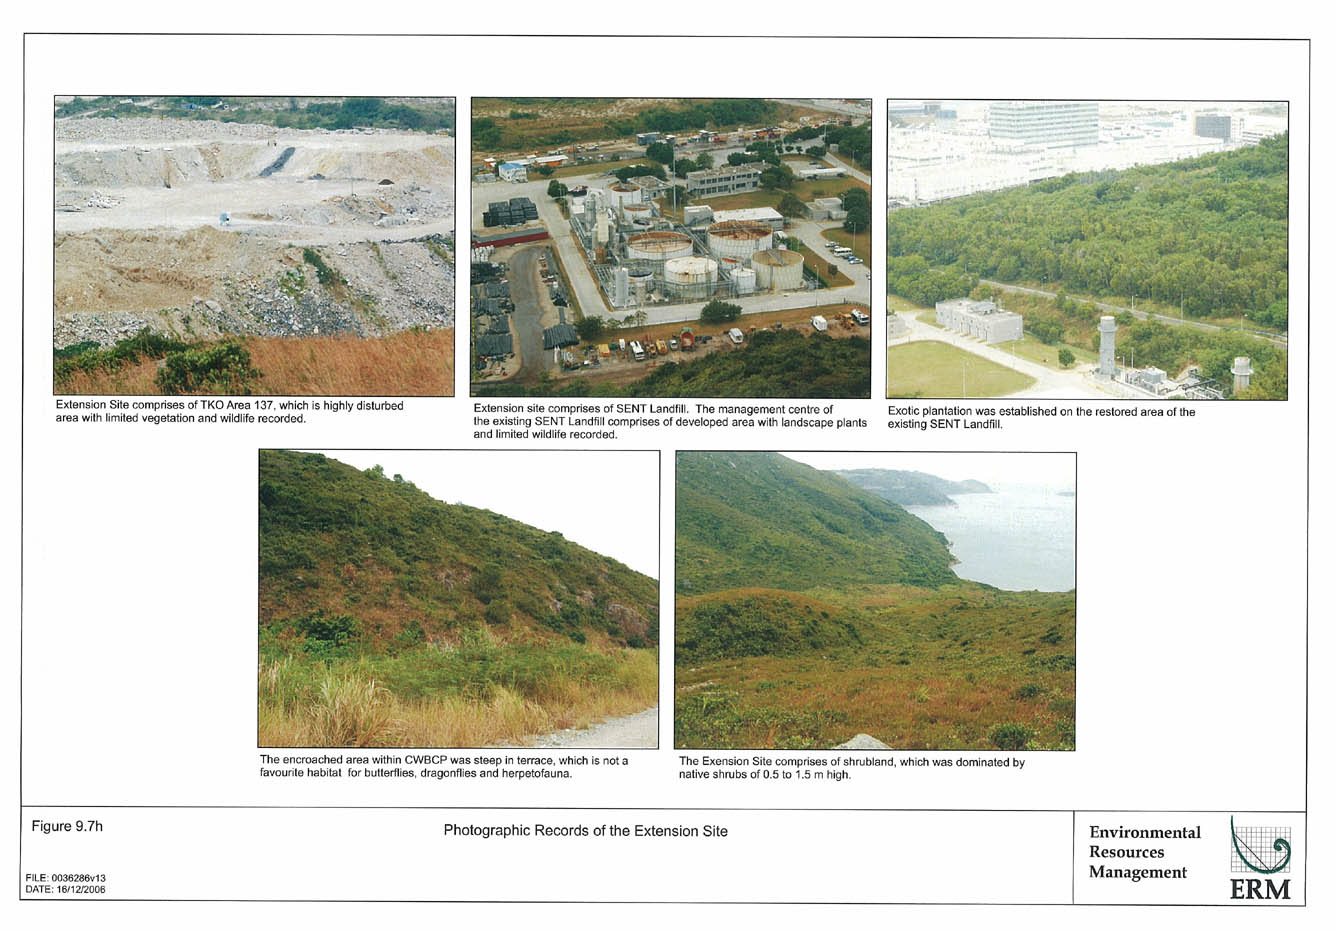
Figure 9.7h
Photographic Records of the Extension Site
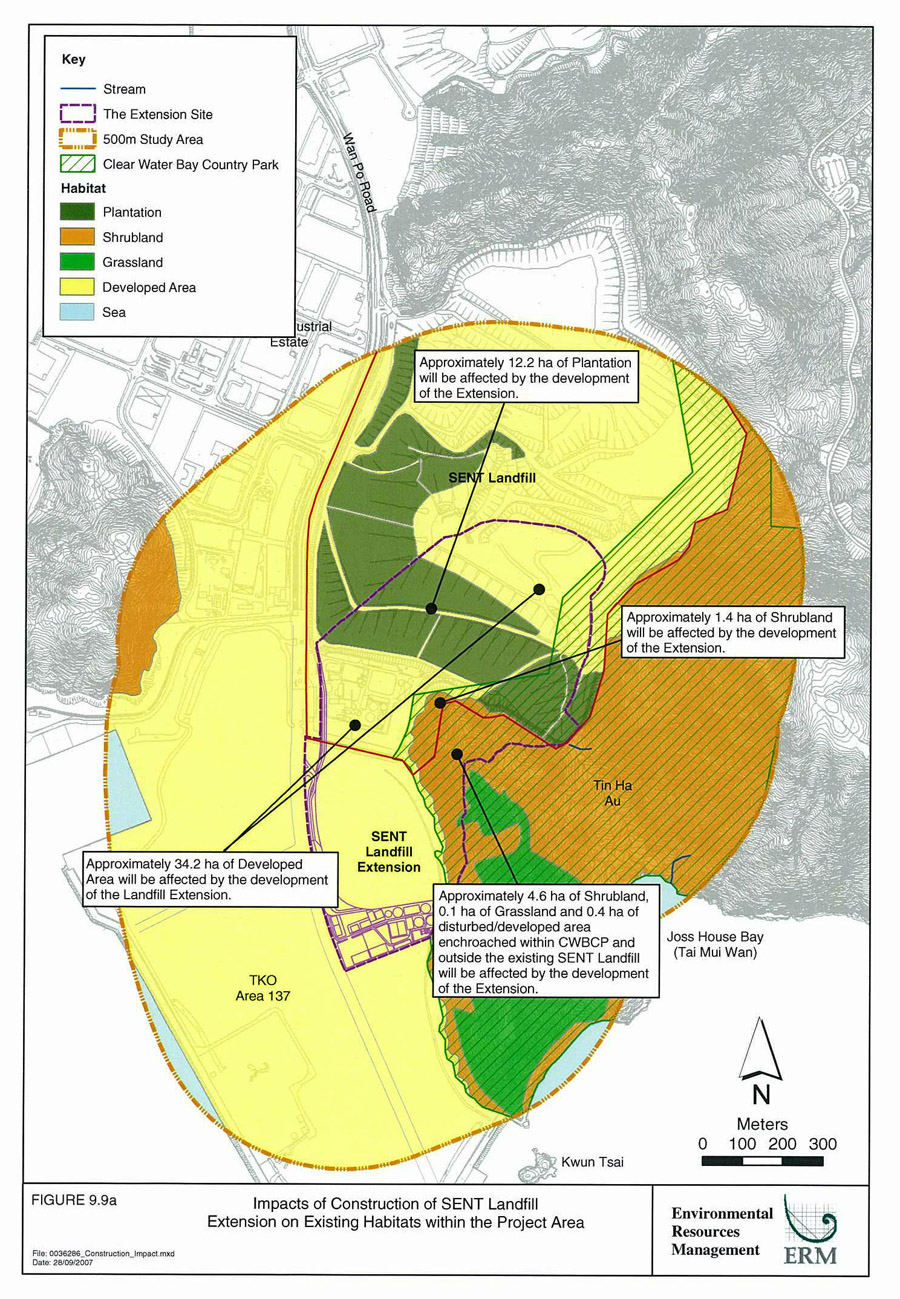
Figure 9.9a
Impacts of Construction of SENT Landfill Extension on Existing Habitas within the Project Area
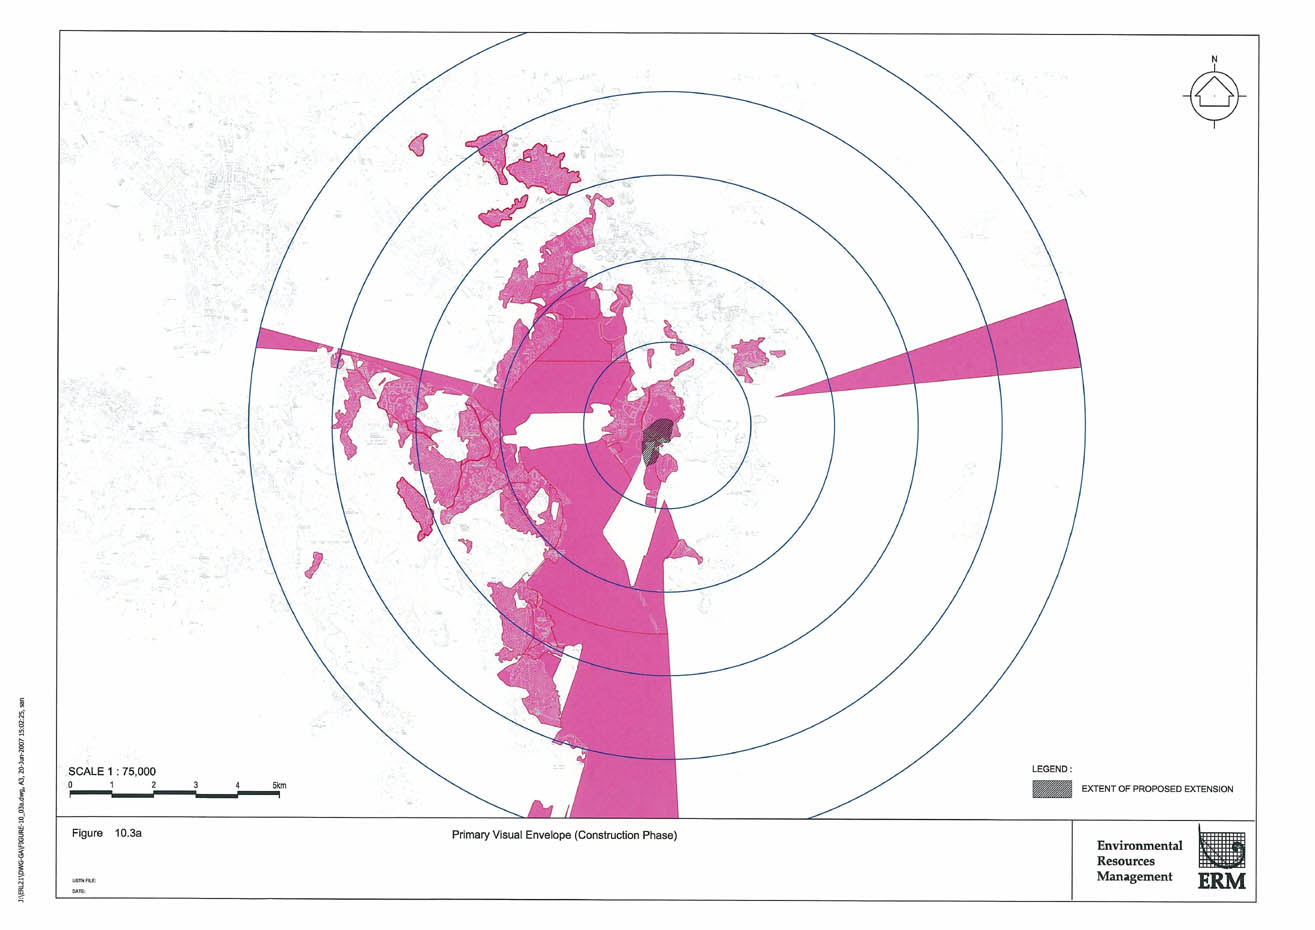
Figure 10.3a
Primary Visual Envelope (Construction Phase)
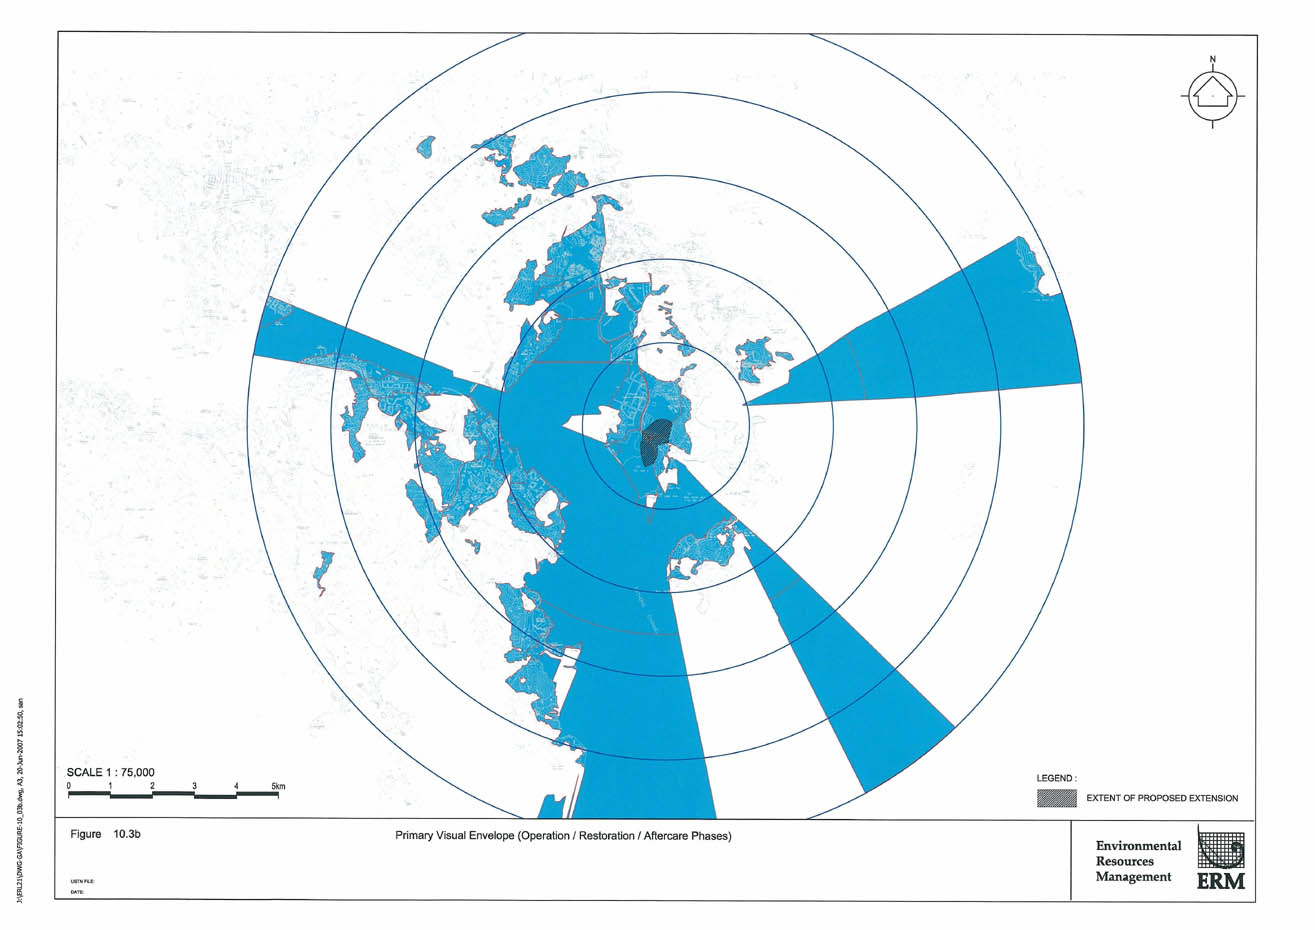
Figure 10.3b
Primary Visual Envelope (Operation / Restoration / Aftercare Phases)
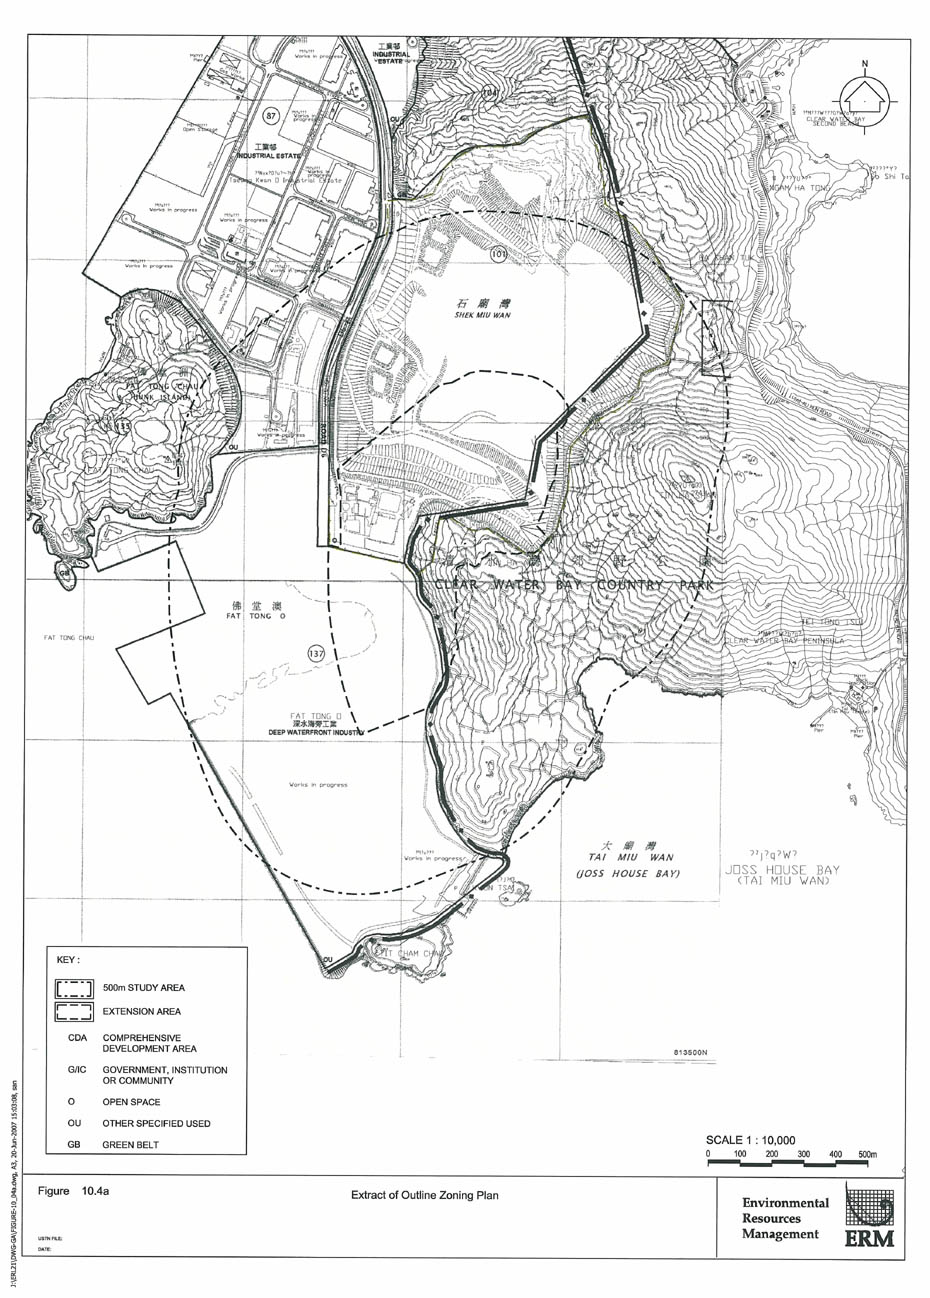
Figure 10.4a
Extract of Outline Zoning Plan
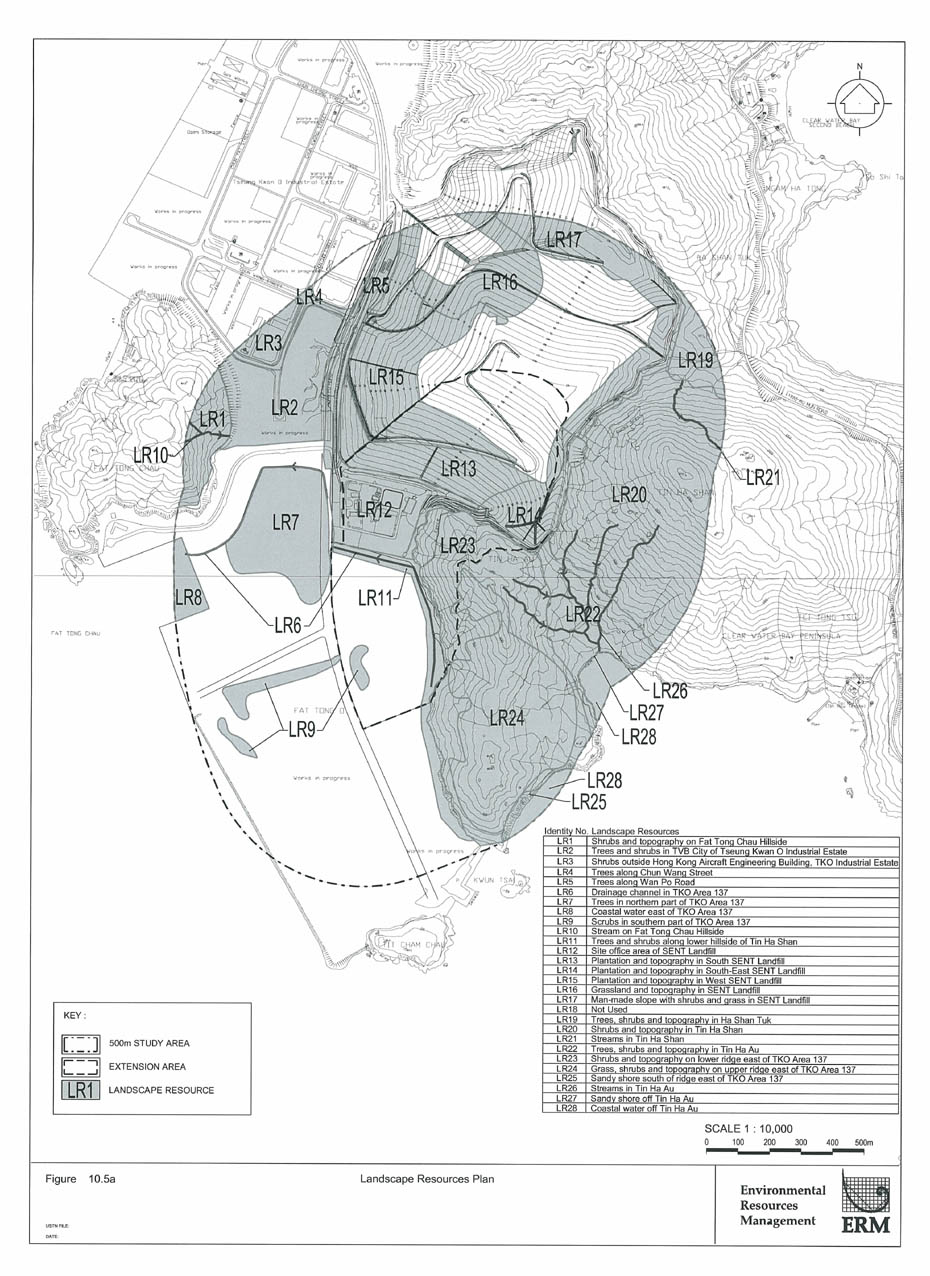
Figure 10.5a
Landscape Resources Plan
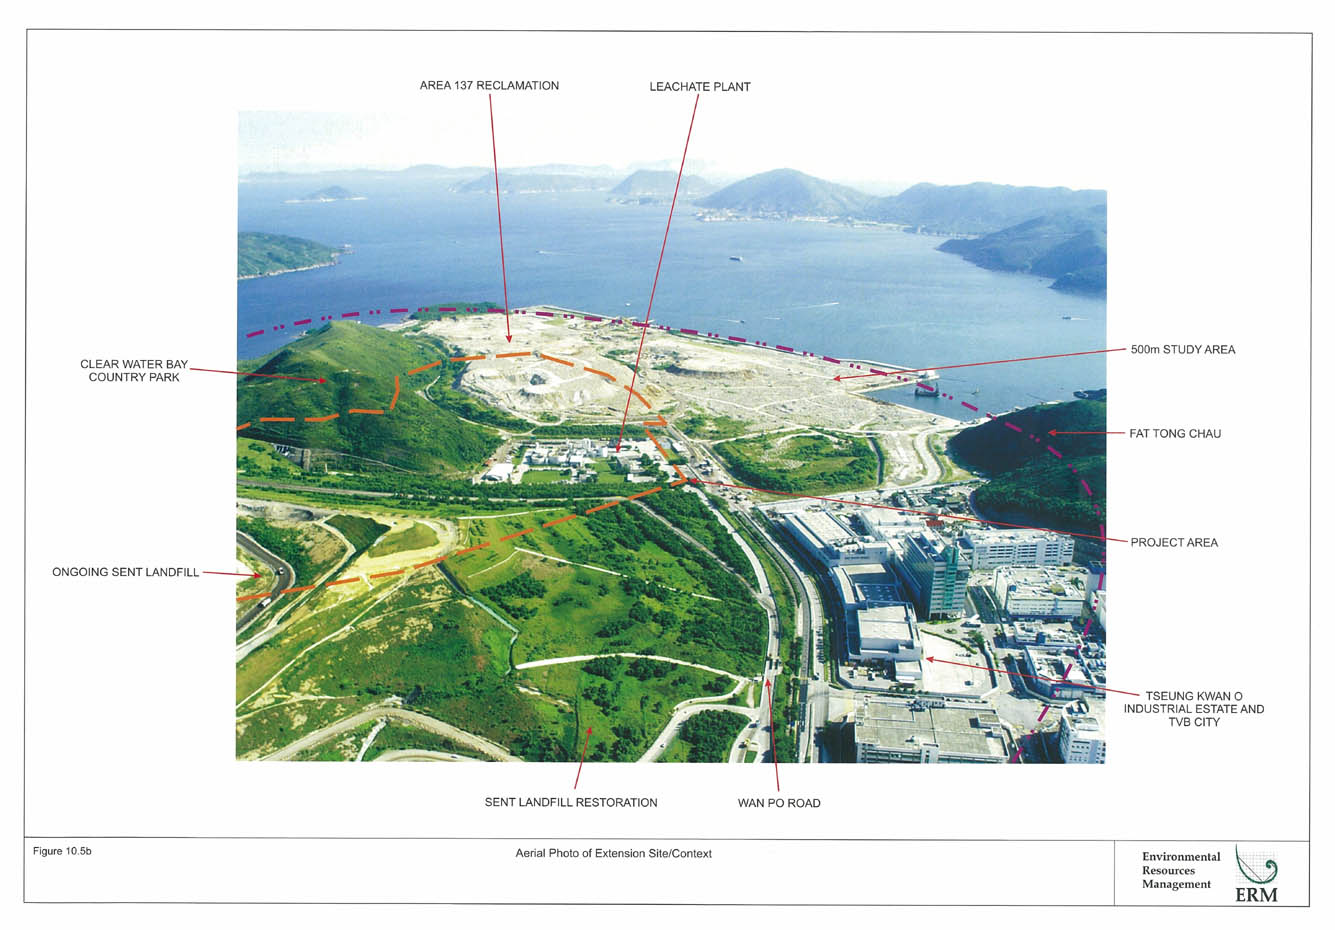
Figure 10.5b
Aerial Photo of Extension Site/Context
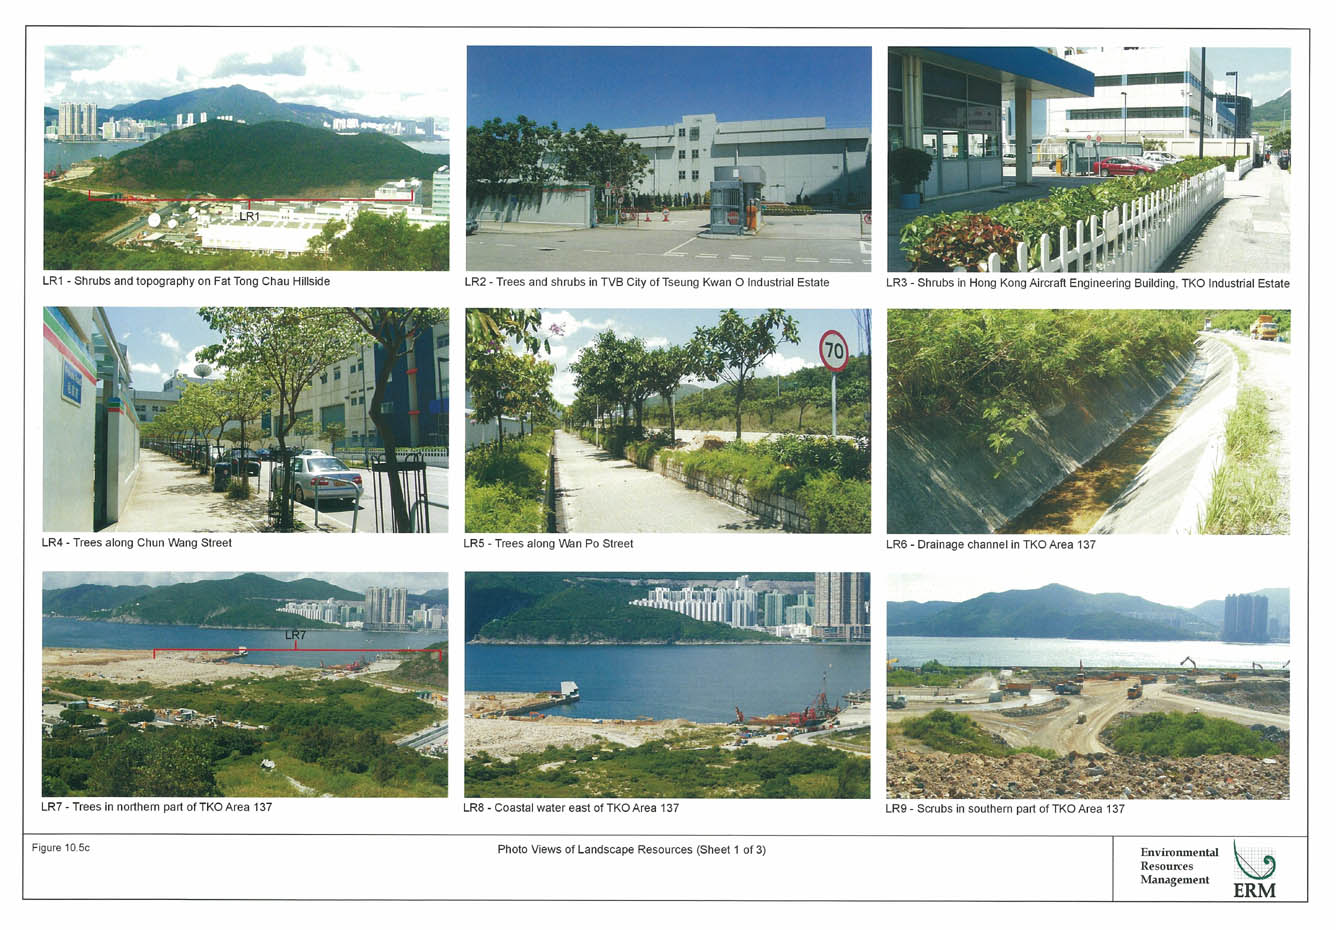
Figure 10.5c
Photo Views of Landscape Resources (Sheet 1 of 3)
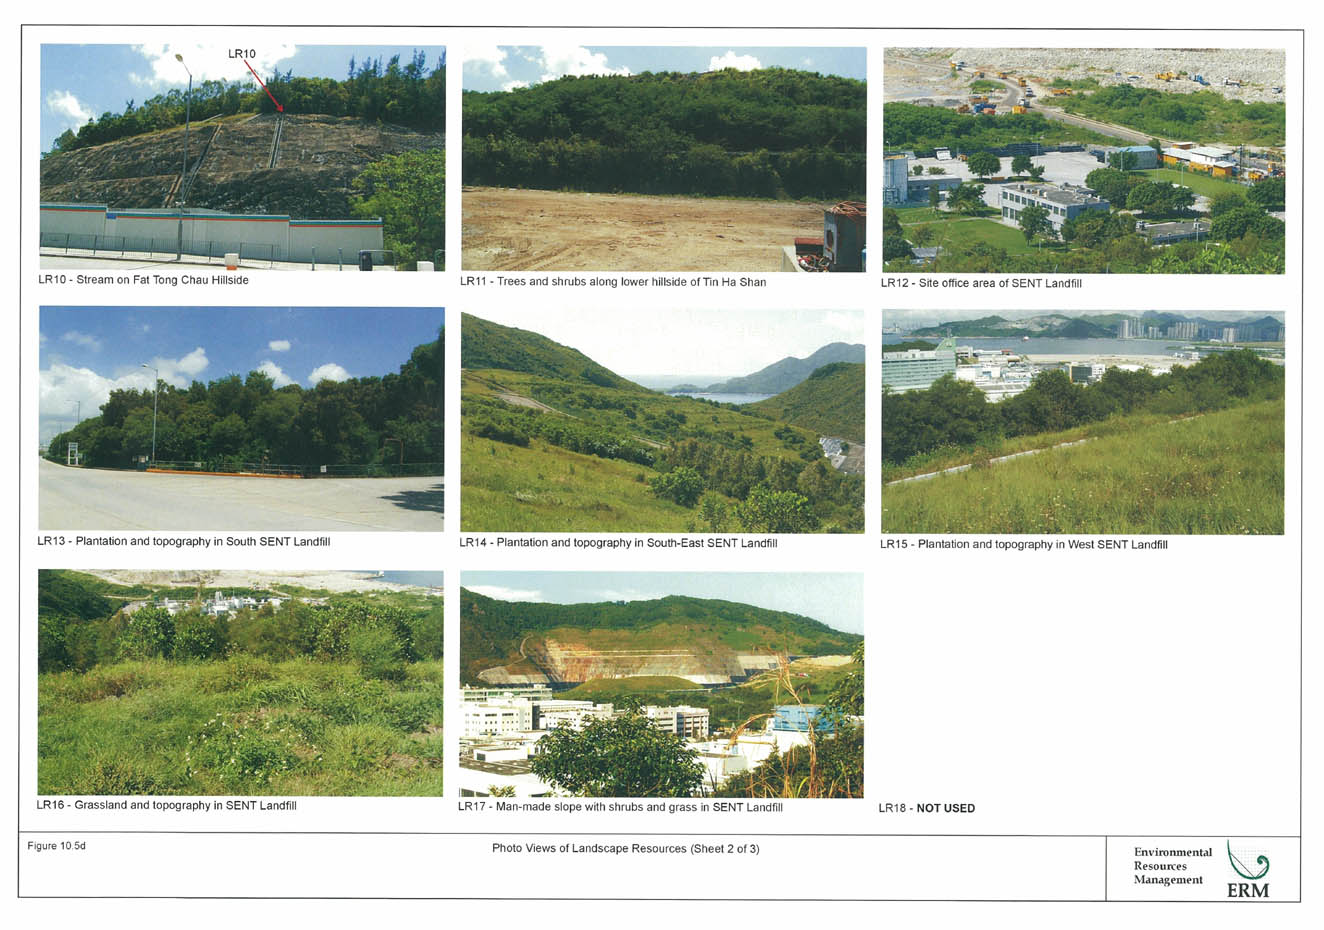
Figure 10.5d
Photo Views of Landscape Resources (Sheet 2 of 3)
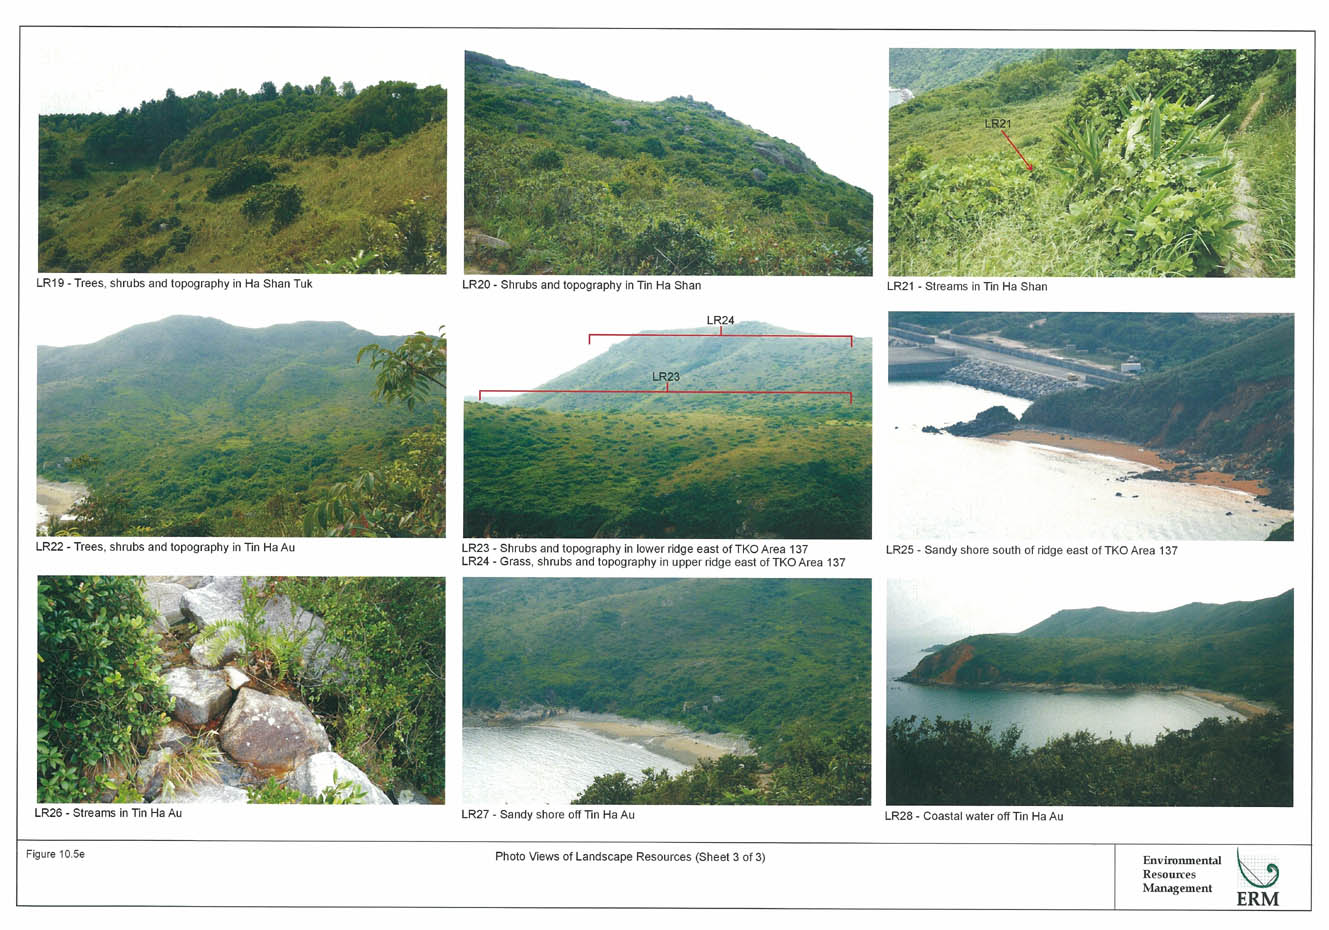
Figure 10.5e
Photo Views of Landscape Resources (Sheet 3 of 3)
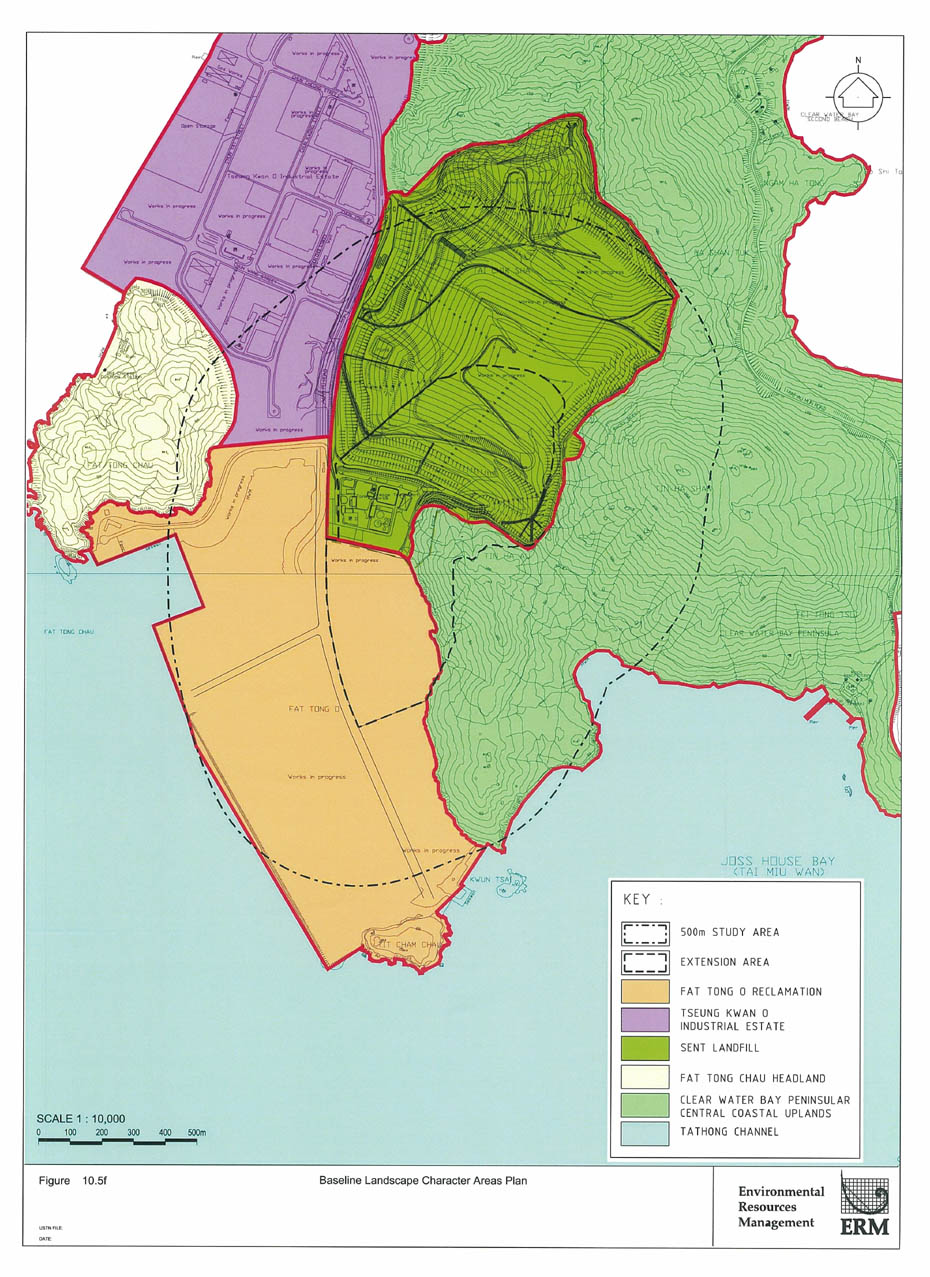
Figure 10.5f
Baseline Landscape Character Areas Plan
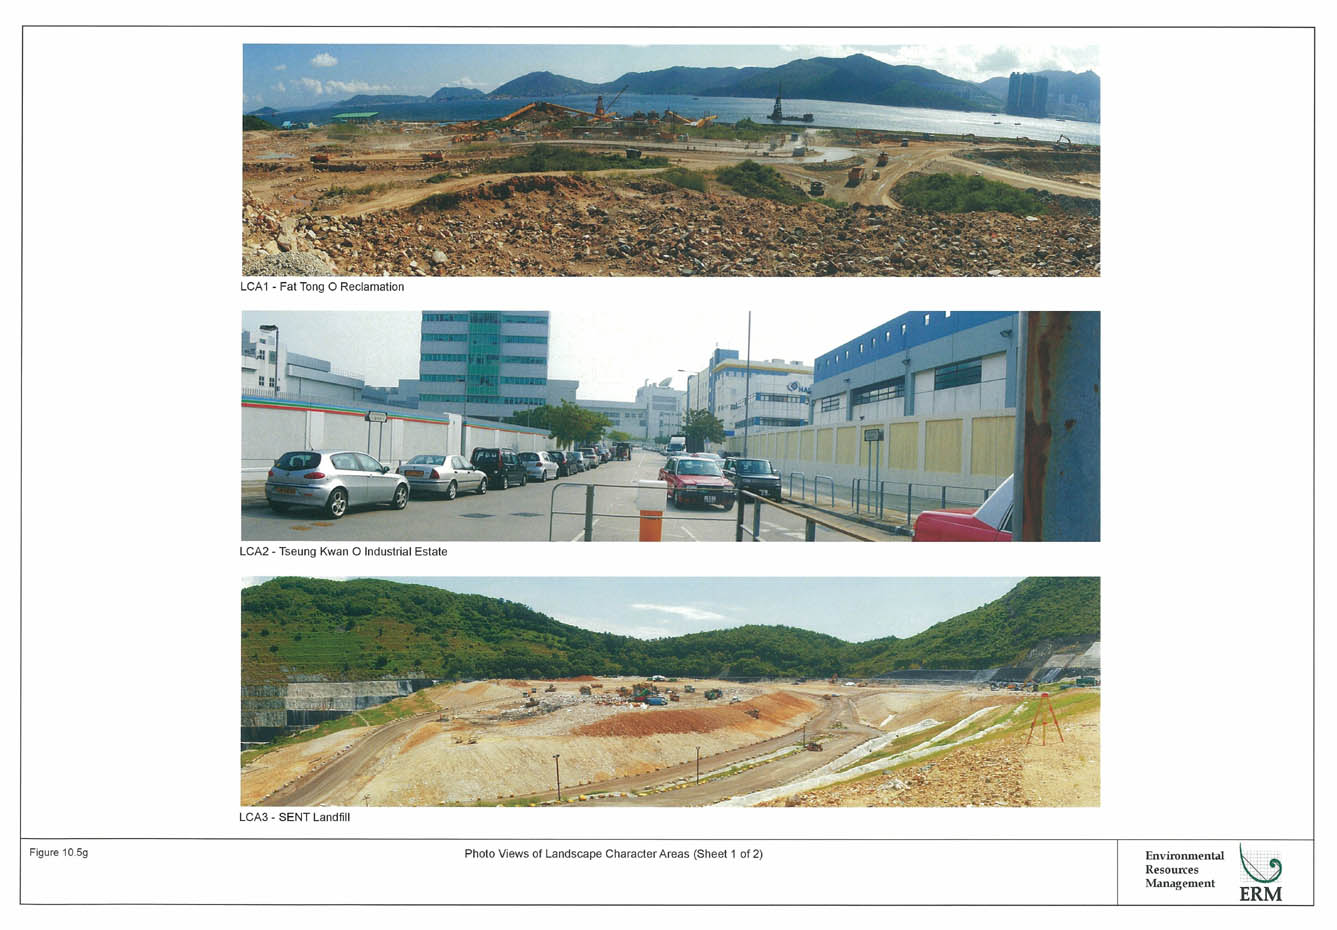
Figure 10.5g
Photo Views of Landscape Character Areas (Sheet 1 of 2)
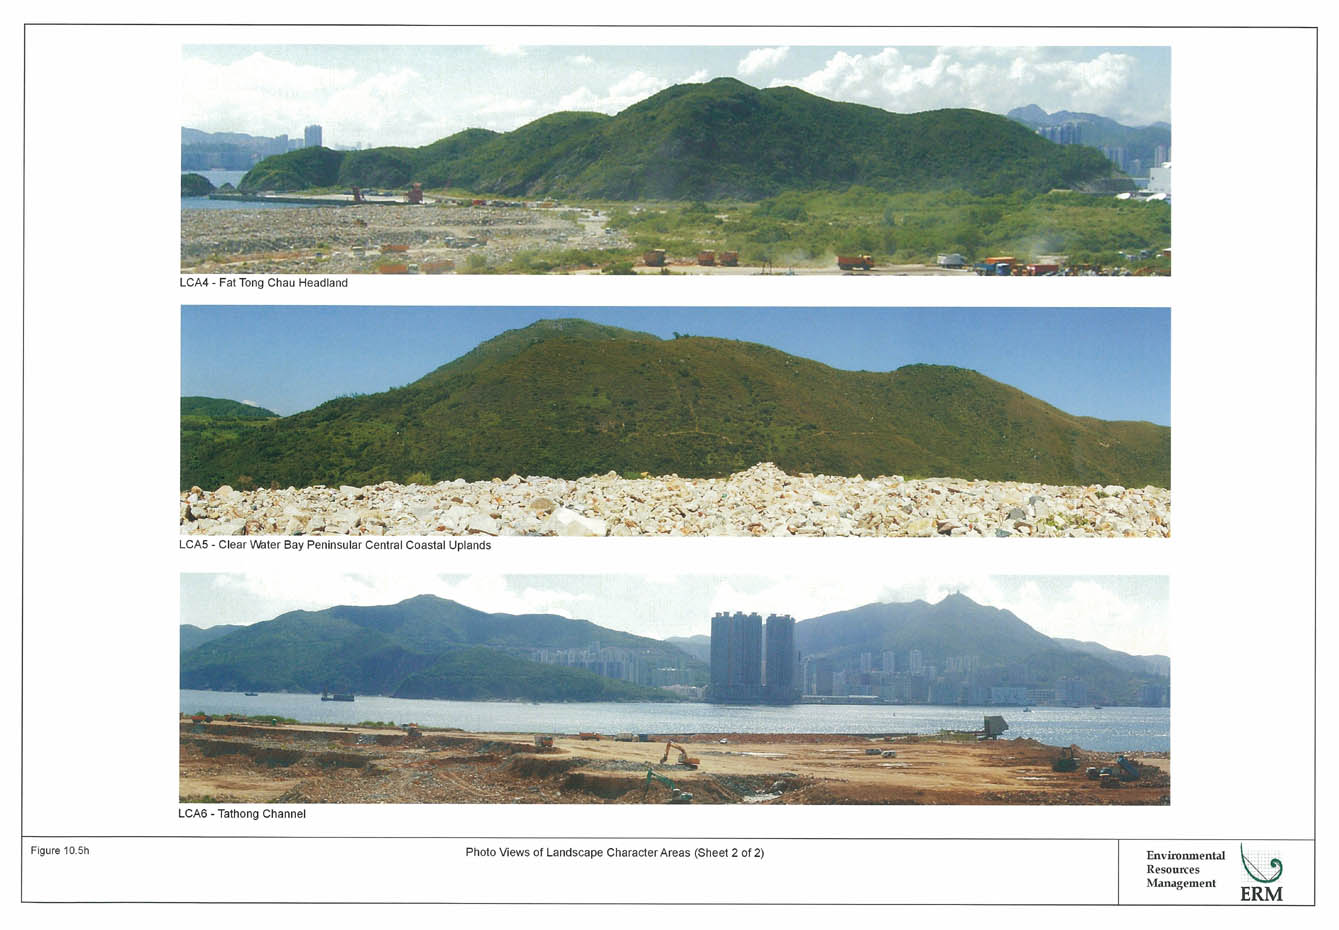
Figure 10.5h
Photo Views of Landscape Character Areas (Sheet 2 of 2)
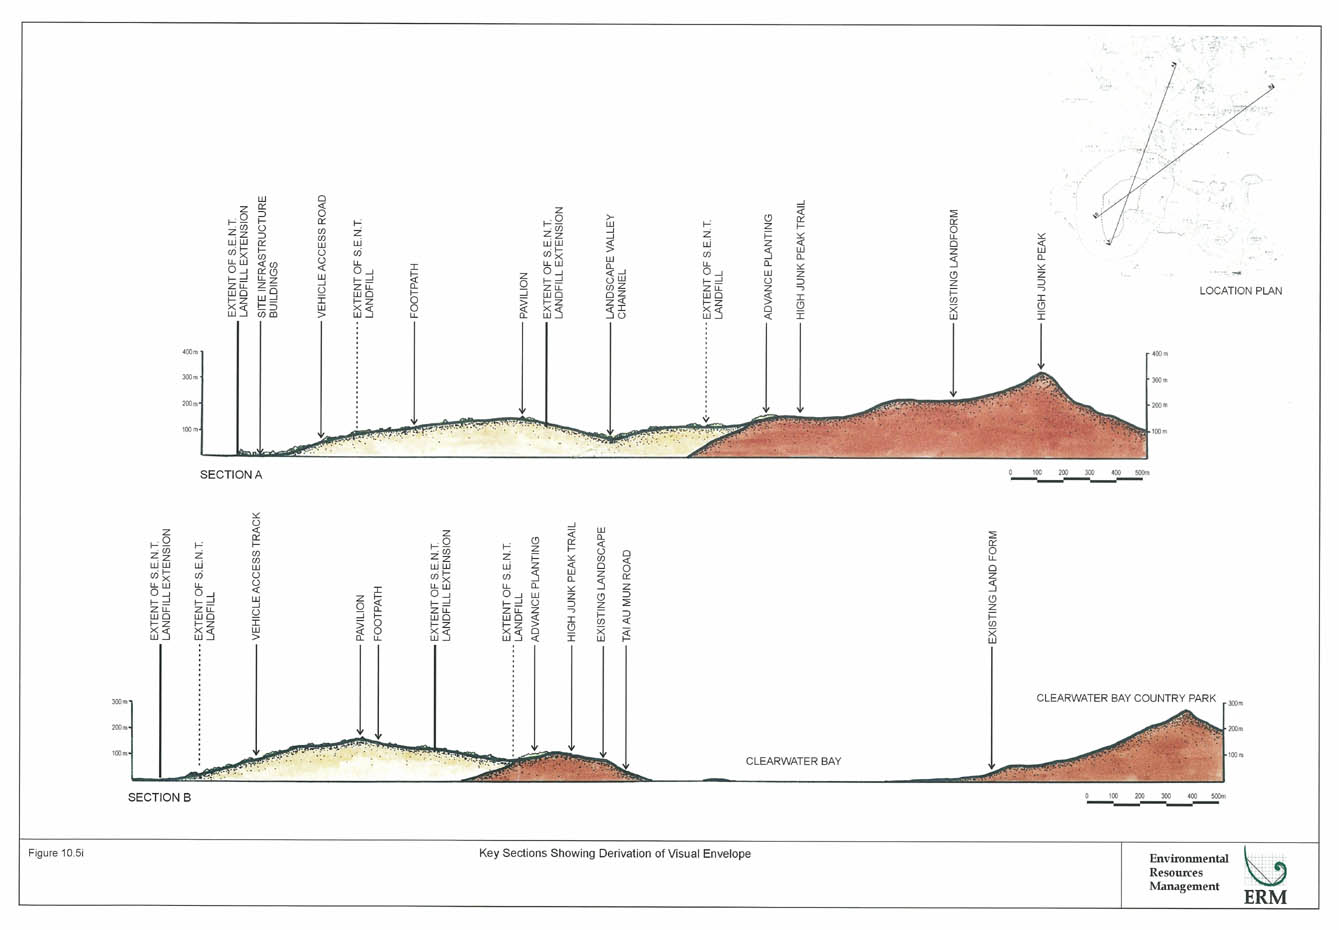
Figure 10.5i
Key Section Showing Derivation of Visual Envelope
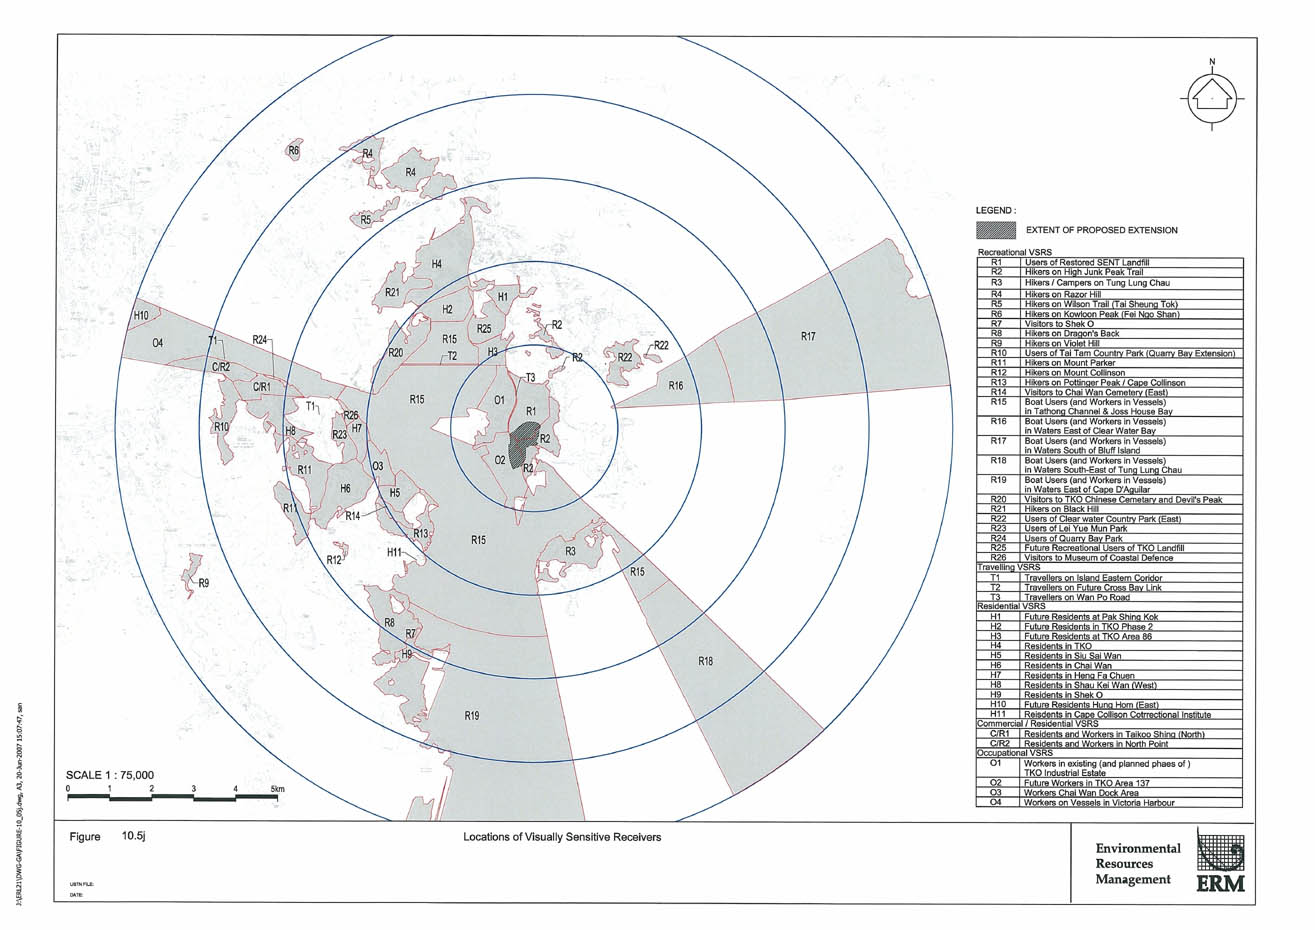
Figure 10.5j
Locations of Visually Sensitive Receivers
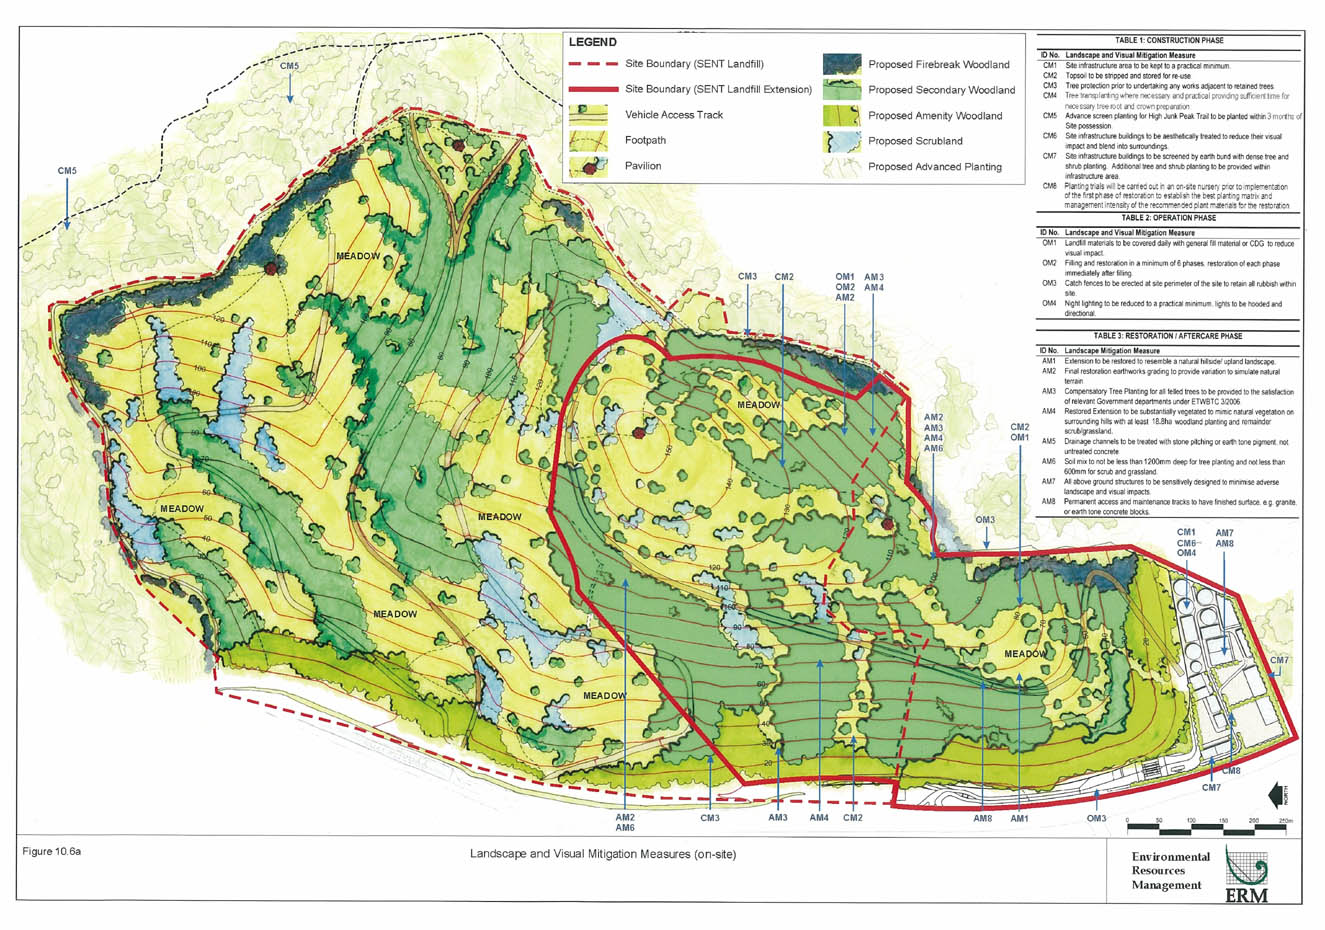
Figure 10.6a
Locations of Visual Mitigation Measures (on-site)
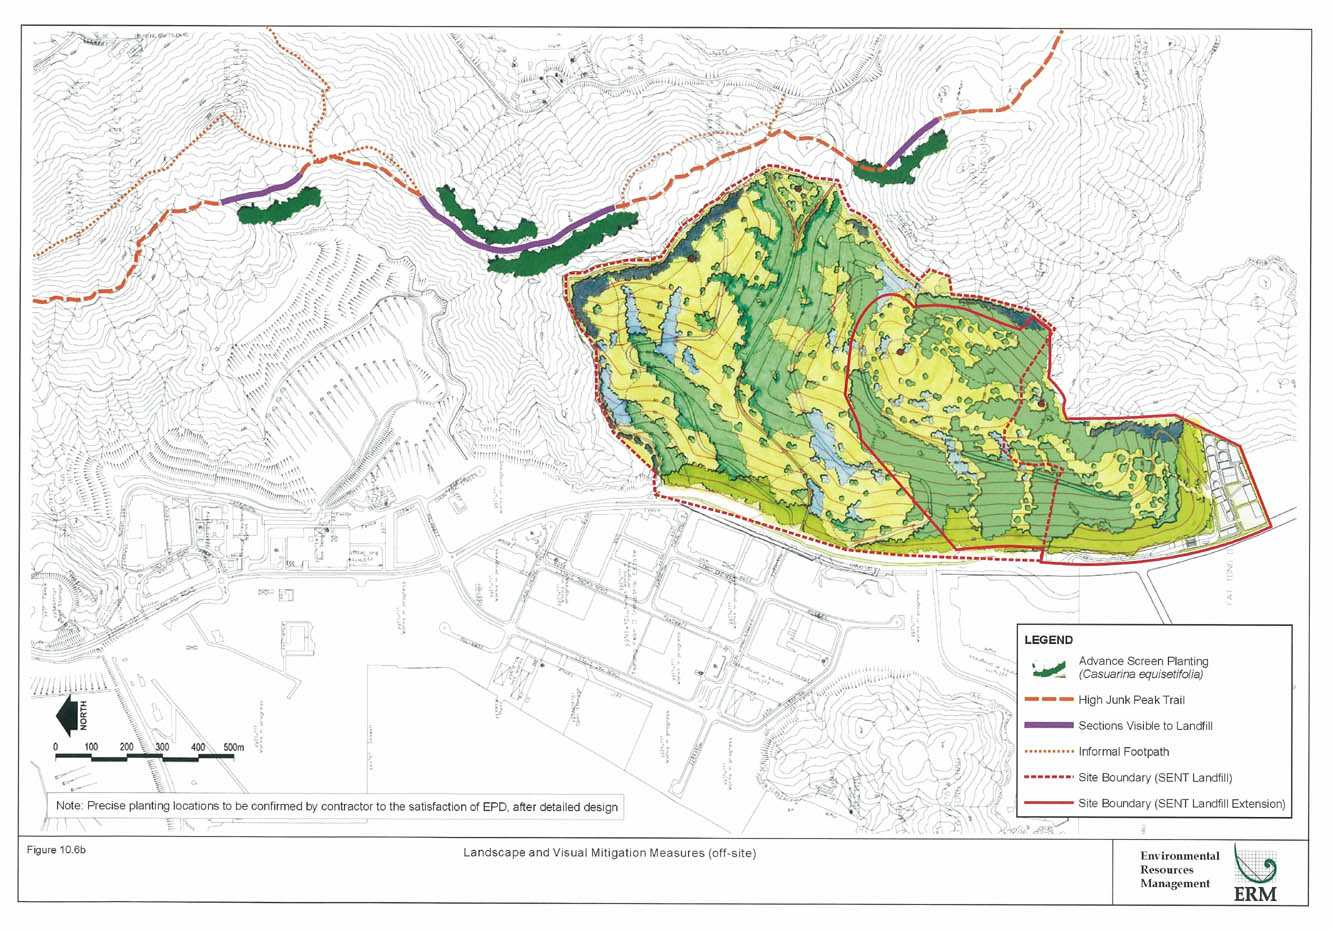
Figure 10.6b
Locations of Visual Mitigation Measures (off-site)
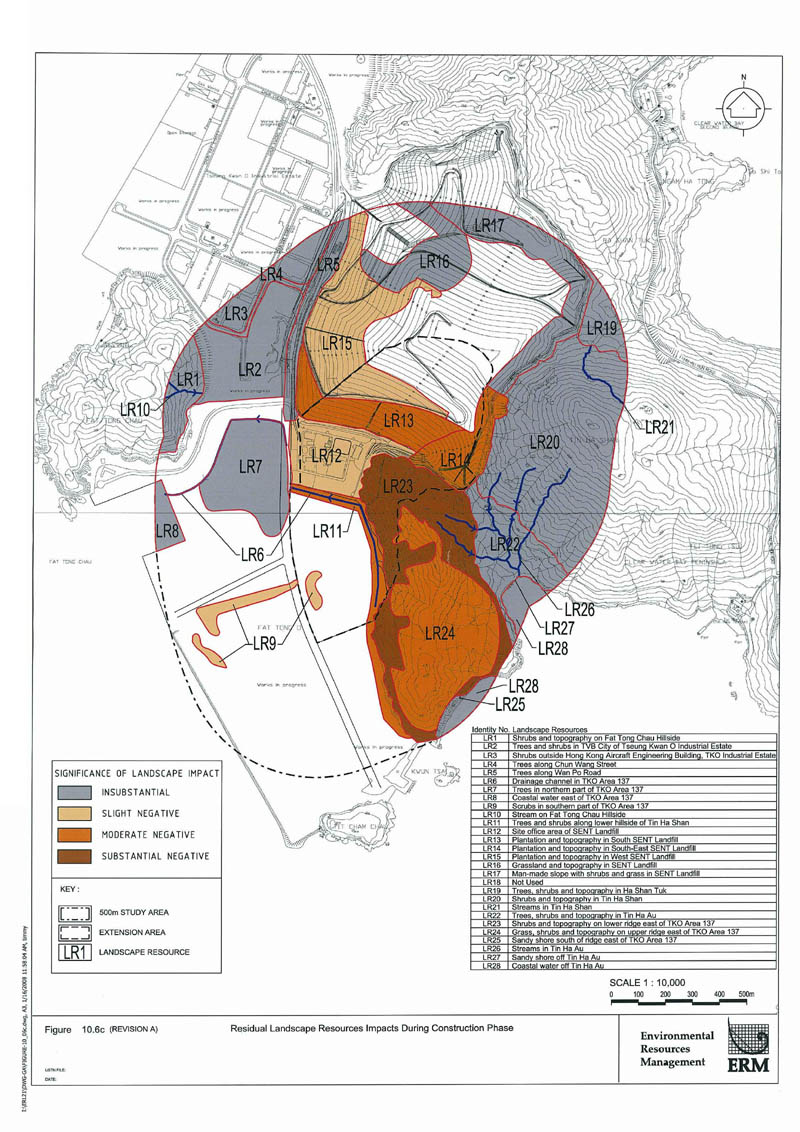
Figure 10.6c
Residual Landscape Resources Impacts During Construction Phase
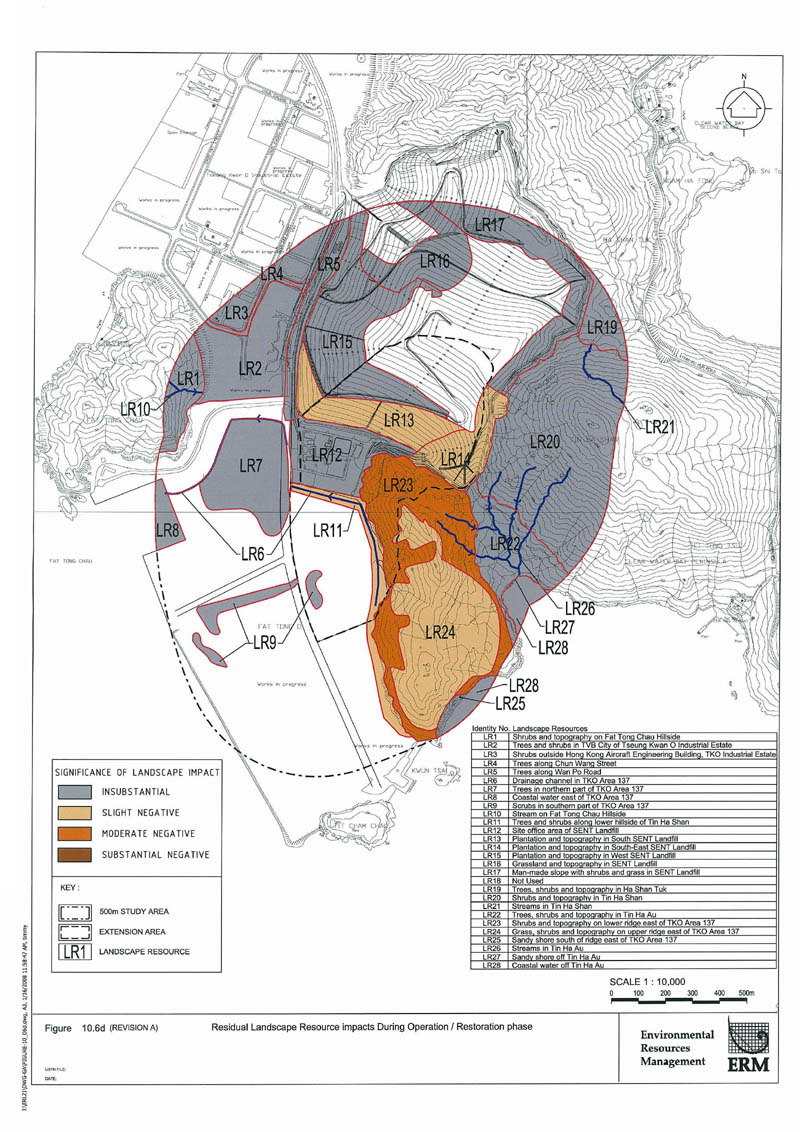
Figure 10.6d
Residual Landscape Resources Impacts During Operation / Restoration phase
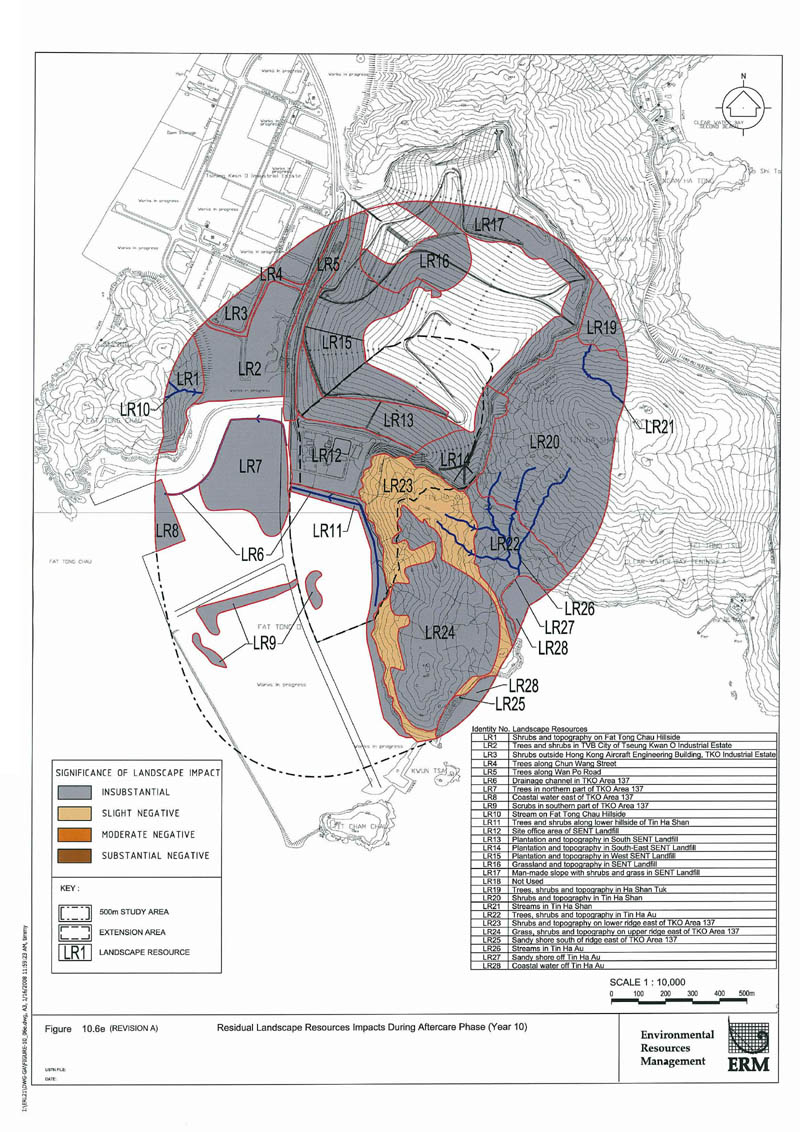
Figure 10.6e
Residual Landscape Resources Impacts During Aftercare Phase (Year 10)
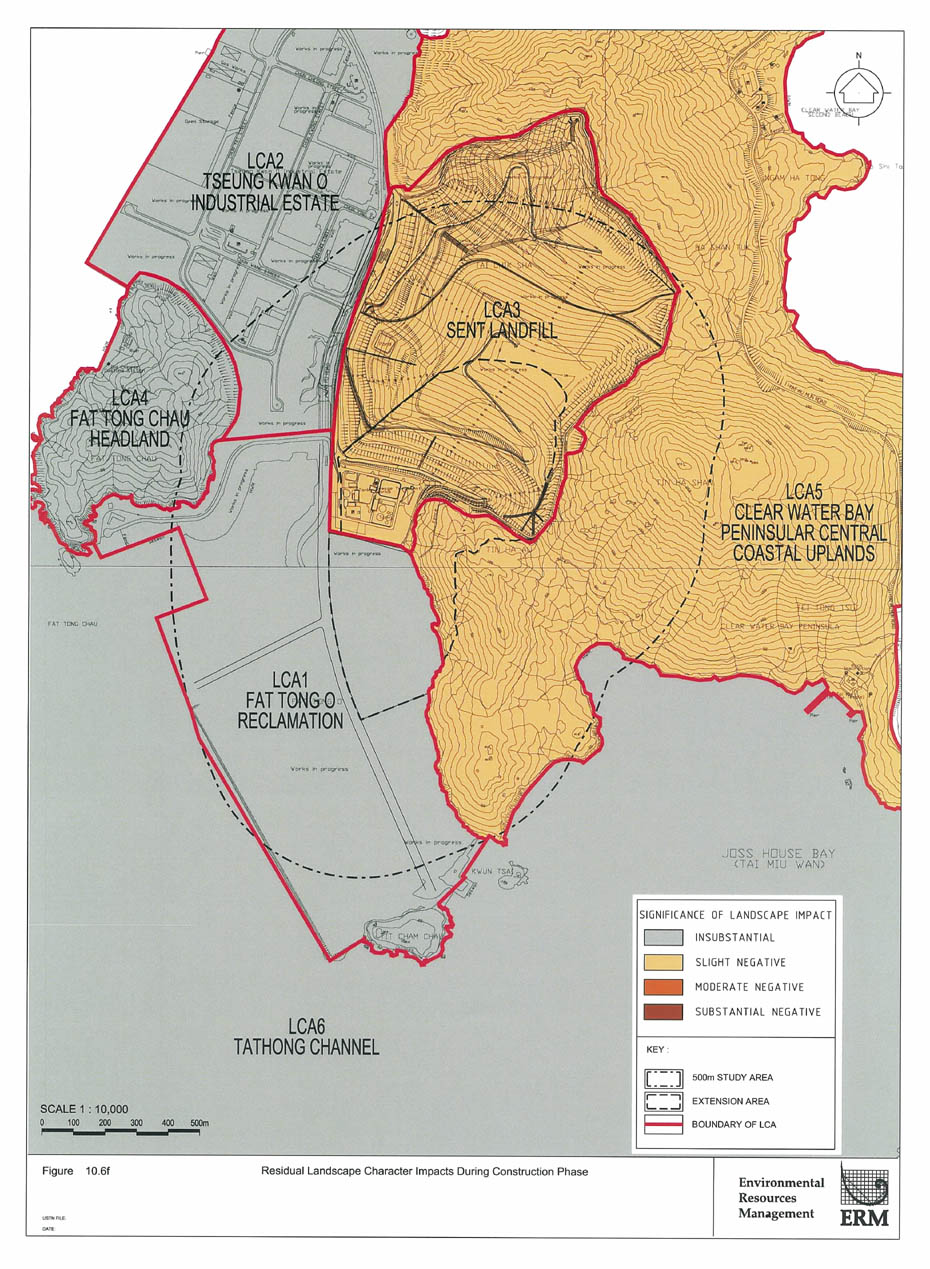
Figure 10.6f
Residual Landscape Character During Construction Phase
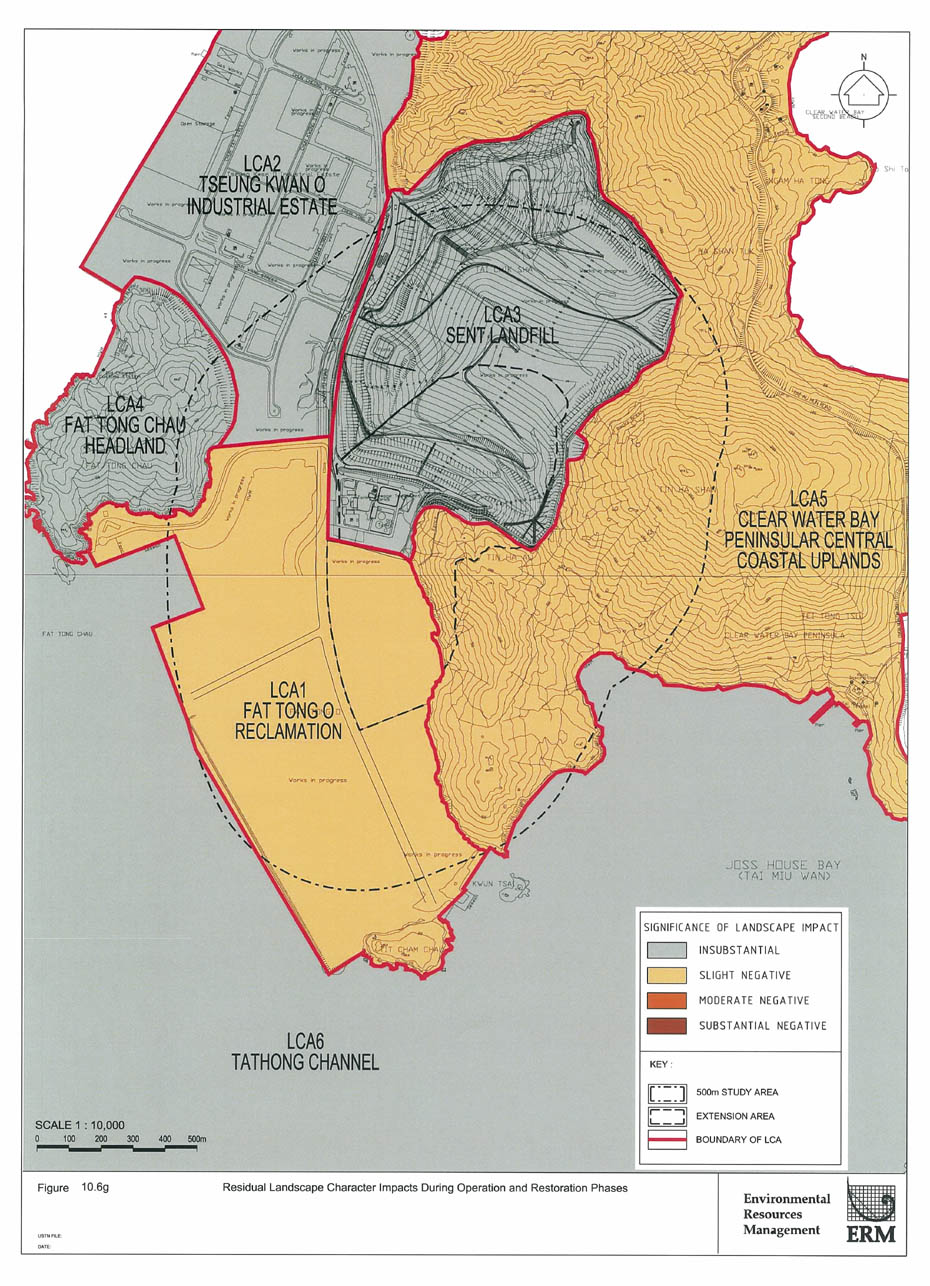
Figure 10.6g
Residual Landscape Character Impact During Operation and Restoration Phase
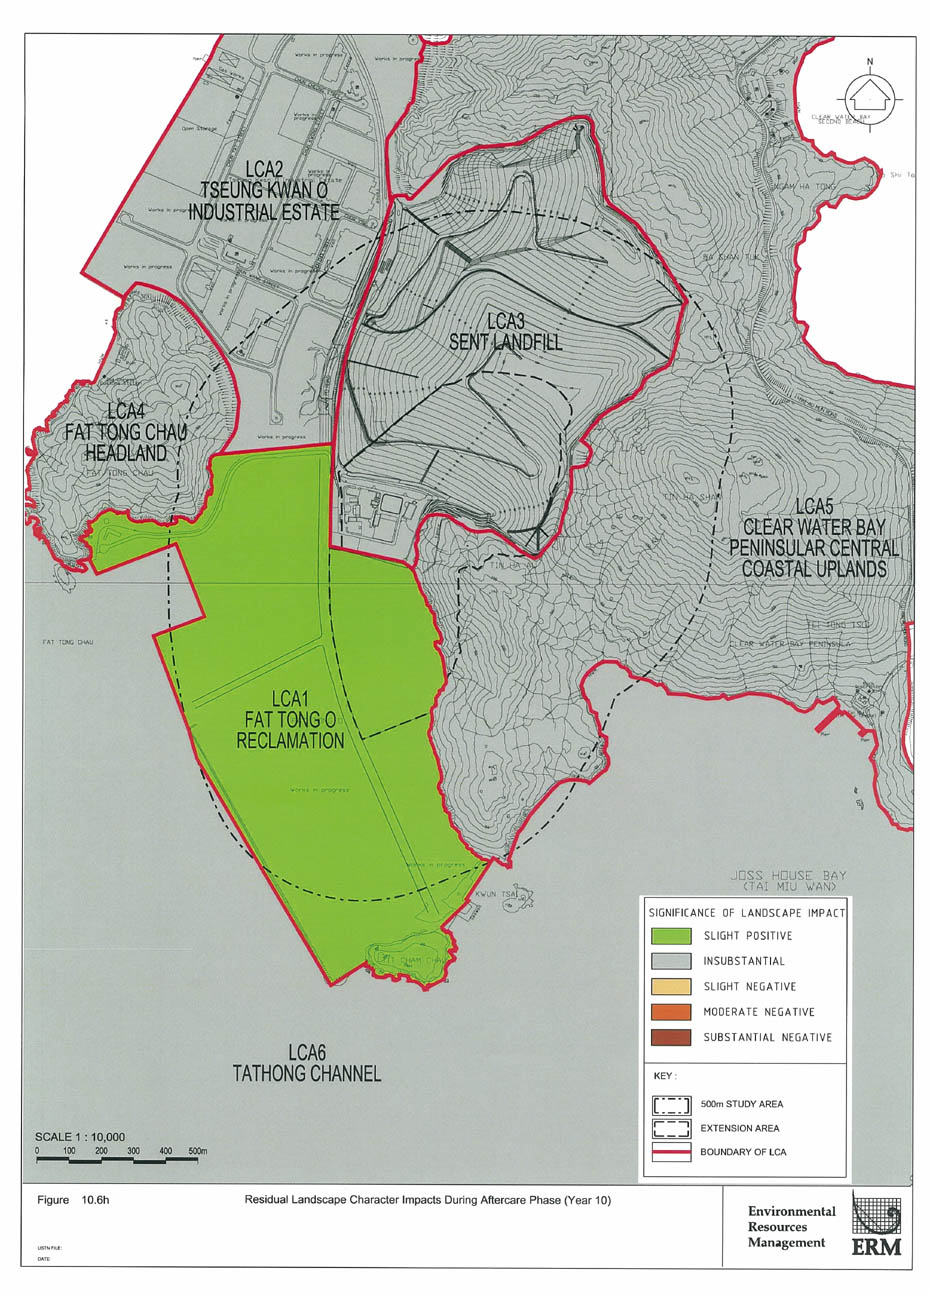
Figure 10.6h
Residual Landscape Character Impacts During Aftercare Phase (Year 10)
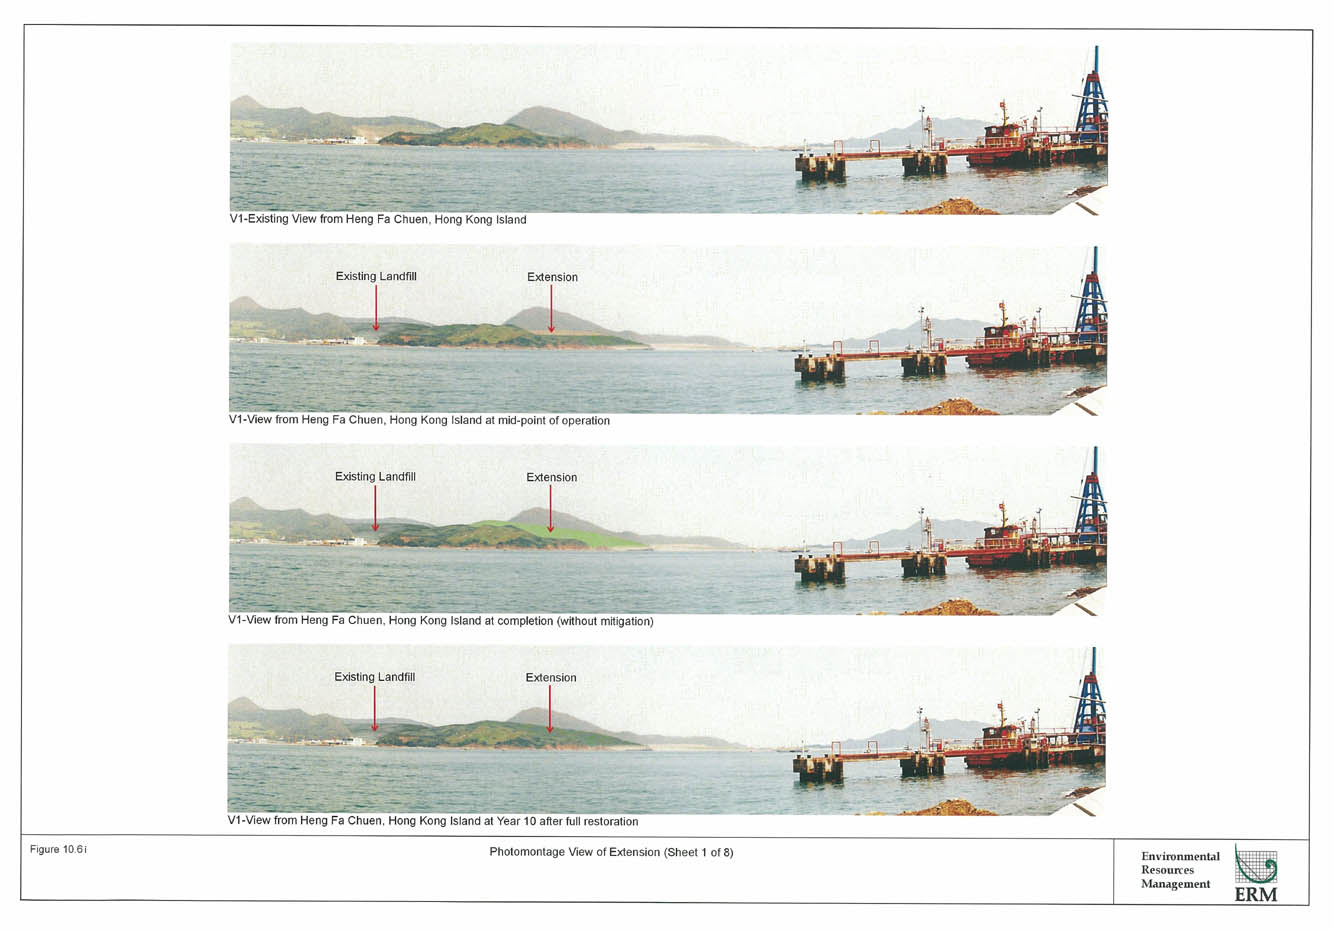
Figure 10.6i
Photomontage View of Extension (Sheet 1 of 8)
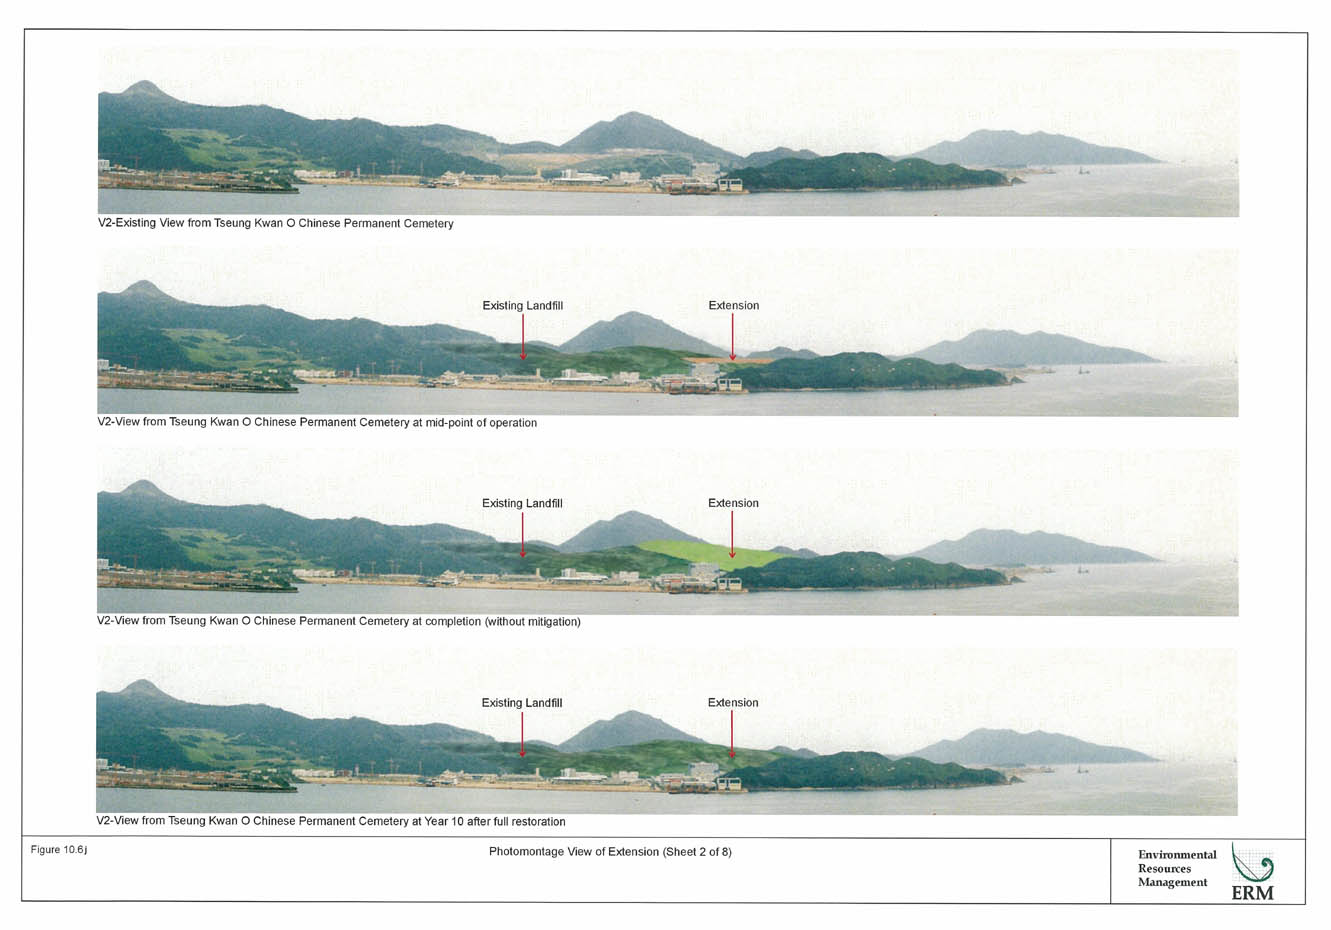
Figure 10.6j
Photomontage View of Extension (Sheet 2 of 8)
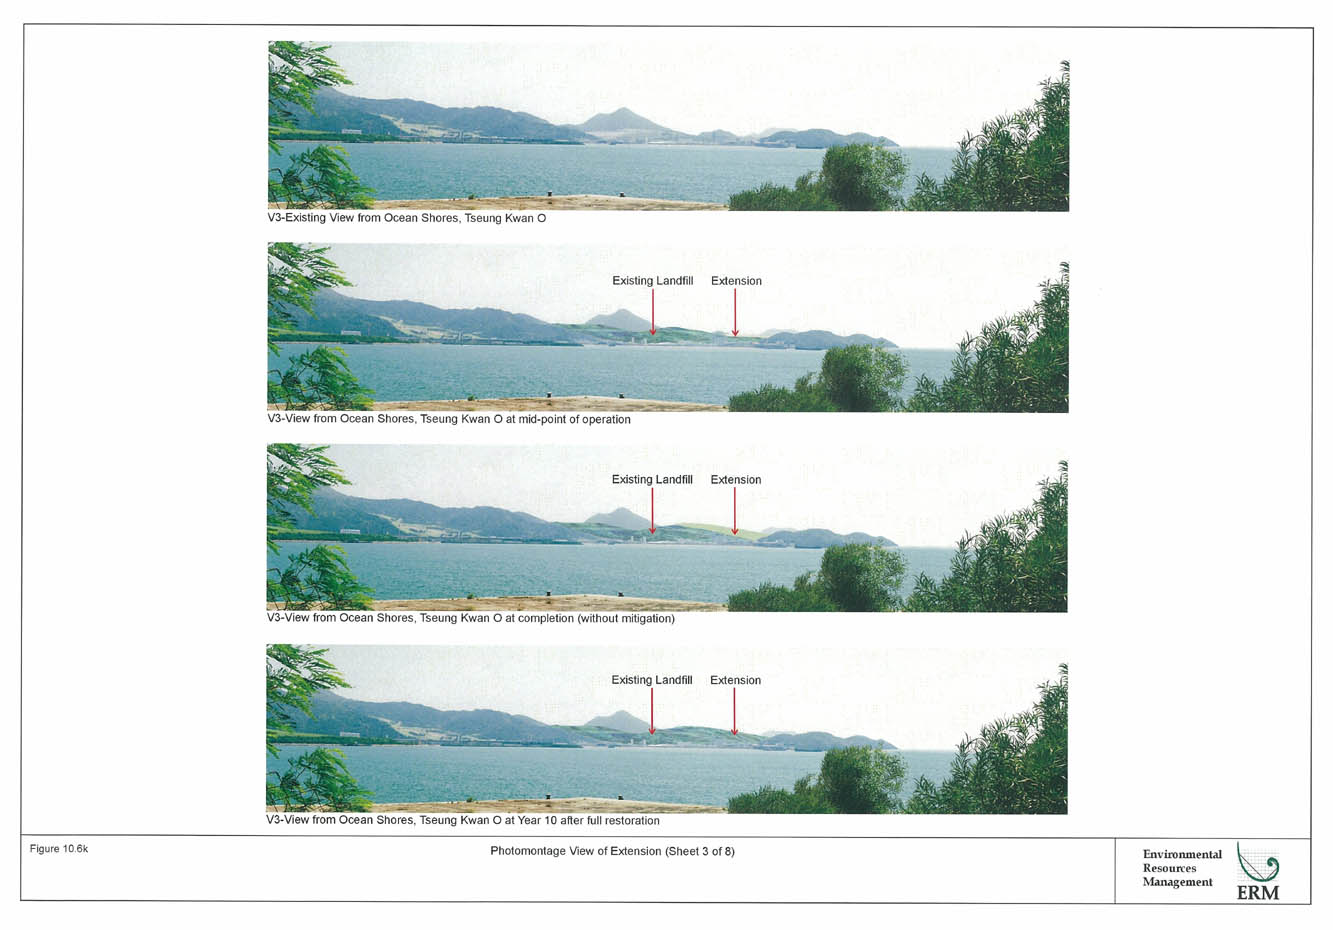
Figure 10.6k
Photomontage View of Extension (Sheet 3 of 8)
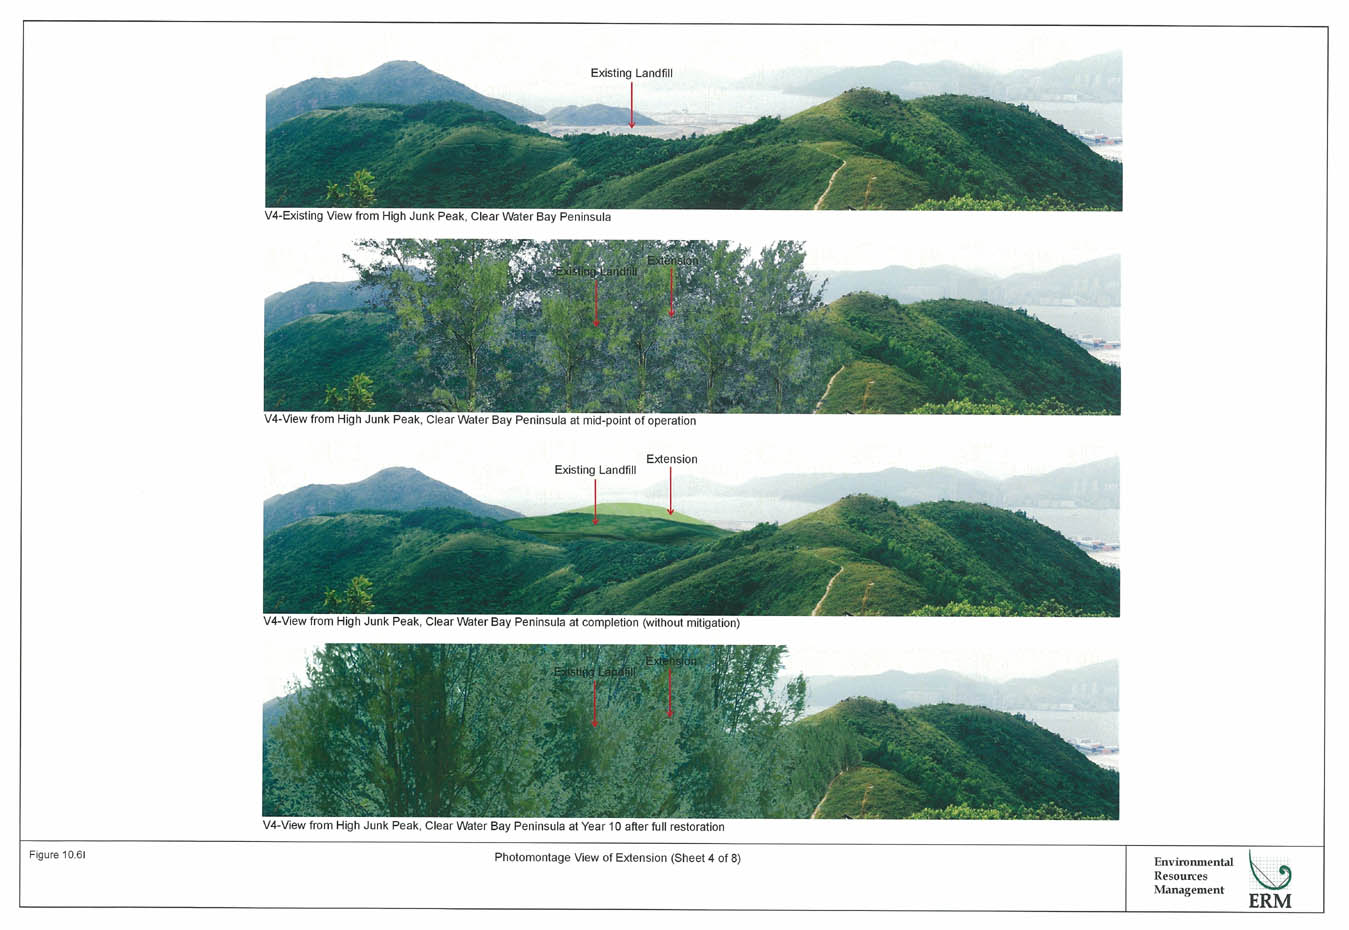
Figure 10.6l
Photomontage View of Extension (Sheet 4 of 8)
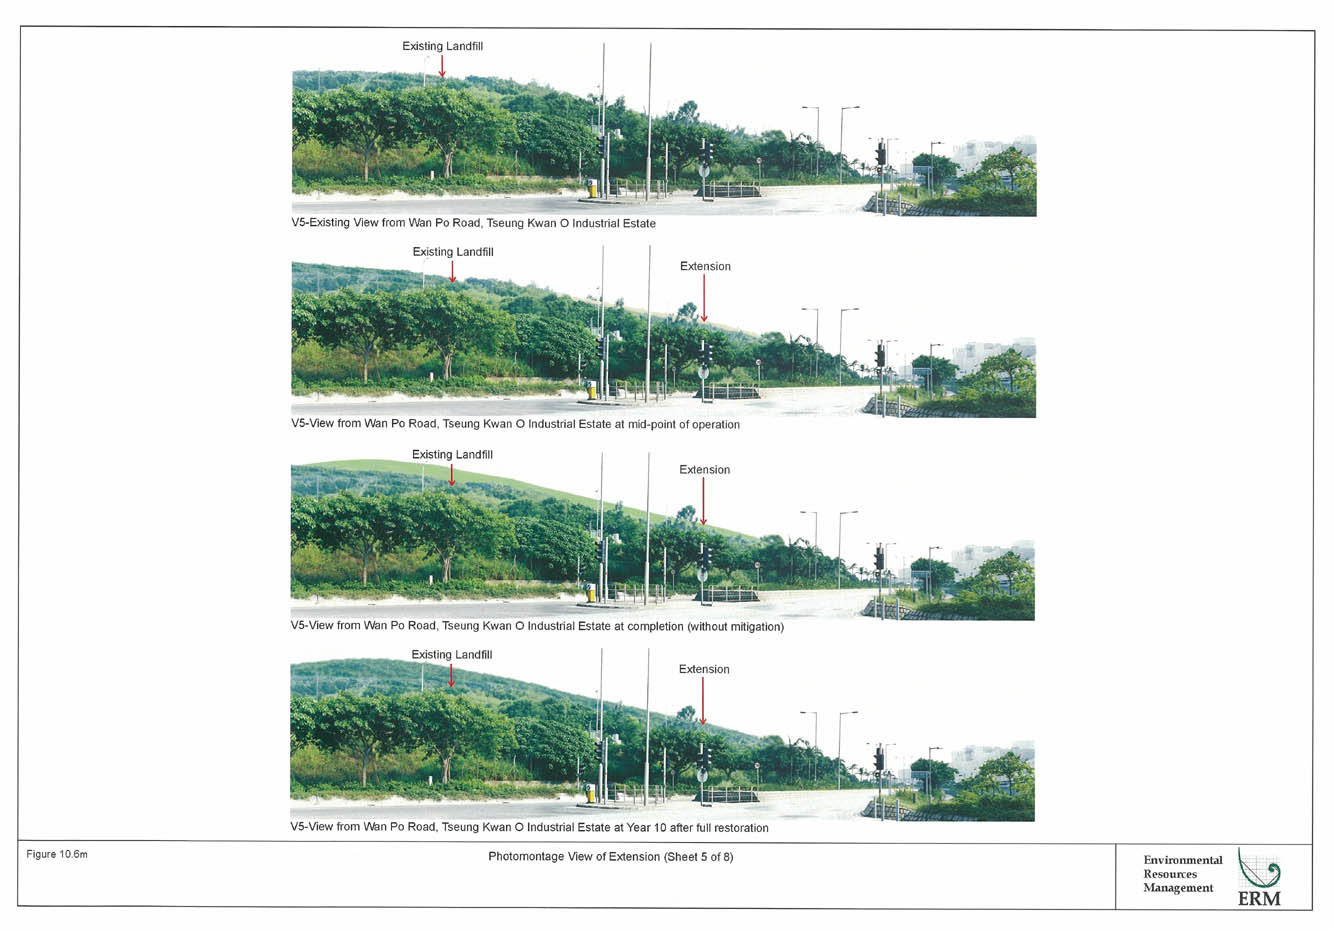
Figure 10.6m
Photomontage View of Extension (Sheet 5 of 8)
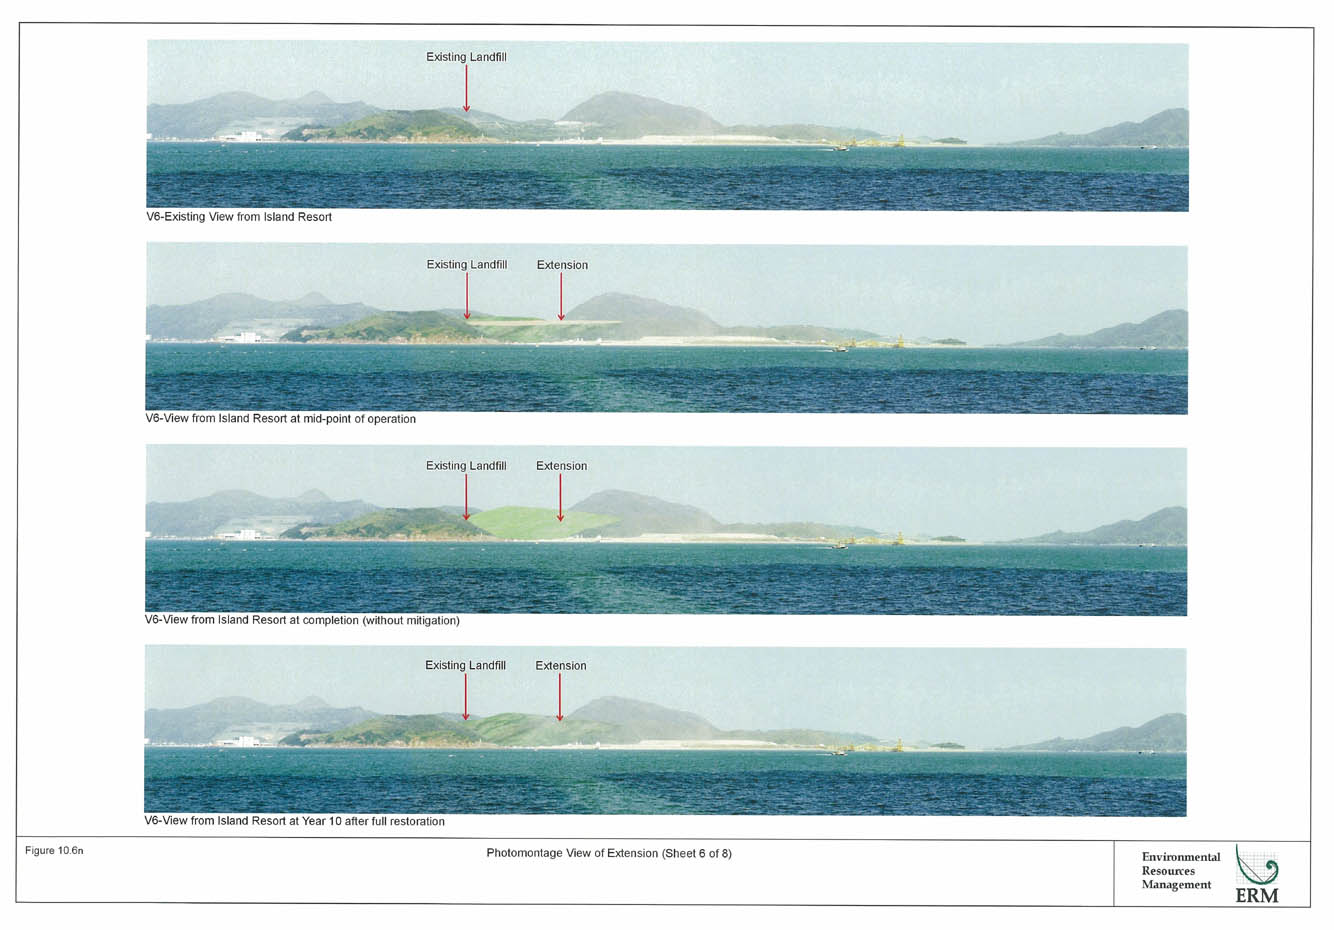
Figure 10.6n
Photomontage View of Extension (Sheet 6 of 8)
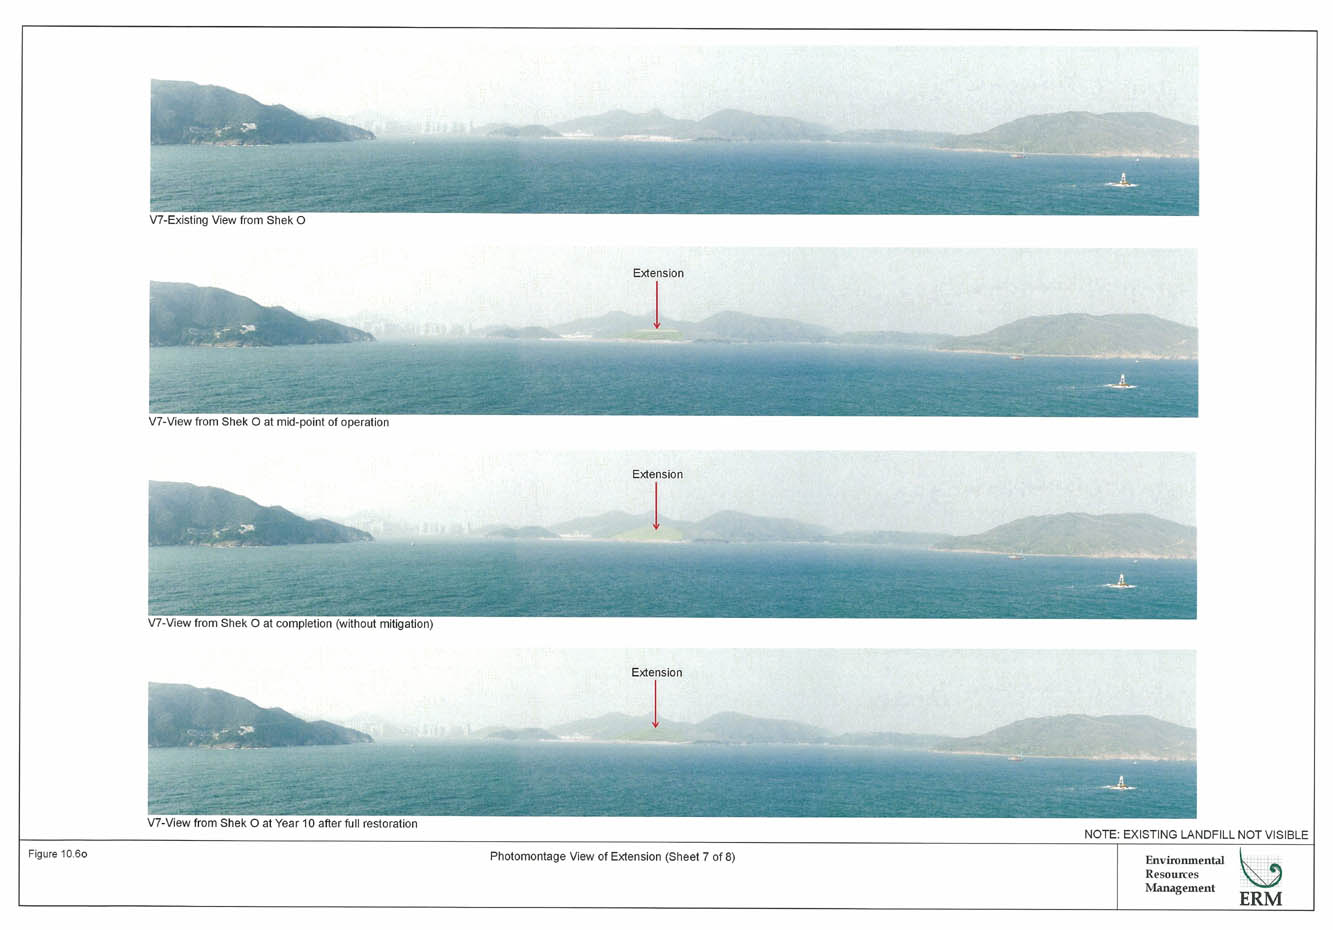
Figure 10.6o
Photomontage View of Extension (Sheet 7 of 8)
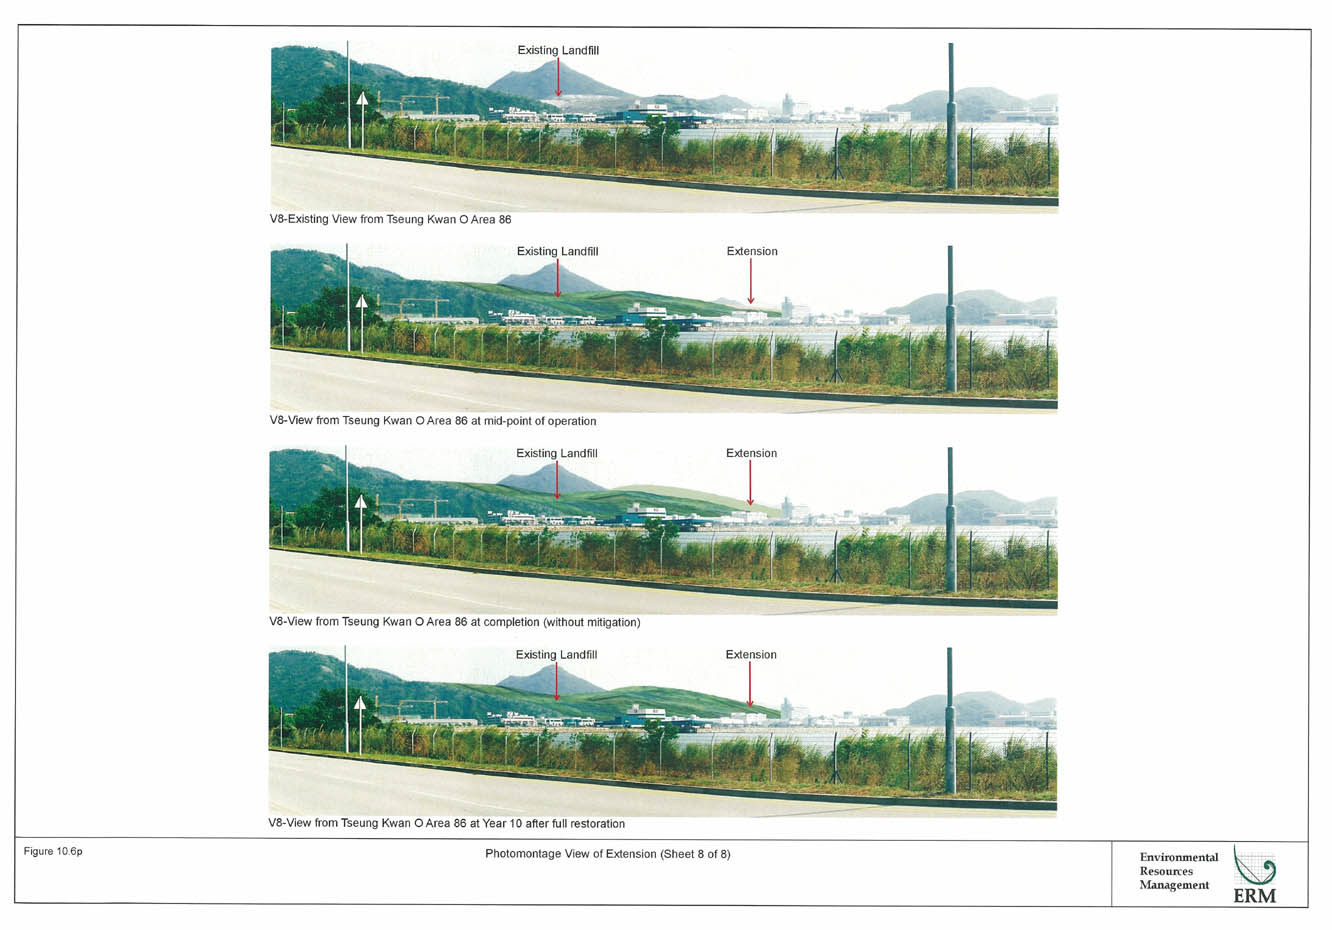
Figure 10.6p
Photomontage View of Extension (Sheet 8 of 8)
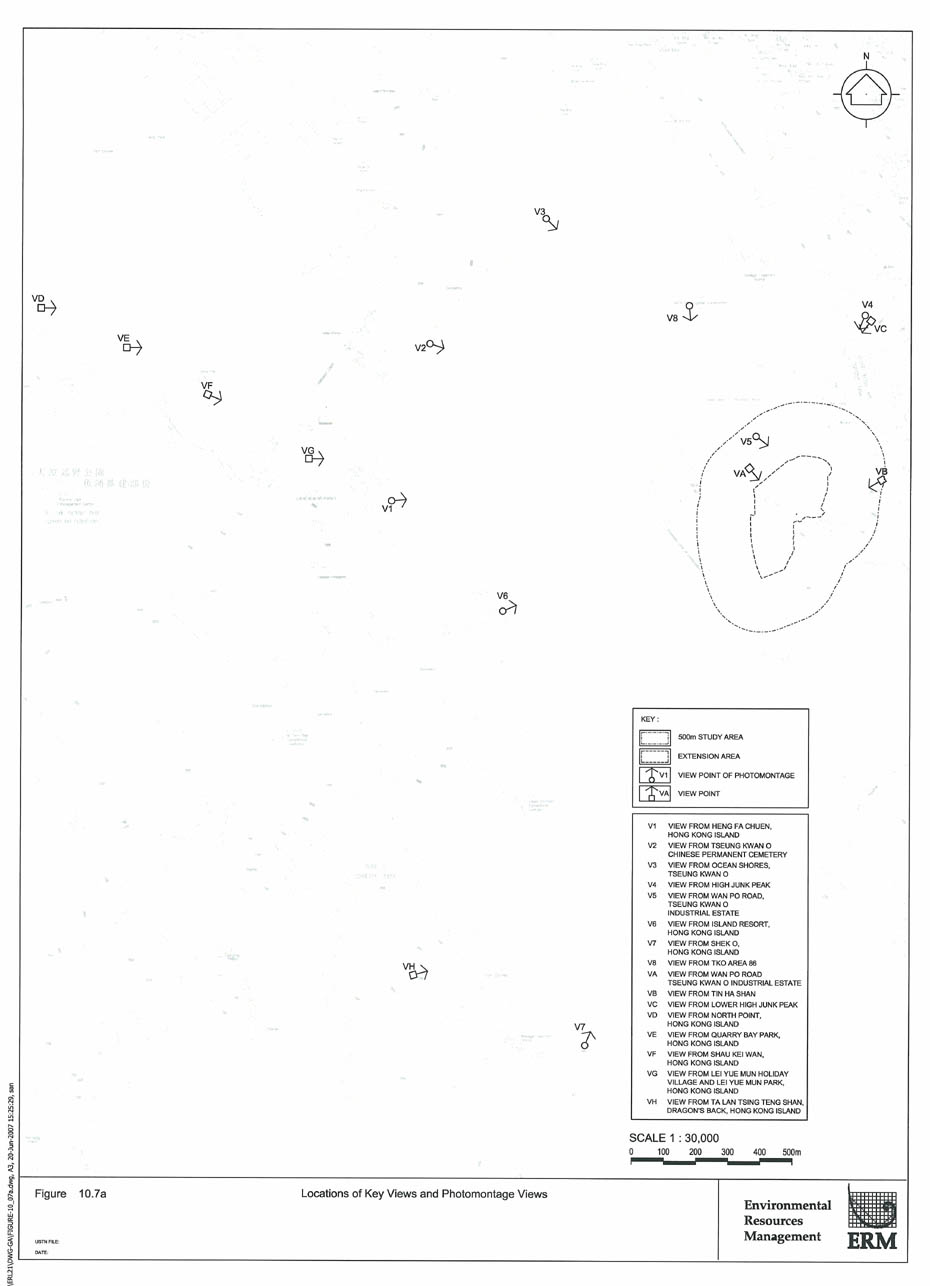
Figure 10.7a
Locations of Key Views and Photomontage Views
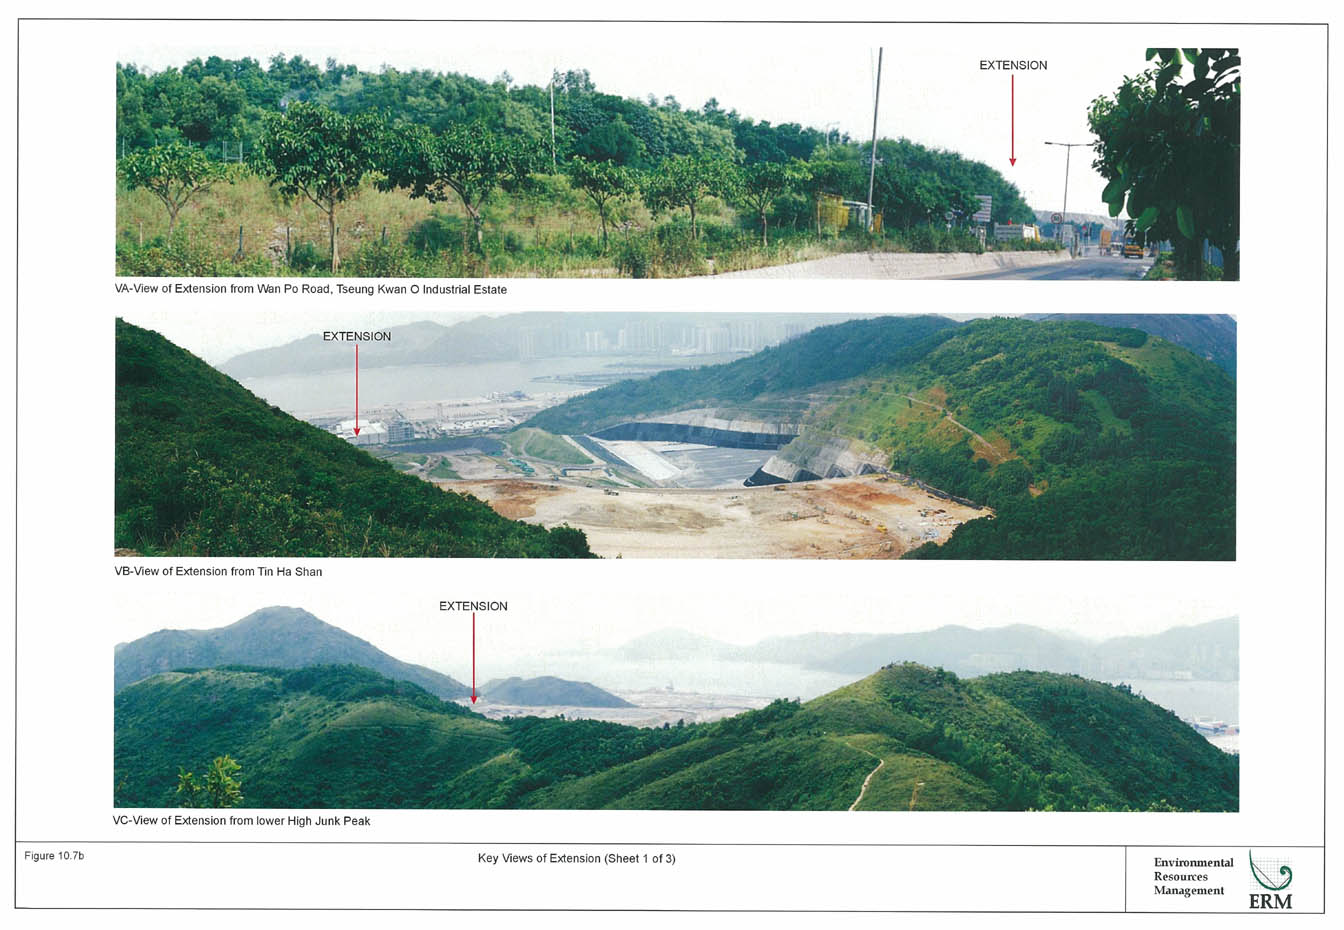
Figure 10.7b
Key Views of Extension (Sheet 1 of 3)
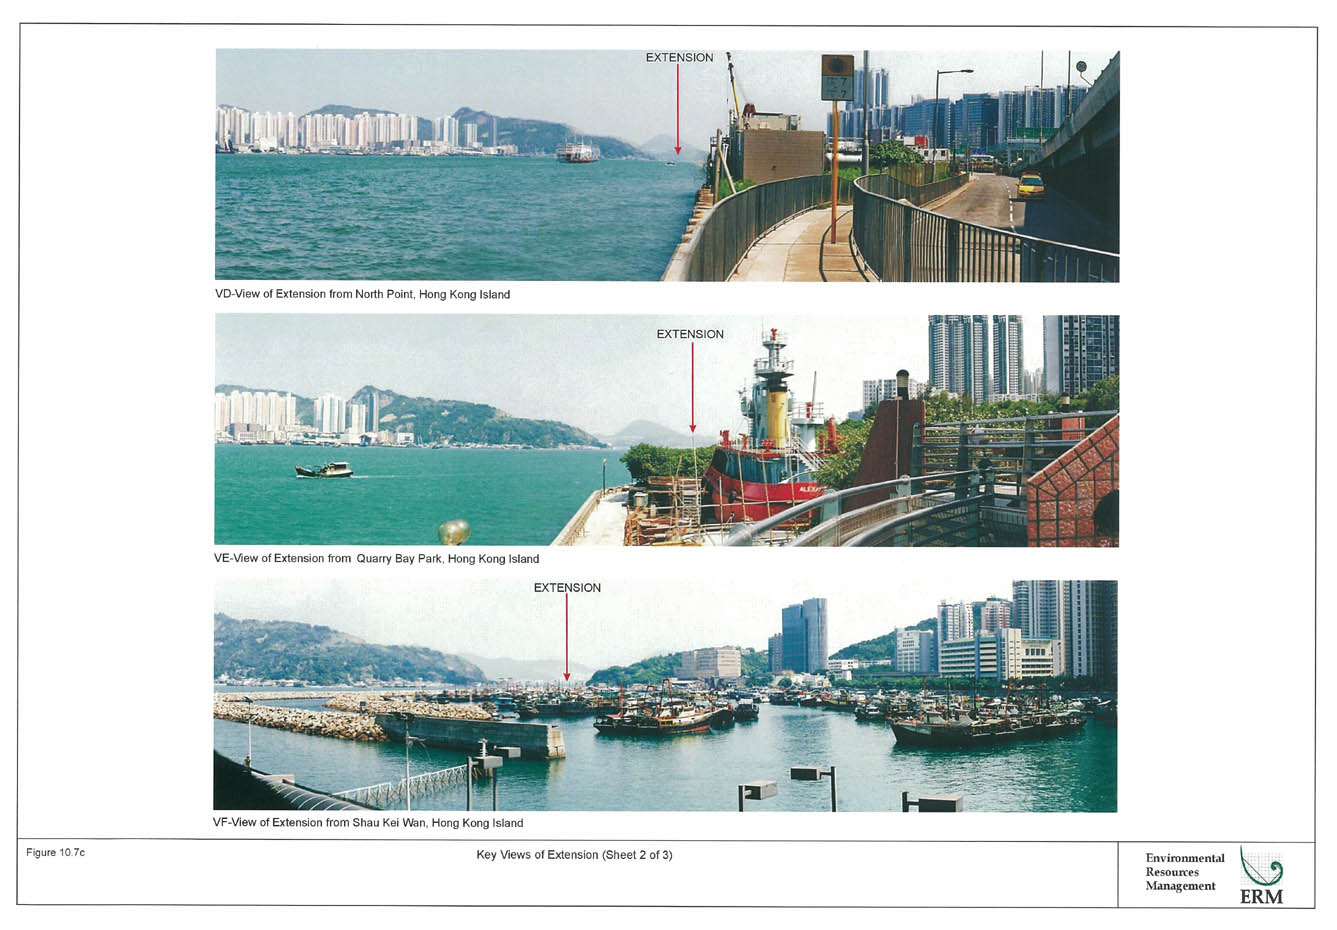
Figure 10.7c
Key Views of Extension (Sheet 2 of 3)
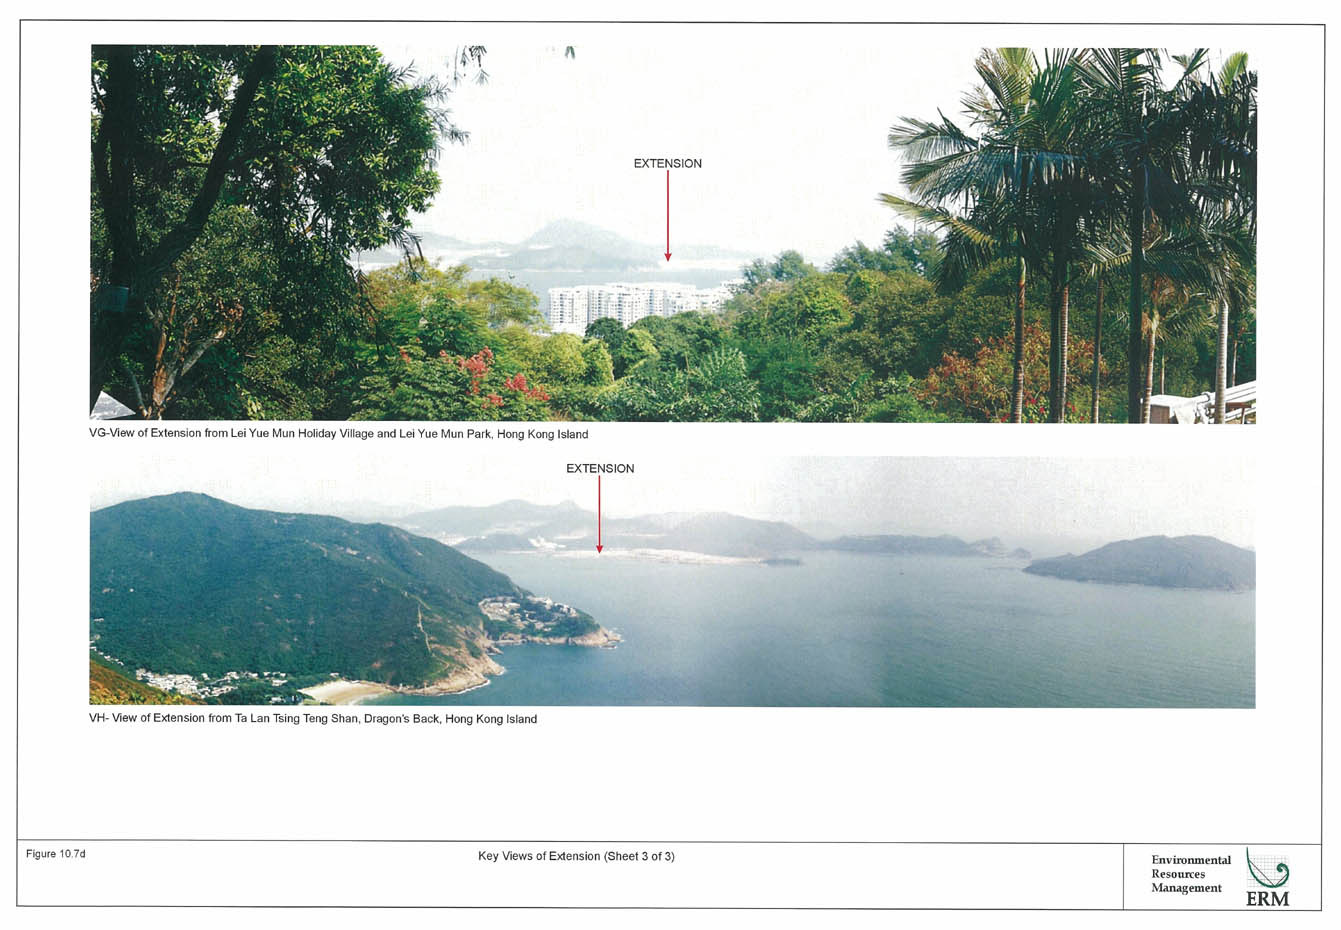
Figure 10.7d
Key Views of Extension (Sheet 3 of 3)
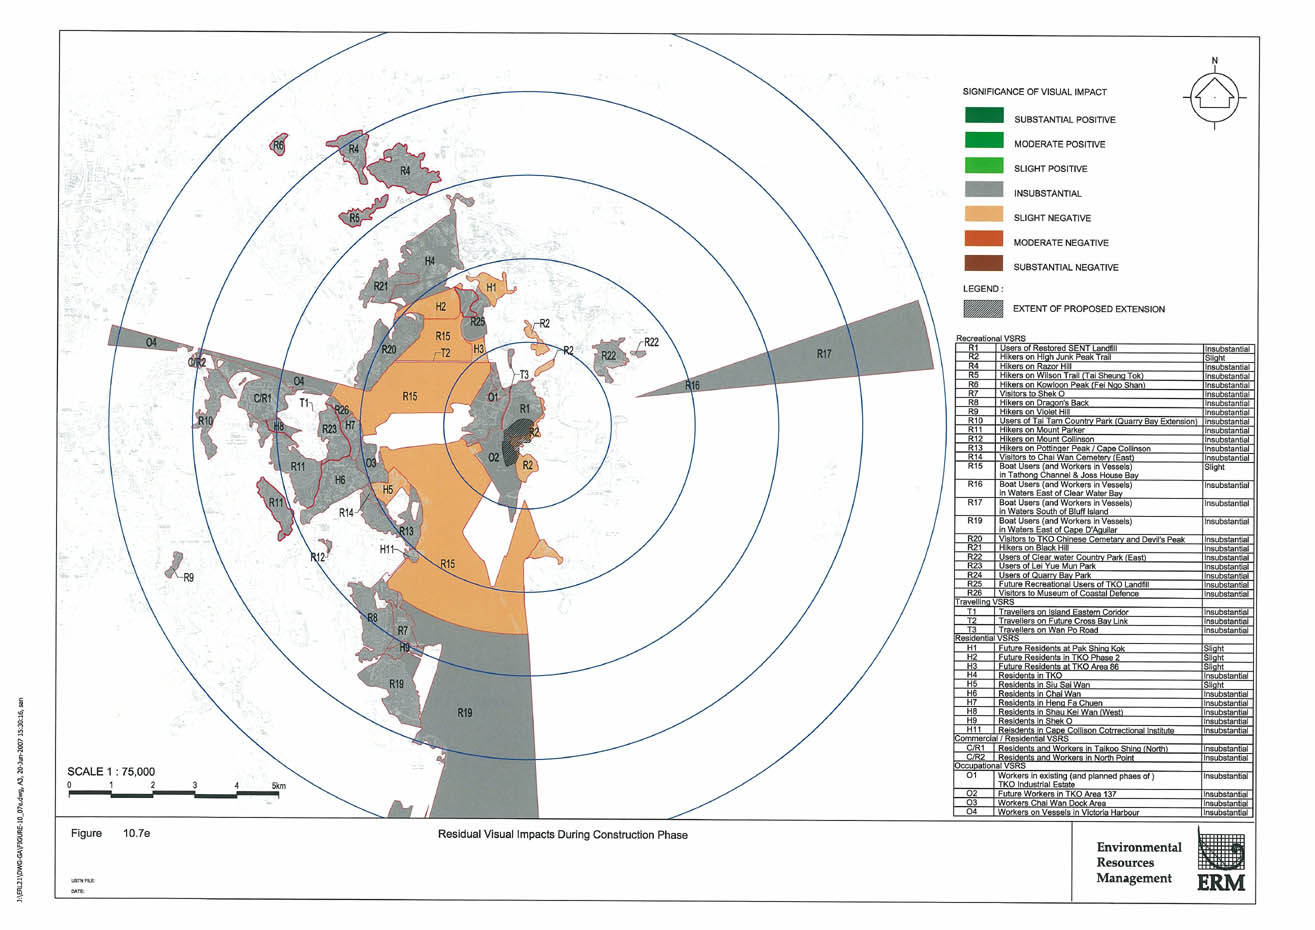
Figure 10.7e
Residual Visual Impacts During Construction Phase
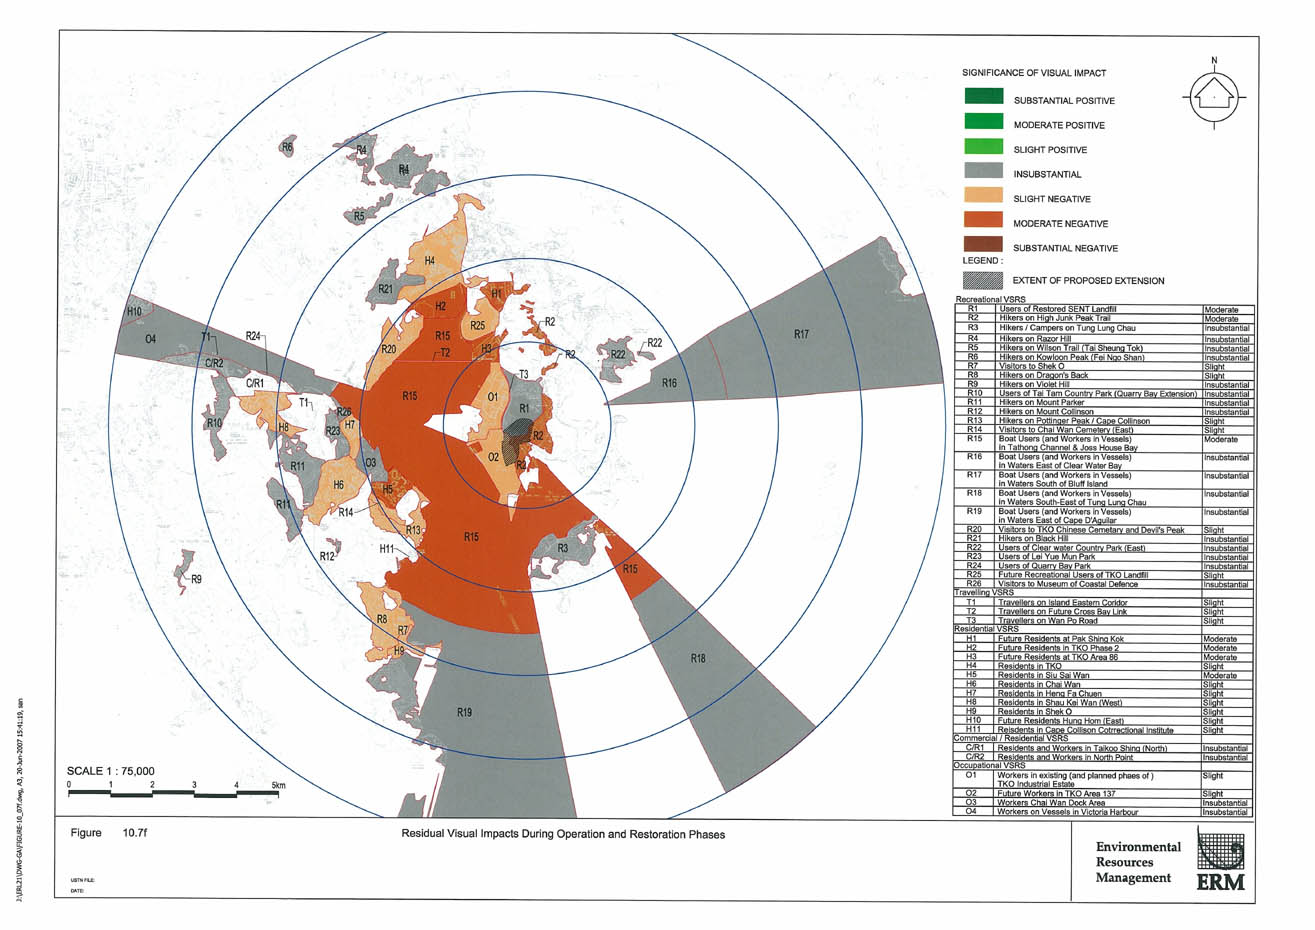
Figure 10.7f
Residual Visual Impacts During Operation and Restoration Phases
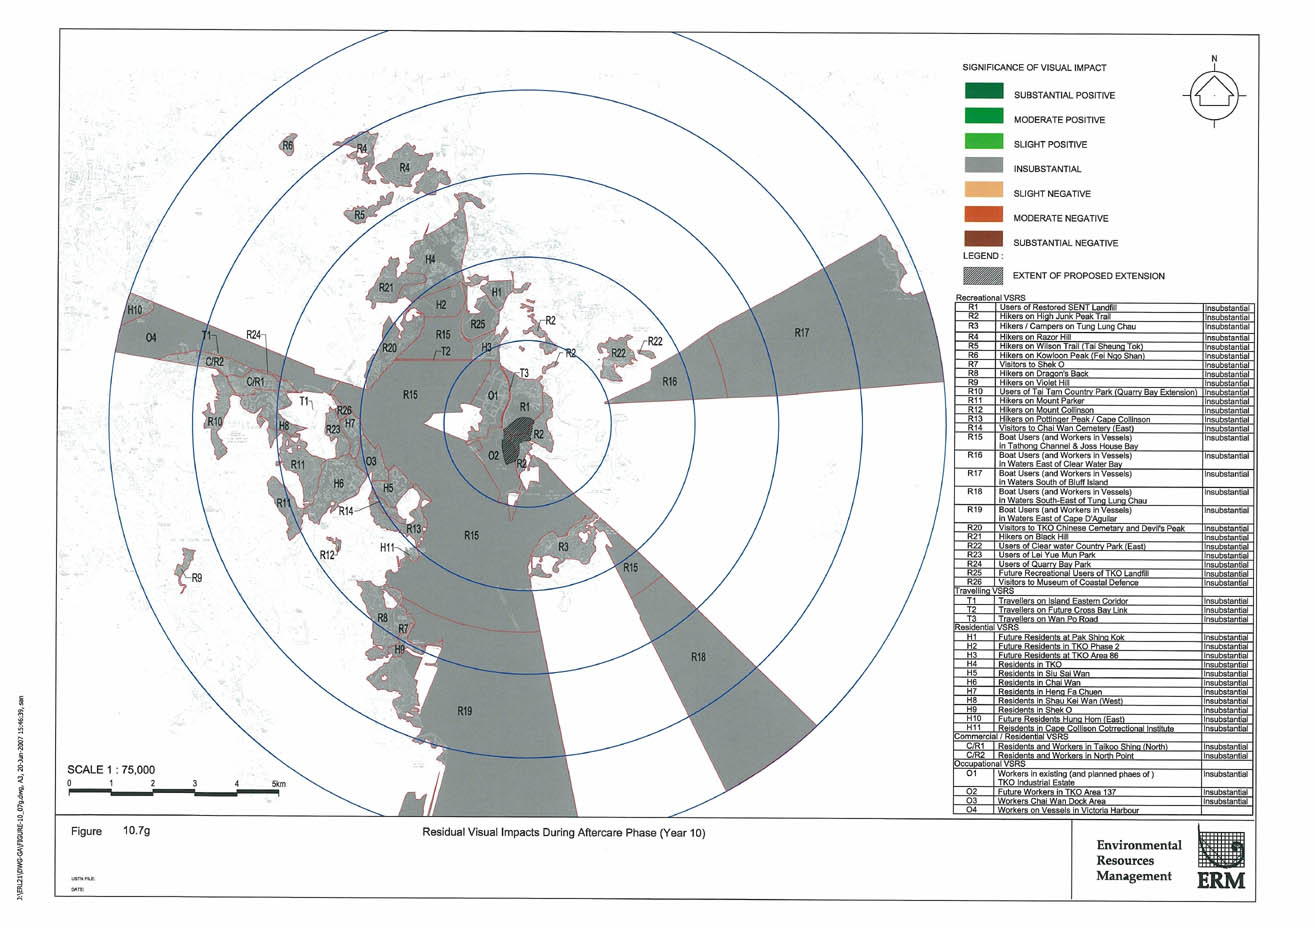
Figure 10.7g
Residual Visual Impacts During Aftercare Phase (Year 10)
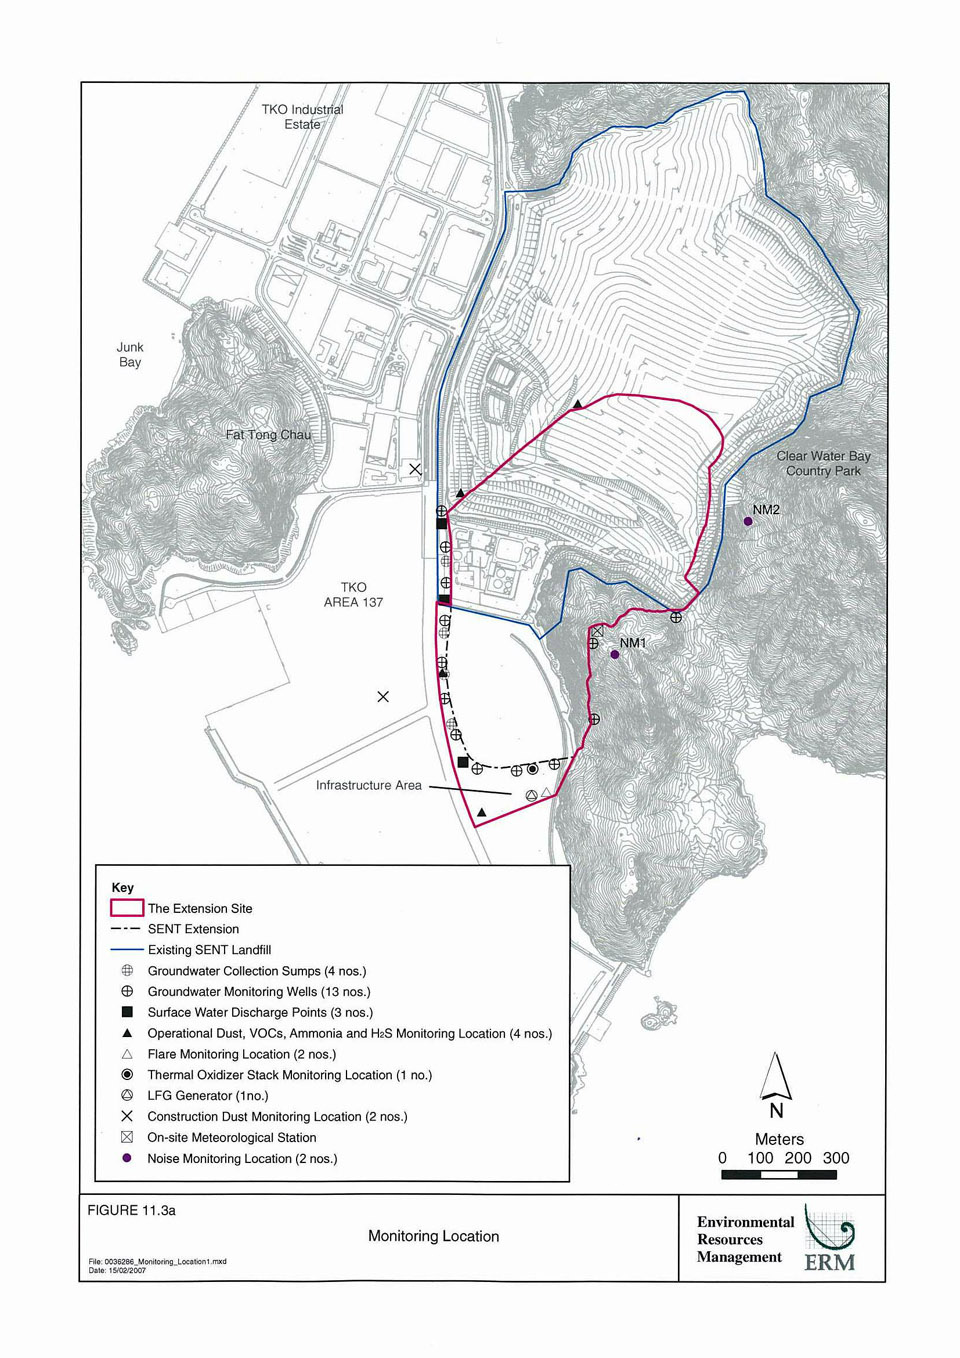
Figure 11.3a
Monitoring Location
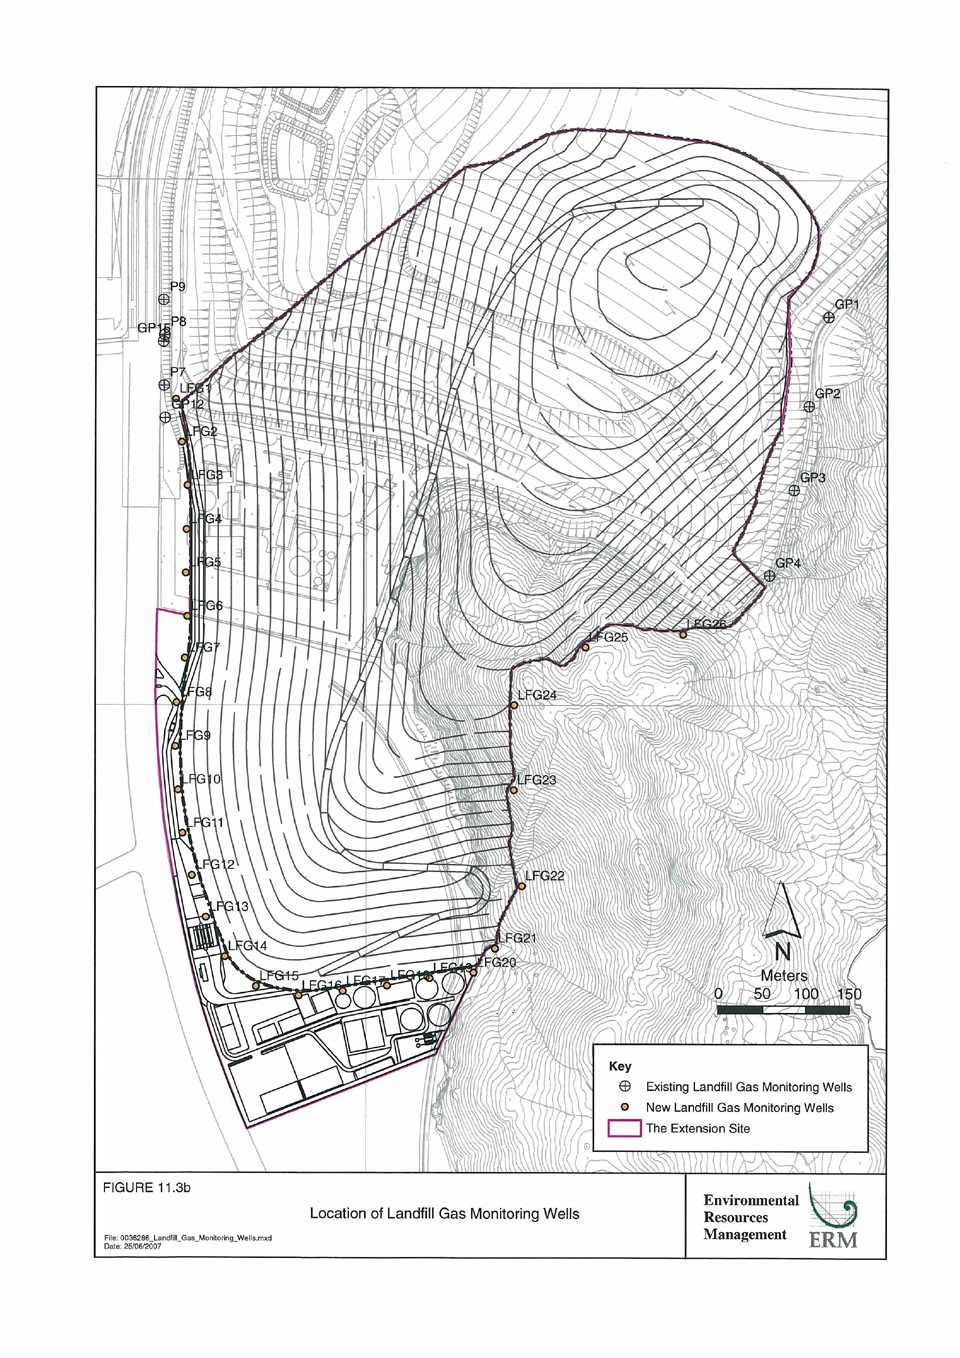
Figure 11.3b
Location of Landfill Gas Monitoring Wells