7.3 Legislation,
Standards & Guidelines
7.5 Baseline Conditions
and Sensitive Receivers – Desktop Study
7.6 Baseline Conditions and Sensitive
Receivers – Field Surveys
7.7 Construction Phase
Impact Assessment
7.8 Operation Phase
Impact Assessment
7.9 Mitigation &
Best Practices Measures
7.10 Environmental Monitoring &
Audit
7.11 Conclusions & Recommendations
7 Avifauna
7.1.1.1 This section presents the approach to and the findings of the ecological impact assessment of avifauna. The aim of the ecological impact assessment is to examine the avifauna and other components of the ecological habitats within the assessment area in order to protect, maintain or rehabilitate the natural environment. Special attention shall be paid to avoid impacts on wildlife groups or habitats / species with conservation interests including but not limited to migratory birds, breeding visitors and uncommon resident species.
7.1.1.2
There is extensive literature on the potential and actual effects that wind
farms have on birds (e.g. Percival, 2003
·
Loss of habitats or particular
foraging areas
·
Presenting a barrier to bird
movement
·
Displacing birds from the area
·
Adversely affecting birds’
feeding grounds or food sources
· Presenting a collision risk to birds.
7.1.1.3 The assessment shall identify and quantify the potential ecological impacts to the natural environment and the associated wildlife groups and habitats / species arising from the proposed Project including its construction and operation phases as well as the subsequent management and maintenance of the proposed development. The assessment has been conducted for installation of 67 nos. of 3MW turbines (Scenario A) and also for 40 nos. of 5MW turbines (Scenario B).
7.1.1.4 For the purpose of the avifauna impact assessment, the Study Area includes the wind farm area and its surroundings to a varying extent, depending on the specific elements being considered. These areas are defined as follows:
·
Desktop Study Area: the circled
area as displayed in Figure 7.1 to cover the sea area within approximately
·
Field Survey Area: covering the
wind farm area and an adjacent area of approximately
·
Assessment Area(s): the wind
farm area plus additional
7.1.1.1 The aim of the avifauna impact assessment is to consider all potential impacts upon resident and migratory bird species and their habitats from the construction and operation of the proposed Project. In this regard the duration and focus of the baseline surveys was expanded beyond the scope of the EIA Study Brief.
7.1.1.2 Specific objectives of the assessment include:
·
Collect information from
desktop study and field surveys to establish an ecological baseline for the assessment
area. The field surveys include both resident and migratory birds and covered a
20-month period
·
Identify and predict potential
ecological impacts during construction and operation of the proposed
development
·
Evaluate the significance and
acceptability of the identified impacts
·
Recommend effective and
practicable alternatives and mitigation measures
· Recommend the need for and the scope of an appropriate monitoring and audit programme.
7.2
Legislation, Standards
& Guidelines
7.2.1.1
Reference shall be made to local legislation governing flora, fauna and
habitat conservation. Directly relevant legislation includes:
7.2.1.2
Wild Animals Protection
Ordinance (Cap. 170) provides for the
protection of species listed in ' Schedule 2 ' of the Ordinance by prohibiting
the disturbance, taking or removal of such animals, their nests and eggs. This
Ordinance excludes fish and marine invertebrates, but does allow for the
protection of all marine mammals found in
7.2.1.3
Protection of Endangered
Species of Animals and Plants Ordinance (Cap. 586) gives effect in Hong Kong to the
Convention on International Trade in Endangered Species of Wild Fauna and Flora
signed in Washington D.C. on 3 March 1973
7.2.1.4 Regionally / internationally protected species: such as those species listed in the following:
·
International
·
Convention on International
Trade in Endangered Species (CITES)
·
List of National Key Protected
Species in the Mainland PRC
· Species considered sensitive and / or of local / regional / international conservation concerns by published literature.
7.2.1.5
EIA -TM (Annexes 8 and 16)
7.3.1 Desk-top Study Information Sources
7.3.1.1 A desktop study has been conducted to review records of migratory and resident avifauna that currently or may potentially utilise the Study Area. The information and data sources under review include:
·
Pilot Project to Increase
Awareness of the Ecological Importance of the Breeding Colonies of Terns in
·
Seabird Migration Survey in
Southern and South-eastern Hong Kong Waters, spring (HKBWS, 2006) (ECF Project
2005-10)
·
The Population and Breeding
Ecology of White-bellied Sea-eagles in
·
2002 – 2007 Monitoring Data of
White-bellied Sea Eagles in Hong Kong (Agriculture, Fisheries and Conservation
Department (AFCD), unpublished data)
·
The Avifauna of Hong Kong
(Carey et. al., 2001)
·
Tern Surveys
conducted by HKBWS (unpublished data)
·
The Birds of Hong Kong and
7.3.2 Approach for Conducting Field Surveys
7.3.2.1
Additional / novel field
surveys are necessary to supplement or to fill the information gap of the baseline
conditions generated from desktop study. Several types of field surveys have
been widely documented (e.g. Department for Environment, Food and Rural
Affairs, 2005
· Boat-based Survey
· Aerial Survey
· Radar Survey
7.3.2.2 Table 7.1 presents a summary of different types of bird surveys with regard to their documented advantages and limitations.
Table 7.1 Summary of Boat-based Survey, Aerial Surveys and Radar Surveys with Regard to Advantages and Limitations
|
Types of Surveys |
Advantages |
Limitations |
|
Boat-based Surveys |
· Most sensitive methods to detect obtrusive and low-flying birds · Good in identifying birds to species level · Allow collection of behavioural information on birds such as (feeding, movements between roosts, flight heights), and more detailed information on bird characters, e.g. age and sex. |
· Poor in estimating total numbers for large population of birds · Poor in terms of obtaining a snapshot of distribution at any one
time |
|
Aerial Surveys |
· Good in terms of obtaining a snapshot of distribution at any one
time · Allow surveys of large area at any one time · Allow good estimate of relative abundance and densities for large
population of birds across a seascape |
· Poor in terms of identifying obtrusive or low-flying birds · Poor in terms of identifying birds to species level · Unable to provide detailed information such as behaviour, flight height or direction. |
|
Radar Surveys |
· Allow surveys during night time · Allow quantification of marked passage movements by significantly large flocks of migrating or moving birds |
· Poor to provide information for bird identification · Sensitive to human disturbance · Only allow collection of information at fixed points. |
7.3.2.3
Based on the results of desk-top study as conducted under Sub-section 7.5, the most appropriate type of survey
methodology has been selected to conduct the field survey as described under Sub-section 7.6.
7.3.3 Collision
Risk Impact Assessment
& Evaluation
Collision
Risk Calculation
7.3.3.1
Several
collision risk models for wind farm birds have been developed in recent years.
Among these models the Scottish Natural Heritage (SNH)
bird collision risk model (Band et al,
2007) is regarded as generally robust and has been most frequently used for
several years in Scotland and more recently in the rest of the UK (Madders and
Whitfield, 2006). This model has
been adopted for this EIA Study as presented under Sub-section
7.8.
7.3.3.2
Collision
calculation is based on the worst-case wind farm configuration, being that with
the largest blade pitch angle (relative to the rotor plane of the turbine), the
smallest rotation period of turbines (the fastest speed of the blade), the
maximum bird sizes, and the slowest flight speed of the bird obtained from
available documentation or literature.
Table 7.2 displays the worst-case
configuration for the two proposed turbine options.
Table 7.2 Configuration
of the Proposed Turbine Options
|
Variables |
Scenario A |
Scenario B |
|
Risk Area of the wind farm (WF + |
|
|
|
Rotor diameter |
|
|
|
Number of turbines |
67 |
40 |
|
Rotation period |
3.33 seconds |
4.96 seconds |
7.3.3.3
Collision
risk calculations have been prepared for two behaviour scenarios: one extreme worst-case
scenario that assumes birds take no action to avoid collision, and one
recognizing that most birds do take avoiding action (Band et al, 2007). For the
latter behavioural scenario a “conservative” 95% ‘avoidance factor’ has been
applied as suggested by the SNH guidelines (http://www.snh.org.uk).
7.3.3.4
Stage 1 of
the model predicts the number of bird flying through rotors based on field
observations. In Stage 2, the model predicts the
probability (collision probability) of a bird to be hit by a wind farm turbine
when it makes a transit through a rotor. Unlike Stage 1, the collision
probability is independent of the abundance of birds (i.e. independent of field
data) but depends only on the size of a bird (wingspan / bird length) and its
flight speed.
Number of Birds Flying Through Rotors (Stage 1)
7.3.3.5
Under
Stage 1 of the model, the amount of flight activity within the proposed wind
farm site was quantified and expressed by the number of “bird transits” per
season (as defined in sub-sections
1.
Identify a
‘flight risk volume’ (Vw):
This value was taken as the risk area of the
wind farm multiplied by the rotor diameter. The risk area was taken as
2.
Calculate
the combined volume swept out by the wind farm rotors (Vr):
Vr = N x πR2 x (d + l) where N is the number
of wind turbines, d is the depth of the rotor back to front, and l is the
length of the bird.
3.
Estimate
the proportion (Pw) of the time that the species spent flying within
the flight risk volume (Vw) in each bird season (this will be
defined in the “Field Survey Methodology” under sub-section
To allow the use of the model, the point count
data obtained from the field survey were converted into time budget data for
bird activity in the wind farm area under observation. The time budget (in
“bird seconds”) for flight activity was predicted from the survey data
collected at the five fixed-point count locations (P3 to P7) at the proposed
wind farm. At each location, a circular “visible envelope” of
Except for raptors and birds in near-shore
area, the majority of birds sighted in the offshore environment (the proposed
wind farm site) were observed in straight flight. For a bird in straight flight
within the visible envelope, the longest time for it to become lost from the
observer would therefore be the time for it to travel
The flight activity (Pw : proportion
of time that a species spent flying within the “flight risk volume (Vw)”)
was then taken as the bird seconds spent by the species within the risk area
(taken as the wind farm area plus
4.
Estimate
the bird occupancy (nw) within the flight risk volume in each
season/ survey period:
nw = Pw x daily usage x site usage
Daily
usage by the bird was assumed as 7 hours per day
(i.e. the average survey duration of the whole Study Area per trip, of which
birds were assumed most active in the Study Area)
Site
usage by the bird species was estimated from the
duration of species that persisted in each bird season plus a 3-day buffer
period from the starting and ending dates of the survey period. This was taken
as the number of days between the first and the last calendar dates for which
the species persisted in the study area plus 6 days (as a buffer period).
5.
Calculate
the bird occupancy of the volume swept by the rotors (nr):
nr = nw x (Vr / Vw)
(in bird seconds)
6.
Calculate
the time (t) taken for a bird to make a transit through the rotor and
completely clear the rotors:
t = (d + l) / v where v m/s is the speed of the
bird through the rotor
7.
Calculate
the number of bird transits through the rotors:
Number of birds transits through rotors = nr
/ t
Collision Likelihood (Stage 2)
7.3.3.6
The
probability of a bird flying through a rotor being hit depends on the size of
the bird (both length and wingspan), the breadth
and pitch of the turbine blades, the rotation speed of the turbine, and the
speed of the bird. Appendix
7B
displays a sample of the spreadsheet containing calculations of the collision
probabilities.
Impact Evaluation
7.3.3.7
A recognized assessment
methodology developed by Scottish Cultural Heritage (SNH) and British Wind
Energy Association (BWEA) (Percival et al,
1999
· Where no important bird populations are identified in the vicinity of the proposed development, or
· Where important bird populations have been identified but where there is substantive evidence that a significant impact will not occur.
7.3.3.8 Given the recent development of offshore wind farms and a limited research base on how bird populations are affected by these developments the second position is difficult to achieve at this time. Therefore, a precautionary approach should be considered to avoid important protected areas or populations of birds for any new offshore developments. The assessment methodology developed by SNH and BWEA provides a framework (in a form of cross-tabulation matrix as presented in Table 7.5) to indicate significance of impact of offshore wind farm development on birds by giving priority to species / populations of high sensitivity in rating impact significance.
7.3.3.9 The assessment approach consists of three stages:
1. Determination of the sensitivity of the feature potentially affected (Table 7.3)
2. Determination of magnitude of effects on birds (Table 7.4)
3. Assessing the significance of the potential impacts by using cross-tabulation of “Sensitivity” and “Magnitude” (Table 7.5)
Table 7.3 Determination of Ornithological Significance
|
Sensitivity |
Determination Factor |
|
Very High |
Cited interest of Special Protection Areas (SPAs) (strictly
protected sites classified under the Bird Directive in In Hong Kong, since there is no designated areas particularly for protection of birds, areas designated as the Sites of Special Scientific Interests (SSSIs) in regard of their ornithological importance are considered of “Very High” sensitivity to potential wind farm impacts in this study. |
|
High |
Other species that contribute to the integrity of a designated area for conservation. Local population of more than 1% of the national population of a species. Ecologically sensitive species, e.g. Accipitridae raptors and Sternidae terns (Langston & Pullan, 2006) |
|
Medium |
Regionally important population of a species, either because of population size or distributional context. |
|
Low |
Any other species of conservation interest not covered above. |
Table 7.4 Determination of Magnitude of Effects on Birds
|
Magnitude |
Definition |
|
Very High |
Total loss or very major alternation to key elements/ features of baseline conditions such that post development character/ composition/ attributes will be fundamentally changed and may be lost from the site altogether. Guide: >80% of population / habitat loss |
|
High |
Major alternation to key elements/ features of the baseline (pre-development) conditions such that post development character/ composition/ attributes will be fundamentally changed. Guide: 20 – 80% of population/ habitat loss |
|
Medium |
Loss or alternation to one or more key elements/ features of the baseline conditions such that post development character/ composition/ attributes of baseline will be partially changed. Guide: 5 – 20% of population/ habitat loss |
|
Low |
Minor shift away from baseline conditions. Change arising from the loss/ alternation will be discernible but underlying character/ composition/ attributes of baseline condition will be similar to pre-development circumstances/ patterns. Guide: 1 – 5% of population/ habitat loss |
|
Negligible |
Very slight change from baseline condition. Change barely distinguishable, approximating to the “no change” situation. Guide: <1% of population/ habitat loss |
Table 7.5 Matrix of Magnitude and Sensitivity for Determination of Impact Significance
|
Magnitude |
Sensitivity |
||||
|
|
Very High |
High |
Medium |
Low |
|
|
Very High |
Very High |
Very High |
High |
Medium |
|
|
High |
Very High |
Very High |
Medium |
Low |
|
|
Medium |
Very High |
High |
Low |
Very Low |
|
|
Low |
Medium |
Low |
Low |
Very Low |
|
|
Negligible |
Low |
Very Low |
Very Low |
Very Low |
|
7.4
Baseline Conditions and
Sensitive Receivers – Desktop Study
7.4.1
Migratory and Visitor
Seabird Populations
7.4.1.1
The most updated published
checklist of Hong Kong avifauna, “The Avifauna of Hong Kong” (Carey et al, 2001) documents a total of 41
seabird species recorded in
7.4.1.2
There are also three seabird
species recently recorded in Hong Kong Waters: Vega Gull Larus vegae in
7.4.1.3
Table 7.6 summarises all these 45 migratory / visitor seabird species that
have been recorded in
Table 7.6 Migratory
and Visitor Seabird Species in
|
Seabirds |
Principal Status* |
Recorded in E / SE Waters? |
|
Family Alcidae (Auks) |
|
|
|
Ancient Murrelet Synthliboramplus antiquus |
W |
Yes |
|
Family Fregatidae (Frigatebirds) |
|
|
|
Christmas Island Frigatebird Fregata andrewsi |
- |
No |
|
Lesser Frigatebird Fregata ariel |
OV |
Yes |
|
Great Frigatebird Fregata minor |
- |
Yes |
|
Family Laridae (Gulls) |
|
|
|
Brown-headed Gull Larus brunnicephalus |
W, M |
No |
|
Mew Gull Larus canus |
M |
No |
|
Yellow-legged Gull Larus cachinnans |
W, M |
Yes |
|
Black-tailed Gull Larus crassirostris |
W, M |
Yes |
|
Slender-billed Gull Larus genei |
- |
No |
|
Glaucous-winged Gull Larus glaucescens |
M |
No |
|
Heuglin’s Gull Larus heuglini |
W, M |
Yes |
|
Glaucous Gull Larus hyperboreus |
- |
No |
|
Pallas’s Gull Larus ichthyaetus |
W, M |
Yes |
|
Little Gull Larus minutus |
- |
No |
|
Relict Gull Larus relictus |
- |
No |
|
Black-headed Gull Larus ridibundus |
W, M |
No |
|
Saunders’s Gull Larus saundersi |
W, M |
No |
|
Slaty-backed Gull Larus schistisagus |
W, M |
Yes |
|
Vega Gull Larus
vegae |
- |
No |
|
Black-legged Kittiwake Rissa tridactyla |
- |
No |
|
Family Pelecanidae
(Pelicans) |
|
|
|
Dalmatian Pelican Pelecanus crispus |
W |
No |
|
Family
Phaethontidae (Tropicbirds) |
|
|
|
White-tailed Tropicbird Phaethon lepturus |
- |
Yes |
|
Family Phalacrocoracidae
(Cormorants) |
|
|
|
Japanese Cormorant Phalacrocorax capillatus |
- |
Yes |
|
Great Cormorant Phalacrocorax carbo |
W |
No |
|
Family Procellariidae
(Shearwaters) |
|
|
|
Streaked Shearwater Calonectris leucomelas |
- |
Yes |
|
Short-tailed Shearwater Puffinus tenuirostris |
- |
Yes |
|
Family Scolopacidae
(Sandpipers) |
|
|
|
Red Phalarope Phalaropus fulicarius |
- |
No |
|
Red-necked Phalarope Phalaropus lobatus |
M |
Yes |
|
Family Sternidae (Terns) |
|
|
|
Whiskered Tern Chlidonias hybridus |
M |
Yes |
|
White-winged Tern Chlidonias leucopterus |
M |
Yes |
|
Aleutian Tern Sterna aleutica |
AM |
Yes |
|
Bridled Tern Sterna anaethetus |
Su, M |
Yes |
|
Gull-billed Tern Sterna nilotica |
M |
Yes |
|
Caspian Tern Sterna caspia |
M |
Yes |
|
Common Tern Sterna hirundo |
M |
Yes |
|
Roseate Tern Sterna dougallii |
Su |
Yes |
|
Black-naped Tern Sterna sumatrana |
Su |
Yes |
|
Sooty Tern Sterna fuscata |
- |
Yes |
|
Little Tern Sterna albifrons |
M |
Yes |
|
Greater Crested Tern Strena bergii |
- |
Yes |
|
Family Stercorariidae
(Jaegers and Jaegers) |
|
|
|
Long-tailed Jaeger Stercorarius longicaudus |
SpM |
Yes |
|
Parasitic Jaeger Stercorarius parasiticus |
- |
Yes |
|
Pomarine Jaeger Stercorarius pomarinus |
- |
Yes |
|
Family Sulidae (Boobies) |
|
|
|
Brown Booby Sula leucogaster |
- |
No |
|
Red-footed Booby Sula sula |
- |
Yes |
*Notes: M:
passage migrant
7.4.1.4
Of these 45 migratory and/or visitor
seabird species, 29 species have been recorded from the eastern or the
south-eastern waters of
7.4.1.5
The seabird survey conducted by
HKBWS in spring 2006 covered the main migration path of seabirds in
Table 7.7 Summary of Numbers of Seabirds Recorded in HKBWS Seabird Survey in Spring 2006 (HKWBS, 2006)
|
Seabirds |
Number |
% of Total |
|
Family
Alcidae (Auks) |
|
|
|
Ancient Murrelet Synthliboramplus antiquus |
3 |
0.03 |
|
Sub-total |
0.03 |
|
|
Family
Laridae (Gulls) |
|
|
|
Yellow-legged Gull Larus cachinnans |
2 |
0.02 |
|
Black-tailed Gull Larus crassirostris |
2 |
0.02 |
|
Heuglin’s Gull Larus heuglini |
158 |
1.81 |
|
Slaty-backed Gull Larus schistisagus |
1 |
0.01 |
|
Unidentified Gull Larus sp. |
8 |
0.09 |
|
Sub-total |
171 |
1.95 |
|
Family
Procellariidae (Shearwaters) |
|
|
|
Streaked Shearwater Calonectris leucomelas |
52 |
0.59 |
|
Short-tailed Shearwater Puffinus tenuirostris |
15 |
0.17 |
|
Unidentified Shearwater Puffinus sp. |
3 |
0.03 |
|
Sub-total |
70 |
0.80 |
|
Family
Scolopacidae (Sandpipers) |
|
|
|
Red-necked Phalarope Phalaropus lobatus |
6618 |
75.63 |
|
Sub-total |
6618 |
75.63 |
|
Family
Sternidae (Terns) |
|
|
|
Whiskered Tern Chlidonias hybridus |
6 |
0.07 |
|
White-winged Tern Chlidonias leucopterus |
754 |
8.61 |
|
Aleutian Tern Sterna aleutica |
200 |
2.28 |
|
Bridled Tern Sterna anaethetus |
55 |
0.63 |
|
Gull-billed Tern Sterna nilotica |
5 |
0.06 |
|
Caspian Tern Sterna caspia |
4 |
0.05 |
|
Common Tern Sterna hirundo |
212 |
2.42 |
|
Roseate Tern Sterna dougallii |
2 |
0.02 |
|
Black-naped Tern Sterna sumatrana |
258 |
2.95 |
|
Sooty Tern Sterna fuscata |
1 |
0.01 |
|
Little Tern Sterna albifrons |
1 |
0.01 |
|
Greater Crested Tern Strena bergii |
10 |
0.11 |
|
Unidentified Tern Chlidonias sp. / Sterna sp. |
219 |
2.50 |
|
Sub-total |
1727 |
19.73 |
|
Family
Stercorariidae (Jaegers and Jaegers) |
|
|
|
Long-tailed Jaeger Stercorarius longicaudus |
113 |
1.29 |
|
Parasitic Jaeger Stercorarius parasiticus |
13 |
0.15 |
|
Pomarine Jaeger Stercorarius pomarinus |
17 |
0.19 |
|
Unidentified Jaeger Sterocrarius sp. |
18 |
0.21 |
|
Sub-total |
161 |
1.84 |
7.4.2
Breeding
Seabird Populations
7.4.2.1
Of the documented 45 migratory
and / or visiting seabird species in
7.4.2.2
Since these earliest records
summer breeding colonies of all the three tern species have been recorded at
offshore islands
7.4.2.3 Table 7.8 summarises the data collected by HKBWS between 1993 – 1997 on the minimum number of adults and fledged juveniles of the three breeding tern species at the East Ninepin.
|
Year |
Black-naped Tern |
Bridled Tern |
Roseate Tern |
|||
|
Adult |
Juvenile |
Adult |
Juvenile |
Adult |
Juvenile |
|
|
1993 |
80 |
10 |
8 |
0 |
40 |
4 |
|
1994 |
85 |
1 |
1 |
0 |
46 |
0 |
|
1995 |
35 |
2 |
0 |
0 |
3 |
0 |
|
1996 |
10 |
0 |
0 |
0 |
0 |
0 |
|
1997 |
0 |
0 |
0 |
0 |
0 |
0 |
7.4.2.4
In 2003, a government-funded
project was conducted by HKBWS, namely “Pilot Project to Increase Awareness of
the Ecological Importance of the Breeding Colonies of Terns in
7.4.2.5
The study also first identified
breeding tern colonies on
7.4.2.6
Although there has been no
formally published data on breeding terns in
Table 7.9 Available
Results of On-going Breeding Tern Surveys in SE Waters of
|
Date |
Black-naped Tern |
Bridled Tern |
Roseate Tern |
|||
|
Adult |
Juvenile |
Adult |
Juvenile |
Adult |
Juvenile |
|
|
22 Jul 05 |
130 |
uncertain |
13 |
uncertain |
8 |
uncertain |
|
11 Jul 06 |
174 |
uncertain |
67 |
uncertain |
10 |
uncertain |
|
21 Jul 06 |
174 |
10 |
39 |
1 |
53 |
uncertain |
7.4.3.1 White-bellied Sea Eagle (WBSE), Haliaeetus leucogaster, belongs to the Family Accipitridae, is one of the ten fish eagle species in the world (ECA, 2007). WBSEs are monotypic species that inhabit coastal areas and offshore islands. Juveniles of WBSEs are dispersive, while breeding pairs tend to be more sedentary within their own territories. Nests of WBSEs are usually found on tall trees or on remote coastal cliffs (Tsim et al., 2003).
7.4.3.2
WBSE has a world distribution
from western
7.4.3.3
Although the conservation
status of WBSE is determined as “Least Concern (LC)” in accordance with the
“The IUCN Red List Categories and Criteria (
7.4.3.4
An on-going monitoring
programme of local WBSEs was first started in 2001 by AFCD to record local
distribution and provides long-term monitoring of the species. A total 154
sighting records from 55 sighting locations were obtained from November 2001 to
July 2007 (AFCD unpublished data). Figure 7.8 indicates the
sighting locations of WBSE in
7.4.3.5 The most recent estimates from confirmed sighting records up to 2003 suggest that there are possibly 39 WBSEs in Hong Kong, including 23 adults and 16 immature / juveniles (Tsim et al., 2003), and a total of 8 confirmed nests / breeding pairs. The most updated information (up to July 2007) from AFCD unpublished monitoring data show that the number of recorded breeding pairs increases from 8 pairs in 2002/03 to 12 pairs in 2006/07.
7.4.3.6
The locations of sighting
records suggest that the eastern and southern waters of
7.4.3.7
A total of 7 breeding nests
have been reported in SE waters that fall within the Study Area of the proposed wind farm, as displayed in Figures 7.9
and 7.10. Of these locations, Ninepin Islands,
Wang Chau and Steep Island are the closest breeding locations to the proposed
wind farm (approximately
7.4.3.8
A study on foraging behaviour
of two breeding pairs of WBSE at Yeung Chau (Sai Kung) (during incubation
period) and Tai Ngam Hau (during chick-rearing period) was conducted by AFCD
between 2001 and 2003. Observations of the foraging pairs at Yeung Chau and Tai
Ngam Hau suggest that the breeding WBSEs foraged most frequently between
Table 7.10 Summary of the Results of WBSE Breeding Site Survey in SE Waters Between 2002/03 and 2006/07 (AFCD unpublished data)
|
Surveyed Site |
Year |
||||
|
2002/03 |
2003/04 |
2004/05 |
2005/06 |
2006/07 |
|
|
|
U |
U |
S(P) |
U |
X |
|
|
U |
U |
U |
X |
X |
|
Tai Ngam Hau |
S(2) |
S(2) |
S(1) |
S(2) |
S(2) |
|
Tsim Chau |
S(1) |
U |
F(P) |
F |
S(1) |
|
Tsang Pang Kok |
U |
U |
U |
S(1) |
F |
|
Yeung Chau (Sai Kung) |
F |
F |
F |
F |
F |
|
Wang Chau |
U |
U |
U |
U |
S(1) |
Notes:
S(1): Success
– Bred successfully
S(P): Probably
success – No fledgling seen
F: Fail
– Adults abandoned the nest during breeding period
F(P): Probably
fail – None of fledgling nor feeding behaviour were observed. But the breeding
pair stayed at the nesting site for the whole breeding period
X: No
nest – either because the pair didn’t attempt breeding or no WBSE inhabit the site
during breeding season
U: Uncertain
– Insufficient data.
7.4.3.9
A study on post-release
monitoring of two immature White-bellied Sea Eagles after rehabilitation
jointly conducted by Kadoorie Farm and Botanic Garden (KFBG) and Agriculture,
Fisheries and Conservation Department (AFCD) in 2002 (Griffiths and Tsim, 2004)
by use of radio transmitters showed that both immature birds were able to fly
well and establish their territory ranges within very short period of time
after release (< 1 month). The
radio-tracking results suggested that all recorded positions of the two
immature WBSEs were all confined to near-shore coastal areas, within
approximately
7.4.4
Conclusion
of Desktop Study
7.4.4.1
A desktop study has been
conducted to cover the sea area (as displayed in Figure 7.1) within
7.4.4.2
Results of the desktop study
suggest that approximately 2/3 (or 29 out of the total 45) of migratory seabird
species in
7.4.4.3
7.5
Baseline Conditions and Sensitive Receivers –
Field Surveys
7.5.1 Field Survey Methodologies
7.5.1.1 Based on the results of desktop study, boat-based field survey was proposed for use in this study based on the following considerations:
·
Abundance of existing birds
within the Study Area are predicted
to be low: Daily bird counts covering the majority of seabird population in S
and SE HK waters ranged from 61 – 969 (HKBWS, 2006). The numbers are far too
low compared to those obtained in other wind farm studies (e.g. NERI, 2000
· Most seabirds are of low flight altitude: the results of the HKBWS 2006 seabird study showed that more than 96% of the observed birds belong to terns (~20%), the sandpiper, Red-necked Phalarope (~76%), and shearwaters, (~1%), which usually fly at low altitudes or near water surface.
·
Absence of marked passage movements of migrating /
moving birds: No moving flocks of birds of significant
size or marked passage of moving / migration birds have been identified in the
Study Area from previous surveys / studies. Instead,
all migratory / moving birds in
7.5.1.2
A fixed transect route for day
7.5.1.3 In order to avoid missing birds in key areas and to allow estimation of population sizes of breeding colonies, fixed-point counts were conducted at a total of 9 fixed survey points, including P1 to P8, and Kong Tau Pai. Point count locations have been selected to cover the project area of concern (i.e., all four corners and the centre of the wind farm site area) and four coastal locations from which bird flights would originate / breeding activity would be centred.
7.5.1.4 For P1 to P8, fixed-point counts were conducted for 30 minutes at each of the points. For Kong Tau Pai, the known current breeding location in the SE waters for terns, point-counts were performed until all terns (including adults and juveniles) on the islet were counted and recorded.
7.5.1.5 All boat-based surveys were conducted by a professional ornithologist, with the best experience in coastal and seabird survey in the HKSAR and with specific survey experience in the Study Area. Additional staff support, including support for breeding bird point counts, was provided as appropriate, depending on sighting frequency.
7.5.1.6 The boat-based survey involved scanning on both sides of the boat by the observer to ensure no under-counting. For each bird sighting, the position of the observer was recorded using a GPS navigator. An estimate of the distance of bird from observer was made and aided by the use of a range finder to allow the analysis of bird distribution across environmental gradients (e.g. distance gradients away from the proposed wind farm).
7.5.1.7 For all bird sightings along the transect route, information including species identity, number of individuals, behaviour (e.g. at flight or foraging), height and direction of flight, maturity of the birds (adult / juvenile), and whether or not the birds fly through the Wind farm area was recorded.
7.5.1.8 All the bird surveys were conducted at daytime with good weather conditions (e.g. at Beaufort scale <5), to enable the best visibility and observer efficiency, and hence data reliability.
7.5.1.9 Survey duration / periods were defined and represented by four “bird seasons” according to the general understanding of occurrence of various types of seabirds or bird population across the SE waters of Hong Kong: Spring Migratory Period (March – mid June), Summer Breeding Period for terns (mid June – August), Autumn Migratory Period (September – November), and the Winter Period (December – February) for some winter breeders such as the WBSE.
7.5.1.10 Boat-based surveys were conducted more frequently during migratory periods when observation opportunities of birds offshore were expected to be greatest. The following frequency was basically followed as far as practicable:
· Spring Migratory Period 2006 (May – mid June 2006) [Frequency: 2x /week]
· Summer Breeding Period 2006 (mid June – August 2006) [Frequency: 2x /month]
· Winter Period 2006 - 2007 (December 2006 – February 2007) [Frequency: 2x /month]
· Spring Migratory Period 2007 (March – May 2007) [Frequency: 2x /week]
· Summer Breeding Period 2007 (August 2007) [Frequency: 1x /week]
· Autumn Migratory Period 2007 (September – November 2007) [Frequency: 1x / week]
· Winter Period 2007 (December 2007) [Frequency: 1x /week]
7.5.1.11
The survey during the Spring
Migratory Period in 2006 and 2007 was designed to cover spring migration of
seabirds during the months March through May (HKBWS, 2006). The Summer Breeding
Period covered the breeding season of the three breeding terns in
Table 7.11 Dates of Boat-based Surveys Undertaken in the Study Area Between May 2006 and December 2007.
|
Dates |
|
|
Spring Migratory Period 2006 |
2006 May: 23, 26, 30 2006 June: 2, 5, 9, 12, 15 |
|
Summer Breeding Period 2006 |
2006 July: 4, 18 2006 August: 5, 19, 30 |
|
Winter Period 2006 - 2007 |
2006 December: 23, 30 2007 January: 12, 24 2007 February: 8, 22 |
|
Spring Migratory Period 2007 |
2007 March: 7, 10, 15, 16, 20, 26, 29 2007 April: 2, 6, 10, 12, 16, 19, 23, 26, 30 2007 May: 11, 12, 17, 22 |
|
Summer Breeding Period 2007 |
2007 August: 16,
24, 30 |
|
Autumn Migratory Period 2007 |
2007 September: 6,
13, 19, 27 2007 October: 5,
11, 18, 25 2007 November: 2,
10, 17, 24 |
|
Winter Period 2007 |
2007 December: 1, 7,
15, 23, 29 |
7.5.1.12 Except for the Autumn Migratory Period 2007 which generally covers a full “Autumn” period from September through November, other survey periods in 2006 and 2007 cover different selective periods of a particular season. As such, for the collision risk presented in Sub-section 7.8 survey data from 2006 and 2007 has been pooled for the risk analysis on a ‘species per season’ basis.
7.5.2.1 Total counts for the whole survey period (between May 2006 and December 2007) are summarised in Table 7.12 and Table 7.13 for Scenario A and Scenario B, respectively.
7.5.2.2
Peak daily counts for the whole
survey period are summarised in Table 7.14 and Table 7.15 for Scenario A and Scenario B,
respectively. Appendix
Table 7.12 Total
Counts of Bird Species Recorded during Boat-based Surveys within the Study Area
(the proposed wind farm area (WF) with
|
Species |
WF |
WF + |
WF + |
WF + |
Whole Area |
|
|
Passerines |
Black Drongo Dicrurus macrocercus |
7 |
7 |
7 |
7 |
7 |
|
Blue Rock Thrush Monticola solitarius |
0 |
0 |
0 |
0 |
1 |
|
|
Chinese Bulbul Pycnontus sinensis |
0 |
0 |
0 |
0 |
6 |
|
|
Collared Crow Corvus torquatus |
0 |
0 |
0 |
0 |
1 |
|
|
Crested Myna Acridotheres cristatellus |
0 |
0 |
0 |
0 |
20 |
|
|
Dollarbird Eurystomus orientalis |
0 |
0 |
0 |
0 |
1 |
|
|
Large-billed Crow Corvus marcorhynchos |
0 |
0 |
0 |
0 |
3 |
|
|
Oriental
Turtle Dove Streptopelia orientalis |
0 |
0 |
0 |
0 |
3 |
|
|
Yellow Wagtail Motacilla flava |
0 |
5 |
5 |
8 |
8 |
|
|
Yellow-bellied Prinia Prinia flaviventris |
0 |
0 |
0 |
0 |
1 |
|
|
Raptors |
Black Kite Milvus migrans |
0 |
3 |
4 |
6 |
615 |
|
Bonelli’s Eagle Hieraaetus fasciatus |
0 |
0 |
0 |
0 |
1 |
|
|
Chinese Goshawk Accipiter soloensis |
1 |
1 |
1 |
1 |
5 |
|
|
Raptors |
Common Buzzard Buteo buteo |
0 |
0 |
0 |
0 |
1 |
|
Common Kestrel Falco tinnunculus |
0 |
0 |
0 |
0 |
2 |
|
|
Eurasian Hobby Falco subbuteo |
0 |
0 |
0 |
0 |
1 |
|
|
Grey-faced Buzzard Butastur indicus |
0 |
0 |
0 |
0 |
1 |
|
|
Osprey Pandion haliaetus |
0 |
1 |
1 |
1 |
5 |
|
|
Peregrine Falcon Falco peregrinus |
0 |
0 |
0 |
0 |
12 |
|
|
Unidentified Raptor |
0 |
0 |
0 |
1 |
1 |
|
|
White-bellied Sea Eagle Haliaeetus leucogaster |
0 |
0 |
0 |
0 |
138 |
|
|
Seabirds |
Aleutian Tern Sterna aleutica |
33 |
65 |
71 |
103 |
154 |
|
Ancient Murrelet Synthliboramphus antiquus |
0 |
0 |
0 |
0 |
2 |
|
|
Black-naped Tern Sterna sumatrana |
6 |
12 |
12 |
14 |
1048 |
|
|
Black-tailed Gull Larus crassirostris |
28 |
37 |
38 |
40 |
48 |
|
|
Bridled Tern Sterna anaethetus |
89 |
191 |
222 |
246 |
883 |
|
|
Common Tern Sterna hirundo |
46 |
85 |
89 |
99 |
167 |
|
|
Greater Crested Tern Sterna bergii |
0 |
2 |
2 |
2 |
3 |
|
|
Heuglin’s Gull Larus heuglini |
9 |
12 |
13 |
13 |
14 |
|
|
Litter Tern Sterna albisfrons |
1 |
2 |
2 |
2 |
2 |
|
|
Long-tailed Jaeger Stercorarius longicaudus |
1 |
2 |
6 |
6 |
6 |
|
|
Pomarine Jaeger Stercorarius pomarinus |
6 |
9 |
14 |
14 |
14 |
|
|
Roseate Tern Sterna dougallii |
0 |
6 |
7 |
7 |
181 |
|
|
Short-tailed Shearwater Puffinus tenuirostris |
0 |
0 |
0 |
0 |
2 |
|
|
Streaked Shearwater Calonectris leucomelas |
4 |
8 |
8 |
8 |
8 |
|
|
Unidentified Gull Larus sp. |
1 |
1 |
1 |
1 |
1 |
|
|
Unidentified Jaeger Stercorarius sp. |
17 |
17 |
17 |
17 |
17 |
|
|
Unidentified Tern Sterna sp. |
20 |
25 |
33 |
48 |
87 |
|
|
Seabirds |
White-winged Black Tern Chlidonias leucopterus |
43 |
72 |
74 |
80 |
126 |
|
Swallows / Swifts |
Barn Swallow Hirundo rustica |
44 |
53 |
53 |
55 |
88 |
|
Little Swift Apus affinis |
1 |
2 |
2 |
3 |
48 |
|
|
Pacific Swift Apus pacificus |
0 |
0 |
0 |
0 |
230 |
|
|
Black-crowned
Night Heron Nycticorax nycticorax |
0 |
0 |
0 |
0 |
1 |
|
|
Waders & Waterbirds |
Cattle Egret Bubulcus ibis (coromandus) |
20 |
47 |
47 |
47 |
47 |
|
Chinese Pond Heron Ardeola bacchus |
0 |
0 |
0 |
0 |
4 |
|
|
Common Kingfisher Alcedo atthis |
1 |
1 |
1 |
1 |
1 |
|
|
Curlew Numenius arquata (orientalis) |
0 |
0 |
0 |
0 |
1 |
|
|
Great Egret Egretta alba |
0 |
0 |
0 |
0 |
1 |
|
|
Greater Sand Plover Charadrius leschenaultii |
0 |
0 |
1 |
1 |
1 |
|
|
Green Sandpiper Tringa ochropus |
0 |
1 |
1 |
1 |
1 |
|
|
Grey Heron Ardea cinerea |
11 |
12 |
12 |
12 |
12 |
|
|
Little Egret Egretta garzetta |
26 |
45 |
45 |
65 |
141 |
|
|
Northern Shoveler Anas clypeata |
10 |
10 |
10 |
10 |
10 |
|
|
Pacific Golden Plover Pluvialis fulva |
3 |
3 |
3 |
5 |
5 |
|
|
Pacific Reef Egret Egretta sacra |
0 |
0 |
0 |
0 |
80 |
|
|
Red Knot Calidris canutus |
0 |
0 |
0 |
15 |
15 |
|
|
Red-necked Phalarope Phalaropus lobatus |
128 |
243 |
247 |
283 |
722 |
|
|
Ruddy Turnstone Arenaria interpres |
7 |
7 |
7 |
7 |
7 |
|
|
Unidentified egret Egretta sp. |
0 |
0 |
0 |
0 |
30 |
|
|
Unidentified shore bird |
0 |
12 |
12 |
12 |
12 |
|
|
Whimbrel Numenius phaeopus |
0 |
0 |
0 |
0 |
33 |
|
|
White-breasted Kingfisher Halcyon smyrnnsis |
0 |
0 |
0 |
0 |
1 |
|
|
Wood Sandpiper Tringa glareola |
0 |
31 |
31 |
31 |
37 |
|
|
Total |
563 |
1030 |
1099 |
1272 |
5124 |
|
Table 7.13 Total Counts of Bird Species
Recorded during Boat-based Surveys within the Study Area (the proposed wind
farm area (WF) with
|
Bird Type |
Species |
WF |
WF + |
WF + |
WF + |
Whole Area |
|
Passerines |
Black Drongo Dicrurus macrocercus |
7 |
7 |
7 |
7 |
7 |
|
Blue Rock Thrush Monticola solitarius |
0 |
0 |
0 |
0 |
1 |
|
|
Chinese Bulbul Pycnontus sinensis |
0 |
0 |
0 |
0 |
6 |
|
|
Collared Crow Corvus torquatus |
0 |
0 |
0 |
0 |
1 |
|
|
Crested Myna Acridotheres cristatellus |
0 |
0 |
0 |
0 |
20 |
|
|
Dollarbird Eurystomus orientalis |
0 |
0 |
0 |
0 |
1 |
|
|
Large-billed Crow Corvus marcorhynchos |
0 |
0 |
0 |
0 |
3 |
|
|
Oriental
Turtle Dove Streptopelia orientalis |
0 |
0 |
0 |
0 |
3 |
|
|
Yellow Wagtail Motacilla flava |
5 |
5 |
5 |
8 |
8 |
|
|
Yellow-bellied Prinia Prinia flaviventris |
0 |
0 |
0 |
0 |
1 |
|
|
Raptors |
Black Kite Milvus migrans |
0 |
3 |
4 |
6 |
615 |
|
Bonelli’s Eagle Hieraaetus fasciatus |
0 |
0 |
0 |
0 |
1 |
|
|
Chinese Goshawk Accipiter soloensis |
1 |
1 |
1 |
1 |
5 |
|
|
Common Buzzard Buteo buteo |
0 |
0 |
0 |
0 |
1 |
|
|
Common Kestrel Falco tinnunculus |
0 |
0 |
0 |
0 |
2 |
|
|
Eurasian Hobby Falco subbuteo |
0 |
0 |
0 |
0 |
1 |
|
|
Grey-faced Buzzard Butastur indicus |
0 |
0 |
0 |
0 |
1 |
|
|
Osprey Pandion haliaetus |
0 |
1 |
1 |
1 |
5 |
|
|
Peregrine Falcon Falco peregrinus |
0 |
0 |
0 |
0 |
12 |
|
|
Unidentified Raptor |
0 |
0 |
1 |
1 |
1 |
|
|
White-bellied Sea Eagle Haliaeetus leucogaster |
0 |
0 |
0 |
0 |
138 |
|
|
Seabirds |
Aleutian Tern Sterna aleutica |
36 |
69 |
71 |
103 |
154 |
|
Ancient Murrelet Synthliboramphus antiquus |
0 |
0 |
0 |
0 |
2 |
|
|
Seabirds |
Black-naped Tern Sterna sumatrana |
10 |
12 |
12 |
14 |
1048 |
|
Black-tailed Gull Larus crassirostris |
22 |
37 |
38 |
40 |
48 |
|
|
Bridled Tern Sterna anaethetus |
119 |
197 |
224 |
246 |
883 |
|
|
Common Tern Sterna hirundo |
44 |
86 |
90 |
99 |
167 |
|
|
Greater Crested Tern Sterna bergii |
0 |
2 |
2 |
2 |
3 |
|
|
Heuglin’s Gull Larus heuglini |
9 |
13 |
13 |
13 |
14 |
|
|
Litter Tern Sterna albisfrons |
1 |
2 |
2 |
2 |
2 |
|
|
Long-tailed Jaeger Stercorarius longicaudus |
2 |
2 |
6 |
6 |
6 |
|
|
Pomarine Jaeger Stercorarius pomarinus |
7 |
13 |
14 |
14 |
14 |
|
|
Roseate Tern Sterna dougallii |
0 |
6 |
7 |
7 |
181 |
|
|
Short-tailed Shearwater Puffinus tenuirostris |
0 |
0 |
0 |
0 |
2 |
|
|
Streaked Shearwater Calonectris leucomelas |
4 |
8 |
8 |
8 |
8 |
|
|
Unidentified Gull Larus sp. |
1 |
1 |
1 |
1 |
1 |
|
|
Unidentified Jaeger Stercorarius sp. |
17 |
17 |
17 |
17 |
17 |
|
|
Unidentified Tern Sterna sp. |
21 |
28 |
30 |
48 |
87 |
|
|
White-winged Black Tern Chlidonias leucopterus |
49 |
72 |
74 |
80 |
126 |
|
|
Swallows / Swifts |
Barn Swallow Hirundo rustica |
46 |
53 |
53 |
55 |
88 |
|
Little Swift Apus affinis |
1 |
2 |
2 |
3 |
48 |
|
|
Pacific Swift Apus pacificus |
0 |
0 |
0 |
0 |
230 |
|
|
Black-crowned
Night Heron Nycticorax nycticorax |
0 |
0 |
0 |
0 |
1 |
|
|
Waders & Waterbirds |
Cattle Egret Bubulcus ibis (coromandus) |
29 |
47 |
47 |
47 |
47 |
|
Chinese Pond Heron Ardeola bacchus |
0 |
0 |
0 |
0 |
4 |
|
|
Common Kingfisher Alcedo atthis |
1 |
1 |
1 |
1 |
1 |
|
|
Curlew Numenius arquata (orientalis) |
0 |
0 |
0 |
0 |
1 |
|
|
Great Egret Egretta alba |
0 |
0 |
0 |
0 |
1 |
|
|
Waders & Waterbirds |
Greater Sand Plover Charadrius leschenaultii |
0 |
0 |
1 |
1 |
1 |
|
Green Sandpiper Tringa ochropus |
0 |
1 |
1 |
1 |
1 |
|
|
Grey Heron Ardea cinerea |
11 |
12 |
12 |
12 |
12 |
|
|
Little Egret Egretta garzetta |
30 |
45 |
45 |
65 |
141 |
|
|
Northern Shoveler Anas clypeata |
10 |
10 |
10 |
10 |
10 |
|
|
Pacific Golden Plover Pluvialis fulva |
3 |
3 |
3 |
5 |
5 |
|
|
Pacific Reef Egret Egretta sacra |
0 |
0 |
0 |
0 |
80 |
|
|
Red Knot Calidris canutus |
0 |
0 |
0 |
15 |
15 |
|
|
Red-necked Phalarope Phalaropus lobatus |
159 |
242 |
246 |
283 |
722 |
|
|
Ruddy Turnstone Arenaria interpres |
7 |
7 |
7 |
7 |
7 |
|
|
Unidentified egret Egretta sp. |
0 |
0 |
0 |
0 |
30 |
|
|
Unidentified shore bird |
12 |
12 |
12 |
12 |
12 |
|
|
Whimbrel Numenius phaeopus |
0 |
0 |
0 |
0 |
33 |
|
|
White-breasted Kingfisher Halcyon smyrnnsis |
0 |
0 |
0 |
0 |
1 |
|
|
Wood Sandpiper Tringa glareola |
30 |
31 |
31 |
31 |
37 |
|
|
Total |
694 |
1048 |
1099 |
1272 |
5124 |
|
Table 7.14 The
Peak Daily Counts of Bird Species Recorded during Boat-based Surveys within the
Study Area (the proposed wind farm (WF) with
|
Bird Type |
Species |
WF |
WF + |
WF + |
WF + |
Whole Area |
|
Passerines |
Black Drongo Dicrurus macrocercus |
7 |
7 |
7 |
7 |
7 |
|
Blue Rock Thrush Monticola solitarius |
0 |
0 |
0 |
0 |
1 |
|
|
Chinese Bulbul Pycnontus sinensis |
0 |
0 |
0 |
0 |
5 |
|
|
Collared Crow Corvus torquatus |
0 |
0 |
0 |
0 |
1 |
|
|
Crested Myna Acridotheres cristatellus |
0 |
0 |
0 |
0 |
4 |
|
|
Dollarbird Eurystomus orientalis |
0 |
0 |
0 |
0 |
1 |
|
|
Passerines |
Large-billed Crow Corvus marcorhynchos |
0 |
0 |
0 |
0 |
2 |
|
Oriental
Turtle Dove Streptopelia orientalis |
0 |
0 |
0 |
0 |
3 |
|
|
Yellow Wagtail Motacilla flava |
0 |
5 |
5 |
5 |
5 |
|
|
Yellow-bellied Prinia Prinia flaviventris |
0 |
0 |
0 |
0 |
1 |
|
|
Raptors |
Black Kite Milvus migrans |
0 |
1 |
1 |
2 |
29 |
|
Bonelli’s Eagle Hieraaetus fasciatus |
0 |
0 |
0 |
0 |
1 |
|
|
Chinese Goshawk Accipiter soloensis |
1 |
1 |
1 |
1 |
4 |
|
|
Common Buzzard Buteo buteo |
0 |
0 |
0 |
0 |
1 |
|
|
Common Kestrel Falco tinnunculus |
0 |
0 |
0 |
0 |
1 |
|
|
Eurasian Hobby Falco subbuteo |
0 |
0 |
0 |
0 |
1 |
|
|
Grey-faced Buzzard Butastur indicus |
0 |
0 |
0 |
0 |
1 |
|
|
Osprey Pandion haliaetus |
0 |
1 |
1 |
1 |
1 |
|
|
Peregrine Falcon Falco peregrinus |
0 |
0 |
0 |
0 |
3 |
|
|
Unidentified Raptor |
0 |
0 |
0 |
1 |
1 |
|
|
White-bellied Sea Eagle Haliaeetus leucogaster |
0 |
0 |
0 |
0 |
11 |
|
|
Seabirds |
Aleutian Tern Sterna aleutica |
23 |
41 |
41 |
70 |
121 |
|
Ancient Murrelet Synthliboramphus antiquus |
0 |
0 |
0 |
0 |
2 |
|
|
Black-naped Tern Sterna sumatrana |
2 |
3 |
3 |
3 |
114 |
|
|
Black-tailed Gull Larus crassirostris |
15 |
15 |
15 |
15 |
15 |
|
|
Bridled Tern Sterna anaethetus |
19 |
31 |
37 |
38 |
138 |
|
|
Common Tern Sterna hirundo |
8 |
19 |
19 |
25 |
48 |
|
|
Greater Crested Tern Sterna bergii |
0 |
2 |
2 |
2 |
2 |
|
|
Heuglin’s Gull Larus heuglini |
5 |
5 |
5 |
5 |
5 |
|
|
Litter Tern Sterna albisfrons |
1 |
1 |
1 |
1 |
1 |
|
|
Long-tailed Jaeger Stercorarius longicaudus |
1 |
1 |
3 |
3 |
3 |
|
|
Seabirds |
Pomarine Jaeger Stercorarius pomarinus |
5 |
6 |
10 |
10 |
10 |
|
Roseate Tern Sterna dougallii |
0 |
6 |
7 |
7 |
52 |
|
|
Short-tailed Shearwater Puffinus tenuirostris |
0 |
0 |
0 |
0 |
1 |
|
|
Streaked Shearwater Calonectris leucomelas |
2 |
4 |
4 |
4 |
4 |
|
|
Unidentified Gull Larus sp. |
1 |
1 |
1 |
1 |
1 |
|
|
Unidentified Jaeger Stercorarius sp. |
16 |
16 |
16 |
16 |
16 |
|
|
Unidentified Tern Sterna sp. |
6 |
7 |
7 |
16 |
37 |
|
|
White-winged Black Tern Chlidonias leucopterus |
22 |
39 |
39 |
39 |
48 |
|
|
Swallows / Swifts |
Barn Swallow Hirundo rustica |
15 |
15 |
15 |
15 |
26 |
|
Little Swift Apus affinis |
1 |
1 |
1 |
2 |
17 |
|
|
Pacific Swift Apus pacificus |
0 |
0 |
0 |
0 |
32 |
|
|
Black-crowned
Night Heron Nycticorax nycticorax |
0 |
0 |
0 |
0 |
1 |
|
|
Waders & Waterbirds |
Cattle Egret Bubulcus ibis (coromandus) |
14 |
23 |
23 |
23 |
23 |
|
Chinese Pond Heron Ardeola bacchus |
0 |
0 |
0 |
0 |
4 |
|
|
Common Kingfisher Alcedo atthis |
1 |
1 |
1 |
1 |
1 |
|
|
Curlew Numenius arquata (orientalis) |
0 |
0 |
0 |
0 |
1 |
|
|
Great Egret Egretta alba |
0 |
0 |
0 |
0 |
1 |
|
|
Greater Sand Plover Charadrius leschenaultii |
0 |
0 |
1 |
1 |
1 |
|
|
Green Sandpiper Tringa ochropus |
0 |
1 |
1 |
1 |
1 |
|
|
Grey Heron Ardea cinerea |
11 |
12 |
12 |
12 |
12 |
|
|
Little Egret Egretta garzetta |
25 |
25 |
25 |
45 |
53 |
|
|
Northern Shoveler Anas clypeata |
9 |
9 |
9 |
9 |
9 |
|
|
Pacific Golden Plover Pluvialis fulva |
3 |
3 |
3 |
3 |
3 |
|
|
Pacific Reef Egret Egretta sacra |
0 |
0 |
0 |
0 |
6 |
|
|
Red Knot Calidris canutus |
0 |
0 |
0 |
15 |
15 |
|
|
Waders & Waterbirds |
Red-necked Phalarope Phalaropus lobatus |
50 |
82 |
82 |
92 |
224 |
|
Ruddy Turnstone Arenaria interpres |
7 |
7 |
7 |
7 |
7 |
|
|
Unidentified egret Egretta sp. |
0 |
0 |
0 |
0 |
30 |
|
|
Unidentified shore bird |
0 |
12 |
12 |
12 |
12 |
|
|
Whimbrel Numenius phaeopus |
0 |
0 |
0 |
0 |
15 |
|
|
White-breasted Kingfisher Halcyon smyrnnsis |
0 |
0 |
0 |
0 |
1 |
|
|
Wood Sandpiper Tringa glareola |
0 |
30 |
30 |
30 |
30 |
|
|
Peak Daily Counts |
60 |
103 |
110 |
121 |
325 |
|
Table 7.15 The
Peak Daily Counts of Bird Species Recorded during Boat-based Surveys within the
Study Area (the proposed wind farm (WF) with
|
Bird Type |
Species |
WF |
WF + |
WF + |
WF + |
Whole Area |
|
Passerines |
Black Drongo Dicrurus macrocercus |
7 |
7 |
7 |
7 |
7 |
|
Blue Rock Thrush Monticola solitarius |
0 |
0 |
0 |
0 |
1 |
|
|
Chinese Bulbul Pycnontus sinensis |
0 |
0 |
0 |
0 |
5 |
|
|
Collared Crow Corvus torquatus |
0 |
0 |
0 |
0 |
1 |
|
|
Crested Myna Acridotheres cristatellus |
0 |
0 |
0 |
0 |
4 |
|
|
Dollarbird Eurystomus orientalis |
0 |
0 |
0 |
0 |
1 |
|
|
Large-billed Crow Corvus marcorhynchos |
0 |
0 |
0 |
0 |
2 |
|
|
Oriental
Turtle Dove Streptopelia orientalis |
0 |
0 |
0 |
0 |
3 |
|
|
Yellow Wagtail Motacilla flava |
5 |
5 |
5 |
5 |
5 |
|
|
Yellow-bellied Prinia Prinia flaviventris |
0 |
0 |
0 |
0 |
1 |
|
|
Raptors |
Black Kite Milvus migrans |
0 |
1 |
1 |
2 |
29 |
|
Bonelli’s Eagle Hieraaetus fasciatus |
0 |
0 |
0 |
0 |
1 |
|
|
Chinese Goshawk Accipiter soloensis |
1 |
1 |
1 |
1 |
4 |
|
|
Raptors |
Common Buzzard Buteo buteo |
0 |
0 |
0 |
0 |
1 |
|
Common Kestrel Falco tinnunculus |
0 |
0 |
0 |
0 |
1 |
|
|
Eurasian Hobby Falco subbuteo |
0 |
0 |
0 |
0 |
1 |
|
|
Grey-faced Buzzard Butastur indicus |
0 |
0 |
0 |
0 |
1 |
|
|
Osprey Pandion haliaetus |
0 |
1 |
1 |
1 |
1 |
|
|
Peregrine Falcon Falco peregrinus |
0 |
0 |
0 |
0 |
3 |
|
|
Unidentified Raptor |
0 |
0 |
1 |
1 |
1 |
|
|
White-bellied Sea Eagle Haliaeetus leucogaster |
0 |
0 |
0 |
0 |
11 |
|
|
Seabirds |
Aleutian Tern Sterna aleutica |
25 |
41 |
41 |
70 |
121 |
|
Ancient Murrelet Synthliboramphus antiquus |
0 |
0 |
0 |
0 |
2 |
|
|
Black-naped Tern Sterna sumatrana |
2 |
3 |
3 |
3 |
114 |
|
|
Black-tailed Gull Larus crassirostris |
15 |
15 |
15 |
15 |
15 |
|
|
Bridled Tern Sterna anaethetus |
20 |
31 |
37 |
38 |
138 |
|
|
Common Tern Sterna hirundo |
6 |
19 |
20 |
25 |
48 |
|
|
Greater Crested Tern Sterna bergii |
0 |
2 |
2 |
2 |
2 |
|
|
Heuglin’s Gull Larus heuglini |
5 |
5 |
5 |
5 |
5 |
|
|
Litter Tern Sterna albisfrons |
1 |
1 |
1 |
1 |
1 |
|
|
Long-tailed Jaeger Stercorarius longicaudus |
1 |
1 |
3 |
3 |
3 |
|
|
Pomarine Jaeger Stercorarius pomarinus |
5 |
10 |
10 |
10 |
10 |
|
|
Roseate Tern Sterna dougallii |
0 |
6 |
7 |
7 |
52 |
|
|
Short-tailed Shearwater Puffinus tenuirostris |
0 |
0 |
0 |
0 |
1 |
|
|
Streaked Shearwater Calonectris leucomelas |
2 |
4 |
4 |
4 |
4 |
|
|
Unidentified Gull Larus sp. |
1 |
1 |
1 |
1 |
1 |
|
|
Unidentified Jaeger Stercorarius sp. |
16 |
16 |
16 |
16 |
16 |
|
|
Unidentified Tern Sterna sp. |
7 |
7 |
7 |
16 |
37 |
|
|
Seabirds |
White-winged Black Tern Chlidonias leucopterus |
22 |
39 |
39 |
39 |
48 |
|
Swallows / Swifts |
Barn Swallow Hirundo rustica |
15 |
15 |
15 |
15 |
26 |
|
Little Swift Apus affinis |
1 |
1 |
1 |
2 |
17 |
|
|
Pacific Swift Apus pacificus |
0 |
0 |
0 |
0 |
32 |
|
|
Black-crowned
Night Heron Nycticorax nycticorax |
0 |
0 |
0 |
0 |
1 |
|
|
Waders & Waterbirds |
Cattle Egret Bubulcus ibis (coromandus) |
23 |
23 |
23 |
23 |
23 |
|
Chinese Pond Heron Ardeola bacchus |
0 |
0 |
0 |
0 |
4 |
|
|
Common Kingfisher Alcedo atthis |
1 |
1 |
1 |
1 |
1 |
|
|
Curlew Numenius arquata (orientalis) |
0 |
0 |
0 |
0 |
1 |
|
|
Great Egret Egretta alba |
0 |
0 |
0 |
0 |
1 |
|
|
Greater Sand Plover Charadrius leschenaultii |
0 |
0 |
1 |
1 |
1 |
|
|
Green Sandpiper Tringa ochropus |
0 |
1 |
1 |
1 |
1 |
|
|
Grey Heron Ardea cinerea |
11 |
12 |
12 |
12 |
12 |
|
|
Little Egret Egretta garzetta |
25 |
25 |
25 |
45 |
53 |
|
|
Northern Shoveler Anas clypeata |
9 |
9 |
9 |
9 |
9 |
|
|
Pacific Golden Plover Pluvialis fulva |
3 |
3 |
3 |
3 |
3 |
|
|
Pacific Reef Egret Egretta sacra |
0 |
0 |
0 |
0 |
6 |
|
|
Red Knot Calidris canutus |
0 |
0 |
0 |
15 |
15 |
|
|
Red-necked Phalarope Phalaropus lobatus |
70 |
82 |
82 |
92 |
224 |
|
|
Ruddy Turnstone Arenaria interpres |
7 |
7 |
7 |
7 |
7 |
|
|
Unidentified egret Egretta sp. |
0 |
0 |
0 |
0 |
30 |
|
|
Unidentified shore bird |
12 |
12 |
12 |
12 |
12 |
|
|
Whimbrel Numenius phaeopus |
0 |
0 |
0 |
0 |
15 |
|
|
White-breasted Kingfisher Halcyon smyrnnsis |
0 |
0 |
0 |
0 |
1 |
|
|
Wood Sandpiper Tringa glareola |
30 |
30 |
30 |
30 |
30 |
|
|
Peak Daily Counts |
81 |
106 |
107 |
121 |
325 |
|
7.5.2.3 A total of 5,124 bird sighting records from 57 identified species and 6 unidentified species were obtained from 59 survey days, including 51 passerine sightings (1%), 782 raptor sightings (15%), 2,763 seabird sightings (54%), 366 sightings of swallows / swifts (7%), and 1,162 sightings of waders or waterbirds (23%).
7.5.2.4
Of all bird sightings, 21.4%
were within the proposed wind farm area with a
7.5.2.5 The most abundant species was Black-naped Tern, with a total of 1,048 individuals (21% of total birds) within the survey area. Another breeding tern species, Bridled Tern comprised the second largest bird population, with a total 883 individuals (17% of total birds) recorded. Following these two largest groups was the Red-necked Phalarope, with 772 individuals (15% of total birds) recorded.
7.5.2.6 More than half of all observations were of seabirds, and within this group 2,651 individuals (96% of seabirds) were terns, comprising 2,112 individuals from the three breeding terns (Black-naped Terns, Bridled Terns and Roseate Terns) and 539 individuals from 6 non-breeding tern species.
7.5.2.7
The peak daily count for the
whole survey area was 325 individuals recorded on 19 August 2006. Peak daily counts within the proposed
wind farm with a
7.5.2.8
Although Bridled Tern and
Red-necked Phalarope were less abundant than Black-naped Tern within the whole
survey area, they were the two most abundant species within the proposed wind
farm area. Approximately 1/4 observations of Bridled Tern and approximately 1/3
observations of Red-necked Phalarope were recorded within the proposed wind
farm areas under both turbine scenarios with a
7.5.2.9
When peak counts were
considered within the proposed wind farm areas with
7.5.2.10 To allow analysis of the pattern of bird flight height, all relevant data was grouped into categories corresponding to the configuration of the proposed wind turbine options as displayed by Table 7.16.
Table 7.16 Flight
Height Categories for Scenario A and Scenario B
|
Flight Height Categories |
Scenario A |
Scenario B |
|
“Below-rotor Zone” / “Clearance Zone” |
< |
< |
|
“Rotor Zone” |
|
30 – |
|
“Above-blade Zone” |
> |
> |
7.5.2.11 Table 7.17 and Table 7.18 summarises the total 3,626 birds (excluding 1,498 birds that were found resting on land / boat) observed at each height category recorded within the survey area between May 2006 and December 2007 for Scenario A and Scenario B respectively. The following datasets thus includes all birds in flight, regardless of the location they were observed with the broader field survey area.
Table 7.17 Number of Birds Observed at Each Flight Height Category within the Survey Area between May 2006 and December 2007 for Scenario A
|
Bird Type |
Species |
Flight Height Categories |
||
|
Below-rotor Zone |
Rotor Zone |
Above-blade Zone |
||
|
Passerines |
Black Drongo Dicrurus macrocercus |
7 |
0 |
0 |
|
Blue Rock Thrush Monticola solitarius |
1 |
0 |
0 |
|
|
Chinese Bulbul Pycnontus sinensis |
1 |
5 |
0 |
|
|
Collared Crow Corvus torquatus |
1 |
0 |
0 |
|
|
Crested Myna Acridotheres cristatellus |
11 |
2 |
7 |
|
|
Dollarbird Eurystomus orientalis |
0 |
1 |
0 |
|
|
Large-billed Crow Corvus marcorhynchos |
0 |
3 |
0 |
|
|
Oriental
Turtle Dove Streptopelia orientalis |
3 |
0 |
0 |
|
|
Yellow Wagtail Motacilla flava |
8 |
0 |
0 |
|
|
Yellow-bellied Prinia Prinia flaviventris |
1 |
0 |
0 |
|
|
Total
for Passerines |
33 |
11 |
7 |
|
|
Raptors |
Black Kite Milvus migrans |
195 |
294 |
121 |
|
Bonelli’s Eagle Hieraaetus fasciatus |
0 |
1 |
0 |
|
|
Raptors |
Chinese Goshawk Accipiter soloensis |
0 |
5 |
0 |
|
Common Buzzard Buteo buteo |
0 |
0 |
1 |
|
|
Common Kestrel Falco tinnunculus |
0 |
1 |
1 |
|
|
Eurasian Hobby Falco subbuteo |
0 |
1 |
0 |
|
|
Grey-faced Buzzard Butastur indicus |
0 |
1 |
0 |
|
|
Osprey Pandion haliaetus |
4 |
0 |
1 |
|
|
Peregrine Falcon Falco peregrinus |
4 |
5 |
3 |
|
|
Unidentified Raptor |
0 |
1 |
0 |
|
|
White-bellied Sea Eagle Haliaeetus leucogaster |
22 |
78 |
11 |
|
|
Total
for Raptors |
225 |
387 |
138 |
|
|
Seabirds |
Aleutian Tern Sterna aleutica |
149 |
5 |
0 |
|
Ancient Murrelet Synthliboramphus antiquus |
2 |
0 |
0 |
|
|
Black-naped Tern Sterna sumatrana |
160 |
5 |
0 |
|
|
Black-tailed Gull Larus crassirostris |
47 |
0 |
0 |
|
|
Bridled Tern Sterna anaethetus |
439 |
24 |
0 |
|
|
Common Tern Sterna hirundo |
156 |
1 |
0 |
|
|
Greater Crested Tern Sterna bergii |
2 |
0 |
0 |
|
|
Heuglin’s Gull Larus heuglini |
13 |
1 |
0 |
|
|
Litter Tern Sterna albisfrons |
2 |
0 |
0 |
|
|
Long-tailed Jaeger Stercorarius longicaudus |
6 |
0 |
0 |
|
|
Pomarine Jaeger Stercorarius pomarinus |
14 |
0 |
0 |
|
|
Roseate Tern Sterna dougallii |
30 |
0 |
0 |
|
|
Short-tailed Shearwater Puffinus tenuirostris |
2 |
0 |
0 |
|
|
Streaked Shearwater Calonectris leucomelas |
6 |
2 |
0 |
|
|
Seabirds |
Unidentified Gull Larus sp. |
1 |
0 |
0 |
|
Unidentified Jaeger Stercorarius sp. |
17 |
0 |
0 |
|
|
Unidentified Tern Sterna sp. |
89 |
1 |
0 |
|
|
White-winged Black Tern Chlidonias leucopterus |
118 |
8 |
0 |
|
|
Total
for Seabirds |
1250 |
47 |
0 |
|
|
Swallows / Swifts |
Barn Swallow Hirundo rustica |
87 |
1 |
0 |
|
Little Swift Apus affinis |
20 |
10 |
18 |
|
|
Pacific Swift Apus pacificus |
37 |
184 |
9 |
|
|
Total
for Swallows / Swifts |
144 |
195 |
27 |
|
|
Waders & Waterbirds |
Black-crowned
Night Heron Nycticorax nycticorax |
1 |
0 |
0 |
|
Cattle Egret Bubulcus ibis (coromandus) |
44 |
3 |
0 |
|
|
Chinese Pond Heron Ardeola bacchus |
4 |
0 |
0 |
|
|
Common Kingfisher Alcedo atthis |
1 |
0 |
0 |
|
|
Curlew Numenius arquata (orientalis) |
0 |
1 |
0 |
|
|
Great Egret Egretta alba |
1 |
0 |
0 |
|
|
Greater Sand Plover Charadrius leschenaultii |
1 |
0 |
0 |
|
|
Green Sandpiper Tringa ochropus |
1 |
0 |
0 |
|
|
Grey Heron Ardea cinerea |
12 |
0 |
0 |
|
|
Little Egret Egretta garzetta |
140 |
1 |
0 |
|
|
Northern Shoveler Anas clypeata |
10 |
0 |
0 |
|
|
Pacific Golden Plover Pluvialis fulva |
5 |
0 |
0 |
|
|
Pacific Reef Egret Egretta sacra |
71 |
5 |
4 |
|
|
Red Knot Calidris canutus |
0 |
15 |
0 |
|
|
Red-necked Phalarope Phalaropus lobatus |
717 |
5 |
0 |
|
|
Ruddy Turnstone Arenaria interpres |
7 |
0 |
0 |
|
|
Waders & Waterbirds |
Unidentified egret Egretta sp. |
0 |
30 |
0 |
|
Unidentified shore bird |
12 |
0 |
0 |
|
|
Whimbrel Numenius phaeopus |
33 |
0 |
0 |
|
|
White-breasted Kingfisher Halcyon smyrnnsis |
1 |
0 |
0 |
|
|
Wood Sandpiper Tringa glareola |
36 |
1 |
0 |
|
|
Total
for Waders & Waterbirds |
1097 |
61 |
4 |
|
|
Grand Total |
2749 |
701 |
176 |
|
|
Bird Type |
Species |
Flight Height Categories |
||
|
Below-rotor Zone |
Rotor Zone |
Above-blade Zone |
||
|
Passerines |
Black Drongo Dicrurus macrocercus |
7 |
0 |
0 |
|
Blue Rock Thrush Monticola solitarius |
1 |
0 |
0 |
|
|
Chinese Bulbul Pycnontus sinensis |
1 |
5 |
0 |
|
|
Collared Crow Corvus torquatus |
1 |
0 |
0 |
|
|
Crested Myna Acridotheres cristatellus |
11 |
3 |
6 |
|
|
Dollarbird Eurystomus orientalis |
0 |
1 |
0 |
|
|
Large-billed Crow Corvus marcorhynchos |
0 |
3 |
0 |
|
|
Oriental
Turtle Dove Streptopelia orientalis |
3 |
0 |
0 |
|
|
Yellow Wagtail Motacilla flava |
8 |
0 |
0 |
|
|
Yellow-bellied Prinia Prinia flaviventris |
1 |
0 |
0 |
|
|
Total
for Passerines |
33 |
12 |
6 |
|
|
Raptors |
Black Kite Milvus migrans |
147 |
390 |
73 |
|
Bonelli’s Eagle Hieraaetus fasciatus |
0 |
1 |
0 |
|
|
Raptors |
Chinese Goshawk Accipiter soloensis |
0 |
5 |
0 |
|
Common Buzzard Buteo buteo |
0 |
0 |
1 |
|
|
Common Kestrel Falco tinnunculus |
0 |
2 |
0 |
|
|
Eurasian Hobby Falco subbuteo |
0 |
1 |
0 |
|
|
Grey-faced Buzzard Butastur indicus |
0 |
1 |
0 |
|
|
Osprey Pandion haliaetus |
4 |
0 |
1 |
|
|
Peregrine Falcon Falco peregrinus |
4 |
7 |
1 |
|
|
Unidentified Raptor |
0 |
1 |
0 |
|
|
White-bellied Sea Eagle Haliaeetus leucogaster |
12 |
92 |
7 |
|
|
Total
for Raptors |
167 |
500 |
83 |
|
|
Seabirds |
Aleutian Tern Sterna aleutica |
148 |
6 |
0 |
|
Ancient Murrelet Synthliboramphus antiquus |
2 |
0 |
0 |
|
|
Black-naped Tern Sterna sumatrana |
158 |
7 |
0 |
|
|
Black-tailed Gull Larus crassirostris |
42 |
5 |
0 |
|
|
Bridled Tern Sterna anaethetus |
415 |
48 |
0 |
|
|
Common Tern Sterna hirundo |
156 |
1 |
0 |
|
|
Greater Crested Tern Sterna bergii |
2 |
0 |
0 |
|
|
Heuglin’s Gull Larus heuglini |
8 |
6 |
0 |
|
|
Litter Tern Sterna albisfrons |
2 |
0 |
0 |
|
|
Long-tailed Jaeger Stercorarius longicaudus |
6 |
0 |
0 |
|
|
Pomarine Jaeger Stercorarius pomarinus |
14 |
0 |
0 |
|
|
Roseate Tern Sterna dougallii |
30 |
0 |
0 |
|
|
Short-tailed Shearwater Puffinus tenuirostris |
1 |
1 |
0 |
|
|
Streaked Shearwater Calonectris leucomelas |
6 |
2 |
0 |
|
|
Unidentified Gull Larus sp. |
1 |
0 |
0 |
|
|
Seabirds |
Unidentified Jaeger Stercorarius sp. |
17 |
0 |
0 |
|
Unidentified Tern Sterna sp. |
80 |
7 |
0 |
|
|
White-winged Black Tern Chlidonias leucopterus |
118 |
8 |
0 |
|
|
Total
for Seabirds |
1206 |
91 |
0 |
|
|
Swallows / Swifts |
Barn Swallow Hirundo rustica |
87 |
1 |
0 |
|
Little Swift Apus affinis |
3 |
33 |
12 |
|
|
Pacific Swift Apus pacificus |
7 |
214 |
9 |
|
|
Total
for Swallows / Swifts |
97 |
248 |
21 |
|
|
Waders & Waterbirds |
Black-crowned
Night Heron Nycticorax nycticorax |
1 |
0 |
0 |
|
Cattle Egret Bubulcus ibis (coromandus) |
44 |
3 |
0 |
|
|
Chinese Pond Heron Ardeola bacchus |
4 |
0 |
0 |
|
|
Common Kingfisher Alcedo atthis |
1 |
0 |
0 |
|
|
Curlew Numenius arquata (orientalis) |
0 |
1 |
0 |
|
|
Great Egret Egretta alba |
1 |
0 |
0 |
|
|
Greater Sand Plover Charadrius leschenaultii |
1 |
0 |
0 |
|
|
Green Sandpiper Tringa ochropus |
1 |
0 |
0 |
|
|
Grey Heron Ardea cinerea |
12 |
0 |
0 |
|
|
Little Egret Egretta garzetta |
140 |
1 |
0 |
|
|
Northern Shoveler Anas clypeata |
10 |
0 |
0 |
|
|
Pacific Golden Plover Pluvialis fulva |
5 |
0 |
0 |
|
|
Pacific Reef Egret Egretta sacra |
70 |
6 |
4 |
|
|
Red Knot Calidris canutus |
0 |
15 |
0 |
|
|
Red-necked Phalarope Phalaropus lobatus |
707 |
15 |
0 |
|
|
Ruddy Turnstone Arenaria interpres |
7 |
0 |
0 |
|
|
Unidentified egret Egretta sp. |
0 |
30 |
0 |
|
|
Waders & Waterbirds |
Unidentified shore bird |
12 |
0 |
0 |
|
Whimbrel Numenius phaeopus |
33 |
0 |
0 |
|
|
White-breasted Kingfisher Halcyon smyrnnsis |
1 |
0 |
0 |
|
|
Wood Sandpiper Tringa glareola |
36 |
1 |
0 |
|
|
Total
for Waders & Waterbirds |
1086 |
72 |
4 |
|
|
Grand Total |
2589 |
923 |
114 |
|
7.5.2.12 The flight height data of the observed birds demonstrates that 76% (2,749 out of 3,626 birds) and 71% (2,589 out of 3,626 birds) fly below the proposed rotors (i.e. zone of clearance) for Scenario A and Scenario B, respectively.
7.5.2.13 Raptors and Swallows / Swifts are two groups of birds that were most frequently observed flying at relatively high altitudes: 70% of Raptors and 61% of Swallow / Swifts were recorded within or above rotor height for Scenario A, while 78% of Raptors and 74% of Swallows / Swifts were recorded within or above rotor height for Scenario B.
7.5.2.14 In order to investigate bird behaviour within the Study Area, all birds were assigned a behavioural category to their key activities under observation: “feeding” (including both in air and at water), “flying”, and “resting” (either “sitting” on water / “standing” on floating objects or perching on trees on adjacent land). Table 7.19 summarises the observed bird behaviour.
Table 7.19 Number of Birds Observed Under Each Behavioural Category with the Study Area between May 2006 and May 2007
|
Bird Type |
Species |
Feeding |
Flying |
Resting |
Total Counts |
|
Passerines |
Black Drongo Dicrurus macrocercus |
0 |
7 |
0 |
7 |
|
Blue Rock Thrush Monticola solitarius |
0 |
0 |
1 |
1 |
|
|
Chinese Bulbul Pycnontus sinensis |
0 |
6 |
0 |
6 |
|
|
Collared Crow Corvus torquatus |
0 |
1 |
0 |
1 |
|
|
Crested Myna Acridotheres cristatellus |
0 |
5 |
15 |
20 |
|
|
Dollarbird Eurystomus orientalis |
0 |
0 |
1 |
1 |
|
|
Passerines |
Large-billed Crow Corvus marcorhynchos |
0 |
1 |
2 |
3 |
|
Oriental
Turtle Dove Streptopelia orientalis |
0 |
3 |
0 |
3 |
|
|
Yellow Wagtail Motacilla flava |
0 |
8 |
0 |
8 |
|
|
Yellow-bellied Prinia Prinia flaviventris |
0 |
0 |
1 |
1 |
|
|
Total
for Passerines |
0 |
31 |
20 |
51 |
|
|
Raptors |
Black Kite Milvus migrans |
12 |
585 |
18 |
615 |
|
Bonelli’s Eagle Hieraaetus fasciatus |
0 |
1 |
0 |
1 |
|
|
Chinese Goshawk Accipiter soloensis |
0 |
5 |
0 |
5 |
|
|
Common Buzzard Buteo buteo |
0 |
1 |
0 |
1 |
|
|
Common Kestrel Falco tinnunculus |
0 |
2 |
0 |
2 |
|
|
Eurasian Hobby Falco subbuteo |
0 |
1 |
0 |
1 |
|
|
Grey-faced Buzzard Butastur indicus |
0 |
1 |
0 |
1 |
|
|
Osprey Pandion haliaetus |
0 |
4 |
1 |
5 |
|
|
Peregrine Falcon Falco peregrinus |
3 |
8 |
1 |
12 |
|
|
Unidentified Raptor |
0 |
1 |
0 |
1 |
|
|
White-bellied Sea Eagle Haliaeetus leucogaster |
4 |
62 |
72 |
138 |
|
|
Total
for Raptors |
19 |
671 |
92 |
782 |
|
|
Seabirds |
Aleutian Tern Sterna aleutica |
38 |
99 |
17 |
154 |
|
Ancient Murrelet Synthliboramphus antiquus |
0 |
2 |
0 |
2 |
|
|
Black-naped Tern Sterna sumatrana |
83 |
88 |
877 |
1048 |
|
|
Black-tailed Gull Larus crassirostris |
0 |
22 |
26 |
48 |
|
|
Bridled Tern Sterna anaethetus |
151 |
328 |
404 |
883 |
|
|
Common Tern Sterna hirundo |
13 |
136 |
18 |
167 |
|
|
Greater Crested Tern Sterna bergii |
0 |
2 |
1 |
3 |
|
|
Heuglin’s Gull Larus heuglini |
0 |
12 |
2 |
14 |
|
|
Litter Tern Sterna albisfrons |
0 |
2 |
0 |
2 |
|
|
Seabirds |
Long-tailed Jaeger Stercorarius longicaudus |
0 |
5 |
1 |
6 |
|
Pomarine Jaeger Stercorarius pomarinus |
0 |
14 |
0 |
14 |
|
|
Roseate Tern Sterna dougallii |
15 |
15 |
151 |
181 |
|
|
Short-tailed Shearwater Puffinus tenuirostris |
0 |
1 |
1 |
2 |
|
|
Streaked Shearwater Calonectris leucomelas |
0 |
8 |
0 |
8 |
|
|
Unidentified Gull Larus sp. |
0 |
1 |
0 |
1 |
|
|
Unidentified Jaeger Stercorarius sp. |
0 |
17 |
0 |
17 |
|
|
Unidentified Tern Sterna sp. |
3 |
83 |
1 |
87 |
|
|
White-winged Black Tern Chlidonias leucopterus |
15 |
109 |
2 |
126 |
|
|
Total
for Seabirds |
318 |
944 |
1501 |
2763 |
|
|
Swallows / Swifts |
Barn Swallow Hirundo rustica |
0 |
88 |
0 |
88 |
|
Little Swift Apus affinis |
33 |
15 |
0 |
48 |
|
|
Pacific Swift Apus pacificus |
86 |
144 |
0 |
230 |
|
|
Total
for Swallows / Swifts |
119 |
247 |
0 |
366 |
|
|
Waders & Water Birds |
Black-crowned
Night Heron Nycticorax nycticorax |
0 |
1 |
0 |
1 |
|
Waders & Waterbirds |
Cattle Egret Bubulcus ibis (coromandus) |
0 |
47 |
0 |
47 |
|
Chinese Pond Heron Ardeola bacchus |
0 |
4 |
0 |
4 |
|
|
Common Kingfisher Alcedo atthis |
0 |
1 |
0 |
1 |
|
|
Curlew Numenius arquata (orientalis) |
0 |
1 |
0 |
1 |
|
|
Great Egret Egretta alba |
0 |
1 |
0 |
1 |
|
|
Greater Sand Plover Charadrius leschenaultii |
0 |
1 |
0 |
1 |
|
|
Green Sandpiper Tringa ochropus |
0 |
1 |
0 |
1 |
|
|
Grey Heron Ardea cinerea |
0 |
12 |
0 |
12 |
|
|
Little Egret Egretta garzetta |
0 |
115 |
26 |
141 |
|
|
Northern Shoveler Anas clypeata |
0 |
1 |
9 |
10 |
|
|
Waders & Waterbirds |
Pacific Golden Plover Pluvialis fulva |
0 |
5 |
0 |
5 |
|
Pacific Reef Egret Egretta sacra |
6 |
64 |
10 |
80 |
|
|
Red Knot Calidris canutus |
0 |
15 |
0 |
15 |
|
|
Red-necked Phalarope Phalaropus lobatus |
51 |
188 |
493 |
722 |
|
|
Ruddy Turnstone Arenaria interpres |
0 |
7 |
0 |
7 |
|
|
Unidentified egret Egretta sp. |
0 |
30 |
0 |
30 |
|
|
Unidentified shore bird |
0 |
12 |
0 |
12 |
|
|
Whimbrel Numenius phaeopus |
0 |
33 |
0 |
33 |
|
|
White-breasted Kingfisher Halcyon smyrnnsis |
0 |
0 |
1 |
1 |
|
|
Wood Sandpiper Tringa glareola |
0 |
37 |
0 |
37 |
|
|
Total
for Waders & Waterbirds |
57 |
576 |
529 |
1162 |
|
|
Grand Total |
513 |
2469 |
2142 |
5124 |
|
7.5.2.15
The results display that only
513 feeding records (10% of sightings) were within the Study Area, with 46% of
these records reflecting the behaviour of Black-naped Tern and Bridled Tern.
Feeding behaviour was also significant for Pacific Swift (86 nos.), Red-necked
Phalarope (51 nos.), Aleut
7.5.2.16
For the two breeding tern
species, relatively large numbers of Bridled Tern were found feeding within the
proposed wind farm area or in the wind farm buffer areas. However, most of the Bridled Terns were
found following trawlers / boats when they were feeding (possibly on discarded
fishes by the trawlers). For
Black-naped Tern, most feeding activity was concentrated in near-shore waters
such as near Kong Tau Pai and / or East Ninepin. Only a few offshore feeding
records were obtained within the
7.5.2.17
Red-necked Phalarope was mostly
found feeding in near-shore waters although there were a small number of
feeding records obtained within the proposed wind farm area (Figure 7.16).
For Aleut
7.5.3
Ornithological Importance
of the Surveyed Area
7.5.3.1 Table 7.20 lists all 57 identified species and 6 unidentified species recorded within the Study in terms of residential and conservation status.
Table 7.20 Summary of Residential Status and Conservation Status of Bird Species Recorded in the Survey Area
|
Bird Type |
Species |
Residential Status1 |
Conservation Status2 |
||
|
Local (Yes/No) |
Regional (Yes/No) |
International (Yes/No) |
|||
|
Passerine |
Black Drongo |
Summer Visitor |
Yes (1) |
No |
No |
|
Blue Rock Thrush |
Yes (1) |
No |
No |
||
|
Chinese Bulbul |
Abundant Resident |
Yes (1) |
No |
No |
|
|
Collared Crow |
Uncommon Resident |
Yes (1, 3) |
No |
No |
|
|
Crested Myna |
Common Resident |
Yes (1) |
No |
No |
|
|
Dollarbird |
Uncommon Passage Migrant |
Yes (1) |
No |
No |
|
|
Large-bellied Crow |
Common Resident |
Yes (1) |
No |
No |
|
|
Oriental Turtle Dove |
Common Passage Migrant and Winter Visitor |
Yes (1) |
No |
No |
|
|
Yellow Wagtail |
Common Passage Migrant and Winter Visitor |
Yes (1) |
No |
No |
|
|
Yellow-bellied Prinia |
Common Resident |
Yes (1) |
No |
No |
|
|
Raptors |
Black Kite |
Common Resident and Winter Visitor |
Yes (1, 2) |
Yes (5) |
No |
|
Bonelli’s Eagle |
Resident |
Yes (1, 2) |
Yes (5, 6) |
No |
|
|
Chinese Goshawk |
Uncommon Passage Migrant |
Yes (1, 2) |
No |
No |
|
|
Raptors |
Common Buzzard |
Common Winter Visitor |
Yes (1, 2) |
No |
No |
|
Common Kestrel |
Common Autumn Migrant and Winter Visitor |
Yes (1, 2) |
No |
No |
|
|
Eurasian Hobby |
Uncommon Passage Migrant |
Yes (1, 2, 3) |
No |
No |
|
|
Grey-faced Buzzard |
Uncommon Passage Migrant |
Yes (1, 2) |
Yes (6) |
No |
|
|
Osprey |
Common Winter Visitor |
Yes (1, 2) |
Yes (5, 6) |
No |
|
|
Peregrine Falcon |
Scarce Resident and Winter Visitor |
Yes (1, 2, 3) |
No |
No |
|
|
Unidentified raptor |
N.A. |
N.A. |
N.A. |
No |
|
|
White-bellied Sea Eagle |
Uncommon Resident |
Yes (1, 2) |
Yes (5, 8) |
No |
|
|
Seabirds |
Aleutian Tern |
Uncommon Passage Migrant |
Yes (1) |
No |
No |
|
Ancient Murrelet |
Scarce Winter Visitor to Offshore Waters |
Yes (1) |
Yes (7) |
No |
|
|
Black-naped Tern |
Common Summer Visitor |
Yes (1, 3) |
No |
No |
|
|
Black-tailed Gull |
Uncommon Winter Visitor |
Yes (1, 3) |
No |
No |
|
|
Bridled Tern |
Uncommon Summer Visitor |
Yes (1, 3) |
No |
No |
|
|
Common Tern |
Common Passage Migrant |
Yes (1, 3) |
No |
No |
|
|
Greater Crested Tern |
Scarce Passage Migrant |
Yes (1) |
No |
No |
|
|
Heuglin’s Gull |
Common Winter Visitor and Passage Migrant |
Yes (1, 3) |
No |
No |
|
|
Little Tern |
Uncommon Passage Migrant |
Yes (1, 3) |
No |
No |
|
|
Long-tailed Jaeger |
Scarce Passage Migrant |
Yes (1) |
No |
No |
|
|
Pomarine Jaeger |
Occasional Visitor |
Yes (1) |
No |
No |
|
|
Roseate Tern |
Uncommon Summer Visitor |
Yes (1, 3) |
No |
No |
|
|
Short-tailed Shearwater |
N.A. |
Yes (1) |
No |
No |
|
|
Streaked Shearwater |
Occasional Visitor |
Yes (1) |
No |
No |
|
|
Unidentified Gull |
N.A. |
N.A. |
N.A. |
N.A. |
|
|
Unidentified Jaeger |
N.A. |
N.A. |
N.A. |
N.A. |
|
|
Unidentified Tern |
N.A. |
N.A. |
N.A |
N.A. |
|
|
White-winged Black Tern |
Uncommon Passage Migrant |
Yes (1) |
No |
No |
|
|
Swallows / Swifts |
Barn Swallow |
Abundant Passage Migrant and Summer Visitor |
Yes (1) |
No |
No |
|
Swallows / Swifts |
Little Swift |
Abundant Spring Migrant and Common Resident |
Yes (1) |
No |
No |
|
Pacific Swift |
Common Spring Migrant and Summer Visitor |
Yes (1, 3) |
No |
No |
|
|
Waders & Waterbirds |
Black-crowned Night Heron |
Common Resident and Winter Visitor |
Yes (1, 3) |
No |
No |
|
Cattle Egret |
Resident and Common Passage Migrant |
Yes (1, 3) |
No |
No |
|
|
Chinese Pond Heron |
Common Resident |
Yes (1) |
Yes (4) |
No |
|
|
Common Kingfisher |
Common Passage Migrant and Winter Visitor |
Yes (1) |
No |
No |
|
|
Curlew |
Abundant in Winter and Spring |
Yes (1) |
Yes (5) |
No |
|
|
Great Egret |
Common Resident and Winter Visitor |
Yes (1) |
Yes (4) |
No |
|
|
Greater Sand Plover |
Passage Migrant |
Yes (1) |
Yes (5) |
No |
|
|
Green Sandpiper |
Uncommon Passage and Winter Visitor |
Yes (1) |
No |
No |
|
|
Grey Heron |
Common Winter Visitor |
Yes (1) |
Yes (4) |
No |
|
|
Little Egret |
Common Resident |
Yes (1) |
No |
No |
|
|
Northern Shoveler |
Abundant Winter Visitor |
Yes (1) |
Yes (5) |
No |
|
|
Pacific Golden Plover |
Common Winter Visitor |
Yes (1, 3) |
No |
No |
|
|
Pacific Reef Egret |
Uncommon Resident |
Yes (1, 3) |
Yes (6) |
No |
|
|
Red Knot |
Common Passage Migrant |
Yes (1, 3) |
No |
No |
|
|
Red-necked Phalarope |
Common Passage Migrant |
Yes (1) |
No |
No |
|
|
Ruddy Turnstone |
Common Passage Migrant |
Yes (1, 3) |
No |
No |
|
|
Unidentified egret |
N.A. |
N.A. |
N.A. |
N.A. |
|
|
Unidentified shore bird |
N.A. |
N.A. |
N.A. |
N.A. |
|
|
Whimbrel |
Common Passage Migrant |
Yes (1,3 ) |
No |
No |
|
|
White-breasted Kingfisher |
Common Resident |
Yes (1, 3) |
No |
No |
|
|
Wood Sandpiper |
Common Passage Migrant and Winter Visitor |
Yes (1, 3) |
No |
No |
|
1Residential Status
of the species was referred to The Avifauna of
2Conservation Status:
1 – Listed under the
protection of “Wild Animal and Protection Ordinance (Cap. 170)”
2 – Listed under
“Protection of Endangered Species of Animals and
Plants Ordinance (Cap. 586)”
3 – Considered “Local
Concern” by Fellowes et al (2002)
4 – Considered “Potential Regional Concern” by
Fellowes et al (2002)
5 – Considered of “Regional Concern” by Fellowes et al
(2002)
6 – Considered “Rare” in
7– Considered “Vulnerable” in
8 – Considered “Indeterminate” in
7.5.3.2
Of the total 57 identified bird
species recorded in the Study Area, 35 species considered to be of particular
local or regional concern as referred in Table 7.20 (i.e. species of
conservation status listed as “
Table 7.21 Species of Local and /or Regional Conservation Concern and Their Abundance and Distribution in the Study Area (Data between May 2006 and December 2007)
|
Bird Type |
Species* |
Total
Counts
(WF + |
Birds at |
||
|
Scenario A |
Scenario B |
Scenario A |
Scenario B |
||
|
Passerines |
Collared Crow |
0 / 1 |
0 / 1 |
0 / 1 |
0 / 1 |
|
Raptors |
Black Kite |
4 / 615 |
4 / 615 |
415 / 610 |
463 / 610 |
|
Bonelli’s Eagle |
0 / 1 |
0 / 1 |
1 / 1 |
1 / 1 |
|
|
Chinese Goshawk |
1 / 5 |
1 / 5 |
5 / 5 |
5 / 5 |
|
|
Common Buzzard |
0 / 1 |
0 / 1 |
1 / 1 |
1 / 1 |
|
|
Common Kestrel |
0 / 2 |
0 / 2 |
2 / 2 |
2 / 2 |
|
|
Eurasian Hobby |
0 / 1 |
0 / 1 |
1 / 1 |
1 / 1 |
|
|
Grey-faced Buzzard |
0 / 1 |
0 / 1 |
1 / 1 |
1 / 1 |
|
|
Osprey |
1 / 5 |
1 / 5 |
1 / 5 |
1 / 5 |
|
|
Peregrine Falcon |
0 / 12 |
0 / 12 |
8 / 12 |
8 / 12 |
|
|
White-bellied Sea Eagle |
0 / 138 |
0 / 138 |
89 / 111 |
99 / 111 |
|
|
Seabirds |
Ancient Murrelet |
0 / 2 |
0 / 2 |
0 / 2 |
0 / 2 |
|
Black-naped Tern* |
12 / 1048 |
12 / 1048 |
5 / 165 |
7 / 165 |
|
|
Black-tailed Gull* |
38 / 48 |
38 / 48 |
0 / 47 |
5 / 47 |
|
|
Bridled Tern* |
222 / 883 |
224 / 883 |
24 / 463 |
48 / 463 |
|
|
Common Tern |
89 / 167 |
90 / 167 |
1 / 157 |
1 / 157 |
|
|
Heuglin’s Gull |
13 / 14 |
13 / 14 |
1 / 14 |
6 / 14 |
|
|
Little Tern |
2 / 2 |
2 / 2 |
0 / 2 |
0 / 2 |
|
|
Seabirds |
Roseate Tern |
7 / 181 |
7 / 181 |
0 / 30 |
0 / 30 |
|
Swallows / Swifts |
Pacific Swift |
0 / 230 |
0 / 230 |
193 / 230 |
223 / 230 |
|
Waders & Waterbirds |
Black-crowned Night Heron |
0 / 1 |
0 / 1 |
0 / 1 |
0 / 1 |
|
Cattle Egret* |
47 / 47 |
47 / 47 |
3 / 47 |
3 / 47 |
|
|
Chinese Pond Heron |
0 / 4 |
0 / 4 |
0 / 4 |
0 / 4 |
|
|
Curlew |
0 / 1 |
0 / 1 |
1 / 1 |
1 / 1 |
|
|
Great Egret |
0 / 1 |
0 / 1 |
0 / 1 |
0 / 1 |
|
|
Greater Sand Plover |
1 / 1 |
1 / 1 |
0 / 1 |
0 / 1 |
|
|
Grey Heron |
12 / 12 |
12 / 12 |
0 / 12 |
0 / 12 |
|
|
Northern Shoveler |
10 / 10 |
10 / 10 |
0 / 10 |
0 / 10 |
|
|
Pacific Golden Plover |
3 / 5 |
3 / 5 |
0 / 5 |
0 / 5 |
|
|
Pacific Reef Egret |
0 / 80 |
0 / 80 |
9 / 80 |
10 / 80 |
|
|
Red Knot |
0 / 15 |
0 / 15 |
15 / 15 |
15 / 15 |
|
|
Ruddy Turnstone |
7 / 7 |
7 / 7 |
0 / 7 |
0 / 7 |
|
|
Whimbrel |
0 / 33 |
0 / 33 |
0 / 33 |
0 / 33 |
|
|
White-breasted Kingfisher |
0 / 1 |
0 / 1 |
0 / 1 |
0 / 1 |
|
|
Wood Sandpiper |
31 / 37 |
31 / 37 |
1 / 37 |
1 / 37 |
|
*Species
recorded relatively more frequently within the “WF +
Species of Relatively High Sensitivity
7.5.3.3 Based on the results of the desktop study and the field survey, several species or species groups are considered to be of relatively higher sensitivity due to their conservation significance, distribution and / or abundance within the Study Area:
7.5.3.4
7.5.3.5 Figure 7.19 displays the distribution of all WBSE records from May 2006 through December 2007 field surveys overlaid with the wind farm boundary representing Scenario A and Scenario B.
7.5.3.6
A WBSE nest with two juveniles
was first recorded at Wang Chau on 20 March 2007 during the field survey.
Another adult pair of WBSE was also regularly seen around
7.5.3.7
The focussed surveys were
conducted through roaming the near-shore area around those islets where WBSEs
were previously seen. The observer followed any observed WBSE to record their
behaviour (e.g. foraging attempts, sitting on nests, etc.) and their flight
path using a portable GPS, until the bird was lost from sight. During observations a distance of at
least
7.5.3.8
During the
non-breeding period (i.e. July to October), adult WBSE were always found in or
near the islets (Wang Chau and Steep Island) and were more active in the late
afternoon, usually foraging within
7.5.3.9
The pair
at Wang Chau became more sedentary in autumn 2007 and they were seen to return
to the nest used in the last breeding period (winter-spring 2006 / 2007). In November 2007 one bird of the pair
was seen carrying nesting materials back to the previous nesting location where
it sat from December 2007 through February 2008 while its companion was present
nearby. These activities suggested that the pair were attempting to breed. By early March 2008 the adult WBSE had
been seen sitting on the nest for more than 8 weeks (i.e., longer than the
incubation period of ~40 days), however no young / juvenile WBSE were observed.
7.5.3.10
In March
and early April, the adult WBSE pair started to leave the nest and they finally
abandoned the nest and became more mobile and changed their resting sites more
often in the nearby area in the second half of April 2008. These observations
confirm that the Wang Chau’s pair had failed to successfully breed during
winter 2007 / spring 2008.
7.5.3.11
No
juvenile / young WBSEs were observed on the islands, suggesting that the two
juveniles raised in the last breeding season by the Wang Chau pair had left the
nest at Wang Chau and moved outside the study area.
7.5.3.12 Terns (Sternidae) are considered to be potentially susceptible to wind farm collision (Langston and Pullan, 2006). Field survey data suggest the three tern species form the largest component of the seabird population in the Study Area, comprising 2,112 of all birds (41%) and 18% of all feeding records.
7.5.3.13
All Roseate Terns were observed
below the proposed rotor heights (<
7.5.3.14 Red-necked Phalarope was recently found to be one of the most abundant species in southern / south-eastern HKSAR waters (HKBWS, 2006). The EIA Study field survey data support this conclusion, with Red-necked Phalarope comprising approximately 14% of all bird records.
7.5.3.15
Approximately 34% of
observations were made within “WF +
7.5.3.16 Aleutian Tern (n = 154), White-winged Black Tern (n = 126), Black-tailed Gull (n = 48) and Cattle Egret (n = 47) were less abundant than the breeding terns and Red-necked Phalarope, but are still relatively abundant in the field survey area.
7.5.3.17
These species were also
relatively abundant in the “WF +
7.6
Construction Phase Impact
Assessment
7.6.1.1 The construction phase activities shall involve shipment of components to the site for installation, likely from a barge, with support from a number of workboats.
7.6.1.2 These activities shall not result in any adverse impact upon birds, although it shall be necessary that general refuse generated by the construction workforce be appropriately handed and disposed to avoid windblown litter that could be ingested by seabirds.
7.7
Operation
Phase
Impact Assessment
7.7.1.1 In this EIA study, the majority of the birds recorded were found highly restricted to near-shore coastal areas, and all bird species recorded belong to surface-feeding species.
7.7.1.2 Given the remoteness of the wind farm site and lack of special habitat interest in the offshore environment (e.g. low fishery productivity in offshore area as described in Section 8), birds in the Study Area are not anticipated to suffer from loss of marine habitat (benthic habitats) or particular foraging areas. The impact of habitat loss is thus considered to be negligible.
7.7.2 Disturbance / Displacement
7.7.2.1
It is believed that the
presence of an offshore wind farm may result in bird avoidance (i.e. birds
avoid using sea areas within or close to a wind farm due to any possible
environmental disturbance from the wind farm) (Drewitt and Langston, 2006
7.7.2.2 Although relatively high abundance of Bridled Terns was found feeding within the proposed wind farm and its buffer area, the feeding behaviour, as evidenced by field observation, was strongly associated with the presence of fishing trawlers / boats from which the terns may feed on discarded fishes. As the proposed wind farm site has low fisheries productivity and given that most birds in the Study Area prefer feeding at near-shore waters (including around islands) where there is higher fisheries productivity, potential disturbance / displacement impacts on birds are anticipated to be negligible.
7.7.2.3
The
turbines will be painted using non-reflective paint to reduce “blade glint”
(glare from the sun reflecting off the turbine blades), so as to avoid potential
disturbance on the vision of flying birds.
Given this it can be expected that in the open-water environment glare
reflected off the turbines will be insignificant compared to the glare from the
water surface.
7.7.2.4
During
operations some turbine noise / blade whistles may be produced when the
turbines rotate. Research by
Dooling (2002), including a review of the literature on birds hearing ability
in noisy (windy) conditions suggests that birds cannot hear the noise from wind
turbines as well as humans can. As
most birds hear best between about 1 and 5kHz, and the turbine noise and wind
noise are predominantly of low frequencies (below 1-2kHz), the Project’s
operation would not be significant in increasing the overall sound pressure
level on birds.
7.7.3.1 When a wind farm is constructed across a well-defined bird migratory route and bird avoidance responses are significant, it may result in a “barrier effect” that may alter the flyways or flight paths of the migratory species (Drewitt and Langston, 2006).
7.7.3.2 Guidance on the siting of wind farms published by English Nature et al (2001) refers to the need for developments to avoid known bird migration routes, local flight paths, foraging areas, and coastal and inland wetland sites and upland sites of high ornithological importance, particularly those supporting large populations of migratory waterfowl. These considerations have been taken into account for the proposed Project, with field survey data indicating the absence of any significant local flight paths associated with the site location, and with the Project being very deliberately located as far offshore away from more sensitive coastal areas as is deemed practicable.
7.7.3.3 The previous sub-sections refer to migratory species that utilise the area on a seasonal basis, most notably the breeding terns and Red-necked Phalarope that fly through the general area. As these species generally approach coastal areas from the south when arriving to breed, there exist many corridors of entry to the HKSAR coastline. Survey by HKBWS, for example, has determined that southern waters in general to be inhabited by migratory seabirds including terns in some abundance, while from field observations it is known that from landing these birds will travel around the coastline away from exposed offshore areas.
7.7.3.4 It can be expected that some inbound migrants may currently pass through the proposed Project area, although with an indicative turbine spacing of 560 metres the barrier effect of the proposed wind farm on bird migration is not anticipated to be significant.
7.7.4.1
The SNH bird collision risk
model (Band et al, 2007) has been
used to quantify collision risk for a number of selected species that were found
to be relatively most dominant in the Study Area and considered potentially
sensitive to wind farm operation in Sub-section 7.6.
7.7.4.2
Selected species include the
breeding tern species, Black-naped
Tern, Bridled Tern, the waterbirds Red-necked Phalarope
and Cattle Egret, and the seabirds including Aleutian Tern, White-winged Black
Tern and Black-tailed Gull. WBSE was not included in the calculation of
collision risk, as no bird record was found within the proposed wind farm area
and its
7.7.4.3 The predicted numbers of collisions for the seven bird species per season are listed in Tables 7.22 – 7.35. Cases of no avoidance and 95% avoidance action (where a probability of 95% is that an individual bird, or individuals within a flock, has a 95% chance to successfully avoid collision with the turbine when it make a transit past it)
7.7.4.4 are presented in the following to demonstrate the conditions for both the worst case (no avoidance) and the typical (conservative) assumption for real situations respectively.
Table 7.22 Collision
Rates of Black-naped Tern in Both the Worst Case and the Typical Condition for
Scenario A
|
Season |
Spring Migratory Period |
Summer Period |
Autumn Migratory Period |
Winter Period |
|
Flight Risk Volume (Vw) (m3) |
3,080,439,000 |
3,080,439,000 |
3,080,439,000 |
3,080,439,000 |
|
Rotor swept volume (Vr)(m3) |
1,815,764 |
1,815,764 |
1,815,764 |
1,815,764 |
|
Proportion of time within flight risk volume
(Pw) |
0.02% |
0.05% |
0% |
0% |
|
Bird occupancy of flight risk volume (nw)
(seconds/season) |
231.10 |
770.34 |
0 |
0 |
|
Bird occupancy of swept volume (nr)
(seconds/season) |
0.1362 |
0.4541 |
0 |
0 |
|
Number of bird transits through rotor (per
season) |
0.3070 |
1.0233 |
0 |
0 |
|
Band collision risk - p(collision) |
23.50% |
23.50% |
23.50% |
23.50% |
|
Collision per season (no avoidance) |
0.072145 |
0.240482 |
0 |
0 |
|
Collision per season (95% avoidance) |
0.003607 |
0.012024 |
0 |
0 |
Table 7.23 Collision
Rates of Black-naped Tern in Both the Worst Case and the Typical Condition for
Scenario B
|
Season |
Spring Migratory Period |
Summer Period |
Autumn Migratory Period |
Winter Period |
|
Flight Risk Volume (Vw) (m3) |
4,332,149,160 |
4,332,149,160 |
4,332,149,160 |
4,332,149,160 |
|
Rotor swept volume (Vr)(m3) |
1,975,584 |
1,975,584 |
1,975,584 |
1,975,584 |
|
Proportion of time within flight risk volume
(Pw) |
0.03% |
0.07% |
0% |
0% |
|
Bird occupancy of flight risk volume (nw)
(seconds/season) |
341.26 |
1137.53 |
0 |
0 |
|
Bird occupancy of swept volume (nr)
(seconds/season) |
0.1556 |
0.5187 |
0 |
0 |
|
Number of bird transits through rotor (per
season) |
0.3421 |
1.1404 |
0 |
0 |
|
Band collision risk - p(collision) |
16.21% |
16.21% |
16.21% |
16.21% |
|
Collision per season (no avoidance) |
0.055455 |
0.184850 |
0 |
0 |
|
Collision per season (95% avoidance) |
0.002773 |
0.009243 |
0 |
0 |
7.7.4.5
Black-naped
Tern was recorded during the Spring Migratory Periods in 2006 and 2007 and the Summer
Period 2006. Under both Scenarios
the predicted number of collisions is very low even without avoidance action,
leading to the conclusion that collision risk for Black-naped Tern is
negligible.
Table
7.24 Collision
Rates of Bridled Tern in Both the Worst Case and the Typical Condition for
Scenario A
|
Season |
Spring Migratory Period |
Summer Period |
Autumn Migratory Period |
Winter Period |
|
Flight Risk Volume (Vw) (m3) |
3,080,439,000 |
3,080,439,000 |
3,080,439,000 |
3,080,439,000 |
|
Rotor swept volume (Vr)(m3) |
1,849,862 |
1,849,862 |
1,849,862 |
1,849,862 |
|
Proportion of time within flight risk volume
(Pw) |
0.85% |
1.76% |
0.04% |
0% |
|
Bird occupancy of flight risk volume (nw)
(seconds/season) |
11,373.91 |
28,336.52 |
590.34 |
0 |
|
Bird occupancy of swept volume (nr)
(seconds/season) |
6.8303 |
17.0166 |
0.3545 |
0 |
|
Number of bird transits through rotor (per
season) |
7.8690 |
19.6044 |
0.4084 |
0 |
|
Band collision risk - p(collision) |
46.56% |
46.56% |
46.56% |
46.56% |
|
Collision per season (no
avoidance) |
3.663997 |
9.128338 |
0.190174 |
0 |
|
Collision per season (95%
avoidance) |
0.183200 |
0.456417 |
0.009509 |
0 |
|
Season |
Spring Migratory Period |
Summer Period |
Autumn Migratory Period |
Winter Period |
|
Flight Risk Volume (Vw) (m3) |
4,332,149,160 |
4,332,149,160 |
4,332,149,160 |
4,332,149,160 |
|
Rotor swept volume (Vr)(m3) |
2,011,775 |
2,011,775 |
2,011,775 |
2,011,775 |
|
Proportion of time within flight risk volume
(Pw) |
1.80% |
3.71% |
0.09% |
0% |
|
Bird occupancy of flight risk volume (nw)
(seconds/season) |
23,993.41 |
59776.24 |
1245.34 |
0 |
|
Bird occupancy of swept volume (nr)
(seconds/season) |
11.1421 |
27.7591 |
0.5783 |
0 |
|
Number of bird transits through rotor (per
season) |
12.5277 |
31.2110 |
0.6502 |
0 |
|
Band collision risk - p(collision) |
32.10% |
32.10% |
32.10% |
32.10% |
|
Collision per season (no avoidance) |
4.021065 |
10.017922 |
0.208707 |
0 |
|
Collision per season (95% avoidance) |
0.201053 |
0.500896 |
0.010435 |
0 |
7.7.4.6
Bridled
Tern was recorded in all seasons except for the two winter periods. For no bird
avoidance, approximately 9 and 10 collisions are predicted for Bridled Tern for
the Summer Period for Scenario A and Scenario B respectively. However, assuming 95% avoidance as a
conservative scenario as suggested by SNH, less than 1 bird collision is
predicted in any season. The magnitude of collision risk for Bridled Tern is
thus considered to be negligible.
7.7.4.7
As Bridled
Tern usually flies at low altitudes or near the water surface, the Scenario A
turbine option would provide more vertical clearance between the rotor and sea
surface and would thus give rise a lower collision rate for the species.
Table
7.26 Collision
Rates of Red-necked Phalarope in Both the Worst Case and the Typical Condition for
Scenario A
|
Season |
Spring Migratory Period |
Summer Period |
Autumn Migratory Period |
Winter Period |
|
Flight Risk Volume (Vw) (m3) |
3,080,439,000 |
3,080,439,000 |
3,080,439,000 |
3,080,439,000 |
|
Rotor swept volume (Vr)(m3) |
1,773,140 |
1,773,140 |
1,773,140 |
1,773,140 |
|
Proportion of time within flight risk volume
(Pw) |
0.17% |
0% |
0% |
0% |
|
Bird occupancy of flight risk volume (nw)
(seconds/season) |
3612.48 |
0 |
0 |
0 |
|
Bird occupancy of swept volume (nr)
(seconds/season) |
2.0796 |
0 |
0 |
0 |
|
Number of bird transits through rotor (per
season) |
2.5995 |
0 |
0 |
0 |
|
Band collision risk - p(collision) |
41.67% |
41.67% |
41.67% |
41.67% |
|
Collision per season (no avoidance) |
1.083140 |
0 |
0 |
0 |
|
Collision per season (95% avoidance) |
0.054157 |
0 |
0 |
0 |
|
Season |
Spring Migratory Period |
Summer Period |
Autumn Migratory Period |
Winter Period |
|
Flight Risk Volume (Vw) (m3) |
4,332,149,160 |
4,332,149,160 |
4,332,149,160 |
4,332,149,160 |
|
Rotor swept volume (Vr)(m3) |
1,930,345 |
1,930,345 |
1,930,345 |
1,930,345 |
|
Proportion of time within flight risk volume
(Pw) |
0.55% |
0% |
0% |
0% |
|
Bird occupancy of flight risk volume (nw)
(seconds/season) |
11,432.00 |
0 |
0 |
0 |
|
Bird occupancy of swept volume (nr)
(seconds/season) |
5.0939 |
0 |
0 |
0 |
|
Number of bird transits through rotor (per
season) |
6.2078 |
0 |
0 |
0 |
|
Band collision risk - p(collision) |
28.76% |
28.76% |
28.76% |
28.76% |
|
Collision per season (no avoidance) |
1.785410 |
0 |
0 |
0 |
|
Collision per season (95% avoidance) |
0.089270 |
0 |
0 |
0 |
7.7.4.8
Red-necked
Phalarope was recorded during the two Spring Migratory Periods (2006 and 2007),
the Summer Period 2007 and the Autumn Migratory Period 2007. However, all
records of Red-necked Phalarope at the five point-count locations were obtained
during the two Spring Migratory Periods and hence these data were used for
calculating collision risk.
7.7.4.9
The
highest number of collisions predicted for Red-necked Phalarope is
approximately 1.79 birds and 0.089 birds per season for Spring Migratory Period
under Scenario B assuming no bird avoidance and under typical conditions,
respectively. The magnitude of collision risk for Red-necked Phalarope is
considered to be negligible.
7.7.4.10
Like
Bridled Tern, Red-necked Phalarope usually fly at lower altitudes and thus the
predicted collision rates are relatively more sensitive to rotor heights. Less
bird collision was predicted for Scenario A due to more vertical clearance.
Table
7.28 Collision
Rates of Cattle Egret in Both the Worst Case and Typical Conditions for
Scenario A
|
Season |
Spring Migratory Period |
Summer Period |
Autumn Migratory Period |
Winter Period |
|
Flight Risk Volume (Vw) (m3) |
3,080,439,000 |
3,080,439,000 |
3,080,439,000 |
3,080,439,000 |
|
Rotor swept volume (Vr)(m3) |
1,913,798 |
1,913,798 |
1,913,798 |
1,913,798 |
|
Proportion of time within flight risk volume
(Pw) |
0.36% |
0% |
0% |
0% |
|
Bird occupancy of flight risk volume (nw)
(seconds/season) |
5901.36 |
0 |
0 |
0 |
|
Bird occupancy of swept volume (nr)
(seconds/season) |
3.664 |
0 |
0 |
0 |
|
Number of bird transits through rotor (per
season) |
5.8793 |
0 |
0 |
0 |
|
Band collision risk - p(collision) |
34.23% |
34.23% |
34.23% |
34.23% |
|
Collision per season (no avoidance) |
2.012701 |
0 |
0 |
0 |
|
Collision per season (95% avoidance) |
0.100635 |
0 |
0 |
0 |
Table 7.29 Collision
Rates of Cattle Egret in Both the Worst Case and Typical Conditions for
Scenario B
|
Season |
Spring Migratory Period |
Summer Period |
Autumn Migratory Period |
Winter Period |
|
Flight Risk Volume (Vw) (m3) |
4,332,149,000 |
4,332,149,000 |
4,332,149,000 |
4,332,149,000 |
|
Rotor swept volume (Vr)(m3) |
2,079,634 |
2,079,634 |
2,079,634 |
2,079,634 |
|
Proportion of time within flight risk volume
(Pw) |
0.38% |
0% |
0% |
0% |
|
Bird occupancy of flight risk volume (nw)
(seconds/season) |
6224.50 |
0 |
0 |
0 |
|
Bird occupancy of swept volume (nr)
(seconds/season) |
2.9881 |
0 |
0 |
0 |
|
Number of bird transits through rotor (per
season) |
4.6800 |
0 |
0 |
0 |
|
Band collision risk - p(collision) |
23.57% |
23.57% |
23.57% |
23.57% |
|
Collision per season (no avoidance) |
1.103062 |
0 |
0 |
0 |
|
Collision per season (95% avoidance) |
0.055153 |
0 |
0 |
0 |
7.7.4.11
Cattle
Egret was only recorded during the Spring Migratory Period 2007. The highest number
of collisions per season predicted for Cattle Egret assuming no avoidance is
approximately 2.0 for Scenario A and approximately 1.1 for Scenario B.
Approximately 0.1 and 0.06 collisions per season were predicted for typical
conditions for Scenario A and Scenario B, respectively. The magnitude of
collision risk for Cattle Egret is considered to be negligible.
Table
7.30 Collision
Rates of Aleut
|
Season |
Spring Migratory Period |
Summer Period |
Autumn Migratory Period |
Winter Period |
|
Flight Risk Volume (Vw) (m3) |
3,080,439,000 |
3,080,439,000 |
3,080,439,000 |
3,080,439,000 |
|
Rotor swept volume (Vr)(m3) |
1,849,862 |
1,849,862 |
1,849,862 |
1,849,862 |
|
Proportion of time within flight risk volume
(Pw) |
0.02% |
0.02% |
0.50% |
0.01% |
|
Bird occupancy of flight risk volume (nw)
(seconds/season) |
27.01 |
45.02 |
9958.41 |
22.92 |
|
Bird occupancy of swept volume (nr)
(seconds/season) |
0.0162 |
0.0270 |
5.9802 |
0.0138 |
|
Number of bird transits through rotor (per
season) |
0.0206 |
0.0343 |
7.5786 |
0.0174 |
|
Band collision risk - p(collision) |
42.34% |
42.34% |
42.34% |
42.34% |
|
Collision per season (no avoidance) |
0.008703 |
0.014505 |
3.208483 |
0.007384 |
|
Collision per season (95% avoidance) |
0.000435 |
0.000725 |
0.160424 |
0.000369 |
Table 7.31 Collision
Rates of Aleut
|
Season |
Spring Migratory Period |
Summer Period |
Autumn Migratory Period |
Winter Period |
|
Flight Risk Volume (Vw) (m3) |
4,332,149,160 |
4,332,149,160 |
4,332,149,160 |
4,332,149,160 |
|
Rotor swept volume (Vr)(m3) |
2,011,775 |
2,011,775 |
2,011,775 |
2,011,775 |
|
Proportion of time within flight risk volume
(Pw) |
0.02% |
0.02% |
0.63% |
0.02% |
|
Bird occupancy of flight risk volume (nw)
(seconds/season) |
34.19 |
56.98 |
12,604.43 |
29.01 |
|
Bird occupancy of swept volume (nr)
(seconds/season) |
0.0159 |
0.0265 |
5.8533 |
0.0135 |
|
Number of bird transits through rotor (per
season) |
0.0196 |
0.0327 |
7.2393 |
0.0167 |
|
Band collision risk - p(collision) |
29.18% |
29.18% |
29.18% |
29.18% |
|
Collision per season (no avoidance) |
0.005731 |
0.009551 |
2.112723 |
0.004862 |
|
Collision per season (95% avoidance) |
0.000287 |
0.000478 |
0.105636 |
0.000243 |
7.7.4.12
For Aleutian
Tern the highest predicted number of bird collisions was about 3.2 for Autumn
Migratory Period under Scenario A with no avoidance. For typical conditions and
both scenarios the predicted number of collisions is minimal or negligible, and
overall the results suggest a negligible risk.
Table 7.32 Collision
Rates of White-winged Black Tern in Both the Worst Case and Typical Conditions
for Scenario A
|
Season |
Spring Migratory Period |
Summer Period |
Autumn Migratory Period |
Winter Period |
|
Flight Risk Volume (Vw) (m3) |
3,080,439,00 |
3,080,439,00 |
3,080,439,00 |
3,080,439,00 |
|
Rotor swept volume (Vr)(m3) |
1,785,927 |
1,785,927 |
1,785,927 |
1,785,927 |
|
Proportion of time within flight risk volume
(Pw) |
0.40% |
0% |
0.08% |
0% |
|
Bird occupancy of flight risk volume (nw)
(seconds/season) |
3631.61 |
0 |
403.51 |
0 |
|
Bird occupancy of swept volume (nr)
(seconds/season) |
2.1055 |
0 |
0.2339 |
0 |
|
Number of bird transits through rotor (per
season) |
2.4120 |
0 |
0.2680 |
0 |
|
Band collision risk - p(collision) |
45.70% |
45.70% |
45.70% |
45.70% |
|
Collision per season (no avoidance) |
1.102388 |
0 |
0.122488 |
0 |
|
Collision per season (95% avoidance) |
0.055119 |
0 |
0.006124 |
0 |
Table 7.33 Collision
Rates of White-winged Black Tern in Both the Worst Case and Typical Conditions
for Scenario B
|
Season |
Spring Migratory Period |
Summer Period |
Autumn Migratory Period |
Winter Period |
|
Flight Risk Volume (Vw) (m3) |
4,332,149,160 |
4,332,149,160 |
4,332,149,160 |
4,332,149,160 |
|
Rotor swept volume (Vr)(m3) |
1,943,917 |
1,943,917 |
1,943,917 |
1,943,917 |
|
Proportion of time within flight risk volume
(Pw) |
0.42% |
0% |
0.08% |
0% |
|
Bird occupancy of flight risk volume (nw)
(seconds/season) |
3830.46 |
0 |
425.61 |
0 |
|
Bird occupancy of swept volume (nr)
(seconds/season) |
1.7188 |
0 |
0.1910 |
0 |
|
Number of bird transits through rotor (per
season) |
1.9200 |
0 |
0.2133 |
0 |
|
Band collision risk - p(collision) |
31.55% |
31.55% |
31.55% |
31.55% |
|
Collision per season (no avoidance) |
0.605805 |
0 |
0.067312 |
0 |
|
Collision per season (95% avoidance) |
0.030290 |
0 |
0.003366 |
0 |
7.7.4.13
White-winged
Black Tern was recorded within the proposed wind farm area(s) in all survey
periods except the two winter periods (2006-2007 and 2007). However, only 5 bird
individuals were recorded in the two Summer Periods and outside the fixed
point-count locations. Therefore, only records from the two Spring Migratory
Periods and the Autumn Migratory Periods were used for calculating bird
collision risks.
7.7.4.14
The
highest number of collisions predicted for White-winged Black Tern under no
bird avoidance condition is 1.1 for Spring Migratory Period under Scenario A.
For typical conditions assuming 95% bird avoidance rate, all the predicted bird
collision rates are negligible, though Scenario A generally gives a higher
collision risk to White-winged Black Tern. The magnitude of collision risk for
White-winged Black Tern is therefore considered to be negligible.
Table 7.34 Collision
Rates of Black-tailed Gull in Both the Worst Case and Typical Conditions for
Scenario A
|
Season |
Spring Migratory Period |
Summer Period |
Autumn Migratory Period |
Winter Period |
|
Flight Risk Volume (Vw) (m3) |
3,080,439,000 |
3,080,439,000 |
3,080,439,000 |
3,080,439,000 |
|
Rotor swept volume (Vr)(m3) |
1,892486 |
1,892486 |
1,892486 |
1,892486 |
|
Proportion of time within flight risk volume
(Pw) |
0% |
0% |
0% |
0% |
|
Bird occupancy of flight risk volume (nw)
(seconds/season) |
0 |
0 |
0 |
0 |
|
Bird occupancy of swept volume (nr)
(seconds/season) |
0 |
0 |
0 |
0 |
|
Number of bird transits through rotor (per
season) |
0 |
0 |
0 |
0 |
|
Band collision risk - p(collision) |
30.65% |
30.65% |
30.65% |
30.65% |
|
Collision per season (no avoidance) |
0 |
0 |
0 |
0 |
|
Collision per season (95% avoidance) |
0 |
0 |
0 |
0 |
Table 7.35 Collision
Rates of Black-tailed Gull in Both the Worst Case and Typical Conditions for
Scenario B
|
Season |
Spring Migratory Period |
Summer Period |
Autumn Migratory Period |
Winter Period |
|
Flight Risk Volume (Vw) (m3) |
4,332,149,160 |
4,332,149,160 |
4,332,149,160 |
4,332,149,160 |
|
Rotor swept volume (Vr)(m3) |
2,057,014 |
2,057,014 |
2,057,014 |
2,057,014 |
|
Proportion of time within flight risk volume
(Pw) |
0% |
0% |
0.17% |
0.25% |
|
Bird occupancy of flight risk volume (nw)
(seconds/season) |
0 |
0 |
606.60 |
3844.43 |
|
Bird occupancy of swept volume (nr)
(seconds/season) |
0 |
0 |
0.2880 |
1.8254 |
|
Number of bird transits through rotor (per
season) |
0 |
0 |
0.5004 |
3.1715 |
|
Band collision risk - p(collision) |
21.13% |
21.13% |
21.13% |
21.13% |
|
Collision per season (no avoidance) |
0 |
0 |
0.105744 |
0.670168 |
|
Collision per season (95% avoidance) |
0 |
0 |
0.005287 |
0.033508 |
7.7.4.15
Black-tailed
Gull was only recorded within the proposed wind farm area(s) during the Autumn Migratory
Period and the two Winter Periods. The collision risk of Black-tailed Gull is
very sensitive to the rotor height. No bird individual was found flying within
or above rotor height for Scenario A (where the vertical clearance is from
water up to <
7.7.4.16
For each
of the surveyed season, the number of collisions predicted for Black-tailed
Gull in Scenario B is very low even the species takes no avoidance. It is
therefore concluded that the magnitude of collision risk for Black-tailed Gull
is considered to be negligible.
7.7.5 Summary of Significance of Impacts on
Avifauna
7.7.5.1
Given the
magnitude of all possible impacts resulted from construction and operation of
the proposed wind farm are predicted to be negligible, and the lack of species
of “very high” sensitivity in the Study Area or in the vicinity, the
significance of impacts of the proposed wind farm on avifauna are predicted to
be very low.
7.8
Mitigation Measures & Best Practice
7.8.1.1 The location of the proposed wind farm has been selected to avoid any potential construction and operation impacts by avoiding concentrations of sensitive species (e.g. raptors, breeding terns) and their coastal habitats. The results of the baseline study indicate a low abundance of resident and migratory birds in the Study Area, and negligible collision risk has been predicted for all key species of conservation concern (Sub-section 7.8).
7.8.1.2 To avoid any likely impacts resulted from the proposed development the best practice is to conduct pre-construction, during construction and post-construction monitoring. Requirements for the monitoring programme are recommended below.
7.9
Environmental Monitoring
& Audit
7.9.1.1 It is recommended to conduct monitoring of changes in bird behaviour and collision during construction and operation of the proposed wind farm. The monitoring programme will require boat-surveys at intervals ranging from weekly to monthly during the second year of construction, and during operation for a period of 1 year. The monitoring survey shall be conducted more frequently during bird migratory periods (the spring migratory and the autumn migratory periods) as most of the birds recorded in the Study Area belong to migratory bird species.
7.9.1.2 The gathered field data shall be compared with the baseline data in terms of species occurrence, site utilization (distribution within or in close proximity to the wind farm area), and bird abundance and any bird behavioural information to determine any changes in bird response (e.g. whether there is a significant decrease in bird abundance, or change of site utilization preference for breeding / feeding grounds) to construction activities and wind farm operation. Focused species surveys in term of bird tracking should be performed for breeding birds (i.e. terns and WBSE) if breeding colonies are found closed to the Wind Farm Area during construction and post-construction monitoring period.
7.10
Conclusions &
Recommendations
7.10.1.1
An avifauna impact assessment
has been conducted to address all the scoping opinions informed by the Clause
7.10.1.2 Results of the desktop study indicate no designated areas for conservation of avifauna within the desktop Study Area. General seabird populations within the area including passage migrants, visitor breeders and the resident seabird have been identified and reviewed. Ecological profiles of key species have been established based on available information on distribution, abundance, breeding and foraging behaviour.
7.10.1.3 A total of 57 bird species were identified in the Study Area by boat surveys between May 2006 and December 2007, among which several species or species groups are considered of relatively higher sensitivity due to their conservation significance, distribution and / or abundance within the Study Area (Sub-section 7.6). These species include White-bellied Sea Eagle, the breeding terns, Red-necked Phalarope, Black-tailed Gull and Cattle Egret, Aleutian Tern and White-winged Black Tern.
7.10.1.4 The impact assessment suggests that potential impacts on all birds resulting from construction and operation of the proposed wind farm will not be significant. The SNH model has been used and predicts negligible collision risk for all the most sensitive species in the Study Area based on their distribution and abundance information obtained from boat based field surveys. The significance of construction and operation impacts on avifauna is anticipated to be very low.
7.10.1.5 Overall, the proposed wind farm is considered to have no adverse impacts on avifauna. However, it is regarded as best practice to conduct monitoring for bird abundance and bird collision during construction and operation of the wind farm as recommended in Sub-section 7.10.
Band, W.; Madders, M.; Whitfield, D.P. (2007). Developing field and analytical methods to assess avian collision risk at wind farms, in: de Lucas, M. et al (Ed.) (2007). Birds and wind farms: risk assessment and mitigation. pp. 259-275.
Camphuysen, C.J., Fox, A.D.
Leopold, M.F. & Petersen, I.K., (2004). Towards
Standardised Seabirds at Sea Census Techniques in Connection with Environmental
Impact Assessments for Offshore Wind Farms in the
Carey, G.J., Chalmers, M.L., Diskin, D.A.,
Kennerley, P.R., Leader, P. J., Leven, M.R., Lewthwaite, R.W., Melville, D.S.,
Turnbull, M., Young, L. (2001). The Avifauna of
Cheng, T.H., (1987). A Synopsis of the Avifauna of
Department for Environment,
Food and Rural Affairs, (2005). Nature Conservation
Guidance on Offshore Wind farm Development. A Guidance Note on the Implications
of the EC Wild Birds and Habitats Directives for Developers Undertaking
Offshore Wind farm Developments.
Desholm, D. (2003) Thermal Animal Detection System (TADS). Development of a Method for
Es
Drewitt, A.L. and Langston, R.H.W., (2006). Assessing the Impacts of Wind Farms on Birds. Ibis, 148: 29 – 42.
Eagle Conservation
English Nature (2001). Windfarm
development and nature conservation. English
Nature, RSPB, WWF-UK and BWEA. March 2001.
Fellowes, J.R., Lau, M.W.N., Dudgeon, D., Reels, G.T., Ades,
G.W.J.,
Ferguson-Lees,
J. and Christie, D.a., (2005). Raptors of the World.
Griffiths, R
and Tsim, S. (2004) Post Release Monitoring of Rehabilitated White-bellied Sea Eagles
in
IUCN, (2001). The IUCN Redlist of Threatened Species: 2001
Categories and Criteria (Version 3.1).
http://www.iucnredlist.org/info/categories_criteria2001
Langston, R.H.W. and Pullan, J.D., (2006). Effects of Wind Farms on Birds. Nature and Environment, No. 139, 89pp.
Kahlert, J., Petersen, I.K.,
Desholm, M. and Clausager,
Madders, M. and Whitfield, D.P., (2006). Upland Raptors and the Assessment of Wind Farm Impacts. Ibis, 148: 43 – 56.
NERI, (2000). Effects on Birds of an Offshore
Pennycuick, C.J., (1997). Actual and ‘Optimum’ Flight Speeds: Field Data Reassessed. The Journal of Experimental Biology, 200: 2355 – 2361.
Percival, S.M., (2001). Assessment of the Effects of Offshore Wind Farms on Birds. Ecology Consulting.
Percival, S.M., (2003). Birds and Wind Farms in
Percival, S.M., Band, B. and Leeming, T., (1999). Assessing the Ornithological Effects of Wind Farms: Developing a Standard Methodology. Proceedings of the 21st British Wind Energy Association Conference, 161 – 166.
Peterson, I.K., Christensen,
T.K., Kahlert, J., Desholm, M. & Fox, A.D. (2006)
Final Results of Bird Studies at the Offshore Wind Farms at Nysted and Horns
Rev, Denmark. National Environmental Research Institute,
RPS, (2006). West of Duddon Sands Offshore Wind farm: Ornithological Impact Assessment. RPS Ecology, 92pp.
Scottish Natural Heritage, (2005), Survey Methods for Use in Assessing the Impacts of Onshore Wind farms on Bird Communities. SNH Guidance. SNH, Battleby.
Seascape Energy Ltd., (2002). Burbo Offshore Wind Farm – Ornithology: Final Report. Seascape Energy Ltd., 47pp.
The
Tsim, S.T., Lee, W.H., Cheung,
C.S., Chow, K.L., Ma, Y.N. & Liu, K.Y., (2003). The
Population and Breeding Ecology of White-bellied Sea Eagles in
Viney, C., Phillipps, K. and
Lam, C.Y. (2005) The Birds of Hong Kong and
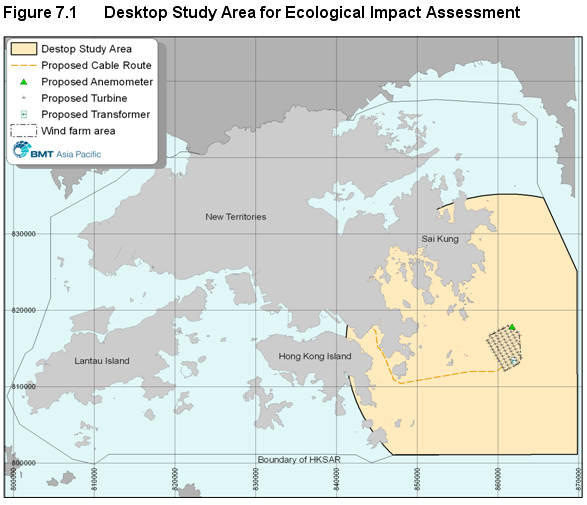
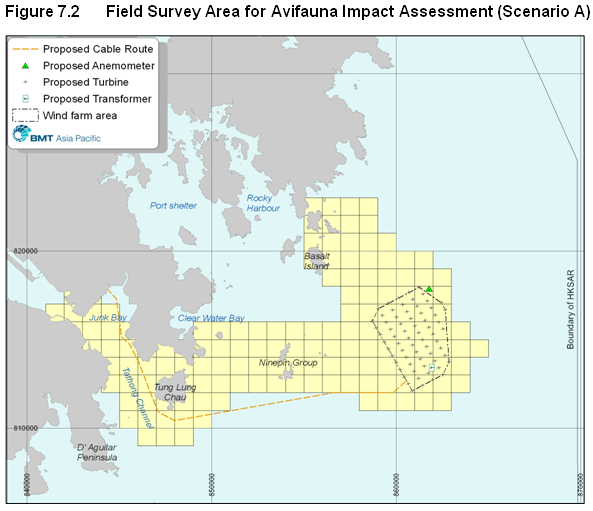
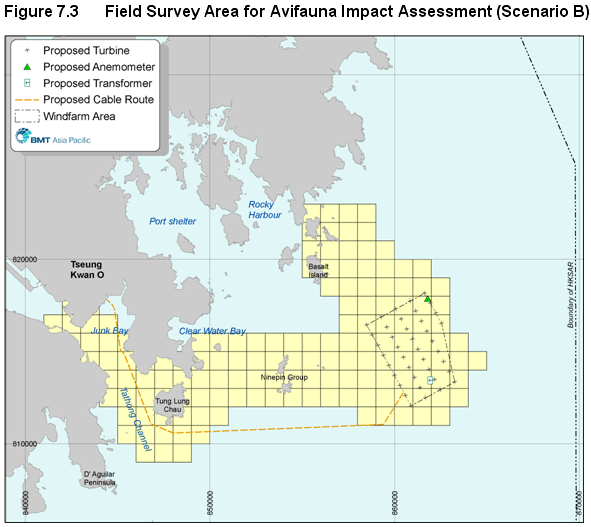
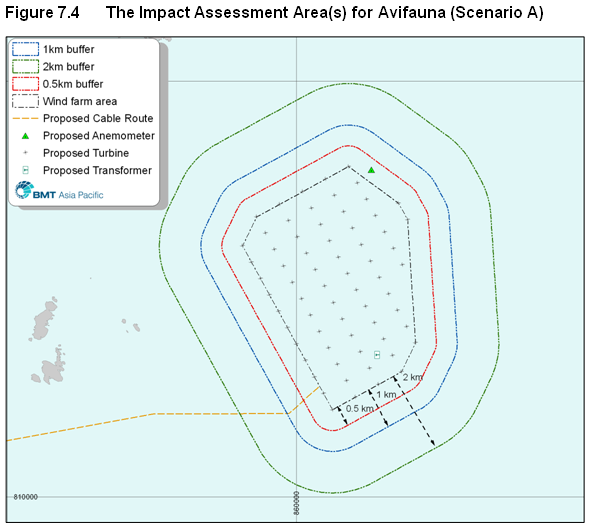
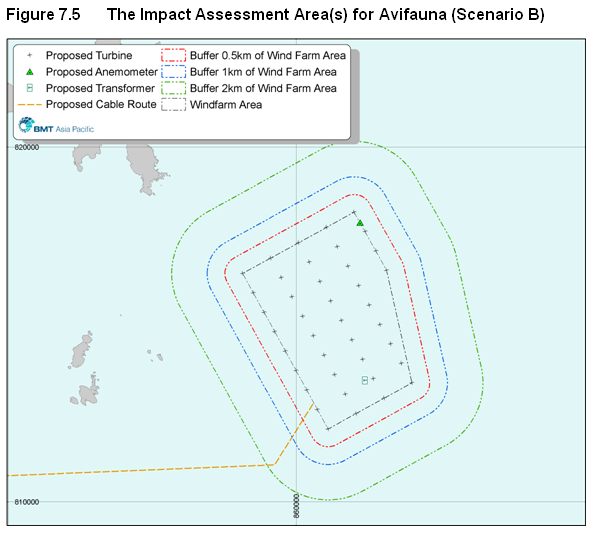
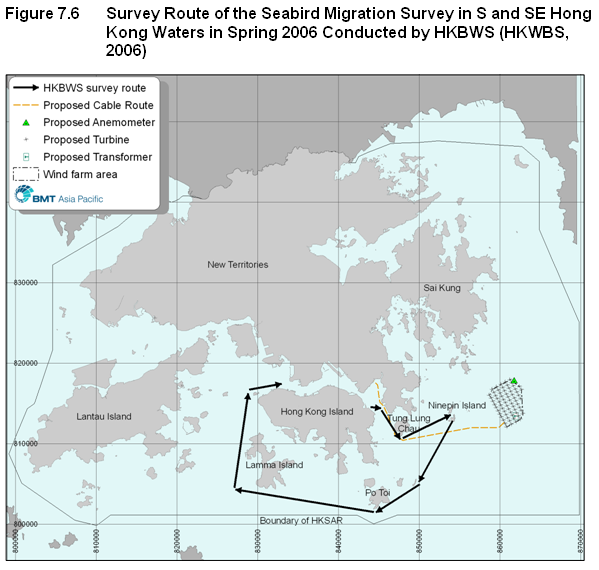
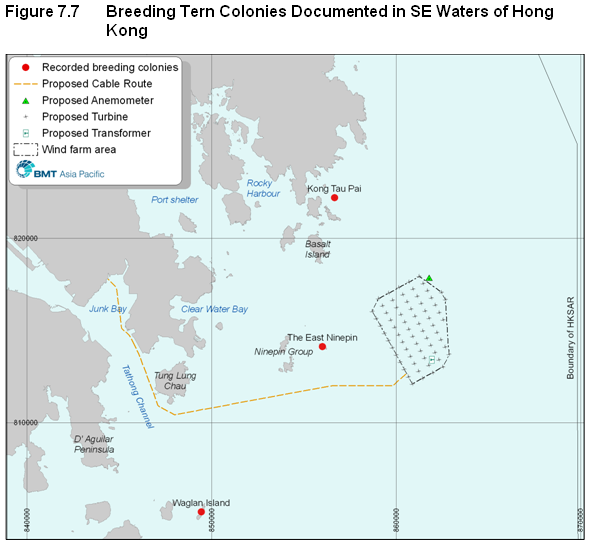
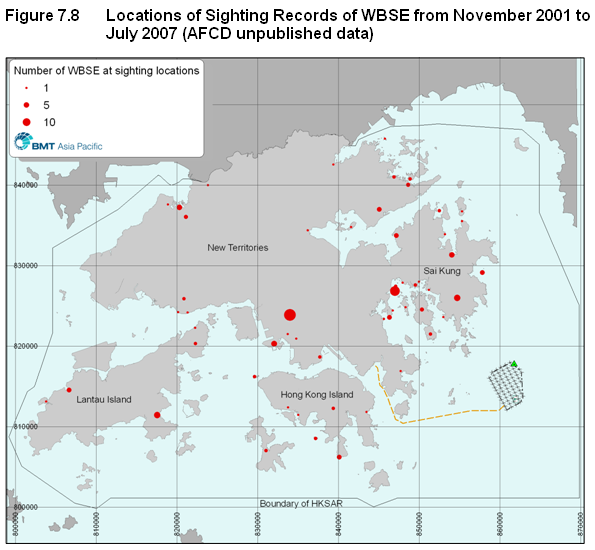
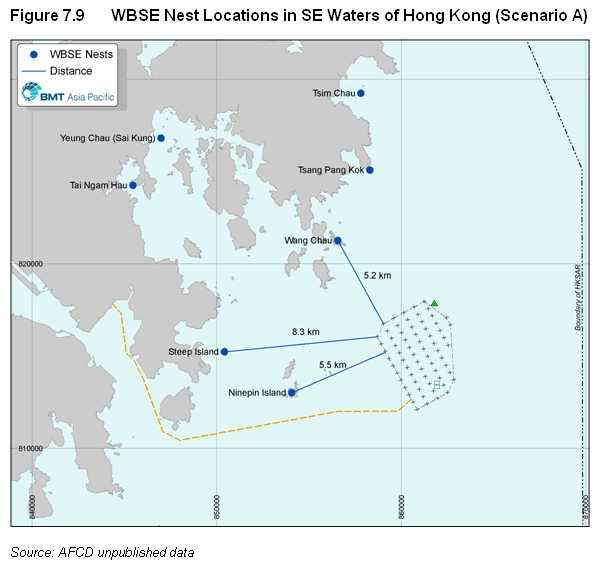
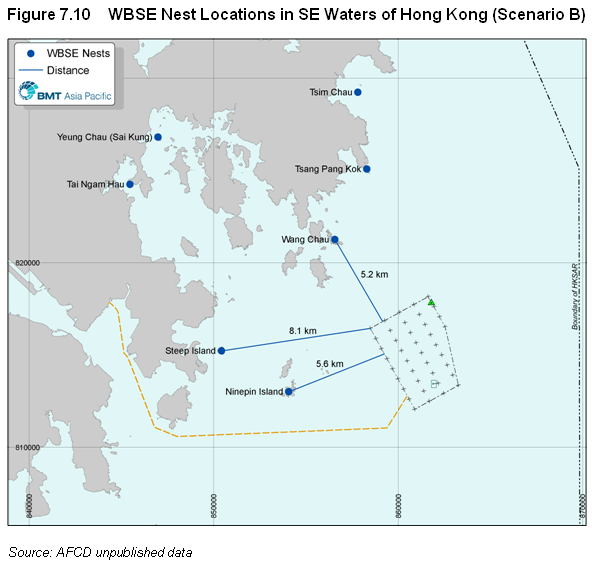
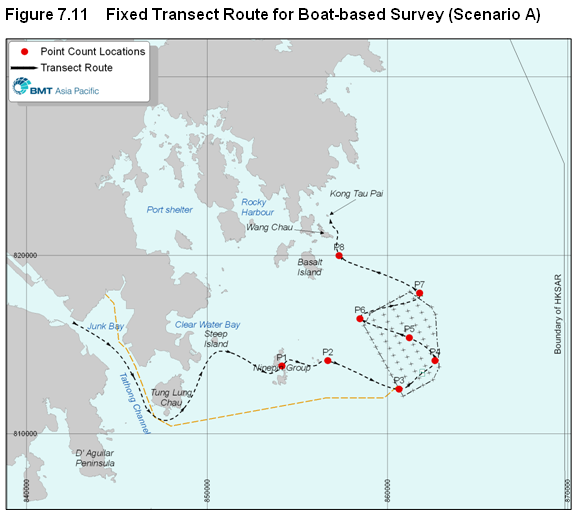
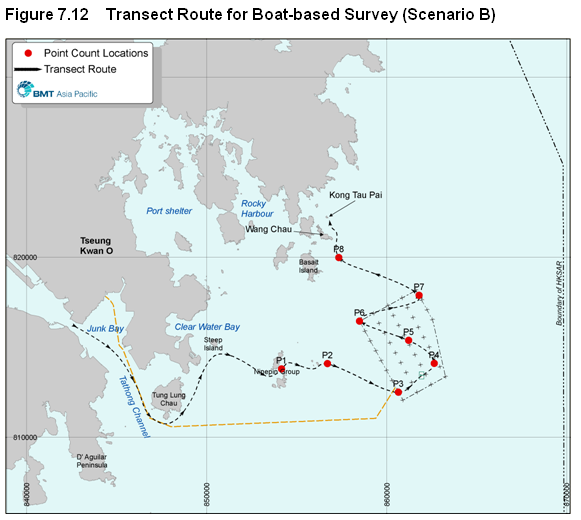
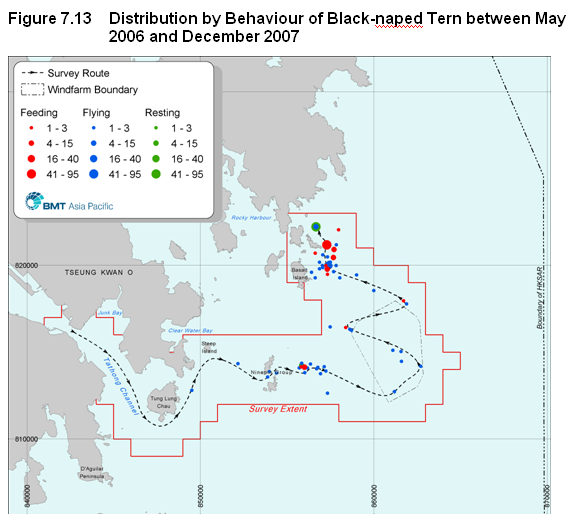
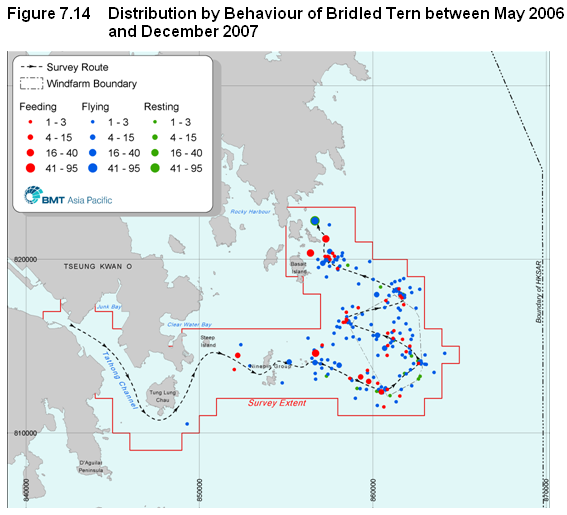
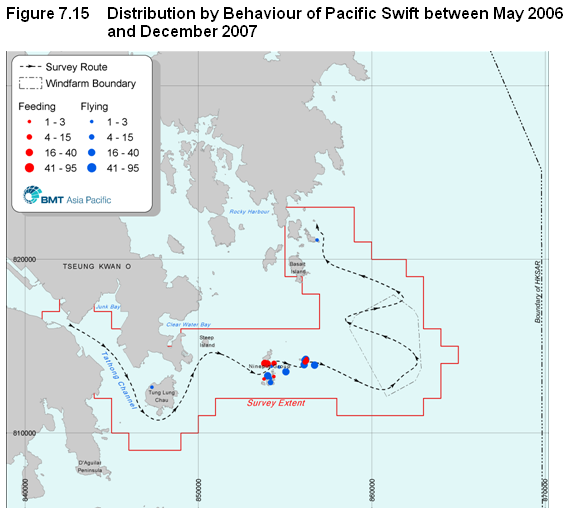
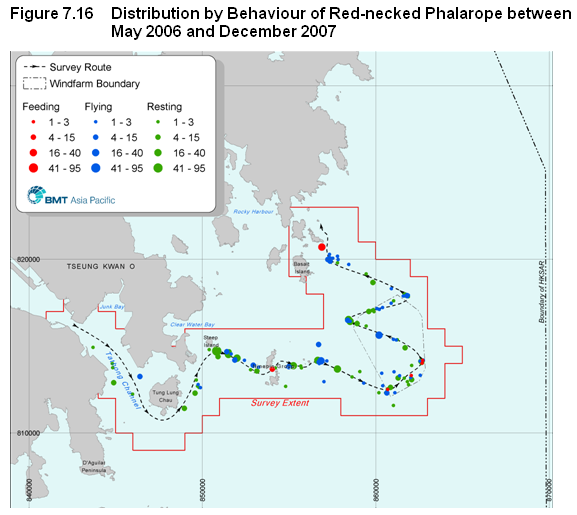
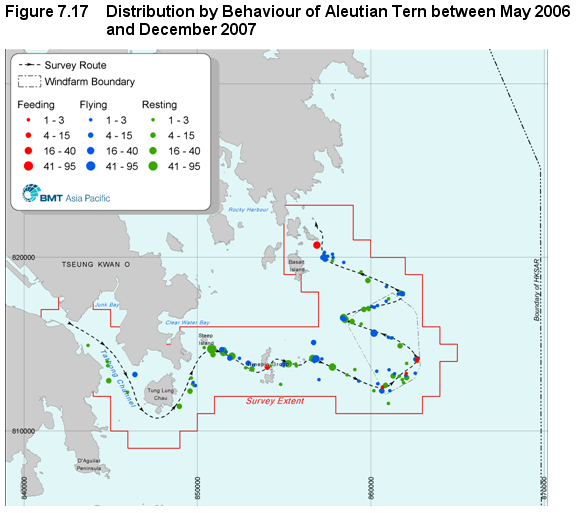
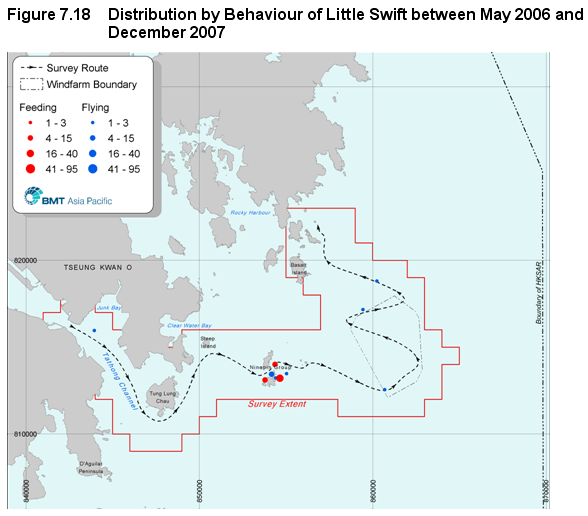
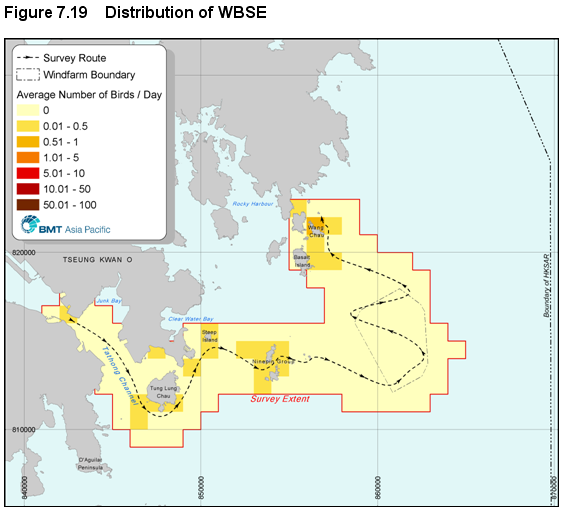
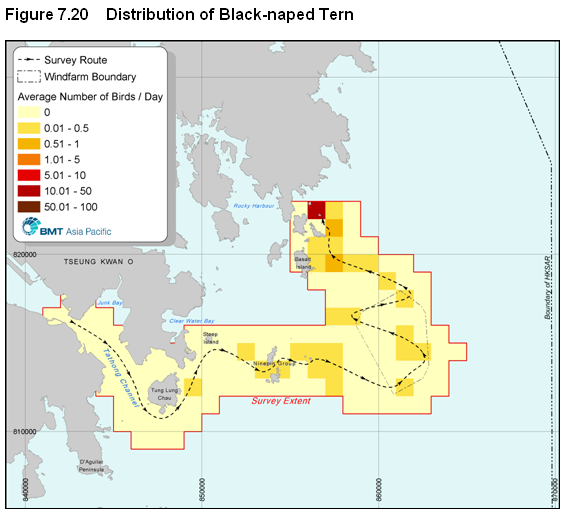
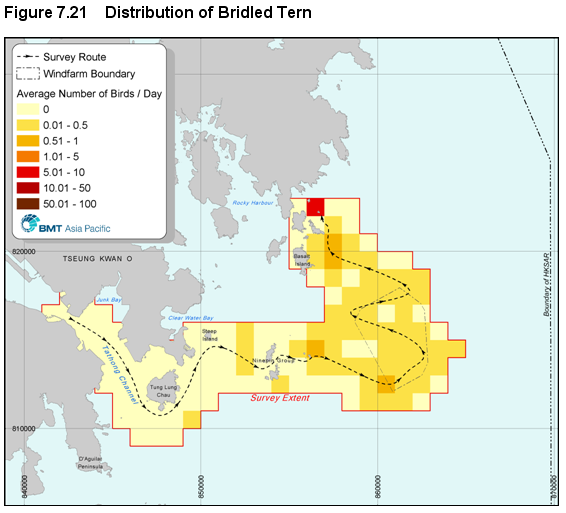
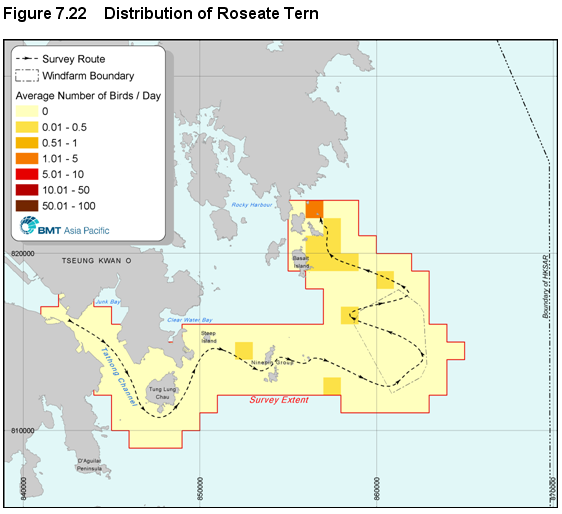
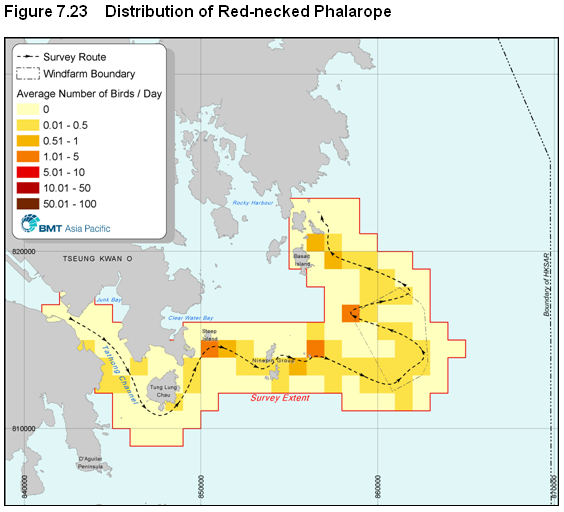
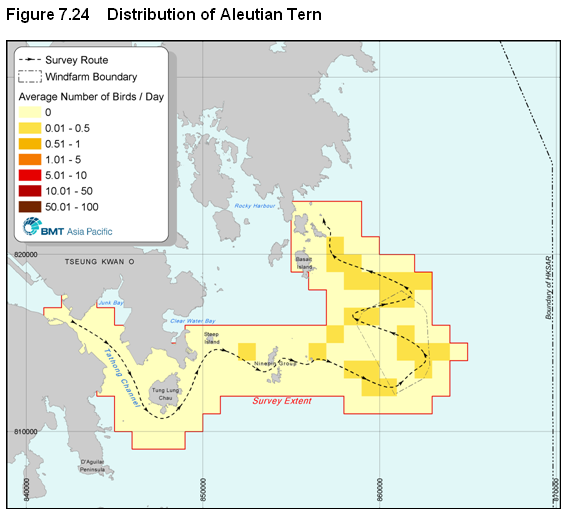
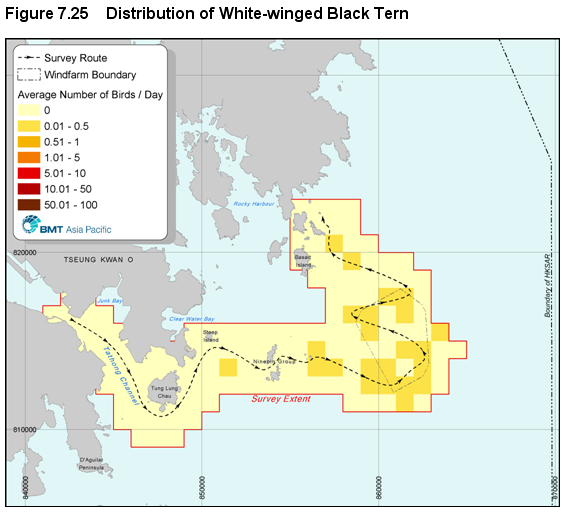
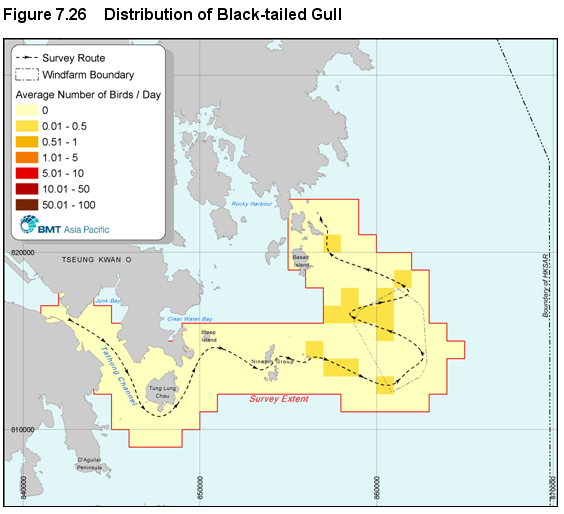
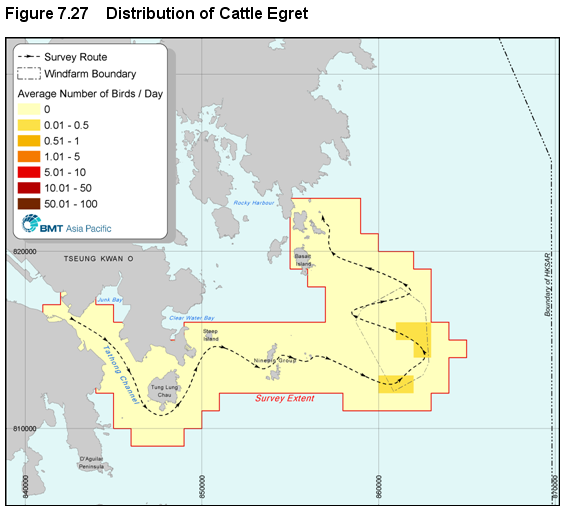