5b.
Water Quality Impact (artificial
island near SKC)
5b.1.1.1 This Section presents an assessment of the potential water quality impacts associated with construction and operation of the IWMF at the artificial island near SKC. Recommendations for mitigation measures have been provided, where necessary, to minimize the identified water quality impacts to an acceptable level.
5b.2 Environmental Legislation, Standards and Guidelines
5b.2.1 Environmental Impact Assessment Ordinance (EIAO)
5b.2.1.1 The Technical Memorandum on Environmental Impact Assessment Process (EIAO-TM) is issued by the EPD under Section 16 of the EIAO. It specifies the assessment method and criteria that need to be followed in the EIA. Reference sections in the EIAO-TM provide the details of the assessment criteria and guidelines that are relevant to the water quality impact assessment, including:
· Annex 6 Criteria for Evaluating Water Pollution
· Annex 14 Guidelines for Assessment of Water Pollution
5b.2.2 Water Pollution Control Ordinance (WPCO)
5b.2.2.1
The Water Pollution Control
Ordinance (Cap. 358) is the major legislation relating to the protection and
control of water quality in
Table 5b.1
Summary of Water Quality
Objectives for
|
Parameters |
Objectives |
Sub-Zone |
|
Offensive
odour, tints |
Not to be
present |
Whole zone |
|
Visible
foam, oil scum, litter |
Not to be
present |
Whole zone |
|
Dissolved Oxygen
(DO) within |
Not less
than 2.0 mg/l for 90% of samples |
Marine
waters |
|
Depth-averaged DO |
Not less than 4.0 mg/l for 90 % of samples |
Marine waters excepting fish culture subzones |
|
Not less than 5.0 mg/l for 90% of samples |
Fish culture subzones |
|
|
Not less than 4.0 mg/l |
Inland waters |
|
|
pH |
To be in the range of 6.5 -
8.5, change due to human activity not to exceed 0.2 |
Marine waters excepting bathing
beach subzones; Mui Wo (A), Mui Wo (B), Mui Wo (C), Mui Wo (E) and Mui Wo (F)
subzones |
|
To be in the range of 6.0 – 9.0 |
Mui Wo (D) sub-zone and other inland waters. |
|
|
To be in the range of 6.0 –9.0 for 95% of samples, change due to human
activity not to exceed 0.5 |
Bathing beach subzones |
|
|
Salinity |
Change due to human activity not to exceed 10% of ambient |
Whole zone |
|
Temperature |
Change due to human activity not to exceed |
Whole zone |
|
Suspended Solids (SS) |
Not to raise the ambient level by 30% caused by human activity |
Marine waters |
|
Change due to waste discharges not to exceed 20 mg/l of annual median |
Mui Wo (A), Mui Wo (B), Mui Wo (C), Mui Wo (E) and Mui Wo (F) subzones |
|
|
Change due to waste discharges not to exceed 25 mg/l of annual median |
Mui Wo (D) subzone and other inland waters |
|
|
Unionized Ammonia (UIA) |
Annual mean not to exceed 0.021 mg(N)/l as unionized form |
Whole zone |
|
Nutrients |
Shall not cause excessive algal growth |
Marine waters |
|
Total inorganic nitrogen (TIN) |
Annual mean depth-averaged inorganic nitrogen not to exceed 0.1
mg(N)/l |
Marine waters |
|
E. coli |
Not exceed 610 per 100 ml, calculated as the geometric mean of all
samples collected in one calendar year |
Secondary contact recreation subzones and fish culture subzones |
|
Not exceed 180 per 100 ml, calculated as the geometric mean of all
samples collected from March to October inclusive in 1 calendar year. Samples
should be taken at least 3 times in 1 calendar month at intervals of between
3 and 14 days. |
Bathing beach subzones |
|
|
5-Day Biochemical Oxygen Demand (BOD5) |
Change due to waste discharges not to exceed 5 mg/l |
Inland waters |
|
Chemical Oxygen Demand (COD) |
Change due to waste discharges not to exceed 30 mg/l |
Inland waters |
|
Dangerous Substances |
Should not attain such levels as to produce significant toxic effects
in humans, fish or any other aquatic organisms |
Whole zone |
|
Waste discharges should not cause a risk to any beneficial use of the
aquatic environment |
Whole zone |
Source: Statement of Water Quality Objectives (Southern Water
Control Zone).
5b.2.3 Sediment Quality Assessment Criteria
5b.2.3.1 Environment, Transport and Works Bureau (ETWB) Technical Circular Works (TCW) No. 34/2002 “Management of Dredged/Excavated Sediment” sets out the procedure for seeking approval to dredge / excavate sediment and the management framework for marine disposal of dredged / excavated sediment. This Technical Circular outlines the requirements to be followed in assessing and classifying the sediment. Sediments are categorized with reference to the Lower Chemical Exceedance Level (LCEL) and Upper Chemical Exceedance Level (UCEL) as follows:
· Category L - Sediment with all contaminant levels not exceeding the LCEL. The material must be dredged, transported and disposed of in a manner that minimizes the loss of contaminants either into solution or by suspension.
· Category M - Sediment with any one or more contaminant levels exceeding the LCEL and none exceeding the UCEL. The material must be dredged and transported with care, and must be effectively isolated from the environment upon final disposal unless appropriate biological tests demonstrate that the material will not adversely affect the marine environment.
· Category H - Sediment with any one or more contaminant levels exceeding the UCEL. The material must be dredged and transported with great care, and must be effectively isolated from the environment upon final disposal.
5b.2.3.2 The sediment quality criteria for the classification of sediment are presented in Table 5b.2.
Table 5b.2 Sediment Quality Criteria for the Classification of Sediment
|
CONTAMINANTS |
LCEL |
UCEL |
|
Heavy
Metal (mg/kg dry weight) |
||
|
Cadmium (Cd) |
1.5 |
4 |
|
Chromium (Cr) |
80 |
160 |
|
Copper (Cu) |
65 |
110 |
|
Mercury (Hg) |
0.5 |
1 |
|
Nickel (Ni) |
40 |
40 |
|
Lead (Pb) |
75 |
110 |
|
Silver (Ag) |
1 |
2 |
|
Zinc (Zn) |
200 |
270 |
|
Metalloid
(mg/kg dry weight) |
||
|
Arsenic |
12 |
42 |
|
Organic-PAHs
(mg/kg dry weight) |
||
|
PAHs (Low Molecular Weight) |
550 |
3,160 |
|
PAHs (High Molecular Weight) |
1,700 |
9,600 |
|
Organic-non-PAHs
(mg/kg dry weight) |
|
|
|
Total PCBs |
23 |
180 |
Source: Appendix A of ETWB TCW No. 34/2002 Management of Dredged /
Excavated Sediment
Note: LCEL – Lower Chemical Exceedance Level
UCEL – Upper Chemical Exceedance Level
5b.3 Description of the Environment
5b.3.1 Existing Baseline Marine Water Quality
5b.3.1.1
Marine water quality monitoring
data routinely collected by EPD were used to establish the baseline condition. The EPD monitoring data collected in 2008 were
summarised in Table
5b.3 for four selected stations close to the Project
site in
Table
5b.3
Baseline Marine Water Quality
Condition for
|
Parameters |
Lantau Island (South) |
|
WPCO WQO (in marine waters) |
|||
|
SM12 |
SM13 |
SM17 |
SM6 |
|||
|
Temperature (℃) |
23.0 (13.7 – 28.9) |
23.0 (13.9 – 29.0) |
22.8 (14.1 – 27.6) |
23.0 (14.1 – 27.1) |
Not more than |
|
|
Salinity (psu) |
29.5 (14.9 – 32.9) |
29.4 (13.9 – 32.9) |
31.2 (25.5 – 33.8) |
30.8 (24.3 – 33.1) |
Not to cause more than 10% change |
|
|
Dissolved Oxygen (DO) (mg/L) |
Depth Average |
6.8 (4.5 –9.8) |
6.8 (4.7 – 9.8) |
6.4 (3.5 – 10.0) |
6.5 (4.7 – 9.7) |
Not less than 4 mg/L for 90% of the samples |
|
Bottom |
6.6 (3.0 – 9.7) |
6.7 (3.3 – 9.6) |
6.0 (2.1 – 10.0) |
5.5 (1.1 – 9.5) |
Not less than 2 mg/L for 90% of the samples |
|
|
Dissolved Oxygen (DO) (% Saturation) |
Depth Average |
93 (63 – 121) |
93 (66 – 122) |
88 (549 – 123) |
90 (66 – 118) |
Not Available |
|
Bottom |
91 (43 – 119) |
92 (48 – 118) |
82 (30 – 122) |
76 (16 – 116) |
Not Available |
|
|
pH |
8.1 (7.7 – 8.3) |
8.2 (7.7 – 8.4) |
8.1 (7.7 – 8.3) |
8.2 (7.7 – 8.5) |
6.5 - 8.5 (±0.2 from natural range) |
|
|
Secchi Disc Depth (m) |
1.8 (1.0 – 3.2) |
1.9 (1.0 – 2.4) |
2.1 (1.2 – 2.8) |
2.0 (0.9 – 3.3) |
Not Available |
|
|
Turbidity (NTU) |
13.5 (8.8 – 21.9) |
11.7 (7.9 – 19.5) |
11.1 (5.8 – 29.8) |
9.4 (4.3 – 19.0) |
Not Available |
|
|
Suspended Solids (SS) (mg/L) |
11.6 (2.8 – 21.0) |
8.6 (3.0 – 16.7) |
5.6 (2.7 – 12.3) |
5.8 (2.1 – 9.9) |
Not more than 30% increase |
|
|
5-day Biochemical Oxygen Demand (BOD5)
(mg/L) |
0.7 (0.2 – 1.8) |
0.7 (0.2 – 1.5) |
0.6 (0.1 – 1.5) |
0.7 (0.1 – 1.4) |
Not Available |
|
|
Ammonia Nitrogen (NH3-N) (mg/L) |
0.07 (0.02 – 0.21) |
0.06 (0.01 – 0.21) |
0.03 (0.01 – 0.10) |
0.04 (0.01 – 0.10) |
Not Available |
|
|
Unionised Ammonia (UIA) (mg/L) |
0.004 (<0.001 – 0.018) |
0.004 (<0.001 – 0.016) |
0.002 (<0.001 – 0.005) |
0.003 (<0.001 – 0.007) |
Not more than 0.021 mg/L for annual mean |
|
|
Nitrite Nitrogen (NO2-N) (mg/L) |
0.041 (0.006 – 0.160) |
0.038 (0.005 – 0.150) |
0.022 (0.002 – 0.046) |
0.038 (0.007 – 0.173) |
Not Available |
|
|
Nitrate Nitrogen (NO3-N) (mg/L) |
0.194 (0.019 – 0.940) |
0.193 (0.019 – 0.977) |
0.126 (0.009 – 0.537) |
0.159 (0.010 – 0.628) |
Not Available |
|
|
Total Inorganic Nitrogen (TIN) (mg/L) |
0.31 (0.07 – 1.31) |
0.29 (0.06 – 1.33) |
0.18 (0.04 – 0.65) |
0.24 (0.04 – 0.87) |
Not more than 0.1 mg/L for
annual mean |
|
|
Total Kjeldahl Nitrogen TKN) (mg/L) |
0.27 (0.15 – 0.46) |
0.26 (0.14 – 0.42) |
0.20 (0.15 – 0.27) |
0.22 (0.14 – 0.27) |
Not Available |
|
|
Total Nitrogen (TN) (mg/L) |
0.51 (0.19 – 1.56) |
0.49 (0.17 – 1.53) |
0.35 (0.17 – 0.80) |
0.41 (0.18 – 1.04) |
Not Available |
|
|
Orthophosphate Phosphorus (OrthoP)
(mg/L) |
0.016 (0.004 – 0.028) |
0.014 (0.005 – 0.028) |
0.012 (0.005 – 0.021) |
0.013 (0.008 – 0.025) |
Not Available |
|
|
Total Phosphorus (TP) (mg/L) |
0.03 (0.02 – 0.05) |
0.03 (0.02 – 0.05) |
0.03 (0.02 – 0.03) |
0.03 (0.02 – 0.04) |
Not Available |
|
|
Silica (as SiO2) (mg/L) |
1.3 (0.1 – 4.9) |
1.3 (0.1 – 5.2) |
1.0 (0.2 – 2.9) |
1.1 (0.3 – 3.4) |
Not Available |
|
|
Chlorophyll-a (mg/L) |
3.5 (1.2 – 10.4) |
3.2 (0.9 – 8.3) |
2.3 (0.6 – 7.0) |
4.9 (1.2 – 12.7) |
Not Available |
|
|
E.
coli (cfu/100 mL) |
21 (2 – 200) |
5 (1 – 81) |
2 (1 – 23) |
2 (1 – 150) |
Not Available |
|
|
Faecal Coliforms (cfu/100 mL) |
43 (3 – 480) |
9 (1 – 300) |
3 (1 - 70) |
4 (1 – 330) |
Not Available |
|
Notes: 1. Data source: Marine Water Quality in
2. Unless otherwise specified, data presented are depth-averaged values calculated by taking the means of three depths: Surface, Mid-depth, Bottom.
3. Data presented are annual arithmetic means of the depth-averaged results except for E. coli and faecal coliforms which are annual geometric means.
4. Data in brackets indicate the ranges.
5b.3.1.2
The Southern WCZ covers an area
located to the south of
5b.3.1.3
In terms of WQO compliance, as
the TIN levels at most stations in the WCZ (including the four selected
stations close to the Project site) were relatively high, especially in the
summer, they exceeded the WQO for this parameter. In the 1990s, the WQO compliance rate for TIN
was consistently below 20%. In 2008, the
TIN levels recorded at all the stations in the
5b.3.2 Existing Baseline Marine Sediment Quality
5b.3.2.1
The potential site at SKC and
the proposed submarine cables are located in remote / rural area. The potential for sediment contamination at or
in the vicinity of the Project site is considered low. Sediment quality monitoring data were
routinely collected by EPD in
Table 5b.4 Baseline Marine Sediment Quality Condition
|
Parameters |
Lantau Island South |
West Lamma Channel |
Sediment Quality Criteria |
||
|
SM13 |
SM6 |
SM7 |
LCEL |
UCEL |
|
|
Heavy Metal (mg/kg dry weight) |
|||||
|
Cadmium (Cd) |
<0.1 (<0.1 –
<0.1) |
<0.1 (<0.1 –
<0.1) |
<0.1 (<0.1 –
<0.1) |
1.5 |
4 |
|
Chromium (Cr) |
22 (19 – 25) |
32 (28 – 37) |
36 (29 – 47) |
80 |
160 |
|
Copper (Cu) |
10 (8 -13) |
18 (15 – 21) |
28 (18 - 38) |
65 |
110 |
|
Mercury (Hg) |
0.08 (<0.05 –
0.18) |
0.09 (0.07 – 0.15) |
0.12 (0.08 – 0.20) |
0.5 |
1 |
|
Nickel (Ni) |
14 (12 – 17) |
23 (19 – 25) |
22 (19 - 26) |
40 |
40 |
|
Lead (Pb) |
25 (21 – 31) |
35 (28 – 38) |
38 (31 – 49) |
75 |
110 |
|
Silver (Ag) |
<0.2 (<0.2 –
<0.2) |
0.2 (<0.2 – 0.2) |
0.4 (<0.2 – 0.6) |
1 |
2 |
|
Zinc (Zn) |
63 (52 – 74) |
93 (82 – 100) |
110 (78 – 140) |
200 |
270 |
|
Metalloid (mg/kg dry weight) |
|||||
|
Arsenic |
5.5 (4.4 – 6.1) |
7.0 (5.8 – 7.9) |
7.3 (6.1 – 8.3) |
12 |
42 |
|
Organic PAHs (mg/kg dry weight) |
|||||
|
PAHs (Low Molecular Weight) |
90 (90 – 90) |
91 (90 – 94) |
93 (90 – 110) |
550 |
3160 |
|
PAHs (High Molecular Weight) |
22 (19 – 25) |
67 (34 – 130) |
91 (40 – 160) |
1700 |
9600 |
|
Organic-non-PAHs (mg/kg dry weight) |
|||||
|
Total PCBs |
18 (18 – 18) |
18 (18 – 18) |
18 (18 – 18) |
23 |
180 |
Note: LCEL – Lower Chemical Exceedance Level
UCEL – Upper Chemical Exceedance Level
5b.3.2.2 Based on the monitoring data (refer to Table 5b.4), the sediments collected at SM13 (to the northwest of SKC), SM6 and SM7 (in the West Lamma Channel) were uncontaminated materials.
5b.4 Water Sensitive Receivers
5b.4.1.1 Locations of the water sensitive receivers (WSRs) within the Study Area are shown in Figure 5b.1. Water sensitive receivers (WSRs) identified at or in the vicinity of the artificial island near SKC and the submarine cable alignment include:
· Horseshoe Crab;
· Gazetted Beaches;
· Fish Culture Zones; and
· Coral Communities.
5b.4.1.2 According to the recent dive surveys, the seabed along the southwest shoreline of Shek Kwu Chau was found to be mainly composed of bedrocks, boulders, muddy and sandy bottom. Limited marine life was seen except only some coral communities found along the southwest coastline of Shek Kwu Chau. Detailed description and assessment of the impact on marine ecology including coral communities are reported separately under the ecology impact assessment in Section 7b.
5b.4.1.3 No WSD flushing water intake is identified in the vicinity of the Project site.
5b.5.1.1
The
Assessment Area as specified in the EIA Study Brief covers an area within
5b.5.1.2
The
water sensitive receivers that may be affected by various construction
activities for the IWMF were identified.
Potential sources of water quality impact that may arise during the
construction and operation phase of the Project were described. All the identified sources of potential water
quality impact were then evaluated and their impact significance determined. The need for mitigation measures to reduce
any identified adverse impacts on water quality to acceptable levels was
determined.
5b.6 Identification of Potential Impacts
5b.6.1.1 The major construction works of the Project would be seabed dredging for reclamation and installation of submarine cables, site formation, construction of facilities and construction of the access road. Potential water quality impact during construction phase of the IWMF would be occurred from:
· Drainage and construction site runoff during site formation and foundation piling;
· General construction activities;
· Accidental spillage and accumulation of solid wastes;
· Sewage effluent produced by on-site workforce; and
· Disturbance and re-suspension of seabed sediments for marine works associated with reclamation and installation of submarine cables.
Drainage and Construction Site Runoff
5b.6.1.2 Runoff from the construction works area may contain increased loads of sediments, other suspended solids and contaminants. Potential sources of pollution from site drainage include:
· Runoff and erosion from exposed soil surfaces, earth working areas and stockpiles;
· Release of grounting and cement materials with rain wash;
· Wash water from dust suppression sprays; and
· Fuel and lubricants from maintenance of construction vehicles and mechanical equipment.
5b.6.1.3 Sediment laden runoff during site formation works, if uncontrolled, may carry pollutants (adsorbed onto the particle surfaces) into the nearby coastal waters.
General Construction Activities
5b.6.1.4
Land-based construction works
may have the potential to cause water pollution. Various types of construction activities
would generate wastewater. These include
general cleaning and polishing, dust suppression and utility installation. These types of wastewater would contain high
concentration of suspended solids.
Wastewater would also be generated from the accumulation of solid waste
such as debris, rubbish, plastic package and construction materials. If uncontrolled, these would lead to
deterioration in water quality.
Accidental Spillage
5b.6.1.5 Variety of chemicals would be used for carrying out construction activities. These chemicals may include petroleum products, spent lubrication oil, grease, mineral oil, solvent and other chemicals. Accidental spillages of chemicals in the works area may contaminate the surface soils. The contaminated soil particles may be washed away by construction site runoff causing water pollution.
Sewage Effluent
5b.6.1.6 Domestic sewage would be generated from the workforce during the construction phase. However, this sewage can be adequately treated by interim sewage treatment facilities, such as portable chemical toilets, which can be installed within the construction site.
Disturbance and Re-suspension of Seabed Sediments
5b.6.1.7 The proposed marine construction works will involve reclamation, construction of breakwaters and anti-scouring protection layer at the southwest coastline of SKC as shown in Figure 5b.2.
5b.6.1.8
The proposed construction
method will adopt an approach where seawalls and breakwaters will first be
formed to fully enclose the reclamation. Containment of fill within the reclamation
area by seawalls and breakwater is proposed, with the seawalls and breakwaters
constructed first (above high water mark) with filling carried out behind the
completed seawalls and breakwater. Under this context, seawall and breakwater
represents the same structure in the construction while differ only in their
functionality. Breakwaters are built to
protect the shore from erosion by wind and wave, thus are built so that they
face outward to the rough sea. In contrast, seawall serves as an interface
between the calm sea and the reclaimed land where coastline protection is not
necessary. Seawalls are built facing sheltered sea where wave action is
expected to be weak. In this sense, the coastline at the northeastern and
northwestern side of the main reclaimed area should be classified as seawalls,
while the rest of the coastline in the site acts as breakwaters. The opening
that needs to be provided for marine access will be shielded by four layers of silt
curtains to control sediment plume dispersion away from the site. The opening
and closing of the silt curtain system would be controlled by the site staff of
the contractor. Barges that need to pass the silt curtain would have to signify
the control staff and wait until permission is granted. The silt curtains would
be fixed at one end on the end of breakwater at marine access opening, while
the movement of the other end would be controlled by appropriate vessels. The
silt curtain system should be kept closed unless passage of vessels or barges
is required. The silt curtain system should
be closed as soon as the barges passes through the marine access opening in
order to minimize the period of curtain opening. The vessels which control the
opening of the silt curtain system would be anchored at the breakwater when the
marine access opening is closed to ensure the silt curtain system could tightly
shield the marine access opening. Filling should only be carried out behind the
silt curtain when the silt curtain is completely closed. This approach was
adopted by the approved Central Reclamation Phase III (CRIII) project as well
as the approved EIA for WDII and CWB as effective measure to control the
dispersion of filling material from the site. The application of silt curtain
at marine access opening is indicatively shown in Appendix 5.5-3. The silt curtain at marine access opening would be fixed at one
end of the end of the breakwater at the side of the SKC coastline whereas the
movement of the other end at the side of the open sea would be controlled by
appropriate vessel(s). As shown in Table
5b.16, the 90th percentile depth-average
current velocity at the artificial island near SKC would be below
5b.6.1.9
For minimizing the dredging and
filling of the overall reclamation work, the seawall and breakwater at the perimeter of the reclaimed land is proposed to be in form of a
cellular cofferdam which consists of circular cells connected together to form
close working environment. The use of sheetpiling to aid construction has been
adopted in recent approved EIAs including Hong
Kong-Zhuhai-Macao Bridge EIA and the South Island Line (East) EIA. No
significant water quality impact is expected in this EIA except negligible localized
disturbance of bottom sediment. The disturbed sediment would be highly
localized and would be settled shortly after. To confine any potential loss of
fine during the piling work, floating-type silt curtain would be used to
surround the circular cell during the piling works. Floating-type silt curtain
would be applicable at the surrounding of the circular cells even at the
closest location from the coral communities (which is about
5b.6.1.10 To further minimize the environmental impacts, the overall reclamation works will be implemented in phases as shown in Figure 5b.5. In phase one, the cofferdam section enclosing the reclamation area would be first constructed. In addition, the section of breakwater preventing the wave from striking the reclamation area directly from the northwest direction would also be constructed. Appropriate measures, such as application of silt curtain around the circular cell when filling, would be also applied to reduce the potential impacts on water quality. Afterwards, the reclamation can be started within the fully formed breakwater and seawall (Phase 2). Appropriate measures, such as silt curtain shielding the marine access opening, would be applied to reduce the potential impacts on water quality. In Phase 3, the remaining breakwater and berth will be constructed while the enclosed area within the cofferdam is being filled and surcharge loading of the reclaimed area is in progress. The detail work phasing at the northwestern seawall of the reclamation area is indicatively shown in Appendix 5.5-3. MSW treatment facilities and the associated supporting facilities will then start to be constructed after the surcharge loading. As described in Section 2, the construction of cofferdam would involve the piling of circular cell of metal sheet into the seabed. No dredging would be required for the installation of these circular cells. As the dredging and filling is bounded behind the sheet piles and cofferdams, it is not likely that suspended solid will be generated and enters the nearby water body. As discussed above, silt curtain would be applied to control the loss of filling material during the filling of circular cell as well as during reclamation. Thus significant loss of fine to the water column is not expected. Band drains may be required to remove excessive water from the reclaimed area. Any surcharge discharge from the band drains, which contains no extra pollutant except suspended fine, could be discharged into the sea via silt removal facilities. Details of the construction phasing are provided in Section 2.
5b.6.1.11
Whereas the installation of
submarine cables will employ subsea burying machine to form narrow cable trench
at sea bed up to 5 meter deep by water jetting and lay the submarine cable
spontaneously. The trench will be
backfilled at the same time with the sediments settling to the trench. The trench dimensions will be about
5b.6.1.12
To prevent the tidal action
from undermining the breakwaters, anti-scouring dredging would be required
around the breakwaters and seawalls. A
layer of sediment of about
5b.6.2.1
Potential
sources of water quality impacts generated from the operation of the Project
include:
· Wastewater generated from the Waste Treatment Process;
· Sewage generated from floor & vehicle washing;
· Sewage generated from the IWMF staff & visitors;
· Transportation of bottom ash, fly ash and APC residues to WENT Landfill for disposal;
· Discharge of saline water from the proposed desalination plant; and
· Disturbance of seabed due to future maintenance dredging.
5b.6.2.2 Besides, change in coastline configuration as a result of the presence of the proposed breakwaters and reclamation could change of flow regime, water quality and sedimentation pattern in marine water. There will be no impacts to water quality from the operation of the proposed submarine cables.
Wastewater Generated from the Waste Treatment Process
5b.6.2.3 The IWMF Phase I will comprise a 3,000 tpd of moving grate incineration plant and a demonstration scale mechanical treatment plant of about 200 tpd capacity. Desalination plant may also be adopted as a water supply system in the IWMF. Wastewater will be generated from the mechanical treatment plant, the incineration plant and the desalination plant (if adopted) in the IWMF Phase I. No spent cooling water discharge is anticipated from the Project operation.
Mechanical Treatment Plant
5b.6.2.4 In the IWMF, “mechanical treatment + dewatering + post-composting” process is recommended for the mechanical treatment plant. A relatively small amount of wastewater will be generated from the treatment processes.
Incineration Plant
5b.6.2.5 Wastewater will also be generated from various processes throughout the incineration plant including:
5b.6.2.6 Boiler - The practice of continuously removing a small percentage of boiler feed water from the boiler to maintain boiler water chemistry is referred to as boiler blowdown. Although the boiler steam cycle is essentially a closed-loop system, impurities can build up in the boiler which, over time, cause scaling and corrosion of the boiler tubes. These effects eventually lead to boiler tube failure. To reduce such problems, continuous boiler blowdown is employed. The hot blowdown water is passed through a heat exchange to recover heat before becoming a source a plant wastewater. The blowdown water is replaced with contaminant-free feed water make-up.
5b.6.2.7
5b.6.2.8 Boiler Feedwater Treatment System - The purpose of the boiler feedwater treatment system is to provide demineralized water for boiler make-up. Demineralized water is needed in the boiler to prevent scaling and corrosion due to mineral deposits. The treatment system typically involves filtering the feed water to remove suspended solids, and removing metals and minerals in a de-mineralizer. The de-mineralizer contains cation and anion exchangers are periodically regenerated using sulfuric acid and caustic soda respectively. Oxygen is removed from the demineralized water using a deaerator. Processed demineralized water is then stored in tanks and drawn off as needed for boiler feeder water, cooling water and other processes. The operation of the various filters, ion exchangers and deaerators requires periodic back flushing of the system to remove the collected contaminants from the treatment system. This process wastewater is then stored in a neutralization tank where appropriate amounts of acid or caustic are add to adjust the pH.
5b.6.2.10 Miscellaneous Blowdown Sources - Other processes that use process water can be minor sources of process water blowdown, these may include water cooled feed chutes, water cooled bearings, cooling water jacketing etc.
Sewage Generated from Floor & Vehicle Washing
5b.6.2.11
Approximately
Sewage Generated from the IWMF Staff & Visitors
5b.6.2.12
The sewage generated from human
activities in the IWMF would include the sewage from the IWMF staff and
visitors, as well as the sewage generated from the canteen, and community
facilities. It is estimated that approximate
Table 5b.5 Estimated Amount of Sewage Generated from the IWMF Staff & Visitors and the Associated Activities
|
Items |
No. of Employee or Visitor |
Unit Flow Factor (1) (m3/d/person) |
Flow (m3/d) |
|
Staff and Visitors |
|||
|
Staff of incineration plant, MT plant, canteen and community facilities |
200 |
0.08 |
16.00 |
|
Visitors |
450 |
0.06 |
27.00 |
|
Activities |
|||
|
Staff canteen |
25 |
1.50 |
37.50 |
|
Community facilities |
20 |
0.35 |
7.00 |
|
Sub-total |
87.50 |
||
|
10% Contingency |
8.75 |
||
|
Total |
96.25 |
||
Note (1):
The unit flow factors adopted to estimate the sewage flow generated from the
staff and visitors in the IWMF are primarily based on the guidelines laid down
in EPD’s Guidelines for Estimating Sewage Flows for Sewage Infrastructure
Planning Version 1.0 (GESF).
Reuse and Treatment of Wastewater Generated from Waste Treatment Process and Sewage from Floor & Vehicle Washing and the IWMF Staff & Visitors
5b.6.2.13 Table 5b.6 shows the estimated quantity and possible characteristic of wastewater generated from treatment process and sewage from floor & vehicle washing and the IWMF staff & visitors.
Table 5b.6 Estimated Quantity and Possible Characteristics of Wastewater Generated from Treatment Process and Sewage from Floor & Vehicle Washing and the IWMF Staff & Visitors
|
|
Flow (m3/d) |
pH |
BOD (mg/L) |
COD (mg/L) |
SS (mg/L) |
Temp. (℃) |
Chloride (mg/L) |
||
|
Incineration
Plant |
Miscellaneous Blowdown
Sources |
1 |
6-8 |
50 |
30 |
50 |
20 |
|
|
|
Boiler Feedwater Treatment
System (Demineralizer Drain) |
30 |
9-11 |
- |
- |
20 |
20 |
3,000 |
||
|
Pump Leak Water |
10 |
6-8 |
- |
- |
50 |
20 |
50 |
||
|
Boiler and Evaporative |
80 |
10-12 |
- |
- |
50 |
50 |
50 |
||
|
Mechanical
Treatment Plant Drain |
5 |
6.5 - 9 |
6,000 – 8,500 |
20,000 - 25,000 |
9,000 - 10,000 |
- |
- |
||
|
Sewage
from Floor and Vehicle Washing |
Floor Washed Drain |
1 |
7-9 |
50 |
30 |
500 |
20 |
100 |
|
|
Vehicle Washed Drain |
30 |
6-8 |
300 |
200 |
500 |
20 |
100 |
||
|
Sewage
from the IWMF Staff & Visitors |
88 |
6-8 |
250 |
520 |
250 |
20 |
- |
||
5b.6.2.14 Generally, wastewater shown in Table 5b.6 can be categorized into two types including high organic loading wastewater and low/nil organic loading wastewater. High organic loading wastewater, such as sewage from floor & vehicle washing and the IWMF staff & visitors, will be treated by secondary wastewater treatment plant provided on-site to remove the organic pollutants for reuse on-site (see Section 5b.6.2.15 below). The bunker leachate / ash leachate from incineration plant (as described in Section 5b.6.2.9) would be highly polluted and would be conveyed to the incineration plant and co-incinerated with MSW and is therefore not included in Table 5b.6. On the other hand, low/nil organic loading wastewater, mainly coming from plant machinery such as dimineralizer drain, contains only trace amount of or no organic pollutants. It only requires simple treatment such as sedimentation or neutralization or even not requires any treatment before being used for flue gas cooling in quench tower or ash quenching. As the artificial island near SKC would be built on reclaimed land in rural area, it is envisioned that the IWMF Phase I would be designed with a net zero discharge of process and sanitary wastewater.
5b.6.2.15 A wastewater treatment plant would be provided on-site to provide treatment to some wastewater generated from the IWMF (such as sewage from the IWMF staff & visitors) for reuse in the incineration plant and the mechanical treatment plant or for washdown and landscape irrigation in the IWMF site following the effluent qualities shown below. The following recommended effluent qualities for reuse purposes are based on the “Guidelines for Water Reuse” published by the USEPA.
· pH : 6 – 8
· BOD : 10 mg/L
· Turbidity : 2 NTU
· Total Coliform/100 mL : non-detectable
· Cl2 residual : 1 mg/L
5b.6.2.16
Because of the compacted area
in SKC, membrane bioreactor (MBR), which requires small footprint, is proposed
for the IWMF for mainly human sewage treatment. Based on the above effluent standards and
wastewater characteristics and quantity shown in Table 5b.6, the wastewater treatment facilities enclosed by
the reinforced concrete structure under the reception hall of the incineration
plant would occupy an area of about
Desalination Plant
5b.6.2.17
If desalination plant is
adopted as a water supply system in the IWMF, the brine water generated would
be either discharged back to the sea where the seawater is collected for
desalination or reused for ash quenching. The brine water drained from the desalination plant
is concentrated seawater (about 1.7-1.8 time more concentrated than the raw
seawater). The design flow of the
desalination plant, if required will be about
Maintenance Dredging
5b.6.2.18 Maintenance dredging maybe required to provide sufficient clearance between the boat and the seabed for safe marine traffic within the marine embayment. Currently, there is no plan for regular maintenance dredging. The need of maintenance dredging would depend on the exact sedimentation and scouring condition after the completion of the Project. Assessment on the water quality impact has been described in Section 5b.7.
5b.7 Prediction and Evaluation of Environmental Impacts
5b.7.1 Land-based Construction Phase Impact
Drainage and Construction Site Runoff
5b.7.1.1
Runoff from the construction
works area may contain increased loads of sediments, other suspended solids and
contaminants. As a good site practice,
mitigation measures should be implemented to control construction site runoff
and drainage from the works areas, and to prevent runoff and drainage water
with high levels of suspended solids from entering the nearby water
bodies. It is estimated that the volume
of runoff generated on site would be about
General Construction Activities
5b.7.1.2 Land-based construction activities may generate wastewater and cause water pollution. Their impacts are likely to be minimal, provided that good construction practices and proper site management would be observed. Effluent discharge from temporary site facilities should be controlled to prevent direct discharge to the neighbouring water environment. It is anticipated that water quality impacts caused by general construction activities would be insignificant with adequate implementation of recommended mitigation measures as described in Sections 5b.8.1.2 and 5b.8.1.3.
Accidental Spillage
5b.7.1.3 Site drainage should be well maintained and good construction practices should be observed to ensure that oil, fuels and solvents are managed, stored and handled properly and do not enter the nearby water streams. No adverse water quality impacts are expected with proper implementation of the recommended mitigation measures (refer to Sections 5b.8.1.4 to 5b.8.1.7).
Sewage Effluent
5b.7.1.4 Domestic sewage would be generated from the workforce during the construction phase. However, this sewage can be adequately treated by interim sewage treatment facilities, such as portable chemical toilets, which can be installed within the construction site. It is unlikely that sewage generated from the site would have a significant water quality impact, provided that sewage is not discharged directly to the water environment, and chemical toilets are used and properly maintained.
5b.7.2 Construction Phase Impact from Cofferdam Construction
5b.7.2.1
The cofferdam construction
would be adopted for construction of breakwater under this Project. The
cofferdam construction would involve piling as well as material filling. Water
quality impact may arise during the piling works as well as the filling of
circular cells. With reference to the recent EIAs such as Hong Kong-Zhuhai-
Ambient and Tolerance Values
5b.7.3.1 The sediment plumes passing over a sensitive receiver will cause the ambient suspended solids concentrations to be elevated. The level of elevation will determine whether the impact is adverse. The determination of the acceptability of elevations in suspended solids (SS) concentrations is based on the Water Quality Objectives (WQO). The WQO for SS is defined as being an allowable elevation of 30% above the background. It is proposed to represent the ambient SS value by the 90th percentile of SS concentrations measured under the EPD routine marine water quality monitoring programme at the stations (namely SM12 and SM13) nearest to the WSRs that would be potentially affected by the localized dredging / filling works (including the horseshoe crab at northern SKC, over 700 coral communities at southwest SKC, the gazetted beaches at southern Lantau Island and east Cheung Chau as well as the fish culture zone at Cheung Sha Wan on the eastern coastline of Lantau Island) as shown in Figure 5b.1. The relevant EPD data and allowable elevations in suspended sediment concentration are summarized in Table 5b.7. The 90th percentile SS values presented in Table 5b.7 were calculated based on the EPD monitoring data collected in the period from 2006 to 2007.
Table 5b.7 Ambient and Tolerance Values for Suspended Solids Concentrations in the Vicinity of Sensitive Receivers
|
Sensitive
Receiver (Relevant EPD Monitoring Station) |
Dry Season |
Wet Season |
||
|
90th Percentile |
30% Tolerance |
90th Percentile |
30% Tolerance |
|
|
Horseshoe Crab at northern SKC, Coral Communities
at Southwest Coastline of SKC, Gazetted beaches at southern Lantau Island
(SM13) |
10.7 mg/L |
3.2 mg/L |
8.4 mg/L |
2.5 mg/L |
|
Gazetted beaches at east Cheung Chau and Cheung
Sha Wan fish culture zone (SM12) |
12.2 mg/L |
3.7 mg/L |
13.0 mg/L |
3.9 mg/L |
5b.7.3.2
The allowable elevation in SS
concentration as defined by the WQO for a particular site corresponds to the
30% tolerance level. The calculated
maximum SS concentrations from the filling and dredging have been compared with
the 30% tolerance values in the above table to determine the acceptability of
the impacts. Review of the 2008 EPD
routine monitoring data indicated that the 90th percentile SS values recorded
at SM12 and SM
Discussion of the Potential Sediment Plume Impacts
5b.7.3.3
The potential site at SKC is
located in the open water in the southern waters of
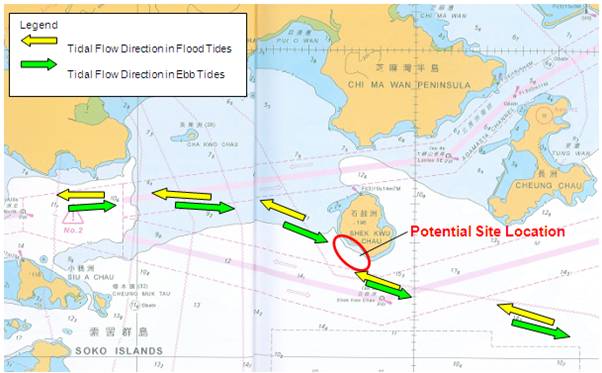
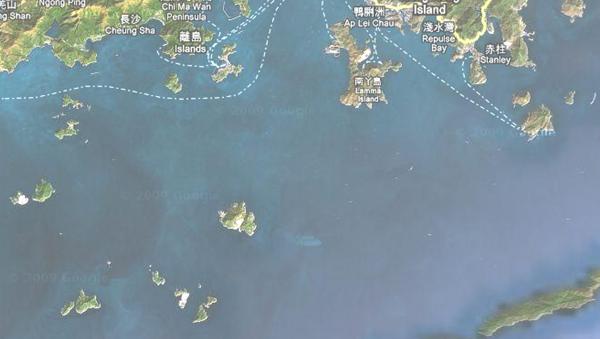
Plate 5b.1 Marine Chart for the Study Area
5b.7.3.4 The WSRs closest to the proposed filling and dredging works at SKC include the horseshoe crab at northern SKC, coral communities at southwestern SKC, the gazetted beaches at southern Lantau Island and east Cheung Chau as well as the fish culture zone at Cheung Sha Wan on the eastern coastline of Lantau Island (as shown in Figure 5b.1). Besides the coral communities identified at the southwest coastline of SKC, all the other WSRs are considered to have a low potential to be significantly influenced by the dredging work as these WSRs are not located along the key transportation paths of any sediment plume formed during the dredging work at SKC. The typical flow patterns around the Study Area, which is obtained from the Delft3D Regional Update model developed under Agreement No. CE42/97, are shown in Plate 5b.2 and Plate 5b.3 below. The arrows shown in Plate 5b.2 and Plate 5b.3 represent the water flow directions during typical ebb and flood tide respectively.
HK

Plate 5b.2
Tidal Current Pattern during
Typical Ebb Tide
HK 
Plate 5b.3
Tidal Current Pattern during
Typical Flood Tide
5b.7.3.5
As shown in Plate
5b.2 and Plate
5b.3, the fish culture zone at Cheung Sha Wan and the
gazetted beaches at east Cheung Chau are largely influenced by the tidal flow
discharged from the Kap Shui Mun near Ma Wan during ebb tides as well as by the
offshore waters from the open
Near Field Sediment Dispersion Modelling
5b.7.3.6
The method of calculation of
the near field concentrations of suspended sediment plumes is the same as that
used in the approved EIA study for Outlying Islands Sewerage Stage 1, Phase II
Package J – Sok Kwu Wan Sewage Collection, Treatment & Disposal Facilities
([1]). In this method, a simple model is used to
calculate the depth averaged suspended sediment concentrations along the
centreline of a plume by solving the advection-diffusion equation for a
continuous line source ([2]). This model is considered appropriate for the
calculation of suspended sediment concentrations from the proposed dredging /
filling work because the equation is based on a continuous line source of
sediment, which is a reasonable approximation of the loss of sediment due to
suspension during grab dredging / filling. It is appropriate for areas where the tidal
current is uni-directional for each phase of the tidal cycle (i.e. the ebb and
flood phases), which is the case at SKC where the tidal current is also
uni-directional for each phase of the tidal cycle. This method is applicable for suspended
sediment plumes of length no greater than the maximum tidal excursion. The sediment plume generated from the proposed
dredging / filling work at SKC would be transported along the tidal flow around
the southwest coastline of SKC which generally runs from the southeast to the
west and from the west to the southeast during flood and ebb tides
respectively. The maximum depth-averaged
tidal current speeds around SKC could be up to
Tidal Excursion = Maximum Tidal Current Speed * Period * 2 / π
5b.7.3.7
The tidal excursion is thus
calculated to be approximately
![]()
where C(x) = concentration
at distance x from the source;
q = sediment loss rate (
D = water depth (
x = distance from source;
ω = diffusion velocity (
5b.7.3.8
Any sediment plume generated
from the proposed dredging / filling works at SKC would be transported by the
tidal flow around the SKC. The
representative water depth at the reclamation area of the artificial island
near SKC would be over
5b.7.3.9 The use of the above equation is limited to situations where the value of γ, as defined by the following equation, is small and where ω / u is also small.
γ = W * t / D
where W = settling
velocity of suspended sediment;
t = time;
D = water depth (
5b.7.3.10
The sediments suspended by the
dredging / filling operations may be split into a fine fraction and a coarse
fraction. The fine fraction is assumed
to remain in suspension indefinitely, which is based on the fact that the
settling velocity for the sediment particles according to Stokes Law is offset
by local turbulence. The value of
settling velocity, W, for the coarse fraction of the sediment (based on
the Stokes Law) would depend on the sediment particle size. The value for t will be taken to be
half of the tidal period, which may be taken to be the time between the ebb and
flood phases of the tidal cycle. In
5b.7.3.11
The average current speed in
the vicinity of the artificial island near SKC is conservatively taken to be
Prediction and Evaluation of Impacts from Filling for the Reclamation Area
Consideration of Mitigation Measures and Sediment Loss Rate
5b.7.3.12
The filling of reclamation area
will be conducted at a production rate of
5b.7.3.13
Based
on the approved EIA for “Further Development of
Tseung Kwan O Feasibility Study” as well as “Tuen Mun – Chek Lap Kok Link - Investigation”, the loss rate during
sand filling would be about 5% of fine content from the filling material. The
fine content of sand is assumed to be 5% of the bulk under the above 2 studies.
Since the filling material used under this Project would be consisted of rock,
sand and public fill, the fine content of the composite filling material could not
be simply determined. As the fine content for the rock (negligible fine
content) and sand (about 5% fine content ([3])) is expected to be lower than that of public fill (25% fine content ([4])), it would be conservative to assume the filling material to be consisted
of entirely public fill. It is assumed under this assessment that 5% of the
fine content in the public fill would be lost during the filing operation,
which is based on the assumption adopted under the approved EIA for “Hong Kong - Zhuhai - Macao Bridge
Hong Kong Boundary Crossing Facilities”. The density of public fill adopted
under this assessment is
5b.7.3.15
The current speeds around the
Project site are less than
Model Results
5b.7.3.16 The results of the calculation of suspended solid concentrations under unmitigated filling scenario are given in Table 5b.8.
Table 5b.8 Calculated Suspended Sediment Elevation under Unmitigated Filling Scenario
|
Distance from Source
(m) |
Suspended Sediment
Concentration (mg/L) |
|
50 |
434.2 |
|
100 |
217.1 |
|
200 |
108.6 |
|
250 |
86.8 |
|
300 |
72.4 |
|
400 |
54.3 |
|
500 |
43.4 |
|
600 |
36.2 |
|
700 |
31.0 |
|
800 |
27.1 |
|
900 |
24.1 |
Note: The assessment result is calculated based on the following assumptions:
1. the filling material would be consisted of 100% public fill;
2.
the fine content for public fill is assumed to be 25% and 5% of the
fine content would be loss to the water column during the filling process. The
density of public fill is assumed to be
3.
no silt curtain would be applied at the marine access opening.
Coral Communities
5b.7.3.17
As shown in Table
5b.8, the level of SS elevation due to the reclamation
filling at the closest coral community (minimum distance from the dredging
boundary to the nearest non-translocatable coral community is
5b.7.3.18 Moving the artificial island near SKC further south (to reduce the level of impact from the proposed marine works) was considered not feasible due to marine safety reason as explained in Section 2. For mitigating the impact on SS elevation on coral, it is proposed that a silt curtains system should be applied at the marine access opening to control the dispersion of filling material. As discussed in Section 5b.7.3.14, the assumed silt removal efficiency for silt curtains system at marine access opening adopted under this assessment is 80%. During the initial period of reclamation, this silt-removal efficiency of the silt curtains system at marine access opening shall be verified by examining the results of water quality monitoring points under the EM&A works. The verified silt curtain effectiveness shall be used for future reference only. The detailed methodology for the field trial of silt curtain system at marine access opening for verification of the silt removal efficiency should be submitted to EPD for approval prior to the trial. The need to implement additional mitigation measures shall be determined in accordance with the event/action plan in the EM&A Manual if there is any exceedance of the water quality identified in the monitoring results under the EM&A programme.
5b.7.3.19
To further reduce the elevation
in SS due to the reclamation filling, the use of public fill for any filling
works below +2.5 mPD (ie below high watermark) should be limited as the fine
content in public fill would generally be higher than that of sand and rock. It
is proposed that the use of public fill below +2.5 mPD should be controlled at
maximum
Table 5b.9 Calculated Suspended Sediment Elevation under Mitigated Filling Scenario
|
Distance from Source
(m) |
Suspended Sediment
Concentration contributed from: (mg/L) |
||||
|
Public Fill ( |
Sand ( |
Rock ( |
Total |
||
|
50 |
8.4 |
3.7 |
0.0 |
12.1 |
|
|
100 |
4.2 |
1.9 |
0.0 |
6.0 |
|
|
200 |
2.1 |
0.9 |
0.0 |
3.0 |
|
|
242 |
1.7 |
0.8 |
0.0 |
2.5 |
|
|
250 |
1.7 |
0.7 |
0.0 |
2.4 |
|
|
300 |
1.4 |
0.6 |
0.0 |
2.0 |
|
|
400 |
1.0 |
0.5 |
0.0 |
1.5 |
|
|
500 |
0.8 |
0.4 |
0.0 |
1.2 |
|
|
600 |
0.7 |
0.3 |
0.0 |
1.0 |
|
|
700 |
0.6 |
0.3 |
0.0 |
0.9 |
|
|
800 |
0.5 |
0.2 |
0.0 |
0.8 |
|
|
900 |
0.5 |
0.2 |
0.0 |
0.7 |
|
Note: The assessment result is calculated based on the following assumptions:
1. the filling material would be composed of public fill, sand and rock in the amount stated in the table;
2.
the fine content for public fill is assumed to be 25% and 5% of the
fine content would be loss to the water column during the filling process. The
density of public fill is assumed to be
3.
the fine content for sand is assumed to be 5% and 5% of the fine
content would be loss to the water column during the filling process. The
density of sand is assumed to be
4. the filling of rock do not contribute to any loss of fine during the filling process;
5.
silt curtain would be applied at the marine access opening and its
silt removal efficiency would be 80%.
5b.7.3.20
As shown in Table
5b.9, the predicted maximum SS elevation at
5b.7.3.21 To ensure the actual efficiency of the silt curtains system would be at least as high as the level assumed in the assessment, a field trial should be carried out at the early stage of the reclamation to determine the silt removal efficiency of the silt curtains system (with total four layers of silt curtains). The silt curtain at the marine access opening is indicatively illustrated at Appendix 5.5-3 and Appendix 5.5-4. The details for the field trial are provided in the EM&A manual.
Prediction and Evaluation of Impacts from Localized Dredging for Anti-Scouring Protection Layer
Consideration of Mitigation Measures and Sediment Loss Rate
5b.7.3.22
The localized dredging works
for anti-scouring protection layer for seawalls and breakwaters at SKC will be
conducted at a production rate of
5b.7.3.23
Based
on the approved EIA for “Construction of
an International Theme Park in Penny's Bay of North Lantau together with its
Essential Associated Infrastructures (Theme Park)”, the sediment loss rate
from grab dredging in areas with significant amount of debris or big boulders
on the seabed would be
5b.7.3.25
The current speeds around the
Project site are less than
Model Result
5b.7.3.26 The results of the calculation of suspended sediment concentrations are given in Table 5b.10.
Table 5b.10 Calculated Suspended Sediment Elevation under Unmitigated Dredging Scenario (Silt Curtain Implemented)
|
Distance from Source (m) |
Suspended Sediment Concentration (mg/L) |
|
15 |
174 |
|
50 |
52.2 |
|
100 |
26.1 |
|
200 |
13.1 |
|
300 |
8.7 |
|
400 |
6.5 |
|
500 |
5.2 |
|
600 |
4.4 |
|
700 |
3.7 |
|
800 |
3.3 |
|
900 |
2.9 |
Coral Communities
5b.7.3.27
As shown in Table
5b.10, the level of SS elevation due to the dredging
operation at the closest coral community (minimum distance from the dredging
boundary to the nearest non-translocatable coral community is >
5b.7.3.28
For mitigating the impact on SS
elevation on coral, no dredging operation would be carried out within
Table 5b.11 Calculated Suspended Sediment Elevation under Mitigated Dredging Scenario (Silt Curtain Implemented and Dredging Rate Reduces)
|
Distance from the Nearest Coral (m) |
Maximum Allowable Production Rate (m3/day) |
Maximum SS Elevation (mg/L) |
|
Above 100 |
380 |
2.5 |
5b.7.3.29
Table 5b.12 below summarizes the
recommended dredging rate for this Project.
The permitted number of grab per hour is also shown in Table
5b.12, which should be specified in the construction
contract for this Project to be followed by the dredging contractor. It is recommended to employ closed grab with
small capacity of
Table 5b.12 Recommended Maximum Dredging Rate and Permitted Number of Grab Per Hour
|
Distance from the Nearest Coral (m) |
Recommended Dredging Rate (m3
per day) |
Permitted No. of Grab per Hour Using Grab Size of Approx.
|
|
Above 100 |
380 |
No more than 15 |
5b.7.3.30
As shown in Table
5b.11, after the reduction of dredging rate, the
resulted maximum SS elevation would greatly reduced to 2.5 mg/L, which complied
with the SS criterion of elevation from 30% of the ambient SS. Since the
maximum SS elevation is calculated from the shortest distance (
Sediment Elevation and Sedimentation Impact upon Coral Communities
5b.7.3.31
As shown in Table
5b.8 and Table
5b.11, full compliance with the SS criterion is
predicted at all the identified coral communities. As compared with the baseline SS level at SKC
(11.6 mg/L and 8.6 mg/L for SM12 and SM13 respectively in 2008), the maximum
elevation in SS level (2.5 mg/L) only contribute to a small increment. As shown
in the Appendix 5.1, the baseline sedimentation rate at SKC would be
5b.7.3.32 As discussed in Section 5b.7.3.2, the maximum SS elevation predicted at the nearest coral community would be 2.5 mg/L, which would fulfills the criteria for SS elevation. It is therefore believed that no adverse SS impact on the coral community at Southwest Coastline of Shek Kwu Chau would be anticipated. Detailed assessment of the effect of SS upon these coral communities and further mitigation measures recommended for protection of these coral communities are separately provided under the ecological impact assessment in Section 7b.
Horseshoe Crab at
5b.7.3.33
Horseshoe crab was identified
at northern SKC about
Other Sensitive Receivers
5b.7.3.34
Besides the coral communities
and horseshoe crab, the nearest WSRs (including the gazetted beaches at
southern
Oxygen Depletion from Dredging
5b.7.3.35 The sediment oxygen demand (SOD) of the sediment samples collected for biogas risk investigation has been used to determine the reductions in dissolved oxygen (DO) concentration, based on the predicted increases in suspended sediment concentrations in accordance with the following equation:
where DODEP = Dissolved oxygen (DO)
depletion (mg/l)
C = Predicted maximum suspended
solids (SS) concentration (mg/l)
SOD = Sediment oxygen demand
(mg/kg) measured in the sediment samples collected from marine SI
K = Daily
oxygen uptake factor (set as 1)
5b.7.3.36 In the calculation, the daily oxygen uptake factor, K, was set to be 1, which means instantaneous oxidation of the sediment oxygen demand. This was a conservative prediction of DO depletion since oxygen depletion is not instantaneous. It is worth noting that the above equation does not account for re-aeration which would tend to reduce impacts of the SS on the DO concentrations in the water column.
5b.7.3.37 The calculation was performed using the highest levels of sediment oxygen demand (SOD) measured in the sediment samples collected during the sediment sampling for conservative predictions. The highest SOD level (575 mg/kg) was recorded at Station MI11. Locations of the sampling stations are given in Figure 6b.1.
5b.7.3.38
The
predicted maximum DO depletion during dredging was used to evaluate the water quality
impacts. The calculated maximum DO
depletion was subtracted from the measured background DO level to determine the
resultant DO level in marine water. The
10 percentile values of the measured DO levels were used as the background
levels, following the approach adopted in the approved EIAs for “Dredging Works for Proposed Cruise Terminal
at Kai Tak” and “Wan Chai Development
Phase II & Central-Wan Chai Bypass”. The proposed analysis,
which is on the conservative side, will likely overestimate the impact on DO. The predicted maximum DO depletions are given
in Table 5b.13.
Table 5b.13 Calculation of the Effects of Increased Suspended Solids Concentration on
Dissolved Oxygen Concentration under Unmitigated Scenario
|
Maximum SS Elevation at Important Ecological Sites
(mg/L) |
SOD in Sediment (mg/kg) |
Maximum DO Depletion (mg/L) |
Background Depth-averaged DO (mg/L) |
Resultant DO (mg/L) |
WQO for Depth-averaged DO |
|
174 |
575 |
0.1 |
5.90 |
5.8 |
≥4 mg/l |
5b.7.3.39 No significant DO depletion was predicted at the sensitive receivers in SKC even under unmitigated scenario. The dredging activities would cause a maximum DO depletion of 0.1 mg/L at the nearest sensitive receiver. Full compliance with the WQO for depth-averaged DO was predicted in SKC. Hence, no adverse impacts at the sensitive receivers on the DO levels in SKC would be expected from the dredging works.
5b.7.4 Construction Phase Impact from Installation of Submarine Cables
5b.7.4.1 The cable burying machine would include an injector lowered to the seabed. The injector fluidizes a trench using high pressure water jets and the cable is immediately laid within the trench. The sides of the trench slip around the cable, burying it and leaving a small depression in the seabed. The maximum width of the seabed fluidized by the injector is 3 m and the cable is buried to a maximum depth of 5 m. During the jet plough cable laying process the seabed sediments will be disturbed and a small percentage will be lost to suspension in the lower part of the water column in the immediate vicinity of the jet plough. The analysis of the potential transport of fine sediments suspended into the water column during the cable laying process has been conducted based on the assumptions and methodology adopted under past approved studies for similar cable laying works such as the “VSNL Intra Asia Submarine Cable System – Deep Water Bay (EP-294/2007)” and the “Proposed 132kV Submarine Cable Route for Airport "A" to Castle Peak Power Station Cable Circuit, CLP Power (EP 267/2007)”.
5b.7.4.2
During cable laying, the seabed
sediment will be released at the bottom of the water column which will result
in high localized suspended sediment concentrations and high settling velocities.
This is because at high concentrations
within a much localized area, suspended sediment will tend to form large
aggregations of sediment particles (the process of flocculation) which have a
higher settling velocity than the individual sediment particles. It is expected that the suspended sediments
will remain within
5b.7.4.3
Typically the settling velocity
of SS is determined by examining the relationship between SS initial
concentrations and the cohesive nature of the sediment being disturbed. Typically, as SS concentration increases, so
will settling velocity as sediment particles flocculate, gain mass and settle
faster. However, this relationship does
not hold true when initial SS concentrations exceed values such as
Settling Time =
5b.7.4.4 The distance travelled by the sediment will thus be the settling time multiplied by the current velocity.
Distance Travelled = 200
s x
5b.7.4.5
The above calculation indicated
that the sediments disturbed during laying of the submarine cable will settle
onto the seabed within approximately
5b.7.4.6 As shown in Figure 5b.3, the most of the influence zone of the laying works would be far away from the Shek Kwu Chau site. The laying of submarine cables in this area would not cause cumulative water quality impact with the dredging for sheet piling at the Shek Kwu Chau site. No concurrence works between laying of cables and dredging/reclamation works within the same location is allowed. For works close to each other, the construction program should be arranged so that the dredging/reclamation works within area bounded by the breakwaters and the laying of cables would not operate within a distance of 80m from each other to avoid any accumulative impact on the environment (in case if such tight schedule is necessary).
5b.7.4.7 During submarine cable laying works, a water quality monitoring programme should be conducted to ensure no unacceptable water quality impacts will occur at the nearby WSRs.
5b.7.5 Consideration of Cumulative Construction Phase Impacts
5b.7.5.1 Two projects may be carried out concurrently with the IWMF Project at the artificial island near SKC:
ESB-209/2009 – Outlying
Marine works
5b.7.5.2
The concurrent project would
involve the construction of a Sewage Treatment Works (STW) at San Shek
Wan. Although the STW building would be
located outside the study area of the IWMF at Cheung
Sha, nevertheless, its associated submarine outfall, which is approximately
5b.7.5.3
While the tentative
construction schedule for the IWMF project is 2013 to 2018, there may be an
overlapping period for the two projects.
As the water quality impacts generated from the proposed reclamation and
submarine cable installation works are predicted to be localized and will not
encroach any WSRs, no significant cumulative impact on marine ecology due to
water quality would be anticipated. The location of the proposed outfall of the
Outlying Islands Sewerage Project is shown in Figure 5b.7. The distance of the proposed outfall from the
IWMF site is approximately
ESB-187/2008 – Improvement of Fresh Water Supply to Cheung Chau (2010 – 2013)
Marine works
5b.7.5.4
This concurrent project would
construct a submarine water main across Adamasta Channel, between Northern
Channel of Cheung Chau and
5b.7.5.5
According to the tentative
schedule of the concurrent project, which is 2010 to 2013, the submarine water
main laying works may overlap with the construction works for the IWMF Project
(2013-2018). Considering that the
overlapping time would be short, and that the water quality impacts generated
from the IWMF marine works are predicted to be localized and will not encroach
any WSRs, no significant cumulative impact on marine ecology due to water
quality would be anticipated. The location of the new water main of the Fresh
Water Supply Improvement Project is shown in Figure 5b.7. The distance
of the proposed submarine water main is at least
5b.7.6 Operation Phase Impact from Project Effluent
Wastewater from Waste Treatment Process and Sewage from Floor & Vehicle Washing and the IWMF Staff & Visitors
5b.7.6.1 As discussed in Section 5b.6.2.14, the IWMF facilities would be designed with a net zero discharge of process and sanitary wastewater. A wastewater treatment plant would be provided on-site to treat high organic loading wastewater (such as sewage from floor & vehicle washing and the IWMF staff & visitors) for reuse in the incineration plant and mechanical treatment plant or for washdown and landscape irrigation. The bunker leachate / ash leachate from incineration plant (as described in Section 5b.6.2.9) would be highly polluted and would be conveyed to the incineration plant and co-incinerated with MSW. All other wastewater (i.e. low/nil organic loading wastewater mainly coming from plant machinery such as demineralizer drain) only requires simple treatment such as sedimentation or neutralization or even not requires any treatment before being used for flue gas cooling in quench tower or ash quenching. Therefore, no adverse water quality impact would be expected.
Transportation of bottom ash, fly ash and APC residues to WENT Landfill for disposal
5b.7.6.2 As discussed in Section 2, the IWMF would comprise (a) an advanced thermal incineration plant of about 3,000 tpd capacity and (b) a demonstration-scale mechanical treatment plant of about 200tpd or less for mixed MSW. The main waste type to be generated during the operation of the thermal incineration plant would be bottom ash, fly ash and air pollution control (APC) residues. For treating 3,000 tpd of mixed MSW, it is estimated that approximately 660 tpd of bottom ash and 120 tpd of fly ash and APC residues would be generated from the thermal incineration plant.
5b.7.6.3 The bottom ash is considered to be inert provided that the combustion systems in the incinerator are designed and operated correctly, and would be disposed of at landfill. Fly ash and APC residues from the flue gas stream can also be disposed of at landfill after proper treatment. The pollution load in fly ash and APC residues would likely be higher and more readily leachable than that in bottom ash. Cement solidification or chemical stabilization would be adopted to pre-treat the fly ash and APC residue to ensure that they would conform to the proposed Incineration Residue Pollution Control Limits and leachability criteria.
5b.7.6.5 Moreover, as suggested in Section 6, the ashes would be stored in covered container during transportation, the possibility for accidental exposure of the ashes to the environment would be low. Transportation of incineration waste would also be avoided during adverse weather condition to prevent unanticipated risk. It is believed that the risk to the environment concerning the accidental spillage of ashes during marine transportation is low.
5b.7.6.6 As the incineration waste would be stored within covered container which prevent the contact between the incineration waste and marine water, leaching of pollutants from the incineration waste may not occur even if the containers fall into the sea accidentally. Even if spillage occurs under a very remote condition with some of the incineration waste containers damaged, the containers could still be effective in limiting the dispersion of leached contaminants. As discussed in Section 5b.7.6.4, the flying ash and APC residue from the incineration plants would be solidified and the leaching of pollutant would be limited. For the non-solidified bottom ash which passes the leachability criteria of Incineration Residue Pollution Control Limits (IRPCL), the possible level of leaching would be far lower than the contaminant levels listed in the IRPCL. In case of spillage, the dropped containers which contain the incineration waste are expected to fall to the seabed and could be recovered by the cleanup operation following the spillage. This would prevent the prolonged localized impact on water quality in case some of the containers are opened or damaged.
5b.7.6.7 It is expected that the possibility for the spillage of incineration waste would be scant. In case of spillage, the leaching of pollutant from the incinerated waste would be limited and the consequential impact on water quality, ecology and fishery resources would be low. A comprehensive emergency response plan for any accidental spillage should be submitted by the operation contractor to the EPD for agreement before the operation of the facilities. Salvage and cleanup action to recover the spilled incineration waste containers following the spillage should be carried out according to the emergency response plan to mitigate the environmental impact in case of spillage. Further details on the management of waste are given in Section 6.
Discharge of Saline Water from Desalination Plant
5b.7.6.8
Approximately
5b.7.6.9 A comparison of the characteristics of the saline water discharge with the standards for effluents discharged into the inshore waters of Southern Water Control Zone is given in Table 5b.14 below:
Table 5b.14 Comparison of Saline Water Discharge from Desalination Plant with Effluent Discharge Standard
|
Parameters |
Saline Water Note 1 |
Discharge Standard Note 2 & 3 |
Compliance with Discharge Standard |
|
pH |
6 – 8 |
6 – 9 |
Yes |
|
Temperature (℃) |
14 – 29 |
40 |
Yes |
|
Suspended Solids (mg/L) |
6 – 30 |
30 |
Yes |
|
BOD (mg/L) |
0.4 – 3.0 |
20 |
Yes |
|
Total Residual Chorine (mg/L) |
<1 |
<1 |
Yes |
Notes: 1. It is calculated based on the assumption that the brine water
produced is generally 1.7-1.8 times more concentrated than raw seawater for SS
and BOD. There will be no temperature elevations in the saline water discharge
as compared to the ambient water temperature. The characteristics of the baseline seawater
quality are obtained from “Marine Quality
in
2. Discharge standard for flow rate of >1500
and ≤
3. The effluent discharge standards do not specify a standard for salinity.
5b.7.6.11
The density profiles at the monitoring
point was extracted and analyzed on days of spring tide and neap tide in both dry
and wet seasons. The model results shown
that the vertical density in dry season was found to be uniformly distributed
over the entire water column while in wet season, a stratification of seawater was
observed. Based on the analysis of
ambient density profiles, two sets of density profiles were adopted for near
field simulation, including one set of density profile predicted for dry season
(with no sign of stratification) and one set of density profile predicted for
wet season (with the highest degree of stratification predicted over the entire
15-day wet season simulation period). The
current profiles extracted at the same monitoring point was also analyzed and
calculated as 10 and 90 percentile values (for dry and wet seasons). The near field impact was simulated for
different combinations of vertical density profile and ambient current velocity
using the design effluent flow rate (
Table 5b.15 Density Profile at SKC IWMF Desalination Plant Outfall
|
Depth from water surface (m) |
Density (kg/m3) |
|
|
Dry Season (D) |
Wet Season (W) |
|
|
0.76 |
1.0150 |
1.0067 |
|
2.27 |
1.0150 |
1.0068 |
|
3.79 |
1.0150 |
1.0075 |
|
5.30 |
1.0150 |
1.0101 |
|
6.82 |
1.0150 |
1.0124 |
|
8.33 |
1.0150 |
1.0137 |
|
9.85 |
1.0150 |
1.0145 |
|
11.36 |
1.0150 |
1.0152 |
|
12.88 |
1.0150 |
1.0152 |
|
14.39 |
1.0150 |
1.0152 |
|
15.15 |
1.0150 |
1.0152 |
Table 5b.16 Current Velocity Profile at SKC IWMF Desalination Plant Outfall
|
Depth from water surface (m) |
Current Velocity (m/s) |
|||
|
Dry Season |
Wet Season |
|||
|
10%ile (dv10) |
90%ile (dv90) |
10%ile (wv10) |
90%ile (wv90) |
|
|
0.76 |
0.0604 |
0.3369 |
0.1140 |
0.6427 |
|
2.27 |
0.0555 |
0.3342 |
0.1530 |
0.6734 |
|
3.79 |
0.0532 |
0.3307 |
0.1746 |
0.6403 |
|
5.30 |
0.0517 |
0.3260 |
0.1401 |
0.5553 |
|
6.82 |
0.0506 |
0.3201 |
0.1210 |
0.4561 |
|
8.33 |
0.0498 |
0.3128 |
0.0897 |
0.3540 |
|
9.85 |
0.0491 |
0.3038 |
0.0538 |
0.2801 |
|
11.36 |
0.0484 |
0.2921 |
0.0364 |
0.2365 |
|
12.88 |
0.0475 |
0.2763 |
0.0316 |
0.2104 |
|
14.39 |
0.0457 |
0.2514 |
0.0250 |
0.1698 |
|
15.15 |
0.0457 |
0.2514 |
0.0250 |
0.1698 |
Table 5b.17 Summary of Proposed Model Runs
|
Model Run No. |
Run ID |
Density Profile |
Ambient Current Velocity |
|
1 |
D-dv10 |
D |
dv10 |
|
2 |
D-dv90 |
D |
dv90 |
|
3 |
W-wv10 |
W |
wv10 |
|
4 |
W-wv90 |
W |
wv90 |
Prediction and
Evaluation of Near Field Modelling Results