11.          Water Quality Impact

Introduction

11.1        This section presents an assessment of the potential water quality impacts associated with the construction and operation phases of the Project.  Recommendations for mitigation measures have been provided, where necessary, to minimize the identified water quality impacts to an acceptable level.

Water Sensitive Receivers

Victoria Harbour

11.2        In order to evaluate the potential water quality impacts from the Project, water sensitive receivers (WSR) in Victoria Harbour and its adjacent waters have been considered. No freshwater WSR (such as natural streams and rivers) were identified within 300 m from the boundaries of the SCL (HUH-ADM) works areas.  Major marine WSRs identified include:

Ÿ  Seawater intakes; and

Ÿ  Important coral communities

Seawater Intakes

11.3        Seawater intakes identified in Victoria Harbour include WSD flushing water intakes and cooling water intakes. Intakes identified along the coastlines of Wan Chai, Causeway Bay, North Point and Kowloon Peninsula are shown in Figure No. NEX2213/C/331/ENS/M59/002 and Figure No. NEX2213/C/331/ENS/M59/003.  Water sensitive receivers identified in the remaining areas of Victoria Harbour and its adjacent waters (excluding the area in Wan Chai, Causeway Bay, North Point and Kowloon Peninsula are shown in Figure No. NEX2213/C/331/ENS/M59/001. 

11.4        It should be noted that a number of cooling water pumping stations and intakes are located within the proposed permanent reclamation limit of Wan Chai Development Phase II (WDII) along the existing waterfront of Wan Chai.  These intakes supply cooling water to the air conditioning systems of various commercial buildings in the Wan Chai area including:

Ÿ  Hong Kong Convention and Exhibition Centre (HKCEC) Phase 1

Ÿ  Shui On Centre

Ÿ  Telecom House

Ÿ  The Hong Kong Academy for Performing Arts

Ÿ  Government Buildings (Wan Chai Tower/Revenue Tower/Immigration Tower)

Ÿ  China Resources Building

Ÿ  Hong Kong Convention and Exhibition Centre (HKCEC) Extension

Ÿ  Great Eagle Centre

Ÿ  Sun Hung Kai Centre

11.5        Cooling water intake for Sun Hung Kai Centre will be reprovisioned to the new waterfront of Wan Chai during operational phase of the proposed WDII.  The rest of the above listed cooling water intakes (except for the intake of HKCEC Extension) will be reprovisioned to the intake chambers to the north of HKCEC Extension.  No relocation of the existing intake of HKCEC Extension is required under the WDII project.

11.6        An existing WSD flushing water intake is also located within the proposed WDII reclamation limit at Wan Chai which will be reprovisioned to the new waterfront of Wan Chai under the WDII project.

11.7        Figure No. NEX2213/C/331/ENS/M59/002 shows the locations of the existing and reprovisioned seawater intakes along the waterfront of Wan Chai, Causeway Bay and North Point.

11.8        Two seawater intakes are located within the Causeway Bay Typhoon Shelter (CBTS), which supply cooling water to the air conditioning systems of Excelsior Hotel, World Trade Centre, no. 27- 63 Paterson Street as well as Windsor House as shown in Figure No. NEX2213/C/331/ENS/M59/002. No permanent reclamation is required in CBTS under either the WDII project or this Project, and thus no permanent intake relocation would be required at CBTS. However, the cooling water intake for Windsor House would be located within the temporary reclamation works area in CBTS and therefore would need to be temporarily relocated to the adjacent area to allow continuous operation of the intake during the construction phase. Further discussion on the temporary intake relocation within CBTS is provided in Section 11.76. Location of the existing and temporarily diverted intake within the CBTS is indicatively shown in Plate 1 under Section 11.69.

11.9        There are several cooling water intakes operated in close proximity to the Project alignment at the Hung Hom landfall.  Locations of these cooling water intakes are shown in Figure No. NEX2213/C/331/ENS/M59/003.

Important Coral Communities

11.10      Water quality impacts on important coral communities with conservation interest are addressed in this water quality impact assessment.  Recognized important coral sites that are within the Study Area (Western Buffer, Victoria Harbour and Eastern Buffer WCZs) are located in the far field at Green Island as shown in Figure No. NEX2213/C/331/ENS/M59/005.

Shek O

11.11      WSRs most likely to be affected by the proposed Shek O casting basin would be the marine water and beneficial uses in Tai Tam Bay including three gazetted beaches at Turtle Cover, Hairpin, Stanley Main respectively.  The whole Tai Tam Bay is classified as secondary contact recreation subzone.

11.12      There are no fish culture zones within Tai Tam Bay. The nearest beaches are Stanley Main and Hairpin, which are located more than 2km west of the casting basin. The Cape D’Aguilar Marine Reserve is located at the southeastern tip of the Tai Tam Bay, designated to protect the rocky shores and the subtidal habitats in the area. The Cape D’Aguilar – Kau Pei Chau Site of Special Scientific Interest (SSSI) is also located at the southeastern tip of the Tai Tam Bay. Locations of WSRs in Tai Tam Bay are shown in Figure No. NEX2213/C/331/ENS/M59/009.

Environmental Legislation, Policies, Plans, Standards and Criteria

11.13      The criteria for evaluating water quality impacts in this EIA Study include:

Environmental Impact Assessment Ordinance (EIAO)

11.14      The Technical Memorandum on Environmental Impact Assessment Process (EIAO-TM) was issued by EPD under Section 16 of the EIAO.  It specifies the assessment method and criteria that were followed in this Study.  Reference sections in the EIAO-TM provide the details of assessment criteria and guidelines that are relevant to the water quality assessment, including:

Ÿ  Annex 6 – Criteria for Evaluating Water Pollution

Ÿ  Annex 14 – Guidelines for Assessment of Water Pollution

Water Quality Objectives

11.15      The Water Pollution Control Ordinance (WPCO) provides the major statutory framework for the protection and control of water quality in Hong Kong.  According to the Ordinance and its subsidiary legislation, Hong Kong waters are divided into ten Water Control Zones (WCZs).  Corresponding statements of Water Quality Objectives (WQO) are stipulated for different water regimes (marine waters, inland waters, bathing beaches subzones, secondary contact recreation subzones and fish culture subzones) in the WCZ based on their beneficial uses.  The proposed Project is located within Victoria Harbour (Phase Three) WCZ and the corresponding WQO are listed in Table 11.1. The proposed Shek O casting basin is located within Southern WCZ and the corresponding WQO are listed in Table 11.2.

Table 11.1         Summary of Water Quality Objectives for Victoria Harbour WCZ

Parameters

Objectives

Sub-Zone

Offensive odour, tints

Not to be present

Whole zone

Visible foam, oil scum, litter

Not to be present

Whole zone

Dissolved oxygen (DO) within 2 m of the seabed

Not less than 2.0 mg/l for 90% of samples

Marine waters

Depth-averaged DO

Not less than 4.0 mg/l for 90% of samples

Marine waters

pH

To be in the range of 6.5 - 8.5, change due to human activity not to exceed 0.2

Marine waters

Salinity

Change due to human activity not to exceed 10% of ambient

Whole zone

Temperature

Change due to human activity not to exceed 2

Whole zone

Suspended solids (SS)

Not to raise the ambient level by 30% caused by human activity

Marine waters

Unionised ammonia (UIA)

Annual mean not to exceed 0.021 mg/l as unionised form

Whole zone

Nutrients

Shall not cause excessive algal growth

Marine waters

Total inorganic nitrogen (TIN)

Annual mean depth-averaged inorganic nitrogen not to exceed 0.4 mg/l

Marine waters

Toxic substances

Should not attain such levels as to produce significant toxic, carcinogenic, mutagenic or teratogenic effects in humans, fish or any other aquatic organisms.

Whole zone

Human activity should not cause a risk to any beneficial use of the aquatic environment.

Whole zone

Source:   Statement of Water Quality Objectives (Victoria Harbour (Phases One, Two and Three) Water Control Zone)

Table 11.2         Summary of Water Quality Objectives for Southern WCZ

Parameters

Objectives

Sub-Zone

Offensive odour, tints

Not to be present

Whole zone

Visible foam, oil scum, litter

Not to be present

Whole zone

Dissolved Oxygen (DO) within 2 m of the seabed

Not less than 2.0 mg/l for 90% of samples

Marine waters

Depth-averaged DO

Not less than 4.0 mg/l for 90 % of samples

Marine waters excepting fish culture subzones

Not less than 5.0 mg/l for 90% of samples

Fish culture subzones

Not less than 4.0 mg/l

Inland waters

pH

To be in the range of 6.5 - 8.5, change due to human activity not to exceed 0.2

Marine waters excepting bathing beach subzones; Mui Wo (A), Mui Wo (B), Mui Wo (C), Mui Wo (E) and Mui Wo (F) subzones

To be in the range of 6.0 – 9.0

Mui Wo (D) sub-zone and other inland waters.

To be in the range of 6.0 –9.0 for 95% of samples, change due to human activity not to exceed 0.5

Bathing beach subzones

Salinity

Change due to human activity not to exceed 10% of ambient

Whole zone

Temperature

Change due to human activity not to exceed 2

Whole zone

Suspended Solids (SS)

Not to raise the ambient level by 30% caused by human activity

Marine waters

Change due to waste discharges not to exceed 20 mg/l of annual median

Mui Wo (A), Mui Wo (B), Mui Wo (C), Mui Wo (E) and Mui Wo (F) subzones

Change due to waste discharges not to exceed 25 mg/l of annual median

Mui Wo (D) subzone and other inland waters

Unionized Ammonia (UIA)

Annual mean not to exceed 0.021 mg(N)/l as unionized form

Whole zone

Nutrients

Shall not cause excessive algal growth

Marine waters

Total inorganic nitrogen (TIN)

Annual mean depth-averaged inorganic nitrogen not to exceed 0.1 mg(N)/l

Marine waters

E. coli

Not exceed 610 per 100 ml, calculated as the geometric mean of all samples collected in one calendar year

Secondary contact recreation subzones and fish culture subzones

Not exceed 180 per 100 ml, calculated as the geometric mean of all samples collected from March to October inclusive in 1 calendar year. Samples should be taken at least 3 times in 1 calendar month at intervals of between 3 and 14 days.

Bathing beach subzones

5-Day Biochemical Oxygen Demand (BOD5)

Change due to waste discharges not to exceed 5 mg/l

Inland waters

Chemical Oxygen Demand (COD)

Change due to waste discharges not to exceed 30 mg/l

Inland waters

Dangerous Substances

Should not attain such levels as to produce significant toxic effects in humans, fish or any other aquatic organisms

Whole zone

Waste discharges should not cause a risk to any beneficial use of the aquatic environment

Whole zone

Source:   Statement of Water Quality Objectives (Southern Water Control Zone)

Water Supplies Department (WSD) Water Quality Criteria

11.16      Besides the WQO set under the WPCO, the WSD has specified a set of objectives for water quality at flushing water intakes as listed in Table 11.3 which shall not be exceeded at all stages of the Project.  The target limit for suspended solids (SS) at these intakes is 10 mg/l or less.

Table 11.3         WSD’s Water Quality Criteria for Flushing Water at Sea Water Intakes

Parameter (in mg/l unless otherwise stated)

Target Limit

Colour (HU)

< 20

Turbidity (NTU)

< 10

Threshold Odour Number (odour unit)

< 100

Ammoniacal Nitrogen

< 1

Suspended Solids

< 10

Dissolved Oxygen

> 2

Biochemical Oxygen Demand

< 10

Synthetic Detergents

< 5

E. coli (no. per 100 mL)

< 20,000

Cooling Water Intake Standards

11.17      Based on a questionnaire survey conducted under the approved Comprehensive Feasibility Study for Wan Chai Development Phase II (WDIICFS) EIA ([1]), a SS limit of 40 mg/L was adopted as the assessment criterion for MTR cooling water intakes.  No information on the SS limit is available for other cooling water intakes.  These findings have been confirmed by a telephone survey conducted under the recent approved EIA for the Hong Kong Convention and Exhibition Centre (HKCEC) Atrium Link Extension (ALE).  The SS criterion for cooling water intakes is different from that for the WSD’s intakes as their beneficial uses are different (the former is used for cooling water system and the latter for flushing purpose).

Technical Memorandum

11.18      Discharges of effluents are subject to control under the WPCO.  The Technical Memorandum on Standards for Effluents Discharged into Drainage and Sewerage Systems, Inland and Coastal Waters (TM-DSS) gives guidance on the permissible effluent discharges based on the type of receiving waters (foul sewers, storm water drains, inland and coastal waters).  The limits control the physical, chemical and microbial quality of effluents.  Any sewage from the proposed construction and operation activities must comply with the standards for effluents discharged into the foul sewers, inshore waters or marine waters of Victoria Harbour WCZ and Southern WCZ, as given in the TM-DSS.

Practice Note

11.19      A Practice Note for Professional Persons (ProPECC) was issued by the EPD to provide guidelines for handling and disposal of construction site discharges.  The ProPECC PN 1/94 “Construction Site Drainage” provides good practice guidelines for dealing with ten types of discharge from a construction site.  These include surface runoff, groundwater, boring and drilling water, bentonite slurry, water for testing and sterilisation of water retaining structures and water pipes, wastewater from building constructions, acid cleaning, etching and pickling wastewater, and wastewater from site facilities.  Practices given in the ProPECC PN 1/94 should be followed as far as possible during construction to minimise the water quality impact due to construction site drainage.

Assessment Criteria for Corals

11.20      This water quality impact assessment has covered the impacts upon the sensitive coral communities with conservation interest identified in the far field at Green Island as indicated in NEX2213/C/331/ENS/M59/005.

11.21      Potential impacts on corals may arise through excessive sediment deposition.  The magnitude of impacts on corals is assessed based on the predicted sedimentation rate and SS elevation.

11.22      According to Pastorok and Bilyard ([2]) and Hawker and Connell ([3]), a sedimentation rate higher than 0.1 kg/m2/day would introduce moderate to severe impact upon corals.  This criterion has been adopted for protecting the corals in Hong Kong under other approved EIAs such as Wan Chai Development Phase II (WDII) & Central-Wan Chai Bypass (CWB) EIA, Tai Po Sewage Treatment Works Stage 5 EIA and Further Development of Tseung Kwan O Feasibility Study EIA.  This sedimentation rate criterion is considered to offer sufficient protection to marine ecological sensitive receivers and is anticipated to guard against unacceptable impacts.  This protection has been confirmed by previous EM&A results which have indicated no adverse impacts to corals have occurred when this assessment criterion has been adopted.

11.23      Besides the sedimentation rate criterion, the WQO for SS established under the WPCO (i.e. the SS elevations should be less than 30% of ambient baseline conditions) is also used to evaluate the water quality impact on corals.  The WQO for SS has also been adopted under the approved Tai Po Sewage Treatment Works Stage 5 EIA as one of the assessment criteria for evaluating the water quality impact from the sewage effluent on corals identified at Tolo Harbour, Green Island and Junk Bay.

Metals and Micro-pollutants

11.24      Elutriate tests were conducted to estimate the amount of pollutants that would be released into the water during dredging.  However, there are no relevant standards in Hong Kong for assessment of acceptable concentrations of heavy metals and micro-pollutants such as total polychlorinated biphenyls (PCBs), total polyaromatic hydrocarbons (PAHs) and tributyltin (TBT) in marine water. It is thus proposed to make reference to the relevant water quality standards in the EU, Australia and USEPA.  The proposed assessment criteria for metals and organic micro pollutants are summarized in Table 11.4.  These assessment criteria have also been adopted under the approved EIA for “Laying of Western Cross Harbour Main and Associated Land Mains from West Kowloon to Sai Ying Pun”, Wan Chai Development Phase II & Central-Wan Chai Bypass” and “Dredging Works for Proposed Cruise Terminal at Kai Tak”.

Table 11.4         Proposed Assessment Criteria for Dissolved Metals and Micro-Pollutants with Reference to Standards Adopted by Other Countries

Parameters

Assessment Criteria (µg/L)

Arsenic

25 1

Cadmium

2.5 1

Chromium

15 1

Copper

5 1

Lead

25 1

Mercury

0.3 1

Nickel

30 1

Silver

2.3 1

Zinc

40 1

PCBs

0.03 2

PAHs

3 3

TBT

0.1 4

Notes:

1.        European Union Environmental Quality Standard (EQS) Values to Protect Marine Life.

2.        The Criterion Continuous Concentration (CCC) of National Recommended Water Quality Criteria for Saltwater of the USEPA (2006).

3.        Australian water quality guidelines for fresh and marine waters.

4.        Michael H. Salazar and Sandra M. Salazar (1996). “Mussels as Bioindicators: Effects of TBT on Survival, Bioaccumulation, and Growth under Natural Conditions” in Organotin, edited by M. A. Champ and P. F. Seligman. Chapman & Hall, London.

Description of the Environment and Baseline Conditions

Marine Water Quality in Central Victoria Harbour

11.25      Marine water quality monitoring data routinely collected by EPD were used to establish the baseline condition.  The EPD monitoring data collected in 2008 were summarized in Table 11.5 for Central Victoria Harbour WCZ (Stations VM4 and VM5).  Locations of Stations VM4 and VM5 are shown in Figure No. NEX2213/C/331/ENS/M59/001.  Descriptions of the baseline water quality conditions provided in the subsequent sections are extracted from the EPD’s report “2008 Marine Water Quality in Hong Kong which contains the latest information published by EPD on marine water quality at the moment of preparing this Report.

11.26      In the past, wastewater from both sides of the Victoria Harbour was discharged into it just after simple screening, leading to marine water low in dissolved oxygen (DO) and high in organic nutrients and sewage bacteria.  Full commissioning of Harbour Area Treatment Scheme (HATS) Stage 1, which collects sewage from Kowloon Peninsular, Tseung Kwan O, Kwai Tsing and Hong Kong Island East to Stonecutters Island Sewage Treatment Works (SCISTW) for treatment, in late 2001 has brought large and sustained improvements to the water quality in Victoria Harbour.  In 2008, full compliance with WQO for bottom DO, depth-averaged DO, Total Inorganic Nitrogen (TIN) and Unionised Ammonia (UIA) was achieved in the two selected monitoring stations closest to the SCL alignment.  Relatively high E.coli levels were measured at all the selected stations as they were still subject to the sewage discharges from local Preliminary Treatment Works (PTW) at Central, Wan Chai West and Wan Chai East.

Table 11.5         Baseline Marine Water Quality Condition for Central Victoria Harbour

Parameters

Victoria Harbour (Central)

WPCO WQO

(in marine waters)

VM4

VM5

Temperature

()

23.4

(16.2 – 27.1)

23.5

(16.3 – 27.2)

Not more than 2 in daily temperature range

Salinity

31.3

(26.2 – 33.2)

30.9

(25.7 – 32.7)

Not to cause more than 10% change

Dissolved Oxygen

(DO) (mg/L)

Depth Average

5.3
(3.0 – 7.0)

5.0

(3.0 – 6.2)

Not less than 4 mg/L for 90% of the samples

Bottom

4.9
(2.4 – 7.0)

5.0

(3.0 – 6.8)

Not less than 2 mg/L for 90% of the samples

Dissolved Oxygen

(DO) (% Saturation)

Depth Average

73
(45 – 94)

70

(45 – 89)

Not Available

Bottom

69
(35 – 87)

69

(45 – 85)

Not Available

pH

8.0
(7.9 – 8.3)

8.0

(7.9 – 8.3)

6.5 - 8.5 (± 0.2 from natural range)

Secchi disc Depth

(m)

2.5
(1.5 – 3.1)

2.3

(1.8 – 3.3)

Not Available

Turbidity

(NTU)

7.9
(2.6 – 11.9)

7.9

(3.1 – 12.0)

Not Available

Suspended Solids

(SS) (mg/L)

5.1
(2.9 – 8.6)

5.0

(2.8 – 8.7)

Not more than 30% increase

5-day Biochemical Oxygen Demand

(BOD5) (mg/L)

0.8
(0.3 – 1.4)

1.2

(0.3 – 3.5)

Not Available

Ammonia Nitrogen

(NH3-N) (mg/L)

0.13
(0.03 – 0.22)

0.17

(0.05 – 0.27)

Not Available

Unionised Ammonia

(UIA) (mg/L)

0.006
(<0.001 – 0.011)

0.007

(0.001 – 0.010)

Not more than 0.021 mg/L for annual mean

Nitrite Nitrogen

(NO2-N) (mg/L)

0.035
(0.008 – 0.152)

0.039

(0.020 – 0.146)

Not Available

Nitrate Nitrogen

(NO3-N) (mg/L)

0.156
(0.047 – 0.450)

0.176

(0.098 – 0.447)

Not Available

Total Inorganic Nitrogen

(TIN) (mg/L)

0.32
(0.15 – 0.73)

0.39

(0.22 – 0.71)

Not more than 0.4 mg/L for annual mean

Total Kjeldahl Nitrogen

(mg/L)

0.33
(0.17 – 0.46)

0.40

(0.23 – 0.59)

Not Available

Total Nitrogen

(TN) (mg/L)

0.52
(0.26 – 0.96)

0.62

(0.40 – 0.93)

Not Available

Orthophosphate Phosphorus

(OrthoP) (mg/L)

0.028
(0.008 – 0.041)

0.032

(0.009 – 0.057)

Not Available

Total Phosphorus

(TP) (mg/L)

0.04
(0.02 – 0.06)

0.05

(0.04 – 0.09)

Not Available

Silica (as SiO2)

(mg/L)

1.0
(0.2 – 2.4)

1.1

(0.1 – 2.7)

Not Available

Chlorophyll-a

(µg/L)

3.5
(0.2 – 18.3)

3.9

(0.3 – 19.3)

Not Available

E.coli

(cfu/100mL)

2,900
(370 – 12,000)

4,200

(840 – 23,000)

Not Available

Faecal Coliforms

(cfu/100mL)

6,300
(920 – 26,000)

10,000

(1,400 – 81,000)

Not Available

Notes:

1.        Data source: Marine Water Quality in Hong Kong in 2008.

2.        Except as specified, data presented are depth-averaged values calculated by taking the means of three depths: Surface, mid-depth and bottom.

3.        Data presented are annual arithmetic means of depth-averaged results except for E.coli and faecal coliforms that are annual geometric means.

4.        Data in brackets indicate the ranges.


Marine Water Quality in Tai Tam Bay

11.27      The EPD monitoring data collected at Tai Tam Bay (Station SM1) in 2008 were summarized in Table 11.6.  Location of Station SM1 is shown in Figure No. NEX2213/C/331/ENS/M59/009.  Full compliance with the WQO for UIA and DO was achieved in Tai Tam Bay.  The TIN level at Tai Tam Bay however exceeded the WQO which might be due to the influence of Pearl River as well as other local discharges related to the heavy storms in June and July 2008.

Table 11.6         Baseline Marine Water Quality Condition for Tai Tam Bay

Parameters

Tai Tam Bay

WPCO WQO

(in marine waters)

SM1

Temperature

()

22.7

(13.9 – 26.8)

Not more than 2 in daily temperature range

Salinity

31.7

(26.3 – 33.8)

Not to cause more than 10% change

Dissolved Oxygen

(DO) (mg/L)

Depth Average

6.6

(4.6 – 9.1)

Not less than 4 mg/L for 90% of the samples

Bottom

5.9

(2.8 – 9.2)

Not less than 2 mg/L for 90% of the samples

Dissolved Oxygen

(DO) (% Saturation)

Depth Average

91

(66 – 115)

Not Available

Bottom

81

(40 – 117)

Not Available

pH

8.2

(7.8 – 8.5)

6.5 - 8.5 (± 0.2 from natural range)

Secchi disc Depth

(m)

2.6

(1.2 – 4.5)

Not Available

Turbidity

(NTU)

8.1

(4.2 – 11.1)

Not Available

Suspended Solids

(SS) (mg/L)

4.2

(1.3 – 10.0)

Not more than 30% increase

5-day Biochemical Oxygen Demand

(BOD5) (mg/L)

0.6

(0.3 – 1.2)

Not Available

Ammonia Nitrogen

(NH3-N) (mg/L)

0.03

(0.01 – 0.06)

Not Available

Unionised Ammonia

(UIA) (mg/L)

0.002

(<0.001 – 0.005)

Not more than 0.021 mg/L for annual mean

Nitrite Nitrogen

(NO2-N) (mg/L)

0.023

(0.002 – 0.110)

Not Available

Nitrate Nitrogen

(NO3-N) (mg/L)

0.133

(0.002 – 0.670)

Not Available

Total Inorganic Nitrogen

(TIN) (mg/L)

0.18

(0.01 – 0.84)

Not more than 0.1 mg/L for annual mean

Total Kjeldahl Nitrogen

(mg/L)

0.17

(0.12 – 0.23)

Not Available

Total Nitrogen

(TN) (mg/L)

0.33

(0.12 – 0.95)

Not Available

Orthophosphate Phosphorus

(OrthoP) (mg/L)

0.010

(0.006 – 0.017)

Not Available

Total Phosphorus

(TP) (mg/L)

0.03

(0.02 – 0.03)

Not Available

Silica (as SiO2)

(mg/L)

0.9

(0.3 – 2.8)

Not Available

Chlorophyll-a

(µg/L)

3.0

(0.8 – 7.9)

Not Available

E.coli

(cfu/100mL)

2

(1 – 20)

Not Available

Faecal Coliforms

(cfu/100mL)

4

(1 – 38)

Not Available

Notes:                                                                           

1.        Data source: Marine Water Quality in Hong Kong in 2008.

2.        Except as specified, data presented are depth-averaged values calculated by taking the means of three depths: Surface, mid-depth and bottom.

3.        Data presented are annual arithmetic means of depth-averaged results except for E.coli and faecal coliforms that are annual geometric means.

4.        Data in brackets indicate the ranges.

5.        Bold number indicates exceedance of WQO.

Marine Water Quality within Causeway Bay Typhoon Shelter

11.28      A summary of published EPD monitoring data (in 2008) collected from the monitoring station at the Causeway Bay Typhoon Shelter (VT2) is presented in Table 11.7.  Location of Station VT2 is shown in Figure No. NEX2213/C/331/ENS/M59/001.  The data are extracted from the EPD’s publication “2008 Marine Water Quality in Hong Kong.

Table 11.7         Baseline Marine Water Quality Condition for Causeway Bay Typhoon Shelter

Parameters

EPD Monitoring Station

(Bi-Monthly)

WPCO WQO

(in marine waters)

VT2

Temperature

()

23.2

(15.6 – 26.8)

Not more than 2 in daily temperature range

Salinity

(ppt)

30.0

(28.3 – 31.8)

Not to cause more than 10% change

Dissolved Oxygen

(DO) (% Saturation)

Depth Average

60
(52 – 66)

Not Available

Bottom

60
(53 – 70)

Not Available

Dissolved Oxygen

(DO) (mg/L)

Depth Average

4.3
(3.5 – 5.5)

Not less than 4 mg/L for 90% of the samples

Bottom

4.4
(3.6 – 5.9)

Not less than 2 mg/L for 90% of the samples

pH

7.9
(7.8 – 8.1)

6.5 - 8.5 (± 0.2 from natural range)

Secchi disc Depth

(m)

2.1
(1.8 – 2.6)

Not Available

Turbidity

(NTU)

8.5
(6.1 – 11.2)

Not Available

Suspended Solids

(SS) (mg/L)

5.6
(2.8 – 8.0)

Not more than 30% increase

Silica (as SiO2)

(mg/L)

1.4
(0.9 – 2.5)

Not Available

5-day Biochemical Oxygen Demand

(BOD5) (mg/L)

1.4
(0.7 – 1.9)

Not Available

Nitrite Nitrogen

(NO2-N) (mg/L)

0.033
(0.020 – 0.052)

Not Available

Nitrate Nitrogen

(NO3-N) (mg/L)

0.199
(0.110 – 0.290)

Not Available

Ammonia Nitrogen

(NH3-N) (mg/L)

0.24
(0.14 – 0.33)

Not Available

Unionised Ammonia

(UIA) (mg/L)

0.009
(0.003 – 0.020)

Not more than 0.021 mg/L for annual mean

Total Inorganic Nitrogen

(TIN) (mg/L)

0.47
(0.41 – 0.50)

Not more than 0.4 mg/L for annual mean

Total Nitrogen

(TN) (mg/L)

0.74
(0.68 – 0.83)

Not Available

Orthophosphate Phosphorus

(OrthoP) (mg/L)

0.042
(0.027 – 0.052)

Not Available

Total Phosphorus

(TP) (mg/L)

0.07
(0.05 – 0.09)

Not Available

Chlorophyll-a

(µg/L)

2.0
(0.9 – 5.0)

Not Available

E.coli

(cfu/100mL)

3,500
(87 – 49,000)

Not Available

Faecal Coliforms

(cfu/100mL)

8,800
(150 – 100,000)

Not Available

Notes:

1.        Except as specified, data presented are depth-averaged data.

2.        Data presented are annual arithmetic means except for E.coli and faecal coliforms that are geometric means.

3.        Data enclosed in brackets indicate ranges.

4.        Bold number indicates exceedance of WQO.

11.29      Due to the embayment form and reduced flushing capacity of the typhoon shelter, marine water within the typhoon shelter is vulnerable to pollution.  In 2008, high levels of E.coli were recorded at the Causeway Bay Typhoon Shelter (CBTS) indicating faecal contamination.  The water quality level marginally exceeded the WQO for TIN but fully complied with the WQO for DO and UIA.  Significant long-term improvements in terms of decreasing trends in TIN, TN, OrthoP and TP were observed in CBTS.

Sediment Quality

11.30      The results of marine sediment quality analysis from the marine ground investigation works at the Project site are presented in Section 12 (under the Waste Management Section).  A review of the sediment quality data from the marine ground investigation indicated that most of the marine sediments to be dredged under the Project were classified as contaminated (Category M or H).  Details of the sediment quality criteria and guidelines as well as a comprehensive review of the sediment quality data collected at the proposed marine works areas are given in Section 12.

Identification of Potential Impacts

General Description of Onsite Construction Works in Victoria Harbour

11.31      SCL (HUH-ADM) is a 6-km extension of East Rail Line from a new Hung Hom (HUH) Station across the harbour to new stations at Exhibition (EXH) and Admiralty (ADM). The cross-harbour tunnels of the SCL (HUH-ADM) would be constructed using immersed tube (IMT). The sections of tunnels at Hung Hom landfall as well as within the CBTS would be constructed by cut and cover method involving temporary reclamation.  Tunnels from the CBTS to ADM would be constructed using tunnel boring machine (TBM) with a section of cut and cover method at the sea channel between Hong Kong Convention and Exhibition Centre, which would be reclaimed under the WDII Project.  Hard rock sections of the alignment south of ADM would be constructed using drill-and-blast method.

11.32      Dredging of marine mud would be required at the southeast corner of the CBTS to provide additional space for temporary relocation of anchorage area due to the proposed temporary reclamation within the CBTS.

11.33      The temporary reclamation within the CBTS would also require relocation of the temporary RHKYC jetty to a new location within the CBTS, which would involve minor piling works.  No dredging is required for construction of the temporary jetty.

11.34      Engineering assessments have been undertaken by reviewing the latest geological profile within the Study Area to determine the optimal IMT alignment for SCL (HUH-ADM) to minimize the risk of encountering rock head and thus minimizing the need of underwater blasting during the IMT construction whilst meeting all other Project or engineering requirements. Hence, underwater blasting would unlikely be needed for the IMT construction but would still be potentially required in areas where the rock head level is relatively high.

11.35      Two barging point locations are proposed for transportation of spoil generated under this Project for reuse/disposing of.  These barging points are located at ex-Wan Chai Public Cargo Working Area and Hung Hom Freight Pier respectively.  No dredging is required for construction of these barging points. 

11.36      Consideration of alternative construction options and development of the preferred option are discussed in detail under Section 2.

General Description of Offsite Construction Works in Shek O

11.37      Offsite works areas required for construction of the Project include the site for casting of IMT segments (at Shek O Casting Basin).

11.38      The construction works required at Shek O would basically involve installation of gates at the gate frames of the existing quarry. No marine works / dredging would be required for construction of the proposed casting basin at Shek O.

Identification of Potential Construction Phase Impacts

Marine Construction Works

Temporary Reclamation at Hung Hom Landfall and Associated Works

11.39      Temporary reclamation would be required at Hung Hom landfall where a temporary cofferdam will be constructed adjacent to temporary piled platform for works access. Removal of fender piles of Hung Hom Bypass and minor piling works would be undertaken prior to the construction of the platform and cofferdam. Release of sediment and wastewater generated from the demolition and pilling works would potentially elevate the SS concentrations in the water column, if not well controlled.  Nonetheless, excavation and tunnel construction works will be undertaken within the cofferdam.  Upon completion of tunnel construction works, reinstatement of fender piles will be carried out.  If it is not properly implemented, the potential impact will be similar to that arising from marine piling works as described above.  Since no open dredging would be required for abovementioned works, no significant water quality impact would be expected.  Layout of works area at Hung Hom landfall is shown in Figure No. NEX2213/C/331/ENS/M50/021 in Section 3.

Removal and Reinstatement of the Tip of Freight Pier at Hung Hom for IMT Construction

11.40      The tip of Hung Hom Freight Pier would need to be removed for construction of the IMT. The freight pier is a masonry gravity structure. The grain size of materials to be involved in the pier removal works would hence be large and no dredging work would be required. Therefore no off-site migration of fines would be expected.

11.41      After the completion of the IMT construction of the SCL tunnel, the tip of Hung Hom Freight Pier would be reinstated back at its original position. The reinstatement works would involve marine piling, which would potentially increase the SS concentrations in the water column, if not well controlled. No dredging would be required for the reinstatement of the tip of Hung Hom Freight Pier. With the application of the appropriate mitigation measures as shown in Section 11.217, no significant water quality impact is expected.

IMT Across the Victoria Harbour and Temporary Reclamation within CBTS

11.42      The key potential water quality impacts would be associated with the proposed dredging and filling works required for the IMT construction (across the Victoria Habour) as well as the temporary reclamation within the CBTS as identified below.

Ÿ  Dredging works will disturb the marine bottom sediment, causing an increase in SS concentrations in the water column and forming sediment plume along the tidal flows.

Ÿ  Loss of fill materials into the water column during filling activities causing an increased SS level.

Ÿ  Release of sediment-bound contaminants such as heavy metals into the water column, either via suspension or by disturbance as a result of dredging.

Ÿ  Release of the same contaminants due to leakage and spillage as a result of poor handling and overflow from barges during dredging and transport.

Ÿ  Temporary embayments will be formed between the partially reclaimed land as the temporary reclamation within the CBTS proceeds in stages.  Potential accumulation of pollutants from contaminated stormwater runoff (due to debris and oil / grease left on the ground, and organic matter from expedient connections) into the temporary embayments may increase the dissolved oxygen demand in the slack water, causing dissolved oxygen depletion and, in turn, potential odour impacts on the neighbouring sensitive receivers.

Construction of Temporary RHKYC Jetty within the CBTS

11.43      Minor piling works would be required for construction of the temporary jetty within the CBTS. Release of sediment and wastewater generated from the pilling works would potentially increase the SS concentrations in the water column, if not well controlled.  The associated water quality impact and mitigation measures in relation to the construction of the temporary jetty are separately addressed in the EIA for SCL Protection Works at CBTS.

Underwater Blasting along the IMT Across the Victoria Harbour

11.44      The provisional underwater blasting works will have mitigation measures to avoid loss of fines and release of contaminants into the marine waters from the bottom sediments around the blasting areas.

Shek O Casting Basin for Off-site Construction

11.45      Construction of the Shek O Casting Basin would involve installation of gates at the gate frames of the existing quarry which would not result in any adverse water quality impact.

11.46      Activities relating to the flooding and emptying of the casting basin for the removal of the formed tunnel units would have the potential to impact on water quality.  Water in the basin may be contaminated with particulates from cement and concrete which could affect pH.  Suspended solids in the flooded basin may be expected to be elevated above the background.  Wash-down, oil, grease, and concrete curing waters are also potential contaminants. Mitigation and control measures are required to minimize the water quality impacts.

11.47      After completion of all the IMT fabrication and construction works, the Shek O site will be reinstated to the layout originally planned under the Rehabilitation of Shek O Quarry project. No marine works would be involved in the proposed reinstatement work and hence no adverse water quality impact would be expected. 

General Construction Activities

11.48      The land-based construction works could have the potential to cause water pollution.  Various types of construction activities may generate wastewater.  These include general cleaning and polishing, wheel washing and dust suppression.  These types of wastewater would contain high concentrations of SS.  Impacts could also result from the sewage effluent from the construction work force involved with the construction.  If uncontrolled, these effluents could lead to deterioration in water quality.

Construction Site Run-off

11.49      Construction site run-off would cause potential water quality impacts.    Potential pollution sources of site run-off may include:

Ÿ  Run-off and erosion of exposed bare soil and earth, drainage channel, earth working area and stockpiles.

Ÿ  Release of any bentonite slurries, concrete washings and other grouting materials with construction run-off, storm water or wastewater from dewatering process.

Ÿ  Wash water from dust suppression sprays and wheel washing facilities.

Ÿ  Fuel, oil and lubricants from maintenance of construction vehicles and equipment.

11.50      During rainstorms, site run-off would wash away the soil particles on unpaved lands and areas with the topsoil exposed.  The run-off is generally characterized by high concentrations of SS.  Release of uncontrolled site run-off would increase the SS levels and turbidity in the nearby water environment. Site run-off may also wash away contaminated soil particles and therefore cause water pollution.

11.51      Wind blown dust would be generated from exposed soil surfaces in the works areas.  It is possible that wind blown dust would fall directly onto the nearby water bodies when a strong wind occurs.  Dispersion of dust within the works areas may increase the SS levels in surface run-off causing a potential impact to the nearby sensitive receivers. 

Accidental Spillage

11.52      A large variety of chemicals may be used during construction activities.  These chemicals may include petroleum products, surplus adhesives, spent lubrication oil, grease and mineral oil, spent acid and alkaline solutions/solvent and other chemicals.  Accidental spillage of chemicals in the works areas may contaminate the surface soils.  The contaminated soil particles may be washed away by construction site run-off or stormwater drainage which in turn causes water pollution.

Excavation Activities

11.53      The construction of the Project involves excavation of soil materials for the cut and cover railway alignment, and ventilation building / ventilation shafts.  Excavated materials may have to be stored on-site before being sorted, reused or transported to disposal sites.  If stored as open air stockpiles with no cover during rainfall, excavated materials would have a potential risk to be washed away and thereby causing sudden increase of SS and oxygen demand in the receiving water.

Disposal of Waste

11.54      Construction and demolition (C&D) material as well as excavated material from the construction works would be required to send offsite for recycling or disposal. In case if these materials are dumped at inappropriate location or without proper precautionary measures, water quality impact may arise. Measures for proper disposal of C&D material as well as excavated material generated from the Project have been discussed in detail in Section 12. The destinations of the different kinds of waste generated in the Project construction have been listed in Table 12.8.

11.55     Surplus inert C&D materials generated from the Project may be delivered to two Public Fill Reception Facilities operated by CEDD which are Tuen Mun Area 38 Fill Bank and Tseung Kwan O Area 137 Fill Bank.  The Project Proponent should be responsible for obtaining confirmation and approval from Public Fill Committee (PFC) on the allocation of the disposal site before commencement of the Project works. Construction work should not proceed until all issues on management of C&D materials have been resolved and all relevant arrangements have been endorsed by relevant authorities including PFC and EPD.

11.56     The contractor for the excavation / dredging works shall apply for the site allocations of marine sediment disposal based on the prior agreement with MFC/CEDD. The Project proponent should also be responsible for the application of all necessary permits from relevant authorities, including the dumping permit as required under DASO from EPD, for the disposal of dredged and excavated sediment prior to the commencement of the excavation works.

11.57     No water quality concern would be expected from the disposal of waste provided that the mitigation measures as recommended in Section 12 are properly implemented.

Groundwater Seepage from Uncontaminated Area

11.58      During excavation works, groundwater would be required to be pumped out from works areas in case seepage of groundwater occurs.  Groundwater pumped out or from dewatering activities as a potential source of site run-off may wash away construction site and therefore would cause potential water quality impacts by increasing the SS levels and turbidity in the nearby water environment.

Groundwater from Contaminated Area

11.59      Groundwater pumped out or from dewatering process during excavation works in any contaminated sites could be potentially contaminated.  Discharge / recharge of potentially contaminated groundwater generated from these areas may affect the surface / ground water quality, if uncontrolled.

Identification of Potential Operational Phase Impact

Potential Impact on Water Quality

11.60      Major water quality impacts from the Project operation include:

Ÿ  Run-off and foul water discharges from railway tunnels;

Ÿ  Sewage and wastewater effluents from stations and ventilation building; and

Ÿ  Station / building run-off.

11.61      No seawater cooling system is proposed under the Project.

Run-off and Foul Water Discharges from Railway Tunnels

11.62      The proposed railway alignment would be placed in underground tunnel. During rainstorm, water falls from the train when it enters to the tunnel may generate tunnel run-off. The amount of groundwater seepage into the tunnel may also generate tunnel run-off.  Such run-off may contain limited amount of lubricants, SS, iron, oil and grease. Sources of foul water discharges from the railway tunnel would include the tunnel track wash and fire protection water discharges. Direct discharge of tunnel run-off and railway foul water discharges may cause adverse water quality impact on nearby water environment.

Sewage and Wastewater Effluents from Stations and Ventilation Building

11.63      Sources of sewage and wastewater that will be generated from the stations and ventilation building would include the toilet sanitary wastewater, fire protection water discharges, floor cleaning / washed water and floor drainage and mechanical equipment wastewater. Direct discharge of these sewage and wastewater discharges may cause adverse water quality impact on nearby water environment.

Station and Ventilation Building Run-off

11.64      The stations and ventilation building would be enclosed and therefore run-off will be limited to wash-off from the outside of the stations and ventilation building.  Sources of potential polluted stormwater that may arise from the station and ventilation building run-off include dust from the roof of the buildings and cleaning agents used for washing building facade.

Potential Impact on Flow Regime or Hydrology

11.65      There would be some changes in the seabed levels along the tunnel section within Victoria Harbour after the Project completion, which could have potential impact on the flow regime / hydrology and the associated water quality in Victoria Harbour. 

Assessment Methodology

Marine Construction

11.66      Construction of the tunnel section of the SCL (HUH-ADM) across the Victoria Harbour would involve dredging and temporary reclamations within the CBTS.  The tentative construction programme for this Project is given in Appendix 3.4.  Temporary reclamation within the CBTS for SCL (HUH-ADM) tunnel construction is tentatively scheduled to commence in 2015 for completion in 2018, while the temporary reclamation for the SCL Protection Works and dredging at southeast corner of the CBTS for additional space for temporary relocation of anchorage (which will be constructed by CWB) would be carried out from 2012 to 2013.  The IMT construction across the Victoria Harbour channel is tentatively scheduled to be undertaken within the period from 2014 to 2017. The key water quality impact from the IMT construction would be associated with the bulk dredging and bulk filling activities in the open harbour, which would commence in 2016 for completion in 2017.

Temporary Reclamation within CBTS

Construction Method

11.67      Construction of the SCL (HUH-ADM) tunnel within the CBTS will have works interfaces with the construction of the CWB tunnel.  Temporary reclamation would be adopted for the tunnel construction works within the CBTS as well as a short section immediately outside the CBTS breakwater.  The proposed construction method adopts an approach where dredging and temporary seawall construction will be first conducted to enclose each phase of the temporary reclamation.  Installation of diaphragm wall on temporary reclamation as well as any bulk filling will proceed behind the completed seawall.  Any gaps that may need to be provided for marine access will be shielded by silt curtains to control sediment plume dispersion away from the site.  Demolition of temporary reclamation including the demolition of the diaphragm wall and dredging to the existing seabed levels will also be carried out behind the temporary seawall.  Temporary seawall will be removed after completion of all excavation and dredging works for demolition of the temporary reclamation.  Therefore, the sediment plume can be effectively contained within the temporary reclamation area.  Demolition of temporary seawall will involve removal of rock fill and seawall blocks only, which would not create significant SS impact.  Fines content in the filling materials for seawall construction would be negligible and loss of fill material during seawall construction is therefore not expected.  Thus, potential water quality impact of SS will only arise during the dredging work before completion of the temporary seawall.

11.68      It should be noted that temporary mooring areas would be proposed inside the existing CBTS and Pubic Cargo Working Area (PCWA) under the current construction scheme.  Therefore, the temporary breakwater originally proposed under the approved EIA for WDII and CWB for temporary moorings outside the CBTS breakwater will not be implemented under the currently adopted scheme.  Dredging of marine mud would be required at the southeast corner of the CBTS to provide additional space for temporary relocation of anchorage area due to the Protection Works (which is addressed to be environmentally acceptable in the separate EIA for SCL Protection Works at CBTS).

Phasing and Sequence

11.69      The construction for SCL and CWB within the CBTS would be undertaken in 13 phases, namely TS1, TS4, TS4 Ext., PW1.1, PW1.2, PW1.3, PW1.4, TS2, TS3(W), TS3(E), SCL2, SCL3.1 and SCL3.2 respectively, as shown in Plate 1 below.  Staging of the temporary reclamation works is shown indicatively in Appendix 11.2, which aims only to illustrate the general reclamation sequence within the CBTS. It should be noted that PW1.1, PW1.2, PW1.3 and PW1.4 would be constructed under the SCL Protection works and their associated environmental impact has been fully assessed in the separate EIA for SCL Protection Works at CBTS.

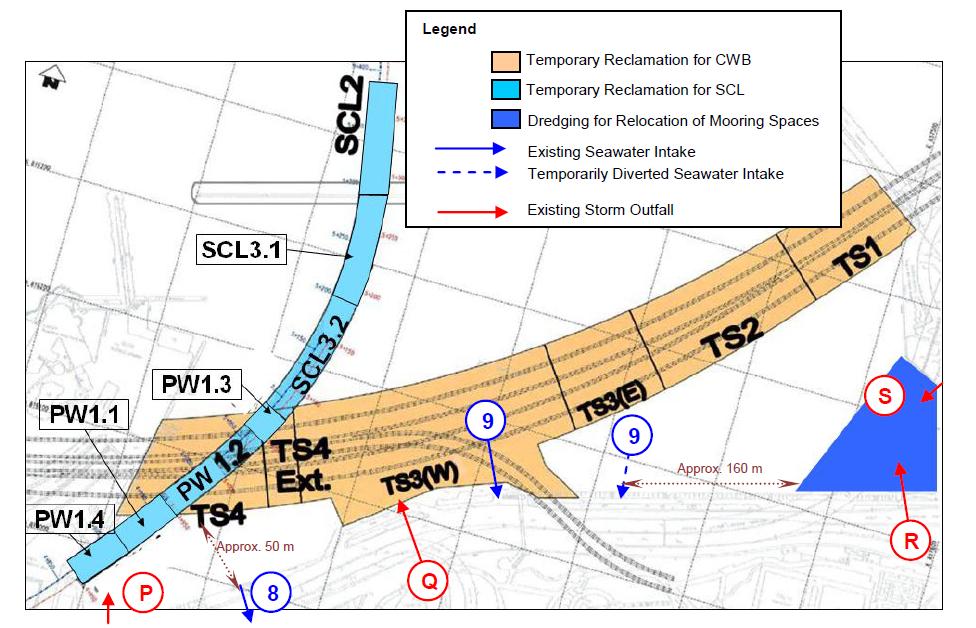
Plate 1. Temporary Reclamation Scheme

11.70      Dredging for TS1 and TS4 will be undertaken tentatively in 2010. Dredging for TS4 Ext., PW1.1, PW1.3 and PW1.4 as well as dredging for relocation of mooring space will commence tentatively in 2012 and will be undertaken after the dredging works for TS1 and TS4 are completed.  Construction of PW1.2 will be undertaken within the seawall of TS4 and hence no seawall construction would be required under PW1.2.

11.71      Dredging and construction of temporary seawall for TS2 will also commence tentatively in 2012, potentially concurrent with the construction works for TS4 Ext., PW1.1, PW1.3 and PW1.4. Demolition of TS1 will proceed before commencement of TS2, TS4 Ext., PW1.1, PW1.3 and PW1.4. The whole TS1 will be removed before commencement of TS2, TS4 Ext., PW1.1 to 1.4.  Hence, dredging at TS2, TS4 Ext., PW1.1, PW1.3 and PW1.4 would potentially take place when the seawall of TS4 is in place. On the other hand, dredging at southeast corner for relocation of mooring space is tentatively scheduled for carrying out in early 2012 before commencement of TS2, TS4 Ext., PW1.1, PW1.3 and PW1.4 and would be potentially undertaken when the seawalls of both TS1 and TS4 are in place (with no other concurrent dredging work inside the CBTS).  In case dredging at the southeast corner of CBTS for relocation of mooring space and dredging for TS2, TS4 Ext., PW1.1, PW1.3 and PW1.4 are required to work concurrently within the CBTS during the actual implementation of the Project, the potential cumulative water quality impact would be controlled by limiting the total combined dredging rate within the CBTS as discussed in detail under Sections 11.80, 11.83 and 11.91.

11.72      Dredging for TS3(E) is tentatively scheduled for commencement in the first quarter of 2014 when only PW1.4 is in place. TS4, TS2, TS4 Ext. and PW1.1 to 1.3 will be completely removed before commencement of TS3(E). Therefore, water body behind temporary reclamation area will not be fully enclosed, which minimize water quality impacts.

11.73      Dredging and seawall construction for TS3(W) would commence tentatively in the second quarter of 2014. Dredging for TS3(W) would be carried out when TS3(E) and PW1.4 are in place. Dredging and seawall construction for SCL2 would tentatively take place in 2015 when PW1.4 and TS3(W) are in place.  TS3(E) would be completely removed before commencement of SCL2. Dredging for SCL2 would be undertaken immediately outside the existing breakwater of CBTS.  Dredging for SCL3.1 would tentatively commence in the first quarter of 2016 when PW1.4, SCL2 and TS3(W) are in place.

11.74      Dredging and seawall construction for SCL3.2 would tentatively commence in the first quarter of 2017 after the temporary reclamations for PW1.4, SCL2 and TS3(W) are completely removed. 

11.75      Dredging within the CBTS will be carried out at a maximum rate of 6,000 m3 per day and no more than two closed grab dredgers would be operated for the dredging works at any one time within the CBTS.  Dredging for SCL2 will be undertaken outside the CBTS and are separately addressed in Section 11.92.

11.76      There are two existing cooling water intakes (namely Intakes 8 and 9 respectively as shown in Figure No. NEX2213/C/331/ENS/M59/002) and four existing storm outfalls (namely Culverts P, Q, R and S respectively as shown in Figure No. NEX2213/C/331/ENS/M59/004) located in the CBTS.  As shown in Plate 1 above, the storm outfall (Culvert Q) and the cooling water intake for Windsor House (Intake 9) are located in the area of TS3(W).  Before the seawall construction at TS3(W) is completed, the cooling water intake will be diverted to the adjacent area and the intake point would be slightly shifted to the east along the existing seawall outside the TS3(W) site to ensure continuous operation of the intake during the construction period (similar to the arrangement adopted under the approved WDII & CWB EIA).  Furthermore, the storm outfall (Culvert Q) will be temporarily diverted to the north of TS3(W) before the seawall of TS3(W) is completely constructed.  No temporary diversion will be implemented for Intake 8 as well as Culverts P, R and S.

Impacts from Sediment Plume upon the Water Quality inside the CBTS

11.77      There is no biological sensitive receiver within the CBTS and there are no areas of conservation value, ecological importance or mariculture activities in the vicinity.  The closest water sensitive receivers to the temporary reclamation works would be the cooling water intakes for Excelsior Hotel and World Trade Centre (namely Intake 8) and Windsor House (namely Intake 9) as shown in Plate 1 and Figure No. NEX2213/C/331/ENS/M59/002.  No SS criterion was available for these cooling water intakes (refer Section 11.17). 

11.78      The dredging work along the southern seawall of TS4, PW1.1 and PW1.4 would be closest to Intake 8. The dredging work along the seawall of TS3(W) and TS3(E) (which are non-SCL activities) as well as the dredging for relocation of mooring space would be closest to Intake 9.  Hence, these dredging activities would be most critical in terms of the water quality impact upon the cooling water intakes.  The remaining dredging works would be further away from the cooling water intakes and the associated water quality impacts are considered less significant.  Following the recommendations provided in the approved EIA for WDII and CWB, the following water quality mitigation measures are recommended for seawall constructions inside the CBTS due to their close proximity to the cooling water intakes:

Ÿ  Temporary seawall should be partially constructed to protect the nearby seawater intakes from further dredging activities.  For example, the seawalls along the southeast and southwestern boundaries of PW1.1 and PW1.4 should be constructed first (above high water mark) so that the seawater intake at the inner water would be protected from the impacts from the remaining dredging activities along the northwest boundary;

Ÿ  Dredging should be carried out by closed grab dredger to minimize release of sediment and other contaminants during dredging;

Ÿ  Silt curtains should be deployed to fully enclose the closed grab dredger during any dredging operation, i.e. all dredging works proposed inside the CBTS (including those within the boundary of PW1.1 to PW1.4, SCL2, SCL 3.1, SCL 3.2, TS1, TS4, TS4 Ext., TS2, TS3(W) and TS3(E) for temporary reclamation and at southeast corner of the CBTS for relocation of mooring space) as indicated in Plate 1 would be carried out with the deployment of silt curtain;

Ÿ  Silt screens will be installed at the cooling water intakes within the CBTS during the temporary reclamation period;

Ÿ  Site audit and water quality monitoring should be carried out at the seawater intakes during the marine works.

11.79      In addition, no more than two dredgers (of about 8 m3 capacity each) would be operated for dredging within the typhoon shelter at any time.  The total dredging rate of no more than 6,000 m3 per day will be maintained within the CBTS throughout the construction period. Works for the SCL that will likely have interfacing issues with the CWB construction within the CBTS (including PW1.1 to PW1.4 as well as dredging at the southeast corner of the CBTS for relocation of mooring space) will be carried out by the same contractor of the CWB project. Hence, TS1, TS2, TS4, TS4 Ext, PW1.1 to 1.4 and dredging for relocation of mooring space will be carried out under the same contract to ensure that the maximum dredging rate within the CBTS would not exceed the required limit of 6,000 m3 per day.  SCL2, SCL 3.1 and SCL3.2 are scheduled to be carried out after all the proposed dredging works for CWB within the CBTS are fully completed.

11.80      One modelling scenario was proposed under the separate EIA Study for SCL Protection Works at CBTS to assess the water quality impact during the seawall dredging along PW1.1 within the CBTS.  This scenario assumed that dredging along the southern seawall of PW1.1 would take place after the formation of TS4 and TS1, and hence, a temporary embayment would be formed at the southwest corner of the CBTS where Intake 8 is located. Based on the tentative programme, TS1 would already be removed when dredging at PW1.1 is carrying out.  TS1 was however assumed to be in place under the modelling exercise, which would be a conservative assumption in terms of the flushing impact at CBTS. Under this scenario, dredging will be carried out within this temporary embayment at the maximum dredging rate of 6,000m3 per day, which would be the worst case in terms of the tidal circulation at the southwest corner of the CBTS and potential impact upon Intake 8.  Impact from dredging along the seawall of TS4 would be less critical as the dredging work would be conducted before formation of any temporary seawall within the CBTS which would result in a better tidal flushing.  Water quality impact from seawall dredging at TS4 (before formation of any temporary reclamation within the CBTS) had been fully assessed under the approved EIA for WDII and CWB to be acceptable.  Impact from dredging at TS4 Ext. would also be less critical and the dredging work would be undertaken in a more open area with better flushing and dispersion capacity. Details of this assessment scenario and model result are presented in the separate EIA Report for SCL Protection Works at CBTS which showed that the marine construction works would not result in adverse water quality impact in the CBTS as well as the open harbour.

11.81      Impact during the seawall dredging work for the remaining dredging phases (i.e. PW1.3, SCL2, SCL3.1 and SCL3.2) would be less critical as the dredging locations would be further away from the cooling water intakes than PW1.1.  In particular, impact upon cooling water intakes during the dredging for SCL2 would be shielded by the breakwater of CBTS.  In addition, the pollution loading from Culvert Q was significantly larger than that from the other storm outfalls within the CBTS (based on the field survey results available from the approved WDII & CWB EIA) and this culvert would be diverted to the north of TS3(W) during the dredging work at SCL2.  Thus, less pollutant will be discharged into the temporary embayments where the seawater intakes are located, which would reduce the background SS level at the intake points. Therefore, no significant adverse impact would be expected from the seawall dredging at SCL2, SCL 3.1 and SCL3.2.

11.82      The dredging scenario assessed under the EIA for SCL Protection Works at CBTS is assumed to be undertaken at a maximum rate of 6000 m3 per day using two closed grab dredgers.  It is assumed that both dredgers would be operated at a location closest to Intake 8 for worst case assessment.  It was also assumed that silt curtains would be deployed around the dredging operation and silt screens would be installed at the cooling water intakes within the CBTS to minimize the potential impact.   

11.83      Dredging of marine mud at the southeast corner of CBTS for relocation of mooring space is tentatively scheduled to be undertaken in 2012. The total dredging rate within the CBTS shall not exceed 6,000m3 per day at any time as recommended in Table 11.24. As discussed under the separate EIA for SCL Protection Works at CBTS, dredging is assumed to be undertaken at PW1.1 at the maximum dredging rate of 6,000m3 per day inside the temporary embayment close to Intake 8, which would represent a worst case in terms of the potential impact upon the seawater intakes due to the dredging activities for SCL within the CBTS. As the distance between the dredging area for relocation of mooring space and the nearest seawater intake point would be greater than the distance between PW1.1 and the nearest intake point assumed under the EIA for SCL Protection Works at CBTS (see Plate 1 under Section 11.69), dredging for relocation of mooring space would not be worse than dredging at PW1.1 assumed under the EIA for SCL Protection Works at CBTS in terms of the potential impact upon the intake points.  In case dredging at the southeast corner of CBTS for relocation of mooring space and dredging at PW1.1 to PW1.4 are required to work concurrently within the CBTS, the total maximum dredging rate of 6,000m3 per day as stipulated in Table 11.24 would still be maintained within the CBTS, i.e. the combined production rate for the dredging work at TS1, TS4, TS4 Ext., PW1.1 to PW1.4, TS2, TS3(W), TS3(E), SCL2, SCL3.1 and SCL3.2 (for tunnel construction) and the dredging work at the southeast corner of CBTS (for relocation of mooring space) would not exceed 6,000m3 per day.

11.84      As the CBTS is a nearly enclosed marine embayment, the sediment plume generated from the dredging work for temporary reclamation is expected to be mainly confined within the CBTS and would not contribute any significant cumulative impact with other concurrent activities in the open harbour as demonstrated from the model results available from the approved EIA for WDII and CWB. Dredging for SCL2 will be undertaken outside the CBTS and are separately addressed in Section 11.92.

Water Quality in Temporary Embayments within the CBTS

11.85      Because of the relatively low flushing capacity, the interim construction phase water quality of the temporary embayments at the existing CBTS is of particular concern. However, there is no biological sensitive receiver within the CBTS and there are no areas of conservation value, ecological importance or mariculture activities in the vicinity.  The only water sensitive receivers inside the CBTS would be the cooling water intakes (namely Intakes 8 and 9) with no water quality (e.g. suspended solids) requirements.  Therefore, the key concern would be the accumulation of pollutants discharged from the polluted storm culverts within any temporary embayment formed from the temporary reclamations, potentially causing an increase in the dissolved oxygen (DO) demand and, in turn, potential DO depletion and odour impacts.

11.86      In 2013 (i.e. when TS2, TS4, TS4 Ext. and PW1.1 to 1.4 will be in place simultaneously) would be the worst-case scenario in terms of the water quality impact, considering that these land formations would create a temporary embayment at the southwest corner of the CBTS inside which a storm outfall, namely Culvert P, and a cooling water intake, namely Intake 8, are located close to each other.  Potential water quality impact associated with the accumulation of pollutants discharged from the storm culverts into the temporary embayment was modelled under the approved WDII & CWB EIA for one interim construction scenario (namely Scenario 3C).  This scenario assumed that TS4, TS4 Ext, TS2 and TS3(E) as well as a temporary typhoon shelter (including a temporary breakwater and piled wave wall) outside the existing CBTS (the temporary typhoon shelter has been deleted from the scope of CWB project, see remarks in the figure below) would be in place at the same time, which represented a very worse case in terms of the water circulation in CBTS as shown in the figure below.


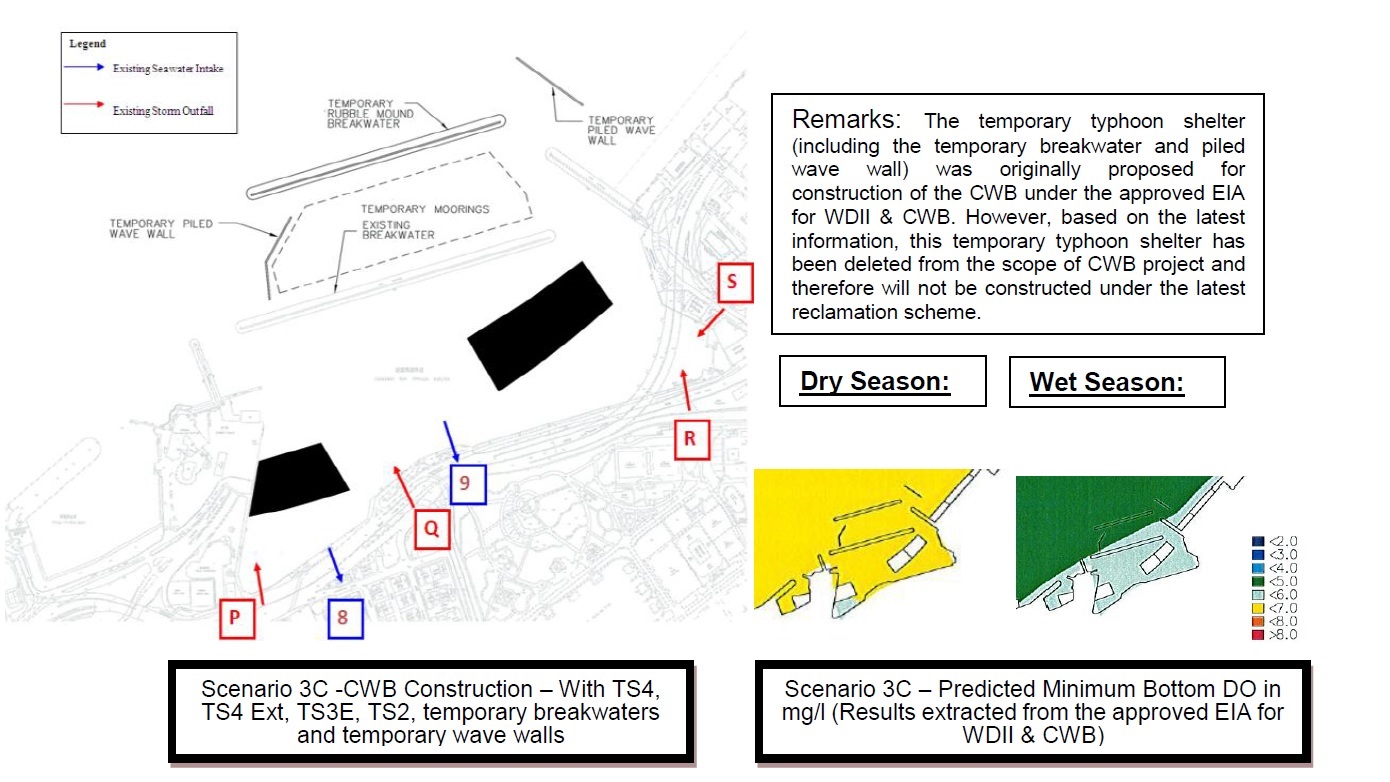
11.87      As shown by EPD’s routine marine water quality monitoring data, the existing DO levels measured in the CBTS fully comply with the WQO and potential DO depletion inside the CBTS is not a concern.  The model results available from the approved EIA for WDII and CWB also indicated that the DO levels would not be significantly depleted inside the embayments formed by the temporary reclamations. The predicted minimum DO levels were all > 5 mg/L (see figure above) which means full compliance with the WQOs. 

11.88      As compared to Scenario 3C simulated under the approved WDII & CWB EIA, changes in the land configuration in 2012 proposed under the latest reclamation scheme would involve a relatively small amount of additional temporary land for PW1.1, PW1.3 and PW1.4, which could slightly reduce the flushing capacity in the CBTS, but on the other hand, the temporary breakwaters and wave walls assumed under the approved EIA will not be implemented under the current scheme (better flushing effect would be achieved in the CBTS with no temporary breakwaters and wave walls).  Also, TS3(E) assumed under Scenario 3C of the approved EIA would not be in place during 2013 under the current reclamation sequence. The proposed changes in land configurations under the current reclamation scheme are considered minor in terms on their overall impact on the flushing capacity in the CBTS and would unlikely affect the conclusion of the model results available from the approved WDII & CWB EIA for the interim construction scenario.   A water quality monitoring and audit programme will be implemented during the construction phase to avoid aggravation of odour nuisance from seawater arising from temporary reclamation in the CBTS. In case the temporary reclamation work for the Project is found during the water quality monitoring and audit programme to cause unacceptable oxygen depletion (e.g.  DO level <2 mg/L) in the CBTS, additional water quality improvement measures (e.g. use of aeration method to improve the DO levels in the marine embayment) will be considered and implemented in the CBTS as necessary to rectify the problems. Details of the water quality monitoring and audit programme including the Event and Action Plan are provided in the standalone EM&A Manual for this Project.

11.89      Another worst case scenario would occur in 2016 when PW1.4, SCL2, SCL3.1 and TS3(W) will be in place at the same time.  This scenario is however considered less critical as Culvert Q (with the largest pollution loading amongst the other outfalls) will be temporarily diverted to the north of TS3(W) before the seawall of TS3(W) is completely constructed.  Thus, less pollutant will be discharged into the temporary embayments where the cooling intakes are located.  In addition, this temporary land configuration would create two openings close to the storm outfalls (Culverts P, R and S).  Thus, more water circulation at the storm outfalls would be expected under this scenario when compared to the early reclamation stage.    

11.90      SCL3.1 and SCL3.2 (which would be potentially in place in 2017) will be less critical as their configurations will allow more open waters flushing near the storm culverts and they will be carried out in phase to minimize the pollution loads to the nearby waters.  Also, TS3(W) and TS3(E) will be completely removed before commencement of SCL3.2 and the associated pollutant dispersion effects would not be worse than that under Scenario 3C (see figure above). Hence the potential concern on DO depletion is not expected.  Therefore, no significant water quality impact will be created from the SCL works.

Dredging for Relocation of Mooring Space within CBTS

11.91      Dredging would be undertaken at the eastern part of the CBTS tentatively in 2012 for relocation of mooring space. The proposed dredging extent is shown in Plate 1 under Section 11.69. The total dredging rate within the CBTS shall not exceed 6,000m3 per day at any time. In case dredging at the southeast corner of CBTS for relocation of mooring space and dredging for SCL and CWB tunnel construction are required to work concurrently within the CBTS, the total maximum dredging rate of 6,000m3 per day would still be maintained within the CBTS (refer to Section 11.82).  Silt curtain would be installed around the dredging operation to minimize the release of sediments. As previously mentioned, the closest water sensitive receivers to the proposed works would be the cooling water intakes for Excelsior Hotel and World Trade Centre (namely Intake 8) and Windsor House (namely Intake 9) as shown in Plate 1 above. The sediment plume modelling scenario assessed under the separate EIA Study for SCL Protection Works at CBTS already represented the worst case in terms of the potential water quality impact within the CBTS assuming a maximum dredging rate of 6000m3 per day. The sediment source assumed under that EIA was located near PW1.1, which is approximately 50m away from Intake 8 (see Plate 1 above) and both the source point and the intake point would be located in a temporary embayment with low flushing capacity. This considered being a highly conservative assumption since the dredger would not ever be stationary at the same location close to the intake point.  It should be noted that the nearest distance of Intake 8 from PW1.1 (i.e. 50m) as shown in Plate 1 above has already taken account of the maximum temporary reclamation extent proposed for the tunnel construction at CBTS. On the other hand, dredging for relocation of mooring space at the eastern part of CBTS would result in the same total effective sediment loss rate but the sediment source would be further away from the nearest cooling water intake (i.e. Intake 9), see Plate 1 above. Therefore, the water quality impacts upon Intake 9 due to the dredging work for relocation of mooring space would not be worse than that upon Intake 8 due to the dredging works for PW1.1.  Hence, no additional modelling scenario is necessary for dredging at the southeast corner of the CBTS for relocation of mooring space. Similarly, the concurrent dredging for TS2 (which is not SCL activity) would be carried out at a more open marine environment while the minimum distance from the closest WSR (Intake 9) is about 65m. Given that the maximum dredging rate within the CBTS will be maintained at 6,000 m3 per day, the assumed modelling scenario in the EIA for SCL Protection Works at CBTS would already represent the worst case water quality impact and therefore no additional modelling scenario will be required for assessing the dredging for relocation of mooring space in CBTS. No unacceptable water quality impact was predicted due to the dredging for mooring space in CBTS in the EIA for SCL Protection Works at CBTS.

Dredging for SCL2 and IMT Construction in Open Harbour

11.92      The key water quality impact from the IMT construction would be associated with the bulk dredging and bulk filling activities in the open harbour, which would be conducted in the period from 2016 to 2017. The proposed IMT alignment would run across the open harbour from the HUH side to an area just outside the existing CBTS breakwater. Dredging for SCL2 (refer to Plate 1 under Section 11.69) will also be undertaken outside the CBTS in the open harbour and would potentially take place in 2015. The key water quality impact for the Project would be the proposed dredging and filling activities in the open harbour area with cumulative impacts from other possible concurrent marine works. 

11.93      Bulk dredging along the IMT alignment would be undertaken as the first stage.  Laying of the tunnel segment would be carried out in the subsequent stage.  Bulk filling along the IMT alignment would be conducted after laying of the tunnel segment is completed. As the proposed IMT tunnel construction would be relatively large in scale, it was assumed that laying of the tunnel segment could be conducted together with the bulk filling operation.  Based on the tentative construction programme, bulk filling along the IMT tunnel alignment would be carried out after all the bulk dredging works are completed.  Hence, bulk dredging and bulk filling along the IMT alignment would not occur at the same time.  Bulk dredging is considered more critical activity as it would potentially release sediment-bound contaminants and is therefore assumed for water quality modelling purpose.

11.94      The dredging works in the open harbour were assumed (under the unmitigated scenario) to be conducted at a maximum production rate of about 6,667 m3 per day.  It should be highlighted that exceedances of the WSD water quality (SS) criterion at the flushing water intakes were predicted under the unmitigated scenario.  Based on the modelling results, reduction of the maximum production rate for the dredging works in open harbour to 2,500 m3 per day would be required to minimize the water quality impact upon the flushing water intakes under the mitigated scenario (refer to Section 11.210).  That is, the total dredging rate for construction of the IMT and SCL2 in open harbour should not exceed 2,500 m3 per day.  Only one closed grab dredger would be used for the dredging works in the open harbour at any one time for construction of the IMT and SCL2. The typical bucket size of the grab of the dredgers for dredging in the open harbour would be about 18 m3.  It was considered that the bulk filling rate for IMT construction should not be larger than the maximum allowable dredging rate (which is 2,500 m3 per day under the mitigated scenario as stated in Section 11.210) estimated from the modelling exercise.

11.95      Any potential blasting work, if required, would be undertaken after completion of the dredging works required for the IMT construction.  The marine sediments at or near the blasting area would be removed prior to the blasting work.  Activities associated with the underwater blasting works include the preparation of drilling holes within which the charges are placed and firing the charges.  Fragment rock will then be removed by grab dredger. The diameter of the resulting materials will be large and as such no off-site migration of fines is expected.

Consideration of Possible Water Quality Mitigation Measures

11.96      Silt curtains should not be used in areas where current speeds are high, as the effectiveness of the silt curtains will be reduced in areas of high current speeds.  Thus, silt curtains are considered less effective to mitigate the SS impacts in the middle of the Victoria Harbour channel or in areas close to the fairway.

11.97      Deployment of floating type silt curtain would be practical for dredging and sand filling operations within the embayed area or in near shore region near the coastline where the water currents would be relatively small.  The northern section of the IMT tunnel would be constructed in close proximity to the cooling water intakes along the Hung Hom landfall (refer to Figure No. NEX2213/C/331/ENS/M59/003) but these cooling water intakes are considered to have high SS tolerance. Nevertheless, the bulk dredging and sand filling work at the northern tunnel segment (close to the Hung Hom landfall) would be undertaken in sequence rather than operated concurrently to minimize the dredging impact. Following the approach of temporary reclamation inside the CBTS which would also be conducted close to the cooling water intakes, it is recommended that installation of floating type or frame type silt curtain around the closed grab dredger and deployment of silt screen at the nearby cooling water intakes should be implemented for construction of the IMT segment in the near shore region (e.g. within 200m from the Hung Hom landfall) to minimize the potential water quality impacts. Deployment of floating type silt curtain in the offshore waters near the fairway would be less effective and therefore only the frame type silt curtain would be recommended for the dredging works in the offshore waters near the fairway. In view that the implementation of silt curtain around the closed grab dredgers would reduce the dispersion of SS and implementation of silt screen at the intake could further reduce the SS level at the intake, no significant overall water quality impacts would be expected from the IMT construction in the near shore region or close to the Hung Hom landfall.

11.98      The following precautionary / mitigation measures will be adopted to minimize the potential water quality impacts from the underwater blasting work, if required:

Ÿ  Charge will be placed in cores within the rock in order that there will be no blast directly into the water. The shock wave pressures will be reduced as much as possible;

Ÿ  In terms of the construction sequence, sediment dredging (within the planned IMT works area) will be conducted prior to underwater blasting. Entrainment of suspended solids can then be minimized during the underwater blasting.

Other Possible Concurrent Projects

11.99      With reference to the EIA Study Brief, the assessment area shall include the Victoria Harbour Water Control Zone (WCZ), the Eastern Buffer WCZ and the Western Buffer WCZ as declared under the Water Pollution Control Ordinance (WPCO), and any areas within a distance of 300m from the Project boundary and from any works sites.  Other possible concurrent dredging and filling activities within the assessment area such as those for the construction of the proposed WDII & CWB and the Kai Tak Development (KTD) as well as the Installation of Submarine Gas Pipelines from Ma Tau Kok to North Point for Former Kai Tak Airport Development (New Submarine Gas Main) have been considered in the water quality assessment.

Wan Chai Development Phase II (WDII) and Central-Wan Chai Bypass (CWB)

11.100   Based on the latest design information available from the project “WDII – Design and Construction for Trunk Road Tunnel Option under SA2 to Agreement No. CE 54/2001” and the project “Design & Construction of CWB / IEC Link under SA3 to Agreement No. CE8/95”, the proposed marine construction works for WDII and CWB will involve:

Ÿ  Permanent reclamation at Hong Kong Convention and Exhibition Centre (HKCEC)

Ÿ  Permanent reclamation at Wan Chai (WCR)

Ÿ  Permanent reclamation at North Point (NPR)

Ÿ  Temporary reclamation at Public Cargo Working Area (TPCWA) and Causeway Bay (TCBR) for construction of the CWB tunnel

Ÿ  Construction of new cross-harbour water mains from Wan Chai to Tsim Sha Tsui

Ÿ  Construction of Wan Chai East submarine sewage outfall

Ÿ  The odour mitigation works at the south-western corner of CBTS

11.101   The following measures have been implemented in the design of reclamation phasing to ensure the continuous operation of the existing waterfront facilities and, simultaneously, to minimize the impacts on water quality:

Ÿ  a number of small and confined areas of land formation are planned;

Ÿ  containment of fill within each of these confined areas by seawalls is proposed, with the seawall constructed first (above high water mark) with filling carried out behind the completed seawalls.  Any gaps that may need to be provided for marine access will be shielded by silt curtains to control sediment plume dispersion away from the site.  Filling should be carried out behind the silt curtain.

11.102   Therefore, potential water quality impact of SS would only arise during the dredging for seawall foundation.  There will be a total of five main reclamation shoreline zones, namely HKCEC, WCR, NPR, TPCWA and TCBR respectively.  Each of these reclamation shoreline zones, except for the TCBR, is subdivided into different stages as indicated in Table 11.8 below.  The TCBR for construction of the CWB tunnel inside the CBTS would be combined with the SCL tunnel construction as detailed in Sections 11.67 to 11.98 and Table 11.24 above and is therefore not further described in this section.  Within the same reclamation zone, seawall dredging will be performed in sequence instead of operating concurrently.  Thus, dredging along the seawall will be undertaken for only one stage at a time to minimize the potential water quality impacts within each reclamation zone.  The indicative programme for seawall dredging works at different stages of the WDII and CWB construction are also provided in Table 11.8 below.  The layout of different reclamation stages for HKCEC, WCR and NPR as well as the locations of the proposed water mains and sewage outfall would follow those presented in Figure 2.7 of the approved WDII & CWB EIA[4]. Layout of the revised temporary reclamation scheme inside CBTS is indicatively presented in Plate 1 above.

11.103   Dredging will be carried out by closed grab dredger for the following works:

Ÿ  Seawall construction in all the reclamation shoreline zones (HKCEC, WCR, NPR, TPCWA)

Ÿ  Construction of the proposed water mains

Ÿ  Construction of the proposed sewage outfall

11.104   Deployment of silt curtains around the closed grab dredgers to contain SS within the construction site during seawall dredging and seawall trench filling is recommended for the areas of HKCEC, WCR and NPR.  Based on the water quality modelling and assessment result, deployment of silt curtains is considered not necessary for the dredging works at TPCWA.

11.105   The maximum dredging rates recommended for different marine works zones are given in Table 11.8.  The dredging rate and mitigation measures recommended for the TCBR are detailed in Sections 11.67 to 11.98 and are therefore not repeated in this section.  It should be noted that the dredging rates listed in Table 11.8 have not considered the effect of silt curtains as recommended for HKCEC, WCR and NPR. The dredging work for Wan Chai Reclamation and HKCEC reclamation under the WDII Project would be potentially concurrent with the dredging work proposed for the SCL Protection works and the associated cumulative water quality impact has been fully assessed under the separate EIA for SCL Protection Works at CBTS. The temporary reclamation works in CBTS for construction of the CWB and SCL, as discussed in Sections 11.67 to 11.98, would potentially be concurrent with the IMT construction proposed under this Project and hence would be included in Scenario 1 of this water quality modeling to assess their cumulative water quality impact.

Table 11.8     Tentative Programme and Recommended Maximum Dredging Rates for WDII and CWB

Reclamation Zone

Tentative Programme

Maximum Dredging Rate

m3 per day

m3 per hour

m3 per week

Dredging along seawall or breakwater

North Point Reclamation (NPR) Shoreline Zone

NPR Stage 1

2010

6,000

375

42,000

NPR Stage 2 West

2010

6,000

375

42,000

NPR Stage 2 East

2011

6,000

375

42,000

Temporary Public Cargo Working Area (TPCWA) Reclamation Shoreline Zone

TPWCA East

2010

5,000

313

35,000

TPWCA West

2013

5,000

313

35,000

Wan Chai Reclamation (WCR) Shoreline Zone

WCR Stage 1 See Note (3)

2010

1,500

94

10,500

WCR Stage 2

2012

6,000

375

42,000

WCR Stage 3

2013

1,500

94

10,500

WCR Stage 4

2013

6,000

375

42,000

Hong Kong Convention and Exhibition Centre (HKCEC) Shoreline Zone

HKCEC Stage 1

2010

1,500

94

10,500

HKCEC Stage 2

2012

6,000

375

42,000

HKCEC Stage 3

2012

1,500

94

10,500

Dredging along pipelines

Cross Harbour Water Mains

2010 –2011

1,500

94

10,500

Wan Chai East Submarine Sewage Pipeline

2010

1,500

94

10,500

Note:

1.        Dredging to be carried out by closed grab dredger (16 hours per day).

2.        Silt curtains to be deployed around seawall dredging and seawall trench filling in NPR, WCR and HKCEC areas.

3.        Reduced dredging rates of 1,500 m3 per day are applicable to construction of the western seawall of WCR Stage 1 which is close to the WSD Wan Chai intake.  For construction of the remaining seawalls of WCR Stage 1, the maximum dredging rate of 6,000 m3 per day will be applied.

Dredging Works for Proposed Cruise Terminal at Kai Tak (CT Dredging)

11.106   Development of the proposed Kai Tak Cruise Terminal would require dredging at the existing seawall at the southern tip of the former Kai Tak Airport runway for construction of a berth structure for two berths, and dredging the seabed fronting the new berth structure to provide necessary manoeuvring basin. It is planned to implement the Kai Tak Cruise Terminal in two phases.  Based on the latest information, Phase I Berth for the initial phase is scheduled for operation by 2013.  Phase II Berth for the longer term is currently scheduled for operation after 2015.  Dredging required for operation of the Phase I Berth (i.e. Stage 1 dredging) has commenced in June 2010 and is tentatively scheduled for completion in mid 2013.  The programme for Stage 2 dredging is unconfirmed at this stage but its completion can be extended up to 2020 and the earliest possible time for the Stage 2 dredging would be 2013 to 2014 after the Stage 1 dredging and decommissioning and removal of the existing submarine gas pipelines currently located to the west of the former Kai Tak Airport runway within the required manoeuvring space and the dredging zone of the Phase II Berth.  Indicative location of the CT dredging and the existing submarine gas main are shown in Figure No. NEX2213/C/331/ENS/M59/006.

11.107   The maximum dredging rate recommended during the Stage 1 dredging period would be 8,000 m3 per day (including the dredging of 4,000 m3 per day at or near the seawall for berth construction using 2 closed grab dredgers plus the dredging of 4,000 m3 per day in the manoeuvring area for the Phase I Berth using another 2 closed grab dredgers).  During the Stage 2 dredging period, 2 closed grab dredgers will be in operation simultaneously with a maximum production rate of 4,000 m3 per day.  Silt curtains would be deployed around the two closed grab dredgers used for dredging at or near the existing seawall of the former Kai Tak Airport runway for construction of the cruise berth only. There would be overlaying construction period for the SCL Protection Works and the CT dredging (Stage 1). The cumulative water quality impact from the CT dredging (Stage 1) has been assessed in the separate EIA for SCL Protection Works at CBTS. As the programme for CT dredging (Stage 2) is not yet confirmed and thus may potentially be concurrent with the SCL bulk dredging for IMT construction, the CT dredging (Stage 2) would be included in Scenario 1 of this water quality assessment.

Public Landing Steps cum Fireboat Berth under the KTD Project

11.108   A section of the existing seawall at the former Kai Tak Airport runway will need to be re-constructed for the proposed public landing steps cum fireboat berth under the Kai Tak Development.  Seawall reconstruction would involve excavation and dredging at and near the existing seawall of the runway.  Based on the latest information available from the KTD project, dredging at and near the seawall area will be carried out in November 2010 for completion in August 2011 (before commencement of the dredging works for SCL) at a maximum production rate of 1,000m3 per day.  Indicative location of the proposed public landing steps cum fireboat berth is provided in Figure No. NEX2213/C/331/ENS/M59/006. The marine construction for Public Landing Steps cum Fireboat Berth would have already been finished before the commencement of the marine dredging works proposed under the SCL, and would not contribute any cumulative marine water quality impact with the SCL Project and is therefore not considered for water quality modelling under the separate EIA for SCL Protection Works at CBTS and this EIA.

Runway Opening under the KTD Project

11.109   Opening a 600m wide gap at the northern section of the former Kai Tak Airport runway was proposed under the KTD as a potential mitigation measure to improve the water circulation and water quality in Kai Tak Approach Channel (KTAC).  The opening would be covered by a piled deck.  Indicative location of the proposed runway opening is shown in Figure No. NEX2213/C/331/ENS/M59/006.

11.110   Demolition of existing runway will involve excavation of bulk fill and dredging to -5mPD.  The proposed construction method adopts an approach where the existing seawall at the runway will not be removed until completion of all excavation and dredging works for demolition of the runway.  Thus, excavation of bulk fill and majority of the dredging works will be carried out behind the existing seawall, and the sediment plume can be effectively contained within the works area.  Demolition of existing seawall will involve removal of gravel only, which would not create significant SS impact.  Fines content in the filling materials in the seawall would be negligible and loss of fill material during seawall demolition is not expected.

11.111   As there is likely some accumulation of sediments alongside the runway, there will be a need to dredge the existing seabed after completion of all the demolition works.  Thus, potential water quality impact of SS will arise from the dredging on either side of the 600m opening.  Based on the latest information, dredging alongside the 600m opening will be carried out at a maximum production rate of 2,000m3 per day using one closed grab dredger.

11.112   Based on the latest information, removal of existing seawalls and dredging at the 600m runway opening is tentatively scheduled to commence in early 2014.  Localized dredging would also need to be undertaken on either side of the 600m opening. Localized dredging on the side fronting Kowloon Bay is tentatively scheduled to be undertaken in 2014 combining with the construction of the runway opening.  Localized dredging of the remediated sediments along the runway opening within the KTAC is tentatively scheduled to commence in the third quarter of 2011 for completion in mid-2012, potentially concurrent with the SCL Protection Works within the CBTS.  However, the localized dredging at KATC would be small in scale and isolated within the KTAC embayment (enclosed by the breakwaters of Kwun Tong Typhoon Shelter) and would not contribute any significant cumulative water quality impact with the tunnel construction works within the CBTS which would also be enclosed by the breakwater of CBTS.  Hence the proposed localized dredging at KTAC would not be considered for water quality modelling under the separate EIA for SCL Protection Works at CBTS and this EIA. The dredging and filling for IMT construction proposed under this Project would be undertaken in the period from 2016 to 2017, which would not be concurrent with any localized dredging work proposed under the KTD project. The proposed runway opening is more than 2 km away from the alignment of the SCL. The approved EIA for KTD indicated that the runway opening to be implemented under the KTD would not change the overall flow regime in the central Victoria Harbour including the CBTS area.  Hence, the hydrodynamic effect of the runway opening would not be included in the sediment plume modelling work for the separate EIA for SCL Protection Works at CBTS and this EIA study.

Disused Fuel Dolphin under the KTD Project

11.113   There is a disused fuel dolphin at inner Kowloon Bay (enclosed by the breakwaters of To Kwa Wan Typoon Shelter) that would be decommissioned in the future.  The fuel dolphin structure and its connecting fuel pipelines are considered as part of the fuelling facilities of the former Kai Tak Airport and hence the possible water quality impacts arising from the decommissioning of these facilities have been reviewed under the EIA Study for Decommissioning of the Former Kai Tak Airport other than the North Apron.  No dredging would be required for the demolition / decommissioning works and hence this decommissioning work would not be considered for water quality modelling under the separate EIA for SCL Protection Works at CBTS and this EIA.

Installation of Submarine Gas Pipelines from Ma Tau Kok to North Point for Former Kai Tak Airport Development (New Submarine Gas Main)

11.114   Twin 400mm diameter steel submarine gas pipelines are currently aligned 235m west of and parallel to the former Kai Tak Airport runway as indicated in Figure No. NEX2213/C/331/ENS/M59/006.  The pipelines serve as a strategic gas supply to Hong Kong Island and is covered under an existing wayleave agreement.  They run between a gas offtake and pigging station at Ma Tau Kok (MTK) and a gas pigging station at Quarry Bay.  As mentioned before, the existing pipeline is located within the manoeuvring space and the dredging zone of the Phase II Berth for the proposed cruise terminal at Kai Tak.  Hence, the pipeline would need to be reprovisioned before dredging can commence for the Phase II cruise berth.

11.115   The dredging associated with removal of the existing submarine gas mains will be incorporated into the Stage 2 works of the CT Dredging (refer to Sections 11.106 and 11.107) and the earliest possible time for the Stage 2 dredging would be 2013 to 2014.  Based on the latest information, dredging of seabed for construction of the New Submarine Gas Main would be conducted in 2012 at a maximum rate of 4,000m3 per day.  The construction of the New Submarine Gas Main is a designated project and the cumulative environmental impacts associated with the gas main construction will be examined in detail under separate EIA study. The marine construction works for New Submarine Gas Main would potentially be concurrent with the SCL Protection Works and its cumulative effect on water quality has been included in the separate EIA for SCL Protection Works at CBTS. The marine construction works for New Submarine Gas Main would not be concurrent with the IMT construction under this Project thus would not be included in this water quality assessment.

Road T2 and Central Kowloon Route (CKR)

11.116   It should be noted that the Central Kowloon Route (CKR) and Road T2 will join up to provide an east-west road link across Kowloon, from Tseung Kwan O in the east to West Kowloon in the west.  Road T2 includes an immersed tube section from Cha Kwo Ling to the South Apron area of the former airport.  The road is then at-grade connecting to the CKR near the north end of the former runway.  The CKR then enters a short section of immersed tube in inner Kowloon Bay before entering a tunnel beneath To Kwa Wan.  Both the immersed tube sections of Road T2 and CKR will require dredging.  The indicative locations of CKR and Road T2 are shown in Figure No. NEX2213/C/331/ENS/M59/006.

11.117   In view that the section of CKR alignment is small, it is assumed that dredging and backfilling would be conducted in sequence rather than occurring at the same time.  Based on the latest information obtained from Highways Department, the expected construction period for CKR would be 2015 to 2020, which could be concurrent with the tunnel construction works within the CBTS as well as the IMT dredging and filling work in open harbour proposed under the SCL. In view of the potential contamination of sediment in the Kowloon Bay area, it is considered that the CKR dredging should be carried out in a careful and controlled manner.  The maximum production rate of 1,000m3 per day would be adopted based on the latest information. The CKR project is a designated project and the cumulative environmental impacts associated with the CKR will be examined in detail under separate EIA study. As the construction of CKR would potentially be concurrent with both the marine construction for SCL Protection Works as well as the IMT construction under this Project, the cumulative water quality impact from CKR has been included in the separate EIA of SCL Protection Works at CBTS as well as in this water quality modelling exercise.

11.118   The dredging and filling activities for construction of Road T2 would be at a larger scale. Road T2 is still under planning and EIA stage and its construction is expected to be carried out in the period from 2012 to 2016, which could be concurrent with the tunnel construction work for SCL within the CBTS as well as the SCL IMT construction in the open harbour.  Based on the latest information, construction of the Road T2 would require marine dredging and filling for construction of IMT and temporary reclamation inside and immediately outside the breakwater of Kwun Tong Typhoon Shelter (KTTS) where dredging could be conducted at a maximum rate of 8,000m3 per day (using four grab dredgers) at the same time when sand filling is conducted at a maximum rate of 4,000m3 per day (using another four grab dredgers). Dredging and filling for temporary reclamation for construction of the Road T2 would be conducted in 2012 to 2013, potentially concurrent with the dredging works proposed under SCL Protection Works.  Construction of the IMT proposed under the Road T2 would be carried out in the period from 2013 to 2015 before commencement of the bulk dredging and filling proposed under the SCL IMT construction in open harbour. Removal of the existing breakwater of KTTS and subsequent reinstatement need to be allowed for construction of Road T2. The plant used for removing and reinstating the breakwater would be similar to the plant used for dredging marine sediments.  The material being dredged from the breakwaters will be largely rockfill which will have low fines content and therefore much less water quality impact than dredging of the adjacent muds.  Sand filling would be carried out at rate of 2,000 m3/day for reinstatement of breakwater of KTTS in the first quarter of 2016, potentially concurrent with the SCL IMT construction in open harbour. The Road T2 project is also a designated project and the cumulative environmental impacts associated with the Road T2 will be examined in detail under separate EIA study. The cumulative water quality impact from Road T2 has been included in the separate EIA for SCL Protection Works at CBTS since the construction of temporary reclamation for Road T2 would be concurrent with the SCL Protection Works. The cumulative water quality impact from the proposed sand filling works for reinstatement of the KTTS breakwater under the Road T2 project would also be included in Scenario 1 of this water quality assessment as these filling works would be potentially concurrent with the IMT dredging proposed under this Project.

Dredging at Kwai Tsing Container Basin (KTCB) and its Approach Channel

11.119   The objective of the Project is to carry out necessary dredging work in KTCB and portions of Western Fairway and Northern Fairway.  However, as the proposed dredging in KTCB is located more than 8 km away from the Project site outside the Victoria Harbour channel, the associated cumulative water quality effects from this dredging work is considered insignificant.  The proposed dredging in KTCB is therefore not considered in this EIA as well as the separate EIA for SCL Protection Works at CBTS.  The proposed dredging work is a designated project and the cumulative environmental impacts associated with this dredging work have been examined in detail under a separate EIA study.

Laying of Western Cross Harbour Water Mains and Associated Land Mains (Western Harbour Main)

11.120   A new cross-harbour water main would be constructed to provide security of water supply from West Kowloon to Sai Ying Pun.  The associated dredging works would be conducted at a maximum dredging rate of 4,000m3 per day. Frame-type silt curtains would be deployed to enclose the dredging and filling operation. According to the latest information, construction of the water main has been started since early 2010 and would last for about 2 years.  It is possible that the dredging and filling work involves in the construction of Western Harbour Mains would be concurrent with the tunnel construction works proposed under the SCL within the CBTS. The indicative location of the Western Cross Harbour Main is shown in Figure No. NEX2213/C/331/ENS/M59/006. The marine works under Western Harbour Mains would potentially be concurrent with the SCL Protection Works and its cumulative water quality effect has been considered in the separate EIA for SCL Protection Works at CBTS. The construction of the Western Harbour Main would not be concurrent with the remaining marine works proposed under the SCL and is therefore not included in the water quality modelling under this EIA.

Lei Yue Mun Waterfront Enhancement

11.121   A new landing facility will be built at Lei Yue Mun under this water enhancement project.  Construction of the landing facility would require dredging off the landing area and construction of a new breakwater.  Based on the modelling results provided in the Preliminary Environmental Review Report for this waterfront enhancement project, the operation of the proposed landing facility and breakwater would not change the overall flow regime in the Victoria Harbour.  With regard to the dredging impact during the construction phase, the mixing zone for SS elevation was predicted to be highly localized around the works site (within about 100 m) at both dry and wet seasons.  The proposed waterfront enhancement works would not cause any cumulative water quality impact with the dredging works for SCL, considering that the waterfront enhancement works are located at least 4km away from the SCL alignment. Thus the marine construction works proposed under the waterfront enhancement project would not be considered for water quality modelling under this EIA and the separate EIA for SCL Protection Works at CBTS.

Container Terminal 10

11.122   Based on the Project Profile for Container Terminal No. 10 (CT10), the preliminary feasibility study for CT10 would commence in early 2009 for completion in late 2011.  Hence, the design information for CT10 including the implementation programme, reclamation layout, construction design and methods (e.g.  the production rate for dredging activities) is currently unconfirmed. In addition, the CT10 would be located outside the harbour channel and far away (more than 8 km) from the SCL alignment.  The cumulative water quality impact from the CT10 construction is considered to be minor.  Therefore, the CT10 reclamation will not be considered in the sediment plume modeling under this EIA and the separate EIA for SCL Protection Works at CBTS.

Other Concurrent Projects

11.123   It should be noted that no dredging activity is anticipated for the Harbour Area Treatment Scheme (HATS) Stage 2A.  All the marine activities for Central Reclamation Phase III (CRIII) will be completed before construction of the SCL tunnel section across Victoria Harbour.

Sediment Plume Modelling Scenario

11.124   As identified in Sections 11.77 to 11.82, the worst case sediment plume impact upon the local water quality within the CBTS would occur during the dredging for tunnel construction at PW1.1.  Based on the tentative construction programme for concurrent projects as identified above, dredging at PW1.1 would potentially occur in 2012 together with the CT Dredging (Stage 1), construction of the trunk Road T2, Central Kowloon Route (CKR), New Submarine Gas Main and Western Harbour Main as well as the dredging for Wan Chai Reclamation and HKCEC Reclamation under the WDII project.  The worst-case cumulative water quality impact due to the tunnel construction at PW1.1 has been fully addressed under a separate EIA study.  Details of the associated water quality impact and mitigation measures are provided in the EIA Report for SCL Protection Works at CBTS.

11.125   This sediment plume modelling exercise aimed to assess the cumulative water quality impact from the dredging work for SCL (HUH-ADM) in the open harbour (including the construction of IMT and SCL2).  The open dredging work immediately outside the breakwater of CBTS for SCL2 (refer to Plate 1 under Section 11.69) would potentially occur in 2015 and therefore would not be concurrent with the bulk dredging  works for IMT construction proposed under this Project  which is scheduled for commencement in 2016. However, dredging for tunnel construction inside the breakwater of CBTS for SCL and CWB would be tentatively carried out in the period from 2010 to 2017, potentially concurrent with the IMT construction in the open harbour and thus included in this modelling exercise. The programme for other concurrent marine works have been reviewed including Western Habour Main (2010-2012), dredging for WDII (2010 – 2013), CT Dredging (Stage 1) (2010 – 2013), CT Dredging (Stage 2) (programme unconfirmed), New Submarine Gas Main (2012), Public Landing Step (2010-2011), Runway Opening - localized dredging on the side fronting Kowloon Bay (2014), Road T2 (2012 – 2016) and CKR (2015 – 2020). Based on the tentative programme, most of the concurrent dredging / filling works in the open Victoria Harbour would be completed before commencement of the IMT and SCL2 construction for SCL (HUH-ADM), except the marine works of CKR and Road T2.  In addition, the CT Dredging is also included in this sediment plume modelling exercise for conservative assessment as the programme for CT Dredging (Stage 2) is still unconfirmed (refer to Section 11.106).

Scenario 1

11.126   Hence, Scenario 1 assumes that the following marine works will take place concurrently with the construction of IMT / SCL2 for SCL (HUH-ADM) in open harbour.

Ÿ  Dredging for tunnel construction within the CBTS (dredging is assumed at TS3(W) which is a worst case upon Intake 9, refer to Section 11.77)

Ÿ  CT Dredging (Stage 2) under the KTD project

Ÿ  Dredging for CKR

Ÿ  Sand filling for Road T2

Scenario 2

11.127   Scenario 2 is basically the same as Scenario 1 which aimed to assess the water quality impact from the dredging / IMT construction for SCL in the open harbour but assuming that there would be no other concurrent marine works in the Victoria Harbour.  Scenario 1 (as discussed above) has included other concurrent projects. Scenario 2 is therefore to assess the potential water quality impacts from the dredging work in Victoria Harbour for SCL2 / IMT construction under the SCL project alone, in case the actual programme for other concurrent projects is outside the SCL2 / IMT construction period.

Locations of Sediment Spill Sources

Construction of SCL2 and IMT Construction in the open Victoria Harbour outside the CBTS under the Project

11.128   For construction of the SCL2 and IMT tunnel in the open Victoria Harbour, no more than one closed grab dredger is assumed to be working simultaneously for the dredging activity. Dredging for SCL2 in the open harbour will not be scheduled to concurrent with the dredging for IMT construction.  For the purpose of modelling, alternative dredging locations have been considered to cover the tunnel alignment in the open harbour (outside the breakwater of CBTS).  They are:

Ÿ  Case 1: One closed grab dredger (namely A1 as shown in Figure No. NEX2213/C/331/ENS/M59/006 and Figure No. NEX2213/C/331/ENS/M59/007) working close to the Kowloon side; and

Ÿ  Case 2: One closed grab dredger (namely A2 as shown in Figure No. NEX2213/C/331/ENS/M59/006 and Figure No. NEX2213/C/331/ENS/M59/007) working close to the Hong Kong Island.

11.129   The assumed spill location for Case 1 would be close to the water intakes along the Hung Hom landfall.  Similarly, the assumed spill location for Case 2 would be close to the water intakes located along the coastline of Hong Kong Island.  The selected spill locations (Case 1 and Case 2) are considered appropriate to represent a reasonable worst-case for the overall water quality impact.

Dredging Works for Proposed Cruise Terminal at Kai Tak (CT Dredging) Stage 2

11.130   Two spill locations (namely A11 and A12 respectively as shown in Figure No. NEX2213/C/331/ENS/M59/006) are assumed under Scenario 1 for Stage 2 dredging works with reference to the approved EIA for CT Dredging.  Alternative spill locations within the proposed dredging area have been assessed under the approved EIA for CT Dredging and the assessment results indicated that no significant difference in the predicted SS levels was found between the alternative scenarios. 

Dredging for Tunnel Construction within the CBTS under the CWB Project

11.131   One sediment source (namely A13) for CWB is included in Scenario 1 to represent the dredging works along the seawalls of TS3(W). Dredging at TS3(W) is assumed for cumulative assessment to address the worst-case water quality upon the cooling water intake (namely Intake 9) within the CBTS. The corresponding source location is given in Figure No. NEX2213/C/331/ENS/M59/006.

Dredging for CKR

11.132   One spill source (namely A15 as shown in Figure No. NEX2213/C/331/ENS/M59/006) is assumed to be located at the inner Kowloon Bay to represent the dredging work for CKR construction.

Sand filling for Road T2

11.133   One spill source (namely A7 as shown in Figure No. NEX2213/C/331/ENS/M59/006) is assumed to be located close to the Kwun Tong Typhoon Shelter to represent the sand filling work for reinstatement of breakwater of Kwun Tong Typhoon Shelter.

Sediment Loss Rates

11.134   Sediment loss rates for the SCL2 / IMT dredging in the open harbour were estimated based on the assumptions listed below:

Ÿ  The dry density of harbour mud is 1,600 kg/m3, based on the results of geotechnical site investigation conducted under the WDII and CWB project;

Ÿ  Spill loss during mud dredging by closed grab dredger will be continuous, 16 hours a day, 6 days per week;

Ÿ  With respect to rate of sediment loss during dredging, the Contaminated Spoil Management Study ([5]) (Mott MacDonald, 1991, Table 6.12) reviewed relevant literature and concluded that losses from closed grab dredgers were estimated at 11 – 20 kg/m3 of mud removed.  Taking the upper figure of 20 kg/m3 to be conservative, the loss rate in kg/s was calculated based on the daily volume rate of dredging.  (Assuming a dry density for marine mud of 1,600 kg/m3, the sediment loss during dredging is equivalent to a spill amount of approximately 1.25%);

Ÿ  Spillage of mud dredged by closed grab dredgers is assumed to take place uniformly over the water column;

Ÿ  Dredging of contaminated and uncontaminated mud will be carried out at the same rate.

11.135   The calculated sediment loss rates for Scenario 1 and Scenario 2 are shown in Table 11.9 and Table 11.10 respectively.  The corresponding source locations are indicated in Figure No. NEX2213/C/331/ENS/M59/006 and NEX2213/C/331/ENS/M59/007.  The loss rates shown in Table 11.9 for Road T2, CKR as well as the dredging work within the CBTS are the reduced loss rates which have considered the effect of silt curtains. No deployment of silt curtain was assumed for the CT dredging (Stage 2) based on the approved EIA for CT Dredging. On the other hand, deployment of silt curtains has not been considered for the SCL2/ IMT dredging in the open harbour in calculating the sediment loss rates which would provide conservative predictions.  It is assumed that reduction of production rate for IMT dredging as well as the dredging work for SCL2 would be considered if the water quality impacts are found to be unacceptable.

Table 11.9     Maximum Dredging / Filling Rates – Scenario 1 (Unmitigated Scenario for SCL IMT Construction)

Concurrent Source ID

(See Figure No. NEX2213/C/331/ENS/M59/006)

Activity

Approximate Duration

Production Rate

(m3 per day)

Sediment Loss Rate (kgžs-1)

Dredging for construction of IMT and SCL2 in open Victoria Harbour outside the CBTS under the Project

Alternative dredging locations: either A1 or A2

A1 or A2: Dredging  (1 closed grab dredger of 18 m3 capacity)

1 year

6,667

2.31

Dredging Works for Proposed Cruise Terminal at Kai Tak (CT Dredging) Stage 2

A11

Based on the information available in the approved EIA for CT Dredging

0.93

A12

0.93

Dredging for Tunnel Construction within the CBTS under the CWB Project

A13 (at CBTS)

Based on the information available in the approved EIA for WDII & CWB

0.52

Dredging for CKR

A15

Based on the information available from the CKR project (See Note B)

0.12

Sand Filling for Road T2

A7

Based on the information available from the Road T2 project (See Note C)

0.19

Note A The assumed sediment loss rates for Source ID A13 and A15 are the reduced loss rate (75% reduction assumed) after considering the effect from deployment of silt curtain. No silt curtain is assumed to be deployed for Source ID A1 / A2, A11 and A12.

Note B  Based on latest information from the CKR project, the dredging rate for CKR would be 1000 m3 per day with deployment of silt curtain.  The calculated sediment loss rate presented in this table is however based on a production rate of 2000 m3 per day with deployment of silt curtain (75% reduction in sediment loss rate assumed), which is a conservative approach.

Note C  Based on latest information from the Road T2 project, the sand filling rate for reinstatement of the breakwater of Kwun Tong Typhoon Shelter under the Road T2 would be undertaken at a production rate of 2000 m3 per day with deployment of silt curtain (75% reduction in sediment loss rate assumed).

Table 11.10   Maximum Dredging / Filling Rates – Scenario 2 (Unmitigated Scenario for SCL IMT Construction)

Concurrent Source ID

(See Figure No. NEX2213/C/331/ENS/M59/007)

Activity

Approximate Duration

Production Rate

(m3 per day)

Sediment Loss Rate (kgžs-1)

Dredging for construction of IMT and SCL2 in open Victoria Harbour outside the CBTS under the SCL Project

Alternative dredging locations: either A1 or A2

A1 or A2: Dredging  (1 closed grab dredger of 18 m3 capacity)

1 year

6,667

2.31

Model Coverage Area and Grid Schematization

11.136   Computer modelling is used to assess the potential impacts on water quality in Victoria Harbour associated with the construction of the SCL (HUH-ADM) within the harbour.  The Delft3D suite of models, developed by Delft Hydraulics, are used as the modelling platforms.  No initial dilution modelling is performed for the purpose of this water quality assessment.

11.137   The Delft3D Victoria Harbour (VH) model is used as the basis for hydrodynamic and water quality modelling.  The VH model was extensively calibrated and fully verified by comparing computational results with field measurements.  The grid mesh of the VH model has a high resolution (approximately 50m x 50m) at CBTS and (approximately 75m x 75m) at Central Victoria Harbour.  The performance of the VH model was checked and confirmed to be satisfactory.

11.138   The coverage and grid layout of the VH model are shown in Figures C1a and C1b of Appendix 11.3.  The grid quality at the area near the SCL alignment is presented in Figures C2 and C3 of Appendix 11.3 for orthogonality and smoothness.  The coverage and resolution of this VH model are considered adequate for use under the present water quality assessment study.

11.139   The grid quality of the VH model is generally good except in some areas at or close to the land boundary and marine embayments.  The flow velocities at the closed grid cells along the land boundary are generally small.  The velocities at or near the land boundary along the coastlines would be less than 0.5 m/s at mid-flood/mid-ebb and less than 0.1 m/s at most of the times.  In view of the small velocity, numerical errors associated with the change of orthogonality and smoothness should be small.  Therefore, it is considered appropriate to adjust the grid line to represent the coastal features (rather than keeping these closed grid cells orthogonal or smooth).  Orthogonality and smoothness at open grid cells has been checked to be adequate.

Coastline Configurations

Within the Assessment Area

11.140   Based on the information on the planned developments from the EIA Reports registered under the EIAO, there would not be any major change in the coastline configuration in the Victoria Harbour WCZ.

11.141   Based on the latest information, seawall construction for most of the WDII reclamation stages will be completed in 2013.  The coastlines to be adopted under Scenario 1 and Scenario 2 will however include partially reclaimed lands (e.g. HKCEC Stage 1 and WCR Stage 1).  Model results from the approved WDII & CWB EIA indicated that the net effect of the WDII & CWB reclamations on the tidal flow in Victoria Harbour would be insignificant. Although the permanent reclamation after 2013 would involve some small changes to the coastlines of Wan Chai and North Point as compared to the coastline configurations assumed under Scenario 1 and Scenario 2, these changes are relatively small and is unlikely to have a major effect on the modelling results. 

11.142   It should be noted that the “no reclamation” scenario will be adopted for the Kai Tak Development (KTD) based on the approved EIA for KTD.  The proposed runway opening is more than 2 km away from the alignment of the SCL. The approved EIA for KTD indicated that the runway opening to be implemented under the KTD would not change the overall flow regime in the Victoria Harbour including the main harbour channel and CBTS area.  The modeling results available from the approved EIA for KTD also indicated that the 600 m opening would not cause any significant change in the extent of the sediment plume impact.  Hence, the hydrodynamic effect of the runway opening is excluded in the sediment plume modelling work for this EIA study.

11.143   The reclamation for Yau Tong Bay Reclamation (YTBR) is excluded as it is still subject to planning review.  The coastline configurations to be adopted in the modelling for Scenario 1 and Scenario 2 are indicated in Figure No. NEX2213/C/331/ENS/M59/006 and NEX2213/C/331/ENS/M59/007 respectively.

Outside the Assessment Area

11.144   For the hydrodynamic modelling of this EIA, a regional model was setup to cover the whole of Hong Kong and the Pearl Estuary.  The regional model is used to provide the boundary inputs to the - VH Model for the present study.  For the purpose of setting up the regional model properly, the coastline configurations for other planned reclamation projects located outside the assessment area as listed in Table 11.11 are also updated to mimic the envisaged conditions for the modelling year.  The coastline configurations assumed for Scenario 1 and Scenario 2, highlighting the incorporated coastal developments, are shown in Figure No. NEX2213/C/331/ENS/M59/008.

Table 11.11       Summary of Planned Coastal Developments Outside the Assessment Area

Coastal Developments to be included in the Update Model

Information Source

Sunny Bay Reclamation

EIA Report for “Northshore Lantau Development Feasibility Study” (Register No.: AEIAR-031/2000)

Tuen Mun - Chek Lap Kok Link (TMCLKL)

Project Profile for “Tuen Mun - Chek Lap Kok Link” (Study Brief No.  ESB-175/2007)

Further Development of Tseung Kwan O (FDTKO)

EIA Report for “Further Development of Tseung Kwan O Feasibility Study” (EIAO Register No.: AEIAR-092/2005)

Hong Kong – Zhuhai – Macao Bridge Hong Kong Boundary Crossing Facilities (HKZMB – HKBCF)

EIA Study Brief for “Hong Kong – Zhuhai – Macao Bridge Hong Kong Boundary Crossing Facilities” (EIAO Register No.: AEIAR-145/2009)

11.145   Site selection for the Integrated Waste Management Facilities (IWMF) is still unconfirmed and therefore will not be included in the modelling.  Under this modelling exercise, reclamations for Sunny Bay, TMCLKL and HKZMB–HKBCF are assumed to be fully completed whilst the FDTKO reclamation is assumed to be only partially completed.  It should be noted that the reclamations assumed in Table 11.11 above are all outside the boundary of the Victoria Harbour WCZ in the far field.  Possible change of coastline at these areas would unlikely affect the outcome of this water quality modelling.

Sediment Plume Modelling

11.146   Sediment plumes arising from the mud dredging and filling activities during the marine construction works are simulated using Delft3D-PART.  This model has been used for sediment plume modelling in a number of previous reclamation studies in Hong Kong including the approved CT Dredging EIA and WDII & CWB EIA.

11.147   The loss of fines to the water column during dredging and filling operations is represented by discrete particles in the model.  These discrete particles are transported by advection, due to the tidal flows determined from hydrodynamic simulation, and turbulent diffusion and dispersion, based on a random walk technique.  The refined VH Model is used to provide the hydrodynamic information for particle tracking.

11.148   The Delft3D-PART model takes into account the sedimentation process by means of a settling velocity, while erosion of bed sediment, causing resuspension of sediment, is governed by a function of the bed shear stress.  The parameters adopted in the present Study are summarized in Table 11.12.  Each construction Delft3D-PART scenario was simulated with three typical spring-neap tidal cycles for spin-up and one cycle for actual simulation in both dry and wet seasons following the approach adopted under the approved WDII & CWB EIA.

Table 11.12       Summary of Parameters for Sediment Plume Model (Delft3D-PART)

Sediment Plume Model Parameters

Horizontal Dispersion Coefficient DH

(m2žs-1)

a = 0.003

b = 0.4

DH = a t b,

Where t is the age of particle from the instant of discharge in seconds

Vertical Dispersion Coefficient DV

(m2žs-1)

5x10⁻³

1x10⁻⁵

Dry Season

Wet Season

Particle Settling Velocity

(mžs-1)

0.0001 (Constant)

Grain size diameter of 10 mm

Critical Shear Stress

(Pa)

0.05

0.15

Sedimentation

Erosion

Land-based Construction and Operation

11.149   The water sensitive receivers that may be affected by the land-based activities have been identified.  Potential sources of water quality impact that may arise during the land-based activities were described.  This task included identifying pollution sources that could affect the quality of surface water.  All the identified sources of potential water quality impact were then evaluated and their impact significance determined.  The need for mitigation measures to reduce any identified adverse impacts on water quality to acceptable levels was determined.

Potential Impact on Flow Regime or Hydrology during Operation Phase

11.150   There would be some changes in the seabed levels along the tunnel section within Victoria Harbour after the completion of the Project.  Appendix 6.1 compares the existing seabed level and the future design level of the IMT (i.e. at the top of IMT armour after the backfilling operation) along a typical section of the IMT alignment across the harbour. The seabed level above the existing Cross Harbour Tunnel (CHT) is also included in Appendix 6.1 for comparison. The locations of the existing CHT alignment, which lies alongside the SCL IMT alignment, and the existing Hung Hom Fairway are shown in Appendix 11.14. The Hung Hom Fairway is 370m wide and extends between SCL chainage 5950 and 6350 as shown in Appendix 11.14.

11.151   Hydrodynamic modelling was carried out under this Study to investigate the potential impact upon the tidal flushing due to the SCL IMT tunnel.  Two scenarios were simulated to evaluate the change in the tidal flushing during the operational phase:

Scenario A

l     Baseline Scenario without the proposed SCL IMT tunnel


Scenario B

l     Operation Scenario with the proposed SCL IMT tunnel

11.152   The background coastline configuration adopted for the operational phase modelling would be the same as that described in Sections 11.140 to 11.145, which incorporates all planned coastal developments within and outside the Victoria Harbour.  The Delft3D Victoria Harbour (VH) model as mentioned in Sections 11.136 to 11.139 is used as the basis for hydrodynamic modelling.  The model results for the baseline scenario (Scenario A) are compared with that for the operation scenario (Scenario B) to quantify the effect on the tidal flow through the Victoria Harbour.

Uncertainties in Assessment Methodology

11.153   Quantitative uncertainties in the modelling were considered when making an evaluation of the modelling predictions.  The following approach has been adopted to enhance the model performance:

Ÿ  The computational grid of the detailed Victoria Harbour (VH) Model was refined along the coastline of central Victoria harbour to represent the coastal features;

Ÿ  The performance of the detailed VH Model was checked against the results of a fully calibrated model adopted under the approved WDII & CWB EIA to ensure that reliable predictions of hydrodynamics are provided for the Study area;

Ÿ  The simulation comprises a sufficient spin up period so that the initial conditions do not affect the results.

11.154   It should be noted that all the predictions made in this water quality impact assessment were based on the latest available information and assumptions discussed in this section. If there are any major changes to the key assumptions during the actual implementation of the Project in the future, including those for the concurrent projects, the prediction and assessment findings presented in this EIA report should be reviewed accordingly.

Prediction and Evaluation of Environmental Impacts

Marine Construction

Suspended Solids

Seawater Intakes

11.155   Two sediment dispersion scenarios were modelled, as defined in Table 11.9 and Table 11.10 for Scenario 1 and Scenario 2 respectively.  Each construction scenario was simulated with three typical spring-neap tidal cycles for spin-up and one cycle for actual simulation in both dry and wet seasons.  The results for SS levels predicted at the water intakes for dry season and wet seasons, taken into account the background SS concentrations, are shown in Table 11.13 and Table 11.14.  The 90 percentile SS level predicted at the corresponding indicator points under the pre-construction scenario is used as the background SS concentrations for conservative predictions.

11.156   Absolute maximum and tidal-averaged SS concentrations predicted over a spring-neap cycle at the seawater intakes are presented in Table 11.13 and Table 11.14 below.  It should be noted that the SS levels presented in Table 11.13 and Table 11.14 represent the unmitigated scenario for the Project.  The SS levels predicted in Table 11.13 and Table 11.14, on the other hand, have incorporated the effects of mitigation measures recommended under the WDII & CWB , CKR, Road T2 and CT Dredging projects, including the deployment of silt curtains around the dredging / filling works in the near shore region and deploying silt screens at all the cooling water intakes located within the WDII & CWB works boundaries (namely 1, 2, 3, 4, 5, 6, 7, 8 and 9) as well as the WSD flushing water intakes close to the marine works (namely WSD7, WSD9, WSD10, WSD15, WSD17, WSD19 and A).  Locations of these seawater intakes are shown in Figure No. NEX2213/C/331/ENS/M59/001 to NEX2213/C/331/ENS/M59/003.  Scenario 2 has included the SCL works alone and has therefore excluded the mitigation measures recommended under other concurrent projects.

11.157   According to the Contaminated Spoil Management Study ([6]), the implementation of silt curtain around the closed grab dredgers would reduce the dispersion of SS by a factor of 4 (or about 75%).  Similarly, the implementation of silt screen at the intake would reduce the SS level by a factor of 2.5 (or about 60%), based on the values established under the Pak Shek Kok Reclamation, Public Dump EIA (1997). These SS reduction factors (75% for silt curtains and 60% for silt screens) have been adopted in a number of recent studies, including the approved WDII & CWB EIA, CT Dredging EIA as well as the Western Coast Road EIA study.

11.158   The results for Scenario 1 as shown in Table 11.13 indicate exceedances (highlighted in bold) of WSD water quality (SS) criterion at flushing water intakes although deployment of the abovementioned mitigation measures for the concurrent projects would be in place.  The results for Scenario 2 as shown in Table 11.14 also indicate exceedances (highlighted in bold) of WSD water quality (SS) criterion at flushing water intakes (due to this Project alone). Further mitigation measures as discussed in Sections 11.204 to 11.210 are therefore required to minimize the impact under Scenario 1 and Scenario 2.

Table 11.13   Predicted Suspended Solids Concentrations at Seawater Intakes for Scenario 1 – Unmitigated

WQ Sensitive Receivers (ID)

SS concentration (absolute value) in mid-depth (mg/l)

Criterion

Dry Season

Wet Season

Mean

Maximum

% time in

compliance

Mean

Maximum

% time in

compliance

Cooling Water Intakes

MTR Tsing Yi Station (C12)

< 40

6.00

8.68

100.00%

7.59

9.85

100.00%

Daily Farm Ice Plant (C22)

-

4.42

6.18

-

6.49

15.96

-

Pamela Youde Nethersole Eastern Hospital (C23)

-

3.99

4.40

-

5.62

7.39

-

Prince's Building Group (C29)

-

6.53

17.97

-

8.64

35.32

-

HSBC & AIG Tower (C30)

-

6.25

13.78

-

8.51

20.44

-

Queensway Government Offices (C31)

-

6.10

12.60

-

8.58

23.75

-

MTR New South Intake (C32)

< 40

6.43

16.80

100.00%

8.43

17.95

100.00%

Kai Tak DCS (C33)

-

4.42

4.57

-

6.82

9.57

-

Hong Kong Convention and Exhibition Centre Extension (Existing) (1) See Note (4)

-

2.18

4.45

-

3.02

7.69

-

Telecom House / HK Academy for Performing / Shui On Centre (Reprovisioned) (2) See Note (4)

-

2.01

3.95

-

3.03

6.80

-

Hong Kong Convention and Exhibition Centre Phase I (Reprovisioned) (3) See Note (4)

-

2.41

7.77

-

3.29

10.75

-

Wan Chai Tower / Revenue Tower / Immigration Tower (Reprovioned) (4) See Note (4)

-

2.39

5.79

-

3.16

8.11

-

Great Eagle Centre / China Resources Building (Reprovisioned) (5) See Note (4)

-

2.68

7.79

-

3.44

14.46

-

Sun Hung Kai Centre (Reprovisioned) & Proposed Exhibition Station (6&7) See Note (4)

-

2.06

4.84

-

3.33

10.27

-

Excelsior Hotel & World Trade Centre / No. 27-63 Paterson Street (8) See Note (4)

-

2.88

2.88

-

2.94

3.96

-

Windsor House (9) See Note (4)

-

3.00

3.56

-

3.59

10.69

-

City Garden (11)

-

4.94

12.54

-

7.10

32.23

-

Provident Centre (12)

-

5.58

19.47

-

8.01

52.97

-

MTR (Kowloon Station) (13)

< 40

5.73

18.95

100.00%

7.59

18.76

100.00%

China H.K. City (15)

-

5.32

9.73

-

7.27

13.07

-

Harbour City (16)

-

4.88

6.58

-

7.24

16.79

-

Ocean Centre (17)

-

4.87

5.36

-

7.09

12.81

-

Ocean Terminal (18)

-

5.35

10.19

-

7.60

15.22

-

Government Premises (19)

-

6.14

21.75

-

9.11

46.24

-

New World Centre (20)

-

6.81

33.73

-

10.45

44.19

-

East Rail Extension (21)

< 40

4.92

13.23

100.00%

7.15

17.53

100.00%

Metropolis (34)

-

4.65

8.01

-

6.85

21.94

-

Hong Kong Coliseum (35)

-

4.72

7.99

-

6.93

25.42

-

West Kowloon Terminus, MTR (B)

< 40

5.14

10.79

100.00%

7.16

12.48

100.00%

Saltwater Intakes

Kowloon South No. 2 (WSD7) See Note (4)

< 10

2.86

3.08

100.00%

2.86

3.57

100.00%

Tai Wan (WSD9) See Note (4)

< 10

1.92

5.07

100.00%

2.14

3.49

100.00%

Cha Kwo Ling (WSD10) See Note (4)

< 10

1.69

2.00

100.00%

2.12

2.94

100.00%

Tseng Kwan O (WSD12)

< 10

3.69

3.70

100.00%

5.36

6.70

100.00%

Siu Sai Wan (WSD13)

< 10

4.00

4.12

100.00%

5.61

7.17

100.00%

Sai Wan Ho (WSD15) See Note (4)

< 10

1.84

3.16

100.00%

2.68

5.11

100.00%

Quarry Bay (WSD17) See Note (4)

< 10

2.09

4.40

100.00%

2.93

11.67

99.72%

Sheung Wan (WSD19) See Note (4)

< 10

2.39

3.95

100.00%

3.02

4.72

100.00%

Kennedy Town (WSD20)

< 10

5.29

6.84

100.00%

7.14

7.39

100.00%

Wan Chai (Reprovisioned) (A) See Note (4)

< 10

2.08

4.84

100.00%

3.37

10.27

99.72%

Kowloon Station (14)

< 10

5.79

15.97

94.20%

7.54

19.89

95.86%

Notes:

1.        The water quality modelling results for 90 percentile SS predicted under the pre-construction scenario at the corresponding indicator points is adopted as the ambient SS levels.

2.        Other seawater intakes that are not shown in this table were found not be impacted by the proposed marine works for SCL (HUH-ADM).

3.        Bold and shaded number indicates exceedance of criterion.

4.        The SS levels predicted at this specific intake has incorporated the effect from deployment of silt screen around the intake as recommended under the approved EIA for WDII and CWB and CT Dredging, refer to Section 11.156

Table 11.14   Predicted Suspended Solids Concentrations at Seawater Intakes for Scenario 2 – Unmitigated

WQ Sensitive Receivers (ID)

SS concentration (absolute value) in mid-depth (mg/l)

Criterion

Dry Season

Wet Season

Mean

Maximum

% time in

compliance

Mean

Maximum

% time in

compliance

Cooling Water Intakes

MTR Tsing Yi Station (C12)

< 40

5.96

7.67

100.00%

7.48

9.03

100.00%

Daily Farm Ice Plant (C22)

-

4.29

5.64

-

6.26

8.11

-

Pamela Youde Nethersole Eastern Hospital (C23)

-

3.95

4.23

-

5.37

7.07

-

Prince's Building Group (C29)

-

6.35

17.65

-

8.28

34.99

-

HSBC & AIG Tower (C30)

-

6.10

13.10

-

8.17

20.17

-

Queensway Government Offices (C31)

-

5.95

11.93

-

8.28

23.75

-

MTR New South Intake (C32)

< 40

6.28

16.68

100.00%

8.05

17.88

100.00%

Kai Tak DCS (C33)

-

4.42

4.55

-

6.41

7.50

-

Hong Kong Convention and Exhibition Centre Extension (Existing) (1) See Note (4)

-

5.37

11.12

-

7.40

19.22

-

Telecom House / HK Academy for Performing / Shui On Centre (Reprovisioned) (2) See Note (4)

-

5.00

9.88

-

7.38

14.65

-

Hong Kong Convention and Exhibition Centre Phase I (Reprovisioned) (3) See Note (4)

-

5.88

18.80

-

7.95

26.55

-

Wan Chai Tower / Revenue Tower / Immigration Tower (Reprovioned) (4) See Note (4)

-

5.88

14.18

-

7.70

19.95

-

Great Eagle Centre / China Resources Building (Reprovisioned) (5) See Note (4)

-

6.53

19.48

-

8.25

35.85

-

Sun Hung Kai Centre (Reprovisioned) & Proposed Exhibition Station (6&7) See Note (4)

-

5.12

12.10

-

7.82

22.57

-

Excelsior Hotel & World Trade Centre / No. 27-63 Paterson Street (8) See Note (4)

-

7.20

7.20

-

7.20

7.20

-

Windsor House (9) See Note (4)

-

7.48

7.48

-

7.50

12.80

-

City Garden (11)

-

4.90

12.54

-

7.04

32.23

-

Provident Centre (12)

-

5.45

19.47

-

7.75

52.97

-

MTR (Kowloon Station) (13)

< 40

5.66

18.95

100.00%

7.51

18.00

100.00%

China H.K. City (15)

-

5.27

9.73

-

7.22

12.34

-

Harbour City (16)

-

4.87

6.58

-

7.20

16.17

-

Ocean Centre (17)

-

4.86

4.86

-

7.07

12.00

-

Ocean Terminal (18)

-

5.22

9.79

-

7.53

14.84

-

Government Premises (19)

-

5.91

21.75

-

8.75

46.24

-

New World Centre (20)

-

6.41

33.46

-

9.55

43.08

-

East Rail Extension (21)

< 40

4.87

13.23

100.00%

7.06

17.53

100.00%

Metropolis (34)

-

4.62

8.01

-

6.76

21.94

-

Hong Kong Coliseum (35)

-

4.68

7.93

-

6.84

25.42

-

West Kowloon Terminus, MTR (B)

< 40

5.07

9.93

100.00%

7.12

11.98

100.00%

Saltwater Intakes

Kowloon South No. 2 (WSD7) See Note (4)

< 10

7.00

7.52

100.00%

6.80

7.95

100.00%

Tai Wan (WSD9) See Note (4)

< 10

4.68

12.68

99.45%


7.60

100.00%

Cha Kwo Ling (WSD10) See Note (4)

< 10

4.17

4.80

100.00%

5.15

7.27

100.00%

Tseng Kwan O (WSD12)

< 10

3.69

3.70

100.00%

5.34

6.69

100.00%

Siu Sai Wan (WSD13)

< 10

3.99

4.09

100.00%

5.37

7.07

100.00%

Sai Wan Ho (WSD15) See Note (4)

< 10

4.45

7.63

100.00%

6.15

12.27

98.34%

Quarry Bay (WSD17) See Note (4)

< 10

5.05

10.62

99.72%


26.02

96.69%

Sheung Wan (WSD19) See Note (4)

< 10

5.88

9.80

100.00%

7.43

10.70

99.17%

Kennedy Town (WSD20)

< 10

5.27

6.72

100.00%

7.14

7.35

100.00%

Wan Chai (Reprovisioned) (A) See Note (4)

< 10

5.12

12.10

98.90%

7.82

22.57

87.57%

Kowloon Station (14)

< 10

5.71

14.41

95.58%

7.48

19.45

95.86%

Notes:

1.        The water quality modelling results for 90 percentile SS predicted under the pre-construction scenario at the corresponding indicator points is adopted as the ambient SS levels.

2.        Other seawater intakes that are not shown in this table were found not be impacted by the proposed marine works for SCL (HUH-ADM).

3.        Bold and shaded number indicates exceedance of criterion.

4.        The SS levels predicted at this specific intake has incorporated the effect from deployment of silt screen around the intake as recommended under the approved EIA for WDII and CWB and CT Dredging, refer to Section 11.156

Important Coral Communities

11.159   The SS elevations and sedimentation rates predicted at the far-field coral communities at Green Island with great ecological conservation value are provided in Table 11.15 and Table 11.16. It should be highlighted that the maximum SS elevations and the maximum sedimentation rates presented in the tables represent the maximum values predicted over the entire simulation. Both the SS elevations and sedimentation rates would comply with the relevant criteria at all the coral sites. 

Table 11.15    Predicted Suspended Solids Elevations and Sedimentation Rates at Corals for Scenario 1 – Unmitigated

Corals (ID) (refer to Figure No. NEX2213/C/331/ENS/M59/005)

Maximum SS Elevations (mg/L)

Maximum Sedimentation Rate (g/m2/day)

Criterion

(30% of Mean SS Level)

Maximum

Criterion

Maximum

Dry Season

Green Island & Little Green Island (C1)

1.70

1.40

< 100

51.02

Wet Season

Green Island & Little Green Island (C1)

2.76

1.12

< 100

7.53

Table 11.16    Predicted Suspended Solids Elevations and Sedimentation Rates at Corals for Scenario 2 – Unmitigated

Corals (ID) (refer to Figure No. NEX2213/C/331/ENS/M59/005)

Maximum SS Elevations (mg/L)

Maximum Sedimentation Rate (g/m2/day)

Criterion

(30% of Mean SS Level)

Maximum

Criterion

Maximum

Dry Season

Green Island & Little Green Island (C1)

1.70

1.01

< 100

36.99

Wet Season

Green Island & Little Green Island (C1)

2.76

0.75

< 100

7.48

11.160   The contour plots presented in Appendix 11.4 to Appendix 11.7 show the extent of surface, mid-depth and bottom SS elevations averaged over a spring-neap cycle, during wet and dry seasons for Scenario 1 and Scenario 2. Each figure attached in Appendix 11.4 to Appendix 11.7 contains two contour plots where the upper plot shows the unmitigated scenario and the lower plot shows the mitigated scenario.  As shown in the contour plots in Appendix 11.4 to Appendix 11.7, the influence zone of the sediment plume would become localized after implementation of the mitigation measures further recommended in Section 11.210.

Compliance with WQO for SS Elevation

11.161   Non-compliance with the WQO for SS (i.e. elevation of less than 30% of ambient baseline level) would be predicted in the Victoria Harbour under the dredging scenarios.  The maximum extent of the mixing zone for depth-averaged SS elevation (contributed from the Project and other concurrent marine works) is shown in Appendix 11.8 for Scenario 1.  Each figure attached in Appendix 11.8 contains two contour plots where the upper plot shows the unmitigated scenario and the lower plot shows the mitigated scenario. Appendix 11.8 illustrates the maximum extent of mixing zone due to the cumulative impact from the Project and other concurrent marine works.  To provide an indication on the potential water quality impact caused by the Project works alone, the maximum extent of the mixing zone for SS elevation (contributed from the Project alone) is presented in Appendix 11.9 and Appendix 11.10 for Scenario 1 and Scenario 2 respectively. Scenario 2 aimed to assess the impacts due to the IMT construction under the SCL project alone. The mixing zones for SS elevation due to this Project alone are presented for both unmitigated and mitigated scenarios in Appendix 11.9 and Appendix 11.10. As shown in the contour plots, the mixing zone for SS elevation contributed from the SCL alone would be localized under the mitigated scenarios.

Potential Contaminant Release during Dredging

Silver, Cadmium, Copper, Nickel, Lead, Chromium, Mercury, Arsenic, TBT and Chlorinated Pesticides

11.162   This section provides the assessment of contaminant release during dredging for silver, cadmium, copper, nickel, lead, chromium, mercury, arsenic, TBT and chlorinated pesticides([7]).  Contaminant release for zinc, PCBs and PAHs are separately assessed in later sections. An indication of the likelihood of release of contaminants from the marine mud during dredging is given by the results of the elutriation tests from the laboratory testing conducted under the marine SI for selected sediment sampling stations within the marine works areas.  Sediment samples mixed with a solution, i.e. the ambient seawater collected from the same site, were vigorously agitated during the tests to simulate the strong disturbance to the seabed sediment during dredging.  Pollutants absorbed onto the sediment particles would be released and increasing the pollutant concentrations in the solution.  The laboratory testing was to analyse the pollutant concentrations in the solution (elutriate).  If the contaminant levels are higher in the elutriates in comparison with the blanks (i.e. marine water from the same site), it can be concluded that the contaminants are likely to be released into the marine waters during dredging activities.  The elutriate samples were tested for heavy metals and tributyltin (TBT) as well as chlorinated pesticides.  Details of the sediment quality and elutriate sampling and testing are reported separately in the Sediment Sampling and Testing Plan (SSTP) as given in Appendix 12.3.  Laboratory results for the elutriation tests are shown in the Table 11.17.  Locations of the sampling stations are shown in Figure No. NEX2213/C/331/ENS/M59/010 to NEX2213/C/331/ENS/M59/014.

11.163   The concentrations of cadmium, copper, nickel, lead, chromium, arsenic and TBT in the elutriate samples exceeded the assessment criteria.  The highest concentrations of cadmium (3mg/L), lead (35mg/L) and TBT (0.21mg/L) were recorded at Station 2211/SCL/EDH-VC024;  the highest concentrations of copper (20mg/L) and chromium (40mg/L) were recorded at Station 2211/SCL/EDH-VC007;  the highest concentration of nickel (106mg/L) was recorded at Station 2211/SCL/EDH-VC013(1); and the highest concentration of arsenic (32mg/L) was recorded at Station 2211/SCL/VC001(1). The levels of silver and mercury in the elutriate samples complied well with the relevant water quality criteria.

11.164   Based on the elutriate testing results, the required dilutions to meet the assessment criteria were calculated to be 1.2 for cadmium, 4 for copper, 3.5 for nickel, 1.4 for lead, 2.7 for chromium, 1.3 for arsenic and 2.1 for TBT. Based on the result of the tracer dilution modeling conducted under this EIA as mentioned in Sections 11.166 to 11.169, it is considered that the required dilution rate (maximum 4 times) to meet the water quality standards could be easily achieved in the open harbour area with high flushing capacity.  As exceedances for heavy metal and TBT were only recorded in a very small portion of elutriate samples, it is expected that any significant elevation of metal and TBT in the marine water during dredging would be highly transient.  The contaminant concentrations in most of the elutriate test samples complied well with the assessment criteria. It is expected that any release of heavy metals during dredging will be quickly diluted by the large volume of marine water within the construction site.   As the ecological value in CBTS is low, any potential impact due to contaminant elevation within the typhoon shelter should be limited.  Thus, no unacceptable marine water quality impact would be anticipated due to the release of contaminants during dredging.

11.165   Chlorinated pesticides including alpha-BHC, beta-BHC, gamma-BHC, delta-BHC, heptachlor, Aldrin, heptachlor epoxide, endososulfan, p,p’-DDT, p,p’-DDD, p,p’-DDE, endosulfan sulphate, were also measured in both the sediment and elutriate samples.  The laboratory results show that these pesticides were not detected in any of the sediment and elutriate samples.  All the measured values are below the detection limit of 0.5 mg/kg for sediment and 0.1 mg/l for elutriate.  Also, the elutriate test results do not indicate any levels higher than the blank results which indicated that the impact from the potential release of pesticides during dredging would not be an issue of concern.


Table 11.17       Comparison of Marine Site Investigation Sediment Elutriate Test Results with the Water Quality Standards

Vibrocore (Refer to Figure No. NEX2213/C/331/ENS/M59/010 - 014

Sampling Depth (m)

Parameters (mg/l) (2)

Silver

Cadmium

Copper

Nickel

Lead

Chromium

Arsenic

Mercury

TBT

Assessment Criteria (3)

2.3

2.5

5

30

25

15

25

0.3

0.1

2211/SCL/VC001 (1)

0.0 - 0.9

< 2

< 1

< 5

< 10

< 10

< 10

< 25

< 0.1

< 0.013

0.9 - 1.7

< 2

< 1

< 5

< 10

< 10

< 10

32

< 0.1

< 0.012

Blank

< 2

< 1

< 5

< 10

< 10

< 10

< 25

< 0.1

< 0.013

2211/SCL/VC004(1)

0.0 - 0.9

< 2

< 1

< 5

< 10

< 10

< 10

< 25

< 0.1

< 0.011

0.9 - 1.9

< 2

< 1

< 5

< 10

< 10

< 10

< 25

< 0.1

< 0.011

1.9 - 2.9

< 2

< 1

< 5

< 10

< 10

< 10

< 25

< 0.1

0.012

2.9 - 3.9

< 2

< 1

< 5

< 10

< 10

< 10

< 25

< 0.1

0.11

6.0 - 6.9

< 2

< 1

< 5

< 10

< 10

< 10

< 25

< 0.1

< 0.011

8.9 - 10.0

< 2

< 1

< 5

< 10

< 10

< 10

< 25

< 0.1

0.012

Blank

< 2

< 1

< 5

< 10

< 10

< 10

< 25

< 0.1

< 0.011

2211/SCL/EDH-VC007

0.0 - 0.9

< 2

< 1

< 5

< 10

< 10

< 10

< 25

< 0.1

< 0.013

0.9 - 1.9

< 2

< 1

< 5

< 10

< 10

< 10

< 25

< 0.1

< 0.012

2.0 - 2.9

< 2

< 1

< 5

< 10

< 10

< 10

< 25

< 0.1

< 0.012

3.0 - 3.9

< 2

< 1

< 5

< 10

< 10

< 10

< 25

< 0.1

< 0.015

6.0 - 6.9

< 2

< 1

< 5

13

< 10

< 10

< 25

< 0.1

< 0.014

9.0 - 9.9

< 2

1

< 5

50

< 10

< 10

< 25

< 0.1

< 0.012

12 - 12.9

< 2

< 1

< 5

< 10

< 10

< 10

< 25

< 0.1

< 0.013

15 - 15.95

< 2

< 1

< 5

< 10

< 10

< 10

< 25

< 0.1

< 0.012

18 - 18.95

< 2

< 1

< 5

< 10

< 10

< 10

< 25

< 0.1

< 0.010

21 - 21.95

< 2

< 1

< 5

< 10

< 10

< 10

< 25

< 0.1

< 0.010

24 - 24.95

< 2

< 1

20

< 10

1250 (4)

40

< 25

< 0.1

< 0.012

Blank

< 2

< 1

< 5

< 10

< 10

< 10

< 25

< 0.1

< 0.015

2211/SCL/VC010(1)

0.0 - 0.9

< 2

< 1

< 5

< 10

< 10

< 10

< 25

< 0.1

< 0.009

0.9 - 1.9

< 2

< 1

< 5

< 10

< 10

< 10

< 25

< 0.1

< 0.009

1.9 - 2.9

< 2

< 1

< 5

< 10

< 10

< 10

< 25

< 0.1

0.014

3 - 3.95

< 2

< 1

< 5

< 10

< 10

< 10

< 25

< 0.1

-

6 - 6.95

< 2

< 1

< 5

< 10

< 10

< 10

< 25

< 0.1

-

9 - 9.95

< 2

< 1

7

< 10

< 10

< 10

< 25

< 0.1

-

12 - 12.5

< 2

< 1

5

< 10

< 10

< 10

< 25

< 0.1

-

Blank

< 2

< 1

< 5

< 10

< 10

< 10

< 25

< 0.1

< 0.013

2211/SCL/EDH-VC013(1)

0 - 0.9

< 2

< 1

< 5

< 10

< 10

< 10

< 25

< 0.1

< 0.012

1 - 1.9

< 2

< 1

< 5

< 10

< 10

< 10

< 25

< 0.1

< 0.012

2 - 2.9

< 2

< 1

< 5

< 10

< 10

< 10

< 25

< 0.1

< 0.012

3 - 3.9

< 2

< 1

< 5

12

< 10

< 10

< 25

< 0.1

< 0.014

6 - 6.9

< 2

< 1

< 5

11

< 10

< 10

< 25

< 0.1

< 0.012

9 - 9.9

< 2

< 1

< 5

< 10

< 10

< 10

< 25

< 0.1

< 0.013

12 - 12.9

< 2

< 1

< 5

106

< 10

< 10

< 25

< 0.1

0.026

15 - 15.9

< 2

< 1

< 5

< 10

< 10

< 10

< 25

< 0.1

0.064

18 - 18.9

< 2

< 1

< 5

< 10

< 10

< 10

< 25

< 0.1

< 0.011

21 - 21.9

< 2

< 1

< 5

< 10

< 10

< 10

< 25

< 0.1

< 0.013

Blank

< 2

< 1

< 5

< 10

< 10

< 10

< 25

< 0.1

< 0.012

2211/SCL/EDH-VC016(1)

0 - 0.9

< 2

< 1

< 5

< 10

< 10

< 10

< 25

< 0.1

< 0.014

2.0 - 2.9

< 2

< 1

< 5

< 10

< 10

< 10

< 25

< 0.1

< 0.012

3.0 - 3.9

< 2

< 1

< 5

< 10

< 10

< 10

< 25

< 0.1

< 0.012

6 - 6.9

< 2

< 1

< 5

< 10

< 10

< 10

< 25

< 0.1

< 0.011

9 - 9.9

< 2

< 1

< 5

< 10

< 10

< 10

< 25

< 0.1

0.086

12 - 12.9

< 2

< 1

< 5

65

< 10

< 10

< 25

< 0.1

0.097

15 - 15.9

< 2

< 1

< 5

75

< 10

< 10

< 25

< 0.1

< 0.012

18 - 18.9

< 2

< 1

< 5

< 10

< 10

< 10

< 25

< 0.1

< 0.015

Blank

< 2

< 1

< 5

< 10

< 10

< 10

< 25

< 0.1

< 0.013

2211/SCL/EDH-VC019

0 - 0.95

< 2

< 1

< 5

< 10

< 10

< 10

< 25

< 0.1

< 0.013

1 - 1.95

< 2

< 1

< 5

< 10

< 10

< 10

< 25

< 0.1

< 0.014

2 - 2.95

< 2

< 1

< 5

< 10

< 10

< 10

< 25

< 0.1

< 0.015

3 - 3.95

< 2

< 1

< 5

< 10

< 10

< 10

< 25

< 0.1

< 0.014

6 - 6.95

< 2

< 1

< 5

< 10

< 10

< 10

< 25

< 0.1

< 0.014

9 - 9.95

< 2

< 1

< 5

< 10

< 10

< 10

< 25

< 0.1

< 0.015

12 - 12.95

< 2

< 1

< 5

< 10

< 10

< 10

< 25

< 0.1

< 0.012

Blank

< 2

< 1

< 5

< 10

< 10

< 10

< 25

< 0.1

< 0.015

2211/SCL/EDH-VC024

0 - 0.9

< 2

< 1

< 5

< 10

< 10

< 10

< 25

< 0.1

0.21

1 - 1.9

< 2

< 1

< 5

< 10

< 10

< 10

< 25

< 0.1

< 0.012

2 - 2.9

< 2

1

15

42

35

< 10

< 25

< 0.1

< 0.010

3 - 3.9

< 2

< 1

< 5

< 10

< 10

< 10

< 25

< 0.1

< 0.012

6 - 6.9

< 2

< 1

< 5

< 10

< 10

< 10

< 25

< 0.1

< 0.011

9 - 9.9

< 2

< 1

< 5

< 10

< 10

< 10

< 25

< 0.1

< 0.012

12 - 12.9

< 2

2

< 5

< 10

< 10

< 10

< 25

< 0.1

< 0.012

15 - 15.9

< 2

3

< 5

< 10

< 10

< 10

< 25

< 0.1

< 0.011

18 - 18.9

< 2

1

< 5

< 10

< 10

< 10

< 25

< 0.1

< 0.012

21 - 21.9

< 2

1

< 5

< 10

< 10

< 10

< 25

< 0.1

< 0.012

Blank

< 2

< 1

< 5

< 10

< 10

< 10

< 25

< 0.1

< 0.014

2211/SCL/VC028

0 - 1

< 2

< 1

< 5

< 10

< 10

< 10

< 25

< 0.1

< 0.013

Blank

< 2

< 1

< 5

< 10

< 10

< 10

< 25

< 0.1

< 0.013

Note:

1.        Value in bold and shaded indicates exceedance of the Water Quality Standard.

2.        Levels of chlorinated pesticides were all undetected and are therefore not presented.

3.        Refer to Section 11.24.

4.        This test result is doubtful due to abnormally high value and is therefore excluded in the assessment.


Zinc, PCBs and PAHs

11.166   No valid elutriate testing results for zinc, PCBs and PAHs are available for assessment. The assessment of the release of zinc, PCBs and PAHs was made in relation to the sediment quality results (refer to Section 12).  It is assumed in the assessment that all contaminants contained in the sediments that are lost to the water environment during dredging would instantaneously be released into the water column.

11.167   Inert tracers (with zero decay) were introduced into the Delft3D-WAQ model to represent the release of zinc, total PCBs and total PAHs during dredging.  Discharge of inert tracers was assumed at the source points (discharge locations).  The assessment conducted under this EIA on the potential release of contaminants focused on the impact from the IMT dredging proposed under the SCL alone.  Contaminant release due to the dredging operation within the CBTS has been fully assessed under the separate EIA for SCL Protection Works at CBTS.

11.168   Tracer simulation was performed for the dredging scenario to determine the maximum dimensions of mixing zones for zinc, total PCBs and total PAHs.  Each simulation covered two model runs for dry and wet seasons respectively. There are total two sediment source points (namely A1 and A2) assumed for the IMT dredging works under the modelling scenario (refer to Figure No. NEX2213/C/331/ENS/M59/007) and these two source points are located in the northern IMT section, and the southern IMT section respectively.  For calculating the release rate of zinc and PAHs, the sediment sampling results collected along the IMT alignment under the marine SI were sub-divided into two portions for the northern half of the IMT section and the southern half of the IMT section respectively, and the 90 percentile of contaminants measured in the sediment samples collected from each of these two portions were used to calculate the loss rate at the two respective source points respectively for continuous model input.  The zinc levels used for calculating the release rate for model input were 381 mg/kg and 368 mg/kg for source ID A1 and A2 respectively.  The total PAHs levels used for calculating the release rate for model input were 9648 mg/kg and 2350 mg/kg for source ID A1, and A2 respectively. All the PCBs levels measured in the sediment samples were undetected (i.e. < 3 mg/kg or < 30 mg/kg as shown in Appendix 12.4). The value of 30 mg/kg was used to calculate the PCBs loss rate for continuous model input as a conservative approach. 

11.169   Appendix 11.11 and Appendix 11.12 show the contour plots of maximum instantaneous zinc, total PCBs and total PAHs predicted over the entire simulation period for Scenario 1, Scenario 2 respectively.  Each figure contains two contour plots in Appendix 11.11 and Appendix 11.12 (for Scenario 1 and Scenario 2) where the upper plot shows the unmitigated scenario and the lower plot shows the mitigated scenario. As shown in the contour plots, full compliance with the water quality criteria would be achieved under the mitigated scenario for both Scenario 1 and Scenario 2 as shown in Appendix 11.11 and Appendix 11.12. 

Oxygen Depletion During Dredging

11.170   An assessment of DO depletion during dredging is made in relation to the results of the sediment plume modelling of dredging activities (unmitigated scenario) and the sediment quality data for the study area.  The predicted maximum elevations in SS concentrations at various indicator points were used to estimate the effects of increased SS concentrations on DO based on the equation stated below.  The SS elevations used in the calculation for seawater intakes have not considered the effect of silt screen.

DODep = C * SOD * K * 10-6

where   DODEP   = Dissolved oxygen (DO) depletion (mg/l)

                   C   = Predicted maximum suspended solids (SS) concentration (mg/l)

              SOD   = Sediment oxygen demand (mg/kg)

                   K   = Daily oxygen uptake factor (set as 1)

11.171   In the calculation, the daily oxygen uptake factor, K, was set to be 1, which means instantaneous oxidation of the sediment oxygen demand.  This was a conservative prediction of DO depletion since oxygen depletion is not instantaneous. It is worth noting that the above equation does not account for re-aeration which would tend to reduce impacts of the SS on the DO concentrations in the water column. 

11.172   The calculation was performed using the highest levels of 5-day SOD measured in the sediment samples collected during the SI for conservative predictions.  The highest 5-day SOD level was recorded at station 2211/SCL/EDH-VC019 inside the CBTS.  The 10 percentile DO predicted under the pre-construction scenario at the corresponding indicator points were used as the background levels, following the approach adopted under the approved WDII & CWB EIA.  The proposed analysis, which is on the conservative side, will likely overestimate the DO depletion. 

Oxygen Depletion at Water Sensitive Receivers

11.173   The results of DO depletion for various WSRs are given in Table 11.18 for Scenario 1 under the unmitigated scenario.  As the SS elevations predicted under Scenario 2 are smaller than that predicted under Scenario 1 for the unmitigated scenario, the DO depletion under Scenario 2 would not be worse than that predicted under Scenario 1. The results of DO depletion for Scenario 2 are therefore not presented.

Table 11.18    Calculation of the Effects of Increased Suspended Solids Concentrations on Dissolved Oxygen Concentrations under Scenario 1 (Unmitigated)

Indicator Point

Maximum Predicted SS Elevations (mg/L)

SOD5 in Sediment (mg/kg)

Maximum DO Depletion (mg/L)

Background DO (mg/L)

Resultant DO (mg/L)

Dry Season

Hong Kong Convention and Exhibition Centre Extension (Existing)

2.59

3,820

0.0099

6.63

6.62

Telecom House / HK Academy for Performing / Shui On Centre (Reprovisioned)

2.06

3,820

0.0079

6.63

6.62

Hong Kong Convention and Exhibition Centre Phase I (Reprovisioned)

5.91

3,820

0.0226

6.63

6.61

Wan Chai Tower / Revenue Tower / Immigration Tower (Reprovisioned)

3.93

3,820

0.0150

6.63

6.61

Great Eagle Centre / China Resources Building (Reprovisioned)

5.93

3,820

0.0227

6.63

6.61

Sun Hung Kai Centre (Reprovisioned) & Proposed Exhibition Station

3.01

3,820

0.0115

6.64

6.63

Excelsior Hotel & World Trade Centre / No. 27-63 Paterson Street

0.00

3,820

0.0000

6.83

6.83

Windsor House

0.56

3,820

0.0021

6.82

6.82

City Garden

8.06

3,820

0.0308

6.74

6.71

Provident Centre

15.01

3,820

0.0573

6.75

6.69

MTR (Kowloon Station)

14.11

3,820

0.0539

6.62

6.57

China H.K. City

4.78

3,820

0.0183

6.62

6.60

Harbour City

1.72

3,820

0.0066

6.62

6.61

Ocean Centre

0.50

3,820

0.0019

6.62

6.62

Ocean Terminal

5.41

3,820

0.0207

6.62

6.60

Government Premises

16.98

3,820

0.0649

6.63

6.57

New World Centre

29.00

3,820

0.1108

6.62

6.51

East Rail Extension

8.59

3,820

0.0328

6.65

6.62

Metropolis

3.58

3,820

0.0137

6.65

6.64

Hong Kong Coliseum

3.56

3,820

0.0136

6.65

6.64

West Kowloon Terminus (MTR)

6.09

3,820

0.0233

6.62

6.60

Kowloon South No. 2 (WSD7)

0.61

3,820

0.0023

6.44

6.44

Tai Wan (WSD9)

3.32

3,820

0.0127

6.71

6.70

Cha Kwo Ling (WSD10)

0.34

3,820

0.0013

6.81

6.81

Tseung Kwan O (WSD12)

0.01

3,820

0.0000

6.92

6.92

Siu Sai Wan (WSD13)

0.14

3,820

0.0005

6.83

6.83

Sai Wan Ho (WSD15)

1.52

3,820

0.0058

6.82

6.81

Quarry Bay (WSD17)

2.71

3,820

0.0104

6.82

6.81

Sheung Wan (WSD19)

1.95

3,820

0.0074

6.46

6.45

Kennedy Town (WSD20)

1.68

3,820

0.0064

6.43

6.42

Wan Chai (Reprovisioned) (A)

3.01

3,820

0.0115

6.65

6.64

Kowloon Station (14)

11.12

3,820

0.0425

6.62

6.58

Wet Season

Hong Kong Convention and Exhibition Centre Extension (Existing)

4.94

3,820

0.0189

4.72

4.70

Telecom House / HK Academy for Performing / Shui On Centre (Reprovisioned)

3.99

3,820

0.0153

4.72

4.70

Hong Kong Convention and Exhibition Centre Phase I (Reprovisioned)

7.98

3,820

0.0305

4.72

4.69

Wan Chai Tower / Revenue Tower / Immigration Tower (Reprovisioned)

5.35

3,820

0.0204

4.72

4.70

Great Eagle Centre / China Resources Building (Reprovisioned)

11.70

3,820

0.0447

4.72

4.68

Sun Hung Kai Centre (Reprovisioned) & Proposed Exhibition Station

7.51

3,820

0.0287

4.75

4.72

Excelsior Hotel & World Trade Centre / No. 27-63 Paterson Street

1.08

3,820

0.0041

5.27

5.27

Windsor House

7.70

3,820

0.0294

5.23

5.20

City Garden

25.61

3,820

0.0978

4.85

4.75

Provident Centre

46.33

3,820

0.1770

4.85

4.67

MTR (Kowloon Station)

11.68

3,820

0.0446

4.81

4.77

China H.K. City

6.05

3,820

0.0231

4.77

4.75

Harbour City

9.81

3,820

0.0375

4.77

4.73

Ocean Centre

5.83

3,820

0.0223

4.77

4.75

Ocean Terminal

8.15

3,820

0.0311

4.82

4.79

Government Premises

39.18

3,820

0.1497

4.8

4.65

New World Centre

37.29

3,820

0.1425

4.82

4.68

East Rail Extension

10.82

3,820

0.0413

4.77

4.73

Metropolis

15.66

3,820

0.0598

4.77

4.71

Hong Kong Coliseum

19.14

3,820

0.0731

4.77

4.70

West Kowloon Terminus (MTR)

5.56

3,820

0.0212

4.8

4.78

Kowloon South No. 2 (WSD7)

0.31

3,820

0.0012

4.85

4.85

Tai Wan (WSD9)

1.58

3,820

0.0060

4.75

4.74

Cha Kwo Ling (WSD10)

0.97

3,820

0.0037

4.62

4.62

Tseng Kwan O (WSD12)

1.95

3,820

0.0074

5.51

5.50

Siu Sai Wan (WSD13)

2.42

3,820

0.0092

5.41

5.40

Sai Wan Ho (WSD15)

3.21

3,820

0.0123

4.95

4.94

Quarry Bay (WSD17)

9.70

3,820

0.0371

4.86

4.82

Sheung Wan (WSD19)

1.86

3,820

0.0071

4.81

4.80

Kennedy Town (WSD20)

0.27

3,820

0.0010

5.03

5.03

Wan Chai (Reprovisioned) (A)

7.51

3,820

0.0287

4.84

4.81

Kowloon Station (14)

12.80

3,820

0.0489

4.81

4.76

11.174   No significant DO depletion was predicted at the identified WSRs under the unmitigated scenario.  The concurrent dredging activities would cause a maximum DO depletion of no more than 0.18 mg/L at the nearby sensitive receivers.  Full compliance with the WQO for DO is predicted in the Victoria Harbour.  No mixing zone for DO can therefore be identified.  No adverse impacts on the DO levels at the identified far field coral sites and fish culture zones would be expected from the marine works.

Underwater Blasting

11.175   The potential blasting work, if required, would be undertaken after completion of the dredging works required for the IMT construction.  The marine sediments at or near the blasting area would be removed prior to the blasting work.  Activities associated with the underwater blasting works include the preparation of drilling holes within which the charges are placed and firing the charges.  Fragment rock will then be removed by grab dredger. The diameter of the resulting materials will be large and as such no off-site migration of fines is expected.

11.176   It is anticipated that two different explosives charge weights of 25 and 7.7 kg per delay would be required for the potential underwater blasting below and above rockhead level (bedrock and over-sized boulder) respectively for accommodating the IMT. Based on the engineering assessment, the potential zone of influence on the water pressure from the potential blasting operation would be about 30m and 17m from the underwater blasting area using 25kg explosives per delay and 7.7kg per delay respectively. The calculated influence zone is considered localized and within the proposed marine works area for the IMT construction.  Outside the potential zone of influence, the water pressure would be reduced to an acceptable level (i.e. 100kpa) during the blasting operation where no significant disturbance to the bed sediments would be expected. Therefore, no significant SS elevation and breaches of the WQO due to the underwater blasting work would be expected.  Mitigation measures for the underwater blasting work are provided in Section 11.207.


Temporary Reclamation at Hung Hom Landfall and Associated Works

11.177   Marine piling would be required for the construction of the working platform adjacent to the cofferdam at Hung Hom Landfall. Mitigation measures are recommended in Sections 11.200 and 11.201. Loss of fines, if any, from the marine piling work is considered short term, localised and minor. Removal of fender piles of Hung Hom Bypass and minor piling works would be undertaken prior to the construction of the platform and cofferdam. Removal works of fender piles is however unlikely to cause significant disturbance to the seabed and no dredging works would be required. As such, no off-site migration of fines would be expected. Excavation and tunnel construction works will be undertaken within the cofferdam, thus no water quality impact is expected. The potential release of sediment due to the reinstatement of fender piles could be controlled through installation of silt curtains surrounding the works area as necessary. All wastewater generated from the piling activities will be collected by a derrick lighter or other collection system and be treated before discharge. Spoil should be collected by sealed hopper barges for proper disposal. In overall, no unacceptable water quality impact due to the temporary reclamation at Hung Hom Landfall and its associated works would be expected.

Removal and Reinstatement of the Tip of Freight Pier at Hung Hom for IMT Construction

11.178   The tip of Hung Hom Freight Pier would need to be removed for construction of the IMT. Mitigation measures are recommended in Section 11.216 to minimize the potential release of construction wastes. The size of materials to be involved in the pier removal works would however be large and no dredging work would be required and as such no off-site migration of fines would be expected.

11.179   The reinstatement of the tip of freight pier at Hung Hom would be carried out at its original site. The reinstatement of the tip of freight pier would only involve piling works. No dredging would be required. The potential release of sediment due to marine piling could be controlled through the installation of silt curtains surrounding the working area as necessary. All wastewater generated from the piling activities will be collected by a derrick lighter or other collection system and be treated before controlled discharge. Spoil should be collected by sealed hopper barges for proper disposal. No unacceptable water quality impact due to the jetty construction work would be expected.

Shek O Casting Basin Washdown, Flooding and Draining

11.180   Activities relating to the flooding and emptying of the casting basin for the removal of the formed tunnel units would have the potential to impact on water quality.  Water in the basin may be contaminated with particulates from cement and concrete which could affect pH.  Seawater has a high natural buffering capacity and as the basin will be flooded with more than 300,000 m3 of seawater, the effect of pH of the discharged water is likely to be negligible. Suspended solids in the flooded basin may be expected to be elevated above the background although, as for pH, the large volume of water in the basin will tend to reduce this impact.  Sources of contaminants arises from the casting operation would also include the potential use of form oil (a mould-release agent).

11.181   Prior to flooding the casting basin a washdown will be carried out.  Washdown waters (and any concrete curing waters) will drain to the treatment unit.  Contaminants in washdown waters are likely to include oil, grease, suspended solids and mould-release agents.  Settlement of washed waters and oil removal will take place prior to discharge to the sea.  If necessary, pH of the effluent can be controlled at this stage.  Discharge from the treatment unit will have to comply with the TM-DSS. Recovered oil will be properly contained, labeled and stored on site prior to collection by licensed collectors for disposal. 

11.182   During the flooding of the basin with seawater (accomplished by pumps) no escape of water could occur as the cofferdam will still be in place.  Prior to opening a channel through the cofferdam, water inside the basin will be skimmed of floating debris. A period of settling of 24 hours before opening the basin to the sea would allow much of the suspended material to settle out.  The channel through the cofferdam will only be opened with the approval of the Site Engineer to the effect that all reasonable steps had been taken to removal contaminants.

11.183   Draining of the basin will take place after the caisson gate has been put in position. The seawater within the basin will be pumped out and will not contain contaminants as these will all have been removed during the washdown and flooding operations.  The water quality impact due to the washdown, flooding and draining of the casting basin is considered acceptable with proper implementation of the proposed mitigation measures.

Land Based Construction Activities

Construction Site Run-off and General Construction Activities

11.184   Effluent discharge from temporary site facilities and construction site run-off should be controlled to prevent direct discharge to the neighbouring storm drains. Adoption of the guidelines and good site practices from the handling and disposal of construction discharges as part of the construction site management practices (as given in Sections 11.223 to 11.245) would minimize the potential impacts.

Accidental Spillage

11.185   The use of engine oil and lubricants, and their storage as waste materials has the potential to create impacts on the water quality if spillage occurs.  Waste oil may infiltrate into the surface soil layer, or run-off into local water courses, increasing hydrocarbon levels.  The potential impacts could however be mitigated by practical mitigation measures and good site practices (as given in Sections 11.254 to 11.256 ).

Sewage Effluent from Construction Workforce

11.186   During construction, the increased workforce will contribute to the local population of the area.  Impacts include the generation of rubbish and wastewater from temporary sanitary facilities and waste disposal areas.  Although the impact will be temporary, this additional population may impose significant stress on the quality of water in local water courses in the absence of adequate mitigation.  Mitigation measures and good site practices given in Sections 11.246 to 11.247 should be implemented.

Excavation Activities

11.187   Excavations will be carried out for the construction of cut and cover tunnel section, diaphragm walling, shafts and buildings.  Some of the excavation works areas would be located close to the existing drainage system or seawater front.  Potential impacts may occur if rain falls during the excavation works, and water enters the excavated area, or silt and sand material and run-off from the excavation enters the nearby storm drains, increasing turbidity.  Other pollutants, such as oil and grease, and chemicals, as well as bentonite and grouting materials, may be present in the run-off where it flows over storage or maintenance areas for the works.  Erosion of soil enriched in organic matter may release nutrients into the adjacent storm drains.  Erosion of stockpiles may also release suspended solids into nearby storm drains.  As a good site practice, mitigation measures (as given in Sections 11.223 to 11.229) should be implemented to control site run-off and drainage from the works areas from entering the adjacent waters.

Groundwater Seepage from Uncontaminated Area

11.188   Excavation works are required for various construction activities during the construction.  As some of the proposed works areas are near the Victoria Harbour, high ground water level regime due to both tidal effects and rainwater infiltration is anticipated.  Different construction methods such as the use of a cofferdam wall will be employed as necessary to minimize the intrusion of groundwater into works areas.  In case seepage of groundwater occurs, groundwater would be pumped out from works areas and discharged to the storm system via silt trap.  Dewatering processes would be required for wet excavated materials. Groundwater from dewatering process would also be discharged to the storm system via silt removal facilities.  As no groundwater would be directly discharged into drainages and sea, water quality impacts would not be expected.

Site Runoff and Groundwater from Contaminated Areas

11.189   According to Section 13 of the EIA report, it is identified that some works areas might have land contamination issues.  Site Investigation (SI) involving sampling and testing of soil and groundwater was proposed to be undertaken in two stages.  In Stage 1, sampling has been conducted at areas identified as having a high potential contamination (potential hotspots), with the objective to preliminarily assess the soil and groundwater quality through sampling and laboratory testing at the worst-case locations in order to allow time for further assessment if required.

11.190   According to the analytical results (refer to Section 13), no exceedances of the Risk-Based Remediation Goals (RBRGs) (industrial) were found among all soil and groundwater samples collected in Stage I SI works.

11.191   Stage 2 SI will be conducted to provide a more generalised understanding of the presence of contaminants across the alignment of the works area, and investigate sites that are inaccessible for proper site inspection and/or site investigation under Stage 1. The Stage 2 SI will be conducted after the completion of this EIA study/land resumption/site decommissioning and prior to the commencement of the construction work.  Sites that may require further SI are detailed in Section 13.  If land contamination impact is identified in Stage 2 SI, mitigation measures as giving in Section 11.249 should be implemented to control site run-off, and to prevent run-off entering the adjacent waters.

11.192   Prior to the excavation works in the Stage 2 areas as identified under the Land Contamination Assessment provided in Section 13, the groundwater quality in these potentially contaminated areas should be reviewed with reference to the relevant Stage 2 SI results for ground water contamination.  The review results should be submitted to EPD for examination. If the review indicated that the groundwater to be generated from the excavation works from these areas would be contaminated, this contaminated groundwater will be either properly treated in compliance with the requirements of the TM-DSS or properly recharged into the ground. No direct discharge of contaminated groundwater will be adopted.

Tunnelling Activities

11.193   Some sections of the underground tunnel of the Project would be constructed by Drill and Blast (D&B) and Tunnel Boring Machine (TBM) technique.  Potential source of water quality impact from these tunnelling operations would be the discharge of tunnelling wastewater from drilling, boring and wash-down.  The use of bentonite and grouting materials for the construction of bored tunnels may contaminate the water pumped out from the tunnel.  Surface run-off may also be contaminated and turbid water may enter adjacent drainage system and downstream as excavated material is conveyed to the surface.  Wastewater from tunnelling works would also contain a high content of SS.  Water used for the tunnelling activities should as far as practicable be re-circulated after sedimentation.  When there is a need for final disposal, the wastewater should be discharged into storm drains via silt removal facilities.  Wastewater discharging into storm drains should comply with the standards stipulated in the TM-DSS.

Diaphragm Wall

11.194   As cut and cover construction is required, diaphragm walls are used as retaining wall for excavation and serve as either temporary or permanent support for the tunnel.  Potential impacts from any required diaphragm walling include turbid site run-off from the works, and bentonite and concrete washings entering storm drains and eventually into the sea.  Bentonite is a highly turbid material and will cause damage to aquatic organisms in receiving waters.  Run-off may arise during extraction of the bentonite or during preparation for recycling or disposal.  Concrete washings are potentially toxic to aquatic organisms, raising pH of receiving water bodies.  Concrete washings also increase turbidity in a waterbody.  As good site practice, mitigation measures (as given in Sections 11.223 to 11.245) should be implemented to control site run-off and drainage as well as any site effluents generated from the works areas, and to prevent run-off and construction wastes from entering the adjacent waters.

Operation Phase

Change of Flow Regime or Hydrology

11.195   There would be some changes in the seabed levels along the SCL tunnel section in Victoria Harbour after the Project completion (refer to Section 11.150). In order to assess the change in the overall assimilative capacity of Victoria Harbour, the flow discharge across two cross sections at the eastern and western ends of the harbour has been calculated for two scenarios (i.e. with and without the SCL IMT tunnel respectively) as described in Sections 11.151 and 11.152.  The mean and maximum discharge rates, during the flood and ebb tides, through Victoria Harbour under these two scenarios are presented in Table 11.19.  The eastern cross section is located across the Lei Yue Mun Channel, while the western cross section is located between Yau Ma Tei and Sheung Wan (Figure No. NEX2213/C/331/ENS/M59/015).

11.196   The model results indicated that the operation of the SCL IMT tunnel would not change the mean discharge through Victoria Harbour by more than 0.1%. As shown in Appendix 6.1, the seabed level upon the installation of SCL IMT tunnel and its armour will be generally lower than the level of the existing Cross Harbour Tunnel.  Hence any change in flow regime due to the SCL IMT tunnel is likely to be masked by hydrodynamic effect due to the elevation of the existing Cross Harbor Tunnel.  Considering the marginal change in flow discharge through Victoria Harbour, no major impacts on the assimilative capacity and, thus, the water quality of Victoria Harbour is expected to occur as a result of the Project.  No mitigation measures specific to operational phase hydrodynamic / hydrology impact would be required.

Table 11.19               Discharge Rates at Cross Sections to the East and West of Victoria Harbour

Cross Section

Season

Tidal Phase

Mean Discharge (m3 s-1)

Percentage Change (%)

Baseline

(without SCL)

Scenario A

Operation

(with SCL)

Scenario B

Due to

SCL Operation

Victoria Harbour East

Wet

Flood

3966

3968

0.04

Ebb

5147

5146

-0.04

Dry

Flood

5072

5069

-0.06

Ebb

3883

3882

-0.04

Victoria Harbour West

Wet

Flood

3227

3229

0.05

Ebb

4305

4303

-0.04

Dry

Flood

4324

4320

-0.07

Ebb

3142

3140

-0.04

Cross Section

Season

Tidal Phase

Maximum Discharge (m3 s-1)

Percentage Change (%)

Baseline

(without SCL)

Scenario A

Operation

(with SCL)

Scenario B

Due to

SCL Operation

Victoria Harbour East

Wet

Flood

8905

8903

-0.02

Ebb

12315

12308

-0.05

Dry

Flood

10167

10161

-0.06

Ebb

10683

10680

-0.04

Victoria Harbour West

Wet

Flood

7174

7177

0.04

Ebb

9910

9910

0.01

Dry

Flood

8322

8315

-0.07

Ebb

8261

8257

-0.04


Run-off and Foul Water Discharges from Railway Tunnels

11.197   The proposed railway tunnel is a confined environment and hence there would not be any rainwater run-off. During rainstorms, water falls from the train when it enters to the railway tunnel may however generate a small amount of tunnel run-off.  The tunnel wall should be equipped with water-tight liner to avoid ground water seepage. The amount of groundwater seepage into the tunnel would be insignificant. Any tunnel run-off could be contaminated with limited amount of grease and iron from passing trains or from maintenance activities. Sources of foul water discharges from the railway tunnel would include the tunnel track wash and fire protection water discharges. The discharge quality of any tunnel run-off and tunnel foul water should satisfy the standards listed in the TM-DSS.  Standard oil/grit interceptors/chambers should be provided to remove the oil, lubricants, grease, silt and grit from the tunnel run-off and foul water before discharging into the public storm drainage / foul sewerage systems.  No adverse water quality impacts would be expected.

Sewage and Wastewater Effluents from Stations and Ventilation Building

11.198   Sources of sewage and wastewater that will be generated from the stations and ventilation building would include the toilet sanitary wastewater, fire protection water discharges, floor cleaning / washed water and mechanical equipment wastewater. All sewage and wastewater effluent will be discharged into the public foul sewers.  All the sewage effluents will be treated as necessary to satisfy the discharge standards stipulated in the TM-DSS.

Station and Ventilation Building Run-off

11.199   The above-ground buildings are likely to be completely enclosed and therefore run-off will be limited to wash-off from the outside of the building.  Sources of potentially polluted stormwater that may arise from the building run-off include dust from the roof of the buildings and cleaning agents used for washing building facade.  Run-off from the buildings would contain low levels of SS and surfactants used for washing.  Water quality impacts from station and ventilation run-off would be minimal.

Mitigation of Environmental Impacts

Mitigation Measures for Marine Construction

Temporary Reclamation at Hung Hom Landfall and Associated Works

11.200   All excavation and tunnel construction works will be undertaken within the cofferdam and there will be no open dredging.  It is anticipated that no water quality impact would be arising from these works and hence no mitigation measures are required for these construction works.

11.201   Removal of fender piles of Hung Hom Bypass and minor marine piling works will be carried out prior to the construction of the elevated platform adjacent to the cofferdam at Hung Hom Landfall.  Reinstatement of the fender piles will be carried out upon completion of tunnel section.  Potential release of sediment due to abovementioned works could be minimized by installation of silt curtains surrounding the works area as appropriate.

Temporary Reclamation and Dredging within CBTS for the Project

11.202   The following measures have been implemented in the design of the proposed temporary reclamation and dredging within the CBTS to minimise the impacts on water quality:

Ÿ  Temporary reclamation will adopt an approach where temporary seawalls will first be formed to enclose each phase of the temporary reclamation.  Installation of diaphragm wall on temporary reclamation as well as any bulk filling will proceed behind the completed seawall.  Any gaps that may need to be provided for marine access will be shielded by silt curtains to control sediment plume dispersion away from the site.  Demolition of temporary reclamation including the demolition of the diaphragm wall and dredging to the existing seabed levels will also be carried out behind the temporary seawall.  Temporary seawall will be removed after completion of all excavation and dredging works for demolition of the temporary reclamation.

Ÿ  During construction of the temporary reclamation, temporary seawall will be partially constructed to protect the nearby seawater intakes from further dredging activities.  For example, the seawalls along the southeast and northeast boundaries of PW1.1 shall be constructed first (above high water mark) so that the seawater intake at the inner water would be protected from the impacts from the remaining dredging activities along the northwest boundary;

Ÿ  Dredging will be carried out by closed grab dredger to minimize release of sediment and other contaminants during dredging.

Ÿ  Silt curtains will be deployed to fully enclose the closed grab dredger and shall be extended from water surface to the seabed, as far as practicable, during any dredging operation;

Ÿ  Silt screens will be installed at the cooling water intakes within the CBTS during the temporary reclamation period;

Ÿ  Site audit and water quality monitoring shall be carried out at the seawater intakes during the dredging operations.

11.203   In addition, no more than two dredgers (of about 8 m3 capacity each) shall be operated for dredging within the typhoon shelter at any time for the tunnel construction works.  Moreover, the combined dredging rate for all concurrent dredging works (include dredging works for concurrent projects such as WDII and CWB) to be undertaken within the CBTS shall not exceed 6,000 m3 per day (and 375 m3 per hour with a maximum working period of 16 hours per day) throughout the entire construction period.

IMT Construction and Dredging for SCL2 in Open Harbour outside the CBTS for the Project

11.204   The following measures have been implemented in the design of IMT construction to minimize the impacts on water quality

Ÿ  Bulk filling along the IMT tunnel alignment would be carried out after the bulk dredging works are completed.  Hence, bulk dredging and bulk filling along the IMT alignment would not be undertaken at the same time.

Ÿ  Dredging for IMT and SCL2 construction will be carried out by closed grab dredger to minimize release of sediment and other contaminants during dredging.

Ÿ  No more than one closed grab dredger (of about 18m3 capacity) would be operated at the same time for IMT and SCL2 construction.

Ÿ  Dredging for SCL2 construction will not be carried out concurrently with the dredging / filling works for IMT construction.

11.205   The following measures are recommended to be implemented during the construction of the northern IMT segment in the near shore region within 200 m from the Hung Hom landfall to minimize the impacts on water quality:

Ÿ  Floating type or frame type silt curtains shall be deployed around the dredging / filling operations within 200m from the Hung Hom landfall;

Ÿ  Silt screens shall be installed at the cooling water intakes for East Rail Extension, Metropolis and Hong Kong Coliseum (namely 21, 34 and 35 respectively) which are in close vicinity of the northern IMT segment.

11.206   In view of the difficulties and low effectiveness of installing floating type silt curtains near the fairway with high current speeds, deployment of frame type silt curtains is recommended for the remaining IMT segments outside 200 m from the Hung Hom landfall. In other words, silt curtains shall be deployed to enclose the IMT dredging / filling operations area, as shown in Table 11.25. For conservative predictions, the effect of silt curtains has not been considered in calculating the sediment loss rate under the mitigated scenario.  Hence, the changes in the sediment plume impacts from the IMT dredging under the mitigated scenario as compared to the unmitigated scenario are the sole effect of the reduced dredging rate as recommended in Section 11.210 below.  The indicative silt curtain arrangement is provided in Appendix 11.13.

11.207   The following precautionary / mitigation measures will be adopted to minimize the potential water quality impacts from the underwater blasting work, if required:

Ÿ    Charge will be placed in cores within the rock in order that there will be no blast directly into the water. The shock wave pressures will be reduced as much as possible;

Ÿ    In terms of the construction sequence, sediment dredging (within the planned IMT works area) will be conducted prior to underwater blasting. Entrainment of suspended solids can then be minimized during the underwater blasting.

Application of Silt Screens Recommended under Other Concurrent (Non-SCL) Projects

11.208   The water quality modelling and assessments have incorporated the effects of mitigation measures recommended under the WDII & CWB, CKR and CT Dredging projects, including the deployment of silt screens at all the cooling water intakes located within the WDII & CWB works boundaries (namely 1, 2, 3, 4, 5, 6, 7, 8 and 9) as well as the WSD flushing water intakes close to the marine works (namely WSD7, WSD9, WSD10, WSD15, WSD17, WSD19 and A).  Table 11.20 summarizes the application of silt screens recommended under other concurrent projects which are included in the modelling for Scenario 1.  Locations of these seawater intakes are shown in Figure No. NEX2213/C/331/ENS/M59/001 to NEX2213/C/331/ENS/M59/003.


Table 11.20   Application of Silt Screens Recommended under Other Concurrent Projects for Scenario 1 and Scenario 2

WSR

Proposed Locations with Deployment of Silt Screens

WSD Flushing Water Intakes

Ÿ   Kowloon South No. 2 (WSD7),

Ÿ   Tai Wan (WSD9) note 1,

Ÿ   Cha Kwo Ling (WSD10),

Ÿ   Sai Wan Ho (WSD15),

Ÿ   Quarry Bay (WSD17) note 1,

Ÿ   Sheung Wan (WSD19), and

Ÿ   Wan Chai (Reprovisioned) (A) note 1.

Cooling Water Intakes

Ÿ   Hong Kong Convention and Exhibition Centre Extension (1),

Ÿ   Hong Kong Convention and Exhibition Centre Phase I (3),

Ÿ   Telecom House / HK Academy for Performing Arts / Shun On Centre (2),

Ÿ   Wan Chai Tower / Revenue Tower / Immigration Tower and Sun Hung Kai Centre (Reprovisioned) & Proposed Exhibition Station (4, 6 and 7),

Ÿ   Great Eagle Centre / China Resources Building (5),

Ÿ   Excelsior Hotel & World Trade Centre / No. 27 – 63 Paterson Street (8) note 1, and

Ÿ   Windsor House (9) note 1.

Notes:

1.        Amongst all the intakes listed in Table 11.20 above, only three WSD intakes, namely Tai Wan (WSD9), Quarry Bay (WSD17) and Wan Chai (A), and only 2 cooling water intakes, namely Excelsior Hotel /World Trade Centre / No. 27 – 63 Paterson Street (8) and Windsor House (9), would be affected by the SCL Project, Based on the model results (succeeding discussion in Sections 11.204 to 11.207), all the remaining intakes listed in Table 11.20 above are located outside the water quality influence zone of the SCL marine works and thus would not be affected by the SCL Project. The contractor of the SCL Project would be responsible for installation and maintenance of silt screens for these five intakes (ie WSD9, WSD17, A, 8 and 9) as mentioned above as well as four additional intakes (namely 14, 21, 34 and 35) as specified in Table 11.23.

Further Mitigation Measures

Scenario 1

11.209   As shown in Table 11.13, exceedances of target SS standard were predicted at three flushing water intakes at Wan Chai, Quarry Bay and Kowloon Station (namely A, WSD17 and 14 respectively) even after implementation of all the design and mitigation measures recommended in Table 11.20 above, including the deployment of silt screen around the WSD Quarry Bay intake and Wan Chai intake.

11.210   To further mitigate the SS impacts, it is recommended to reduce the maximum production rate for IMT dredging and dredging at SCL2 along the Project alignment from 6,667 m3 per day to 2,500m3 per day (thus the maximum production rate for bulk filling for the IMT tunnel shall be less than 2,500 m3 per day). That is, the hourly production rate for dredging or bulk filling within the open Victoria Harbour (outside the breakwater of CBTS) shall not exceed 156 m3 per hour (if there are other concurrent marine works in Victoria Harbour) and the maximum working hour for the dredging / bulk filling works shall be 16 hours per day (refer to Table 11.24 below). Model results indicated that full compliance with the WSD standard would be achieved at the WSD Quarry Bay intake and Wan Chai intake (namely WSD17 and A respectively) after reducing the dredging rate for IMT construction to 2,500m3 per day.  If no silt screen is applied at the intake point, exceedance of SS criterion was still predicted at the Kowloon Station flushing water intake (namely 14) after reducing the IMT / SCL2 dredging rate to 2,500m3 per day..  Thus, deployment of silt screen around the Kowloon Station Intake is also recommended as an appropriate measure to further minimize the water quality impact.

Scenario 2

11.211   Scenario 2 aimed to assess the potential water quality impacts due to the Project works in the open harbour alone. The model predicted that the maximum production rates of the dredging / filling works for construction of the IMT and SCL2 in the open harbour under the Project can be increased to 4,500m3 per day if there is no other concurrent marine / dredging works in the Victoria Harbour. That is, the hourly production rate for dredging or bulk filling within the open Victoria Harbour (outside the breakwater of CBTS) shall not exceed 281 m3 per hour (if there is no other concurrent marine works in Victoria Harbour) and the maximum working hour for the dredging / bulk filling works shall be 16 hours per day (refer to Table 11.24 below).  Similar to Scenario 1, deployment of silt screen around the Kowloon Station Intake would be required under Scenario 2 to minimize the water quality impact due to its close proximity to the Project works.

Sediment Plume Model Results for Mitigated Scenario

11.212   Table 11.21 and Table 11.22 below summarize the predicted SS levels at the intakes after implementation of the further mitigation measures under Scenario 1 and Scenario 2.  With the recommended further measures (as discussed in Sections 11.209 to 11.211 above), the SS levels predicted at all the seawater intakes would fully comply with the WSD standard.

Table 11.21   Predicted Suspended Solids Concentrations at Seawater Intakes for Scenario 1 – Mitigated

WQ Sensitive Receivers (ID)

SS concentration (absolute value) in mid-depth (mg/l)

Criterion

Dry Season

Wet Season

Mean

Maximum

% time in

compliance

Mean

Maximum

% time in

compliance

Cooling Water Intakes

MTR Tsing Yi Station (C12)

< 40

5.95

7.56

100.00%

7.45

8.79

100.00%

Daily Farm Ice Plant (C22)

-

4.36

5.29

-

6.33

15.87

-

Pamela Youde Nethersole Eastern Hospital (C23)

-

3.98

4.22

-

5.23

5.94

-

Prince's Building Group (C29)

-

5.57

9.94

-

7.88

17.86

-

HSBC & AIG Tower (C30)

-

5.44

8.59

-

7.82

12.55

-

Queensway Government Offices (C31)

-

5.40

8.18

-

7.85

13.33

-

MTR New South Intake (C32)

< 40

5.53

9.48

100.00%

7.80

12.65

100.00%

Kai Tak DCS (C33)

-

4.42

4.48

-

6.75

9.54

-

Hong Kong Convention and Exhibition Centre Extension (Existing) (1) See Note (4)

-

2.00

2.83

-

2.89

4.60

-

Telecom House / HK Academy for Performing / Shui On Centre (Reprovisioned) (2) See Note (4)

-

1.94

2.67

-

2.93

4.89

-

Hong Kong Convention and Exhibition Centre Phase I (Reprovisioned) (3) See Note (4)

-

2.10

4.24

-

3.03

5.84

-

Wan Chai Tower / Revenue Tower / Immigration Tower (Reprovisioned) (4) See Note (4)

-

2.09

3.41

-

2.97

4.85

-

Great Eagle Centre / China Resources Building (Reprovisioned) (5) See Note (4)

-

2.21

4.09

-

3.11

7.23

-

Sun Hung Kai Centre (Reprovisioned) & Proposed Exhibition Station (6&7) See Note (4)

-

1.92

2.96

-

3.10

6.35

-

Excelsior Hotel & World Trade Centre / No. 27-63 Paterson Street (8) See Note (4)

-

2.88

2.88

-

2.94

3.96

-

Windsor House (9) See Note (4)

-

3.00

3.56

-

3.58

10.69

-

City Garden (11)

-

4.68

7.50

-

6.84

16.22

-

Provident Centre (12)

-

4.96

10.09

-

7.32

24.01

-

MTR (Kowloon Station) (13)

< 40

5.22

10.13

100.00%

7.33

11.94

100.00%

China H.K. City (15)

-

5.13

6.75

-

7.14

9.81

-

Harbour City (16)

-

4.87

5.51

-

7.10

11.05

-

Ocean Centre (17)

-

4.87

5.36

-

7.04

9.68

-

Ocean Terminal (18)

-

5.07

7.07

-

7.32

10.37

-

Government Premises (19)

-

5.42

11.33

-

8.04

21.75

-

New World Centre (20)

-

5.77

15.78

-

8.79

21.57

-

East Rail Extension (21)

< 40

4.78

7.86

100.00%

6.94

10.77

100.00%

Metropolis (34)

-

4.54

5.77

-

6.55

12.15

-

Hong Kong Coliseum (35)

-

4.57

5.92

-

6.58

13.46

-

West Kowloon Terminus, MTR (B)

< 40

4.90

7.51

100.00%

7.03

9.58

100.00%

Saltwater Intakes

Kowloon South No. 2 (WSD7) See Note (4)

< 10

2.86

3.01

100.00%

2.86

3.57

100.00%

Tai Wan (WSD9) See Note (4)

< 10

1.85

3.00

100.00%

2.07

3.23

100.00%

Cha Kwo Ling (WSD10) See Note (4)

< 10

1.68

1.85

100.00%

2.07

2.46

100.00%

Tseng Kwan O (WSD12)

< 10

3.69

3.70

100.00%

4.99

5.50

100.00%

Siu Sai Wan (WSD13)

< 10

4.00

4.08

100.00%

5.22

5.96

100.00%

Sai Wan Ho (WSD15) See Note (4)

< 10

1.75

2.28

100.00%

2.33

3.43

100.00%

Quarry Bay (WSD17) See Note (4)

< 10

1.88

2.79

100.00%

2.49

6.39

100.00%

Sheung Wan (WSD19) See Note (4)

< 10

2.17

2.74

100.00%

2.95

3.89

100.00%

Kennedy Town (WSD20)

< 10

5.21

5.86

100.00%

7.14

7.29

100.00%

Wan Chai (Reprovisioned) (A) See Note (4)

< 10

1.95

2.96

100.00%

3.14

6.35

100.00%

Kowloon Station (14)

< 10

2.10

3.99

100.00%

2.91

4.86

100.00%

Notes:

1.        The water quality modelling results for 90 percentile SS predicted under the pre-construction scenario at the corresponding indicator points is adopted as the ambient SS levels.

2.        Maximum dredging rate for IMT construction was reduced from 6,667m3 per day to 2,500m3 per day.

3.        Other seawater intakes that are not shown in this table were found not be impacted by the proposed marine works for the Project.

4.        The SS levels predicted at this specific intake has incorporated the effect from deployment of silt screen around the intake as recommended under the approved EIA for WDII and CWB and CT Dredging, refer to Section 11.156

Table 11.22   Predicted Suspended Solids Concentrations at Seawater Intakes for Scenario 2 – Mitigated

WQ Sensitive Receivers (ID)

SS concentration (absolute value) in mid-depth (mg/l)

Criterion

Dry Season

Wet Season

Mean

Maximum

% time in

compliance

Mean

Maximum

% time in

compliance

Cooling Water Intakes

MTR Tsing Yi Station (C12)

< 40

5.94

7.09

100.00%

7.41

8.45

100.00%

Daily Farm Ice Plant (C22)

-

4.26

5.17

-

6.17

7.43

-

Pamela Youde Nethersole Eastern Hospital (C23)

-

3.95

4.13

-

5.17

6.32

-

Prince's Building Group (C29)

-

5.85

13.48

-

7.89

25.91

-

HSBC & AIG Tower (C30)

-

5.68

10.41

-

7.81

15.91

-

Queensway Government Offices (C31)

-

5.58

9.60

-

7.88

18.33

-

MTR New South Intake (C32)

< 40

5.80

12.83

100.00%

7.75

14.38

100.00%

Kai Tak DCS (C33)

-

4.42

4.51

-

6.38

7.11

-

Hong Kong Convention and Exhibition Centre Extension (Existing) (1) See Note (4)

-

2.05

3.61

-

2.89

6.08

-

Telecom House / HK Academy for Performing / Shui On Centre (Reprovisioned) (2) See Note (4)

-

1.96

3.29

-

2.90

4.86

-

Hong Kong Convention and Exhibition Centre Phase I (Reprovisioned) (3) See Note (4)

-

2.19

5.68

-

3.04

8.06

-

Wan Chai Tower / Revenue Tower / Immigration Tower (Reprovisioned) (4) See Note (4)

-

2.19

4.44

-

2.97

6.29

-

Great Eagle Centre / China Resources Building (Reprovisioned) (5) See Note (4)

-

2.37

5.87

-

3.12

10.57

-

Existing Sun Hung Kai Centre (Reprovisioned) and (6) See Note (4)

-

1.98

3.86

-

3.01

6.99

-

Excelsior Hotel & World Trade Centre / No. 27-63 Paterson Street (8) See Note (4)

-

2.88

2.88

-

2.88

2.88

-

Windsor House (9) See Note (4)

-

2.99

2.99

-

3.00

4.43

-

City Garden (11)

-

4.77

9.92

-

6.90

23.90

-

Provident Centre (12)

-

5.13

14.59

-

7.39

37.91

-

MTR (Kowloon Station) (13)

< 40

5.39

14.37

100.00%

7.37

14.45

100.00%

China H.K. City (15)

-

5.17

8.18

-

7.16

10.61

-

Harbour City (16)

-

4.87

6.02

-

7.13

13.18

-

Ocean Centre (17)

-

4.86

4.86

-

7.04

10.37

-

Ocean Terminal (18)

-

5.08

8.16

-

7.38

12.32

-

Government Premises (19)

-

5.54

16.23

-

8.20

33.50

-

New World Centre (20)

-

5.86

24.12

-

8.69

31.32

-

East Rail Extension (21)

< 40

4.80

10.44

100.00%

6.94

14.01

100.00%

Metropolis (34)

-

4.56

6.85

-

6.60

16.85

-

Hong Kong Coliseum (35)

-

4.60

6.79

-

6.66

19.20

-

West Kowloon Terminus, MTR (B)

< 40

4.95

8.23

100.00%

7.06

10.34

100.00%

Saltwater Intakes

Kowloon South No. 2 (WSD7) See Note (4)

< 10

2.77

2.89

100.00%

2.69

3.12

100.00%

Tai Wan (WSD9) See Note (4)

< 10

1.83

3.99

100.00%

1.98

2.68

100.00%

Cha Kwo Ling (WSD10) See Note (4)

< 10

1.67

1.84

100.00%

2.03

2.61

100.00%

Tseng Kwan O (WSD12)

< 10

3.69

3.70

100.00%

5.15

6.06

100.00%

Siu Sai Wan (WSD13)

< 10

3.99

4.06

100.00%

5.17

6.32

100.00%

Sai Wan Ho (WSD15) See Note (4)

< 10

1.74

2.59

100.00%

2.28

3.94

100.00%

Quarry Bay (WSD17) See Note (4)

< 10

1.91

3.42

100.00%

2.44

7.66

100.00%

Sheung Wan (WSD19) See Note (4)

< 10

2.24

3.30

100.00%

2.93

3.82

100.00%

Kennedy Town (WSD20)

< 10

5.23

6.21

100.00%

7.13

7.27

100.00%

Wan Chai (Reprovisioned) (A) See Note (4)

< 10

1.98

3.86

100.00%

3.01

6.99

100.00%

Kowloon Station (14)

< 10

2.17

4.52

100.00%

2.94

6.17

100.00%

Notes:

1.        The water quality modelling results for 90 percentile SS predicted under the pre-construction scenario at the corresponding indicator points is adopted as the ambient SS levels.

2.        Maximum dredging rate for IMT construction is assumed to be 4,500m3 per day (only for the case with no other concurrent marine / dredging works in the Victoria Harbour).

3.        Other seawater intakes that are not shown in this table were found not be impacted by the proposed marine works for SCL.

4.        The SS levels predicted at this specific intake has incorporated the effect from deployment of silt screen around the intake as recommended under the approved EIA for WDII and CWB and CT Dredging, refer to Section 11.156

11.213   Under the approved EIA for WDII & CWB and CT Dredging, silt screens were recommended to be installed at seven WSD intakes (namely Kowloon South No. 2, Tai Wan, Cha Kwo Ling, Sai Wan Ho, Quarry Bay, Sheung Wan and Wan Chai respectively), refer to Table 11.20.  Based on the model results, even without the other concurrent (non SCL) projects (e.g. CWB, CT Dredging, Road T2 and CKR), the influence of SS from the IMT construction (for the Project) upon three of these WSD intakes (namely Tai Wan, Quarry Bay and Wan Chai respectively) would still be large.  As such, deployment of silt screens at these three WSD intakes (namely Tai Wan, Quarry Bay and Wan Chai) would still be required during the IMT construction period even without other concurrent dredging activities.  The model results also indicated that the remaining four WSD intakes (at Kowloon South No. 2, Cha Kwo Ling, Sheung Wan and Sai Wan Ho respectively) were not significantly influenced by the Project works and thus deployment of silt screens at these intakes is considered unnecessary.  Table 11.23 and Table 11.24 summarize the applications of silt screens and the maximum production rates recommended under the SCL project.  Table 11.25 summarizes the application of silt curtains for the Project activities.  Typical configuration of silt curtains and silt screens, design and set-up of silt curtain are shown in Appendix 11.13.

Table 11.23       Application of Silt Screens Recommended under the Project

SCL Activities

Deployment of Silt Screens

SCL tunnel construction within the CBTS

Cooling Water Intakes for Excelsior Hotel and World Trade Centre (namely Intake 8) and Windsor House (namely Intake 9)

IMT / SCL2 construction  in the open harbour along the SCL alignment

Flushing Water Intakes at Kowloon Station, Tai Wan, Quarry Bay and Wan Chai (namely Intakes 14, WSD9, WSD17 and A respectively)


IMT construction in Victoria Harbour within 200 m from the Hung Hom Landfall

Cooling Water Intakes for East Rail Extension, Metropolis and Hong Kong Coliseum (namely Intakes 21, 34 and 35 respectively)


Table 11.24       Recommended Maximum Production Rates for the Project Activities

Activities

Maximum Production Rate

m3 per day

m3 per hour

m3 per week

The combined production rate for all dredging activities within Causeway Bay Typhoon Shelter

6,000

375

36,000

Dredging / filling in open Harbour area for IMT / SCL2  construction

Case 1 - With other concurrent marine works in Victoria Harbour

2,500

156

15,600

Case 2 - Without other concurrent marine works in Victoria Harbour

4,500

281

27,000

Notes:

1.        Dredging to be carried out by closed grab dredger (16 hours per day, 6 days per week);

Table 11.25       Application of Silt Curtain Recommended under the Project

Areas of Application  

Dredging within Causeway Bay Typhoon Shelter

Dredging / filling works for IMT construction

Compliance with WQO for SS Elevation

11.214   The sediment plumes (SS elevation) under mitigated scenario are shown in Appendix 11.8 for Scenario 1 and Appendix 11.10 for Scenario 2. Each of the figures attached in the appendix contains two contour plots where the upper plot shows the unmitigated scenario and the lower plot shows the mitigated scenario. The mixing zone indicated in Appendix 11.8 has considered the cumulative impacts from SCL and other concurrent marine works in the harbour. To provide an indication on the potential water quality impact caused by the Project works alone, the maximum dimension of the mixing zone for SS elevation (contributed from the Project alone) is presented in Appendix 11.9 for Scenario 1. As shown in the contour plots, the mixing zone for SS (i.e. SS elevation of higher than 30% of ambient baseline level) is predicted to be significantly reduced and is considered acceptable after implementation of the recommended mitigation measures.

Other Mitigation Measures

11.215   Other good site practices that shall be undertaken during filling and dredging include:

Ÿ  mechanical grabs, if used, shall be designed and maintained to avoid spillage and sealed tightly while being lifted;

Ÿ  all vessels shall be sized so that adequate clearance is maintained between vessels and the seabed in all tide conditions, to ensure that undue turbidity is not generated by turbulence from vessel movement or propeller wash;

Ÿ  all hopper barges and dredgers shall be fitted with tight fitting seals to their bottom openings to prevent leakage of material;

Ÿ  construction activities shall not cause foam, oil, grease, scum, litter or other objectionable matter to be present on the water within the site or dumping grounds;

Ÿ  loading of barges and hoppers shall be controlled to prevent splashing of dredged material into the surrounding water.  Barges or hoppers shall not be filled to a level that will cause the overflow of materials or polluted water during loading or transportation;

Ÿ  before commencement of the temporary reclamation works, the holder of the Environmental Permit shall submit plans showing the phased construction of the reclamation, design and operation of the silt curtain.

11.216   The following mitigation measures are proposed to minimize the potential water quality impacts from the construction works at or close to the seafront:

·         Temporary storage of construction materials (e.g. equipment, filling materials, chemicals and fuel) and temporary stockpile of construction and demolition materials shall be located well away from the seawater front and storm drainage during carrying out of the works.

·         Stockpiling of construction and demolition materials and dusty materials shall be covered and located away from the seawater front and storm drainage.

·         Construction debris and spoil shall be covered up and/or disposed of as soon as possible to avoid being washed into the nearby receiving waters.

11.217   The following mitigation measures are proposed to minimize the potential water quality impacts from any marine piling works:

·         The potential release of sediment or excavated materials could be controlled through the installation of silt curtains surrounding the works area as necessary.

·         Spoil shall be collected by sealed hopper barges for proper disposal.

Regular Maintenance of Silt Screens

11.218   Silt screens are recommended to be deployed at the seawater intakes during the construction works period.  Installation of silt screens at the seawater intake points may cause a potential for accumulation and trapping of pollutants, floating debris and refuse behind the silt screens and may lead to potential water quality deterioration at the seawater intake points.  Major sources of pollutants and floating refuse include the runoff and storm water discharges from the nearby coastal areas.  As a mitigation measure to avoid the pollutant and refuse entrapment problems and to ensure that the impact monitoring results are representative, regular maintenance of the silt screens and refuse collection shall be performed at the monitoring stations at regular intervals on a daily basis.  The Contractor shall be responsible for keeping the water behind the silt screen free from floating rubbish and debris during the impact monitoring period.

Floating Refuse and Debris

11.219   Floating refuse and debris may arise from illegal dumping and littering from marine vessels and runoff from the coastal areas.  It is recommended that collection and removal of floating refuse shall be performed at regular intervals on a daily basis.  The Contractor shall be responsible for keeping the water within the site boundary and the neighbouring water free from rubbish during the dredging works.

Shek O Casting Basin Washdown, Flooding and Draining

11.220   Any wastewater including washdown waters and any concrete curing waters generated from the casting basin shall be drained to the wastewater treatment unit.  Appropriate treatment process such as sedimentation and oil removal shall be employed for the wastewater treatment units so that any discharge from the casting basin will comply with standards stipulated in the TM-DSS. Recovered oil from any oil interceptor shall be properly contained, labeled and stored on site prior to collection by licensed collectors for disposal. 

11.221   During the flooding of the basin with seawater (accomplished by pumps) no escape of water could occur as the cofferdam will still be in place.  Prior to opening a channel through the cofferdam, water inside the basin will be skimmed of floating debris. A period of settling of 24 hours before opening the basin to the sea would allow much of the suspended material to settle out.  The channel through the cofferdam will only be opened with the approval of the Site Engineer to the effect that all reasonable steps had been taken to remove contaminants.

Mitigation Measures for Land-based Construction

Construction Site Run-off and General Construction Activities for Onsite and Offsite Works

11.222   The site practices outlined in ProPECC PN 1/94 “Construction Site Drainage” shall be followed as far as practicable in order to minimise surface run-off and the chance of erosion.  Effluent discharged from the construction site shall comply with the standards stipulated in the TM-DSS.  The following measures are recommended to protect water quality and sensitive uses of the coastal area, and when properly implemented shall be sufficient to adequately control site discharges so as to avoid water quality impacts:

Surface Run-off

11.223   Surface run-off from construction sites shall be discharged into storm drains via adequately designed sand/silt removal facilities such as sand traps, silt traps and sedimentation basins.  Channels or earth bunds or sand bag barriers shall be provided on site to properly direct stormwater to such silt removal facilities.  Perimeter channels at site boundaries shall be provided where necessary to intercept storm run-off from outside the site so that it will not wash across the site.  Catchpits and perimeter channels shall be constructed in advance of site formation works and earthworks.

11.224   Silt removal facilities, channels and manholes shall be maintained and the deposited silt and grit shall be removed regularly, at the onset of and after each rainstorm to prevent local flooding.  Any practical options for the diversion and re-alignment of drainage shall comply with both engineering and environmental requirements in order to provide adequate hydraulic capacity of all drains.  Minimum distances of 100 m shall be maintained between the discharge points of construction site runoff and the existing saltwater intakes.

11.225   Construction works shall be programmed to minimize soil excavation works in rainy seasons (April to September).  If excavation in soil cannot be avoided in these months or at any time of year when rainstorms are likely, for the purpose of preventing soil erosion, temporary exposed slope surfaces shall be covered e.g. by tarpaulin, and temporary access roads shall be protected by crushed stone or gravel, as excavation proceeds.  Intercepting channels shall be provided (e.g. along the crest / edge of excavation) to prevent storm runoff from washing across exposed soil surfaces.  Arrangements shall always be in place in such a way that adequate surface protection measures can be safely carried out well before the arrival of a rainstorm.

11.226   Earthworks final surfaces shall be well compacted and the subsequent permanent work or surface protection shall be carried out immediately after the final surfaces are formed to prevent erosion caused by rainstorms.  Appropriate drainage like intercepting channels shall be provided where necessary.

11.227   Measures shall be taken to minimize the ingress of rainwater into trenches.  If excavation of trenches in wet seasons is necessary, they shall be dug and backfilled in short sections.  Rainwater pumped out from trenches or foundation excavations shall be discharged into storm drains via silt removal facilities.

11.228   Open stockpiles of construction materials (e.g. aggregates, sand and fill material) on sites shall be covered with tarpaulin or similar fabric during rainstorms.

11.229   Manholes (including newly constructed ones) shall always be adequately covered and temporarily sealed so as to prevent silt, construction materials or debris from getting into the drainage system, and to prevent storm run-off from getting into foul sewers.  Discharge of surface run-off into foul sewers must always be prevented in order not to unduly overload the foul sewerage system.

11.230   Good site practices shall be adopted to remove rubbish and litter from construction sites so as to prevent the rubbish and litter from spreading from the site area.  It is recommended to clean the construction sites on a regular basis.

Boring and Drilling Water

11.231   Water used in ground boring and drilling for site investigation or rock / soil anchoring shall as far as practicable be re-circulated after sedimentation.  When there is a need for final disposal, the wastewater shall be discharged into storm drains via silt removal facilities.

Wastewater from Concrete Batching Plant

11.232   Wastewater generated from the washing down of mixing trucks and drum mixers and similar equipment shall whenever practicable be used for other site activities.  The discharge of wastewater shall be kept to a minimum and shall be treated to meet the appropriate standard as specified in the TM-DSS before discharging.

11.233   To prevent pollution from wastewater overflow, the pump of any wastewater system shall be provided with an on-line standby pump of adequate capacity and with automatic alternating devices.

11.234   Under normal circumstances, surplus wastewater may be discharged into foul sewers after treatment in silt removal and pH adjustment facilities (to within the pH range of 6 to 10).  Disposal of wastewater into storm drains will require more elaborate treatment.

Wheel Washing Water

11.235   All vehicles and plant shall be cleaned before they leave a construction site to minimize the deposition of earth, mud, debris on roads.  A wheel washing bay shall be provided at every site exit if practicable and wash-water shall have sand and silt settled out or removed before discharging into storm drains.  The section of construction road between the wheel washing bay and the public road shall be paved with backfall to reduce vehicle tracking of soil and to prevent site run-off from entering public road drains.

Bentonite Slurries

11.236   Bentonite slurries used in diaphragm wall and bore-pile construction shall be reconditioned and used again wherever practicable.  If the disposal of a certain residual quantity cannot be avoided, the bentonite slurries shall either be dewatered or mixed with inert fill material for disposal to a public filling area.

11.237   If the used bentonite slurry is intended to be disposed of through the public drainage system, it shall be treated to the respective effluent standards applicable to foul sewer, storm drains or the receiving waters as set out in the TM-DSS.

Water for Testing & Sterilization of Water Retaining Structures and Water Pipes

11.238   Water used in water testing to check leakage of structures and pipes shall be used for other purposes as far as practicable.  Surplus unpolluted water will be discharged into storm drains.

11.239   Sterilization is commonly accomplished by chlorination.  Specific advice from EPD shall be sought during the design stage of the works with regard to the disposal of the sterilizing water.  The sterilizing water shall be used again wherever practicable.

Wastewater from Building Construction

11.240   Before commencing any demolition works, all sewer and drainage connections shall be sealed to prevent building debris, soil, sand etc. from entering public sewers/drains.

11.241   Wastewater generated from building construction activities including concreting, plastering, internal decoration, cleaning of works and similar activities shall not be discharged into the stormwater drainage system.  If the wastewater is to be discharged into foul sewers, it shall undergo the removal of settleable solids in a silt removal facility, and pH adjustment as necessary.

Acid Cleaning, Etching and Pickling Wastewater

11.242   Acidic wastewater generated from acid cleaning, etching, pickling and similar activities shall be neutralized to within the pH range of 6 to 10 before discharging into foul sewers.  If there is no public foul sewer in the vicinity, the neutralized wastewater shall be tankered off site for disposal into foul sewers or treated to a standard acceptable to storm drains and the receiving waters.

Wastewater from Site Facilities

11.243   Wastewater collected from any temporary canteen kitchens, including that from basins, sinks and floor drains, shall be discharged into foul sewer via grease traps.  In case connection to the public foul sewer is not feasible, wastewater generated from kitchens or canteen, if any, shall be collected in a temporary storage tank.  A licensed waste collector shall be deployed to clean the temporary storage tank on a regular basis.

11.244   Drainage serving an open oil filling point shall be connected to storm drains via petrol interceptors with peak storm bypass.

11.245   Vehicle and plant servicing areas, vehicle wash bays and lubrication bays shall as far as possible be located within roofed areas.  The drainage in these covered areas shall be connected to foul sewers via a petrol interceptor.  Oil leakage or spillage shall be contained and cleaned up immediately.  Waste oil shall be collected and stored for recycling or disposal in accordance with the Waste Disposal Ordinance.

Sewage from Workforce

11.246   Construction work force sewage discharges on site are expected to be discharged to the nearby existing trunk sewer or sewage treatment facilities.  If disposal of sewage to public sewerage system is not feasible, appropriate numbers of portable toilets shall be provided by a licensed contractor to serve the construction workers over the construction site to prevent direct disposal of sewage into the water environment.  The Contractor shall also be responsible for waste disposal and maintenance practices.

11.247   Notices shall be posted at conspicuous locations to remind the workers not to discharge any sewage or wastewater into the nearby environment.  Regular environmental audit on the construction site can provide an effective control of any malpractices and can encourage continual improvement of environmental performance on site.  It is anticipated that sewage generation during the construction phase of the project would not cause water pollution problem after undertaking all required measures.

Groundwater Seepages from Uncontaminated Areas

11.248   Appropriate measures will be deployed to minimize the intrusion of groundwater into excavation works areas.  In case seepage of uncontaminated groundwater occurs, groundwater shall be pumped out from the works areas and discharged into the storm system via silt removal facilities.  Uncontaminated groundwater from dewatering process shall also be discharged into the storm system via silt traps.

Site Run-off and Effluent from Contaminated Areas

11.249   If land contaminated site is identified from the Stage 2 SI work (refer to Sections 11.189 to 11.192), the following mitigation measures shall be implemented for the identified contaminated area.  Any transient pile of contaminated soil / material shall be minimized and shall be bottom-lined, bunded and covered with impervious membrane during rain event to avoid generation of contaminated runoff.  Appropriate intercepting channels and partial shelters shall be provided where necessary to prevent rainwater from collecting within trenches or footing excavations. Any contaminated water and wastewater generated from the decontamination process shall not be directly discharged to public sewers or site drainage. They shall be treated or tanked away as necessary for proper disposal in compliance with the TM-DSS.

Groundwater from Contaminated Areas

11.250   No direct discharge of groundwater from contaminated areas shall be adopted.  If land contamination impact and generation of contaminated groundwater is identified from the Stage 2 SI works (refer to Sections 11.189 to 11.192), the following mitigation measures shall be adopted.  Any contaminated groundwater shall be either properly treated in compliance with the requirements of the TM-DSS or properly recharged into the ground.  If wastewater treatment is deployed for treating the contaminated groundwater, the wastewater treatment unit shall deploy suitable treatment processes (e.g. oil interceptor / activated carbon) to reduce the pollution level to an acceptable standard and remove any prohibited substances (such as TPH) to an undetectable range. All treated effluent from the wastewater treatment plant shall meet the requirements as stated in TM-DSS and shall be discharged into the foul sewers.

11.251   If groundwater recharging wells are deployed, the recharging wells shall be installed as appropriate for recharging the contaminated groundwater back into the ground. The recharging wells shall be selected at places where the groundwater quality will not be affected by the recharge operation as indicated in Section 2.3 of the TM-DSS.  The baseline groundwater quality shall be determined prior to the selection of the recharge wells, and submit a working plan (including the laboratory analytical results showing the quality of groundwater at the proposed recharge location(s) as well as the pollutant levels of groundwater to be recharged) to EPD for agreement. Pollution levels of groundwater to be recharged shall not be higher than pollutant levels of ambient groundwater at the recharge well. Prior to recharge, any prohibited substance such as TPH products shall be removed as necessary by installing the petrol interceptor. The Contractor shall apply for a discharge licence under the WPCO through the Regional Office of EPD for groundwater recharge operation or discharge of treated groundwater.


Barging Points

11.252   Mitigation measures as outlined in Sections 11.223 to 11.229 shall be applied to minimize water quality impacts from site runoff and open stockpile of spoils at the proposed barging point where appropriate. Other good site practices include:

Ÿ     all vessels shall be sized so that adequate clearance is maintained between vessels and the seabed in all tide conditions, to ensure that undue turbidity is not generated by turbulence from vessel movement or propeller wash

Ÿ     all hopper barges shall be fitted with tight fitting seals to their bottom openings to prevent leakage of material

Ÿ     construction activities shall not cause foam, oil, grease, scum, litter or other objectionable matter to be present on the water within the site

Ÿ     loading of barges and hoppers shall be controlled to prevent splashing of material into the surrounding water.  Barges or hoppers shall not be filled to a level that will cause the overflow of materials or polluted water during loading or transportation

Effluent Discharge

11.253   There is a need to apply to EPD for a discharge licence for discharge of effluent from the construction site under the WPCO.  The discharge quality must meet the requirements specified in the discharge licence.  All the runoff and wastewater generated from the works areas shall be treated so that it satisfies all the standards listed in the TM-DSS.  Minimum distances of 100 m shall be maintained between the discharge points of construction site effluent and the existing seawater intakes.  The beneficial uses of the treated effluent for other on-site activities such as dust suppression, wheel washing and general cleaning etc., can minimise water consumption and reduce the effluent discharge volume.  If monitoring of the treated effluent quality from the works areas is required during the construction phase of the Project, the monitoring shall be carried out in accordance with the relevant WPCO licence which is under the ambit of regional office of EPD.

Accidental Spillage of Chemicals

11.254   Contractor must register as a chemical waste producer if chemical wastes would be produced from the construction activities.  The Waste Disposal Ordinance (Cap 354) and its subsidiary regulations in particular the Waste Disposal (Chemical Waste) (General) Regulation shall be observed and complied with for control of chemical wastes.

11.255   Any service shop and maintenance facilities shall be located on hard standings within a bunded area, and sumps and oil interceptors shall be provided.  Maintenance of vehicles and equipment involving activities with potential for leakage and spillage shall only be undertaken within the areas appropriately equipped to control these discharges.

11.256   Disposal of chemical wastes shall be carried out in compliance with the Waste Disposal Ordinance.  The Code of Practice on the Packaging, Labelling and Storage of Chemical Wastes” published under the Waste Disposal Ordinance details the requirements to deal with chemical wastes.  General requirements are given as follows:

Ÿ  Suitable containers shall be used to hold the chemical wastes to avoid leakage or spillage during storage, handling and transport.

Ÿ  Chemical waste containers shall be suitably labelled, to notify and warn the personnel who are handling the wastes, to avoid accidents.

Ÿ  Storage area shall be selected at a safe location on site and adequate space shall be allocated to the storage area.

Mitigation Measures for Operation Phase

Tunnel Run-off and Drainage

11.257   Mitigation measures are required to mitigate tunnel run-off from track during the operational phase as illustrated in follow: 

Ÿ     Track drainage channels discharge shall pass through oil/grit interceptors/chambers to remove oil, grease and sediment before discharging into public storm drainage / foul sewerage systems.

Ÿ     The silt traps and oil interceptors shall be cleaned and maintained regularly.

Ÿ     Oily contents of the oil interceptors shall be transferred to an appropriate disposal facility, or to be collected for reuse, if possible.

Sewage Effluents

11.258   Connection of domestic sewage generated from the Project shall be diverted to the foul sewer. All the discharge should comply with the requirements stipulated in the TM-DSS. For handling, treatment and disposal of other operational stage effluent, the practices outlined in ProPECC PN 5/93 shall be adopted where applicable.

Evaluation of Residual Impacts

Construction Phase

Marine Construction

11.259   The major water quality impact associated with marine construction activities is the elevation of SS within the marine water column.  Provided that the recommended mitigation measures are properly implemented, there would be no unacceptable residual water quality impact due to the proposed construction works.

Land-based Construction

11.260   General construction activities associated with the construction of the Project could lead to site runoff containing elevated concentrations of SS and associated contaminants that may enter into the marine water.  However, it is anticipated that the identified water quality impacts will generally be temporary and localised during construction.  No unacceptable residual water quality impacts are anticipated during the construction of the proposed infrastructure, provided all of the recommended mitigation measures are properly implemented and all construction site / works area discharges comply with the TM-DSS standards.

Operation Phase

11.261   Adverse water quality impacts associated with the operation of the Project are not expected.  Thus, there would be no unacceptable residual impact associated with the operation of the Project.

Environmental Monitoring and Audit

11.262   Based on the above assessment of the water quality impact, an environmental monitoring and audit (EM&A) programme is considered necessary to obtain a database of baseline information of water quality before the marine construction works, and thereafter, to monitor any variation of water quality from the baseline conditions and exceedances of WQOs at sensitive receivers during the marine construction works.  DO, turbidity and SS levels should be monitored at designated marine water quality monitoring stations in Victoria Harbour before and during the construction phase.  The DO levels in the CBTS should also be monitored during the tunnel construction works to avoid aggravation of odour nuisance from seawater arising from temporary reclamation. Monitoring of groundwater level and quality should also be carried out, only if the future field investigation at the post EIA stage confirms that groundwater contamination would be a concern. Details of the EM&A programme will be provided in a stand-alone EM&A Manual.  If the monitoring data indicate that the proposed construction works result in unacceptable impacts, appropriate actions should be taken to review the construction method and additional measures such as slowing down, or rescheduling of works should be implemented as necessary.  In case the temporary reclamation work for the Project is found during the water quality monitoring and audit programme to cause unacceptable oxygen depletion (e.g. <2 mg/L) in the CBTS, further water quality improvement mitigation measures (e.g. use of aeration method to improve the DO levels in the marine embayment) should be considered and implemented in the CBTS as necessary to rectify the problems.

11.263   Compliance monitoring of the effluent discharged from the wastewater treatment unit of the Shek O casting basin should be carried out in accordance with the relevant WPCO licence which is under the ambit of regional office of EPD.

Conclusion

Construction Phase

Marine Construction

11.264   The assessment has evaluated the potential impacts caused by marine construction works on water quality due to the elevation of suspended solids concentrations, depletion of dissolved oxygen and increases in contaminants concentration. The worst-case scenarios during the marine construction period, taking into account the cumulative effects from other concurrent marine works in the Harbour have been assessed.  It is predicted that, with the implementation of the recommended mitigation measures, such as the installation of silt curtain, use of closed grab dredgers and reduction of dredging rate, there would be no unacceptable water quality impacts arising from the Project-related construction works and due to the cumulative effects from other concurrent marine construction activities.  A water quality monitoring and audit programme will be implemented to ensure the effectiveness of the proposed water quality mitigation measures.

Land-based Construction

11.265   The key issue from the land-based construction activities would be the potential water quality impact due to the release of sediment-laden water from surface works areas, open cut excavation, tunnelling works and discharge of construction site effluent.  Minimisation of water quality deterioration could be achieved through implementing adequate mitigation measures, such as implementation of site practices outlined in ProPECC PN 1/94 “Construction Site Drainage” and provision of portable toilet.  Regular site inspections would be undertaken routinely to inspect the construction activities and works areas in order to ensure the recommended mitigation measures are properly implemented.  No unacceptable water quality impact would be expected from the land-based construction works with proper implementation of the recommended mitigation measures.

Operation Phase

11.266   The main operational impacts from the Project would come from tunnel/station run-off and effluent discharges from the stations and maintenance activities, which could be minimized through implementing adequate mitigation measures, such as proper collection, treatment and disposal of tunnel runoff. 


([1])           Territory Development Department (July 2001).  Agreement No. CE 74/98, Wan Chai Development Phase II, Comprehensive Feasibility Study, Environmental Impact Assessment Report, Volume I – Text

([2])           Pastorok, R.A. and Bilyard, G.R. (1985).  “Effects of sewage pollution on coral-reef communities.”  Marine Ecology Progress Series 21: 175-189.

([3])           Hawker, D. W. and Connell, D. W. (1992).  “Standards and Criteria for Pollution Control in Coral Reef Areas” in Connell, D. W and Hawker, D. W. (eds.), Pollution in Tropical Aquatic Systems, CRC Press, Inc.

([4])           Figure 2.7 of the approved WDII & CWB EIA can be retrieved from the following link: http://www.epd.gov.hk/eia/register/report/eiareport/eia_1412007/html/Vol%204%20- %20Figures/FIG%202.7.pdf

([5])           Mott MacDonald (1991).  Contaminated Spoil Management Study, Final Report, Volume 1, for EPD, October 1991.

([6])           Mott MacDonald (1991). Contaminated Spoil Management Study, Final Report, Volume 1, for EPD, October 1991

([7])           Sediment disturbance would only occur during dredging operation. The potential release of sediment-bound contaminants during the dredging operation would be simulated using the elutriate test results.  All sediments will be dredged before construction of the SCL tunnel.  Testing of pore water is therefore considered not necessary following the same approach adopted in the approved EIA for Wan Chai Development Phase II and Central – Wan Chai Bypass.