Sectoral Analysis for Road Transport #
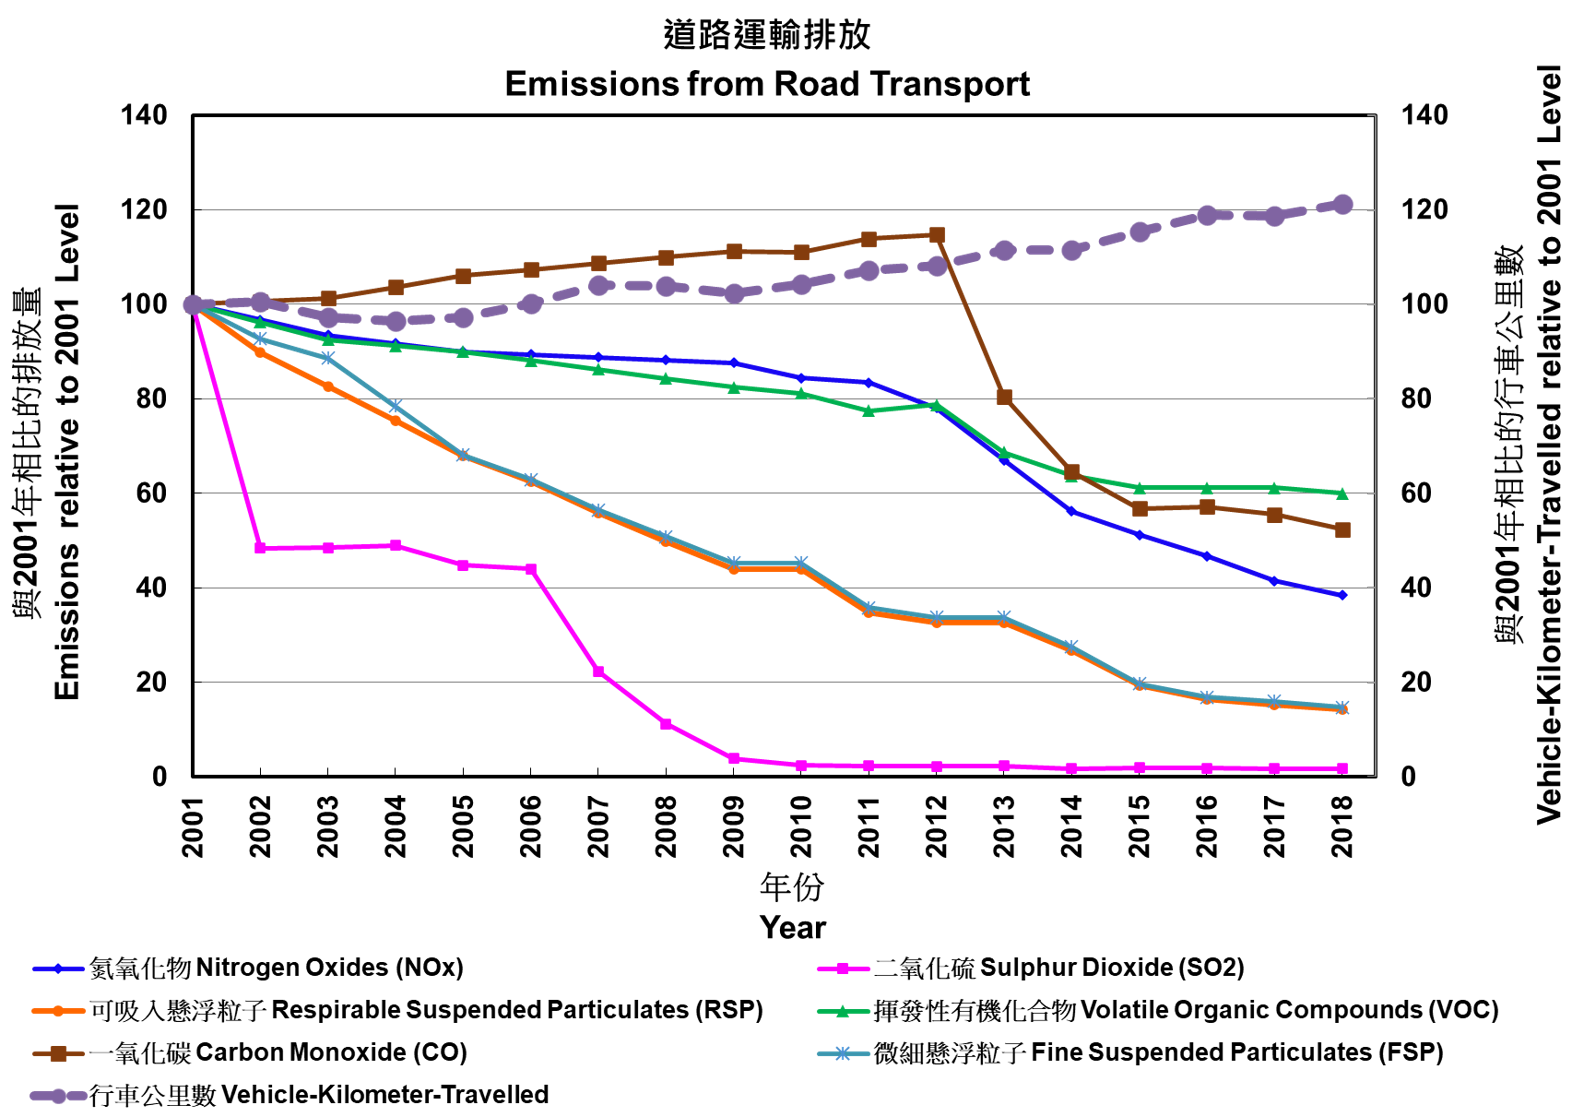
Road transport was a major emission source of NOx, VOC and CO, accounting for 18%, 21% and 50% of the total emissions in 2018, respectively. Overall, the emissions from road transport decreased by 40% to 98% from 2001 to 2018, despite an increase in vehicle-kilometer-travelled of 21% during the same period.
The substantial decreases in NOx, RSP, FSP, VOC and CO emissions from 2010 to 2018 could be attributed to a series of vehicle emission control programmes, which included strengthening the control of emissions from petrol and liquefied petroleum gas (LPG) vehicles by deploying roadside remote sensing equipment to identify vehicles emitting excessively; retrofitting Euro II and Euro III franchised buses with selective catalytic reduction (SCR) systems; progressively phasing out some 82 000 pre-Euro IV diesel commercial vehicles (DCVs) and tightening the emission standards for first registered vehicles to Euro VI in phases according to vehicle classes from 1 July 2017. It is anticipated that emissions from this sector will decrease further, as we are preparing a programme to progressively phase out about 40 000 Euro IV DCVs; working on tightening the vehicle emission standards of first registered motorcycles to Euro 4 and the vehicle emission standards of first registered light buses (design weight of more than 3.5 tonnes) and buses (design weight of not more than 9 tonnes) to Euro VI in phases starting from the second half of 2020; and will fully subsidise franchised bus companies in conducting a trial to retrofit Euro IV and Euro V franchised buses with enhanced SCR systems to upgrade their NOx emission performance to Euro VI level.
As for SO2, the vehicle emissions stayed at a very low level in the past few years because of the introduction of Euro V diesel in December 2007, which has the sulphur content capped at 0.001%.
# Except SO2, emissions of major air pollutants for 2001, 2003, 2005, 2009 and 2010-2018 were calculated based on actual data, while interpolated figures were used for the remaining years. Vehicle-Kilometer-Travelled was provided by the Transport Department.