TABLE
OF CONTENTS
5. WATER QUALITY.. 5-1
5.1 Introduction. 5-1
5.2 Environmental
Legislation, Standards and Guidelines. 5-1
5.3 Description of
Environment 5-11
5.4 Water Sensitive
Receivers. 5-22
5.5 Identification of
Potential Impacts. 5-24
5.6 Assessment Methodology. 5-25
5.7 Prediction and
Evaluation of Environmental Impacts. 5-33
5.8 Mitigation of
Environmental Impacts. 5-58
5.9 Residual Water Quality
Impacts. 5-73
5.10 Environmental
Monitoring and Audit Requirements. 5-73
5.11 Conclusions. 5-73
List of Tables
Table 5.1 Summary of WQOs for
Western Buffer WCZ
Table 5.2 Summary of Water Quality Objectives for North Western
WCZ
Table 5.3 Summary of WSD’s Water Quality Criteria for Flushing
Water Intakes
Table 5.4 Proposed Assessment Criteria for Heavy Metal and Trace
Organics
Table 5.5 Summary EPD’s Routine Marine Water Quality Data for
Western Buffer and Victoria Harbour Phase 1 WCZs in Year 2023
Table 5.6 Summary EPD’s Routine Marine Water Quality Data for
North Western WCZ in Year 2023
Table 5.7 Summary of Water Quality Monitoring Data for Inland
Watercourses (Dry Season)
Table 5.8 Summary of Water Quality Monitoring Data for Inland
Watercourses (Wet Season)
Table 5.9 Annual Geometric Mean E. coli Levels in
Tsuen Wan District
Table 5.10 Identified WSRs
Table 5.11 Projects Incorporated into Modelling for Coastline Configurations
Table 5.12 Validation and Verification Matrix for the Local
Refined Model
Table 5.13 Level of Fitness Summary between the Local Refined
Model and HK-DFM Model at Observation Points
Table 5.14 Level of Fitness Summary between the Local Refined
Model and HK-DFM Model at Cross-sections
Table 5.15 Model Performance of the
Local Refined Model
Table 5.16 90th Percentile SS from EPD Routine
Monitoring Programme (2014-2023)
Table 5.17 Suspended Solids Elevation Criteria (mg/L) for the
Construction Phase Impacts
Table 5.18 Allowable Suspended Solids Elevation Criteria (mg/L) for The
Modelling Observation Points
Table 5.19 Predicted Maximum Suspended Solids (mg/L) Elevations
during Dredging Activities (Run C1a – With Project, Unmitigated)
Table 5.20 Predicted Maximum Suspended Solids (mg/L) Elevations
during Reclamation Filling Activities (Run C1b – With Project,
Unmitigated)
Table 5.21 Predicted Maximum Sedimentation Rate (g/m2/day)
during Dredging Activities (Run C1a – With Project, Unmitigated)
Table 5.22 Predicted Maximum Sedimentation Rate (g/m2/day)
during Reclamation Filling Activities (Run C1b – With Project,
Unmitigated)
Table 5.23 10th Percentile DO Concentration from EPD Routine
Monitoring Programme (2014-2023)
Table 5.24 Corresponding Ambient DO Concentration (mg/L) for The
Modelling Observation Points
Table 5.25 Predicted DO Depletion (mg/L) under Dredging
Activities (Run C1a – With Project and Concurrent Projects, Unmitigated)
Table 5.26 Predicted Resultant DO Depletion (mg/L) under Dredging
Activities (Run C1a – With Project and Concurrent Projects, Unmitigated)
Table 5.27 Predicted DO Depletion (mg/L) under Reclamation
Filling Activities (Run C1b – With Project and Concurrent
Projects, Unmitigated)
Table 5.28 Predicted Resultant Dissolved Oxygen Depletion (mg/L)
under Reclamation Filling Activities (Run C1b – With Project and
Concurrent Projects, Unmitigated)
Table 5.29 Hydrodynamic Modelling Comparison between the With and
Without Project Scenarios
Table 5.30 Comparison of Ebb/Flood Tidal Flow Volume at Concerned
Channels
Table 5.31 Predicted Maximum Suspended Solids (mg/L) Elevations
during Dredging Activities (Run C2a – With Project, Mitigated)
Table 5.32 Predicted Maximum Suspended Solids (mg/L) Elevations
during Reclamation Filling Activities (Run C2b – With Project,
Mitigated)
Table 5.33 Predicted Maximum Sedimentation Rate (g/m2/day)
during Dredging Activities (Run C2a – With Project, Mitigated)
Table 5.34 Predicted Maximum Sedimentation Rate (g/m2/day)
during Reclamation Filling Activities (Run C2b – With Project,
Mitigated)
Table 5.35 Predicted DO Depletion (mg/L) under Dredging
Activities (Run C2a – With Project, Mitigated)
Table 5.36 Predicted Resultant DO Depletion (mg/L) under Dredging
Activities (Run C2a – With Project, Mitigated)
Table 5.37 Predicted DO Depletion (mg/L) under Reclamation
Filling Activities (Run C2b – With Project, Mitigated)
Table 5.38 Predicted Resultant Dissolved Oxygen Depletion (mg/L)
under Reclamation Filling Activities (Run C2b – With Project,
Mitigated)
List of
Figures
Figure
5.1 Locations of Identified Water Sensitive
Receivers
List of
Appendices
Appendix 5.1 Model
Validation and Verification
Appendix 5.2 Reclamation
Construction Sequence and Sediment Release Estimation
Appendix 5.3 Water
Quality Modelling Results (Construction Phase)
Appendix
5.4 Hydrodynamic Modelling Results (Operational
Phase)
Appendix 5.5 Elutriate and Porewater Testing Results
Appendix 5.6 Water Quality Modelling Results
(Sensitivities Analysis)
Appendix 5.7 Assessment of Contaminant Release from
Elutriate/Porewater Testing
5.1.1.1
This section presents an
assessment of the potential water quality impacts associated with the
construction and operation of the Project.
The assessment was conducted in accordance with the criteria and
guidelines set out in Annexes 6 and 14 of the Technical Memorandum on
Environmental Impact Assessment (EIAO-TM) and the requirements set out in
Clause 3.4.6 of the EIA Study Brief (No. ESB-359/2023).
Technical Memorandum on Environmental Impact
Assessment Ordinance
5.2.1.1
The Technical Memorandum on Environmental Impact Assessment Ordinance
(EIAO-TM), which was issued by EPD under Section 16 of the EIAO. Reference sections in the EIAO-TM provide the
details of assessment criteria and guidelines that are relevant to the water
quality assessment, including:
·
Annex
6 - Criteria for Evaluating Water Pollution; and
·
Annex
14 - Guidelines for Assessment of Water Pollution.
Water Pollution Control Ordinance (WPCO)
(Cap.358)
5.2.1.2 The Water Pollution Control Ordinance (WPCO) (Cap. 358) provides the
major statutory framework for the protection and control of water quality in
Hong Kong. According to the Ordinance
and its subsidiary legislation, Hong Kong waters are divided into ten Water
Control Zones (WCZs). Corresponding
statements of Water Quality Objectives (WQOs) are stipulated for different
water regimes (marine waters, inland waters, bathing beaches subzones,
secondary contact recreation subzones and fish culture subzones) in the WCZs
based on their beneficial uses.
5.2.1.3 According to Clause 3.4.6.2 of the EIA Study Brief (No.
ESB-359/2023), the assessment area for this water quality impact assessment
includes areas within 500 meters from the boundary of the Project and shall
cover the Western Buffer WCZ and other affected WCZs as designated under the
WPCO. The WQOs for the Western Buffer
WCZ and North Western WCZ are listed in Table 5.1 and Table
5.2, respectively. These WQOs will be used as the water quality
assessment criteria for the Project.
Table 5.1 Summary
of WQOs for Western Buffer WCZ
|
Parameters
|
Objectives
|
Sub-Zone
|
|
Aesthetic appearance
|
There should be no objectionable odours or discolouration
of the water.
|
Whole zone
|
|
Tarry residues, floating wood, articles made of glass,
plastic, rubber or of any other substances should be absent.
|
|
Mineral oil should not be visible on the surface. Surfactants should not give rise to a
lasting foam.
|
|
There should be no recognisable sewage-derived debris.
|
|
Floating, submerged and semi-submerged objects of a size
likely to interfere with the free movement of vessels, or cause damage to
vessels, should be absent.
|
|
The water should not contain substances which settle to
form objectionable deposits.
|
|
Bacteria
|
The level of Escherichia coli (E.
coli) should not exceed 610 per 100 mL, calculated as the geometric mean
of all samples collected in a calendar year.
|
Secondary
Contact Recreation Subzones and Fish Culture Subzones
|
|
The level of E. coli should not exceed 180 per 100
mL, calculated as the geometric mean of all samples collected from March to
October inclusive in 1 calendar year. Samples should be taken at least 3
times in 1 calendar month at intervals of between 3 and 14 days.
|
Recreation Subzones
|
|
The level of E. coli should be less than 1 per 100
mL, calculated as the geometric mean of the most recent 5 consecutive samples
taken at intervals of between 7 and 21 days.
|
Water Gathering Ground
Subzones
|
|
The level of E. coli should not exceed 1000 per
100 mL, calculated as the geometric mean of the most recent 5 consecutive
samples taken at intervals of between 7 and 21 days.
|
Other inland waters
|
|
Colour
|
Human activity should not cause the colour of water to
exceed 30 Hazen units.
|
Water Gathering Ground
Subzones
|
|
Human activity should not cause the colour of water to
exceed 50 Hazen units.
|
Other inland waters
|
|
Dissolved Oxygen (DO)
|
The level of dissolved oxygen should not fall below 4 mg per
litre for 90% of the sampling occasions during the whole year; values should
be calculated as water column average (arithmetic mean of at least 3
measurements at 1 m below surface, mid-depth and 1 m above seabed). In
addition, the concentration of dissolved oxygen should not be less than 2 mg
per litre within 2 m of the seabed for 90% of the sampling occasions during
the whole year.
|
Marine waters excepting
Fish Culture Subzones
|
|
The level of dissolved oxygen should not be less than 5
mg per litre for 90% of the sampling occasions during the year; values should
be calculated as water column average (arithmetic mean of at least 3
measurements at 1 m below surface, mid-depth and 1 m above seabed). In
addition, the concentration of dissolved oxygen should not be less than 2 mg
per litre within 2 m of the seabed for 90% of the sampling occasions during
the whole year.
|
Fish Culture Subzones
|
|
The level of dissolved
oxygen should not be less than 4 mg per litre.
|
Water Gathering Ground
Subzones and other inland waters
|
|
pH
|
The pH of the water should be within the range of 6.5–8.5
units. In addition, human activity should not cause the natural pH range to
be extended by more than 0.2 unit.
|
Marine waters
|
|
Human activity should not
cause the pH of the water to exceed the range of 6.5–8.5 units.
|
Water Gathering Ground
Subzones
|
|
Human activity should
not cause the pH of the water to exceed the range of 6.0–9.0 units.
|
Other inland waters
|
|
Temperature
|
Human activity should not cause the natural daily
temperature range to change by more than 2.0ºC.
|
Whole zone
|
|
Salinity
|
Human activity should not cause the natural ambient
salinity level to change by more than 10%.
|
Whole zone
|
|
Suspended Solids (SS)
|
Human activity should neither cause the natural ambient
level to be raised by more than 30% nor give rise to accumulation of
suspended solids which may adversely affect aquatic communities.
|
Marine waters
|
|
Human activity should not cause the annual median of
suspended solids to exceed 20 mg per litre.
|
Water Gathering Ground
Subzones
|
|
Human activity should not cause the annual median of
suspended solids to exceed 25 mg per litre.
|
Other inland waters
|
|
Ammonia
|
The unionised ammoniacal nitrogen level should not be
more than 0.021 mg per litre, calculated as the annual average (arithmetic
mean).
|
Whole zone
|
|
Nutrients
|
Nutrients shall not be present in quantities sufficient
to cause excessive or nuisance growth of algae or other aquatic plants.
|
Marine waters
|
|
Without limiting the generality of objective (a) above,
the level of inorganic nitrogen should not exceed 0.4 mg per litre, expressed
as annual water column average (arithmetic mean of at least 3 measurements at
1 m below surface, mid-depth and 1 m above seabed).
|
Marine waters
|
|
5-Day Biochemical
Oxygen Demand (BOD5)
|
The 5-day biochemical oxygen demand should not exceed 3
mg per litre.
|
Water Gathering Ground
Subzones
|
|
The 5-day biochemical oxygen demand should not exceed 5
mg per litre.
|
Other inland waters
|
|
Chemical Oxygen Demand
(COD)
|
The chemical oxygen demand should not exceed 15 mg per
litre.
|
Water Gathering Ground
Subzones
|
|
The chemical oxygen demand should not exceed 30 mg per
litre.
|
Other inland waters
|
|
Toxic Substances
|
Toxic substances in the water should not attain such
levels as to produce significant toxic, carcinogenic, mutagenic or teratogenic
effects in humans, fish or any other aquatic organisms, with due regard to
biologically cumulative effects in food chains and to interactions of toxic
substances with each other.
|
Whole zone
|
|
Human activity should not cause a risk to any beneficial
use of the aquatic environment.
|
|
Turbidity
|
Waste discharges shall not reduce light transmission
substantially from the normal level.
|
Bathing Beach Subzones
|
Source: Statement of Water Quality Objectives (Western
Buffer Water Control Zone), (Cap. 358, section 5)
Table 5.2 Summary
of Water Quality Objectives for North Western WCZ
|
Parameters
|
Objectives
|
Sub-Zone
|
|
Aesthetic appearance
|
Waste discharges shall cause no objectionable odours or
discolouration of the water.
|
Whole Zone
|
|
Tarry residues, floating wood, articles made of glass,
plastic, rubber or of any other substances should be absent.
|
|
Mineral oil should not be visible on the surface.
Surfactants should not give rise to lasting foam.
|
|
There should be no recognisable sewage-derived debris.
|
|
Floating, submerged and semi-submerged objects of a size
likely to interfere with the free movement of vessels, or cause damage to
vessels, should be absent.
|
|
Waste discharges shall not cause the water to contain
substances which settle to form objectionable deposits.
|
|
Bacteria
|
The level of Escherichia coli (E.
coli) should not exceed 610 per 100 mL, calculated as the geometric mean
of all samples collected in a calendar year.
|
Secondary
Contact Recreation Subzones
|
|
The level of E. coli should be less than 1 per 100
mL, calculated as the running median of the most recent 5 consecutive samples
taken at intervals of between 7 and 21 days.
|
Tuen Mun (A) and Tuen
Mun (B) Subzones and Water Gathering Ground Subzones
|
|
The level of E. coli should not exceed 1 000 per
100 mL, calculated as the running median of the most recent 5 consecutive
samples taken at intervals of between 7 and 21 days.
|
Tuen Mun (C) Subzone and
other inland waters
|
|
The level of E. coli should not exceed 180 per 100
mL, calculated as the geometric mean of all samples collected from March to
October inclusive. Samples should be taken at least 3 times in one calendar
month at intervals of between 3 and 14 days.
|
Bathing Beach Subzones
|
|
Colour
|
Waste discharges shall not cause the colour of water to
exceed 30 Hazen units.
|
Tuen Mun (A) and Tuen
Mun (B) Subzones and Water Gathering Ground Subzones
|
|
Waste discharges shall not cause the colour of water to
exceed 50 Hazen units.
|
Tuen Mun (C) Subzone
and other inland waters
|
|
Dissolved Oxygen (DO)
|
Waste discharges shall not cause the level of dissolved
oxygen to fall below 4 mg per litre for 90% of the sampling occasions during
the whole year; values should be calculated as water column average
(arithmetic mean of at least 3 measurements at 1 m below surface, mid-depth
and 1 m above seabed). In addition, the concentration of dissolved oxygen
should not be less than 2 mg per litre within 2 m of the seabed for 90% of
the sampling occasions during the whole year.
|
Marine waters
|
|
Waste discharges shall
not cause the level of dissolved oxygen to be less than 4 mg per litre.
|
Tuen Mun (A), Tuen Mun (B)
and Tuen Mun (C) Subzones, Water Gathering Ground Subzones and other inland
waters
|
|
pH
|
The pH of the water should be within the range of 6.5–8.5
units. In addition, waste discharges shall not cause the natural pH range to
be extended by more than 0.2 unit.
|
Marine waters excepting
Bathing Beach Subzones
|
|
Waste discharges shall
not cause the pH of the water to exceed the range of 6.5–8.5 units.
|
Tuen Mun (A), Tuen Mun
(B) and Tuen Mun (C) Subzones and Water Gathering Ground Subzones
|
|
The pH of the water
should be within the range of 6.0–9.0 units.
|
Other inland waters
|
|
The pH of the water should be within the range of 6.0–9.0
units for 95% of samples collected during the whole year. In addition, waste
discharges shall not cause the natural pH range to be extended by more than
0.5 unit.
|
Bathing Beach Subzones
|
|
Temperature
|
Waste discharges shall not cause the natural daily
temperature range to change by more than 2.0℃.
|
Whole Zone
|
|
Salinity
|
Waste discharges shall not cause the natural ambient
salinity level to change by more than 10%.
|
Whole Zone
|
|
Suspended Solids (SS)
|
Waste discharges shall neither cause the natural ambient
level to be raised by more than 30% nor give rise to accumulation of
suspended solids which may adversely affect aquatic communities.
|
Marine waters
|
|
Waste discharges shall not cause the annual median of suspended
solids to exceed 20 mg per litre.
|
Tuen Mun (A), Tuen Mun
(B) and Tuen Mun (C) Subzones and Water Gathering Ground Subzones
|
|
Waste discharges shall not cause the annual median of
suspended solids to exceed 25 mg per litre.
|
Other inland waters
|
|
Ammonia
|
The unionised ammoniacal nitrogen level should not be
more than 0.021 mg per litre, calculated as the annual average (arithmetic
mean).
|
Whole Zone
|
|
Nutrients
|
Nutrients shall not be present in quantities sufficient
to cause excessive or nuisance growth of algae or other aquatic plants.
|
Marine waters
|
|
Without limiting the generality of objective (a) above, the
level of inorganic nitrogen should not exceed 0.3 mg per litre, expressed as
annual water column average (arithmetic mean of at least 3 measurements at 1
m below surface, mid-depth and 1 m above seabed).
|
Castle Peak Bay Subzone
|
|
Without limiting the generality of objective (a) above,
the level of inorganic nitrogen should not exceed 0.5 mg per litre, expressed
as annual water column average (arithmetic mean of at least 3 measurements at
1 m below surface, mid-depth and 1 m above seabed).
|
Marine waters except
Castle Peak Bay Subzone
|
|
5-Day Biochemical
Oxygen Demand (BOD5)
|
Waste discharges shall not cause the 5-day biochemical
oxygen demand to exceed 3 mg per litre.
|
Tuen Mun (A), Tuen Mun (B)
and Tuen Mun (C) Subzones and Water Gathering Ground Subzones
|
|
Waste discharges shall not cause the 5-day biochemical
oxygen demand to exceed 5 mg per litre.
|
Other inland waters
|
|
Chemical Oxygen Demand
(COD)
|
Waste discharges shall not cause the chemical oxygen
demand to exceed 15 mg per litre.
|
Tuen Mun (A), Tuen Mun
(B) and Tuen Mun (C) Subzones and Water Gathering Ground Subzones
|
|
Waste discharges shall not cause the chemical oxygen
demand to exceed 30 mg per litre.
|
Other inland waters
|
|
Toxins
|
Waste discharges shall not cause the toxins in water to
attain such levels as to produce significant toxic, carcinogenic, mutagenic
or teratogenic effects in humans, fish or any other aquatic organisms, with
due regard to biologically cumulative effects in food chains and to toxicant
interactions with each other.
|
Whole Zone
|
|
Waste discharges shall not cause a risk to any beneficial
use of the aquatic environment.
|
|
Phenol
|
Phenols shall not be present in such quantities as to
produce a specific odour, or in concentration greater than 0.05 mg per litre
as C6H5OH.
|
Bathing Beach Subzones
|
|
Turbidity
|
Waste discharges shall not reduce light transmission
substantially from the normal level.
|
Bathing Beach Subzones
|
Source: Statement
of Water Quality Objectives (North Western Water Control Zone), (Cap. 358, section 5)
Water Supplies Department Water Quality
Criteria
5.2.1.4
The Water Supplies Department (WSD) has specified a set of seawater
quality objectives for their flushing water intakes. The list is shown in Table
5.3. These target objectives will be applied at the points of seawater
abstraction for flushing purpose.
Table 5.3 Summary
of WSD’s Water Quality Criteria for Flushing Water Intakes
|
Parameters
(in mg/L unless otherwise stated)
|
WSD
Target Limit
|
|
Colour (Hazen Unit)
|
<
20
|
|
Turbidity (NTU)
|
<
10
|
|
Threshold Odour Number (odour unit)
|
<
100
|
|
Ammoniacal Nitrogen (NH3-N)
|
<
1
|
|
Suspended Solids (SS)
|
<
10
|
|
Dissolved Oxygen (DO)
|
>
2
|
|
Biochemical Oxygen Demand (BOD)
|
<
10
|
|
Synthetic Detergents
|
<
5
|
|
E. coli (count/100
mL)
|
<
20,000
|
Assessment Criteria for Heavy Metals and Trace Organics
5.2.1.5 There are no existing legislations or guidelines for heavy metals, metalloids,
trace organics (i.e. polycyclic aromatic hydrocarbons (PAH) and polychlorinated
biphenyls (PCB)), and organotin (i.e. tributyltin (TBT)) at water sensitive
receivers (WSRs) in Hong Kong waters.
With reference to the approved EIA studies (,,), the criteria adopted are based on international standards,
including those from Mainland China, Europe, the USA, Australia, and New Zealand.
The adopted criteria for heavy metals and trace organics are presented in Table 5.4.
Table 5.4 Proposed Assessment Criteria for Heavy
Metal and Trace Organics
|
Heavy
Metal/Metalloids/Trace Organics
|
Proposed
Criteria
(µg/L)
|
Reference
|
|
Cadmium (Cd)
|
0.45
|
3
|
|
Chromium (Cr)
|
4.4
|
1
|
|
Copper (Cu)
|
3.1
|
5
|
|
Nickel (Ni)
|
5.0
|
4
|
|
Lead (Pb)
|
1.0
|
4
|
|
Zinc (Zn)
|
8.0
|
1
|
|
Mercury (Hg)
|
0.05
|
4
|
|
Arsenic (As)
|
13
|
1
|
|
Silver (Ag)
|
1.4
|
1
|
|
Total PAHs
|
0.1
|
3
|
|
Total PCBs
|
0.03
|
2
|
|
Tributyltin (TBT)
|
0.0015
|
3
|
References:
[1] Australian and New
Zealand Guidelines for Fresh and Marine Water Quality. Default guideline value for protection for
95% Species in Marine water. Available at:
https://www.waterquality.gov.au/anz-guidelines/guideline-values/default/water-quality-toxicants/search. For chromium, the more stringent standard for
Cr(VI) is adopted. For arsenic, there is
no standard for marine water, standard for freshwater for As(V) was thus
adopted which is more conservative than that for As(III).
[2] U.S. Environmental Protection
Agency, National Recommended Water Quality Criteria, 2009. (https://www.epa.gov/wqc/national-recommended-water-quality-criteria-aquatic-life-criteria-table). The Criteria Continuous
Concentration (CCC) is an estimate of the highest concentration of a material
in surface water (i.e. saltwater) to which an aquatic community can be exposed
indefinitely without resulting in an unacceptable effect. CCC is used as the criterion of the
respective compounds in this study.
[3] DIRECTIVE 2008/105/EC OF THE EUROPEAN PARLIAMENT
AND OF THE COUNCIL of 16 December 2008 on environmental quality standards in
the field of water policy, amending and subsequently repealing Council
Directives 82/176/EEC, 83/513/EEC, 84/156/EEC, 84/491/EEC, 86/280/EEC and
amending Directive 2000/60/EC of the European Parliament and of the Council. https://eur-lex.europa.eu/legal-content/EN/TXT/PDF/?uri=CELEX:32008L0105
[4] China
Sea Water Quality Standard (GB 3097-1997).
https://www.mee.gov.cn/ywgz/fgbz/bz/bzwb/shjbh/shjzlbz/199807/W020061027511546974673.pdf
[5] The USEPA Criterion Continuous
Concentration (CCC),
http://water.epa.gov/scitech/swguidance/standards/criteria/current/index.cfm#Z2,
13 June 2013
Reference Suspended Solids (SS) Criterion
for Cooling Water Intake
5.2.1.6
The suspended solids (SS) criterion for cooling water intakes is
different from that for the WSD's intakes as their beneficial uses are
different (the former is used for cooling water system and the latter for
flushing purpose). There are a number of
cooling water intakes identified in the Western Buffer WCZ and North Western
WCZ, including the ones for Sha Wan Drive, Wah Fu Estate, Castle Peak Power
Station, China Cement Plant, ASD Tuen Mun Hospital, EMSD Sam Shing Estate and
Shiu Wing Steel Mills.
5.2.1.7 The SS limit is 40mg/L for cooling water intake according
to the Mass Transit Railway Corporation (MTRC) and is 100mg/L for HK Electric
Power Station according to the HK Electric. There are no other criteria for cooling water intakes within the
area of influence of this Project. Thus, a more rigid number of 40mg/L will be used in
this report. This criterion had been confirmed by
telephone survey conducted under the approved EIA for the Hong Kong Convention
and Exhibition Centre (HKCEC) Atrium Link Extension (ALE), and approved EIA for
the Dredging Works for Proposed Cruise Terminal at Kai Tak ([4],).
Assessment Criterion for Sediment Deposition
(Applicable to Ecological Subtidal Habitats Only)
5.2.1.8
There is no existing
legislative standard on sedimentation rate available. Soft corals typical of the western coastal
waters where the sediment regime is more dynamic than in other parts of Hong
Kong's coastal waters are expected to be more tolerant of deposition. The daily sediment deposition rate of 200 g/m2/day is generally considered as tolerable in the
western waters. The sediment deposition
rate of 200 g/m2/day has
been adopted as the reference criterion for this study following the approach
adopted under other approved EIA studies (,
,
,).
5.2.1.9
The sedimentation criterion was
derived for protection of subtidal coral habitats only and hence it is not
applicable to other water sensitive receivers such as bathing beach users and
seawater intakes where the main concern would be on the surface / mid-depth
water quality. No sedimentation
criterion specific to bathing beach users and seawater intakes is available and
therefore the sedimentation rates are not presented for these sensitive
receivers under this assessment.
Technical Memorandum for Effluents
Discharged into Drainage and Sewerage Systems, Inland and Coastal Waters
5.2.1.10
Discharge of effluents is
subject to control under the WPCO. The
"Technical Memorandum on Standards for Effluents Discharged into
Drainage and Sewerage Systems, Inland and Coastal Waters" (TM-DSS) was
issued under Section 21 of the WPCO. It
sets the discharge limits vary with the effluent flow rates and the effluent
should comply with the standards for effluent discharged into different type of
receiving waters (foul sewers, stormwater drains, inland and coastal
waters). The standards control the
physical, chemical and microbial quality of effluents.
Practice Notes
5.2.1.11
The "Professional
Persons Environmental Consultative Committee Practice Note 2/24"
(ProPECC PN 2/24) was issued by the EPD
to provide guidelines for handling and disposal of construction site
discharges. The ProPECC PN 2/24 provides some basic environmental guidelines for handling discharge from construction sites, so as to
prevent and minimise some of the pollution
problems generally associated with construction activities. These include
surface run-off, groundwater, boring and drilling water, wastewater from
concrete batching and/or precast concrete casting, wheel washing water,
bentonite slurries, water for testing and/or sterilisation of water retaining
structures and water pipes, wastewater from building constructions, acid
cleaning, etching and pickling wastewater, and wastewater from site
facilities. Practices given in the
ProPECC PN 2/24 should be followed as far
as possible during construction to minimise the water quality impact due to
construction site drainage.
5.2.1.12
The ProPECC PN 1/23 "Drainage
Plans subject to Comments by Environmental Protection Department"
provides guidelines and practices for handling, treatment and disposal of
various effluent discharges to stormwater drains and foul sewers. The design of site draina ge and disposal of
various site effluents generated within the new development area should follow
the relevant guidelines and practices as given in the ProPECC PN 1/23.
Technical Circular
5.2.1.13
Environment, Transport and
Works Bureau Technical Circular (ETWB TC) (Works) No. 5/2005 provides an
administrative framework to better protect all natural streams/rivers from the
impacts of construction works. The procedures
promulgated under this Circular aim to clarify and strengthen existing measures
for protection of natural streams/rivers from government projects and private
developments. The guidelines and
precautionary mitigation measures given in the ETWB TC (Works) No. 5/2005
should be followed as far as possible to protect the inland watercourses at or
near the Project area during the construction phase.
Hong Kong Planning Standards and Guidelines
(HKPSG)
5.2.1.14
Chapter 9 of the HKPSG outlines
environmental requirements that need to be considered in land use
planning. The recommended guidelines,
standards and guidance cover the selection of suitable locations for the developments
and sensitive uses, provision of environmental facilities, and design, layout,
phasing and operational controls to minimise adverse environmental
impacts. It also lists out environmental
factors that influence land use planning and recommends buffer distances for
land uses.
5.3.1
Assessment Area
5.3.1.1
According to Clause 3.4.6.2 of
the EIA Study Brief (No. ESB-359/2023), the Assessment Area for this water
quality impact assessment includes areas within 500m from the boundary of the
Project and shall cover Western Buffer WCZ and other affected WCZs as designated
under the WPCO and the WSRs in the vicinity of the Project.
5.3.2
Marine Water Quality
5.3.2.1
The marine water quality in
vicinity of the Project area has been regularly monitored by EPD on a monthly
basis. Locations of EPD’s Marine Water
Quality Monitoring Stations (NM1/WM4/VM12/VM14) are shown in Figure 5.1. The baseline water quality condition of
marine water was established from the marine water quality monitoring data
routinely collected by EPD in the Western Buffer, North Western and Victoria Harbour WCZs. A summary of EPD
monitoring data collected in 2023 for Western Buffer, North Western and Victoria Harbour Phase 1 WCZs are presented in Table 5.5 and Table 5.6.
5.3.2.2
According to the EPD’s “Marine Water
Quality in Hong Kong 2023”, the Western Buffer WCZ fully achieved the WQOs in
2023. Since the commissioning of the Harbour Area Treatment Scheme Advance
Disinfection Facilities (HATS ADF) in 2010, the E. coli level in the WCZ
decreased substantially. Similar to
other WCZs in the central waters, significant improvement of water quality as
reflected in reduction in terms of E. coli and PO4-P has been
observed.
5.3.2.3
The overall WQO compliance rate
of the North Western WCZ was 89%, with the DO and NH3-N WQOs fully
met. Under the influence of high
seasonal background level in the Pearl River Estuary, the compliance rate for
Total Inorganic Nitrogen (TIN) WQO was 67%.
Table 5.5 Summary
EPD’s Routine Marine Water Quality Data for Western Buffer and Victoria
Harbour Phase 1 WCZs in Year 2023
|
Parameters
|
Hong Kong Island
(West)
|
Tsing Yi
(South)
|
Tsing Yi
(West)
|
Rambler Channel
|
WPCO WQO
(in marine waters)
|
|
WM1
|
WM2
|
WM3
|
WM4
|
VM12
|
VM14
|
|
Temperature (°C)
|
23.5
|
23.9
|
23.7
|
23.7
|
23.9
|
24.1
|
Not more than 2℃ in
daily temperature range
|
|
(17.4
– 27.5)
|
(17.4
– 28.2)
|
(17.4
– 27.8)
|
(17.5
– 28.0)
|
(17.6
- 28.0)
|
(17.6
- 28.7)
|
|
Salinity (ppt)
|
32.6
|
31.5
|
32.1
|
31.7
|
31.4
|
29.5
|
Not to cause more than 10% change
|
|
(30.9
– 33.8)
|
(28.6
– 33.2)
|
(29.2
– 33.2)
|
(29.1
– 33.0)
|
(28.0
- 32.9)
|
(24.4
- 32.9)
|
|
Dissolved Oxygen
(mg/L)
|
Depth Average
|
6.0
|
6.4
|
5.8
|
5.8
|
5.8
|
6.3
|
Not less than 4 mg/L for 90% of samples
|
|
(4.4
- 8.7)
|
(4.8
- 8.6)
|
(3.5
- 7.7)
|
(3.9
- 8.0)
|
(3.5
- 8.4)
|
(3.7
- 8.2)
|
|
Bottom
|
5.7
|
5.8
|
5.4
|
5.4
|
5.1
|
5.5
|
Not less than 2 mg/L for 90% of samples
|
|
(3.0
- 9.0)
|
(4.1
- 7.9)
|
(2.8
- 8.0)
|
(3.0
- 7.9)
|
(3.0 - 7.8)
|
(3.1 - 8.1)
|
|
Dissolved Oxygen
(% Saturation)
|
Depth Average
|
85
|
91
|
82
|
81
|
81
|
88
|
Not available
|
|
(64
- 110)
|
(73
- 119)
|
(52
- 97)
|
(56
- 101)
|
(51 - 121)
|
(54 - 115)
|
|
Bottom
|
79
|
82
|
75
|
76
|
72
|
77
|
Not available
|
|
(42
- 114)
|
(59
- 100)
|
(41
- 101)
|
(43
- 100)
|
(44 -
99)
|
(44 -
104)
|
|
pH
|
7.7
|
7.7
|
7.7
|
7.7
|
7.6
|
7.6
|
6.5 - 8.5 (±0.2 from natural range)
|
|
(7.1
- 8.2)
|
(7.2
– 8.2)
|
(7.2
– 8.2)
|
(7.2
– 8.2)
|
(7.1 -
8.0)
|
(7.1 -
8.1)
|
|
Secchi Disc Depth
(m)
|
2.8
|
2.6
|
2.5
|
2.5
|
2.6
|
2.7
|
Not available
|
|
(1.7
- 3.8)
|
(1.4
- 3.9)
|
(1.8
- 2.9))
|
(1.8
- 3.1)
|
(1.7 -
4.1)
|
(1.5 -
3.8)
|
|
Turbidity
(NTU)
|
5.0
|
3.4
|
5.3
|
4.5
|
6.6
|
5.5
|
Not available
|
|
(1.9
- 13.4)
|
(0.9
- 10.1)
|
(0.6
- 13.1)
|
(1.0
- 11.1)
|
(2.5 -
13.9)
|
(2.7 -
12.4)
|
|
Suspended Solids
(SS)
(mg/L)
|
5.4
|
5.0
|
5.9
|
6.4
|
9.1
|
7.8
|
Not more than 30% increase
|
|
(1.9
- 11.6)
|
(1.9
- 9.6)
|
(3.0
- 11.7)
|
(2.6
- 13.6)
|
(4.3 -
20.0)
|
(2.9 -
22.0)
|
|
5-day Biochemical
Oxygen Demand (BOD5)
(mg/L)
|
0.6
|
0.6
|
0.7
|
0.6
|
0.5
|
0.6
|
Not available
|
|
(<0.1
- 1.2)
|
(0.1
- 1.2)
|
(<0.1
- 1.8)
|
(<0.1
- 1.2)
|
(<0.1 - 1.2)
|
(<0.1 - 1.1)
|
|
Ammonia Nitrogen (NH3-N)
(mg/L)
|
0.059
|
0.110
|
0.131
|
0.102
|
0.137
|
0.099
|
Not available
|
|
(0.019
- 0.187)
|
(0.037
- 0.233)
|
(0.051
- 0.223)
|
(0.028
- 0.163)
|
(0.067 - 0.203)
|
(0.053 - 0.143)
|
|
Unionised Ammonia
(mg/L)
|
0.001
|
0.003
|
0.003
|
0.002
|
0.003
|
0.002
|
Not more than annual average of 0.021mg/L
|
|
(<0.001
- 0.005)
|
(<0.001
- 0.008)
|
(<0.001
- 0.009)
|
(<0.001
- 0.008)
|
(<0.001 - 0.007)
|
(<0.001 - 0.006)
|
|
Nitrite Nitrogen
(NO2-N) (mg/L)
|
0.025
|
0.032
|
0.031
|
0.032
|
0.034
|
0.039
|
Not available
|
|
(0.003
- 0.054)
|
(0.007
- 0.070)
|
(0.008
- 0.067)
|
(0.007
- 0.070)
|
(0.008
- 0.077)
|
(0.007
- 0.089)
|
|
Nitrate Nitrogen
(NO3-N) (mg/L)
|
0.082
|
0.135
|
0.128
|
0.154
|
0.175
|
0.221
|
Not available
|
|
(0.023
- 0.156)
|
(0.037
- 0.210)
|
(0.045
- 0.180)
|
(0.054
- 0.253)
|
(0.040 - 0.390)
|
(0.048 - 0.507)
|
|
Total Inorganic
Nitrogen (TIN) (mg/L)
|
0.17
|
0.28
|
0.29
|
0.29
|
0.35
|
0.36
|
Not more than annual average of 0.4mg/L
|
|
(0.09
- 0.36)
|
(0.19
- 0.38)
|
(0.17
- 0.43)
|
(0.17
- 0.39)
|
(0.15 - 0.58)
|
(0.14 - 0.66)
|
|
Total Kjeldahl
Nitrogen (TKN) (mg/L)
|
0.45
|
0.48
|
0.51
|
0.45
|
0.52
|
0.46
|
Not available
|
|
(0.13
- 0.79)
|
(0.24
- 0.81)
|
(0.21
- 0.88)
|
(0.17
- 0.78)
|
(0.12 - 0.85)
|
(0.14 - 0.85)
|
|
Total Nitrogen (TN)
(mg/L)
|
0.55
|
0.64
|
0.67
|
0.64
|
0.72
|
0.72
|
Not available
|
|
(0.19
- 0.97)
|
(0.32
- 1.02)
|
(0.30
- 1.08)
|
(0.24
- 0.97)
|
(0.28 - 1.19)
|
(0.26 - 1.22)
|
|
Orthophosphate
Phosphorus (PO4) (mg/L)
|
0.009
|
0.012
|
0.014
|
0.013
|
0.016
|
0.013
|
Not available
|
|
(<0.002
- 0.016)
|
(<0.002
- 0.022)
|
(<0.002
- 0.022)
|
(<0.002
- 0.018)
|
(0.008 - 0.026)
|
(0.005 - 0.023)
|
|
Total Phosphorus
(TP)
(mg/L)
|
0.06
|
0.07
|
0.08
|
0.07
|
0.08
|
0.07
|
Not available
|
|
(0.04
- 0.10)
|
(0.05
- 0.13)
|
(0.05
- 0.15)
|
(0.05
- 0.11)
|
(0.05 - 0.14)
|
(0.05 - 0.11)
|
|
Silica (as SiO2)
(mg/L)
|
0.77
|
0.82
|
0.85
|
0.90
|
1.09
|
1.26
|
Not available
|
|
(0.14
- 1.70)
|
(0.18
- 1.50)
|
(0.18
- 1.87)
|
(0.20
- 1.93)
|
(0.35 - 2.30)
|
(0.15 - 3.47)
|
|
Chlorophyll-a
(μg/L)
|
3.3
|
3.5
|
3.2
|
3.3
|
2.4
|
3.2
|
Not available
|
|
(0.3
- 13.7)
|
(0.4
- 14.9)
|
(0.4
- 16.7)
|
(0.3
- 16.7)
|
(0.6
- 10.6)
|
(0.6
- 12.3)
|
|
E. coli
(count/100mL)
|
18
|
150
|
1300
|
160
|
1000
|
360
|
Not available
|
|
(1
- 2300)
|
(3
- 4800)
|
(120
- 7100)
|
(12
- 2500)
|
(190 - 3300)
|
(85 - 21000)
|
|
Faecal Coliforms
(count/100mL)
|
31
|
270
|
2200
|
280
|
2200
|
780
|
Not available
|
|
(1
- 4400)
|
(4
- 8200)
|
(200
- 14000)
|
(24
- 4200)
|
(410 - 12000)
|
(160 - 43000)
|
Notes:
1. Statement of Water Quality Objectives
(Western Buffer Water Control Zone)
2. Data source: EPD Marine Water Quality
in Hong Kong in 2023
3. Except as specified, data presented are
depth-averaged values calculated by taking the means of three depths: Surface,
Mid-depth, Bottom.
4. Data presented are annual arithmetic
means of depth-averaged results except for E. coli and faecal coliforms
that are annual geometric means.
5. Data in brackets indicate the ranges.
Table 5.6 Summary
EPD’s Routine Marine Water Quality Data for North Western WCZ in Year 2023
|
Parameters
|
Lantau Island (North)
|
Pearl Island
|
Pillar Point
|
Urmston Road
|
Chek Lap Kok
(North)
|
Chek Lap Kok
(West)
|
WPCO WQO
(in marine waters)
|
|
NM1
|
NM2
|
NM3
|
NM5
|
NM6
|
NM8
|
|
Temperature (°C)
|
24.0
|
24.3
|
24.3
|
24.4
|
24.7
|
24.5
|
Not more than
2℃ in daily temperature range
|
|
(18.3 - 28.2)
|
(18.4 - 28.8)
|
(18.3 - 28.8)
|
(18.3 - 29.2)
|
(18.2 - 29.7)
|
(18.2 - 29.9)
|
|
Salinity (ppt)
|
30.4
|
29.3
|
29.2
|
28.3
|
27.1
|
28.4
|
Not to cause
more than 10% change
|
|
(26.5 - 33.0)
|
(23.3 - 33.0)
|
(23.8 - 33.1)
|
(22.2 - 32.9)
|
(17.9 - 33.0)
|
(16.0 - 33.1)
|
|
Dissolved Oxygen
(mg/L)
|
Depth Average
|
5.8
|
6.1
|
6.1
|
6.0
|
6.6
|
6.9
|
Not less than
4 mg/L for 90% of samples
|
|
(4.4 - 8.2)
|
(4.7 - 7.9)
|
(4.7 - 8.4)
|
(4.4 - 8.3)
|
(4.5 - 9.5)
|
(5.2 - 9.9)
|
|
Bottom
|
5.5
|
5.8
|
5.8
|
5.7
|
6.7
|
6.8
|
Not less than
2 mg/L for 90% of samples
|
|
(3.4 - 8.3)
|
(4.0 - 8.6)
|
(3.7 - 8.5)
|
(3.5 - 8.7)
|
(4.4 - 11.2)
|
(3.7 - 11.9)
|
|
Dissolved Oxygen
(% Saturation)
|
Depth Average
|
82
|
86
|
85
|
83
|
92
|
97
|
Not available
|
|
(64 - 106)
|
(69 - 118)
|
(69 - 108)
|
(65 - 106)
|
(66 - 141)
|
(76 - 143)
|
|
Bottom
|
77
|
82
|
81
|
80
|
94
|
96
|
Not available
|
|
(50 - 107)
|
(59 - 110)
|
(54 - 109)
|
(52 - 111)
|
(64 - 167)
|
(55 - 174)
|
|
pH
|
7.7
|
7.7
|
7.7
|
7.6
|
7.7
|
7.8
|
6.5 - 8.5
(±0.2 from natural range)
|
|
(7.2 - 8.1)
|
(7.1 - 8.2)
|
(7.1 - 8.2)
|
(7.0 - 8.1)
|
(7.0 - 8.2)
|
(7.2 - 8.4)
|
|
Secchi Disc Depth
(m)
|
2.4
|
2.3
|
2.1
|
2.2
|
2.2
|
1.9
|
Not available
|
|
(1.8 - 3.7)
|
(1.7 - 3.0)
|
(1.6 - 2.6)
|
(1.6 - 3.6)
|
(1.5 - 2.8)
|
(1.6 - 2.6)
|
|
Turbidity
(NTU)
|
6.0
|
5.3
|
6.8
|
5.2
|
4.4
|
6.4
|
Not available
|
|
(0.5 - 22.9)
|
(1.0 - 27.7)
|
(1.2 - 36.7)
|
(1.3 - 12.3)
|
(1.2 - 13.1)
|
(1.3 - 12.4)
|
|
Suspended Solids (SS)
(mg/L)
|
8.0
|
5.7
|
7.6
|
7.9
|
5.9
|
11.2
|
Not more than
30% increase
|
|
(3.3 - 14.0)
|
(3.2 - 7.4)
|
(3.4 - 17.3)
|
(4.5 - 13.2)
|
(3.9 - 13.0)
|
(5.2 - 20.7)
|
|
5-day Biochemical Oxygen Demand (BOD5)
(mg/L)
|
0.7
|
0.6
|
0.6
|
0.7
|
0.6
|
0.7
|
Not available
|
|
(<0.1 - 2.5)
|
(<0.1 - 1.9)
|
(0.2 - 2.3)
|
(0.2 - 2.3)
|
(0.1 - 2.0)
|
(0.1 - 2.4)
|
|
Ammonia Nitrogen (NH3-N)
(mg/L)
|
0.088
|
0.078
|
0.073
|
0.076
|
0.066
|
0.033
|
Not available
|
|
(0.046 - 0.137)
|
(0.050 - 0.137)
|
(0.049 - 0.120)
|
(0.042 - 0.133)
|
(0.039 - 0.098)
|
(0.012 - 0.063)
|
|
Unionised Ammonia
(mg/L)
|
0.002
|
0.002
|
0.002
|
0.002
|
0.002
|
0.001
|
Not more than
annual average of 0.021mg/L
|
|
(<0.001 - 0.005)
|
(<0.001 - 0.004)
|
(<0.001 - 0.004)
|
(<0.001 - 0.004)
|
(<0.001 - 0.004)
|
(<0.001 - 0.006)
|
|
Nitrite Nitrogen
(NO2-N) (mg/L)
|
0.044
|
0.049
|
0.050
|
0.057
|
0.055
|
0.046
|
Not available
|
|
(0.010 - 0.085)
|
(0.011 - 0.099)
|
(0.011 - 0.106)
|
(0.016 - 0.129)
|
(0.016 - 0.133)
|
(0.010 - 0.113)
|
|
Nitrate Nitrogen
(NO3-N) (mg/L)
|
0.245
|
0.307
|
0.323
|
0.403
|
0.439
|
0.351
|
Not available
|
|
(0.075 - 0.467)
|
(0.067 - 0.693)
|
(0.070 - 0.703)
|
(0.096 - 0.867)
|
(0.084 - 1.010)
|
(0.025 - 0.893)
|
|
Total Inorganic Nitrogen (TIN) (mg/L)
|
0.38
|
0.43
|
0.45
|
0.54
|
0.56
|
0.43
|
Not more than
annual average of 0.5mg/L
|
|
(0.20 - 0.57)
|
(0.17 - 0.79)
|
(0.16 - 0.81)
|
(0.20 - 1.05)
|
(0.18 - 1.08)
|
(0.07 - 1.01)
|
|
Total Kjeldahl Nitrogen (TKN) (mg/L)
|
0.44
|
0.39
|
0.39
|
0.37
|
0.34
|
0.35
|
Not available
|
|
(0.17 - 0.82)
|
(0.19 - 0.77)
|
(0.18 - 0.78)
|
(0.19 - 0.71)
|
(0.20 - 0.62)
|
(0.15 - 0.60)
|
|
Total Nitrogen (TN)
(mg/L)
|
0.73
|
0.75
|
0.77
|
0.83
|
0.84
|
0.74
|
Not available
|
|
(0.35 - 1.14)
|
(0.32 - 1.27)
|
(0.31 - 1.23)
|
(0.35 - 1.33)
|
(0.38 - 1.36)
|
(0.21 - 1.37)
|
|
Orthophosphate Phosphorus (PO4) (mg/L)
|
0.014
|
0.014
|
0.018
|
0.017
|
0.017
|
0.012
|
Not available
|
|
(0.002 - 0.021)
|
(0.003 - 0.024)
|
(0.008 - 0.026)
|
(<0.002 - 0.036)
|
(<0.002 - 0.035)
|
(<0.002 - 0.026)
|
|
Total Phosphorus (TP) (mg/L)
|
0.07
|
0.07
|
0.06
|
0.07
|
0.07
|
0.06
|
Not available
|
|
(0.03 - 0.11)
|
(0.04 - 0.11)
|
(0.04 - 0.10)
|
(0.04 - 0.10)
|
(0.04 - 0.11)
|
(0.04 - 0.12)
|
|
Silica (as SiO2)
(mg/L)
|
1.41
|
1.75
|
1.76
|
2.13
|
2.37
|
1.92
|
Not available
|
|
(0.09 - 3.27)
|
(0.08 - 5.17)
|
(0.08 - 5.07)
|
(0.10 - 5.80)
|
(0.09 - 6.57)
|
(0.06 - 5.60)
|
|
Chlorophyll-a
(μg/L)
|
2.8
|
2.0
|
1.9
|
1.6
|
2.7
|
5.7
|
Not available
|
|
(0.4 - 17.2)
|
(0.5 - 9.3)
|
(0.7 - 7.1)
|
(0.5 - 5.2)
|
(0.6 - 14.3)
|
(0.5 - 27.7)
|
|
E. coli
(count/100mL)
|
130
|
33
|
13
|
11
|
4
|
2
|
Not available
|
|
(10 - 1900)
|
(4 - 130)
|
(3 - 80)
|
(1 - 63)
|
(<1 - 20)
|
(1 - 4)
|
|
Faecal Coliforms
(count/100mL)
|
270
|
66
|
33
|
27
|
8
|
4
|
Not available
|
|
(28 - 3200)
|
(6 - 250)
|
(5 - 130)
|
(5 - 110)
|
(1 - 71)
|
(1 - 34)
|
Notes:
1. Statement of Water Quality Objectives
(North Western Water Control Zone)
2. Data source: EPD Marine Water Quality
in Hong Kong in 2023
3. Except as specified, data presented are
depth-averaged values calculated by taking the means of three depths: Surface,
Mid-depth, Bottom.
4. Data presented are annual arithmetic
means of depth-averaged results except for E. coli and faecal coliforms
that are annual geometric means.
5. Data in brackets indicate the ranges.
5.3.3
River Water Quality
5.3.3.1
Upon reviewing the latest
available EIA reports for existing baseline water quality information, it was
found that there are no recent EIA reports with baseline water quality data
from previous projects available. Additionally,
the current routine river water quality monitoring locations established by the
EPD do not cover the water streams near the project site. Therefore, additional water quality survey
was conducted to gather background information on the water systems in the
vicinity of the project site (as shown in Figure 5.1). The technical requirement for the additional River Water Quality Survey
including survey locations, methodology, and duration has been submitted and
approved by EPD.
5.3.3.2
Since there is lack of detailed
characteristics of water quality of the watercourses between Tsing Yi and North
Lantau Island, inland water quality survey of 3 sampling stations was proposed
to collect watercourse information in areas within the proposed 500m boundary
alignment. Locations of the proposed
sampling stations are shown in Figure 5.1,
water sampling location 1 (W1) and 2 (W2) are located at Tsing Yi Island, and
water sampling location 3 (W3) is at North Lantau Island.
5.3.3.3
Water sampling was conducted
between December 2023 and January 2024 as dry season sampling and in April 2024
as wet season sampling. In each season, 3 sampling events with duplicate were
conducted for each sampling
location. Since no water at W1 can be
collected during dry season, there were a total of 30 sampling events at 3 sampling locations
in 2 seasons.
5.3.3.4
For each survey station, field
measurement on temperature, pH, DO, conductivity, turbidity and salinity were taken. Analysis of SS, BOD5, COD, oil and grease, E.
coli, faecal coliforms, ammonia-nitrogen, nitrate-nitrogen, total kjeldahl
nitrogen, reactive phosphorus, total phosphorus, sulphide and metals were
carried out in laboratory determinations.
A summary of water sampling results is listed below in Table 5.7 for dry season and in Table 5.8 for wet season respectively.
Table 5.7 Summary of Water Quality Monitoring Data
for Inland Watercourses (Dry Season)
|
Parameters
|
Unit
|
Criteria
|
W2-
2023 Day 1
|
W2-
2023 Day 2
|
W2-
2024 Day 3
|
W2-
Avg
|
W3-
2023 Day 1
|
W3-
2023 Day 2
|
W3-
2023 Day 3
|
W3-
Avg
|
|
Temperature
|
°C
|
NA
|
17.30
|
21.20
|
21.50
|
20.00
|
13.05
|
11.50
|
19.70
|
14.75
|
|
pH
|
-
|
6.0~9.0
|
8.11
|
8.09
|
7.93
|
8.04
|
8.35
|
8.58
|
7.80
|
8.24
|
|
Dissolved
Oxygen
|
% Saturation
|
NA
|
95.70
|
93.25
|
93.95
|
94.30
|
95.15
|
97.45
|
99.85
|
97.48
|
|
Dissolved
Oxygen
|
mg/L
|
≥4
|
9.30
|
9.16
|
8.29
|
8.91
|
10.02
|
10.62
|
9.14
|
9.92
|
|
Turbidity
|
NTU
|
NA
|
0.36
|
0.38
|
0.44
|
0.39
|
3.80
|
3.37
|
5.09
|
4.08
|
|
Salinity
|
ppt
|
NA
|
0.21
|
0.22
|
0.22
|
0.22
|
0.11
|
0.22
|
0.06
|
0.13
|
|
Conductivity
|
μs
|
NA
|
376.00
|
374.80
|
411.65
|
387.48
|
0.19
|
0.35
|
0.09
|
0.21
|
|
Secchi
Disc Depth
|
cm
|
NA
|
2.00
|
2.00
|
2.00
|
2.00
|
10.00
|
10.00
|
8.00
|
9.33
|
|
Suspended
Solids (SS)
|
mg/L
|
≤25
|
6.20
|
0.65
|
<0.5
|
3.43
|
17.15
|
36.40
|
56.25
|
36.60
|
|
Ammonia
as N
|
mg/L
|
≤0.021
|
<0.005
|
<0.005
|
<0.005
|
<0.005
|
0.03
|
<0.005
|
<0.005
|
0.03
|
|
Nitrate
as N
|
mg/L
|
NA
|
0.44
|
0.46
|
0.44
|
0.45
|
0.08
|
0.07
|
0.07
|
0.07
|
|
Total
Kjeldahl Nitrogen as N
|
mg/L
|
NA
|
0.20
|
0.08
|
0.11
|
0.13
|
0.16
|
0.23
|
0.22
|
0.20
|
|
Total
Phosphorus as P
|
mg/L
|
NA
|
0.02
|
<0.01
|
0.01
|
0.01
|
0.02
|
0.03
|
0.03
|
0.03
|
|
Reactive
Phosphorus as P
|
mg/L
|
NA
|
<0.01
|
<0.01
|
<0.01
|
<0.01
|
<0.01
|
<0.01
|
<0.01
|
<0.01
|
|
Sulphide
as S2-
|
mg/L
|
NA
|
<0.05
|
<0.05
|
<0.05
|
<0.05
|
<0.05
|
<0.05
|
<0.05
|
<0.05
|
|
Cadmium
(Cd)
|
µg/L
|
≤5.5
|
<0.1
|
<0.1
|
<0.1
|
<0.1
|
<0.1
|
<0.1
|
<0.1
|
<0.1
|
|
Chromium
(Cr)
|
µg/L
|
≤4.4
|
7.10
|
6.90
|
6.80
|
6.93
|
<1
|
<1
|
<1
|
<1
|
|
Copper
(Cu)
|
µg/L
|
≤3.1
|
<1
|
<1
|
<1
|
<1
|
1.00
|
2.15
|
2.05
|
1.73
|
|
Lead
(Pb)
|
µg/L
|
≤4.4
|
<1
|
<1
|
<1
|
<1
|
1.70
|
1.30
|
4.40
|
2.47
|
|
Zinc
(Zn)
|
µg/L
|
≤8
|
7.50
|
6.00
|
4.00
|
5.83
|
20.00
|
17.50
|
17.00
|
18.17
|
|
Total
Organic Carbon
|
mg/L
|
NA
|
1.00
|
1.00
|
<1
|
1.00
|
<1
|
<1
|
<1
|
<1
|
|
Oil
& Grease
|
mg/L
|
NA
|
<1
|
<1
|
<1
|
<1
|
<1
|
<1
|
<1
|
<1
|
|
Chemical
Oxygen Demand
|
mg/L
|
≤30
|
3.50
|
4.00
|
4.00
|
3.83
|
7.50
|
4.50
|
10.00
|
7.33
|
|
Biochemical
Oxygen Demand
|
mg/L
|
≤5
|
<0.1
|
0.15
|
0.20
|
0.18
|
1.45
|
0.45
|
0.60
|
0.83
|
|
Aluminium
|
µg/L
|
NA
|
40.00
|
35.00
|
30.00
|
35.00
|
280.00
|
220.00
|
895.00
|
250.00
|
|
E.
coli
|
CFU/100mL
|
≤1000
|
\
|
1
|
\
|
1
|
19
|
21
|
\
|
20
|
|
Faecal
Coliforms
|
CFU/100mL
|
NA
|
4
|
4
|
6
|
5
|
23
|
25
|
\
|
24
|
Notes: (1) Values in bold and underlined indicates
non-compliance with criteria.
(2) The World Geodetic System 1984 coordinates of sampling locations
are: W1: 22°21'06.0"N 114°05'05.0"E; W2: 22°21'15.0"N
114°04'55.0"E; W3: 22°20'03.0"N 114°03'16.0"E.
(3) No water was found at W1 during the survey.
(4) EPD use five key parameters, including pH, suspended solids(SS),
dissolved oxygen (DO), 5-day biochemical oxygen demand (BOD5) and chemical
oxygen demand (COD), are used to assess compliance with the WQOs applicable for
individual monitoring stations for Inland Water.
(5) The data presented in Day 1/2/3 are the average of the duplicated
water sampling results.
(6) “\” indicates no data available or "not detected". The
average data didn’t count the “\” data and averaged the rest valid data.
(7) The data presented in Day 1, Day 2, and Day 3 are the average of the
duplicated water sampling results.
Table 5.8 Summary of Water Quality Monitoring Data
for Inland Watercourses (Wet Season)
|
Parameters
|
Unit
|
Criteria
|
W1-2024 Day 1
|
W1-2024 Day 2
|
W1-2024 Day 3
|
W1-Avg
|
W2-2024 Day 1
|
W2-2024 Day 2
|
W2-2024 Day 3
|
W2-Avg
|
W3-2024 Day 1
|
W3-2024 Day 2
|
W3-2024 Day 3
|
W3-Avg
|
|
Temperature
|
°C
|
NA
|
25.00
|
25.00
|
26.70
|
25.57
|
25.20
|
24.50
|
26.30
|
25.33
|
23.90
|
24.20
|
25.10
|
24.40
|
|
pH
|
-
|
6.0~9.0
|
7.86
|
7.42
|
8.42
|
7.90
|
7.90
|
7.85
|
8.30
|
8.02
|
7.50
|
7.68
|
7.65
|
7.61
|
|
Dissolved
Oxygen
|
% Saturation
|
NA
|
77.30
|
76.90
|
73.45
|
75.88
|
82.15
|
73.20
|
77.20
|
77.52
|
97.15
|
90.35
|
96.40
|
94.63
|
|
Dissolved
Oxygen
|
mg/L
|
≥4
|
6.38
|
6.22
|
5.79
|
6.13
|
6.67
|
6.10
|
6.14
|
6.30
|
8.18
|
7.56
|
7.93
|
7.89
|
|
Turbidity
|
NTU
|
NA
|
2.72
|
31.30
|
1.47
|
11.83
|
2.57
|
11.25
|
1.23
|
5.01
|
12.43
|
4.64
|
6.72
|
7.93
|
|
Salinity
|
ppt
|
NA
|
0.10
|
0.10
|
0.18
|
0.13
|
0.10
|
0.06
|
0.17
|
0.11
|
0.25
|
0.28
|
0.62
|
0.38
|
|
Conductivity
|
μs
|
NA
|
199.00
|
198.35
|
377.35
|
258.23
|
197.55
|
119.65
|
368.20
|
228.47
|
0.53
|
0.58
|
1.25
|
0.78
|
|
Secchi
Disc Depth
|
cm
|
NA
|
\
|
\
|
\
|
\
|
2.00
|
2.00
|
2.00
|
2.00
|
14.00
|
6.00
|
8.00
|
9.33
|
|
Suspended
Solids (SS)
|
mg/L
|
≤25
|
2.40
|
10.75
|
1.65
|
4.93
|
1.55
|
33.20
|
0.95
|
11.90
|
15.25
|
28.25
|
13.35
|
18.95
|
|
Ammonia
as N
|
mg/L
|
≤0.021
|
0.02
|
0.11
|
0.01
|
0.05
|
0.02
|
0.05
|
0.01
|
0.03
|
0.04
|
0.01
|
0.04
|
0.03
|
|
Nitrate
as N
|
mg/L
|
NA
|
2.13
|
1.82
|
2.77
|
2.24
|
2.23
|
1.04
|
2.77
|
2.01
|
0.77
|
0.15
|
0.32
|
0.41
|
|
Total
Kjeldahl Nitrogen as N
|
mg/L
|
NA
|
0.65
|
0.94
|
0.44
|
0.67
|
0.68
|
0.54
|
0.48
|
0.56
|
0.41
|
0.22
|
0.23
|
0.28
|
|
Total
Phosphorus as P
|
mg/L
|
NA
|
<0.01
|
0.05
|
<0.01
|
0.05
|
<0.01
|
0.02
|
<0.01
|
0.01
|
0.04
|
0.03
|
0.02
|
0.03
|
|
Reactive
Phosphorus as P
|
mg/L
|
NA
|
<0.01
|
<0.01
|
<0.01
|
<0.01
|
<0.01
|
<0.01
|
<0.01
|
<0.01
|
0.02
|
<0.01
|
0.01
|
0.01
|
|
Sulphide
as S2-
|
mg/L
|
NA
|
<0.05
|
<0.05
|
<0.05
|
<0.05
|
<0.05
|
<0.05
|
<0.05
|
<0.05
|
<0.05
|
<0.05
|
<0.05
|
<0.05
|
|
Cadmium
(Cd)
|
µg/L
|
≤5.5
|
<0.1
|
0.10
|
<0.1
|
0.10
|
<0.1
|
<0.1
|
<0.1
|
<0.1
|
<0.1
|
<0.1
|
<0.1
|
<0.1
|
|
Chromium
(Cr)
|
µg/L
|
≤4.4
|
<1
|
3.30
|
<1
|
1.77
|
<1
|
1.30
|
<1
|
1.10
|
<1
|
<1
|
<1
|
<1
|
|
Copper
(Cu)
|
µg/L
|
≤3.1
|
6.65
|
22.15
|
3.50
|
10.77
|
5.70
|
9.65
|
5.25
|
6.87
|
2.25
|
<1
|
1.15
|
1.47
|
|
Lead
(Pb)
|
µg/L
|
≤4.4
|
<1
|
8.25
|
<1
|
3.42
|
<1
|
2.20
|
<1
|
1.40
|
2.15
|
<1
|
1.20
|
1.45
|
|
Zinc
(Zn)
|
µg/L
|
≤8
|
26.00
|
118.50
|
13.50
|
52.67
|
21.00
|
106.50
|
125.00
|
84.17
|
20.00
|
235.50
|
65.00
|
106.83
|
|
Total
Organic Carbon
|
mg/L
|
NA
|
4.00
|
6.50
|
3.50
|
4.67
|
4.00
|
6.00
|
3.50
|
4.50
|
4.00
|
2.00
|
2.00
|
2.67
|
|
Oil
& Grease
|
mg/L
|
NA
|
<1
|
<1
|
<1
|
<1
|
<1
|
<1
|
<1
|
<1
|
<1
|
<1
|
<1
|
<1
|
|
Chemical
Oxygen Demand
|
mg/L
|
≤30
|
13.50
|
41.00
|
10.50
|
21.67
|
13.00
|
18.00
|
9.50
|
13.50
|
20.00
|
7.50
|
28.50
|
18.67
|
|
Biochemical
Oxygen Demand
|
mg/L
|
≤5
|
0.50
|
3.10
|
0.95
|
1.52
|
0.45
|
2.20
|
0.50
|
1.05
|
0.85
|
0.70
|
1.00
|
0.85
|
|
Aluminium
|
µg/L
|
NA
|
185.00
|
715.00
|
30.00
|
310.00
|
75.00
|
200.00
|
30.00
|
101.67
|
380.00
|
145.00
|
230.00
|
251.67
|
|
E.
coli
|
CFU/100mL
|
≤1000
|
500
|
7600
|
205
|
2768
|
480
|
2750
|
\
|
1615
|
2000
|
220
|
810
|
1010
|
|
Faecal
Coliforms
|
CFU/100mL
|
NA
|
850
|
8400
|
500
|
3250
|
1060
|
4650
|
\
|
2855
|
2550
|
315
|
1250
|
1371.67
|
Notes: (1) Values in bold and
underlined indicates non-compliance with criteria.
(2) The World
Geodetic System 1984 coordinates of sampling locations are: W1:
22°21'06.0"N 114°05'05.0"E; W2: 22°21'15.0"N 114°04'55.0"E;
W3: 22°20'03.0"N 114°03'16.0"E.
(3) WQO for Inland water was adopted.
(4) EPD use five key parameters, including pH,
suspended solids(SS), dissolved oxygen (DO), 5-day biochemical oxygen demand
(BOD5) and chemical oxygen demand (COD), are used to assess compliance with the
WQOs applicable for individual monitoring stations for Inland Water.
(5) The data presented in
Day 1/2/3 are the average of the duplicated water sampling results.
(6) “\” indicates no data available or "not detected". The
average data didn’t count the “\” data and averaged the rest valid data.
(7) The data presented in Day 1, Day 2, and Day 3 are the average of the
duplicated water sampling results.
5.3.3.5
Due to the prolonged absence of
rainfall during the monitoring period, water samples could not be collected at
water sampling location 1 (W1) in dry season. The characteristics of water
quality from available data at the 3 water sampling locations are discussed
below:
·
Dissolved Oxygen: DO levels varied between 8.29mg/L to
10.62mg/L in dry season and between
5.79 mg/L to 8.18mg/L in wet
season. The DO WQO for inland water in the Western Buffer and North Western
WCZs is set at not less than 4mg/L. The DO is slightly higher in W3 of North
Lantau Island than in W2 of Tsing Yi Island, but both high and comply with the
WQO in both seasons.
·
Salinity: Salinity ranged between 0.06 ppt and 0.22 ppt in dry season but slightly higher in wet
season from a range of 0.06 ppt to 0.62 ppt. The water salinity at W1 and W2 are all below 0.3
ppt but only shown a higher number of 0.62 ppt at W3 in wet season. The
monitored waterbodies are generally within a freshwater environment.
·
Suspended Solids: SS concentrations at W2 in dry season
varied between less than the detection limit of 0.5 mg/L and 6.2 mg/L,
indicating that the upstream of this watershed has minimal anthropogenic
interference. SS at W3 in dry season is relatively higher, primarily due to the
presence of a few residential areas upstream, indicating anthropogenic
influences. In wet season, the SS ranged between 0.95 mg/L and 15.25 mg/L for
the 3 locations generally but only has a high number greater than 25 mg/L at W2 and W3 on
the same sample day (Day 2), which indicates there might be anthropogenic
influences on that day.
·
Nutrients: The nutrient levels for the 3 locations are lower in dry season than in wet season. Ammonia-nitrogen was not detected for
most of the time at 3 locations (detection limit of < 0.005 mg/L) in dry
season and ranged between 0.01 mg/L and 0.11 mg/L in wet season.
Ammonia-nitrogen has the highest number shown at W1 in wet season (0.11 mg/L).
Nitrate-nitrogen levels varied between 0.07 mg/L and 0.46 mg/L in dry season
and increased to a range from 0.15 mg/L to 2.77 mg/L in wet season. Total
Kjeldahl nitrogen ranged from 0.08 mg/L to 0.23 mg/L in dry season and
increased to 0.22-0.94 mg/L in wet season with the highest number shown at W1.
The nitrogen level is higher at W1 and W2 than W3. Reactive Phosphorus was not
detected (detection limit of < 0.01 mg/L) in dry season and only shows a
above detection limit number of 0.02 mg/L at W3 in wet season. Total phosphorus
varied between 0.01 mg/L and 0.03 mg/L in dry season and the upper limit
increased to 0.05 mg/L in wet season. The phosphorus level is not high at all 3
monitoring locations in both seasons. The water quality monitoring results
indicate that there are no significant inputs from domestic or industrial
pollution sources at these 3 locations.
·
Heavy Metals: In dry season, most of the concentrations of cadmium,
chromium, and lead metals were below the assessment criteria (as shown in Table 5.4), except for chromium at W2 ranged between 6.8 µg/L
and 7.1 µg/L, copper at W3 varied between 1 µg/L and 2.15 µg/L, and zinc at W3
exceeded the criteria of 8 µg/L. In wet season, the level of sulphide,
cadmium and chromium were below the assessment criteria at all 3 locations,
while lead only has one above assessment criteria number at W1. The level of copper and Zinc were detected
to exceed the criteria for all 3 locations in wet season. The concentration of
aluminium was higher in W1 and W3 than in W2, and all levels were relatively
elevated in both seasons. Heavy Metals are relatively higher in wet season than
in dry season and the detection of elevated metal levels at the 3 locations may
be attributed to temporary construction effluent located upstream of the water
sampling locations.
·
Carbon: Total organic carbon was detected to be 1mg/L at W2
and was not detected (detection limit of <1mg/L) at W3 in dry season, with
most of the carbon present being in the inorganic form. However, the number
increased in wet season for all the locations in a range between 2 mg/L and 6.5
mg/L, indicating the carbon present being in the organic form in wet season.
·
COD/BOD: COD levels varied between 3.5mg/L and 10mg/L in dry
season and increased to 7.5 mg/L to 41 mg/L in wet season with the highest
exceeded criteria number at W1. BOD levels varied between 0.15mg/L and 0.6mg/L
in dry season and increased to between 0.45 mg/L and 3.1 mg/L in wet season
with the highest number shown at W1 as well.
·
E. coli: In dry season, E. coli level was only 1
CFU/100mL at W2, and between 19 CFU/100mL and 21 CFU/100mL at W3. However, E. coli levels slightly exceed the
assessment criteria limit most of the time at all 3 locations during the wet
season. This indicates potential non-point source pollution from upstream,
such as first flush due to rainfall (that is, initial surface run-off of a rainstorm. Water pollution
entering storm drains in areas with high proportions of impervious surfaces is
typically more concentrated compared to the remainder of the storm).
5.3.4
Beach Water Quality
5.3.4.1
The beach water quality
baseline conditions were established using data from routine monitoring
conducted by the EPD at Ma Wan Tung Wan Beach.
According to the 2024 Annual Beach
Water Quality Reports published by the EPD, Ma Wan Tung Wan Beach received a
"Fair" ranking based on the annual ranking and the geometric mean of E.
coli levels during the bathing season.
Table 5.9 Annual
Geometric Mean E. coli Levels in Tsuen Wan District
|
Beach
|
E.
coli counts per 100mL
|
|
2011
|
2012
|
2013
|
2014
|
2015
|
2016
|
2017
|
2018
|
2019
|
2020
|
2021
|
2022
|
2023
|
2024
|
|
Anglers'
|
27*
|
69*
|
133
|
130
|
77
|
76
|
45
|
143
|
88
|
105
|
135
|
142
|
162
|
83
|
|
Approach
|
59
|
83
|
106
|
121
|
143
|
78
|
114
|
92
|
97
|
133
|
71
|
84
|
92
|
107
|
|
Casam
|
21
|
50
|
71
|
63
|
52
|
42
|
43
|
94
|
79
|
84
|
74
|
109
|
59
|
62
|
|
Gemini
|
19*
|
40*
|
135*
|
110*
|
56*
|
40*
|
39*
|
120*
|
79*
|
101*
|
127*
|
139*
|
107*
|
108*
|
|
Hoi Mei Wan
|
23
|
51
|
86
|
58
|
90
|
65
|
63
|
92
|
112
|
84
|
76
|
75
|
85
|
44
|
|
Lido
|
21
|
32
|
53
|
57
|
52
|
39
|
34
|
76
|
65
|
66
|
98
|
111
|
56
|
54
|
|
Ma Wan
Tung Wan
|
10
|
24
|
41
|
31
|
20
|
32
|
29
|
74
|
46
|
84
|
93
|
54
|
133
|
46
|
|
Ting Kau
|
58*
|
88*
|
107*
|
89
|
151
|
140
|
75
|
101
|
102
|
93
|
85
|
96
|
113
|
76
|
Note: (1) * Beach had not opened for swimming that
year.
(2)
E.coli should not exceed 180 per 100 mL, calculated as the
geometric mean of all samples collected from March to October inclusive in one
calendar year.
5.4.1.1 The WSRs within the Assessment Area were identified with reference
to Annex 14 of the EIAO-TM. Major WSRs
identified in the Western Buffer and North Western WCZs are listed below in Table 5.10 and their indicative locations are given in Figure 5.1.
Table 5.10 Identified
WSRs
|
Category
|
ID
|
Description
|
|
Seawater Intakes
|
C1
|
Seawater Intake
for Future Sunny Bay Development
|
|
C2
|
Tsuen Wan
Seawater Intake
|
|
C3
|
MTR Tsing Yi
Station Seawater Intake
|
|
C4
|
Kwai Chung
Hospital
|
|
Water Pumping
Stations/Flushing Water Intakes
|
WSD1
|
Intake of Sunny
Bay Salt Water Pumping Station
|
|
WSD2
|
Intake of Tsuen
Wan Salt Water Pumping Station
|
|
WSD3
|
Intake of Tsing
Yi Salt Water Pumping Station
|
|
Typhoon
Shelter/Sheltered Anchorages
|
SA1
|
Ting Kau
Sheltered Anchorage
|
|
SA2
|
Tsuen Wan
Sheltered Anchorage
|
|
TS1
|
Rambler Channel
Typhoon Shelter
|
|
Beaches
|
B1
|
Anglers' Beach
|
|
B2
|
Gemini Beach
|
|
B3
|
Hoi Mei Wan
Beach
|
|
B4
|
Casam Beach
|
|
B5
|
Lido Beach
|
|
B6
|
Ting Kau Beach
|
|
B7
|
Approach Beach
|
|
B8
|
Ma Wan Tung Wan
Beach
|
|
Corals
|
CR1
|
Corals at To Kau
Wan
|
|
CR2
|
Corals at Sunny
Bay
|
|
Horseshoe Crabs
|
H1
|
Horseshoe Crabs
Area at Yam O
|
|
Mangroves
|
MG1
|
Mangrove near Ma
Wan
|
|
MG2
|
Mangrove near
Yam O
|
|
Seagrass Beds
|
SG1
|
Seagrass Beds
near Yam O
|
|
Fish Culture
Zone
|
F1
|
Ma Wan Fish Culture Zone
|
5.5
Identification of Potential Impacts
5.5.1.1
The key construction elements
of the Project include tunnels, cable supported bridges crossing Ma Wan Fairway
and Kap Shui Mun Fairway, reclamation area for the proposed bridge towers and
anchorages, viaducts and at-grade roads.
5.5.1.2
Marine construction works of
the Project would mainly involve long-span bridges construction crossing the Ma
Wan Fairway between Ma Wan and Tsing Yi and crossing the Kap Shui Mun Fairway
between Ma Wan and North Lantau. Construction work also includes reclamation at
Tsing Yi and Ma Wan, and construction of pile-supported Vessels Impact
Protection System (VIPS) North Lantau for the protection of bridge towers and
anchorages.
5.5.1.3
To address site constraints, a
combination of ground treatment methods for reclamation including Deep Cement
Mixing (DCM) and dredging will be adopted.
In order to minimise environmental impact, non-dredged reclamation
techniques particularly DCM, will be employed wherever feasible for the
construction of seawalls and the new land. The tentative construction
schedule would be 2027 to 2033 for land-based and marine-based works.
Additionally, a comprehensive set of mitigation
measures will be implemented to mitigate potential adverse effects on water
quality in the proximity of WSRs.
Details of the reclamation method and work sequences are presented in Section
2.9 and Appendix 5.2.
5.5.1.5
The key sources of potential
water quality issues associated with the construction phase are as follows:
Marine-based Construction Works
·
Wastewater
/ sewage effluent, from the construction activities and workforce and the
accidental chemical spillage into the marine environment;
·
Reclamation
at different locations between North Lantau and Tsing Yi Island depending on
geotechnical and environmental constraints; and
·
Potential
dredging in case where it is unavoidable due to the presence of thin layer and
soft marine deposits, or when the soils beneath the marine clay are excessively
stiff, making it challenging or impractical to achieve the desired embedment
condition using the DCM method.
Land-based Construction Works
·
Construction
site run-off;
·
Wastewater
discharges from general construction activities;
·
Accidental
spillage of chemical; and
·
Sewage
effluent produced by on-site workforce.
5.5.2
Operational Phase
5.5.2.1
The key sources of potential
water quality issues associated with the operation of the Project include:
·
Change in hydrodynamic
regime and local flow pattern in the vicinity of reclamation areas at Tsing Yi,
Ma Wan and North Lantau; and
·
Non-point
source surface run-off from the Project.
5.6.1
General
5.6.1.1
The WSRs in the vicinity of the
Project are presented in Figure 5.1.
5.6.2
Land-based Water Quality Impacts
5.6.2.1
All the identified sources of
potential water quality impacts from the land-based construction works and
operational phase water quality impacts (including non-point source surface
run-off) were evaluated and their impact significance determined. Practical water pollution control measures /
mitigation proposals were recommended to minimise the potential water quality
impacts.
5.6.3
Marine-based Water Quality Impacts
Water Quality Modelling Tools
5.6.3.1
The modules, D-Flow Flexible Mesh
and D-Water Quality, from the Delft3D Flexible Mesh (DFM) Suite modelling
software, was employed to simulate the
hydrodynamic and water quality conditions of the waterbodies under various
representative scenarios in this study.
5.6.3.2
DFM Model employs an
unstructured grid system that allows for adaptive mesh refinement, making it
versatile for modelling complex geometries.
The D-Flow module simulates water flow, including tides, currents, and
wave propagation, with high accuracy.
5.6.3.3
The D-Water Quality module
provides a sophisticated framework for studying the distribution and
transformation of constituents within aquatic systems. It facilitates assessments of water quality
parameters, including temperature, salinity, nutrients, and contaminants, while
considering various factors such as sediment interactions and biological
processes.
Sediment Plume Modelling
5.6.3.4
The D-Water Quality module was
utilised to simulate sediment transport processes, including erosion,
deposition, and sediment suspension.
These simulations are essential for comprehending the evolution of the
reclamation and potential dredging activities.
5.6.3.5
The hydrodynamic conditions
generated from the D-FLOW module provided basic hydrodynamic information for
modelling of sediment plume dispersion.
The processes of settling of sediment particles and exchange of sediment
particles between the water column and the seabed govern the sediment
transport. Sediment deposition and erosion occur when the bed shear stress is
below or above the critical shear stress.
The deposition rate and erosion rate were calculated using the following
equations:
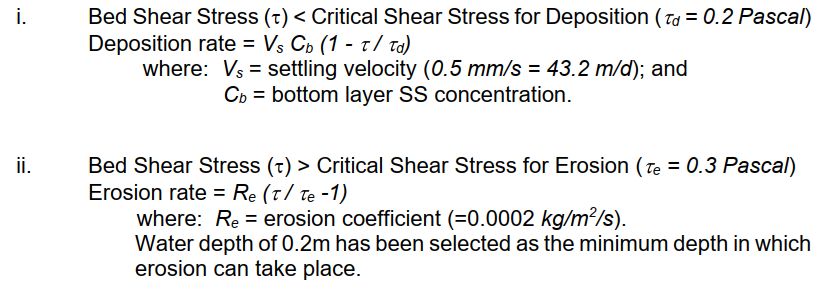
5.6.3.6
The above parameters have been
used to simulate the impacts from sediment plumes in Hong Kong associated with
uncontaminated mud disposal into the Brothers MBA([10]),
dredging for the Permanent Aviation Fuel Facility at Sha Chau([11]),
dredging and jetting for the Development of an Offshore Wind Farm in Hong Kong([12]) and
the Additional Gas-fired Generation Units Project([13]). The same settling velocity of 0.5 mm/s was
adopted in multiple approved EIAs in the vicinity which involved sediment
dispersion modelling, including Hong Kong Offshore LNG Terminal (EIAO Register
No. AEIAR-218/2018), Improvement Dredging for Lamma Power Station Navigation
Channel (EIAO Register No.: AEIAR-212/2017) and Development of a 100MW Offshore
Wind Farm in Hong Kong (EIAO Register No.: AEIAR-152/2010).
Model Grid Layout and Properties
5.6.3.7
The development of the detailed
model for this study is based on the HK-DFM model of version 202210, which was
accessed from the Environmental Protection Department's Centralised Environment
Database (CED). The HK-DFM model domain,
encompasses the northern region of the South China Sea, spanning from
Hainan Island to Taiwan, including all of Hong Kong's waters and the Pearl
River Delta. The northern boundary is
restricted to the coastlines of China and the Special Administrative Regions
(SARs) of Macau and Hong Kong.
5.6.3.8
For this EIA study, a detailed
model has been setup by refining the existing HK-DFM model in the vicinity of
the Project area. Specifically, the
resolution of the model grid in the marine waters near the Project site was
initially set at 140 meters in the HK-DFM Model. The model grid was refined in the Assessment
Area to less than 70 meters to give a better representation of the hydrodynamic
condition.
5.6.3.9
In general, as
shown in pages 2 and 3 of the Appendix
5.1, the refinement of the
HK-DFM model grid in the area of interest involves several steps, with each
step refining the grid by a factor of 2 by 2. In the Project area, a local
refinement of the model grid was applied within a 3-kilometer radius, which
involved grid refinement of the HK-DFM model from its initial 140-meter
resolution to a more detailed 70-meter resolution. This finer grid resolution is essential for
capturing the hydrodynamic characteristics more accurately and simulating the
dispersion of suspended sediments within the plume.
5.6.3.10
The smoothness is defined as
the ratio between the areas of two adjacent grid cells. As required in the
Deltares’ model technical manual, it should preferably be less than 1.2 in the
area of interest, and the ideal orthogonality is less than 0.02. The orthogonality of the locally refined grid
is generally less than 0.02. The grid quality of the detailed model is
generally good, except in some areas near the land boundary and the transition
between different grid sizes.
Considering that the flow velocity at the land boundary is small,
numerical errors associated with changes in orthogonality is minimal.
Model Bathymetry
5.6.3.11
The bathymetry schematisation
of the detailed model relies on the original bathymetry data extracted from the
HK-DFM model. In the local refinement of
the model grid in the vicinity of the Project area, depth data from the 'Charts
for Local Vessels 2018' provided by the Hydrographic Office of the Marine
Department of the HKSAR, was used for updates.
The hydrodynamic impact of the Contaminated Mud Pit (CMP) at East Sha Chau and The Brothers has also been
considered, and the final CMP depth after capping was assumed in the modelling
scenarios.
Boundary Conditions
5.6.3.12
The detailed model for this
Project is based on the original HK-DFM grid with local refinements and no
modifications were made to other offshore grid, the model's open boundary
conditions continue to rely on the original HK-DFM forcing conditions.
5.6.3.13
The HK-DFM Model is influenced
by boundary conditions at its three open boundaries. The tidal water levels at these open
boundaries are determined through harmonic expansion using the amplitudes and
phases of 32 tidal components. These
data were sourced from the global tide model FES2012, which provides amplitudes
and phases of the harmonic constituents on a 1/16° grid. As for the salinity and temperature open
boundary conditions, they are driven by WOA2013 data. The river discharge in
the Pearl River Delta is derived from the global database EartH2Observe.
Meteorological Conditions
5.6.3.14
The HK-DFM Model use spatially-
and time-varying meteorological data obtained from the ERA5 dataset. ERA5 is the latest climate reanalysis
developed by the European Centre for Medium-Range Weather Forecasts (ECMWF). This dataset offers hourly estimates of
various atmospheric variables at a resolution of 0.25º by 0.25º and can be
downloaded in NetCDF or GRIB format.
5.6.3.15
For meteorological surface
forcing of the model, the time- and spatially varying wind speed (in u- and
v-direction), the atmospheric pressure and the Charnock coefficient (required
to translate wind speed to surface stresses) are derived from ECMWF’s ERA5
dataset.
Simulation Periods
5.6.3.16
As required in clause 5 (iii) Appendix
D-1 of the EIA Study Brief, for construction stage impacts, model simulations
should be conducted for both dry and wet seasons. The simulation period should cover at least a
15-day full spring-neap cycle, excluding the spin-up period, for each of the
dry and wet seasons. Thus, in the model setup, the typical dry
season ran from 1 December 2015 to 1 February 2016, while typical wet season
ran from 1 July 2016 to 1 September 2016.
5.6.3.17
As required in clause 5 (vi) of
the EIA Study Brief, the changes in hydrodynamic regime should be assessed with
the model run for at least a 15-day spring-neap tidal cycle in both the dry and
wet seasons. Daily erosion/sedimentation
rate on identified WSR should be computed and assessed against with relevant
criteria.
5.6.3.18
Prior to undertaking any model
validation and assessment, a thorough model spin-up has been conducted to
ascertain the stability of the model results.
Specifically, the model has undergone a spin-up period encompassing year
2015-2016. Subsequently, the results
from the typical dry and wet seasons of 2016 were extracted for further
assessment.
Modelling Scenario
Construction Phase Sediment Plume
Model
5.6.3.19
In order to navigate site
constraints effectively, a hybrid approach involving DCM and dredging ground
treatment methods will be implemented.
The assessment of potential water quality impacts stemming from
marine-based construction activities will focus on quantifying the sources and
characteristics of sediment release during both dredging and DCM processes, as
detailed in the following sections.
Based on the tentative construction programme in Appendix 5.2 and the best
available information from other concurrent projects as detailed
in Section 5.7.2.15 to 5.7.2.16 , the following assessment scenarios were modelled:
·
Run C1a – With Project and
concurrent projects (Unmitigated): Simulate sediment plume dispersion during
Dredging with the highest release rate of suspended solids;
·
Run C1b – With Project and
concurrent projects (Unmitigated): Simulate sediment plume dispersion during Filling with the
highest release rate of suspended solids;
·
Run C2a – With Project and
concurrent projects (Mitigated): Simulate sediment plume dispersion during Dredging with the
highest release rate of suspended solids;
·
Run C2b – With Project and concurrent projects (Mitigated): Simulate
sediment plume dispersion during Filling with the highest release rate of suspended solids.
Operational Phase Hydrodynamic Model
5.6.3.20
The operational phase
hydrodynamic model is to evaluate the potential change in hydrodynamic regime
and local flow pattern in the vicinity of reclamation areas upon completion of
the Project. The following two
assessment scenarios have been evaluated in this study:
·
Scenario
1: Base Scenario – “Without Project” condition; and
·
Scenario
2: Development Scenario – With proposed reclamation.
Coastline Configuration and Cumulative
Assessment
5.6.3.21
Major factors that would affect
the water quality simulation would be (i) the change in pollution loading
discharged to marine waters; and (ii) the change in coastline configurations.
5.6.3.23
Table
5.11 shows the coastal development projects incorporated in the
coastline configurations for modelling.
However, it should be noted that some of these projects are still under
study and their layouts may be subjected to further modifications. Further details regarding the programme
overlap between the Project and concurrent projects will be updated in the EIA
report wherever feasible.
Table
5.11 Projects Incorporated into Modelling for Coastline Configurations
|
Project
|
Source of Information on Project Layout
|
|
Development of Integrated Waste Management
Facilities Phase 1
|
EIA Report for “Development of IWMF Phase 1”
(EIAO Register No.: AEIAR – 163/2012)
|
|
Harbour Area Treatment Scheme Stage 2A
|
EIA Report for “HATS Stage 2A” (EIAO Register
No.: AEIAR – 121/2008)
|
|
Hong Kong – Zhuhai – Macao Bridge Hong Kong
Boundary Crossing Facilities
|
EIA Report for “HZMB Hong Kong BCF” (EIAO
Register No.: AEIAR – 145/2009)
|
|
Hong Kong Link Road
|
EIA Report for “HZMB – Hong Kong Link Road”
(EIAO Register No.: AEIAR – 144/2009)
|
|
New Contaminated Mud Marine Disposal Facility
at Airport East / East Sha Chau Area
|
EIA Report for “New Contaminated Mud MDF at
Airport East / East Sha Chau Area” (EIAO Register No.: AEIAR – 089/2005)
|
|
Expansion of Hong Kong International Airport
into a Three-Runway System
|
EIA Report for “3RS” (EIAO Register No.:
AEIAR – 185/2014)
|
|
Sha Tin to Central Link
|
EIA Report for “SCL Protection Works at
Causeway Bay Typhoon Shelter: (EIAO Register No.: AEIAR – 159/2011), EIA
Report for “SCL – Hung Hom to Admiralty Section” (EIAO Register No.: AEIAR –
166/2012) and EIA Report for “SCL – Tai Wai to Hung Hom Section” (EIAO
Register No.: AEIAR – 167/2012)
|
|
Kai Tak Cruise Terminal
|
EIA Report for “Dredging, Works for Proposed
Cruise Terminal at Kai Tak” (EIAO Register No.: AEIAR – 115/2007)
|
|
Tuen Mun – Chek Lap Kok Link
|
EIA Report for “TM-CLKL” (EIAO Register No.:
AEIAR – 146/2009)
|
|
Tung Chung New Town Extension
|
EIA Report for “TCNTE” (EIAO Register No.:
AEIAR – 196/2016)
|
|
Contaminated Mud Pit at South Brothers
|
EIA Report for “New Contaminated Mud Marine Disposal
Facility at Airport East / East Sha Chau Area” (EIAO Register No.
AEIAR-089/2005)
(Remark: The hydrodynamic effect of the
capped CMP has been incorporated into the hydrodynamic model. The final level after capping of the CMP is
assumed in the model under all modelling scenarios)
|
|
CMP at East Sha Chau
|
|
Sunny Bay Reclamation
|
PWP Item No. 751CL - Planning and Engineering
Study on Sunny Bay Reclamation
|
|
Road P1 (Tai Ho –
Sunny Bay Section)
|
Project Profile
submitted for Application for EIA Study Brief (EIAO Register No.:
PP-615/2020)
|
|
Reclamation at
Lung Kwu Tan #
|
Project Profile
submitted for Application for EIA Study Brief (EIAO Register No.:
PP-668/2024)
|
|
Route 11 (section between Yuen Long and North
Lantau)
|
EIA Report (EIAO Register No.: AEIAR-255/2023)
|
|
Reclamation for
Kau Yi Chau Artificial Islands #
|
Project Profile
submitted for Application for EIA Study Brief (EIAO Register No.:
PP-633/2021)
|
|
Reclamation at
Tuen Mun West #
|
Public Works Subcommittee (PWSC) (Papers) No. PWSC(2023-24)25 –
Planning and Engineering Study for Lung Kwu Tan Reclamation and the
Re-planning of Tuen Mun West Area
|
|
Water Recreation
and Yacht Bay Development #
|
Project Profile submitted
for Application for EIA Study Brief (EIAO Register No.: PP-677/2024)
|
|
Development of
Integrated Waste Management Facilities Phase 2 (I·PARK2) #
|
EIA Report (EIAO
Register No.: AEIAR-263/2024)
|
|
Development of
Tseung Kwan O Area 137 and Associated Reclamation Sites #
|
EIA Report (EIAO
Register No.: AEIAR-265/2025)
|
Note:
# Only the coastline configurations of these projects
that might potentially affect the hydrodynamic regime and water quality were
included in the water quality impact assessment for operational phase. As these projects are very far away from the
project boundary of TYLL, the cumulative impacts due to these projects would be
negligible and hence they were not included in the list of concurrent projects
in Section 2 of this EIA report.
Model Validation and Verification
5.6.3.24
As shown in Appendix 5.1, the detailed model refined
for this EIA study has been properly calibrated and validated against the
HK-DFM Model before its application. A
comparison was conducted between the timeseries data of water level, salinity,
and current velocity at specified locations, as well as the
momentary/accumulated flow at cross-sections, between the detailed model and
the HK-DFM model.
5.6.3.25
Velocity vector plots and
salinity contour plots were generated and compared to verify that the detailed
model aligns with the HK-DFM Model. This
process supported that the refinement of the HK-DFM model grid does not
compromise the model's accuracy.
5.6.3.26
The Root Mean Square Error
(RMSE) or the standard deviation is the average of the square differences
between the observed and predicted values.
The RMSE is widely used to evaluate the model performance. The RMSE gives absolute values of
observation-prediction discrepancies. An
RMSE error of zero is ideal. To express
the discrepancies in percentage to measure the model performance, the Normalised Root Mean Square Error (NRMSE in %) is
used as the ratio of RMSE to the observed value change. NRMSE in % is
preferred over Relative Error (RE in %) because in modeling, certain variables
may possess significantly large mean values, resulting in very small relative
errors. This could potentially create a
misleading impression that the model predictions are highly accurate.
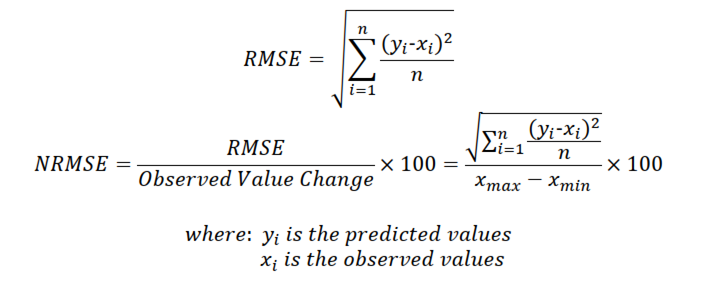
5.6.3.27
The water level predictions
consistently exhibit NRMSE% below 0.5%
at all observation points within the model domain throughout both seasons. Minimal phase error is
observed, particularly at high and low water levels. The water level NRMSE%
consistently remains well below the specified threshold of <8%, as outlined
in the EIA Study Brief Appendix D-1. For
current speed, the overall NRMSE% ranges between 2.40% and 11.96%, and the direction predicted
by the local refined model closely aligns with the HK-DFM Model. The deviation in current speed meets the
requirement set in the EIA Study Brief Appendix D-1, of which
the requirement is less than 30%. In addition to meeting
the NRMSE% requirement, the model also
ensured that the maximum phase error at peak speed is less than 20 minutes, and
the maximum direction error at peak speed is less than 15 degrees. Predicted
salinity also demonstrates strong agreement with the HK-DFM Model, with NRMSE% ranging from approximately 2.58% to 8.37%,
and the predicted maximum salinity deviation could meet with the requirement of
EIA Study Brief <2.5ppt.
5.6.3.28
The NRMSE% for momentary flow across the channel ranges from 0.39% to
1.38%. Minor deviations observed in some
hydrodynamic results can be attributed to the local refined model's grid
refinement. The validation process
indicates that the local refined detailed model consistently aligns well with
the HK-DFM Model, confirming that the grid refinement did not compromise the
accuracy of the model.
Table 5.12 Validation and
Verification Matrix for the Local Refined Model
|
Items
|
Parameters
|
Locations
|
|
Indicative Points
|
Water Level
Salinity
Current Velocity
|
Observation Point 01
KTD_SR5
KTD_G2
WM4
|
|
Cross-sections
|
Momentary Flow
Accumulated Flow
|
ADCP Pillar Point – CLK
ADCP Yam O Wan - TLK
Ma Wan Channel 1
Ma Wan Channel 2
|
|
Map Results
|
Velocity Vectors Plot
Salinity Contour Plot
Salinity Sectional Plot
|
-
|
Table 5.13 Level of Fitness Summary
between the Local Refined Model and HK-DFM Model at Observation Points
|
Observation Locations
|
Seasons
|
Water Level
|
Salinity
|
Current Speed
|
|
RMSE
|
NRMSE (%)
|
RMSE
|
NRMSE (%)
|
RMSE
|
NRMSE (%)
|
|
Observation Point 01
|
Dry Season
|
0.0063
|
0.31%
|
0.0420
|
2.58% |
0.0227 |
2.40% |
|
Wet Season
|
0.0054
|
0.23%
|
0.3714
|
4.06%
|
0.0402
|
3.02%
|
|
KTD_SR5
|
Dry Season
|
0.0093
|
0.46%
|
0.0755 |
5.44% |
0.0896 |
11.96% |
|
Wet Season
|
0.0097
|
0.42%
|
0.7664 |
8.37% |
0.0965
|
11.40%
|
|
KTD_G2
|
Dry Season
|
0.0027
|
0.13%
|
0.0439 |
4.05% |
0.0527
|
7.17%
|
|
Wet Season
|
0.0042
|
0.18%
|
0.5785 |
7.00% |
0.0650 |
4.50% |
|
WM4
|
Dry Season
|
0.0040
|
0.19%
|
0.0486 |
5.12%
|
0.0396
|
5.96%
|
|
Wet Season
|
0.0041
|
0.17%
|
0.5088 |
8.24% |
0.0638
|
8.97%
|
Table 5.14 Level of Fitness Summary
between the Local Refined Model and HK-DFM Model at Cross-sections
|
Observation Cross-sections
|
Seasons
|
Momentary Flow
|
Accumulated Flow
|
|
RMSE
|
NRMSE
(%)
|
RMSE
|
NRMSE
(%)
|
|
ADCP Pillar Point – CLK
|
Dry Season
|
321.1 |
0.39% |
10052408 |
0.42% |
|
Wet Season
|
379.9 |
0.43%
|
105873419
|
4.76%
|
|
ADCP Yam O
Wan - TLK
|
Dry Season
|
329.2 |
0.35% |
10152247 |
0.40% |
|
Wet Season
|
389.2 |
0.39%
|
106340743 |
4.60% |
|
Ma Wan Channel 1
|
Dry Season
|
330.9 |
0.35% |
10161973 |
0.40% |
|
Wet Season
|
388.9 |
0.39%
|
106311584 |
4.58% |
|
Ma Wan Channel 2
|
Dry Season
|
1081.1 |
1.62%
|
152673909 |
3.62%
|
|
Wet Season
|
967.5 |
1.38% |
88589535 |
4.79% |
Table 5.15 Model Performance of the Local Refined Model
|
Criteria
|
Level of fitness
|
Model Performance
|
|
Tidal elevation (Root Mean Square of
the Error)
|
< 8 %
|
< 1.9%
|
|
Maximum phase error at high water and
low water
|
< 20 minutes
|
< 12 minutes
|
|
Maximum current speed deviation
|
< 30 %
|
< 11.9%
|
|
Maximum phase error at peak speed
|
< 20 minutes
|
< 16 minutes
|
|
Maximum direction error at peak speed
|
< 15 degrees
|
< 15 degrees
|
|
Maximum salinity deviation
|
< 2.5 ppt
|
< 2.5 ppt
|
5.7
Prediction and Evaluation of
Environmental Impacts
5.7.1
Land-based Construction Phase Impacts
5.7.1.1
The key construction elements
of the Project include tunnels, cable supported bridges crossing Ma Wan Fairway
and Kap Shui Mun Fairway, reclamation area for the proposed bridge towers and
anchorages, viaducts and at-grade roads.
5.7.1.2
As described in Section 2.9,
land-based construction predominantly involves tunnel excavation for the
Project. The primary construction method
for the tunnels is expected to be the drill-and-blast method, which entails
controlled blasting to excavate medium to hard rock. Viaducts will be employed for the mainline
crossing North Lantau Interchange and Tsing Yi Connection, as well as the
associated slip roads. The viaducts will
be predominantly constructed using the precast concrete segmental erection
method to minimise on-site casting work.
Excavation of the rock hills at Lantau Island near Yi Chuen and Tso Wan
will be carried out as part of the site formation works for the proposed
at-grade roads and tunnel portals.
Tunnelling Works
5.7.1.3
As mentioned above, the primary
method of construction for the tunnel is expected to be the drill-and-blast
method, it might have potential impacts on underground water resource. If the mitigation measures in Section 5.8 are followed as practicable, water quality impacts from tunnelling
are expected to be minimal.
Wastewater from General Construction
Activities
5.7.1.4
Wastewater generated from
construction activities, including general cleaning and polishing, wheel
washing, dust suppression and utility installation may contain high SS
concentrations, as well as a certain amount of grease and oil. Potential water quality impacts due to
uncontrolled wastewater discharge can be avoided if construction and site
management practices are implemented to ensure that litter, fuels, and solvents
do not enter the water environment. It
is expected that if the good site practice suggested in Section 5.8
are followed as far as practicable, the potential water quality impacts
associated with construction activities would be minimal.
Construction Site Run-off
5.7.1.5
Potential pollution sources of
site run-off may include:
·
Run-off
and erosion of exposed bare soil and earth, drainage channels, earth working
areas and stockpiles;
·
Wash
water from dust suppression sprays and wheel washing facilities; and
·
Fuel,
oil and lubricants from maintenance of construction vehicles and equipment.
5.7.1.6
Site run-off would wash away
the soil particles on unpaved lands and areas with topsoil exposed during
rainstorms. Release of uncontrolled site
run-off,
characterised by high concentrations of SS, could increase the SS levels and
turbidity in the nearby water environment.
Site run-off may also wash away soil particles that were contaminated by
the construction activities and therefore cause water pollution.
5.7.1.7
Wind-blown dust would be
generated from exposed soil surfaces in works areas. It is possible that wind-blown dust would
fall directly onto the nearby water bodies when a strong wind occurs. Dispersion of dust within the works areas may
increase the SS levels in surface run-off causing a potential impact to the
nearby sensitive receivers.
5.7.1.8
Proper site practice and good
site management should be followed to prevent run-off with high level of SS
from entering the surrounding waters.
Best Management Practices (BMPs) in controlling construction site discharges
are recommended in Section 5.8
for this Project. With the
implementation of BMPs to control run-off and drainage from the construction
site, disturbance of water bodies would be avoided and deterioration in water
quality would be minimal.
Construction Works Within and in Close
Proximity to Inland Water
5.7.1.9
Construction activities in
close vicinity to the inland watercourses may impact water quality due to the
potential uncontrolled release of construction waste and wastewater. Construction waste and wastewater are generally
characterised by high SS concentration and elevated pH. With the implementation of adequate
construction site drainage and BMPs as described in Section 5.8 and
provision of precautionary measures / practices as specified in ETWB TC(Works)
No. 5/2005 "Protection of natural streams / rivers from adverse impacts
arising from construction works", it is anticipated that water quality
impacts would be minimal.
5.7.1.10
The construction of at-grade
roads, viaduct supports, tunnel portals, and associated slope works at streams
W1, W2, and W3 (as shown in Figure 8.7.1)
may result in a very localised and temporary diversion of these streams. Stream
diversion works should be conducted in accordance with the guidelines specified
in ETWB TC(W) No. 5/2005 – Protection of Natural Streams/Rivers from Adverse
Impacts Arising from Construction Works (ETWB, 2005). To minimize disturbance,
construction works adjacent to watercourses should preferably be carried out
during the dry season where flow in the stream/river is low. Where feasible,
avoidance measures should be implemented, such as establishing a work exclusion
zone with a minimum 5-meter setback from the edge of the watercourse.
Alternatively, elevated temporary work platforms may be used over affected
watercourses for construction and access, with supporting structures positioned
outside the watercourse and its banks to reduce direct impact. With the proper
implementation of the mitigation measures, no unacceptable effects on water
quality are anticipated.
Sewage from Construction Workforce
5.7.1.11
During the construction of the
Project, the workforce on site will generate sewage effluent, which is
characterised by high levels of BOD, ammonia and E. coli counts. Based on the DSD Sewerage Manual, the sewage
production rate for construction workers is estimated at 0.35 m3 per
worker per day. Potential water quality
impacts upon the local drainage and freshwater system may arise from these
sewage effluents, if uncontrolled.
5.7.1.12
Temporary sewage generation can
be adequately treated by interim sewage treatment facilities, such as portable
chemical toilets. Provided that sewage
is not discharged directly into storm drains or inland waters adjacent to the
construction site, temporary sanitary facilities are used and properly
maintained, and control measures as recommended in Section 5.8 are
adopted as far as practicable, it is unlikely that sewage generated from
construction workforce would have a significant water quality impact.
Accidental Spillage of Chemicals
5.7.1.13
The use of chemicals such as
engine oil and lubricants, and their storage as waste materials has the
potential to impact water quality if spillage occurs and enters adjacent water
environment. Waste oil may infiltrate
into the surface soil layer, or run-off into the nearby water environment,
which in turn increases the hydrocarbon levels.
The potential impacts could however be avoided by practical
precautionary measures and good site practices (as given in Section 5.8).
5.7.2
Marine-based Construction Phase Impacts
Proposed Suspended Solids Criteria for
Indicator Points
5.7.2.1
The assessment area of this
Project covers Western Buffer and North Western WCZs. As detailed in Section 5.2, the WQOs
for SS for both WCZs stipulate that for marine waters human activity (e.g.
waste discharge) should not cause the natural ambient level to be raised by 30%
or cause SS accumulation that may adversely affect aquatic communities. The respective allowable increase in SS
concentrations within the corresponding WCZs was used as the assessment
criterion. To determine the ambient SS
concentrations in the affected waters, the water quality monitoring data from
EPD monitoring stations WM4/NM1/VM12/VM14 in the WCZ were analysed.
5.7.2.2
EPD marine water quality data
in sea surface, mid-depth and the bottom were collected and analysis. The sampling in wet season was taken from
April until the end of September in each year. The 90 percentiles for each
station in the recent 10 years from 2014 to 2023 are summarised in
Table 5.16.
Table
5.16 90th Percentile SS from EPD Routine
Monitoring Programme (2014-2023)
|
Station
|
90th Percentile Suspended Solids
Concentrations (mg/L)
|
|
Surface
|
Middle
|
Bottom
|
Depth Averaged
|
|
Dry Season
|
Wet Season
|
Dry Season
|
Wet Season
|
Dry Season
|
Wet Season
|
Dry Season
|
Wet Season
|
|
WM4
|
9.70
|
9.24
|
12.00
|
11.60
|
17.00
|
16.00
|
12.90
|
12.28
|
|
NM1
|
11.90
|
9.96
|
17.80
|
14.60
|
18.00
|
21.80
|
15.90
|
15.45
|
|
VM12
|
10.80
|
11.00
|
12.60
|
11.70
|
14.80
|
18.70
|
12.73
|
13.80
|
|
VM14
|
9.67
|
8.99
|
11.70
|
9.22
|
13.00
|
10.70
|
11.46
|
9.64
|
5.7.2.3
In order to assess the impact
of construction activities on water quality, SS were evaluated against the WQO
which stipulates that waste discharge should not increase the natural ambient
level by more than 30% or cause SS accumulation that may adversely affect
aquatic communities. For the affected WCZs, the allowable increase in SS
concentrations was determined by comparing the ambient SS concentrations in the
affected waters with the SS criteria derived from 30% of the 90th
Percentile SS concentration measurement at the nearest EPD’s Monitoring
Stations, as summarised in Table 5.17. The ambient level was obtained from the
nearest EPD water quality monitoring station for each identified WSR and the
corresponding SS criterion for each modelling observation point is presented in
Table 5.18.
5.7.2.4
For seawater intake WSRs, the
WSD has established standards for the quality of abstracted seawater (Table 5.3). The water quality of identified seawater
intakes in the project has been assessed against an SS criterion of <10mg/L,
in addition to the WQOs. For
the adopted standards for cooling water intake have
been discussed in Section 5.2.1.7, the SS
limit is 40mg/L.
5.7.2.5
The AFCD has established a
guideline value for the protection of water quality at Fish Culture Zones
(FCZs), recommending a maximum value of 50 mg/L. This criterion has been adopted in previously
approved EIA reports (,,,). Therefore, the AFCD criterion,
WSD standard and the WQO are deemed applicable for the
assessment area. While these criteria are considered acceptable but to be conservative, the most stringent value has been adopted for the sediment plume assessment.
5.7.2.6
The list of observation points
at the WSRs and the allowable SS elevation criteria
were summarised in Table 5.18.
Table
5.17 Suspended Solids Elevation Criteria (mg/L) for
the Construction Phase Impacts
|
Station
|
Suspended Solids Criteria (mg/L)
|
|
Surface
|
Middle
|
Bottom
|
Depth Averaged
|
|
Dry Season
|
Wet Season
|
Dry Season
|
Wet Season
|
Dry Season
|
Wet Season
|
Dry Season
|
Wet Season
|
|
WM4
|
2.91
|
2.77
|
3.60
|
3.48
|
5.10
|
4.80
|
3.87
|
3.68
|
|
NM1
|
3.57
|
2.99
|
5.34
|
4.38
|
5.40
|
6.54
|
4.77
|
4.64
|
|
VM12
|
3.24
|
3.30
|
3.78
|
3.51
|
4.44
|
5.61
|
3.82
|
4.14
|
|
VM14
|
2.90
|
2.70
|
3.51
|
2.77
|
3.90
|
3.21
|
3.44
|
2.89
|
Table
5.18 Allowable Suspended Solids Elevation Criteria (mg/L) for
The Modelling Observation Points
|
Location
|
Nearest
EPD’s Station
|
Suspended Solids
Criteria (mg/L)
|
|
Dry Season
|
Wet Season
|
|
S
|
M
|
B
|
DA
|
S
|
M
|
B
|
DA
|
|
WSD1
|
NM1
|
3.57
|
5.34
|
5.40
|
4.77
|
2.99
|
4.38
|
6.54
|
4.64
|
|
MG2
|
NM1
|
3.57
|
5.34
|
5.40
|
4.77
|
2.99
|
4.38
|
6.54
|
4.64
|
|
H1
|
NM1
|
3.57
|
5.34
|
5.40
|
4.77
|
2.99
|
4.38
|
6.54
|
4.64
|
|
SG1
|
NM1
|
3.57
|
5.34
|
5.40
|
4.77
|
2.99
|
4.38
|
6.54
|
4.64
|
|
CR2
|
NM1
|
3.57
|
5.34
|
5.40
|
4.77
|
2.99
|
4.38
|
6.54
|
4.64
|
|
C1
|
NM1
|
3.57
|
5.34
|
5.40
|
4.77
|
2.99
|
4.38
|
6.54
|
4.64
|
|
CR1
|
NM1
|
3.57
|
5.34
|
5.40
|
4.77
|
2.99
|
4.38
|
6.54
|
4.64
|
|
MG1
|
WM4
|
2.91
|
3.60
|
5.10
|
3.87
|
2.77
|
3.48
|
4.80
|
3.68
|
|
WM4
|
WM4
|
2.91
|
3.60
|
5.10
|
3.87
|
2.77
|
3.48
|
4.80
|
3.68
|
|
C4
|
VM12
|
3.24
|
3.78
|
4.44
|
3.82
|
3.30
|
3.51
|
5.61
|
4.14
|
|
B2
|
WM4
|
2.91
|
3.60
|
5.10
|
3.87
|
2.77
|
3.48
|
4.80
|
3.68
|
|
SA2
|
VM14
|
2.90
|
3.51
|
3.90
|
3.44
|
2.70
|
2.77
|
3.21
|
2.89
|
|
C3
|
VM12
|
3.24
|
3.78
|
4.44
|
3.82
|
3.30
|
3.51
|
5.61
|
4.14
|
|
VM12
|
VM12
|
3.24
|
3.78
|
4.44
|
3.82
|
3.30
|
3.51
|
5.61
|
4.14
|
|
VM14
|
VM14
|
2.90
|
3.51
|
3.90
|
3.44
|
2.70
|
2.77
|
3.21
|
2.89
|
|
F1
|
WM4
|
2.91
|
3.60
|
5.10
|
3.87
|
2.77
|
3.48
|
4.80
|
3.68
|
|
B1
|
WM4
|
2.91
|
3.60
|
5.10
|
3.87
|
2.77
|
3.48
|
4.80
|
3.68
|
|
B4
|
WM4
|
2.91
|
3.60
|
5.10
|
3.87
|
2.77
|
3.48
|
4.80
|
3.68
|
|
B5
|
WM4
|
2.91
|
3.60
|
5.10
|
3.87
|
2.77
|
3.48
|
4.80
|
3.68
|
|
B7
|
WM4
|
2.91
|
3.60
|
5.10
|
3.87
|
2.77
|
3.48
|
4.80
|
3.68
|
|
B8
|
WM4
|
2.91
|
3.60
|
5.10
|
3.87
|
2.77
|
3.48
|
4.80
|
3.68
|
|
NM1
|
NM1
|
3.57
|
5.34
|
5.40
|
4.77
|
2.99
|
4.38
|
6.54
|
4.64
|
|
WSD2
|
VM14
|
2.90
|
3.51
|
3.90
|
3.44
|
2.70
|
2.77
|
3.21
|
2.89
|
|
WSD3
|
VM14
|
2.90
|
3.51
|
3.90
|
3.44
|
2.70
|
2.77
|
3.21
|
2.89
|
|
TS1
|
VM14
|
2.90
|
3.51
|
3.90
|
3.44
|
2.70
|
2.77
|
3.21
|
2.89
|
|
B3
|
WM4
|
2.91
|
3.60
|
5.10
|
3.87
|
2.77
|
3.48
|
4.80
|
3.68
|
|
B6
|
WM4
|
2.91
|
3.60
|
5.10
|
3.87
|
2.77
|
3.48
|
4.80
|
3.68
|
|
C2
|
VM14
|
2.90
|
3.51
|
3.90
|
3.44
|
2.70
|
2.77
|
3.21
|
2.89
|
|
SA1
|
WM4
|
2.91
|
3.60
|
5.10
|
3.87
|
2.77
|
3.48
|
4.80
|
3.68
|
Notes: S – Surface Layer, M – Middle Layer; B –
Bottom Layer; DA – Depth Averaged.
Sediment Release due to Proposed Reclamation
Works
5.7.2.7
The reclamation in Ma Wan and
Tsing Yi are unavoidable, as they will be the protection to those bridge
towers, marine bridge piers and marine anchorage in Ma Wan and Tsing Yi. Holistic engineering consideration has taken
to adopt the minimum clearance between the edge of reclamation and the
foundation of bridge tower/pier/anchorage, so as to avoid physical contact
between vessel and bridge structure in collision. At the same time, to minimise the extent of
dredging as far as practicable so as to minimise the associated water quality
impacts and impacts on marine ecology.
5.7.2.8
As presented in Section 2,
in consideration of the different reclamation methods, different reclamation
approaches from dredging to non-dredging were investigated. It was proposed
that non-dredging method using DCM should be applied as far as practicable to
limit the construction time required and reduce the settlement of the
reclamation. However, it should be noted
that the DCM technique may not be practical or the most cost effective in some
areas of the site. According to the
geotechnical condition, rocks (potentially of varying weathering grades),
boulders / cobbles / gravels, sandy materials, dumped materials and debris are
present at the seabed in these areas. In
view of these seabed features and the relatively thin marine deposits in local areas,
dredging of limited depths to remove thin layer of and local marine deposits as
well as various boulders / cobbles / gravels / debris may be considered as a
more practical method.
5.7.2.9
To avoid the need for dredging
and disposal of thick layer of marine deposits especially for the reclamation
of the Tsing Yi and Ma Wan South Towers of the proposed bridge crossing Ma Wan
Fairway, non-dredged reclamation with the marine deposits left in place may be
adopted. DCM ground treatment can be
utilised to improve the strength and stiffness of the soft marine clay to
control the stability of the seawalls and long-term settlement of the reclaimed
areas.
5.7.2.10
Areas of relatively thin marine
deposits are also identified in areas of the proposed reclamation for the
towers of proposed bridges crossing Ma Wan Fairway and Kap Shui Mun Fairway and
Ma Wan South anchorage. Removal of soft
marine deposits by dredging may be considered in these areas. For areas where thick layer of marine
deposits is present, there may be seabed features of boulders / cobbles /
gravels / debris which are potential obstructions for the DCM works. Consideration should be given to the combined
ground treatment method using removal of shallow obstructions followed by DCM
treatment.
5.7.2.11
Furthermore, there may be local
areas where the soft marine deposit is underlain directly by in-situ soils
(e.g. saprolite), which is relatively hard for the DCM rigs to penetrate and
therefore embedment condition of the DCM clusters is not expected to be
acceptable. Under this circumstance,
dredging of soft marine deposit may be necessary in local areas. As dredging works would inevitably generate
SS from the disturbed sediment at the seabed, quantitative water quality
modelling would be conducted to assess the impacts induced by the dredging
works.
5.7.2.12
Appendix 5.2 provides details on
the reclamation work sequence and the potential release of SS. The bulk density of filling materials for
sand and public fill are 1,680kg/m3 and 1,900kg/m3,
respectively. The assumed sediment loss
rate for the public fill and sand blanket is 5% of the fine content percentage
(<63µm) in the filling materials, and the sediment reduction due to the
leading seawall is assumed to be 45% based on the HZMB EIA report and TCNTE EIA
report.
5.7.2.13
According to the latest design,
dredging will be necessary before commencing reclamation works. The proposed reclamation works sequence
revealing that the filling works will be carried out within the seawall, meaning
that once the seawall reaches above sea level, no SS will be released into the
marine water. However, since dredging activities will be carried out before
seawall construction, SS will inevitably be generated when dredging seabed
sediments. Although the majority of the
reclamation works will be carried out within the confines of the already
constructed seawall, for conservative assessment purposes, we assume a
reduction rate of 45% for SS release due to the seawall. Therefore, a quantitative water quality model
was conducted to evaluate the water quality impacts resulting from both the
dredging and reclamation works (filling below water).
5.7.2.14
As shown in Appendix 5.2, the estimated SS loss per
workfront is 121.8 g/s during the dredging activities. Considering three workfronts for each zone,
the total SS release rate amounts to 365.5 g/s for each zoning. In terms of reclamation filling, the highest
release rate of SS under an unmitigated scenario is expected to occur in Q4
2028 to Q1 2029. The SS release is
estimated to be 34.38 tonnes/day for Tsing Yi Tower (Q4 2028 to Q1 2029), 67.66
tonnes/day for Ma Wan South Tower (Q4 2028), and 32.60 tonnes/day for Ma Wan
South Anchorage (Q4 2028). For
conservative assessment, despite the Ma Wan South Tower and Anchorage's work
period being in Q4 2028, the SS loading for these three locations is
combined. Additionally, the SS loading
of 1.87 tonnes/day for Kap Shui Mun Tower in Q1 2028 is included in the
assessment. This scenario represents the
worst condition. Take the Ma Wan South
Tower as example, the SS release rate is calculated to be 1566 g/s under the
unmitigated scenario, whereas the mitigated scenarios with silt curtain are
expected to result in a rate of 861 g/s. The
sediment loss during the DCM operation process, including sediment release from
auger blade rotation and other associated activities, has been comprehensively
considered in the modelling.
5.7.2.15
Regarding the cumulative
impacts from concurrent projects, the Route 11 (section between Yuen Long and
North Lantau) and
Road P1 (Tai Ho – Sunny Bay Section) were considered for the construction phase. For the I-Park 2, according to the Approved EIA Report for
Development of Integrated Waste Management Facilities Phase 2 (I·PARK2) (EIAO
Register No.: AEIAR-263/2024), the project's construction phase is scheduled to
commence in 2026 with anticipated completion in the early 2030s, with two
sediment dispersion modelling scenarios from closed grab dredger operational at
the Middle Ash Lagoon shoreline during 2026 sand placement operations and at
the West Ash Lagoon shoreline during 2027 sand placement activities. As
detailed in Section 5.7.2.14 and Appendix 5.2, Q4 2028 to Q1 2029 would be the worst-case for sedimentation
impacts from this Project, demonstrating temporal separation from both I∙PARK2
construction scenarios.
Sediment Plume Modelling Results of
Unmitigated Scenario
5.7.2.17
In the context of dredging
activities scenario, the maximum predicted SS elevations and sedimentation rate
at the WSRs and other observation points under scenario C1 are outlined in Table 5.19 and Table 5.21,
with the predicted maximum extents of SS elevations and sedimentation rates
detailed in Appendix 5.3. The maximum extent of the sediment plume
resulting from dredging is confined to the dredging
area, and no exceedance is anticipated at any of the WSRs. While a slight exceedance was observed near
the dredging area, the exceedance zone is very small. The
maximum distance of the exceedance zone from the sediment release source is
around 58m. From the simulation results, it is evident
that even without the implementation of any mitigation measures such as silt
curtain, the relatively low SS release load from dredging is unlikely to cause
exceedances at nearby WSRs. Consequently, the dredging activities are
not predicted to cause significant adverse water quality impacts on nearby
sensitive receivers, including bathing beaches (e.g., Ma Wan Tung Wan Bathing
Beach), Fish Culture Zones (FCZs) (such as the nearest Ma Wan FCZ), and
intertidal/subtidal habitats (e.g., the corals at To Kau Wan).
5.7.2.18
In the reclamation filling
activities scenario, as shown in Table 5.20 and Table 5.22 due to the adoption of the worst-case assumptions, such as in Ma Wan South Tower, the SS release rate is
calculated to be 1,566 g/s under reclamation filling activities, compared to
only 365.5 g/s during dredging. The
higher SS release would result in short-duration exceedances observed during
the wet season at observation point WM4.
Localised instances of water quality exceedances are expected in the
vicinity of the reclamation filling area. However, it is crucial to emphasise that these exceedances are
transient and of short duration, dissipating rapidly upon cessation of the reclamation filling works. Furthermore, even under these
worst-case conditions, the reclamation filling activities are not predicted to
cause adverse water quality impacts on nearby sensitive receivers. These
include the closest bathing beaches (e.g., Ma Wan Tung Wan Bathing Beach), FCZs
(such as the adjacent Ma Wan FCZ), and intertidal/subtidal habitats (e.g., the corals at To Kau Wan).
Table 5.19 Predicted Maximum Suspended Solids (mg/L)
Elevations during Dredging Activities (Run C1a – With Project, Unmitigated)
|
Location
|
Predicted Maximum Suspended Solids (mg/L)
Elevations
|
Suspended Solids Criteria (mg/L)
|
Compliance to Criteria (mg/L)
|
|
Dry Season
|
Wet Season
|
Dry Season
|
Wet Season
|
|
S
|
M
|
B
|
DA
|
S
|
M
|
B
|
DA
|
S
|
M
|
B
|
DA
|
S
|
M
|
B
|
DA
|
|
WSD1
|
0.01
|
0.02
|
0.04
|
0.02
|
0.01
|
0.03
|
0.05
|
0.03
|
3.57
|
5.34
|
5.40
|
4.77
|
2.99
|
4.38
|
6.54
|
4.64
|
Yes
|
|
MG2
|
0.00
|
0.00
|
0.00
|
0.00
|
0.00
|
0.00
|
0.00
|
0.00
|
3.57
|
5.34
|
5.40
|
4.77
|
2.99
|
4.38
|
6.54
|
4.64
|
Yes
|
|
H1
|
0.00
|
0.00
|
0.00
|
0.00
|
0.00
|
0.00
|
0.01
|
0.00
|
3.57
|
5.34
|
5.40
|
4.77
|
2.99
|
4.38
|
6.54
|
4.64
|
Yes
|
|
SG1
|
0.00
|
0.01
|
0.01
|
0.00
|
0.00
|
0.00
|
0.01
|
0.01
|
3.57
|
5.34
|
5.40
|
4.77
|
2.99
|
4.38
|
6.54
|
4.64
|
Yes
|
|
CR2
|
0.02
|
0.07
|
0.07
|
0.05
|
0.00
|
0.03
|
0.07
|
0.03
|
3.57
|
5.34
|
5.40
|
4.77
|
2.99
|
4.38
|
6.54
|
4.64
|
Yes
|
|
C1
|
0.13
|
0.15
|
0.15
|
0.14
|
0.01
|
0.10
|
0.14
|
0.09
|
3.57
|
5.34
|
5.40
|
4.77
|
2.99
|
4.38
|
6.54
|
4.64
|
Yes
|
|
CR1
|
0.37
|
0.26
|
0.14
|
0.25
|
0.02
|
0.04
|
0.06
|
0.04
|
3.57
|
5.34
|
5.40
|
4.77
|
2.99
|
4.38
|
6.54
|
4.64
|
Yes
|
|
MG1
|
0.21
|
0.64
|
0.65
|
0.50
|
0.15
|
0.74
|
0.78
|
0.56
|
2.91
|
3.60
|
5.10
|
3.87
|
2.77
|
3.48
|
4.80
|
3.68
|
Yes
|
|
WM4
|
0.67
|
0.73
|
0.85
|
0.75
|
0.24
|
1.07
|
1.39
|
0.90
|
2.91
|
3.60
|
5.10
|
3.87
|
2.77
|
3.48
|
4.80
|
3.68
|
Yes
|
|
C4
|
0.00
|
0.00
|
0.00
|
0.00
|
0.00
|
0.00
|
0.00
|
0.00
|
3.24
|
3.78
|
4.44
|
3.82
|
3.30
|
3.51
|
5.61
|
4.14
|
Yes
|
|
B2
|
0.12
|
0.15
|
0.21
|
0.16
|
0.09
|
0.32
|
0.38
|
0.26
|
2.91
|
3.60
|
5.10
|
3.87
|
2.77
|
3.48
|
4.80
|
3.68
|
Yes
|
|
SA2
|
0.00
|
0.02
|
0.02
|
0.01
|
0.00
|
0.00
|
0.01
|
0.00
|
2.90
|
3.51
|
3.90
|
3.44
|
2.70
|
2.77
|
3.21
|
2.89
|
Yes
|
|
C3
|
0.02
|
0.02
|
0.02
|
0.02
|
0.00
|
0.00
|
0.00
|
0.00
|
3.24
|
3.78
|
4.44
|
3.82
|
3.30
|
3.51
|
5.61
|
4.14
|
Yes
|
|
VM12
|
0.01
|
0.01
|
0.00
|
0.01
|
0.00
|
0.00
|
0.00
|
0.00
|
3.24
|
3.78
|
4.44
|
3.82
|
3.30
|
3.51
|
5.61
|
4.14
|
Yes
|
|
VM14
|
0.02
|
0.03
|
0.03
|
0.02
|
0.00
|
0.00
|
0.00
|
0.00
|
2.90
|
3.51
|
3.90
|
3.44
|
2.70
|
2.77
|
3.21
|
2.89
|
Yes
|
|
F1
|
0.07
|
0.18
|
0.21
|
0.15
|
0.01
|
0.13
|
0.14
|
0.10
|
2.91
|
3.60
|
5.10
|
3.87
|
2.77
|
3.48
|
4.80
|
3.68
|
Yes
|
|
B1
|
0.04
|
0.12
|
0.14
|
0.10
|
0.03
|
0.11
|
0.11
|
0.08
|
2.91
|
3.60
|
5.10
|
3.87
|
2.77
|
3.48
|
4.80
|
3.68
|
Yes
|
|
B4
|
0.03
|
0.09
|
0.10
|
0.07
|
0.00
|
0.02
|
0.09
|
0.04
|
2.91
|
3.60
|
5.10
|
3.87
|
2.77
|
3.48
|
4.80
|
3.68
|
Yes
|
|
B5
|
0.02
|
0.09
|
0.10
|
0.07
|
0.00
|
0.04
|
0.12
|
0.05
|
2.91
|
3.60
|
5.10
|
3.87
|
2.77
|
3.48
|
4.80
|
3.68
|
Yes
|
|
B7
|
0.01
|
0.06
|
0.08
|
0.05
|
0.00
|
0.00
|
0.01
|
0.01
|
2.91
|
3.60
|
5.10
|
3.87
|
2.77
|
3.48
|
4.80
|
3.68
|
Yes
|
|
B8
|
0.30
|
0.30
|
0.30
|
0.30
|
0.19
|
0.19
|
0.19
|
0.19
|
2.91
|
3.60
|
5.10
|
3.87
|
2.77
|
3.48
|
4.80
|
3.68
|
Yes
|
|
NM1
|
0.19
|
0.16
|
0.18
|
0.18
|
0.03
|
0.13
|
0.18
|
0.12
|
3.57
|
5.34
|
5.40
|
4.77
|
2.99
|
4.38
|
6.54
|
4.64
|
Yes
|
|
WSD2
|
0.00
|
0.01
|
0.01
|
0.00
|
0.00
|
0.00
|
0.00
|
0.00
|
2.90
|
3.51
|
3.90
|
3.44
|
2.70
|
2.77
|
3.21
|
2.89
|
Yes
|
|
WSD3
|
0.02
|
0.02
|
0.02
|
0.02
|
0.00
|
0.00
|
0.00
|
0.00
|
2.90
|
3.51
|
3.90
|
3.44
|
2.70
|
2.77
|
3.21
|
2.89
|
Yes
|
|
TS1
|
0.00
|
0.00
|
0.01
|
0.00
|
0.00
|
0.00
|
0.00
|
0.00
|
2.90
|
3.51
|
3.90
|
3.44
|
2.70
|
2.77
|
3.21
|
2.89
|
Yes
|
|
B3
|
0.09
|
0.17
|
0.18
|
0.15
|
0.00
|
0.18
|
0.24
|
0.14
|
2.91
|
3.60
|
5.10
|
3.87
|
2.77
|
3.48
|
4.80
|
3.68
|
Yes
|
|
B6
|
0.03
|
0.03
|
0.03
|
0.03
|
0.01
|
0.01
|
0.02
|
0.01
|
2.91
|
3.60
|
5.10
|
3.87
|
2.77
|
3.48
|
4.80
|
3.68
|
Yes
|
|
C2
|
0.01
|
0.01
|
0.01
|
0.01
|
0.00
|
0.00
|
0.00
|
0.00
|
2.90
|
3.51
|
3.90
|
3.44
|
2.70
|
2.77
|
3.21
|
2.89
|
Yes
|
|
SA1
|
0.01
|
0.01
|
0.01
|
0.01
|
0.00
|
0.06
|
0.14
|
0.07
|
2.91
|
3.60
|
5.10
|
3.87
|
2.77
|
3.48
|
4.80
|
3.68
|
Yes
|
Note:
1.
S – Surface Layer, M – Middle Layer; B –
Bottom Layer; DA – Depth Averaged.
2.
Values
in
bold and
underlined indicates non-compliance with WQOs.
3.
The working hours
per day is assumed to be 12 hours.
Table 5.20 Predicted Maximum Suspended Solids (mg/L)
Elevations during Reclamation Filling Activities (Run C1b – With Project, Unmitigated)
|
Location
|
Predicted Maximum Suspended Solids (mg/L)
Elevations
|
Suspended Solids Criteria (mg/L)
|
Compliance to Criteria (mg/L)
|
|
Dry Season
|
Wet Season
|
Dry Season
|
Wet Season
|
|
S
|
M
|
B
|
DA
|
S
|
M
|
B
|
DA
|
S
|
M
|
B
|
DA
|
S
|
M
|
B
|
DA
|
|
WSD1
|
0.01
|
0.06
|
0.07
|
0.04
|
0.02
|
0.07
|
0.16
|
0.08
|
3.57
|
5.34
|
5.40
|
4.77
|
2.99
|
4.38
|
6.54
|
4.64
|
Yes
|
|
MG2
|
0.00
|
0.00
|
0.00
|
0.00
|
0.00
|
0.00
|
0.01
|
0.00
|
3.57
|
5.34
|
5.40
|
4.77
|
2.99
|
4.38
|
6.54
|
4.64
|
Yes
|
|
H1
|
0.00
|
0.00
|
0.00
|
0.00
|
0.00
|
0.00
|
0.01
|
0.01
|
3.57
|
5.34
|
5.40
|
4.77
|
2.99
|
4.38
|
6.54
|
4.64
|
Yes
|
|
SG1
|
0.00
|
0.01
|
0.01
|
0.01
|
0.00
|
0.00
|
0.03
|
0.01
|
3.57
|
5.34
|
5.40
|
4.77
|
2.99
|
4.38
|
6.54
|
4.64
|
Yes
|
|
CR2
|
0.03
|
0.16
|
0.18
|
0.12
|
0.01
|
0.08
|
0.24
|
0.11
|
3.57
|
5.34
|
5.40
|
4.77
|
2.99
|
4.38
|
6.54
|
4.64
|
Yes
|
|
C1
|
0.20
|
0.40
|
0.41
|
0.34
|
0.04
|
0.27
|
0.46
|
0.26
|
3.57
|
5.34
|
5.40
|
4.77
|
2.99
|
4.38
|
6.54
|
4.64
|
Yes
|
|
CR1
|
0.22
|
0.26
|
0.23
|
0.24
|
0.03
|
0.10
|
0.18
|
0.10
|
3.57
|
5.34
|
5.40
|
4.77
|
2.99
|
4.38
|
6.54
|
4.64
|
Yes
|
|
MG1
|
0.17
|
0.48
|
0.47
|
0.38
|
0.17
|
0.74
|
0.74
|
0.55
|
2.91
|
3.60
|
5.10
|
3.87
|
2.77
|
3.48
|
4.80
|
3.68
|
Yes
|
|
WM4
|
2.44
|
3.54
|
4.37
|
3.45
|
0.95
|
8.08
|
4.77
|
4.60
|
2.91
|
3.60
|
5.10
|
3.87
|
2.77
|
3.48
|
4.80
|
3.68
|
No
|
|
C4
|
0.01
|
0.01
|
0.01
|
0.01
|
0.00
|
0.00
|
0.00
|
0.00
|
3.24
|
3.78
|
4.44
|
3.82
|
3.30
|
3.51
|
5.61
|
4.14
|
Yes
|
|
B2
|
0.36
|
0.49
|
0.70
|
0.52
|
0.31
|
0.99
|
1.12
|
0.81
|
2.91
|
3.60
|
5.10
|
3.87
|
2.77
|
3.48
|
4.80
|
3.68
|
Yes
|
|
SA2
|
0.00
|
0.05
|
0.06
|
0.04
|
0.00
|
0.01
|
0.02
|
0.01
|
2.90
|
3.51
|
3.90
|
3.44
|
2.70
|
2.77
|
3.21
|
2.89
|
Yes
|
|
C3
|
0.05
|
0.07
|
0.08
|
0.07
|
0.00
|
0.00
|
0.00
|
0.00
|
3.24
|
3.78
|
4.44
|
3.82
|
3.30
|
3.51
|
5.61
|
4.14
|
Yes
|
|
VM12
|
0.03
|
0.02
|
0.01
|
0.02
|
0.00
|
0.00
|
0.01
|
0.00
|
3.24
|
3.78
|
4.44
|
3.82
|
3.30
|
3.51
|
5.61
|
4.14
|
Yes
|
|
VM14
|
0.05
|
0.09
|
0.09
|
0.08
|
0.00
|
0.01
|
0.02
|
0.01
|
2.90
|
3.51
|
3.90
|
3.44
|
2.70
|
2.77
|
3.21
|
2.89
|
Yes
|
|
F1
|
0.29
|
0.41
|
0.50
|
0.40
|
0.04
|
0.33
|
0.36
|
0.24
|
2.91
|
3.60
|
5.10
|
3.87
|
2.77
|
3.48
|
4.80
|
3.68
|
Yes
|
|
B1
|
0.12
|
0.34
|
0.37
|
0.28
|
0.10
|
0.33
|
0.32
|
0.25
|
2.91
|
3.60
|
5.10
|
3.87
|
2.77
|
3.48
|
4.80
|
3.68
|
Yes
|
|
B4
|
0.10
|
0.33
|
0.38
|
0.27
|
0.01
|
0.09
|
0.28
|
0.12
|
2.91
|
3.60
|
5.10
|
3.87
|
2.77
|
3.48
|
4.80
|
3.68
|
Yes
|
|
B5
|
0.08
|
0.33
|
0.37
|
0.26
|
0.01
|
0.14
|
0.43
|
0.19
|
2.91
|
3.60
|
5.10
|
3.87
|
2.77
|
3.48
|
4.80
|
3.68
|
Yes
|
|
B7
|
0.05
|
0.23
|
0.30
|
0.19
|
0.00
|
0.01
|
0.04
|
0.02
|
2.91
|
3.60
|
5.10
|
3.87
|
2.77
|
3.48
|
4.80
|
3.68
|
Yes
|
|
B8
|
0.79
|
0.79
|
0.79
|
0.79
|
0.68
|
0.66
|
0.66
|
0.67
|
2.91
|
3.60
|
5.10
|
3.87
|
2.77
|
3.48
|
4.80
|
3.68
|
Yes
|
|
NM1
|
0.39
|
0.35
|
0.52
|
0.42
|
0.10
|
0.62
|
0.72
|
0.48
|
3.57
|
5.34
|
5.40
|
4.77
|
2.99
|
4.38
|
6.54
|
4.64
|
Yes
|
|
WSD2
|
0.00
|
0.02
|
0.03
|
0.02
|
0.00
|
0.00
|
0.00
|
0.00
|
2.90
|
3.51
|
3.90
|
3.44
|
2.70
|
2.77
|
3.21
|
2.89
|
Yes
|
|
WSD3
|
0.06
|
0.08
|
0.08
|
0.07
|
0.00
|
0.01
|
0.01
|
0.01
|
2.90
|
3.51
|
3.90
|
3.44
|
2.70
|
2.77
|
3.21
|
2.89
|
Yes
|
|
TS1
|
0.00
|
0.02
|
0.02
|
0.01
|
0.00
|
0.00
|
0.00
|
0.00
|
2.90
|
3.51
|
3.90
|
3.44
|
2.70
|
2.77
|
3.21
|
2.89
|
Yes
|
|
B3
|
0.32
|
0.58
|
0.63
|
0.51
|
0.01
|
0.59
|
0.83
|
0.48
|
2.91
|
3.60
|
5.10
|
3.87
|
2.77
|
3.48
|
4.80
|
3.68
|
Yes
|
|
B6
|
0.09
|
0.09
|
0.10
|
0.09
|
0.05
|
0.05
|
0.05
|
0.05
|
2.91
|
3.60
|
5.10
|
3.87
|
2.77
|
3.48
|
4.80
|
3.68
|
Yes
|
|
C2
|
0.02
|
0.04
|
0.04
|
0.03
|
0.00
|
0.00
|
0.01
|
0.00
|
2.90
|
3.51
|
3.90
|
3.44
|
2.70
|
2.77
|
3.21
|
2.89
|
Yes
|
|
SA1
|
0.13
|
0.38
|
0.49
|
0.34
|
0.01
|
0.22
|
0.51
|
0.25
|
2.91
|
3.60
|
5.10
|
3.87
|
2.77
|
3.48
|
4.80
|
3.68
|
Yes
|
Note:
1.
S – Surface Layer, M – Middle Layer; B –
Bottom Layer; DA – Depth Averaged.
2.
Values
in
bold and
underlined indicates non-compliance with WQOs.
3.
The working hours
per day is assumed to be 12 hours.
Table
5.21 Predicted Maximum Sedimentation Rate (g/m2/day)
during Dredging Activities (Run C1a –
With Project, Unmitigated)
|
WSR
|
Predicted Maximum Sedimentation Rates (g/m2/day)
|
|
Dry Season
|
Wet Season
|
|
WSD1
|
1.6
|
2.2
|
|
MG2
|
0.0
|
0.1
|
|
H1
|
0.0
|
0.3
|
|
SG1
|
0.3
|
0.7
|
|
CR2
|
3.1
|
2.9
|
|
C1
|
6.8
|
6.7
|
|
CR1
|
4.1
|
2.7
|
|
MG1
|
30.6
|
42.4
|
|
WM4
|
37.3
|
68.9
|
|
C4
|
0.1
|
0.0
|
|
B2
|
12.0
|
16.3
|
|
SA2
|
0.8
|
0.3
|
|
C3
|
1.0
|
0.1
|
|
VM12
|
0.1
|
0.1
|
|
VM14
|
1.1
|
0.2
|
|
F1
|
9.3
|
6.4
|
|
B1
|
6.1
|
5.0
|
|
B4
|
4.5
|
3.9
|
|
B5
|
4.5
|
6.3
|
|
B7
|
3.5
|
0.7
|
|
B8
|
0.0
|
0.9
|
|
NM1
|
7.9
|
8.4
|
|
WSD2
|
0.3
|
0.1
|
|
WSD3
|
1.2
|
0.1
|
|
TS1
|
0.2
|
0.0
|
|
B3
|
8.4
|
11.5
|
|
B6
|
0.7
|
0.1
|
|
C2
|
0.6
|
0.1
|
|
SA1
|
8.2
|
6.7
|
Notes:
Values in bold and
underlined indicates non-compliance with criteria, which is the daily sediment
deposition rate of 200 g/m2/day was adopted.
Table
5.22 Predicted Maximum Sedimentation Rate (g/m2/day)
during Reclamation
Filling Activities (Run C1b –
With Project, Unmitigated)
|
WSR
|
Predicted Maximum Sedimentation Rates (g/m2/day)
|
|
Dry Season
|
Wet Season
|
|
WSD1
|
2.8
|
7.2
|
|
MG2
|
0.0
|
0.2
|
|
H1
|
0.1
|
0.6
|
|
SG1
|
0.2
|
1.5
|
|
CR2
|
7.7
|
10.5
|
|
C1
|
18.3
|
21.3
|
|
CR1
|
9.1
|
8.5
|
|
MG1
|
25.1
|
36.8
|
|
WM4
|
192.5
|
241.2
|
|
C4
|
0.4
|
0.0
|
|
B2
|
45.0
|
48.3
|
|
SA2
|
2.5
|
1.1
|
|
C3
|
3.2
|
0.2
|
|
VM12
|
0.3
|
0.5
|
|
VM14
|
3.9
|
0.9
|
|
F1
|
21.6
|
15.8
|
|
B1
|
20.6
|
16.2
|
|
B4
|
16.5
|
13.1
|
|
B5
|
16.8
|
22.8
|
|
B7
|
12.9
|
2.6
|
|
B8
|
0.0
|
1.4
|
|
NM1
|
22.5
|
34.1
|
|
WSD2
|
1.2
|
0.2
|
|
WSD3
|
3.7
|
0.3
|
|
TS1
|
0.8
|
0.1
|
|
B3
|
27.3
|
39.7
|
|
B6
|
2.8
|
0.3
|
|
C2
|
1.8
|
0.3
|
|
SA1
|
22.6
|
24.7
|
Notes: Values in bold and underlined indicate non-compliance with
criteria, which is the daily sediment deposition rate of 200 g/m2/day
was adopted.
Dissolved Oxygen Depletion
5.7.2.19
The degree of oxygen depletion
exerted by a sediment plume is a function of the sediment oxygen demand of the
sediment, the concentration in the water column and the rate of oxygen
replenishment. In this assessment, the
impact of sediment oxygen demand on DO concentrations has been calculated based
on the following equation:
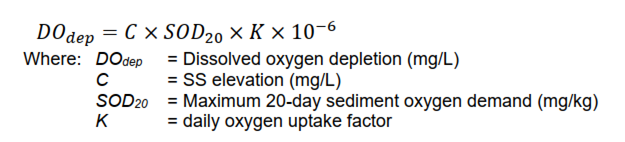
5.7.2.20
Due to the lack of SOD20
information for the Project area, a desktop study has been conducted. In the EIA report of Expansion of Hong Kong International
Airport into a Three-Runway System, sediment sampling and testing was
undertaken in December 2012 for the proposed submarine cable diversion
alignment and the field joint location.
The highest SOD measured in the sediment samples collected from the 21
sampling locations along the proposed submarine cable alignment and field joint
location was 2,230 mg/kg. Quoted from
EIA report of Hong Kong - Zhuhai - Macao Bridge Hong Kong Boundary Crossing
Facilities, in section 9.8.4.11, an SOD of 15,000 mg/kg has been taken with
reference to EPD Marine Monitoring data as a suitably representative value for
sediments in the North-Western Waters region.
For conservative assessment, the SOD20 of 15,000 mg/kg was
used in this EIA.
5.7.2.21
To elaborate the impact of
suspended sediment on DO in water is not an instantaneous process. Previous studies have assumed that the effect
depends on tidally averaged suspended sediment concentrations. However, in this study, the worst-case
scenario was identified by using an increase in suspended sediment as the basis
for the calculation. To ensure that
oxidation rates are not underestimated, the daily uptake factor, K, in the
equation was set to 1.0, as was done in previous HZMB EIA studies (EIAO Register
Nos.: AEIAR-145/2009, AEIAR-144/2009).
This represents instantaneous oxidation of the sediment oxygen demand
and is expected to result in a much larger calculated DO deficit than what
would be experienced.
5.7.2.23
In Table 5.25, the predicted DO depletion at all the observation points is
presented under the dredging activities scenario. The increase in SS level due to dredging
activities results in a minimal DO depletion.
Taking the maximum SS increment at WM4 into account, the associated
depletion value ranges only from 0.05 to 0.07 mg/L. The resultant DO
concentration is calculated in Table 5.26. According to the predicted
results, at most of the WSR locations, even without any mitigation measures
such as a silt curtain, the resulting DO concentrations are expected to be
higher than the water quality objective of 4 mg/L for the depth-averaged DO
WQO, and 2mg/L for the bottom layer DO WQO.
The instances of exceeding standards at some locations were observed, as
indicated in Table
5.24, are attributed to
relatively low baseline values during the wet season at those specific
locations. Furthermore, dredging activities are predicted to have a negligible
impact on nearby sensitive receivers, including the closest bathing beaches
(e.g., Ma Wan Tung Wan Bathing Beach), FCZs (such as the adjacent Ma Wan FCZ),
and intertidal/subtidal habitats (e.g.,
the corals at To Kau Wan). For instance, the estimated DO depletion at the
nearest coral community at To Kau Wan is only between 0.0006 and 0.0038 mg/L,
while at the closest Ma Wan Tung Wan Bathing Beach, it ranges from 0.0028 to
0.0045 mg/L – both representing very minimal changes.
5.7.2.24
In the reclamation filling
activities scenario, due to the relatively higher SS release load compared to
the dredging scenario, short-duration SS exceedances are observed at monitoring
point WM4. Consequently, this leads to
DO depletion ranging between 0.052 to 0.070 mg/L (Table 5.27). This range of DO depletion is relatively
consistent with that predicted for the dredging scenario. Furthermore, the
reclamation filling activities are predicted to have a negligible impact on the
nearby FCZ. For example, the estimated DO depletion at the nearest coral
community at To Kau Wan is between 0.0015 and 0.0035 mg/L.
5.7.2.25
Overall, the DO depletion
induced by both dredging and reclamation filling is very minimal. Instances of exceeding standards at certain
locations can be attributed to the relatively low baseline values during the wet
season at those specific locations.
Table
5.23 10th Percentile DO Concentration from EPD
Routine Monitoring Programme (2014-2023)
|
Station
|
10th Percentile Dissolved Oxygen Concentrations
(mg/L)
|
|
Surface
|
Middle
|
Bottom
|
Depth Averaged
|
|
Dry Season
|
Wet Season
|
Dry Season
|
Wet Season
|
Dry Season
|
Wet Season
|
Dry Season
|
Wet Season
|
|
WM4
|
4.70
|
4.22
|
5.10
|
2.98
|
5.10
|
2.50
|
4.97
|
3.23
|
|
NM1
|
4.91
|
4.40
|
5.21
|
3.20
|
5.21
|
2.50
|
5.11
|
3.37
|
|
VM12
|
4.54
|
4.13
|
4.52
|
3.70
|
4.70
|
3.13
|
4.59
|
3.65
|
|
VM14
|
4.23
|
4.06
|
4.50
|
3.60
|
4.90
|
3.43
|
4.54
|
3.70
|
Notes:
(1). 10 percentiles
derived from the recent 10 years (2014 to 2023) EPD data.
(2). 10 percentiles DO values in bold and underlined
indicates non-compliance with WQOs.
Table
5.24 Corresponding Ambient DO Concentration
(mg/L) for The Modelling Observation Points
|
Location
|
Nearest
EPD’s Stations
|
Ambient DO
Concentration (mg/L)
|
|
Dry Season
|
Wet Season
|
|
S
|
M
|
B
|
DA
|
S
|
M
|
B
|
DA
|
|
WSD1
|
NM1
|
4.91
|
5.21
|
5.21
|
5.11
|
4.40
|
3.20
|
2.50
|
3.37
|
|
MG2
|
NM1
|
4.91
|
5.21
|
5.21
|
5.11
|
4.40
|
3.20
|
2.50
|
3.37
|
|
H1
|
NM1
|
4.91
|
5.21
|
5.21
|
5.11
|
4.40
|
3.20
|
2.50
|
3.37
|
|
SG1
|
NM1
|
4.91
|
5.21
|
5.21
|
5.11
|
4.40
|
3.20
|
2.50
|
3.37
|
|
CR2
|
NM1
|
4.91
|
5.21
|
5.21
|
5.11
|
4.40
|
3.20
|
2.50
|
3.37
|
|
C1
|
NM1
|
4.91
|
5.21
|
5.21
|
5.11
|
4.40
|
3.20
|
2.50
|
3.37
|
|
CR1
|
NM1
|
4.91
|
5.21
|
5.21
|
5.11
|
4.40
|
3.20
|
2.50
|
3.37
|
|
MG1
|
WM4
|
4.70
|
5.10
|
5.10
|
4.97
|
4.22
|
2.98
|
2.50
|
3.23
|
|
WM4
|
WM4
|
4.70
|
5.10
|
5.10
|
4.97
|
4.22
|
2.98
|
2.50
|
3.23
|
|
C4
|
VM12
|
4.54
|
4.52
|
4.70
|
4.59
|
4.13
|
3.70
|
3.13
|
3.65
|
|
B2
|
WM4
|
4.70
|
5.10
|
5.10
|
4.97
|
4.22
|
2.98
|
2.50
|
3.23
|
|
SA2
|
VM14
|
4.23
|
4.50
|
4.90
|
4.54
|
4.06
|
3.60
|
3.43
|
3.70
|
|
C3
|
VM12
|
4.54
|
4.52
|
4.70
|
4.59
|
4.13
|
3.70
|
3.13
|
3.65
|
|
VM12
|
VM12
|
4.54
|
4.52
|
4.70
|
4.59
|
4.13
|
3.70
|
3.13
|
3.65
|
|
VM14
|
VM14
|
4.23
|
4.50
|
4.90
|
4.54
|
4.06
|
3.60
|
3.43
|
3.70
|
|
F1
|
WM4
|
4.70
|
5.10
|
5.10
|
4.97
|
4.22
|
2.98
|
2.50
|
3.23
|
|
B1
|
WM4
|
4.70
|
5.10
|
5.10
|
4.97
|
4.22
|
2.98
|
2.50
|
3.23
|
|
B4
|
WM4
|
4.70
|
5.10
|
5.10
|
4.97
|
4.22
|
2.98
|
2.50
|
3.23
|
|
B5
|
WM4
|
4.70
|
5.10
|
5.10
|
4.97
|
4.22
|
2.98
|
2.50
|
3.23
|
|
B7
|
WM4
|
4.70
|
5.10
|
5.10
|
4.97
|
4.22
|
2.98
|
2.50
|
3.23
|
|
B8
|
WM4
|
4.70
|
5.10
|
5.10
|
4.97
|
4.22
|
2.98
|
2.50
|
3.23
|
|
NM1
|
NM1
|
4.91
|
5.21
|
5.21
|
5.11
|
4.40
|
3.20
|
2.50
|
3.37
|
|
WSD2
|
VM14
|
4.23
|
4.50
|
4.90
|
4.54
|
4.06
|
3.60
|
3.43
|
3.70
|
|
WSD3
|
VM14
|
4.23
|
4.50
|
4.90
|
4.54
|
4.06
|
3.60
|
3.43
|
3.70
|
|
TS1
|
VM14
|
4.23
|
4.50
|
4.90
|
4.54
|
4.06
|
3.60
|
3.43
|
3.70
|
|
B3
|
WM4
|
4.70
|
5.10
|
5.10
|
4.97
|
4.22
|
2.98
|
2.50
|
3.23
|
|
B6
|
WM4
|
4.70
|
5.10
|
5.10
|
4.97
|
4.22
|
2.98
|
2.50
|
3.23
|
|
C2
|
VM14
|
4.23
|
4.50
|
4.90
|
4.54
|
4.06
|
3.60
|
3.43
|
3.70
|
|
SA1
|
WM4
|
4.70
|
5.10
|
5.10
|
4.97
|
4.22
|
2.98
|
2.50
|
3.23
|
Notes: (1) S – Surface Layer, M – Middle Layer; B –
Bottom Layer; DA – Depth Averaged.
(2) 10 percentiles
DO values in bold and underlined indicates non-compliance with WQOs
Table 5.25 Predicted DO Depletion (mg/L) under Dredging
Activities (Run C1a –
With Project and Concurrent Projects, Unmitigated)
|
Station
|
Dry Season
|
Wet Season
|
|
S
|
M
|
B
|
DA
|
S
|
M
|
B
|
DA
|
|
WSD1
|
0.00
|
0.00
|
0.00
|
0.00
|
0.00
|
0.00
|
0.00
|
0.00
|
|
MG2
|
0.00
|
0.00
|
0.00
|
0.00
|
0.00
|
0.00
|
0.00
|
0.00
|
|
H1
|
0.00
|
0.00
|
0.00
|
0.00
|
0.00
|
0.00
|
0.00
|
0.00
|
|
SG1
|
0.00
|
0.00
|
0.00
|
0.00
|
0.00
|
0.00
|
0.00
|
0.00
|
|
CR2
|
0.00
|
0.00
|
0.00
|
0.00
|
0.00
|
0.00
|
0.00
|
0.00
|
|
C1
|
0.00
|
0.00
|
0.00
|
0.00
|
0.00
|
0.00
|
0.00
|
0.00
|
|
CR1
|
0.01
|
0.00
|
0.00
|
0.00
|
0.00
|
0.00
|
0.00
|
0.00
|
|
MG1
|
0.00
|
0.01
|
0.01
|
0.01
|
0.00
|
0.01
|
0.01
|
0.01
|
|
WM4
|
0.01
|
0.01
|
0.01
|
0.01
|
0.00
|
0.02
|
0.02
|
0.01
|
|
C4
|
0.00
|
0.00
|
0.00
|
0.00
|
0.00
|
0.00
|
0.00
|
0.00
|
|
B2
|
0.00
|
0.00
|
0.00
|
0.00
|
0.00
|
0.00
|
0.01
|
0.00
|
|
SA2
|
0.00
|
0.00
|
0.00
|
0.00
|
0.00
|
0.00
|
0.00
|
0.00
|
|
C3
|
0.00
|
0.00
|
0.00
|
0.00
|
0.00
|
0.00
|
0.00
|
0.00
|
|
VM12
|
0.00
|
0.00
|
0.00
|
0.00
|
0.00
|
0.00
|
0.00
|
0.00
|
|
VM14
|
0.00
|
0.00
|
0.00
|
0.00
|
0.00
|
0.00
|
0.00
|
0.00
|
|
F1
|
0.00
|
0.00
|
0.00
|
0.00
|
0.00
|
0.00
|
0.00
|
0.00
|
|
B1
|
0.00
|
0.00
|
0.00
|
0.00
|
0.00
|
0.00
|
0.00
|
0.00
|
|
B4
|
0.00
|
0.00
|
0.00
|
0.00
|
0.00
|
0.00
|
0.00
|
0.00
|
|
B5
|
0.00
|
0.00
|
0.00
|
0.00
|
0.00
|
0.00
|
0.00
|
0.00
|
|
B7
|
0.00
|
0.00
|
0.00
|
0.00
|
0.00
|
0.00
|
0.00
|
0.00
|
|
B8
|
0.00
|
0.00
|
0.00
|
0.00
|
0.00
|
0.00
|
0.00
|
0.00
|
|
NM1
|
0.00
|
0.00
|
0.00
|
0.00
|
0.00
|
0.00
|
0.00
|
0.00
|
|
WSD2
|
0.00
|
0.00
|
0.00
|
0.00
|
0.00
|
0.00
|
0.00
|
0.00
|
|
WSD3
|
0.00
|
0.00
|
0.00
|
0.00
|
0.00
|
0.00
|
0.00
|
0.00
|
|
TS1
|
0.00
|
0.00
|
0.00
|
0.00
|
0.00
|
0.00
|
0.00
|
0.00
|
|
B3
|
0.00
|
0.00
|
0.00
|
0.00
|
0.00
|
0.00
|
0.00
|
0.00
|
|
B6
|
0.00
|
0.00
|
0.00
|
0.00
|
0.00
|
0.00
|
0.00
|
0.00
|
|
C2
|
0.00
|
0.00
|
0.00
|
0.00
|
0.00
|
0.00
|
0.00
|
0.00
|
|
SA1
|
0.00
|
0.00
|
0.00
|
0.00
|
0.00
|
0.00
|
0.00
|
0.00
|
Notes: S – Surface Layer, M – Middle Layer; B –
Bottom Layer; DA – Depth Averaged.
Table
5.26 Predicted Resultant DO Depletion (mg/L)
under Dredging Activities (Run C1a –
With Project and Concurrent Projects, Unmitigated)
|
Station
|
Dry Season
|
Wet Season
|
|
S
|
M
|
B
|
DA
|
S
|
M
|
B
|
DA
|
|
WSD1
|
4.91
|
5.21
|
5.21
|
5.11
|
4.40
|
3.20
|
2.50
|
3.37
|
|
MG2
|
4.91
|
5.21
|
5.21
|
5.11
|
4.40
|
3.20
|
2.50
|
3.37
|
|
H1
|
4.91
|
5.21
|
5.21
|
5.11
|
4.40
|
3.20
|
2.50
|
3.37
|
|
SG1
|
4.91
|
5.21
|
5.21
|
5.11
|
4.40
|
3.20
|
2.50
|
3.37
|
|
CR2
|
4.91
|
5.21
|
5.21
|
5.11
|
4.40
|
3.20
|
2.50
|
3.37
|
|
C1
|
4.91
|
5.21
|
5.21
|
5.11
|
4.40
|
3.20
|
2.50
|
3.37
|
|
CR1
|
4.90
|
5.21
|
5.21
|
5.11
|
4.40
|
3.20
|
2.50
|
3.37
|
|
MG1
|
4.70
|
5.09
|
5.09
|
4.96
|
4.22
|
2.97
|
2.49
|
3.22
|
|
WM4
|
4.69
|
5.09
|
5.09
|
4.96
|
4.22
|
2.96
|
2.48
|
3.22
|
|
C4
|
4.54
|
4.52
|
4.70
|
4.59
|
4.13
|
3.70
|
3.13
|
3.65
|
|
B2
|
4.70
|
5.10
|
5.10
|
4.96
|
4.22
|
2.98
|
2.49
|
3.23
|
|
SA2
|
4.23
|
4.50
|
4.90
|
4.54
|
4.06
|
3.60
|
3.43
|
3.70
|
|
C3
|
4.54
|
4.52
|
4.70
|
4.59
|
4.13
|
3.70
|
3.13
|
3.65
|
|
VM12
|
4.54
|
4.52
|
4.70
|
4.59
|
4.13
|
3.70
|
3.13
|
3.65
|
|
VM14
|
4.23
|
4.50
|
4.90
|
4.54
|
4.06
|
3.60
|
3.43
|
3.70
|
|
F1
|
4.70
|
5.10
|
5.10
|
4.96
|
4.22
|
2.98
|
2.50
|
3.23
|
|
B1
|
4.70
|
5.10
|
5.10
|
4.97
|
4.22
|
2.98
|
2.50
|
3.23
|
|
B4
|
4.70
|
5.10
|
5.10
|
4.97
|
4.22
|
2.98
|
2.50
|
3.23
|
|
B5
|
4.70
|
5.10
|
5.10
|
4.97
|
4.22
|
2.98
|
2.50
|
3.23
|
|
B7
|
4.70
|
5.10
|
5.10
|
4.97
|
4.22
|
2.98
|
2.50
|
3.23
|
|
B8
|
4.70
|
5.10
|
5.10
|
4.96
|
4.22
|
2.98
|
2.50
|
3.23
|
|
NM1
|
4.91
|
5.21
|
5.21
|
5.11
|
4.40
|
3.20
|
2.50
|
3.36
|
|
WSD2
|
4.23
|
4.50
|
4.90
|
4.54
|
4.06
|
3.60
|
3.43
|
3.70
|
|
WSD3
|
4.23
|
4.50
|
4.90
|
4.54
|
4.06
|
3.60
|
3.43
|
3.70
|
|
TS1
|
4.23
|
4.50
|
4.90
|
4.54
|
4.06
|
3.60
|
3.43
|
3.70
|
|
B3
|
4.70
|
5.10
|
5.10
|
4.96
|
4.22
|
2.98
|
2.50
|
3.23
|
|
B6
|
4.70
|
5.10
|
5.10
|
4.97
|
4.22
|
2.98
|
2.50
|
3.23
|
|
C2
|
4.23
|
4.50
|
4.90
|
4.54
|
4.06
|
3.60
|
3.43
|
3.70
|
|
SA1
|
4.70
|
5.10
|
5.10
|
4.97
|
4.22
|
2.98
|
2.50
|
3.23
|
Notes:
(1).S – Surface Layer, M
– Middle Layer; B – Bottom Layer; DA – Depth Averaged.
(2).10 percentiles DO
values in bold and underlined indicates non-compliance with WQOs.
Table
5.27 Predicted DO Depletion (mg/L) under
Reclamation Filling Activities (Run C1b – With Project and Concurrent Projects,
Unmitigated)
|
Station
|
Dry Season
|
Wet Season
|
|
S
|
M
|
B
|
DA
|
S
|
M
|
B
|
DA
|
|
WSD1
|
0.00
|
0.00
|
0.00
|
0.00
|
0.00
|
0.00
|
0.00
|
0.00
|
|
MG2
|
0.00
|
0.00
|
0.00
|
0.00
|
0.00
|
0.00
|
0.00
|
0.00
|
|
H1
|
0.00
|
0.00
|
0.00
|
0.00
|
0.00
|
0.00
|
0.00
|
0.00
|
|
SG1
|
0.00
|
0.00
|
0.00
|
0.00
|
0.00
|
0.00
|
0.00
|
0.00
|
|
CR2
|
0.00
|
0.00
|
0.00
|
0.00
|
0.00
|
0.00
|
0.00
|
0.00
|
|
C1
|
0.00
|
0.01
|
0.01
|
0.01
|
0.00
|
0.00
|
0.01
|
0.00
|
|
CR1
|
0.00
|
0.00
|
0.00
|
0.00
|
0.00
|
0.00
|
0.00
|
0.00
|
|
MG1
|
0.00
|
0.01
|
0.01
|
0.01
|
0.00
|
0.01
|
0.01
|
0.01
|
|
WM4
|
0.04
|
0.05
|
0.07
|
0.05
|
0.01
|
0.12
|
0.07
|
0.07
|
|
C4
|
0.00
|
0.00
|
0.00
|
0.00
|
0.00
|
0.00
|
0.00
|
0.00
|
|
B2
|
0.01
|
0.01
|
0.01
|
0.01
|
0.00
|
0.01
|
0.02
|
0.01
|
|
SA2
|
0.00
|
0.00
|
0.00
|
0.00
|
0.00
|
0.00
|
0.00
|
0.00
|
|
C3
|
0.00
|
0.00
|
0.00
|
0.00
|
0.00
|
0.00
|
0.00
|
0.00
|
|
VM12
|
0.00
|
0.00
|
0.00
|
0.00
|
0.00
|
0.00
|
0.00
|
0.00
|
|
VM14
|
0.00
|
0.00
|
0.00
|
0.00
|
0.00
|
0.00
|
0.00
|
0.00
|
|
F1
|
0.00
|
0.01
|
0.01
|
0.01
|
0.00
|
0.00
|
0.01
|
0.00
|
|
B1
|
0.00
|
0.01
|
0.01
|
0.00
|
0.00
|
0.00
|
0.00
|
0.00
|
|
B4
|
0.00
|
0.00
|
0.01
|
0.00
|
0.00
|
0.00
|
0.00
|
0.00
|
|
B5
|
0.00
|
0.00
|
0.01
|
0.00
|
0.00
|
0.00
|
0.01
|
0.00
|
|
B7
|
0.00
|
0.00
|
0.00
|
0.00
|
0.00
|
0.00
|
0.00
|
0.00
|
|
B8
|
0.01
|
0.01
|
0.01
|
0.01
|
0.01
|
0.01
|
0.01
|
0.01
|
|
NM1
|
0.01
|
0.01
|
0.01
|
0.01
|
0.00
|
0.01
|
0.01
|
0.01
|
|
WSD2
|
0.00
|
0.00
|
0.00
|
0.00
|
0.00
|
0.00
|
0.00
|
0.00
|
|
WSD3
|
0.00
|
0.00
|
0.00
|
0.00
|
0.00
|
0.00
|
0.00
|
0.00
|
|
TS1
|
0.00
|
0.00
|
0.00
|
0.00
|
0.00
|
0.00
|
0.00
|
0.00
|
|
B3
|
0.00
|
0.01
|
0.01
|
0.01
|
0.00
|
0.01
|
0.01
|
0.01
|
|
B6
|
0.00
|
0.00
|
0.00
|
0.00
|
0.00
|
0.00
|
0.00
|
0.00
|
|
C2
|
0.00
|
0.00
|
0.00
|
0.00
|
0.00
|
0.00
|
0.00
|
0.00
|
|
SA1
|
0.00
|
0.01
|
0.01
|
0.01
|
0.00
|
0.00
|
0.01
|
0.00
|
Notes: S – Surface Layer, M – Middle Layer; B –
Bottom Layer; DA – Depth Averaged.
Table 5.28 Predicted Resultant Dissolved
Oxygen Depletion (mg/L) under Reclamation Filling Activities (Run C1b – With Project and Concurrent Projects,
Unmitigated)
|
Station
|
Dry Season
|
Wet Season
|
|
S
|
M
|
B
|
DA
|
S
|
M
|
B
|
DA
|
|
WSD1
|
4.91
|
5.21
|
5.21
|
5.11
|
4.40
|
3.20
|
2.50
|
3.37
|
|
MG2
|
4.91
|
5.21
|
5.21
|
5.11
|
4.40
|
3.20
|
2.50
|
3.37
|
|
H1
|
4.91
|
5.21
|
5.21
|
5.11
|
4.40
|
3.20
|
2.50
|
3.37
|
|
SG1
|
4.91
|
5.21
|
5.21
|
5.11
|
4.40
|
3.20
|
2.50
|
3.37
|
|
CR2
|
4.91
|
5.21
|
5.21
|
5.11
|
4.40
|
3.20
|
2.50
|
3.37
|
|
C1
|
4.91
|
5.20
|
5.20
|
5.10
|
4.40
|
3.20
|
2.49
|
3.36
|
|
CR1
|
4.91
|
5.21
|
5.21
|
5.11
|
4.40
|
3.20
|
2.50
|
3.37
|
|
MG1
|
4.70
|
5.09
|
5.09
|
4.96
|
4.22
|
2.97
|
2.49
|
3.23
|
|
WM4
|
4.66
|
5.05
|
5.03
|
4.91
|
4.21
|
2.86
|
2.43
|
3.16
|
|
C4
|
4.54
|
4.52
|
4.70
|
4.59
|
4.13
|
3.70
|
3.13
|
3.65
|
|
B2
|
4.69
|
5.09
|
5.09
|
4.96
|
4.22
|
2.97
|
2.48
|
3.22
|
|
SA2
|
4.23
|
4.50
|
4.90
|
4.54
|
4.06
|
3.60
|
3.43
|
3.70
|
|
C3
|
4.54
|
4.52
|
4.70
|
4.59
|
4.13
|
3.70
|
3.13
|
3.65
|
|
VM12
|
4.54
|
4.52
|
4.70
|
4.59
|
4.13
|
3.70
|
3.13
|
3.65
|
|
VM14
|
4.23
|
4.50
|
4.90
|
4.54
|
4.06
|
3.60
|
3.43
|
3.70
|
|
F1
|
4.70
|
5.09
|
5.09
|
4.96
|
4.22
|
2.98
|
2.49
|
3.23
|
|
B1
|
4.70
|
5.09
|
5.09
|
4.96
|
4.22
|
2.98
|
2.50
|
3.23
|
|
B4
|
4.70
|
5.10
|
5.09
|
4.96
|
4.22
|
2.98
|
2.50
|
3.23
|
|
B5
|
4.70
|
5.10
|
5.09
|
4.96
|
4.22
|
2.98
|
2.49
|
3.23
|
|
B7
|
4.70
|
5.10
|
5.10
|
4.96
|
4.22
|
2.98
|
2.50
|
3.23
|
|
B8
|
4.69
|
5.09
|
5.09
|
4.95
|
4.21
|
2.97
|
2.49
|
3.22
|
|
NM1
|
4.90
|
5.20
|
5.20
|
5.10
|
4.40
|
3.19
|
2.49
|
3.36
|
|
WSD2
|
4.23
|
4.50
|
4.90
|
4.54
|
4.06
|
3.60
|
3.43
|
3.70
|
|
WSD3
|
4.23
|
4.50
|
4.90
|
4.54
|
4.06
|
3.60
|
3.43
|
3.70
|
|
TS1
|
4.23
|
4.50
|
4.90
|
4.54
|
4.06
|
3.60
|
3.43
|
3.70
|
|
B3
|
4.70
|
5.09
|
5.09
|
4.96
|
4.22
|
2.97
|
2.49
|
3.23
|
|
B6
|
4.70
|
5.10
|
5.10
|
4.97
|
4.22
|
2.98
|
2.50
|
3.23
|
|
C2
|
4.23
|
4.50
|
4.90
|
4.54
|
4.06
|
3.60
|
3.43
|
3.70
|
|
SA1
|
4.70
|
5.09
|
5.09
|
4.96
|
4.22
|
2.98
|
2.49
|
3.23
|
Notes:
(1).S – Surface Layer, M
– Middle Layer; B – Bottom Layer; DA – Depth Averaged.
(2).10 percentiles DO
values in bold and underlined indicates non-compliance with WQOs.
Contaminant Release from Elutriate/Porewater
Testing
5.7.2.26
The potential consequences of
releasing contaminants into the marine water during the construction phase,
including DCM in reclamation and dredging activities were thoroughly
investigated. To estimate the quantity of contaminants potentially discharged into
the water column, laboratory tests were conducted on elutriate and porewater
samples, as detailed in the Sediment Sampling and Testing Plan (SSTP) found in Chapter 6. The testing conducted at the proposed
reclamation site focused on the following parameters:
·
Heavy
metals and metalloid including cadmium, chromium, copper, mercury, nickel,
lead, zinc, silver and arsenic;
·
Organic
micro-pollutants including PCB, PAH, Organichlorine Pesticides (OC); and
·
Inorganic
non-metallic pollutants including nitrogen and phosphorous.
5.7.2.27
For elutriate and porewater
testing, marine water samples were collected alongside grab samples and
vibrocore/borehole samples from the following five locations:
·
VC-40a;
·
VC-41;
·
VC-42;
·
VC-43; and
·
VC-44
5.7.2.28
The summary of testing results in Appendix 5.5 were checked against the criteria set in Table 5.4. The concentrations of heavy metals and
organic compounds in the elutriate and porewater tests at the five
locations generally remained below the prescribed
limits. However, certain locations exhibited slight elevated levels of arsenic, copper, and zinc, necessitating further
assessment. The testing results in
Appendix 5.5 highlighted those specific parameters, including arsenic, copper,
zinc, TBT, PAHs, PCBs, TIN, and un-ionized ammonia (UIA), require additional
assessment to confirm compliance at the WSRs.
5.7.2.29
The Appendix
5.7 provides the detailed assessment of contaminant
release from elutriate/porewater testing. The dilution factor from the four
reclamation sites to each WSR can be calculated using the following equation.
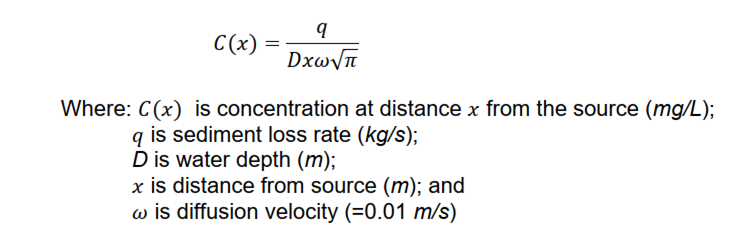
5.7.2.30
This equation calculates the concentration
along the centreline of a plume through solving an advection-diffusion equation
for a continuous line source, which is appropriate for calculating the
concentrations of contaminant release for the dredging works. This is because
the equation assumes a continuous line source of sediment, which is an
appropriate approximation of the
sediment lost to suspension during grab dredging. It is
appropriate for areas where the tidal current is uni-directional for each phase
of the tidal cycle (i.e. the ebb and flood phases). The similar approach has
been adopted in the approved EIA studies including Route 11 (Section between
Yuen Long and North Lantau), Tung Chung New Town Extension, Hong Kong – Zhuhai
– Macao Bridge Hong Kong Boundary Crossing Facilities, and Cycle Track between
Tsuen Wan and Tuen Mun (Tuen Mun to So Kwun Wat). The dilution factor is
estimated by assuming the radius of initial release as 10m. The calculation of
sediment contaminant release would only be applied to the nearby WSRs.
5.7.2.31
Based on the summarized
elutriate and porewater test results for the five sampling points presented in Appendix
5.5 and Appendix 5.7, the net contaminant release for each parameter
was calculated using a weighted average method. This calculation considered the
maximum filling rates from the four reclamation zones — Tsing Yi Tower, Ma Wan
South Tower, Ma Wan South Anchorage, and Kap Shui Mun Tower — and the
corresponding maximum net increases in contaminant concentrations derived from
elutriate and porewater testing at the nearest sampling stations for each area.
5.7.2.32
Subsequently, the contaminant
concentrations at each WSR location were calculated based on the dilution
factors determined earlier. The estimated contaminant concentrations derived
from both elutriate and porewater testing are summarised in Appendix 5.7. The
results indicate that the predicted contaminant concentrations comply with the
applicable environmental criteria at both ecological and recreational receptor
points. The dispersion and transformation processes in the receiving
environment contribute to the reduction of contaminant levels, ensuring
compliance with water quality requirements. According to Item f of Section
S1.3.2, Annex 6 of the Technical Memorandum on Environmental Impact Assessment
Process, for Total Inorganic Nitrogen (TIN), which is set to prevent
undesirable algal bloom, as the level is heavily influenced by the background
seasonal estuarine input, the criteria should be assessed such that the
discharge will not cause any further deterioration by more than 30% of the
annual average levels, if their existing levels have exceeded or are close to
the established WQO. In this project, even without applying the 30% allowance,
the predicted TIN concentrations remain below the 0.4 mg/L criterion, and
therefore still meet the WQO. The assessment results in Appendix
5.7 show that concentrations of all contaminants at
WSRs comply with the relevant criteria. This indicates that the water quality
impact induced from the Project’s construction phase is insignificant, thus no
adverse water quality impacts is anticipated.
5.7.2.33
The NH3 level was
determined using the observed Total Ammonia as N, ambient temperature and
salinity. The calculation method could
be referred to the following reference: i) Bower C.E. and Bidwell J.P.
(1978), Ionisation of ammonia in seawater:
Effect of temperature, pH and salinity. J. Fish. Res. Board Can. Vol.35,
pp.1012-1016; and ii) K., Russo R.C. & et. al. (1975), Aqueous ammonia
equilibrium calculations: effect of pH and temperature. J. Fish. Res. Board
Can. Vol.32, pp.2379-2383. According
to the assessment result in Appendix 5.7, the Un-ionise Ammonia at each
WSR are below the 0.021mg/L criterion, and therefore fulfill the WQO
requirements.
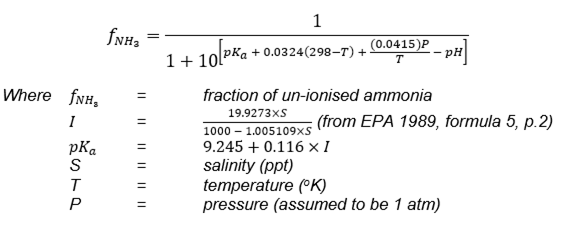
5.7.2.34
Based on the assessment results,
adverse impacts on water quality due to contaminants released from disturbed
sediments during construction activities are not anticipated.
Wastewater / Sewage Effluent from The Construction Activities and Workforce and The
Accidental Chemical Spillage into The Marine Environment
5.7.2.35
During the construction phase,
an increase in marine traffic for the transportation of construction materials
is anticipated, which may impact marine water quality. The potential impacts
include sewage generated by the construction workforce and accidental spillage
of chemicals or chemical waste into the marine environment. These potential
impacts can be readily controlled; sewage will be managed by providing adequate
sanitary facilities such as portable chemical toilets on vessels, and the
storage and disposal of chemical waste will follow the guidelines stipulated in
the Waste Disposal (Chemical Waste) (General) Regulations.
Besides these operational concerns, the overflow of
filling materials from barges or hoppers can also cause water pollution during
loading or transportation. This potential water quality impact can be minimised
through good management practices. Specifically, measures such as carefully
limiting the loading capacity of barges will be implemented to avoid the
overflow of fill material. With these practices for both operational waste and
material handling in place, adverse water
quality impacts from the increase in marine traffic are not anticipated.
Pile-Supported Vessels Impact Protection
System (VIPS) at Lantau Deflection
Pier
5.7.2.36
To meet the location of
deflection pier at North Lantau, VIPS is proposed to be adopted in the area of
existing shoreline. The VIPS structure
will be supported by piles with a superstructure and hanger slab to protect the
piles from vessel impact, thus reclamation is no longer required at North
Lantau. The VIPS structure will be
supported by piles with a reinforced concrete superstructure and hanger slab to
protect the piles from vessel impact. This sea-based logistical approach
eliminates the need for extensive shoreline construction sites, material
stockpiling on land, or heavy vehicle traffic along coastal roads.
Consequently, the VIPS construction is self-contained offshore, with its only potential
land interface being a small, temporary area for logistical support. This
method avoids significant land-based activities such as excavation or land
reclamation, thereby preserving the integrity of the existing coastline while
still providing the necessary protection for the pier.
5.7.2.37
The construction of the pier
will not involve open sea dredging of the seabed. It will primarily employ
in-situ bored pile foundations founded on bedrock or the seabed. As detailed in Chapter 2.6, during
construction, the piling equipment will be set up on a barge after installing a
silt curtain. Subsequently, pile
construction will take place by placing a steel pile casing at the pier site,
with seawater trapped inside the casing.
A funnel will be utilised at the top of the pile casing during
excavation. This construction method,
creating a confined environment for excavation, minimises the release of
contaminants into the water column, thereby reducing the risk of disturbance to
the seabed and the adjacent marine environment.
5.7.2.38
Based on Chapter 2 - Project Description,
VIPS at the Lantau Deflection Pier has some piles located in seawater. Based on
the rate of constructing a pile (i.e. 5m/day) and the pile diameter (i.e. 2m),
the sediment volume generation is calculated to be  .
To quantify the rate of sediment loss into the water column, relevant study
reports were reviewed: i) Contaminated Spoil Management Study (MacDonald,
1991); ii) EIA: Dredging an Area of Kellett Bank for Reprovisioning of Six
Government Mooring Buoys - Working Paper on Design Scenarios (ERM,1997); and
iii) EIA: Hong Kong – Zhuhai – Macao Bridge Hong Kong Boundary Crossing
Facilities (2009). The reports
indicated that sediment loss is at a rate of 20~25 kg/m3 for areas
with significant amounts of debris on the seabed, and of 12~18 kg/m3
for areas where debris is less likely to hinder the operations. For conservative assessment purpose, the
highest sediment loss rate 25 kg/m3 is adopted. Consequently, the sediment release rate into
the water column was estimated to be
.
To quantify the rate of sediment loss into the water column, relevant study
reports were reviewed: i) Contaminated Spoil Management Study (MacDonald,
1991); ii) EIA: Dredging an Area of Kellett Bank for Reprovisioning of Six
Government Mooring Buoys - Working Paper on Design Scenarios (ERM,1997); and
iii) EIA: Hong Kong – Zhuhai – Macao Bridge Hong Kong Boundary Crossing
Facilities (2009). The reports
indicated that sediment loss is at a rate of 20~25 kg/m3 for areas
with significant amounts of debris on the seabed, and of 12~18 kg/m3
for areas where debris is less likely to hinder the operations. For conservative assessment purpose, the
highest sediment loss rate 25 kg/m3 is adopted. Consequently, the sediment release rate into
the water column was estimated to be  without mitigation measures.
5.7.2.39
Compared to the sediment loss rate
estimates for reclamation in Section 5.7.2.15, the SS release is estimated to
be 34.38 tonnes/day for the Tsing Yi Tower (Q4 2028 to Q1 2029), 67.66
tonnes/day for the Ma Wan South Tower (Q4 2028), and 32.60 tonnes/day for the
Ma Wan South Anchorage (Q4 2028). In contrast, the sediment loss rate caused by
VIPS is a maximum of only 0.39 tonnes/day, which is significantly lower than
the values caused by reclamation. It should also be noted that the above VIPS
SS release estimation adopts a highly conservative approach, without
considering any confined environment as described in Section 5.7.2.36.
5.7.2.40
Excavation of soil and rock
socket will be carried out using a mechanical grab and reverse circulation
drill, respectively. Steel reinforcement
will be installed, fixed with a permanent casing for concreting. The pile cap above high-tide level will be
installed through the construction of a cofferdam, utilising permanent precast
panels. Seawater trapped inside the cofferdam will be pumped out, creating a
dry working environment throughout the construction process.
Potential
Changes in Hydrodynamic Regime
5.7.3.1
The hydrodynamic simulations
comparing scenarios with and without reclamation are presented in
Table 5.29, Table 5.30 and detailed in Appendix
5.4. This study conducted a
thorough analysis of water level, salinity, and current speed at three
specified locations and five cross-sections near the reclamation area, both
before and after the proposed reclamation activities. The focus of the cross-sectional results was
primarily on evaluating changes in tidal flow at the main water passage
sections in the area following the implementation of the reclamation project,
characterised by both instantaneous and cumulative flow rates. Three observation points were placed in the
adjacent waters of the reclamation area to assess variations in seawater flow
before and after project implementation.
5.7.3.2
The findings indicate that the
proposed reclamation area had a negligible impact on local hydrodynamics, with
only minor alterations observed in water level, flow velocity, and
salinity. As shown in Table 5.29, the overall changes in water
level are minimal, with a normalised NRMSE below
0.5%. The NRMSE for
salinity and velocity is below 5%. The NRMSE percentages for
momentary flow are consistently below 1.1% at all observation
cross-sections. The comparative analysis
of flow rates reveals that the flow remains stable at both cross-sections
before and after the proposed reclamation, with no significant differences
observed between the two scenarios.
5.7.3.3
As presented in Table 5.30 and Appendix 5.4, a comparison
of ebb and flood tidal flow volumes was conducted for the key channels under
both “without project” and “with project” scenarios, covering both dry and wet
seasons. For the dry season, the
relative differences in ebb and flood tidal flow volumes across channels such
as ADCP YAM O WAN – TLK, MA WAN CHANNEL 1, and others are very small — mostly
within a fraction of a percent (-1.36% to 0.45%).
Similarly, during the wet season, minimal relative differences (-1.58%
to 0.33%) were observed for these same channels.
Overall, the Project is predicted to result in insignificant changes to the ebb and flood tidal flow volumes at all concerned
channels. The relative differences across all channels and seasons range from
approximately –1.58% to +0.45%, indicating
that the impact on tidal flow characteristics is
insignificant. This level of
change confirms that the Project's influence on the hydrodynamic regime is
insignificant when compared to the baseline "without project"
conditions and does not alter the overall tidal behaviour in the study area.
5.7.3.4
The results affirm that the
proposed reclamation activities have a negligible impact on the local
hydrodynamic regime. Although there is a
slight alteration in tidal flow direction in the vicinity of the reclaimed area
due to localised land reclamation projects, it is insufficient to disrupt the
water dynamics characteristics in the region. This minor change in current
direction is attributed to the localised nature of the reclamation and the
overall stability of the hydrodynamic conditions in the area. Given the minimal change in average velocity,
there is no anticipation of a significant impact on flushing capacity. The projected operational impacts of the
Project suggest no noteworthy alterations in flow regime and water
quality. Consequently, no adverse
hydrodynamic, no additional
pollution source and water quality impacts are expected
during the operational phase, and no mitigation measures, such as maintenance
dredging, are deemed necessary.
Table 5.29 Hydrodynamic Modelling Comparison between the
With and Without Project Scenarios
|
Locations
|
Season
|
Water Level
|
Surface Salinity
|
Bottom
Salinity
|
Depth-average Current Speed
|
Momentary Flow
|
|
RMSE
|
NRMSE
(%)
|
RMSE
|
NRMSE
(%)
|
RMSE
|
NRMSE
(%)
|
Magnitude Without Project
(m/s)
|
Magnitude With Project
(m/s)
|
RMSE
|
NRMSE
(%)
|
RMSE
|
NRMSE
(%)
|
|
|
F5
|
Dry
|
0.005
|
0.25%
|
0.044
|
3.06%
|
0.033
|
2.51%
|
0.066
|
0.065
|
0.11
|
3.26%
|
|
|
|
Wet
|
0.004
|
0.18%
|
0.148
|
1.59%
|
0.110
|
1.04%
|
0.091
|
0.093
|
0.37
|
1.69%
|
|
|
KTD_G2
|
Dry
|
0.004
|
0.23%
|
0.031
|
2.71%
|
0.022
|
2.74%
|
0.152
|
0.151
|
0.08
|
2.89%
|
|
|
Wet
|
0.005
|
0.23%
|
0.130
|
1.58%
|
0.193
|
2.14%
|
0.196
|
0.195
|
0.33
|
1.68%
|
|
|
B14
|
Dry
|
0.005
|
0.29%
|
0.020
|
2.74%
|
0.020
|
2.73%
|
0.004
|
0.004
|
0.03
|
2.32%
|
|
|
Wet
|
0.007
|
0.35%
|
0.432
|
3.84%
|
0.391
|
4.46%
|
0.005
|
0.005
|
1.08
|
4.09%
|
|
|
ADCP Yam O Wan - TLK
|
Dry
|
|
|
|
|
118.0
|
0.13%
|
|
|
Wet
|
176.3
|
0.17%
|
|
|
Ma Wan Channel 1
|
Dry
|
118.0
|
0.13%
|
|
|
Wet
|
168.4
|
0.16%
|
|
|
Ma Wan Channel 2
|
Dry
|
255.2
|
0.36%
|
|
|
Wet
|
326.0
|
0.43%
|
|
|
Kap Shui Mun
|
Dry
|
149.1
|
0.69%
|
|
|
Wet
|
250.7
|
1.10%
|
|
|
Rambler Channel
|
Dry
|
79.5
|
0.29%
|
|
|
Wet
|
77.8
|
0.58%
|
|
|
|
|
|
|
|
|
|
|
|
|
|
|
|
|
|
Note: the definition of RMSE and NRMSE were presented in Section
5.6.3.26.
Table
5.30 Comparison of Ebb/Flood Tidal Flow Volume at
Concerned Channels
|
Cross-section
|
Tidal
Flow Type
|
Without
project (m3)
|
With
project (m3)
|
Difference
(m3)
|
Relative
Difference (%)
|
|
Dry
Season
|
|
ADCP
YAM O WAN-TLK
|
Ebb Tidal Flow
|
4.58E+10
|
4.58E+10
|
-2.95E+07
|
-0.06%
|
|
Flood Tidal Flow
|
-5.40E+10
|
-5.38E+10
|
2.51E+08
|
-0.46%
|
|
MA
WAN CHANNEL 1
|
Ebb Tidal Flow
|
4.63E+10
|
4.62E+10
|
-2.93E+07
|
-0.06%
|
|
Flood Tidal Flow
|
-5.45E+10
|
-5.42E+10
|
2.51E+08
|
-0.46%
|
|
KAP
SHUI MUN
|
Ebb Tidal Flow
|
1.10E+10
|
1.09E+10
|
-8.32E+07
|
-0.75%
|
|
Flood Tidal Flow
|
-1.39E+10
|
-1.39E+10
|
-6.21E+07
|
0.45%
|
|
MA
WAN CHANNEL 2
|
Ebb Tidal Flow
|
3.38E+10
|
3.40E+10
|
1.41E+08
|
0.42%
|
|
Flood Tidal Flow
|
-4.01E+10
|
-3.96E+10
|
4.91E+08
|
-1.22%
|
|
RAMBLER
CHANNEL
|
Ebb Tidal Flow
|
3.81E+09
|
3.76E+09
|
-5.19E+07
|
-1.36%
|
|
Flood Tidal Flow
|
-1.48E+09
|
-1.48E+09
|
8.01E+06
|
-0.54%
|
|
Wet
Season
|
|
ADCP
YAM O WAN-TLK
|
Ebb Tidal Flow
|
5.19E+10
|
5.18E+10
|
-1.03E+08
|
-0.20%
|
|
Flood Tidal Flow
|
-5.40E+10
|
-5.38E+10
|
2.29E+08
|
-0.42%
|
|
MA
WAN CHANNEL 1
|
Ebb Tidal Flow
|
5.24E+10
|
5.23E+10
|
-1.03E+08
|
-0.20%
|
|
Flood Tidal Flow
|
-5.45E+10
|
-5.43E+10
|
2.28E+08
|
-0.42%
|
|
KAP
SHUI MUN
|
Ebb Tidal Flow
|
1.21E+10
|
1.19E+10
|
-1.91E+08
|
-1.58%
|
|
Flood Tidal Flow
|
-1.28E+10
|
-1.28E+10
|
4.83E+07
|
-0.38%
|
|
MA
WAN CHANNEL 2
|
Ebb Tidal Flow
|
3.84E+10
|
3.85E+10
|
1.28E+08
|
0.33%
|
|
Flood Tidal Flow
|
-4.20E+10
|
-4.16E+10
|
3.42E+08
|
-0.81%
|
|
RAMBLER
CHANNEL
|
Ebb Tidal Flow
|
3.77E+09
|
3.71E+09
|
-5.78E+07
|
-1.53%
|
|
Flood Tidal Flow
|
-1.53E+09
|
-1.51E+09
|
1.51E+07
|
-0.99%
|
Note: the sign of the values under “Without project” and “With project”
represents the flow direction and the corresponding positive flow direction can
be referred to Appendix 5.4.
Surface Run-off
5.7.3.5
Surface run-off to be generated
from the Project is known as non-point source pollution. The additional paved roads will increase the
quantity of surface run-off. Release of uncontrolled surface run-off would
increase the suspended solids levels and turbidity as well as nutrients in the
nearby waterbodies. However, impacts
upon water quality would be minimal provided that proper drainage system would
be incorporated into the proposed works to receive surface run-off to the
drainage system at the planning and design stages.
5.7.3.6
It should be emphasised that
there will be no direct wastewater discharge during the operational phase of
the project. No sewage or process wastewater will be generated from the
proposed road infrastructure, and
therefore, no new pollution sources will be introduced during operation. It is anticipated that with proper implementation of BMPs as
recommended in Section 5.8, no adverse water quality impact from
non-point source surface run-off is expected.
5.8.1
Construction Phase
Reclamation Works
5.8.1.1
Based on the reclamation method
and work sequences discussed in Section 2 and Appendix 5.2, a silt curtain will
be installed before any dredging and reclamation activities to minimise the
impact of suspended solids on marine water.
The removal efficiency of a single floating silt curtain is assumed to
be 45%, in accordance with the HZMB, TCNTE and New Contaminated Sediment
Disposal Facility to the West Lamma EIA reports. To ensure
environmental compliance, a Silt Curtain Deployment Plan will be submitted to
the EPD for approval in advance
of any construction, particularly marine reclamation works.
5.8.1.2
Based on the aforementioned
simulations, the dredging scenario, even without implementing any mitigation
measures, can maintain full compliance at all WSR locations. Therefore, with the additional 45% reduction
in SS release through the implementation of silt curtains, both the sediment
plume and sedimentation rate values are further reduced (Table 5.31, Table 5.33 and Appendix 5.3).
5.8.1.3
In the scenario of reclamation
filling activities, based on the previous assessment, short-duration
exceedances are projected at the observation point WM4 location if no
mitigation measures are implemented.
However, with the implementation of a silt curtain, no
exceedance at WM4 will be anticipated. All other WSR locations
comply with WQOs. The sediment plume closes the
reclamation works area is further reduced in extent compared to the scenario
without mitigation measures (Table 5.32,
Table 5.34 and Appendix
5.3). Section 5.7.2.22
highlights that EPD monitoring data indicate lower 10th percentile
depth-averaged values at certain stations during the wet season, in comparison
to the dry season. The model predictions (Table
5.35 to Table 5.38) suggest that DO depletion resulting from the Project activities
would be minimal and temporary, particularly with the implementation of the
silt curtain. Consequently, no significant water quality impacts are expected.
Table 5.31 Predicted Maximum Suspended Solids (mg/L)
Elevations during Dredging Activities (Run C2a – With Project, Mitigated)
|
Location
|
Predicted Maximum Suspended Solids (mg/L)
Elevations
|
Suspended Solids Criteria (mg/L)
|
Compliance to Criteria (mg/L)
|
|
Dry Season
|
Wet Season
|
Dry Season
|
Wet Season
|
|
S
|
M
|
B
|
DA
|
S
|
M
|
B
|
DA
|
S
|
M
|
B
|
DA
|
S
|
M
|
B
|
DA
|
|
WSD1
|
0.00
|
0.01
|
0.02
|
0.01
|
0.00
|
0.01
|
0.03
|
0.01
|
3.57
|
5.34
|
5.40
|
4.77
|
2.99
|
4.38
|
6.54
|
4.64
|
Yes
|
|
MG2
|
0.00
|
0.00
|
0.00
|
0.00
|
0.00
|
0.00
|
0.00
|
0.00
|
3.57
|
5.34
|
5.40
|
4.77
|
2.99
|
4.38
|
6.54
|
4.64
|
Yes
|
|
H1
|
0.00
|
0.00
|
0.00
|
0.00
|
0.00
|
0.00
|
0.00
|
0.00
|
3.57
|
5.34
|
5.40
|
4.77
|
2.99
|
4.38
|
6.54
|
4.64
|
Yes
|
|
SG1
|
0.00
|
0.00
|
0.00
|
0.00
|
0.00
|
0.00
|
0.01
|
0.00
|
3.57
|
5.34
|
5.40
|
4.77
|
2.99
|
4.38
|
6.54
|
4.64
|
Yes
|
|
CR2
|
0.01
|
0.04
|
0.04
|
0.03
|
0.00
|
0.01
|
0.04
|
0.02
|
3.57
|
5.34
|
5.40
|
4.77
|
2.99
|
4.38
|
6.54
|
4.64
|
Yes
|
|
C1
|
0.07
|
0.08
|
0.08
|
0.08
|
0.01
|
0.06
|
0.08
|
0.05
|
3.57
|
5.34
|
5.40
|
4.77
|
2.99
|
4.38
|
6.54
|
4.64
|
Yes
|
|
CR1
|
0.20
|
0.14
|
0.08
|
0.14
|
0.01
|
0.02
|
0.03
|
0.02
|
3.57
|
5.34
|
5.40
|
4.77
|
2.99
|
4.38
|
6.54
|
4.64
|
Yes
|
|
MG1
|
0.12
|
0.35
|
0.36
|
0.28
|
0.08
|
0.41
|
0.43
|
0.31
|
2.91
|
3.60
|
5.10
|
3.87
|
2.77
|
3.48
|
4.80
|
3.68
|
Yes
|
|
WM4
|
0.37
|
0.40
|
0.47
|
0.41
|
0.13
|
0.59
|
0.76
|
0.50
|
2.91
|
3.60
|
5.10
|
3.87
|
2.77
|
3.48
|
4.80
|
3.68
|
Yes
|
|
C4
|
0.00
|
0.00
|
0.00
|
0.00
|
0.00
|
0.00
|
0.00
|
0.00
|
3.24
|
3.78
|
4.44
|
3.82
|
3.30
|
3.51
|
5.61
|
4.14
|
Yes
|
|
B2
|
0.07
|
0.08
|
0.11
|
0.09
|
0.05
|
0.18
|
0.21
|
0.14
|
2.91
|
3.60
|
5.10
|
3.87
|
2.77
|
3.48
|
4.80
|
3.68
|
Yes
|
|
SA2
|
0.00
|
0.01
|
0.01
|
0.01
|
0.00
|
0.00
|
0.00
|
0.00
|
2.90
|
3.51
|
3.90
|
3.44
|
2.70
|
2.77
|
3.21
|
2.89
|
Yes
|
|
C3
|
0.01
|
0.01
|
0.01
|
0.01
|
0.00
|
0.00
|
0.00
|
0.00
|
3.24
|
3.78
|
4.44
|
3.82
|
3.30
|
3.51
|
5.61
|
4.14
|
Yes
|
|
VM12
|
0.01
|
0.00
|
0.00
|
0.00
|
0.00
|
0.00
|
0.00
|
0.00
|
3.24
|
3.78
|
4.44
|
3.82
|
3.30
|
3.51
|
5.61
|
4.14
|
Yes
|
|
VM14
|
0.01
|
0.01
|
0.01
|
0.01
|
0.00
|
0.00
|
0.00
|
0.00
|
2.90
|
3.51
|
3.90
|
3.44
|
2.70
|
2.77
|
3.21
|
2.89
|
Yes
|
|
F1
|
0.04
|
0.10
|
0.12
|
0.08
|
0.01
|
0.07
|
0.08
|
0.05
|
2.91
|
3.60
|
5.10
|
3.87
|
2.77
|
3.48
|
4.80
|
3.68
|
Yes
|
|
B1
|
0.02
|
0.07
|
0.07
|
0.05
|
0.02
|
0.06
|
0.06
|
0.04
|
2.91
|
3.60
|
5.10
|
3.87
|
2.77
|
3.48
|
4.80
|
3.68
|
Yes
|
|
B4
|
0.02
|
0.05
|
0.06
|
0.04
|
0.00
|
0.01
|
0.05
|
0.02
|
2.91
|
3.60
|
5.10
|
3.87
|
2.77
|
3.48
|
4.80
|
3.68
|
Yes
|
|
B5
|
0.01
|
0.05
|
0.05
|
0.04
|
0.00
|
0.02
|
0.07
|
0.03
|
2.91
|
3.60
|
5.10
|
3.87
|
2.77
|
3.48
|
4.80
|
3.68
|
Yes
|
|
B7
|
0.01
|
0.03
|
0.04
|
0.03
|
0.00
|
0.00
|
0.01
|
0.00
|
2.91
|
3.60
|
5.10
|
3.87
|
2.77
|
3.48
|
4.80
|
3.68
|
Yes
|
|
B8
|
0.17
|
0.17
|
0.16
|
0.17
|
0.10
|
0.10
|
0.10
|
0.10
|
2.91
|
3.60
|
5.10
|
3.87
|
2.77
|
3.48
|
4.80
|
3.68
|
Yes
|
|
NM1
|
0.10
|
0.09
|
0.10
|
0.10
|
0.02
|
0.07
|
0.10
|
0.06
|
3.57
|
5.34
|
5.40
|
4.77
|
2.99
|
4.38
|
6.54
|
4.64
|
Yes
|
|
WSD2
|
0.00
|
0.00
|
0.00
|
0.00
|
0.00
|
0.00
|
0.00
|
0.00
|
2.90
|
3.51
|
3.90
|
3.44
|
2.70
|
2.77
|
3.21
|
2.89
|
Yes
|
|
WSD3
|
0.01
|
0.01
|
0.01
|
0.01
|
0.00
|
0.00
|
0.00
|
0.00
|
2.90
|
3.51
|
3.90
|
3.44
|
2.70
|
2.77
|
3.21
|
2.89
|
Yes
|
|
TS1
|
0.00
|
0.00
|
0.00
|
0.00
|
0.00
|
0.00
|
0.00
|
0.00
|
2.90
|
3.51
|
3.90
|
3.44
|
2.70
|
2.77
|
3.21
|
2.89
|
Yes
|
|
B3
|
0.05
|
0.09
|
0.10
|
0.08
|
0.00
|
0.10
|
0.13
|
0.08
|
2.91
|
3.60
|
5.10
|
3.87
|
2.77
|
3.48
|
4.80
|
3.68
|
Yes
|
|
B6
|
0.01
|
0.01
|
0.01
|
0.01
|
0.01
|
0.01
|
0.01
|
0.01
|
2.91
|
3.60
|
5.10
|
3.87
|
2.77
|
3.48
|
4.80
|
3.68
|
Yes
|
|
C2
|
0.00
|
0.01
|
0.01
|
0.01
|
0.00
|
0.00
|
0.00
|
0.00
|
2.90
|
3.51
|
3.90
|
3.44
|
2.70
|
2.77
|
3.21
|
2.89
|
Yes
|
|
SA1
|
0.02
|
0.06
|
0.08
|
0.05
|
0.00
|
0.03
|
0.08
|
0.04
|
2.91
|
3.60
|
5.10
|
3.87
|
2.77
|
3.48
|
4.80
|
3.68
|
Yes
|
Note:
1.
S – Surface Layer, M – Middle Layer; B –
Bottom Layer; DA – Depth Averaged.
2.
Values
in
bold and
underlined indicates non-compliance with WQOs.
3.
The working hours
per day is assumed to be 12 hours.
Table 5.32 Predicted Maximum Suspended Solids (mg/L)
Elevations during Reclamation Filling Activities (Run C2b – With Project, Mitigated)
|
Location
|
Predicted Maximum Suspended Solids (mg/L)
Elevations
|
Suspended Solids Criteria (mg/L)
|
Compliance to Criteria (mg/L)
|
|
Dry Season
|
Wet Season
|
Dry Season
|
Wet Season
|
|
S
|
M
|
B
|
DA
|
S
|
M
|
B
|
DA
|
S
|
M
|
B
|
DA
|
S
|
M
|
B
|
DA
|
|
WSD1
|
0.00
|
0.03
|
0.04
|
0.02
|
0.01
|
0.04
|
0.09
|
0.05
|
3.57
|
5.34
|
5.40
|
4.77
|
2.99
|
4.38
|
6.54
|
4.64
|
Yes
|
|
MG2
|
0.00
|
0.00
|
0.00
|
0.00
|
0.00
|
0.00
|
0.00
|
0.00
|
3.57
|
5.34
|
5.40
|
4.77
|
2.99
|
4.38
|
6.54
|
4.64
|
Yes
|
|
H1
|
0.00
|
0.00
|
0.00
|
0.00
|
0.00
|
0.00
|
0.01
|
0.00
|
3.57
|
5.34
|
5.40
|
4.77
|
2.99
|
4.38
|
6.54
|
4.64
|
Yes
|
|
SG1
|
0.00
|
0.00
|
0.00
|
0.00
|
0.00
|
0.00
|
0.02
|
0.01
|
3.57
|
5.34
|
5.40
|
4.77
|
2.99
|
4.38
|
6.54
|
4.64
|
Yes
|
|
CR2
|
0.02
|
0.09
|
0.10
|
0.07
|
0.00
|
0.05
|
0.13
|
0.06
|
3.57
|
5.34
|
5.40
|
4.77
|
2.99
|
4.38
|
6.54
|
4.64
|
Yes
|
|
C1
|
0.11
|
0.22
|
0.22
|
0.19
|
0.02
|
0.15
|
0.25
|
0.14
|
3.57
|
5.34
|
5.40
|
4.77
|
2.99
|
4.38
|
6.54
|
4.64
|
Yes
|
|
CR1
|
0.12
|
0.14
|
0.12
|
0.13
|
0.01
|
0.05
|
0.10
|
0.06
|
3.57
|
5.34
|
5.40
|
4.77
|
2.99
|
4.38
|
6.54
|
4.64
|
Yes
|
|
MG1
|
0.09
|
0.25
|
0.24
|
0.19
|
0.09
|
0.39
|
0.39
|
0.29
|
2.91
|
3.60
|
5.10
|
3.87
|
2.77
|
3.48
|
4.80
|
3.68
|
Yes
|
|
WM4
|
1.34
|
1.95
|
2.40
|
1.90
|
0.52
|
3.45
|
2.63
|
2.20
|
2.91
|
3.60
|
5.10
|
3.87
|
2.77
|
3.48
|
4.80
|
3.68
|
Yes
|
|
C4
|
0.00
|
0.00
|
0.00
|
0.00
|
0.00
|
0.00
|
0.00
|
0.00
|
3.24
|
3.78
|
4.44
|
3.82
|
3.30
|
3.51
|
5.61
|
4.14
|
Yes
|
|
B2
|
0.20
|
0.27
|
0.38
|
0.28
|
0.17
|
0.55
|
0.62
|
0.45
|
2.91
|
3.60
|
5.10
|
3.87
|
2.77
|
3.48
|
4.80
|
3.68
|
Yes
|
|
SA2
|
0.00
|
0.03
|
0.03
|
0.02
|
0.00
|
0.01
|
0.01
|
0.01
|
2.90
|
3.51
|
3.90
|
3.44
|
2.70
|
2.77
|
3.21
|
2.89
|
Yes
|
|
C3
|
0.03
|
0.04
|
0.04
|
0.04
|
0.00
|
0.00
|
0.00
|
0.00
|
3.24
|
3.78
|
4.44
|
3.82
|
3.30
|
3.51
|
5.61
|
4.14
|
Yes
|
|
VM12
|
0.02
|
0.01
|
0.00
|
0.01
|
0.00
|
0.00
|
0.01
|
0.00
|
3.24
|
3.78
|
4.44
|
3.82
|
3.30
|
3.51
|
5.61
|
4.14
|
Yes
|
|
VM14
|
0.03
|
0.05
|
0.05
|
0.04
|
0.00
|
0.00
|
0.01
|
0.00
|
2.90
|
3.51
|
3.90
|
3.44
|
2.70
|
2.77
|
3.21
|
2.89
|
Yes
|
|
F1
|
0.16
|
0.23
|
0.27
|
0.22
|
0.02
|
0.18
|
0.19
|
0.13
|
2.91
|
3.60
|
5.10
|
3.87
|
2.77
|
3.48
|
4.80
|
3.68
|
Yes
|
|
B1
|
0.07
|
0.19
|
0.20
|
0.15
|
0.05
|
0.18
|
0.18
|
0.14
|
2.91
|
3.60
|
5.10
|
3.87
|
2.77
|
3.48
|
4.80
|
3.68
|
Yes
|
|
B4
|
0.05
|
0.18
|
0.21
|
0.15
|
0.00
|
0.05
|
0.15
|
0.07
|
2.91
|
3.60
|
5.10
|
3.87
|
2.77
|
3.48
|
4.80
|
3.68
|
Yes
|
|
B5
|
0.05
|
0.18
|
0.20
|
0.14
|
0.01
|
0.08
|
0.23
|
0.11
|
2.91
|
3.60
|
5.10
|
3.87
|
2.77
|
3.48
|
4.80
|
3.68
|
Yes
|
|
B7
|
0.03
|
0.12
|
0.16
|
0.10
|
0.00
|
0.00
|
0.02
|
0.01
|
2.91
|
3.60
|
5.10
|
3.87
|
2.77
|
3.48
|
4.80
|
3.68
|
Yes
|
|
B8
|
0.43
|
0.43
|
0.43
|
0.43
|
0.37
|
0.36
|
0.36
|
0.37
|
2.91
|
3.60
|
5.10
|
3.87
|
2.77
|
3.48
|
4.80
|
3.68
|
Yes
|
|
NM1
|
0.22
|
0.19
|
0.28
|
0.23
|
0.05
|
0.34
|
0.39
|
0.26
|
3.57
|
5.34
|
5.40
|
4.77
|
2.99
|
4.38
|
6.54
|
4.64
|
Yes
|
|
WSD2
|
0.00
|
0.01
|
0.01
|
0.01
|
0.00
|
0.00
|
0.00
|
0.00
|
2.90
|
3.51
|
3.90
|
3.44
|
2.70
|
2.77
|
3.21
|
2.89
|
Yes
|
|
WSD3
|
0.03
|
0.04
|
0.04
|
0.04
|
0.00
|
0.00
|
0.00
|
0.00
|
2.90
|
3.51
|
3.90
|
3.44
|
2.70
|
2.77
|
3.21
|
2.89
|
Yes
|
|
TS1
|
0.00
|
0.01
|
0.01
|
0.01
|
0.00
|
0.00
|
0.00
|
0.00
|
2.90
|
3.51
|
3.90
|
3.44
|
2.70
|
2.77
|
3.21
|
2.89
|
Yes
|
|
B3
|
0.17
|
0.32
|
0.35
|
0.28
|
0.01
|
0.32
|
0.46
|
0.26
|
2.91
|
3.60
|
5.10
|
3.87
|
2.77
|
3.48
|
4.80
|
3.68
|
Yes
|
|
B6
|
0.05
|
0.05
|
0.05
|
0.05
|
0.03
|
0.03
|
0.03
|
0.03
|
2.91
|
3.60
|
5.10
|
3.87
|
2.77
|
3.48
|
4.80
|
3.68
|
Yes
|
|
C2
|
0.01
|
0.02
|
0.02
|
0.02
|
0.00
|
0.00
|
0.00
|
0.00
|
2.90
|
3.51
|
3.90
|
3.44
|
2.70
|
2.77
|
3.21
|
2.89
|
Yes
|
|
SA1
|
0.07
|
0.21
|
0.27
|
0.18
|
0.01
|
0.12
|
0.28
|
0.14
|
2.91
|
3.60
|
5.10
|
3.87
|
2.77
|
3.48
|
4.80
|
3.68
|
Yes
|
Note:
1.
S – Surface Layer, M – Middle Layer; B –
Bottom Layer; DA – Depth Averaged.
2.
Values
in
bold and
underlined indicates non-compliance with WQOs.
3.
The working hours
per day is assumed to be 12 hours.
Table
5.33 Predicted Maximum Sedimentation Rate (g/m2/day)
during Dredging Activities (Run C2a –
With Project, Mitigated)
|
WSR
|
Predicted Maximum Sedimentation Rates (g/m2/day)
|
|
Dry Season
|
Wet Season
|
|
WSD1
|
0.9
|
1.2
|
|
MG2
|
0.0
|
0.1
|
|
H1
|
0.0
|
0.1
|
|
SG1
|
0.2
|
0.4
|
|
CR2
|
1.7
|
1.6
|
|
C1
|
3.7
|
3.7
|
|
CR1
|
2.3
|
1.5
|
|
MG1
|
17.1
|
23.3
|
|
WM4
|
20.5
|
37.9
|
|
C4
|
0.1
|
0.0
|
|
B2
|
6.6
|
9.0
|
|
SA2
|
0.5
|
0.2
|
|
C3
|
0.6
|
0.0
|
|
VM12
|
0.1
|
0.1
|
|
VM14
|
0.6
|
0.1
|
|
F1
|
5.1
|
3.5
|
|
B1
|
3.4
|
2.8
|
|
B4
|
2.5
|
2.2
|
|
B5
|
2.5
|
3.5
|
|
B7
|
1.9
|
0.4
|
|
B8
|
0.0
|
0.5
|
|
NM1
|
4.4
|
4.6
|
|
WSD2
|
0.2
|
0.0
|
|
WSD3
|
0.6
|
0.0
|
|
TS1
|
0.1
|
0.0
|
|
B3
|
4.6
|
6.4
|
|
B6
|
0.4
|
0.0
|
|
C2
|
0.3
|
0.0
|
|
SA1
|
3.4
|
3.7
|
Notes: Values in bold and underlined indicate non-compliance with
WQOs.
Table
5.34 Predicted Maximum Sedimentation Rate (g/m2/day)
during Reclamation Filling Activities (Run C2b – With Project, Mitigated)
|
WSR
|
Predicted Maximum Sedimentation Rates (g/m2/day)
|
|
Dry Season
|
Wet Season
|
|
WSD1
|
1.6
|
3.9
|
|
MG2
|
0.0
|
0.1
|
|
H1
|
0.0
|
0.3
|
|
SG1
|
0.1
|
0.8
|
|
CR2
|
4.2
|
5.7
|
|
C1
|
10.0
|
11.7
|
|
CR1
|
4.9
|
4.7
|
|
MG1
|
12.9
|
19.1
|
|
WM4
|
105.8
|
132.7
|
|
C4
|
0.2
|
0.0
|
|
B2
|
24.7
|
26.8
|
|
SA2
|
1.4
|
0.6
|
|
C3
|
1.8
|
0.1
|
|
VM12
|
0.2
|
0.2
|
|
VM14
|
2.2
|
0.5
|
|
F1
|
11.8
|
8.6
|
|
B1
|
11.3
|
8.9
|
|
B4
|
9.1
|
7.2
|
|
B5
|
9.3
|
12.6
|
|
B7
|
7.1
|
1.4
|
|
B8
|
0.0
|
0.8
|
|
NM1
|
12.3
|
18.8
|
|
WSD2
|
0.7
|
0.1
|
|
WSD3
|
2.0
|
0.2
|
|
TS1
|
0.5
|
0.0
|
|
B3
|
15.0
|
21.8
|
|
B6
|
1.6
|
0.1
|
|
C2
|
1.0
|
0.2
|
|
SA1
|
12.4
|
13.6
|
Notes: Values in bold and underlined indicate non-compliance with
WQOs.
Table
5.35 Predicted DO Depletion (mg/L) under Dredging
Activities (Run C2a –
With Project, Mitigated)
|
Station
|
Dry Season
|
Wet Season
|
|
S
|
M
|
B
|
DA
|
S
|
M
|
B
|
DA
|
|
WSD1
|
0.00
|
0.00
|
0.00
|
0.00
|
0.00
|
0.00
|
0.00
|
0.00
|
|
MG2
|
0.00
|
0.00
|
0.00
|
0.00
|
0.00
|
0.00
|
0.00
|
0.00
|
|
H1
|
0.00
|
0.00
|
0.00
|
0.00
|
0.00
|
0.00
|
0.00
|
0.00
|
|
SG1
|
0.00
|
0.00
|
0.00
|
0.00
|
0.00
|
0.00
|
0.00
|
0.00
|
|
CR2
|
0.00
|
0.00
|
0.00
|
0.00
|
0.00
|
0.00
|
0.00
|
0.00
|
|
C1
|
0.00
|
0.00
|
0.00
|
0.00
|
0.00
|
0.00
|
0.00
|
0.00
|
|
CR1
|
0.00
|
0.00
|
0.00
|
0.00
|
0.00
|
0.00
|
0.00
|
0.00
|
|
MG1
|
0.00
|
0.01
|
0.01
|
0.00
|
0.00
|
0.01
|
0.01
|
0.00
|
|
WM4
|
0.01
|
0.01
|
0.01
|
0.01
|
0.00
|
0.01
|
0.01
|
0.01
|
|
C4
|
0.00
|
0.00
|
0.00
|
0.00
|
0.00
|
0.00
|
0.00
|
0.00
|
|
B2
|
0.00
|
0.00
|
0.00
|
0.00
|
0.00
|
0.00
|
0.00
|
0.00
|
|
SA2
|
0.00
|
0.00
|
0.00
|
0.00
|
0.00
|
0.00
|
0.00
|
0.00
|
|
C3
|
0.00
|
0.00
|
0.00
|
0.00
|
0.00
|
0.00
|
0.00
|
0.00
|
|
VM12
|
0.00
|
0.00
|
0.00
|
0.00
|
0.00
|
0.00
|
0.00
|
0.00
|
|
VM14
|
0.00
|
0.00
|
0.00
|
0.00
|
0.00
|
0.00
|
0.00
|
0.00
|
|
F1
|
0.00
|
0.00
|
0.00
|
0.00
|
0.00
|
0.00
|
0.00
|
0.00
|
|
B1
|
0.00
|
0.00
|
0.00
|
0.00
|
0.00
|
0.00
|
0.00
|
0.00
|
|
B4
|
0.00
|
0.00
|
0.00
|
0.00
|
0.00
|
0.00
|
0.00
|
0.00
|
|
B5
|
0.00
|
0.00
|
0.00
|
0.00
|
0.00
|
0.00
|
0.00
|
0.00
|
|
B7
|
0.00
|
0.00
|
0.00
|
0.00
|
0.00
|
0.00
|
0.00
|
0.00
|
|
B8
|
0.00
|
0.00
|
0.00
|
0.00
|
0.00
|
0.00
|
0.00
|
0.00
|
|
NM1
|
0.00
|
0.00
|
0.00
|
0.00
|
0.00
|
0.00
|
0.00
|
0.00
|
|
WSD2
|
0.00
|
0.00
|
0.00
|
0.00
|
0.00
|
0.00
|
0.00
|
0.00
|
|
WSD3
|
0.00
|
0.00
|
0.00
|
0.00
|
0.00
|
0.00
|
0.00
|
0.00
|
|
TS1
|
0.00
|
0.00
|
0.00
|
0.00
|
0.00
|
0.00
|
0.00
|
0.00
|
|
B3
|
0.00
|
0.00
|
0.00
|
0.00
|
0.00
|
0.00
|
0.00
|
0.00
|
|
B6
|
0.00
|
0.00
|
0.00
|
0.00
|
0.00
|
0.00
|
0.00
|
0.00
|
|
C2
|
0.00
|
0.00
|
0.00
|
0.00
|
0.00
|
0.00
|
0.00
|
0.00
|
|
SA1
|
0.00
|
0.00
|
0.00
|
0.00
|
0.00
|
0.00
|
0.00
|
0.00
|
Notes: S – Surface Layer, M – Middle Layer; B –
Bottom Layer; DA – Depth Averaged.
Table 5.36 Predicted Resultant DO
Depletion (mg/L) under Dredging Activities (Run C2a – With Project, Mitigated)
|
Station
|
Dry Season
|
Wet Season
|
|
S
|
M
|
B
|
DA
|
S
|
M
|
B
|
DA
|
|
WSD1
|
4.91
|
5.21
|
5.21
|
5.11
|
4.40
|
3.20
|
2.50
|
3.37
|
|
MG2
|
4.91
|
5.21
|
5.21
|
5.11
|
4.40
|
3.20
|
2.50
|
3.37
|
|
H1
|
4.91
|
5.21
|
5.21
|
5.11
|
4.40
|
3.20
|
2.50
|
3.37
|
|
SG1
|
4.91
|
5.21
|
5.21
|
5.11
|
4.40
|
3.20
|
2.50
|
3.37
|
|
CR2
|
4.91
|
5.21
|
5.21
|
5.11
|
4.40
|
3.20
|
2.50
|
3.37
|
|
C1
|
4.91
|
5.21
|
5.21
|
5.11
|
4.40
|
3.20
|
2.50
|
3.37
|
|
CR1
|
4.91
|
5.21
|
5.21
|
5.11
|
4.40
|
3.20
|
2.50
|
3.37
|
|
MG1
|
4.70
|
5.09
|
5.09
|
4.96
|
4.22
|
2.97
|
2.49
|
3.23
|
|
WM4
|
4.69
|
5.09
|
5.09
|
4.96
|
4.22
|
2.97
|
2.49
|
3.23
|
|
C4
|
4.54
|
4.52
|
4.70
|
4.59
|
4.13
|
3.70
|
3.13
|
3.65
|
|
B2
|
4.70
|
5.10
|
5.10
|
4.97
|
4.22
|
2.98
|
2.50
|
3.23
|
|
SA2
|
4.23
|
4.50
|
4.90
|
4.54
|
4.06
|
3.60
|
3.43
|
3.70
|
|
C3
|
4.54
|
4.52
|
4.70
|
4.59
|
4.13
|
3.70
|
3.13
|
3.65
|
|
VM12
|
4.54
|
4.52
|
4.70
|
4.59
|
4.13
|
3.70
|
3.13
|
3.65
|
|
VM14
|
4.23
|
4.50
|
4.90
|
4.54
|
4.06
|
3.60
|
3.43
|
3.70
|
|
F1
|
4.70
|
5.10
|
5.10
|
4.97
|
4.22
|
2.98
|
2.50
|
3.23
|
|
B1
|
4.70
|
5.10
|
5.10
|
4.97
|
4.22
|
2.98
|
2.50
|
3.23
|
|
B4
|
4.70
|
5.10
|
5.10
|
4.97
|
4.22
|
2.98
|
2.50
|
3.23
|
|
B5
|
4.70
|
5.10
|
5.10
|
4.97
|
4.22
|
2.98
|
2.50
|
3.23
|
|
B7
|
4.70
|
5.10
|
5.10
|
4.97
|
4.22
|
2.98
|
2.50
|
3.23
|
|
B8
|
4.70
|
5.10
|
5.10
|
4.96
|
4.22
|
2.98
|
2.50
|
3.23
|
|
NM1
|
4.91
|
5.21
|
5.21
|
5.11
|
4.40
|
3.20
|
2.50
|
3.37
|
|
WSD2
|
4.23
|
4.50
|
4.90
|
4.54
|
4.06
|
3.60
|
3.43
|
3.70
|
|
WSD3
|
4.23
|
4.50
|
4.90
|
4.54
|
4.06
|
3.60
|
3.43
|
3.70
|
|
TS1
|
4.23
|
4.50
|
4.90
|
4.54
|
4.06
|
3.60
|
3.43
|
3.70
|
|
B3
|
4.70
|
5.10
|
5.10
|
4.97
|
4.22
|
2.98
|
2.50
|
3.23
|
|
B6
|
4.70
|
5.10
|
5.10
|
4.97
|
4.22
|
2.98
|
2.50
|
3.23
|
|
C2
|
4.23
|
4.50
|
4.90
|
4.54
|
4.06
|
3.60
|
3.43
|
3.70
|
|
SA1
|
4.70
|
5.10
|
5.10
|
4.97
|
4.22
|
2.98
|
2.50
|
3.23
|
Notes:
(1).S – Surface Layer, M
– Middle Layer; B – Bottom Layer; DA – Depth Averaged.
(2).10 percentiles DO
values in bold and underlined indicates non-compliance with WQOs.
Table 5.37 Predicted DO Depletion
(mg/L) under Reclamation Filling Activities (Run C2b – With Project, Mitigated)
|
Station
|
Dry Season
|
Wet Season
|
|
S
|
M
|
B
|
DA
|
S
|
M
|
B
|
DA
|
|
WSD1
|
0.00
|
0.00
|
0.00
|
0.00
|
0.00
|
0.00
|
0.00
|
0.00
|
|
MG2
|
0.00
|
0.00
|
0.00
|
0.00
|
0.00
|
0.00
|
0.00
|
0.00
|
|
H1
|
0.00
|
0.00
|
0.00
|
0.00
|
0.00
|
0.00
|
0.00
|
0.00
|
|
SG1
|
0.00
|
0.00
|
0.00
|
0.00
|
0.00
|
0.00
|
0.00
|
0.00
|
|
CR2
|
0.00
|
0.00
|
0.00
|
0.00
|
0.00
|
0.00
|
0.00
|
0.00
|
|
C1
|
0.00
|
0.00
|
0.00
|
0.00
|
0.00
|
0.00
|
0.00
|
0.00
|
|
CR1
|
0.00
|
0.00
|
0.00
|
0.00
|
0.00
|
0.00
|
0.00
|
0.00
|
|
MG1
|
0.00
|
0.00
|
0.00
|
0.00
|
0.00
|
0.01
|
0.01
|
0.00
|
|
WM4
|
0.02
|
0.03
|
0.04
|
0.03
|
0.01
|
0.05
|
0.04
|
0.03
|
|
C4
|
0.00
|
0.00
|
0.00
|
0.00
|
0.00
|
0.00
|
0.00
|
0.00
|
|
B2
|
0.00
|
0.00
|
0.01
|
0.00
|
0.00
|
0.01
|
0.01
|
0.01
|
|
SA2
|
0.00
|
0.00
|
0.00
|
0.00
|
0.00
|
0.00
|
0.00
|
0.00
|
|
C3
|
0.00
|
0.00
|
0.00
|
0.00
|
0.00
|
0.00
|
0.00
|
0.00
|
|
VM12
|
0.00
|
0.00
|
0.00
|
0.00
|
0.00
|
0.00
|
0.00
|
0.00
|
|
VM14
|
0.00
|
0.00
|
0.00
|
0.00
|
0.00
|
0.00
|
0.00
|
0.00
|
|
F1
|
0.00
|
0.00
|
0.00
|
0.00
|
0.00
|
0.00
|
0.00
|
0.00
|
|
B1
|
0.00
|
0.00
|
0.00
|
0.00
|
0.00
|
0.00
|
0.00
|
0.00
|
|
B4
|
0.00
|
0.00
|
0.00
|
0.00
|
0.00
|
0.00
|
0.00
|
0.00
|
|
B5
|
0.00
|
0.00
|
0.00
|
0.00
|
0.00
|
0.00
|
0.00
|
0.00
|
|
B7
|
0.00
|
0.00
|
0.00
|
0.00
|
0.00
|
0.00
|
0.00
|
0.00
|
|
B8
|
0.01
|
0.01
|
0.01
|
0.01
|
0.01
|
0.01
|
0.01
|
0.01
|
|
NM1
|
0.00
|
0.00
|
0.00
|
0.00
|
0.00
|
0.01
|
0.01
|
0.00
|
|
WSD2
|
0.00
|
0.00
|
0.00
|
0.00
|
0.00
|
0.00
|
0.00
|
0.00
|
|
WSD3
|
0.00
|
0.00
|
0.00
|
0.00
|
0.00
|
0.00
|
0.00
|
0.00
|
|
TS1
|
0.00
|
0.00
|
0.00
|
0.00
|
0.00
|
0.00
|
0.00
|
0.00
|
|
B3
|
0.00
|
0.00
|
0.01
|
0.00
|
0.00
|
0.00
|
0.01
|
0.00
|
|
B6
|
0.00
|
0.00
|
0.00
|
0.00
|
0.00
|
0.00
|
0.00
|
0.00
|
|
C2
|
0.00
|
0.00
|
0.00
|
0.00
|
0.00
|
0.00
|
0.00
|
0.00
|
|
SA1
|
0.00
|
0.00
|
0.00
|
0.00
|
0.00
|
0.00
|
0.00
|
0.00
|
Notes: S – Surface Layer, M – Middle Layer; B – Bottom
Layer; DA – Depth Averaged.
Table
5.38 Predicted Resultant Dissolved Oxygen
Depletion (mg/L) under Reclamation Filling Activities (Run C2b – With Project, Mitigated)
|
Station
|
Dry Season
|
Wet Season
|
|
S
|
M
|
B
|
DA
|
S
|
M
|
B
|
DA
|
|
WSD1
|
4.91
|
5.21
|
5.21
|
5.11
|
4.40
|
3.20
|
2.50
|
3.37
|
|
MG2
|
4.91
|
5.21
|
5.21
|
5.11
|
4.40
|
3.20
|
2.50
|
3.37
|
|
H1
|
4.91
|
5.21
|
5.21
|
5.11
|
4.40
|
3.20
|
2.50
|
3.37
|
|
SG1
|
4.91
|
5.21
|
5.21
|
5.11
|
4.40
|
3.20
|
2.50
|
3.37
|
|
CR2
|
4.91
|
5.21
|
5.21
|
5.11
|
4.40
|
3.20
|
2.50
|
3.37
|
|
C1
|
4.91
|
5.21
|
5.21
|
5.11
|
4.40
|
3.20
|
2.50
|
3.36
|
|
CR1
|
4.91
|
5.21
|
5.21
|
5.11
|
4.40
|
3.20
|
2.50
|
3.37
|
|
MG1
|
4.70
|
5.10
|
5.10
|
4.96
|
4.22
|
2.97
|
2.49
|
3.23
|
|
WM4
|
4.68
|
5.07
|
5.06
|
4.94
|
4.21
|
2.93
|
2.46
|
3.20
|
|
C4
|
4.54
|
4.52
|
4.70
|
4.59
|
4.13
|
3.70
|
3.13
|
3.65
|
|
B2
|
4.70
|
5.10
|
5.09
|
4.96
|
4.22
|
2.97
|
2.49
|
3.23
|
|
SA2
|
4.23
|
4.50
|
4.90
|
4.54
|
4.06
|
3.60
|
3.43
|
3.70
|
|
C3
|
4.54
|
4.52
|
4.70
|
4.59
|
4.13
|
3.70
|
3.13
|
3.65
|
|
VM12
|
4.54
|
4.52
|
4.70
|
4.59
|
4.13
|
3.70
|
3.13
|
3.65
|
|
VM14
|
4.23
|
4.50
|
4.90
|
4.54
|
4.06
|
3.60
|
3.43
|
3.70
|
|
F1
|
4.70
|
5.10
|
5.10
|
4.96
|
4.22
|
2.98
|
2.50
|
3.23
|
|
B1
|
4.70
|
5.10
|
5.10
|
4.96
|
4.22
|
2.98
|
2.50
|
3.23
|
|
B4
|
4.70
|
5.10
|
5.10
|
4.96
|
4.22
|
2.98
|
2.50
|
3.23
|
|
B5
|
4.70
|
5.10
|
5.10
|
4.96
|
4.22
|
2.98
|
2.50
|
3.23
|
|
B7
|
4.70
|
5.10
|
5.10
|
4.97
|
4.22
|
2.98
|
2.50
|
3.23
|
|
B8
|
4.69
|
5.09
|
5.09
|
4.96
|
4.21
|
2.97
|
2.49
|
3.23
|
|
NM1
|
4.91
|
5.21
|
5.21
|
5.11
|
4.40
|
3.19
|
2.49
|
3.36
|
|
WSD2
|
4.23
|
4.50
|
4.90
|
4.54
|
4.06
|
3.60
|
3.43
|
3.70
|
|
WSD3
|
4.23
|
4.50
|
4.90
|
4.54
|
4.06
|
3.60
|
3.43
|
3.70
|
|
TS1
|
4.23
|
4.50
|
4.90
|
4.54
|
4.06
|
3.60
|
3.43
|
3.70
|
|
B3
|
4.70
|
5.10
|
5.09
|
4.96
|
4.22
|
2.98
|
2.49
|
3.23
|
|
B6
|
4.70
|
5.10
|
5.10
|
4.97
|
4.22
|
2.98
|
2.50
|
3.23
|
|
C2
|
4.23
|
4.50
|
4.90
|
4.54
|
4.06
|
3.60
|
3.43
|
3.70
|
|
SA1
|
4.70
|
5.10
|
5.10
|
4.96
|
4.22
|
2.98
|
2.50
|
3.23
|
Notes:
(1). S – Surface Layer,
M – Middle Layer; B – Bottom Layer; DA – Depth Averaged.
(2).10 percentiles
DO values in bold and underlined indicates non-compliance with WQOs.
Construction of Piles at Deflection Pier at
North Lantau
5.8.1.4
Pile casing and watertight cofferdam
should be installed at the pier site and seawater trapped inside the casing and
cofferdam should be pumped out to generate a dry working environment prior to
carrying out sediment excavation. During
dewatering of the cofferdam, appropriate desilting or sedimentation device
should be provided on site for treatment before discharge. The Contractor should ensure discharge water
from the sedimentation tank meeting the WPCO / TM-DSS requirements before
discharge.
5.8.1.5
To minimise any adverse water
quality impact during the excavation of sediment, a funnel should be placed at
the top of pile casing during excavation and silt curtains should be deployed
to completely enclose the cofferdam and steel pile casing. Silt curtains should be deployed prior to
setting up piling equipment on barge, installation of cofferdam and pile
casing. Silt curtains should only be
removed after completion of pile caps and piers. The Contractor should be responsible for the
design, installation and maintenance of the silt curtain to minimise the
impacts on water quality. The design and
specification of the silt curtains should be submitted by the Contractor to the
Service Manager for approval. All vessels should be sized such that
adequate clearance is maintained between vessels and the sea bed at all states
of the tide to ensure that undue turbidity is not generated by turbulence from
vessel movement or propeller wash.
Wastewater from General Construction
Activities and Construction Site Run-off
5.8.1.6
Control of potential pollution
of nearby water bodies during the construction phase of the Project should be
achieved by measures to:
·
prevent
or minimise the likelihood of pollutants (generated from construction
activities) being in contact with rainfall or run-off; and
·
abate
pollutants in the stormwater surface run-off prior to the discharge of surface
run-off to the nearby water bodies.
5.8.1.7
These principal objectives
should be achieved by implementation of the BMPs of mitigation measures in
controlling water pollution. The
guidelines for handling and disposal of construction site discharges as
detailed in the ProPECC PN 2/24 should be
followed, where applicable. All effluent
discharged from the construction site should comply with the standards
stipulated in the TM-DSS. The following
measures are recommended to protect water quality of the inland and coastal
waters, and when properly implemented should be sufficient to adequately
control site discharges so as to avoid water quality impacts.
Construction Site Run-off
5.8.1.8
Surface run-off from
construction sites should be discharged into storm drains via adequately
designed sand/silt removal facilities such as sand traps, silt traps and
sedimentation basins. Channels or earth
bunds or sandbag barriers should be provided on site during construction works
to properly direct stormwater to such silt removal facilities. Perimeter channels should be provided on site
boundaries where necessary to intercept storm run-off from outside the site so
that it will not wash across the site.
Catchpits and perimeter channels should be constructed in advance of
site formation works and earthworks.
5.8.1.9
Silt removal facilities,
channels and manholes should be maintained and the deposited silt and grit
should be removed regularly, at the onset of and after each rainstorm to
prevent local flooding. Any practical
options for the diversion and re-alignment of drainage should comply with both
engineering and environmental requirements in order to provide adequate
hydraulic capacity of all drains.
5.8.1.10
Construction works should be
programmed to minimise soil excavation works in rainy seasons (April to
September). If soil excavation cannot be
avoided in these months or at any time of year when rainstorms are likely, for
the purpose of preventing soil erosion, temporary exposed slope surfaces should
be covered e.g., by tarpaulin, and temporary access roads should be protected
by crushed stone or gravel, as excavation proceeds. Intercepting channels should be provided
(e.g., along the crest / edge of excavation) to prevent storm run-off from
washing across exposed soil surfaces.
Arrangements should always be in place in such a way that adequate
surface protection measures can be safely carried out well before the arrival
of a rainstorm.
5.8.1.11
Earthworks final surfaces
should be well compacted and the subsequent permanent work or surface
protection should be carried out immediately after the final surfaces are
formed to prevent erosion caused by rainstorms.
Appropriate drainage like intercepting channels should be provided where
necessary.
5.8.1.12
Measures should be taken to
minimise the ingress of rainwater into trenches. If excavation of trenches in wet seasons is
necessary, they should be dug and backfilled in short sections. Rainwater pumped out from trenches or
foundation excavations should be discharged into storm drains via silt removal
facilities.
5.8.1.13
Open stockpiles of construction
materials (e.g., aggregates, sand and fill material) on sites should be covered
with tarpaulin or similar fabric during rainstorms. Measures should be taken to prevent the
washing away of construction materials, soil, silt or debris into any drainage
system.
5.8.1.14
Manholes (including newly
constructed ones) should always be adequately covered and temporarily sealed so
as to prevent silt, construction materials or debris from getting into the
drainage system, and to prevent storm run-off from getting into foul sewers. Discharge of surface run-off into foul sewers
must always be prevented in order not to unduly overload the foul sewerage
system.
Boring and Drilling Water
5.8.1.15
Water used in ground boring and
drilling for site investigation or rock / soil anchoring should as far as
practicable be re-circulated after sedimentation. When there is a need for final disposal, the
wastewater should be discharged into storm drains via silt removal facilities.
Wheel Washing Water
5.8.1.16
All vehicles and plants should
be cleaned before they leave a construction site to minimise the deposition of
earth, mud, debris on roads. A wheel
washing bay should be provided at every site exit if practicable and wash water
should have sand and silt settled out or removed before discharging into storm
drains. The section of construction road
between the wheel washing bay and the public road should be paved to reduce
soil track-out by vehicles and to prevent site run-off from entering public
road drains.
Rubbish and Litter
5.8.1.17
Good site practices should be
adopted to remove rubbish and litter from construction sites so as to prevent
the rubbish and litter from spreading from the site area. It is recommended to clean the construction
sites on a regular basis.
Acid Cleaning, Etching and Pickling
Wastewater
5.8.1.18
Acidic wastewater generated
from acid cleaning, etching, pickling and similar activities should be
neutralised to within the pH range of 6 to 10 before discharging into foul
sewers.
Effluent Discharge
5.8.1.19
There is a need to apply to EPD
for a discharge licence for discharge of effluent from the construction site
under the WPCO. The discharge quality
must meet the requirements specified in the discharge licence. All the run-off and wastewater generated from
the works areas should be treated so that it satisfies all the standards listed
in the TM-DSS. The beneficial uses of
the treated effluent for other on-site activities such as dust suppression
sprays, wheel washing and general cleaning, etc., can minimise water
consumption and reduce the effluent discharge volume. If monitoring of the treated effluent quality
from the works areas is required during the construction phase of the Project,
the monitoring should be carried out in accordance with the relevant WPCO
licence.
Construction Works Within and in Close
Proximity to Inland Water
5.8.1.20
For construction of bridge piers
within the drainage channel (modified watercourse), all pilling and excavation
works should be fully enclosed by cofferdam / watertight steel casing. Cofferdam and watertight steel casing should
be constructed to isolate the construction activities from the river
water. The detailed design of the
cofferdams and watertight steel casing will be conducted by the Contractor
during the construction phase to fulfil the requirements in DSD Technical
Circular No. 1/2017 “Temporary Flow Diversions and Temporary Works Affecting
Capacity in Stormwater System” for DSD approval in order to formulate feasible
options of these temporary structure.
5.8.1.21
Water pumps should be used to
collect any construction site run-off and ingress/seepage water within the
cofferdam and watertight steel casing.
The collected construction site surface run-off and ingress/seepage water
should be diverted to the on-site wastewater treatment facilities for treatment
to satisfactory levels before discharged.
There is a need to apply to EPD for a discharge licence for discharging
effluent from the construction site under the WPCO. The discharge quality must meet the requirements
specified in the discharge licence and follow the TM-DSS.
5.8.1.22
The precautionary measures /
practices outlined in ETWB TC (Works) No. 5/2005 "Protection of natural
streams / rivers from adverse impacts arising from construction works"
should also be adopted where applicable to minimise the water quality impacts
on any natural streams or surface water systems. Relevant precautionary measures / practices
from the ETWB TC (Works) No. 5/2005 include but not limited to the following:
·
The
use of less or smaller construction plants may be specified in areas close to
the watercourses to reduce the disturbance to the surface water;
·
Construction
works adjacent to watercourses should preferably be carried out during the dry
season where flow in the stream/river is low;
·
Temporary
storage of materials (e.g., equipment, chemicals and fuel) and temporary
stockpile of construction materials should be located well away from any water
courses when carrying out of the construction works;
·
Stockpiling
of construction materials and dusty materials should be covered and located
away from any watercourses;
·
Construction
debris and spoil should be covered up and / or disposed of as soon as possible
to avoid being washed into the nearby water receivers; and
·
Proper
shoring may need to be erected in order to prevent soil or mud from slipping
into the watercourses.
Sewage from Construction Workforce
5.8.1.23
No direct discharge of sewage
to the stormwater drains and inland water will be allowed. Adequate and sufficient portable chemical
toilets should be provided in the works areas to handle sewage from
construction workforce. A licensed
collector should be employed to clean and maintain the chemical toilets on a
regular basis. Notices should be posted at conspicuous locations to remind the
workers not to discharge any sewage or wastewater into the surrounding
environment. Regular environmental audit
of the construction site should be conducted to provide an effective control of
any malpractices and achieve continual improvement of environmental performance
on site.
Accidental Spillage of Chemicals
5.8.1.24
Contractor must register as a
chemical waste producer if chemical wastes would be produced from the
construction activities. The Waste
Disposal Ordinance (Cap. 354) and its subsidiary regulations in particular the
Waste Disposal (Chemical Waste) (General) Regulation, should be observed and
complied with for control of chemical wastes.
The Contractor is also recommended to develop management procedures for
chemicals used and prepare an emergency spillage handling procedure to deal
with chemical spillage in case of accident occurs.
5.8.1.25
Any service shop and
maintenance facilities should be located on hard standings within a bunded
area, and sumps and oil interceptors should be provided. Maintenance of vehicles and equipment
involving activities with potential for leakage and spillage should only be
undertaken within the areas appropriately equipped to control these discharges.
5.8.1.26
Disposal of chemical wastes
should be carried out in compliance with the Waste Disposal Ordinance. The Code of Practice on the Packaging,
Labelling and Storage of Chemical Wastes published under the Waste Disposal Ordinance
details the requirements to deal with chemical wastes. General requirements are given as follows:
·
Suitable
containers should be used to hold the chemical wastes to avoid leakage or
spillage during storage, handling and transport;
·
Chemical
waste containers should be suitably labelled, to notify and warn the personnel
who are handling the wastes, to avoid accidents; and
·
Storage
area should be selected at a safe location on site and adequate space should be
allocated to the storage area.
Wastewater / Sewage Effluent from The Construction Activities and Workforce and The Accidental
Chemical Spillage into The Marine Environment
5.8.1.27
The potential impact associated
with sewage generated by the workforce shall be controlled by the provision of
adequate sanitary facilities such as portable chemical toilets on the marine
vessels. The storage and disposal of chemical waste shall follow the guidelines
stipulated in the Waste Disposal (Chemical Waste) (General) Regulations.
Besides, overflow of filling materials in the barges or hoppers can cause water
pollution during loading or transportation. Good management practice such as
limiting the capacity of a barge to avoid overflow of filling material can
minimise the potential water quality impact.
Tunnelling Works
5.8.1.28
During tunnelling operations,
the Contractor shall adopt appropriate water control measures to the extent
practicable, including the following:
·
Ahead
Probing: The Contractor shall conduct rigorous ground probing ahead of the
tunnel face to identify zones with potential for significant water inflow.
Probe drilling results shall be evaluated to determine the need for
pre-grouting along the tunnel alignment. In areas where discrete, permeable
geological features could lead to substantial inflow, grouting should be
implemented to reduce groundwater ingress.
·
Pre-grouting:
In cases of excessive water inflow, pre-grouting shall be carried out to
minimize inflow into the tunnel. This will be achieved through a systematic and
carefully designed grouting protocol, based on site-specific conditions and
probe drilling data.
·
Grout
Treatment Design: As a general principle, pre-grouting design shall be informed
by data obtained from probe holes drilled ahead of the tunnel face.
·
If
works results in potential groundwater drawdown, it is crucial to ensure that
the engineers/APs are informed of the issue and its potential water quality
impact if not controlled. Due consideration should be made with reference to
prevailing regulations, guidelines and standards (including but not limited to
CEDD’s “General Specification for Civil Engineering Works – Part 5; GEO
publications such as GEO Publication No.1/2023 and Geoguide 2, BD’s PNAPs such
as PNAP No.APP-24, etc.) during site investigation and actual civil works on
groundwater monitoring and control.
5.8.2
Operational Phase
Surface Run-off
5.8.2.1
The ProPECC PN 1/23 “Drainage
Plans subject to Comment by the Environmental Protection Department” provides
guidelines and practices for handling, treatment and disposal of various
effluent discharges to stormwater drains and foul sewers. The design of site drainage should follow the
relevant guidelines and practices as given in the ProPECC PN 1/23.
Design Measures
5.8.2.2
Exposed surface shall be
avoided within the site to minimise soil erosion. The site shall be either hard paved or
covered by landscaping area and plantation where appropriate.
5.8.2.3
The drainage system within the
site should be designed to cater for the run-off from 50 year-return-period
rainstorm.
Devices / Facilities to Control Pollution
5.8.2.4
Screening facilities such as
standard gully grating and trash grille, with spacing which is capable of
screening large substances such as fallen leaves and rubbish should be provided
at the inlet of drainage system.
5.8.2.5
Road gullies with standard
design and silt traps and oil interceptors should be incorporated during the
detailed design to remove particles present in stormwater run-off.
Administrative Measures
5.8.2.6
BMPs for stormwater discharge
and management, as well as good administrative and management measures for
riparian public open spaces as detailed below are recommended for the Project
to mitigate potential adverse water quality impacts.
5.8.2.7
Good management measures such
as regular cleaning and sweeping of road surface / open areas should be
followed. The road surface / open area
cleaning should also be carried out prior to occurrence of rainstorm.
5.8.2.8
Manholes, as well as stormwater
gullies, ditches provided among the development areas should be regularly
inspected and cleaned (e.g., monthly).
Additional inspection and cleansing should be carried out before forecasting
heavy rainfall.
5.9.1.1
The water quality impacts
associated with the construction of the Project would be temporary and
localised. With proper implementation of
the recommended mitigation measures, no unacceptable residual water quality impact
would be anticipated during the construction phase.
5.9.2
Operational Phase
5.9.2.1
As outlined in Section 5.7.3,
no adverse hydrodynamic and water quality impacts are anticipated during the
operation of the Project. Consequently, there will be no adverse residual
impacts associated with the Project's operation.
5.10.2
Operational Phase
5.10.2.1
As no adverse hydrodynamic and
water quality impacts would be anticipated from the Project, no monitoring programme
specific for operational phase of the Project would be required.
5.11.1
Construction Phase
5.11.1.1
During the construction phase,
the sediment plume resulting from dredging is confined to the dredging area,
and no exceedance is anticipated at any of the WSRs. Simulation results indicate that even without
implementing mitigation measures such as silt curtain, the relatively low
sediment release load from dredging is unlikely to cause exceedances at nearby
WSRs.
5.11.1.2
In the scenario involving
reclamation filling activities relatively
high sedimentation rate are projected at the observation point WM4 if no
mitigation measures are implemented. With the deployment of silt curtains, the
sediment plume is further reduced. Furthermore, transient DO depletion
resulting from the Project activities would be minimal. Overall, no adverse
water quality impacts are expected.”
5.11.1.3
The key issues of the
land-based construction work include wastewater generated from general
construction activities, construction site run-off, sewage from construction
workforce, accidental spillage of chemicals and underground water impact
during tunnelling works. The potential
water quality impacts could be mitigated and controlled by implementing the
recommended mitigation measures. Regular
site inspections should be undertaken routinely to inspect the construction
activities and works area to ensure that the recommended mitigation measures
are proper implemented.
5.11.2
Operational Phase
5.11.2.1
Potential hydrodynamic changes resulting from the proposed reclamation have been identified and
evaluated through a computational modelling approach. The hydrodynamic modelling results indicate
that the proposed Project would not significantly alter the local hydrodynamic
regime. Negligible differences were
observed in water level, salinity, flow velocities, flow rates, and flow fields
between the without and with
Project scenarios.
The potential changes in hydrodynamic regime due to the Project can be considered insignificant.