Executive
Summary
The construction works for
the Proposed 132kV Submarine Cable
Route for Airport “A” to Castle Peak Power Station
Cable Circuit (Application No. DIR-143/2006) commenced on 10 November
2007. This is the 4th weekly Environmental Monitoring and Audit
(EM&A) report presenting the EM&A works carried out during the period
from 3 December to 9 December 2007 in accordance with the EM&A Manual.
Summary of Construction Works undertaken during
the Reporting Period
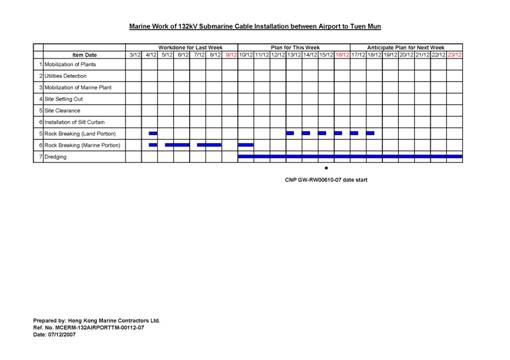
During
the reporting week, at the Tuen Mun landing site, rock breaking operations were
undertaken by both backhoe machine on land and marine rock breaker on board of
the work barge. It should be noted that
there were occasions when rock breaking operation was not undertaken. No marine works involving
dredging and jetting operations were conducted during the reporting period.
Water
Quality
Three
monitoring events were scheduled between 3 December and 9 December 2007. All monitoring events at all designated
monitoring stations were performed on schedule, ie on 3 December, 5 December
and 8 December 2007.
All
measured dissolved oxygen and turbidity levels did not fall below the Action
and Limit (AL) Levels. Suspended
Solids (SS) levels at all monitoring events were below AL Levels during the
reporting week, with the exception of mid-flood monitoring on 3 December 2007.
The
exceedance of Limit Level of depth-averaged SS recorded on 3 December 2007 was considered
to be unrelated to the Project and may be due to the natural fluctuation.
Environmental Non-conformance
One
exceedance of the Limit Level of depth-averaged SS, which was recorded on 3
December 2007, was unlikely to be caused by the Project.
No non-compliance
event was recorded during the reporting week.
No complaint and summons/prosecution was
received during the reporting week.
Future Key Issues
During
the following week (ie 10 December to 16 December 2007), the Project works will
involve rock breaking at the inshore area.
Marine works which involve mainly dredging operation will also be
conducted.
ERM-Hong Kong, Limited (ERM) was appointed
by CLP Power (CLP) as the Environmental Team (ET) to implement the
Environmental Monitoring and Audit (EM&A) programme for the Proposed 132kV Submarine Cable Route
for Airport “A” to Castle Peak Power Station Cable Circuit (thereinafter called
the Project).
1.1
Purpose of the Report
This is the 4th weekly EM&A
report, which summarises the impact monitoring results and audit findings for
the EM&A programme during the reporting period from 3 December to 9 December 2007.
1.2
Structure of the Report
The structure of the report is as follows:
Section 1 : Introduction
Details the
background, purpose and structure of the report.
Section 2 : Project Information
Summarises background and scope of the project,
site description, project organisation and contact details, construction
programme, the construction works undertaken and the status of Environmental
Permits/Licenses during the reporting period.
Section 3 : Environmental Monitoring
Requirement
Summarises
the monitoring parameters, monitoring programmes, monitoring methodologies,
monitoring frequency, monitoring locations, Action and Limit Levels, Event /
Action Plans, environmental mitigation measures as recommended in the EIA
report and relevant environmental requirements.
Section 4 : Implementation Status on
Environmental Mitigation Measures
Summarises
the implementation of environmental protection measures during the reporting
period.
Section 5 : Monitoring Results
Summarises the
monitoring results obtained in the reporting period.
Section 6 : Environmental Non-conformance
Summarises any monitoring exceedance,
environmental complaints and environmental summons within the reporting period.
Section 7 : Future Key Issues
Summarises
the monitoring schedule for the next week.
Section 8 : Review of EM&A Data and
Impact Assessment Predictions
Compares
and contrasts the EM&A data in the reporting period with the impact
assessment predictions and annotates with explanations of discrepancies.
Section 9 : Conclusions
Presents
the key findings of the impact monitoring results.
2.1
Background
CLP
will install a 132 kV submarine cable circuit to connect Castle Peak Power
Station and Hong Kong
International Airport
in order to meet the electricity load growth at the Airport.
The
proposed cable route will start from Tuen Mun and extend southward crossing the
Urmston Road
to the Airport. The cable landing
sites will be located to the west of Butterfly
Beach, Tuen Mun and at
the northern part of the platform of the Airport (see Figure 2.1).
In
September 2006, a Project Profile (PP) for the proposed 132kV Cable Route for
Airport “A” to Castle Peak CCTS (thereinafter called the ‘Project’) was
prepared and submitted to the Environmental Protection Department (EPD) under
the Environmental Impact Assessment
Ordinance (EIAO) for application for Permission to apply directly for
Environmental Permit (EP) (Application No. DIR-143/2006).
An Environmental Permit (EP-267/2007) for
the works was granted on 29 March 2007.
Under the requirements of Condition
2.12 of the EP, an EM&A programme as set out in the Environmental Monitoring and Audit Manual
(EM&A Manual) is required to be implemented. In accordance with the EM&A Manual, impact monitoring of
water quality is required for the Project.
Baseline
Monitoring was conducted between 18 October and 28 October 2007. Through communications with EPD, a silt
curtain at the water intake of the Airport should already be in place during
the baseline monitoring. EPD hence
advised the baseline monitoring (thereinafter called Baseline Environmental Monitoring Part B) for the Airport East
section of works should be postponed until a silt curtain is ready. Accordingly, the baseline monitoring
programme was undertaken for the Tuen Mun part only and is thereinafter called Baseline Environmental Monitoring Part A. Similarly, the Impact Monitoring was
carried out for the Tuen Mun part only.
This report,
therefore, only presents results of the data from monitoring stations around the
Tuen Mun landing site (Figure 2.1). Results of the impact monitoring data
will therefore be compared against the results of the Baseline Environmental
Monitoring Part A.
2.2
Site Description
The
proposed 132kV cable is located in-between Tuen Mun and the Airport and the
alignment is illustrated in Figure 2.1.
2.3
Marine
Construction Works Undertaken during Reporting Week
During
the reporting week, rock breaking operations were undertaken by both backhoe
machine on land and marine rock breaker on board of the work barge at inshore
area of Tuen Mun landing. It should
be noted that there were occasions when rock breaking operation was not
undertaken. No marine works involving
dredging and jetting operations were conducted during the reporting period.
The works programme of the
period between 3 December and 9 December 2007 is presented in Annex A.
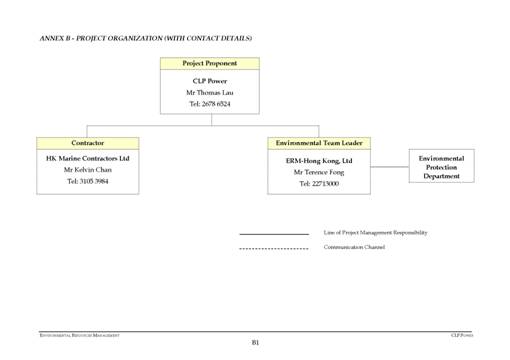
2.4
Project Organisation
The
Project Organisation chart and contact details are shown in Annex B.
2.5
Status of Environmental Approval Documents
A
summary of the relevant permits, licences, notifications and/or reports on
environmental protection for this Project is presented in Table 2.1.
Table
2.1 Summary
of Environmental Licensing, Notification, Permit and Reporting Status
|
Permit / Licence / Notification
/ Report
|
Reference
|
Validity Period
|
Remarks
|
|
EM&A
Manual
|
-
|
Throughout
the construction period
|
submitted
on 25 January 2007
|
|
Environmental
Permit
|
EP-267/2007
|
Throughout
the construction period
|
granted
on 29 March 2007
|
|
Baseline
Environmental Monitoring Report (Part A)
|
-
|
Throughout
the construction period for Tuen Mun Section
|
approved
by EPD on 8 November 2007
|
3.1
Monitoring Locations
In accordance with
the EM&A Manual, prior to the
installation of the cable, water quality sampling was undertaken at stations
situated around the cable laying works area at Tuen Mun. The locations of the sampling stations
are shown in Figure 2.1.
·
C1 and C2 are Control Stations located over 1 km away from the Tuen Mun
landing point and hence are not expected to be influenced by the construction
works due to their remoteness;
·
U1 and D1 are Gradient Stations situated approximately 300 m either side
of the cable alignment for monitoring the effect of dredging at the Tuen Mun
landing point and for identifying the source of impact; and,
·
SR1 is a Sensitive Receiver used to monitor the effect of the
construction works on Butterfly
Beach.
The co-ordinates of
these monitoring stations are listed in Table
3.1.
Table
3.1 Co-ordinates
of Water Quality Monitoring Stations (HK Grid)
|
Station
|
Nature
|
Description
|
Easting
|
Northing
|
|
C1
|
Control
Station
|
>1
km away from the cable alignment
|
814483.53
|
825367.63
|
|
C2
|
Control
Station
|
>1
km away from the cable alignment
|
812890.08
|
824763.40
|
|
U1
|
Impact
Station
|
300
m away from the cable alignment
|
813561.87
|
825446.07
|
|
D1
|
Impact
Station
|
300
m away from the cable alignment
|
813140.26
|
825298.99
|
|
SR1
|
Impact
Station
|
Butterfly
Beach
|
813483.43
|
825681.39
|
It should be noted
that water quality monitoring was undertaken at Tuen Mun only, consisting of
stations C1, C2, U1, D1 and SR1.
The monitoring at the Airport has been postponed until the silt curtains
have been installed for the artificial reef near the Airport.
3.2
Monitoring Parameters and Frequency
The
impact water quality monitoring was conducted in accordance with the requirements
stated in EM&A Manual, which is
presented below.
3.2.1
Monitoring Parameters
Parameters measured in situ were:
·
dissolved oxygen (DO) (% saturation and mg L-1);
·
temperature (°C);
·
turbidity (NTU); and
·
salinity (‰).
The only parameter measured
in the laboratory was:
·
suspended solids (SS) (mgL-1).
In addition to the
water quality parameters, other relevant data were measured and recorded in
field logs, including the location of the sampling stations, water depth, time,
weather conditions, sea conditions, tidal state, special phenomena and work
activities undertaken around the monitoring and works area that may influence
the monitoring results.
3.2.2
Monitoring Frequency
Impact water quality
monitoring was carried out three times a week. The interval between two sets of
monitoring was not less than 36 hours. The monitoring was undertaken at five
locations (three impact monitoring stations D1, U1 and SR1, and two control monitoring
stations C1 and C2), as shown on Figure 2.1. Samples were taken during
mid-flood and mid-ebb tidal state on each sampling occasion.
3.3
Monitoring Equipment and Methodology
3.3.1
Monitoring Equipment
Dissolved Oxygen, Temperature, Salinity, Turbidity
Measuring Equipment
The instrument was a portable, weatherproof
multi-parameter measuring instrument (YSI 6820) complete with cables,
multi-probe sensor, comprehensive operation manuals, and was operable from a DC
power source. It was capable of
measuring:
·
dissolved oxygen levels in the range of 0 – 50 mg L-1; and 0-500%
saturation;
·
temperature of -5 to 50 °C;
·
turbidity levels between 0-1000 NTU (response of the sensor was checked
with certified standard turbidity solutions before the start of measurement);
and,
·
salinity in the range of 0-40 ppt (checked with 30 ppt Salinity
solutions before the start of the measurement).
Water Depth Gauge
The water depth gauge affixed to the bottom of the
water quality monitoring vessel was used.
Current Velocity and Direction
Current velocity and direction was estimated by conducting
float tracking.
Positioning Device
A Global Positioning System (GPS) was used (C-Navigator
World DGPS, GPS 72A) during monitoring to ensure the accurate recording of the
position of the monitoring vessel before taking measurements. The use of DGPS was used for positioning
device, which was well calibrated at appropriate checkpoint.
Water Sampling Equipment
Water samples for suspended solids measurement were
collected by the use of a multi-bottle water sampling system (General Oceanics
Inc., Rosette Sampler ROS02), consisting of PVC bottles of more than two
litres, which could be effectively sealed with cups at both ends. The water sampler had a positive latching
system to keep it open and prevent premature closure until released by a
messenger when the sampler was at the selected water depth.
3.3.2
Monitoring Methodology
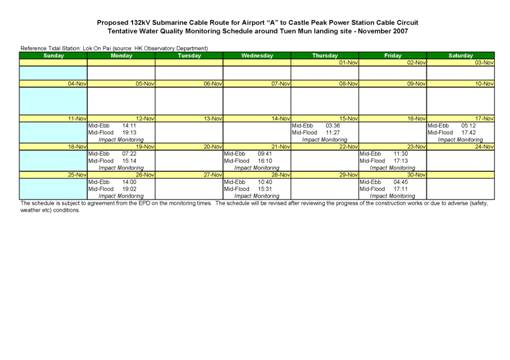
Timing & Frequency
The water quality sampling was undertaken within a
3 hour window of 1.5 hours before and 1.5 hours after mid-flood and mid-ebb
tides. Tidal range for flood and
ebb tides was not less than 0.5m for capturing representative tides.
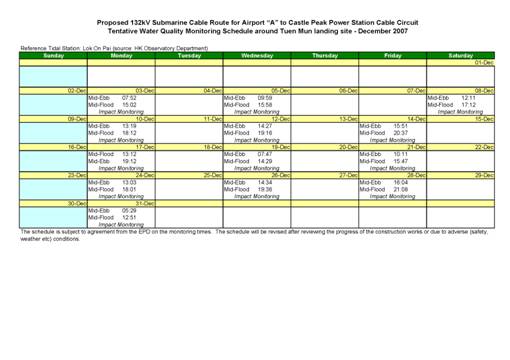
Reference was made to the predicted tides at Lok On
Pai, which is the tidal station nearest to the Project site, published on the
website of Hong Kong Observatory(). Based on the predicted water levels at
Lok On Pai, the impact water quality monitoring was conducted between 3
December and 9 December, following the schedule presented in Annex C.
Duplicate samples were collected from each of the
monitoring events for in situ measurements and laboratory
analysis.
Depths
Each station was sampled and measurements were
taken at three depths, 1 m below the sea surface, mid depth and 1m above the
sea bed. For stations that were
less than 3 m in depth, only the mid depth sample was taken.
Protocols
The multi-parameter measuring instrument (YSI 6820)
was checked and calibrated by an HOKLAS accredited laboratory before use. Onsite calibration was also carried out
to check the responses of sensors and electrodes using certified standard
solutions before each use. Sufficient
stocks of spare parts were maintained for replacements when necessary, and backup
monitoring equipment was made available.
Water samples for SS measurements were collected in
high density polythene bottles, packed in ice (cooled to 4° C without being frozen), and delivered to an HOKLAS
accredited laboratory as soon as possible after collection.
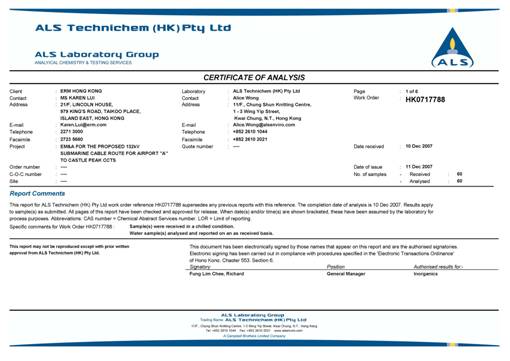
Laboratory Analysis
All laboratory work was carried out by an HOKLAS
accredited laboratory. Water
samples of about 1,000 mL were collected at the monitoring and control stations
for carrying out the laboratory determinations. The determination work started within the
next working day after collection of the water samples. The analyses followed the standard
methods as described in APHA Standard
Methods for the Examination of Water and Wastewater, 19th
Edition, unless otherwise specified (APHA 2540D for SS).
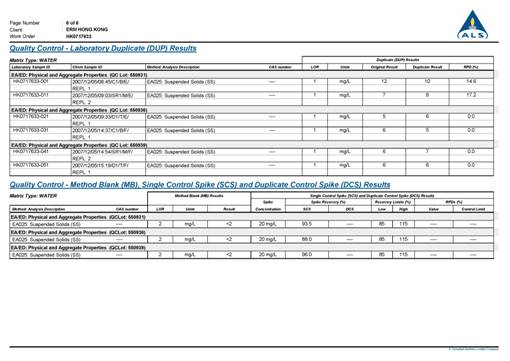
The QA/QC details were in accordance with
requirements of HOKLAS or another internationally accredited scheme (for details
refer to Annex D).
3.3.3
Action and Limit Levels
The Action and Limit levels,
which were established based on the results of Baseline Environmental Monitoring Part A, are presented in Table 3.2.
Table 3.2 Action
and Limit Levels for Water Quality
|
Parameter
|
Unit
|
Tide
|
Depth
|
Action Level
|
Limit Level
|
|
Suspended Solids (SS)
|
mg L-1
|
Mid-Ebb
|
Depth-averaged
|
12.8
|
13.3
|
|
Mid-Flood
|
Depth-averaged
|
23.6
|
28.3
|
|
Dissolved Oxygen (DO)
|
mg L-1
|
Mid-Ebb
|
Surface and Middle
|
5.2
|
4.0
|
|
Bottom
|
5.3
|
2.0
|
|
Mid-Flood
|
Surface and Middle
|
5.5
|
4.0
|
|
Bottom
|
5.5
|
2.0
|
|
Turbidity
|
NTU
|
Mid-Ebb
|
Depth-averaged
|
7.0
|
8.3
|
|
Mid-Flood
|
Depth-averaged
|
14.8
|
18.9
|
3.3.4
Event and Action Plan
The Event and Action Plan
for water quality monitoring which was stipulated in the EM&A Manual is presented in Table
3.3.
Table 3.3 Event and Action Plan for Water
Quality
|
Event
|
Action
|
|
Action
Level Exceedance
|
Step
1 - repeat sampling event;
Step
2 – identify source(s) of impact
and confirm whether exceedance was due to the construction works;
Step
3 – inform EPD and LCSD and
confirm notification of the non-compliance in writing;
Step
4 - discuss with cable
installation contractor the most appropriate method of reducing suspended
solids during cable installation (e.g. reduce cable laying speed/volume of
water used during installation, increase effectiveness of silt curtain).
Step
5 - repeat measurements after
implementation of mitigation for confirmation of compliance.
Step
6 - if non compliance continues -
increase measures in Step 3 and repeat measurements in Step 3. If non compliance occurs a third time,
suspend cable laying operations.
|
|
Limit Level Exceedance
|
Undertake Steps 1-5 immediately, if further non compliance continues at the
Limit Level, suspend cable laying operations until an effective solution is
identified.
|
4.1
Recommended Mitigation Measures
Mitigation measures for
water quality control have been recommended in the Project Profile and the
Environmental Permit. The
Contractor is responsible for the design and implementation of the following
measures.
During cable
laying the following will be undertaken:
·
Although
the sediment loss during both grab dredging and suction dredging is expected to
be quite small, the Contractor will be employing a silt curtain around the
dredgers to reduce the dispersion of sediments from the landing points.
·
Closed
grab dredgers will be used to avoid dispersion of suspended solids into the
sea.
·
The
maximum dredging rate at Tuen Mun shore approach will be limited to 1,500 m3 day-1 for working 10 hours per day, i.e., 150 m3 hr-1.
·
The
maximum dredging rates of grab dredgers and suction method, whichever to be
deployed by the contractor, at the Airport shore approach will be limited to
650 m3 day-1 and 1,600 m3 day-1 for
working 16 hours per day, i.e., 41 m3 hr-1 and 100 m3
hr-1.
·
All
barges used for the transport of dredged materials will be fitted with tight
bottom seals in order to prevent leakage of material during loading and
transport.
·
All
barges will be filled to a level, to ensure that material does not spill over
during loading and transport to the disposal site and that adequate freeboard
is maintained to ensure that the decks are not washed by wave action.
·
The
forward speed of the jetting machine will be limited to a maximum of 80 m hr-1 and
24 hours operation.
4.2
Implementation Status of Mitigation Measures
Since no marine works involving
dredging and jetting operations were carried out during this reporting week,
the mitigation measures as stipulated in the Project Profile and the EP were
not required.
In additional to the
regulatory requirements as mentioned in Section
4.1 above, the Contractor has implemented a precautionary measure for the
works undertaken at the inshore area.
As a precautionary measure, a silt curtain has been installed around the
excavator that operates at low tide each day.
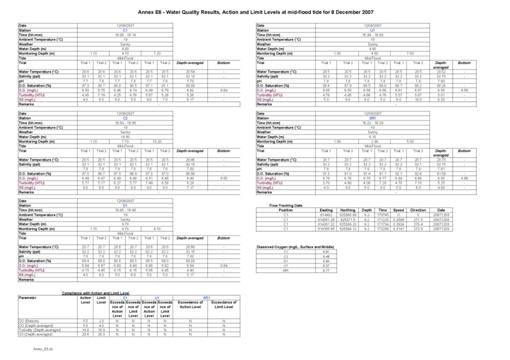
5.1
Impact Monitoring Results
The monitoring data and graphical
presentations are included in Annex E and summarised
below.
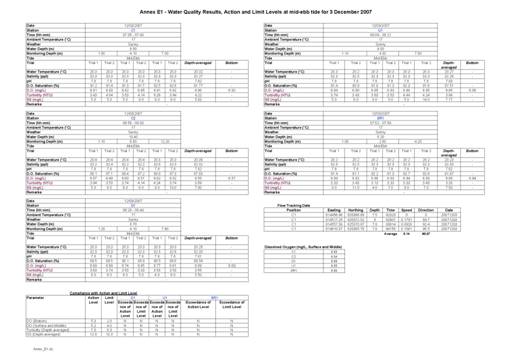
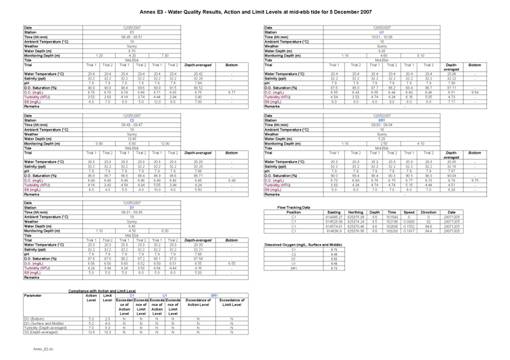
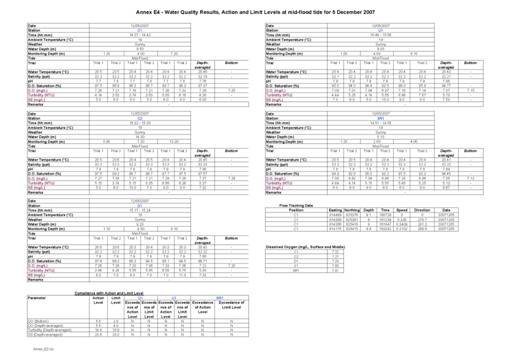
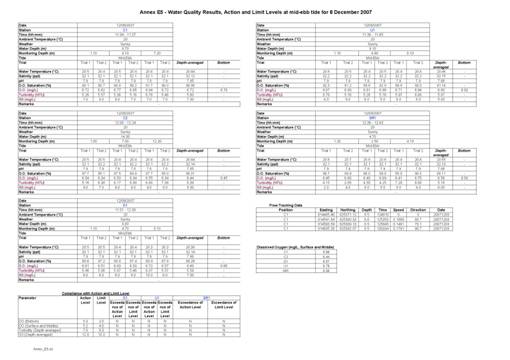
Three monitoring events were
scheduled between 3 December and 9 December 2007. All monitoring at all designated
monitoring stations were performed on schedule, ie on 3 December, 5 December
and 8 December 2007. The monitoring
results are presented in Annexes E1
to E6.
No major activities
influencing the water quality were identified between 3 December and 9 December
2007.
All measured dissolved
oxygen and turbidity levels did not fall below the Action and Limit (AL)
Levels. SS levels at all monitoring
events, with exception of mid-flood monitoring on 3 December 2007, were below AL
Levels during the reporting week (Tables 5.1
& 5.2, and Annex E).
Table 5.1 Action
and Limit Levels for Water Quality and Status of Impacts Stations D1, U1 and
SR1 on the Levels during Mid-ebb Tide
|
Sampling Date/ Parameter
|
Action Level
|
Limit Level
|
Station D1
|
Station U1
|
Station SR1
|
|
Exceedance of Action Level 1
|
Exceedance of Limit Level 1
|
Exceedance of Action Level 1
|
Exceedance of Limit Level 1
|
Exceedance of Action Level 1
|
Exceedance of Limit Level 1
|
|
03/12/2007
|
|
|
|
|
|
|
|
|
|
DO (mg/L) (Bottom)
|
5.3
|
2.0
|
N
|
N
|
N
|
N
|
N
|
N
|
|
DO (mg/L) (Depth-averaged)
|
5.2
|
4.0
|
N
|
N
|
N
|
N
|
N
|
N
|
|
Turbidity (NTU) (Depth-averaged)
|
7.0
|
8.3
|
N
|
N
|
N
|
N
|
N
|
N
|
|
SS (mg/L) (Depth-averaged)
|
12.8
|
13.3
|
N
|
N
|
N
|
N
|
N
|
N
|
|
05/12/2007
|
|
|
|
|
|
|
|
|
|
DO (mg/L) (Bottom)
|
5.3
|
2.0
|
N
|
N
|
N
|
N
|
N
|
N
|
|
DO (mg/L) (Depth-averaged)
|
5.2
|
4.0
|
N
|
N
|
N
|
N
|
N
|
N
|
|
Turbidity (NTU) (Depth-averaged)
|
7.0
|
8.3
|
N
|
N
|
N
|
N
|
N
|
N
|
|
SS (mg/L) (Depth-averaged)
|
12.8
|
13.3
|
N
|
N
|
N
|
N
|
N
|
N
|
|
08/12/2007
|
|
|
|
|
|
|
|
|
|
DO (mg/L) (Bottom)
|
5.3
|
2.0
|
N
|
N
|
N
|
N
|
N
|
N
|
|
DO (mg/L) (Depth-averaged)
|
5.2
|
4.0
|
N
|
N
|
N
|
N
|
N
|
N
|
|
Turbidity (NTU) (Depth-averaged)
|
7.0
|
8.3
|
N
|
N
|
N
|
N
|
N
|
N
|
|
SS (mg/L) (Depth-averaged)
|
12.8
|
13.3
|
N
|
N
|
N
|
N
|
N
|
N
|
|
Notes:
1.
“Y” denotes exceedance of Action/Limit
Level and “N” denotes no exceedances of Action/Limit Level
|
Table 5.2 Action
and Limit Levels for Water Quality and Status of Impacts Stations D1, U1 and
SR1 on the Levels during Mid-flood Tide
|
Sampling Date/ Parameter
|
Action Level
|
Limit Level
|
Station D1
|
Station U1
|
Station SR1
|
|
Exceedance of Action Level 1
|
Exceedance of Limit Level 1
|
Exceedance of Action Level 1
|
Exceedance of Limit Level 1
|
Exceedance of Action Level 1
|
Exceedance of Limit Level 1
|
|
03/12/2007
|
|
|
|
|
|
|
|
|
|
DO (mg/L) (Bottom)
|
5.5
|
2.0
|
N
|
N
|
N
|
N
|
N
|
N
|
|
DO (mg/L) (Depth-averaged)
|
5.5
|
4.0
|
N
|
N
|
N
|
N
|
N
|
N
|
|
Turbidity (NTU) (Depth-averaged)
|
14.8
|
18.9
|
N
|
N
|
N
|
N
|
N
|
N
|
|
SS (mg/L) (Depth-averaged)
|
23.6
|
28.3
|
N
|
N
|
N
|
Y
|
N
|
N
|
|
05/12/2007
|
|
|
|
|
|
|
|
|
|
DO (mg/L) (Bottom)
|
5.5
|
2.0
|
N
|
N
|
N
|
N
|
N
|
N
|
|
DO (mg/L) (Depth-averaged)
|
5.5
|
4.0
|
N
|
N
|
N
|
N
|
N
|
N
|
|
Turbidity (NTU) (Depth-averaged)
|
14.8
|
18.9
|
N
|
N
|
N
|
N
|
N
|
N
|
|
SS (mg/L) (Depth-averaged)
|
23.6
|
28.3
|
N
|
N
|
N
|
N
|
N
|
N
|
|
08/12/2007
|
|
|
|
|
|
|
|
|
|
DO (mg/L) (Bottom)
|
5.5
|
2.0
|
N
|
N
|
N
|
N
|
N
|
N
|
|
DO (mg/L) (Depth-averaged)
|
5.5
|
4.0
|
N
|
N
|
N
|
N
|
N
|
N
|
|
Turbidity (NTU) (Depth-averaged)
|
14.8
|
18.9
|
N
|
N
|
N
|
N
|
N
|
N
|
|
SS (mg/L) (Depth-averaged)
|
23.6
|
28.3
|
N
|
N
|
N
|
N
|
N
|
N
|
|
Notes:
1.
“Y” denotes exceedance of
Action/Limit Level and “N” denotes no exceedances of Action/Limit Levels
|
6.1
Summary of Environmental Exceedance
Exceedance of the Limit Level of depth-averaged SS (mg L-1)
was recorded at Station U1 during mid-flood tide on 3 December 2007 (Figure 6.1, Table 6.1).
Table 6.1 Exceedance of Action
Level of Depth-averaged Suspended Solids (mg L-1)
|
Exceedance
Log No.
|
0072833_03 Dec 07_SS_Stations U1
[Total No. of Exceedances:
1]
|
|
Sampling
date
|
3 December 2007
|
|
Monitoring
station
|
U1
|
|
Action
Levels (mg L-1)
|
Mid-ebb
|
12.8
|
|
Mid-flood
|
23.6
|
|
Limit
Levels (mg L-1)
|
Mid-ebb
|
13.3
|
|
Mid-flood
|
28.3
|
|
Measured
Levels (mg L-1)
|
Mid-ebb
|
7.17
|
|
Mid-flood
|
31.83 (exceeds Limit Level)
|
With reference to the recorded current
direction (271 deg), Stations C1, U1 and SR1 are located upstream of the
Project site while Stations C2 and D1 are located downstream of the Project
site during mid-flood.
The exceedances during mid-flood are
unlikely to be due to the Project, in view of the following:
·
The Contractor confirmed that
there was no works carried out for the Project in the afternoon, ie during
mid-flood.
·
Downstream Stations C2 and D1
recorded lower SS levels than those recorded at upstream Stations U1, C1 and
SR1.
·
Station SR1, which is located
closer to the construction site, recorded lower SS level than that recorded at
Station U1, which is further away from the construction site.
In addition to the above-mentioned reasons,
the laboratory for SS testing has verified the testing results which complied
with QA/QC. The exceedance was
therefore considered likely to be an isolated case and caused by natural
fluctuation.
The exceedance incident was notified to EPD
and LCSD.
6.2
Summary of Environmental Non-compliance
No non-compliance event was recorded during
the reporting period.
6.3
Summary of Environmental Complaint
No complaint was received during the
reporting period.
6.4
Summary of Environmental Summons and Prosecution
No summons or prosecution on environmental
matters was received during the reporting period.
7.1
Key Issues For The Coming Month
During the following week (ie 10 December
to 16 December 2007), the project works will involve rock breaking at the
inshore area. Marine works which
involve mainly dredging operation will also be conducted. The expected construction programme is
enclosed in Annex A.
7.2
Monitoring Schedule For The Coming Months
The tentative schedule of impact water
quality monitoring for November and December is presented in Annex C. The environmental monitoring will be
conducted at the same monitoring locations as those for this reporting week.
Since there were no marine works involving
dredging and jetting operations at the Project site during the reporting week,
it was not necessary to compare the monitoring data with the impact assessment
predictions in the Project Profile.
This Weekly Impact Monitoring Report
presents the EM&A work undertaken during the period from 3 December to 9
December 2007 in accordance with the EM&A Manual and the requirements under
EP-267/2007.
Although exceedances of the Limit Level of SS
were found on 3 December 2007, these were unlikely to be
caused by the Project and may be due to natural fluctuation.
No non-compliance event was recorded during the reporting week.
No complaint and
summons/prosecution was received during the reporting week.
The ET will keep track of the EM&A
programme to ensure compliance of environmental requirements and the proper
implementation of all necessary mitigation measures.