|
|
|
|
|
|
|
Environmental Impact
Assessment
for
Proposed Headquarters and Bus Maintenance Depot
in Chai Wan
|
|
|
|
|
|
|
|
|
|
|
|
|
|
|
|
|
Project Consultancy Team:
Ling Chan + Partners Limited
in association with
CH2M HILL (China) Limited
Wong Pak Lam & Associates Limited
Thomas Anderson & Partners Limited
LLA Consultancy Limited
MDA Hong Kong Limited
Edaw Earthasia Limited
|
|
TABLE OF CONTENTS
1. Introduction
1.1 Project Need
1.2 Project
Design & Technical Assessments
1.3 Objectives
of the Assessment
1.4 Public Inputs
1.5 Structures
of the EIA Report
2. Site
selection HistoRy
2.1 Identification
of Alternative Development Sites
2.2 Selection
of Preferred Site
2.3 Required
Technical Assessments of Selected Site
3. Project
Description and key environmental issues identification
3.1 The Subject
Site and its Environs
3.2 Bus Depot
Design
3.3 Implementation
Programme
3.4 Identification
of Key Environmental Issues
4. Air
Quality Impact Assessment
4.1 Introduction
4.2 Assessment
Criteria
4.3 Air
Sensitive Receivers (ASRs)
4.4 Baseline
Condition
4.5 Construction
Dust Emission Impact Assessment
4.6 Vehicular
Emission Impact Assessment
4.7 Environmental
Monitoring & Audit (EM&A) Requirements
4.8 Assessment
Conclusions
5. Noise
Impact Assessment
5.1 Introduction
5.2 Study Area and Noise Sensitive Receivers (NSRs)
5.3 Construction Noise Impact Assessment
5.4 Operational Fixed Noise Impact Assessment
5.5 Operational Off-site Traffic Noise Impact
Assessment
5.6 Conclusion
6. Waste
Management
6.1 Introduction
6.2 Legislation and Guidelines
6.3 Construction Waste Impacts
6.4 Construction Waste EM&A Requirements
6.5 Operational Phase Waste Impact
6.6 Conclusion
7. Land Contamination Prevention
7.1 Introduction
7.2 Baseline Condition
7.3 Potential Land Contamination Sources
7.4 Land Contamination Preventive Measures
7.5 Conclusion
8. Hazard Impact
8.1 Introduction
8.2 Quantitative
Risk Assessment
8.3 Population
Data
8.4 Meteorology
8.5 Local
Topography
8.6 Ignition
Source
8.7 Hazard Events
8.8 Safety
System and Fire Protection/Fighting System Failure
8.9 Summary
of Frequency of Failure Cases Adopted
8.10 Hazard
Occurrence
8.11 Consequence
of Hazard Occurrence
8.12 Consequence
Analysis
8.13 Risk Summation
8.14 Assessment
Finding and Discussion
8.15 Conclusion
9. Landscape
and Visual Impact Assessment
9.1 Introduction
9.2 Landscape Impact Assessment
9.3 Visual Impact
10. Wastewater
Treatment and Disposal Facilities
10.1 Relevant
Standards and Guidelines
10.2 Wastewater
Treatment and Disposal
11. sUMMARY
OF eNVIRONMENTAL OUTCOMEs
11.1 Introduction
11.2 Environmental Benefits
12. Overall
Conclusion
12.1 Introduction
12.2 Key Environmental Issues
12.3 Air Quality Impact Assessment
12.4 Noise Impact Assessment
12.5 Waste
Management
12.6 Land
Contamination Prevention
12.7 Hazard Impact
12.8 Landscape
and visual impacts
12.9 Wastewater
Treatment and Disposal Facilities
12.10 Overall
Conclusion
LIST OF FIGURES
Figure 1‑1 Location
of proposed Headquarters and Bus Maintenance Depot in Chai Wan. 1-5
Figure 2‑1 Locations
the small patches of undeveloped sites (I, II and III) in A Kung Ngam
Industrial Area. Error! Bookmark not
defined.
Figure 2‑2 Locations
of Sites A, B and C in Chai Wan East Industrial Area. Error!
Bookmark not defined.
Figure 3‑1 Outline Zoning Plan No. S/H20/11 (Extract). Error! Bookmark not
defined.
Figure 3‑2 Proposed Locations of Vehicular
Access and Routing Plan. Error!
Bookmark not defined.
Figure 3‑3 Preliminary Floor Layout Plan –
Ground Floor and Upper Ground Floor Plan. Error!
Bookmark not defined.
Figure 3‑4 Preliminary Floor Layout Plan – First Floor
Plan. Error! Bookmark not
defined.
Figure 3‑5 Preliminary Floor Layout Plan – Second Floor
Plan. Error! Bookmark not
defined.
Figure 3‑6 Preliminary Floor Layout Plan – Third Floor
Plan. Error! Bookmark not
defined.
Figure 3‑7 Preliminary Floor Layout Plan – Fourth &
Fifth Floor Plan. Error!
Bookmark not defined.
Figure 3‑8 Cross Section of the Proposed Headquarters and
Bus Maintenance Depot Development Error!
Bookmark not defined.
Figure 3‑9 Preliminary Construction Programme. Error! Bookmark not
defined.
Figure 3‑10 Air
Quality/ Noise Impact Assessments - Boundary of Study Area. Error! Bookmark not
defined.
Figure 4‑1 Location of the Representative Assessment
Points, Air Quality Impact Assessment Error!
Bookmark not defined.
Figure 4‑2 Mitigated 1-hour TSP Concentrations predicted
at 1.5m above Ground, Construction Dust Impact Assessment Error! Bookmark not
defined.
Figure 4‑3 Mitigated 24-hour TSP Concentrations predicted
at 1.5m above Ground, Construction Dust Impact Assessment Error! Bookmark not
defined.
Figure 4‑4 Cumulative 1-hour NO2 Concentrations
predicted at worst-affected height (10m above ground) resulted from open road
& depots emission. Error!
Bookmark not defined.
Figure 4‑5 Predicted 1-hour CO Concentrations predicted at
worst-affected height (10m above ground) resulted from open road & depots
emission. Error! Bookmark not
defined.
Figure 4‑6 Predicted 24-hour RSP Concentrations predicted
at worst-affected height (10m above ground) resulted from open road &
depots emission. Error! Bookmark not
defined.
Figure 4‑7 Predicted 24-hour NO2
Concentrations predicted at worst-affected height (10m above ground) resulted
from open road & depots emission. Error!
Bookmark not defined.
Figure 5‑1 Locations of Representative
Assessment Points selected for Noise Impact Assessment Error! Bookmark not
defined.
Figure 5‑2 Location
of the 6m high noise barrier recommended during the construction phase at the
western boundary of the site along Shing Tai Road. Error!
Bookmark not defined.
Figure 5‑3 Preliminary
Design of the Temporary Noise Barrier erected at the western site boundary
along Shing Tai Road. Error! Bookmark not
defined.
Figure 5‑4 Location
of the recommended 3m High Solid Vertical Wall on the Roof Level of the Bus
Depot Error! Bookmark not
defined.
Figure 8‑1 The
150m Study Area surrounding the Petrol/LPG Filling Station. Error! Bookmark not
defined.
Figure 8‑2 Layout
of a typical Petrol Cum LPG Filling Station. Error!
Bookmark not defined.
Figure 8‑3 Predicted
Societal Risk in the vicinity of the LPG/Petrol Filling Station. Error! Bookmark not
defined.
Figure 8‑4 Predicted
Individual Risk in the vicinity of the LPG/Petrol Filling Station. Error! Bookmark not
defined.
LIST OF TABLES
Table 2‑1 Nearest Distance of Site B
and C from the nearby Sensitive Receivers
Table 4‑1 Hong Kong Air Quality Objectives
Table 4‑2 Representative Assessment
Points
Table 4‑3 Background Air Pollutant
Levels Adopted in the Assessment
Table 4‑4 Maximum 1-hour TSP
Concentrations predicted at the ASRs
Table 4‑5 24-hour Average TSP
Concentrations predicted at the ASRs
Table 4‑6 Maximum 1-hour TSP
Concentrations predicted at the ASRs
Table 4‑7 24-hour Average TSP
Concentrations predicted at the ASRs
Table 4‑8 Year 2018 Traffic Forecast
during the early Morning Peak Leaving
Table 4‑9 Year 2018 Traffic Forecast
during the Nighttime Peak Return
Table 4‑10 2003 Vehicular Emission Factors
Table 4‑11 Predicted Pollutant
Concentrations from Open Road Vehicular Emission
Table 4‑12 Worst-case Bus Flow entering/ leaving the Depot Building
Table 4‑13 Emission Factor for Buses
inside Depot
Table 4‑14 Bus Depot Air Pollutant
Emission Rates
Table 4‑15 Predicted pollutant
concentrations due to emissions from Citybus Depot and NWFB Depot
Table 4‑16 Cumulative Pollutant
Concentrations from Open Road Traffic Emission & Depots Emission
Table 5‑1 Representative Assessment Points selected for
Noise Impact Assessment
Table 5‑2 Noise Limits for Daytime
Construction Activities
Table 5‑3 PME Inventory for Foundation Construction Works
Table 5‑4 Inventory of PMEs during Sheet Piling and Pile Cap Construction
Table 5‑5 Inventory of PMEs during Superstructure Construction
Table 5‑6
Unmitigated Noise Levels
predicted at the RAPs, Leq(30min.)dB(A)
Table 5‑7 Mitigated Noise Level Predicted at the Representative NSRs (with
silenced PMEs)
Table 5‑8 Predicted Noise Level at the Representative NSRs (with silenced
PME, phasing of activities and reduction in number of PME operating
simultaneously)
Table 5‑9 Mitigated Noise Levels at the RAPs (with silenced PME, phasing of
activities and reduction in number of PME, fixed noise barrier and machinery
enclosures)
Table 5‑10 Area Sensitivity Ratings of NSRs
Table 5‑11 Identified Noise Sources associated with the
Depot Operation
Table 5‑12 Predicted Noise Levels at the NSRs due to Depot
Operation
Table 5‑13 Year 2003 Traffic Forecast
Table 5‑14 Year2018 Traffic Forecast
Table 5‑15 Predicted Noise Levels for the “with bus depot” and “without bus
depot”scenarios during early morning peak hour (0530 to 0630), L10(1-hr)
Table 5‑16 Predicted Noise Levels for the “with bus depot” and “without bus
depot”scenarios during mid-night peak hour (2300 to 0000), L10(1-hr)
Table 5‑17 Predicted Noise Levels for the “with bus depot” and “without bus
depot”scenarios during early morning peak hour (0530 to 0630), L10(1-hr)
Table 5‑18 Predicted Noise Levels for the “with bus depot” and “without bus
depot”scenarios during mid-night peak hour (2300 to 0000), L10(1-hr)
Table 6‑1 Likely Types and Estimated
Quantity of Chemical Wastes to be produced from Depot Operation
Table 8‑1 Safety Valves associated with Pipelines
On-site
Table 8‑2 Design Capacity of the Local Road Carriageways
adopted in the QRA study
Table 8‑3 Most Frequent Wind Speed-Stability Class
Combination
Table 8‑4 Identified Failure case of the LPG
Installation
Table 8‑5 Summary of Spontaneous Failure Cases
and their Frequency of Occurrences
Table 8‑6 Underground Vessel Loading Failure
Cases and their Frequency of Occurrences
Table 8‑7 Underground Vessel Loading Failure
Cases and their Frequency of Occurrences
Table 8‑8 External Event and their Frequency of
Occurrences
Table 8‑9 Failure Rates of Various Safety
Systems
Table 8‑10 Fire Fighting System Failure Cases
and their Frequency of Occurrences
Table 8‑11 Summary of Frequency of
Failure Cases
Table 8‑12 Estimated Failure Rates for
Identified Representative Release Outcomes
Table 8‑13 Release Rate Model Input and Output
Table 8‑14 Hazard Event Outcome for
Representative Release Event
Table 8‑15 Hazard Consequence Outcome Frequency
Table 8‑16 Fatal Radiation Exposure Levels (From Probit)
Table 8‑17 Fireball/BLEVE Model Input and Output
Table 8‑18 Release Rate for Liquid Discharge
Table 8‑19 Jet Flame Model Input and Output
Table 8‑20 Dispersion Model Input and
Output
Table 8‑21 Events contributed to PLL
Table 9‑1 Summary of the Implementation for the
Transplanting Works
Table 11‑1 Environmentally Sensitive Areas and Population
Protected
LIST OF APPENDICES
Appendix 1-1 EIA Study Brief
Appendix 4-1 Worksheet showing Calculation of Dust Emission
Rates, Construction Dust Impact Assessment
Appendix 4-2 A typical FDM result file, Construction Dust
Impact Assessment
Appendix 4-3 Locations of the Existing and Committed Road
Carriageways near to the Proposed Bus Depot
Appendix 4-4 Typical CALINE4 result files, Vehicular Emission
Impact Assessment
Appendix 4-5 Spreadsheet showing the Calculation of Depot
Pollutant Emission Rates
Appendix 4-6 Typical ISCST3
Result Files, Depot Pollutant Emission (NO2,
CO, RSP)
Appendix 5-1 Typical
Calculation Worksheet – Unmitigated Scenario, Construction Noise Impact
Assessment (1, 2, 3,
4, 5,
6, 7,
8, 9,
10, 11, 12)
Appendix 5-2 Typical
Calculation Worksheet – Mitigated Scenario 1, Construction Noise Impact
Assessment (1, 2, 3,
4, 5,
6, 7,
8, 9,
10, 11, 12)
Appendix 5-3 Typical
Calculation Worksheet – Mitigated Scenario 2, Construction Noise Impact
Assessment (1, 2, 3,
4, 5,
6, 7,
8)
Appendix 5-4 Typical
Calculation Worksheet – Mitigated Scenario 3, Construction Noise Impact
Assessment (1, 2, 3,
4, 5,
6)
Appendix 5-5 Typical
Calculation Worksheet, Depot Noise Impact Assessment (1, 2,
3, 4,
5, 6,
7)
Appendix 5-6 Traffic Forecast
Endorsement (1, 2, 3)
Appendix 5-7 Detailed Traffic
Noise Modelling Results (1, 2, 3,
4, 5,
6,7,
8, 9,
10, 11, 12,
13, 14, 15,
16)
Appendix 8-1 Fault Tree Analysis
Appendix 8-2 Event Tree Analysis
Appendix 9-2 Drawings showing
the landscape proposal and design concept to avoid potential visual impact (1, 2, 3, 4, 5, 6, 7)
1.
Introduction
1.1
Project Need
1.1.1
Citybus Limited (Citybus) is one of the major bus services
operators in Hong Kong. To date, it
still does not have its own permanent bus depot. The reliance of the company’s
engineering and maintenance services on temporary depots build on short term
tenancy sites that need to be demolished after temporary use has proven over
the past years not to be a preferable practice. The need to decommission the temporary depot at Aldrich Bay in
near future will create an immediate problem for the company. It would be difficult for Citybus to
maintain its quality bus services to the Hong Kong public in the lack of stable
engineering and maintenance facilities.
1.1.2
Citybus currently operates about 90 routes with a fleet of
about 790 buses on the Hong Kong Island.
While over 400 buses are serving routes in Southern District, some 300
buses are for routes running in the Eastern and Central Districts. Besides, around 50 buses are running on
cross-harbour routes. The daily
servicing of these buses requires depot facilities for refueling, maintenance,
repairing, washing, coin collection and transfer of octopus databank data, etc.
1.1.3
Buses running in the Southern District are currently served by
the bus depot at Ap Lei Chau. A
permanent depot facility is needed in the Eastern District to serve the other
bus routes running on the Hong Kong Island.
With consideration of alternative sites as described in details in
Section 2, a suitable development site of sufficient size was selected with the
relevant Government departments for construction of the proposed bus
depot.
1.1.4
A Traffic Impact Assessment (TIA) was conducted for the
proposed bus depot and approved by the Authority. The TIA study assessed the potential traffic impact of the
proposed bus depot on the adjacent road networks in terms of junction capacity
and bus queue length. Traffic
generation from other future developments, including the New World First Bus
(NWFB) Permanent Depot, was taken into account in the TIA study. The Final TIA Report was accepted by
Transport Department in May 2001.
1.2
Project Design & Technical Assessments
1.2.1
A consultancy team led by Ling Chan + Partners Limited (LCP)
was commissioned by Citybus in December 2000 to study the architectural design
and engineering requirements of the proposed development. CH2M HILL (China)
Limited (formerly known as EHS Consultants Limited) has been commissioned by
Citybus as a sub-consultant of LCP to carry out an EIA Study for the proposed
bus depot development. Issues on
Landscape and Visual Impacts were addressed by EDAW Earthasia Ltd. (EDAW) and
LCP.
1.2.2
Architectural, engineering and traffic design of the
development were developed by LCP, Wong Pak Lam & Associates Ltd. (WPL),
Thomas Anderson & Partners Ltd. (TAP), LLA Consultancy Ltd. (LLA), EDAW and
MDA Hong Kong Ltd. through a series of design co-ordination meetings with
Citybus. The team also provided input
to the EIA study in the relevant areas of their expertise. Inputs on the traffic forecast aspect and
engineering in the EIA study were provide by LLA, WPL and TAP.
1.2.3
According to Part 1 Schedule 2 Section A.6(Roads, railways and
depot) of the EIA Ordinance (EIAO), a transport depot located in less than 200m
from the nearest boundary of an existing or planned residential area and educational
institution is classified as a Designated Project. As the closest distance between the proposed bus depot and the
Hong Kong Institute of Vocational Education (Chai Wan) and Tsui Wan Estate is
about 80m and 165m respectively, the project is classified as a Designated
Project. An Environmental Permit issued
by the Director of Environmental Protection (DEP) is required prior to the
construction and operation of the proposed bus depot.
1.2.4
An application (No: ESB-065/2001) for an Environmental Impact
Assessment (EIA) Study Brief under Section 5(1) of the EIAO was submitted to
DEP on 19th January 2001 with a Project Profile. A Study Brief {No.
ESB-065/2001} was issued by the Authority to the applicant (Citybus) under
Section 5(7)(a) of the EIAO on 5th March 2001 for the preparation of
the EIA report. Appendix 1-1 presents
the EIA Study Brief.
1.2.5
This EIA report is prepared in accordance with the
requirements stated in the Study Brief. An Environmental Permit will only be
issued by DEP for the construction and operational of the project after the
approval of the EIA Report.
1.3
Objectives of the Assessment
1.3.1
The main objective of this EIA study is to provide information
on the nature and extent of the potential environmental impacts arising from
the construction and operation of the proposed bus depot and related activities
taking place concurrently. The study will provide information for DEP’s
decisions on:
(i)
the
overall acceptability of any adverse environmental consequences that are likely
to arise as a result of the proposed project;
(ii)
the
conditions and requirements for the detailed design, construction and operation
of the proposed project to mitigate adverse environmental consequences wherever
practicable; and
(iii)
the
acceptability of residual impacts after the proposed mitigation measures are
implemented.
1.3.2
The objectives of this EIA study, as stated in Section 2.1 of
the Study Brief, are as follows:
(i)
to
describe the proposed project and associated works together with the
requirements for carrying out the proposed project;
(ii)
to
consider alternative site(s) and to compare the environmental benefits and
dis-benefits of each of the site in selecting a preferred site;
(iii)
to
identify and describe the elements of the community and environment likely to
be affected by the proposed project, including both the natural and man-made
environment;
(iv)
to
identify and quantify emission sources and determine the significance of
impacts on sensitive receivers and potential affected uses;
(v)
to
propose the provision of mitigation measures so as to minimize pollution,
environmental disturbance and nuisance during construction and operation of the
project;
(vi)
to
identify, predict and evaluate the residual (i.e. after practicable mitigation)
environmental impacts and the cumulative effects expected to arise during the
construction and operational phases of the project in relation to the sensitive
receivers and potential affected uses;
(vii)
to
identify, assess and specify methods, measures and standards, to be included in
the detailed design, construction and operation of the project which are
necessary to mitigate environmental impacts and to reduce them to acceptable
levels;
(viii)
to
investigate the extent of the secondary environmental impacts that may arise
from the proposed mitigation measures and to identify the constraints
associated with the mitigation measures recommended in the EIA study as well as
the provision of any necessary modification; and
(ix)
to
design and specify the environmental monitoring and audit requirements, if
required, to ensure the implementation and the effectiveness of the
environmental protection and pollution control measures adopted.
1.4
Public Inputs
1.4.1 During
the public inspection period of the Project Profile, public inputs and comments
were received on the project under the EIA Process. The key concerns of some members of the Eastern District Board
received were discussed during the Board meeting on 12 February 2001. The key environmental issues of interest in
relation to the EIA study are summarized below:
·
Potential
air quality impact on nearby sensitive receivers, including Tsui Wan Estate
during the operational phase;
·
Potential
traffic noise impact on Heng Fa Chuen, Tsui Wan Estate and Yue Wan Estate from
bus movement on the road carriageways in the vicinity of the bus depot,
especially traffic noise from Wing Tai Road;
·
Potential
water quality impact on the cargo handling basin;
·
Wastewater
and waste management (including chemical waste) during the operational phase;
·
Potential
cumulative environmental impact from the operation of two bus depots and other
future developments in the area; and
·
Members
agree with the project proponent that a permanent bus depot is needed but
consider that the possibility to locate the bus depot at other district should
be considered.
1.4.2 Potential
concern on these environmental factors has been taken into account in the
study.
1.5
Structures of the EIA Report
1.5.1
This section describes the background, project needs, and
objectives of the EIA study. The site
selection history is described in Section 2.
Design of the proposed development and the identified key environmental
issues are described in Section 3.
Sections 4 to 10 focus on each of the key environmental aspects, and
present the assessment criteria, approach/ methodologies, findings, and
recommended mitigation measures, if necessary. Section 11 presents a summary of
environmental outcomes and the overall conclusion of the EIA study.
1.5.2
The content in Sections 2 through 11 are listed below:
· Section 2 Site Selection History
– describes the site selection process that has gone through with the relevant
Government departments in identifying the subject site for the bus depot
development;
· Section 3 Project Description and
Key Environmental Issues Identification – the subject site and its
environs, preliminary design of the bus depot, the planned implementation
programme, and the key environmental issues identified are described under this
section;
· Section 4 Air Quality Impact
Assessment – presents the construction phase air quality impact assessment,
and operational phase vehicular emission impact assessment;
· Section 5 Noise Impact Assessment
– presents the construction noise impact assessment, traffic noise impact
assessment and industrial noise impact assessment for the operational phase;
· Section 6 Waste Management
Implications – presents an analysis of waste generation and proposes
management measures for the key waste types during the construction and
operational phases of the project;
· Section 7 Land Contamination
Prevention – describes possible sources of contamination arising from the
future operation of the bus depot, appropriate operational practices, waste
management strategies and precautionary measures;
· Section 8 LPG/ Petrol Filling
Station Hazard Impact – assesses the potential hazard from the
operation of the future LPG/ petrol filling station located to the north of the
site on the proposed bus depot;
· Section 9 Landscape and Visual
Impacts – describes the landscape mitigation proposal and present the
preliminary design of the bus depot building to achieve visual compatibility
with its environmental context and avoid visual impact;
· Section 10 Sewage Treatment and
Disposal Facilities – describes the design measures to ensure proper sewage
treatment and disposal;
· Section 11 Summary of
Environmental Outcomes;
· Section 12 Overall Conclusion
2.
Site selection HistoRy
2.1
Identification of Alternative Development Sites
2.1.1
For maintaining of a quality service on the Hong Kong Island,
provision of a permanent bus depot in the Eastern District for the refueling,
maintenance and washing of Citybus’ buses running in the Eastern and Central
Districts is needed. The need to
decommission the temporary depot at Aldrich Bay, which is not zoned for
industrial use, aggregated the problem.
Citybus started the dialogue with the relevant Government departments in
early 2000 to express the urgent need for a permanent depot.
2.1.2
Citybus currently operates about 90 routes with a fleet of
about 790 buses on Hong Kong Island.
While over 400 buses are serving routes in Southern District, some 300
buses are for routes running in the Eastern and Central Districts. Besides, around 50 buses are running on
cross-harbour routes. The daily
servicing of these buses requires depot facilities for refueling, maintenance,
repairing, washing, coin collection and transfer of octopus databank data, etc.
2.1.3
Operationally, Citybus needs two permanent bus depots. Location-wise, it would be more efficient
and environmental friendly to have one depot in the Eastern District and
another in the Southern District. As a
significant portion of buses are heading towards the Central District from
Eastern District when the bus service commences early in the morning, and
returning from Central District to Eastern District for parking, establishment
of a bus depot in the Eastern District will minimize the travelled routes,
distance and time between the bus depot and the various bus terminuses. The establishment of a new bus depot in
other districts may affect Citybus’ existing operation in serving the
public. The operational needs of the buses
running in the Southern District are currently met by the depot facility at Ap
Lei Chau. A permanent depot facility in
the Eastern District is in demand after the decommissioning of the temporary
bus depot in Aldrich Bay.
2.1.4
Taking into consideration the operational requirements of the
multi-storey bus depot in terms of the driveway and ramp system with 15-m
turning radius, and areas required for bus parking, maintenance bays, sunken
pits, workshops, storage areas, staff changing rooms, etc., the minimum size of
the site needed for the construction of a multi-storey bus depot was identified
to be about 1ha.
2.1.5
Bus depots are preferably to be located within industrial
areas to ensure that the landuses in its proximity are compatible. Industrial area in the Eastern District is,
however, extremely rare. During the
site selection process, Planning Department (PlanD) advised that in the Eastern
District, undeveloped industrial areas were only available in Chai Wan East
Industrial Area and A Kung Ngam Industrial Area in Shau Kei
Wan.
2.1.6
Most industrial sites in A Kung Ngam have already been
developed, leaving only three small separate and unformed sites with a site
area of about 920m2, 1800m2 and 1900m2. Figure 2-1 presents the locations of these
separate and undeveloped industrial sites (I, II and III) as shown in the Draft
Shau Kei Wan Outline Zoning Plan (No. S/H9/10).
2.1.7
These unformed industrial sites in A Kung Ngam are too small
for the construction of the proposed multi-storey bus depot. Even the total
area of these undeveloped sites is only about 4,600m2 which cannot
meet the minimum site area required for the design and construction of the bus
depot. Besides, development of the bus
depot on these sites will require resumption of private properties which may not
be feasible.
2.1.8
The existing China Motor Bus (CMB) depot located at Chai Wan
Road will be rented by Citybus for temporary use after decommissioning of its
existing temporary bus depot at Aldrich Bay until the planned completion of the
new depot in mid 2003. The CMB depot
site has been rezoned as a Comprehensive Development Area (CDA) for
redevelopment. Further use of the site
as a bus depot is therefore not preferable.
Besides, there are numerous existing residential buildings located in
close proximity to the existing bus depot at Chai Wan Road. Longer-term use of the site as a permanent
bus depot is not a preferred option from an environmental viewpoint given the
close proximity of the existing bus depot to the nearby sensitive receivers.
2.1.9
The site selection process confirmed that there are no
available industrial sites in the Eastern District other than the industrial
sites in Chai Wan East Industrial Area.
2.1.10
A 0.78 hectare site located to the immediate south of New
World First Bus Depot was initially identified for consideration. The site was
rejected as the site area involved cannot satisfy the minimum site area
requirement for a multi-storey bus depot.
Figure 2-2 shows the location of the site (Site A).
2.2
Selection of Preferred Site
2.2.1
Two candidate sites, Site B and Site C, located within the
Chai Wan East Industrial Area were identified and considered with the
Government departments during the site selection process. Both sites have a similar site area of approximately
1 ha. It was identified that these were
the only available sites within the industrial area that could meet the site
area requirement of the bus depot.
Figure 2-2 shows the locations of these alternative sites – B and C in
the Draft Chai Wan Outline Zoning Plan (OZP) No. S/H20/11 (Extract). The environmental benefits and dis-benefits
of these alternative sites have been considered and compared in the selection
of the preferred site in order to avoid potential environmental impact.
2.2.2
The key environmental factors that would have bearing on the
location of the bus depot include air quality and noise associated with the
operation of the bus depot. Site C, the
selected site, is preferred from an environmental viewpoint as it is located
further away from the nearby sensitive receivers of interest. Table
2‑1 presents a comparison of the nearest distance from
the nearby sensitive receivers for the two alternative sites.
Table
2‑1 Nearest
Distance of Site B and C from the nearby Sensitive Receivers
|
Location
|
Approximate Nearest Separation (m)
|
|
|
Site B
|
Site C
|
|
Heng Fa Chuen
|
115
|
390
|
|
Staff Quarters of
Hong Kong Institute of Vocational Education (IVE) (Chai Wan)
|
110
|
135
|
|
IVE (Chai Wan)
|
130
|
80
|
|
Tsui Wan Estate
|
490
|
165
|
2.2.3
It can be noted that the distance separation between the
nearest residential blocks from the bus depot is greater for Site C than for
Site B. Comparing the relative distance
of Site B and Site C from the residential blocks, Site C was identified to be
the preferred site in terms of avoiding potential environmental effects on air
quality and noise associated with the operation of the bus depot.
2.2.4
Although the Hong Kong Institute of Vocational Education (IVE)
(Chai Wan) is located closer to Site C, it is not expected to be in operation
during the hours in the early morning and near mid-night when the bus depot
would be most active.
2.2.5
In addition, it can be noted that Site C is more directly
linked to Island Eastern Corridor, Shun Tai Road, Sheung On Street when
compared with Site B. Traveling distance on Shing Tai Road and the new roads
within the Industrial Area and the associated vehicular emission can be reduced
for buses heading towards Shau Kei Wan or Siu Sai Wan directions for site C
than for Site B.
2.3
Required Technical Assessments of Selected Site
2.3.1
The selection of Site C was a Government departmental
agreement taking into account, as illustrated above, the requirements on site
area of the bus depot, availability of industrial sites in the Eastern District,
the urgent programme of the project, and landuse compatibility including the
environmental factors.
2.3.2
At the Hong Kong District Planning Conference in mid-June
2000, the site C, bounded by the future local road 20/4 to the East and Shing
Tai Road to the West, was selected and agreed in-principle by the Government
departments to be a suitable site for Citybus to further study the design of
its permanent bus depot proposal.
Citybus was required to conduct a Traffic Impact Assessment (TIA) and an
Environmental Impact Assessment (EIA) to assess and confirm the technical
feasibility of the project at the subject site.
2.3.3
The Final TIA conducted by Citybus’ Traffic Consultant
approved by TD in May 2001 confirms the acceptability of the site for the
development of the bus depot from a traffic point-of-view. Traffic generation from other future
developments in the area, including the New World First Bus (NWFB) bus depot
has been taken into account in the TIA study. The findings of this EIA Study
will confirm the environmental acceptability of the project. Potential cumulative environmental impact
has been assessed as appropriate in accordance with the requirements and
methodologies presented in the Technical Memorandum on EIA Process (EIAO-TM).
Mitigation and/or control measures have been identified and recommended where
necessary.
3.
Project Description and key
environmental issues identification
3.1
The Subject Site and its
Environs
3.1.1
The
proposed bus depot is planned to be constructed on an approximately 1 hectare site
located in the Chai Wan East Industrial Area.
The site selection process is described in Section 2. Figure 1-1 shows the location of the site.
3.1.2
A
major portion of the site is currently unoccupied. Highways Department (HyD) is temporarily occupying a southern
portion of the site for a work area until June 2001. A small area at the northern part of the site falls within the
boundary of the NWFB temporary bus depot.
Located at a minimum distance of about 80m to the North-west of the
future bus depot is Hong Kong Institute of Vocational Education (IVE) (Chai
Wan). Lying between the college and the
bus depot site are the MTR railway tracks leading to the Chai Wan Station to
the south and Shing Tai Road. To the immediate North of IVE is its associated
Staff Quarters. Tsui Wan Estate is
situated at more than 165m to the South-west of the site. The nearest residential blocks at Heng Fa
Chuen is located at approximately 390m to the north of the site.
3.1.3
The
site was reclaimed and is zoned for industrial use (“I”) similar to some other
landuses in its vicinity as shown in the latest Draft Outline Zoning Plan (OZP)
No. S/H20/11 gazetted on 20 April 2001.
According to the Notes of the OZP, “Bus Depot” is a column 1 use that no
planning permission from the Town Planning Board is required. Figure 3-1 presents an Extract of the OZP.
Planning Department (PlanD) has advised that in addition to the proposed
bus depot, the Chai Wan East Industrial Area is also planned to accommodate an
Open Space, a Joint Government Departmental Depot, Lorry Park & Motor
Vehicle Repair Workshop, New World First Bus Depot, LPG/ Petrol Filling Station
and Hong Kong Post Super Centre.
3.1.4
The
northern side of the site is planned by the Government for the provision of a
LPG/ petrol filling station, while the Southern side of the site would be the
HK Post Supercentre. At this stage,
only the NWFB depot situated near Chong Fu Road and located at about 135m from
the proposed bus depot is under active construction. The NWFB depot is expected to be completed by year 2002. All other proposed developments in the area
are still at a planning stage without a concrete development programme.
3.1.5
The
proposed Citybus depot will be bound by a future local road – Road 20/4 to the
East and Shing Tai Road to the west.
Other future new roads in the Chai Wan East Industrial Area include Road
20/6 and Road 20/10 as shown in Figure 1-1.
Highways Department (HyD) has advised that the three new roads – 20/4,
20/6 and 20/10 would be completed in December 2002.
3.1.6
The planned
bus routing plan agreed with TD is illustrated in Figure 3-2.The ingress point of the bus depot is planned at Road 20/4, which
is a local road lying away from nearby sensitive receivers. Buses approaching
the depot from Island Eastern Corridor (IEC) will travel via Shing Tai Road
northbound, Road 20/6 and Road 20/4.
There will only be one egress point each located at Shing Tai Road and
Road 20/4 respectively. The egress point
on Shing Tai Road will serve IEC bound buses which will go via Shing Tai Road
southbound and Shun Tai Road. Buses leaving or returning to the depot will not
pass through the section of Shing Tai Road further north of the site leading to
Heng Fa Chuen.
3.1.7
The
20/4 Road egress point is planned for Siu Sai Wan bound buses. It is understood that Wing Tai Road
currently carries high traffic flows during the peak hours. To avoid potential traffic noise impact
attributed to the operation of the proposed bus depot, as agreed with the
Authority, buses commuting between the bus depot and Siu Sai Wan area will be
required to take the route through the future Sheung On Street Extension
(connecting the existing Sheung On Street with the future Road 20/4) under
normal operating conditions (i.e. except for emergency conditions), instead of
allowed to use Wing Tai Road and Shing Tai Road at all time periods. Citybus will require its employees to
strictly follow this requirement when entering/ leaving the bus depot.
3.2
Bus Depot Design
3.2.1
The
proposed bus depot will be constructed in form of a low-rise building occupying
a site area of approximately 1 hectare.
The development will provide spaces for bus parking, maintenance and
office areas. Architectural design of
the development has been developed by the Project Architect – LCP, with input
on the engineering, traffic and environmental aspects provided by the
sub-consultants.
3.2.2
Figures
3-3 to 3-7 present the preliminary ground to fifth floor layout plans of the
bus depot. A cross section of the
building is shown in Figure 3-8.
The bus depot will consist of three stories located at ground floor
(G/F), first floor (1/F) and roof floor (3/F).
As shown on the preliminary plans, the G/F will house approximately 2
refuelling bays, 2 washing bays, 29 sunken pits, 4 brake testers and 5
maintenance bays. The 1/F will provide some 46 maintenance bays for annual
maintenance works. The 3/F (roof) floor will provide about 100 bus parking
areas. The fourth floor (4/F) and fifth
floor (5/F) that will be built at the southern portion of the site only will be
used for office areas. The upper ground
floor (U/G) and second floor (2/F) is a mezzanine floor provided at the
southern part of the site near Road 20/4.
Spare parts storage areas, chemical storage areas and scrap yards/ waste
material stores will be provided on the G/F and 1/F. Taking into account the interface with the future developments
located in its immediate proximity, including the LPG/ Petrol Filling Station
and the Hong Kong Post Super Centre, the northern and southern sides of the bus
depot building are planned to be constructed with a solid concrete facade.
3.2.3
At the
ingress point at Road 20/4, the incoming buses will enter bays 1 and 2 for
refuelling, coin collection, transfer of octopus data to databank, and vehicle
washing. The whole process of the refuelling/ servicing and washing would
normally take about 3 to 5 minutes. If
maintenance is required, the buses will drive into one of the maintenance bays
or sunken pits.
3.2.4
To
facilitate the buses entering directly to the maintenance area, a passing lane
will be provided in parallel to the refuelling/ washing bay lanes. The provision of a passing lane will also
help to avoid the generation of a long queue length of buses waiting to be
serviced and the associated potential traffic impact. The holding area within the bus depot was assessed to be
sufficient to accommodate the bus queue, as confirmed in the approved TIA.
3.2.5
After
the completion of washing procedure, buses will leave the depot for further
servicing, or returning to parking areas located on 3/F of the bus depot or
off-site. On the 1/F, normally a bus under annual maintenance check will have
to station in a maintenance bay for about 5 to 7 days. Bus movements on the 1/F will therefore be
very limited.
3.2.6
The
number of staff working in the bus depot/ maintenance area and offices is
estimated to be about 319 and 201 respectively during daytime (approx. 08:00 to
18:00). In the evening and night-time
(approx. 18:00 to 08:00), some 50 workers are expected to be working at the bus
depot.
3.3
Implementation Programme
3.3.1
Construction works are planned to start near end of 2001 to
meet the urgent demand to have the depot ready for operation in mid-2003. Figure 3-9 shows a preliminary construction
programme. The development is expected
to be completed in mid-2003.
3.4
Identification
of Key Environmental Issues
3.4.1 The
key environmental issues during the construction and operational phases of the
proposed development are identified to include the following:
During
the Construction Phase
·
Potential
construction dust impact on the nearby air sensitive receivers;
·
Potential
construction noise impact from construction activities;
·
Construction
waste management and implications
During
the Operational Phase
·
Potential
vehicular emission impact from buses moving within the depot and running at the
adjacent roads;
·
Potential
traffic noise impact from buses running on the road carriageways in the
vicinity of the depot;
·
Potential
fixed noise impact generated from activities at the bus depot;
·
Undertaking
of land contamination preventive measures;
·
Proper
chemical waste management;
·
Provision
of sewage treatment and disposal
3.4.2 The
EIA Study Brief requires in general a study area of 300m and 500m from the
boundary of the project site with respect to air quality impact assessment and
noise impact assessment, respectively.
Figure 2-10 shows the study area boundary for air quality and noise
impact assessments.
3.4.3 In
addition to the above key environmental issues, the EIA Study Brief requires an
evaluation on the potential hazard impact arising from the operation of the
future LPG/ Petrol Filling Station located on the northern side of the site
(Section 8), Landscape and Visual Impacts associated with the implementation of
the project (Section 9), and an illustration on the Sewage Treatment and
Disposal Facilities (Section 10).
4.
Air Quality Impact Assessment
4.1
Introduction
4.1.1
This section assesses the potential air quality impact
associated with the construction and operational phase of the proposed bus
depot. Air sensitive receivers (ASRs) have been identified and worst case
impact on these receivers have been assessed quantitatively.
4.1.2
Dust generation from construction activities is identified to
be of key interest during construction phase of the project. During the operational phase, vehicular emission
from buses running within the bus depot and on the adjacent roads is the key
focus of the study.
4.1.3
The assessment covers a study area of 500m from the
development site boundary in accordance with the requirements of the EIA Study
Brief.
4.2
Assessment Criteria
4.2.1
The principal legislation regulating air quality in Hong Kong
is the Air Pollution Control Ordinance (APCO) (Cap. 311). Air Quality Objectives (AQOs) are set for
the whole territory which specify statutory concentration limits for various
criteria pollutants and the maximum numbers of times allowed to exceed over a
specified period of time. The AQOs for
Carbon Monoxide (CO), Nitrogen Dioxide (NO2), Total Suspended
Particulates (TSP) and Respirable Suspended Particulates (RSP), which are
relevant to the assessments, are summarised in Table 4‑1.
Table 4‑1 Hong
Kong Air Quality Objectives
|
Pollutant
|
Pollutants
Concentration (mg/m3)
|
|
|
Averaging Time
|
|
|
1 hour (i)
|
8 hours (ii)
|
24 hours (ii)
|
1 year (iii)
|
|
CO
|
30,000
|
10,000
|
N.A.
|
N.A.
|
|
NO2
|
300
|
N.A.
|
150
|
80
|
|
TSP
|
N.A.
|
N.A.
|
260
|
80
|
|
RSP
|
N.A.
|
N.A.
|
180
|
55
|
(i) Not to be exceeded more than 3 times per year;
(ii) Not to be
exceeded more than once per year;
(iii) Arithmetic
means;
N.B. Concentrations
measured at 298 K and 101.325 kPa (one atmospheric pressure).
4.2.2
In addition to the AQOs, EPD requires under Annex 4 in the
Technical Memorandum on EIA Process (EIAO-TM) issued under the EIA Ordinance an
hourly TSP limit of 500mg/m3 for construction dust impact assessment.
4.2.3
The Air Pollution Control (Construction Dust) Regulation
came into effect since 16 June 1997.
Site formation, construction of the foundation and superstructure of
buildings, road construction works, etc. are classified as “notifiable work”
under the Regulation. Any work which
involves stockpiling of dusty materials, loading, unloading or transfer of
dusty materials, transfer of dusty materials using a belt conveyor system, use
of vehicles, debris handling, excavation or earth moving, site clearance, etc.
are regarded as “regulatory work”. A
Schedule specifying the dust control requirements for a variety of construction
activities is included in the Regulation.
The contractor responsible for a construction site where a notifiable
work and/ or regulatory work is being carried out have to ensure that the work
is carried out in accordance with the Schedule with regard to dust control.
4.3
Air Sensitive Receivers (ASRs)
4.3.1
As stated in Annex 12 of the EIAO-TM, domestic premises and
schools are defined as Air Sensitive Receivers (ASRs). The nearest ASRs situated in the vicinity of
the proposed bus depot within the study area were identified for the air
quality impact assessment. These ASRs
include the IVE (Chai Wan) and its auxiliary Staff Quarters located to the
north-west of the development site, Tsui Wan Estate located to the south of the
development and Heng Fat Chuen situated to the north of the site.
4.3.2
Representative assessment points (A1 to A6) have been selected
for the air quality impact assessment.
The ASRs represented are described in Table 4‑2. Locations of
the representative assessment points are shown in Figure 4-1.
Table 4‑2 Representative
Assessment Points
|
Ref. No.
|
Location of ASR
|
Closest distance of ASR from bus depot
boundary (m)
|
|
A1
|
Heng
Fa Chuen
|
390
|
|
A2
|
Staff
Quarters of Hong Kong Institute of Vocational Education (IVE) (Chai Wan)
|
135
|
|
A3
|
IVE
(Chai Wan)
|
80
|
|
A4
|
IVE
(Chai Wan)
|
85
|
|
A5
|
Tsui
Hong House, Tsui Wan Estate
|
185
|
|
A6
|
Tsui
Sau House, Tsui Wan Estate
|
165
|
4.4
Baseline Condition
4.4.1
The existing major air pollution sources in the study area are
expected to be open road traffic emission from major road carriageways (e.g.
Island East Corridor).
4.4.2
Annual average concentrations of nitrogen dioxide (NO2)
and respirable suspended particulate (RSP) recorded by EPD’s monitoring station
in Eastern district for the year 1999 have been used as background pollutant
concentrations in the study area. Although the number of monitoring records for
NO2 for Eastern monitoring station is below the minimum data
required within a quarter, the concentration of 66mg/m3 was found
to be comparable with the concentration at Tsuen Wan which have similar
landuses.
4.4.3
For carbon monoxide (CO) and total suspended particulate (TSP) which has no published data available
in the study area, EPD’s records from the Tsuen Wan monitoring station in 1999
has been adopted. Table 4‑3 summarises the background concentrations of CO, NO2,
and RSP adopted in the assessment for the purpose of evaluating the cumulative
air quality impact.
Table
4‑3 Background Air Pollutant Levels Adopted
in the Assessment
|
Air Pollutant
|
Annual Average Concentration (mg/m3)
|
|
CO
|
1177
|
|
NO2
|
66
|
|
TSP
|
79
|
|
RSP
|
47
|
Note : Background
concentrations of CO, NO2 and RSP in the study area has been assumed
based on reported data given in “Air Quality in Hong Kong, 1999” published by
EPD.
4.5
Construction Dust Emission
Impact Assessment
Introduction
4.5.1
The major air quality impact of concern during the
construction phase will be potential dust emission impact on nearby ASRs.
Unacceptable impacts from the criteria pollutants - nitrogen oxides (NOx),
sulphur dioxide (SO2), and carbon monoxide (CO) are unlikely as
significant emissions are not anticipated. Emission from diesel trucks for the
haulage of materials and construction plants will contain high percentage of
smoke particulate and unburned hydrocarbons in comparison with petrol driven
vehicles. However, as the anticipated number of construction plants associated
with the construction works will be limited, significant impact on the existing
air quality is not envisaged.
Dust Emission Sources
4.5.2
Based on the nature of the construction, major dust emission
sources associated with the construction activities are expected to arise from
excavation, material handling and vehicle movement on unpaved haul roads during
the foundation construction stage. The
corresponding dust emission rates associated with these activities have been
worked out by making reference to the typical emission factors reported in the
Compilation of Air Pollutant Emission Factors (AP-42) 5th Edition
published by U.S. Environmental Protection Agency (USEPA).
à
Excavation activities - dust emission from excavation has
been estimated by making reference to the emission factor given in Section 13.2.4
of USEPA AP-42. Dust emissions have
been estimated on a per excavator basis with consideration of typical
excavation rate, number of excavator involved, etc. to simulate a
representative scenario;
à
Material handling - potential dust emission from loading/
unloading activities of excavated material have also been predicted by making
reference to Section 13.2.4 of USEPA AP-42.
Dust emissions from loading/ unloading have been estimated on a per
truck basis with consideration of the capacity of each truck, and the estimated
number of trucks to simulate a representative scenario.
à
Vehicle movement on unpaved haul
roads - dust
emission from traffic movement on unpaved haul roads have been estimated by
making reference to Section 13.2.2 of USEPA AP-42, with consideration of no. of
trucks, typical vehicle speed, weight, number of wheels, etc.
4.5.3
A worksheet showing the calculation of dust emission rates
from each activity is presented in Appendix 4-1 for reference.
4.5.4
Foundation works for the New World First Bus (NWFB) depot was
completed. Concurrent superstructure construction activities at the NWFB depot
is not expected to give rise to a significant cumulative dust impact. There are no known major planned
construction activities in the vicinity of the site that may pose a potential
significant cumulative impact. Besides,
it is expected that even if there would be other construction activities
planned in future, these works will also be required to implement sufficient
dust control measures in accordance with the requirements of the Air
Pollution Control (Construction Dust) Regulation.
Dust Emission Modelling
4.5.5
Construction dust impact arising from the key dust emission
sources presented above during the foundation construction stage on the nearby
existing ASRs has been predicted using the air quality model “Fugitive Dust Model” (FDM). The model was particularly developed to
model fugitive dust emissions and is well accepted by HKEPD and USEPA for this
purpose. The model was developed based
on the widely used Gaussian plume formulae for estimation of pollutant
concentrations but has been adapted to incorporate a gradient-transfer
deposition algorithm which accounts for the settling out of dust particles, and
to include the wind dependent factor on dust emission rates. The model is designed to predict fugitive
dust dispersion from point, line, area and volume sources.
4.5.6
Based on information on general size distribution as reported
in Guide to Rock and Soil Descriptions
issued by the Geotechnical Control Office, Civil Engineering Services
Department, Hong Kong (1988), it has been assumed in the dust dispersion model
that 80% of particulates have size equal to 30µm, with the remaining 20%
assumed to be respirable with a size of 10µm.
An average dust density of 2,500 kg/m3 has been assumed in
the study.
à
Hourly
wind direction and speed, air temperature together with atmospheric Pasquill
stability class obtained at King’s Park;
à
Daily
morning and maximum mixing heights based on the radiosonde ascent at King’s
Park; and
à
Hourly
total sky cover, cloud amount and cloud based height of the 1st - 4th
layers observed at the Hong Kong Observatory Headquarters in Tsim Sha Tsui.
4.5.8
Given the stringent noise limits that need to be satisfied
before construction activities within the restricted hours will be allowed, it
is expected that there will only be construction activities during daytime from
0700 to 1900 hours. Nevertheless, to be
conservative in the study, dusty construction activities have been assumed to
be in operation continuously over a 24-hour period to give a worst-case
situation.
4.5.9
Maximum 1-hour and 24-hour TSP concentrations were predicted
at each representative assessment points A1 through A6 identified above. Given the limited height of the dust
emission sources, TSP concentrations were predicted at 1.5m, 5m and 10m above
ground at the representative assessment points to simulate the worst-case
situations. ASRs situated at higher
levels are expected to be subject to lower dust impact. With account of the background TSP levels,
the maximum 1-hour and 24-hour average TSP concentrations predicted were
compared with the 1-hour and 24-hour TSP limits of 500mg/m3 and 260mg/m3,
respectively. A typical FDM result file for construction dust impact assessment
is enclosed in Appendix 4-2 for reference.
Assessment Results (Unmitigated
Scenario)
4.5.10
The unmitigated maximum 1-hour and 24-hour average TSP
concentrations predicted at the representative assessment points, with
background concentration included, are presented in Table 4‑4 and Table
4‑5 below.
Table 4‑4 Maximum
1-hour TSP Concentrations predicted at the ASRs
(without
Mitigation Measures)
|
Ref. No.
|
Location
|
Predicted TSP concentrations
(mg/m3)
|
|
|
|
1.5m above ground
|
5m above ground
|
10m above ground
|
|
A1
|
Heng Fa Chuen
|
115
|
110
|
100
|
|
A2
|
Staff Quarters of the IVE
(Chai Wan)
|
190
|
157
|
136
|
|
A3
|
IVE (Chai Wan)
|
279
|
216
|
157
|
|
A4
|
IVE (Chai Wan)
|
504
|
378
|
212
|
|
A5
|
Tsui Hong House, Tsui Wan
Estate
|
180
|
173
|
151
|
|
A6
|
Tsui Sau House, Tsui Wan Estate
|
227
|
217
|
184
|
Note: Background TSP concentration of 79mg/m3 has been included.
Table
4‑5 24-hour
Average TSP Concentrations predicted at the ASRs
(without
Mitigation Measures)
|
Ref. No.
|
Location
|
Predicted TSP concentration
(mg/m3)
|
|
|
|
1.5m above ground
|
5m above Ground
|
10m above Ground
|
|
A1
|
Heng Fa Chuen
|
89
|
89
|
88
|
|
A2
|
Staff Quarters of the IVE
(Chai Wan)
|
112
|
108
|
100
|
|
A3
|
IVE (Chai Wan)
|
143
|
132
|
110
|
|
A4
|
IVE (Chai Wan)
|
352
|
247
|
147
|
|
A5
|
Tsui Hong House, Tsui Wan
Estate
|
110
|
106
|
97
|
|
A6
|
Tsui Sau House, Tsui Wan
Estate
|
150
|
144
|
126
|
Note: Background concentration of 79mg/m3 has been included.
4.5.11
The modelling results for the unmitigated scenario revealed
that the nearby Air Sensitive Receivers will be subject to dust level at
acceptable levels, except at A4. In
accordance with the requirements set out in the Air Pollution Control (Construction
Dust) Regulation, sufficient dust control/ mitigation measures shall be
implemented to ensure full protection of the nearby ASRs.
Control
Measures for mitigating Fugitive Dust Emissions
4.5.12
The following measures are specifically recommended for
implementation together with those presented in the Air Pollution Control
(Construction Dust) Regulation:
General Site Management
4.5.13
Appropriate working methods should be devised and arranged to
minimise dust emissions and to ensure any installed air pollution control
system and measures are operated and/or implemented in accordance with their
design merits. In the event of
malfunctioning of any control system or equipment, the relevant dusty
activities shall stop until the relevant control system or equipment are
restored to proper functioning.
4.5.14
Frequent mist spraying should be applied on dusty areas. The frequency of spraying required will
depend upon local meteorological conditions such as rainfall, temperature, wind
speed and humidity. The amount of mist
spraying should be just enough to dampen the material without over-watering,
which could result in unnecessary surface water runoff.
4.5.15
No free falling of construction debris shall be allowed at the
site.
Vehicles and Site Haul Road
4.5.16
Dust emission from unpaved roads comes predominantly from
travelling of vehicles. Areas within the site where there are regular vehicle
movements should have an approved hard surface. Speed controls at an upper limit of 10 to 15 kph should be
imposed and their movements should be confined to designed roadways within the
site. All dusty vehicle loads should
have side and tail boards and should be covered by tarpaulin extending at least
300 mm over the edges of the side and tail boards. Wheel-wash troughs and hoses should be provided at exit points of
the site.
Material Stockpiling and Handling
4.5.17
The amount of stockpiling should be minimised as far as
practicable. The surface of the stockpile should be kept wet by spraying with
water. Dust emission during loading of
fill material to dump trucks should be mitigated by spraying to sufficiently
damp the material prior to any loading or unloading operation. Dusty
construction debris should be covered or stored inside enclosed areas where
practicable to avoid dust generation.
4.5.18
Watering is an effective dust control measure commonly
employed in storage piles and handling operations and should be implemented
where appropriate. Other control measures such as enclosed or semi-enclosed
windboard should be used, where applicable, to minimise dust emission.
4.5.19
With the implementation of the
above-mentioned dust mitigation measures together with those
required in the Air Pollution Control (Construction Dust) Regulation, it is
expected that a minimum dust control efficiency of at least 50% is
achievable. Table 4-6 and 4-7 present
the mitigated dust levels predicted at the ASRs based on 50% dust control
efficiency. Implementation of dust
control measures in accordance with the requirements under the Air Pollution
Control (Construction Dust) Regulation will therefore ensure that unacceptable
dust impact will not be generated.
Table 4‑6 Maximum
1-hour TSP Concentrations predicted at the ASRs
(with
Mitigation Measures)
|
Ref. No.
|
Location
|
Predicted maximum 1-hr TSP concentrations (mg/m3)
|
|
|
|
1.5m above ground
|
5m above ground
|
10m above ground
|
|
A1
|
Heng Fa Chuen
|
97
|
94
|
89
|
|
A2
|
Staff Quarters of the IVE
(Chai Wan)
|
134
|
118
|
107
|
|
A3
|
IVE (Chai Wan)
|
179
|
147
|
118
|
|
A4
|
IVE (Chai Wan)
|
292
|
228
|
146
|
|
A5
|
Tsui Hong House, Tsui Wan
Estate
|
130
|
126
|
115
|
|
A6
|
Tsui Sau House, Tsui Wan
Estate
|
153
|
148
|
132
|
Note: Background TSP concentration of 79mg/m3 has been included.
Table 4‑7 24-hour
Average TSP Concentrations predicted at the ASRs
(with
Mitigation Measures)
|
Ref. No.
|
Location
|
Predicted 24-hour average TSP concentration (mg/m3)
|
|
|
|
1.5m above ground
|
5m above Ground
|
10m above Ground
|
|
A1
|
Heng Fa Chuen
|
84
|
84
|
83
|
|
A2
|
Staff Quarters of the IVE
(Chai Wan)
|
95
|
94
|
90
|
|
A3
|
IVE (Chai Wan)
|
111
|
105
|
95
|
|
A4
|
IVE (Chai Wan)
|
216
|
163
|
113
|
|
A5
|
Tsui Hong House, Tsui Wan
Estate
|
94
|
93
|
88
|
|
A6
|
Tsui Sau House, Tsui Wan
Estate
|
115
|
111
|
103
|
Note: Background concentration of 79mg/m3 has been included.
4.5.20
Contour maps presenting the predicted mitigated maximum 1-hour
and 24-hour average TSP concentrations at 1.5m above ground are given in Figure
4-2 and Figure 4-3. Background TSP level has been included in the results. The results show that the fugitive dust
impact arising from the construction works when dust mitigation measures
required under the Air Pollution Control (Construction Dust) Regulation are
implemented will be within the relevant dust assessment criteria. Implementation of the recommended
Environmental Monitoring and Audit Program (EM&A) will further ensure full
protection of the nearby ASRs. Details
of the EM&A Programme are presented in the Environmental Management Plan
(EMP).
4.6
Vehicular Emission Impact Assessment
4.6.1
During the operational phase of the bus depot, vehicular
emission from buses running within the depot and commuting to and from the
depot is the focus of the assessment.
Emissions of the key criteria pollutants associated with vehicular
traffic, including nitrogen dioxide (NO2), carbon monoxide (CO), and
respirable suspended particulate (RSP) have been studied.
4.6.2
Potential cumulative air quality impact from the concurrent
operation of the NWFB depot in the area, as well as traffic emissions from the
nearby road carriageways have been taken account of quantitatively in the
study. Traffics generated from the
future landuses within the Chai Wan East Industrial Area have been considered
in the traffic forecast provided by the Project Traffic Consultant – LLA
Consultancy Limited.
4.6.3
Air pollutants may also be generated from other depot
operations including engine testing, brake testing and painting. However, the emission quantity and
associated air pollution is expected to be insignificant.
Open
Road Vehicular Emission
Traffic Forecast
4.6.4
Similar to other future developments, operation of the
proposed bus depot will inevitably results in generation of some traffic flows
on the nearby road carriageways. This
section assesses the potential air quality impact associated with traffic
movement in the study area, taking into account the additional traffic flows
generated from the proposed bus depot.
Effects of other possible future developments in the study area have
also been taken into account through incorporation of traffic generation into
the traffic forecast.
4.6.5
Traffic forecast for the year 2018 during the early morning
(0530 to 0630) and mid-night (2300 to 0000) peak hour, when the highest traffic
flow contribution is expected to be generated from the proposed bus depot, has
been adopted in the study. Traffic
generation from other possible future developments in the area, including the
NWFB depot has been taken into consideration in the preparation of the traffic
forecast. The traffic forecast data
prepared by the Project Traffic Consultant has been endorsed by Transport
Department for use in the EIA study (see Appendix 5-6). In the preparation of the traffic forecast,
the Traffic Consultant has taken into account the data presented in the
approved EIA reported carried out for NWFB Permanent Depot in Chai Wan to
ensure that a consistent and conservative approach is being followed. Table 4-8
and Table
4‑9 present the 2018 Traffic Forecast during the early
morning and nighttime peak hours when the highest bus flows will be generated
from the bus depot. Alignment of the
road carriageways studied is presented in Appendix 4-3.
Table
4‑8 Year
2018 Traffic Forecast during the early Morning Peak Leaving
|
Label
|
Traffic Volume (veh/hr)
|
% of Passenger Car
|
% of HGV
|
% of Bus
|
|
A
|
332
|
21.5
|
56.6
|
22.0
|
|
B
|
171
|
47.1
|
50.0
|
2.9
|
|
C
|
160
|
25.8
|
74.2
|
0.0
|
|
D
|
306
|
39.3
|
38.5
|
22.2
|
|
E
|
565
|
54.5
|
45.5
|
0.0
|
|
F
|
835
|
57.0
|
43.0
|
0.0
|
|
G
|
249
|
14.0
|
58.7
|
27.3
|
|
H
|
3086
|
71.1
|
26.6
|
2.4
|
|
I
|
114
|
15.0
|
85.0
|
0.0
|
|
J
|
162
|
24.2
|
72.7
|
3.1
|
|
K
|
47
|
25.0
|
28.2
|
46.8
|
|
L
|
212
|
24.3
|
75.7
|
0.0
|
|
M
|
232
|
24.3
|
75.7
|
0.0
|
|
N
|
3086
|
71.1
|
26.6
|
2.4
|
|
O
|
284
|
37.7
|
62.3
|
0.0
|
|
P
|
2694
|
70.1
|
29.9
|
0.0
|
|
Q
|
20
|
90.0
|
10.0
|
0.0
|
|
R
|
20
|
90.0
|
10.0
|
0.0
|
Table
4‑9 Year
2018 Traffic Forecast during the Nighttime Peak Return
|
Label
|
Traffic Volume (veh/hr)
|
% of Passenger Car
|
% of HGV
|
% of Bus
|
|
A
|
734
|
40.9
|
42.7
|
16.3
|
|
B
|
346
|
40.7
|
42.0
|
17.3
|
|
C
|
50
|
93.8
|
6.2
|
0.0
|
|
D
|
368
|
57.8
|
25.9
|
16.3
|
|
E
|
889
|
86.3
|
13.7
|
0.0
|
|
F
|
1325
|
77.6
|
22.4
|
0.0
|
|
G
|
368
|
44.9
|
38.8
|
16.3
|
|
H
|
2564
|
58.8
|
36.5
|
4.7
|
|
I
|
68
|
18.0
|
82.0
|
0.0
|
|
J
|
647
|
25.4
|
65.3
|
9.3
|
|
K
|
85
|
38.6
|
14.3
|
47.1
|
|
L
|
477
|
44.6
|
55.4
|
0.0
|
|
M
|
481
|
44.6
|
55.4
|
0.0
|
|
N
|
2564
|
58.8
|
36.5
|
4.7
|
|
O
|
433
|
55.8
|
44.2
|
0.0
|
|
P
|
1654
|
59.8
|
40.2
|
0.0
|
|
Q
|
20
|
90.0
|
10.0
|
0.0
|
|
R
|
20
|
90.0
|
10.0
|
0.0
|
Air Quality Modelling
4.6.6
Potential vehicular emission from open road traffic has been
assessed with the air quality model CALINE4.
The model is a line source model developed by the California Department
of Transport. It was developed based on
the Gaussian diffusion formulae and a mixing zone concept in predicting
dispersion of pollutants emitted from road carriageways.
4.6.7
As the bus depot will commence operation in 2003, to be
conservative in the assessment, emission factors for vehicular pollutants
recommended by DEP in air quality study have been used with 2018 traffic
forecast data in the modeling study. As
pollutant emission factors are expected to be reduced as technology advance in
reducing vehicular emissions, this approach to the study is considered very
conservative. Table 4-10 presents the
2003 vehicular emission factors of CO, NOx and RSP for passenger
cars, buses and heavy diesel vehicles.
Table 4‑10 2003
Vehicular Emission Factors
|
Vehicle Type
|
Emission Factor (mg/km)
|
|
|
CO
|
NOx
|
RSP
|
|
Passenger Car
(Petrol)
|
2.34
|
0.90
|
0.03
|
|
Franchised
Bus Double Deck (FBDD)
|
9.22
|
10.53
|
1.17
|
|
Heavy Diesel Vehicle
|
8.53
|
6.21
|
1.05
|
The following assumptions
were adopted throughout the study :
i.
NOx
is a mixture of NO and NO2;
ii.
20%
of NOx is assumed to be NO2;
iii.
NO
was modelled as “Inert Gas”; with a molecular weight of 46g;
iv.
The
proportion of RSP in the vehicular emission is assumed to be 100% of the
particulate matter which is, in general, less than 10 mm
in the aerodynamic diameter.
4.6.8
Pasquill Stability Class F with a wind speed of 1m/s has been
adopted in the CALINE4 modelling to simulate the worst-case meteorological
conditions. The ambient temperature was
assumed to be 25 degree Celsius. The
average mixing height was taken as 500m according to monitoring data obtained
from Kai Tak Weather Station. Wind
direction standard deviation of 6 degree.
The aerodynamic roughness coefficient was set at 100cm.
4.6.9
Concentrations of maximum 1-hour CO, NO2 and RSP at
the representative assessment points A1 through A6 presented in Figure 4-1 were
predicted from the model. As there is
currently no hourly AQO for RSP, the modeled peak hour RSP concentrations were
converted to daily average concentration for checking compliance with the daily
criteria of 180mg/m3. 24-hour NO2 concentrations at the
assessment points were also predicted using the same approach. Assuming that the predicted maximum peak
hour traffic flow would last for 10 hours and the wind would be blowing at the
worst direction for 24 hours, a conversion factor of 0.4 has been applied to
convert maximum 1-hour RSP and NO2 concentrations to maximum 24-hour
average for comparison with the relevant Air Quality Objectives.
Assessment Results
4.6.10
Table 4-11 presents the modeled maximum 1-hour NO2,
1-hour CO and 24-hour average RSP and NO2 concentrations at the
representative assessment points for open road vehicular emission. Background pollutant concentrations have
been added to the results. Typical CALINE4 result files are presented in Appendix
4-4.
4.6.11
It can be noted that all modeling results are falling well
within the relevant AQOs.
Table
4‑11 Predicted
Pollutant Concentrations from Open Road Vehicular Emission
|
Ref.
No.
|
Location
|
Predicted pollutant concentrations (mg/m3) at discrete receptor
|
|
|
|
|
Height
above ground (m)
|
1-hr NO2
|
24-hr NO2
|
1-hr CO
|
24-hr RSP
|
|
|
|
|
1.5
|
5
|
10
|
15
|
20
|
1.5
|
5
|
10
|
15
|
20
|
1.5
|
5
|
10
|
15
|
20
|
1.5
|
5
|
10
|
15
|
20
|
|
|
A1
|
Heng Fa
Chuen
|
104
|
104
|
104
|
104
|
104
|
81
|
81
|
81
|
81
|
81
|
1635
|
1520
|
1520
|
1406
|
1406
|
63
|
62
|
59
|
56
|
55
|
|
|
A2
|
Staff
Quarters of the IVE (Chai Wan)
|
179
|
141
|
141
|
141
|
141
|
111
|
96
|
96
|
96
|
96
|
1864
|
1864
|
1864
|
1749
|
1749
|
74
|
73
|
71
|
69
|
66
|
|
|
A3
|
IVE
(Chai Wan)
|
179
|
179
|
179
|
141
|
141
|
111
|
111
|
111
|
96
|
96
|
1978
|
1978
|
1864
|
1864
|
1749
|
77
|
76
|
74
|
71
|
68
|
|
|
A4
|
IVE
(Chai Wan)
|
141
|
141
|
141
|
141
|
141
|
96
|
96
|
96
|
96
|
96
|
1864
|
1864
|
1749
|
1749
|
1635
|
71
|
70
|
68
|
66
|
64
|
|
|
A5
|
Tsui
Hong House, Tsui Wan Estate
|
141
|
141
|
141
|
104
|
104
|
96
|
96
|
96
|
81
|
81
|
1749
|
1749
|
1635
|
1520
|
1520
|
69
|
67
|
64
|
62
|
60
|
|
|
A6
|
Tsui
Sau House, Tsui Wan Estate
|
141
|
141
|
141
|
104
|
104
|
96
|
96
|
96
|
81
|
81
|
1864
|
1749
|
1635
|
1635
|
1520
|
70
|
68
|
64
|
62
|
60
|
|
|
|
Air Quality Objectives (AQO)
|
300
|
|
30,000
|
180
|
|
Note:
Background pollutant concentrations are included in the results.
Depot Emissions
4.6.12
In addition to the off-site bus traffic, operation of the bus
depot would also result in generation of some air pollutants directly from the
depot.
Pollutant
Emission Rates
4.6.13
Exhaust emission from buses moving and idling inside the
proposed bus depot building was studied.
As discussed before, maximum bus flows leaving or returning to the bus
depot are expected to occur during early morning (0530 to 0630) and at
mid-night (2300 to 0000). Bus flow
information, in terms of worst-case number of buses entering and leaving each
floor of the proposed depot building during the peak hours, was estimated by
the project traffic consultant and are summarised in Table 4‑12.
Table
4‑12 Worst-case
Bus Flow entering/ leaving the Depot Building
|
|
Number of Buses/Hour1
|
|
|
During mid-night
|
During Early Morning
|
|
Floor Level
|
Entering
|
Leaving
|
Entering
|
Leaving
|
|
G/F
|
80
|
80
|
5
|
90
|
|
1/F2
|
80
|
80
|
0
|
85
|
|
Roof floor3
|
70
|
70
|
0
|
85
|
Notes:
1.
Bus flow data for each floor includes the accumulated flow passing each
floor level;
2.
1/F maintenance bay is for annual maintenance activities which occur
outside the above peak hours. Nevertheless, to be conservative, the maximum
hourly bus flows which are expected to occur during daytime have been assumed
for the mid-night scenario;
3.
Maximum numbers of buses are expected to return to the depot for parking
at approximately 19:30 to 20:30. Again,
as a conservative approach, the peak hourly flows have also been assumed to
occur during the mid-night scenario for the vehicular emission impact study.
4.6.14
Vehicular emission within the bus depot would be generated
from bus movement within the depot, as well as from bus idling. Emission factors for these two activities
were referenced to the Fleet Average Emission Factors calculated by the “FAEF”
Model, and EPD recommended idling factors.
These are summarised in Table
4‑13.
Table
4‑13 Emission
Factor for Buses inside Depot
|
|
Emission Factors
|
|
Bus activity
|
NOx
|
CO
|
RSP
|
|
Traveling (g/km)
|
11.71
|
8.89
|
1.38
|
|
Idling (g/min/vehicle)
|
2.0
|
2.0
|
0.042
|
4.6.15
Worst-case average emission rates of NO2, CO and
RSP from bus movement and idling within the bus depot were calculated from the
estimated maximum hourly bus flows and bus traveling distance and are
summarised in Table
4‑14. A
spreadsheet showing the calculation of these emission rates are set out in
Appendix 4-5. These highest pollutant
emission rates will only occur during the peak hour. Applying these emission rates in the model for testing of
pollutant dispersion under different worst-case meteorological conditions at
different hours of the days will therefore generate conservative results. Taking into account the worst-case maximum
number of buses, multiple point sources were assumed to be present concurrently
as a conservative approach in the air quality modelling.
Table
4‑14 Bus
Depot Air Pollutant Emission Rates
|
|
|
Pollutant
Emission Rate (g/s) Per Source
|
|
Floor
|
No. of
Sources
|
NO2
|
CO
|
RSP
|
|
G/F
|
80
|
0.00130
|
0.00032
|
0.000164
|
|
1/F
|
80
|
0.00062
|
0.00015
|
0.000059
|
|
Roof floor
|
70
|
0.00069
|
0.00016
|
0.000069
|
4.6.16
In addition to the proposed Bus Depot, New World First Bus
(NWFB) Services Limited will also operate a similar bus depot facility located
at about 135m to the north of the development site. Similar pollutant emission rates estimated from bus movement and
idling within the NWFB depot were identified from the NWFB EIA report (EIAO
registration no.: EIA-034/1999) and inputted to the ISCST3 for studying the
potential cumulative air quality impact due to emissions from the two depots.
Air Quality Modelling
4.6.17
The dispersion of air pollutants released from the proposed
bus depot and NWFB depot was studied quantitatively using the air quality model
“Industrial Source Complex Short Term Version 3 (ISCST3)” released by Trinity
Consultants Incorporated. This model was developed based on the principle of
Gaussian dispersion and is widely acceptable by authorities worldwide including
the United States Environmental Protection Agency (USEPA) and the Hong Kong
Environmental Protection Department (EPD).
Pollutant emissions from each floor of the bus depot were modeled. The
emission heights were taken at 0.5m above the floor slabs, which is the
approximate height of the bus exhaust pipes.
4.6.18
The same set of meteorological data as presented in Section 4.5.7 has been adopted in the air quality modeling. Background pollutant concentrations as
presented in Table
4‑3 were adopted.
Modelling Results
4.6.19
Table 4-15 presents the predicted maximum 1-hour NO2,
CO and 24-hour average RSP and NO2 concentrations at the
representative assessment points A1 through A6 due to emission from the two
depots. Typical ISCST3 result files can
be found in Appendix 4-6. All modeling
results are found to be well within the AQOs.
Cumulative
Impact from Open Road Traffic and Depot Emissions
4.6.20
Cumulative pollutant concentrations at the representative
assessment points due to operations of the two bus depots, off-site road
vehicular emissions and background pollutant concentrations were conservatively
estimated from summation of the ISCST3 and CALINE4 results and are presented in
Table 4-16.
Table 4‑15 Predicted
pollutant concentrations due to emissions from Citybus Depot and NWFB Depot
|
Ref. No.
|
Location
|
Predicted pollutant concentrations (mg/m3)
at discrete receptor
|
|
|
|
|
Height
above ground (m)
|
1-hr NO2
|
24-hr NO2
|
1-hr CO
|
24-hr RSP
|
|
|
|
|
1.5
|
5
|
10
|
15
|
20
|
1.5
|
5
|
10
|
15
|
20
|
1.5
|
5
|
10
|
15
|
20
|
1.5
|
5
|
10
|
15
|
20
|
|
|
A1
|
Heng Fa
Chuen
|
74
|
74
|
74
|
73
|
74
|
68
|
68
|
68
|
68
|
68
|
1211
|
1210
|
1209
|
1208
|
1210
|
48
|
48
|
48
|
49
|
48
|
|
|
A2
|
Staff
Quarters of the IVE (Chai Wan)
|
82
|
82
|
81
|
80
|
79
|
70
|
70
|
70
|
70
|
70
|
1242
|
1242
|
1240
|
1236
|
1230
|
49
|
49
|
49
|
51
|
49
|
|
|
A3
|
IVE (Chai
Wan)
|
82
|
82
|
83
|
82
|
80
|
71
|
71
|
71
|
71
|
71
|
1242
|
1243
|
1245
|
1243
|
1236
|
49
|
49
|
49
|
52
|
49
|
|
|
A4
|
IVE (Chai
Wan)
|
81
|
81
|
83
|
83
|
81
|
75
|
75
|
75
|
75
|
75
|
1237
|
1240
|
1245
|
1245
|
1240
|
51
|
51
|
51
|
56
|
51
|
|
|
A5
|
Tsui Hong
House, Tsui Wan Estate
|
85
|
85
|
85
|
84
|
83
|
72
|
72
|
72
|
72
|
72
|
1258
|
1258
|
1256
|
1252
|
1247
|
50
|
50
|
50
|
53
|
50
|
|
|
A6
|
Tsui Sau
House, Tsui Wan Estate
|
83
|
83
|
82
|
82
|
80
|
71
|
71
|
71
|
71
|
71
|
1247
|
1247
|
1245
|
1242
|
1236
|
49
|
49
|
49
|
52
|
49
|
|
|
|
Air Quality
Objectives (AQO)
|
300
|
|
30,000
|
180
|
|
|
|
|
|
|
|
|
|
|
|
|
|
|
|
|
|
|
|
|
|
|
|
|
|
Note: Background
pollutant concentrations are included.
Table 4‑16 Cumulative
Pollutant Concentrations from Open Road Traffic Emission & Depots Emission
|
Ref. No.
|
Location
|
Predicted pollutant
concentrations (mg/m3) at discrete receptor
|
|
|
|
|
Height above ground (m)
|
1-hr NO2
|
24-Hr NO2
|
1-hr CO
|
24-hr RSP
|
|
|
|
|
1.5
|
5
|
10
|
15
|
20
|
1.5
|
5
|
10
|
15
|
20
|
1.5
|
5
|
10
|
15
|
20
|
1.5
|
5
|
10
|
15
|
20
|
|
|
A1
|
Heng Fa Chuen
|
112
|
112
|
111
|
111
|
111
|
83
|
83
|
84
|
84
|
84
|
1668
|
1554
|
1553
|
1437
|
1439
|
64
|
63
|
60
|
59
|
56
|
|
|
A2
|
Staff Quarters of the IVE (Chai Wan)
|
195
|
157
|
157
|
156
|
154
|
115
|
100
|
100
|
100
|
100
|
1929
|
1929
|
1927
|
1809
|
1803
|
76
|
75
|
73
|
73
|
68
|
|
|
A3
|
IVE (Chai Wan)
|
195
|
195
|
195
|
157
|
156
|
116
|
116
|
116
|
101
|
101
|
2043
|
2044
|
1931
|
1930
|
1809
|
79
|
78
|
76
|
76
|
71
|
|
|
A4
|
IVE (Chai Wan)
|
156
|
157
|
158
|
158
|
157
|
105
|
105
|
105
|
105
|
105
|
1924
|
1927
|
1818
|
1817
|
1698
|
75
|
75
|
73
|
75
|
68
|
|
|
A5
|
Tsui Hong House, Tsui Wan Estate
|
161
|
161
|
160
|
122
|
120
|
102
|
102
|
102
|
87
|
87
|
1830
|
1830
|
1713
|
1595
|
1590
|
72
|
70
|
67
|
68
|
62
|
|
|
A6
|
Tsui Sau House, Tsui Wan Estate
|
158
|
158
|
158
|
119
|
118
|
101
|
101
|
101
|
86
|
86
|
1934
|
1819
|
1703
|
1699
|
1580
|
72
|
70
|
67
|
68
|
63
|
|
|
|
Air Quality Objectives (AQO)
|
300
|
|
30,000
|
180
|
|
Note: Background pollutant concentrations are
included.
4.6.21
The maximum 1-hour NO2 concentration was predicted
at A3 at 10m above ground from the modelling. In addition to the discrete
representative assessment points, assessment points were selected based on a
50m x 50m grid covering the key air sensitive areas of interest, viz. Heng Fa
Chuen, IVE (Chai Wan) and its associated Staff Quarters, and Tsui Wan Estate. Pollutant isopleths of maximum 1-hour NO2,
1-hour CO and 24-hour RSP and NO2 were generated from the ISCST3 and
CALINE4 modelling results obtained at the worst affected level at 10m above
ground. Background pollutant
concentrations set out in Table
4‑3 were added to the modelling results for comparison
with the relevant AQOs. The contour
maps are presented in Figure 4-4 to Figure 4-7.
4.6.22
All predicted air pollutant concentrations at various levels
of the ASRs are well within the AQOs.
The assessment results reveal that vehicular emissions from open road
traffic and emission from the two bus depots will unlikely pose an unacceptable
air quality impact on the surrounding ASRs.
4.7
Environmental Monitoring & Audit (EM&A) Requirements
4.7.1
The quantitative construction dust impact assessment confirms
that no unacceptable air quality impact affecting the nearby ASRs is
anticipated when the required dust control/ mitigation measures required under
the Air Pollution Control (Construction Dust) Regulation are implemented. Nevertheless, for checking the
implementation of the dust mitigation measures required under the Air Pollution
Control (Construction Dust) Regulation, implementation of a dust monitoring
programme is recommended as part of the environmental monitoring and audit
(EM&A) programme.
4.7.2
The detailed vehicular emission impact assessment indicates
that vehicular emission from buses will not be a concern during the operational
phase. The carrying out of air quality
EM&A works in relation to air quality during the operational phase is not
considered necessary.
4.8
Assessment Conclusions
Construction Phase
4.8.1
The dust impact assessment concluded that the dust impact
during the construction phase of the development will be in compliance with the
air quality criteria when dust control measures required under the Air
Pollution Control (Construction Dust) Regulation are in place. Construction air quality impact should be
minor and effective dust control can be achieved by implementation of the dust
control measures required under the Air Pollution Control (Construction
Dust) Regulation.
Operational Phase
4.8.2
Potential air quality impact arising from the operation of the
proposed bus depot, including emission directly from the bus depot and from
open road vehicular emission, has been assessed. Direct emission from the NWFB depot, as well as vehicular
emission from traffic generated by the planned landuses including the NWFB
depot in the area, has been considered.
The cumulative pollutant concentrations predicted are all satisfying the
relevant AQOs. The assessment results
obtained with a conservative assessment approach indicate that the operation of
the bus depot will not cause any unacceptable air quality impact on the
surrounding air sensitive receivers.
5.
Noise Impact Assessment
5.1
Introduction
5.1.1 This
section presents an assessment of noise impact associated with the construction
and operation of the project. During
the construction phase, potential noise impact arising from the operation of
powered mechanical equipment (PME) at the work sites is the key interest. Potential traffic noise impact from buses
running on the road carriageways in the vicinity of the bus depot and that
generated from fixed noise sources are the focus of the operational phase
impact study. Where necessary,
mitigation measures will be recommended to reduce the noise impact down to meet
acceptable levels.
5.2
Study Area and Noise
Sensitive Receivers (NSRs)
5.2.1 A
study area of 300m from the boundary of the project site has been adopted in
the study in accordance with the requirement stated in the EIA Study Brief.
5.2.2 As
defined in Annex 13 of the EIAO-TM, domestic premises and schools are defined
as noise sensitive receivers. In the
current study, the nearest NSRs identified in the proximity of the proposed Bus
depot are the residential developments to the north and south of the Bus Depot,
namely Heng Fa Chuen and Tsui Wan Estate respectively, and the IVE (Chai Wan)
and its associated Staff Quarters.
Representative assessment points (RAPs) have been selected for each of
these NSRs and their locations are shown in Figure 4-1. These RAPs are described in Table 5‑1. The
separation distance between the RAPs and the bus depot is also shown in Table
5-1.
Table 5‑1
Representative Assessment Points selected for Noise Impact Assessment
|
RAPs
|
Description
|
Floors
|
Separation (Approx.) (m)
|
|
HF-1
|
Block 50, Heng Fa Chuen
|
G/F to 20/F
|
390
|
|
HF-2
|
Block 16, Heng Fa Chuen
|
G/F to 20/F
|
658
|
|
SH-1
|
Staff Quarters of the IVE (Chai Wan)
|
G/F to 25/F
|
200
|
|
SH-2
|
Staff Quarters of the IVE (Chai Wan)
|
G/F to 25/F
|
160
|
|
IV-1
|
IVE (Chai Wan)
|
G/F to 5/F
|
175
|
|
IV-2
|
IVE (Chai Wan)
|
G/F to 5/F
|
85
|
|
TW-1
|
Tsui Sau House, Tsui Wan Estate
|
G/F to 30/F
|
165
|
|
TW-2
|
Tsui Fuk House, Tsui Wan Estate
|
G/F to 30/F
|
235
|
|
TW-3
|
Tsui Ling House, Tsui Wan Estate
|
G/F to 30/F
|
305
|
|
TW-4
|
Tsui Hong House, Tsui Wan Estate
|
G/F to 30/F
|
205
|
5.2.3 Eastern
facade of IVE (Chai Wan) Staff Quarters (SH-3 and SH-4 in Figure 4-1) is installed
with fixed windows (i.e. does not rely on opened windows for ventilation) such
that the relevant noise standards are not applicable. Therefore, RAPs were only selected on the western façade of the
Staff Quarters for the assessment. Besides, it is identified that IVE (Chai
Wan) is installed with air-conditioners such that the occupants in the teaching
classrooms and laboratories will not rely on openable windows as the primary
means for ventilation.
5.2.4 No
planned NSRs are identified in the proximity of the bus depot that could be
subject to a noise impact resulting from the project.
5.2.5 The
existing dominant noise sources identified in the vicinity of these NSRs
include traffic noise from the nearby major road carriageways (e.g. Island
Eastern Corridor) and railway noise from the MTR tracks.
5.3
Construction Noise Impact Assessment
Legislation and Assessment Criteria
5.3.1 Construction
noise is controlled under the Noise
Control Ordinance (NCO) which prohibits the use of powered mechanical
equipment (PME) during the restricted hours (7 p.m. to 7 a.m. on normal
weekdays and any time on a public holiday, including Sunday) without a valid
Construction Noise Permit (CNP) granted by the Authority. The criteria and procedures for issuing such
a permit are specified in the “Technical Memorandum on Noise From Construction
Works Other than Percussive Piling” (TM1).
5.3.2 For
construction works other than percussive piling, although TM1 do not provide
control over daytime construction activities, noise limits are set out in Table
1B of Annex 5 of the EIAO TM which have been adopted as the assessment criteria
in this study. These noise standards
are summarised in Table
5‑2 below:
Table 5‑2 Noise Limits for
Daytime Construction Activities
|
NSR
|
0700 to 1900
hours on any day not being a Sunday or general holiday Leq (30min.)
dB (A)
|
|
All domestic
premises including temporary housing accommodation
|
75
|
|
Educational
institutions including kindergartens, nurseries.
|
70
65 (during examination)
|
N.B. (i) The above standards apply to uses which
rely on opened windows for ventilation;
(ii) The above
standards shall be viewed as the maximum permissible noise levels assessed at
1m from the external facade.
5.3.3 Construction
works during the restricted hours are not required. However, if the Contractor finds that works during restricted
hours are required, then, he should apply for a Construction Noise Permit
(CNP). Despite any description or
assessment made in this EIA Report on construction noise aspects, there is no
guarantee that a CNP will be issued for the project construction. The Noise Control Authority will consider a
well-justified CNP application, once filed, for construction works within
restricted hours as guided by the relevant Technical Memoranda issued under the
Noise Control Ordinance. The Noise
Control Authority will take into account of contemporary conditions/ situations
of adjoining land uses and ay previous complaints against construction
activities at the site before making his decision in granting a CNP. Nothing in this EIA Report shall bind the
Noise Control Authority in making his decision. If a CNP is to be issued, the Noise Control Authority shall
include in it any condition he thinks fit.
Failure to comply with any such conditions will lead to cancellation of
the CNP and prosecution action under the NCO.
5.3.4 With
effect from 1 November 96, the use of specified powered mechanical equipment
(SPME) for carrying out construction work other than percussive piling and/ or
the carrying out of prescribed construction work (PCW) within a designated area
are also brought under control. The relevant technical details are provided in
the “Technical Memorandum on Noise from Construction Work in Designated Areas”
(TM2).
5.3.5 Percussive
piling is controlled similarly by a noise permit system and described in the
NCO and the “Technical Memorandum On Noise From Percussive Piling” (TM3) which
restrict the number of hours during which piling can be conducted. No percussive piling may be carried out in
the territory without a valid CNP issued by the Authority. Besides, a CNP will only be granted for
percussive piling which is scheduled during normal working hours between 7 a.m.
to 7 p.m. from Monday to Saturday. The
carrying out percussive piling is prohibited at any time on Sundays and public
holidays as well as during the weekday from 7 p.m. to 7 a.m. the next day.
Assessment Methodology
5.3.6 The
approach used in the assessment of noise from construction works other than percussive
piling is based on standard acoustic principles, and the guidelines given Para.
5.3 and 5.4 of Annex 13 of the EIAO TM.
The methodology adopted is the same as that presented in TM1.
5.3.7 The
methodology for assessing construction noise impact arising from the project
has been developed based on the standard acoustic principles in TM1. In brief,
this includes the following steps:
(i)
based
on the preliminary construction programme given in Figure 3-9, identify the most likely powered
mechanical equipment (PME) to be used during foundation construction and
superstructure construction;
(ii)
identify
the nearest representative assessment points of the NSRs to the work sites;
(iii)
calculate
the total Sound Power Level (SWL) of the equipment that would likely be used
simultaneously at the notional source location of the site;
(iv)
calculate
the Predicted Noise Level (PNL) based on distance attenuation from the notional
source positions to the NSRs;
(v)
with
consideration of the effect of façade reflection at the NSRs, calculate the
Corrected Noise Level (CNL) at the NSRs; and
(vi)
compare
the CNL with the relevant daytime noise limits and identify situations and
locations where the implementation of construction noise mitigation measures
would be necessary.
Noise Sources
5.3.8 Exact
details on the PME to be used during the construction phase would not be
available before the appointment of the Contractor in future. Nevertheless, based on previous experience
in similar construction projects, the Project Engineer, Wong Pak Lam &
Associates Limited, has developed a preliminary PME inventory for the purpose
of quantitative assessments in the study.
Table 5-3 through Table 5-5 present the PME inventories for the
foundation construction works; sheet piling and pile cap construction, and
superstructure construction, respectively.
The plant inventories listed in these tables have been confirmed by the
Project Architect based on his experience in similar projects to be practical
and practicable for completing the works within the planed construction programme,
and demonstrated in practices through similar projects undertaken by
contractors. Potential cumulative noise
impact from concurrent use of different groups of PMEs has been assessed in the
study for identification of the mitigation measures required under these
situations.
5.3.9 The
carrying out of a quantitative construction noise assessment based on the
preliminary PME inventories established at this planning stage will allow the
identification of potential construction noise problem and location of the
potentially affected NSRs such that practicable and sufficient noise mitigation
measures can be derived accordingly at this early stage and incorporated as
contract requirements for the future Contractor to follow. Implementation of sufficient noise
mitigation can be checked through Environmental Monitoring and Audit
requirements.
Table 5‑3 PME Inventory for Foundation Construction Works
|
PME
|
No.
of Equipment
|
SWL,
dB(A)
|
|
Piling, large diameter bored, oscillator
|
10
|
115
|
|
Piling, large diameter bored, reverse
circulation drill
|
7
|
100
|
|
Generator
|
4
|
108
|
|
Excavator
|
4
|
112
|
|
Lorry
|
2
|
112
|
|
Crawler crane
|
13
|
112
|
|
Concrete lorry mixer
|
4
|
109
|
|
Dump
Truck
|
3
|
117
|
Table 5‑4 Inventory of PMEs during
Sheet Piling and Pile Cap Construction
|
Equipment
Group
|
PME
|
No. of Equipment
|
SWL, dB(A)
|
|
1
|
Compressor
<10m3 /min
|
2
|
100
|
|
|
Concrete
pump
|
1
|
109
|
|
|
Generator
|
2
|
108
|
|
|
Compactor/
Concrete Vibrator
|
2
|
105
|
|
|
Excavator
|
3
|
112
|
|
|
Lorry
|
3
|
112
|
|
|
Concrete
Lorry Mixer
|
3
|
109
|
|
|
|
|
|
|
2
|
Tower
Crane
|
2
|
95
|
|
|
|
|
|
|
3
|
Bar
Bender
|
2
|
90
|
|
|
Saw
|
2
|
108
|
|
|
|
|
|
|
4
|
Sheet
Pile Vibrator
|
2
|
114
|
Table 5‑5 Inventory
of PMEs during Superstructure Construction
|
Equipment
Group
|
PME
|
No. of Equipment
|
SWL, dB(A)
|
|
1
|
Compressor
<10m3 /min
|
2
|
100
|
|
|
Concrete
pump
|
2
|
109
|
|
|
Generator
|
2
|
108
|
|
|
Compactor/
Concrete Vibrator
|
5
|
105
|
|
|
Excavator
|
3
|
112
|
|
|
Lorry
|
3
|
112
|
|
|
Concrete
Lorry Mixer
|
6
|
109
|
|
|
|
|
|
|
2
|
Tower
Crane
|
3
|
95
|
|
|
Hoist,
Material
|
2
|
95
|
|
|
|
|
|
|
3
|
Bar
Bender
|
3
|
90
|
|
|
Saw
|
4
|
108
|
|
|
Planer
|
2
|
117
|
|
|
|
|
|
|
4
|
Poker
|
2
|
113
|
Representative
Assessment Points
5.3.10 Three
Representative Assessment Points (RAPs) including HF-1, IV-2 and TW-1 situated
nearest to the development site were selected in the construction noise impact
assessment. Locations of these RAPs are shown in Figure 5-1. As these RAPs are situated closest to the
development site, compliance of the daytime construction noise limits at these
RAPs will indicate that the standards will also be met at other Noise Sensitive
Receivers located at further distance away from the site.
Assessment
Results (Unmitigated Scenario)
5.3.11 Table 5‑6 presents the unmitigated noise levels predicted at
the RAPs for the various construction stages and scenarios. For the sheeting piling and pile cap
construction stage and superstructure construction stage, concurrent operation
of different PME groups were considered under 6 scenarios (see notes under
Table 5-6). Those predicted noise
levels exceeding the noise criteria are highlighted in bold. Worksheets showing the calculation at IV-2,
TW-1 and HF-1 are provided in Appendix 5-1 for reference.
Table 5‑6 Unmitigated
Noise Levels predicted at the RAPs, Leq(30min.)dB(A)
|
|
Construction Stages
|
|
Foundation
|
Sheet Piling and Pile Cap Construction
|
Superstructure Construction
|
|
RAPs
|
Construction
|
S1
|
S2
|
S3
|
S4
|
S5
|
S6
|
|
IV-2 (1/F)
|
82
|
75
|
76
|
76
|
78
|
77
|
79
|
|
IV-2 (3/F)
|
82
|
75
|
76
|
76
|
78
|
77
|
79
|
|
IV-2 (5/F)
|
82
|
75
|
76
|
76
|
78
|
77
|
79
|
|
TW-1 (1/F)
|
76
|
69
|
70
|
70
|
72
|
70
|
72
|
|
TW-1 (15/F)
|
76
|
69
|
70
|
70
|
72
|
70
|
72
|
|
TW-1 (30/F)
|
75
|
69
|
70
|
70
|
72
|
70
|
72
|
|
HF-1 (1/F)
|
71
|
64
|
65
|
65
|
67
|
66
|
68
|
|
HF-1 (10/F)
|
71
|
64
|
65
|
65
|
67
|
66
|
68
|
|
HF-1 (20/F)
|
71
|
64
|
65
|
65
|
67
|
66
|
68
|
S1 – scenario 1 : concurrent operation of Groups 1, 2 &
3 PMEs in Table 5-4;
S2 – scenario 2 : concurrent operation of Groups 1, 2
& 4 PMEs in Table 5-4;
S3 – scenario 3 : concurrent operation of Groups 1, 2,
3 & 4 PMEs in Table 5-4;
S4 – scenario 4 : concurrent operation of Groups 1, 2
& 3 PMEs in Table 5-5;
S5 – scenario 5 : concurrent operation of Groups 1, 2
& 4 PMEs in Table 5-5;
S6 – scenario 6 : concurrent operation of Groups 1, 2,
3 & 4 PMEs in Table 5-5
5.3.12 The assessment
results from consideration of the unmitigated scenarios revealed that given the
significant distance separation between the site and Tsui Wan Estate and Heng
Fa Chuen, it is predicted that the daytime construction noise limit of Leq(30min.)
75dB(A) will be fully satisfied at HF-1 and the NSRs represented at all
floors. The noise standard will also be
satisfied at TW-1 except for some units located at low and medium levels during
the foundation construction stage which will be subject to a noise exceedance
of 1dB(A).
5.3.13 Given
the more stringent noise limit applied to educational institutions and the
closer distance of IVE (Chai Wan) to the site, noise impact up to a maximum
level of 82dB(A) exceeding the noise limit of 70dB(A) for 12dB(A) was predicted
at IV-2 during the execution of foundation works. Noise mitigation measures
will be required to mitigate the construction noise impact predicted at IV-2,
as well as low and medium floors of TW-1.
5.3.14 It
shall be noted that the assessment results predicted above only represent the
worst-case construction scenarios i.e. when equipment adopted for different
construction activities are in concurrent and continuous operation, and located
at the same notional source position nearest to each RAP in question. In reality, the occurrence of these
scenarios would be rare. Nevertheless,
the assessment results revealed that particular attention should be placed to
implement sufficient control/ mitigation measures to alleviate the noise impact
during the execution of the construction works, especially for construction
works carried out near the IVE (Chai Wan) and Tsui Wan Estate.
Recommended Construction Noise Mitigation
Measures
5.3.15 Potential noise
impacts from the foundation works, sheet piling and pile cap construction and
superstructure construction can be minimised by adopting a combination of the
following noise mitigation measures. These include:
·
Use of quiet PME;
·
Phasing of construction activities to minimise
concurrent operation of PME; and
·
Minimise number of PME working concurrently;
·
Erect temporary noise barriers at required locations,
and provision of acoustic enclosure for stationary emission sources;
·
Good site practice and noise management
5.3.16 These standard
noise mitigation measures have been proven to be practical and practicable in
mitigating noise impact generated from PME.
Local contractors have demonstrated through similar projects that the
implementation of these standard noise mitigation measures in alleviating
construction noise impact will not affect the completion of the works within
scheduled timeframe.
Selecting Quiet PME
5.3.17
Silenced types of equipments are locally available for certain PMEs for
use in construction activities. Based
on the preliminary PME inventory, reduced SWL for a number of quieter plants
were identified from TM1 or BS5228 (Part 1 : 1997) Noise and vibration control on
construction and open sites (BS5228) for the purpose of the assessment. These quiet PME which are known to be
locally available and adopted in the assessment are given below:
PME
|
Reference and SWL
|
|
Excavator
|
BS5228 Table C3/97 -
105dB(A) max;
|
|
Lorry
|
BS5228 Table C3/59 -
105dB(A) max;
|
|
Dump Truck
|
BS5228 Table C9/27 -
105dB(A) max;
|
|
Sheet Pile Vibrator
|
BS5228 Table C4/9 –
111dB(A) max;
|
|
Poker
|
BS5228 Table C6/43 –
105dB(A) max;
|
|
Saw
|
BS5228 Table C7/75 –
105dB(A) max;
|
|
Generator
|
TM CNP102 - 100 dB(A) max
|
5.3.18
Use of quiet plants in construction works have been demonstrated in
many other construction projects requiring noise mitigation to be practical and
practicable without affecting the target construction programmes. It is recommended that the future contractor
appointed for the project should to be required to diligently seek equivalent
models of silenced PMEs with a SWL similar to or less than that presented for
the above PMEs, and quiet model of other PMEs as far as practicable.
5.3.19
Table 5‑7 sets out the mitigated noise levels predicted at the
RAPs when silenced PME with the reduced SWL presented above are in use. Worksheets showing calculation of noise
levels at the RAP are provided in Appendix 5-2 for reference.
5.3.20
It can be noted from Table 5‑7 that by adopting the available quiet PMEs, the noise
levels at the NSRs will be reduced.
Especially, noise levels radiated from the foundation works at TW-1 will
also be alleviated to meet Leq(30min.) 75dB(A) (i.e. the noise limit
is satisfied at all nearby residential blocks). By comparison of Table 5-7 with Table 5-6, it can also be noted
that noise impact at IV-2 can also be reduced for about 1 to 4dB(A) when the
quiet PMEs are in use.
Table 5‑7 Mitigated
Noise Level Predicted at the Representative NSRs (with silenced PMEs)
|
|
Construction Stages
|
|
Foundation
|
Sheet Piling and Pile Cap Construction
|
Superstructure Construction
|
|
RAPs
|
Construction
|
S1
|
S2
|
S3
|
S4
|
S5
|
S6
|
|
IV-2 (1/F)
|
81
|
72
|
73
|
73
|
77
|
74
|
77
|
|
IV-2 (3/F)
|
81
|
71
|
73
|
73
|
77
|
74
|
77
|
|
IV-2 (5/F)
|
81
|
71
|
73
|
73
|
77
|
74
|
77
|
|
TW-1 (1/F)
|
75
|
65
|
66
|
67
|
70
|
67
|
71
|
|
TW-1 (15/F)
|
75
|
65
|
66
|
67
|
70
|
67
|
71
|
|
TW-1 (30/F)
|
74
|
65
|
66
|
67
|
70
|
67
|
71
|
|
HF-1 (1/F)
|
70
|
61
|
62
|
62
|
66
|
63
|
66
|
|
HF-1 (10/F)
|
70
|
61
|
62
|
62
|
66
|
63
|
66
|
|
HF-1 (20/F)
|
70
|
61
|
62
|
62
|
66
|
63
|
66
|
S1 – scenario 1 : concurrent
operation of Groups 1, 2 & 3 PMEs in Table 5-4;
S2 – scenario 2 : concurrent
operation of Groups 1, 2 & 4 PMEs in Table 5-4;
S3 – scenario 3 : concurrent
operation of Groups 1, 2, 3 & 4 PMEs in Table 5-4;
S4 – scenario 4 : concurrent
operation of Groups 1, 2 & 3 PMEs in Table 5-5;
S5 – scenario 5 : concurrent
operation of Groups 1, 2 & 4 PMEs in Table 5-5;
S6 – scenario 6 : concurrent
operation of Groups 1, 2, 3 & 4 PMEs in Table 5-5
Phasing of Construction Activities
& Reduce Number of Equipment working concurrently
5.3.21 Noise
levels presented in Table 5-7 were obtained by assuming simultaneous operation
of different groups of PMEs. In reality, this is unlikely as equipments serving
different purpose are expected to be in use in sequence rather than operating
concurrently. Taking into account the
common work sequence in the assessment, as shown in Appendix 5-3, equipment
involved in the foundation works can be sub-divided into the following two main
groups:
·
PME Group 1 - Bored piling (oscillator), piling
(reverse circulation driller), generator, excavator and lorry.
·
PME Group 2 – Crawler crane, concrete lorry mixer and
dump truck.
5.3.22 Besides,
with regard to the superstructure construction phase, it is expected that the
equipment groups used concurrently can be sub-divided into the following two
series: PME Groups 1, 2 and 3, or PME Groups 1, 2 and 4 after taking into
consideration the nature of the construction activities involved.
5.3.23 In
addition to phasing of construction activities, the number of similar PMEs
operating simultaneously can be controlled to further alleviate the noise
impact. Thus, during the foundation
stage, it is expected that the noise levels at the RAPs can be further reduced
when the number of concurrently working large diameter bored piles and crawler
crane can be reduced for PME Groups 1 and 2; for the superstructure
construction stage, the noise levels at the RAPs can be alleviated with reduction
in number of concrete lorry mixer, saw and planer working simultaneously within
a 30-minute period.
5.3.24 Table
5-8 presents the further mitigated noise levels when the above additional noise
mitigation measures, including phasing of construction activities and reduce
number of equipment operating simultaneously, are applied.
Table
5‑8 Predicted Noise Level at the Representative NSRs (with silenced PME,
phasing of activities and reduction in number of PME operating simultaneously)
|
|
Construction Stages
|
|
Foundation Construction
|
Sheet Piling and Pile Cap Construction1
|
Superstructure Construction
|
|
RAPs
|
P1
|
P2
|
S1
|
S2
|
S3
|
S4
|
S5
|
|
IV-2 (1/F)
|
75
|
75
|
72
|
73
|
73
|
75
|
73
|
|
IV-2 (3/F)
|
75
|
75
|
71
|
73
|
73
|
75
|
73
|
|
IV-2 (5/F)
|
75
|
75
|
71
|
73
|
73
|
75
|
72
|
|
TW-1 (1/F)
|
69
|
69
|
65
|
66
|
67
|
68
|
66
|
|
TW-1 (15/F)
|
69
|
69
|
65
|
66
|
67
|
68
|
66
|
|
TW-1 (30/F)
|
68
|
68
|
65
|
66
|
67
|
68
|
66
|
|
HF-1 (1/F)
|
65
|
64
|
61
|
62
|
62
|
64
|
62
|
|
HF-1 (10/F)
|
64
|
64
|
61
|
62
|
62
|
64
|
62
|
|
HF-1 (20/F)
|
64
|
64
|
61
|
62
|
62
|
64
|
62
|
P1 – cumulative noise levels
when Group 1 PMEs presented in Paragraph 5.3.27 are in use;
P2 - cumulative noise levels
when Group 1 PMEs presented in Paragraph 5.3.27 are in use;
S1 – scenario 1 : concurrent
operation of Groups 1, 2 & 3 PMEs in Table 5-4;
S2 – scenario 2 : concurrent
operation of Groups 1, 2 & 4 PMEs in Table 5-4;
S3 – scenario 3 : concurrent
operation of Groups 1, 2, 3 & 4 PMEs in Table 5-4;
S4 – scenario 4 : concurrent
operation of Groups 1, 2 & 3 PMEs in Table 5-5;
S5 – scenario 5 : concurrent
operation of Groups 1, 2 & 4 PMEs in Table 5-5;
1 Noise levels as presented in Table 5-7 i.e. mitigated noise levels when
silenced PMEs only are in use.
5.3.25 The
assessment results presented above demonstrated that with the consideration of
phasing of construction activities and reduction in number of certain noisy
equipment operating simultaneously under the planned construction programme,
noise levels at IV-2 during the foundation stage can be reduced up to 6dB(A),
while up to 2dB(A) can be reduced for the superstructure construction phase.
5.3.26 The
provision of these additional noise mitigation measures will also benefit the
NSRs represented by TW-1 and HF-1.
5.3.27 The
mitigated noise levels indicated that IV-2 would still be affected, given its
closer distance and the more stringent noise limit.
Use of Temporary Noise Barriers and
Machinery Enclosures
5.3.28 The erection of
noise barriers between major noise sources and affected NSRs at required
locations will be effective in reducing the potential construction noise
impact.
5.3.29 The
minimum effective height of noise barriers should be as such that no part of
the noise source should be visible from the target NSRs to be protected. The guidelines given in the Booklet entitled
“A Practical Guide for the Reduction of Noise from Construction Works” issued
by EPD is recommended to be referenced to in the detailed design of the
temporary acoustic barriers by the contractor. Barriers should have no openings
or gaps, and preferably have a superficial surface density of at least 7 kg/m2. Where required, temporary barriers of sufficient
height with skid footing and a cantilevered upper portion can be erected within
a few meters from stationary plants, and at practicable distance from mobile
plants operating over a small area or using a well defined route, to alleviate
potential construction noise impact. In accordance with BS5228, proper use of
barriers for PME can achieve a noise reduction of 10dB(A) when the noise screen
completely hides the sources from the receiver; and of 5dB(A) when the top of
the plant is just visible to the receiver over the noise barrier.
5.3.30 For
protection of the low-rise IVE (Chai Wan) located at about 80m to the west of
the site, a 6m high vertical noise barrier (or equivalent, if a cantilever type
noise barrier is adopted) is recommended to be erected at the western site
boundary along Shing Tai Road to shield the noise generated from noise
activities generated behind the barrier.
As confirmed with the Project Engineer, the required noise barrier can
be incorporated into the design of the site hoarding along Shing Tai Road. For maintaining the acoustic shielding
effectiveness of the temporary noise barrier proposed, vehicular access to the
construction site shall not be positioned at Shing Tai Road as far as practicable. Figure 5-2 and Figure 5-3 show the location
and preliminary design of the temporary noise barrier to be erected during the
construction phase at the western site boundary along Shing Tai Road.
5.3.31 The
erection of the fixed noise barrier at the western site boundary will allow a
maximum noise reduction of 10dB(A) for those NSRs that are fully screened from
the noise sources by the barriers located at ground level. To be conservative in the assessment, a
noise reduction effect of -5dB(A) has only been applied in the calculation.
5.3.32 In addition to the
temporary noise barriers, certain types of PME such as generators and
compressors can be totally shielded by machinery enclosures. A transmission loss of 10dB(A) for noise
enclosure has been conservatively applied in the study.
5.3.33 Table 5‑9 presents the further mitigated noise levels predicted
at the RAPs when the noise reduction effect of the temporary noise barrier
erected at the western site boundary and provision of machinery enclosures are
considered in the calculation.
Worksheets showing the calculation at the RAPs are provided in Appendix
5-4 for reference.
5.3.34 If
required, additional movable noise barriers can be temporarily erected at
specific locations within the site in the proximity of noisy work areas, when
generation of high noise levels is expected to be associated with certain
construction activities, or identified through the Environmental Monitoring and
Audit (EM&A) progamme.
Table 5‑9 Mitigated
Noise Levels at the RAPs (with silenced PME, phasing of activities and
reduction in number of PME, fixed noise barrier and machinery enclosures)
|
|
Construction Stages
|
|
Foundation Construction2
|
Sheet Piling and Pile Cap Construction1
|
Superstructure Construction3
|
|
RAPs
|
P1
|
P2
|
S1
|
S2
|
S3
|
S4
|
S5
|
|
IV-2 (1/F)
|
70
|
70
|
67
|
68
|
68
|
70
|
69
|
|
IV-2 (3/F)
|
70
|
70
|
67
|
68
|
68
|
70
|
69
|
|
IV-2 (5/F)
|
70
|
70
|
67
|
68
|
68
|
70
|
69
|
|
TW-1 (1/F)
|
69
|
69
|
65
|
66
|
67
|
68
|
66
|
|
TW-1 (15/F)
|
69
|
69
|
65
|
66
|
67
|
68
|
66
|
|
TW-1 (30/F)
|
68
|
68
|
65
|
66
|
67
|
68
|
66
|
|
HF-1 (1/F)
|
65
|
64
|
61
|
62
|
62
|
64
|
62
|
|
HF-1 (10/F)
|
64
|
64
|
61
|
62
|
62
|
64
|
62
|
|
HF-1 (20/F)
|
64
|
64
|
61
|
62
|
62
|
64
|
62
|
S1 – scenario 1 : concurrent operation of Groups 1, 2
& 3 PMEs in Table 5-4;
S2 – scenario 2 : concurrent operation of Groups 1, 2
& 4 PMEs in Table 5-4;
S3 – scenario 3 : concurrent operation of Groups 1, 2,
3 & 4 PMEs in Table 5-4;
S4 – scenario 4 : concurrent operation of Groups 1, 2
& 3 PMEs in Table 5-5;
S5 – scenario 5 : concurrent operation of Groups 1, 2
& 4 PMEs in Table 5-5.
1 Noise levels as presented in Table 5-7 for TW-1 and HF-1 i.e. mitigated
noise levels when silenced PMEs are in use;
2 Noise levels as presented in Table 5-8 for TW-1 and HF-1 i.e. mitigated
noise levels when silenced PMEs, phasing of activities and reduction in number
of PME operating simultaneously are applied;
3 Noise levels as presented in Table 5-8 for TW-1 and HF-1 i.e. mitigated
noise levels when silenced PMEs, phasing of activities and reduction in number
of PME operating simultaneously are applied;
5.3.35 The
results of the calculations revealed that with the combined application of
quiet PMEs, implement phasing of construction activities, reduce number of the
operating simultaneously, and use of temporary noise barrier and machinery
enclosures, the construction noise levels at the RAPs can be alleviated to
acceptable levels. The implementation
of the recommended and sufficient noise mitigation measures by the contractor
can be checked through the recommended Environmental Monitoring and Audit
(EM&A) Programme.
5.3.36 As
recommended in the EM&A programme presented in the Environmental Management
Plan (EMP), the Environmental Team (ET) leader shall liaise with the
representative of IVE (Chai Wan) and the Examination Authority to ascertain the
exact time periods of all examination periods during the execution of
construction works. During the examination periods, the Contractor shall liaise
with the ET and the representative of IVE (Chai Wan) to ensure that sufficient/
additional noise mitigation measures are applied to further reduce the noise
impact to meet the more stringent noise limit.
5.3.37 Other
practicable noise mitigation measures are also identified and are recommended
below for implementation to ensure full protection of the nearby NSRs.
Other Recommended Noise Mitigation
Measures
5.3.38 To be
prudent in the construction noise management, the following additional noise
mitigation and good site practices are recommended for implementation.
·
the
Contractor shall comply with and observe the Noise Control Ordinance (NCO) and
its current subsidiary regulations;
·
before
the commencement of any work, the Contractor shall submit to the Engineer for
approval the method of working, equipment and sound-reducing measures intended
to be used at the site;
·
the
Contractor shall devise and execute working methods that will minimise the
noise impact on the surrounding environment; and shall provide experienced
personnel with suitable training to ensure that these methods are implemented;
·
only
well-maintained plants should be operated on-site;
·
plants
should be serviced regularly during the construction programme;
·
machines
that may be in intermittent use should be shut down or throttled down to a
minimum between work periods;
·
silencer
and mufflers on construction equipment should be utilised and should be
properly maintained during the construction programme;
·
noisy
activities can be scheduled to minimise exposure of nearby NSRs to high levels
of construction noise. For example,
noisy activities can be scheduled for midday or at times coinciding with
periods of high background noise (such as during peak traffic hours);
·
noisy
equipment such as emergency generators shall always be sited as far away as
possible from noise sensitive receivers;
·
mobile
plants should be sited as far away from NSRs as possible; and
·
material
stockpiles and other structures should be effectively utilised as noise
barrier, where practicable.
EM&A Requirements
5.3.39 Implementation
of sufficient noise mitigation measures is identified to be required for the
protection of certain NSRs located in the proximity of the development
site. In order to check for the
implementation of sufficient noise mitigation measures by the contractor, a
construction phase noise monitoring and audit programme is recommended. Details
on the noise monitoring and audit (EM&A) requirements, methodology and
action plans are described in the Environmental Management Plan (EMP) submitted
under a separate cover.
5.4
Operational Fixed Noise
Impact Assessment
Legislation and Assessment Criteria
5.4.1 Noise
standards required to be met at NSRs for noise generated from fixed noise
sources are stated in the Technical
Memorandum for the Assessment of Noise from Places other than Domestic
Premises, Public Places or Construction Sites (TM4). In order to plan for a better environment, in accordance with the
requirements under Table 1 in Annex 5 of the EIAO-TM, the maximum noise
level arising from the noise sources, measured in terms of Leq(30 min) at
the NSRs shall be 5 dB(A) below the Acceptable Noise Level (ANL) as specified
in TM4.
5.4.2 In
determining the ANL, appropriate Area Sensitivity Rating (ASR) for a NSR have
to be established first. Section 2.3.4 of the TM specifies that the Area
Sensitivity Rating depends upon the characteristics of the area in which the
NSRs are located. There are four types
of areas described in the TM which are summarised in Table 5-9 below. An ASR “B” was assumed for residential
blocks of Heng Fa Chuen assessed in this study. As the IVE (Chai Wan) is located in less than 100m from the
boundary of the Chai Wan East Industrial Area, assuming an ASR “C” is
considered appropriate. The annual
average daily traffic flows on Wing Tai Road is over 30,000 veh/day based on
the Annual Traffic Census issued by Transport Department in recent years. An ASR “C” was therefore also assumed at the
facades of the blocks of Tsui Wan Estate directly facing Wing Tai Road in
accordance with TM4.
5.4.3 In
any event, the Area Sensitivity Rating assumed in this EIA Study is for
indicative assessment only given that details on the design/ building layouts
of the future developments at the Chai Wan East Industrial Area are not
available at this early planning design.
It should be noted that fixed noise sources are controlled under section
13 of the NCO. At the time of
investigation, the Noise Control Authority shall determine noise impact from
concerned fixed noise sources on the basis of prevailing legislation and
practices being in force, and taking account of contemporary conditions /
situations of adjoining land uses. Nothing in this EIA Report shall bind the
Noise Control Authority in the context of law enforcement against all the fixed
noise sources being assessed.
Table 5‑10 Area
Sensitivity Ratings of NSRs
|
Type of Area Containing NSR
|
Degree to which NSR is affected by Influencing
Factors (Ifs)
|
|
|
Not Affected
|
Indirectly Affected
|
Directly Affected
|
|
(i)
Rural area, including country parks, or village type developments
|
A
|
B
|
B
|
|
(ii)
Low density residential area consisting of low-rise or isolated
high-rise developments
|
A
|
B
|
C
|
|
(iii) Urban area
|
B
|
C
|
C
|
|
(iv) Area other than
those above
|
B
|
B
|
C
|
5.4.4 For
ASR “B”, the ANL for the daytime/ evening (0700-2300) and night-time (2300-0700
next day) periods measured at 1m in front of the building facade of the NSR
shall be Leq(30min.) 65 dB(A) and 55 dB(A), respectively. Taking into account the EIAO-TM
requirements, a “5dB(A) margin has been applied to the noise limits stipulated
in the TM. The noise assessment criteria, “Acceptable Noise Level (ANL) – 5
dB(A)” criteria, adopted in the study are therefore Leq(30min.) 60dB(A)
and 50dB(A) during the daytime/ evening and nighttime periods,
respectively. For ASR “C” the
applicable “ANL – 5dB(A)” criteria are Leq(30min.) 65dB(A) and
55dB(A) during daytime/ evening and nighttime, respectively.
Assessment
Approach
5.4.5 The
assessment on fixed plant noise impact was conducted based on consideration of
standard acoustics principles presented in TM4 and are summarized below:
(i)
Based on the preliminary design layout plans and equipment
inventory required to be provided at the new facility, identify the key noise
sources of potential concern;
(ii)
Estimate the sound power levels (SWL) associated with
operation of each of these activities based on available measurement results
obtained at an existing bus depot;
(iii)
Calculate the Corrected Noise Level (CNL) at selected
representative NSRs based on consideration of distance attenuation, noise
shielding effect, and façade correction;
(iv)
Compare the CNL with the relevant noise criteria and recommend
noise mitigation measures if necessary.
Identified Noise Sources and
Calculation
5.4.6 The
consultants visited the existing, temporary bus depot of Citybus located at
Aldrich Bay on 19 December 2001 in the morning, 15 February 2001 near mid-night
and 12 June 2001 in the evening. The
fixed noise sources that could be of concern during the operational phase of
the proposed bus depot were identified to include:
·
Brake
testing;
·
Bus
parking/ leaving;
·
Engine
testing at maintenance bays;
·
Bus
washing bays
5.4.7 In
addition to the above noise sources, potential noise impact from air charging
before bus leaving has been taken into consideration in the study as a
conservative approach, through it is understood that new models of bus
currently in use normally do not require such operation as the old buses. The taking into consideration of air
charging in the assessment therefore represents one conservative approach to
the assessment.
5.4.8 Other
operational activities such as bus refueling and general maintenance and
repairing activities were not identified to be potential noise sources of concern
as confirmed during the site visit to the existing bus depot.
5.4.9 Noise
measurements were conducted by the consultants during the site visits using a
calibrated Bruel & Kjaer Type 2236 Noise Meter. Noise levels were measured taking into consideration the acoustic
principle as presented in the International Standard ISO 3766 : Acoustics –
Determination of sound power levels of noise sources using sound pressure –
survey method using an enveloping measurement surface over a reflecting plane. All measurement positions have been selected
such that the radius of the hemispherical measurement surface is greater than
twice the length of the noise sources.
Repeated measurements were carried out and the highest noise levels
measured or reported were adopted for the calculation.
5.4.10 Acoustic
data associated with operation of bus washing bays, brake testing, and engine
testing at maintenance bays were obtained by making reference to the approved
EIA Report for NWFB permanent Depot at Chai Wan and tested to be conservative
through noise measurement results. For
air charging and bus parking/ leaving, sound exposure levels (SEL) were
measured for prediction of the SEL associated with each of these activities and
the cumulative noise levels at the assessment points. Appendix 5-5 presents a summary of the source terms considered in
the assessment.
5.4.11 Table
5-10 summarises the acoustic characteristics of the identified noise sources
that are expected to be associated with the future operation of the bus
depot. Locations and numbers of noise
sources were identified based on the number of facilities as presented in the
preliminary design layout plans given in Figure 3-3 through Figure 3-8.
Table
5‑11 Identified Noise Sources associated with the Depot Operation
|
Activities
|
Noise
Level, dB(A) (i)
|
Location
|
Max. no. of
sources within a 30min. period (ii)
|
|
|
Daytime/
Evening
|
Nighttime
|
|
Brake
testing
|
98.6 (SWL)
|
G/F
|
4
|
4
|
|
Bus parking
|
83.2 (SEL)
|
3/F
|
33(iii)
|
43(iv)
|
|
Air
charging
|
83.1 (SEL)
|
3/F
|
33(iii)
|
43(iv)
|
|
Maintenance
area – engine testing
|
98.6 (SWL)
|
G/F
|
5
|
5
|
|
Maintenance
area – engine testing
|
98.6 (SWL)
|
1/F
|
10
|
5
|
|
Bus washing
bay
|
88.4 (SWL)
|
G/F
|
2
|
2
|
|
Bus washing
bay
|
88.4 (SWL)
|
3/F
|
1
|
1
|
(i) SWL values based on the approved EIA report for NWFB
Permanent Depot and tested through measurements. SEL values were based on repeated measurements at existing
Citybus depot at Aldrich Bay;
(ii) Conservatively estimated based on the number
facilities provided as shown in the design layout and the nature of the
activities in terms of likelihood of occurrence of concurrent noise sources;
(iii) Based on the maximum number of buses entering the bus
depot during the evening time period;
(iv) Based on the maximum number of buses leaving the roof
level bus parking space during early morning within a 30 minute period
Planned Shielding Structures
5.4.12 In the
presence of the future LPG/ Petrol Filling Station and Hong Kong Post Super
Centre on the northern and southern sides of the development site, these sides
of the bus depot is planned to be constructed with a solid concrete façade
without openings. A correction of
–10dB(A) has therefore been applied to account for the noise shielding effect
for noise sources located on G/F and 1/F in the prediction of the noise levels
at TW1 and HF-1 as the sightline from these NSRs to the noise sources will be
fully blocked. Besides, to account for
the partial shielding effect provided by the parapet walls and other building
structures along the northern façade of the development, a –5dB(A) correction
has been applied to noise sources located on G/F and 1/F.
5.4.13 As a
prudent approach in avoiding potential fixed noise impact, it is planned to
erect a 3m high vertical wall along the northern, western and southern façades
of the bus depot building at the roof level.
Figure 5-4 shows the location of the planned 3m high noise barrier. The height of this barrier will be effective
in providing full shielding to the top noise sensitive floor (i.e. 5/F) of IVE
(Chai Wan) such as a noise reduction effect of 10dB(A) is achievable. To be prudent in the noise assessment, a
noise reduction of 5dB(A) only was applied in the calculation.
5.4.14 NSRs
located at low levels at Tsui Wan Estate and Heng Fa Chuen are also expected to
be shielded by the proposed 3m high noise barriers erected at the roof
level. As a conservative approach to
the study, a - 5dB(A) correction has only been applied in the calculation of
the noise level at the lowest floor studied.
No correction was applied to those floors not directly shielded by the
noise barriers.
Representative
Assessment Points
5.4.15 The
RAPs selected for the assessment include IV-2, TW-1 and HF-1 which represent
the nearest NSRs. Locations of these
RAPs can be found in Figure 5-1.
Assessment Results
5.4.16 Table
5-12 presents the highest noise levels predicted at the RAPs during daytime/
evening and the nighttime periods.
Spreadsheets showing the calculations are presented in Appendix 5-5.
Table
5‑12
Predicted Noise Levels at the NSRs due to Depot Operation
|
RAPs
|
NSRs
|
Predicted noise level, Leq(30min.) dB(A)
|
Noise Assessment Criteria
|
|
|
|
Daytime/ evening (D/E)
|
Nighttime (N)
|
D/E
|
N
|
|
IV-2 (1/F)
|
IVE (Chai Wan)
|
59
|
|
|
|
|
IV-2 (3/F)
|
IVE (Chai Wan)
|
59
|
N/A
|
65
|
N/A
|
|
IV-2 (5/F)
|
IVE (Chai Wan)
|
59
|
|
|
|
|
TW-1 (4/F)
|
Tsui Sau House, Tsui Wan Estate
|
48
|
48
|
|
|
|
TW-1 (6/F)*
|
Tsui Sau House, Tsui Wan Estate
|
50
|
50
|
65
|
55
|
|
TW-1 (30/F)*
|
Tsui Sau House, Tsui Wan Estate
|
50
|
50
|
|
|
|
HF-1 (4/F)
|
Heng Fa Chuen
|
45
|
44
|
|
|
|
HF-1 (6/F)*
|
Heng Fa Chuen
|
46
|
46
|
60
|
50
|
|
HF-1 (20/F)*
|
Heng Fa Chuen
|
46
|
46
|
|
|
N/A – The Institute is not expected to be in operation during nighttime
(2300 to 0700hrs);
* Predicted noise level when no noise reduction effect of the noise
barriers (presented in Figure 5-4) has been applied.
5.4.17 As
shown in Table
5‑12, the predicted noise levels are all in compliance
with the relevant noise assessment criteria i.e. Leq(30min.) 60dB(A)
and 50dB(A) during daytime/evening and nighttime respectively for HF-1; Leq(30min.)
65dB(A) and 55dB(A) during daytime/evening and nighttime respectively for HF-1;
and the daytime/ evening noise limit of 65dB(A) applicable at IV-2. Noise impact on IV-2 during nighttime is not
expected to be a concern as the Institute would not be in operation.
5.4.18 The
northern and southern facades of the bus depot building will be constructed
with solid concrete wall without openings.
A 3m high vertical solid wall will also be erected at the northern,
western and southern boundary at the roof bus parking level of the bus depot as
a noise control measure. With these effective noise control measures in place,
the assessment findings calculated based on a conservative approach has
demonstrated that with the planned design of the bus depot, the nearby noise sensitive
receivers will unlikely be subject to unacceptable fixed noise impact.
5.5
Operational Off-site
Traffic Noise Impact Assessment
Bus
Routing and Traffic Forecast
5.5.1 Operation
of the proposed bus depot will inevitably generate some additional traffic
(buses) on the adjacent road carriageways.
This section presents an assessment on the potential noise contribution
from the operation of the bus depot.
5.5.2 As
a proactive approach in avoiding potential traffic and traffic noise impact, a
bus routing plan has been agreed with the Government through the TIA. Based on the agreed plan, buses commuting
between the depot and Siu Sai Wan area will be required to route through the
future Sheung On Street Extesion (connecting Sheung On Street and Road 20/4) in
leaving/ returning to the depot in normal operating conditions, instead of
allowed to use Wing Tai Road and Shing Tai Road at all time periods. Citybus will require its employees to
strictly follow this requirement agreed with TD. The agreed bus routing plan is as shown in Figure 3-2.
5.5.3 Bus
ingress/ egress flows in the vicinity road carriageways during the early
morning peak (0530 to 0630) and mid-night peak (2300 to 0000) were predicted by
the Project Traffic Consultant. With
the bus flow data and consideration of other future landuses in the area,
including the NWFB depot, the 2003 and 2018 traffic forecast (traffic flows and
percentage of heavy vehicles) at early morning peak (0530 to 0630) and
mid-night peak (2300 to 0000) were projected by the Project Traffic Consultant
and agreed with TD for two scenarios – “with proposed bus depot” and “without
proposed bus depot”. These traffic
forecast data are presented in Table
5‑13 and Table
5‑14. In the preparation of the traffic forecast, the
Traffic Consultant has taken into account the data presented in the approved
EIA reported carried out for NWFB Permanent Depot in Chai Wan to ensure that a
consistent and conservative approach is being followed. Relevant correspondence
showing the endorsement of the traffic forecast data by the Authority is
presented in Appendix 5-6. Alignment of
the road carriageways can be found in Appendix 4-3.
Table
5‑13 Year 2003 Traffic Forecast
|
Label
|
Morning Peak Leaving
|
Nighttime Peak Return
|
|
All Traffic
|
Without Bus Depot
|
All Traffic
|
Without Bus Depot
|
|
veh/hr
|
% of HV
|
veh/hr
|
% of HV
|
veh/hr
|
% of HV
|
veh/hr
|
% of HV
|
|
A
|
296
|
75.7
|
223
|
72.5
|
624
|
55.4
|
504
|
51.1
|
|
B
|
134
|
55.7
|
129
|
51.5
|
351
|
53.1
|
291
|
50.8
|
|
C
|
118
|
74.2
|
118
|
74.2
|
37
|
6.2
|
37
|
6.2
|
|
D
|
285
|
58.4
|
217
|
49.5
|
359
|
34.1
|
299
|
31.0
|
|
E
|
512
|
45.5
|
512
|
45.5
|
875
|
13.7
|
875
|
13.7
|
|
F
|
736
|
43.0
|
736
|
43.0
|
1262
|
22.4
|
1262
|
22.4
|
|
G
|
228
|
84.1
|
160
|
80.7
|
364
|
48.3
|
304
|
46.3
|
|
H
|
2584
|
30.2
|
2511
|
27.2
|
2342
|
41.3
|
2222
|
38.3
|
|
I
|
62
|
85.0
|
62
|
85.0
|
37
|
82.0
|
37
|
82.0
|
|
J
|
85
|
85.0
|
80
|
75.0
|
317
|
82.0
|
257
|
72.0
|
|
K
|
35
|
85.0
|
13
|
53.0
|
49
|
82.0
|
9
|
27.0
|
|
L
|
161
|
72.5
|
161
|
72.5
|
397
|
55.4
|
397
|
55.4
|
|
M
|
177
|
72.5
|
177
|
72.5
|
400
|
55.4
|
400
|
55.4
|
|
N
|
2584
|
30.2
|
2511
|
27.2
|
2342
|
41.3
|
2222
|
38.3
|
|
O
|
275
|
62.3
|
275
|
62.3
|
420
|
44.2
|
420
|
44.2
|
|
P
|
1999
|
29.9
|
1999
|
29.9
|
1347
|
41.1
|
1347
|
41.1
|
|
Q
|
20
|
10.0
|
20
|
10.0
|
20
|
10.0
|
20
|
10.0
|
|
R
|
20
|
10.0
|
20
|
10.0
|
20
|
10.0
|
20
|
10.0
|
Table
5‑14 Year2018 Traffic Forecast
|
Label
|
Morning Peak Leaving
|
Nighttime Peak Return
|
|
All Traffic
|
Without Bus Depot
|
All Traffic
|
Without Bus Depot
|
|
veh/hr
|
% of HV
|
veh/hr
|
% of HV
|
veh/hr
|
% of HV
|
veh/hr
|
% of HV
|
|
A
|
332
|
75.7
|
259
|
72.5
|
734
|
55.4
|
614
|
51.1
|
|
B
|
171
|
55.7
|
166
|
51.5
|
346
|
53.1
|
286
|
50.8
|
|
C
|
160
|
74.2
|
160
|
74.2
|
50
|
6.2
|
50
|
6.2
|
|
D
|
306
|
58.4
|
238
|
49.5
|
368
|
34.1
|
308
|
31.0
|
|
E
|
565
|
45.5
|
565
|
45.5
|
889
|
13.7
|
889
|
13.7
|
|
F
|
835
|
43.0
|
835
|
43.0
|
1325
|
22.4
|
1325
|
22.4
|
|
G
|
249
|
84.1
|
181
|
80.7
|
368
|
48.3
|
308
|
46.3
|
|
H
|
3086
|
30.2
|
3013
|
27.2
|
2564
|
41.3
|
2444
|
38.3
|
|
I
|
114
|
85.0
|
114
|
85.0
|
68
|
82.0
|
68
|
82.0
|
|
J
|
162
|
85.0
|
157
|
75.0
|
647
|
82.0
|
587
|
72.0
|
|
K
|
47
|
85.0
|
25
|
53.0
|
85
|
82.0
|
45
|
27.0
|
|
L
|
212
|
75.7
|
212
|
75.7
|
477
|
55.4
|
477
|
55.4
|
|
M
|
232
|
75.7
|
232
|
75.7
|
481
|
55.4
|
481
|
55.4
|
|
N
|
3086
|
30.2
|
3013
|
27.2
|
2564
|
41.3
|
2444
|
38.3
|
|
O
|
284
|
62.3
|
284
|
62.3
|
433
|
44.2
|
433
|
44.2
|
|
P
|
2694
|
29.9
|
2694
|
29.9
|
1654
|
40.2
|
1654
|
40.2
|
|
Q
|
20
|
10.0
|
20
|
10.0
|
20
|
10.0
|
20
|
10.0
|
|
R
|
20
|
10.0
|
20
|
10.0
|
20
|
10.0
|
20
|
10.0
|
Assessment
Criteria and Methodology
5.5.4 A
road traffic noise standard of L10(1-hr) 70dB(A) and L10(1-hr) 65dB(A)
for domestic premises and educational institutions respectively is specified in
Table 1 under Annex 5 of the EIAO-TM.
These noise limits are meant for the hour having the overall peak
traffic flows, and apply to uses which rely on opened windows for ventilation. They are therefore not directly applicable
in the current study for the hours during which there will be maximum number of
buses returning and/or leaving the bus depot.
5.5.5 In
order to assess if the operation of the proposed bus depot would result in a
significant increase in the overall noise levels on the nearby NSRs, a comparison
of the traffic noise levels during early morning peak and mid-night peak for
the “with bus depot” and “without bus depot” scenarios were considered with the
2003 and 2018 traffic forecast. Noise
contribution from the bus depot is considered insignificant when the difference
is less than 1.0dB(A) based on consideration of basis acoustic principle.
5.5.6 The
methods described in the U.K. Department of Transport’s “Calculation of Road
Traffic Noise (1988)” have been used in the prediction of traffic noise at the
NSRs.
Representative
Assessment Points
5.5.7 Locations
of the representative assessment points (RAPs) selected for the traffic noise
impact assessment are as shown in Figure 5-1.
Although RAPs SH-3 and SH-4 located on the eastern façade of the IVE
Staff Quarters are not of concern as fixed windows are installed, noise levels
for the “with bus depot” and “without bus depot” scenarios have also been
predicted at these RAPs for reference.
Assessment
Results
5.5.8 Table 5‑15 to Table
5‑18 present a summary of the predicted 2003 and 2018
traffic noise levels at the RAPs for the “with bus depot” and “without bus
depot” scenarios during the early morning peak hour (0530 to 0630) and
mid-night peak hour (2300 to 0000).
Detailed results (noise levels predicted at different floors) are given
in Appendix 5-7.
Table
5‑15 Predicted
Noise Levels for the “with bus depot” and “without bus depot”scenarios during early
morning peak hour (0530 to 0630), L10(1-hr)
|
|
|
During Peak Hour Morning Leaving (dB(A))
|
Net Bus Noise Contribution (dB(A))
|
|
NSRs
|
Floors
|
All Traffic (year 2003)
|
No Buses (year 2003)
|
Year 2003
|
|
HF-1
|
1/F-20/F
|
66 – 67
|
65 – 67
|
0.1 – 0.2
|
|
HF-2
|
1/F-20/F
|
76 – 80
|
76 – 79
|
0.2 – 0.4
|
|
TW-1
|
1/F-30/F
|
71 – 77
|
71 – 77
|
0.1 – 0.2
|
|
TW-2
|
1/F-30/F
|
68 – 72
|
68 – 72
|
0.0 – 0.1
|
|
TW-3
|
1/F-30/F
|
69 – 72
|
69 – 72
|
0.1 – 0.2
|
|
TW-4
|
1/F-30/F
|
70 – 74
|
70 – 73
|
0.2 – 0.4
|
|
IV-1
|
1/F-5/F
|
75 – 78
|
74 – 78
|
0.4 – 0.5
|
|
IV-2
|
1/F-5/F
|
68 – 68
|
67 – 67
|
0.9 – 0.9
|
|
SH-1
|
1/F-25/F
|
71 – 72
|
70 – 72
|
0.4 – 0.4
|
|
SH-2
|
1/F-25/F
|
65 – 71
|
65 – 70
|
0.5 – 0.5
|
|
SH-3
|
1/F-25/F
|
64 – 66
|
64 – 65
|
0.2 – 0.3
|
|
SH-4
|
1/F-25/F
|
65 – 66
|
65 – 65
|
0.4 – 0.5
|
Table
5‑16 Predicted Noise Levels for
the “with bus depot” and “without bus depot”scenarios during mid-night peak
hour (2300 to 0000), L10(1-hr)
|
|
|
During Peak Hour Night-time Return (dB(A))
|
Net Bus Noise Contribution (dB(A))
|
|
NSRs
|
Floors
|
All Traffic (year 2003)
|
No Buses (year 2003)
|
Year 2003
|
|
HF-1
|
1/F-20/F
|
67 – 69
|
67 – 69
|
0.1 – 0.2
|
|
HF-2
|
1/F-20/F
|
76 – 80
|
76 – 80
|
0.5 – 0.5
|
|
TW-1
|
1/F-30/F
|
71 – 77
|
71 – 77
|
0.0 – 0.2
|
|
TW-2
|
1/F-30/F
|
69 – 72
|
69 – 72
|
0.1 – 0.2
|
|
TW-3
|
1/F-30/F
|
70 – 72
|
69 – 72
|
0.1 – 0.2
|
|
TW-4
|
1/F-30/F
|
70 – 74
|
70 – 73
|
0.2 – 0.4
|
|
IV-1
|
1/F-5/F
|
75 – 79
|
75 – 78
|
0.5 – 0.5
|
|
IV-2
|
1/F-5/F
|
70 – 70
|
69 – 69
|
0.9 – 0.9
|
|
SH-1
|
1/F-25/F
|
71 – 73
|
71 – 72
|
0.5 – 0.5
|
|
SH-2
|
1/F-25/F
|
66 – 72
|
65 – 71
|
0.5 – 0.6
|
|
SH-3
|
1/F-25/F
|
66 – 67
|
66 – 67
|
0.3 – 0.3
|
|
SH-4
|
1/F-25/F
|
67 – 68
|
67 – 68
|
0.4 –0.4
|
Table
5‑17 Predicted Noise Levels for
the “with bus depot” and “without bus depot”scenarios during early morning peak
hour (0530 to 0630), L10(1-hr)
|
|
|
During Peak Hour Morning Leaving (dB(A))
|
Net Bus Noise Contribution (dB(A))
|
|
NSRs
|
Floors
|
All Traffic (year 2018)
|
No Buses (year 2018)
|
Year 2018
|
|
HF-1
|
1/F-20/F
|
67 – 68
|
67 – 68
|
0.1 – 0.2
|
|
HF-2
|
1/F-20/F
|
77 – 80
|
76 – 80
|
0.4 – 0.4
|
|
TW-1
|
1/F-30/F
|
72 – 77
|
71 – 77
|
0.0 – 0.2
|
|
TW-2
|
1/F-30/F
|
69 – 73
|
69 – 72
|
0.1 – 0.1
|
|
TW-3
|
1/F-30/F
|
70 –73
|
70 – 73
|
0.0 – 0.2
|
|
TW-4
|
1/F-30/F
|
71 – 74
|
70 – 74
|
0.2 – 0.4
|
|
IV-1
|
1/F-5/F
|
75 – 79
|
75 – 78
|
0.4 – 0.4
|
|
IV-2
|
1/F-5/F
|
69 – 69
|
68 – 68
|
0.8 – 0.8
|
|
SH-1
|
1/F-25/F
|
71 – 73
|
71 – 73
|
0.4 – 0.5
|
|
SH-2
|
1/F-25/F
|
66 – 72
|
65 – 71
|
0.4 – 0.6
|
|
SH-3
|
1/F-25/F
|
65 – 67
|
65 – 67
|
0.2 – 0.3
|
|
SH-4
|
1/F-25/F
|
66 – 67
|
66 – 67
|
0.3 – 0.3
|
Table
5‑18 Predicted
Noise Levels for the “with bus depot” and “without bus depot”scenarios during
mid-night peak hour (2300 to 0000), L10(1-hr)
|
|
|
During Peak Hour Night-time Return (dB(A))
|
Net Bus Noise Contribution (dB(A))
|
|
NSRs
|
Floors
|
All Traffic (year 2018)
|
No Buses (year 2018)
|
Year 2018
|
|
HF-1
|
1/F-20/F
|
68 – 70
|
67 – 70
|
0.0 – 0.1
|
|
HF-2
|
1/F-20/F
|
77 – 81
|
76 – 80
|
0.4 – 0.5
|
|
TW-1
|
1/F-30/F
|
72 – 77
|
71 – 77
|
0.1 – 0.3
|
|
TW-2
|
1/F-30/F
|
69 – 73
|
69 – 72
|
0.1 – 0.2
|
|
TW-3
|
1/F-30/F
|
70 – 73
|
70 – 73
|
0.1 – 0.2
|
|
TW-4
|
1/F-30/F
|
70 – 74
|
70 – 74
|
0.2 – 0.4
|
|
IV-1
|
1/F-5/F
|
76 – 79
|
75 – 78
|
0.5 – 0.5
|
|
IV-2
|
1/F-5/F
|
71 – 71
|
70 – 70
|
0.8 – 0.8
|
|
SH-1
|
1/F-25/F
|
71 – 73
|
71 – 73
|
0.4 – 0.5
|
|
SH-2
|
1/F-25/F
|
66 – 72
|
66 – 71
|
0.5 – 0.6
|
|
SH-3
|
1/F-25/F
|
67 – 68
|
67 – 68
|
0.3 – 0.3
|
|
SH-4
|
1/F-25/F
|
68 – 69
|
68 – 69
|
0.4 – 0.4
|
5.5.9 A
comparison of the noise levels for the “with bus depot” and “without bus depot”
scenarios at the NSRs indicated that the noise contribution from buses is less
than 1.0dB(A) under both year 2003 and 2018 scenarios. The assessment results therefore
demonstrate that with the low level of traffic generation from the bus depot,
operation of the bus depot will unlikely introduce any unacceptable traffic
noise impact on the nearby NSRs for the short-term scenario and in the long
run.
5.6
Conclusion
Construction
Noise
5.6.1 The
construction noise impact assessment has been undertaken based on the
preliminary construction proramme and equipment inventory. Whilst the contractor appointed in future
may prefer to use different types and numbers of equipment in the construction
activities, the assessment has given information on individual and combined
SWLs of Powered Mechanical Equipment (PME) that could be used and the noise
mitigation measures required such that the overall noise levels at the NSRs can
be controlled to meet the daytime construction noise limits.
5.6.2 The
assessment results indicate that the implementation of a combination of noise
mitigation measures will be necessary to alleviate the construction noise
impact to acceptable levels. These
measures include the use of quiet equipment, temporary noise barriers, noise
enclosure, phasing of construction activities, reducing the numbers of
equipment operating concurrently and good site practice as well as noise
management.
5.6.3 Quantitative
assessments indicated that the combined use of the recommended noise mitigation
measures could alleviate the construction noise impact at all nearby NSRs to
levels satisfying the noise standards.
Sufficient mitigation measures shall be implemented to ensure that the
noise levels at the NSRs are controlled within Leq(30min.) 75dB(A).
5.6.4 Noise
monitoring has been recommended as part of the Environmental Monitoring and
Audit Programme and is described in the Environmental Management Plan (EMP).
Operational Phase Noise
5.6.5 Noise
control measures have been incorporated into the design of the bus depot as a
prudent approach. The northern and
southern side of the bus depot building will have blank façade, and a 3m high
solid wall will be erected alongside the northern, western and southern edge of
the bus depot building at the roof level.
The assessment on potential noise impact from fixed noise sources based
on a conservative approach indicates that noise generated from the depot
operation is not expected to be a concern.
All predicted noise levels are satisfying the relevant daytime/evening
and nighttime noise standards.
5.6.6 As
a prudent approach, potential off-site traffic noise impact has been avoided by
careful planning of the bus routing plan.
Buses from Siu Sai Wan approaching the depot and Siu Sai Wan bound buses
are required to route through the future Sheung On Street Extension and Road
20/4 at all time periods under normal operating conditions and use of Wing Tai
Road and Shing Tai Road will not be allowed.
Citybus will require its employees to strictly follow this requirement
when entering or leaving the bus depot.
5.6.7 A
comparison of the noise levels for the “with bus depot” and “without bus depot”
scenarios predicted with 2003 and 2018 traffic forecast indicated that traffic
noise contribution from buses generated from the depot on the background noise
levels on the adjacent road carriageways will be insignificant. Therefore, operation of the bus depot will
unlikely contribute any significant traffic noise impact on the nearby NSRs.
6.
Waste Management
6.1
Introduction
6.1.1 This
section identifies the types of waste likely to be generated during the
construction and operation of the proposed bus depot, and assesses the waste
management implications in accordance with the criteria and guidelines given in
Annex 7 and Annex 15 of the EIAO TM.
6.1.2 Implementation
of proper waste management during the construction phase is necessary. At this planning stage, appropriate disposal
method for each type of waste was identified, along with consideration of
opportunities for construction waste reduction, reuse or recycling. The potential impacts arising from the
handling, collection, and disposal of construction wastes and the environmental
mitigation measures required to mitigate these environmental impacts were
identified and recommended.
6.1.3 The
operation of the proposed bus depot is expected to generate limited and similar
types of wastes as many other industrial undertakings. Significant environmental impact is not
anticipated. Nevertheless, requirements
on proper chemical waste management have been identified for future implementation.
6.2
Legislation and Guidelines
6.2.1 The
principle legislation governing waste management in Hong Kong is the Waste Disposal Ordinance (Cap. 354)
(WDO), and its subsidiary regulations.
The Ordinance, enacted in 1980, generally encompasses all stages of
waste management, from place of arising to final disposal point of waste. The Waste
Disposal (Chemical Waste) (General) Regulation, enacted under the WDO in
1992, provides controls on all aspects of chemical waste disposal, including
storage, collection, transport, treatment and final disposal.
6.2.2 In
addition to the WDO and its subsidiary regulation, the following legislation
have some bearing on the handling, treatment and disposal of wastes in Hong
Kong, viz.,:
· Dumping at Sea Ordinance (1995);
· Crown Land Ordinance (Cap. 28);
· Public Health and Municipal Services Ordinance (Cap. 132) Public
Cleansing and Prevention of Nuisances (Urban Council) and (Regional Council)
By-laws; and
· Dangerous Goods Ordinance.
6.2.3 There
are also various guidelines which are relevant to waste management in Hong
Kong:
· Waste Disposal Plan for Hong Kong (December 1989), Planning,
Environmental and Lands Branch Government Secretariat;
· New Disposal Arrangements for Construction Waste (1992), Environmental
Protection Department & Civil Engineering Department;
· Code of Practice on the Packaging, Labelling and Storage of Chemical
Wastes (1992), Environmental Protection Department;
· Works Branch Technical Circular No. 6/92, Fill Management;
· Works Branch Technical Circular 22/92, Hong Kong Government;
· Works Branch Technical Circular No. 2/93, Public Dumps;
· Work Branch Technical circular No. 16/93, Wet Soil in Public Dumps;
· Works Bureau Technical Circular No. 5/98, On Site Sorting of
Construction Waste on Demolition Sites;
· Works Bureau Technical Circular No. 5/99, Trip-ticket System for
Disposal of Construction and Demolition Material;
· Works Bureau Technical Circular No. 25/99, Incorporation of Information
on Construction and Demolition Material Management in Public Works Subcommittee
Papers;
· Technical Circular No. 11/92 Classification of Dredging Sediments for
Marine Disposal, Environmental Protection Department
6.3
Construction Waste Impacts
Identification of Sources and Characteristics of Wastes
6.3.1 Construction
of the proposed bus depot will involve the following key activities:
· Site clearance - the amount of works is expected to be minimal as the site will be
vacated before handled over to the project proponent for the development;
· Foundation Works – the foundation works will involve piling and excavation activities;
· Superstructure Construction – this will involve construction of a 5 stories building (2 stories
occupying the whole site and a 3-stories extension along Road 20/4).
6.3.2 The
nature of these construction works is considered similar to other building
construction works in the territory.
The following waste categories are expected to be generated:
· Excavated Material;
· Construction and demolition waste;
· Chemical waste;
· General refuse.
6.3.3 The
nature and likely quantity of each of these waste types arising from the
construction phase of the Project are evaluated below. The potential environmental impacts, which
may arise from the handling, storage, transport and disposal of each waste
type, are then assessed. Prior to
consideration of disposal options for each waste type, opportunities for waste
reduction, reuse, or recycling have been identified.
Construction and Demolition (C&D) Material
6.3.4 A
major portion of the subject site is currently unoccupied. It is also expected that when the site is
handed over to the project proponent for the development of the bus depot, the
existing structures occupying the site, including the work area temporary
occupied by HyD, would be vacated.
C&D Material generation during the site clearance is therefore
expected to be very limited.
6.3.5 The
major source of C&D Material is expected to arise from the excavation
activities.
6.3.6 Excavated
material will be generated from the foundation works from bored piling works
and excavation activities for pile cap, manholes and other underground
utilities and facilities, including underground fuel tanks and sunken pits. Detailed design of the foundation works is
not available at this stage such that it is only possible to give a rough
estimate on the amount of excavated material.
A preliminary estimate is 28,000m3 for the bored piling works
and 55,000m3 from other excavation activities, giving a total
quantity of some 83,000m3.
6.3.7 Additional
C&D material would also be generated from the building construction works.
Based on the proposed GFA of the building and an assumed C&D generation
rate of 0.1m3m-2 (Ref.: Reduction of Construction Waste
Final Report, Hong Kong Polytechnic, 1983), the quantity of C&D material is
estimated to be about 2,900m3.
6.3.8 The
total quantity of C&D material generated requiring offsite disposal to
public filling areas is estimated to be 86000m3. The quantity of C&D waste is expected to
be insignificant but should be disposed of proper if encountered as far as
practicable. Wherever possible, the
amount of C&D waste to be disposed of at landfill should be minimised.
6.3.9 Based
on the preliminary construction programme, the daily quantity of excavation
material to be handled is estimated to be some 900m3/day. Considering the nature of the project, it
can be agreed that there is limited opportunity for reusing the excavated
material onsite. It is estimated that approximately
20 truck load per hour is required to handle the daily quantity of excavated
material for delivery to off-site public filling areas or other reclamation
areas.
6.3.10 The
key secondary environmental concern associated with the handling of the excavated
material is expected to be potential fugitive dust emission and noise
impact. With the implementation of the
recommended dust and noise control/ mitigation measures presented in the air
quality and noise sections, these secondary environmental factors are not
expected to be a concern.
6.3.11 During
the site clearance stage, it is recommended that the contractor should adopt a
“selective demolition” approach if waste material are encountered as far as
practicable such that reusable material such as wood, metal, and steel can be
segregated for reuse or recycling.
Inert demolition material such as soil, rock, concrete, brick, cement
plaster/ mortar, inert building debris, aggregates and asphalt, etc. shall be
reused by delivery to public filling area, public filling barging points or
land formation sites. Only degradable
waste shall be disposed of at landfill.
6.3.12 Beside,
surplus construction material, which may arise from construction preparatory
works and actual construction activities, shall be minimised, reused or
recycled as far as practicable. These
material may include:
· Wood from formwork;
· Surplus concrete or grouting mixes;
· Damaged or contaminated construction
materials;
· Equipment and vehicle maintenance
parts; and
· Materials and equipment wrappings,
etc.
6.3.13 Wherever
practicable, the production of construction waste should be minimised by the
contractor through careful design, planning, good site management, control of
ordering procedures, segregation and reuse of materials. These measures will also assist in
minimising costs associated with the construction works. For examples, wooden boards can be reused
on-site or off-site, though the reusability and quantity of final waste will
depend on the quality, size and shape of the boards. Those timbers which cannot be reused again shall be sorted and
stored separate from all inert waste before disposed of in landfill.
Arrangement could be made for private contractors to collect used formwork
materials for reuse. On-site incineration of wooden waste is prohibited.
6.3.14 If
feasible, noise enclosure or barriers used on-site should be designed so that
they are reusable after they have been dismantled and removed. Should construction site hoarding be
erected, metal fencing or building panels, which are more durable than wooden
panels, are recommended to be used where practicable. Opportunity shall also be sought to re-use any wooden boards used
in site fencing on-site or off-site.
Concrete and masonry can be crushed and used as fill material if
practicable.
Chemical Waste
6.3.15 As
defined under the Waste Disposal
(Chemical Waste) (General) Regulation, chemical waste includes any
substance being scrap material or unwanted substances specified under Schedule
1 of the Regulation. Chemical waste
that would be generated from the construction of the bus depot is anticipated
to arise from chemicals used in operation and maintenance of on-site
equipment. These may include fuel, oil,
lubricants, cleaning fluids, and solvents arising from leakage or maintenance
of on-site equipment and vehicles.
Chemicals generated from daily operation of the construction works shall
be recycled/ reused on-site as far as practicable.
6.3.16 The
amount of chemical waste that will be generated from the construction work will
depend on the contractor’s on-site maintenance intention, age and number of
plant and vehicles used. Chemical
wastes such as lubricating oil or solvent generated by workers are not expected
to be in large quantity, given the nature of the construction activities
involved. The chemical waste types are
expected to be readily accepted by licensed contractors in Hong Kong.
6.3.17 If
off-site disposal of chemical waste is required, they should be collected and
delivered by licensed contractors to Tsing Yi Chemical Waste Treatment Facility
and be disposed of in strict accordance with the Waste Disposal (Chemical Waste) (General) Regulation. Contractors
shall register with EPD as chemical waste producers when disposal of chemical
waste is anticipated to be required.
Chemical waste materials have to be stored on-site with suitable
containers so that leakage or spillage is prevented during the handling,
storage, and subsequent transportation.
6.3.18 Provided
that the handling, storage and disposal of chemical wastes are in accordance
with the Waste Disposal (Chemical Waste)
(General) Regulation and the Code of
Practice on the Packaging, Labelling and Storage of Chemical Wastes, it
will not cause an unacceptable environmental impact.
General Refuse
6.3.19 Throughout
the construction phase, the workforce on the construction site will generate a
variety of general refuse requiring disposal.
These refuse will mainly consist on food wastes, aluminium cans, and
waste paper, etc. No information regarding
the number of workers on-site is available at this feasibility study stage. Assuming that 100 workers are working
together at any one time, and a waste generation rate of about 0.6 kg per
person, it is estimated that the amount of general refuse that would be
generated is in the order of 60 kg per day.
6.3.20 General
refuse generated at the construction site shall be stored separated from
construction and chemical wastes to avoid cross contamination. A reliable waste collector shall be employed
by the Contractor to remove general refuse from the construction site on a
daily basis where appropriate to minimise the potential odour, pest and litter
impacts. The segregation of aluminum
cans or other recyclable material for recycling should be considered as far as
practicable.
Overall Waste Management
6.3.21 To
ensure the appropriate handling of different construction waste types, it is
recommended that the contractor shall be required to implement the recommended
waste management measures through establishing a waste management plan. The WMP
shall be submitted to the Project Engineer at the commencement of the project
for approval on the advice of DEP.
6.3.22 The
following additional control/ mitigation measures are recommended:
(i)
Storage areas for different waste
types - different types of waste should
be segregated and stored in different containers, skips or stockpiles to
enhance reuse or recycling of materials and their proper disposal. An on-site temporary storage area equipped
with required control measures (e.g. dust) should be provided;
(ii)
Trip-ticket system - in order to monitor the disposal of inert C&DM at public filling
facilities and the remaining C&D waste to landfills, and control
fly-topping, a trip-ticket system should be included as a contractual
requirements and audited by the Environmental Team;
(iii)
Records of Wastes - a recording system for the amount of wastes generated, recycled and
disposed (including the disposal sites) should be proposed;
(iv)
Training - training should be provided to workers in respect of site cleanliness
and appropriate waste management procedure, including waste reduction, reuse
and recycling, and avoid contamination of reusable C&DM.
6.4
Construction Waste EM&A Requirements
6.4.1 In
order to ensure that each construction waste stream generated from the
construction phase of the Project are managed in accordance with the procedures
recommended in this EIA, it is recommended that regular auditing by an
Environmental Team be carried out. The
regular audit should look at all aspects of waste management including waste
generation, storage, recycling, reuse, transport and disposal.
6.5
Operational Phase Waste Impact
6.5.1 The
key waste type of potential concern with respect waste management during the
operational phase would be chemical waste.
The types and quantity of chemical waste material that would be
generated from the operation of the bus depot has been preliminary estimated at
this planning stage and is set out in Table
6‑1.
Table 6‑1 Likely
Types and Estimated Quantity of Chemical Wastes to be produced from Depot
Operation
|
Waste
|
Estimated Annual Quantity
|
|
Spent oil filters
|
18,000kg
|
|
Waste oil (including
engine oil, transmission oil and rear axle oil)
|
360,000 litre
|
|
Waste Battery Cell
|
800 pcs.
|
|
Waste Electrolyte (i.e.
diluted sulphuric acid)
|
13,000 litre
|
|
Spent Solvent
|
Insignificant
|
|
Spent Paint
|
Insignificant
|
|
Waste Diesel
|
Insignificant
|
6.5.2 Provided
that chemical wastes generated during the operational phase are managed in
accordance with the requirements under the Code of Practice on the Packaging,
Labelling and Storage of Chemical Waste published by EPD, they should not cause
any unacceptable impacts. Sludge
generated from the water treatment system of the bus washing machines shall be
regularly removed and transported away by licensed collectors for proper
disposal. Oily sludge accumulated
inside oil/petrol interceptors in the bus washing areas and grease traps in the
kitchen areas should also be regularly removed and transported away by licensed
collectors for proper disposal.
6.5.3 Proper
chemical waste management and disposal is recommended to be checked through the
impact-orientated EMS to be established during the detailed design stage and
operational phase of the project, as recommended in the Environmental
Management Plan.
6.6
Conclusion
6.6.1 The
waste streams that would be generated during the construction phase of the
proposed bus depot were identified and evaluated in terms of their quantity,
type and nature, etc. Opportunities for
reduction in waste generation through reuse or recycling are identified. The waste management implications and
potential environmental impacts associated with the handling, transport, and
disposal of the identified waste types are addressed. Mitigation measures based on good practices have been recommended
for each waste type to address any potential environmental impacts.
6.6.2 The
Contractor shall be required to implement the recommended waste management
measures through establishing a Waste Management Plan (WMP) at an early stage
before construction works commence. The
WMP should be submitted to the Engineer for approval on the advice of the
EPD. In addition, an audit programme is
recommended to be in place during the construction phase to check that the
waste generated from the construction site are being managed in accordance with
the recommended procedures. Handling
and disposal of waste generated from the project is not expected to give rise
to any significant dust and noise in the presence of appropriate control/
mitigation measures recommended.
6.6.3 Provided
that the recommendations set out in this section are implemented, no waste
related regulatory non-compliance and unacceptable environmental impacts would
be expected to arise from the handling, storage, transport and disposal of
wastes during both the construction of the Project.
7.
Land
Contamination Prevention
7.1
Introduction
7.1.1 Operation
of the proposed bus depot will inevitably involve storage and delivery of
diesel fuel on-site, as well as the use of various chemicals, through not
expected to be in a significant quantity.
These facilities are identified to have the potential to cause land
contamination in the long run if the fuel and chemicals are not properly
stored, handled, managed and disposed of during operation.
7.1.2 In
accordance with ProPECC Practice Note No. 3/94 “Contaminated Land Assessment
and Remediation”, appropriate operational practices, waste management
strategies and precautionary measures are formulated to prevent the occurrence
of land contamination problem as far as practicable.
7.2
Baseline Condition
7.2.1 The
1 hectare site for the bus depot development was formed from reclamation and
was used as part of the site for provision temporary housing
accommodation. A major portion of the
site is currently unoccupied. A
southern part of the site is currently occupied by Highways Department (HyD)
for use as a site office and storage area.
A small portion of the site to the north of the access road falls within
the boundary of the NWFB temporary bus depot facilities and is being used as bus
parking spaces. It is understood that
there are no underground facilities installed within or in the immediate
proximity of the subject site. The site
is paved. There was no sign of land contamination from the site survey.
7.2.2 The
site area occupied by HyD and NWFB will be vacated before handled over to the
project proponent for the construction of the bus depot development.
7.3
Potential Land
Contamination Sources
7.3.1 The
key facilities at the proposed bus depot which may have the potential to cause
land contamination problem in future are identified as follows:
· Underground diesel fuel storage
tanks and associated pipelines;
· Near the diesel fuel refuelling
bays;
· Chemical storage areas; and
· Maintenance areas (sunken pits)
7.3.2 Required
onsite storage of diesel fuel is estimated to be in the order of 180,000 litre
to meet the operational requirements.
The storage quantity of paint, paint thinner and turpentine is estimated
to be some 200 litre, 150 litre and 50 litre, respectively.
7.4
Land Contamination
Preventive Measures
Diesel
Fuel Tanks and associated Pipelines
7.4.1 The
following preventive measures are recommended to avoid land contamination from
storage and use of diesel fuel on-site:
7.4.2 The
diesel fuel tanks to be installed by the appointed contractor shall be of a
specified durability. The underground
tanks to be installed shall be placed within a concrete pit to avoid direct
contact of the tank surface with soil.
The concrete pit shall be accessible to allow tank integrity test be
carried out on an annual basis, or when deemed necessary by an independent qualified
surveyor or structural engineer. Any
potential problems such as potential cracking shall be rectified as far as
practicable.
7.4.3 The
diesel fuel pipelines are preferably to be installed above ground. If underground piping is unavoidable,
concrete lined trenches should be constructed to contain the pipelines. The distance between the diesel fuel
refueling bays and the underground tanks should be minimized as appropriate to
avoid the need of long pipelines.
7.4.4 Proper
installation and use of meters (e.g. at the two ends of a filling line) in
diesel fuel filling would allow unexpected pressure drop or difference and sign
of leakage be detected from routine inspection or during diesel fuel
refueling. Any identified leakage
should be reported to the plant manager in-charge. Any spillage of fuel
material should be removed immediately with portable pump when the quantity is
large or absorbing materials when the quantity is low. Used absorbing material should be properly
stored and disposed of as chemical waste.
7.4.5 The
refueling of buses shall be undertaken by well trained staff to avoid spillage
of fuel. The underground tanks refueling (from tankers) should only be
undertaken by authorized staff of fuel company using the company’s standard
procedures to avoid spillage of diesel fuel.
Use
of Chemicals
7.4.6 Chemicals
used onsite should be properly stored in designated areas. The storage, use, manufacture, labeling and
conveyance of substances/ chemicals that are classified as Dangerous Goods
under the Dangerous Goods (Application & Exemption) Regulation are
controlled under the Dangerous Goods Ordinance. For those chemical wastes that are controlled under the Waste
Disposal (Chemical Waste) (General) Regulation should comply with the Code of
Practice on the Packaging, Labeling and Storage of Chemical Waste.
7.4.7 Any
spillage incidents should be reported to the project manager in-charge. Immediate action should be taken to confine
the spillage and to clean up the spill.
If the spillage quantity is large, hand-operated pumps or other
efficient measures should be used to clean up the spill effectively. Used absorbing material for cleaning up of
minor spillage should be properly handled, stored and disposed of as chemical
waste.
7.4.8 The
plant manager in-charge should keep a record on incidents of chemical spillage
and the actions taken.
7.4.9 Implementation
of the land contamination preventive measures is recommended to be checked
through the impact-oriented EMS system to be established during the detailed
design stage and operational phase of the project as recommended in the
Environmental Management Plan.
7.5
Conclusion
7.5.1 Sources
of potential land contamination have been identified to be diesel fuel tanks
and associated pipelines, as well as storage and use of chemicals. Preventive
measures to avoid land contamination have been recommended for
implementation. The proper
implementation of these measures will greatly minimize the land contamination
potential in future.
8.
Hazard Impact
8.1
Introduction
8.1.1
According
to the latest Draft Outline Zoning Plan (Plan No. S/H20/11), the “Other
Specified Uses” (“OU”) Site on the northern side of the development is planned
to be developed into a petrol filling cum liquefied petroleum gas (LPG) filling
station.
8.1.2
Electrical
and Mechanical Services Department (EMSD) requires a minimum separation
distance of 15m between LPG filling station and industrial/ commercial
buildings to minimise the potential hazard associated with operation of LPG
filling station. Section 3.4.6 of the
EIA Study Brief requires a review/ assessment of the planned population and the
design layout of the bus depot project so as to ascertain the potential hazard
impacts from the adjacent planned LPG filling station is acceptable if the 15m
separation distance requirement cannot be provided.
8.1.3
Planning
Department has advised that in identifying the LPG/ Petrol Filling Station, the
requirement of providing a separation distance of 15m between LPG filling
station and the bus depot has been observed.
As shown in Figure 8-1, a width of about 35m has been reserved for the
eastern part of the “OU” site to allow flexibility in the LPG filling station
design so that the 15m separation between the future LPG filling station and
the bus depot may be accommodated. However,
required safety measures could only be worked out at detailed design stage by
the developers of the sites in consultation with concerned Government
departments.
8.1.4
Given
the close proximity of the LPG/ Petrol Filling Station to the bus depot, to be
prudent, a Quantitative Risk Assessment (QRA) was carried out to confirm
whether there would be any potential hazard associated with the operation of
the LPG/ Petrol Filling Station on the proposed bus depot. Precautionary measures have been identified
and incorporated into the design of the bus depot as an at-receiver risk
reduction measure.
8.1.5
A LPG
filling station is classified as a Notifiable Gas Installation under the Gas
Safety Ordinance. In accordance with
EMSD’s guidelines, the future project proponent of the LPG filling station will
be required by the Authority to carry out a Quantitative Risk Assessment (QRA)
to ensure that its design and operation will not impose unacceptable individual
risk and societal risk on the sensitive landuses in its proximity. There is currently no information on the
design, servicing capacity, and development programme of the LPG/ Petrol
Filling Station. The current assessment
has therefore been carried out based on some reasonable and conservative
assumptions.
8.2
Quantitative Risk Assessment
Assumptions on the Design of the
Future LPG/ Petrol Filling Station
8.2.1
Design
of the future LPG/ Petrol filling station is not available at this initial
planning stage. In order to quantify
the extent of potential hazard impact on the proposed bus depot, a typical LPG/
Petrol filling station design is assumed in this study. Figure 8-2 shows the
layout plan of a typical Petrol cum LPG filling station.
8.2.2
Based
on the typical design, both LPG and petrol/diesel storage vessels are expected
to be installed underground, with all vessels covered with corrosion protection
coating, stress relieved and have undergone 100% radiography. Two LPG storage vessels each with a maximum
capacity of 12 tonnes are assumed to exist, giving a total storage capacity of
24 tonnes. It is also assumed that there
are four sets of dispenser facilities (with 8 dispensing nozzles in total) for
serving LPG-vehicles (taxis) for each vessel.
LPG and Petrol/diesel vessels would be separated as a common design
strategy so as to avoid any knock-on effect in case accident occurs. A bay area
would be dedicated for the LPG filling tankers. Moreover, the station is
assumed to be equipped with standard fire fighting apparatus, including fire
extinguishers and boxes of sand. Solid radiation wall would be provided within
the filling station at three sides along the station boundary. According to the location of the planned
facility, access to the LPG/ Petrol filling station would be provided at Road
20/6.
8.2.3
It is
assumed that the daily consumption of each LPG-vehicle is about 30kg. It is
expected that about 60 LPG-vehicle would be served per day by each dispensing
nozzle so that the daily consumption rate will be about 14.4 tonnes. LPG is expected to be delivered to the site
by tanker trucks and pumped into the underground vessels. LPG is fed to the
dispenser via a site pump installed with the storage vessels. Based on the daily consumption rate, the
usual LPG stock maintained on-site is assumed to be ranging from about 5.5 to
20 tonnes with a maximum storage of about 85% of the maximum capacity. There
would be a bay area for the parking of the delivery trucks. A LPG delivery truck normally has a maximum
LPG capacity of about 9 tonnes. Truck-in frequency is therefore approximately
1.6 times a day. It is assumed that
each loading process takes about 2 hours. Truck-in period is assumed at time of
lower population in the vicinity, which is a usual operation practice of the
station.
8.2.4
It is
further assumed that the taxi trade would like to maintain the current practice
for diesel taxis that each taxi would be refilled twice a day during the shift
changes. Based on the above
information, it can be estimated for the QRA study that:
Maximum no. of loading to LPG vehicle vessels per year (8x60x2x365) = 350,400
Maximum no. of loading to underground LPG vessel per year (1.6x365) = 584
Maximum total time spend in loading per year (2x1.6x365) = 1,168 hour
Fraction of loading time in a year (1168/24/365) = 0.133
8.2.5
Connection
of safety valves associated with different types of pipelines of the LPG
installation is assumed based on that provided at an existing facility observed
as follows:
Table 8‑1 Safety Valves
associated with Pipelines On-site
|
Pipeline
|
Approx. Pipe Length (m)
|
Safety valves
|
|
Liquid filling line leading to the storage vessel
|
2m
|
1 filler valve, 2 pressure
relief valve, 3 shut off valve, 1 non-return valve
|
|
Liquid supply line leading to the dispensers
|
15m
|
3 shut off valve, 1 pressure
relief valve
|
|
Vent Pipe connected to the storage vessel
|
3m
|
1 pressure relief valve
|
|
Vapour from dispenser to vessel
|
15m
|
1 excess flow valve, 1 shut
off valve
|
The
Study Area
8.2.6
Based
on the normal storage quantity at a planned LPG/ Petrol filling station, the
potentially affected area should a hazard event arises is expected to be
limited. Nevertheless, a study area of
150m radius from the LPG installation is adopted in the study and is shown in Figure
8-1. Based
on the latest Draft Outline Zoning Plan (Plan No. S/H20/11), existing and
planned developments within the study area include:
· The proposed bus depot at the
subject site;
· Open space area to the north of the
filling station;
· Planned industrial area to the
northeast of the filling station;
· Cargo handling area to the east of
the filling station;
· A section of the railway track to
the west of the filling station; and
· Local road carriageways.
8.3
Population Data
8.3.1
The
QRA study has been carried out with population data reasonably assumed based on
the planned landuses in the vicinity of the LPG/ Petrol filling station in
accordance with the landuse zoning as shown in the Draft Outline Zoning Plan
(OZP) and information provided by Planning Department.
Proposed bus depot
8.3.2
As
described in Section 3, the proposed bus depot will be in the form of a
low-rise building occupying a site area of approximately 1 hectare. The development will provide spaces for bus
parking, maintenance and office areas.
As a prudent approach in the design of the bus depot, the entire
northern façade of the bus depot building will be constructed with a solid
concrete wall without openings.
8.3.3
The
number of staff working indoor in the bus depot and office area is estimated to
be about 319 and 201 during daytime (approx. 08:00 to 18:00) respectively. In the evening and night-time (approx. 18:00
to 08:00), some 50 workers are expected to be working at the bus depot, and
none in the office.
Open space area
8.3.4 The
site bounded by Road 20/10 and located to the north of Road 20/6 is zoned as an
Open Space Site (“O”) to serve the nearby working population in accordance with
the Draft OZP (Plan No. S/H20/11). A
population of 20 is assumed for this area based on observation of similar open
space uses at other industrial areas.
Planned Industrial Site
8.3.5
According
to information provided by Planning Department, the industrial site located to
the immediate north of the LPG/ Petrol Filling Station is currently reserved
for the construction of a Lorry Park & Motor Vehicle Repair Workshop. Based on the nature of use and the site area
involved, an indoor working population of 300 is assumed at the facility.
Railway Track
8.3.6
The
typical capacity of each cart will be about 280 person per compartment. A
12-cart train will have total passengers of 3360 at peak hour. A train speed of
50km/hr and a peak train frequency of about once per 1.5 minutes are assumed.
Accordingly, the population can be estimated based on the following formula.
Population = No of person per train x No. of train per hour / Speed *
Length of track fall within the study area
Road Carriageways
8.3.7
Road
carriageways in the vicinity include Shing Tai Road, Sheung On Street, Road
20/4, Road 20/10 and Road 20/6. With the proposed bus depot, there will be
additional flow of buses on these local road carriageways especially during the
early morning and near mid-night return time period. The design capacity of these local roads, as shown in Table 8‑2, were adopted in the QRA study as a conservative
approach.
Table 8‑2 Design Capacity of the Local Road
Carriageways adopted in the QRA study
|
Road Carriageway
|
Peak Hour Traffic (veh/hr)
|
% of Heavy Vehicles
|
|
Shing Tai Road – south of Road 20/6
|
3200
|
22
|
|
Road 20/4 – north of Road 20/6
|
800
|
22
|
|
Road 20/6
|
800
|
22
|
|
Road 20/4 – south of Road 20/6
|
800
|
22
|
|
Shing Tai Road – north of Road 20/6
|
800
|
22
|
|
Road 20/10
|
800
|
22
|
Sources:
1 Design Capacity:
TPDM Vol. 2 Table 2.4.1.1 and Guidelines on Traffic Impact Assessment &
Day-time ban requirements for road works on traffic sensitive routes (Table 2);
2 % of Heavy Vehicles
– ATC 1999 (Station 1009)
8.3.8
2 and
10 person/vehicle for passenger car and heavy vehicles is assumed in this
study. The population along these roads is calculated as:
Population = No of person per vehicle x No. of vehicle per hour / Speed
* Road Length
8.4
Meteorology
8.4.1
Local
meteorology will influence the spreading of LPG. Hourly meteorological data of the Year 1998 from King’s Park
Weather Station involving a matrix of weather class (speed/ stability
combinations) and wind directions have been obtained from the Hong Kong
Observatory for the QRA study. The
three most dominant sets of wind speed-stability class combination during
daytime and night-time are identified and summarised below in Table 8‑3.
Table 8‑3 Most Frequent Wind Speed-Stability Class
Combination
|
|
Meteorological Category
|
|
|
Daytime
|
Night time
|
|
|
Direction
|
4D
|
3C
|
2B
|
1F
|
4D
|
2F
|
Total
|
|
0-30
|
0.38
|
0.83
|
0.56
|
2.80
|
0.43
|
1.75
|
6.75
|
|
30-60
|
0.32
|
0.32
|
0.19
|
1.35
|
0.73
|
1.10
|
4.01
|
|
60-90
|
2.15
|
1.67
|
1.21
|
4.06
|
4.74
|
3.23
|
17.06
|
|
90-120
|
11.03
|
3.15
|
2.02
|
5.17
|
12.64
|
2.85
|
36.86
|
|
120-150
|
0.00
|
0.32
|
0.35
|
1.67
|
0.16
|
0.35
|
2.85
|
|
150-180
|
0.08
|
0.62
|
0.27
|
1.21
|
0.24
|
0.59
|
3.01
|
|
180-210
|
0.27
|
0.89
|
0.48
|
1.21
|
0.54
|
0.97
|
4.36
|
|
210-240
|
0.19
|
1.59
|
1.24
|
2.58
|
0.24
|
0.94
|
6.78
|
|
240-270
|
0.03
|
0.30
|
2.64
|
5.97
|
0.16
|
1.72
|
10.82
|
|
270-300
|
0.03
|
0.03
|
0.19
|
0.75
|
0.05
|
0.13
|
1.18
|
|
300-330
|
0.00
|
0.05
|
0.08
|
0.40
|
0.00
|
0.11
|
0.65
|
|
330-360
|
0.19
|
0.86
|
0.73
|
1.99
|
0.62
|
1.29
|
5.68
|
|
Total
|
14.66
|
10.63
|
9.95
|
29.16
|
20.55
|
15.04
|
100.00
|
8.5
Local Topography
8.5.1
The site
where the planned LPG/ Petrol filling station and the surrounding landuses are
located is relatively flat. Gas dispersion has taken to affect up to a height
of about 3 levels.
8.6
Ignition Source
8.6.1
Ignition
source is an important parameter for determining the consequence due to delayed
ignition. Source of ignition is
identified to be associated with vehicles using the road carriageways. As a
solid radiation wall will be provided along three sides of the planned LPG/
Petrol filling station, and the entire northern facade of the bus depot will be
constructed with a solid concrete wall, dispersion is more likely spread to
Road 20/6.
Hazard Events and Consequence
8.6.2
LPG
release associated with the operation of the LPG filling station could occur as
a result of spontaneous failure of pressurised LPG equipment such as storage
vessel, tanker failure and pipework failure and loading failure such as hose
misconnection and hose disconnection error.
8.6.3
Possible
outcomes of LPG leakage leading to fatality include jet fire, flash fire and
fireball. Pool fire is usually a
localised hazard event and would not occur when LPG released is flashed to
vapour so that flash fire, which can affect off-site area, is resulted. Occurrence of vapour cloud explosion (VCE)
requires significant confinement of vapour which is expected to be unlikely for
LPG vessels installed underground.
8.7
Hazard Events
8.7.1
An LPG
release event could occur as a result of spontaneous failure of pressurised LPG
equipment such as storage vessel, loading failure such as hose connection or
disconnection error, and from external events such as earthquake. The various possible failure cases are
summarised in Table 8‑4.
Table 8‑4 Identified Failure case of the LPG Installation
|
Failure category
|
Failure cases
|
|
Spontaneous
|
·
Storage Vessel Failures
·
Tanker Failures
·
Pipework Failures
·
Dispenser Failures
·
Flexible Hose Failures
·
Flange Gasket Failures
·
Valve Leak Failures
|
|
Loading from Tanker to Vessel
|
·
Vessel Filling Hose Misconnection
·
Vessel Filling Hose Disconnection Error
·
Disconnection with Valve Open
·
Tanker Drive Away
·
Tanker Impact
·
Tanker Collision during Unloading
·
Loading Pipework Over Pressurisation
·
Storage Vessel Overfilling
|
|
Loading from Dispenser to Vehicles
|
·
Vessel Filling Hose Disconnection Error
·
Vehicle Drive Away
·
Vehicle Impact
·
Vehicle Collision during Unloading
·
Vehicle Storage Vessel Overfilling
|
|
External Event
|
·
Earthquake
·
Aircraft Crash
·
Landslide
·
Severe Environmental Event
·
Subsidence
·
External Fire
·
Lightning Strike
·
Dropped Object
|
8.7.2
Generic
failure rates associated with the various possible initiating events were
adopted, where appropriate, to effect a conservative assessment. The
significance of each failure case is thoroughly considered and incorporated in
the assessment, where appropriate.
Spontaneous Failure
(i)
Storage
Vessel Failure
8.7.3
Storage
vessel failure can be cold catastrophic, leading to instantaneous release of
LPG, or cold partial failure resulting in continuous release of LPG to the
atmosphere. The generic failure rate of
1.8 x 10⁻⁷ has been adopted for cold spontaneous catastrophic
failure. For partial failure, a generic
value of 5.0 x 10⁻⁶ has been adopted. The vessel is assumed stress relieved, 100% radiograph tested and
covered with Chartek coating (a fire protective coating), which is typical of
such kind of installation.
(ii)
Tanker
Failure
8.7.4
LPG
delivery trucks in Hong Kong are covered with Chartek coating and equipped with
many features so that they can be treated as a considerably well secured
device. The definition of catastrophic
and partial failure are similar to that of vessels. The catastrophic and partial failure rate of a road tanker for
the study is 2.0 x 10⁻⁶ and 5.0 x 10⁻⁶ per year,
respectively.
(iii)Pipework Failure
8.7.5
Failure
of pipework can generally be classified into two types - guillotine (with
complete severance of the pipe) and partial failure (pipe splits less than the
pipe diameter). Risk from partial
failure is considered negligible as the leakage is insignificant to the overall
risk. This study will therefore only
account for the consequence from guillotine failures. A generic guillotine
failure rate of pipe of 1.0 x 10⁻⁶ per metre per year has been
adopted. However, it is noted that the
effect of guillotine failure is significant only if leak(s) is failed to be
isolated. In other words, it requires
the failure of other safety systems to substantiate the event. Fault tree
analysis technique will be adopted to account such “failure to isolate” risks.
(iv)Dispenser Failure
8.7.6
A
dispenser is responsible for the supply of LPG fuel to vehicles (taxi in this
case). The failure mode is regarded
similar to that of pipework and storage vessels. That is, potential LPG release
can be modelled as a guillotine failure of the liquid supply line at the
dispenser. A frequency of 1.0 x 10⁻⁶
was adopted for dispenser failure in the study.
(v)
Flexible
Hose Failure
8.7.7
The
LPG delivery truck carries with it a flexible hose for LPG unloading to the
underground vessel. On the other hand, there is also hose for dispenser
facilities. Again, the effect of
partial failure of the hose is anticipated to be negligible. Only guillotine
failure is therefore considered. A generic guillotine failure rate of 1.8 x 10⁻⁷
per transfer based on transfer duration of 2 hours is adopted. Each filling
process for vehicles, on the other hand, takes about 1 minute. An Excess Flow
Valve (EFV) is expected to be fitted immediately upstream of the hose reel.
(vi)Flange/ Gasket and Valve Leak Failures
8.7.8
It is
considered that failures of gaskets would only tend to give relatively small
scale of leakage and will not contribute significantly to the risk from the
subject LPG installation. The results from gasket failure will not be
considered further in the study. External leaks from valves is neither
anticipated to contribute significantly to the risk from the LPG installation
and hence were not considered in the study.
8.7.9
Table 8‑5 summarises the failure cases and the associated
frequency of occurrences to be adopted in the QRA study.
Table 8‑5 Summary of Spontaneous Failure Cases and their
Frequency of Occurrences
|
Failure case
|
Frequency
|
|
Storage vessel failure (assuming SR and 100%
radiograph, with age of vessel < 20 years)
·
Catastrophic
·
Partial (25 mm equivalent diameter)
|
1.8 x 10⁻⁷ per
vessel year
5.0 x 10⁻⁶ per
vessel year
|
|
Road tanker failure
·
Catastrophic
·
Partial (25 mm equivalent diameter)
|
2.0 x 10⁻⁶ per
road tanker year
5.0 x 10⁻⁶ per
road tanker year
|
|
Guillotine failure of
pipework
|
1.0 x 10⁻⁶ per
metre per year
|
|
Dispenser failure
|
1.0 x 10⁻⁶ per
year
|
|
Flexible hose guillotine
failure
·
Filling to underground vessel
·
Filling to vehicles
|
9.0 x 10⁻⁸ per hour; or
1.8 x 10⁻⁷ per transfer
1.5 x 10⁻⁹ per transfer
|
Loading from Tanker to Vessel Failure
(i)
Hose
Misconnection
8.7.10
This
study only considers misconnection errors which results in hose coming
completely apart, giving a full-bore release. It is anticipated that small leaks
will be rectified instantaneously by the truck driver or his assistant, and
hence are not considered. A failure
rate of 3 x 10⁻⁵ per operation resulting from human error which
leads to misconnection is adopted.
(ii)
Hose
Disconnection Error
8.7.11
This
is a gross human error event which require a complete disregard of normal
operating procedure as well as the failure of assistant to prevent it from
happening. A failure rate of 2 x 10⁻⁶
per operation for an operator to disconnect a hose during loading operation has
been used in the study.
(iii)Disconnection with Valve Open.
8.7.12
The
event is significant only if the release is fed from the storage vessel and
when the vessel is over-pressurised with failure of the associated safety
valves (i.e. a Non-return Valve in the present case), as well as driver’s
failure to shut down the Manual Valve.
(iv)Tanker Drive Away
8.7.13
A
drive-away error could be resulted from (i) repositioning of truck during
delivery and/ or (ii) inadvertent driver away before delivery completion. The outcome of this failure matches those of
hose misconnection. A number of
measures such as the use of wheel chocks, interlocks on shutters and parking
brake have been implemented in Hong Kong.
Moreover, there is a dedicated bay area for the parking of the truck so
that repositioning during delivery is unlikely. Furthermore, the driver is also
responsible for the unloading process.
Therefore, driving away before completion is much unlikely. A failure rate of 4 x 10⁻⁶ per
operation has been adopted in the study.
(v)
Tanker
Impact
8.7.14
Tanker
impact refers to the striking of part of the LPG installation by the LPG
delivery truck, causing damage to the installation pipework, the tanker, the
tanker fittings or the hose connection pipework. Given that the LPG vessel and
pipework is situated underground, and there is a dedicated bay area of the
parking of the tanker which is located apart from dispensers and other
facilities, the probability of guillotine failure of pipework and dispensers is
expected to be negligible.
(vi)Tanker Collision during Unloading
8.7.15
Although
there is a dedicated area for the parking of the tanker, it is considered that
the parked tanker can still be close to the path of the vehicle movement for
vehicles utilising the inner dispenser systems. Mitigation measures can be proposed that loading process is
carried out other than peak hours for vehicle refilling and control is taken to
avoid vehicles using the inner dispenser system so as to avoid any occasion of
collision.
(vii)Loading Pipework over Pressurisation.
8.7.16
It is
possible that a LPG delivery truck driver makes an error when unloading from
the truck to the underground storage vessel.
Over pressurisation of the liquid filling line would be resulted should
the operator forgets to open all relevant valves on the pipe/ hose. However,
over-pressurisation protection system of the road tanker should fail and other
failure to isolate leak system (e.g. possibility of the leak being isolating
using manual valves) does not work. It
is considered that the concerned scenario will have a much lower probability to
happen than the “misconnection” error event (which will lead to a similar
outcome) and hence is not considered to be a significant contributor to the
overall risk.
(viii)Storage Tank Overfilling
8.7.17
The
practice on-site in unloading LPG to the underground storage vessel is that it
will only be filled to a maximum of lower than 85% of the maximum capacity,
through monitoring with a level gauge during loading operation. It is considered that the probability of the
driver overfilling the storage vessel is low.
It is also an offence in Hong Kong for a person to overfill an LPG
storage vessel. Even if overfilling
does occur, the following failures are also required to occur for failure of
the storage vessel as a result of the over pressurisation :
à
failure
of the truck pump overpressure protection system;
à
failure
of pressure relief valve on storage tank;
à
failure
of driver and his assistant to detect problem and to take effective mitigation
action accordingly.
8.7.18
It is considered
that the probability for occurrence of such combination of failures is
extremely low. Such scenario is
therefore neglected in the QRA study.
(ix)
Human
Error
8.7.19
Even
failure of equipment occurs, it is possible for staff to rectify the problem before
any hazard event occurs. There are two
staffs responsible for the unloading process (i.e. the driver and one site
staff). As the staff should have
undergone training programme for the job, the probability that the problem
cannot be rectified before hazard event occurs can be assumed to be lower than
0.5. In this study a probability of 0.2
is assumed for human error.
8.7.20
Table 8‑6 summarise the concerned loading failure cases and the
associated frequency for occurrences for the QRA study.
Table
8‑6 Underground Vessel Loading Failure Cases and
their Frequency of Occurrences
|
Concerned Loading Failure Case
|
Frequency of Occurrence
|
|
Hose Misconnection
|
3 x 10⁻⁵ per operation
|
|
Hose Disconnection
|
2 x 10⁻⁶ per operation
|
|
Tanker Drives Away
|
4 x 10⁻⁶ per operation
|
|
Human Error
|
0.2 per demand
|
Loading from Dispenser to Vehicles Failure
(i)
Hose
Disconnection Error
8.7.21
Similar
to the case of hose disconnection from tanker to vessel, a failure rate of 2 x
10-6 per operation for an operator to disconnect a hose during
loading operation has been adopted.
(ii)
Vehicle
Drives Away
8.7.22
In
Hong Kong, vehicle engines should be off before the refilling process. The drives away accident is unlikely. Even a
failure occurs, it is highly likely that the failure can be immediately
rectified because there is a dedicated staff attending the filling process. A failure rate of 4 x 10⁻⁶ per
operation is assumed.
(iii)Vehicle Impact
8.7.23
Travelling
speed when manoeuvring inside the station is usually very slow. Therefore, the impact is usually
insignificant. There is no reported
case in Hong Kong for dispenser failure due to vehicle impact for Petrol
Filling Station in Hong Kong. In this
study, the failure rate due to vehicle impact is assumed as 1 x 10⁻⁹
per visit.
(iv)Vehicle Collision during Unloading
8.7.24 Vehicle may be crashed by coming
vehicles during unloading. As the LPG quantity contained in the vessel of the vehicle
is comparatively small, the leakage from taxi is negligible. On the other hand, if the safety devices
fails, it is possible to have LPG leakage from dispenser. In this study, it is assumed that the
failure rate due to vehicle impact is assumed as 1 x 10⁻⁹ per visit.
(v)
Vehicle
Storage Vessel Overfilling
8.7.25
The
overfilling of vehicle storage vessel may lead to the failure of storage vessel
in the vehicle. Again, the event is not
considered in this study due to the small quantity of storage.
Table
8‑7 Underground Vessel Loading Failure
Cases and their Frequency of Occurrences
|
Concerned Loading
Failure Case
|
Frequency of
Occurrence
|
|
Hose
Disconnection
|
2 x 10⁻⁶
per operation
|
|
Vehicle Drives Away
|
4 x 10⁻⁶
per operation
|
|
Vehicle Impact
|
1 x 10⁻⁹
per visit
|
|
Vehicle Collision
during Unloading
|
1 x 10⁻⁹
per visit
|
External Event Failure
(i)
Earthquake
8.7.26
It is
estimated that earthquake of Modified Mercali Intensity (MMI) VII is required to
provide sufficient intensity to result in damage to storage vessel or
pipework. The probability of earthquake
occurrence is assumed to be 1.0 x 10⁻⁵ per year. The failure rate of pipework as well as
partial failure of underground vessel due to earthquake is taken to be 0.01,
whereas the other failure rate of road tanker and the underground vessel is
considered to be zero.
(ii)
Aircraft
crash
8.7.27
The
subject site is not under the existing airway and the distance between the
subject site and the airfield (i.e. Chek Lap Kok International Airport) is over
5 miles which is the criteria for the consideration of airfield accident.
Therefore, it is not considered in this study as the probability of crashing
exactly onto the LPG installation is extremely small.
(iii)Landslide
8.7.28
As the
vessel of the proposed LPG filling station is situated underground, only
dispenser failure can result. Yet, the
installation is not situated on hill side so that landslide leading to
dispenser and landslide failure should not be accounted.
(iv)Severe environmental event
8.7.29
Loss
of containment of LPG due to severe environmental event such as typhoon or
tsunami (i.e. a tidal wave following an earthquake) is considered to be
insignificant, especially for the proposed installation where LPG vessel is situated
underground.
(v)
Subsidence
8.7.30
Subsidence
is usually slow in movement and such movement can be observed and remedial
action can be taken in time. The
probability of hazardous event due to subsidence is therefore considered
negligible.
(vi)External fire
8.7.31
External
fire means the occurrence of fire event which lead to the failure of
tanker/vessel or other facilities. The
key potential concern relates to the LPG road tanker shell being affected by an
external fire. In Hong Kong, LPG
delivery trucks are provided with safety features to prevent the spread of fire
from an engine or cab fire to the LPG vessel and are shielded with Chartek
coating, a fire-resisting material.
Fire extinguishers are also provided.
The regulations also require that the vessel be effectively screened
with fire-resisting shields from the interior of the cab, fuel tank, electrical
generator, engine, etc. Therefore, it
can be assumed that such external fire will not lead to any significant event
outcome.
(vii)Lightning strike
8.7.32
The
frequency of a lightning strike on road tanker is extremely low. Risk resulting
from lightning strike on the LPG vessel on-site is considered extremely low, as
the vessel is located underground.
Based on these analysis, no consideration is given for effect from
lightning strike in this study.
(viii)Dropped object
8.7.33
As the
LPG vessel and pipework system are situated underground, potential damage from
dropped object is restricted to dispensers only. However, top shielding is provided such that damage by dropped
object is unlikely.
Table
8‑8 External Event and their Frequency
of Occurrences
|
Concerned Loading Failure
Case
|
Frequency of Occurrence
|
|
Earthquake Modified Mercali
Intensity (MMI) VII
|
1.0 x 10⁻⁵ per
year
|
8.8
Safety System and Fire Protection/Fighting System Failure
8.8.1
The
previous section gives an analysis of all possible failure cases. For these failure cases to contribute a
significant risk, these have to be accompanied with failure of the corresponding
safety systems (valves) and/ or fire protection/ fighting system. The types and
nature of safety systems and fire protection system present on site will be
identified and taken into account in the study based on the associated failure
rates presented below, where appropriate.
Safety System Failure
8.8.2
Typical
safety systems involved in LPG installation include over-pressure protection
system, pressure relief valve (PRV), excess flow valve (EFV), non-return valve
(NRV), high pressure shut off valve (SOV), filler valve, emergency valve and
breakaway coupling. These are
responsible for the isolation of failure cases in order to avoid leakage, and
risks incurred.
(i)
Truck
pump over-pressure protection system
8.8.3
It is
used to terminate loading operation automatically in case over-pressure is
detected. The failure rate is assumed
to be 1.0 x 10⁻⁴ per operation in this study.
(ii)
Non-return
valve
8.8.4
This
type of valve is provided to avoid the back flow of LPG along liquid filling
line. The failure rate is 0.013 per
demand.
(iii)Emergency valve
8.8.5
This
type of valve is provided for manual shut-off during emergency situation in
order to isolate a leak. They are used
in pipework of liquid inlet. The failure rate of emergency valve is determined
to be 10-4 per demand or 0.19 per year.
(iv)Pressure relief valve
8.8.6
Pressure
relief valve (PRV) avoids pipework or vessels from being over pressurised. They are connected directly with vessels and
at liquid inlet and outlet pipework, in order to relieve pressure in case it
exceeds the desired level. In this
study, the failure rate of PRV is assumed to be 0.01 per demand. Both PRV and over-pressure protection system
aim at avoiding the occurrence of over-pressurisation. Added the fact that the practice of the existing
LPG installation is to maintain a maximum LPG level of 85% of full capacity,
failure of vessels due to overfilling is unlikely.
(v)
Shut
off valve
8.8.7
Shut
off valves are connected in order to control the pressure of the output LPG
vapour to avoid over-pressure. A failure rate of 0.01 per demand is adopted in
this study.
(vi)Excess flow valve
8.8.8
The
excess flow valve installed at the road tanker and the storage vessel are
expected to be in operation when a guillotine failure of pipework or flexible
filling hose occurs. Assuming a 10 year
test interval as a conservative approach, a demand failure rate of 0.13 per
demand was adopted in the study.
(vii)Breakaway coupling
8.8.9
A
breakaway coupling is provided on the filling line to the storage tank, just
downstream of the flexible hose connection in order to mitigate the effect of
possible drive away incident The
adopted failure rate is 0.013 per demand.
(viii)Filler valve
8.8.10
A
filler valve is usually connected at the end of the liquid inlet position to
avoid back flow of LPG. The adopted failure rate is 0.013 per demand.
8.8.11
Table 8‑9 sets out the adopted failure rates of various safety
system.
Table
8‑9 Failure Rates of Various Safety Systems
|
Failure case
|
Frequency
|
|
Truck pump over-pressure protection system
|
1.0 x 10⁻⁴ per demand
|
|
Non-return valve (NRV)
|
0.013 per demand
|
|
Emergency valve
|
0.19 per year or 10-4 per demand
|
|
Pressure relief valve (PRV)
|
0.01 per demand
|
|
Shut off valve (SOV)
|
0.01 per demand
|
|
Excess flow valve (EFV)
|
0.13 per demand
|
|
Breakaway coupling
|
0.013 per demand
|
|
Filler valve
|
0.013 per demand
|
Fire Protection/Fighting System
Failure
(i)
Water
Spray System Failure
8.8.12
The provision
of a water spray system could put out a fire associated with a road tanker,
since the tanker is covered with a fire protection coating called Chartek. It is considered that a water spray system
can be effective against jet fire for a coated road tanker with a probability
of 0.5.
(ii)
Chartek
Coating Failure
8.8.13
It was
reported that a Chartek coating can give protection for at least 1 hour in case
of jet fire. The coating ensured that the maximum wall temperature did not
exceed 300°C where a
temperature of 500°C is required
for thermal weakening of vessel wall that leads to BLEVE (Boiling Liquid
Evaporating Vapour Explosion). A failure rate of Chartek coating under jet fire
is assumed to be 0.1 per demand under attack for over 1 hour.
(iii)Failure of Fire Service
8.8.14
In
urban area, fire service will be available within a few minutes. It is considered unlikely that the Fire
Service would not be active prior to the occurrence of a BLEVE. However, in
this exercise, it is assumed that such failure rate is 0.5 per demand.
8.8.15
Table 8‑10 summarises the concerned fire fighting system failure
cases and their associated frequency of occurrence.
Table 8‑10 Fire Fighting System Failure Cases and their
Frequency of Occurrences
|
Failure case
|
Frequency
|
|
Water spray
system failure
|
0.5 per demand
|
|
Chartek coating
failure under jet fire
|
0.1 per demand
|
|
Fire service
failure
|
0.5 per demand
|
8.9
Summary of Frequency of Failure Cases Adopted
8.9.1
Table 8‑11 gives a summary
of the frequencies associated with the various failure cases as adopted in this
study.
Table 8‑11 Summary of Frequency of
Failure Cases
|
Failure case
|
Frequency
|
|
Storage vessel
failure (SR and 100% radiography)
·
Catastrophic
·
Partial (25 mm equivalent diameter)
|
1.8 x 10⁻⁷ per vessel year
5.0 x 10⁻⁶ per vessel year
|
|
Road tanker failure
·
Catastrophic
·
Partial (25 mm equivalent diameter)
|
2.0 x 10⁻⁶ per road tanker year
5.0 x 10⁻⁶ per road tanker year
|
|
Guillotine failure of pipework
|
1.0 x 10⁻⁶ per metre per year
|
|
Dispenser failure
|
1.0 x 10⁻⁶ per year
|
|
Flexible hose guillotine failure
·
Filling to underground vessel
·
Filling to vehicles
|
9.0 x 10⁻⁸
per hour
1.8 x 10⁻⁷
per transfer
1.5 x 10⁻⁹
per transfer
|
|
Hose misconnection
|
3 x 10⁻⁵ per operation
|
|
Hose disconnection (underground vessel filling)
|
2 x 10⁻⁶ per operation
|
|
Tanker drives away
|
4 x 10⁻⁶ per operation
|
|
Human error
|
0.2 per demand
|
|
Hose
disconnection (vehicle filling)
|
2 x 10⁻⁶ per operation
|
|
Vehicle drives
away
|
4 x 10⁻⁶ per operation
|
|
Vehicle impact
|
1 x 10⁻⁹ per visit
|
|
Vehicle collision during unloading
|
1 x 10⁻⁹ per visit
|
|
Earthquake of
Modified Mercali Intensity (MMI) VII
|
1.0 x 10⁻⁵
per year
|
|
Truck pump
over-pressure protection system
|
1.0 x 10⁻⁴ per
demand
|
|
Non-return valve
|
0.013 per demand
|
|
Emergency shut-off
valve
|
0.19 per year or
10-4 per demand
|
|
Driver fails to
close manual valve
|
0.5 per demand
|
|
Pressure relief
valve
|
0.01 per demand
|
|
Excess flow valve
|
0.13 per demand
|
|
Breakaway
coupling
|
0.013 per demand
|
|
Water spray system
failure
|
0.5 per demand
|
|
Chartek coating
failure under jet fire
|
0.1 per demand
|
|
Fire service
failure
|
0.5 per demand
|
8.10
Hazard Occurrence
Hazard
Event
8.10.1
There are
various different events which could result in LPG release. Yet, based on the analysis given in Section 3, only the significant cases have been analysed in
this study. Representative hazard initiating event of release cases are
summarised below :
à
Cold
Catastrophic Failure of LPG Vessel;
à
Cold
Catastrophic Failure of Road Tanker;
à
Cold
Partial Failure of LPG Vessel;
à
Cold
Partial Failure of LPG Tanker;
à
Failure
of Filling Line to Vessel.
à
Failure
of Liquid Supply Line to Dispenser;
à
Failure
of Dispenser;
à
Failure
of Flexible Hose for Underground Vessel Loading;
à
Failure
of Flexible Hose for Vehicle Vessel Loading.
8.10.2
Fault
tree analysis is taken based on the failure cases of the hazard events and significant
event outcome as identified above. The fault tree diagram incorporates
different types of failure cases, together with failure of safety equipment and
other human errors which contribute to the release outcome as mentioned. It also addresses the failure to prevent
occurrences of hazard event such as BLEVE (i.e. Boiling Liquid Evaporation
Vapour Explosion) subsequently. The
results as worked out using fault tree analysis are then applied to event tree
analysis in order to relate failure cases with hazard events. A set of fault tree diagrams is shown in
Appendix 8-1. The failure rate as
estimated using the fault tree diagrams are summarised in Table 8‑12.
Table 8‑12 Estimated Failure Rates for Identified
Representative Release Outcomes
|
Representative Release Outcome
|
Failure rate (per year)
|
|
Cold Catastrophic Failure of LPG Vessel
|
3.6 x 10⁻⁷
|
|
Cold Catastrophic Failure of Road Tanker
|
2.7 x 10⁻⁷
|
|
Cold Partial Failure of LPG Vessel
|
1.0 x 10⁻⁵
|
|
Cold Partial Failure of LPG Tanker
|
6.7 x 10⁻⁷
|
|
Failure of Liquid-Inlet Pipework
|
4.8 x 10⁻⁸
|
|
Failure of Liquid Supply Line to Dispenser
|
1.0 x 10⁻⁷
|
|
Failure of Dispenser
|
5.6 x 10⁻⁶
|
|
Failure of Flexible Hose for Underground Vessel Loading
|
6.6 x 10⁻¹⁰
|
|
Failure of Flexible Hose for Vehicle Loading
|
7.1 x 10⁻⁸
|
8.11
Consequence of Hazard Occurrence
Hazard
Consequence
8.11.1
With respect
to LPG leakage, a fire or explosion event can be obtained. The possible outcomes include :
à
Jet
Fire;
à
Flash
Fire;
à
Fireball;
à
Vapour
Cloud Explosion (VCE);
à
BLEVE
8.11.2
It is
assumed in this study that all LPG released will be flashed to vapour so that
flash fire can be formed instead of pool fire.
Actually, this assumption considers the worst scenario because pool fire
is usually a localised hazard event while flash fire can affect off-site area
as well. Beside the event mentioned
above, thermal weakening of the pressure vessel can lead to the occurrences of
BLEVE. Event tree diagrams will be used
for event outcome analysis. The event
tree describes the relationship between outcomes of release cases and hazard
events as a result of such releases.
Frequency
Analysis
8.11.3
The
generic event tree diagrams take into account the following situations, which
lead to possible outcome of fireball, BLEVE, jet fire and flash fire.
à
immediate
and delayed ignition;
à
possible
formation of VCE;
à
progress
of unloading process;
à
possible
flame impingement; and
à
failure
of safety equipment
8.11.4
In
this study, WHAZAN II developed by DNV Technica Ltd. is used for consequence
analysis. WHAZAN II contains a set of hazard analysis models (called
consequence models) together with a physical properties database of up to one
hundred chemicals for estimate of the effect of hazardous chemical
releases. The release rate can be
studied using WHAZAN II.
8.11.5
With
respect to continuous release of LPG, the models: Liquid Discharge - Orifice
and Liquid Discharge - Pipe in WHAZAN II will be used to determine the
discharge rate for such continuous release from vessel/tanker and pipework.
Table 8-13 shows the input and output for the release rate model.
Table 8‑13 Release
Rate Model Input and Output
|
Model
|
Input
|
Output
|
|
Liquid Discharge - Orifice
|
Storage Temperature
Storage Pressure
Orifice Diameter
Discharge coefficient
Liquid Head
|
Discharge Rate
Flash Fraction
Exit Velocity
|
|
Liquid Discharge - Pipe
|
Storage Temperature
Storage Pressure
Pipe Diameter
Velocity Head Loss
Liquid Head
|
Discharge Rate
Flash Fraction
Exit Velocity
|
8.11.6
WHAZAN
II uses the Bernoulli equation {eq 1} for incompressible flow of liquid through
an orifice, which is as follows:
8.11.7
For
the calculation of liquid outflow rates from pipers, WHAZAN II uses the
Bernoulli equation for incompressible flow.
The calculations assume that the pipe is horizontal and is connected, at
the upstream end, to a vessel containing liquid with the surface of the liquid
a height h above the level of the pipe.
The mass flow rate (eq 2) is as follows:
8.11.8
Room
temperature and saturated vapour pressure is assumed for liquid discharge
modelling. This gives a storage temperature and pressure of 298K and 9.85
bar. The discharge rate of 9.5kg/s and
7kg/s respectively for vessel/tanker are resulted. On the other hand, LPG
leakage from dispenser/flexible hose are affected by the submersible pump rate
which is usually of about 100litre/min.
By conversion, it is about 0.6kg/s.
Based on the discharge rate, the time to empty the vessel and tanker for
vessel/tanker partial failure and dispenser/flexible hose leakage should be
about 15 minutes and 3 hours respectively.
8.11.9
It is
known that BLEVE will result if the vessel/tanker is not empty when vessel
failure due to thermal weakening by flame impingement occurs. Impingement is due to jet fire which attacks
the vessel/tanker. And at the same time,
safety equipment cannot effect to avoid the increase of temperature so that
rupture occurs. The possibility of
impingement on vessels/tankers is dependent upon the relative position of
vessels/tankers and the orifice or pipe where leakage occurs. As the time to emptiness for partial failure
of vessel/tanker is about 15 minutes, and the time for thermal weakening is
about 1 hour, it is considered BLEVE is unlikely to occur for these failure
case. In this exercise, it is assumed
that the road tanker is not empty before failure only for guillotine failure of
liquid inlet pipework, guillotine failure of liquid outlet pipework, failure of
dispenser and failure of flexible hose.
8.11.10
Ignition
probability is one of the determining factors of consequence of hazard outcome.
Fireball will result in case immediate ignition upon catastrophic failure of
vessels/ tankers occurs. Jet fire
usually occurs as a result of partial failure of vessels/tankers or the
breakaway of pipework, and is triggered by immediate ignition.
8.11.11
For
delayed ignition, flash fire may occur and followed by jet fire if there is LPG
fuel remained for continuous release. On the other hand, VCE can only occur in
case a significant degree of confinement is available to generate the
turbulence required, which is not anticipated in the current situation based on
the “open” design of the LPG installation.
8.11.12
The
ignition probability is dependent upon the time of release (e.g. ignition
probability will be lower at night when fewer ignition sources are expected to
be present), the scale of release, weather category/ wind direction and
topography, which affects the dispersion distance to the lower flammable limit
for LPG, and location of ignition sources. In case of catastrophic failure of
vessel/ tanker, immediate ignition is more likely. On the other hand, there is a higher probability for delayed
ignition with respect to continuous release due to partial failure, pipework
failure, etc.
8.11.13
The
probability of ignition would be determined for different directions, wind
speed and stability class. With respect
to the proposed LPG filling station, gas will more likely spread to Road 20/6
due to the use of solid wall on the other three sides.
8.11.14
Occurrence
of VCE requires significant confinement of vapour, which is unlikely for such
“open” design of the proposed LPG filling station. Therefore, the probability
for VCE is occur is considered negligible in this study.
8.11.15
The
proposed LPG filling station also provides facilities for the storage and
supply of petrol and gasoline. It
implies the necessity to consider knock-on effect due to LPG hazard outcome.
With respect to the possible hazard outcomes, only fireball and BLEVE will
result in significant impact leading to knock-on failure. Owing to the use of underground storage for
petrol and gasoline, their vessels and pipework failure due to fireball and
BLEVE are unlikely. However, failure of dispensers will be possible, which
leads to jet fire occurrence. Yet, the
effect and area covered by fireball or BLEVE will be much higher than that of
jet fire. It is therefore concluded
that such knock-on effect can be neglected in this study.
8.11.16
Event
tree diagrams are developed for the study and are shown in Appendix 8-2. A summary of the result of event tree
analysis is shown below in Table 8-14.
Table 8‑14 Hazard Event Outcome for Representative
Release Event
|
Representative Release Event
|
Hazard Outcome and Probability of Occurrence
|
|
Cold Catastrophic Failure of LPG Vessel
|
Fireball (90%)
|
|
Cold Catastrophic Failure of Road Tanker
|
Flash fire (10%)
|
|
Cold Partial Failure of LPG Vessel
|
Jet fire (29%)
|
|
Cold Partial Failure of LPG Tanker
|
Flash fire (24%)
|
|
Failure of Filling Line to Flexible Hose
|
Jet fire (29%)
|
|
Failure of Liquid Supply Line to Dispenser
|
Flash fire (24%)
|
|
Failure of Dispenser
|
BLEVE (0.007 %)
|
|
Failure of Flexible Hose for Underground Vessel Loading
|
|
|
Failure of Flexible Hose for Vehicle Loading
|
|
8.11.17
Based on
the result in Table 8-14, there is an extremely low probability for BLEVE
occurrence. By incorporating the
failure rate and consequence of event, the probability of occurrences of each
hazard outcome can be derived and summarised below in Table 8‑15.
Table 8‑15
Hazard Consequence Outcome Frequency
|
Frequency of Occurrence
|
|
|
|
|
|
Failure Case
|
Consequence
|
|
|
Fire
Ball
|
Flash
Fire
|
Jet
Fire
|
BLEVE
|
|
Cold Catastrophic Failure of LPG Vessel
|
3.2 x 10⁻⁷
|
3.6 x 10⁻⁸
|
0
|
0
|
|
Cold Catastrophic Failure of Road Tanker
|
2.4 x 10⁻⁷
|
2.7 x 10⁻⁸
|
0
|
0
|
|
Cold Partial Failure of LPG Vessel
|
0
|
2.4 x 10⁻⁶
|
2.9 x 10⁻⁶
|
0
|
|
Cold Partial Failure of LPG Tanker
|
0
|
1.6 x 10⁻⁷
|
1.9 x 10⁻⁷
|
0
|
|
Failure of Filling Line to Flexible Hose
|
0
|
1.2 x 10⁻⁸
|
1.4 x 10⁻⁸
|
3.4 x 10⁻¹²
|
|
Failure of Liquid Supply Line to Dispenser
|
0
|
2.4 x 10⁻⁸
|
2.9 x 10⁻⁸
|
7 x 10-12
|
|
Failure of Dispenser
|
0
|
1.3 x 10⁻⁷
|
1.6 x 10⁻⁷
|
3.9 x 10⁻¹¹
|
|
Failure of Flexible Hose for Underground Vessel Loading
|
0
|
1.6 x 10⁻¹⁰
|
1.9 x 10⁻¹⁰
|
4.6 x 10⁻¹⁴
|
|
Failure of Flexible Hose for Vehicle Loading
|
0
|
1.7 x 10⁻⁸
|
2.1 x 10⁻⁸
|
5.0 x 10⁻¹²
|
8.12
Consequence Analysis
8.12.1
Beside
the release rate, spreading of fire and explosion events are also studied using
WHAZAN II. The following models for
propane are used to determine dispersion and affected distance of fire ball and
jet fire event:
à
Dense
Cloud Dispersion;
à
Jet
Flame;
à
Fireball/BLEVE.
8.12.2
Additionally,
an in-house developed software, the QRA system 1.0 has been applied to predict
the consequence of such hazard impacts and estimate the risk including societal
and individual risks incurred based on the result generated by WHAZAN II.
Fatality
Rate
8.12.3
The
level of damage caused is a function of duration of exposure, as well as of
heat flux. The variation of the effects
on humans with changes in heat flux and in duration of exposure can be
expressed in the form of a probit equation (Eisenberg, 1977) :
 where Q is in Watts and t is in seconds.
8.12.4
Table 8‑16 presents time of exposure required for different
fatality levels under various radiation levels.
Table 8‑16 Fatal
Radiation Exposure Levels (From Probit)
|
|
Seconds Exposure for % Fatality
Levels
|
|
Radiation Level (kW/m2)
|
1%
|
50%
|
99%
|
|
1.6
|
500
|
1300
|
3200
|
|
4.0
|
150
|
370
|
930
|
|
12.5
|
30
|
80
|
200
|
|
37.5
|
8
|
20
|
50
|
8.12.5
It is
assumed that it might be possible to “shelter” within half to one minute in
general. Therefore, the radiation of 4.0 kW/m2 or lower can be
significant from the point of view of pain, but not of fatality as there should
be sufficient time for escape.
8.12.6
Jet
fire and flash fire are of longer duration and fireball is of limited duration
between 2 to 30 seconds. Accordingly,
radiation level of 4.0 kW/m2 or lower for fireball will have a fatal
rate of zero.
Fireball
8.12.7
Fireball
is more likely to occur with respect to immediate ignition upon instantaneous
release from vessels/tankers due to catastrophic failure. Instantaneous
ignition of a certain mass of LPG results in explosion and fire of
hemispherical shape. Heat is evolved by radiation. When the combustion has filled the fireball, the thermal
radiation output of the fireball is at its maximum and the hemisphere forms a
sphere and rises due to the buoyancy of the hot gases formed by the combustion
to a height of about ¾ times of the diameter of the fireball. The principal hazard of an LPG fireball
arises from thermal radiation. Due to
its intensity, its effects are not significantly influenced by weather, wind
direction or source of ignition. The effects can be expressed simply in terms
of fatality rate at given distances and heights.
8.12.8
The
radius of the fireball, radiation distance and duration is solely determined by
the mass of LPG available. The mass for fireball calculation is assumed to be
the total mass retained in the ruptured vessel. By adopting the Fireball model in Whazan II, the duration of the fireball
and radiant heat level at particular distance can be obtained.
8.12.9
For
the occurrences of fireball or BLEVE, empirical correlation in WHAZAN is used
to calculate the size, duration and radiant intensity of fireballs of flammable
liquid and/or vapour. Table
8‑17 shows the input and output of the fireball/BLEVE
model.
Table 8‑17 Fireball/BLEVE
Model Input and Output
|
Model
|
Input
|
Output
|
|
Fireball/ BLEVE
|
Flammable Mass
Efficiency Factor
|
Maximum fireball radius
Duration of fireball
Distances to the 1.6, 4.0, 12.5
and 37.5 kW/m2 radiation levels
|
8.12.10
Using
the correlation of Crossthwaite et al (1988) the maximum fireball radius is:
The duration for m<37,000 kg is:  and for m>37,000
kg is:
and for m>37,000
kg is: 
The energy released by combustion at efficiency h is: Q = Hcmh and
 Roberts (1982).
8.12.11
Accordingly,
the fatality rate can be estimated using the probit formulae
Jet Fire
8.12.12
In
case partial failure of the vessel/ tanker and failure of pipework, hose, etc.
occur, a continuous release of LPG will be resulted. Vessel/tanker is usually pressurised so that the escape velocity
of LPG is relatively high. WHAZAN II is used to determine the discharge rate
and in turn the jet fire event for such continuous release from vessel/tanker
and pipework. Table 8‑18 shows the escape velocity and discharge rate of LPG
with respect to orifice and pipework discharge.
Table 8‑18 Release
Rate for Liquid Discharge
|
Model
|
Mass Discharge (kg/s)
|
Release Rate (m/s)
|
|
Liquid Discharge - Orifice
|
9.5
|
32.7
|
|
Liquid Discharge - Pipe
|
7.0
|
24.3
|
8.12.13
The jet
fire model in WHAZAN II is based upon that described in API RP521 (American
Petroleum Institute, 1982). The size of
the flame is dependent upon the flow rate and in turn the operating pressure
and size of the break. Table
8‑19 shows the input and output of jet flame model where
the length of the frame is given by:
Table 8‑19 Jet Flame Model
Input and Output
|
Model
|
Input
|
Output
|
|
Jet Flame
|
Flare Diameter
Discharge Rate
Discharge Speed
Wind Speed
Efficiency Factor
Radiation Level Required
|
Downwind distance
Crosswind distance
Distances to 4.0, 12.5 and 37.5 kW/m2 radiation levels
|
Flash
Fire
8.12.14
With respect
to continuous release, the dispersion distance of LPG should be found in order
to determine the scale of influence geographically. Dense cloud dispersion model will be applied. Table 8‑20 shows the input and output for these dispersion
models.
Table 8‑20 Dispersion
Model Input and Output
|
Release
|
Model
|
Input
|
Output
|
|
Instantaneous
|
Dense Cloud
Dispersion
(instantaneous
release)
|
Mass Released
Release
Temperature
Dilution Factor
Initial Cloud
Radius
Wind Speed
Pasquill
Stability Category
Surface Roughness
Parameter
Ambient
Temperature
Relative Humidity
Min Concentration
of Interest
|
Maximum downwind
effect distance
|
8.12.15
WHAZAN
II uses the Cox and Carpenter (1980) model which is one of several “top-hat” or
“box” models in existence for dense cloud dispersion modelling. An instantaneous release is represented as a
cylindrical cloud. As the dense cloud
disperses, it spreads laterally outwards due to density effects, and entrains
air through its top and side surfaces. On the other hand, a continuous release
is represented by a cloud of rectangular cross-section, which spreads laterally
cross-wind because of gravity and moves with the wind.
8.12.16
Lateral
spreading takes place at a rate:
where the constant k is obtained by comparison with experimental data
and is found to have a value of approximately unity. In this equation, r is the radius of instantaneous clouds and the
semi-width of continuous clouds. The
ground level concentration at the cloud centreline in then modelled as:
 for the instantaneous release case and as:
 for the continuous release case
8.12.17
Humans
who are encompassed outdoors by the flash fire will be fatally injured. A fatality rate of unity is assumed.
8.13
Risk Summation
Modelling
of Consequences of Hazards
8.13.1
To calculate
the risk of hazard occurrence including fireball, flash fire and jet fire, the
in-house developed software QRA-LPG will be used. It is capable of integrating all contributing factors to produce
an individual risk contour and societal risk in the form of F-N curve. These factors include failure frequencies,
hazard ranges, weather parameters, population distribution (spacial and
temporal) and appropriate impact factors.
Collection of Data
8.13.2
The
collection of data as classified in QRA-LPG includes: topography, population,
meteorology, risk source, event outcome probability, consequences and escape
factor data. Additionally, protection factor is accounted by re-adjusting the
population to emulate the effect of protection.
Topography
8.13.3
The
topography is composed of objects called regions. A region can be defines as buildings, roads and other areas.
Subsequently, population information can be related to the regions to calculate
the impact.
Population and Ignition Source
8.13.4
Population
data is defined with reference to the region of the topography information.
Additionally, the variation of population is also specified here with respect
to different period such as weekday/weekend or time of a day. Moreover, protection factor is applied here
to take into account the difference between indoor (including population inside
trains) and outdoor situation and the effect of thermal radiation wall. A protection factor of 0.8 is assumed for
persons situated inside a structured building; a protection factor of 0.5 is adopted
for vehicles. For population protected by the solid radiation wall (the
northern façade) of the proposed bus depot, a higher protection factor has been
applied to reflect further mitigation effect. Ignition source, on the other
hand, is defined for calculating the extent of influence of flashfire event.
Meteorology
8.13.5
The
frequency of occurrences of combination of wind speed and stability class in
daytime and nighttime is also included for assessment.
Risk Event and Consequence
8.13.6
Each
risk event consequence consists of information about the frequency of each
consequence, consequence parameter, and time of occurrence.
Risk Source
8.13.7
This
database includes information about the frequency of occurrence of each risk
event and the location where it happens. As the LPG inventory level varies, it
is assumed in this exercise that the consumption of LPG is in a linear manner,
and 5 periods are sub-divided within which the inventory level will be
different, such that the change of inventory level can be simulated.
8.14
Assessment Finding and
Discussion
Assessment
Criteria
8.14.1
Having
considered every aspect ranging from initiating events, hazard occurrences,
possible impact to quantified risk levels, the individual and societal risks
obtained can be compared with the risk guidelines, which has been adopted by
CCPHI to assess the off-site risk levels of PHIs. The maximum level of off-site
individual risk associated with PHIs should not exceed 1 in 100,000 per year.
On the other hand, the societal risk guidelines are expressed in terms of lines
plotting the frequency (see Figure 8-3).
Two Frequency of Fatalities (F) vs. Number of Fatalities (N) risk lines
are used in the societal risk guidelines to determine “acceptable” or
“unacceptable” societal risks. Moreover, there is a vertical cut-off line at
the 1,000 fatality level extending down to a frequency of 1 in billion
years. The intermediate region is
incorporated in the societal risk guidelines in which the acceptability of
societal risk is borderline and should be reduced to a level which is “as low
as reasonably practicable” (ALARP). It
seeks to ensure that all practicable and cost-effective measures which can
reduce risks will be considered.
Control
Measures
8.14.2 There
are many practical methods for reducing risks associated with the operation of
the LPG filling station. The
application of a fireproof coating to tankers will greatly reduce the risk of
BLEVE. The installation of safety devices such as EFV can reduce the frequency
of failure events. The selection of safe site for the stationary installation
and place for the parking of tanker is useful to reduce fatality and occurrence
frequency of impact event. Moreover,
the inventory should be kept as low as possible. Furthermore, proper training and safety practice can reduce the
probability of incorrect action.
8.14.3 In
this study, standard control measures has been assumed to be incorporated into
the design of the LPG filling station such as the use of fireproof coating to
tankers, the maintenance of low inventory (a maximum of about 85% of full
capacity), installation of safety devices, the dedication of bay area for
tanker parking and the avoidance of tanker collision during unloading by
controlling the use of dispenser system, well-adopted training system and
well-trained personnel. As a
precautionary measure, the entire northern façade of the bus depot building
will be constructed in form of a solid concrete wall without opening as an
at-receiver risk-reduction measure.
Assessment
Finding
8.14.4
The assessment
result in the form of societal risk in form of F-N curve and individual risk
contour are shown in Figures 8-3 and 8-4, respectively.
8.14.5
It can
be observed that the societal risk is within the acceptable region as defined
by the risk guidelines. The individual risk in the vicinity of the LPG
installation expressed in terms of risk level contour line is shown in Figure
8-4. The individual risk level within
the boundary of the bus depot site is also found to be within the acceptable
level of 1 in 100,000 per year.
8.14.6
The
Potential Loss of Life (PLL), which is calculated based upon the following
equation, are equal to 2.5 x 10⁻⁵.
Moreover, significant events contributed to the PLL is listed in Table 8‑21.

Table 8‑21 Events contributed to PLL
|
Hazardous Event
|
Fatality
|
Frequency
|
F x N
|
|
Fireball
|
5 – 322
|
3.4E-07
|
2.3E-05
|
|
Flashfire
|
1 – 13
|
5.6E-07
|
9.9E-07
|
|
Jetfire
|
1 – 3
|
3.1E-07
|
5.9E-07
|
|
|
|
|
2.5E-05
|
8.15
Conclusion
8.15.1 The
findings of the QRA carried out based on the design of a typical LPG/ Petrol
filling station indicated with the provision of standard risk control measures incorporated
into the design of the LPG/ Petrol filling station, and the precautionary
measure of providing a solid concrete wall for the entire northern façade of
the bus depot building, the project based on the existing design will not be
subjected to unacceptable risk from the operation of the LPG/ Petrol filling
station and the overall societal risk impact will be within acceptable level.
It is anticipated that the proposed project will not pose any unacceptable
constraint on the future design of the LPG/Petrol filling station.
9.
Landscape and Visual Impact
Assessment
9.1
Introduction
9.1.1 The
proposed building layout covers the entire site due to the need to accommodate
the various provisions on site which is just over one hectare. These included driveway and ramp system with
15-m turning radius, 80 numbers of maintenance spaces, about 100 numbers of
parking spaces and other supporting facilities. Consequently, there will be no space for plating after the
building is completed.
9.2
Landscape Impact
Assessment
9.2.1 A
baseline study has been carried out to identify the existing landscape
character of the site, according to the Guidelines for Landscape Impact
Assessment of EIAO Technical Memorandum. The site is a flat vacant lot
presenting no special landscape character and visual amenity in the area. The
only landscape resource is the existing vegetation scattered throughout the
study area.
9.2.2 As
such, a comprehensive tree survey (See Appendix – 9-1 submitted under a
separate cover) has been carried out to identify the baseline conditions of the
existing landscape resources based on the survey parameters set out in WBTC
24/94. A total 111 numbers of trees,
including 23 numbers of trees which are outside boundary, have been surveyed. The trees are mainly common species with
trunk diameter varies from 0.1m to 0.4m.
There is only one banyan tree (T51) which trunk diameter is over 0.5m.
9.2.3 According
to the proposed architectural layout, all the existing trees within the site
will be affected by the works and cannot be retained. In other words, a total 88 numbers of trees will be required to
be removed from the site during the site clearance period.
Mitigation
Measures
9.2.4 In
order to mitigate the landscape impact, a detailed study on transplanting some
of the high quality trees have been conducted (See Appendix 9-1) to formulate
the transplanting strategies according to a set of established criteria.
9.2.5 In
order to enhance the environmental quality of the area, the feasibility of
transplanting T104 (Grevillea robusta), T105 (Bombax malabaricum) and T111
(Bombax malabaricum) to the nearby roundabouts on Road 20/4 (Annex 1) outside
Citybus’ proposed depot has been explored. Given that Road 20/4 would only be
completed in around July 2002 which could not match the time for transplanting
of trees in December 2001, and the roundabouts on this road are quite small
with a diameter of about 8 metres, Transport Department considered that it was
not suitable to transplant the trees at such locations because these
roundabouts were delineated by road markings only. Some long vehicles, particularly the container trucks observing
the Superpost Centre on Road 20/4, might need to weave into the roundabout to
make turnings. From road safety point
of view, it is not appropriate to transplant these 3 trees at the roundabouts.
9.2.6 Discussions
have been held with DAO of LCSD and Landscape Section of Highways Department on
selecting suitable sites to accommodate all the transplanted trees. During the discussion, it was agreed that
the trees should be transplanted to a large open space for better establishment
and aesthetic reasons.
9.2.7 Effort
is also being made through Lands Department to make enquiries from various
government departments, including AFCD, etc., for an outlet for the trees.
9.2.8 In
case no suitable site can be identified by government departments, it is
recommended to transplant the trees to Chai Wan Park (Annex 2) Cape Collinson
Chinese Permanent Cemetery (Annex 3), Yee Shing Lane Sitting Out Area (Annex 4)
or the proposed Town Park at Aldrich Bay (Annex 5). Visit to the site and
discussion with LCSC indicate that this option are feasible, subject to
LCSD’s final agreement on the exact
location of the transplanted trees.
9.2.9 If
the trees cannot be transplanted to their permanent locations immediately due
to various reasons, the transplanting contractor shall be required to form a
holding nursery for the purpose of nursing the trees exclusively for this
project. The maintenance of these trees
shall be closely monitored by the landscape consultants until they are
successfully transplanted to their permanent locations. The cost for the whole operation up to
successful handover of trees to relevant departments shall be borne by the
Applicant.
9.2.10 In
addition, a planting proposal is included (Section 7 of Appendix 9-1) and is
based on the proposed building layout with the intention to introduce greenery
where possible to mitigate the landscape impact and further enhance the quality
of the environment.
9.2.11 Since
the existing vegetation mainly consists Ficus trees, as illustrated in the tree
survey, a row of Ficus benjamina is proposed to be planted with understorey
shrubs. The wall behind the planter
will be covered by creepers and vines to form a green backdrop on the street
level.
9.2.12 There
are planters on the 1st and 3rd floor where Ficus
benjamina will also be planted. In
order to soften the hard edge and introduce more greenery to the building,
hanging plants such as Allamanda cathartica and Scindapsus aureus will also be
planted to improve the visual quality.
9.2.13 As the
quality of streetscape is important to mitigate the landscape and visual
impact, it is further recommended that a row of heavy standard Delonix regia
should be planted along the proposed footpath along Road 20/4, and the footpath
along Shing Tai Road where practicable.
As the footpaths are outside site boundary, approval should be obtained
form Highway’s Department.
Implementation
9.2.14 The
transplanting works will be carried out strictly according to the Transplanting
Specification (Appendix D of Tree Survey Report) under the close monitoring by
ER who should be a qualified landscape architect or arboriculturist. The
various responsible parties can be summarized as follows:
Table 9‑1 Summary of the
Implementation for the Transplanting Works
|
Mitigation Measures
|
Funding
|
Implementation
|
Maintenance
|
Management
|
|
1. Transplanting 13 nos of trees to Chai Wan Park,
Cape Collinson Chinese Permanent Cemetery, Yee Shing Lane Sitting Out Area or
the proposed town park at Aldrich Bay
|
Citybus
|
Contractor
|
LCSD
|
Food and Environment Hygiene Department /
LCSD
|
|
2. Compensatory Planting within site boundary
|
Citybus
|
Contractor
|
Citybus
|
Citybus
|
|
3. Tree Planting along Road 20/4 & Shing Tai
Road
|
Citybus
|
Contractor
|
LCSD
|
Highways / Transport Department
|
9.3
Visual Impact
9.3.1
It is
recognized that the two common side boundary walls could have an impact
visually, particularly due to the requirements that they must be solid without openings. However, as the subject site to a class ‘A’
site, it is not normal to elaborately treat the side common walls. However, since it is anticipated that a
petrol filling station, which traditionally is single-storey, will be erected
on the site besides the northern boundary wall, special attention will be paid
in its treatment. As no details are
available on the petrol filling station to be built and therefore treatment of
our external wall cannot take into consideration its location, building form,
colour, etc., it is proposed that recessed grove lines be introduced to divide
the wall into panels, so as to reduce its massive scale. Colours will also be used to further break
down the scale by means of spray-painting on plaster. In addition to spray-painting, metal cladding, tiling will also
be used for the main elevations facing Road 20/4 and Shing Tai Road, in order
to add richness in texture and colour, so as to create an environmental in
harmony with the surroundings.
9.3.2
The
side and rear elevations of the building would be designed in line with the
style of front elevation as shown in the perspective given in Appendix 9-2.
10.
Wastewater Treatment and Disposal
Facilities
10.1
Relevant Standards and Guidelines
10.1.1
The Water Pollution Control Ordinance (WPCO) (Cap. 358)
enacted in 1980 is the principal legislation controlling water quality in Hong
Kong. Under the WPCO, Hong Kong waters
are classified into 10 Water Control Zones (WCZ). Statutory Water Quality Objectives (WQO) are specified for each
WCZ. The WQO for any particular waters,
as defined in the WPCO, shall be the quality which should be achieved and
maintained in order to promote conservation and best use of those waters in the
public interest.
10.1.2 The
Technical Memorandum on “Standards for Effluents Discharged into Drainage and
Sewerage Systems, Inland and Coastal Waters” issued under Section 21 of the
WPCO defines acceptable discharge limits of effluent to different types of
receiving waters. Under the Ordinance,
any discharge into a WCZ requires licensing and must comply with the terms and
conditions specified in the licence, except for domestic sewage discharged into
public foul sewers, and unpolluted water into stormwater drains and river
courses.
10.1.3 The guidelines
for handling and disposal of construction site discharges as detailed in EPD’s
ProPECC Note PN1/94 “Construction Site Drainage” recommend measures for
construction phase wastewater management.
10.2
Wastewater Treatment and Disposal
10.2.1
Wastewater effluent generated from the construction
work stage shall be managed in accordance with the requirements under ProPECC
Note PN1/94 such that an unacceptable water quality impact would not be
resulted. No effluent discharge shall
be allowed into the embayed water of the Cargo Handling Basin, or stormwater
drains at road carriagways and other public areas during the construction
phase.
10.2.2
During the operational phase, wastewater effluent
generated from designated bus washing areas may contain petrol and should be
diverted to petrol interceptors before being discharged into government
sewers. Sewage generated from kitchen
area should also be diverted to grease traps before disposal. The design of the petrol interceptors and
grease traps to be installed shall enable the treated effluent to meet the
limits stipulated in the Technical Memorandum on “Standards for Effluents
Discharged into Drainage and Sewerage Systems, Inland and Coastal Waters”.
10.2.3 Sufficient
stormwater drainage facility should be provided for the development. All rainwater collected from the roof floor
carparks shall be diverted to petrol/oil interceptor. The design of which
should allow stormwater bypass during peak flow periods.
10.2.4 No
effluent discharge shall be allowed into the embayed water of the Cargo Handling
Basin, or stormwater drains at road carriagways and other public areas during
the operational phase.
11.
sUMMARY OF eNVIRONMENTAL OUTCOMEs
11.1 Introduction
11.1.1 This
chapter of the report summarises the key environmental outcomes associated with
the proposed Headquarters and Bus Maintenance Depot development in Chai Wan as
assessed in the preceding sections.
11.2 Environmental Benefits
Maintaining
a Stable Engineering and Maintenance Facilities
11.2.1 Implementation
of the project will establish a stable bus maintenance facility to support
Citybus’ services in the Eastern and Central Districts in the long term as a
sustainable approach. This will avoid
the recurrent process of construction and then demolition of temporary bus
depot in the region.
11.2.2 As the
existing temporary bus depot of Citybus is planned to be demolished later this
year, and the CMB depot site in Chai Wan, which is rezoned as a CDA, cannot be
rented for longer term use due to its redevelopment programme, the early
establishment of the proposed bus depot will enable the maintaining of a stable
engineering and maintenance facility for buses serving the public in the
Eastern and Central Districts on an environmentally acceptable development
site.
Compatibility
of Landuses
11.2.3 Temporary
bus depots are often located at sites not planned for long-term industrial
uses. As a result, there are often
active development or redevelopment taking place in the vicinity of these
sites. Through transient, there are
often situations that the new developments and the temporary bus depot are not
directly compatible landuses,.
11.2.4 The
subject industrial site was selected after a site selection process, and
demonstrated through this EIA to be a suitable site for development of a
permanent bus depot. Establishing a
permanent bus depot on the subject site instead of continuous reliance on
temporary bus depot can therefore be regarded as an environmental and planning
gain of the project.
Environmentally
Friendly Design Adopted and Problems Avoided
11.2.5 Design
of the bus depot has taken into account various design factors including
environmental, architectural, engineering, and traffic. On the environmental side, in order to avoid
potential industrial noise impact on the surrounding landuses, the northern and
southern sides of the building are planned to be constructed as a blank façade
to block the views from Heng Fa Chuen and Tsue Wan Estate. Additionally, 3m high noise barrier is
planned to be erected near the depot edge at roof level of the bus depot to
alleviate potential noise impact from bus parking or leaving.
11.2.6 Design
of the bus depot ingress and egress points have also taken into account the
locations of the nearby sensitive receivers.
Thus, no bus ingress point is planned on the western side (as well as southern
and northern sides of the development) of the development such that even during
emergency situations, potential bus queuing on Shing Tai Road can be
avoided.
11.2.7 The
multi-storey bus depot is designed to be a low-rise building consisting of G/F,
1/F and roof floor. Higher floors (4/F
and 5/F) allocated for office uses will only be constructed at an extension on
the southern side of the site abutting the future Road 20/4. Potential visual
impact has been further avoided by consideration of appropriate building façade
treatment. Strategies considered
include the use of recessed grove lines to divide wall into panels to reduce
the massive scale of the facades, and use of colours to further breakdown the
scale by means of spray-painting on plaster.
Metal cladding and tiling will be used for the elevations as appropriate
facing Road 20/4 and Shing Tai Road to add richness in texture and colour. The implementation of these measures will
ensure visual compatibility with the surrounding environmental context.
Benefits
of Recommended Environmental Protection Measures
11.2.8 Sufficient
dust and noise control measures have been recommended to ensure that the
construction impact, through transient, can be controlled or alleviated to
acceptable levels. Appropriate control
measures have also been identified and recommended to effect proper
construction waste management and wastewater effluent control to be implemented
by the Contractor.
11.2.9 A tree
survey has been undertaken and a tree preservation and planting proposal has
been formulated to alleviate the landscape and visual impact to acceptable
levels.
11.2.10 Appropriate design
of the bus depot will avoid potential industrial noise impact from the depot
operation. Potential traffic noise
impact has also been avoided through adopting an appropriate bus routing plan
for buses leaving or returning to the bus depot. The air quality and traffic noise models reveal that potential
vehicular emission and traffic noise impact will be within acceptable levels.
11.2.11 Implementation of
the strategies and measures recommended in the EIA report during the
operational phase will effect appropriate waste and wastewater management and
minimize the chance of land contamination potential in future. Implementation of the impact-mitigation
oriented Environmental Management System (EMS) during the operational phase
will not only allow the relevant environmental legislation and regulations to
be satisfied, but also prevent the occurrence of any unacceptable environmental
impact and achieve continual improvements guided by the established
Environmental Policy.
11.2.12 Adopting a blank
façade on the northern side of the depot building will minimize the risk from
the operation of the planned LPG/ Petrol filing station as a precautionary
measure.
11.2.13 The environmental
sensitive receivers and population that will be protected from potential
environmental impact avoided or mitigated has been estimated and summarized in
Table 11-1.
Table 11‑1 Environmentally Sensitive
Areas and Population Protected
|
Environmentally Sensitive Areas
|
Estimated
Population (approx.) protected during mid-night return or early morning
leaving of buses
|
|
Heng Fa Chuen
|
350
|
|
Staff Quarters of Hong Kong Institute of Vocational
Education (Chai Wan)
|
150
|
|
Institute of Vocational Education (Chai
Wan)
|
N/A
|
|
Tsui Wan Estate
|
3,000
|
N/A – not expected to be in operation during the early
morning leaving and mid-night return of buses.
12.
Overall Conclusion
12.1
Introduction
12.1.1 An
Environmental Impact Assessment (EIA) has been undertaken to address all key
environmental issues associated with the construction and operation of the
proposed bus depot. The assessments
were carried out based on the requirements of the EIA study brief (Brief No.
ESB-065/2001) issued by Director of Environmental Protection (DEP).
12.1.2 The
project proponent identified the need to construct and operate a permanent bus
depot and approached the Government departments to discuss the issue in early
2000. Site selection was considered
with the relevant Government departments taking into account factors including
site requirements and landuse compactability.
At the Hong Kong District Planning Conference held in mid-June 2000, the
subject site bounded by the future local road 20/4 to the East and Shing Tai
Road to the west currently under study was finally selected to be a suitable
site to be further studied in details.
Planning Department advised that the site selection was a Government
Departmental agreement taking into account the relevant factors. Citybus was required to conduct a Traffic
Impact Assessment (TIA) and an EIA to assess and confirm the technical
feasibility of the project at the subject site.
12.2
Key Environmental Issues
12.2.1 The
key environmental issues studied in the EIA include air quality, noise, waste
management, land contamination prevention, sewage treatment and disposal,
hazard impact as well as landscape and visual impacts in accordance with the
requirements of the EIA Study Brief.
Mitigation measures have been recommended where necessary to alleviate
all identified environmental impacts associated with the construction and operation
of the project. The conclusions for
each of the assessed environmental aspects are summarized below.
12.3 Air Quality Impact Assessment
12.3.1 Construction
dust emission is identified to be the key concern during the construction
phase, particularly during the execution of the foundation works. With the application of the air quality
model, Fugitive Dust Model (FDM), the extent of potential dust emission impact
on the surrounding Air Sensitive Receivers (ASRs) were assessed. All predicted dust levels at the ASRs were
found to be within acceptable levels.
Nevertheless, dust control measures have been recommended for
implementation as a prudent approach in controlling potential air quality
impact. With the implementation of dust
control measures under the requirements of the Air Pollution Control (Construction
Dust) Regulation, implementation of the project will unlikely generate any
unacceptable air quality impact on the surrounding ASRs during the construction
phase. Implementation of the required
dust control measures are recommended to be checked through carrying out an
environmental monitoring and audit programme.
12.3.2 Potential
concern over operation of the proposed bus depot in terms of creating an air
quality problem leading to exceedance of the Air Quality Objectives (AQOs) were
assessed quantitatively. Emissions
directly from the proposed bus depot, buses running on the nearby road
carriageways were assessed for the year 2018 scenario taking into account the
likely traffic flows on the roads in the presence of other future developments
in the area. The early morning peak
hour and mid-night peak hour scenarios were considered as these represent the
worst-case situations when the bus depot would generate the maximum bus flows. With consideration of worst-case
meteorological conditions, the cumulative pollutant levels on the nearby ASRs
were found to be well within the relevant AQOs. The assessment results indicate that the operation of the bus
depot will not cause any unacceptability air quality impact on the surrounding
ASRs.
12.4
Noise Impact Assessment
12.4.1 The
construction noise impact assessment revealed that in the absence of noise
mitigation measures, operation of powered mechanical equipment (PME) during the
foundation works and superstructure construction may pose a noise impact on the
surrounding noise sensitive receivers (NSRs), including IVE (Chai Wan) and
nearest blocks of Tsui Wan Estate.
Sufficient noise mitigation measures have been recommended and their
adequacy was evaluated quantitatively to alleviate the noise impact to meet the
daytime construction noise limit.
12.4.2 Potential
operational phase noise impact arising from operation of fixed plants at the
depot was assessed with a quantitative approach. In the presence of other planned future developments in the
vicinity, the northern and southern sides of the depot building are planned to
be bound by a solid façade. A 3m high
solid wall will also be erected at near the depot edge along the southern,
western and northern side of the bus depot at roof level. The findings of the assessment based on
consideration of the worst-case scenario indicate that given the significant
distance separation between the bus depot and the nearby NSRs, the presence of
a significant noise impact is not anticipated.
12.4.3 As a
prudent approach, potential off-site traffic noise impact has been taken into
account in the planning of the bus route.
It was agreed with Transport Department (TD) through the Traffic Impact
Assessment (TIA) that buses from Siu Sai Wan to the depot and Siu Sai Wan bound
buses will be required to use Sheung On Street Extension and Road 20/4 instead
of allowed to use Wing Tai Road and Shing Tai Road at all time periods.
12.4.4 Potential
traffic noise impact attributable to the proposed bus depot on the nearby NSRs
were assessed by comparing the traffic noise levels for the early morning peak
and mid-night peak periods for the “with bus depot” and “without bus depot”
scenarios in 2003 and 2018. The
assessment results confirm that noise contribution from buses generated from
the depot on the background noise levels on the road carriageways will be
insignificant.
12.5 Waste Management
12.5.1 The
concerned waste streams that would be generated during the construction and
operational phases of the project were identified and evaluated in terms of
their types, nature and likely quantity as far as practicable. Opportunities
for reduction in waste generation through reuse or recycling are identified and
evaluated. The waste management
implications and potential environmental impacts associated with the handling,
transport, and disposal of the identified waste types are addressed. Mitigation
measures based on good practices have been recommended for each waste type to
address any potential environmental impacts.
12.5.2 A
Waste Management Plan (WMP) is recommended to be developed by the appointed by
Contractor based on the recommended control measures for the handling of
C&DM. The WMP should be submitted to the Engineer for approval on the
advice of the EPD. In addition, an
audit programme is recommended to be in place during the construction phase to
check that the waste generated from the construction site are being managed in
accordance with the recommended procedures.
Handling and disposal of waste generated from the project is not
expected to give rise to any significant dust and noise impact in the presence
of appropriate control/ mitigation measures.
12.6
Land Contamination Prevention
12.6.1 Potential
sources of land contamination during the operation of the bus depot were
identified to be associated with diesel fuel storage and refueling, as well as
storage and use of chemicals.
Appropriate land contamination preventive measures have been identified
and recommended for implementation.
12.7
Hazard Impact
12.7.1
An “Other Specified Uses” (“OU”) site located on the northern side
of the development is zoned for the development of a petrol filling cum
liquefied petroleum gas (LPG) filling station, as shown in the latest Draft
Outline Zoning Plan (Plan No. S/H20/11).
12.7.2
Electrical and Mechanical Services Department (EMSD) requires a
minimum separation distance of 15m between LPG filling station and industrial/
commercial buildings to minimise potential hazard associated with operation of
LPG filling station. Planning
Department (PlanD) has advised that in identifying a suitable site for the LPG/
Petrol filling station, the requirement of providing a separation distance of
15m between the LPG filling station and the proposed bus depot has been
observed.
12.7.3
Given the close proximity of the proposed bus depot to the
future LPG/ Petrol filling station, as a prudent approach, a Quantitative Risk
Assessment (QRA) has been conducted to ascertain if the risk posed by the LPG
filling station on the bus depot is within acceptable level. Precautionary measure in terms of adopting a
blank façade for the northern side of the bus depot building has been
incorporated into the design of the bus depot.
12.7.4
The QRA study assessed and quantified the risk associated with
the operation of the LPG/ petrol filling station in form of Societal Risk and
Individual Risk for comparison with the risk guidelines. The calculated societal risk level is within
the acceptable region as specified in the Risk Guidelines for PHI and the
Potential Loss of Life (PLL) is 2.5 x 10⁻⁵ per year. On the other hand the individual risk level
also falls within the acceptable limit of 1 in 100,000 per year.
12.7.5
The findings of the study confirm that with the provision of
standard risk control measures incorporated into the design of the LPG/ Petrol
filling station, and the precautionary measure of providing a solid concrete
wall for the entire northern façade of the bus depot building, the project will
not be subject to unacceptable risk from the operation of the LPG/ Petrol
filling station and the overall societal risk impact will be within acceptable
level.
12.8 Landscape and visual impacts
12.8.1
A baseline study has been carried out and identify that the
only landscape resource is the existing vegetation scattered throughout the
study area. As such, a comprehensive
tree survey has been carried out to identify the baseline conditions of the
existing landscape resources. The trees
are mainly common species with trunk diameter varies from 0.1m to 0.4m. The bus depot building has to cover the
entire site due to the need to accommodate the following provisions onsite –
driveway and ramp system, maintenance spaces, parking spaces and other
supporting facilities. A total 88
number of trees will be required to be removed from the site during the site
clearance period.
12.8.2
In order to mitigate the landscape impact, it is suggested to
transplant 13 numbers of good quality trees to Chai Wan Park, Cape Collinson
Chinese Permanent Cemetery, Yee Shing Lane Sitting Out Area or the proposed
town park at Aldrich Bay.
12.8.3
In addition, a planting proposal is developed according to the
proposed building layout with the intention to introduce greenery where
possible to mitigate the landscape impact and further enhance the quality of
the environment.
12.8.4
As the quality of streetscape is important to mitigate the
landscape impact, it is further recommended that a row of heavy standard
Delonix regia should be planted along the proposed footpath along Road 20/4 and
Shing Tai Road where practicable. As
these footpaths are outside the site boundary, approval should be obtained from
Highway’s Department.
12.8.5
To avoid potential visual impact associated with the bus depot
building design, strategies including the use of recessed grove lines to divide
wall into panels to reduce its massive scale, and use of colours to further
breakdown the scale by means of spray-painting on plaster. Metal cladding and tiling will also be used
for the main elevations facing Road 20/4 and Shing Tai Road to add richness in
texture and colour. It is expected that
these measures will ensure visual compatibility with its environmental context.
12.9
Wastewater Treatment and
Disposal Facilities
12.9.1
Wastewater effluent generated from the construction work stage
shall be managed in accordance with the requirements under ProPECC Note PN1/94
such that an unacceptable water quality impact would not be resulted. No effluent shall be allowed to be
discharged into the Cargo Handling Basin.
12.9.2
During the operational phase, wastewater effluent generated
from designated bus washing areas may contain petrol and should be diverted to
petrol interceptors before being discharged into government foul sewers. Sewage arising from the site such as kitchen
area should also be diverted to grease traps before disposal to foul sewer. The design of the petrol interceptors and
grease traps to be installed shall enable the treated effluent to meet the
limits stipulated in the Technical Memorandum on “Standards for Effluent
Discharged into Drainage and Sewerage Systems, Inland and Coastal Waters”.
12.9.3
Sufficient stormwater drainage facility should be provided for
the development. All rainwater
collected from the roof floor bus parking areas shall be diverted to petrol/oil
interceptor before disposal. The design
of the inceptors should allow stormwater bypass during peak flow periods.
12.10
Overall Conclusion
12.10.1 All key environmental issues
associated with the construction and operation of the project have been
identified and assessed in accordance with the requirements of the EIA study
brief. Mitigation, control or preventive
measures have been recommended if necessary.
With these measures, the construction and operation of the proposed bus
depot should unlikely cause any unacceptable impact from an environmental
perspective.
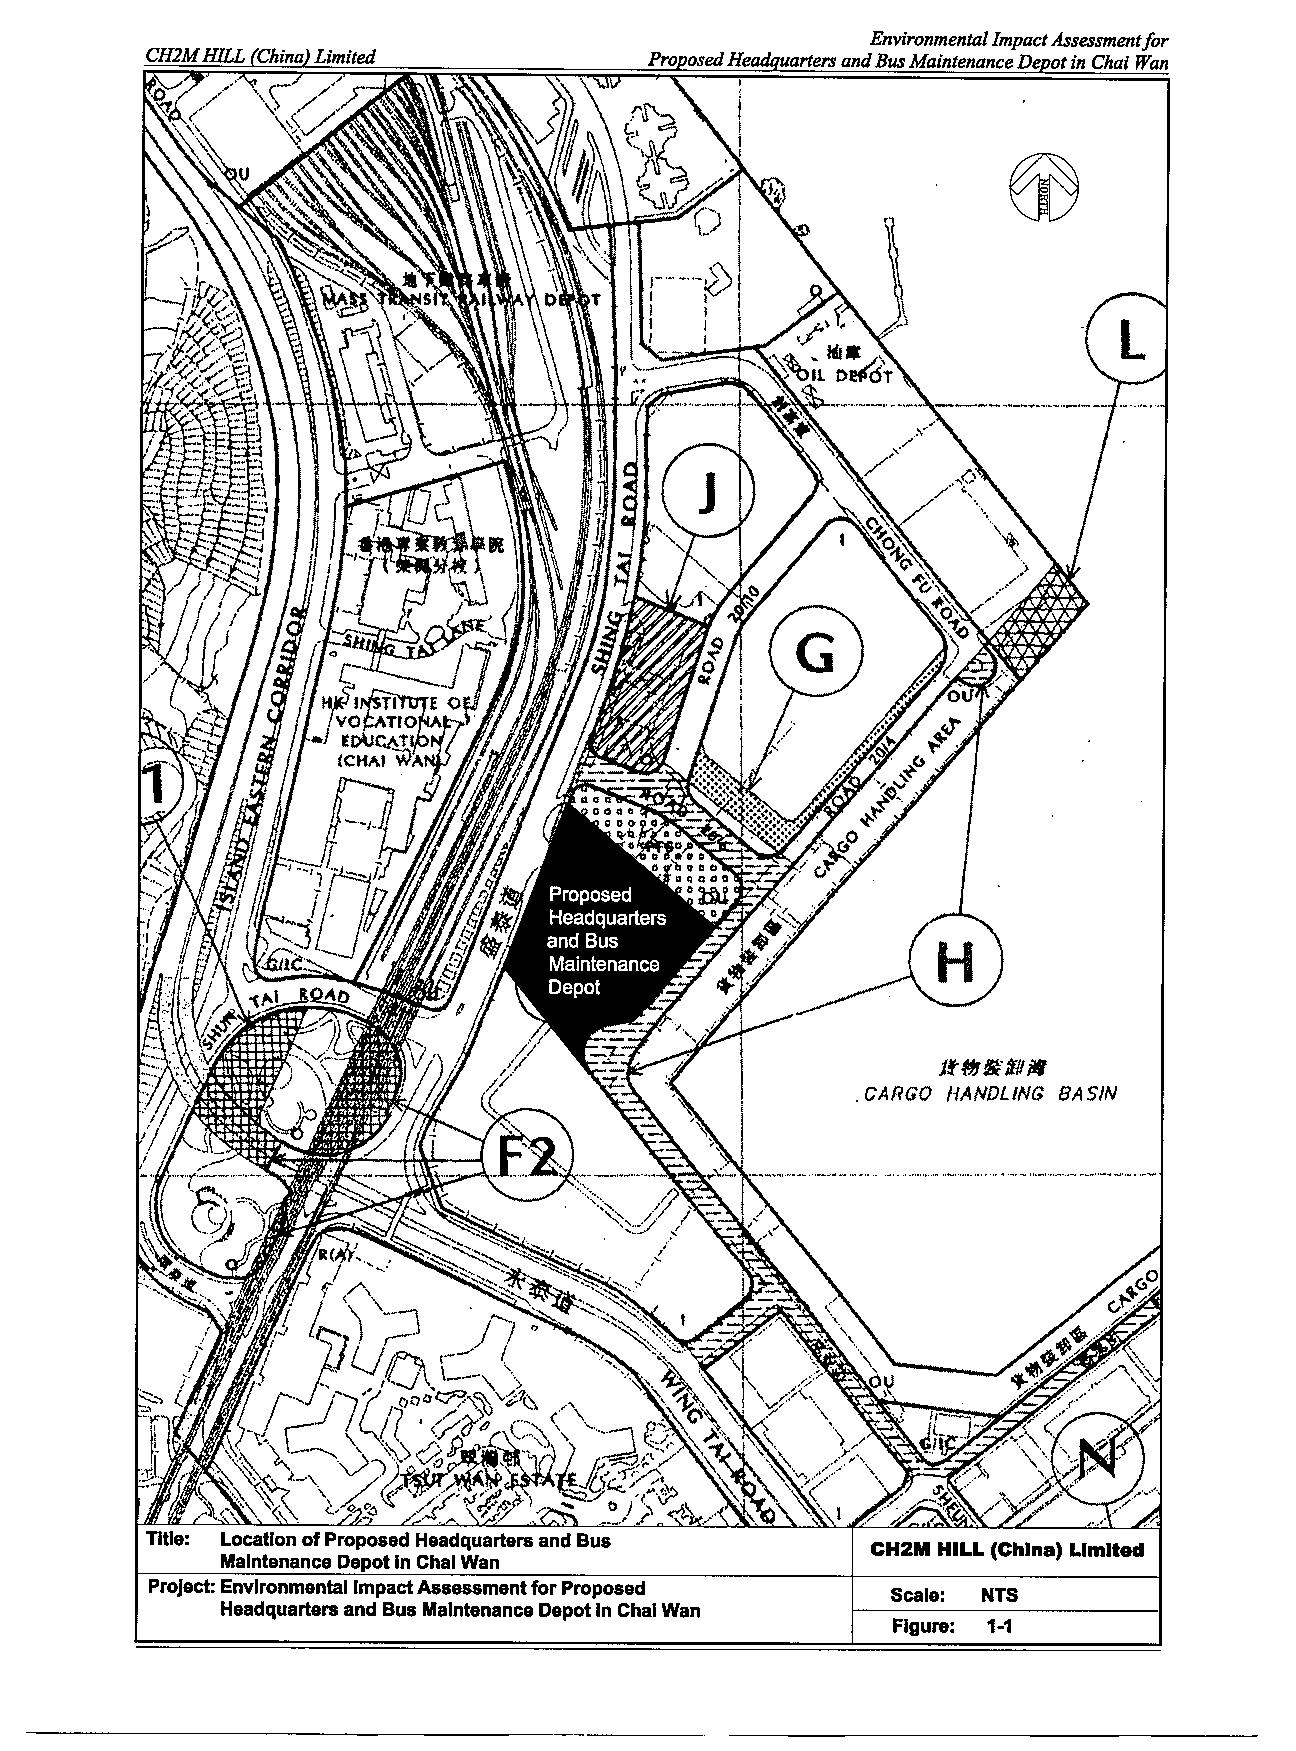
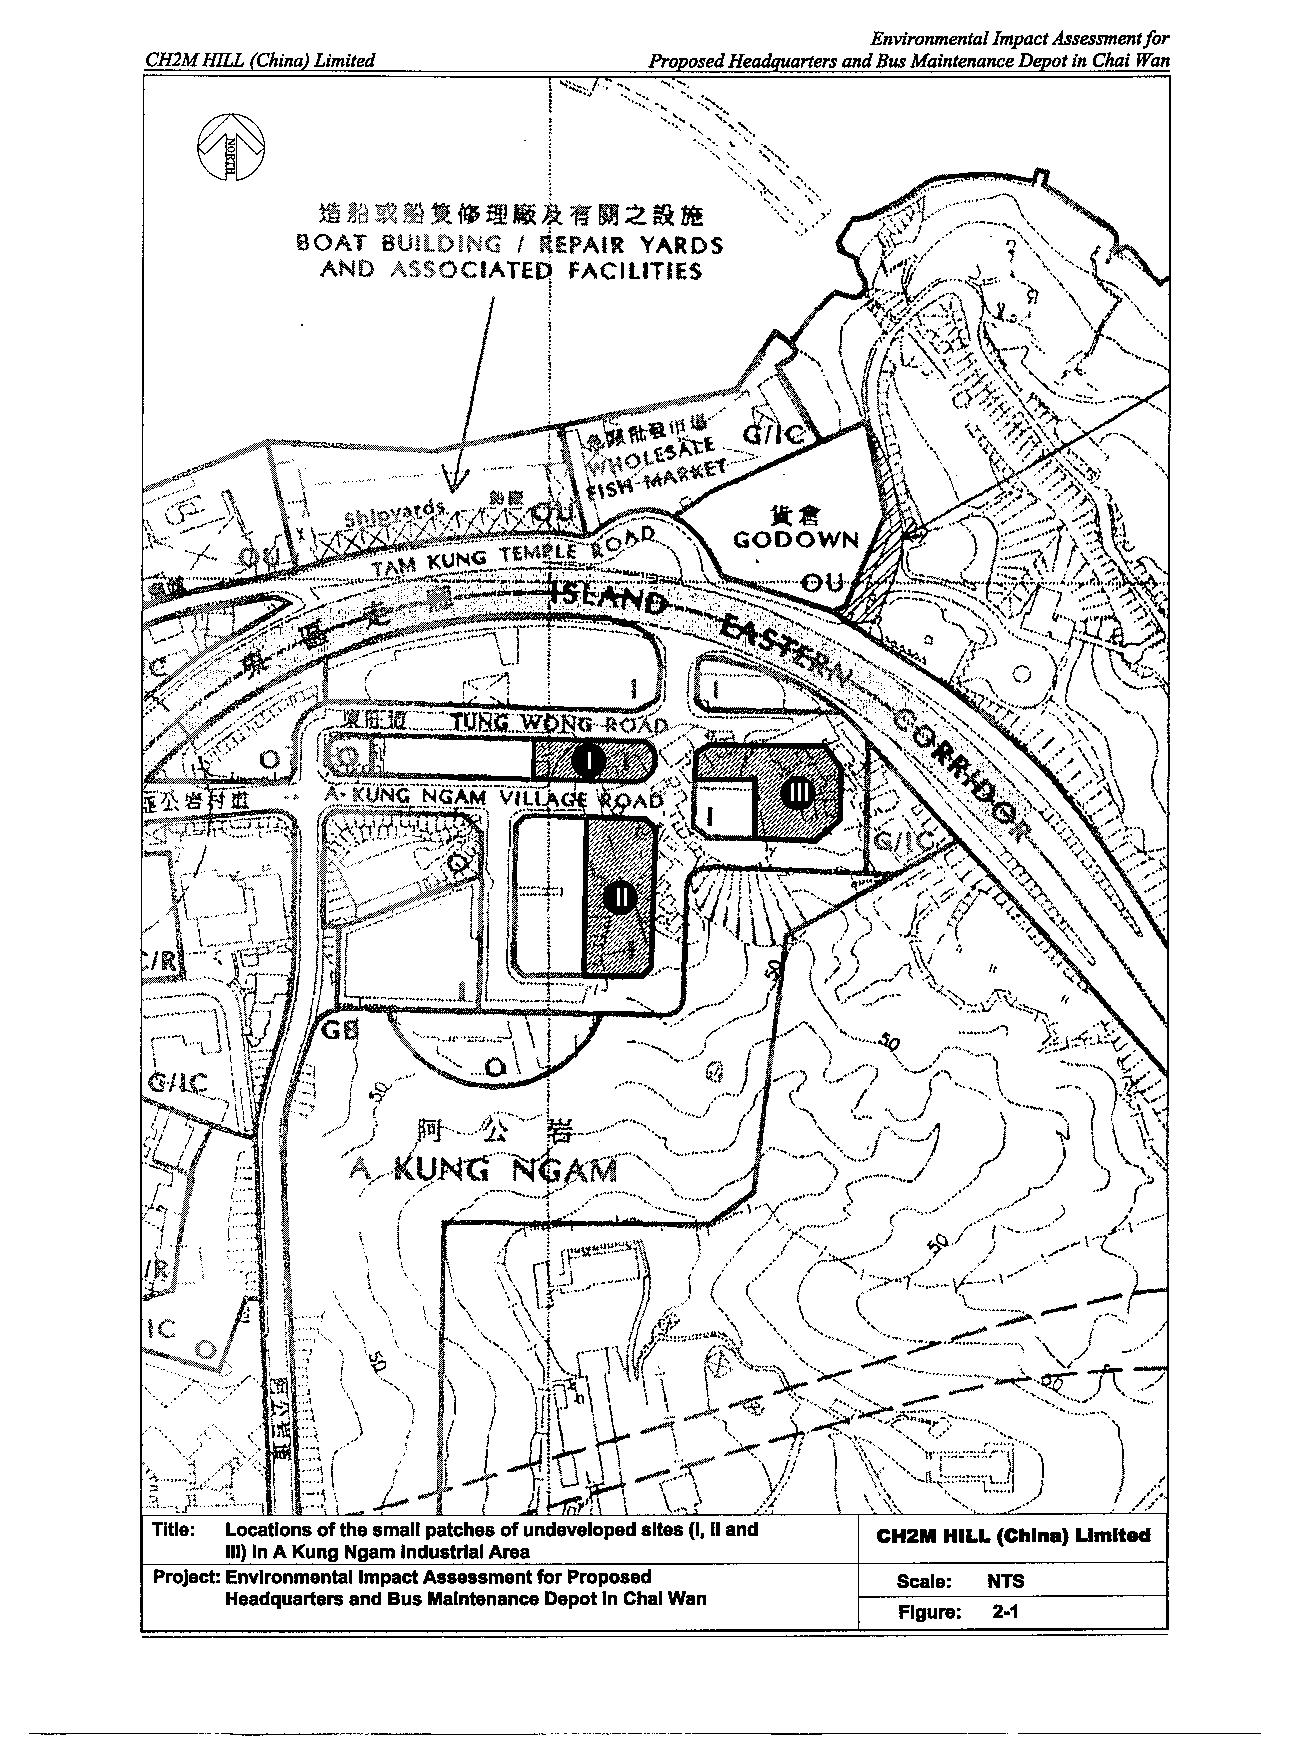
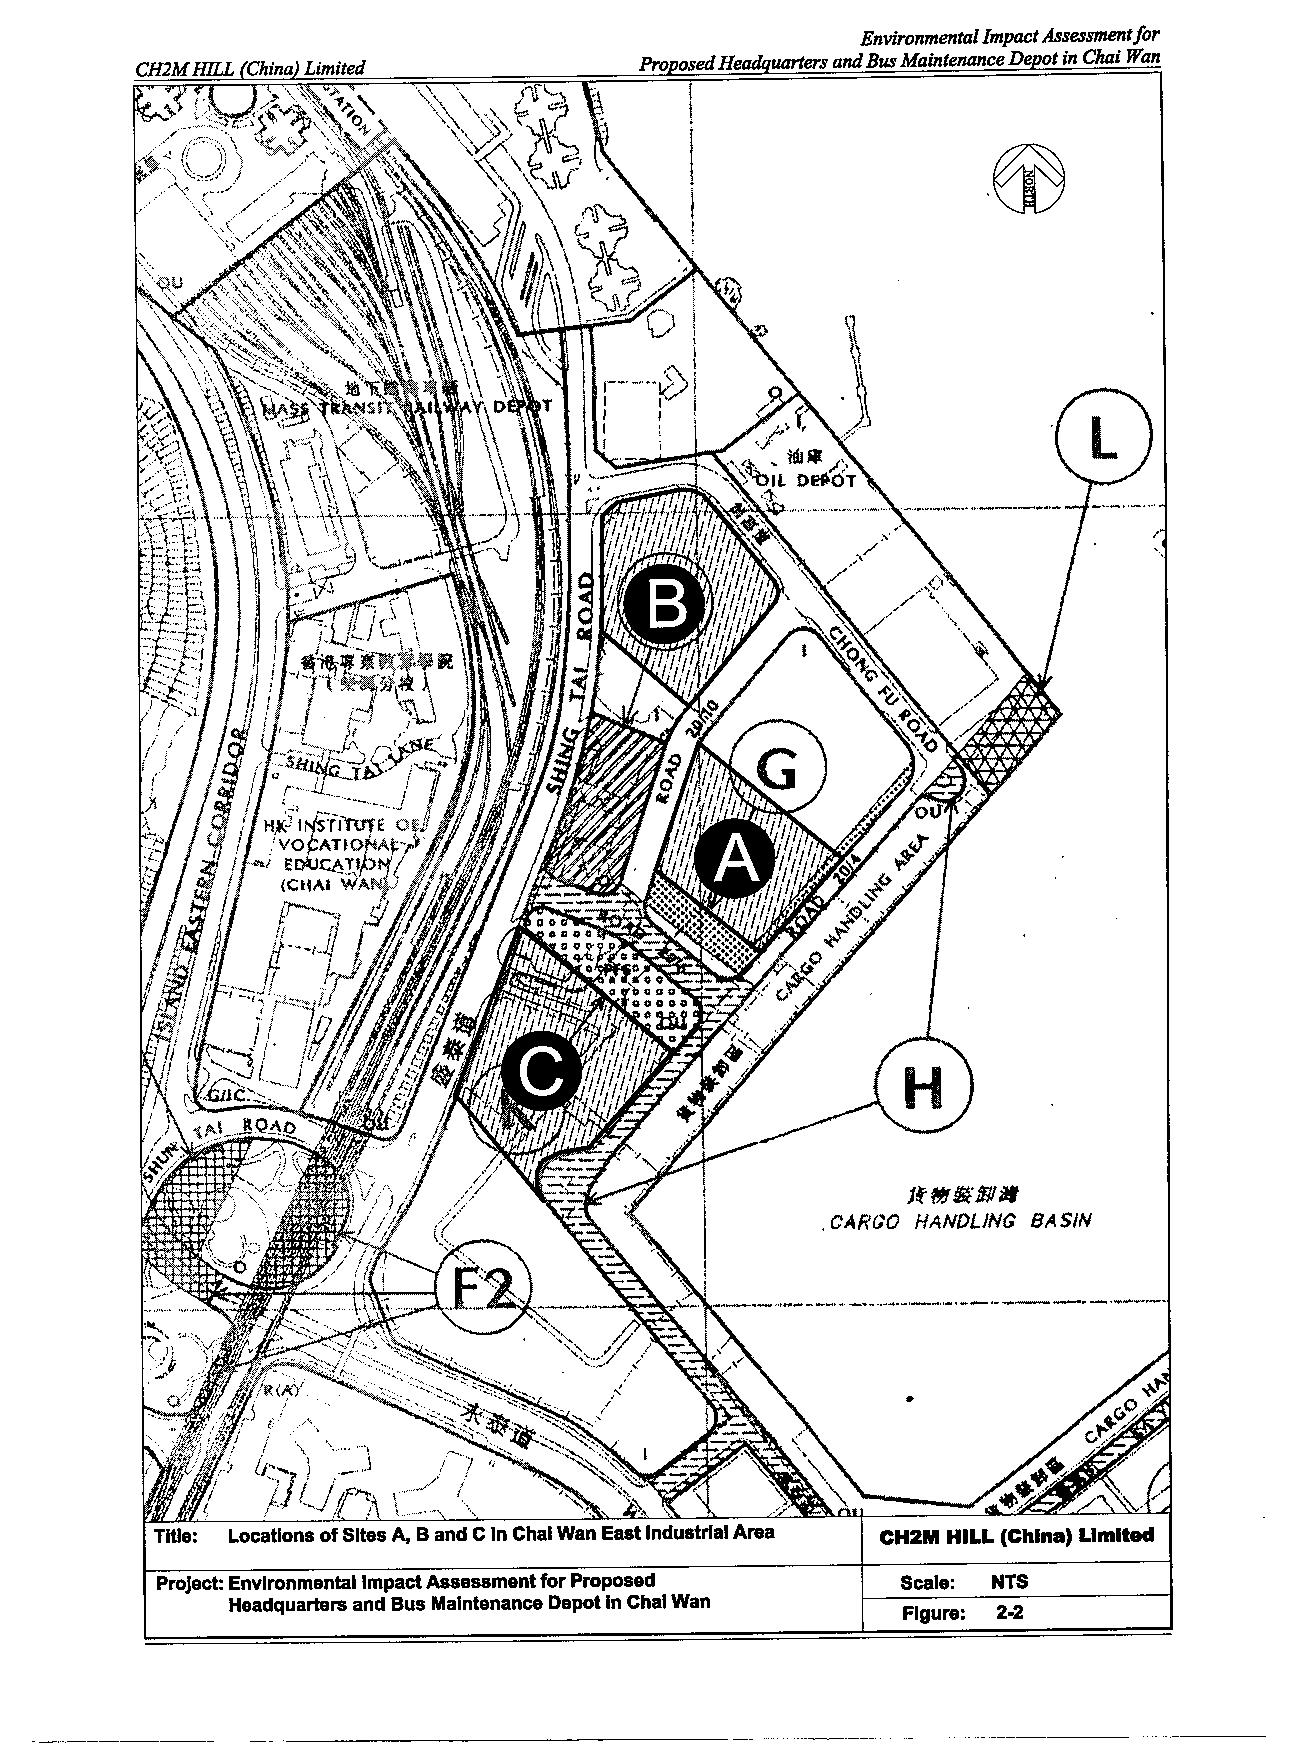
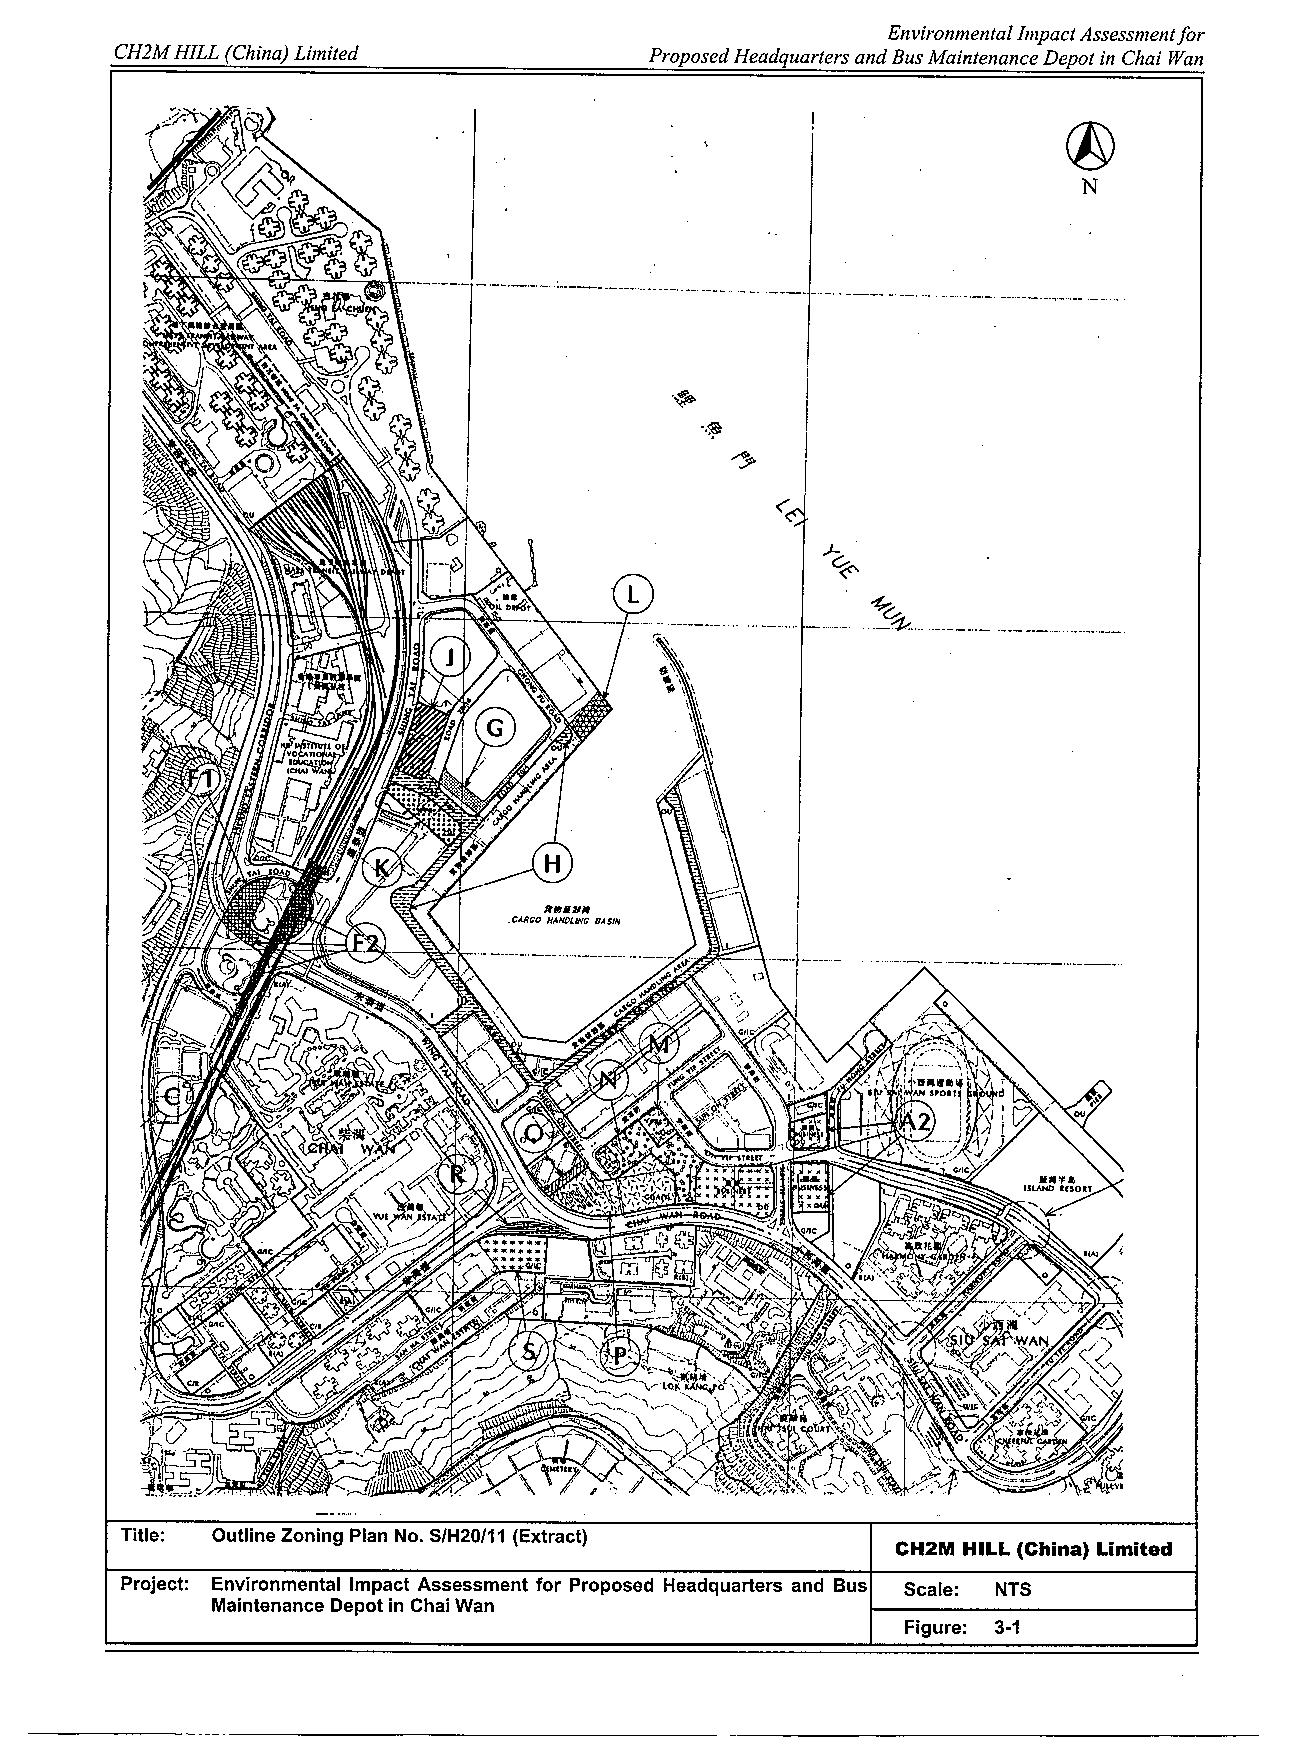
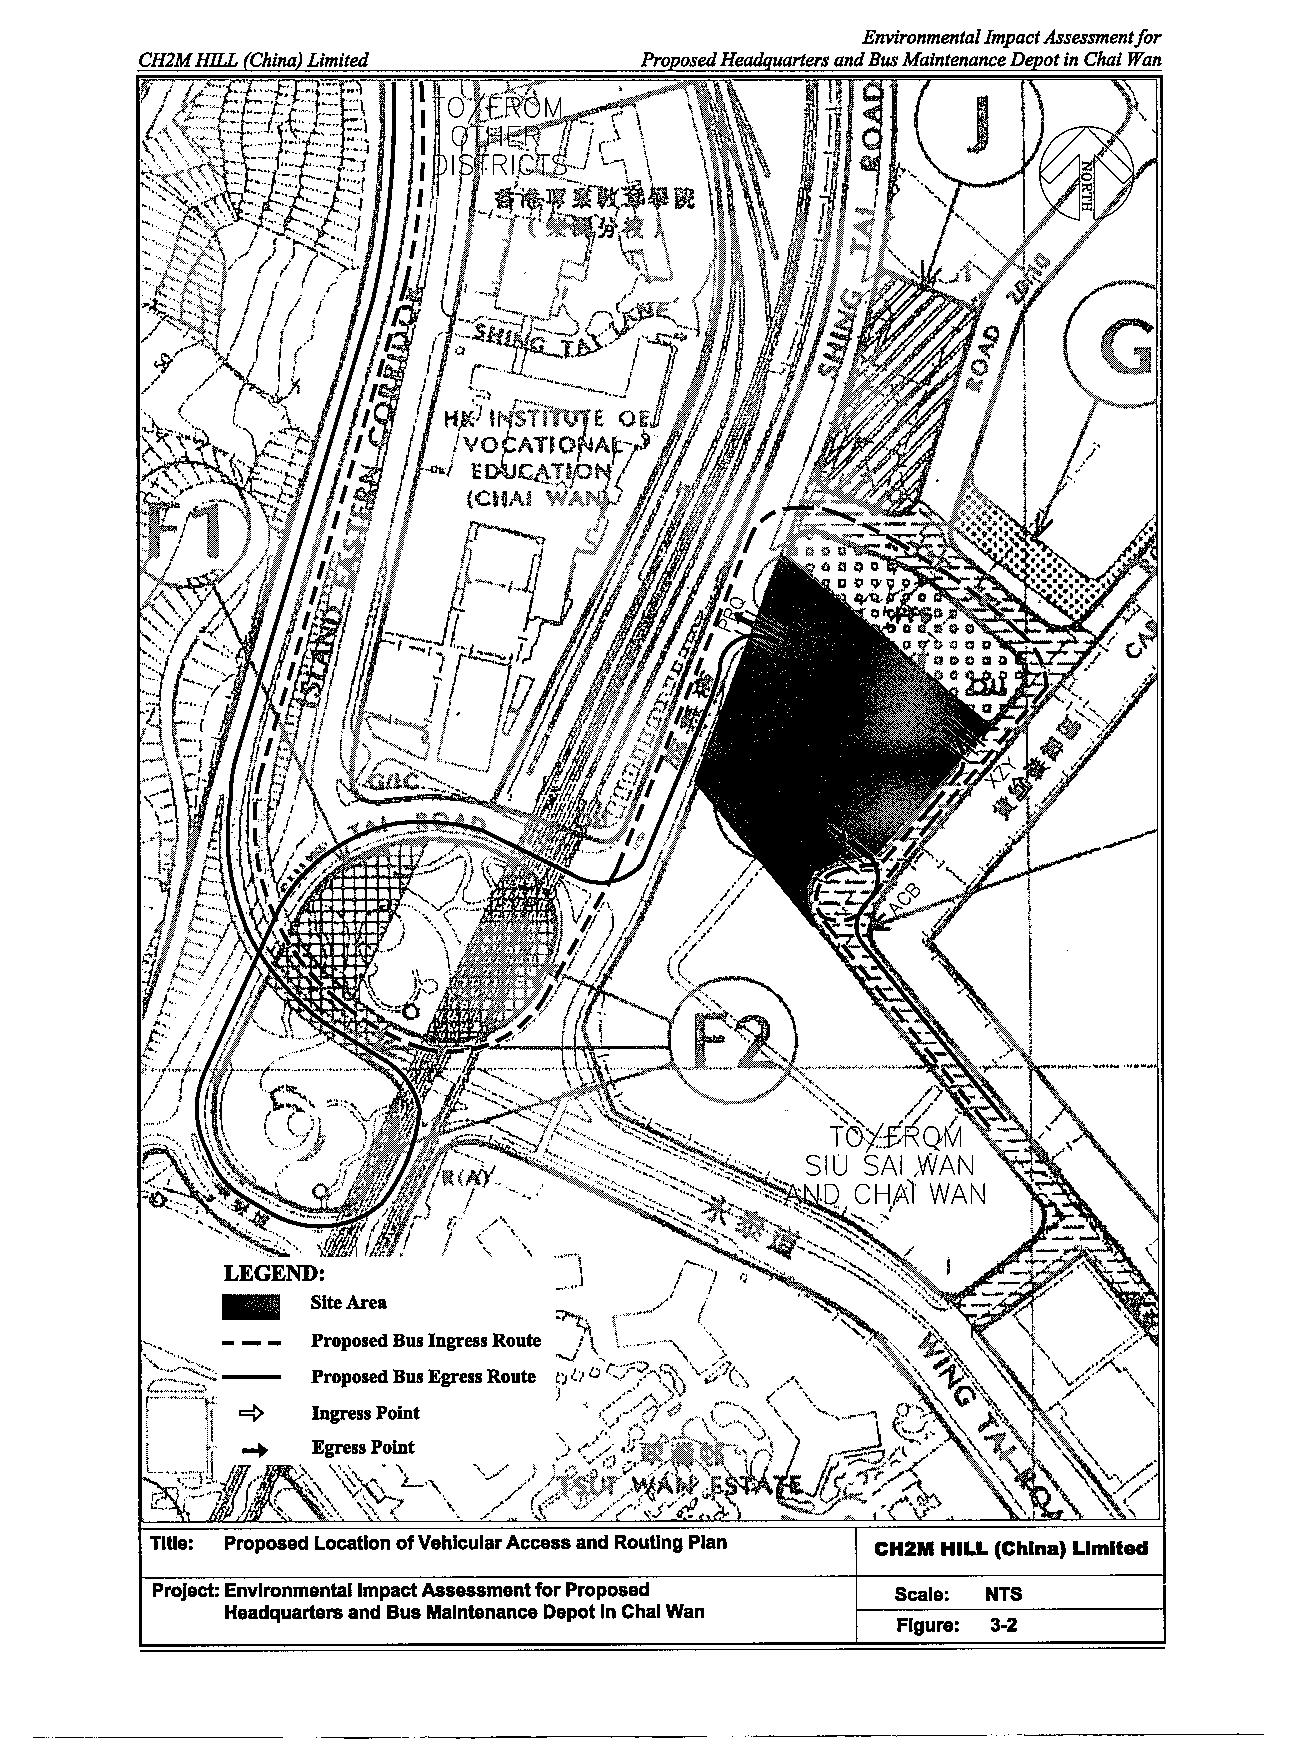
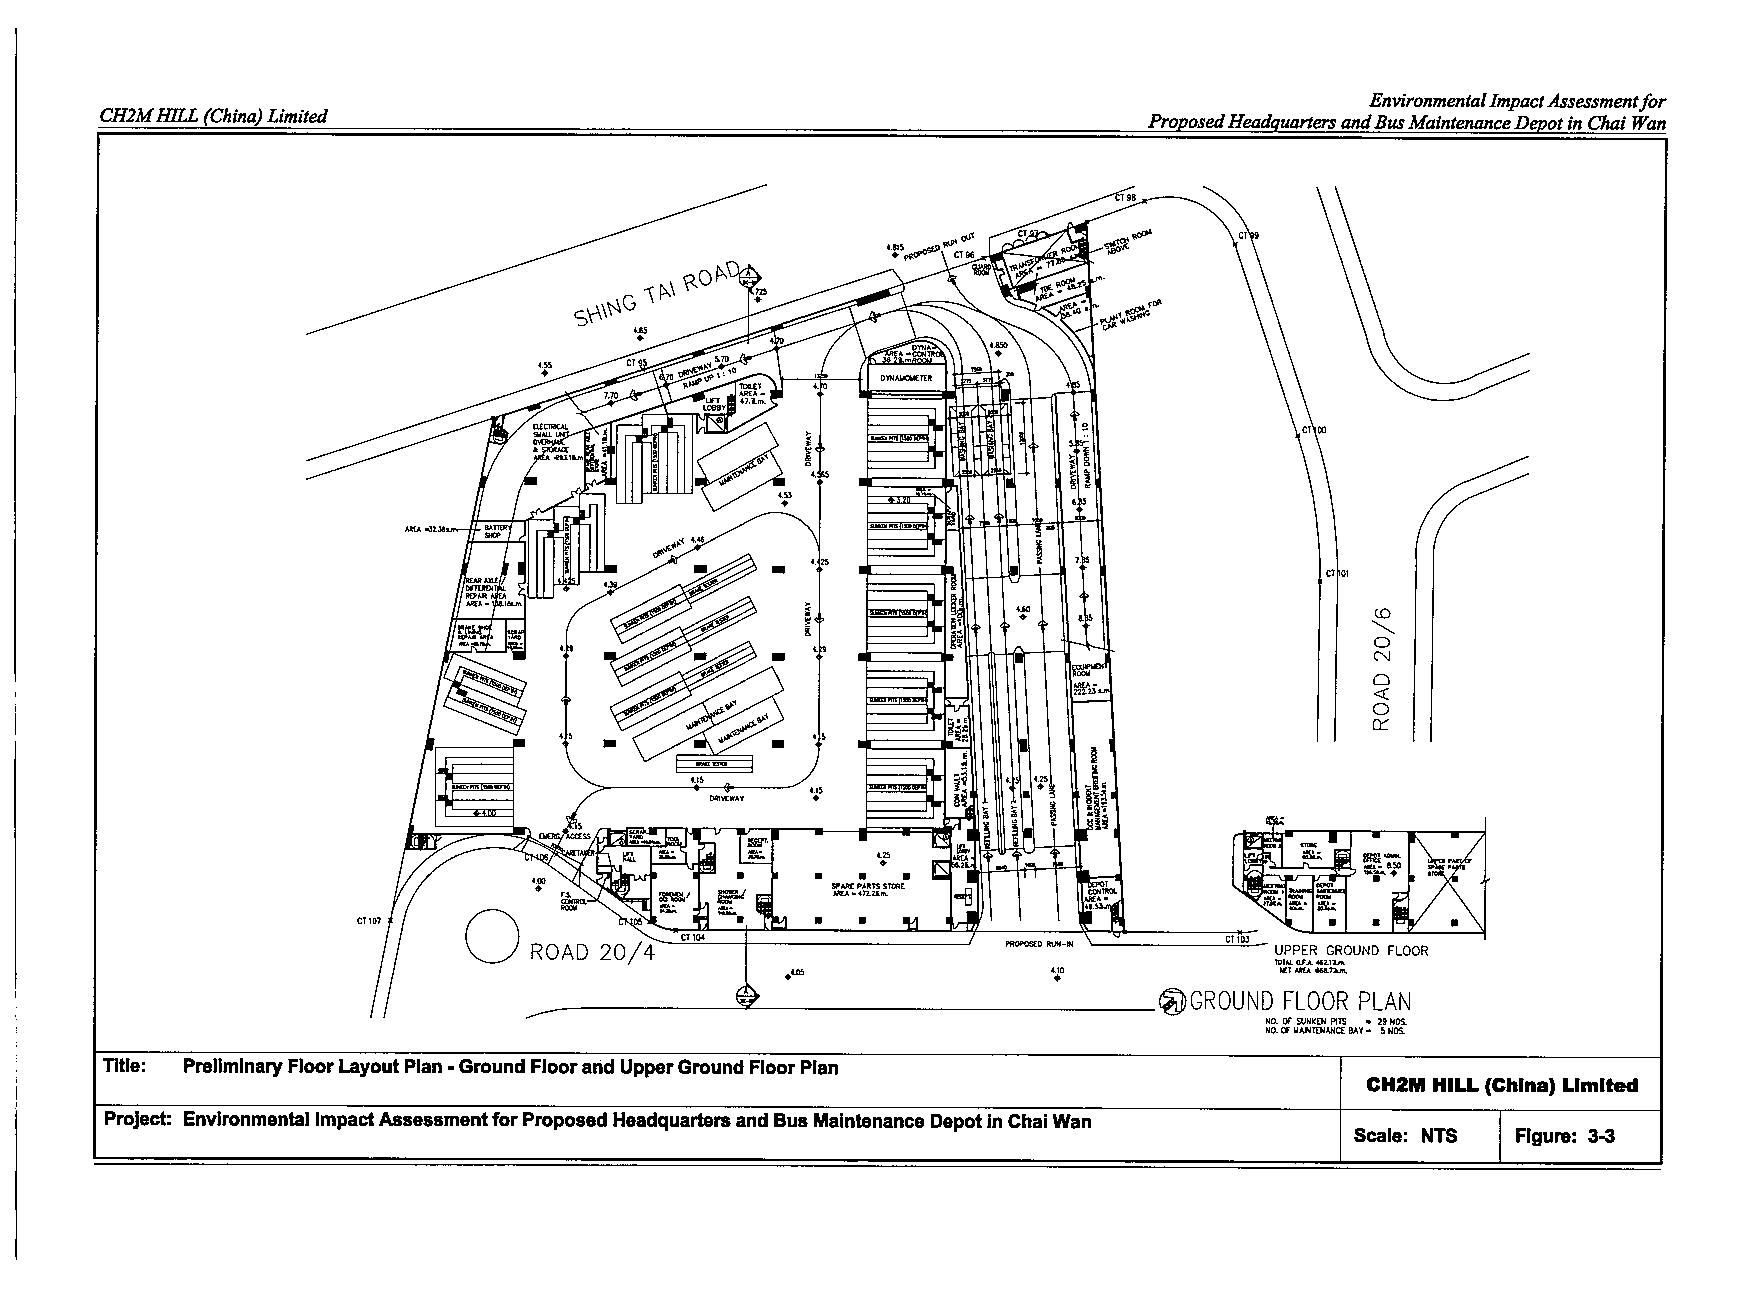
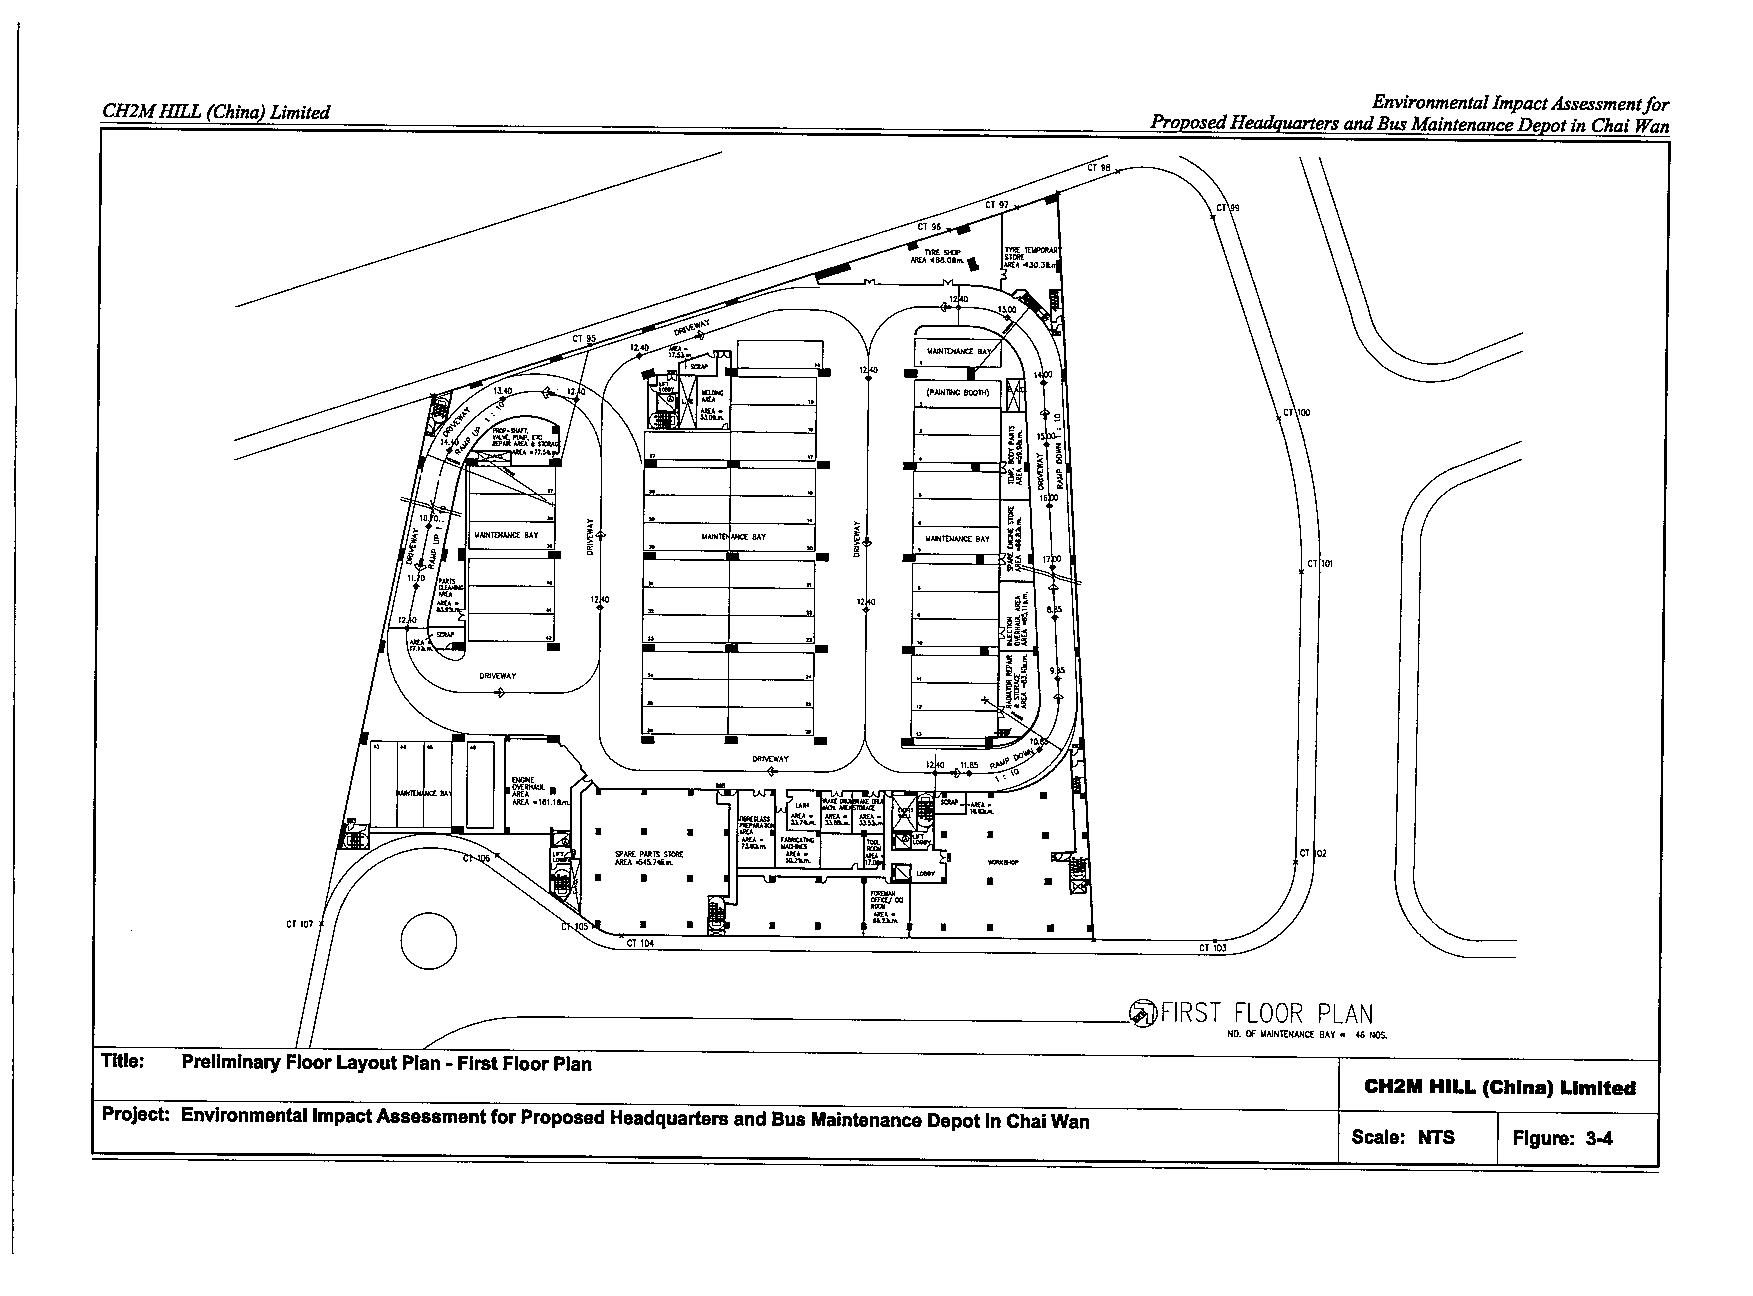
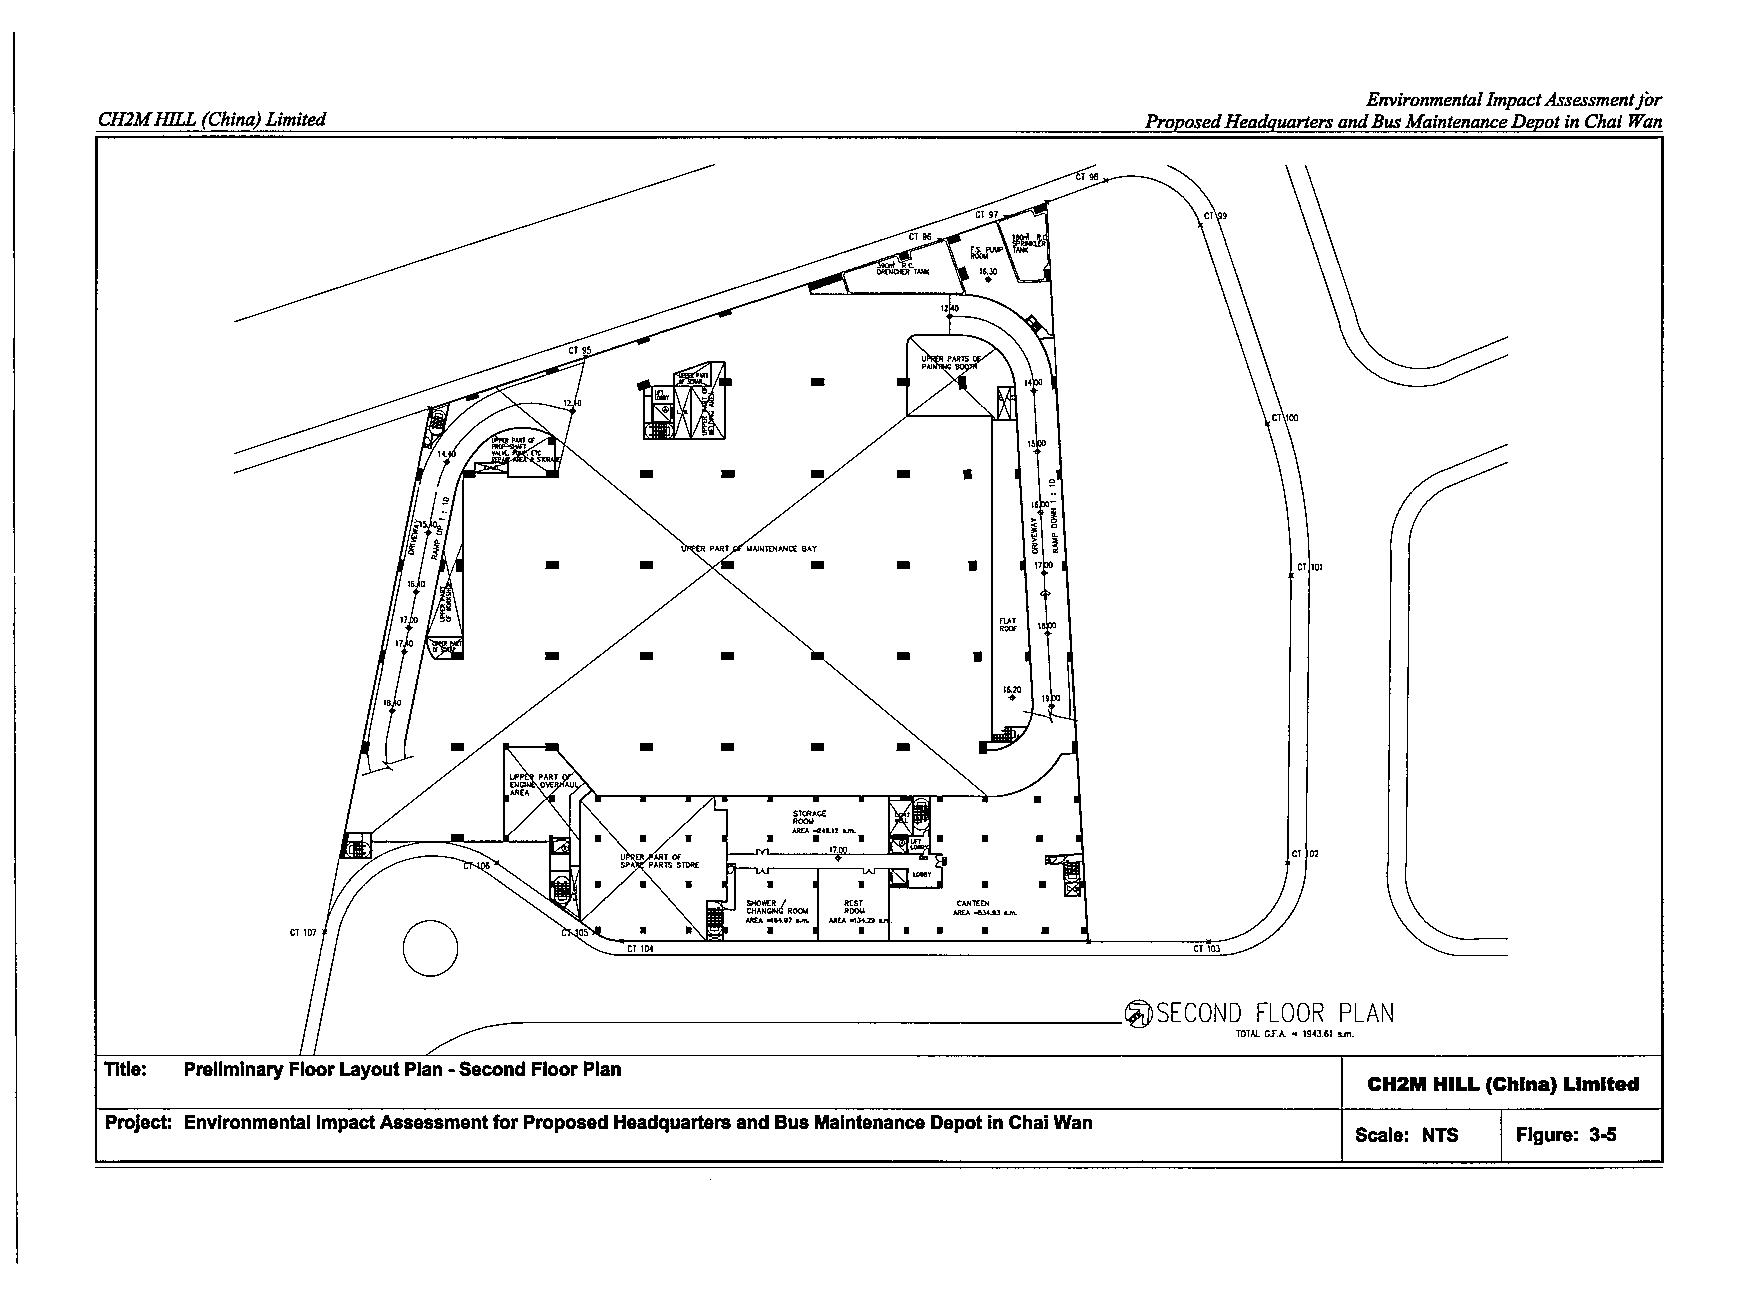
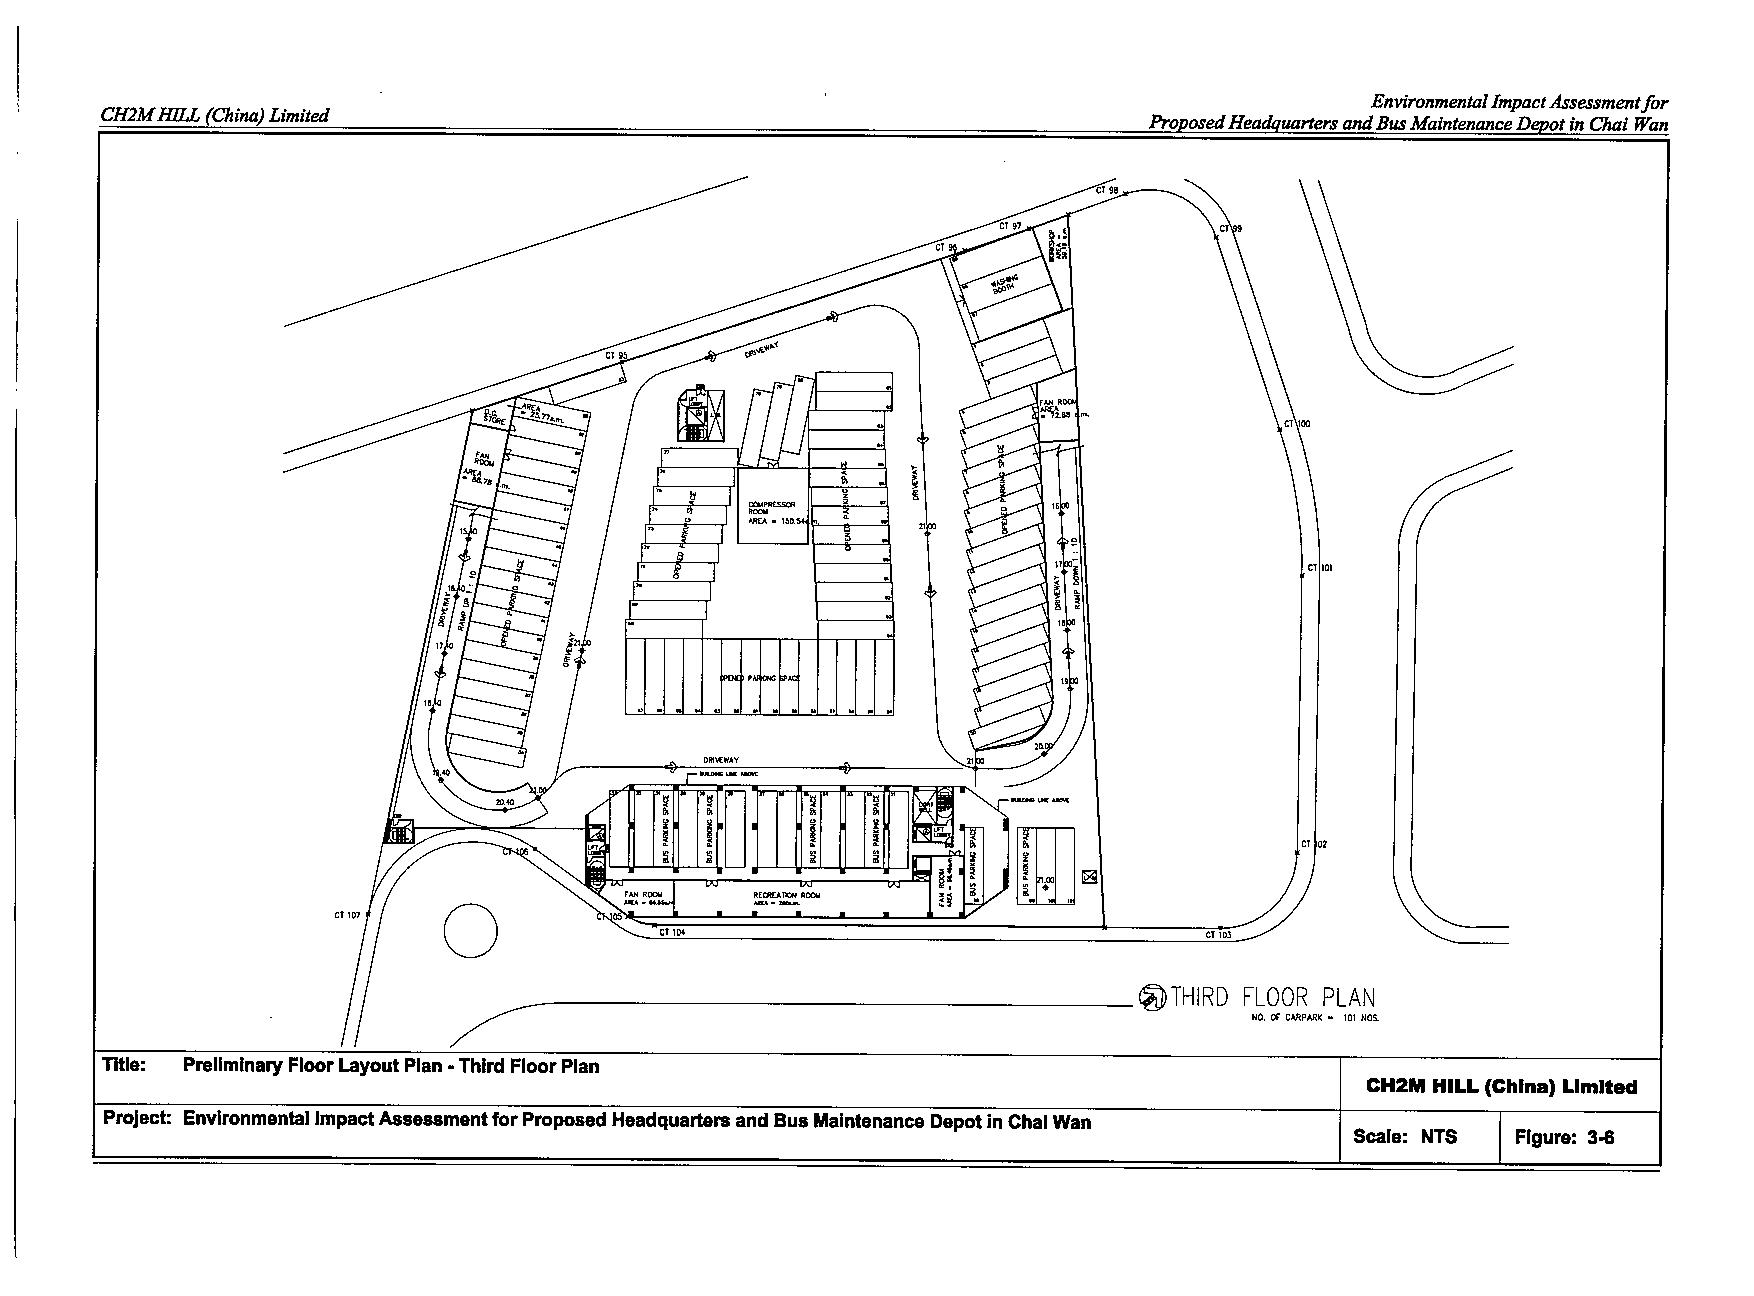
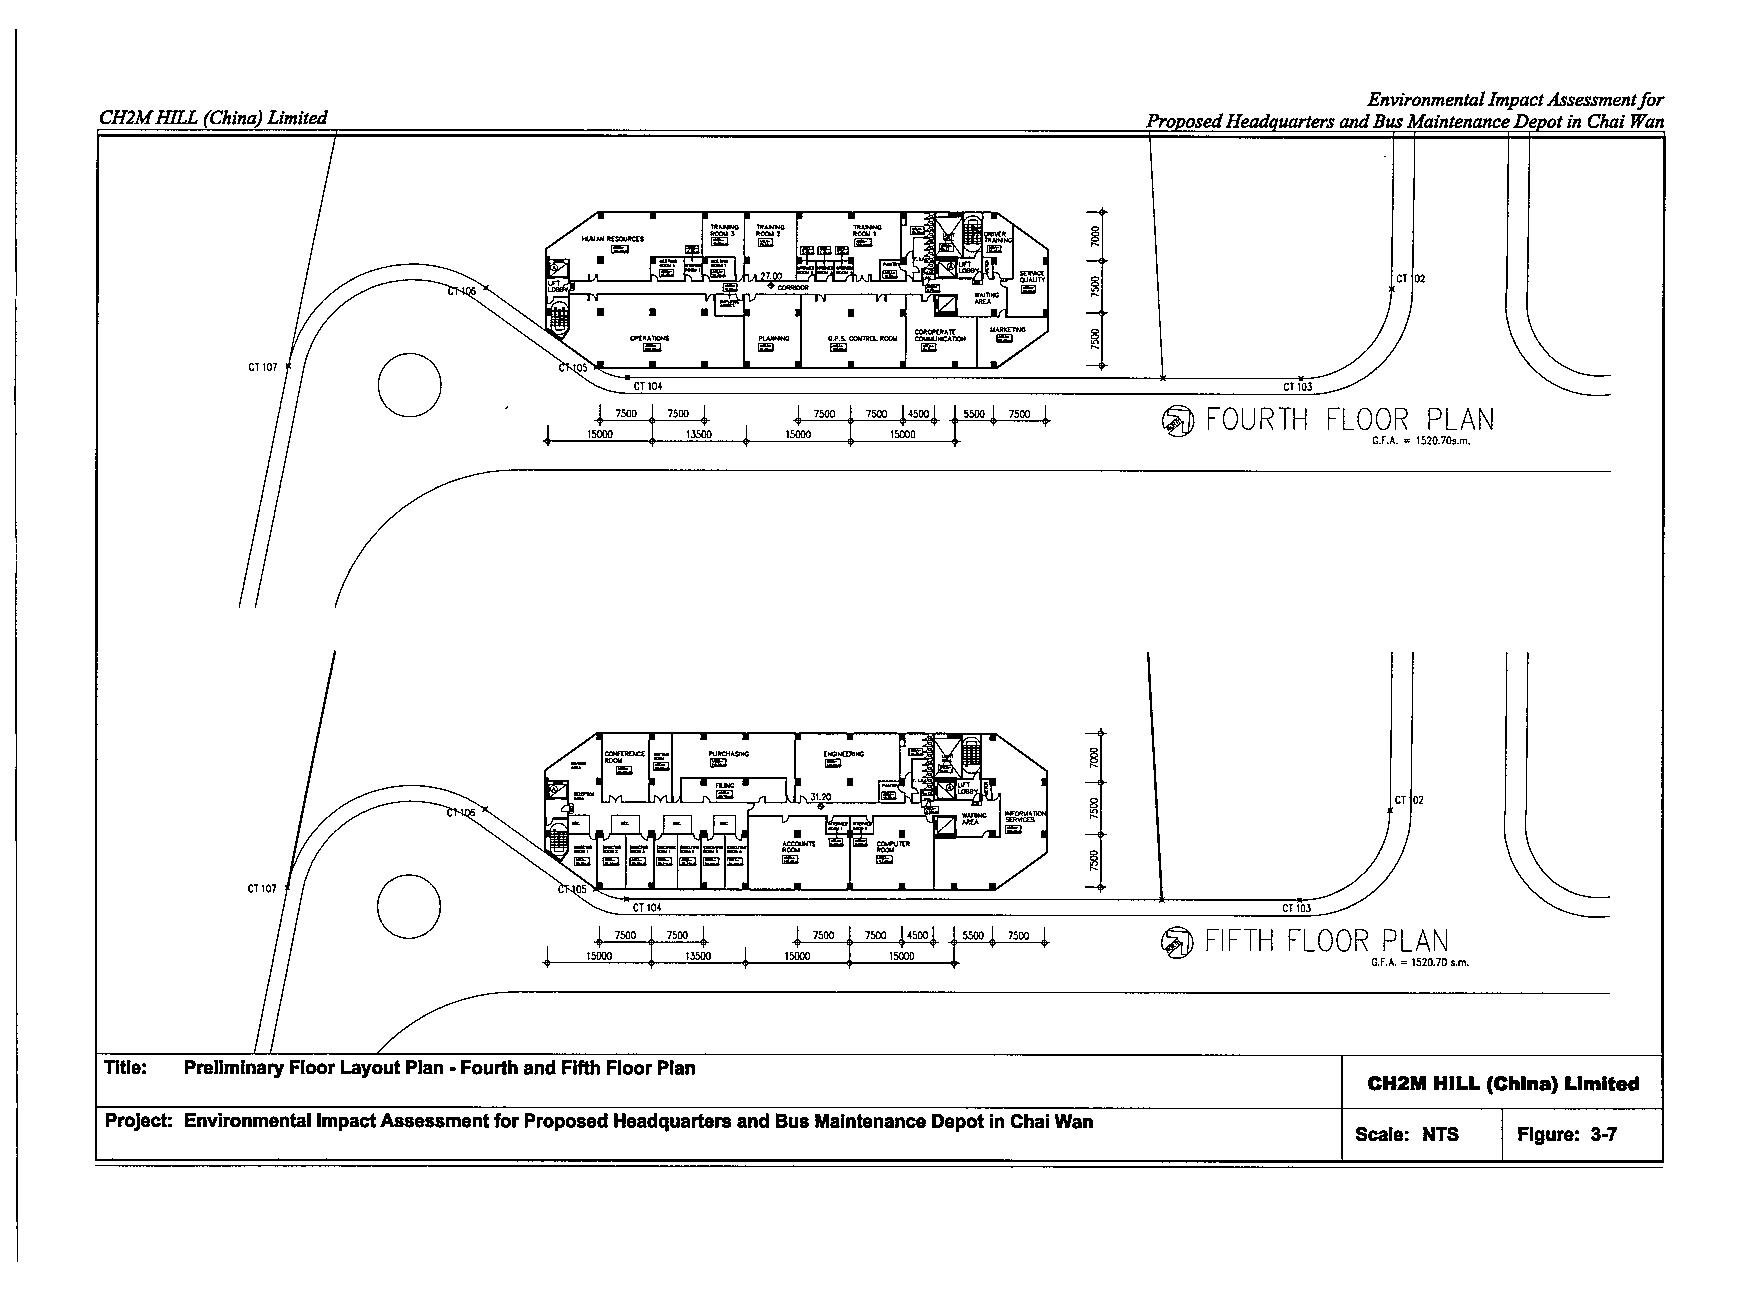
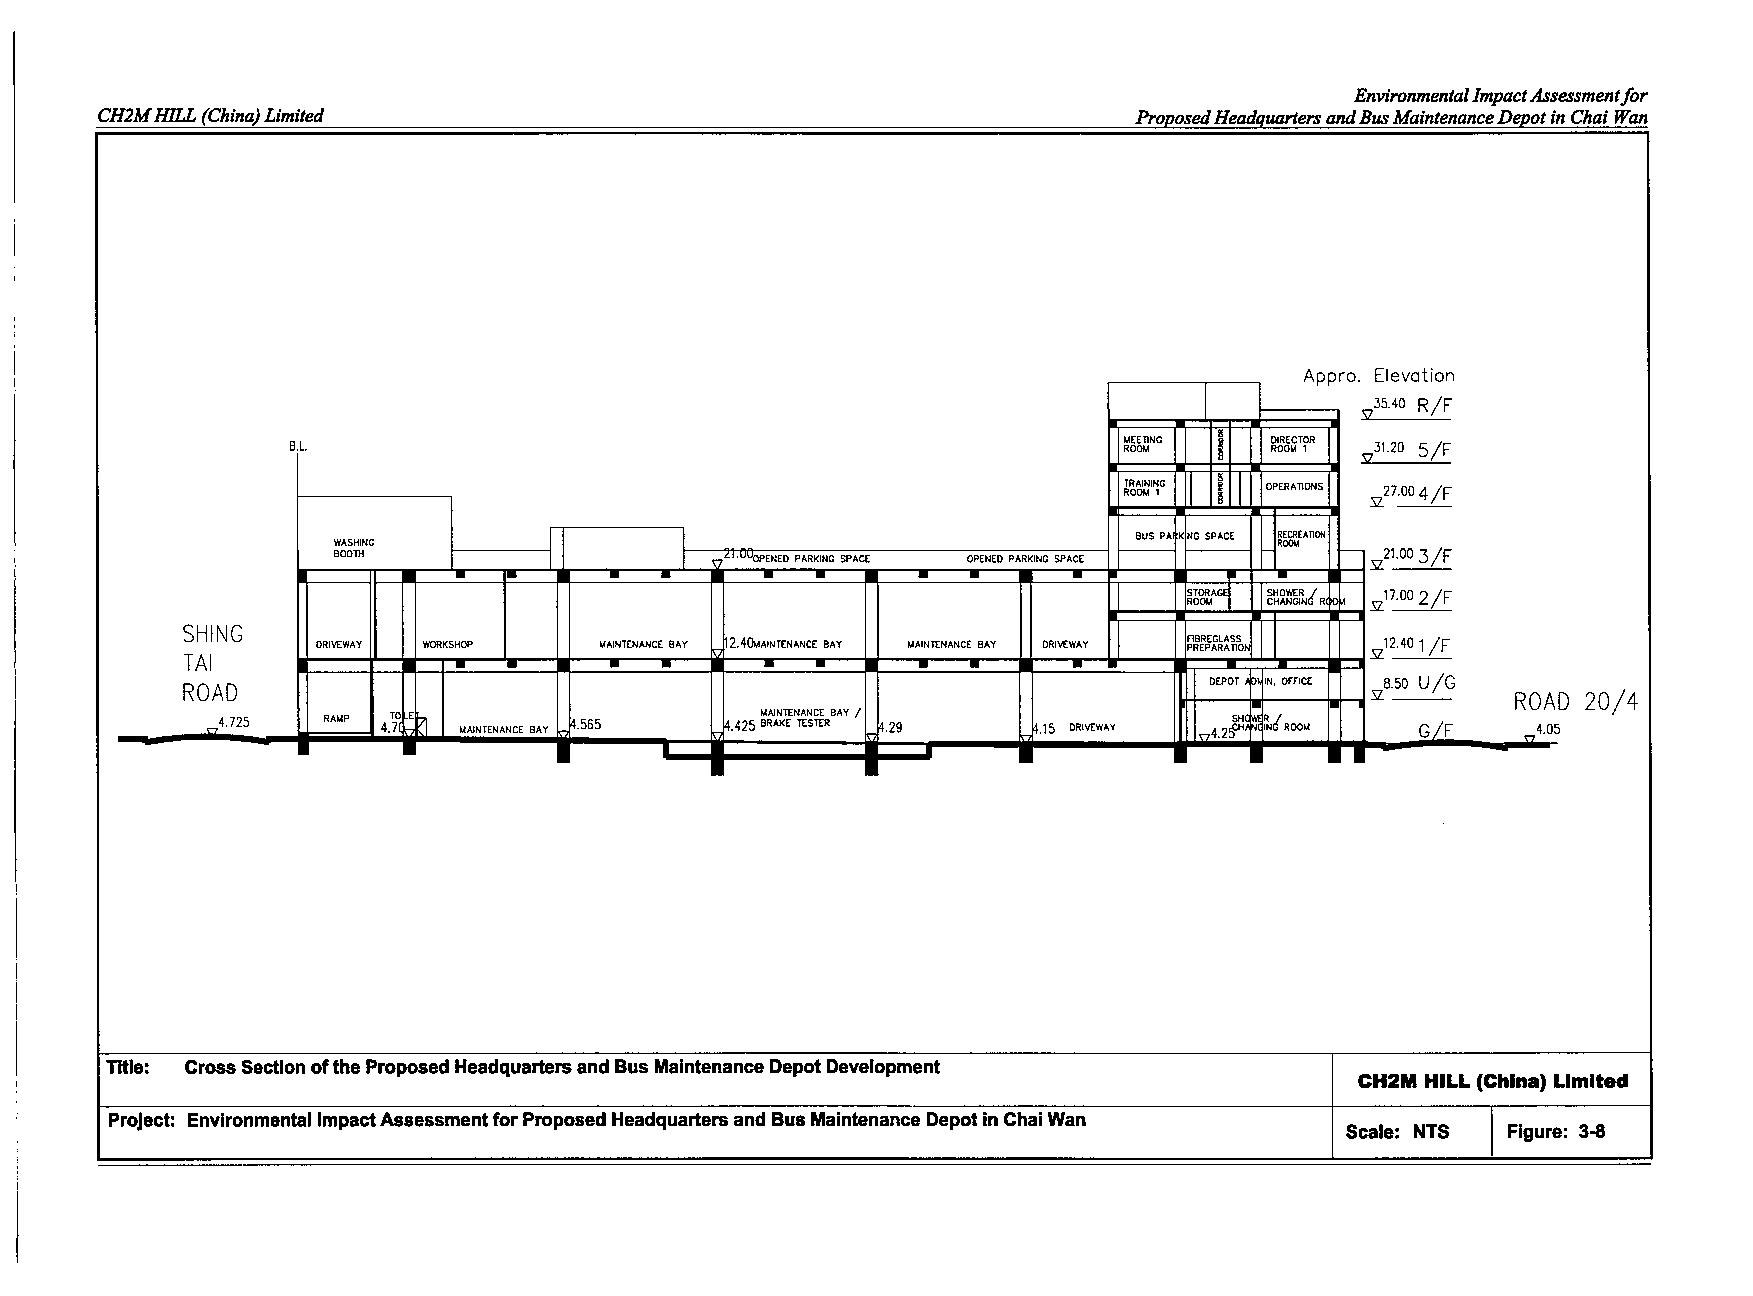
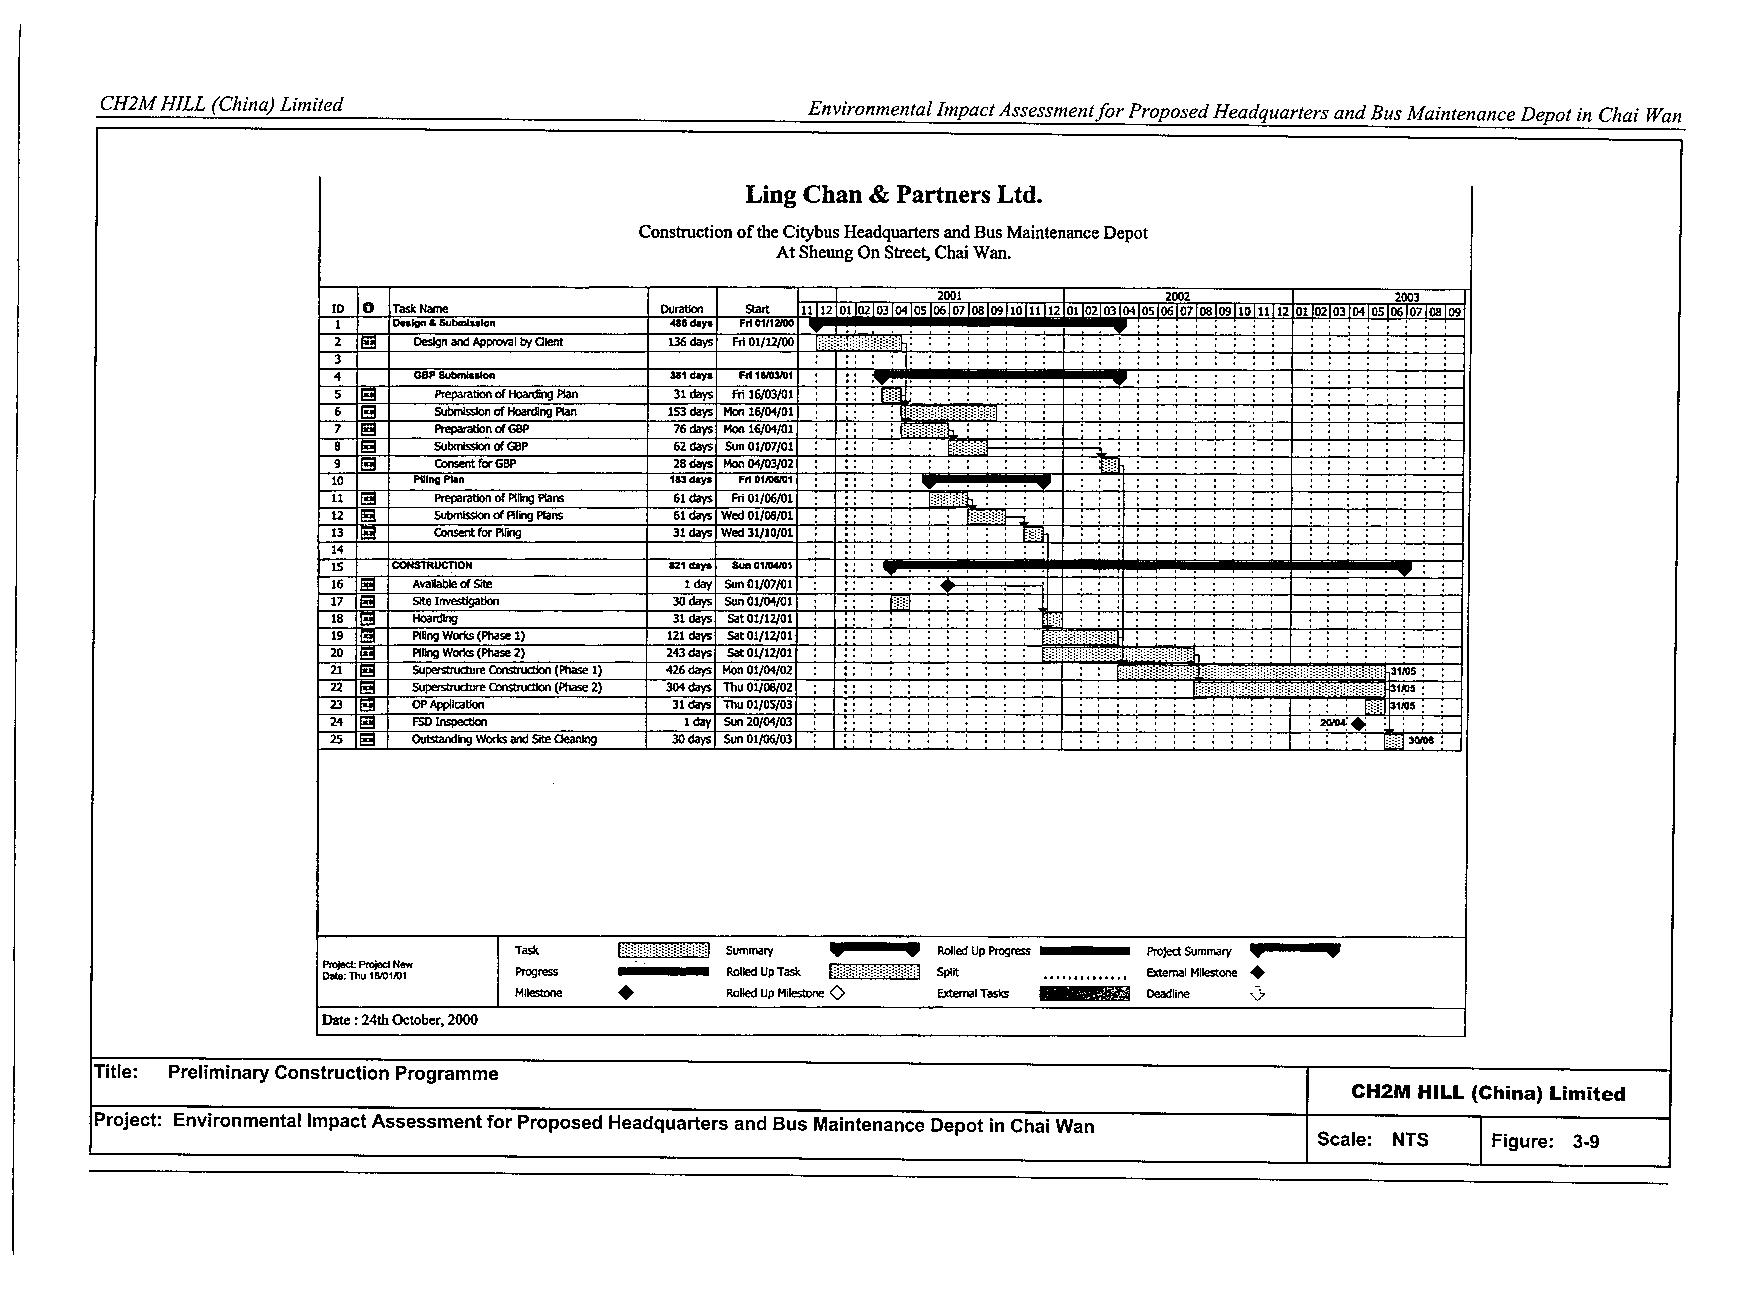
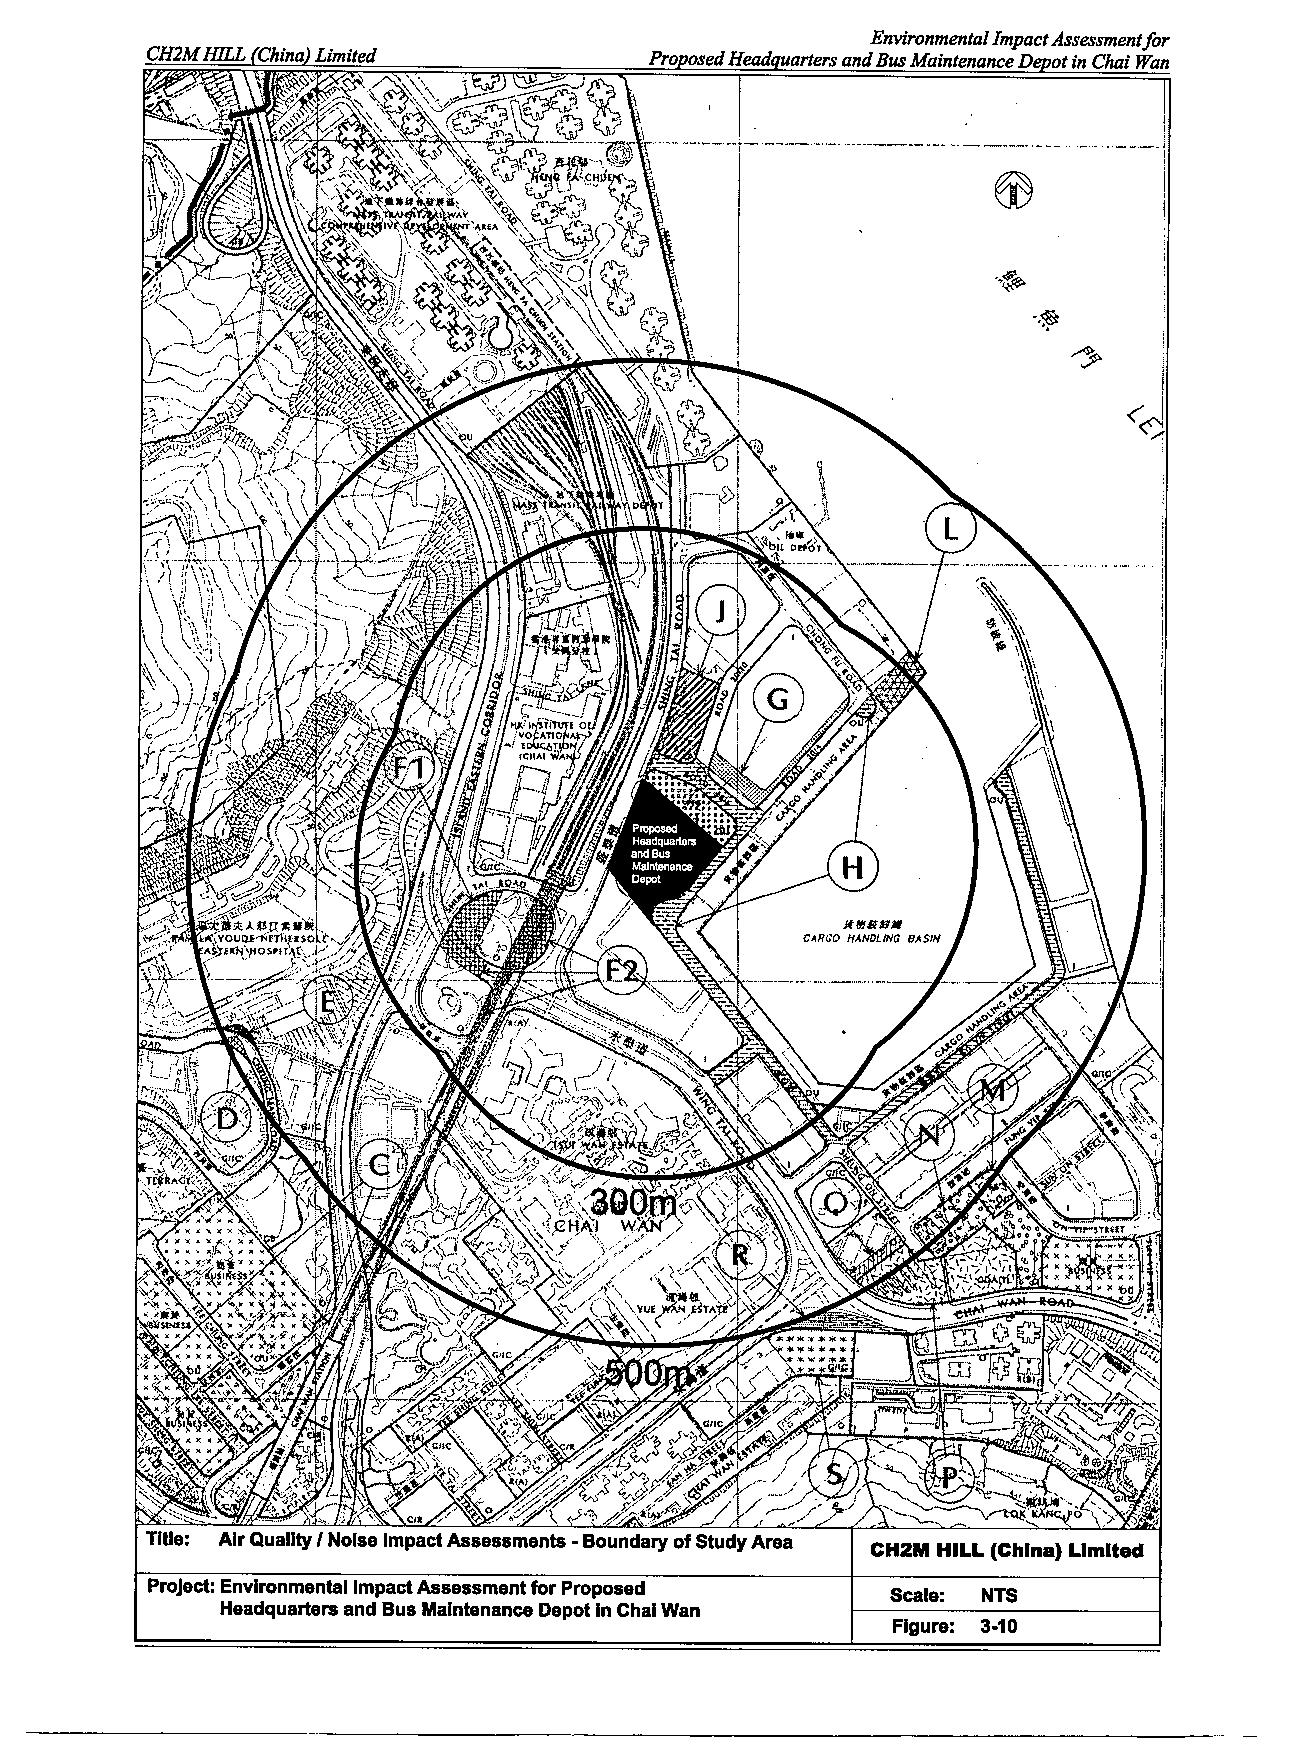
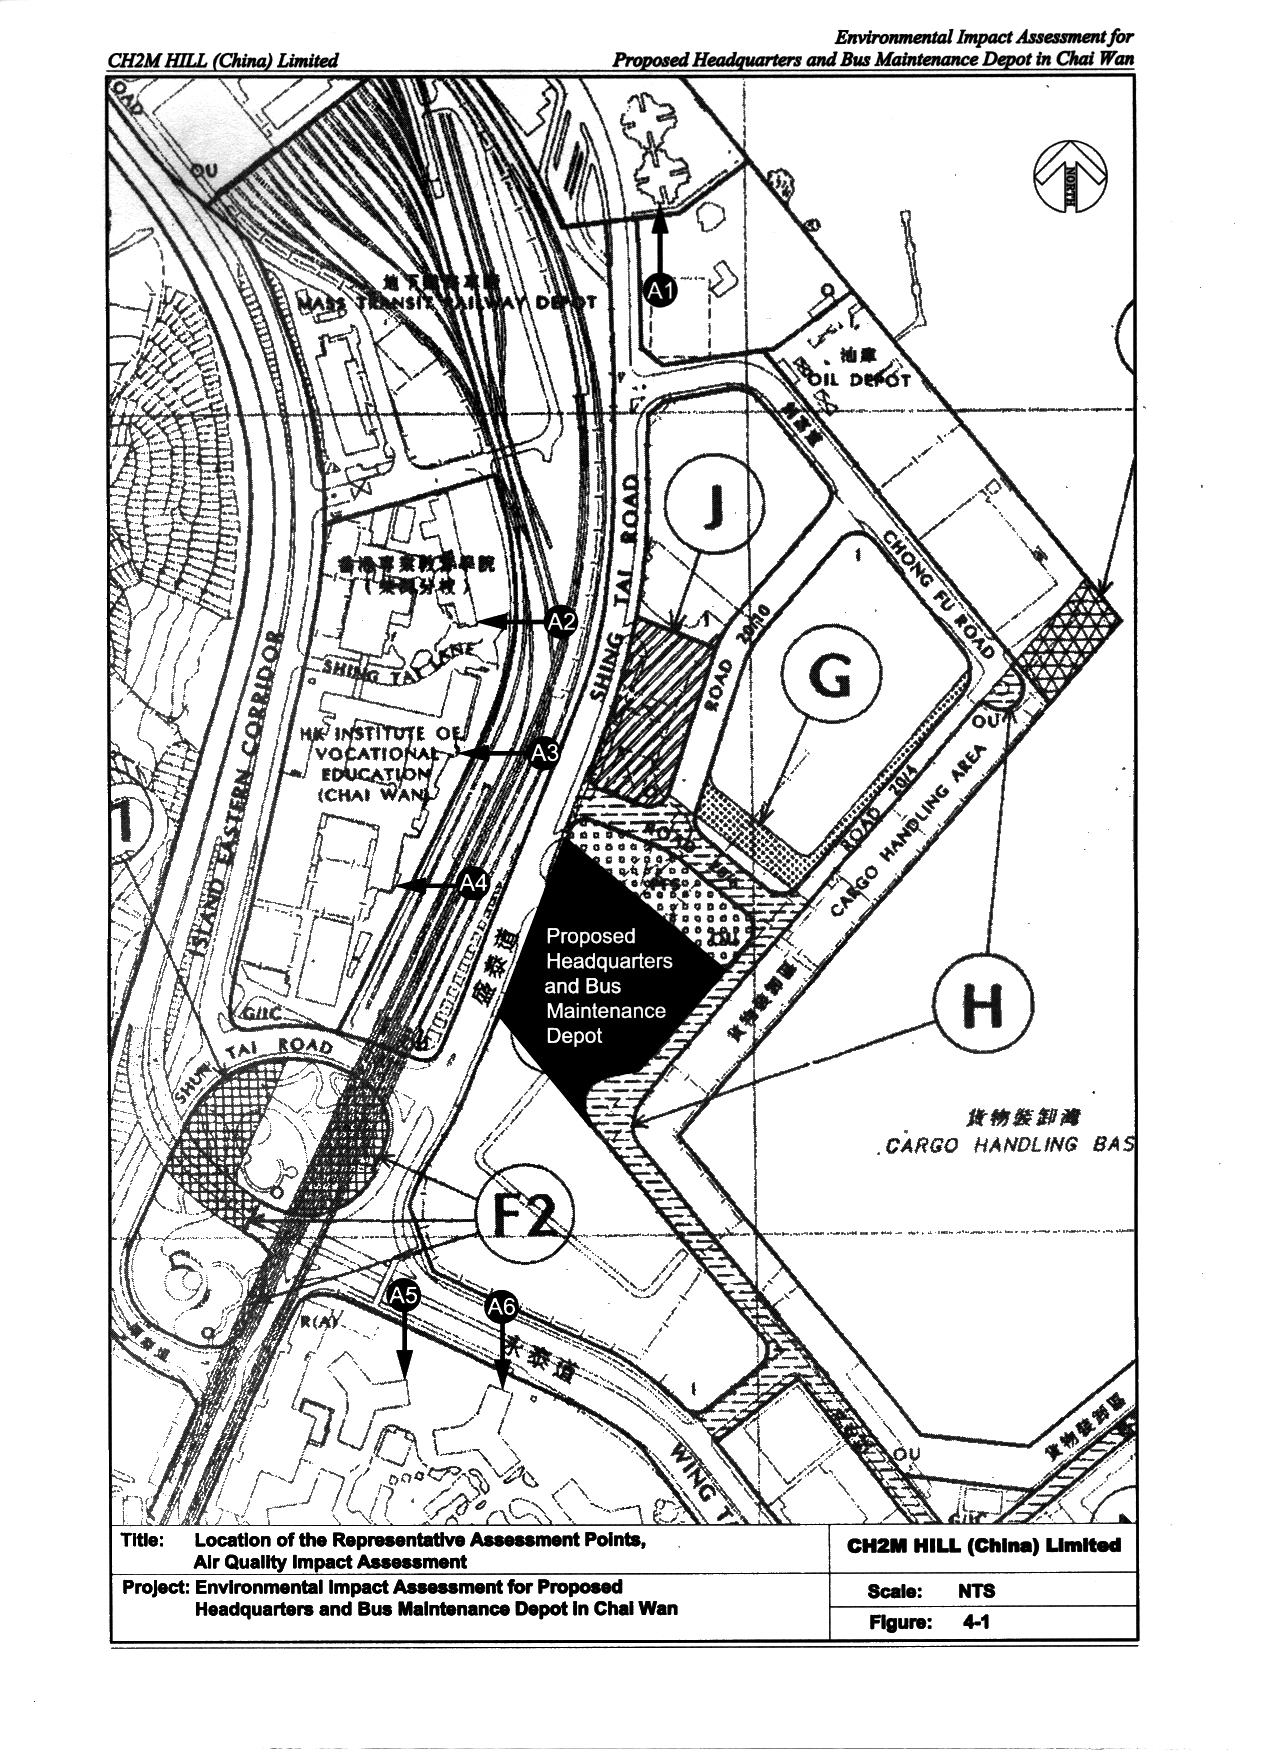
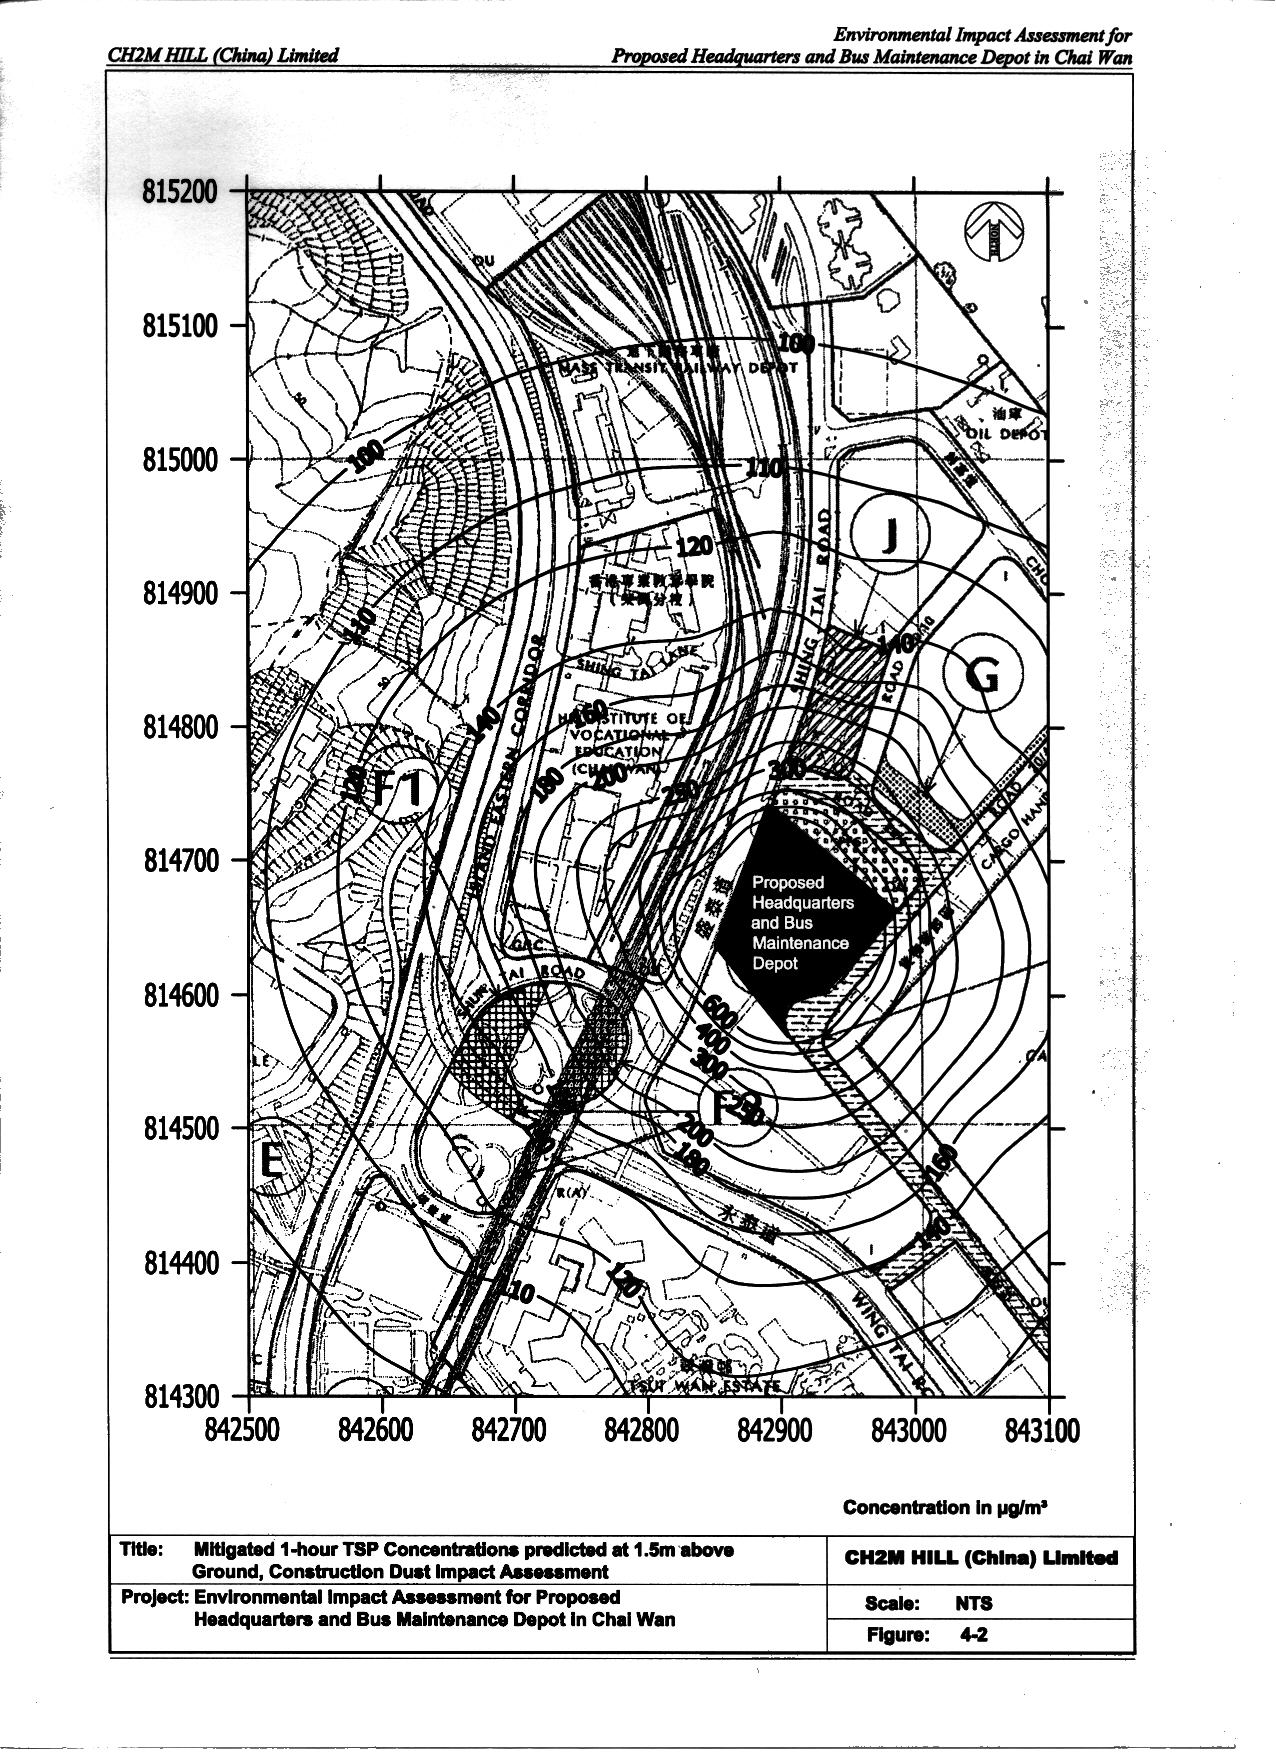
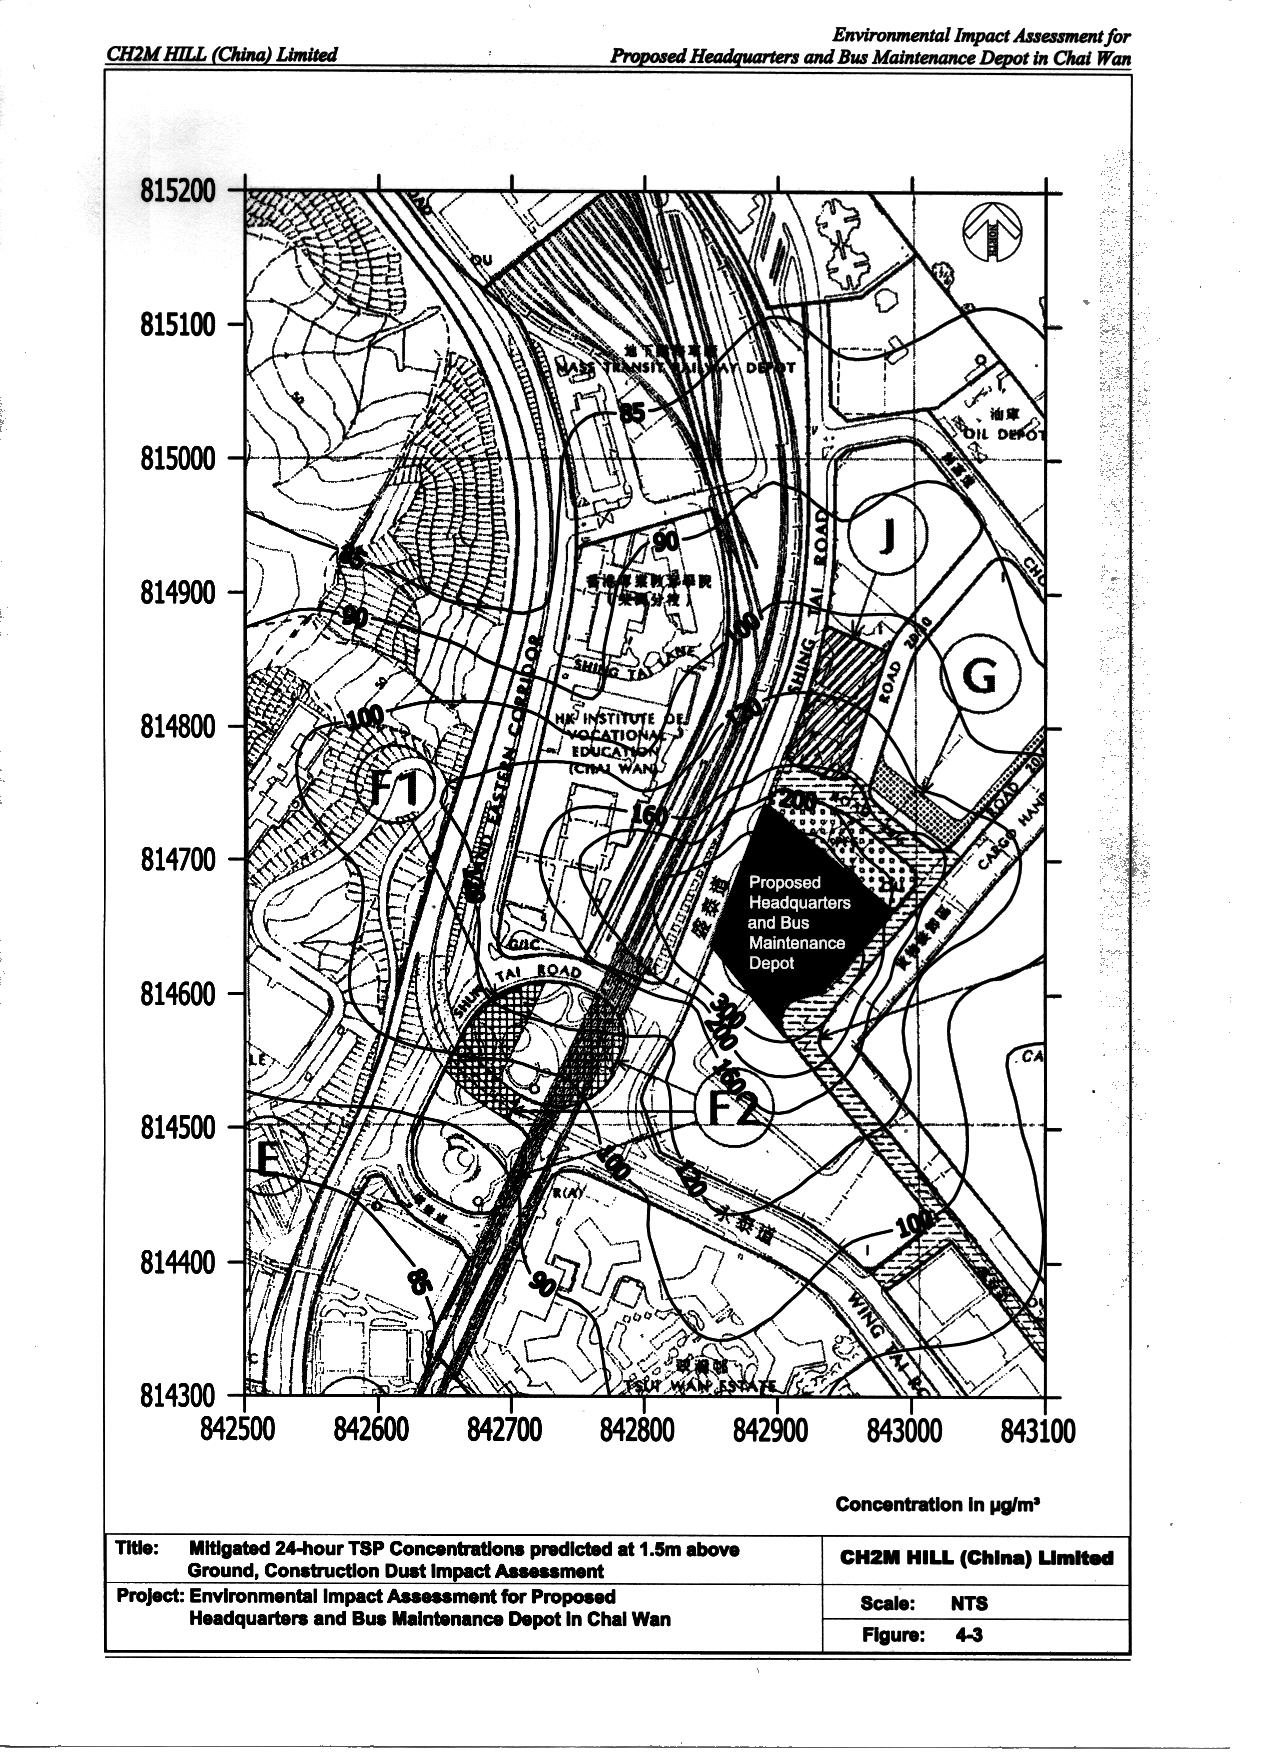
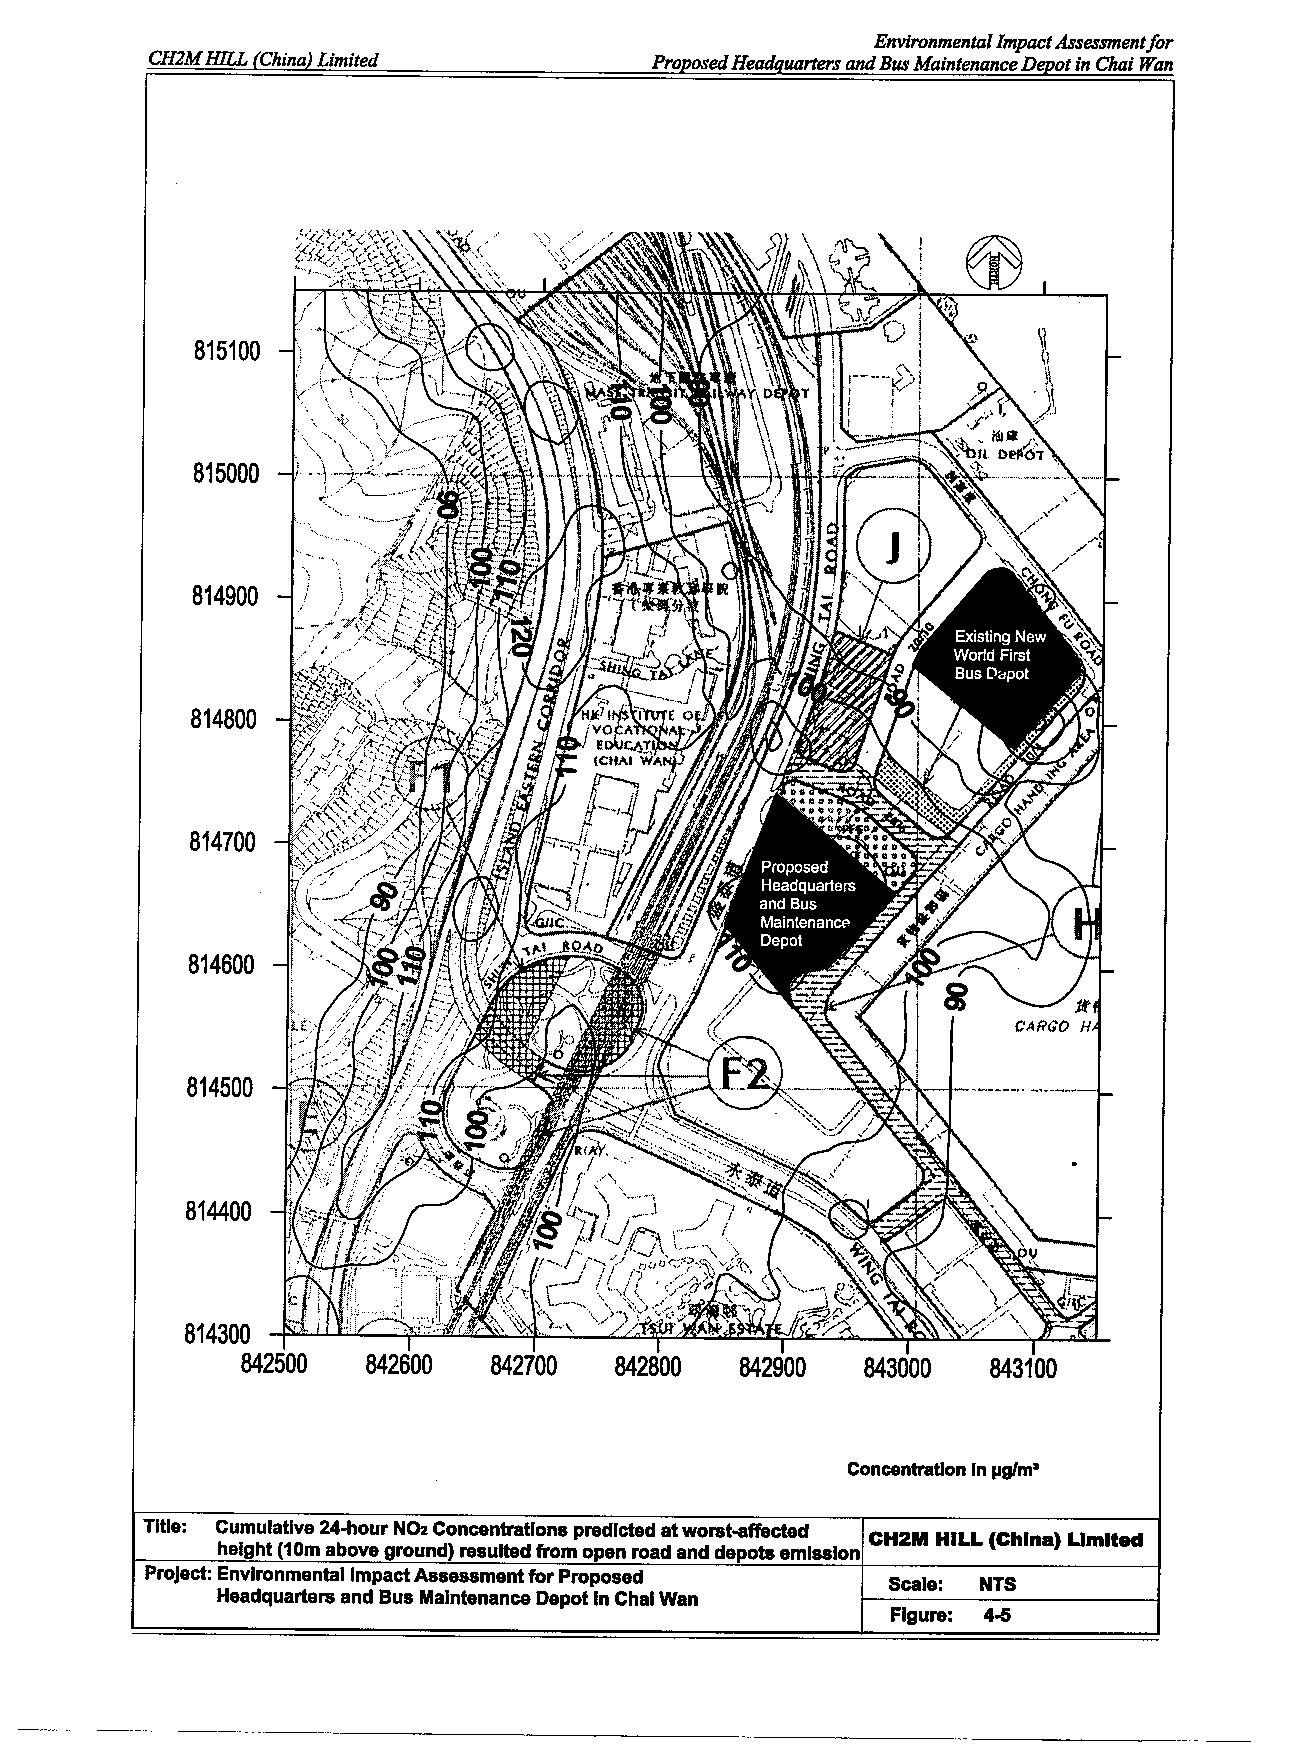
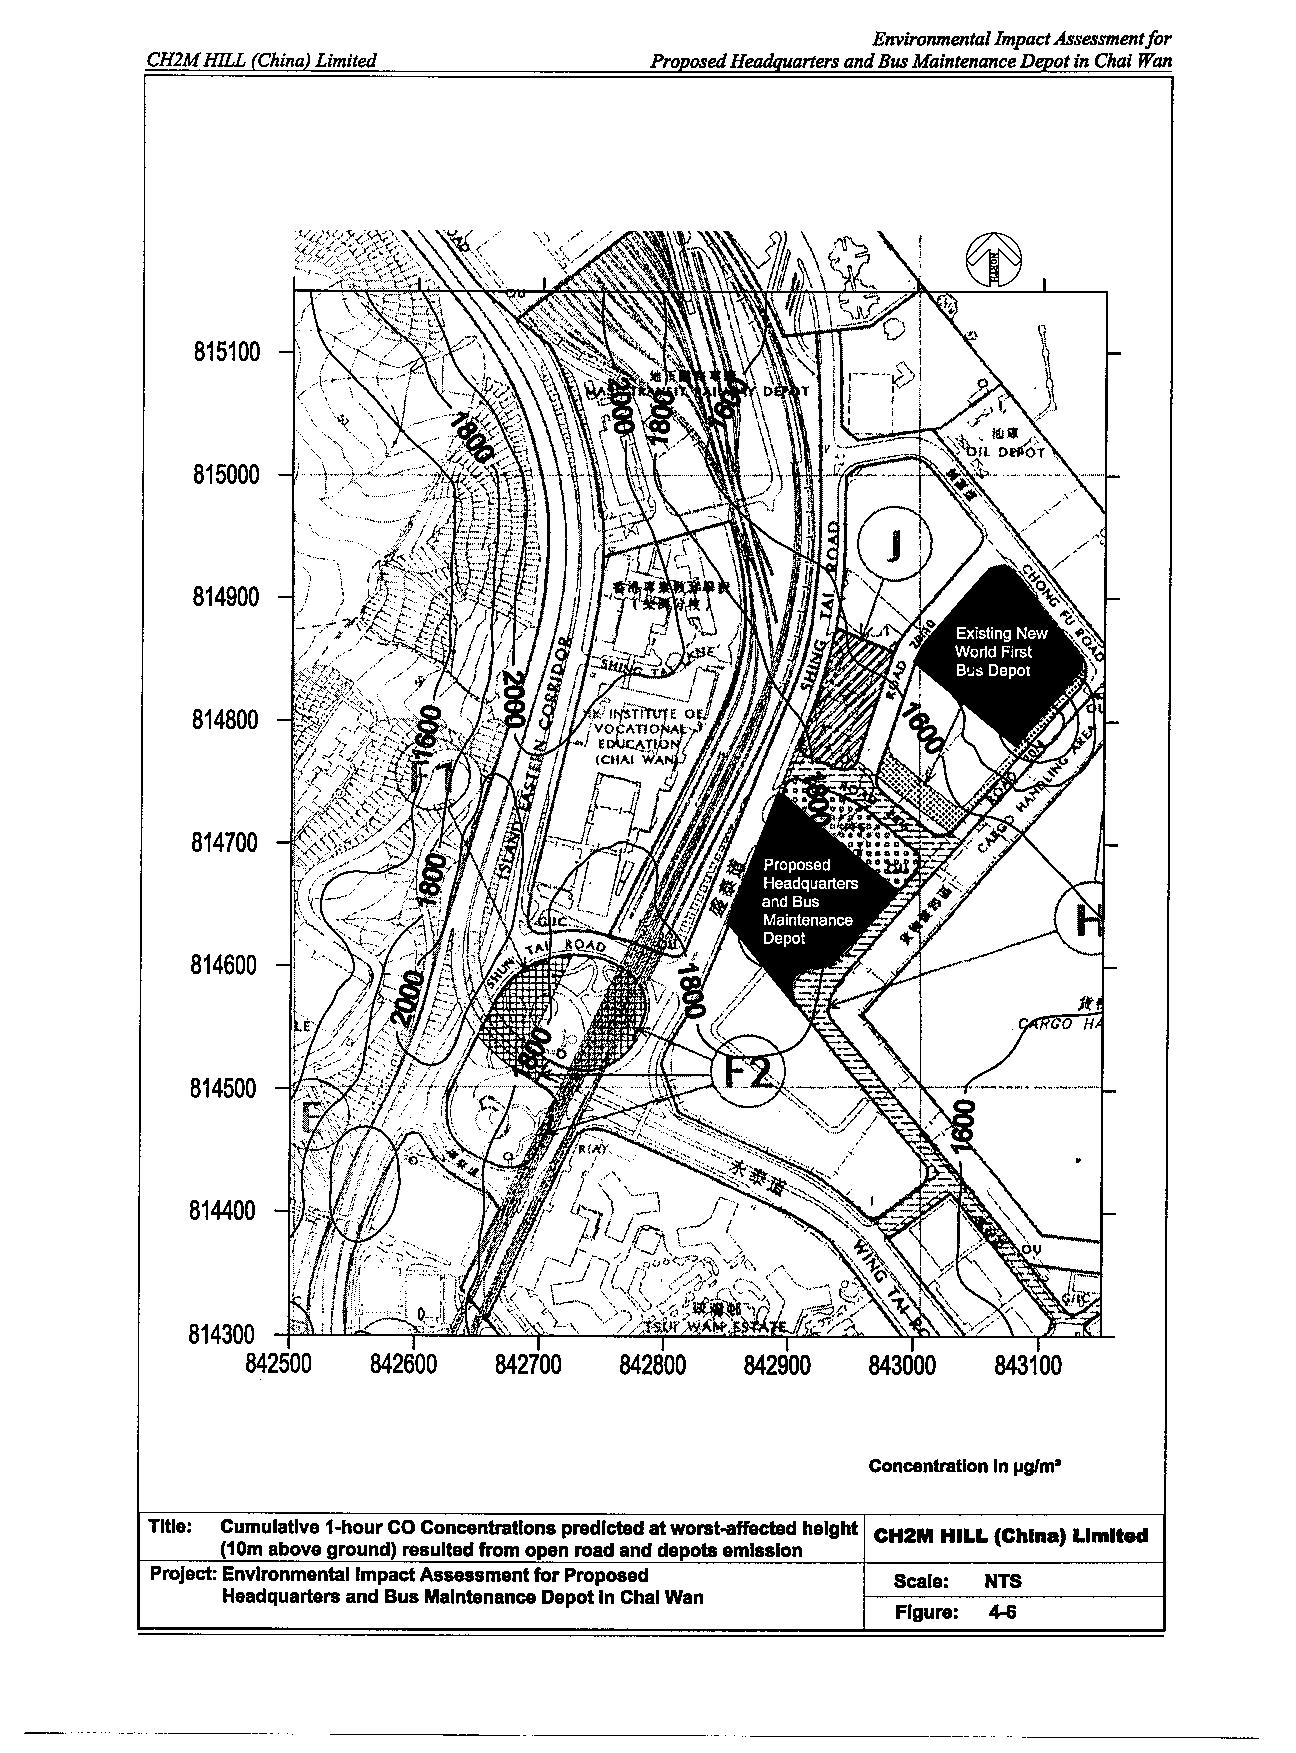
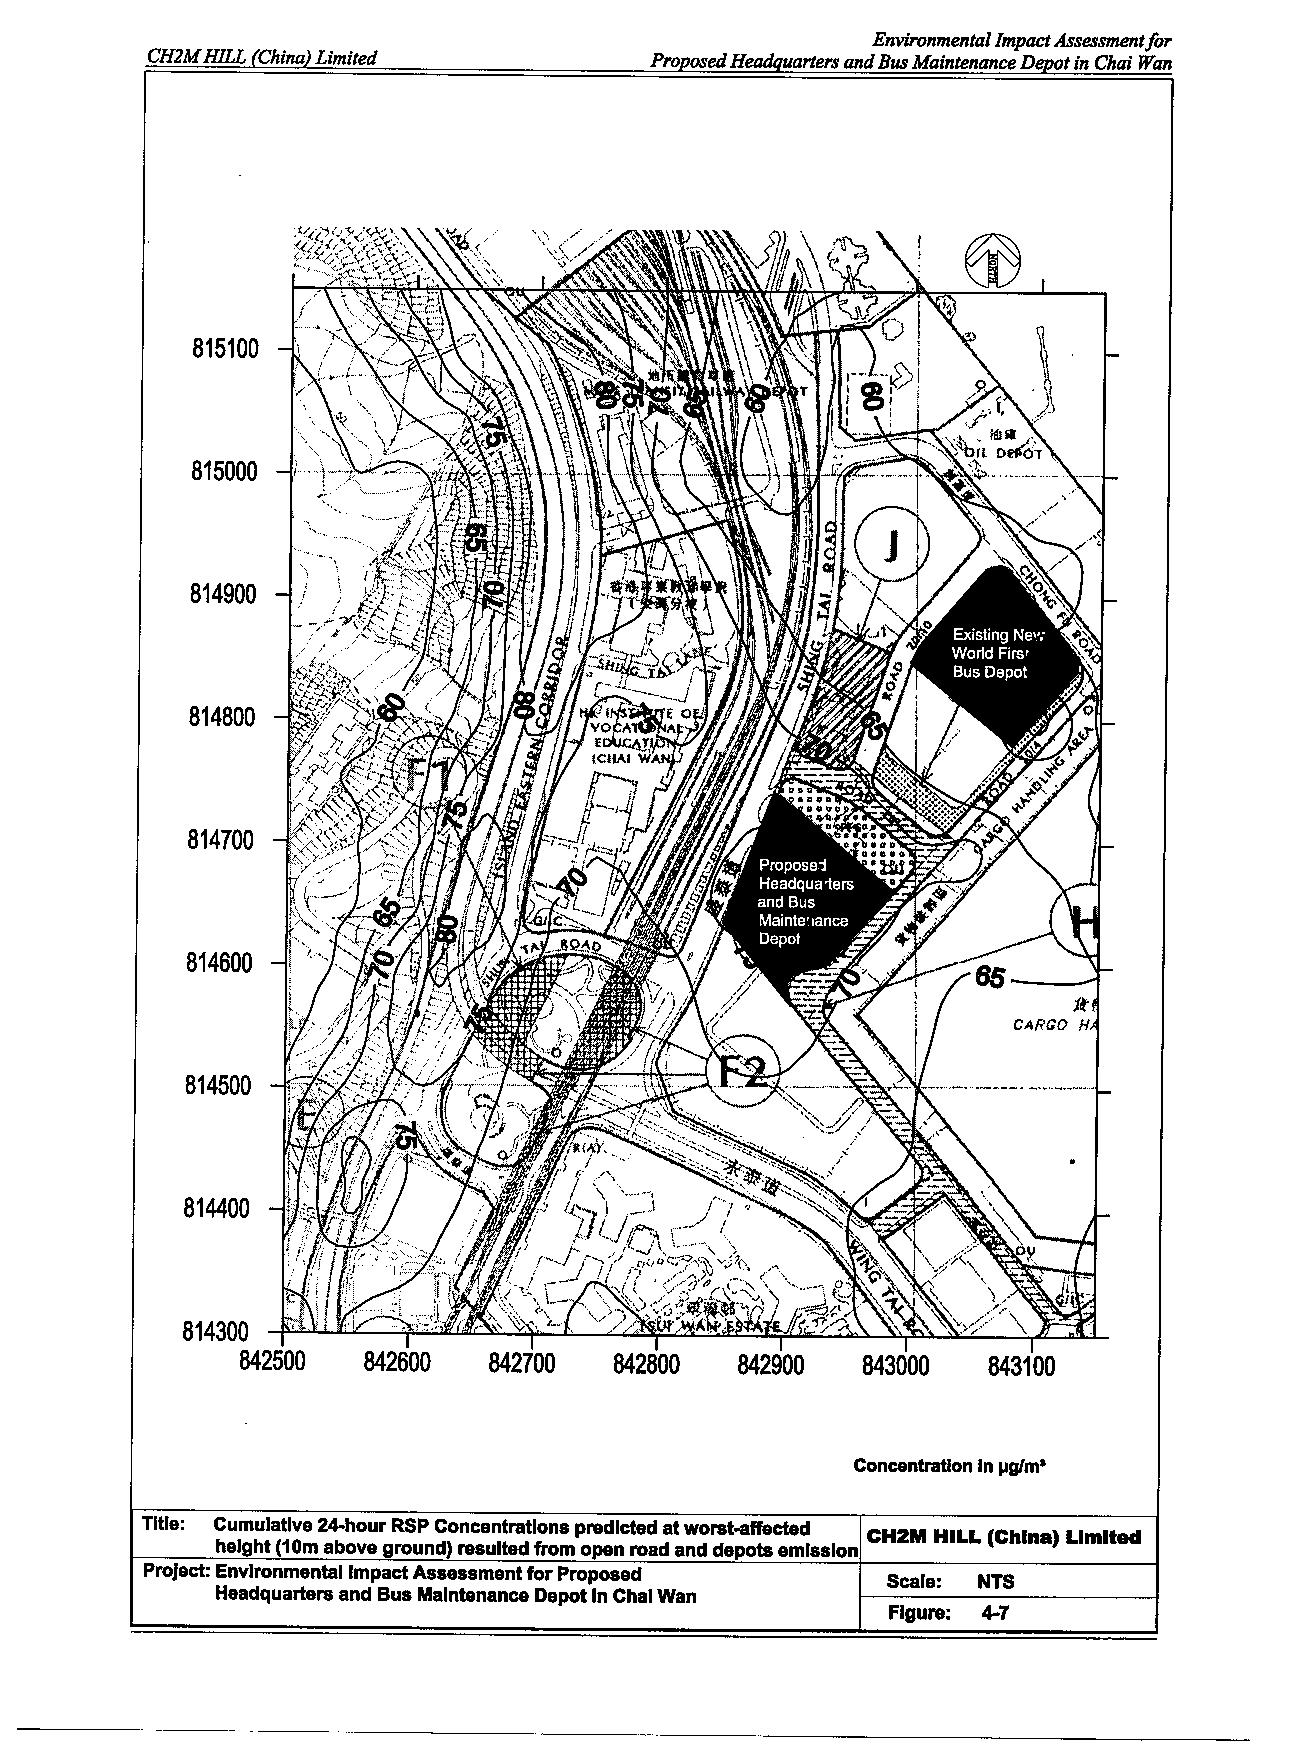
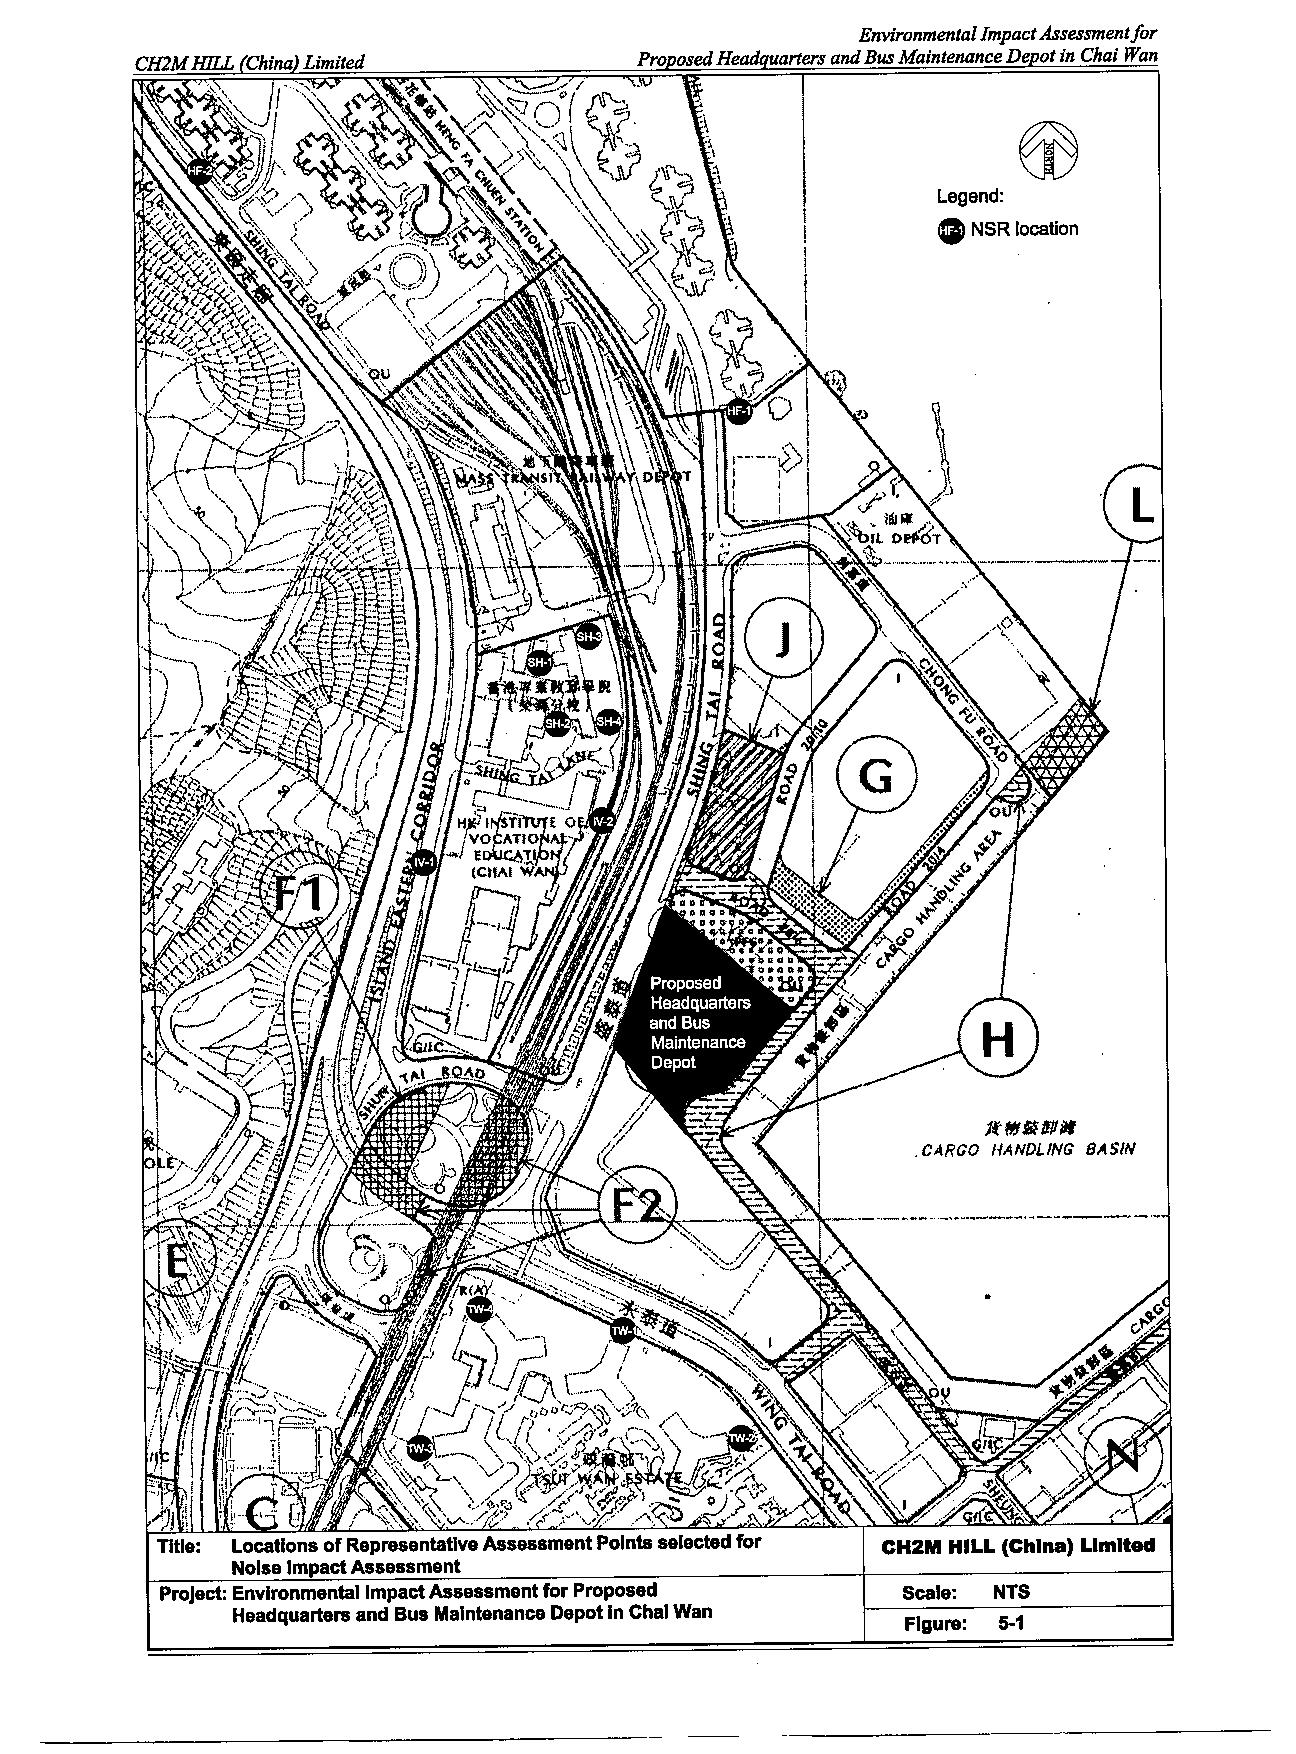
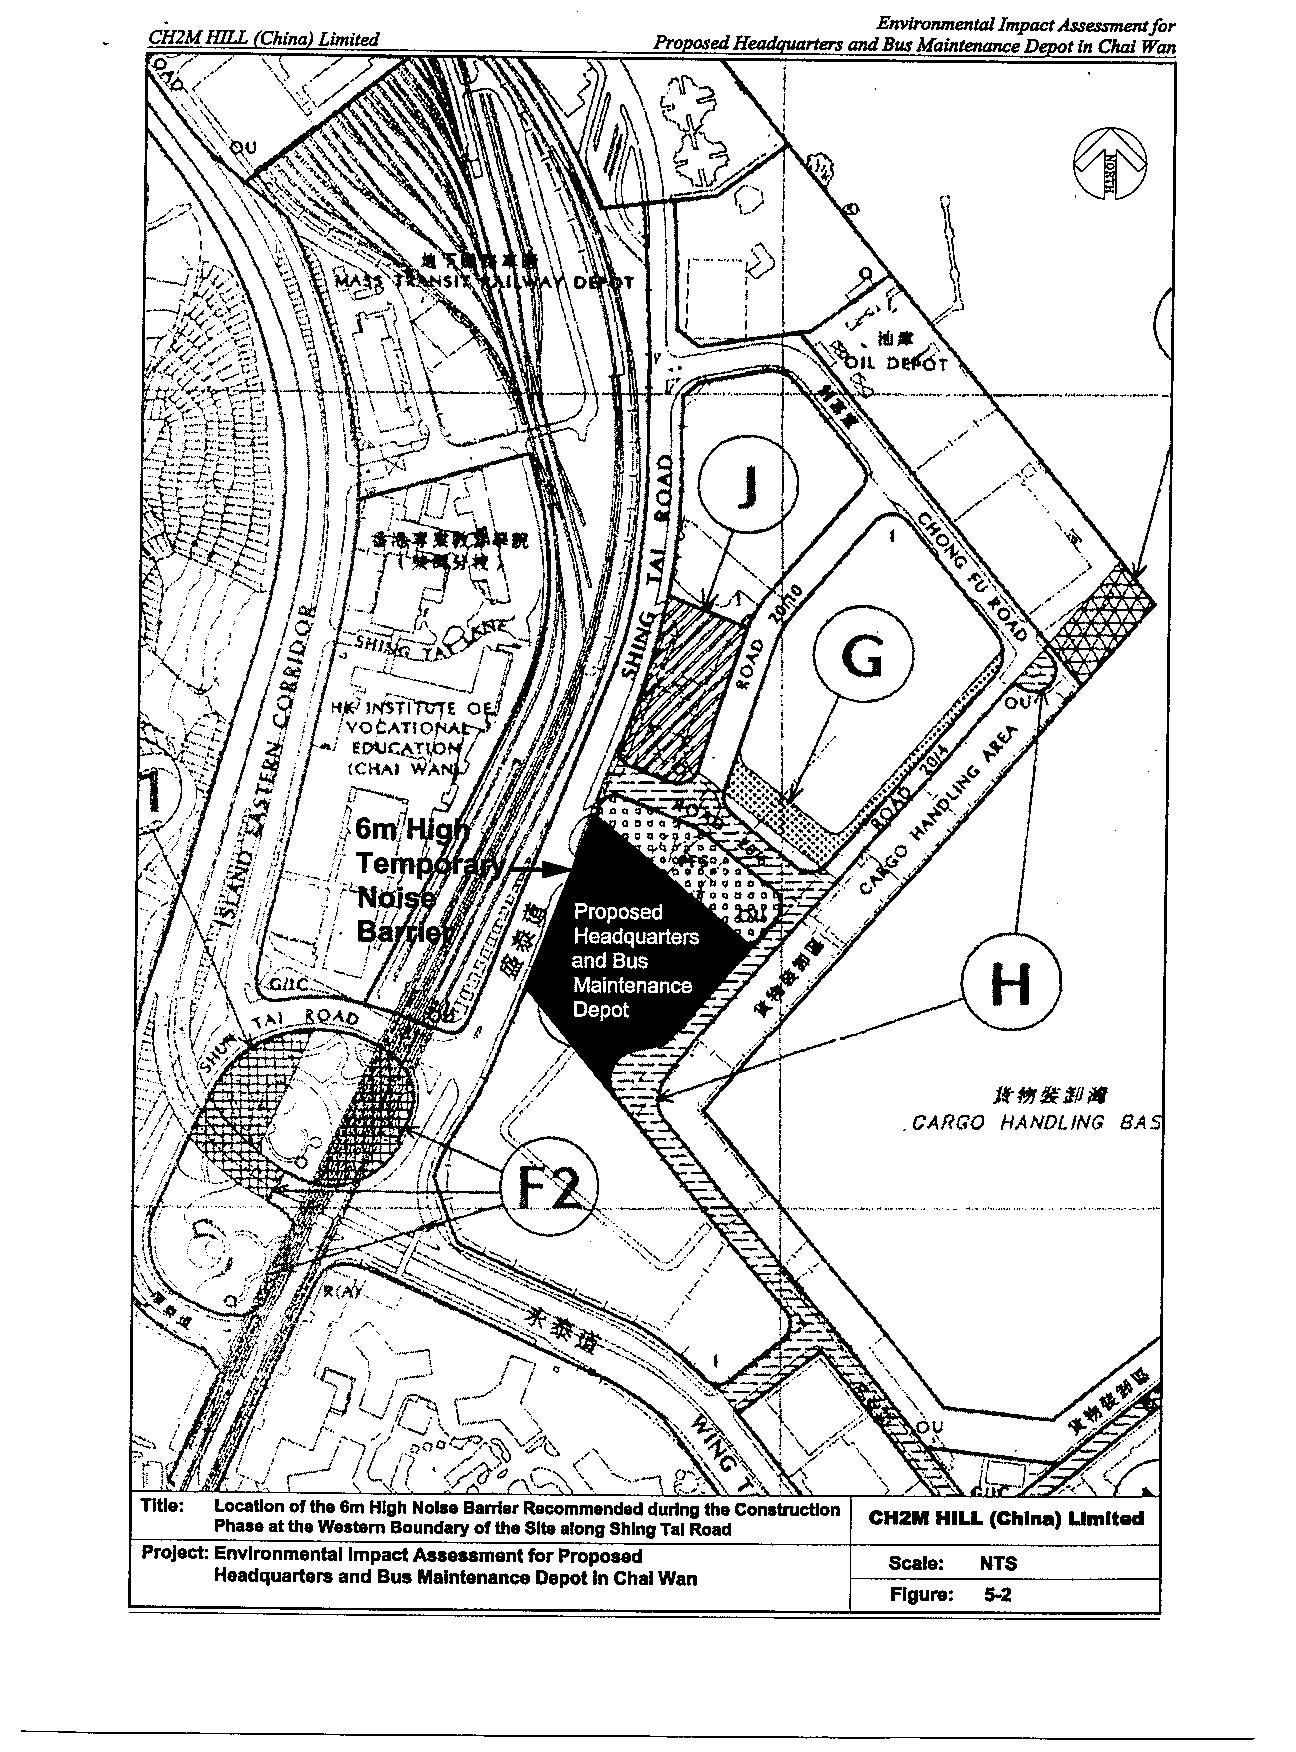
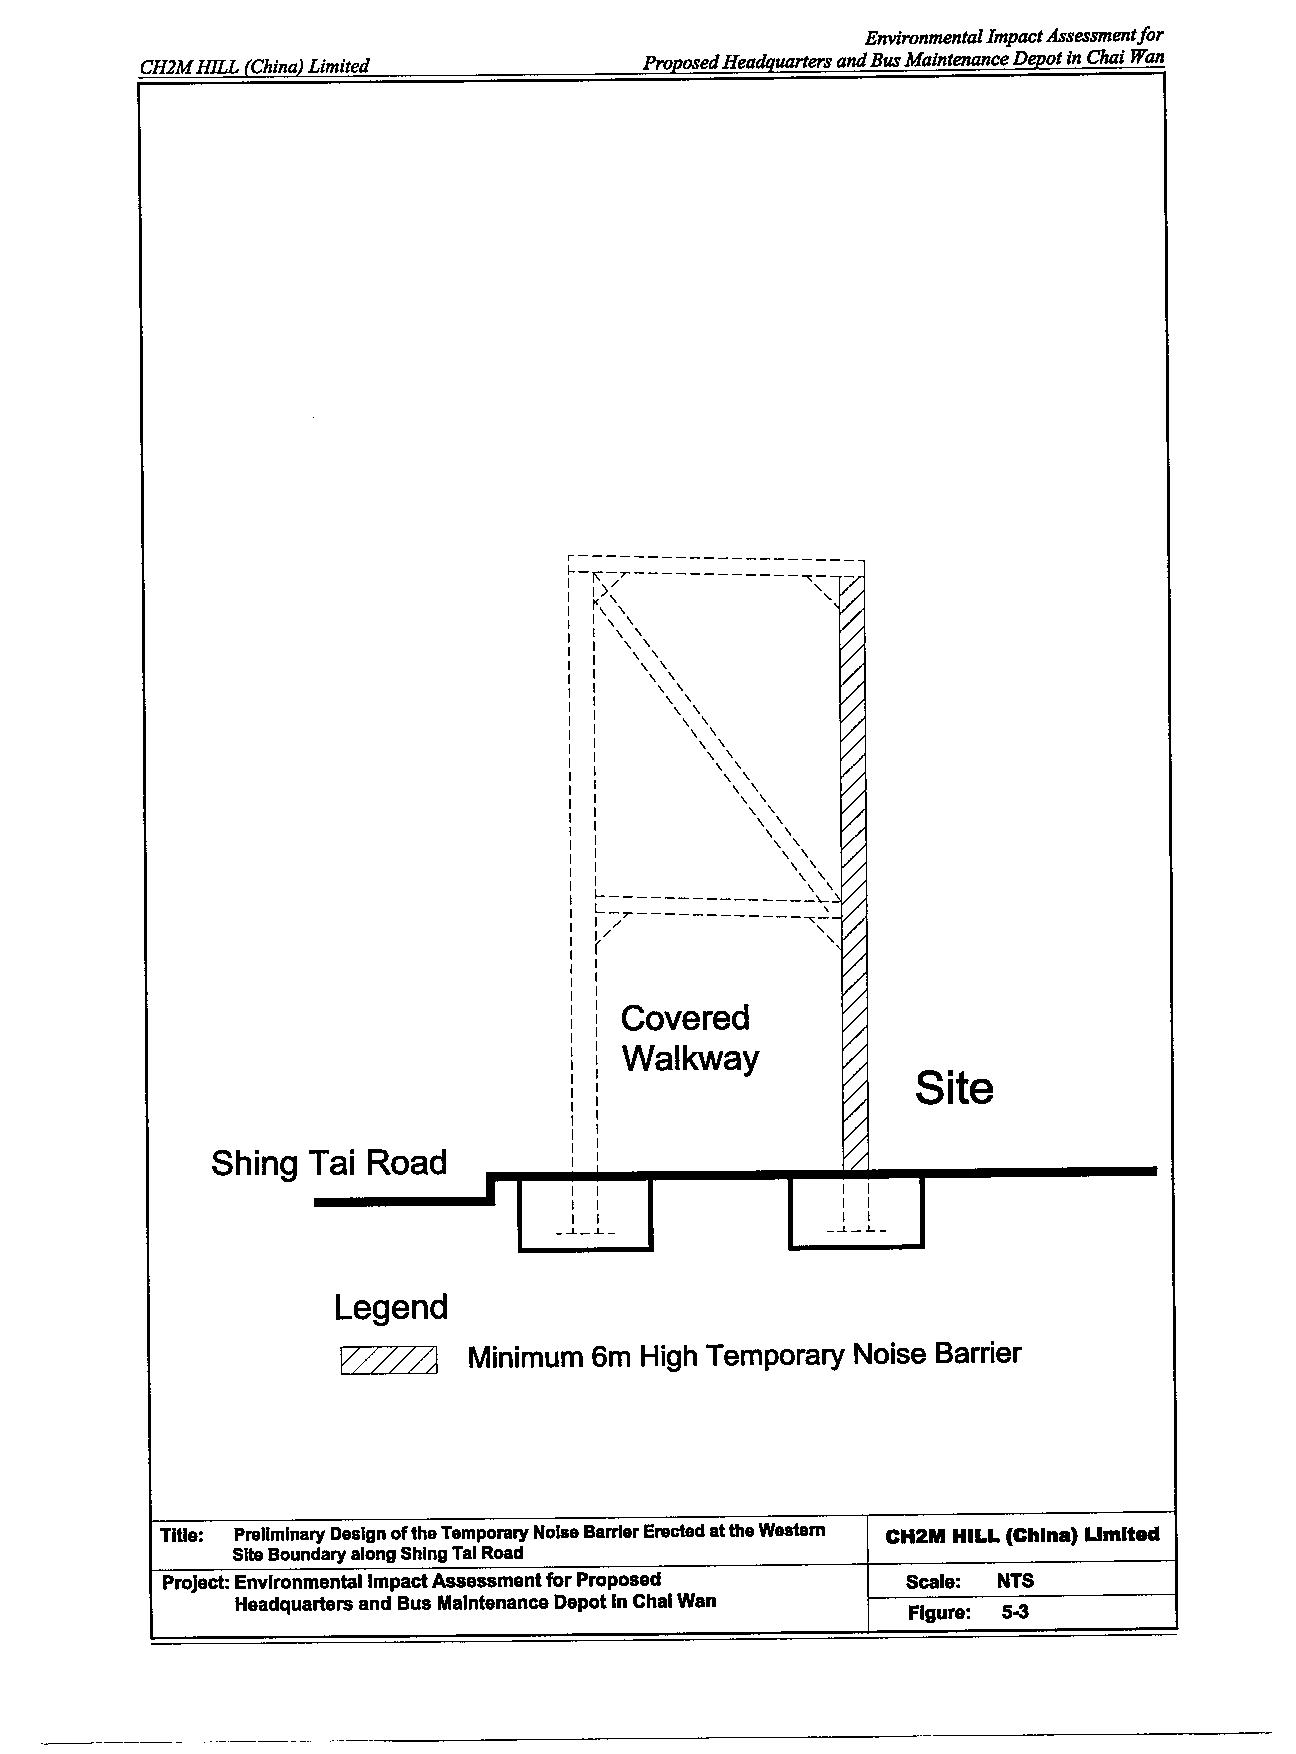
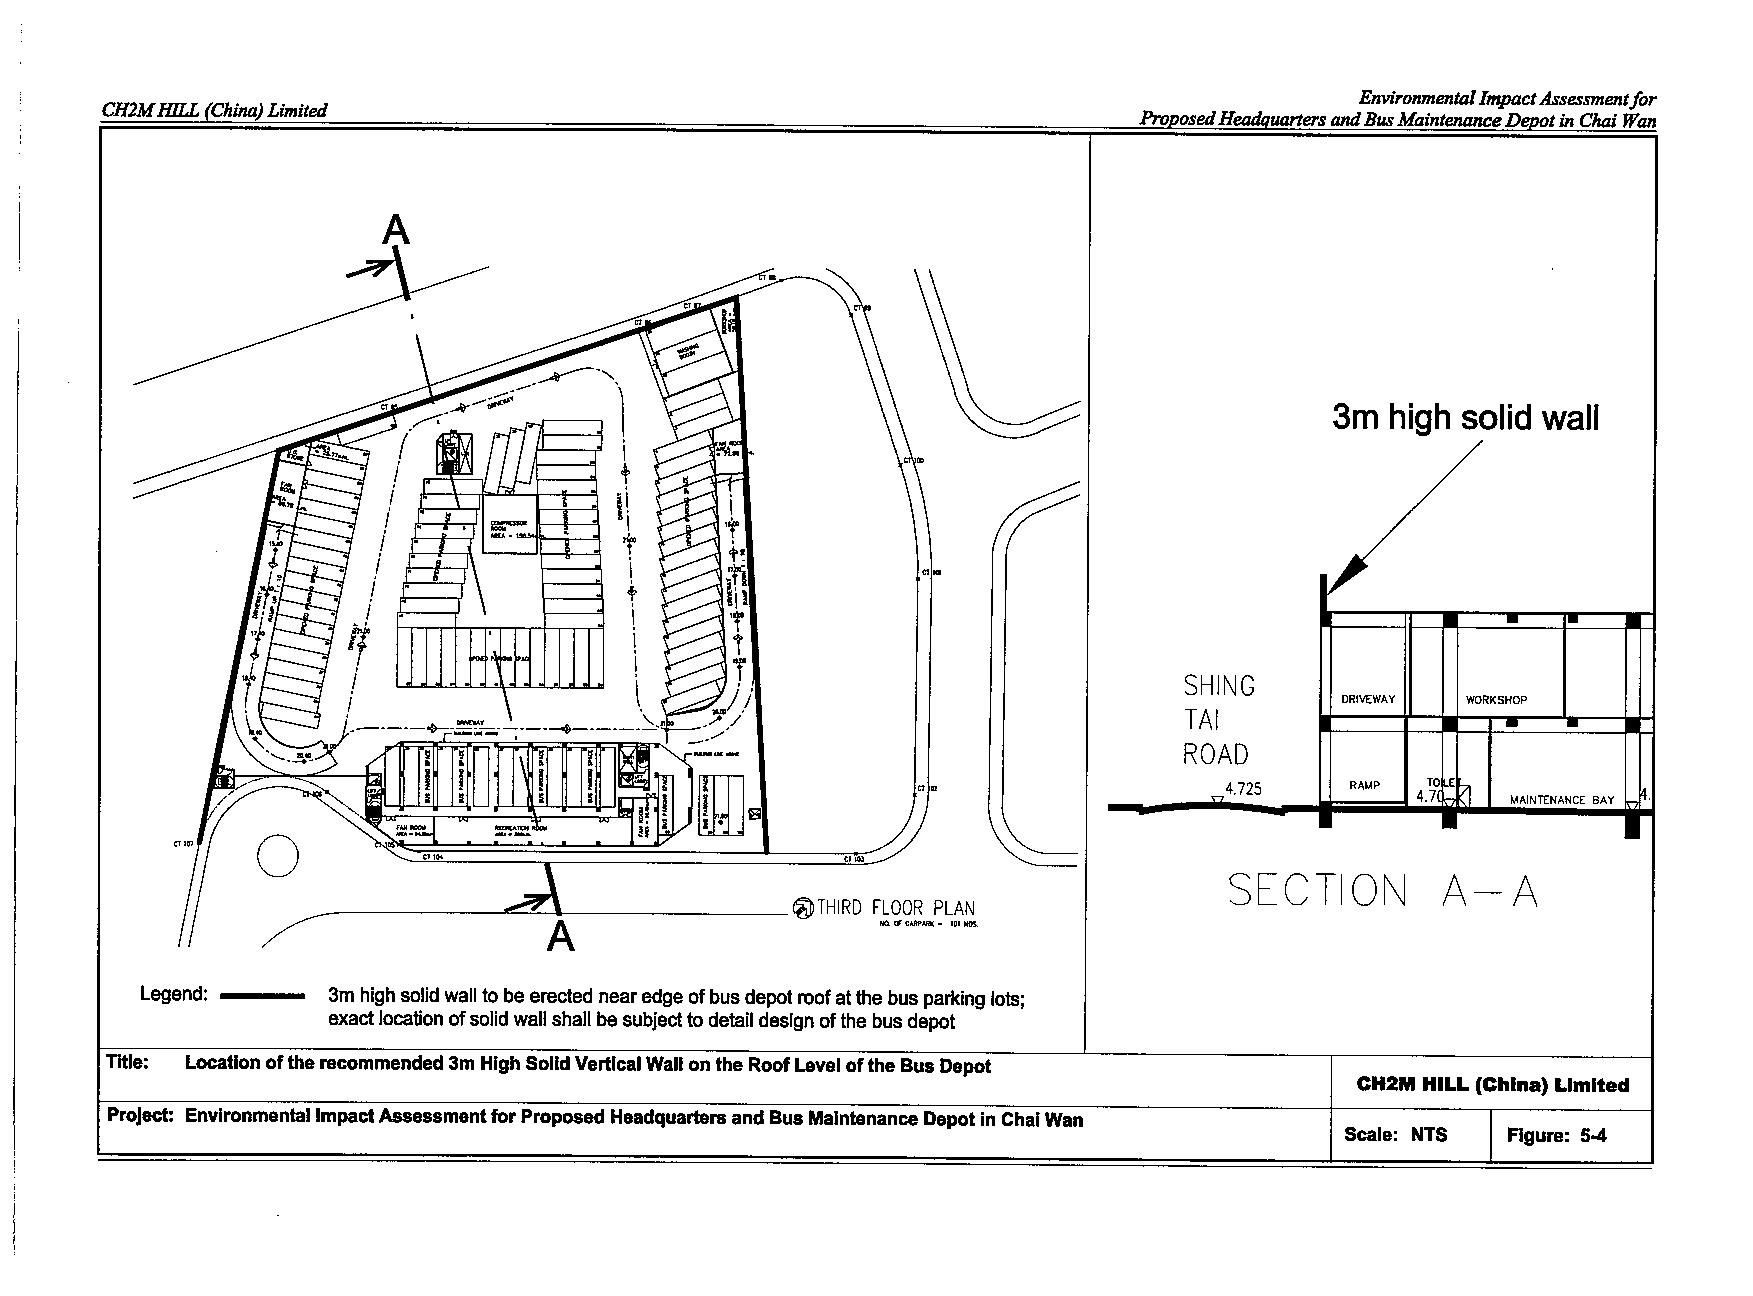
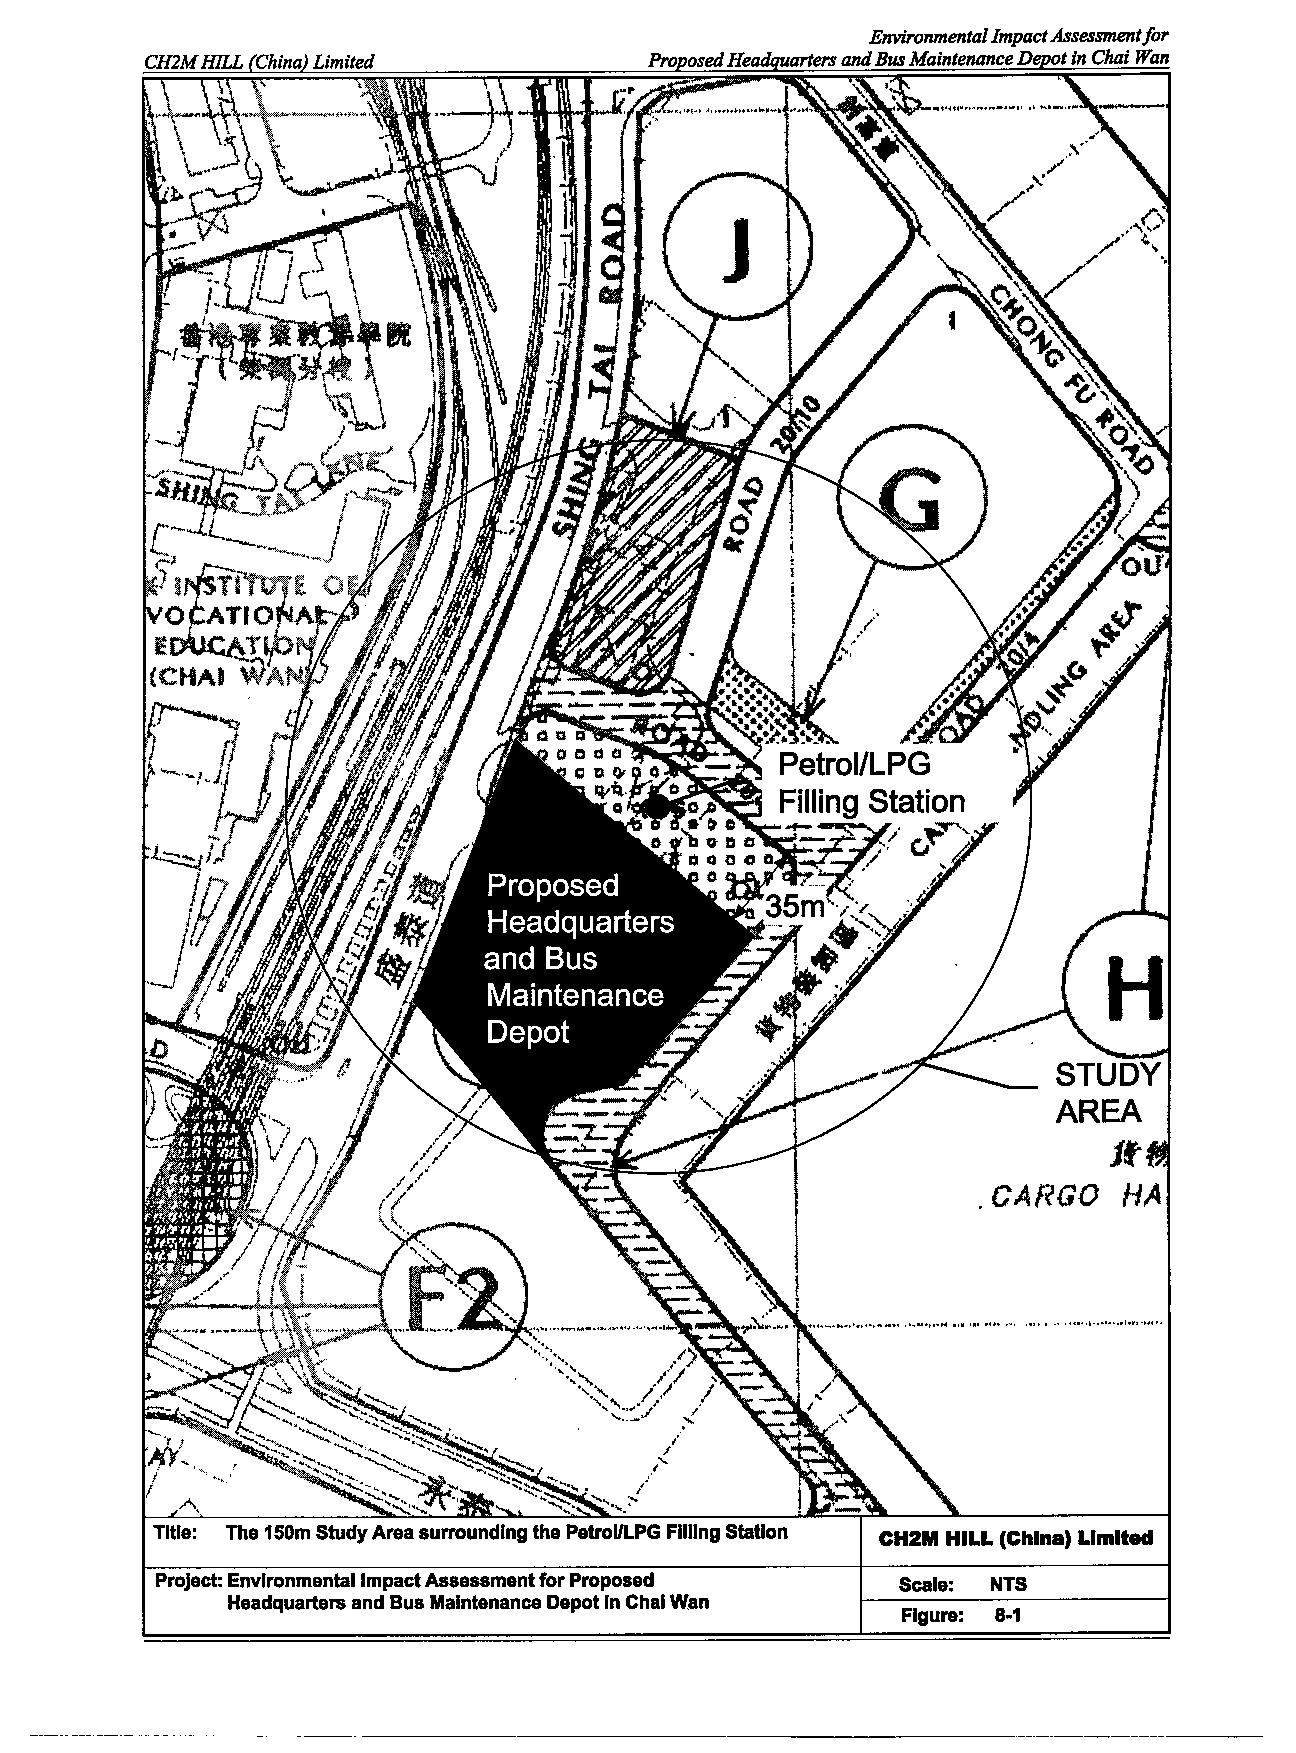
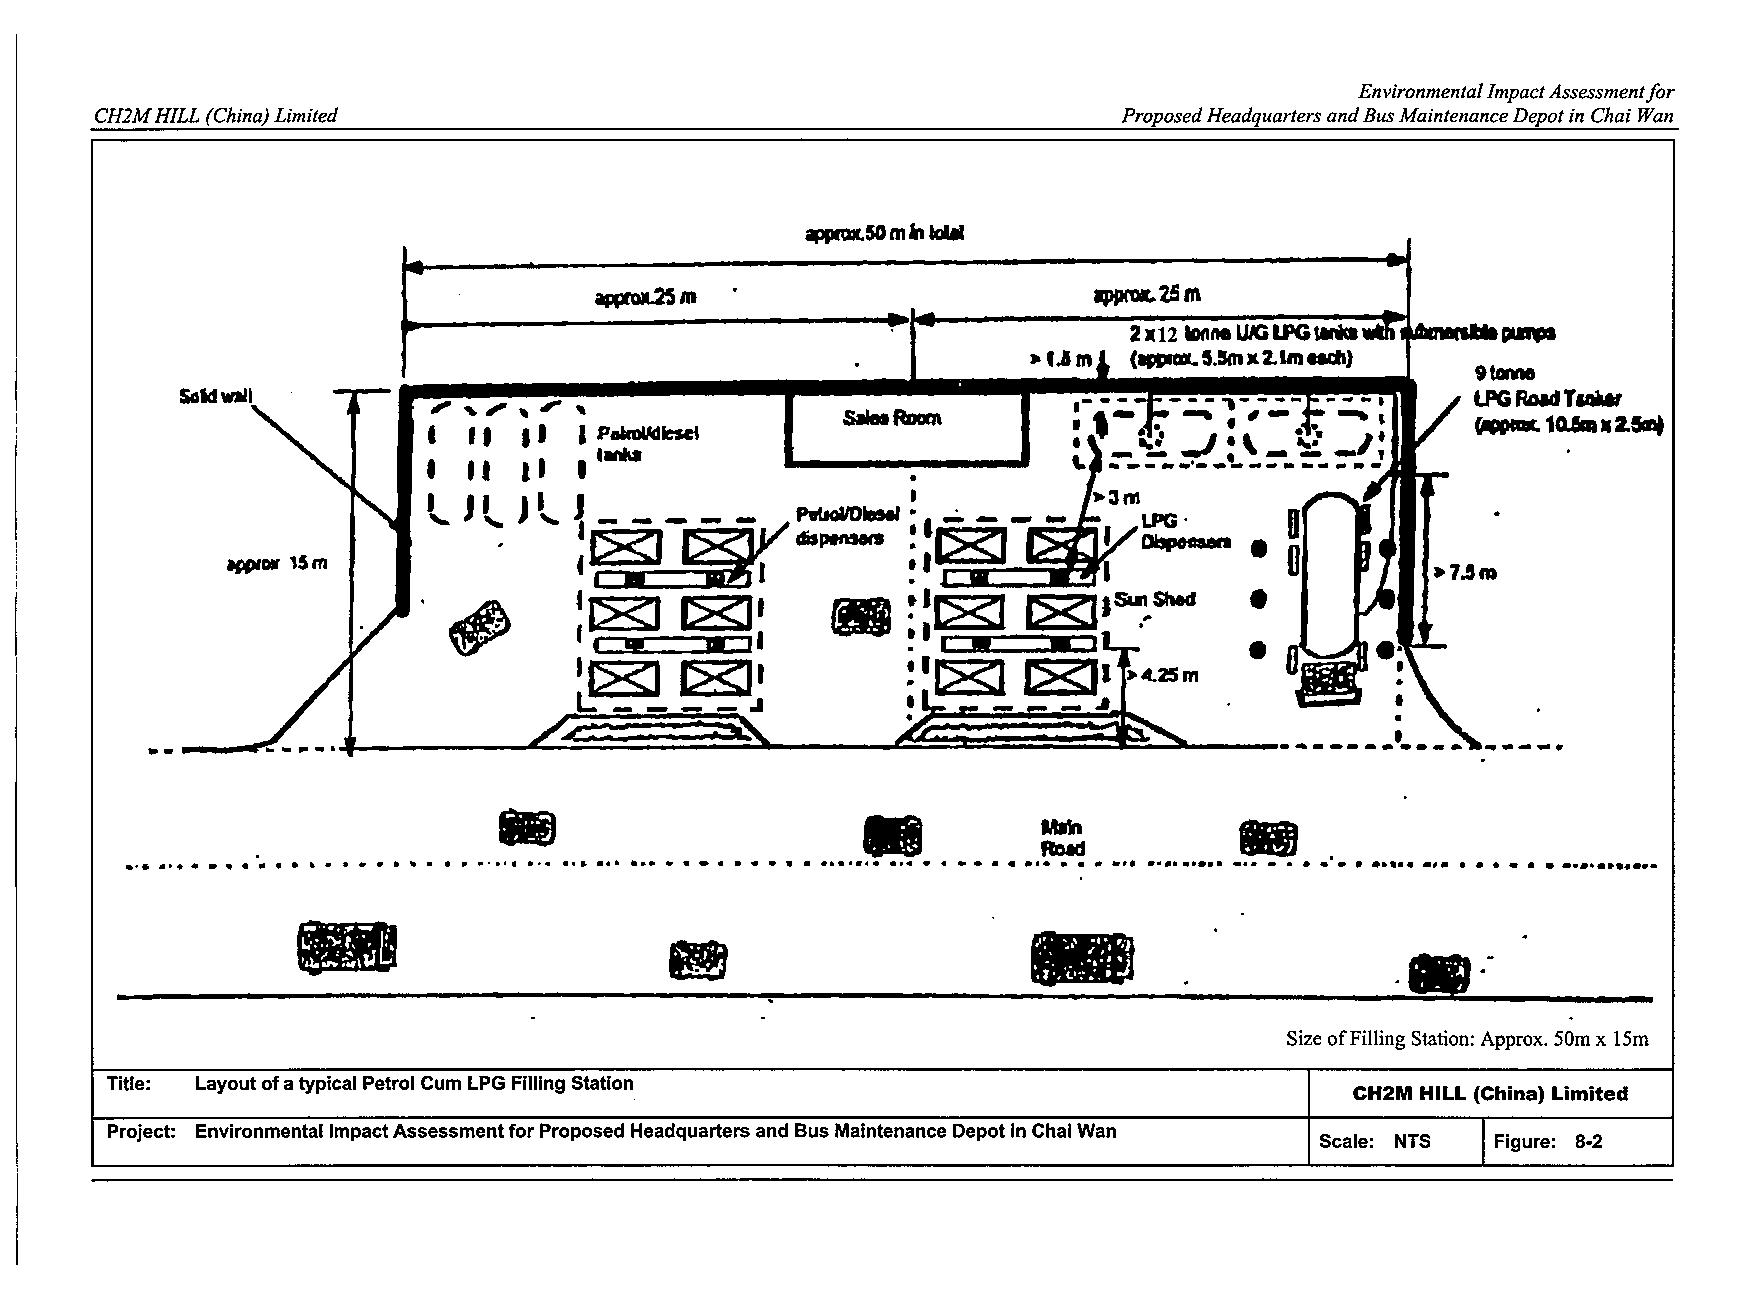
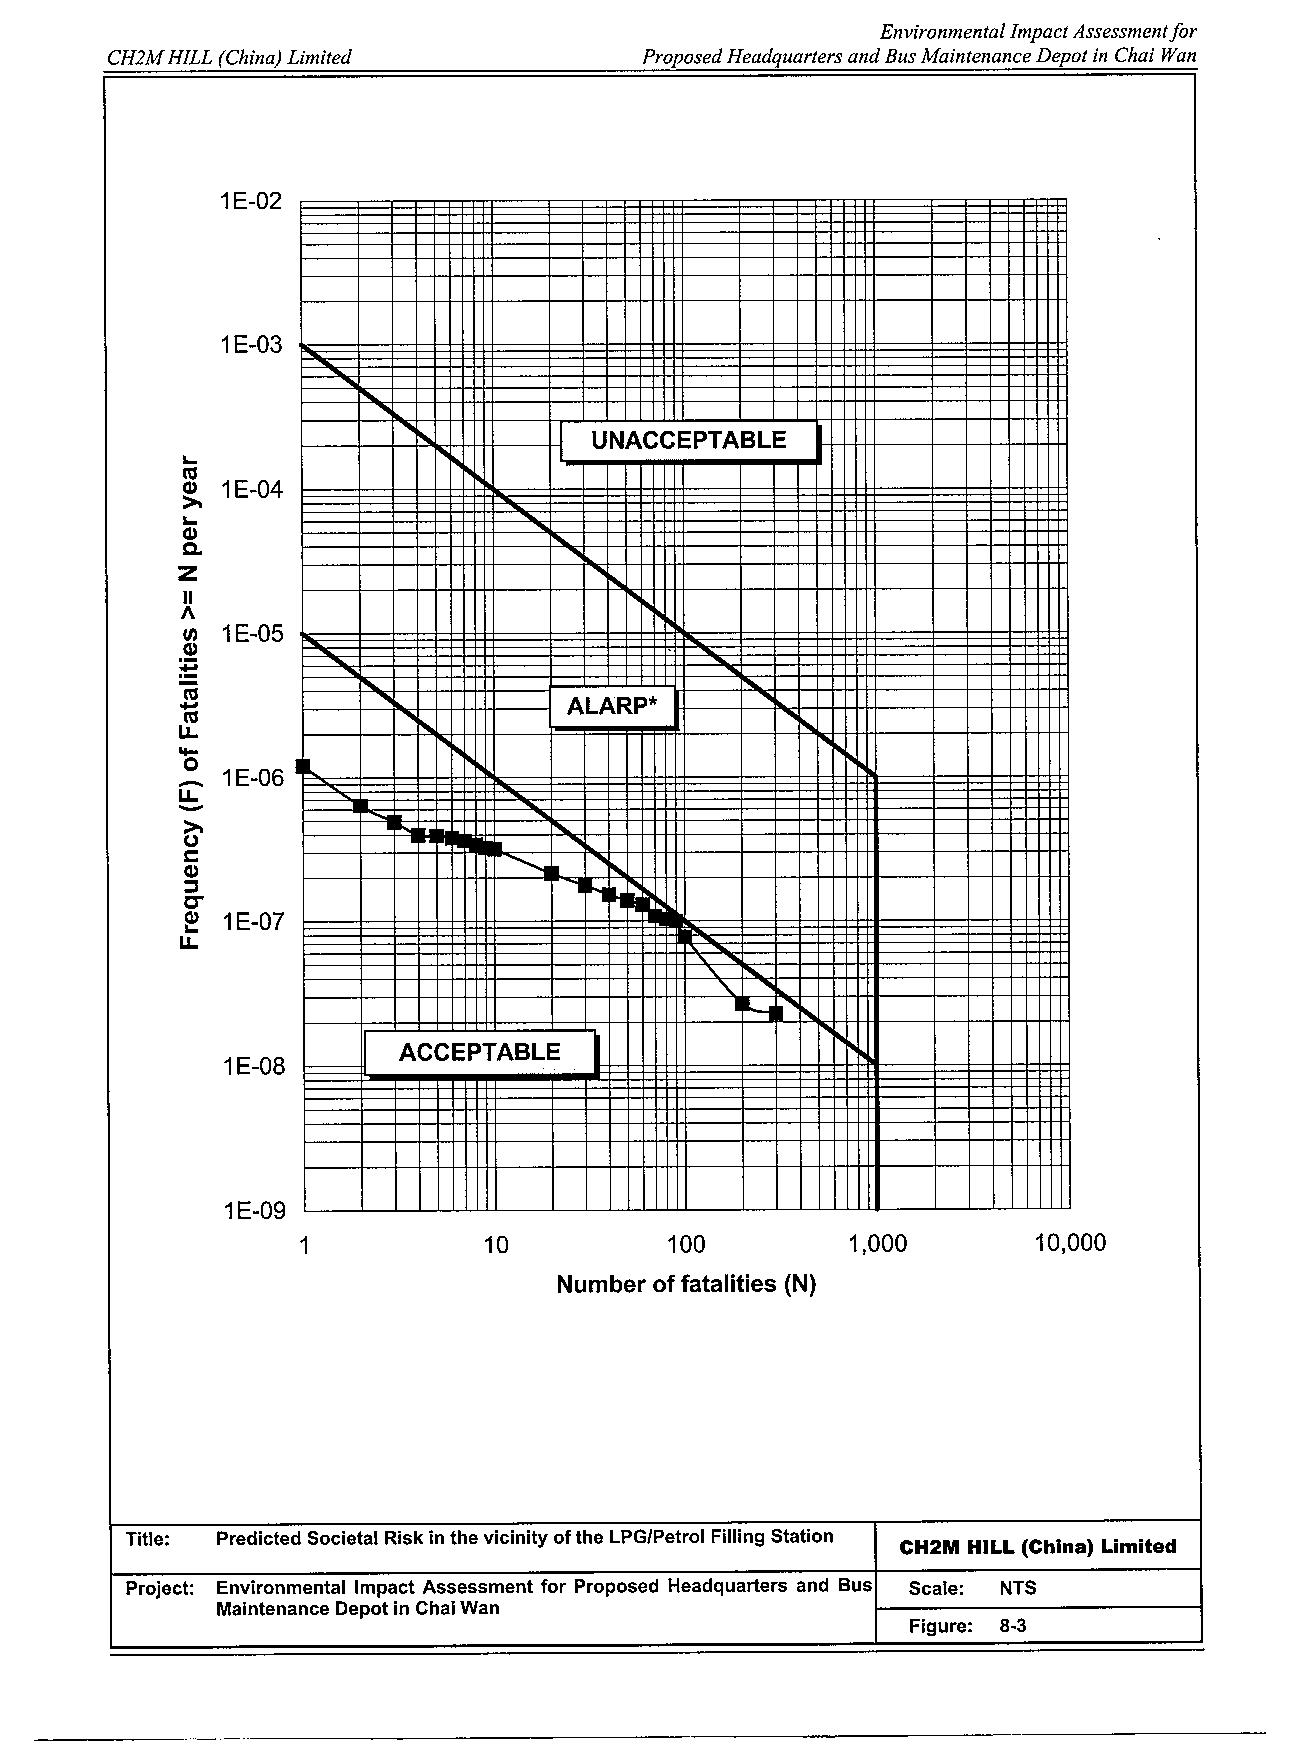
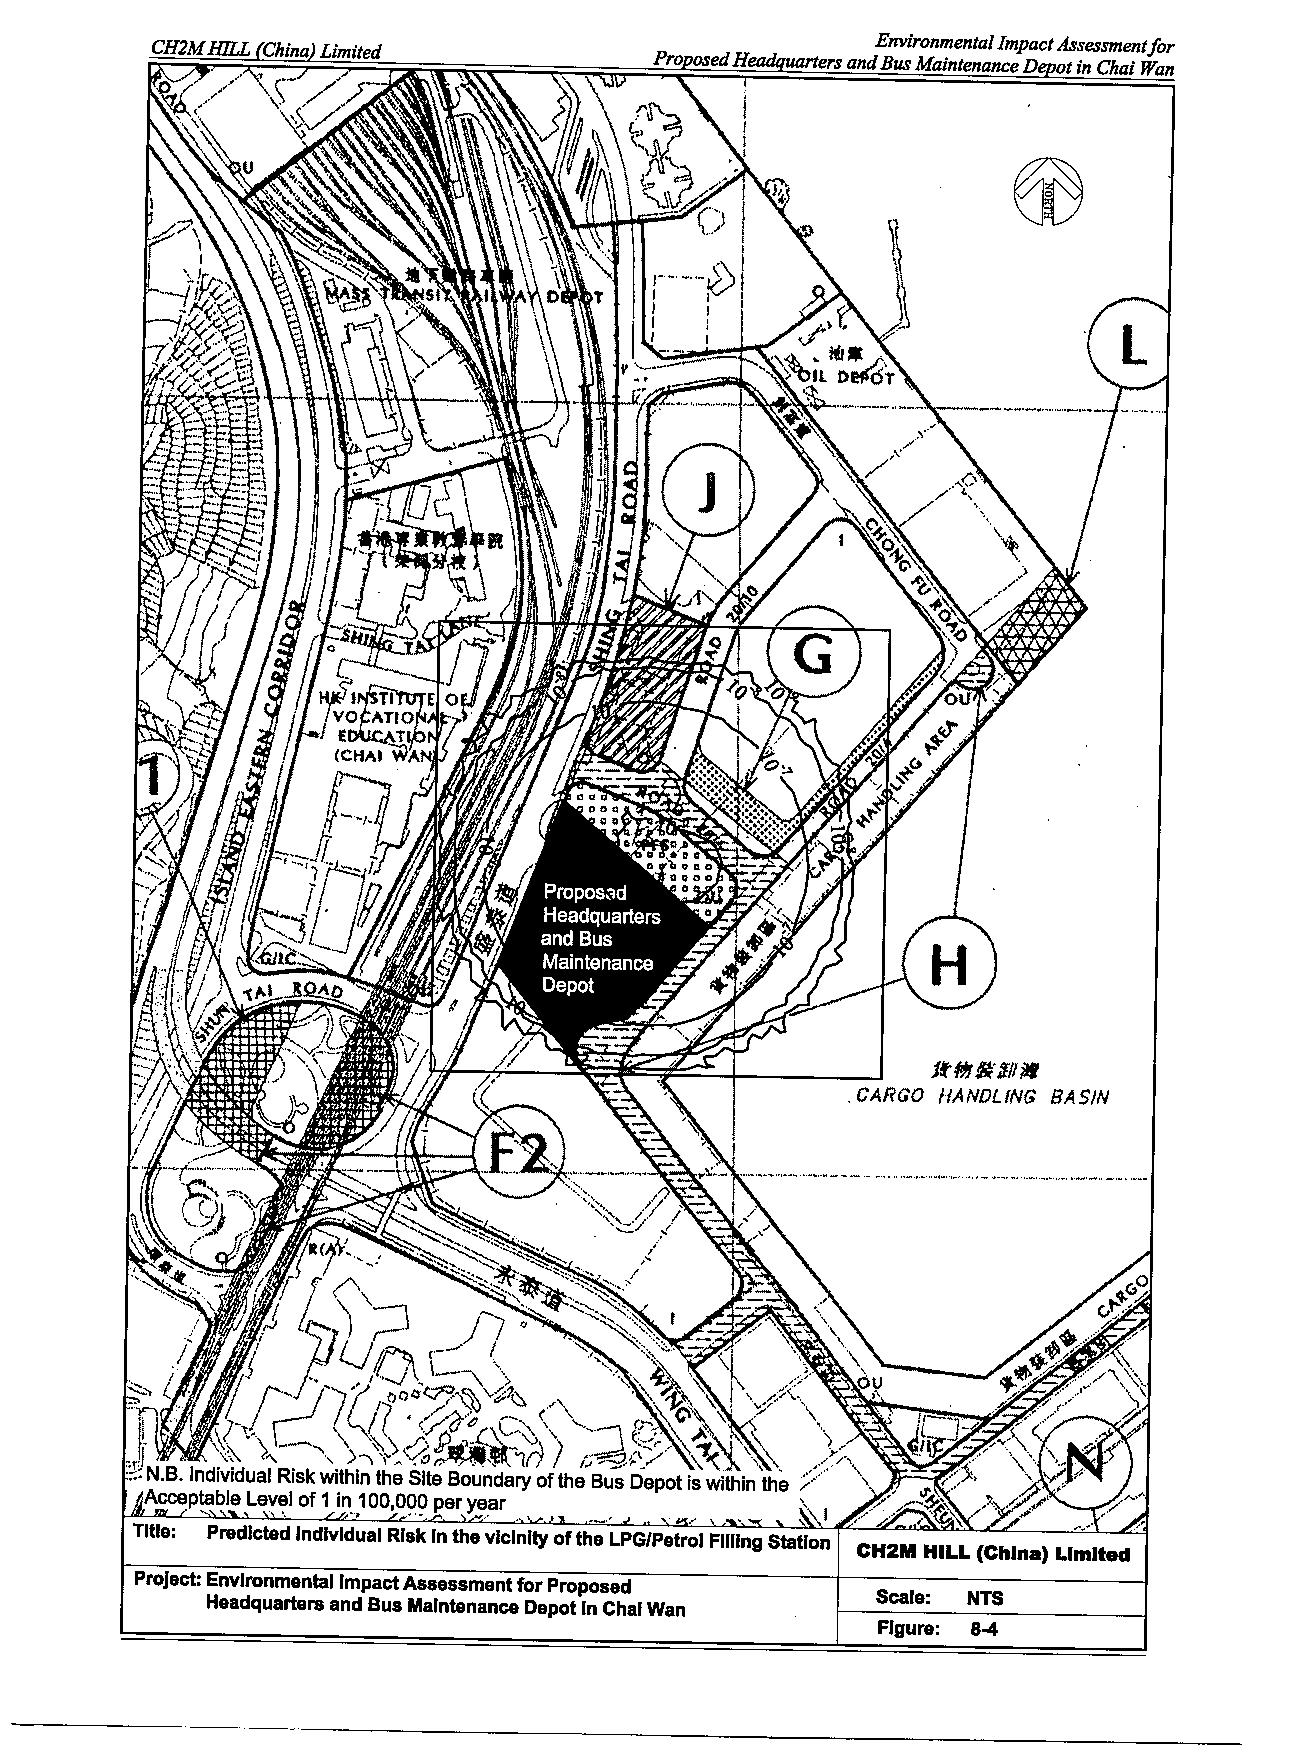
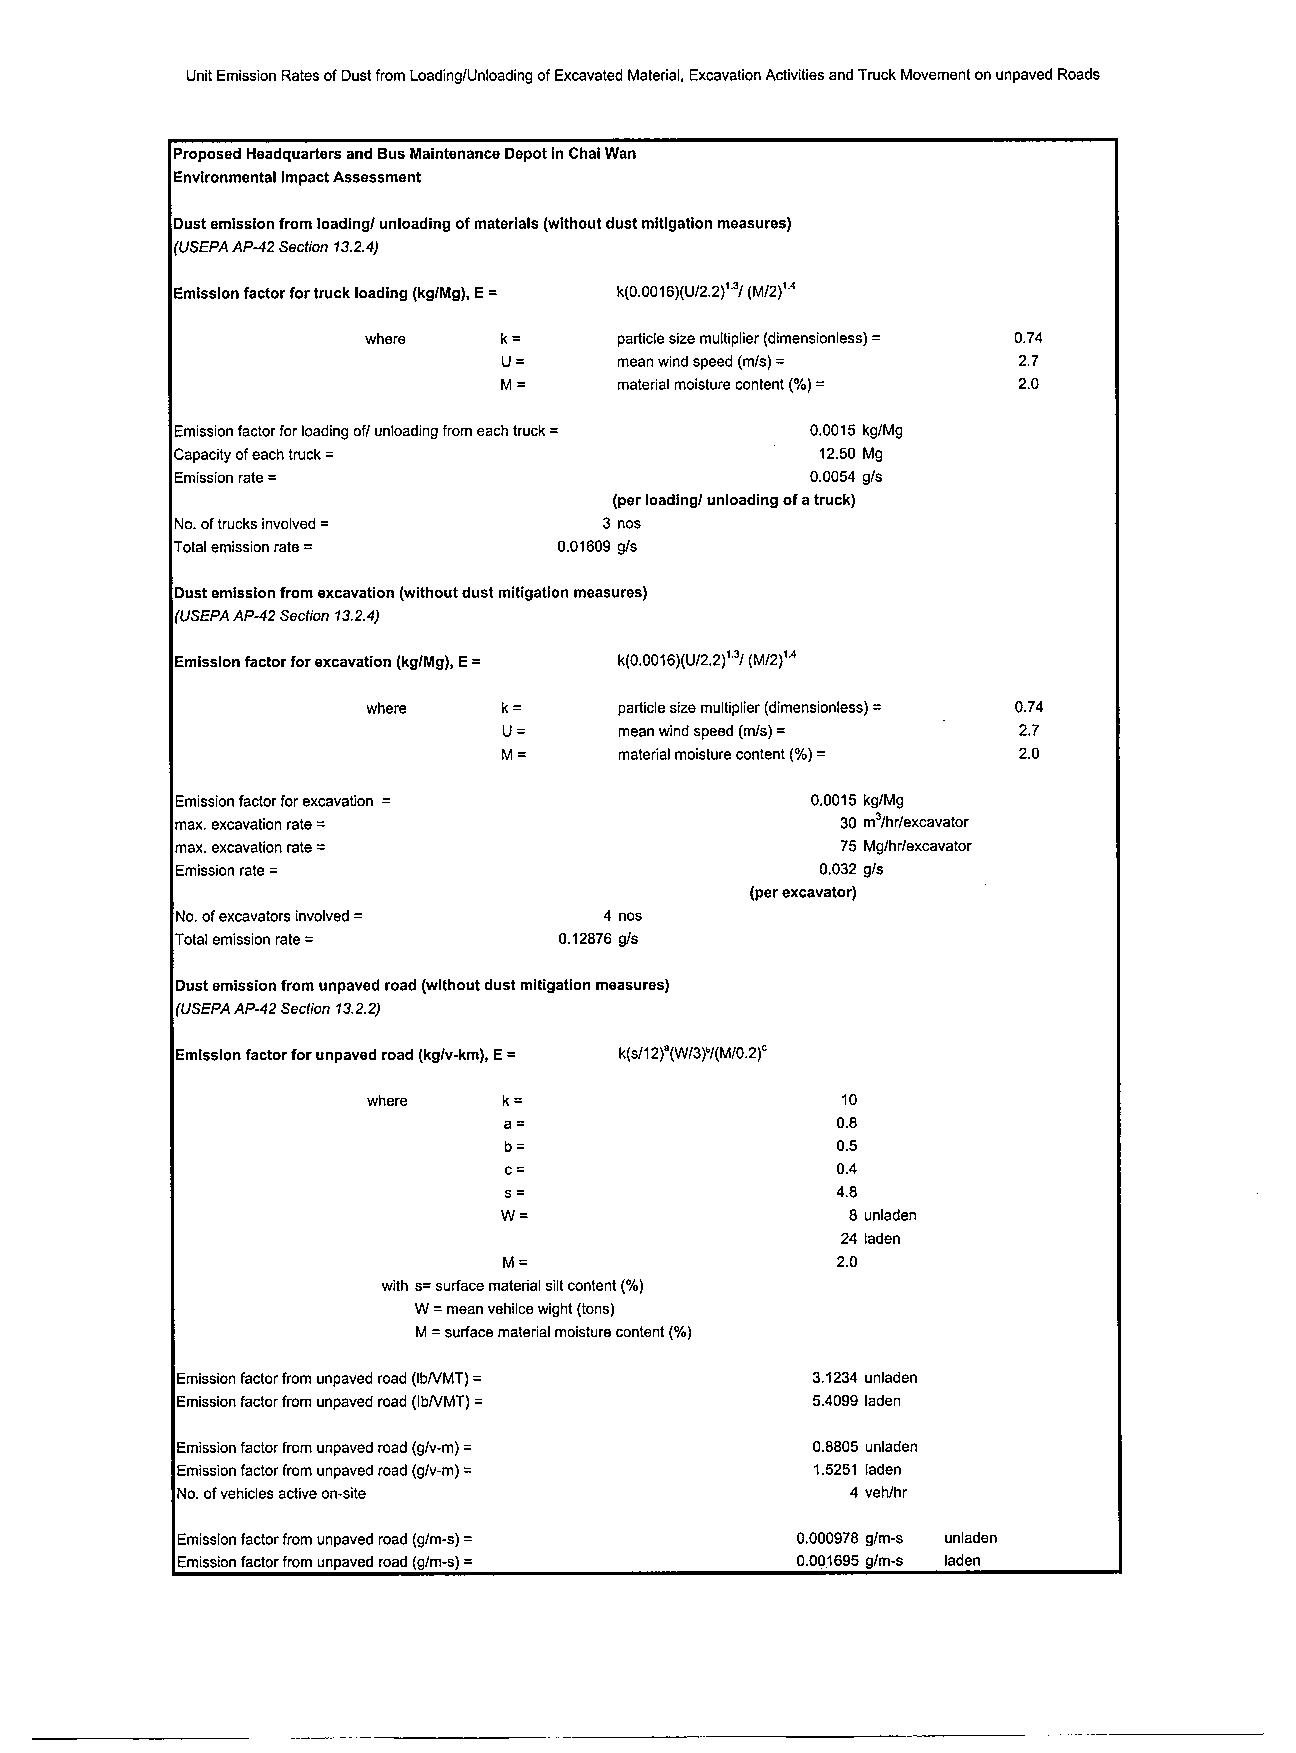
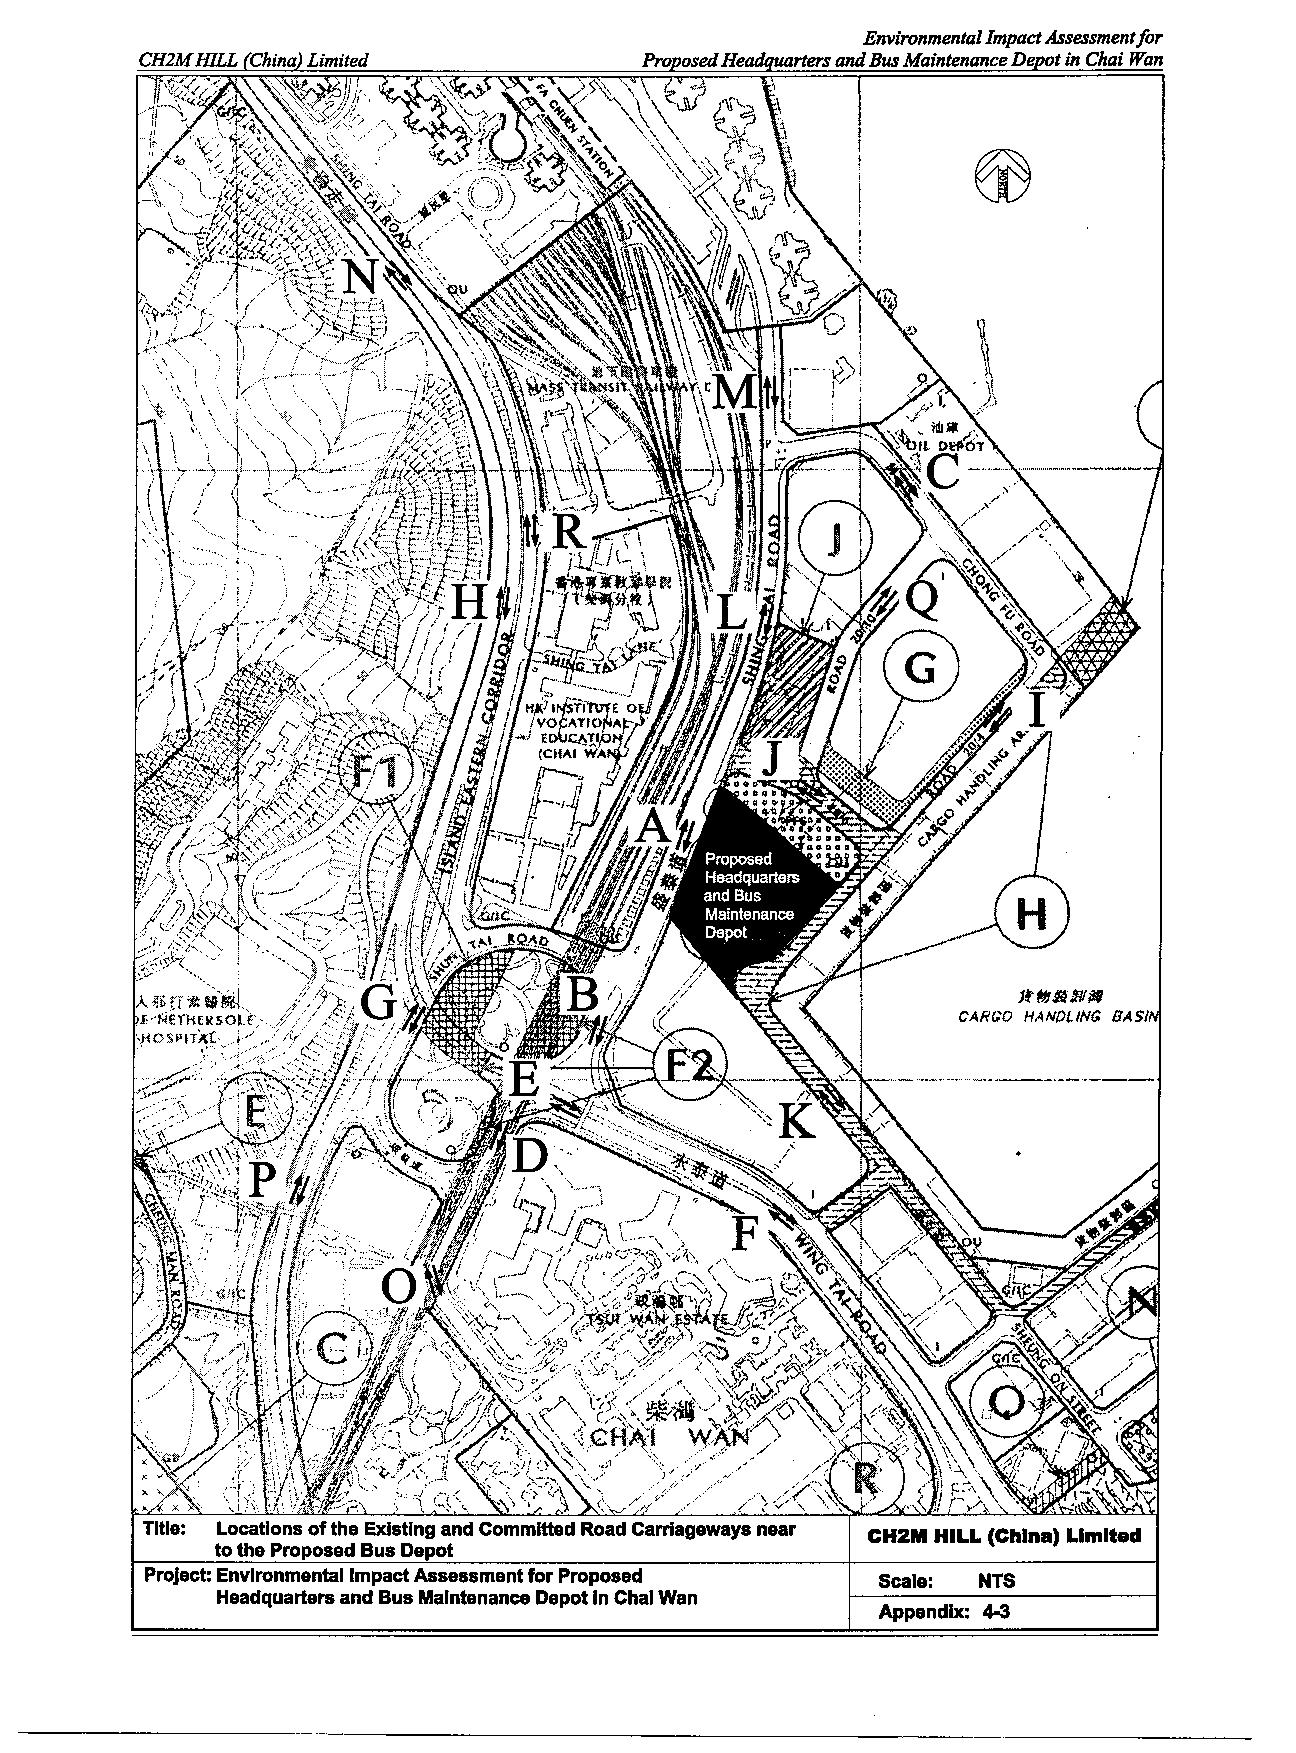
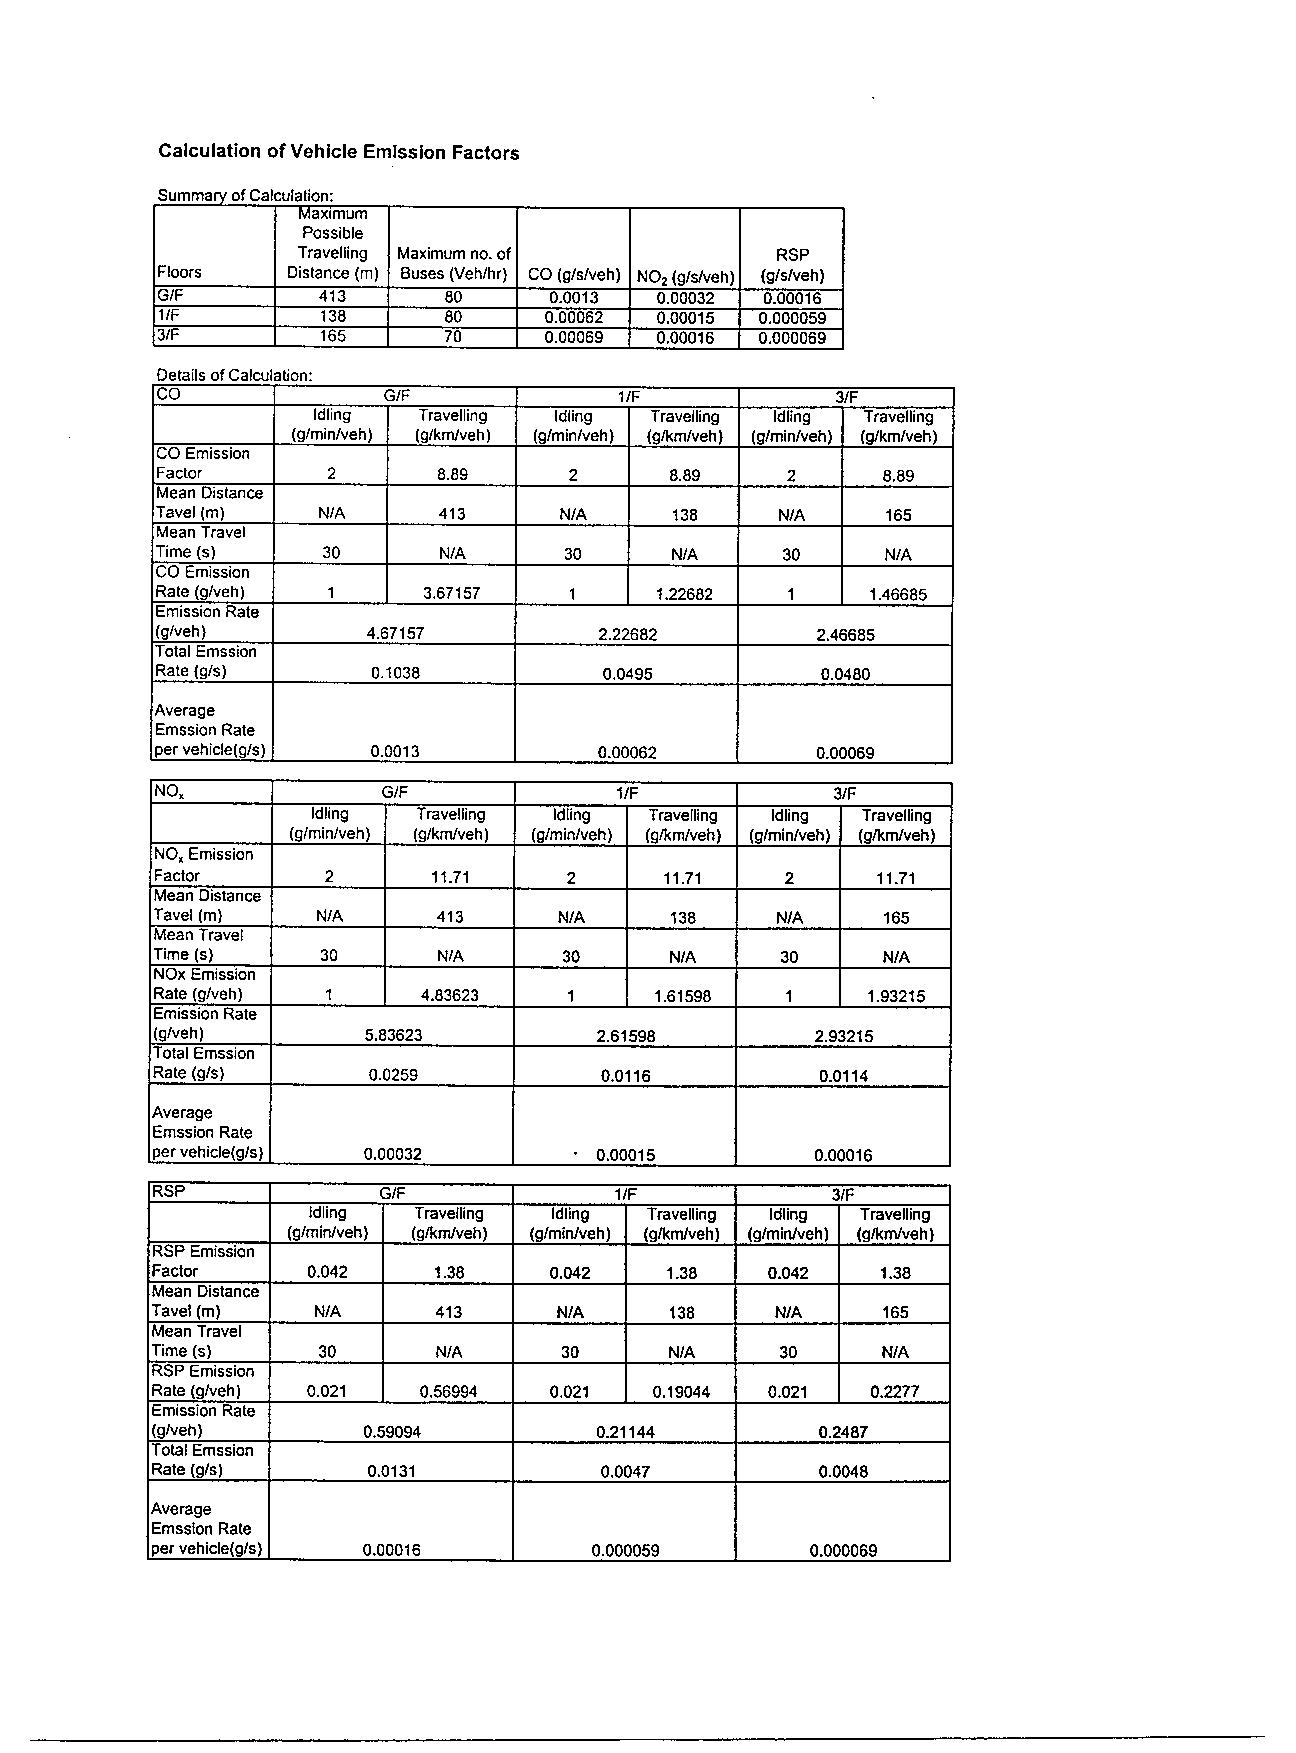
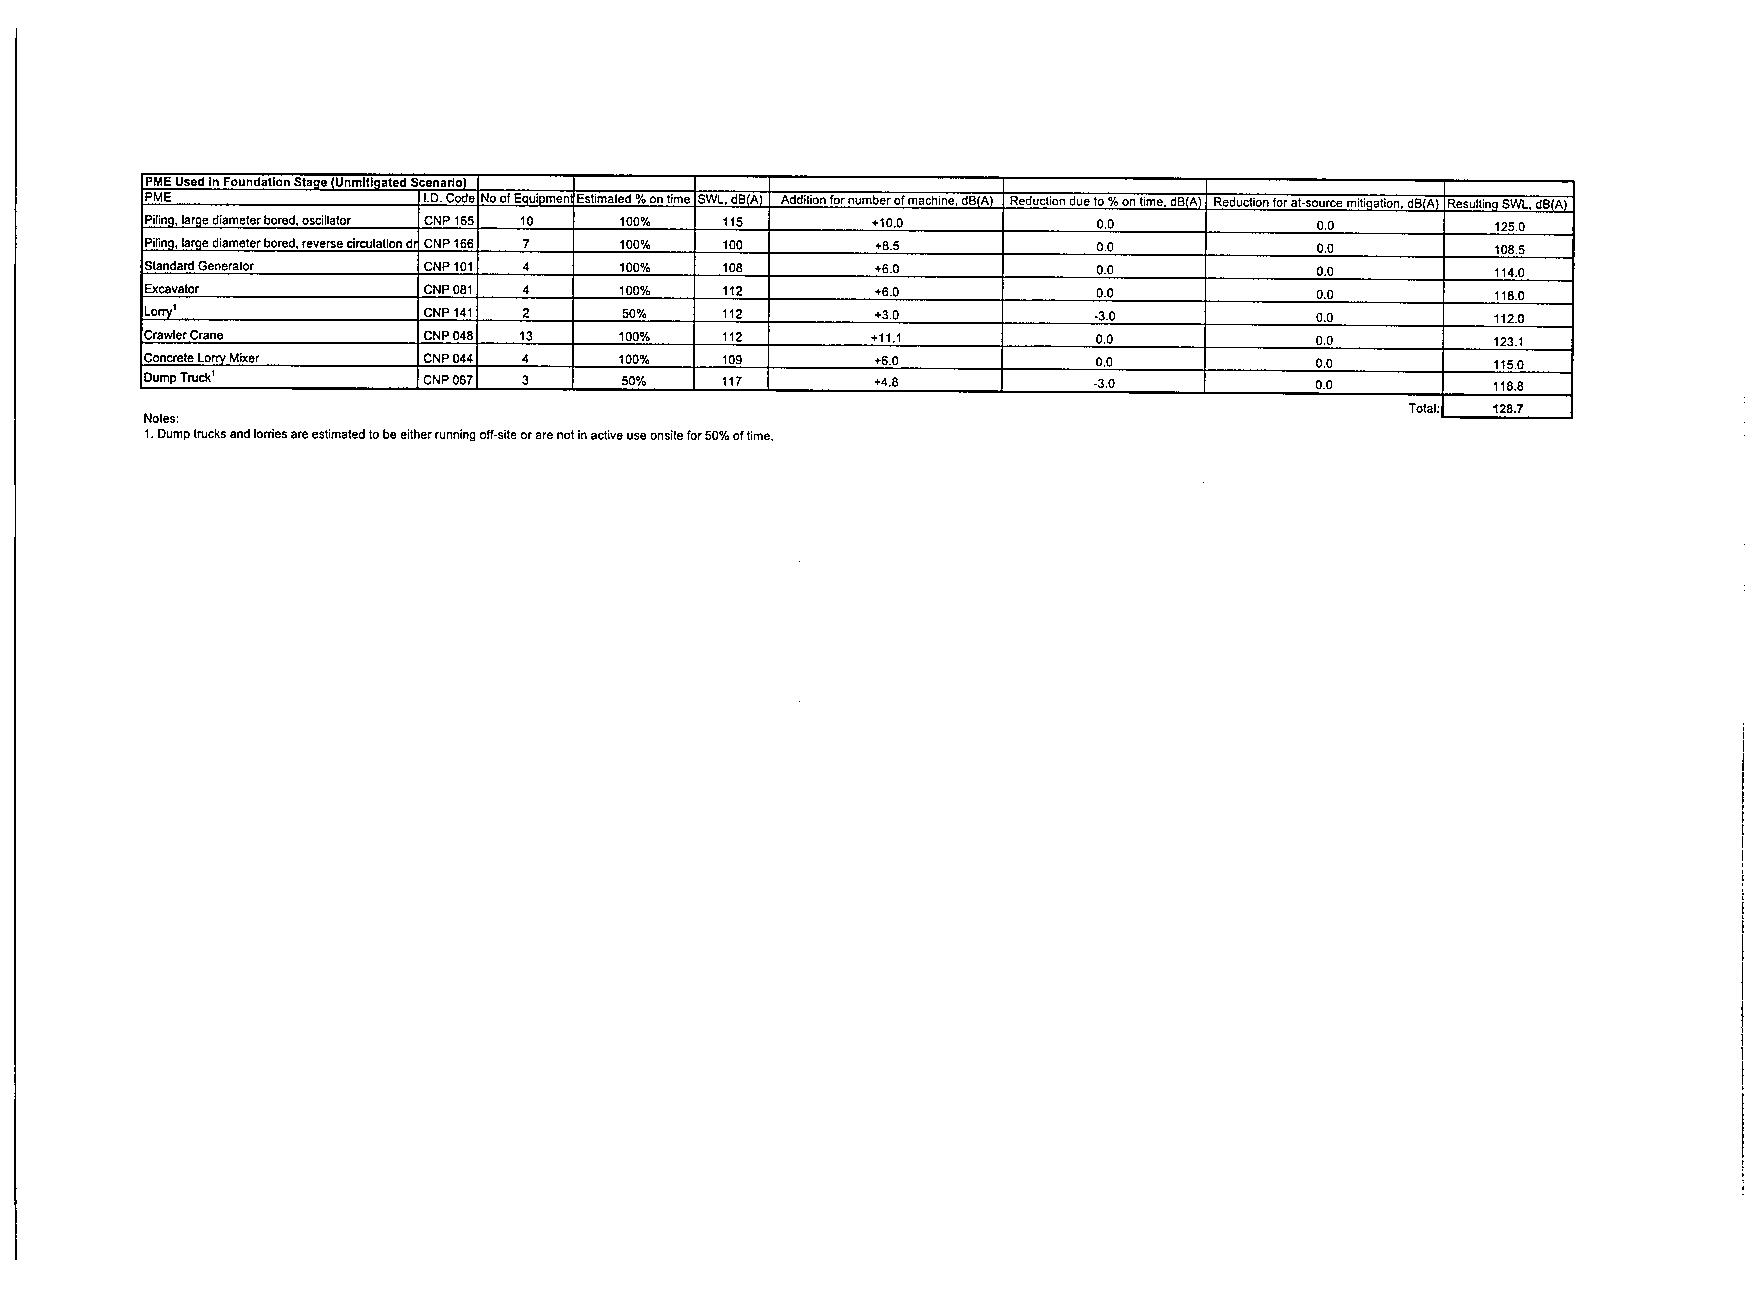
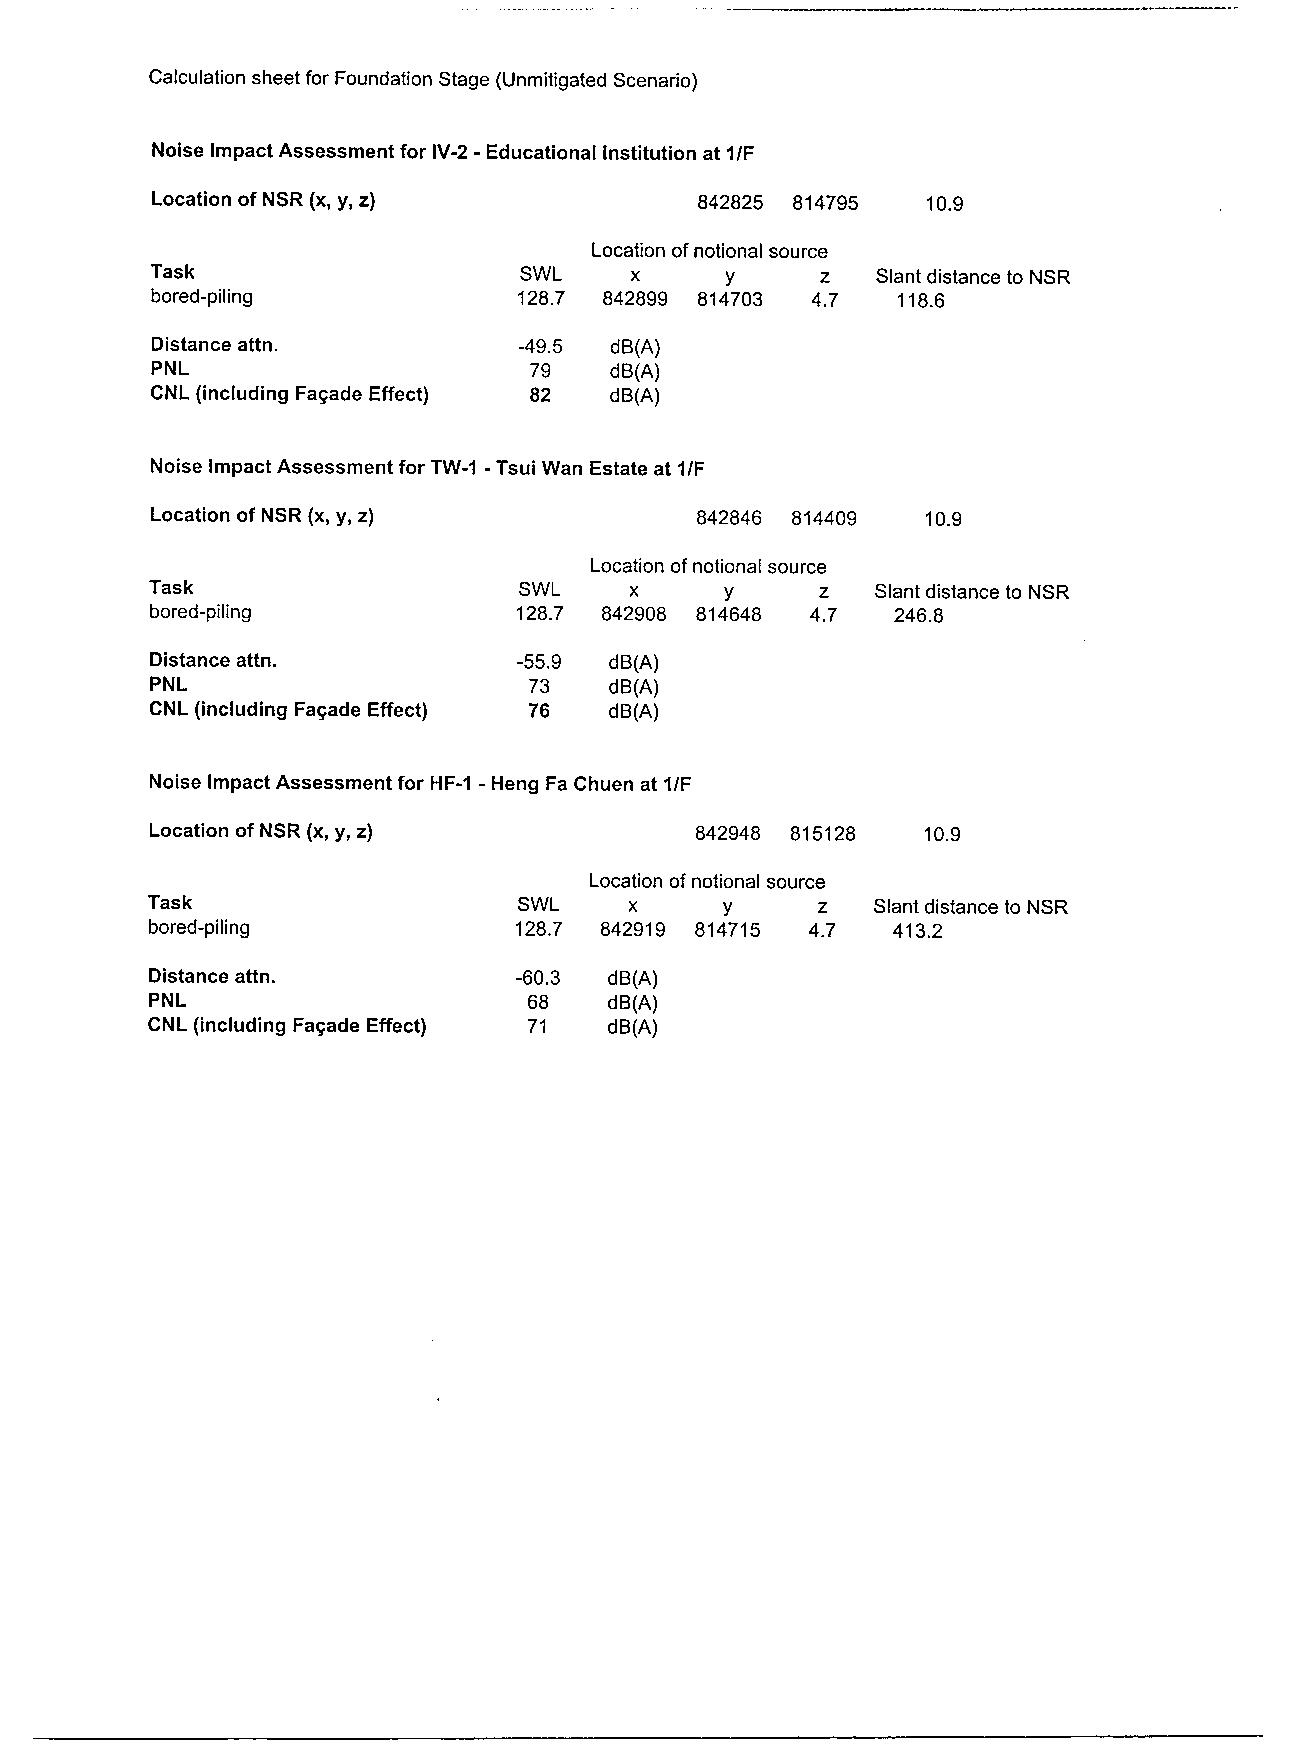
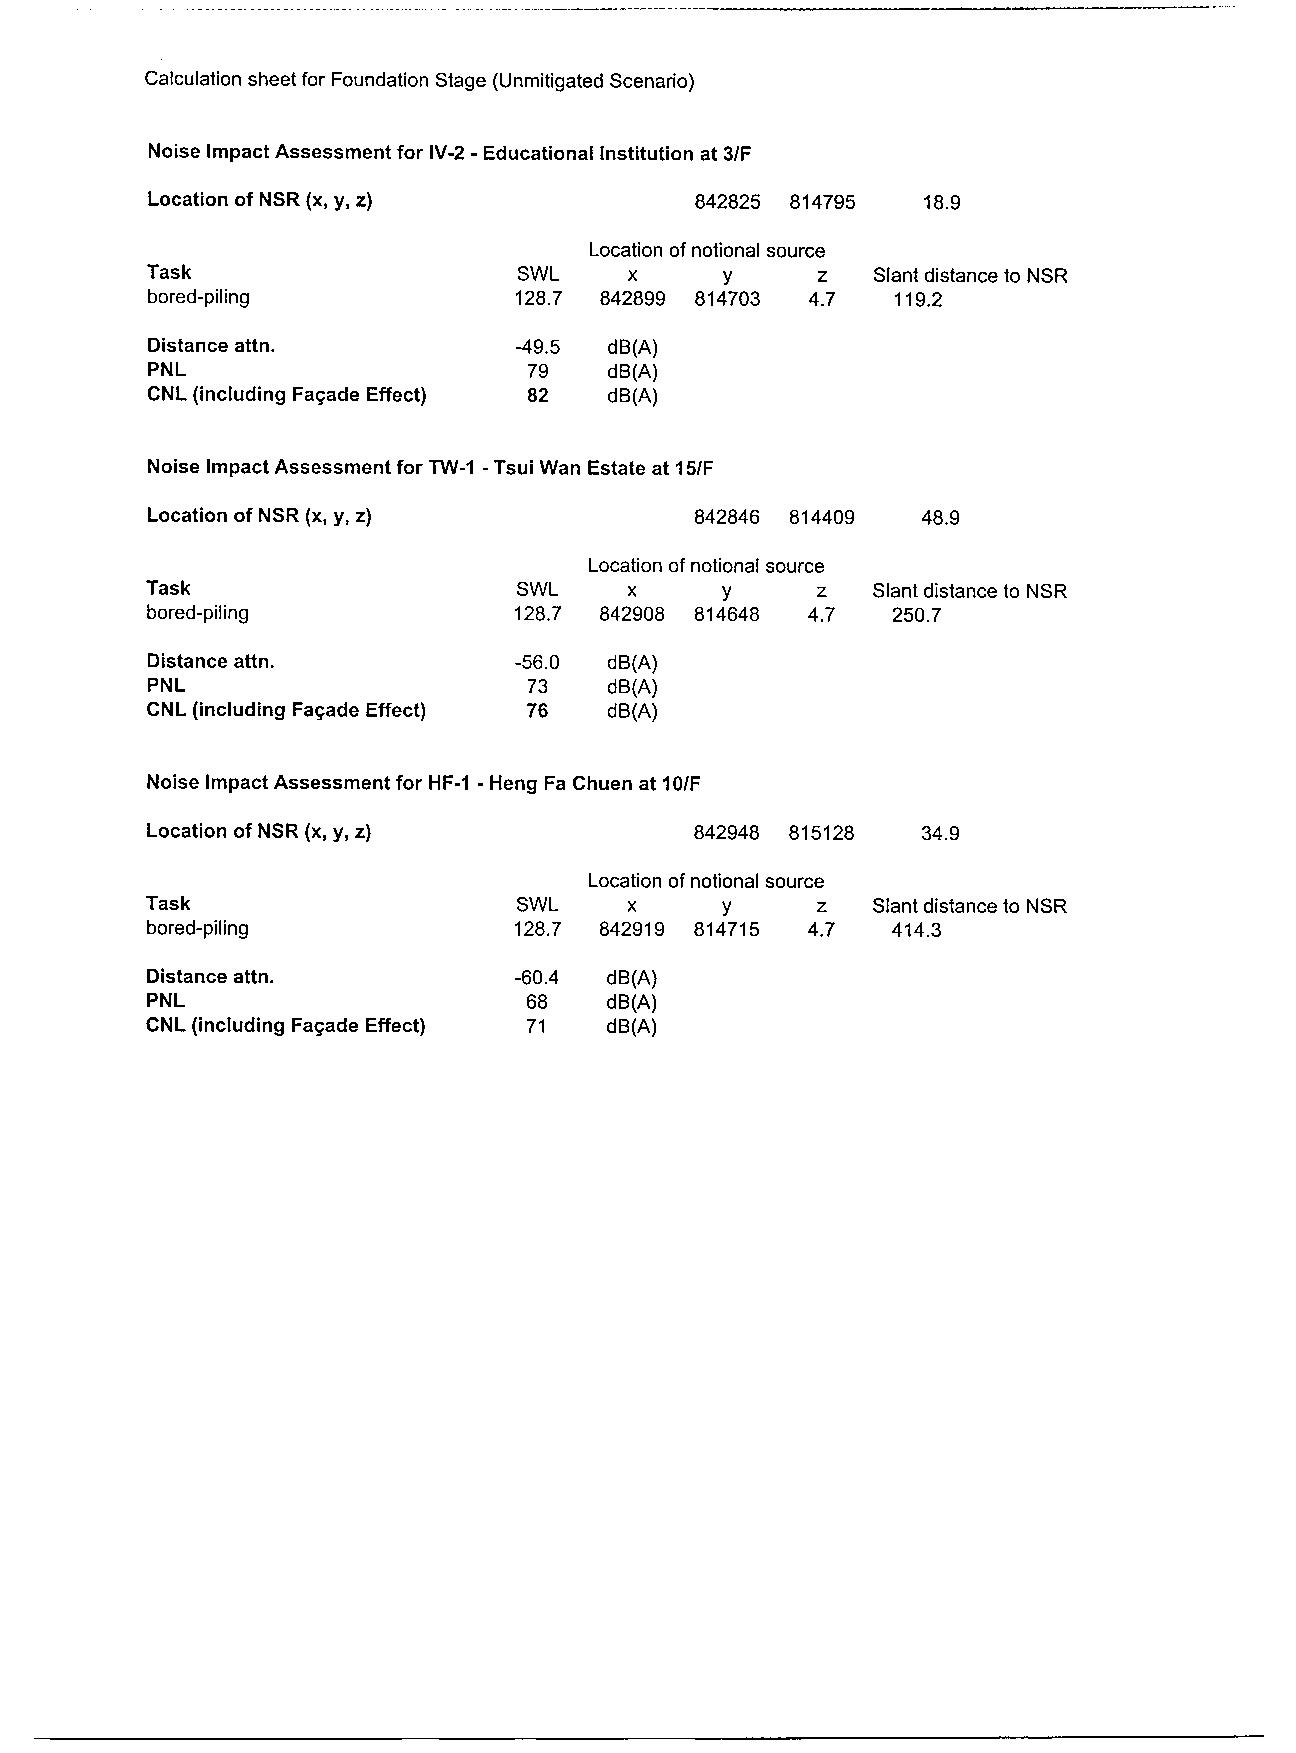
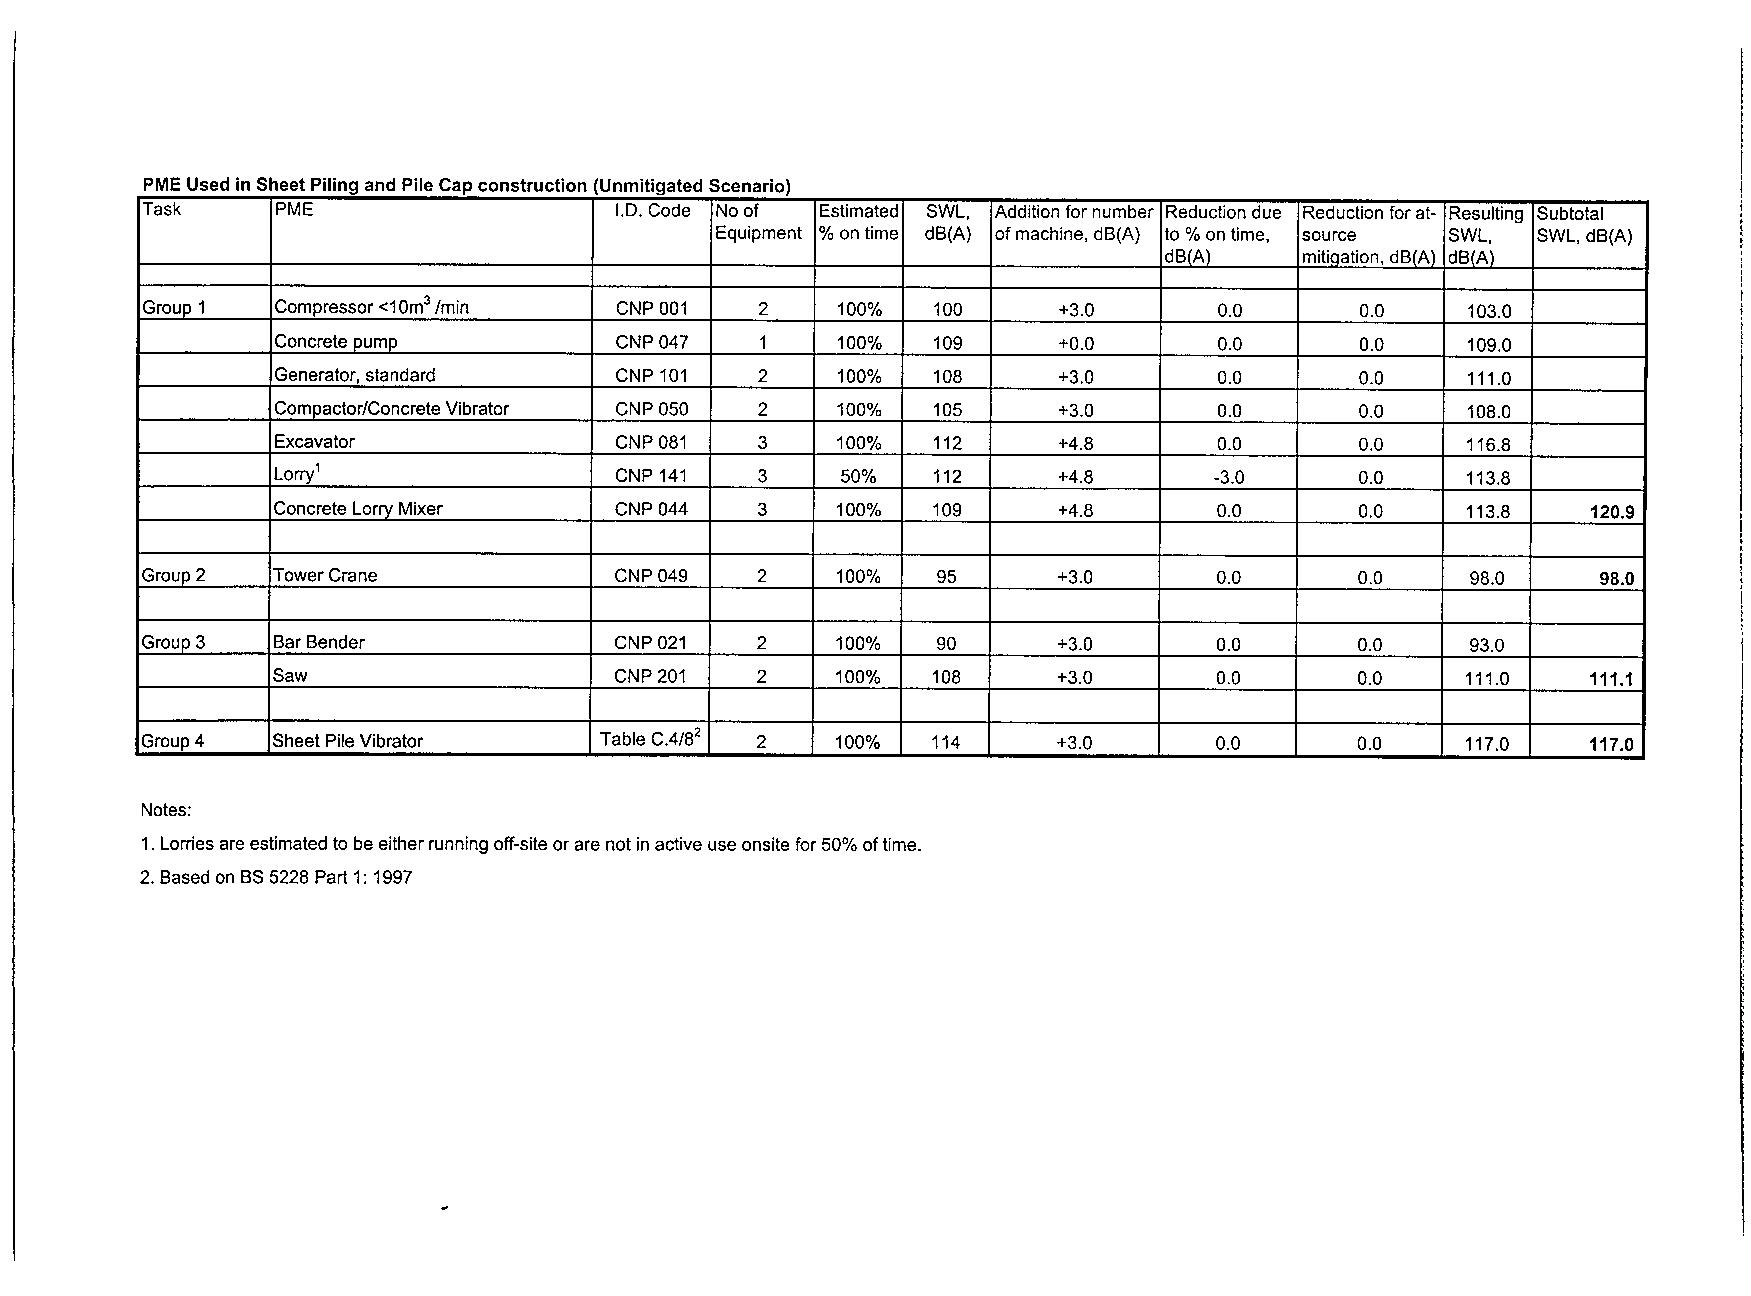
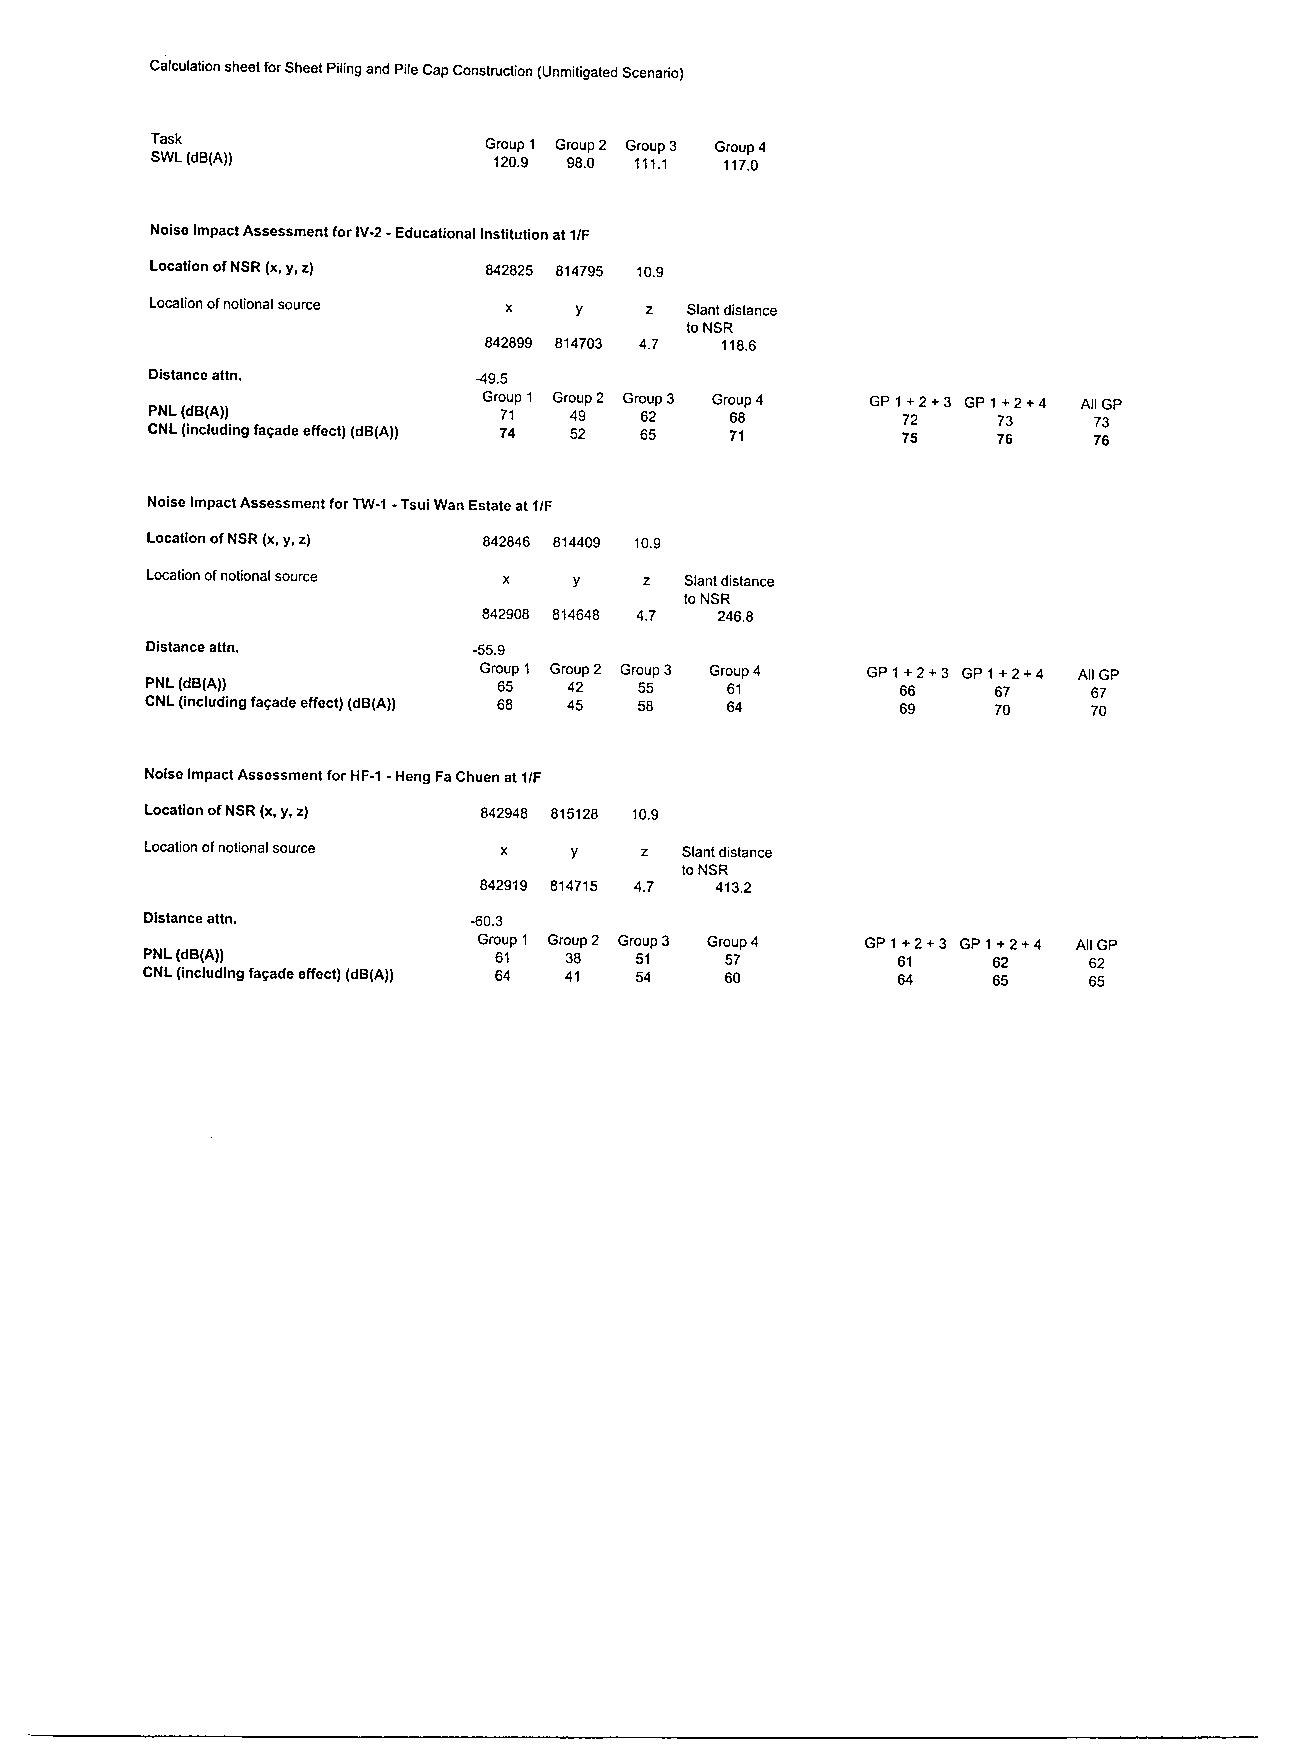
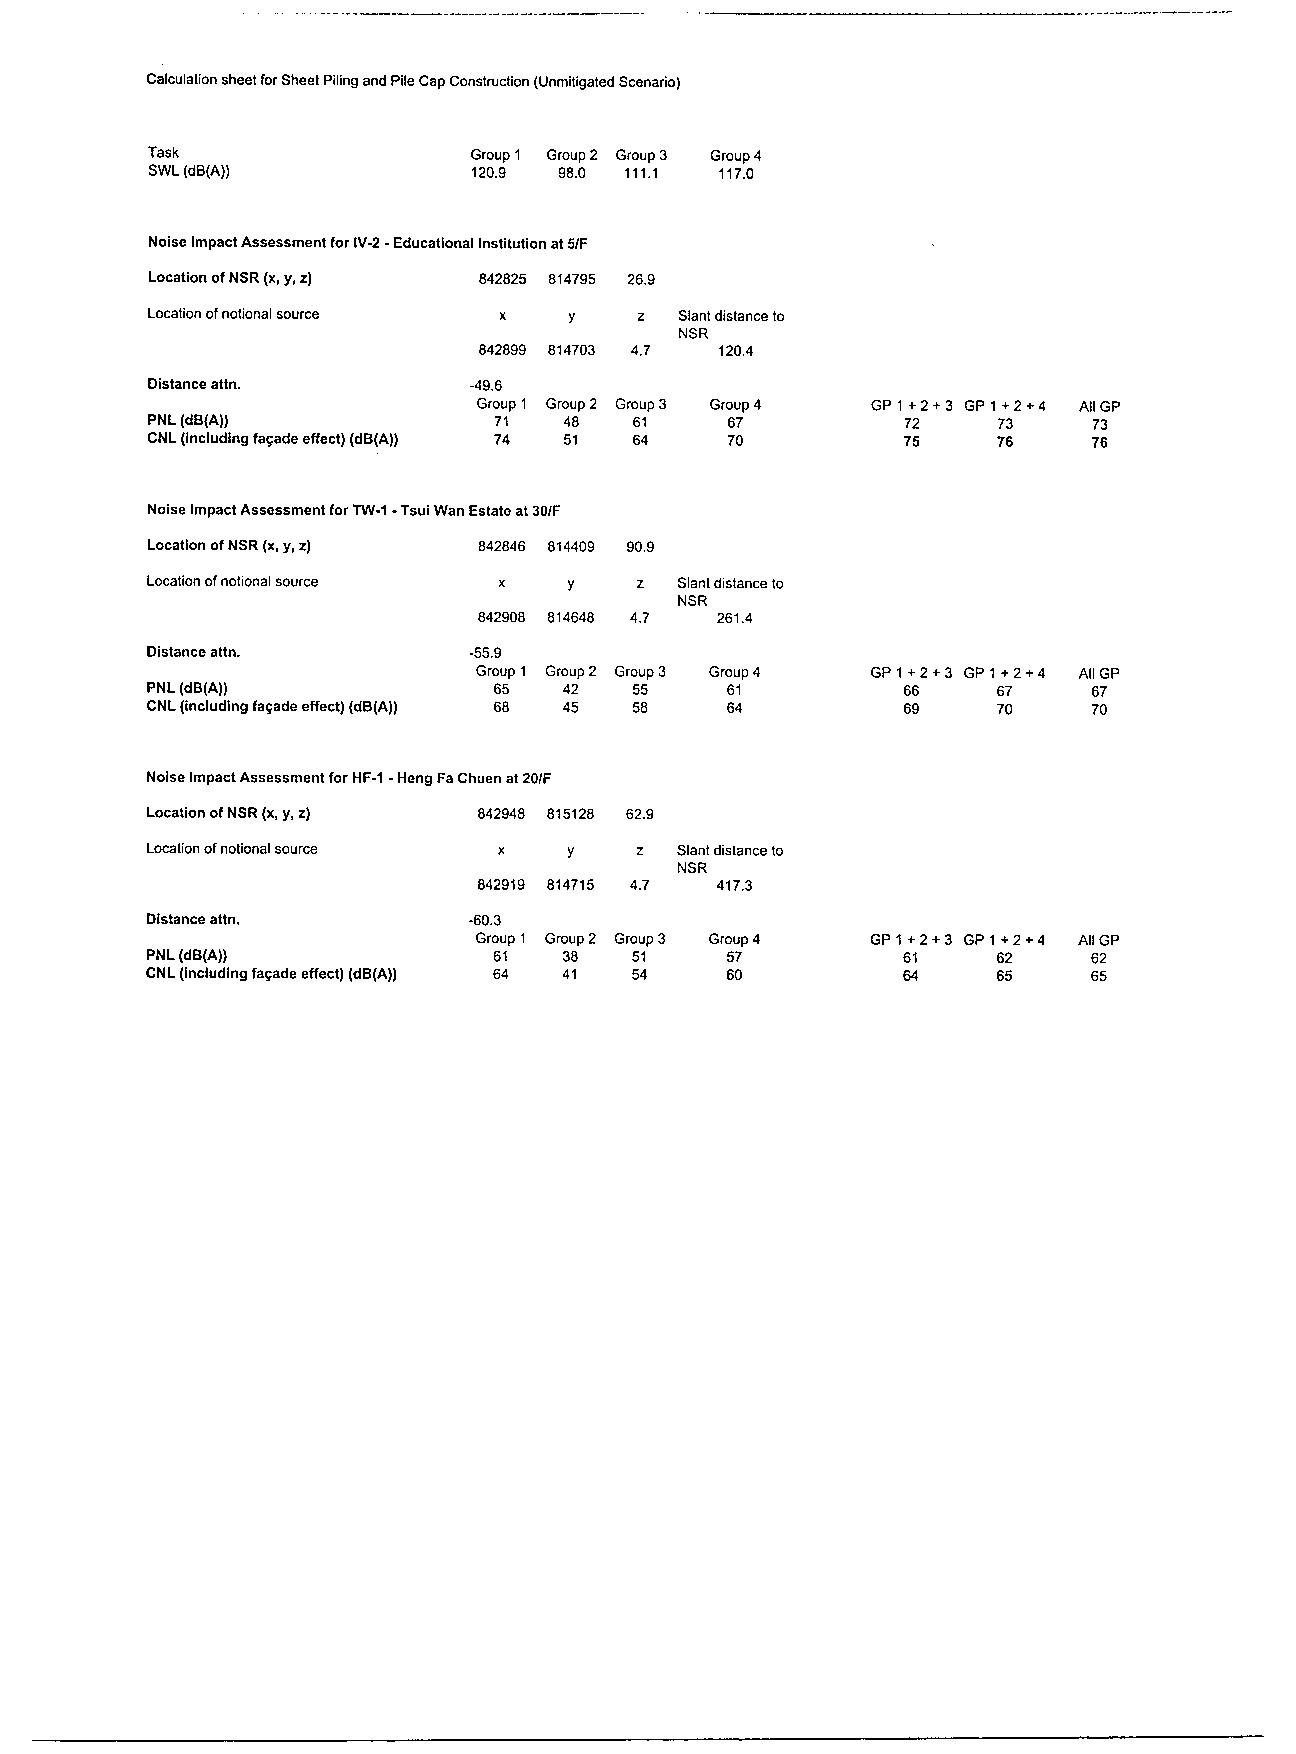
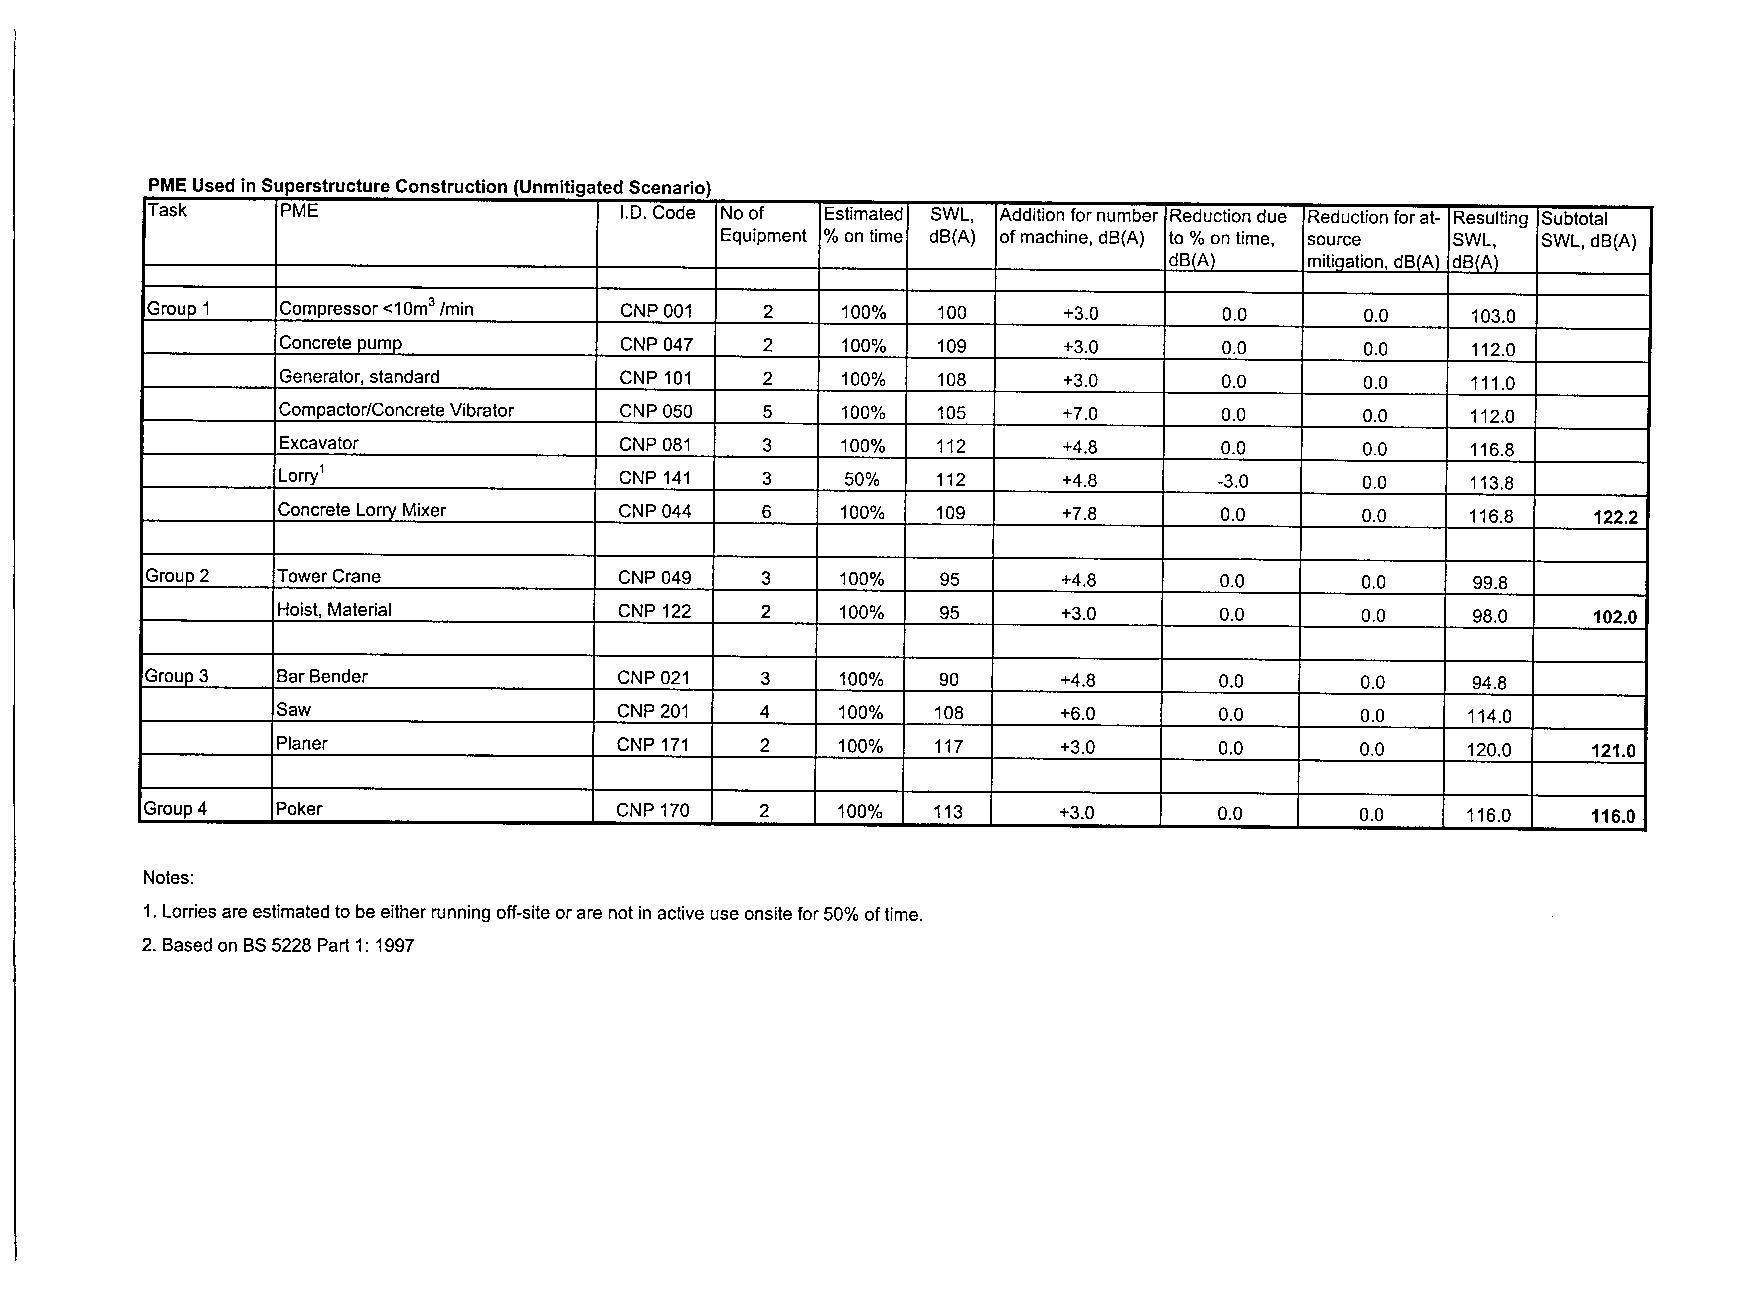
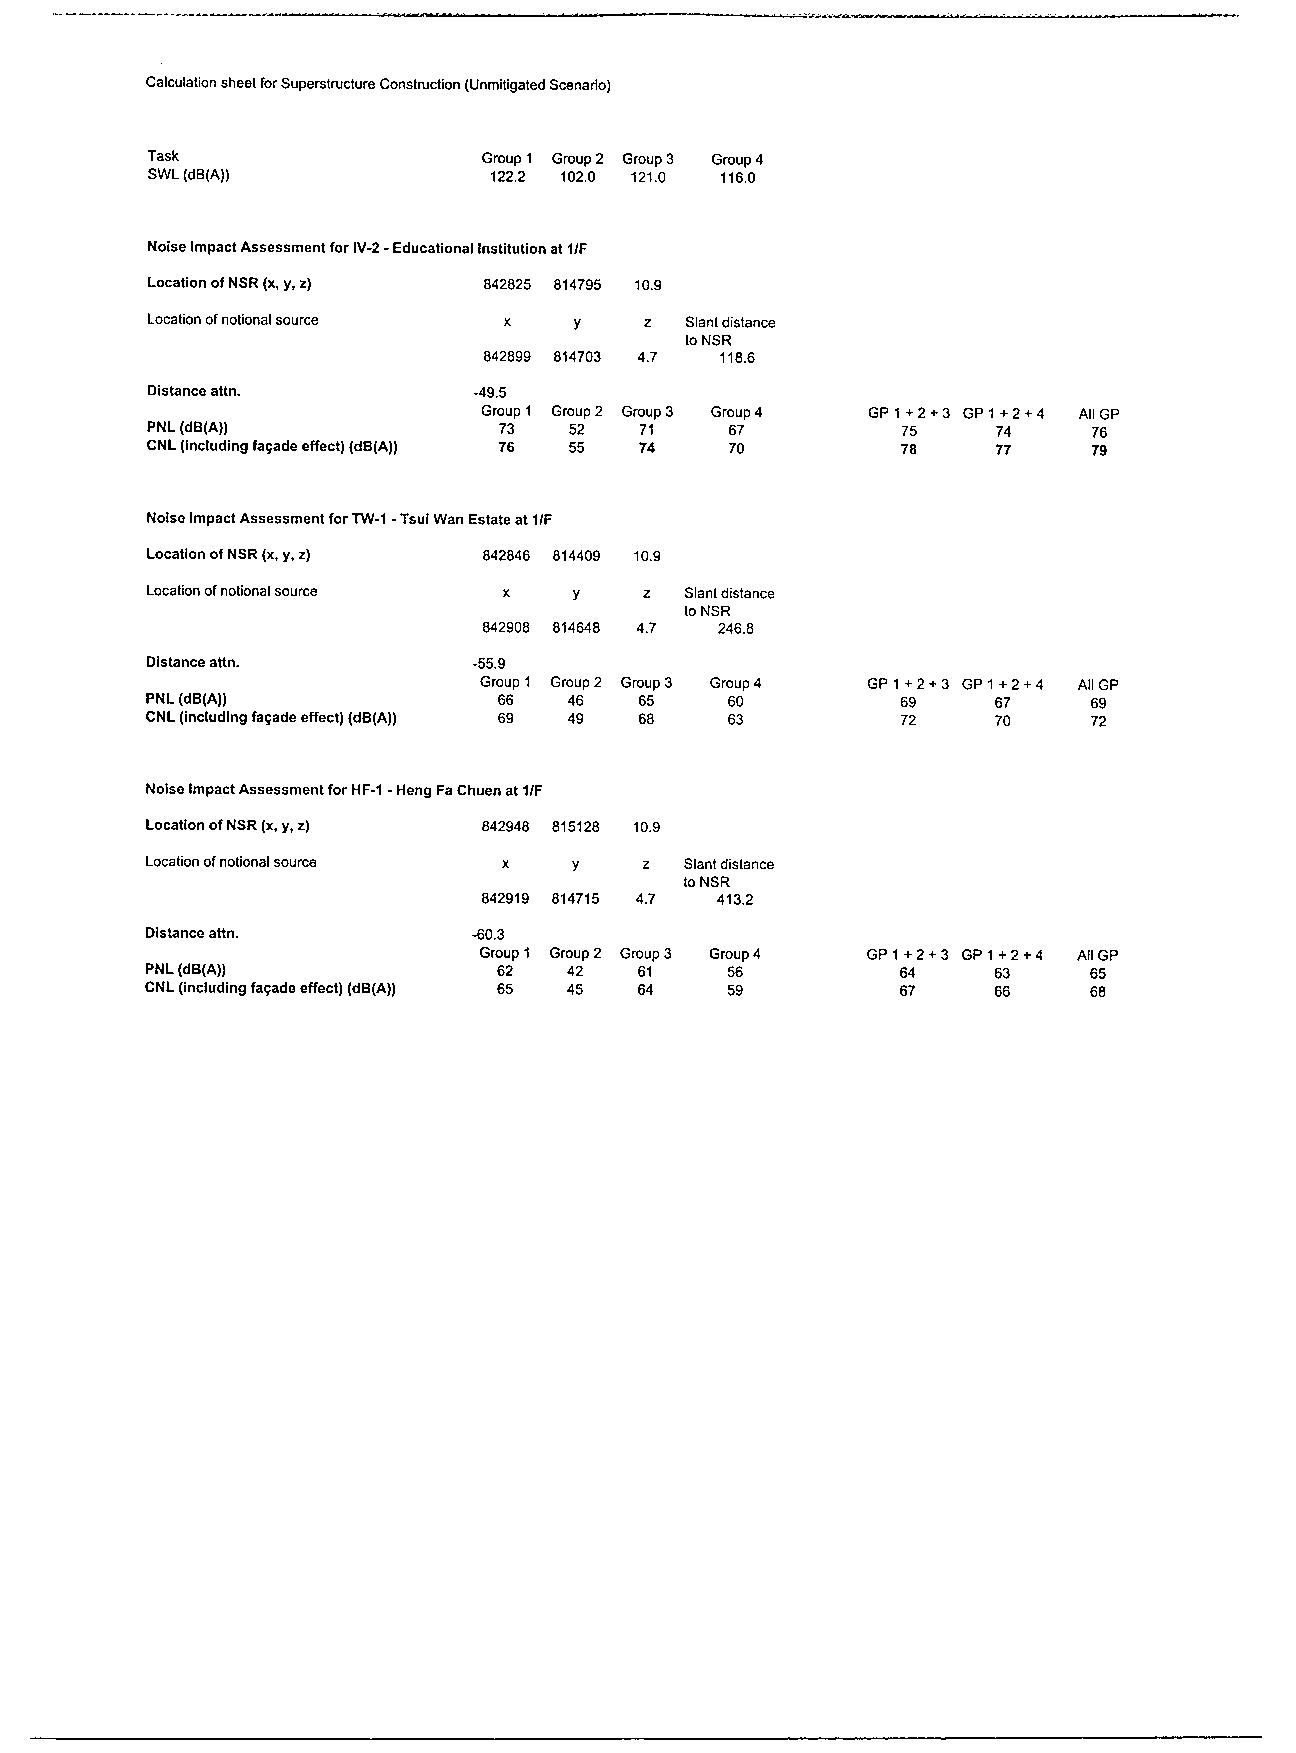
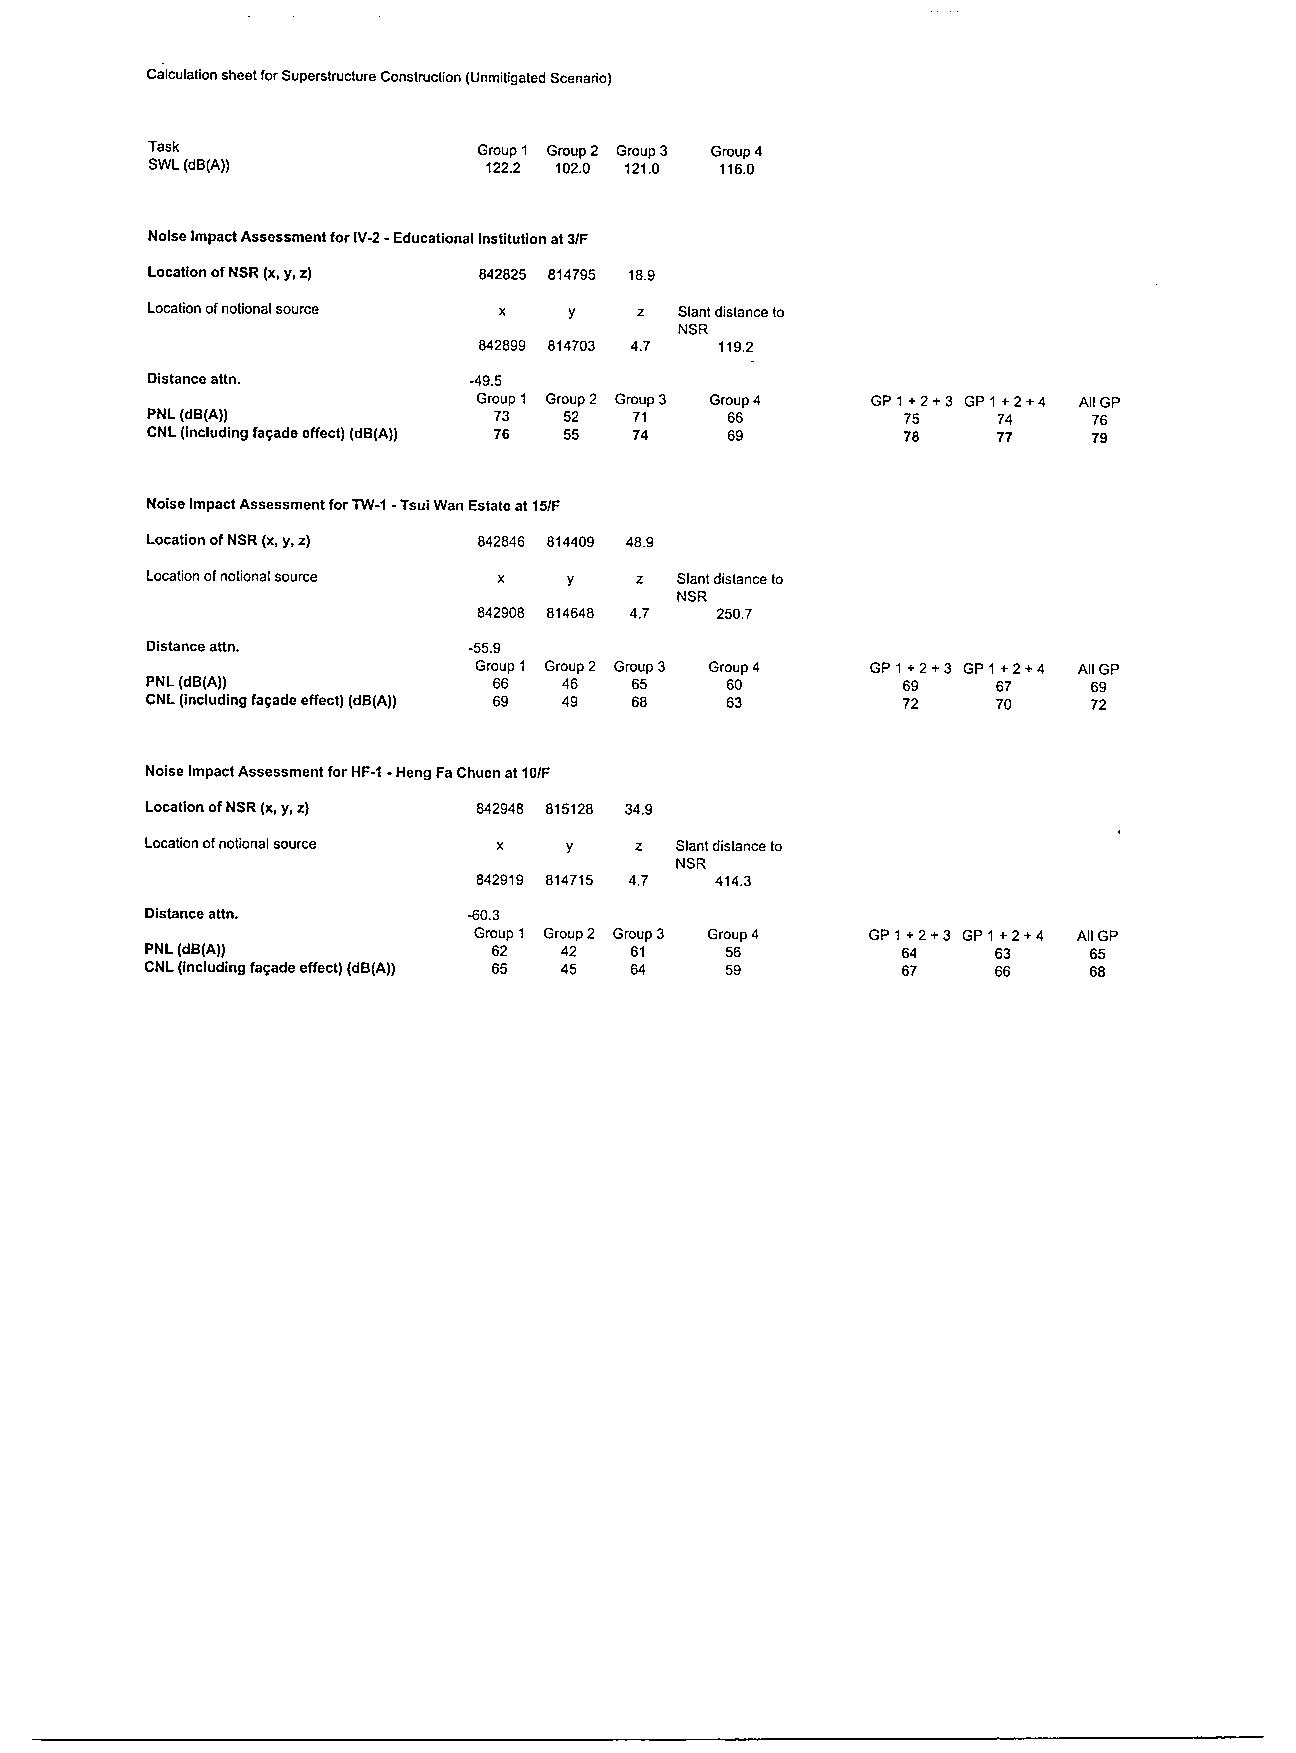
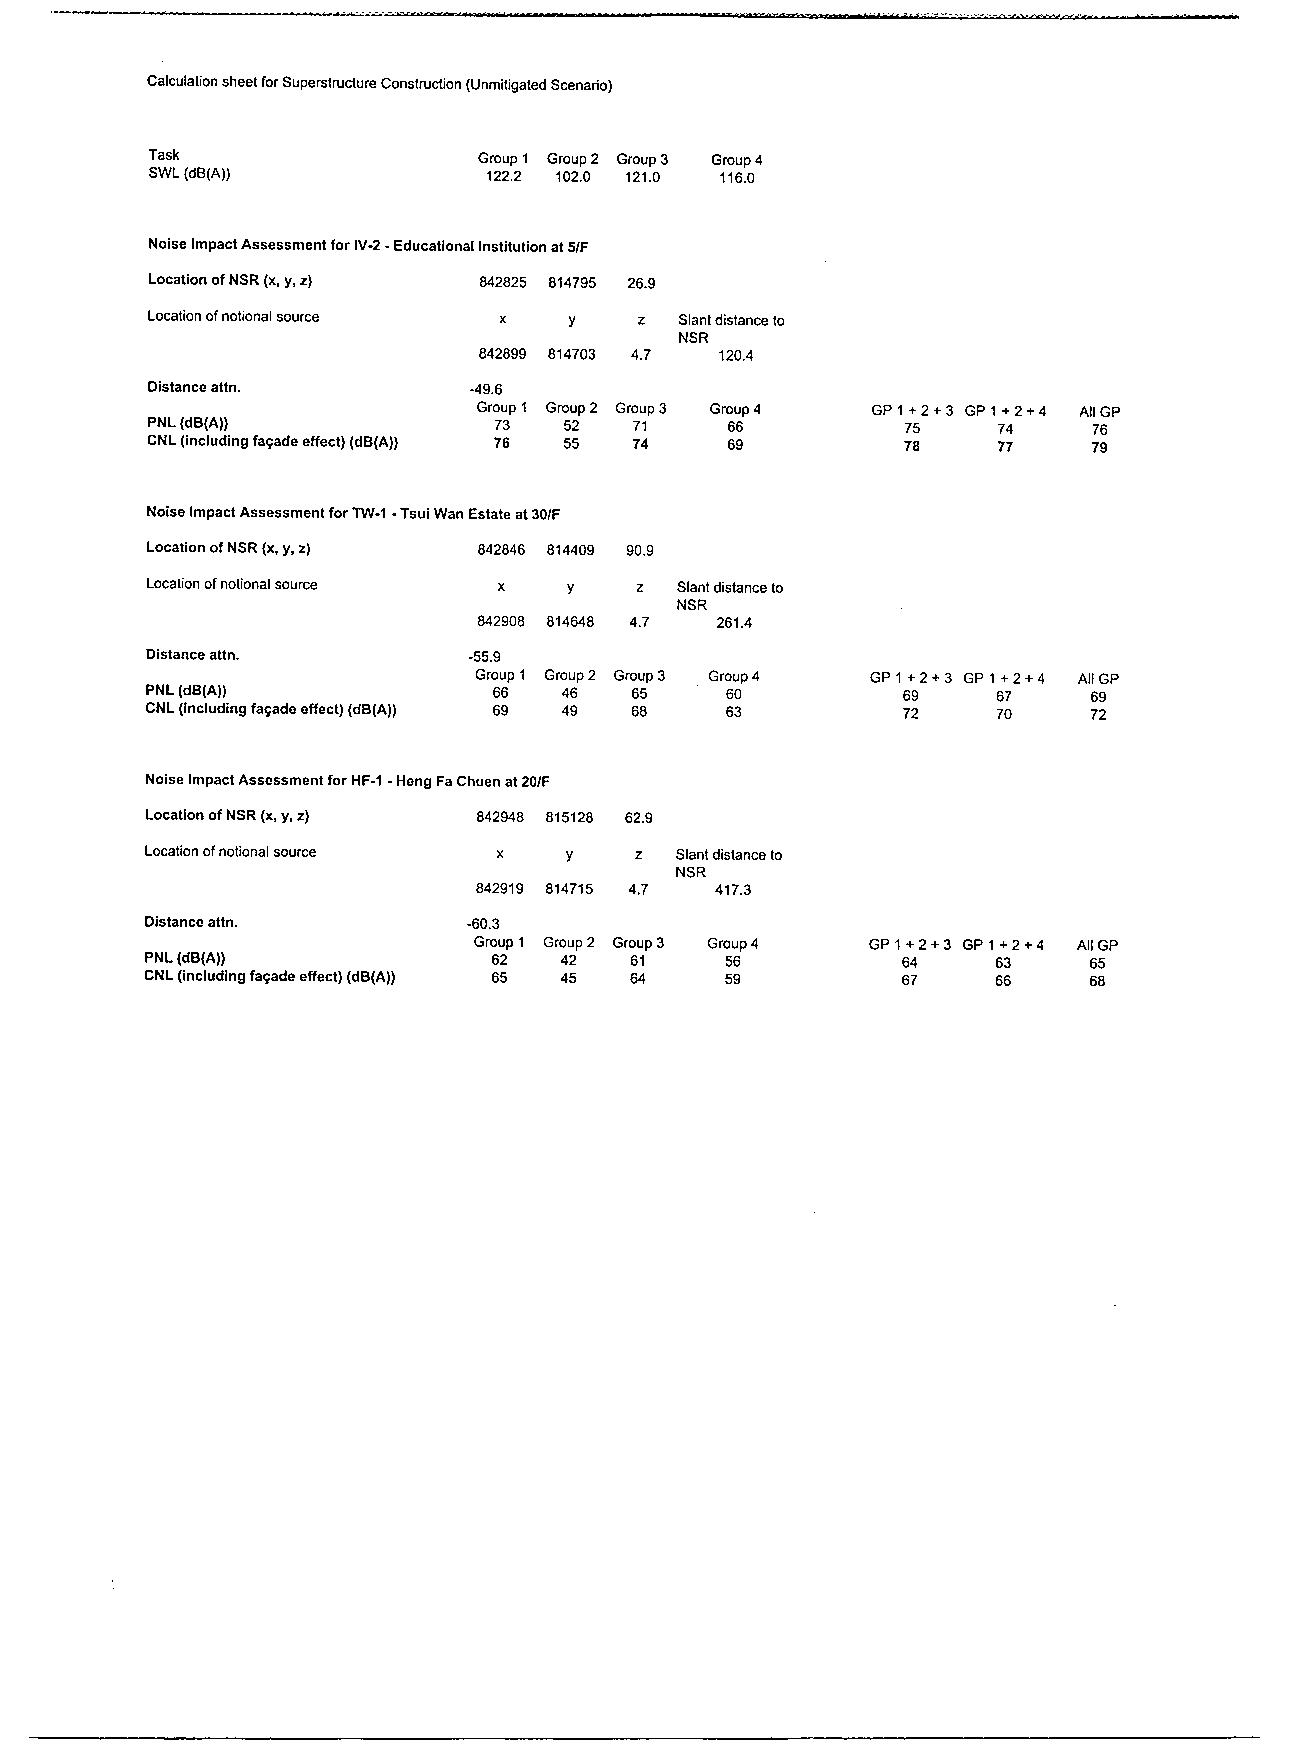
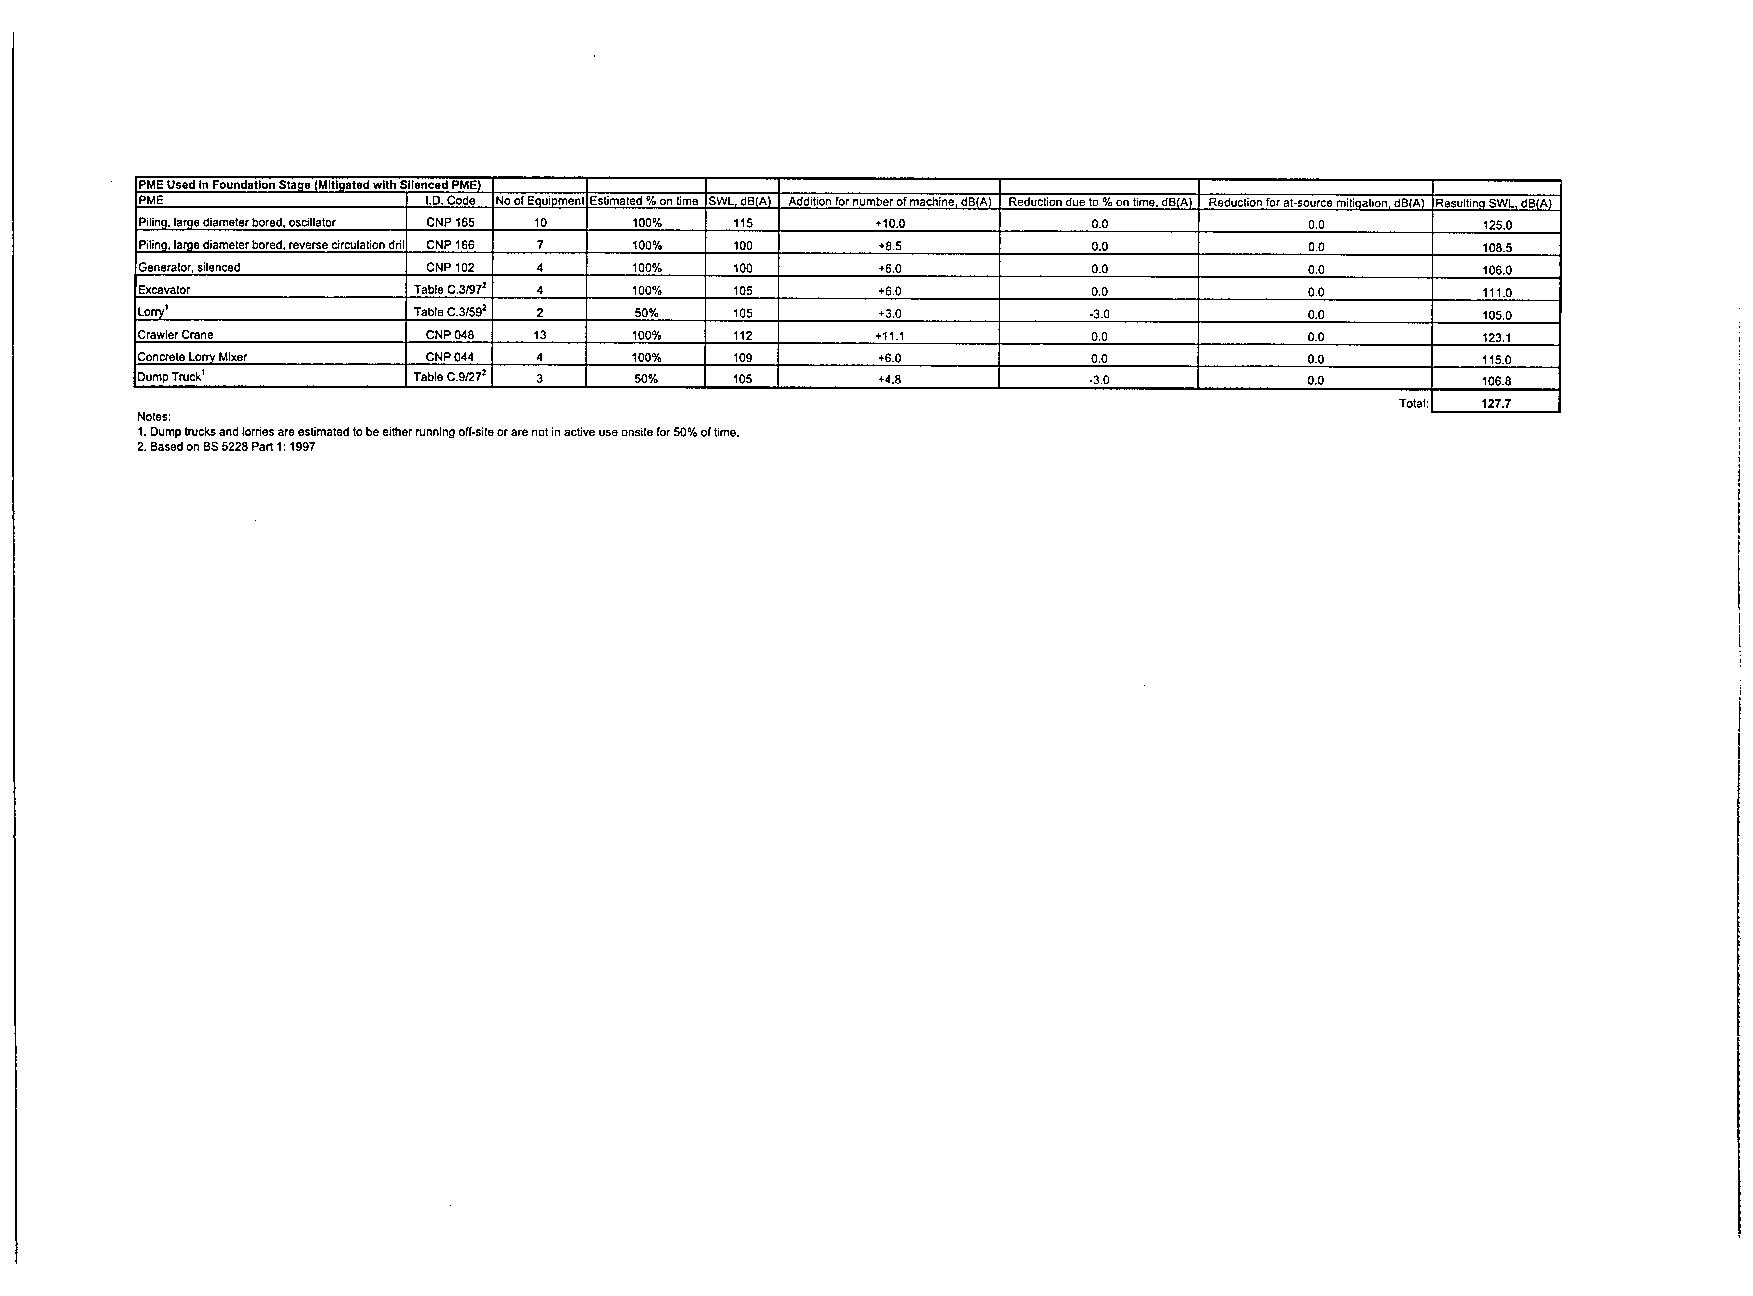
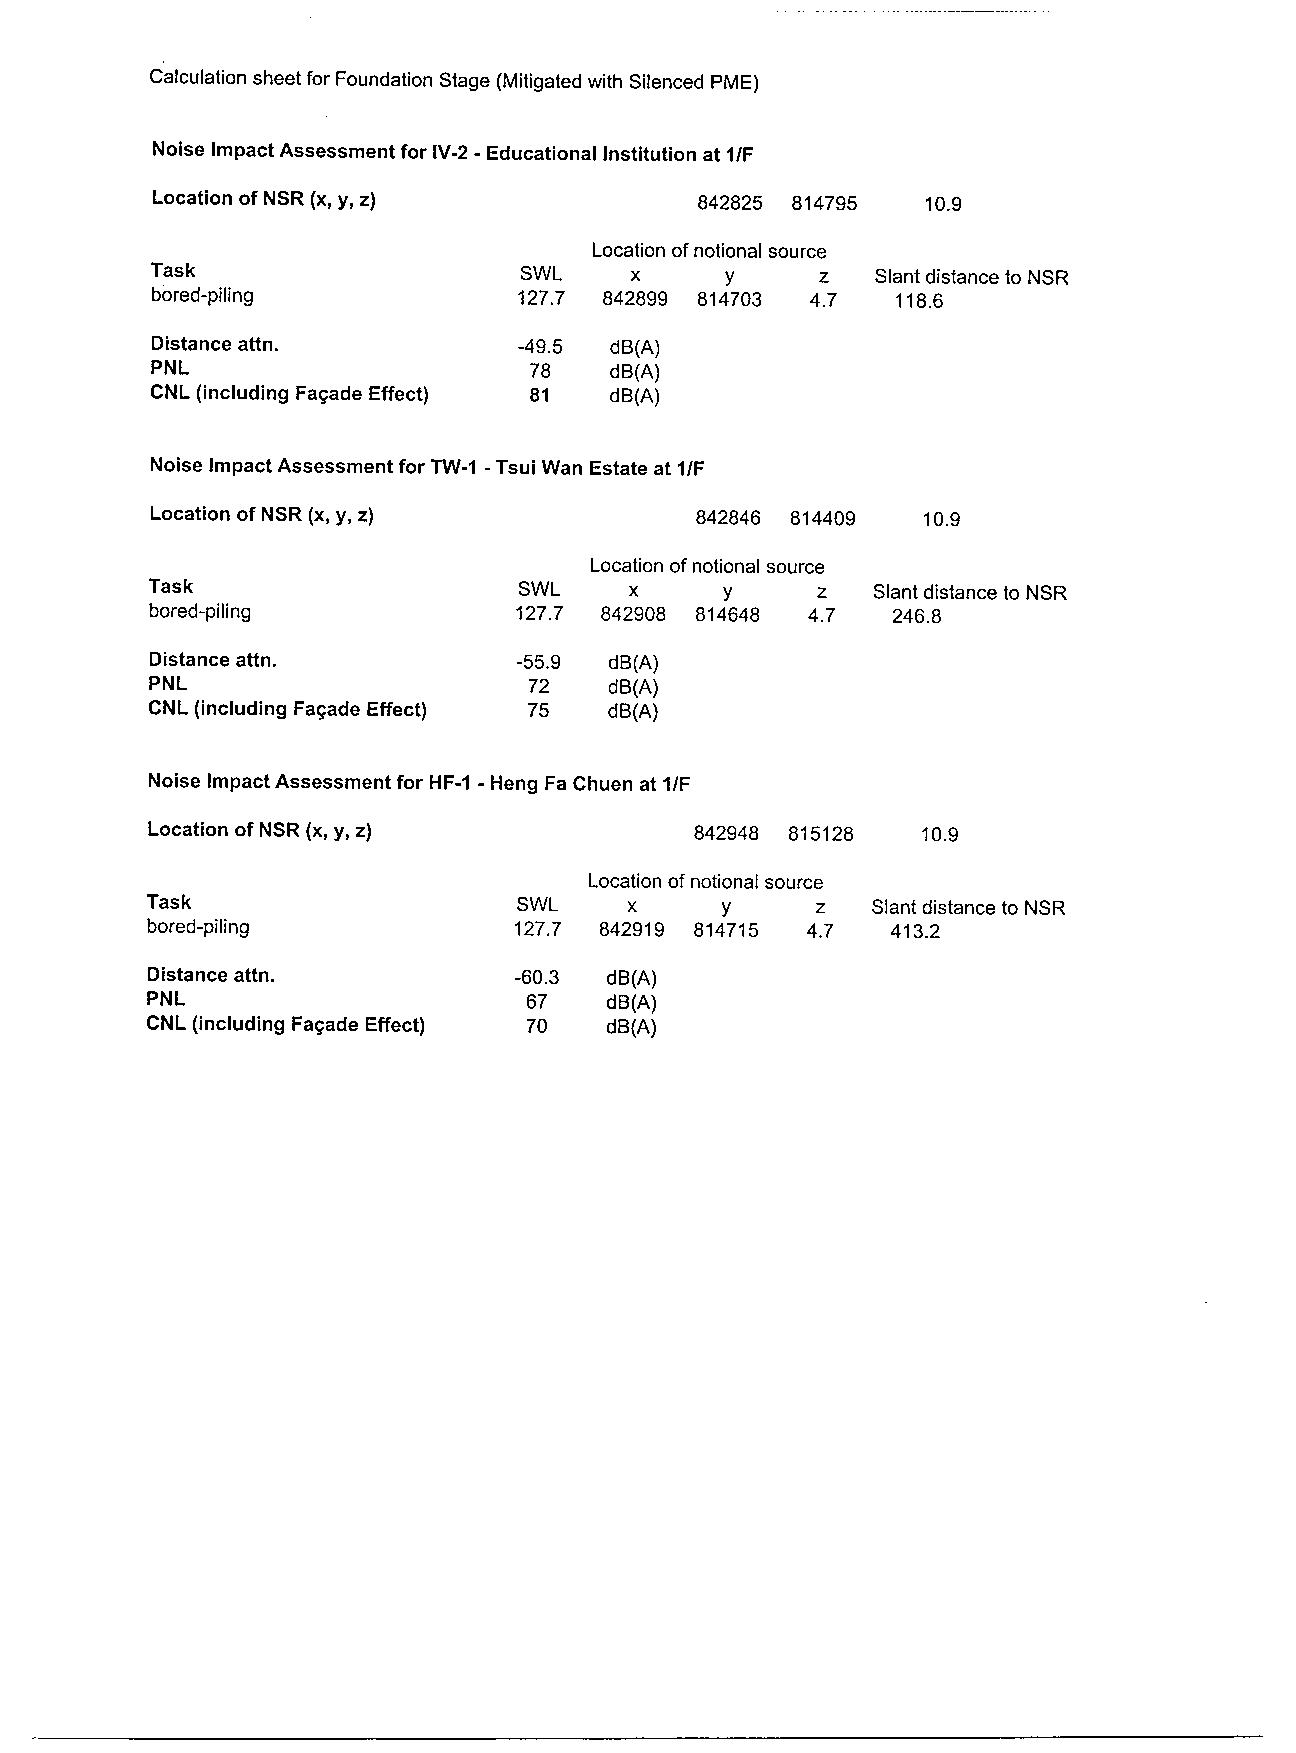
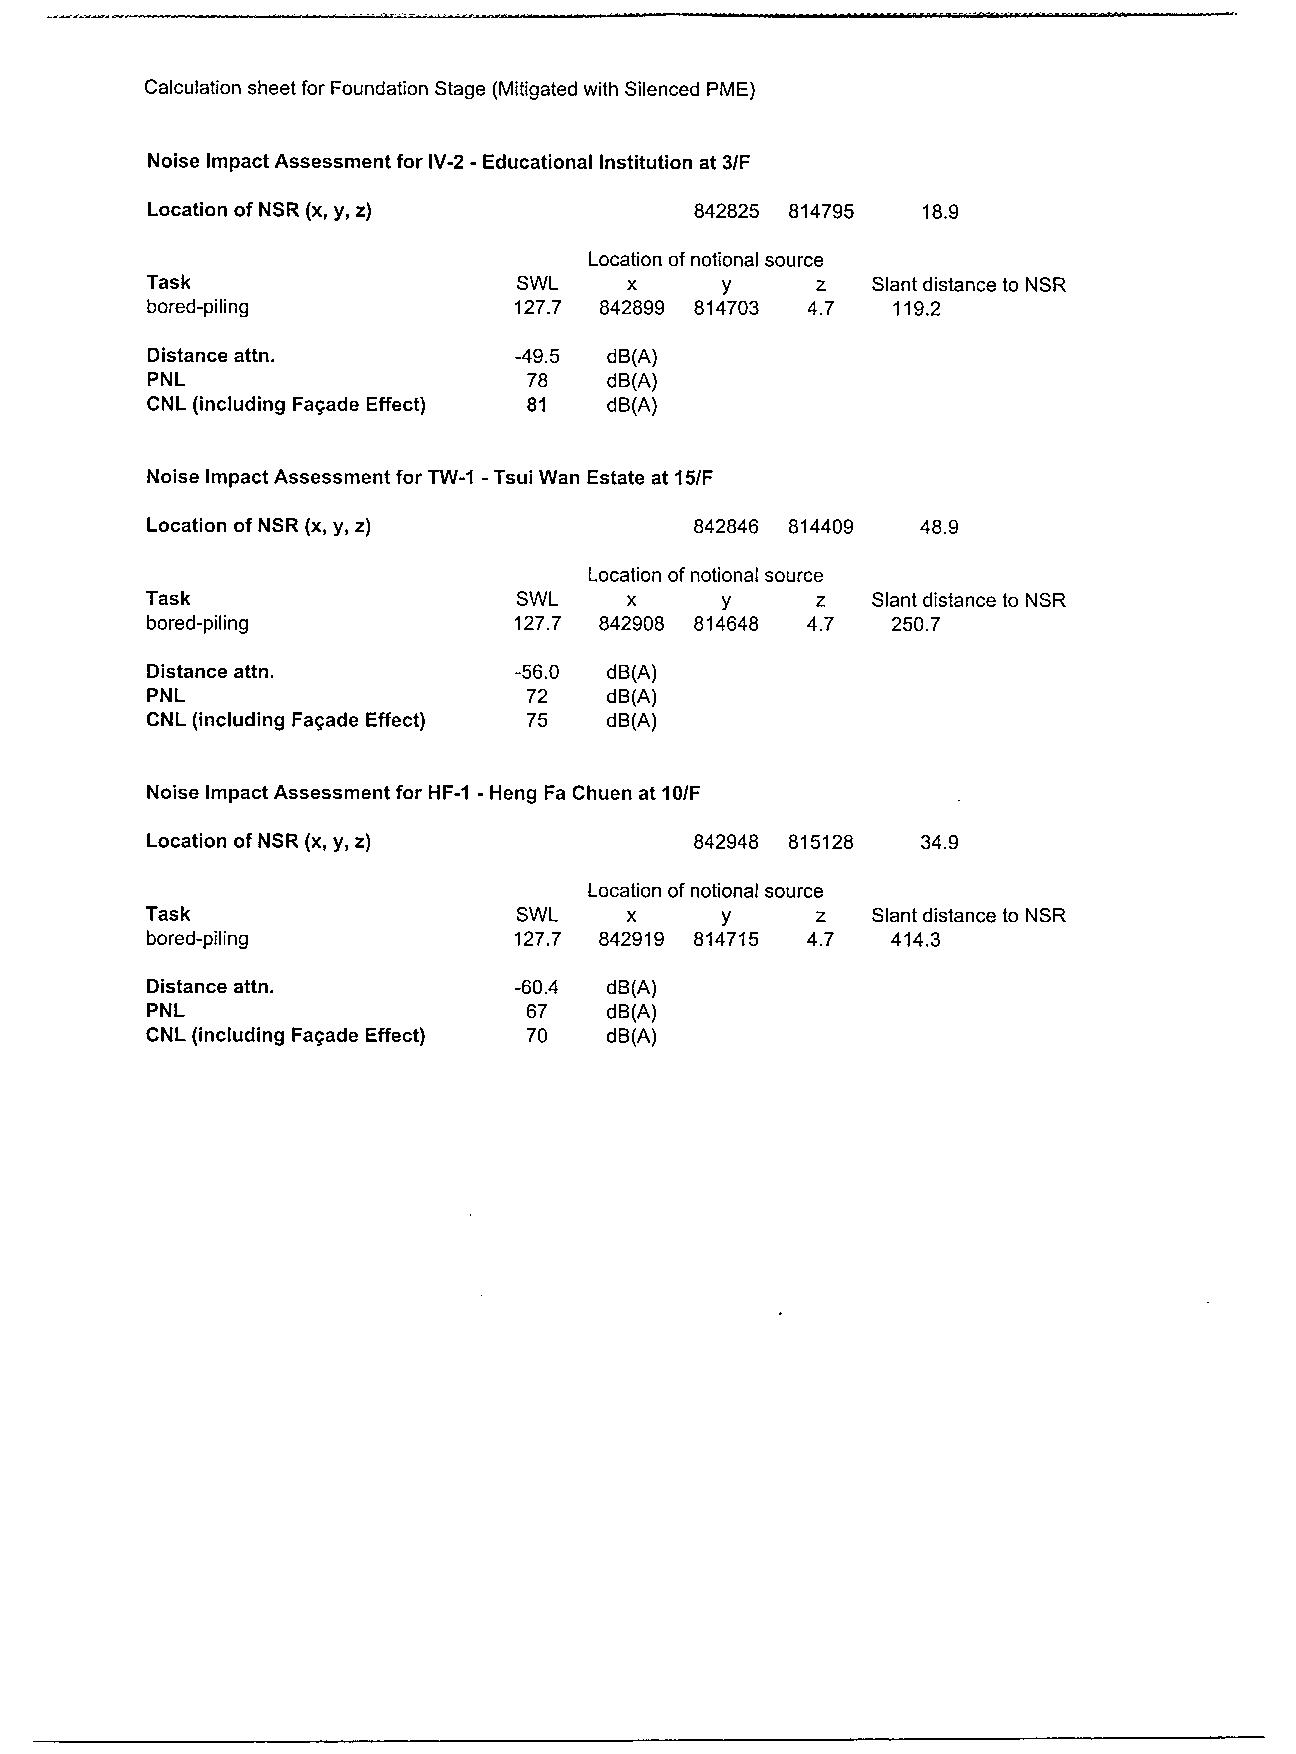
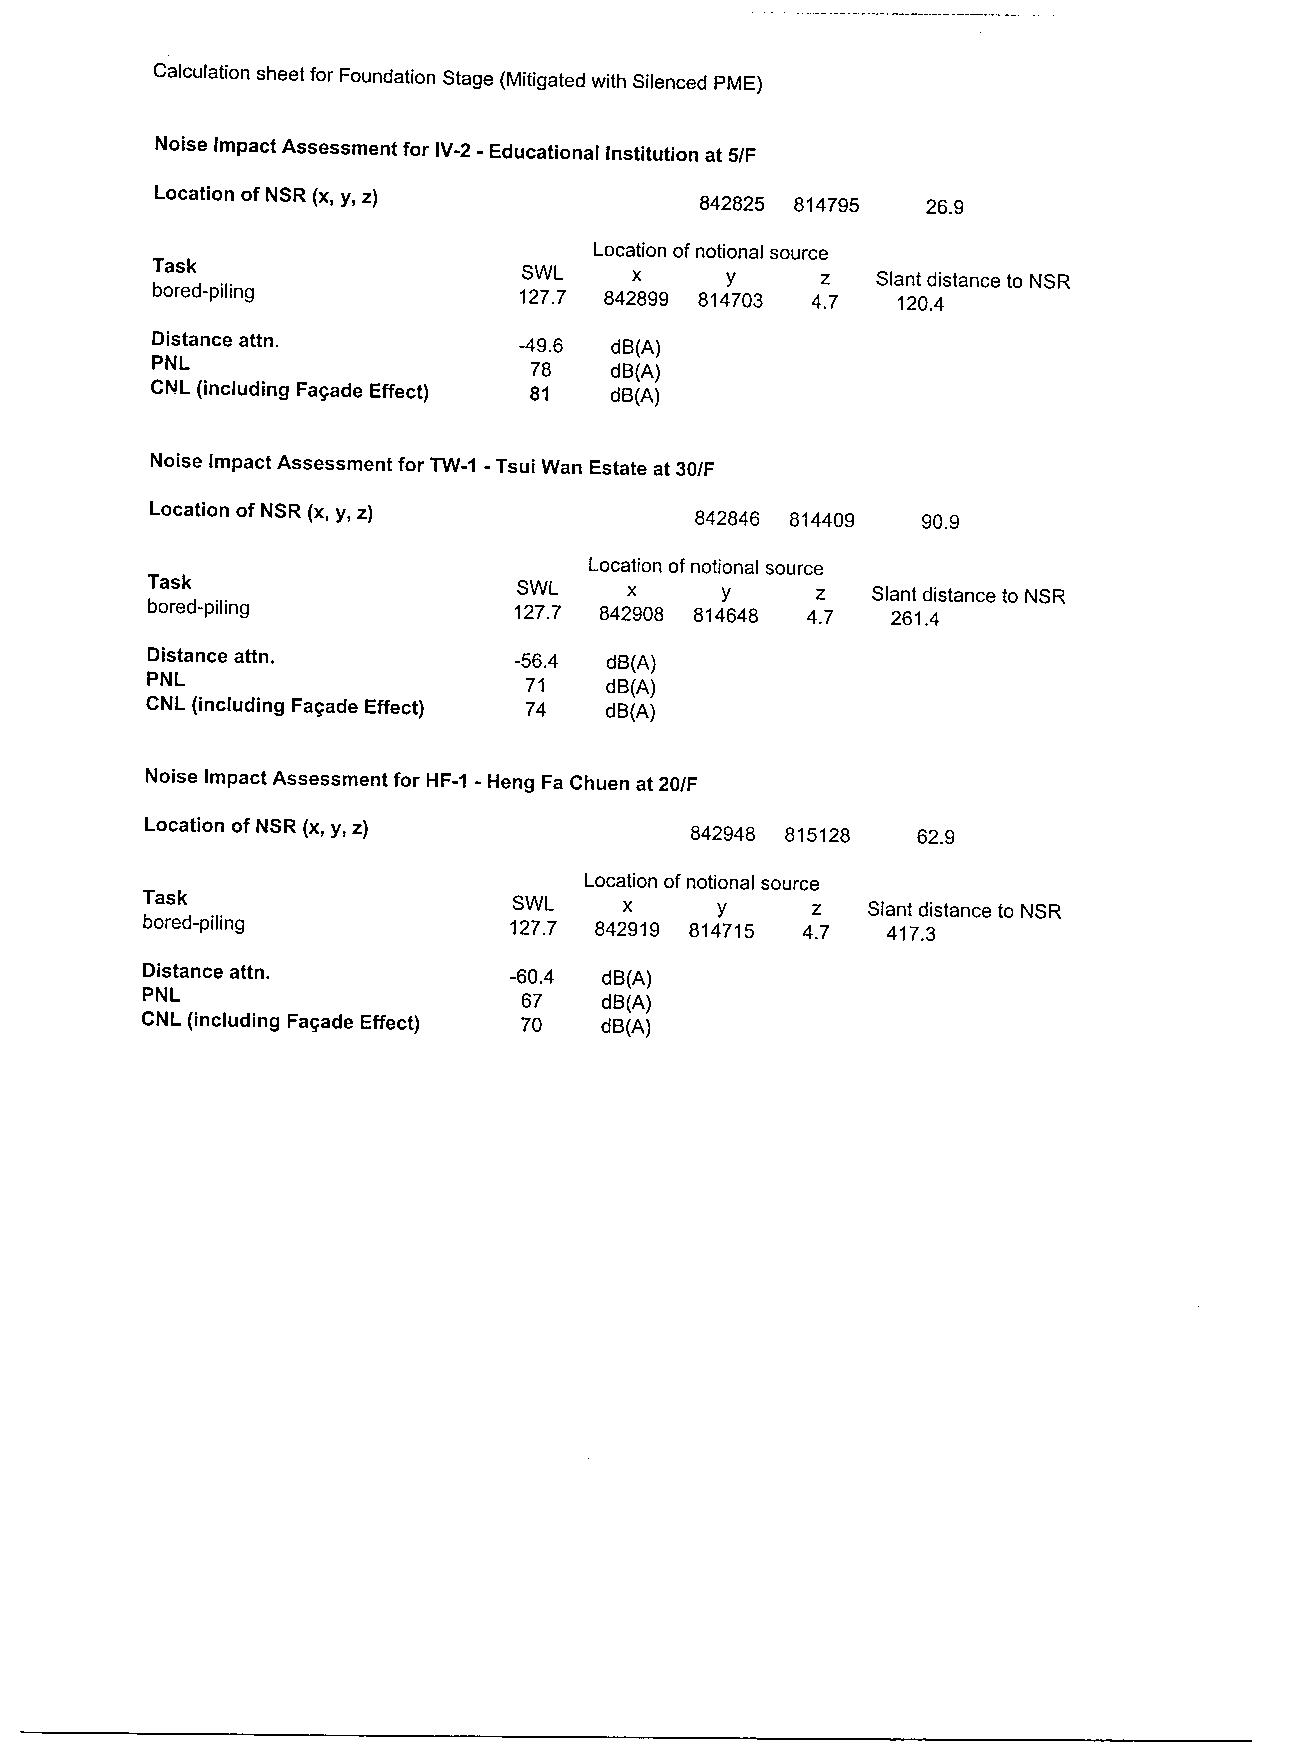
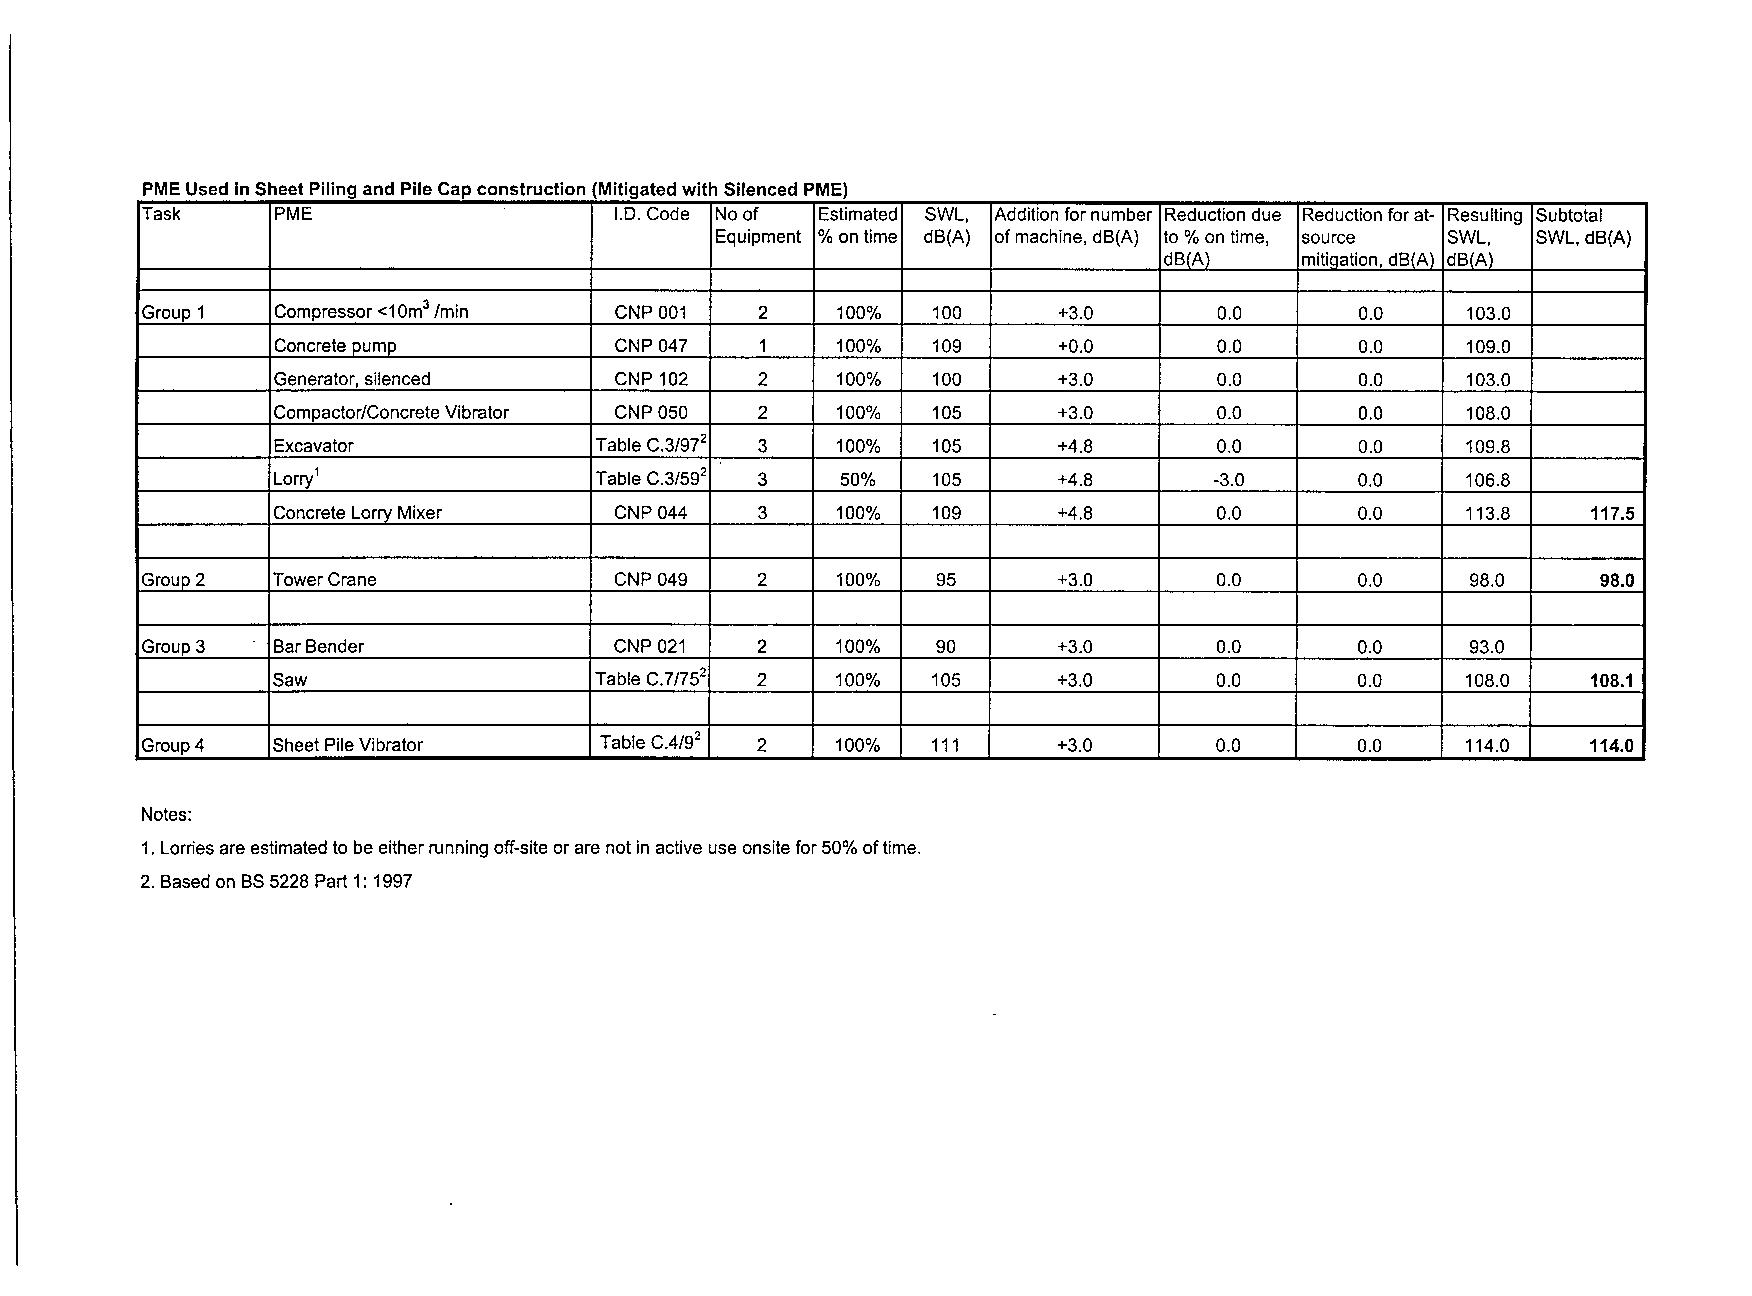
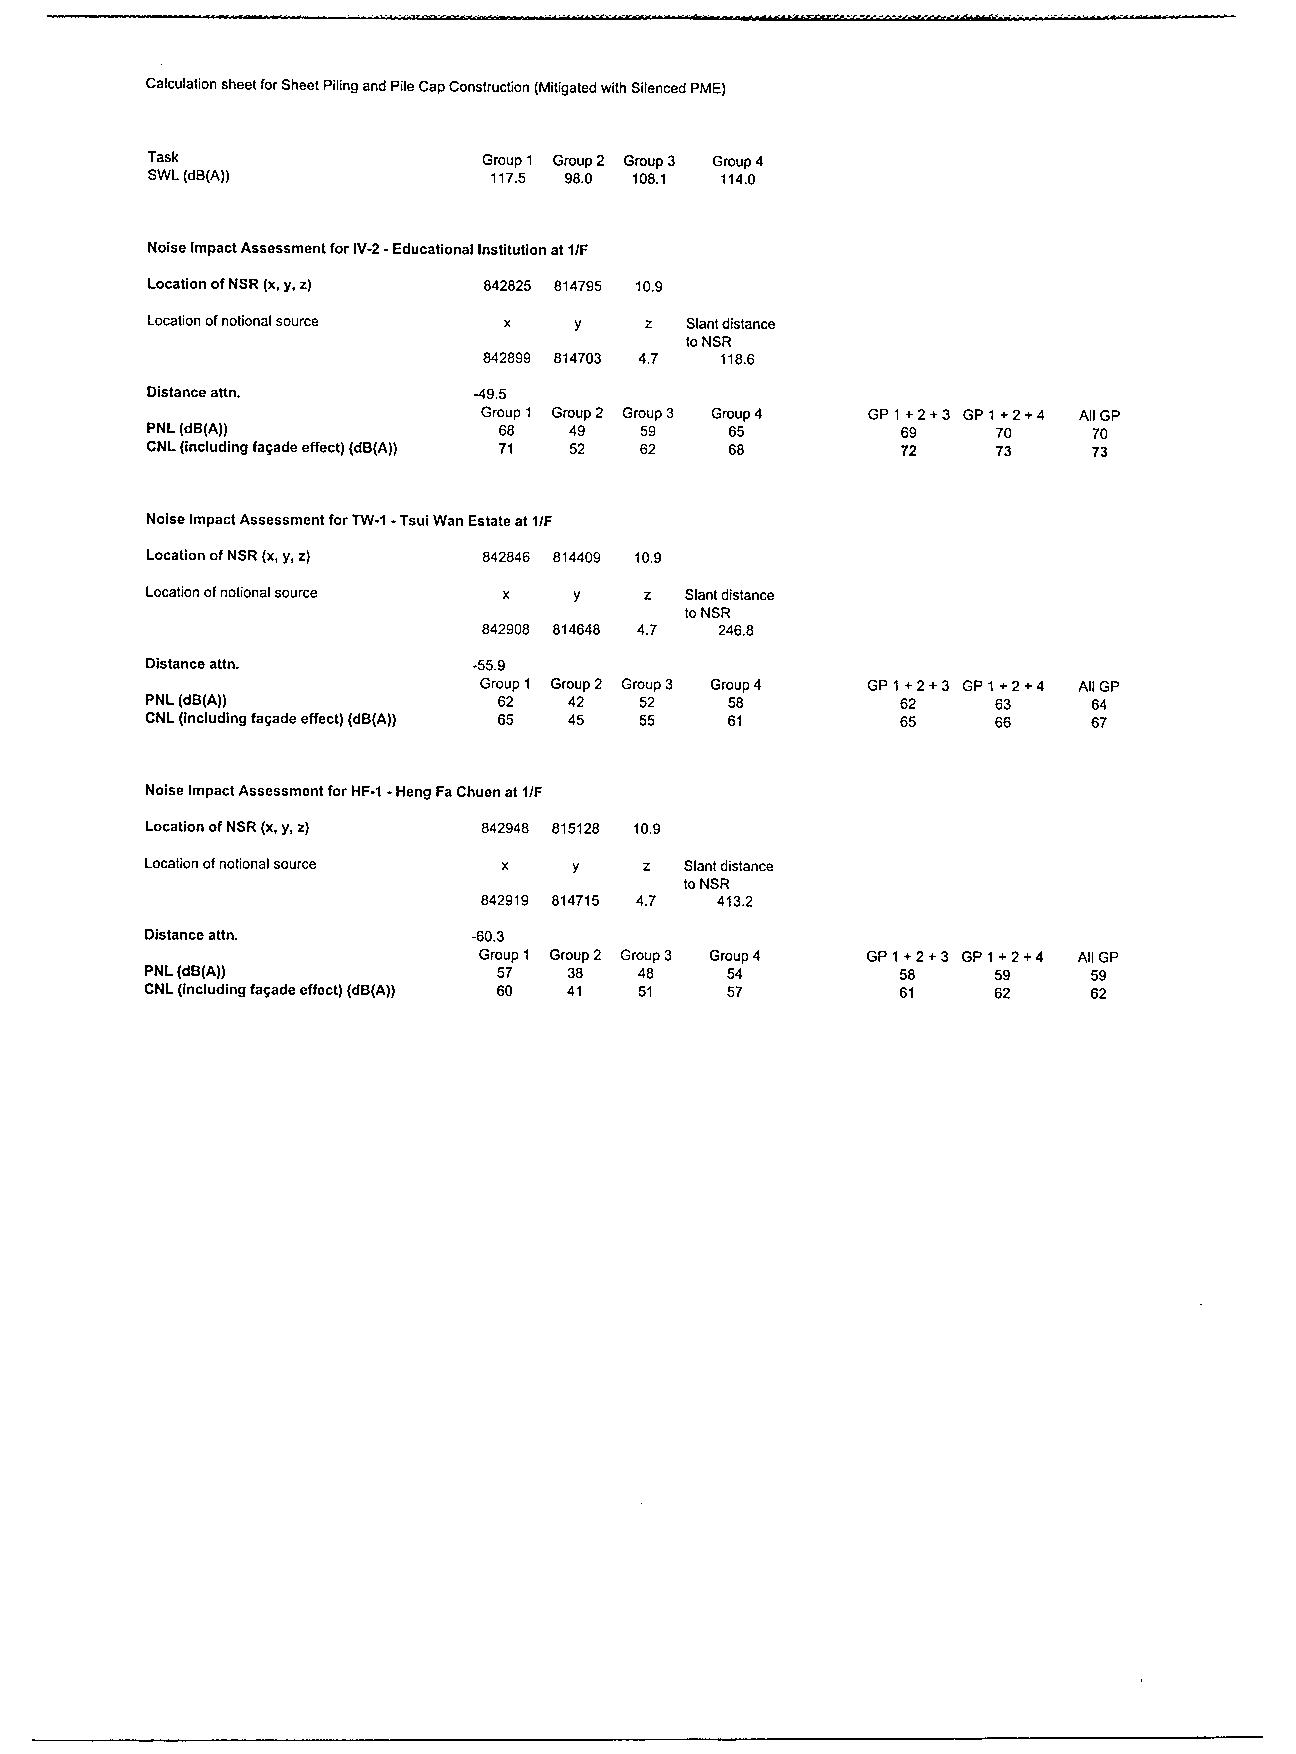
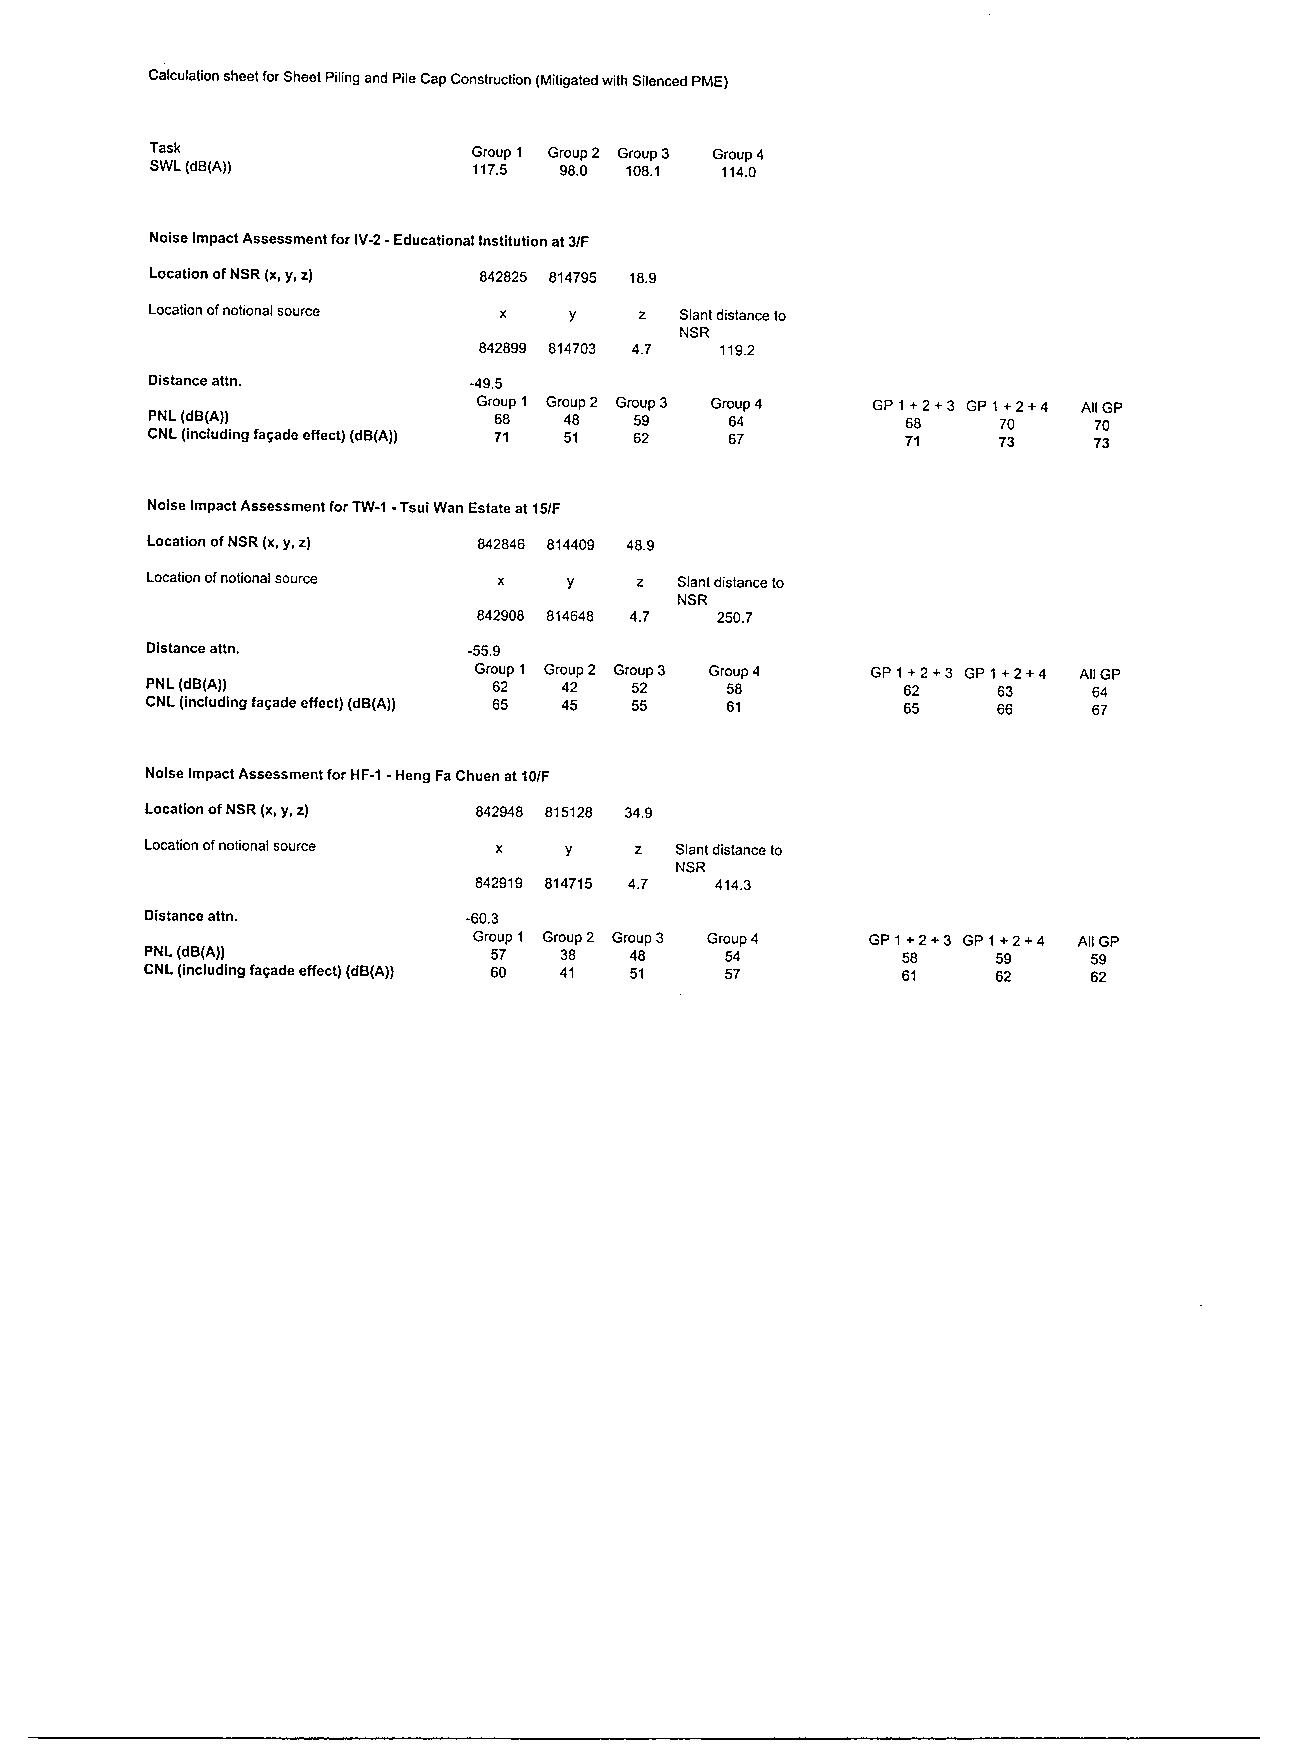
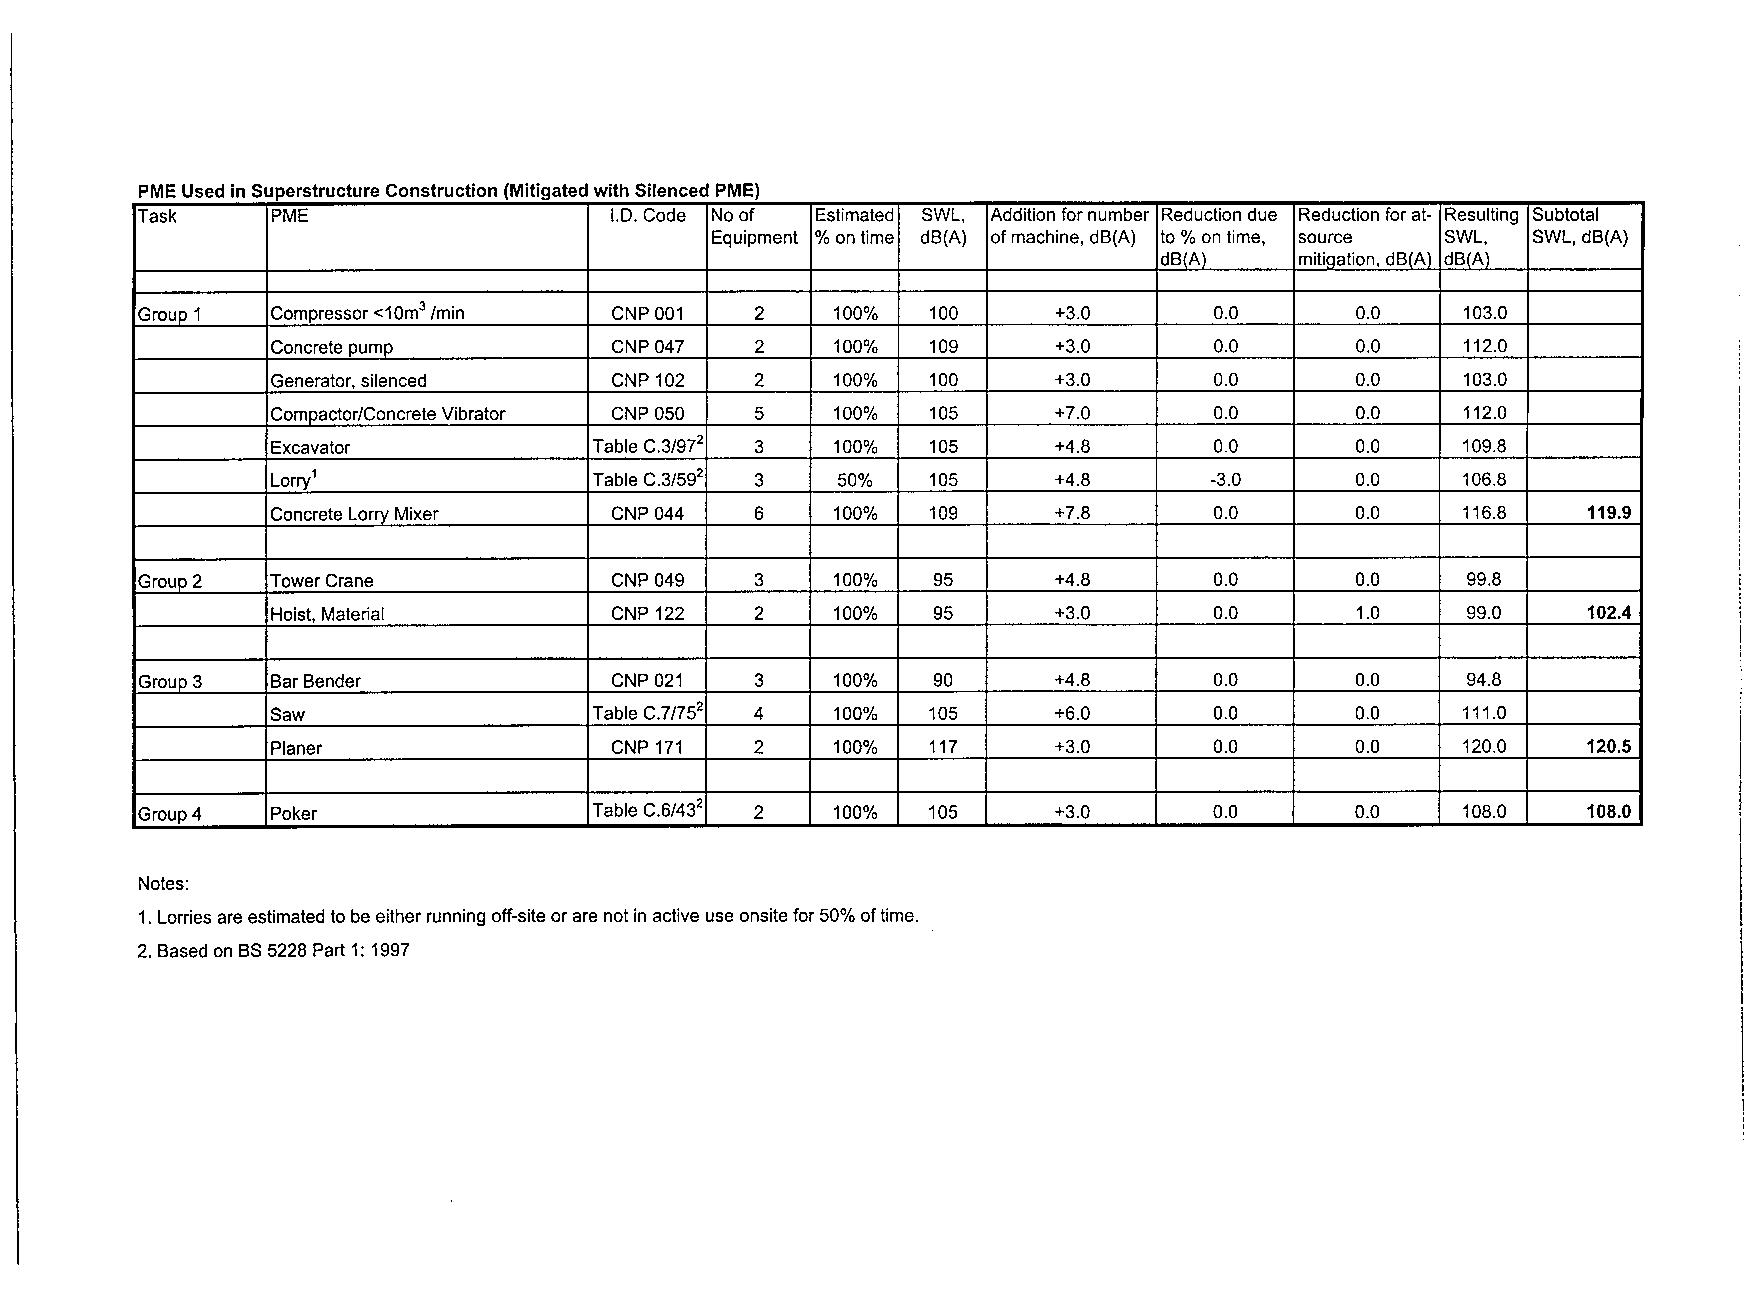
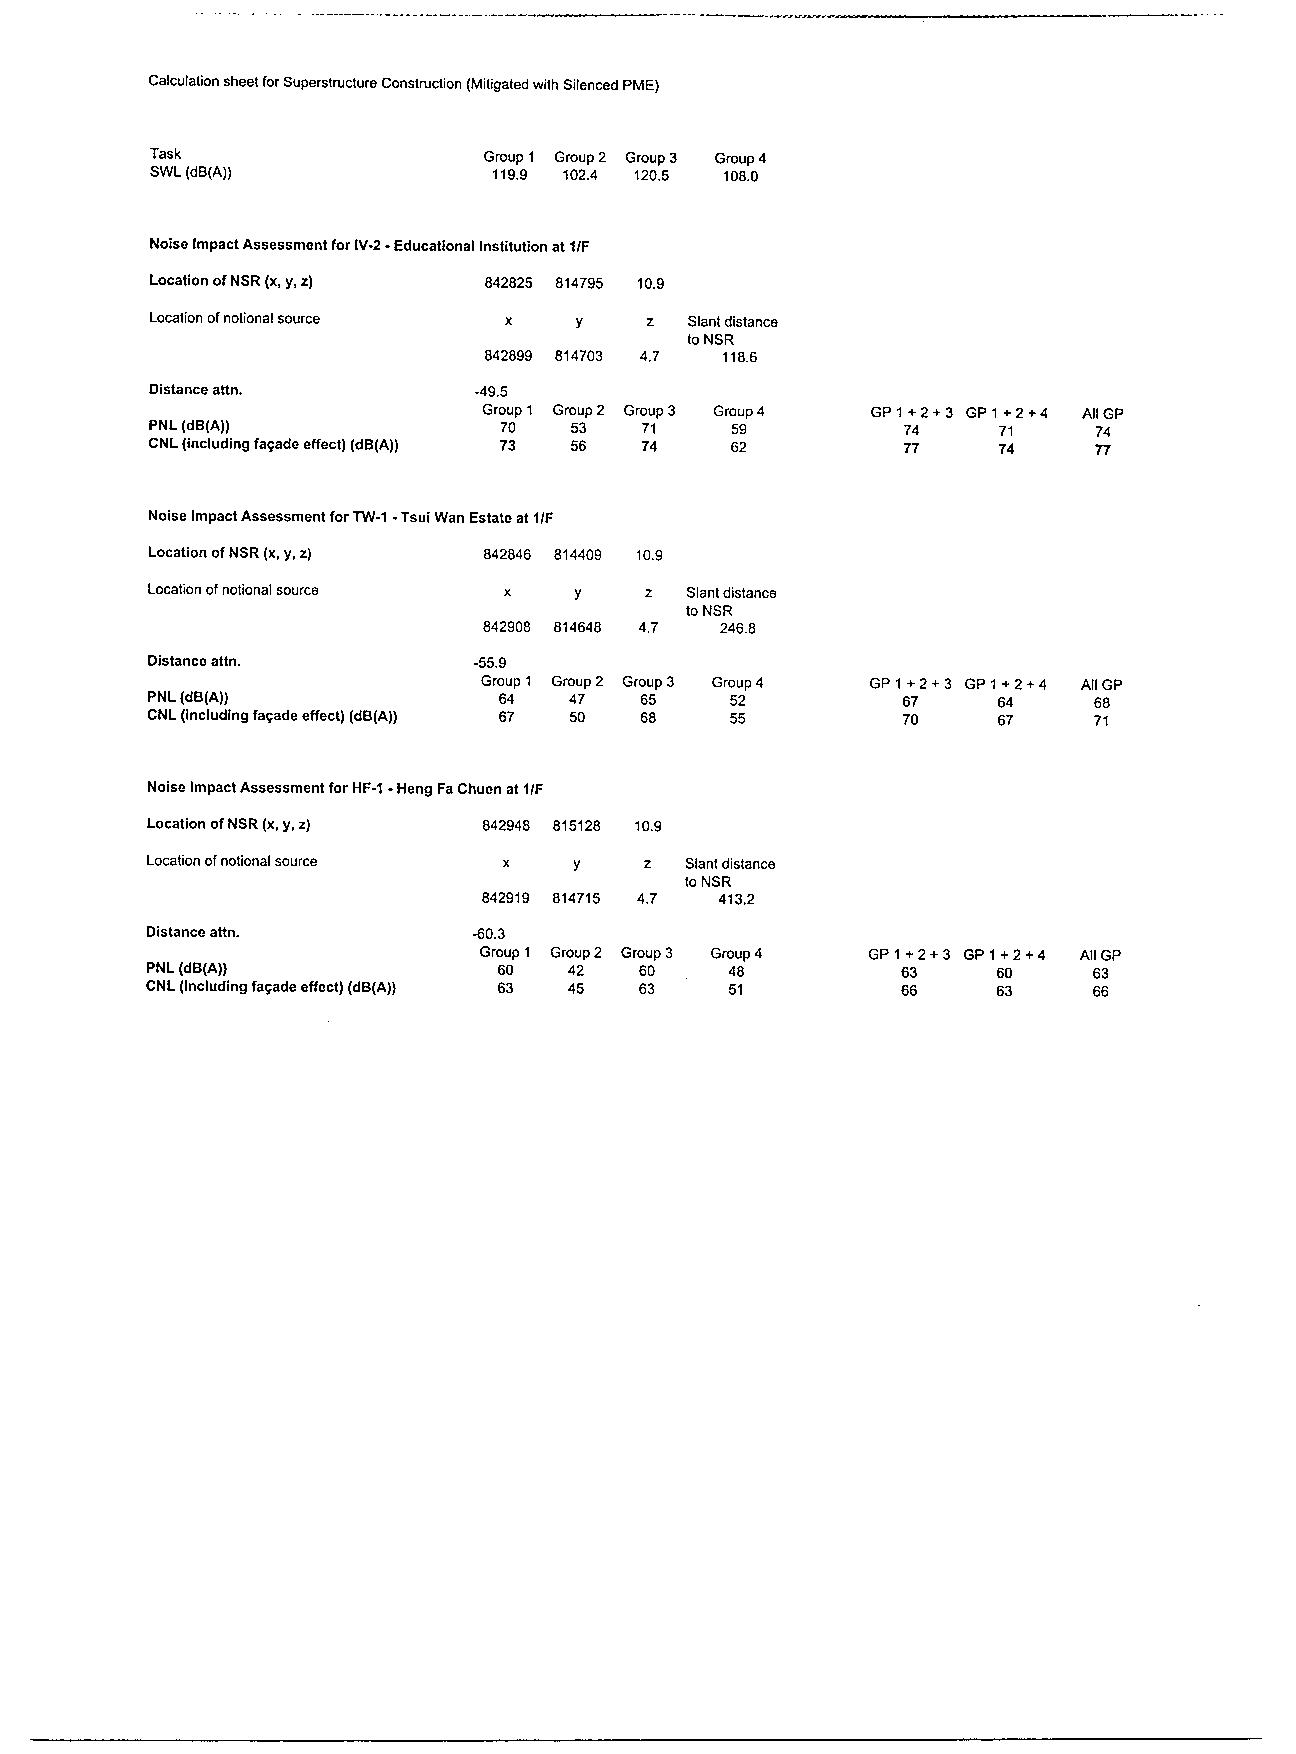
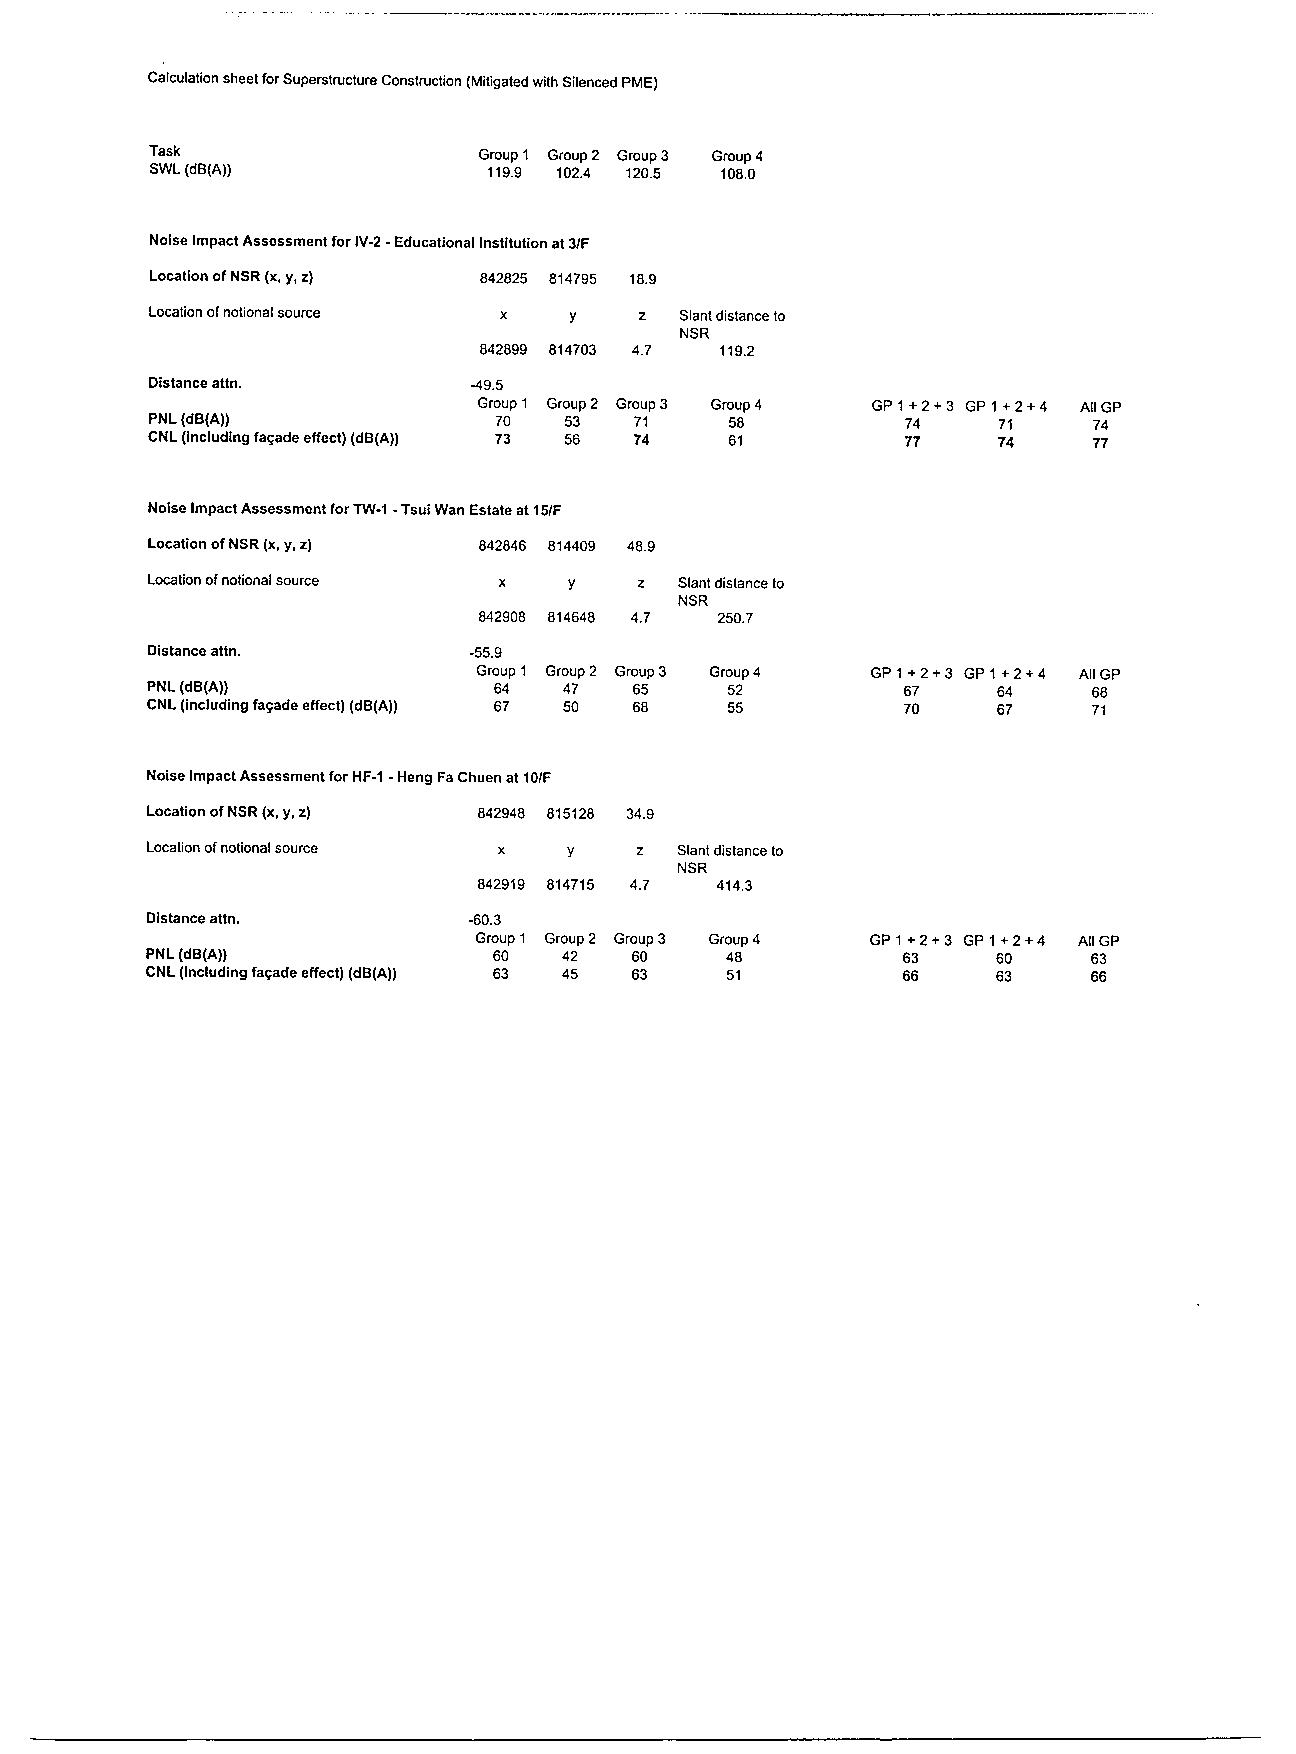
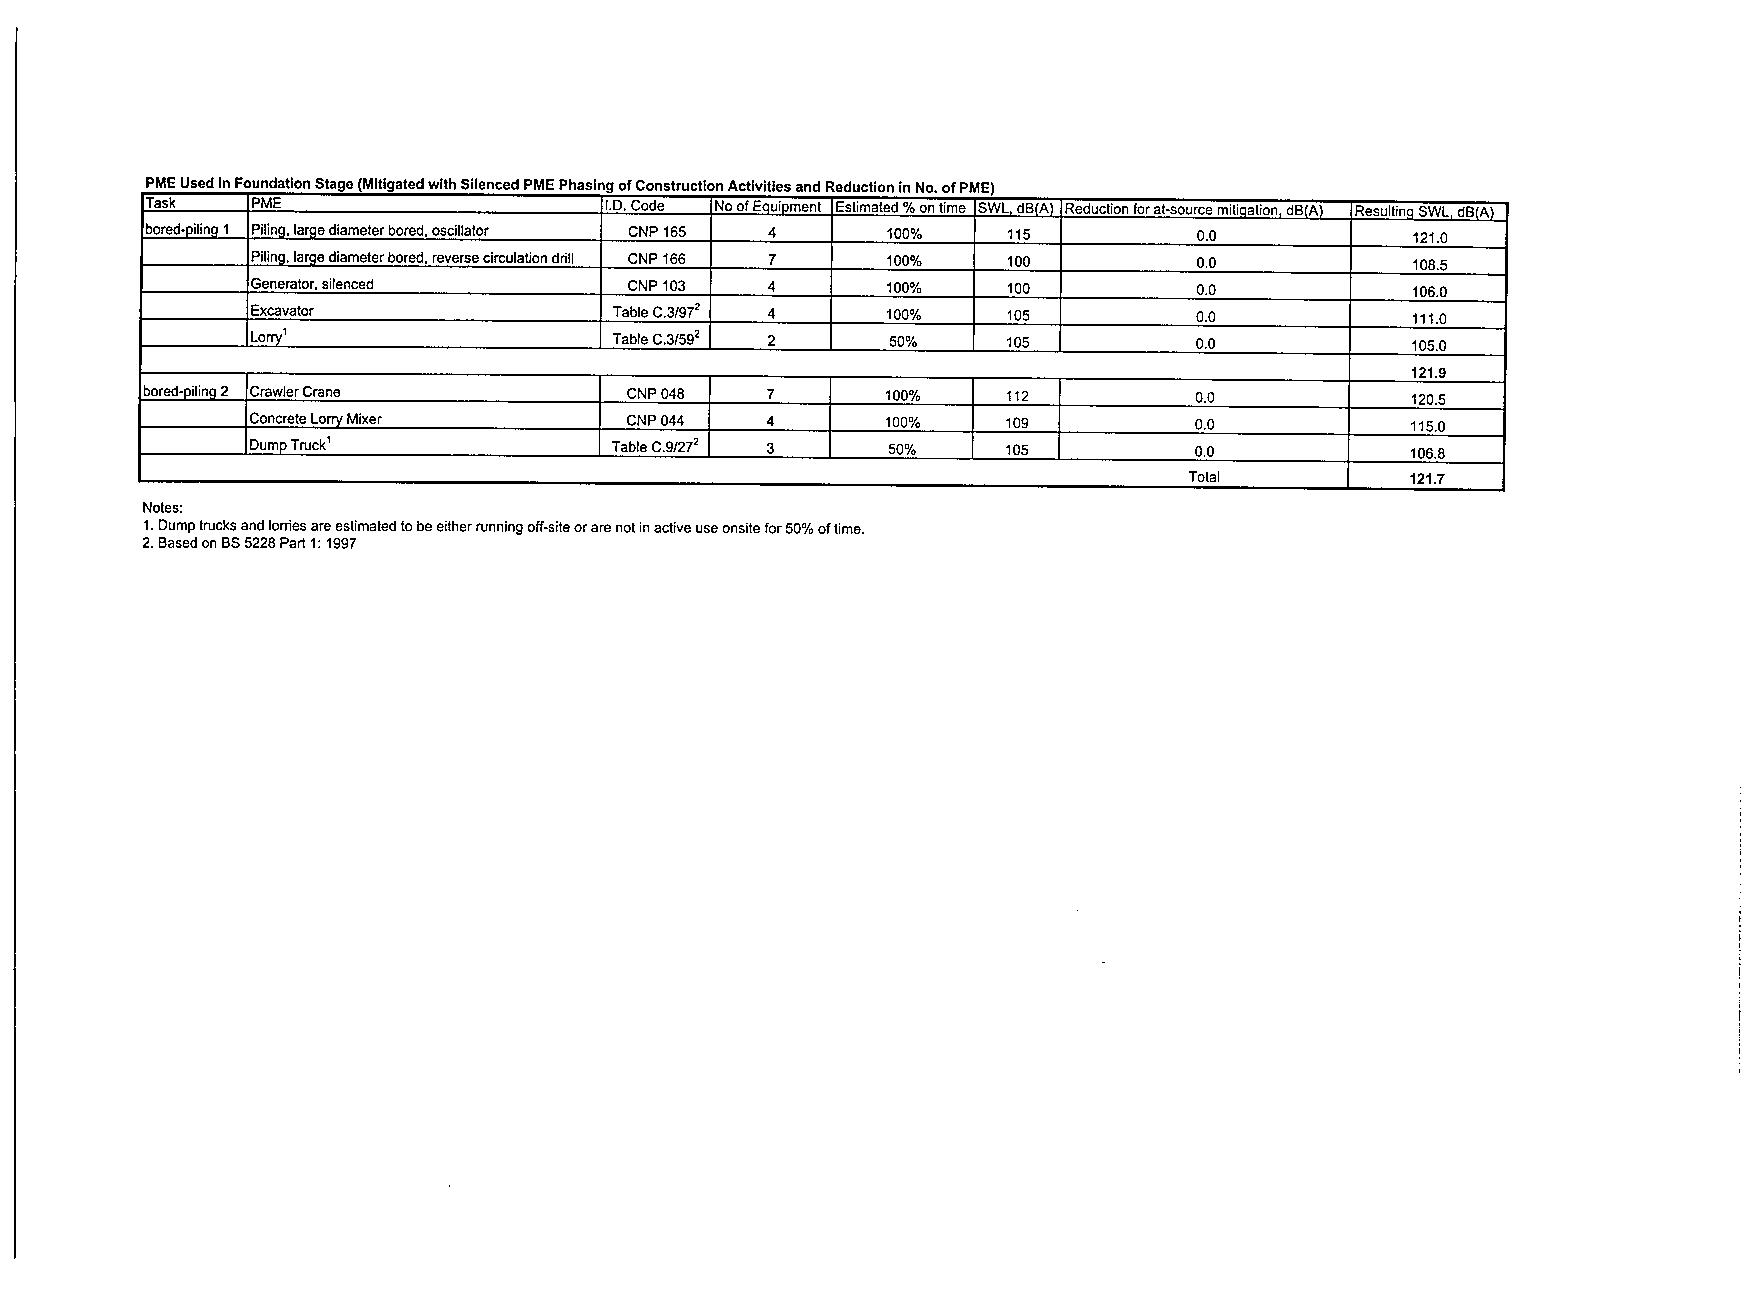
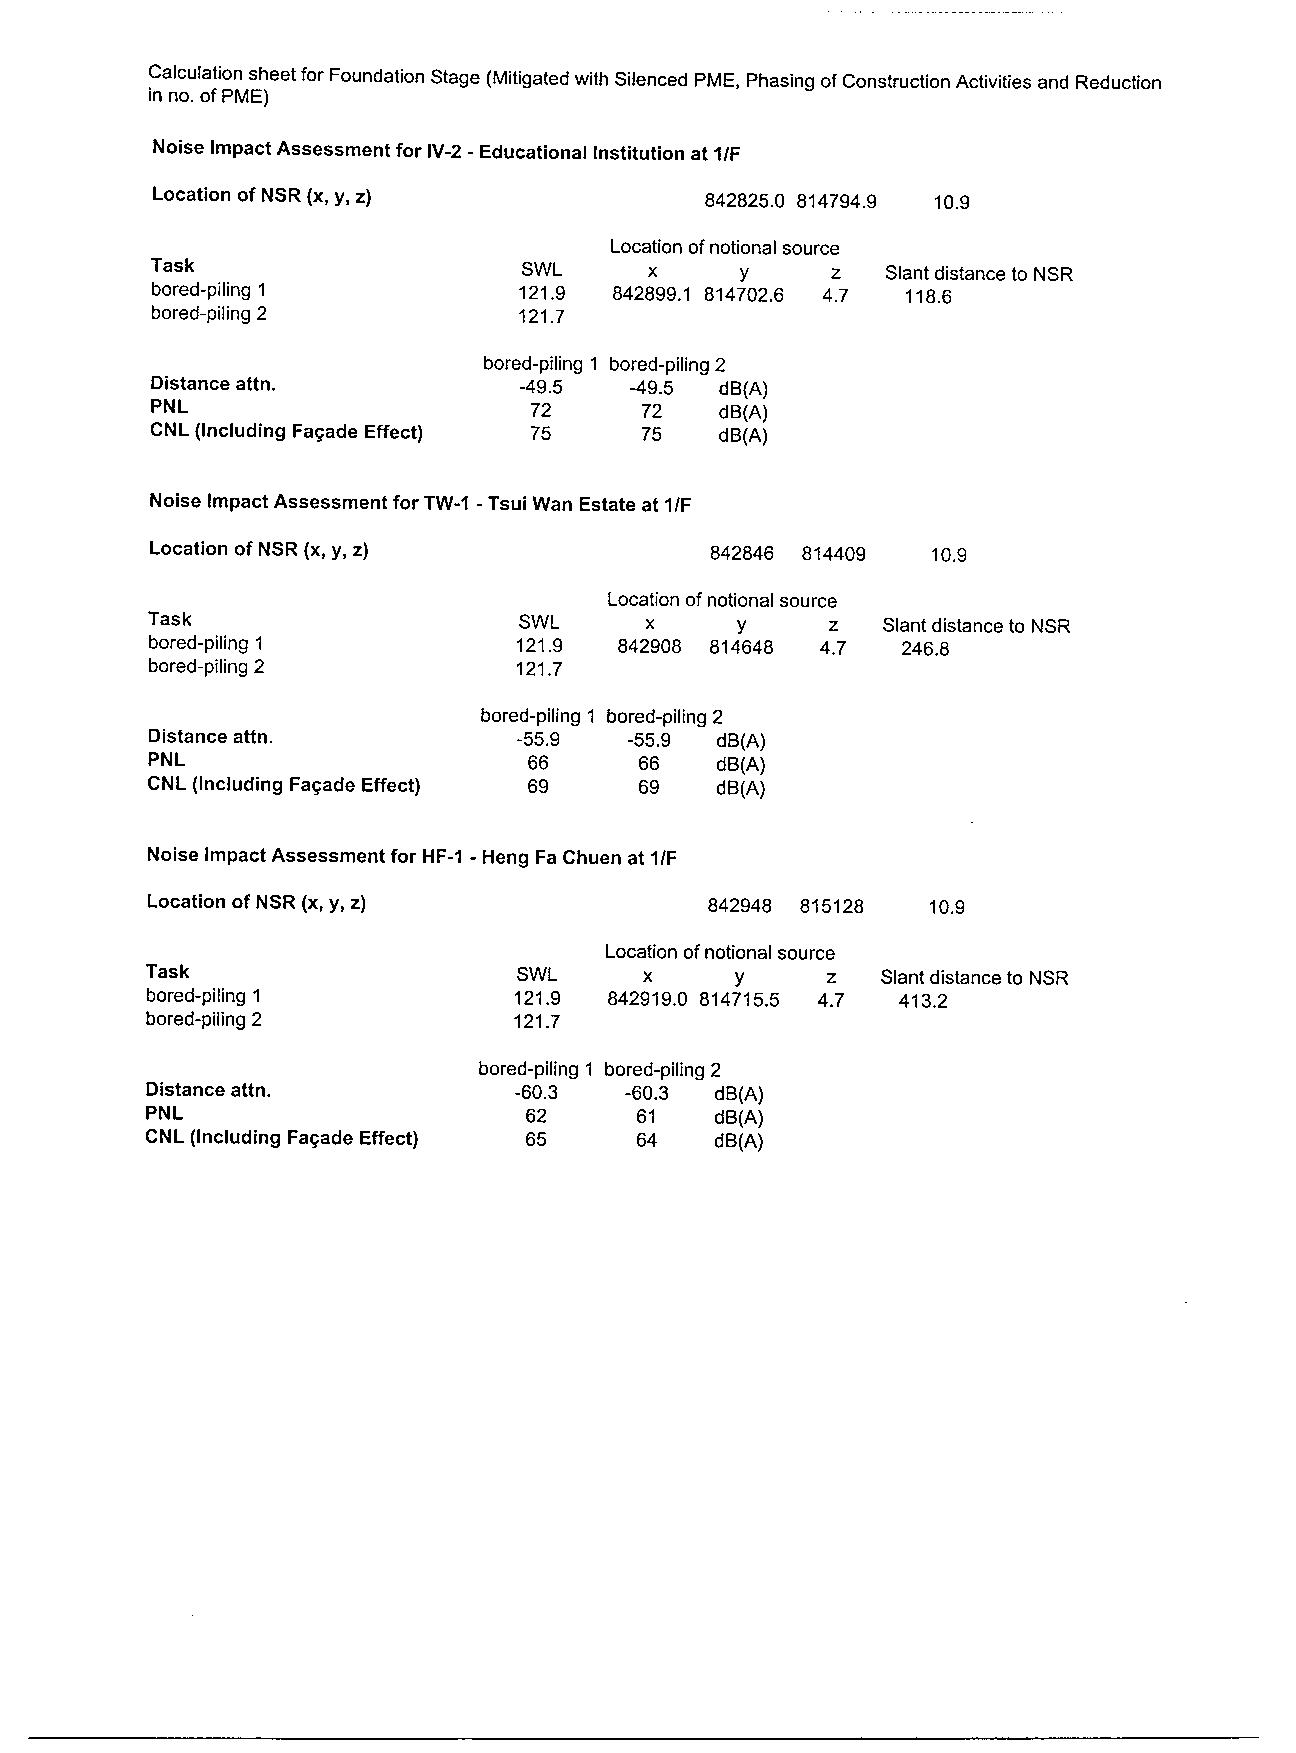
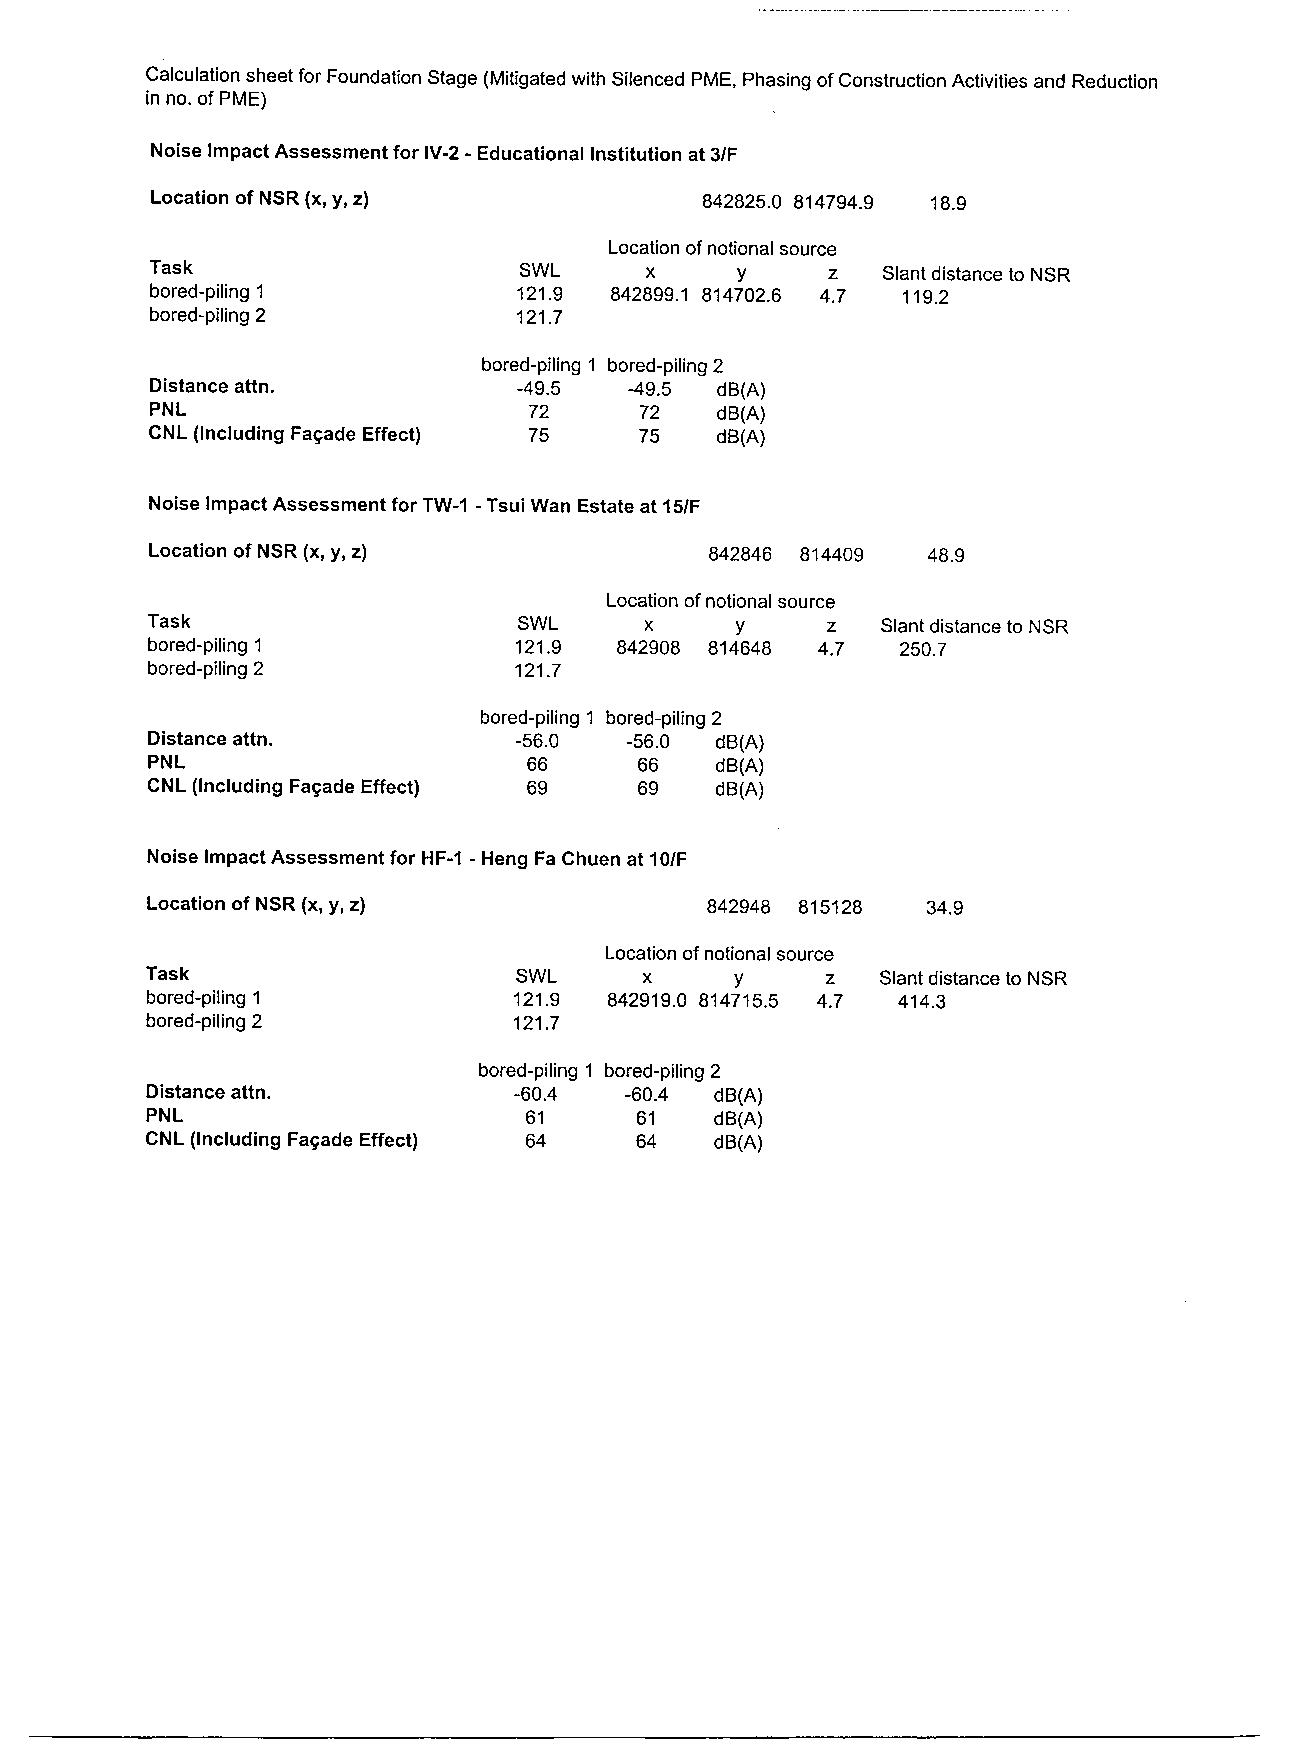
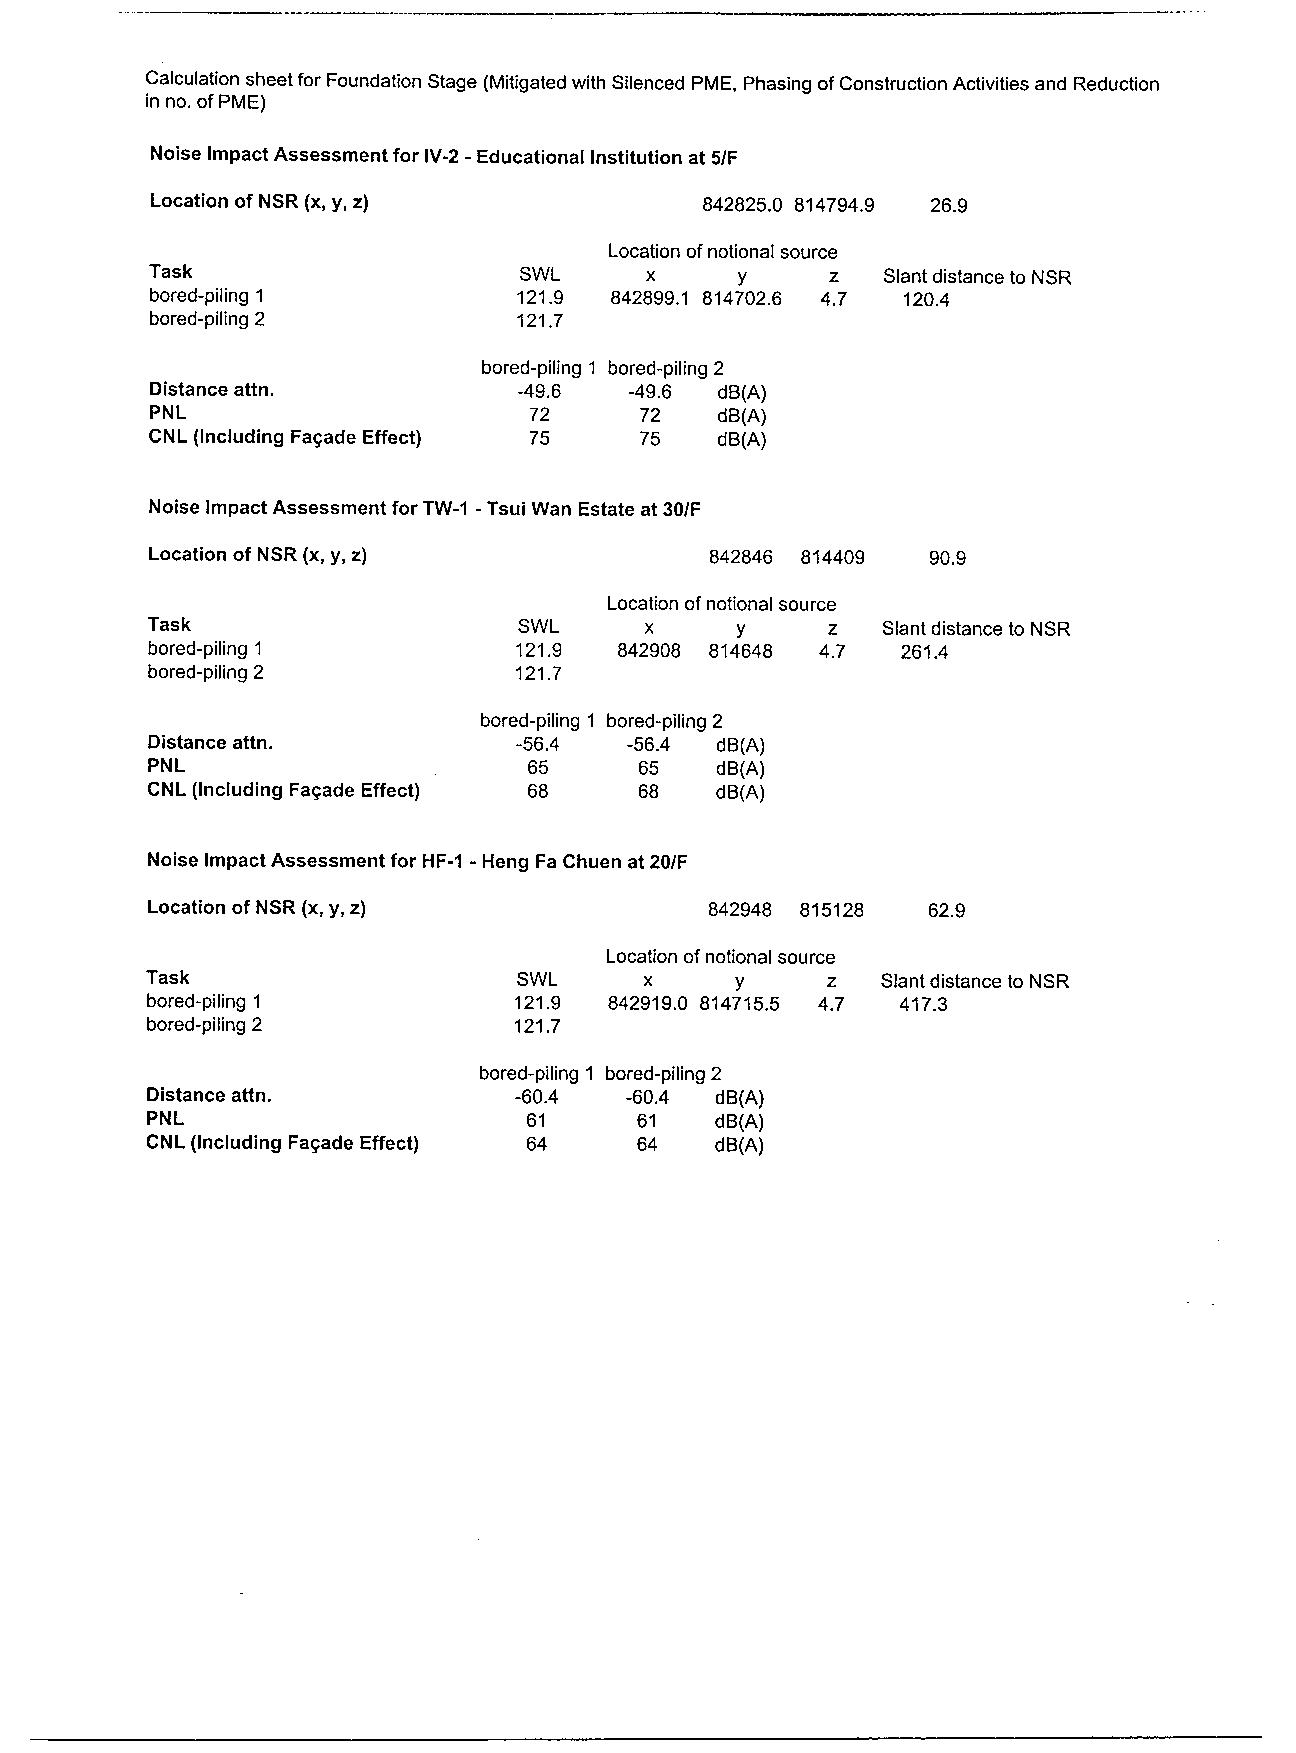
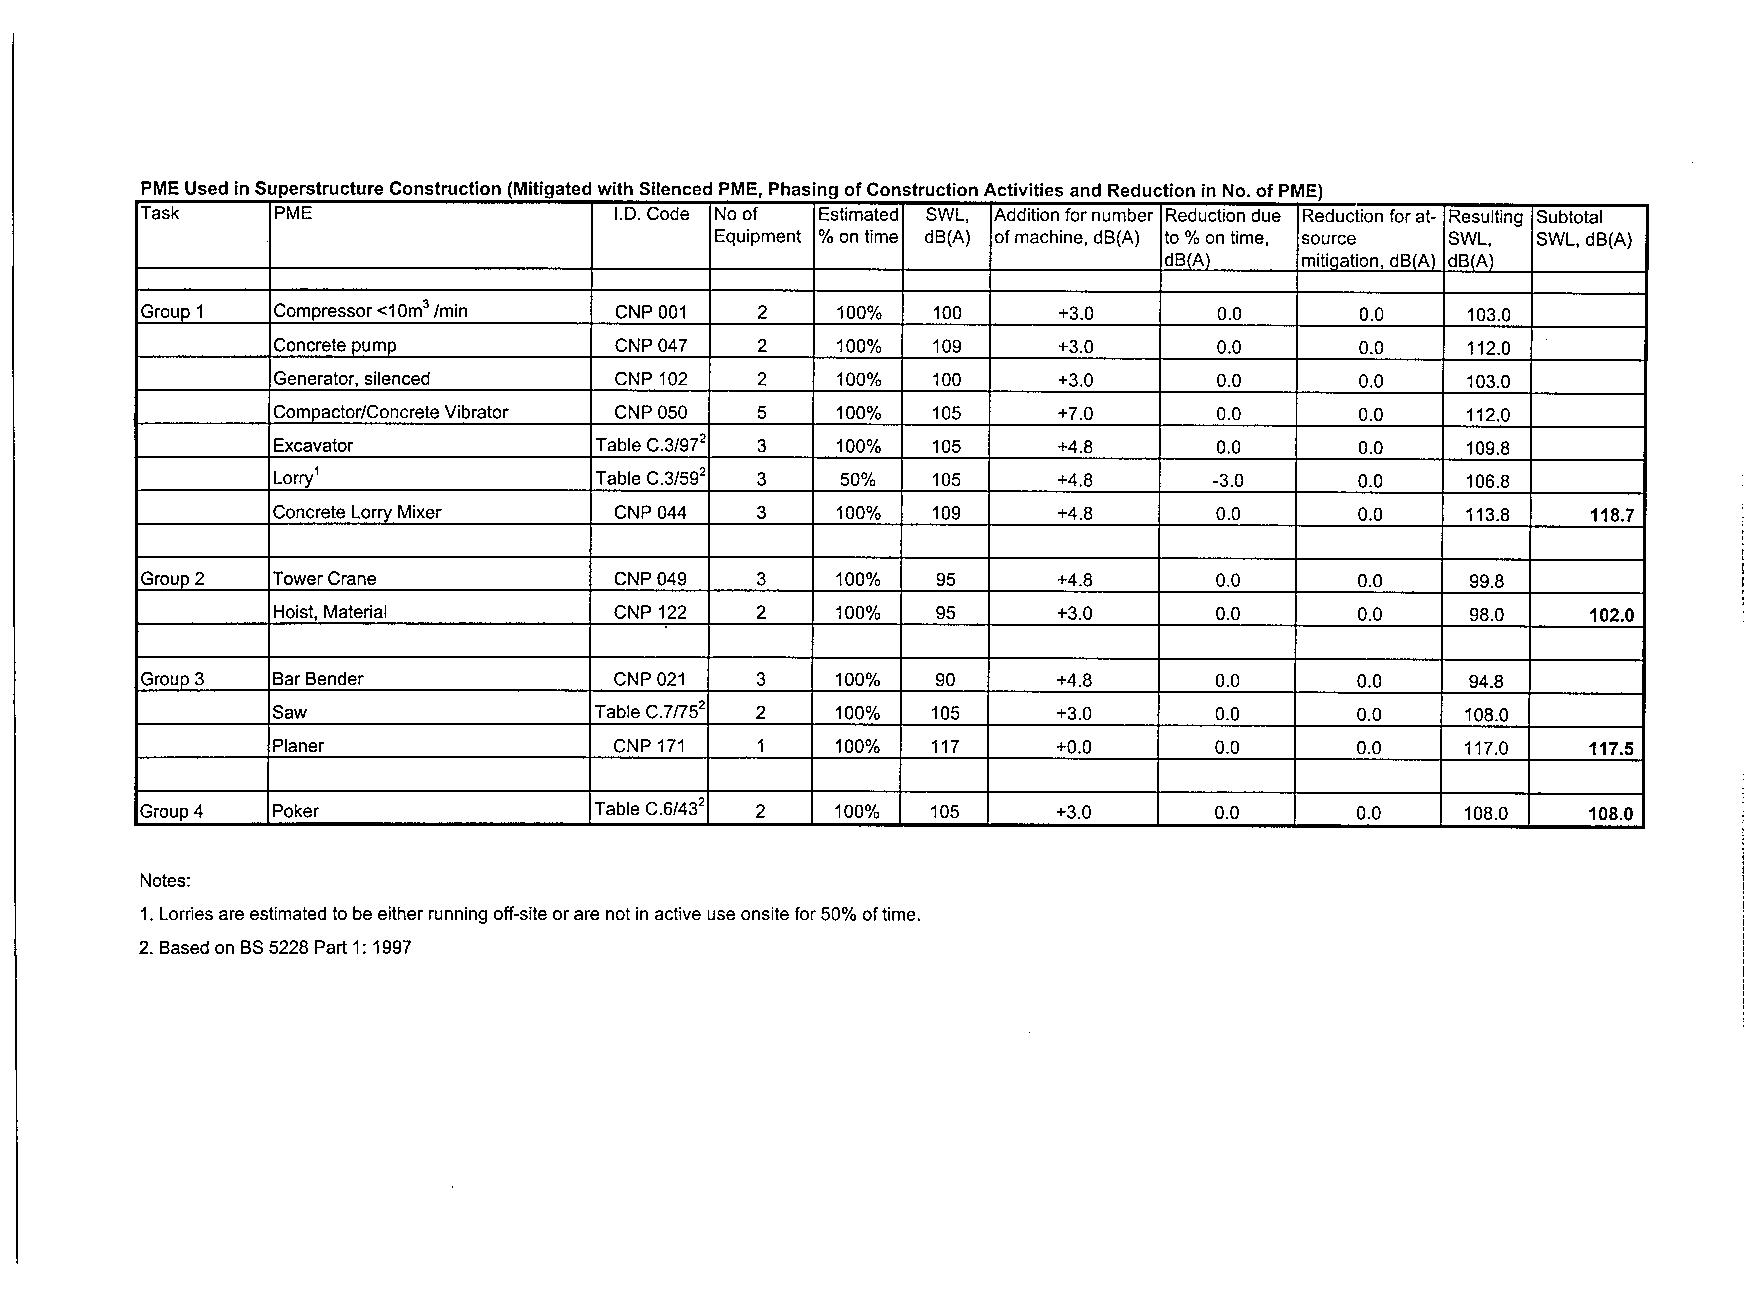
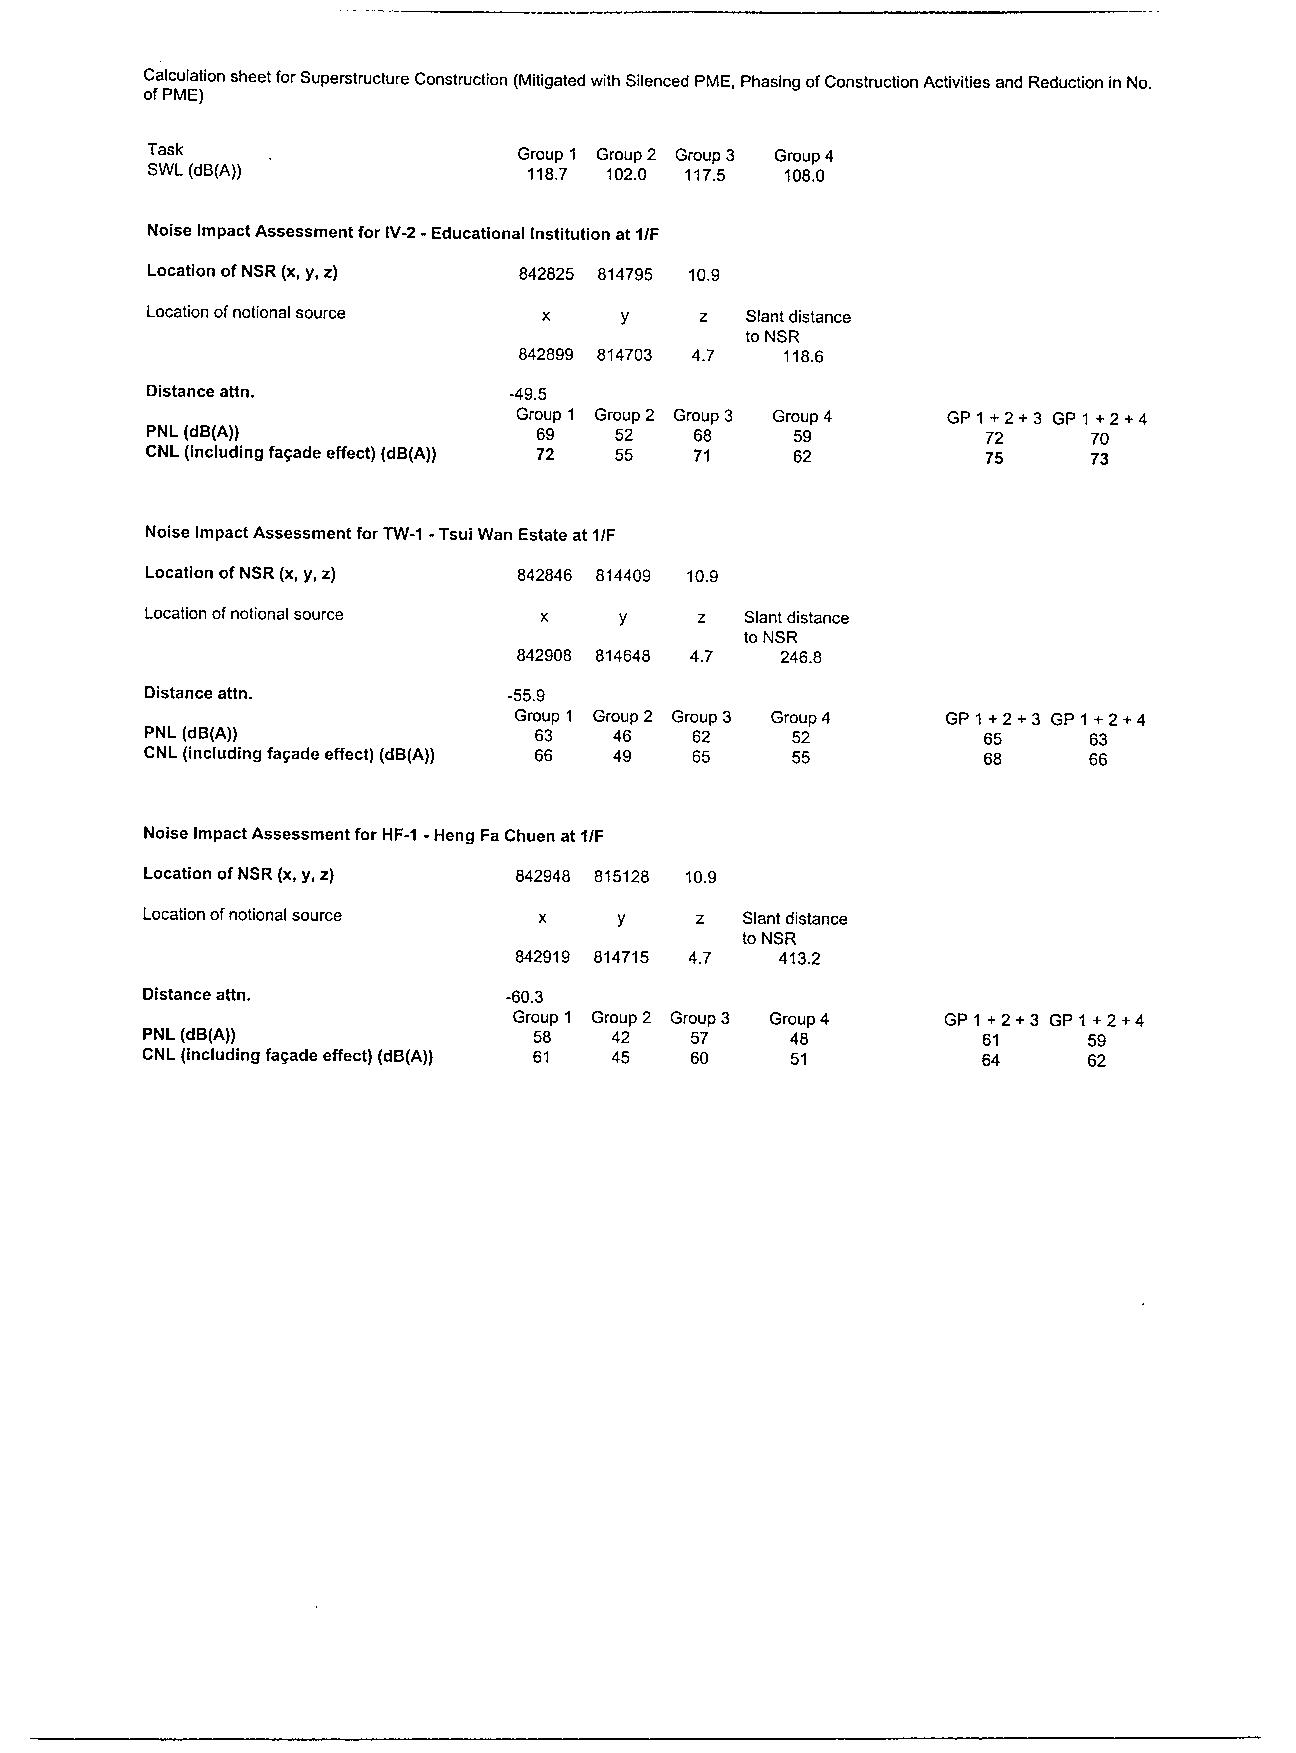
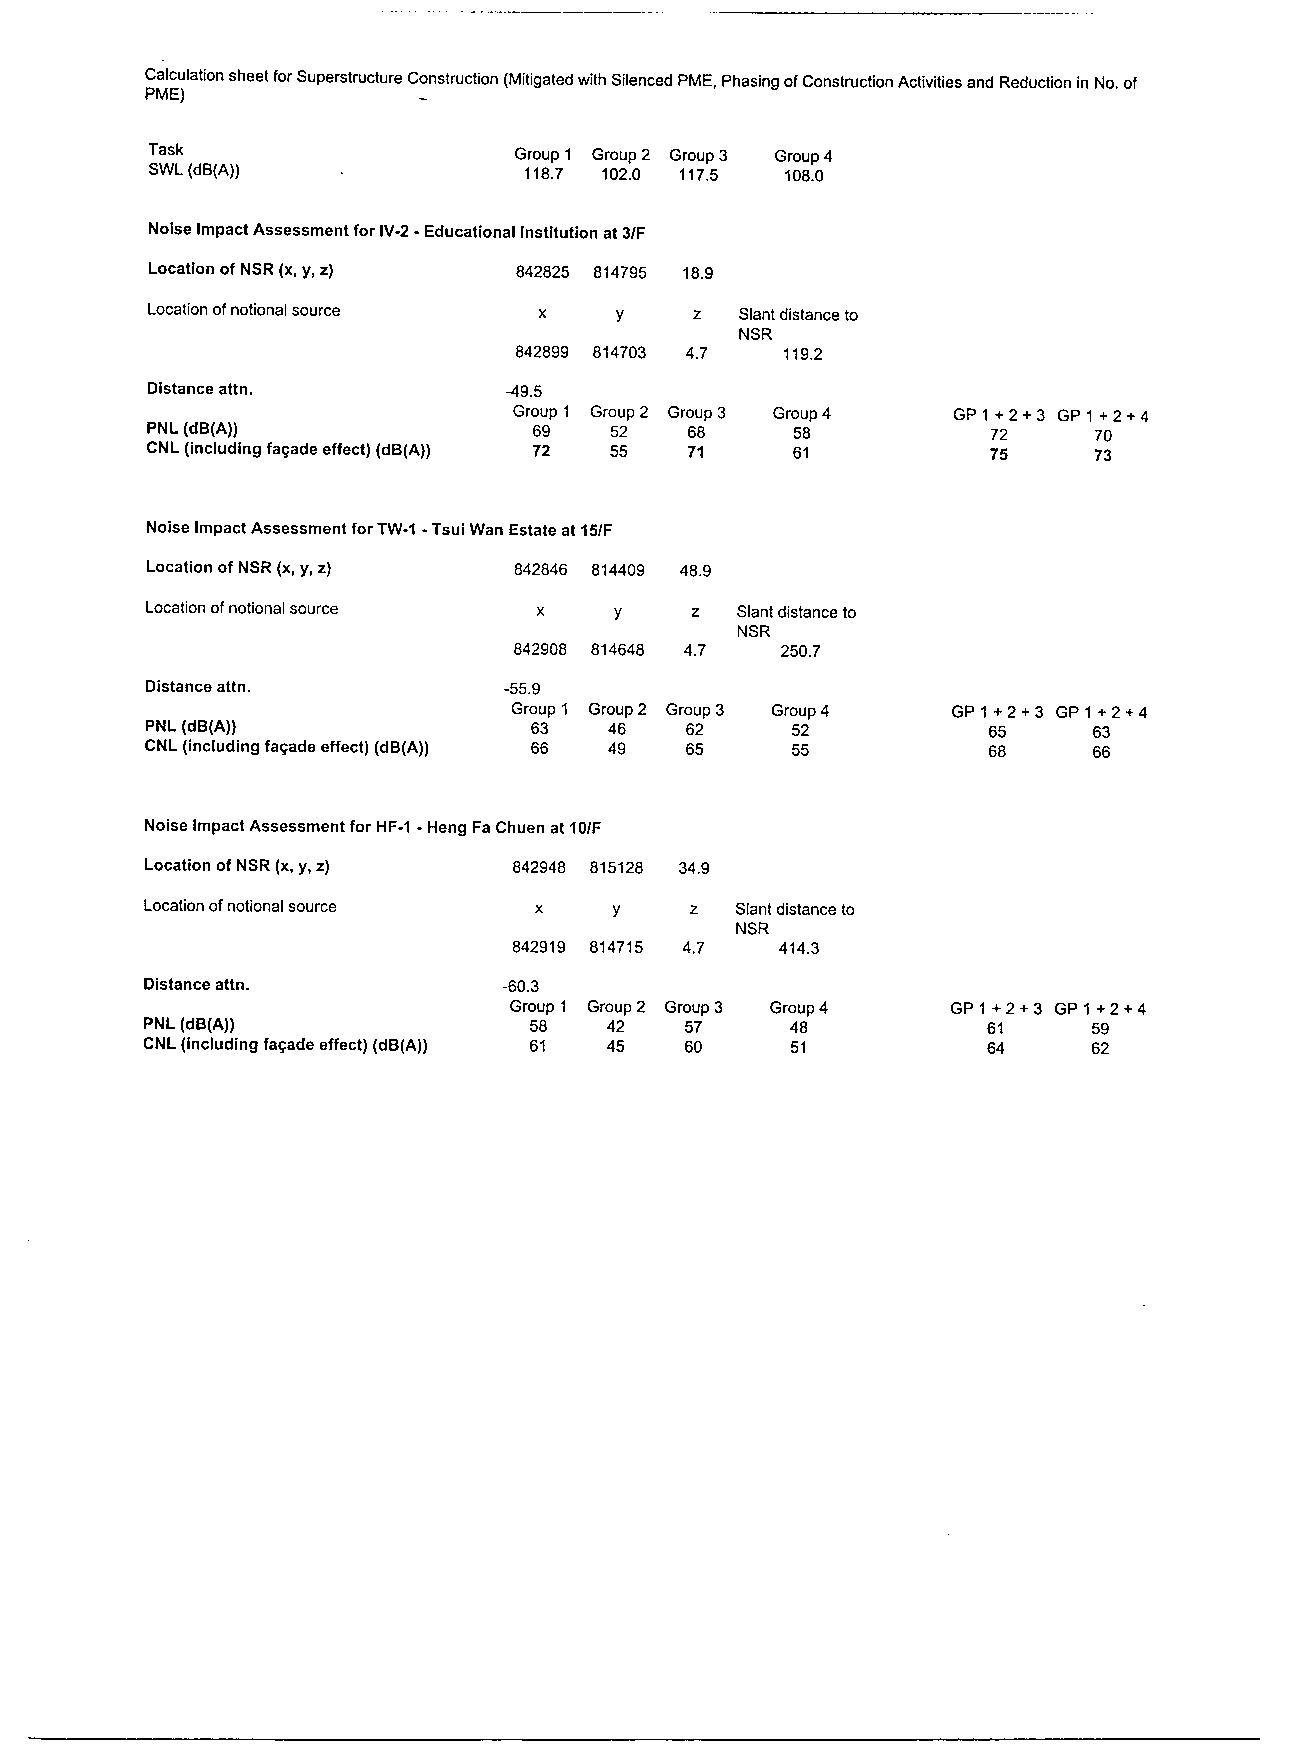
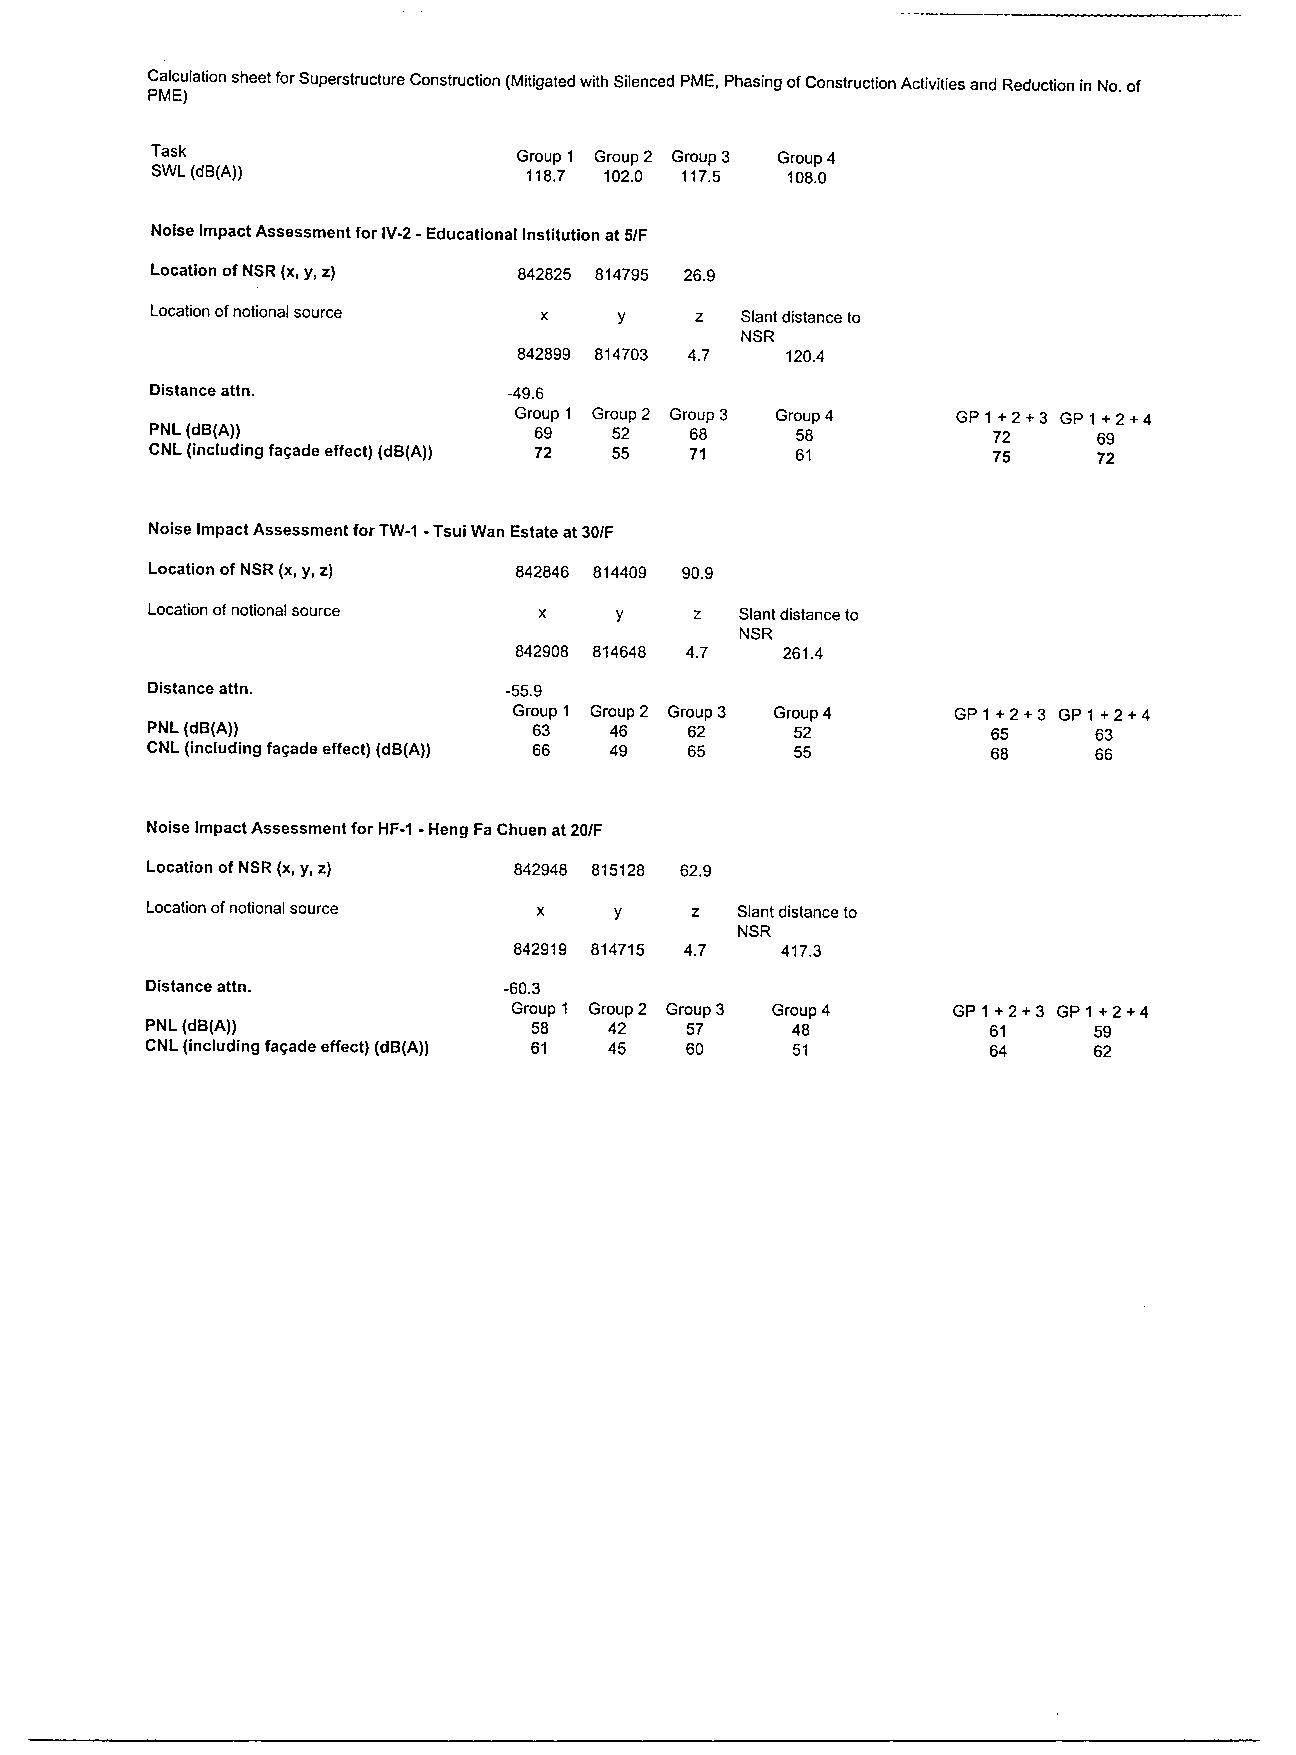
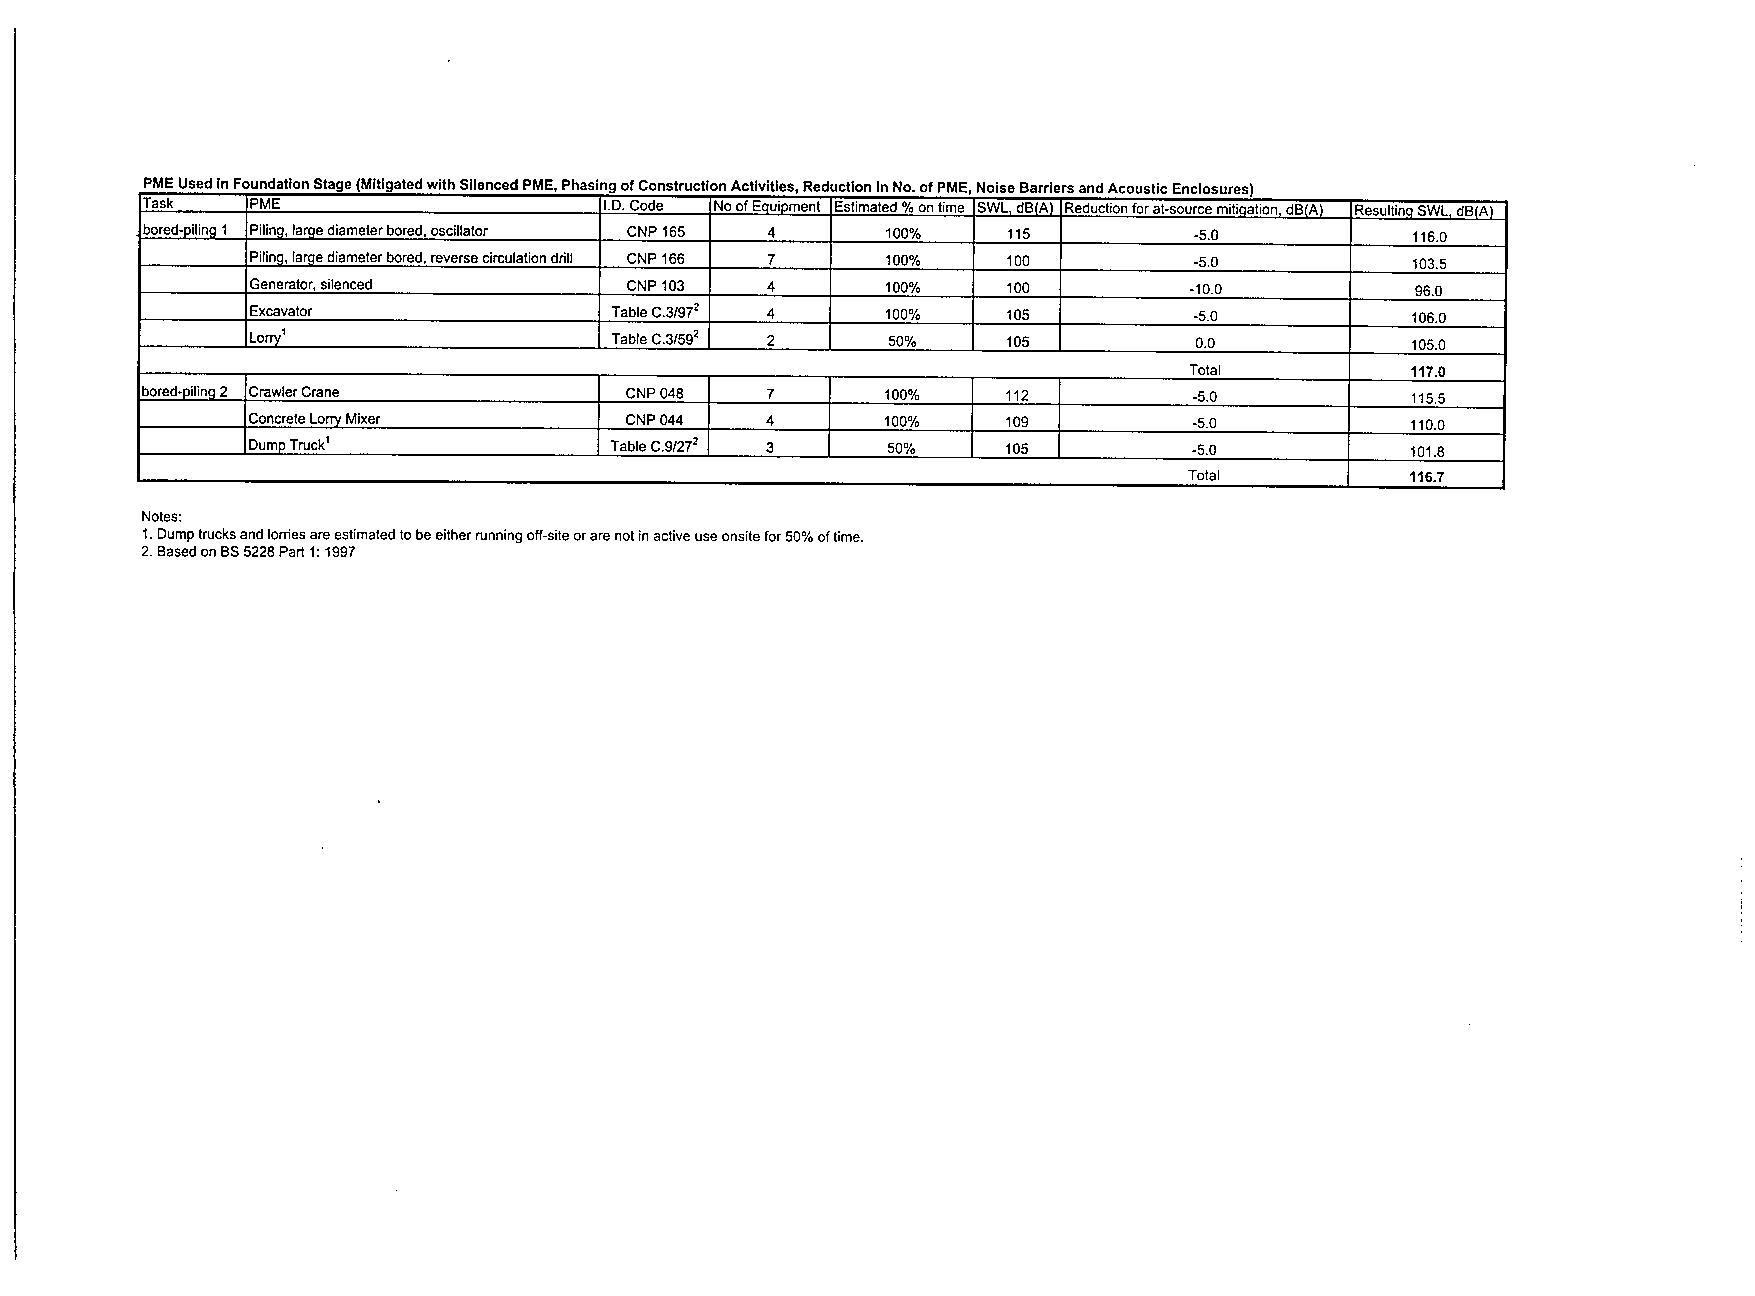
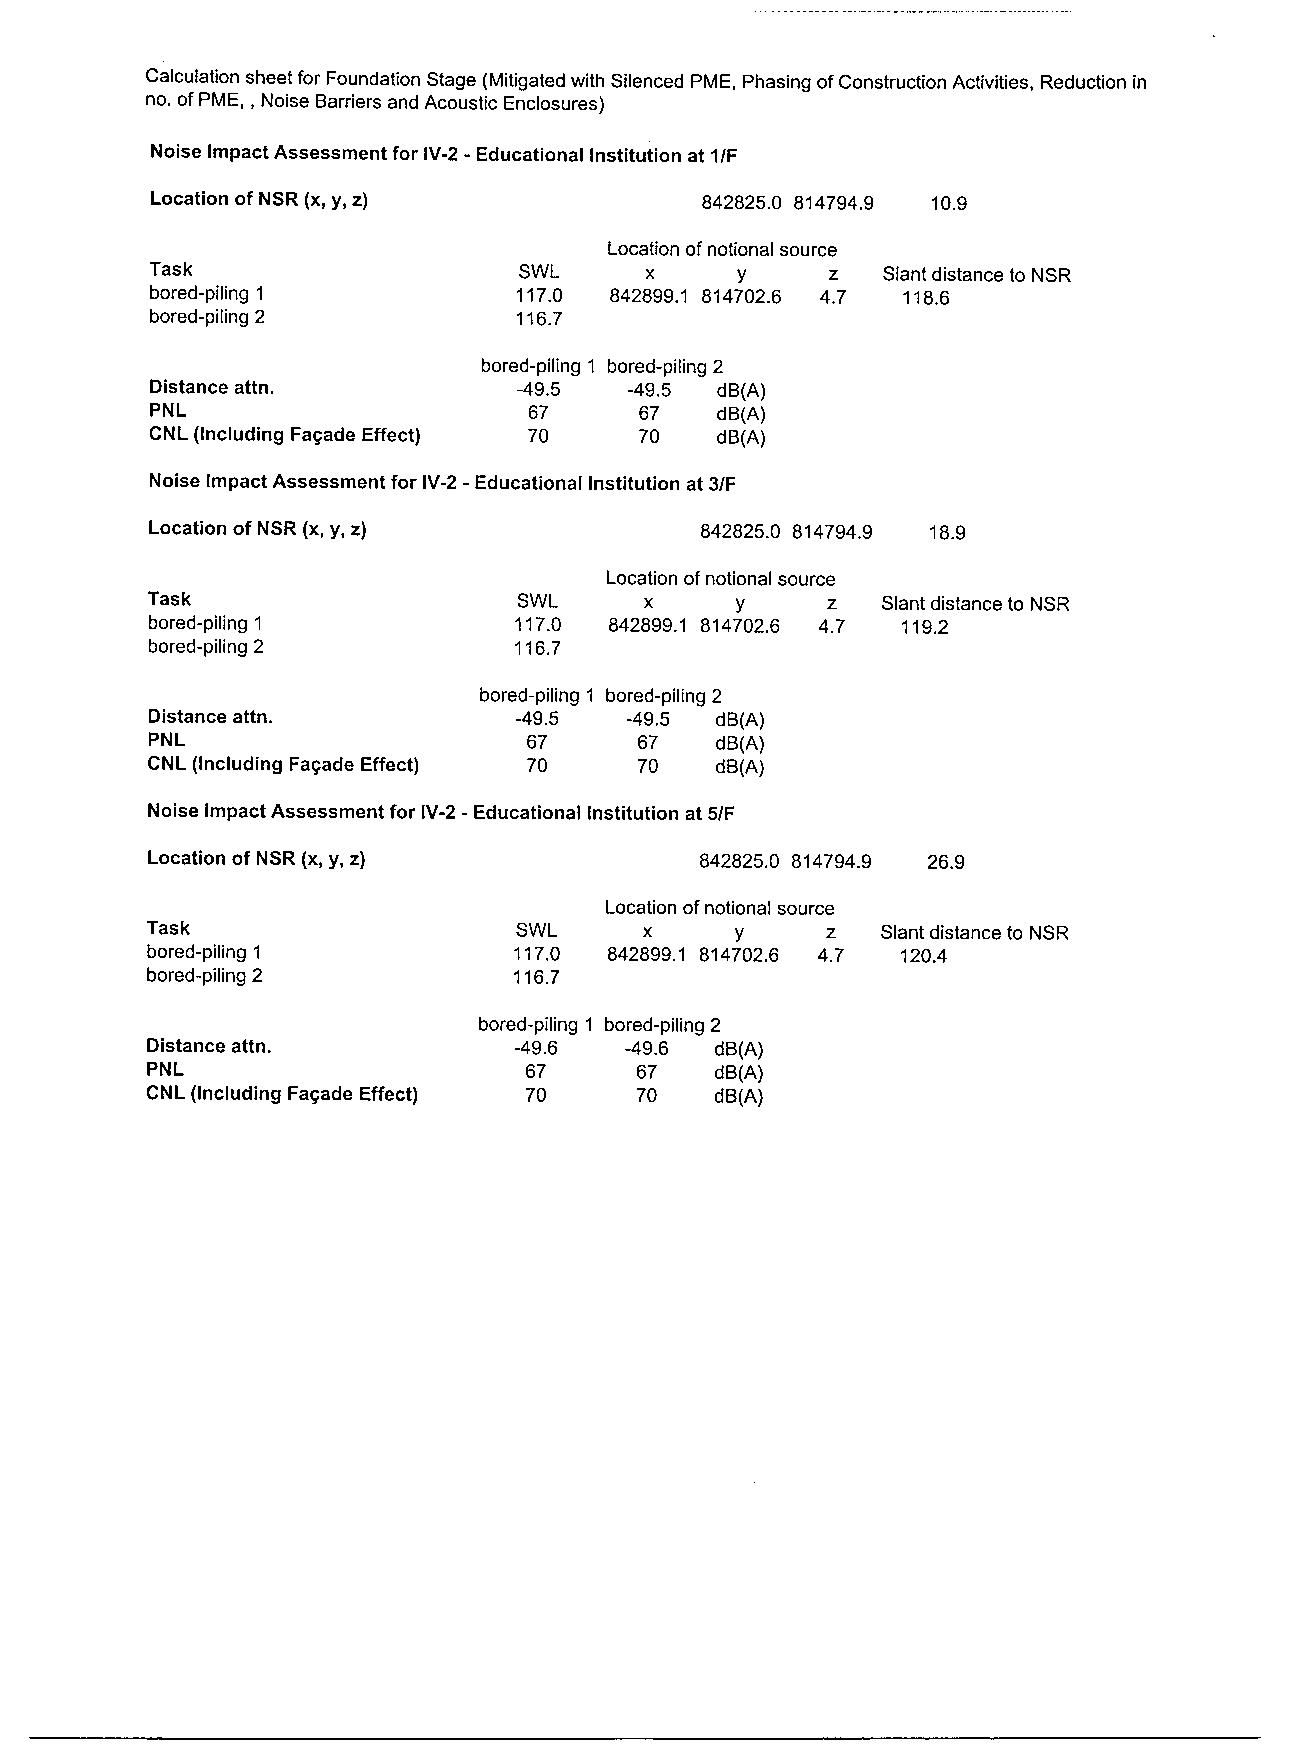
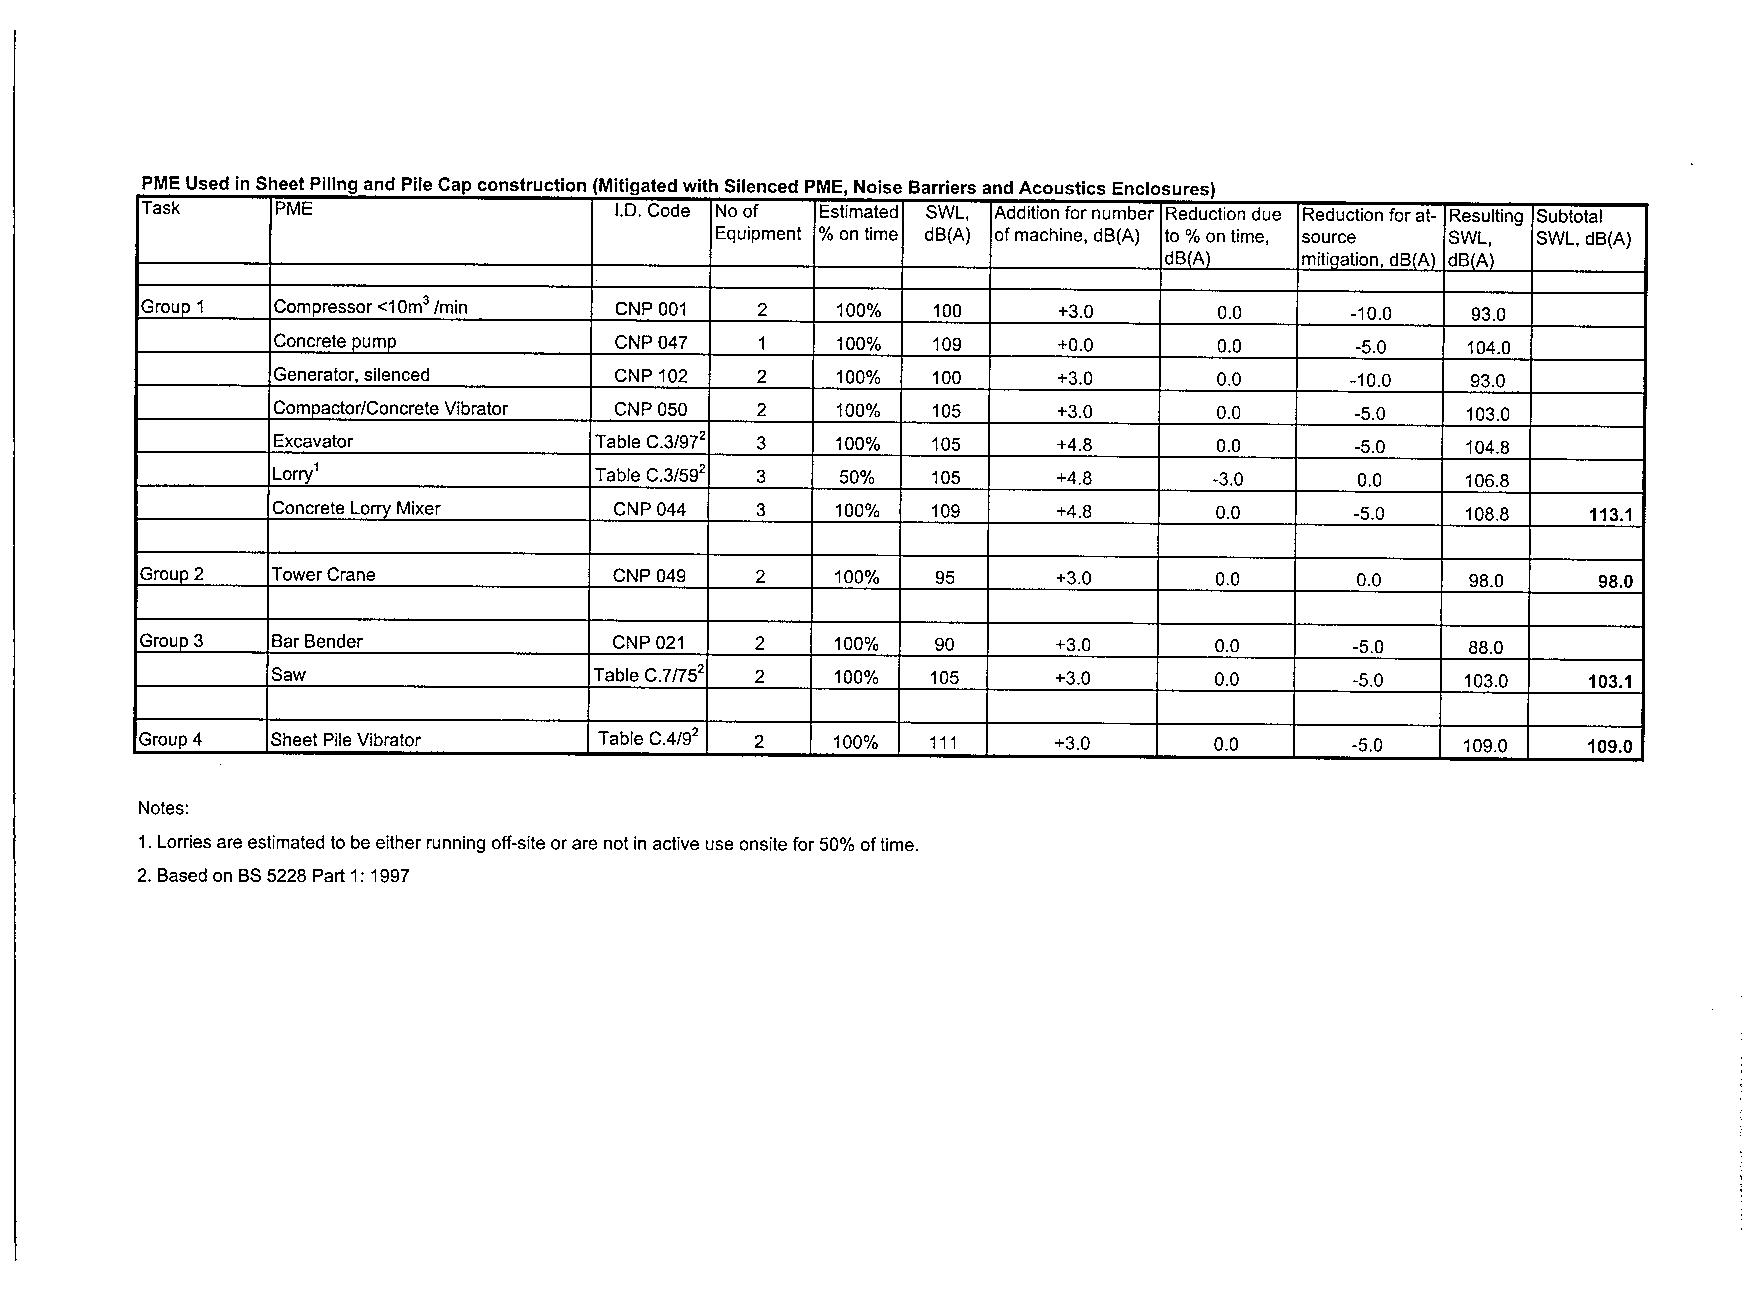
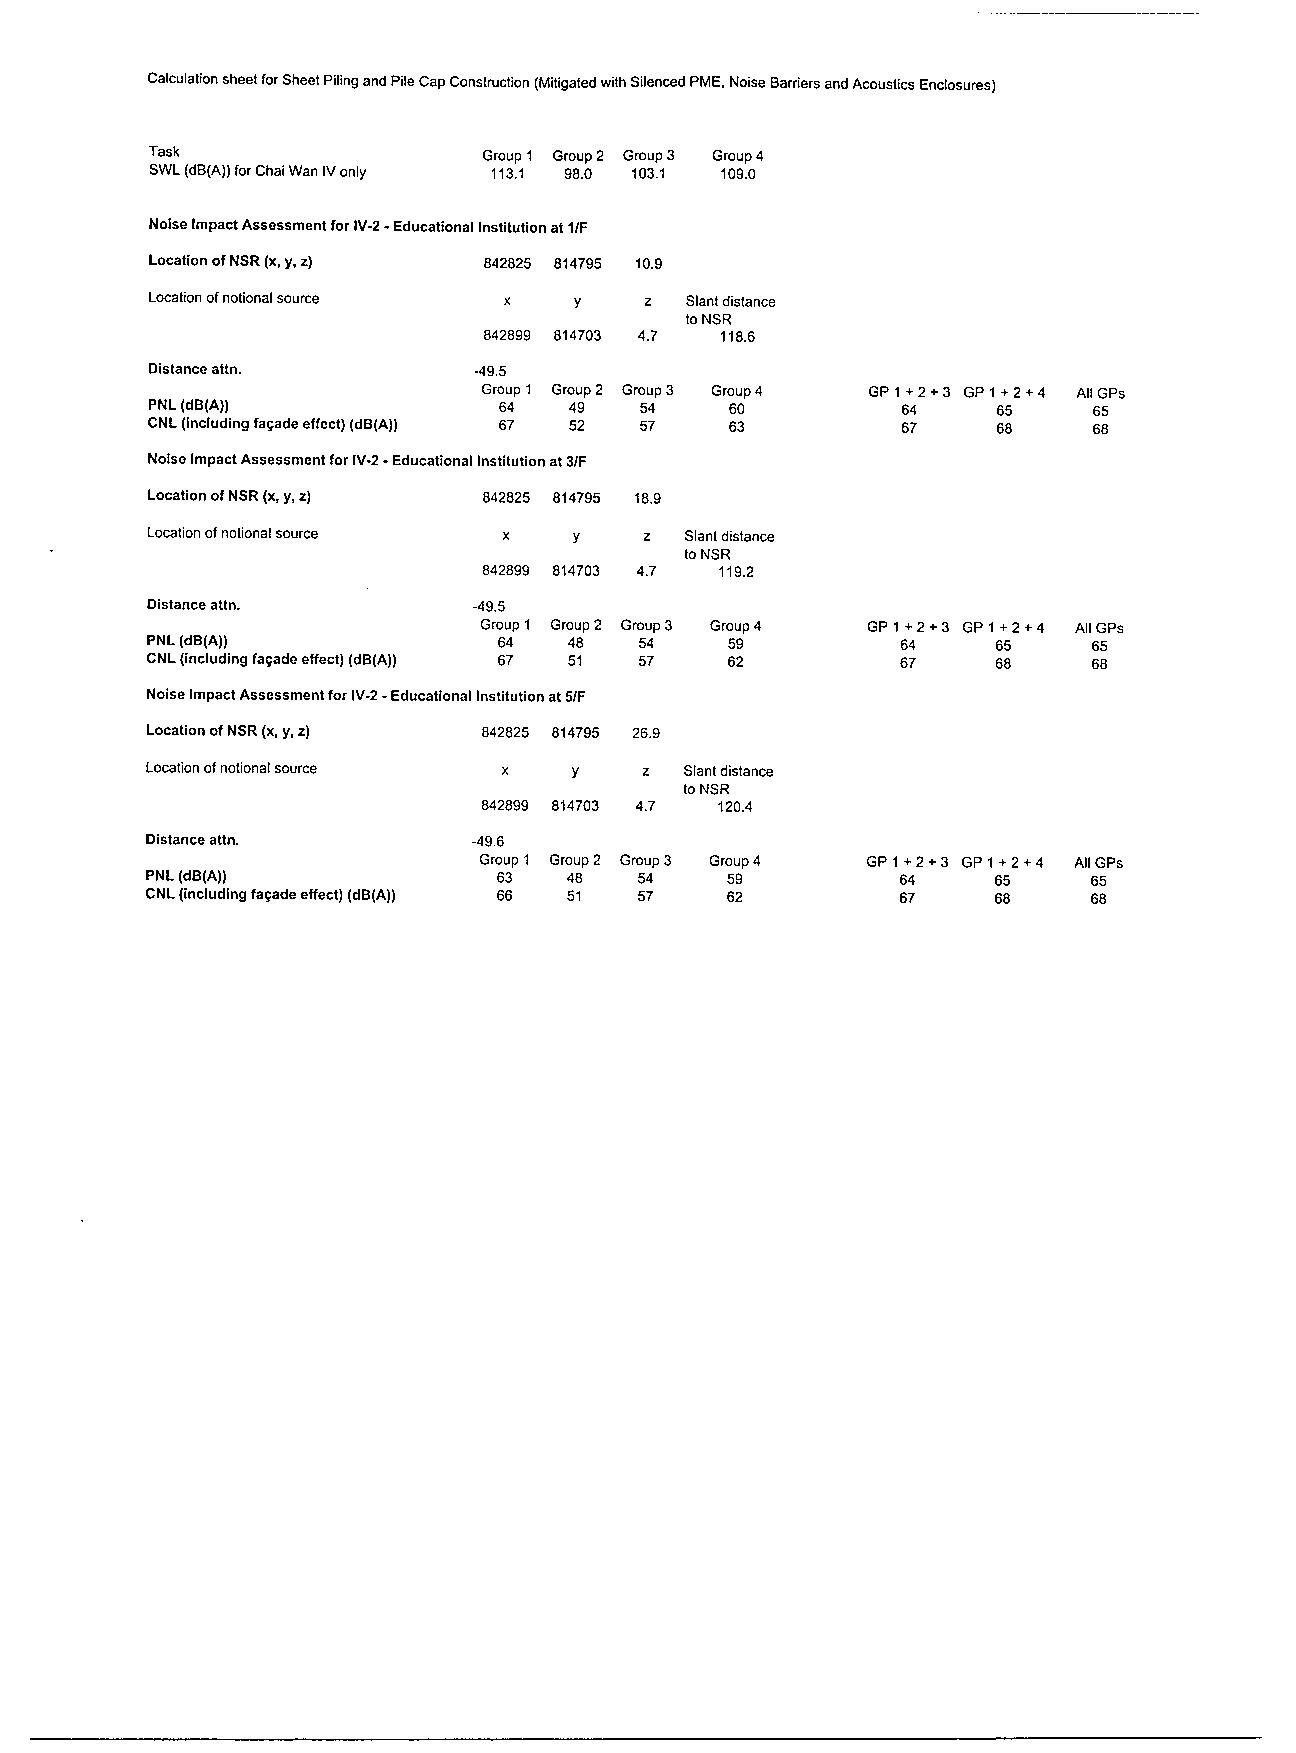
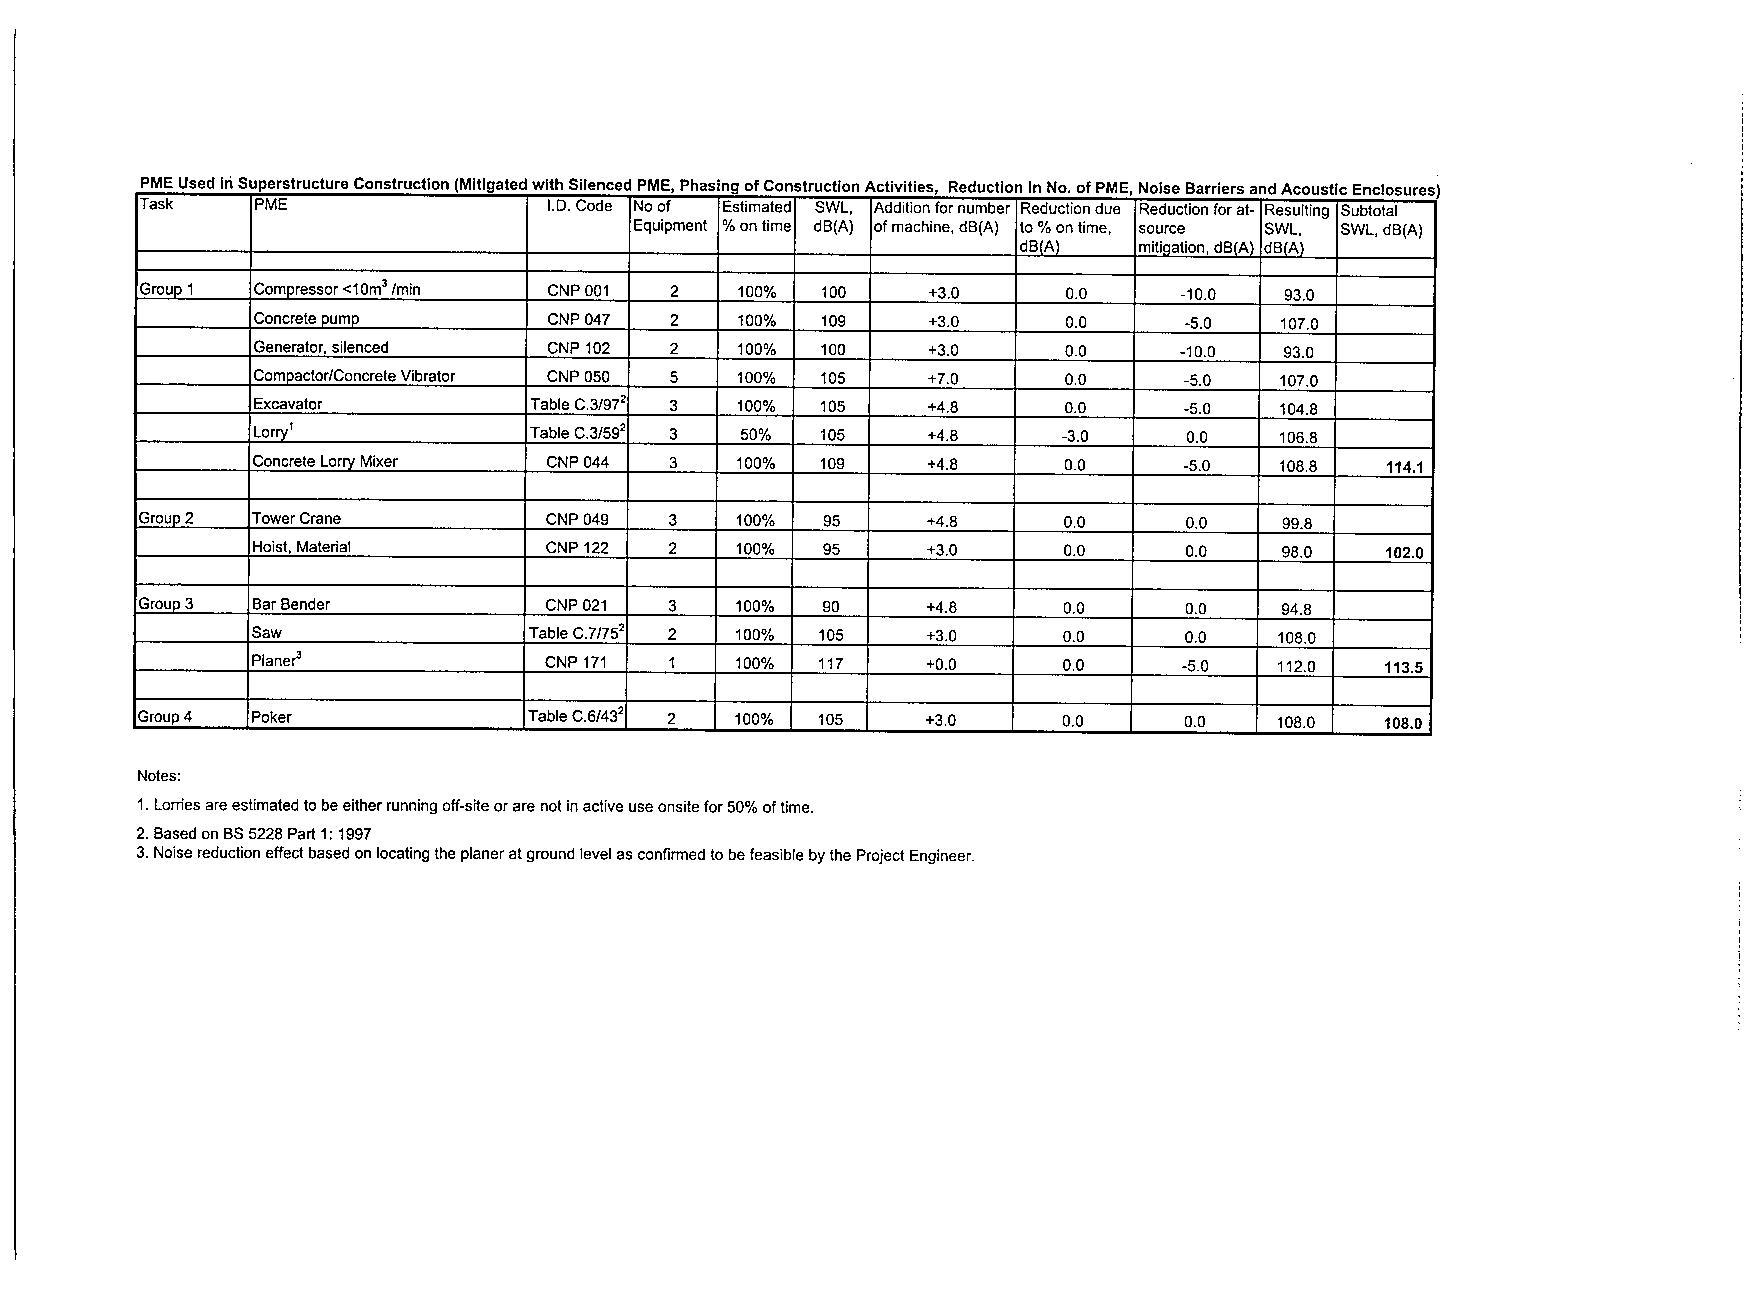
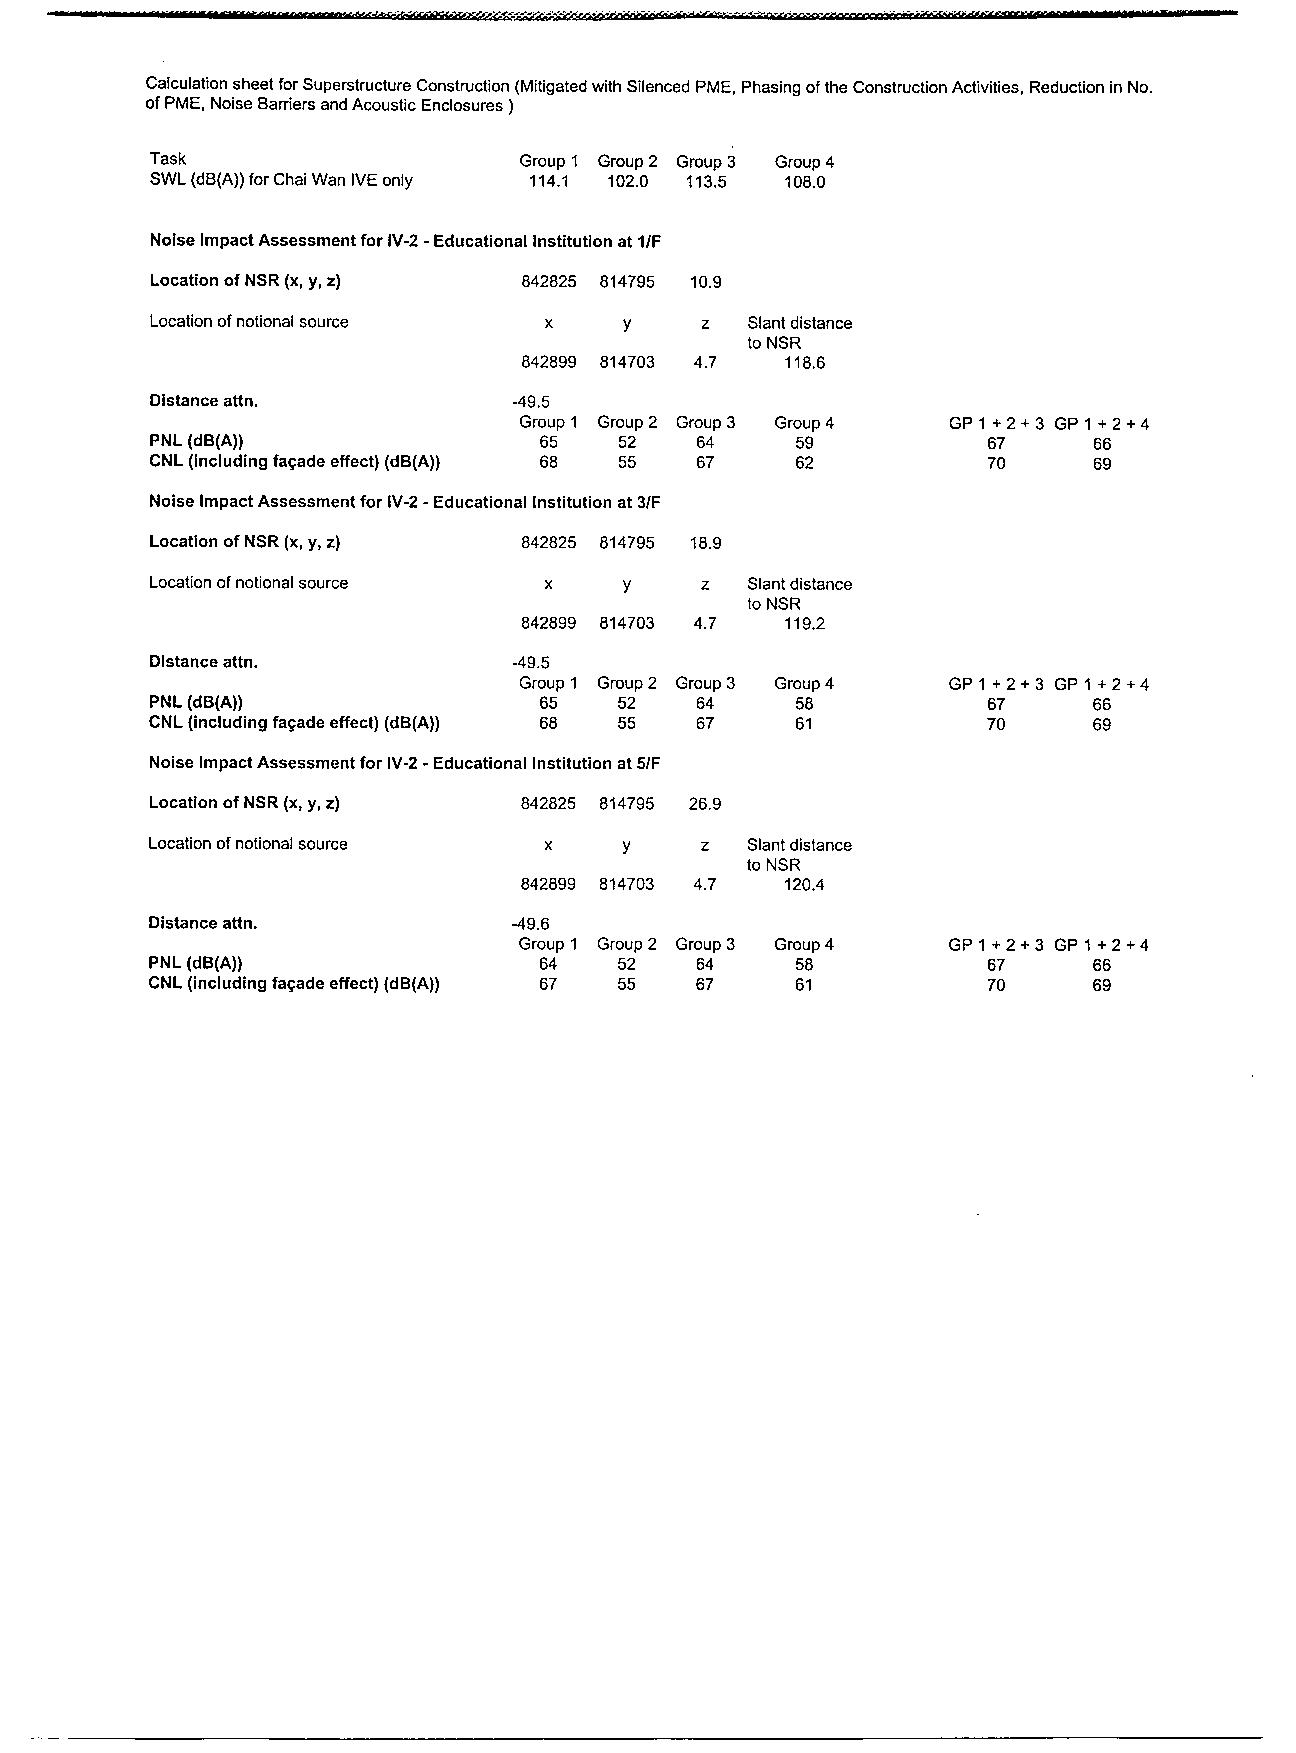
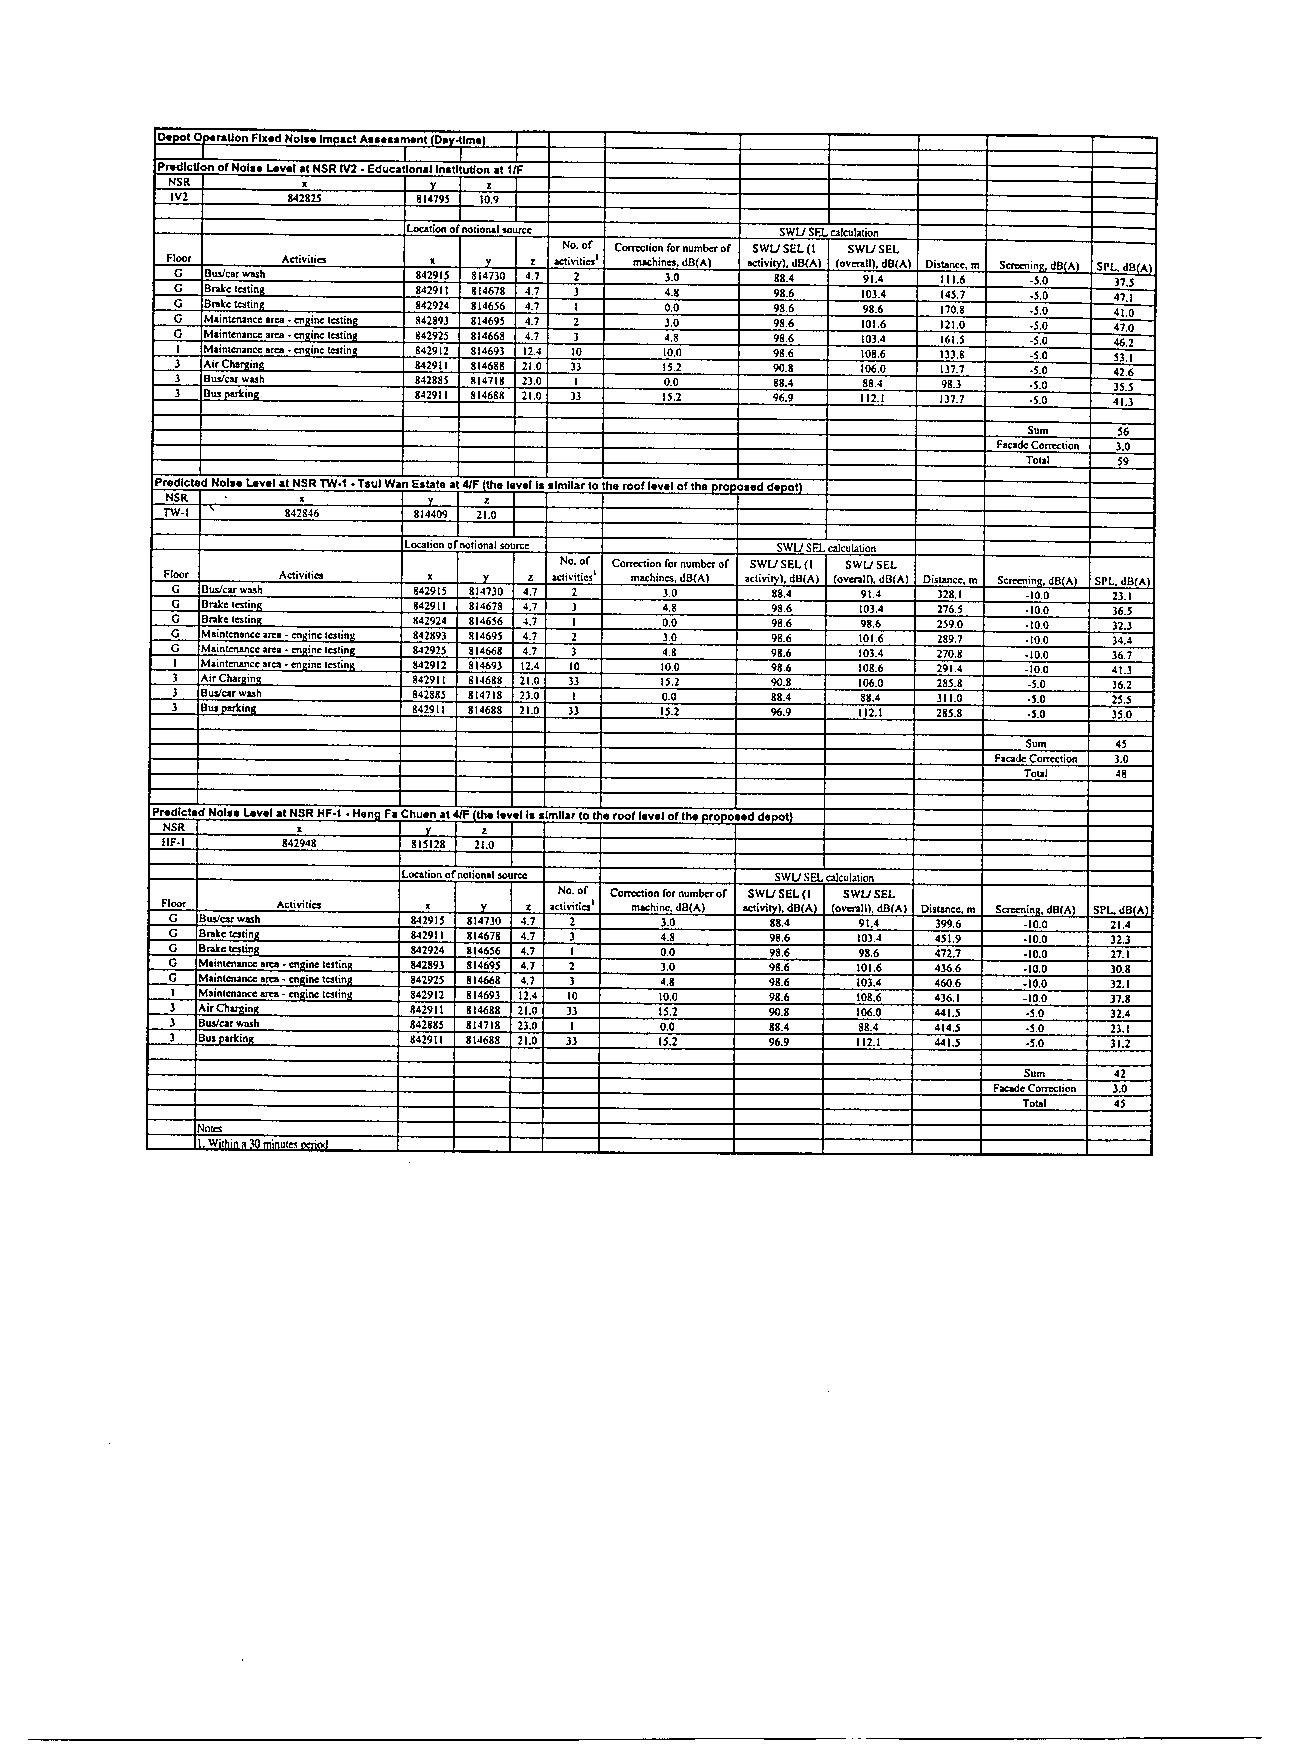
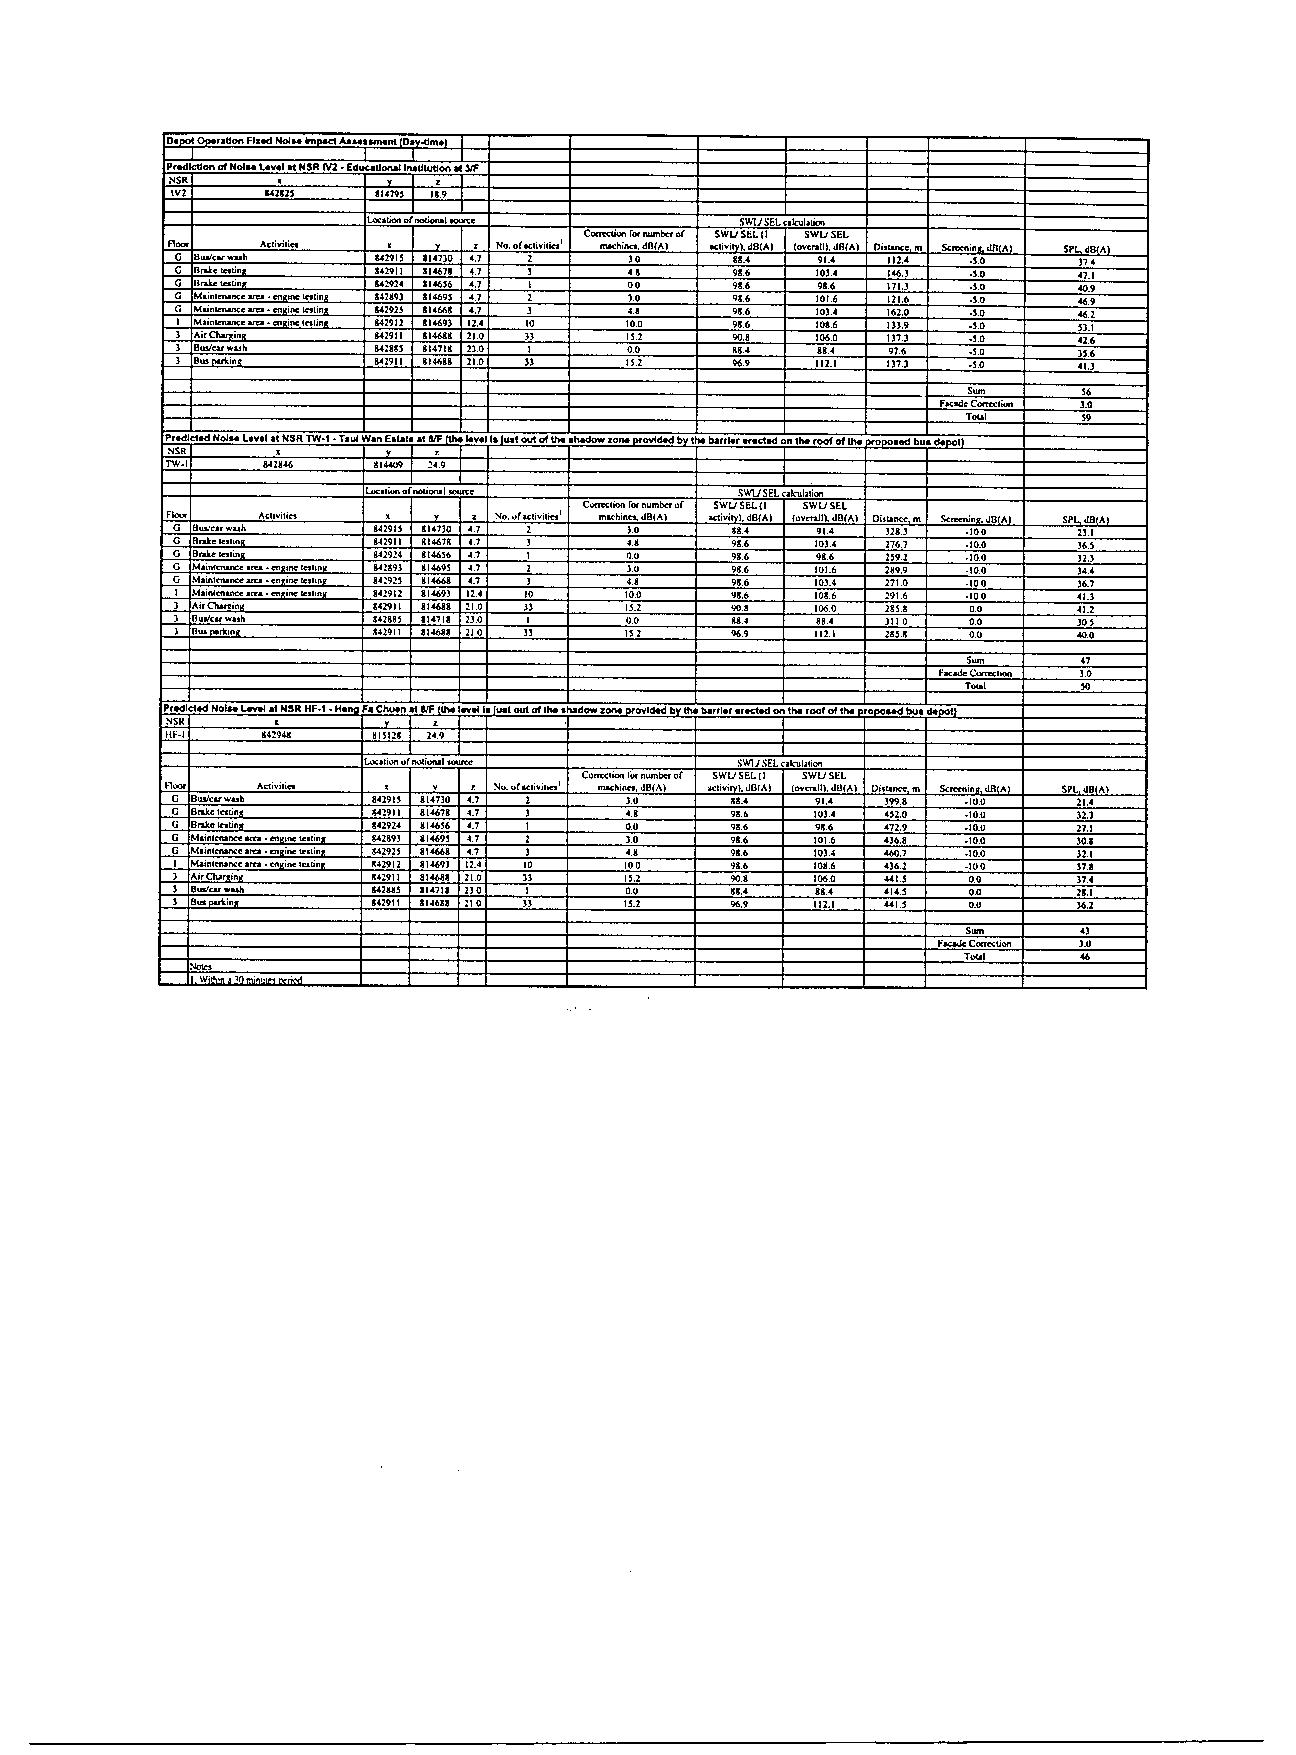
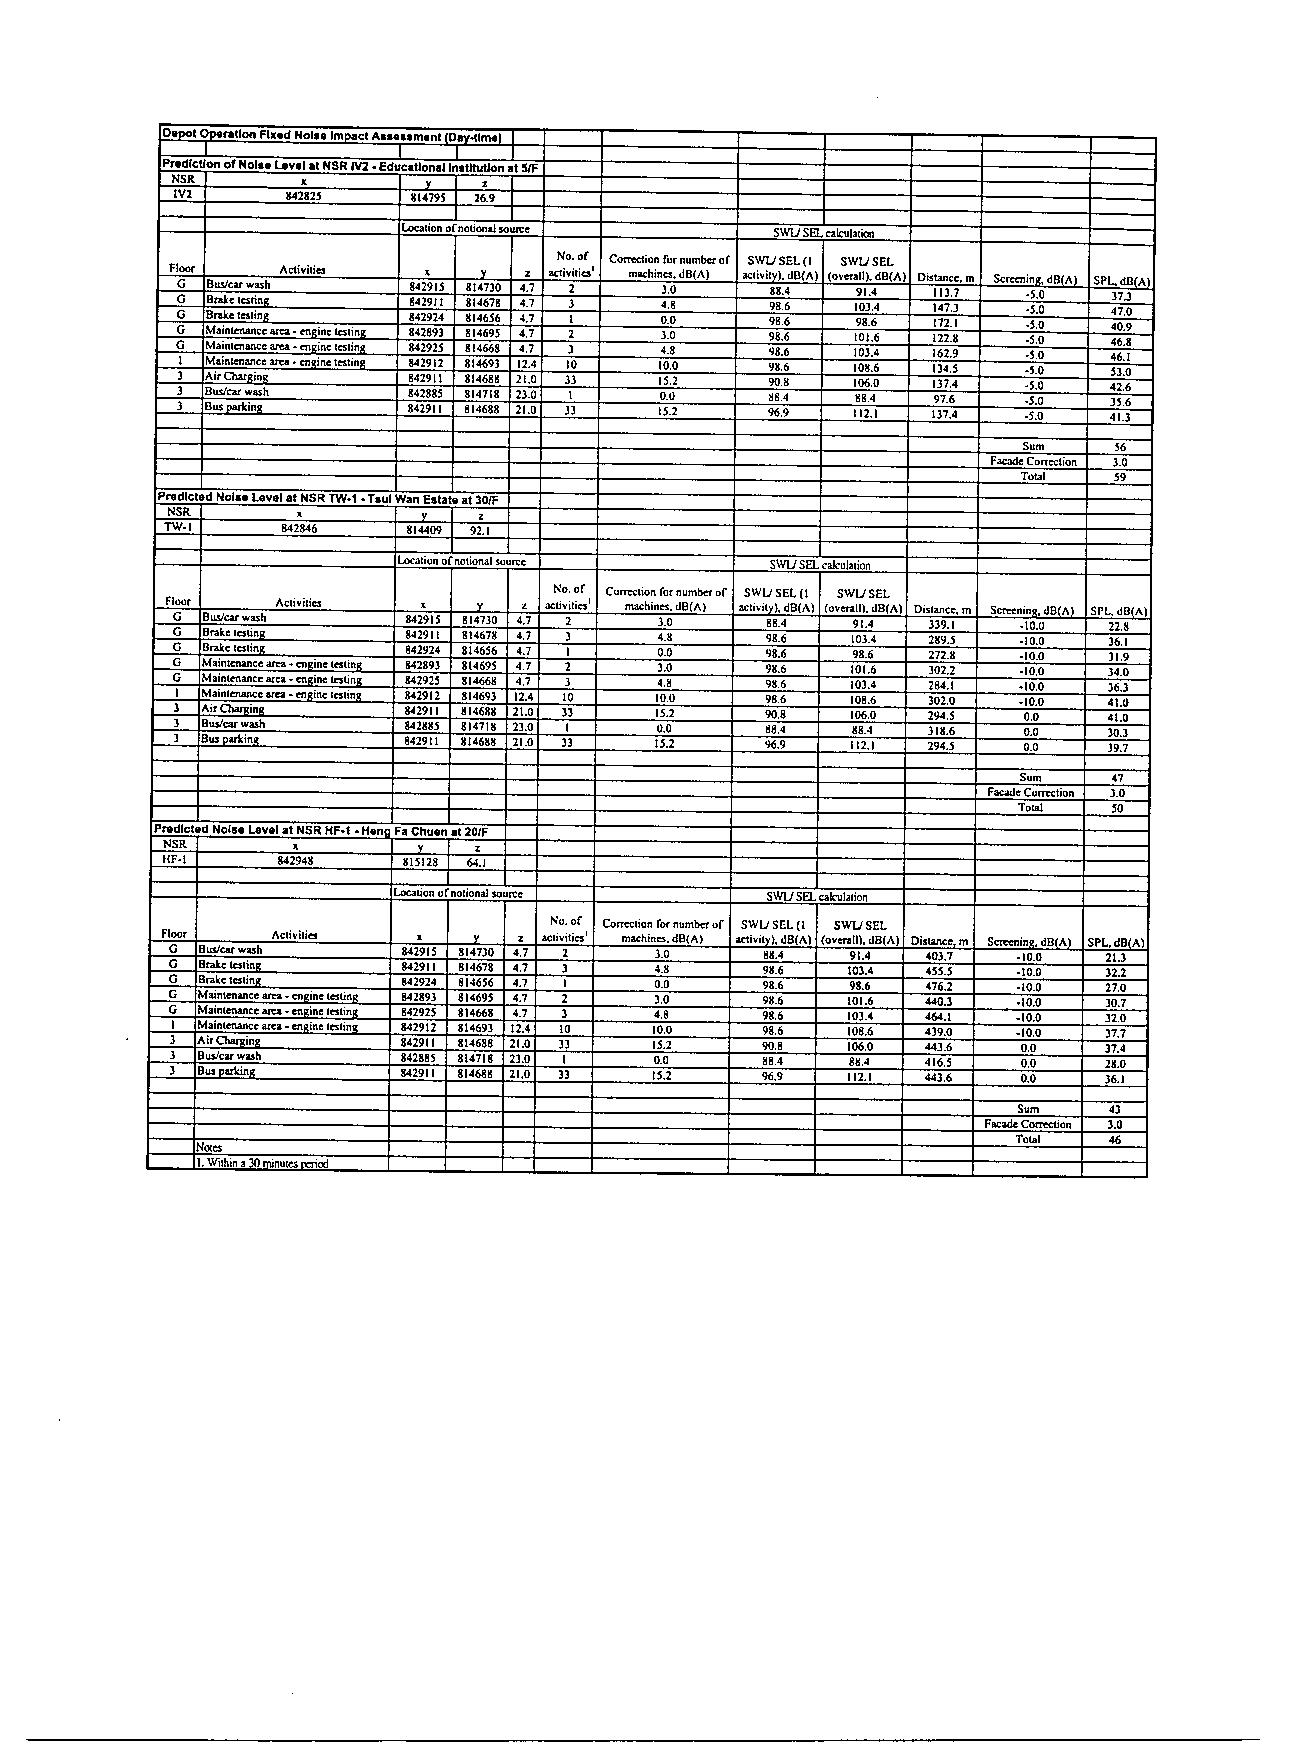
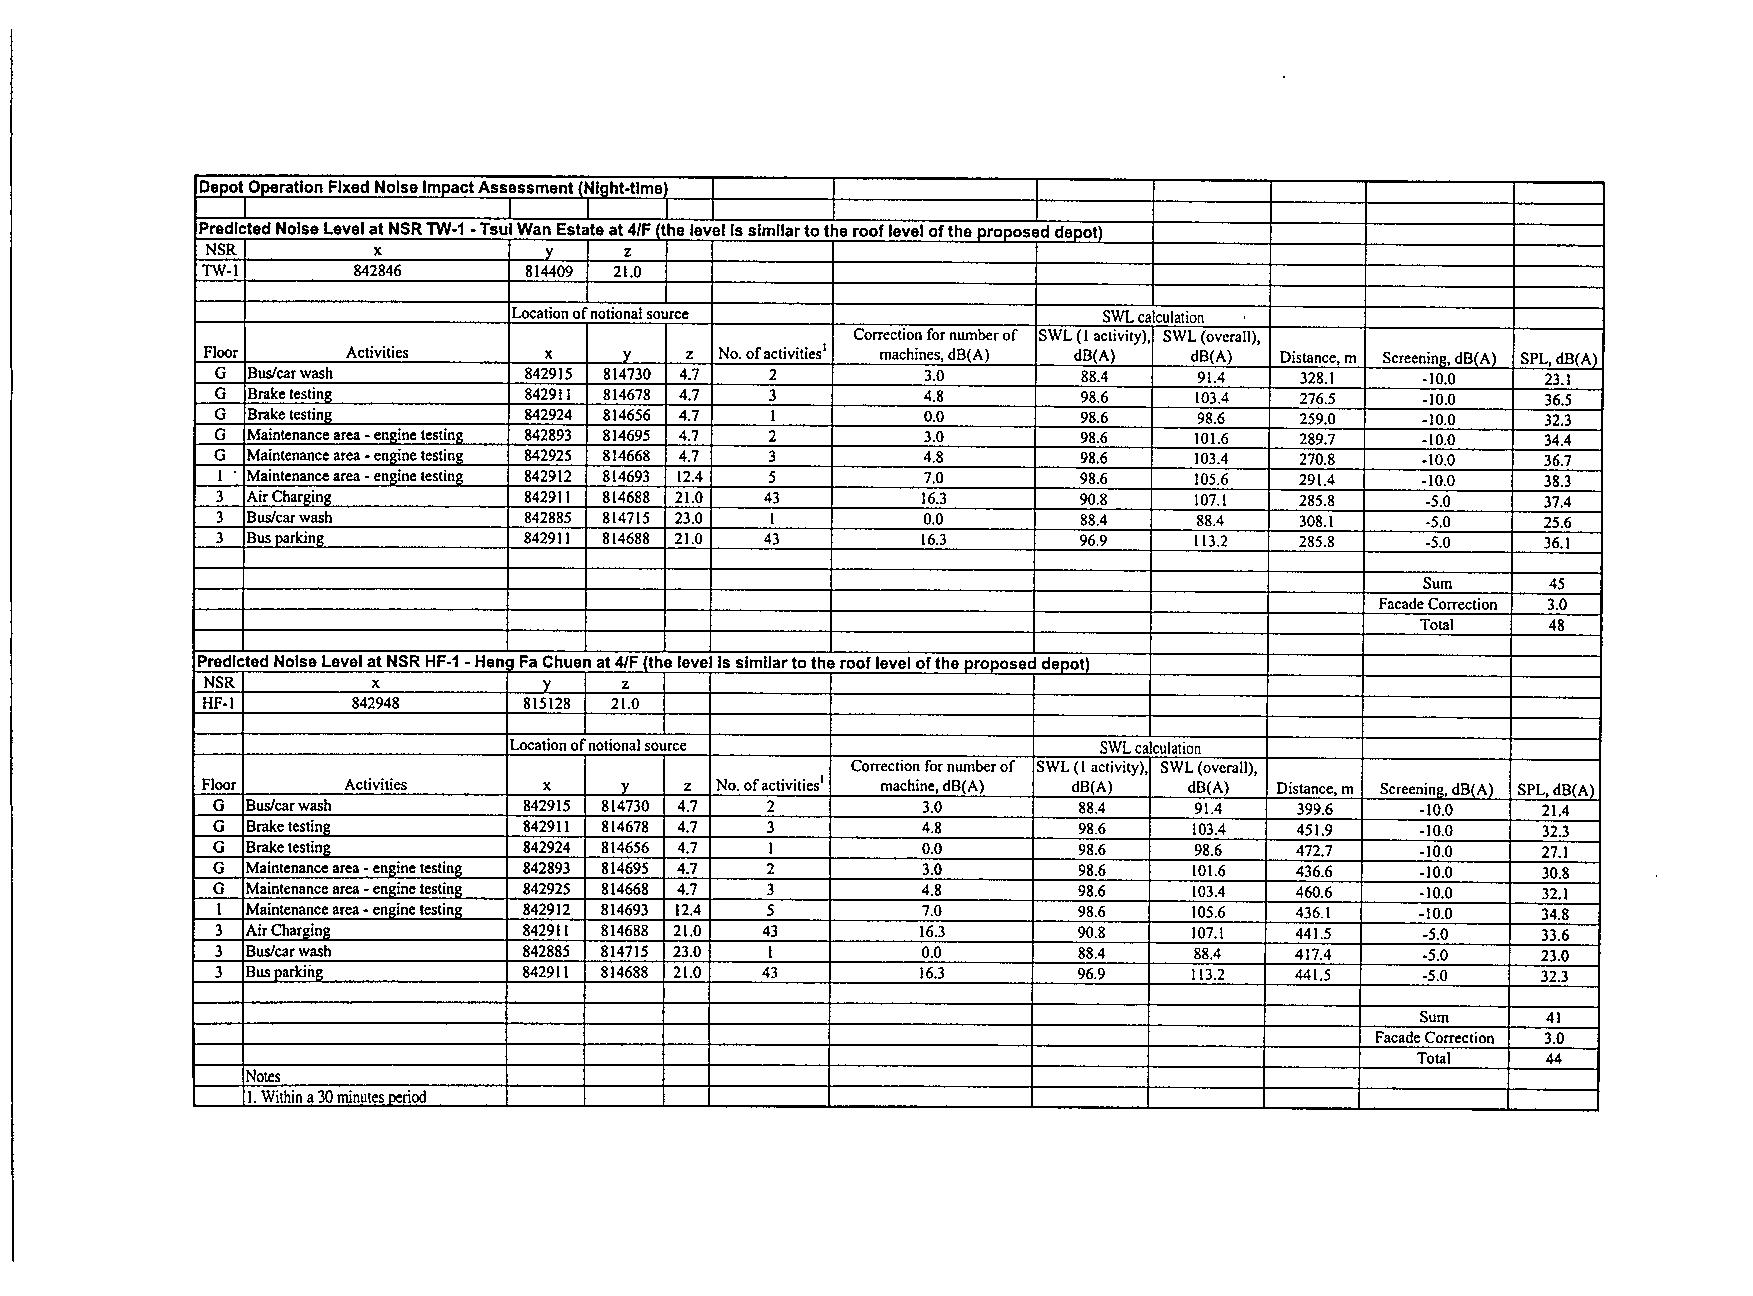
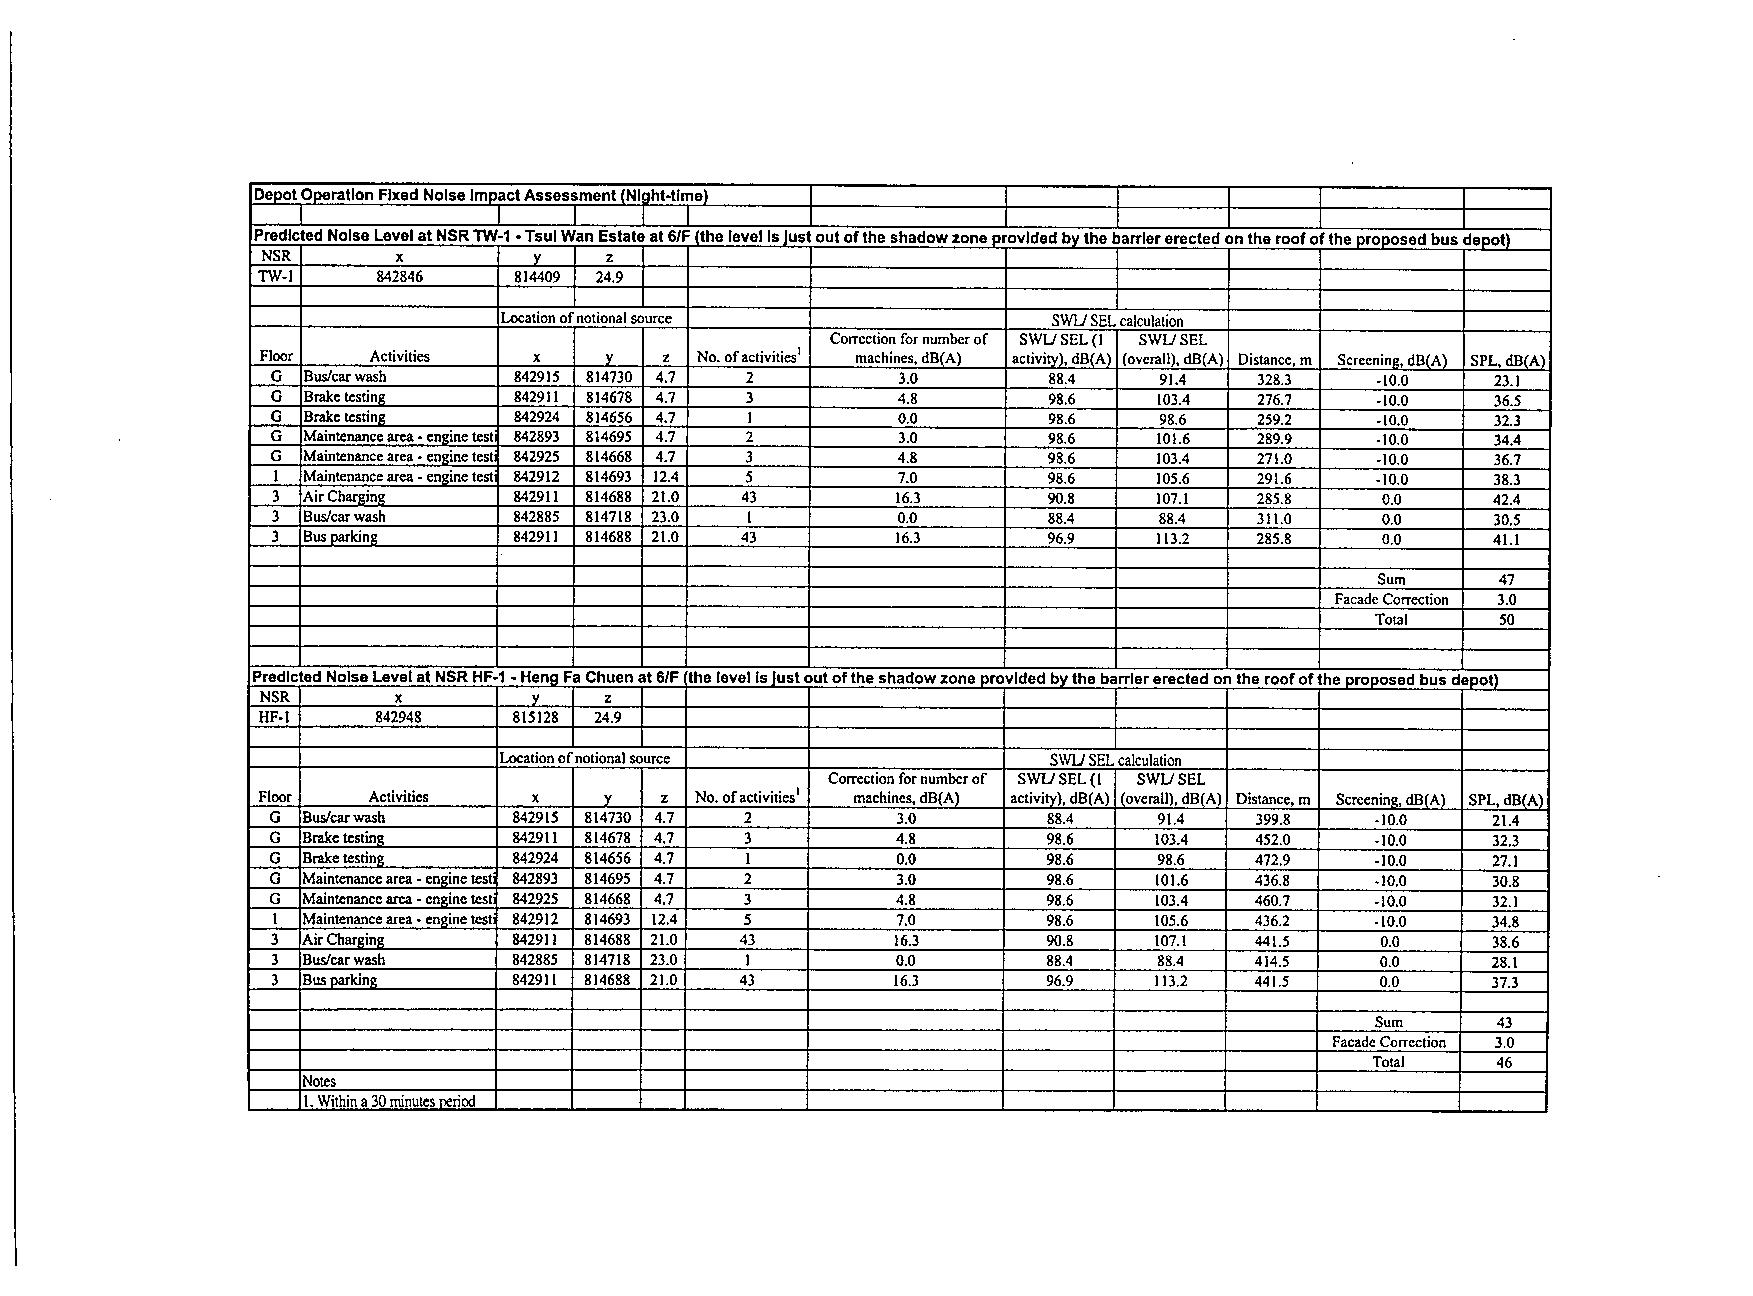
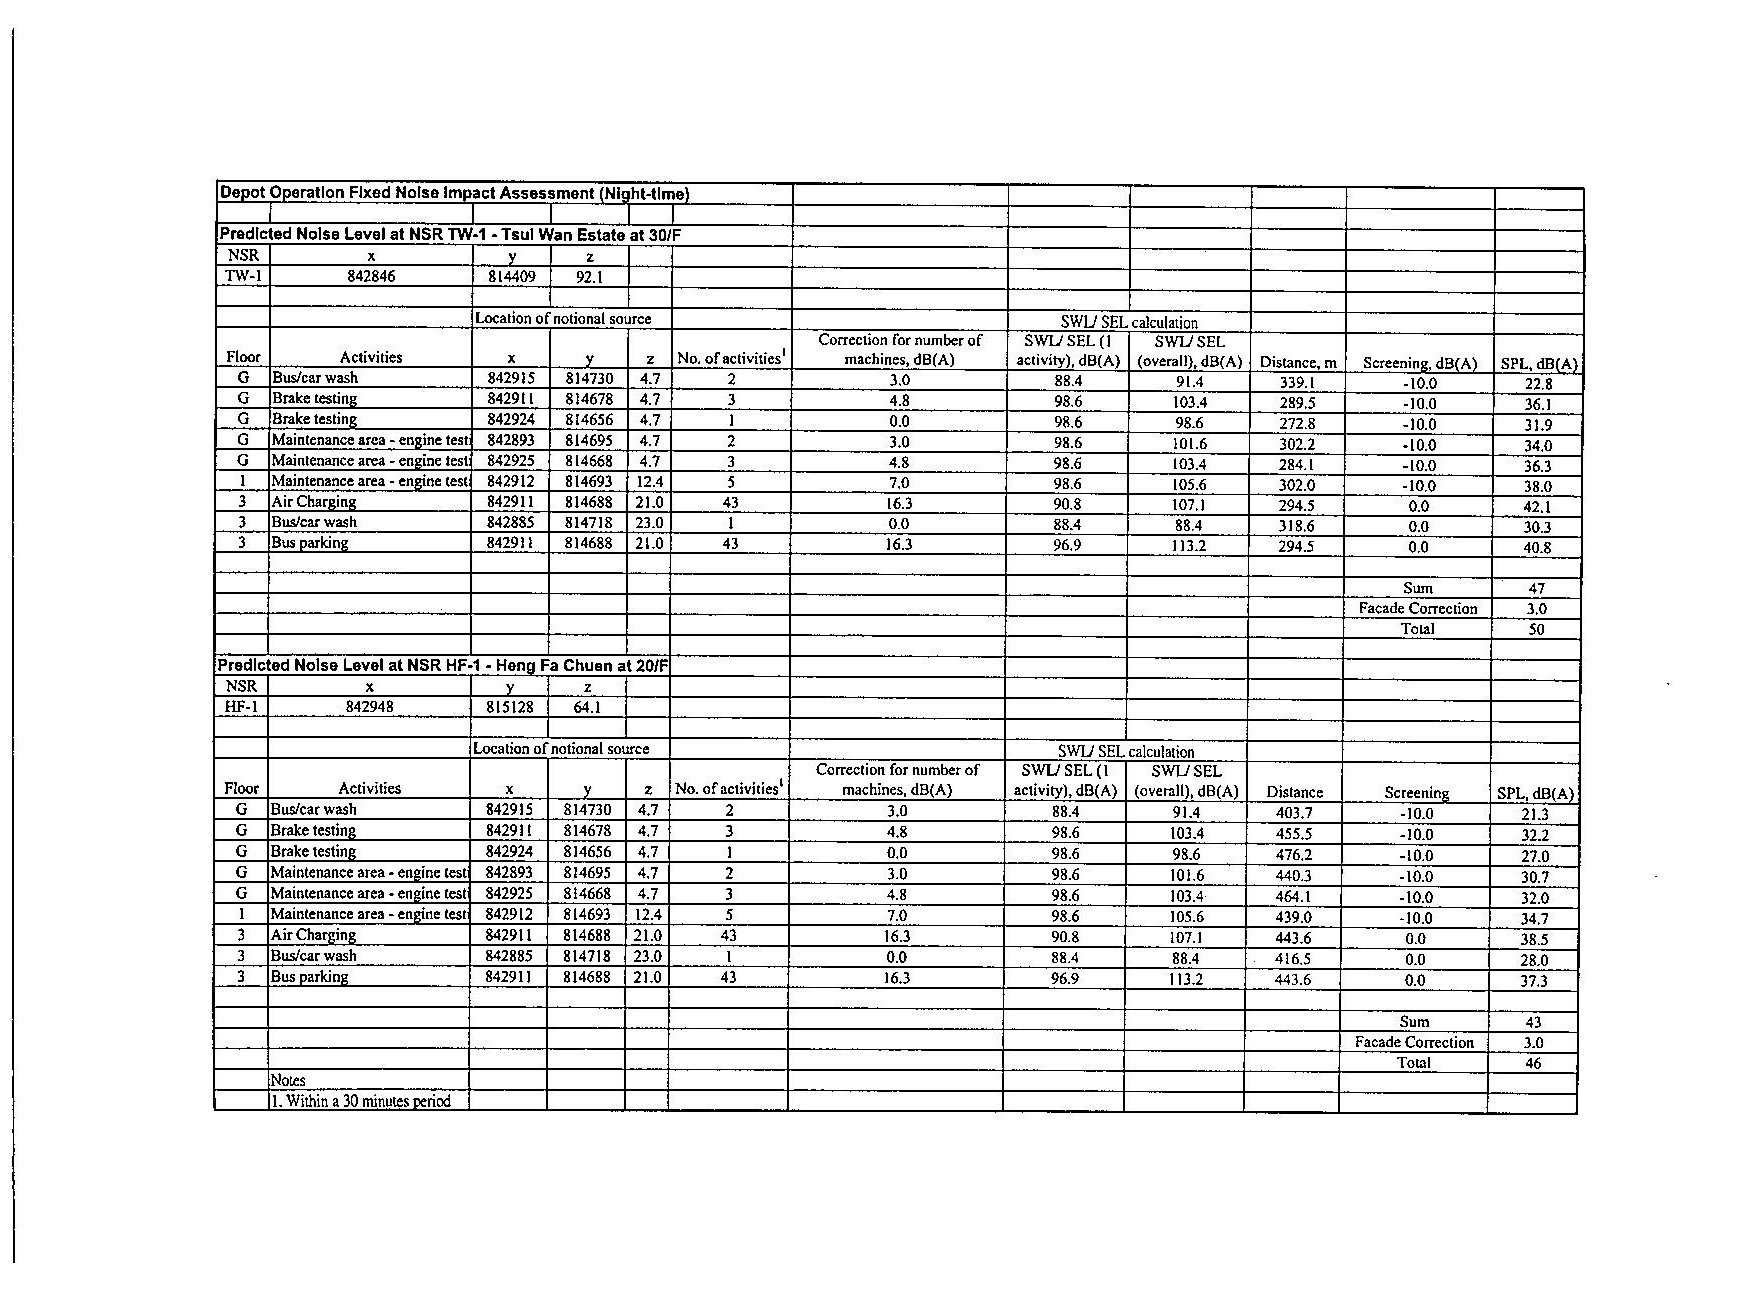
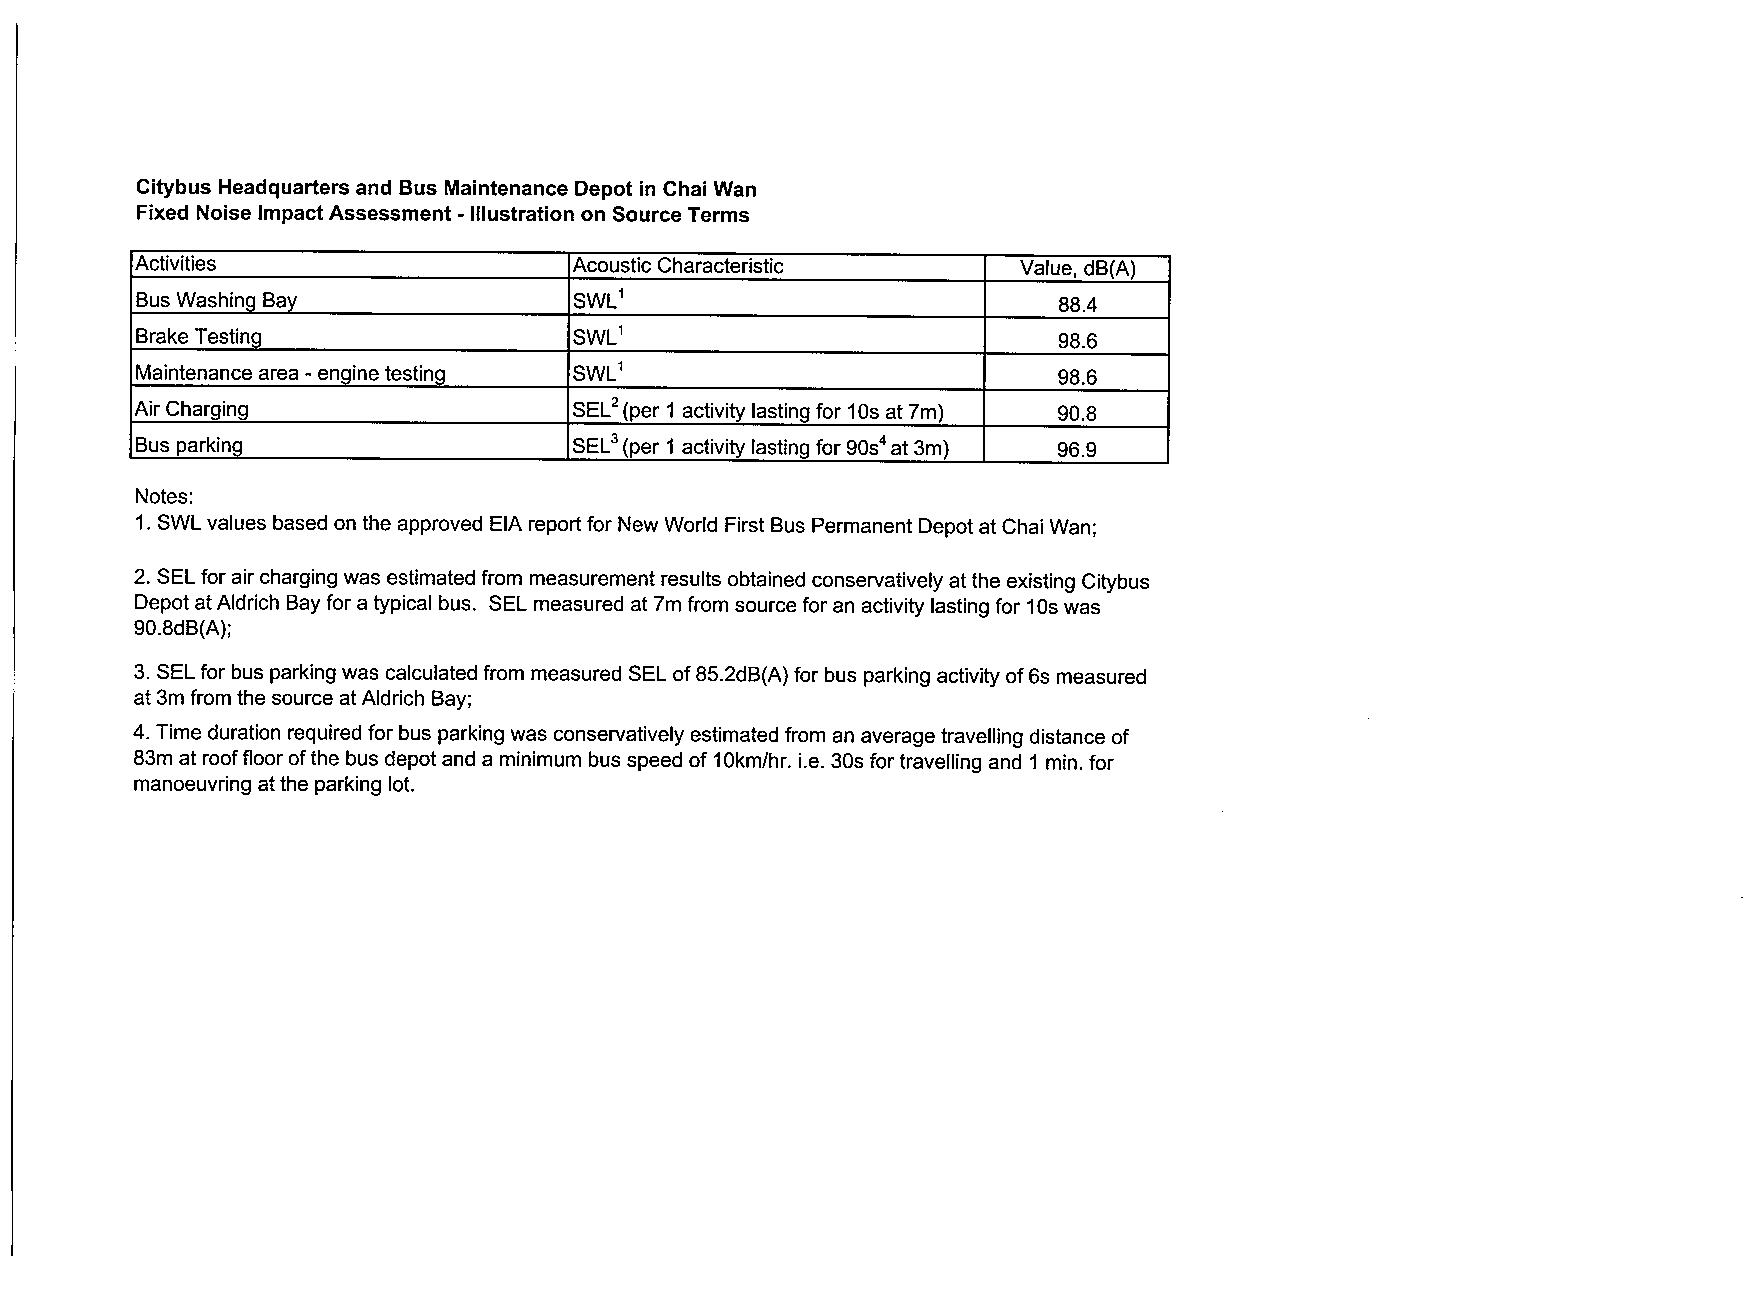
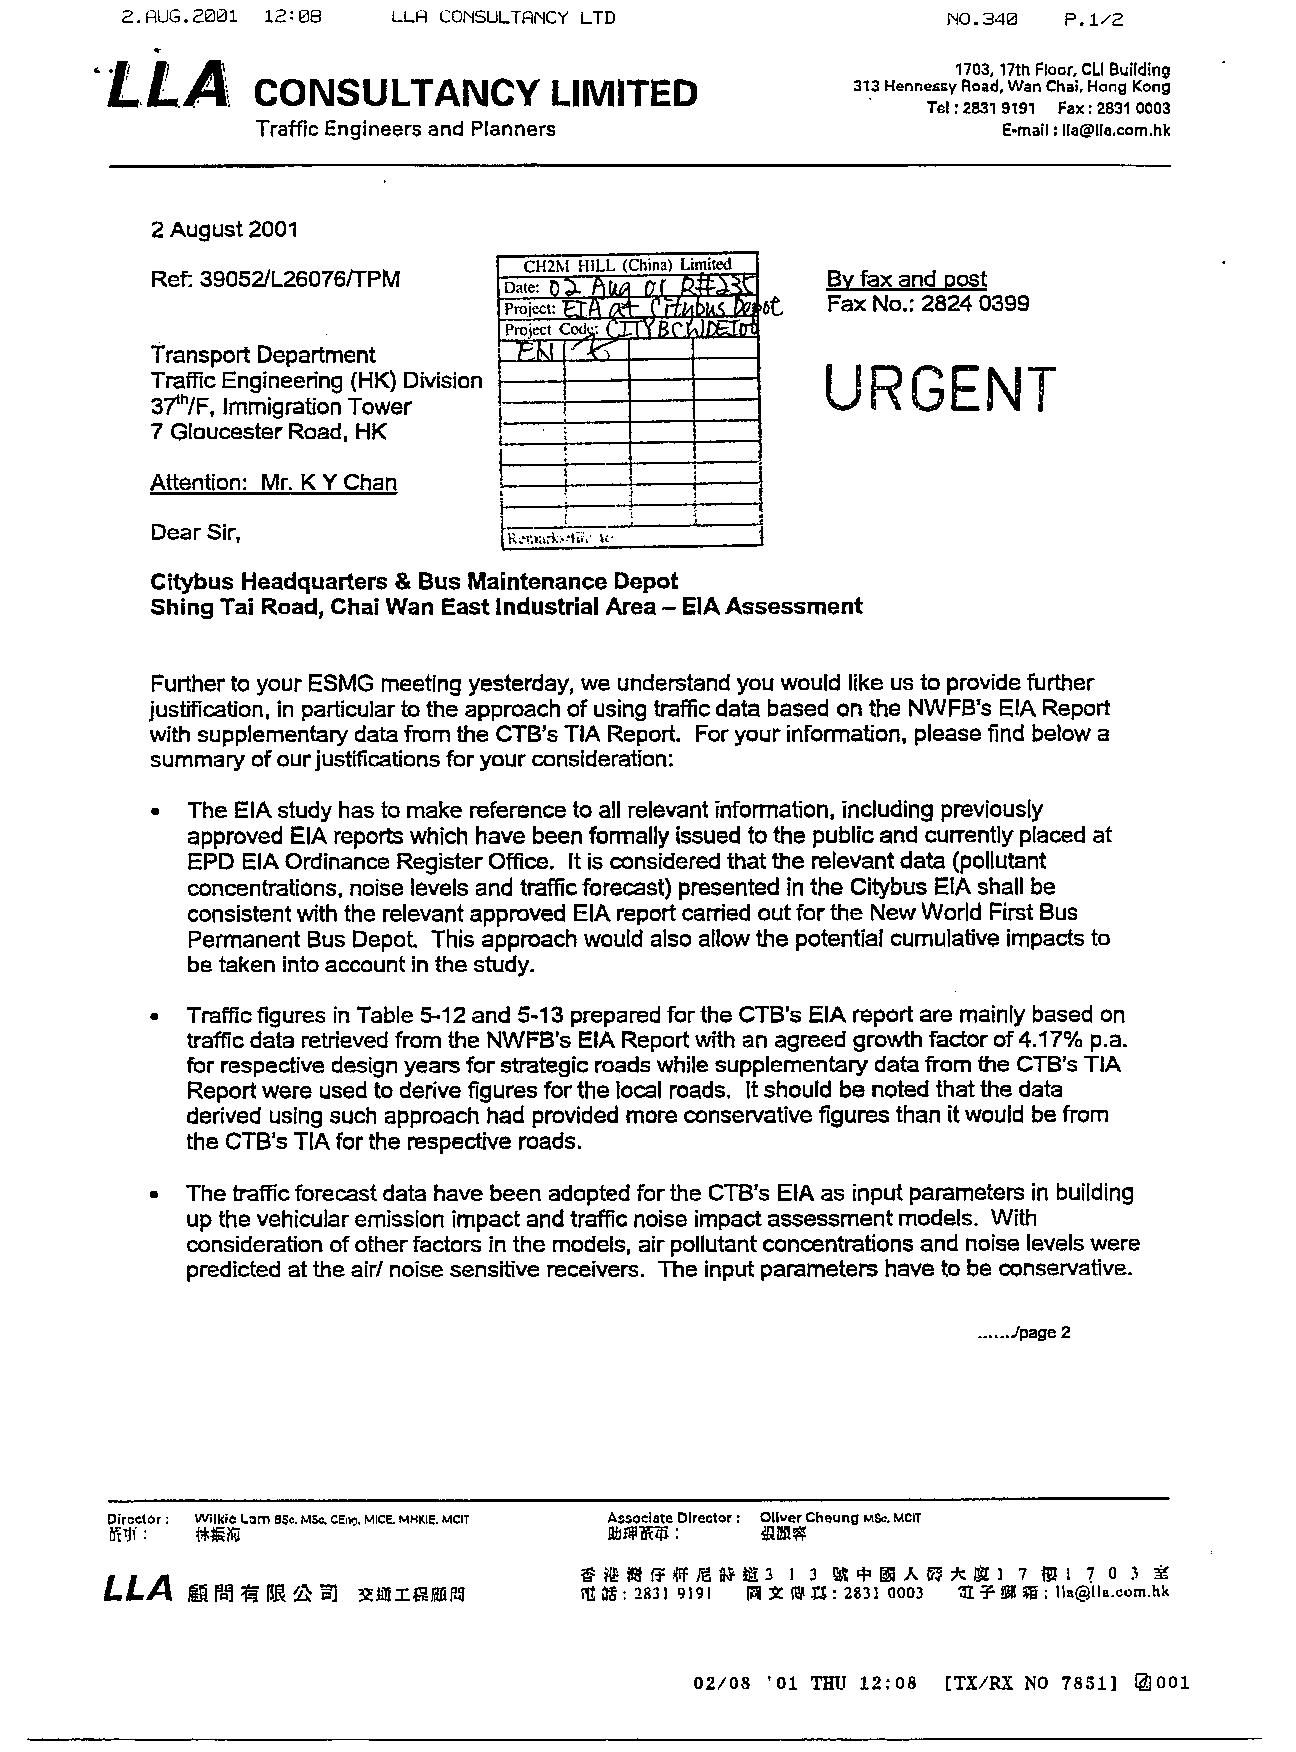
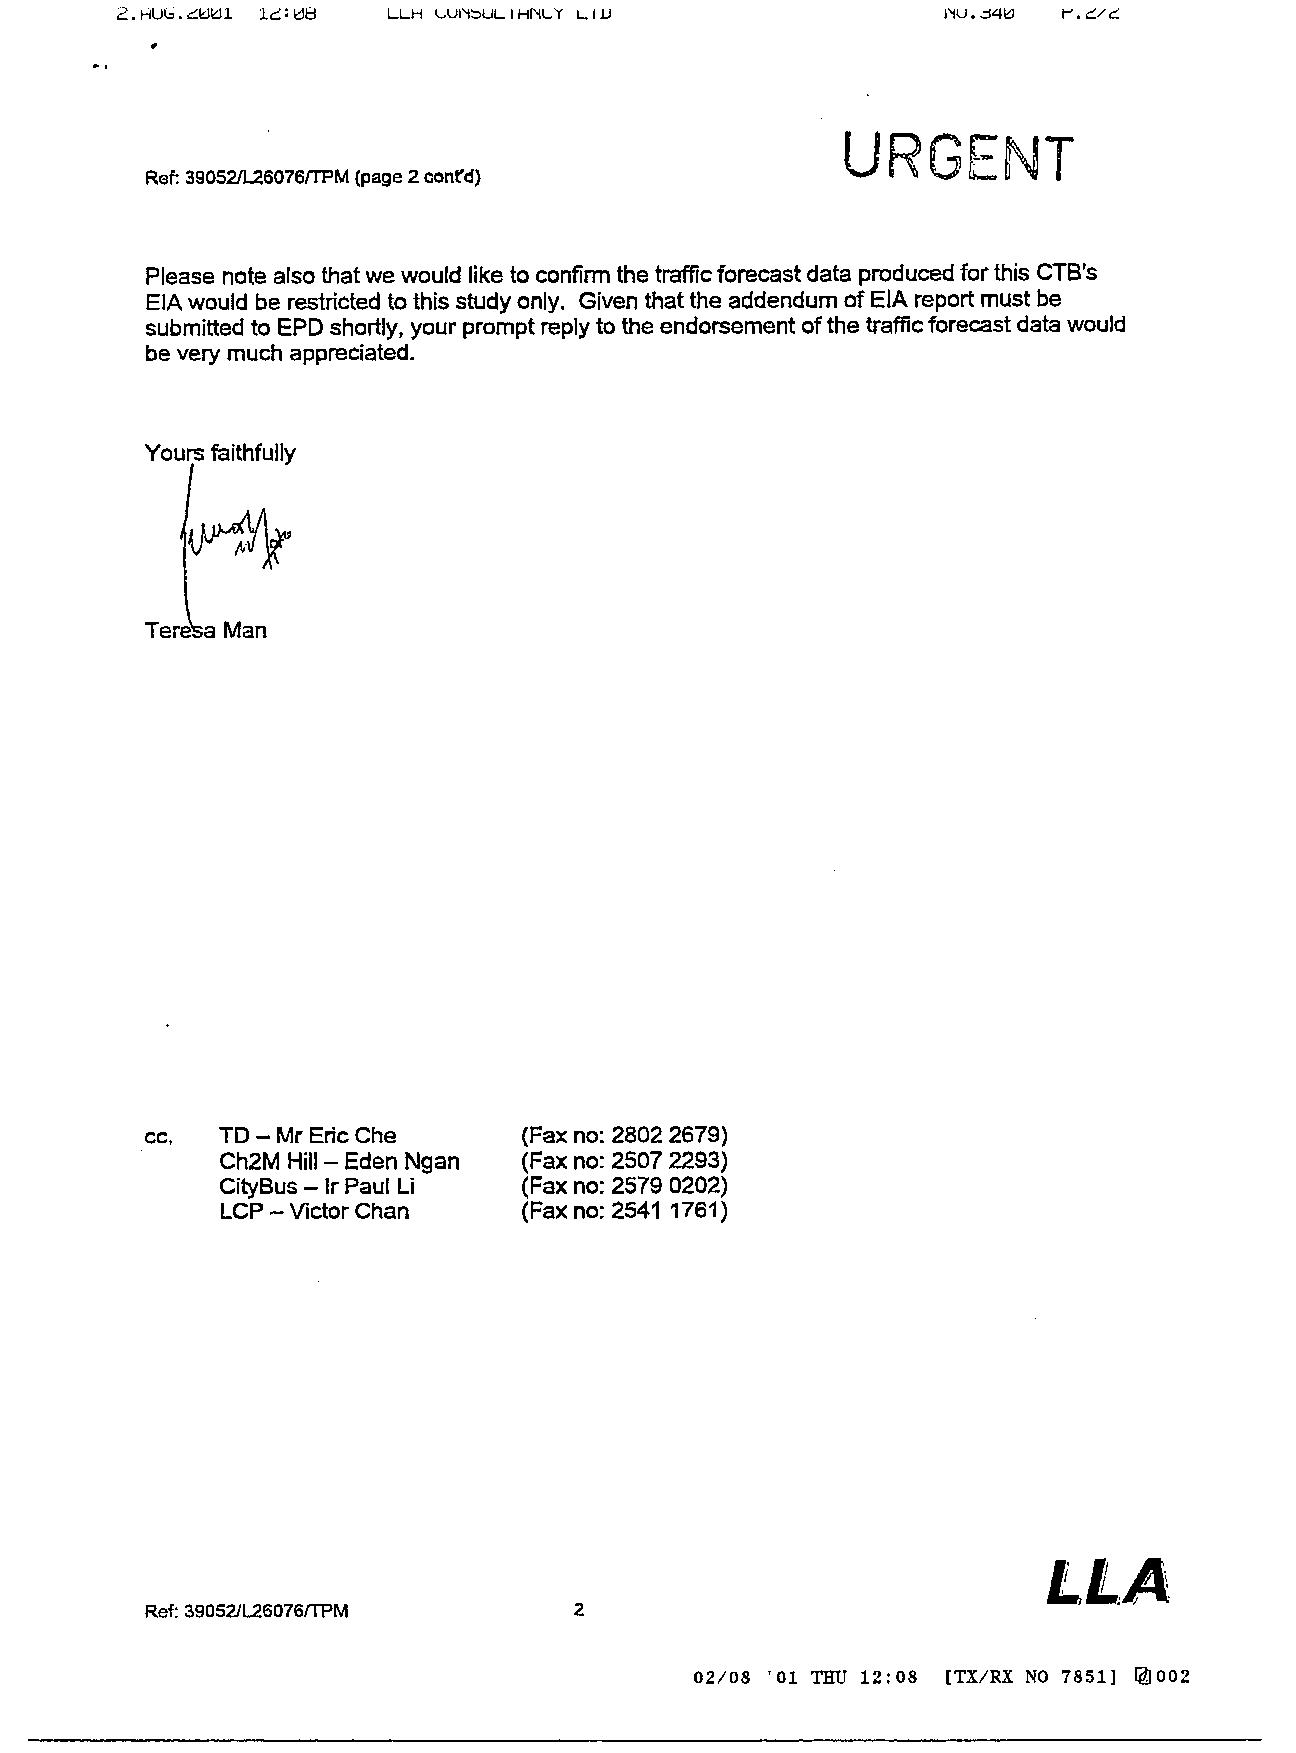
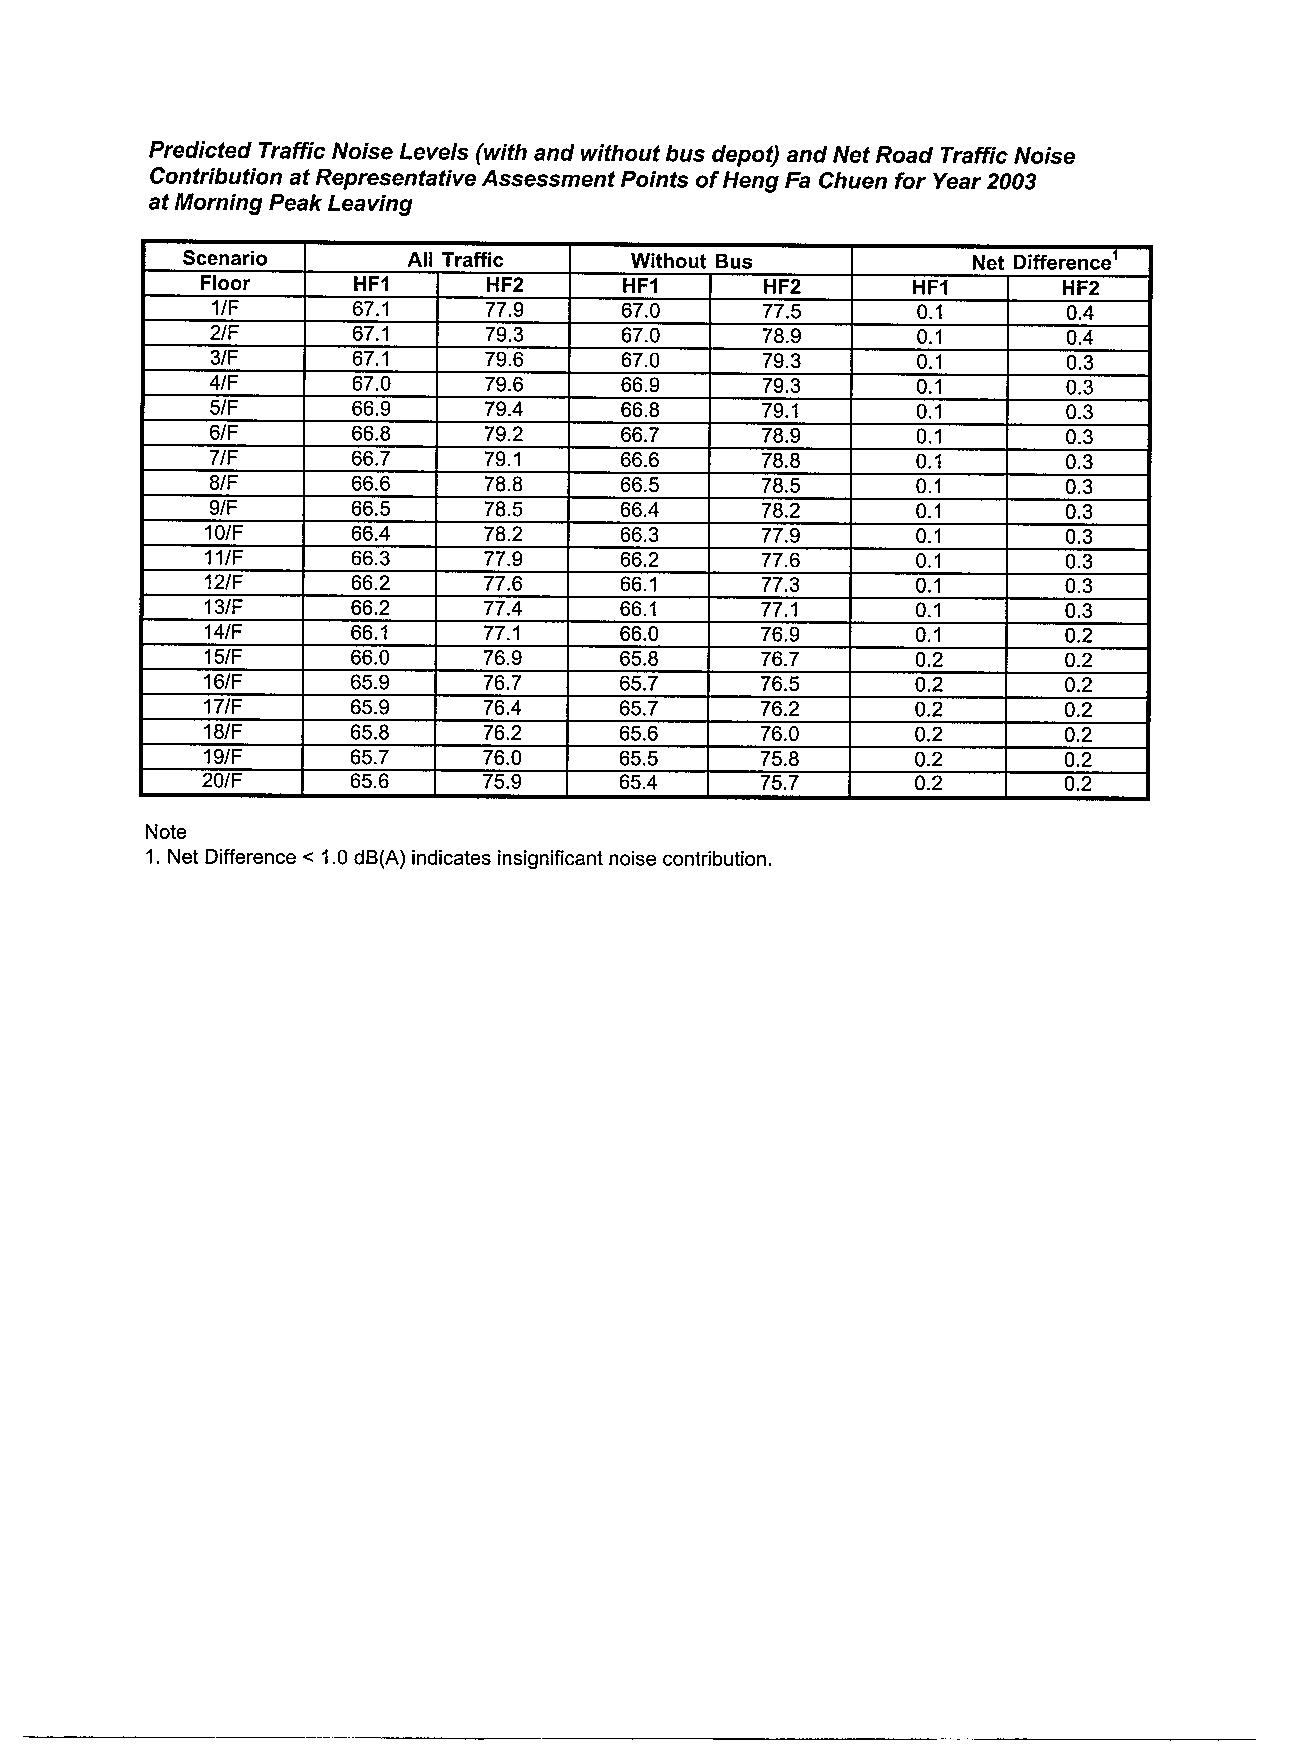
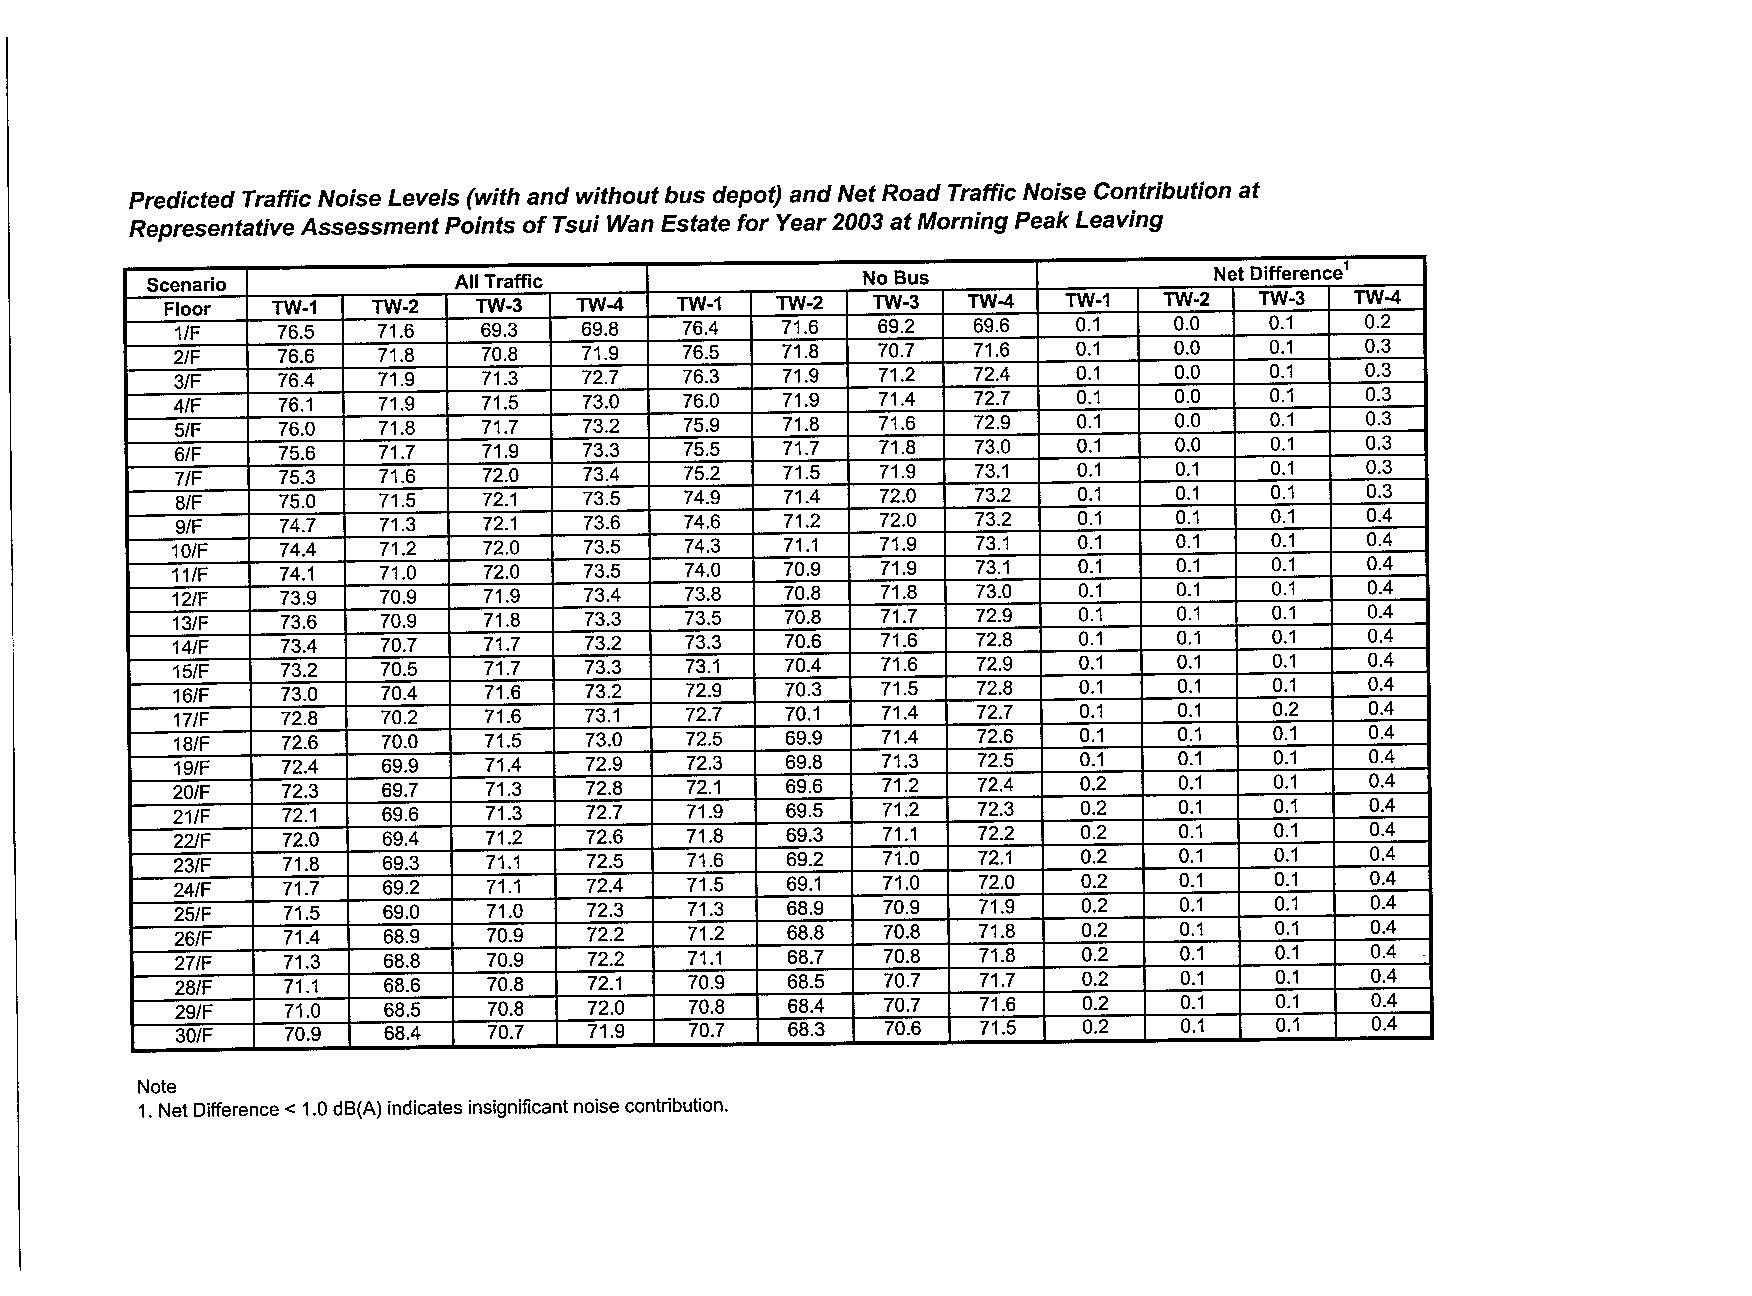
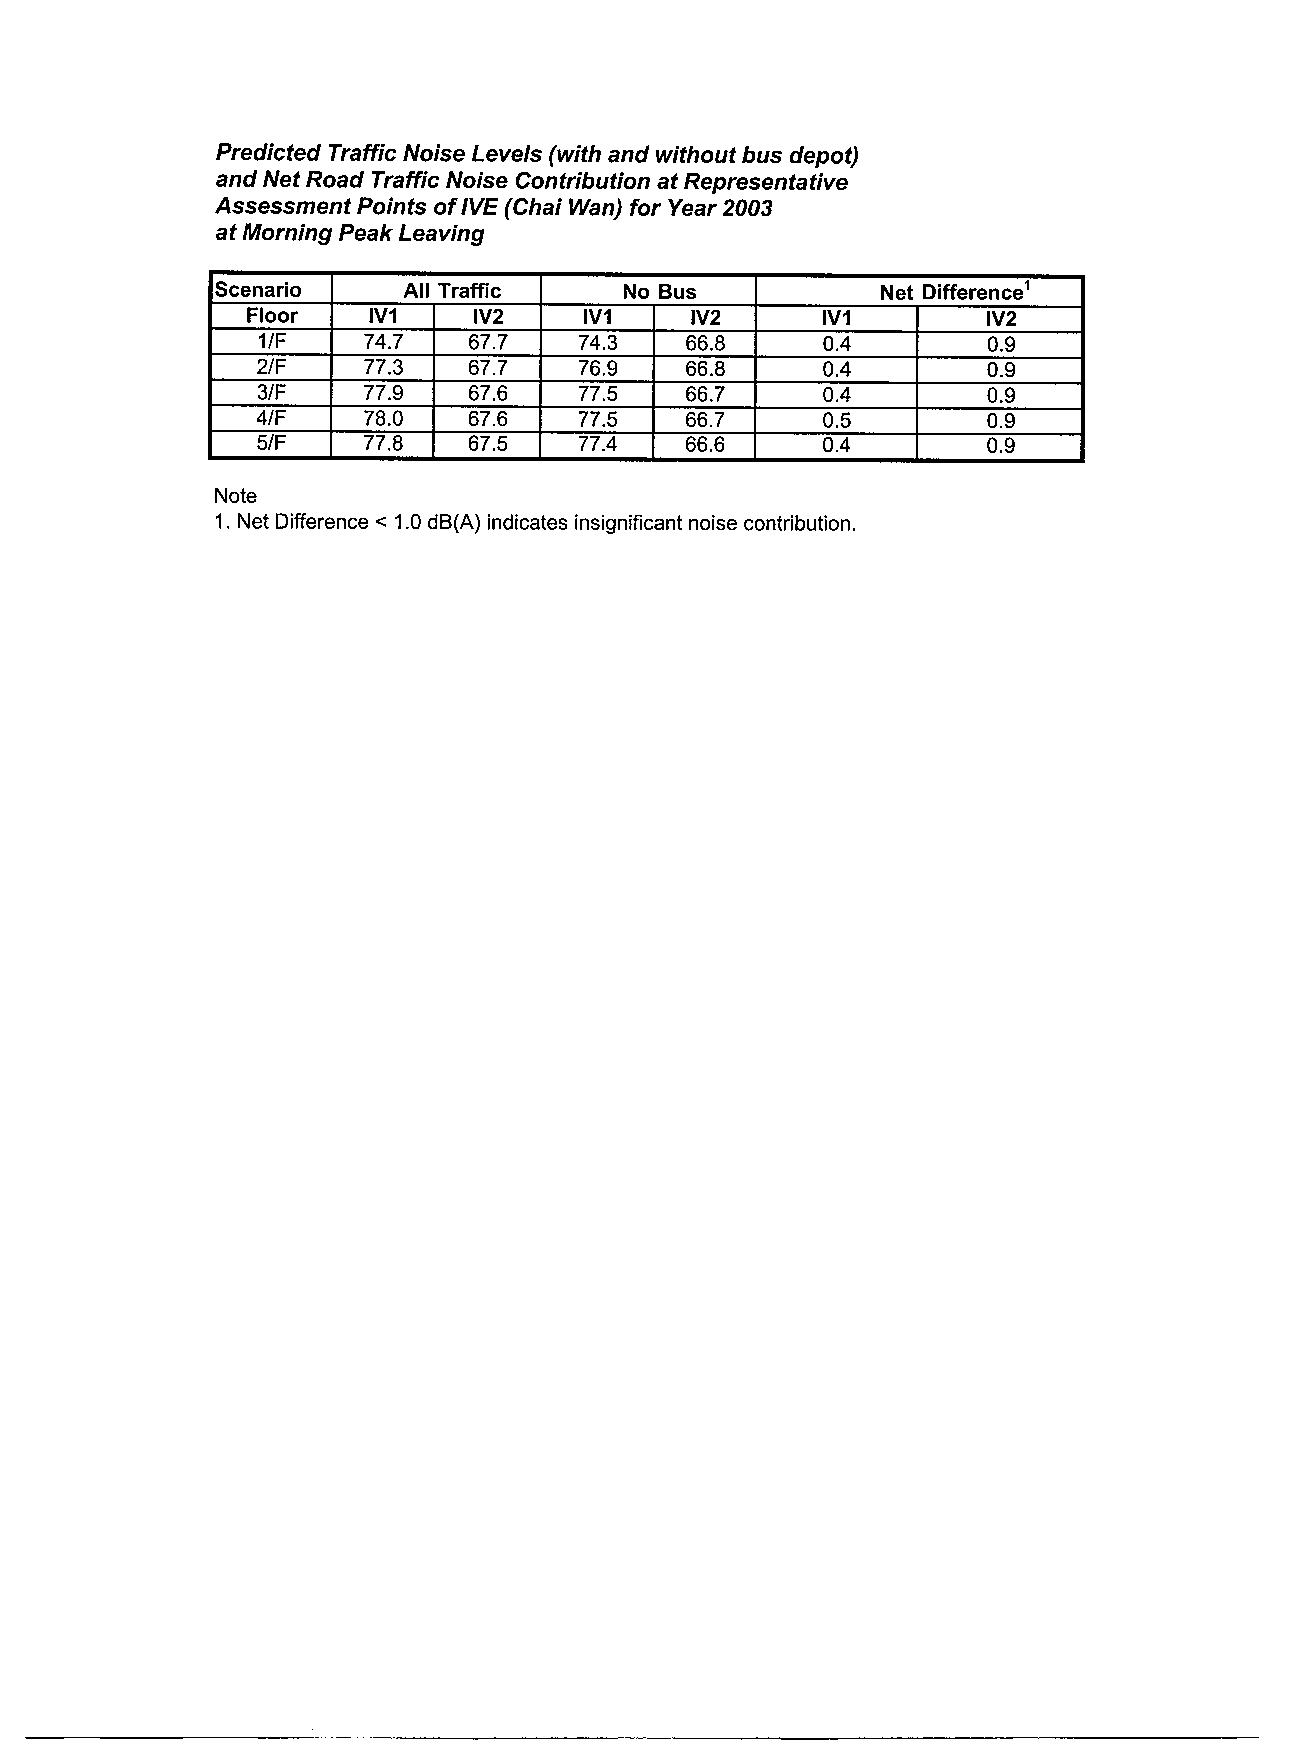
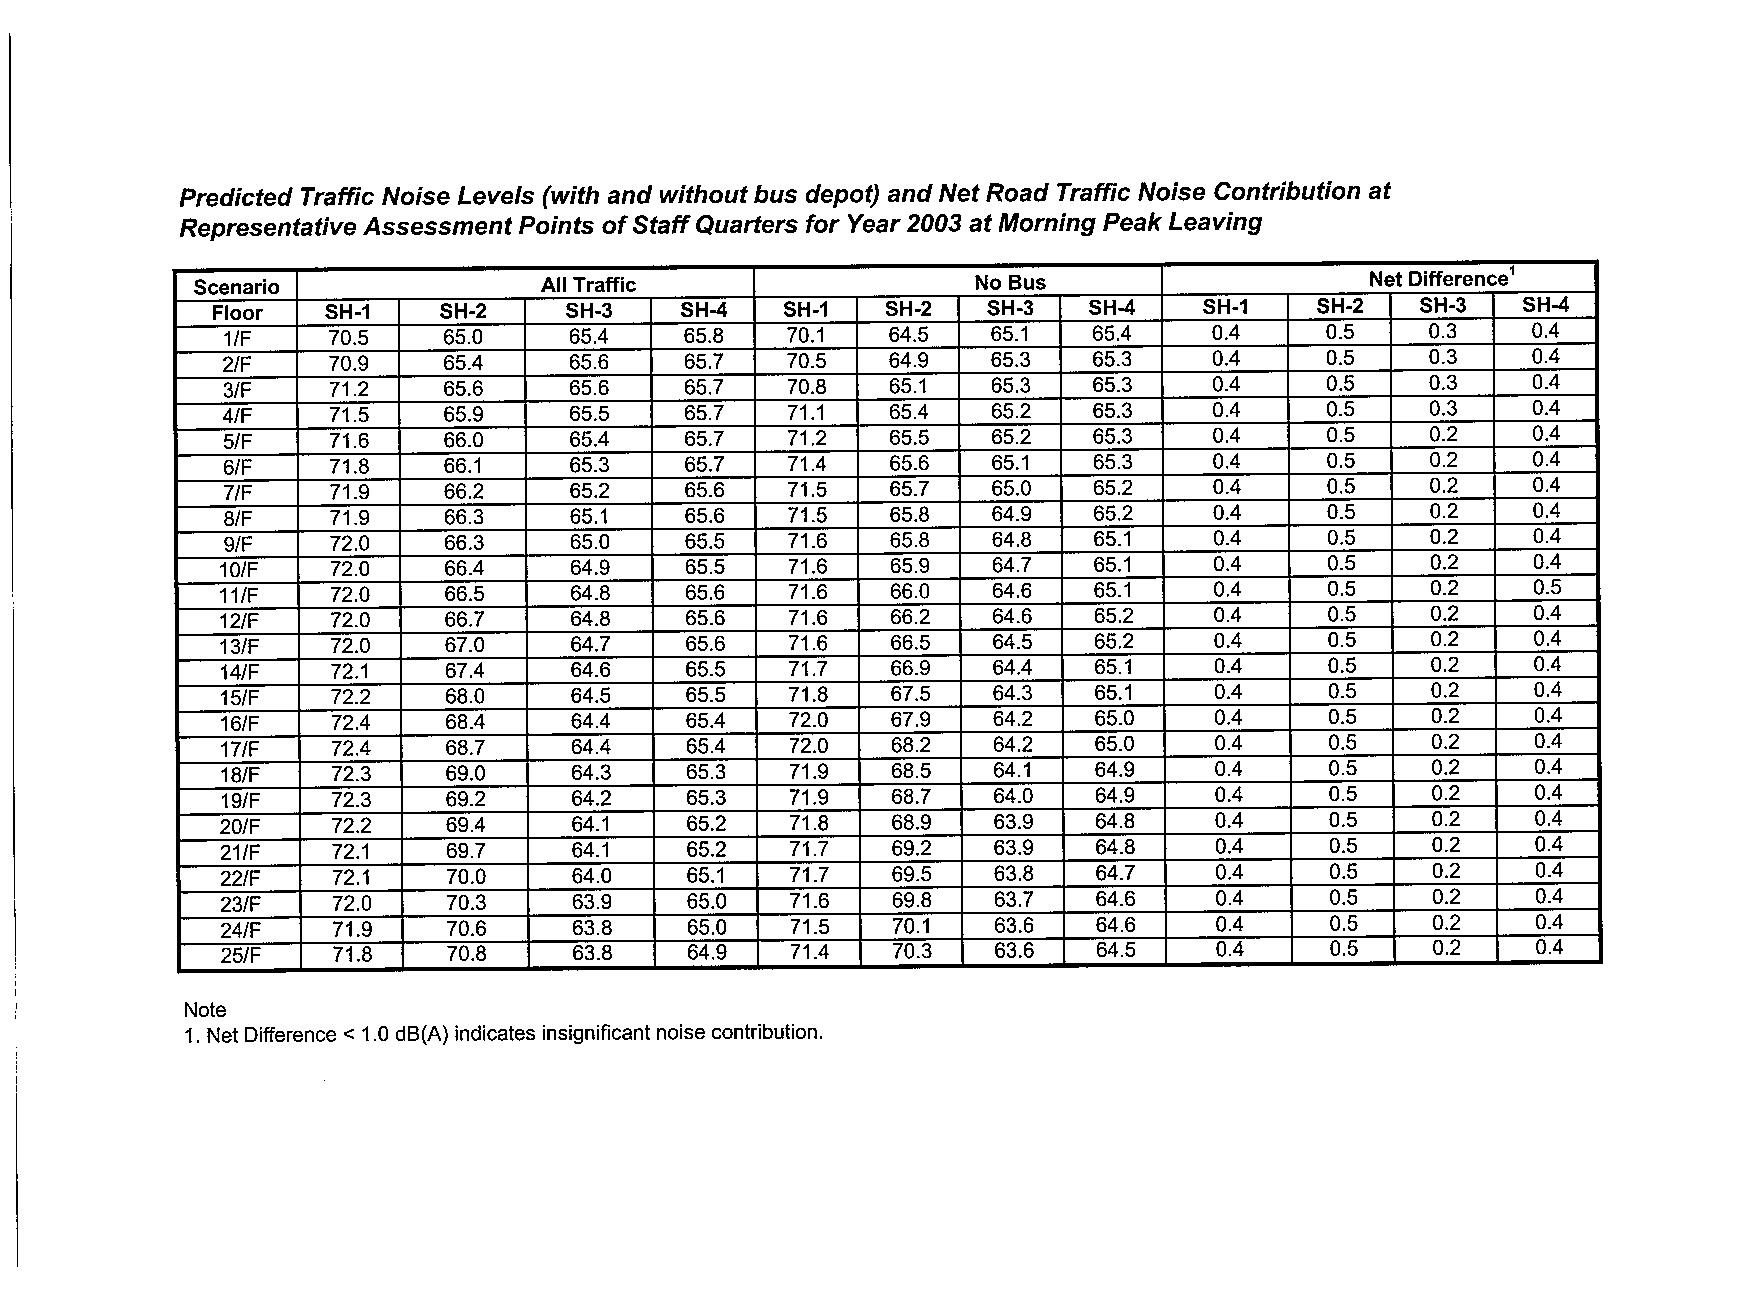
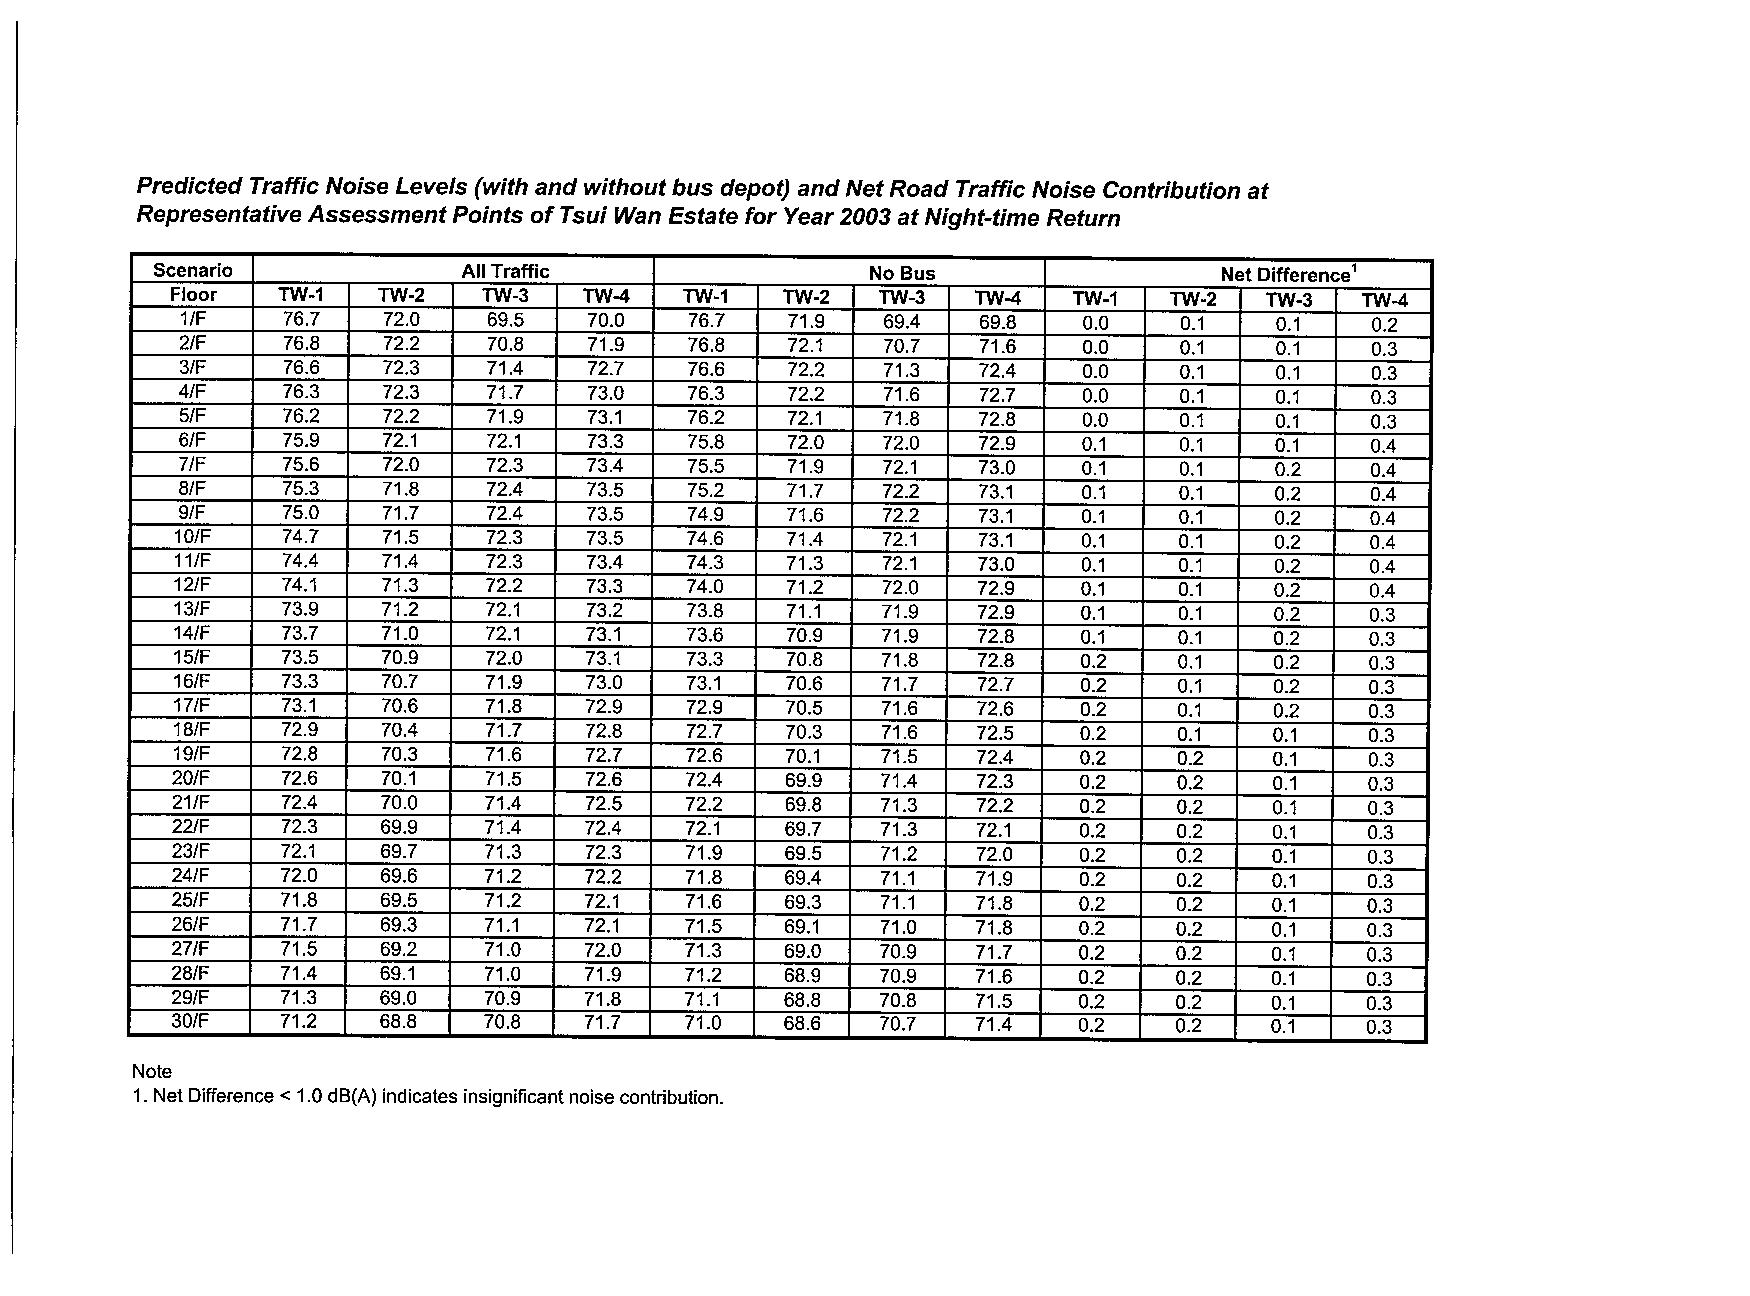
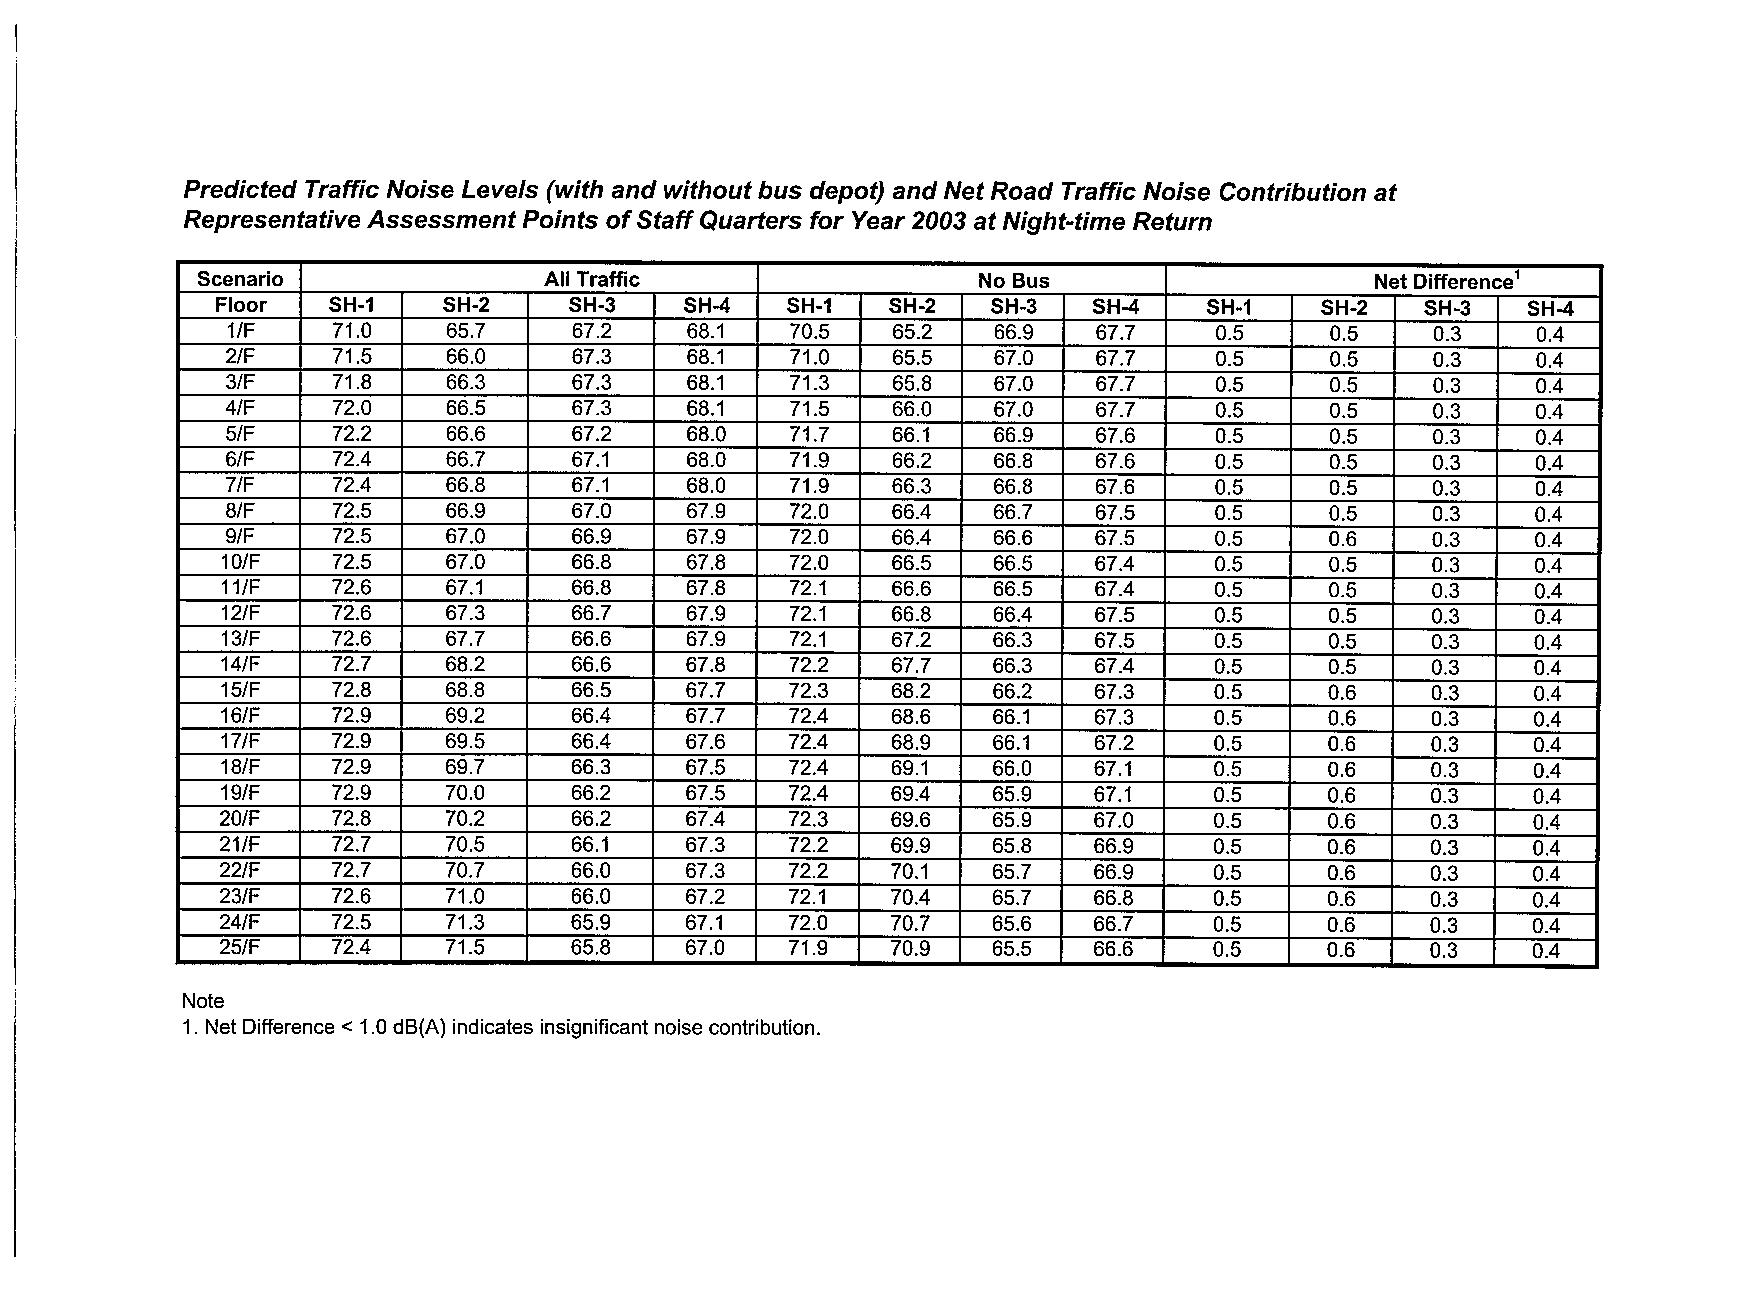
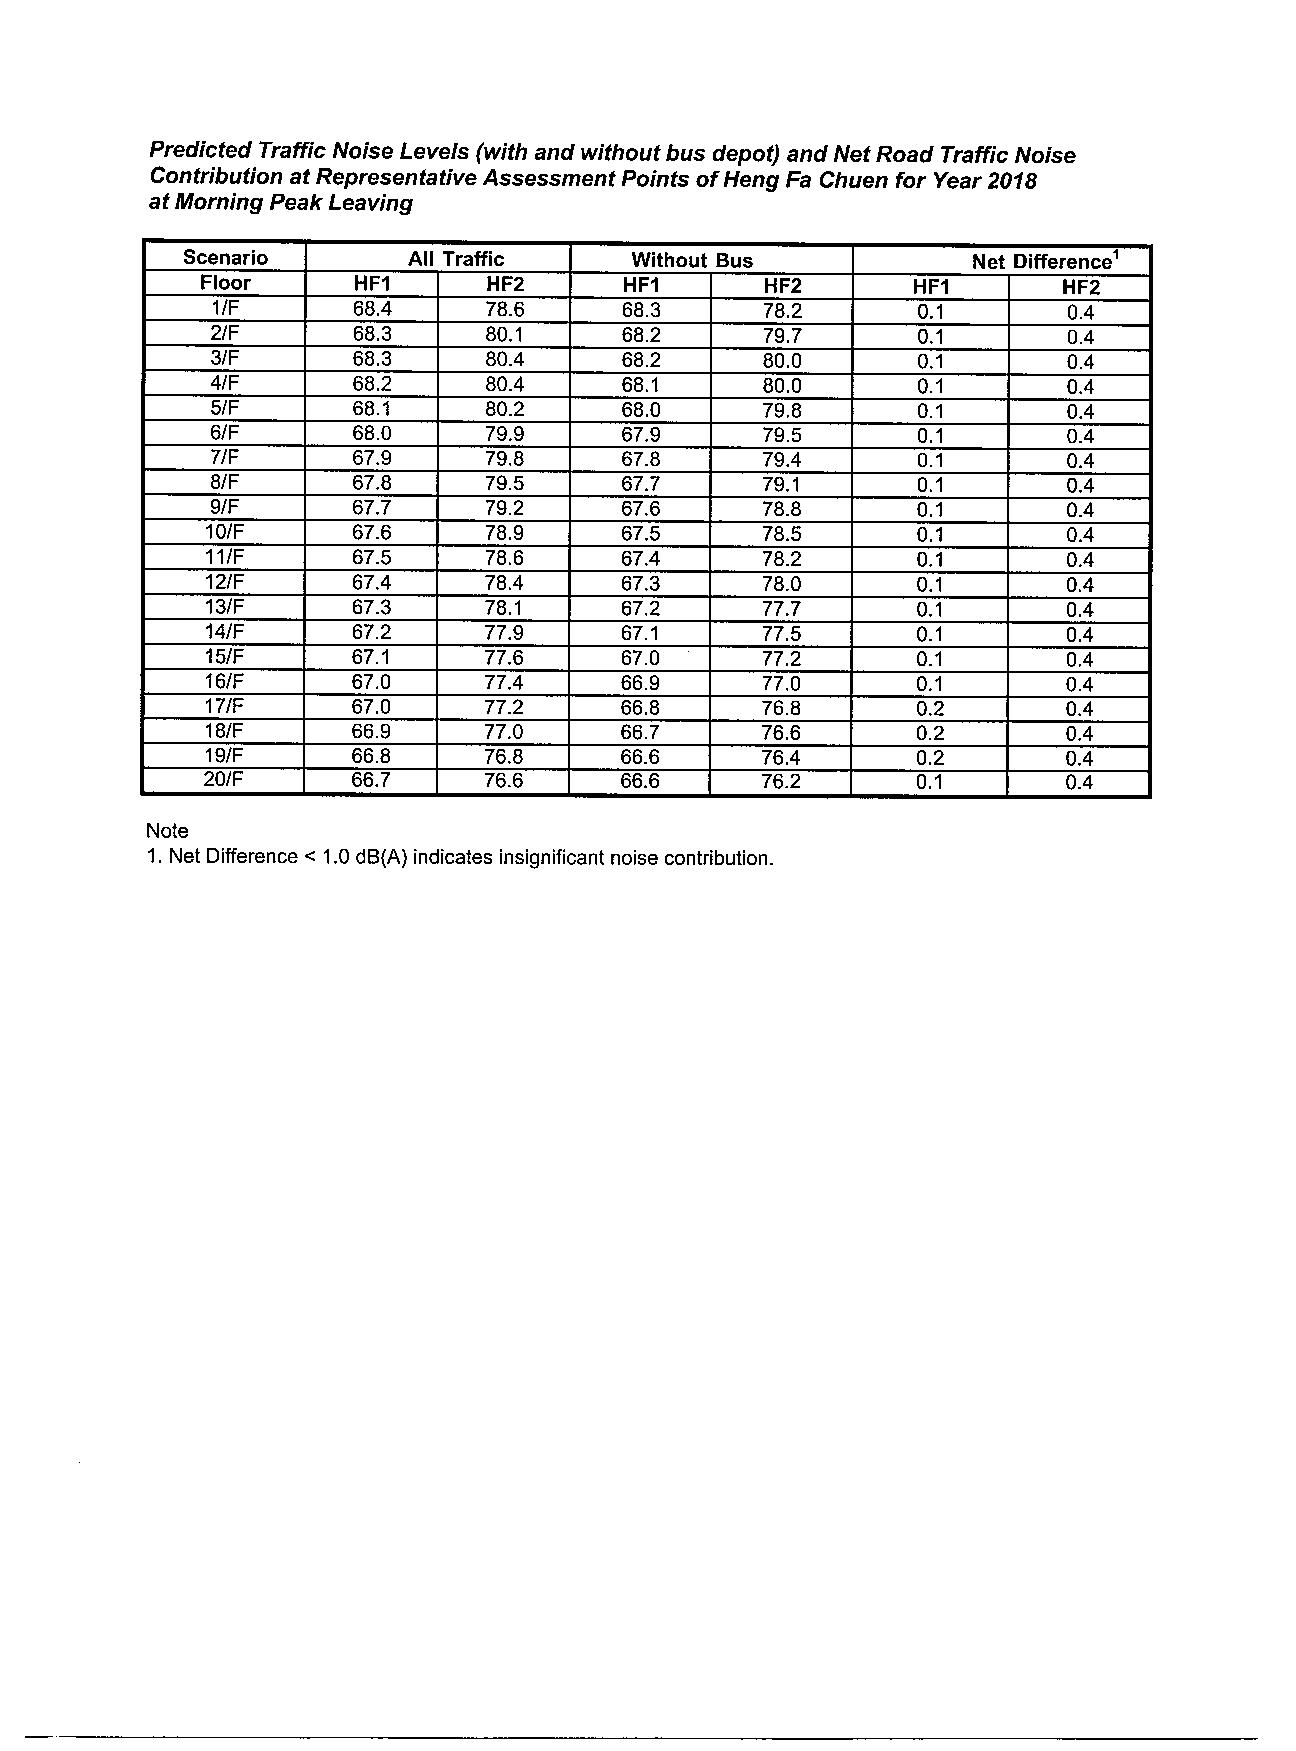
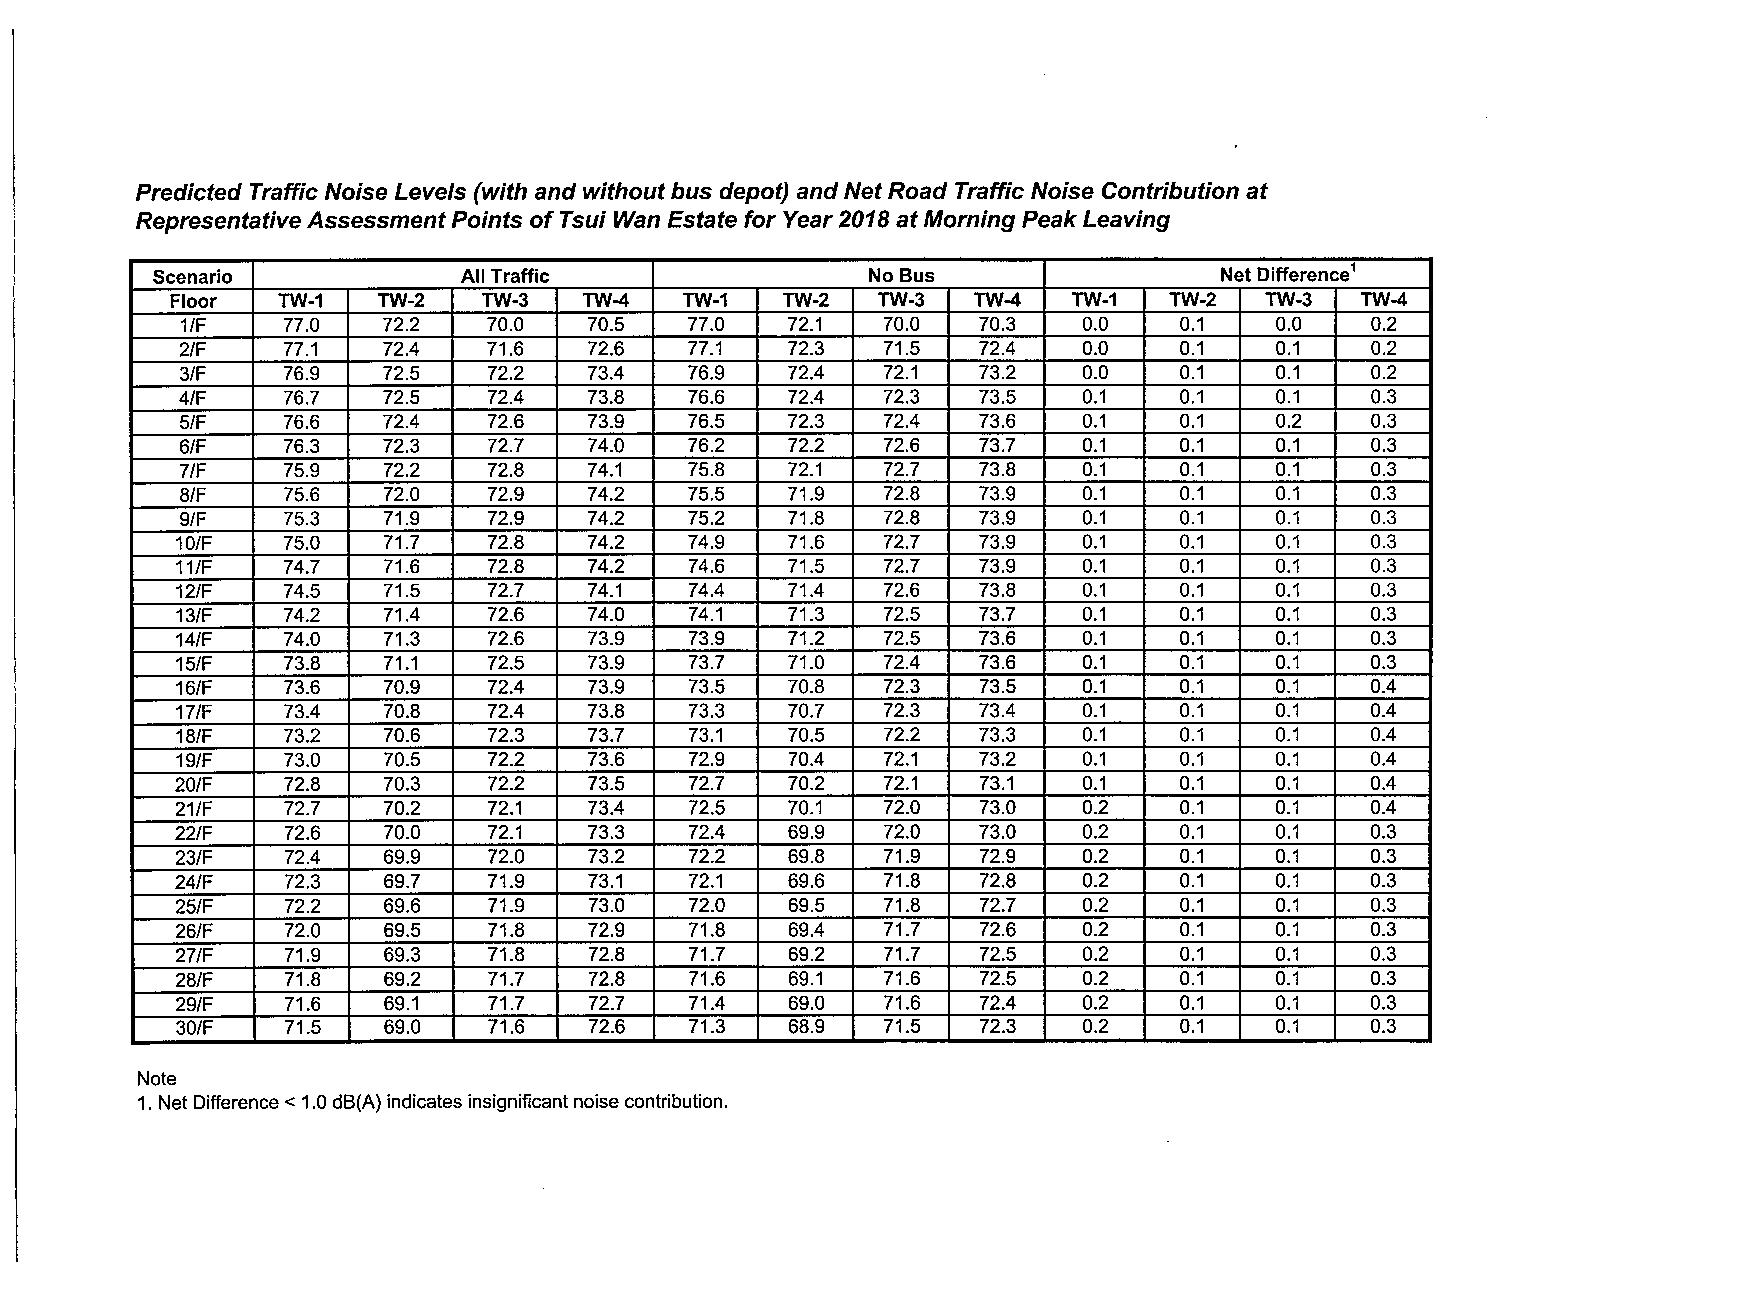
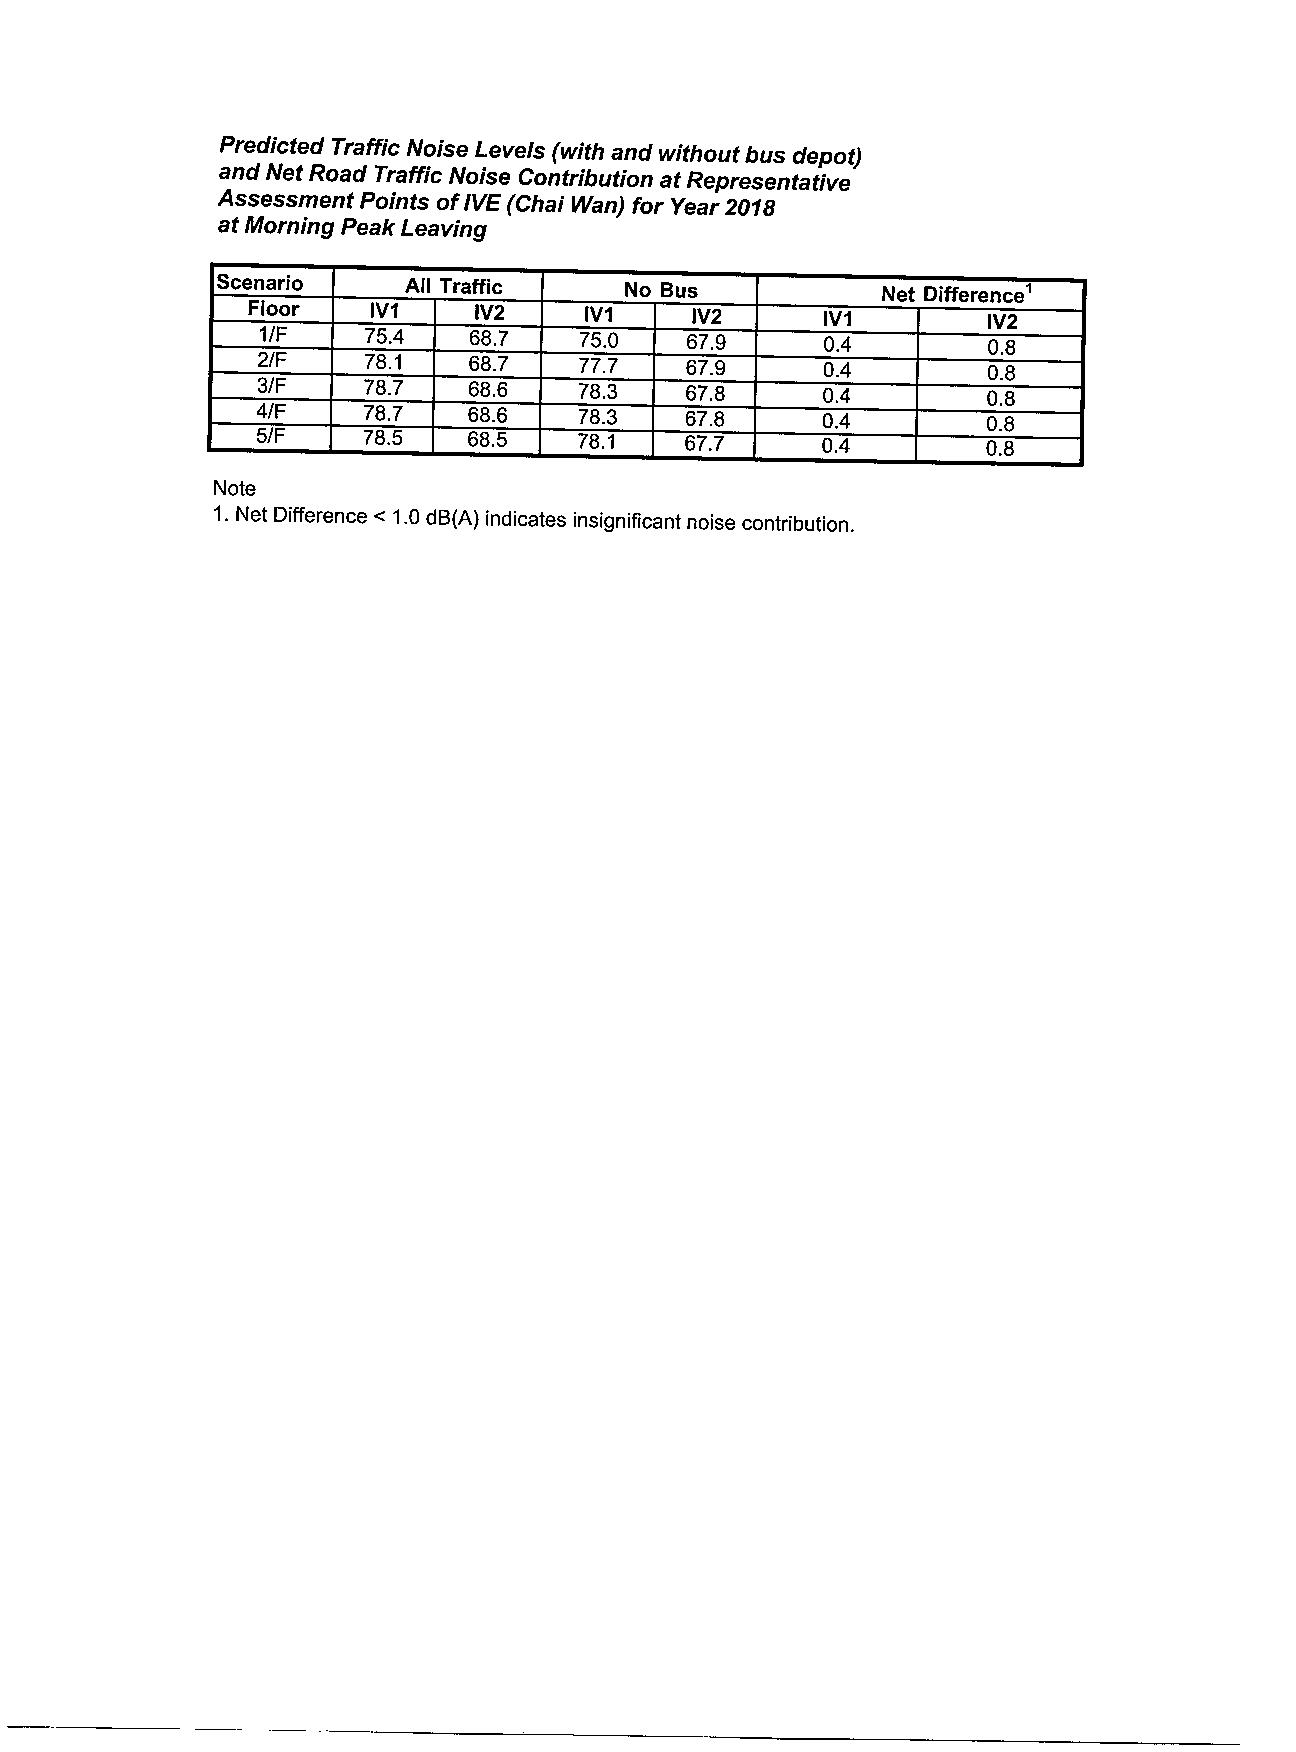
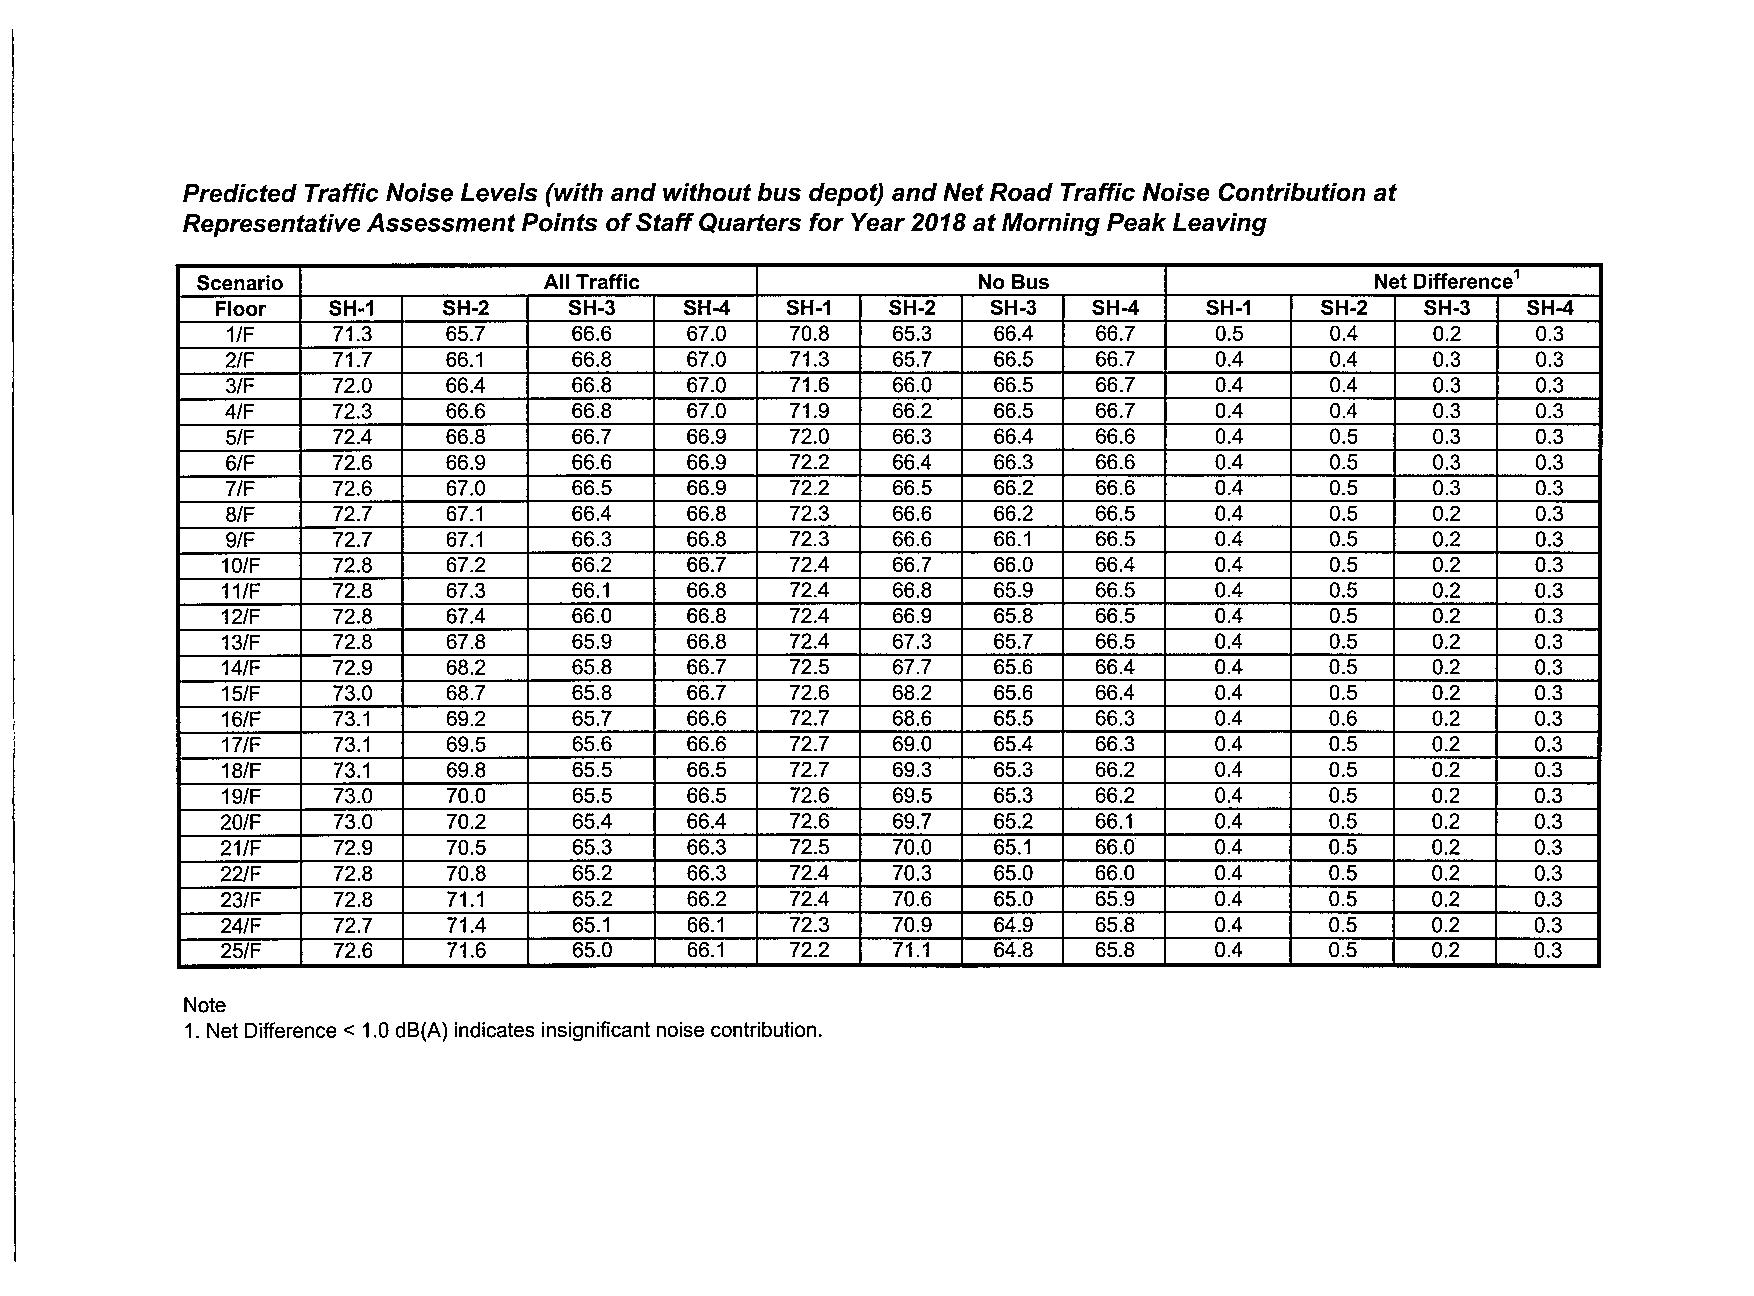
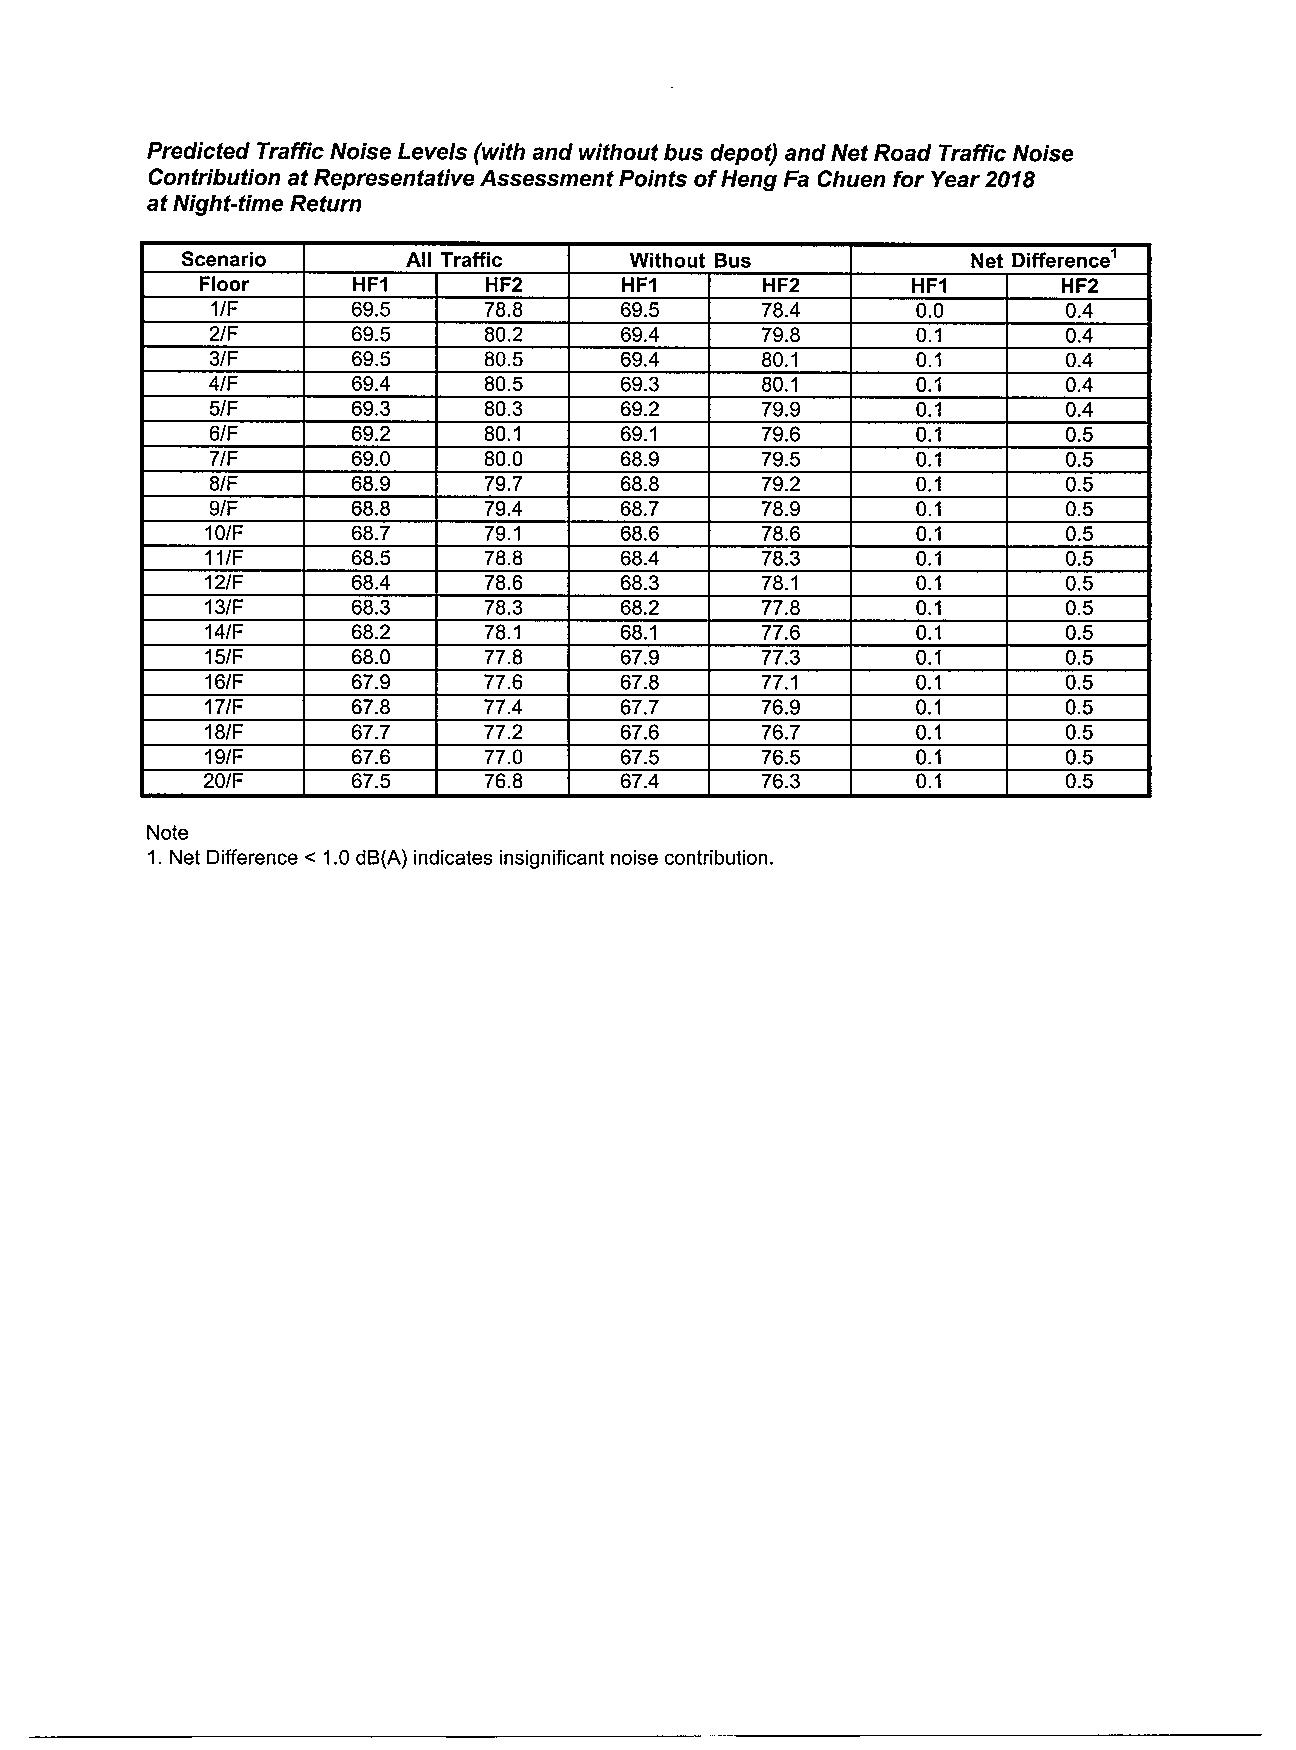
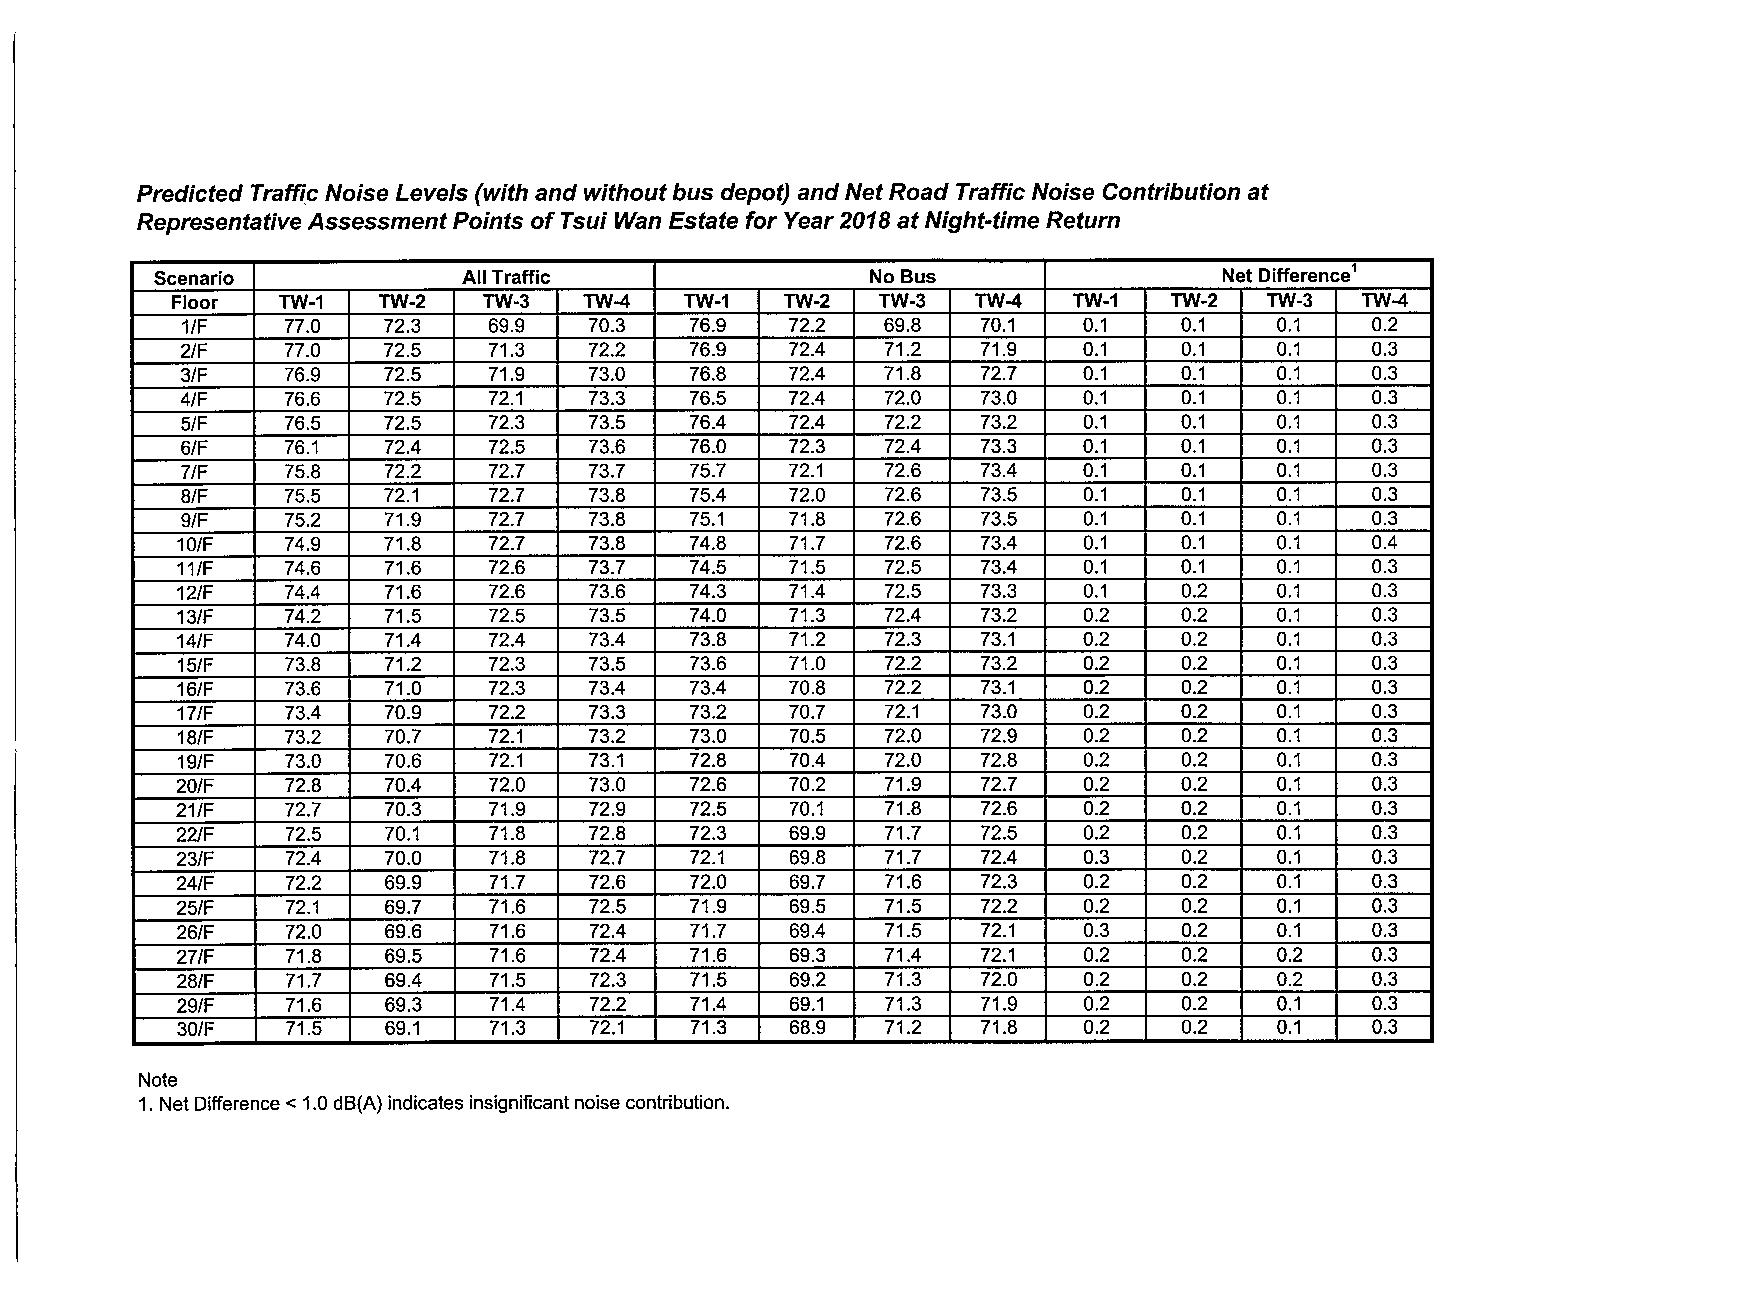
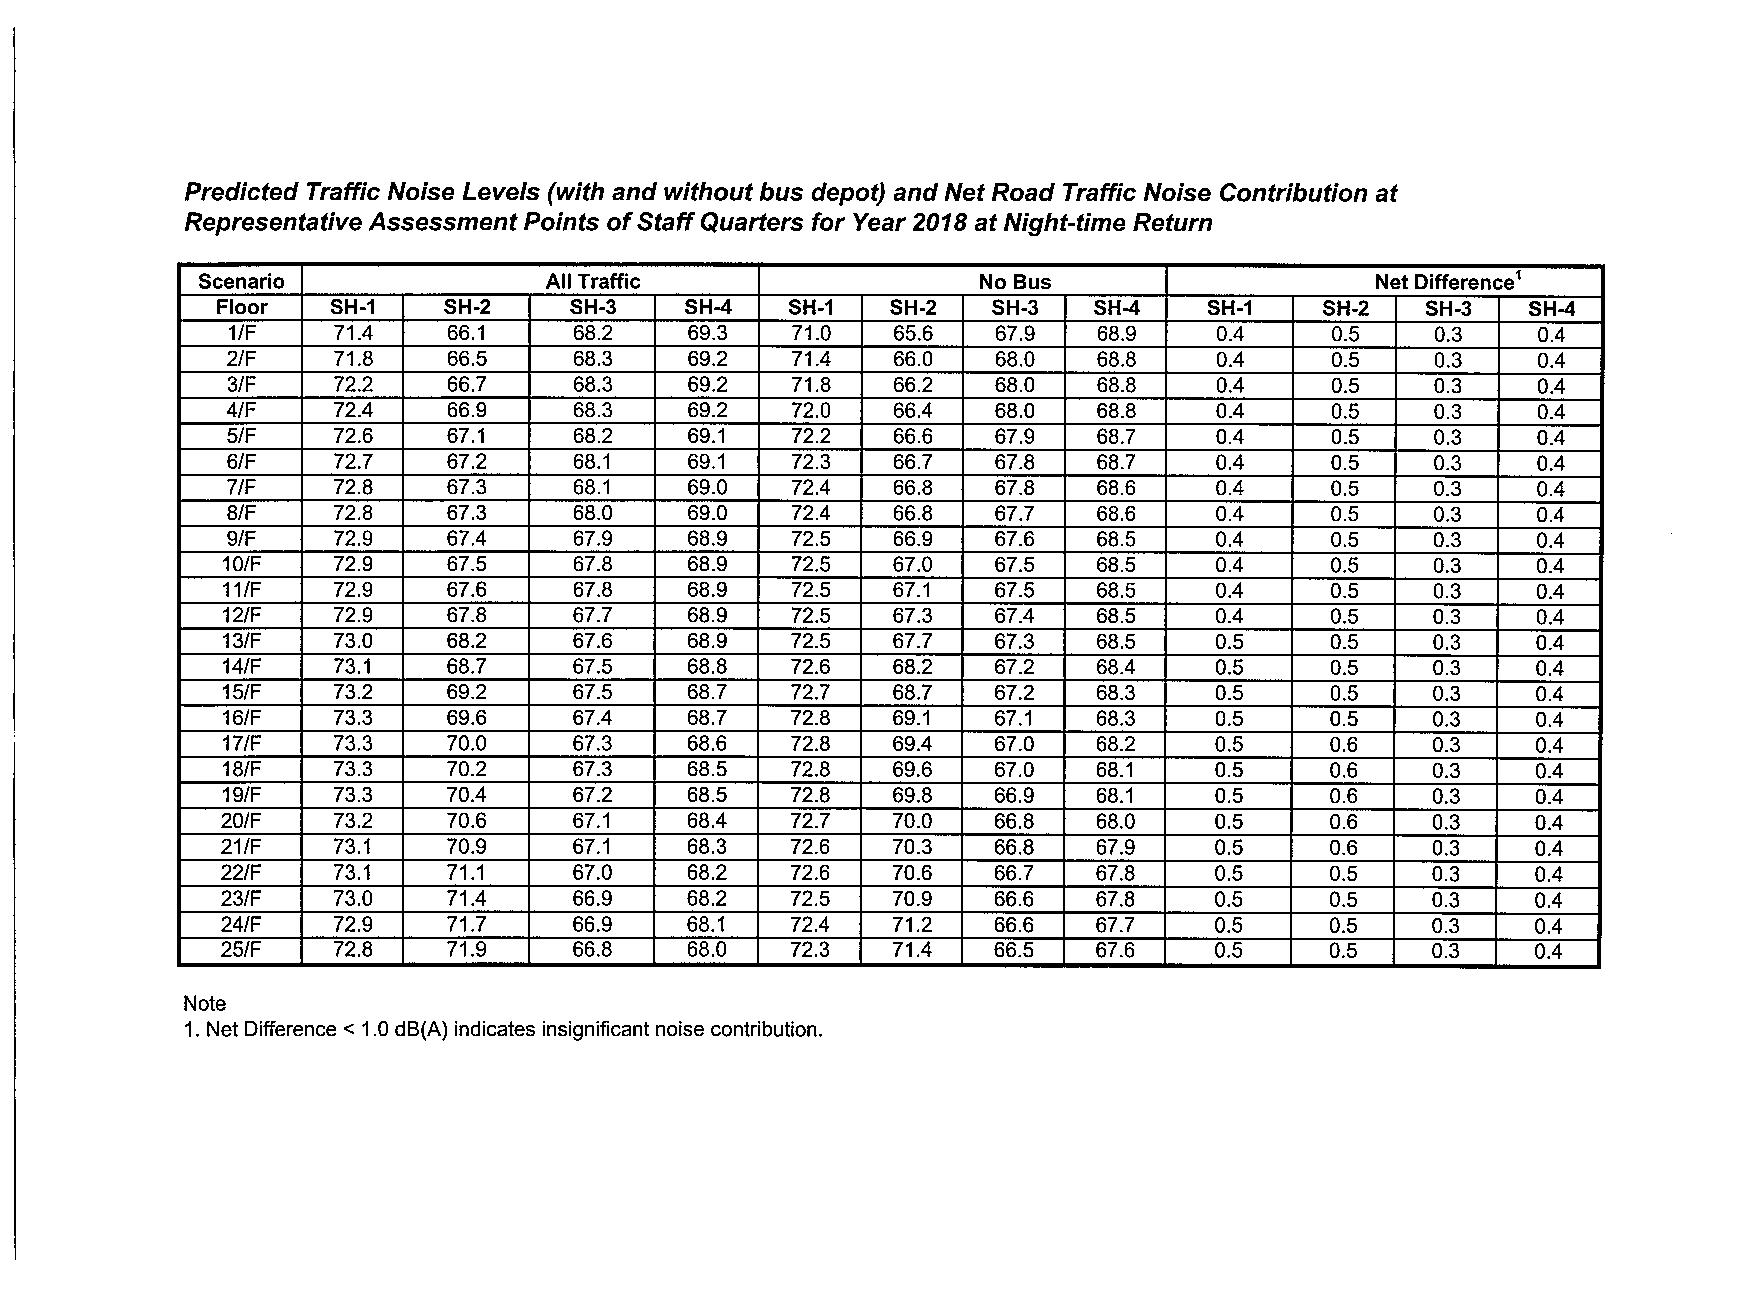
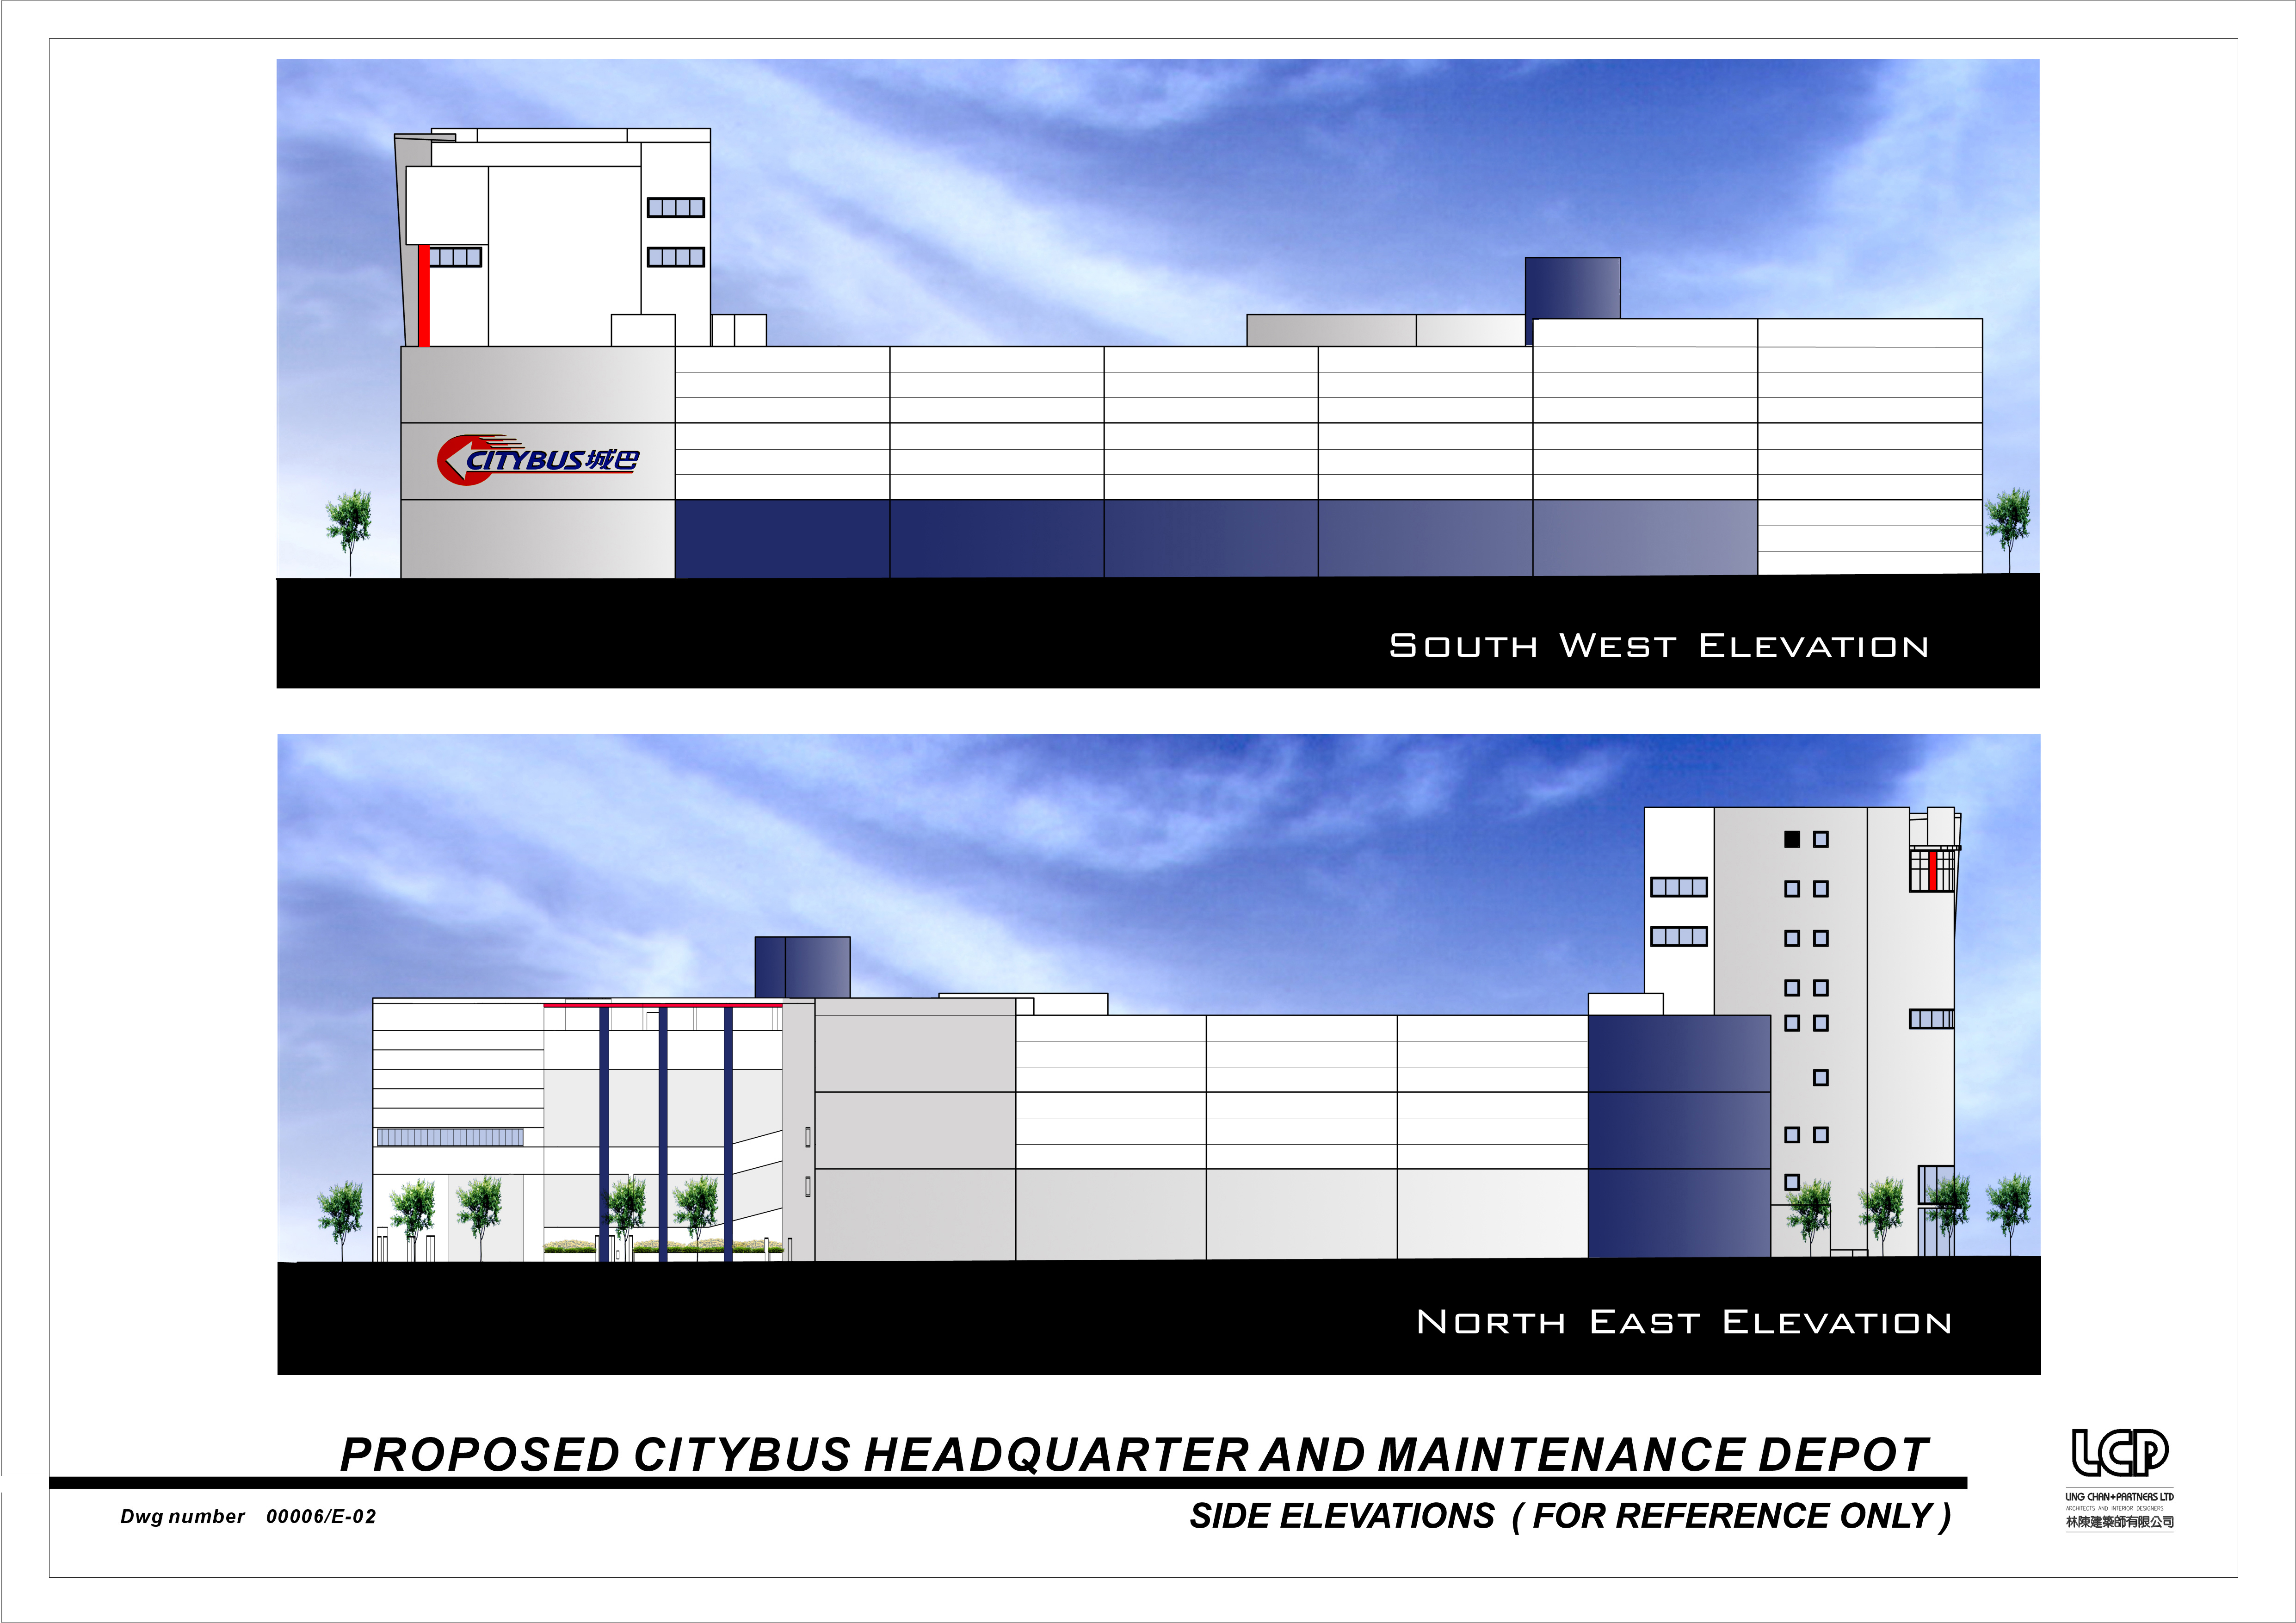