TABLE OF CONTENTS
Nature, Scope and Benefits of the Project
Size and Design of the project
Interactions with Other Projects
Description of scenarios without the Project
3. Consideration of Alternative Sites
Broad Criteria for Decontamination Works Area
Potential Sites for Decontamination Works
Decontamination Works Areas Outside the Penny’s Bay Development Area
Comparison of Decontamination Works Areas Outside the Penny’s Bay Development Area
Environmental Legislation,
Policies, Plans, Standards and Criteria
Site Setting and Physical
Characteristics of Study Area
Identification of Sensitive
Receivers
Identification of
Environmental Impacts
Evaluation of Environmental
Impacts
Mitigation for Land
Contamination
Environmental Monitoring
and Audit Requirements
Conclusions and
Recommendations
5 AIR QUALITY IMPACT ASSESSMENT
Baseline Conditions and Air
Sensitive Receivers
Identification of Pollutant
Sources
6. Waste Management Implications
Environmental Legislation, Standards and Evaluation Criteria
Prediction and Evaluation of Environmental Impacts
Conclusion and Recommendations
Environmental Legislations, Standards and Evaluation Criteria
Description of the Environment
Identification of Water Quality Impacts
Evaluation of Water Quality Impacts
Summary of Potential Water Quality Impacts
Mitigation of Environmental Impacts
Cumulative Environmental Impacts
Residual Environmental Impacts
8. Ecological IMPACT Assessment
Environmental Legislation, Standards and Guidelines
Description of Existing Ecological Baseline Conditions
Identification of Ecological Impacts
Prediction of Ecological Impacts
Mitigation of Ecological Impacts
Ecological Monitoring and Audit (EM&A) Requirement
Legislation, Standards, Guidelines & Criteria
Evaluation of Cultural Heritage Impacts
Mitigation of Adverse Environmental Impacts
10. Summary of environmental outcomes
11. ENVIRONMENTAL MONITORING AND AUDIT REQUIREMENTS
12. Conclusion
Environmental Monitoring and Audit
13 implementation of mitigation measures
LIST OF FIGURES
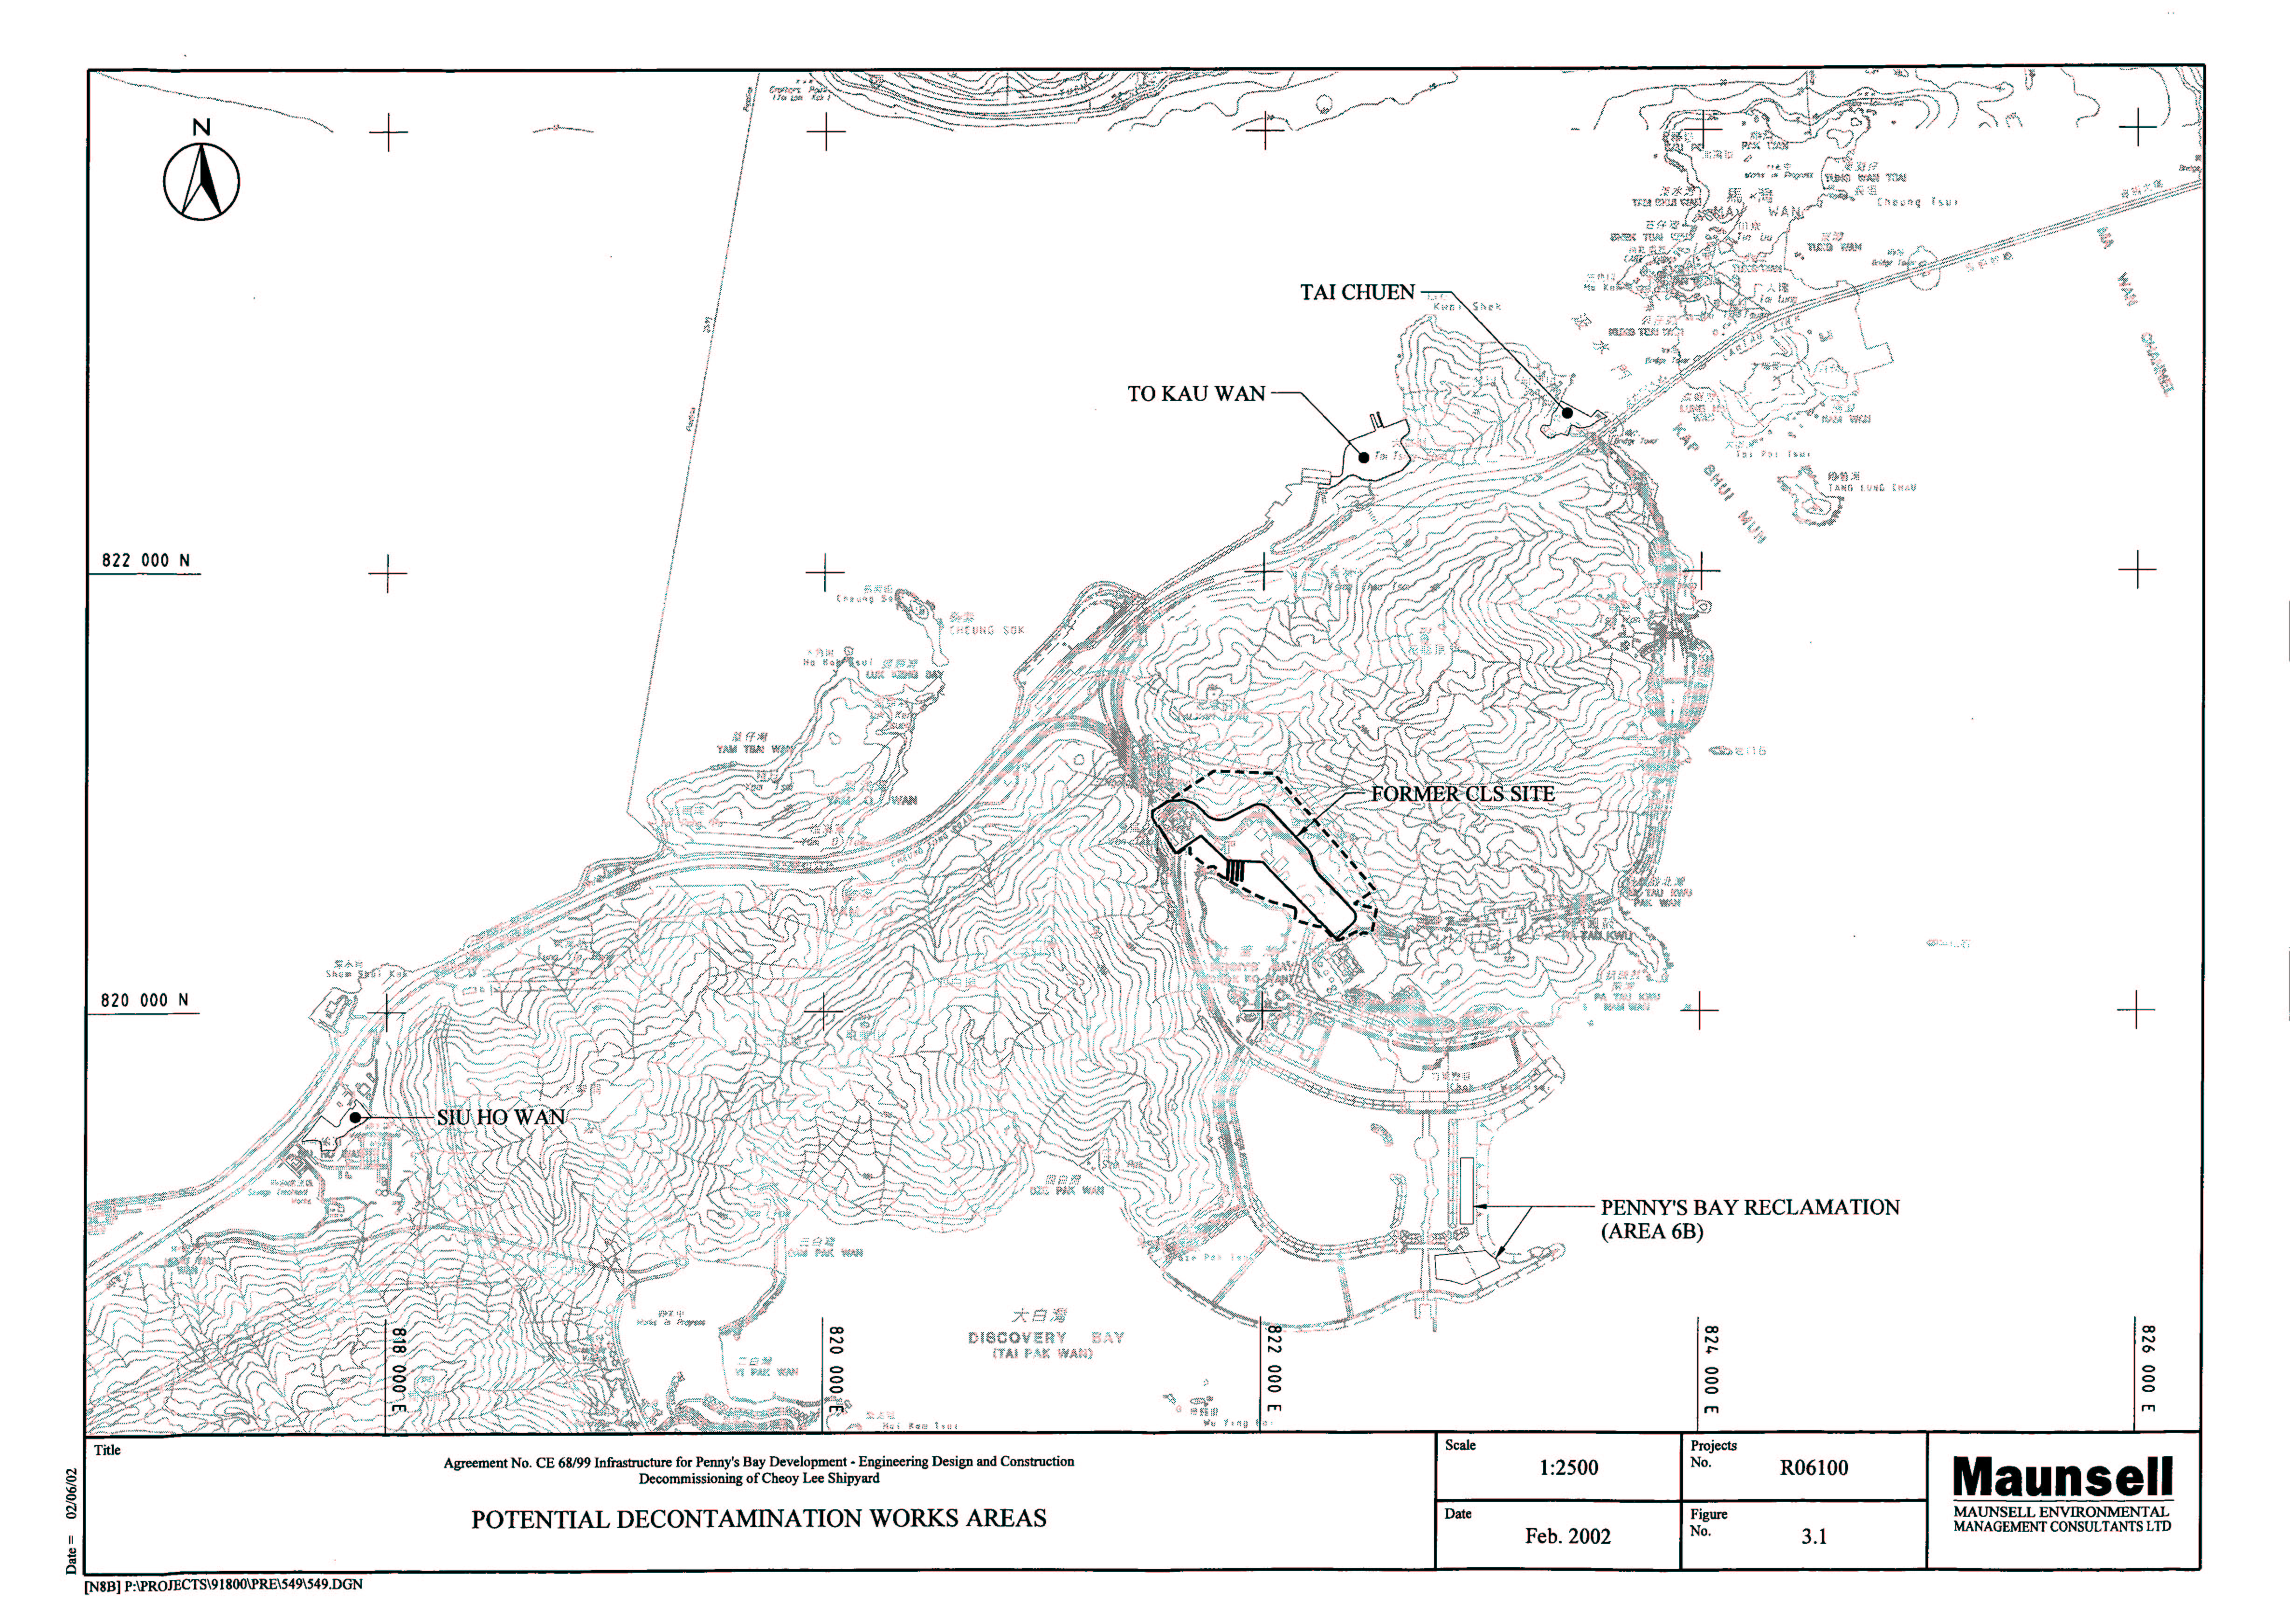
Figure 3.1 Potential Decontamination Works Areas
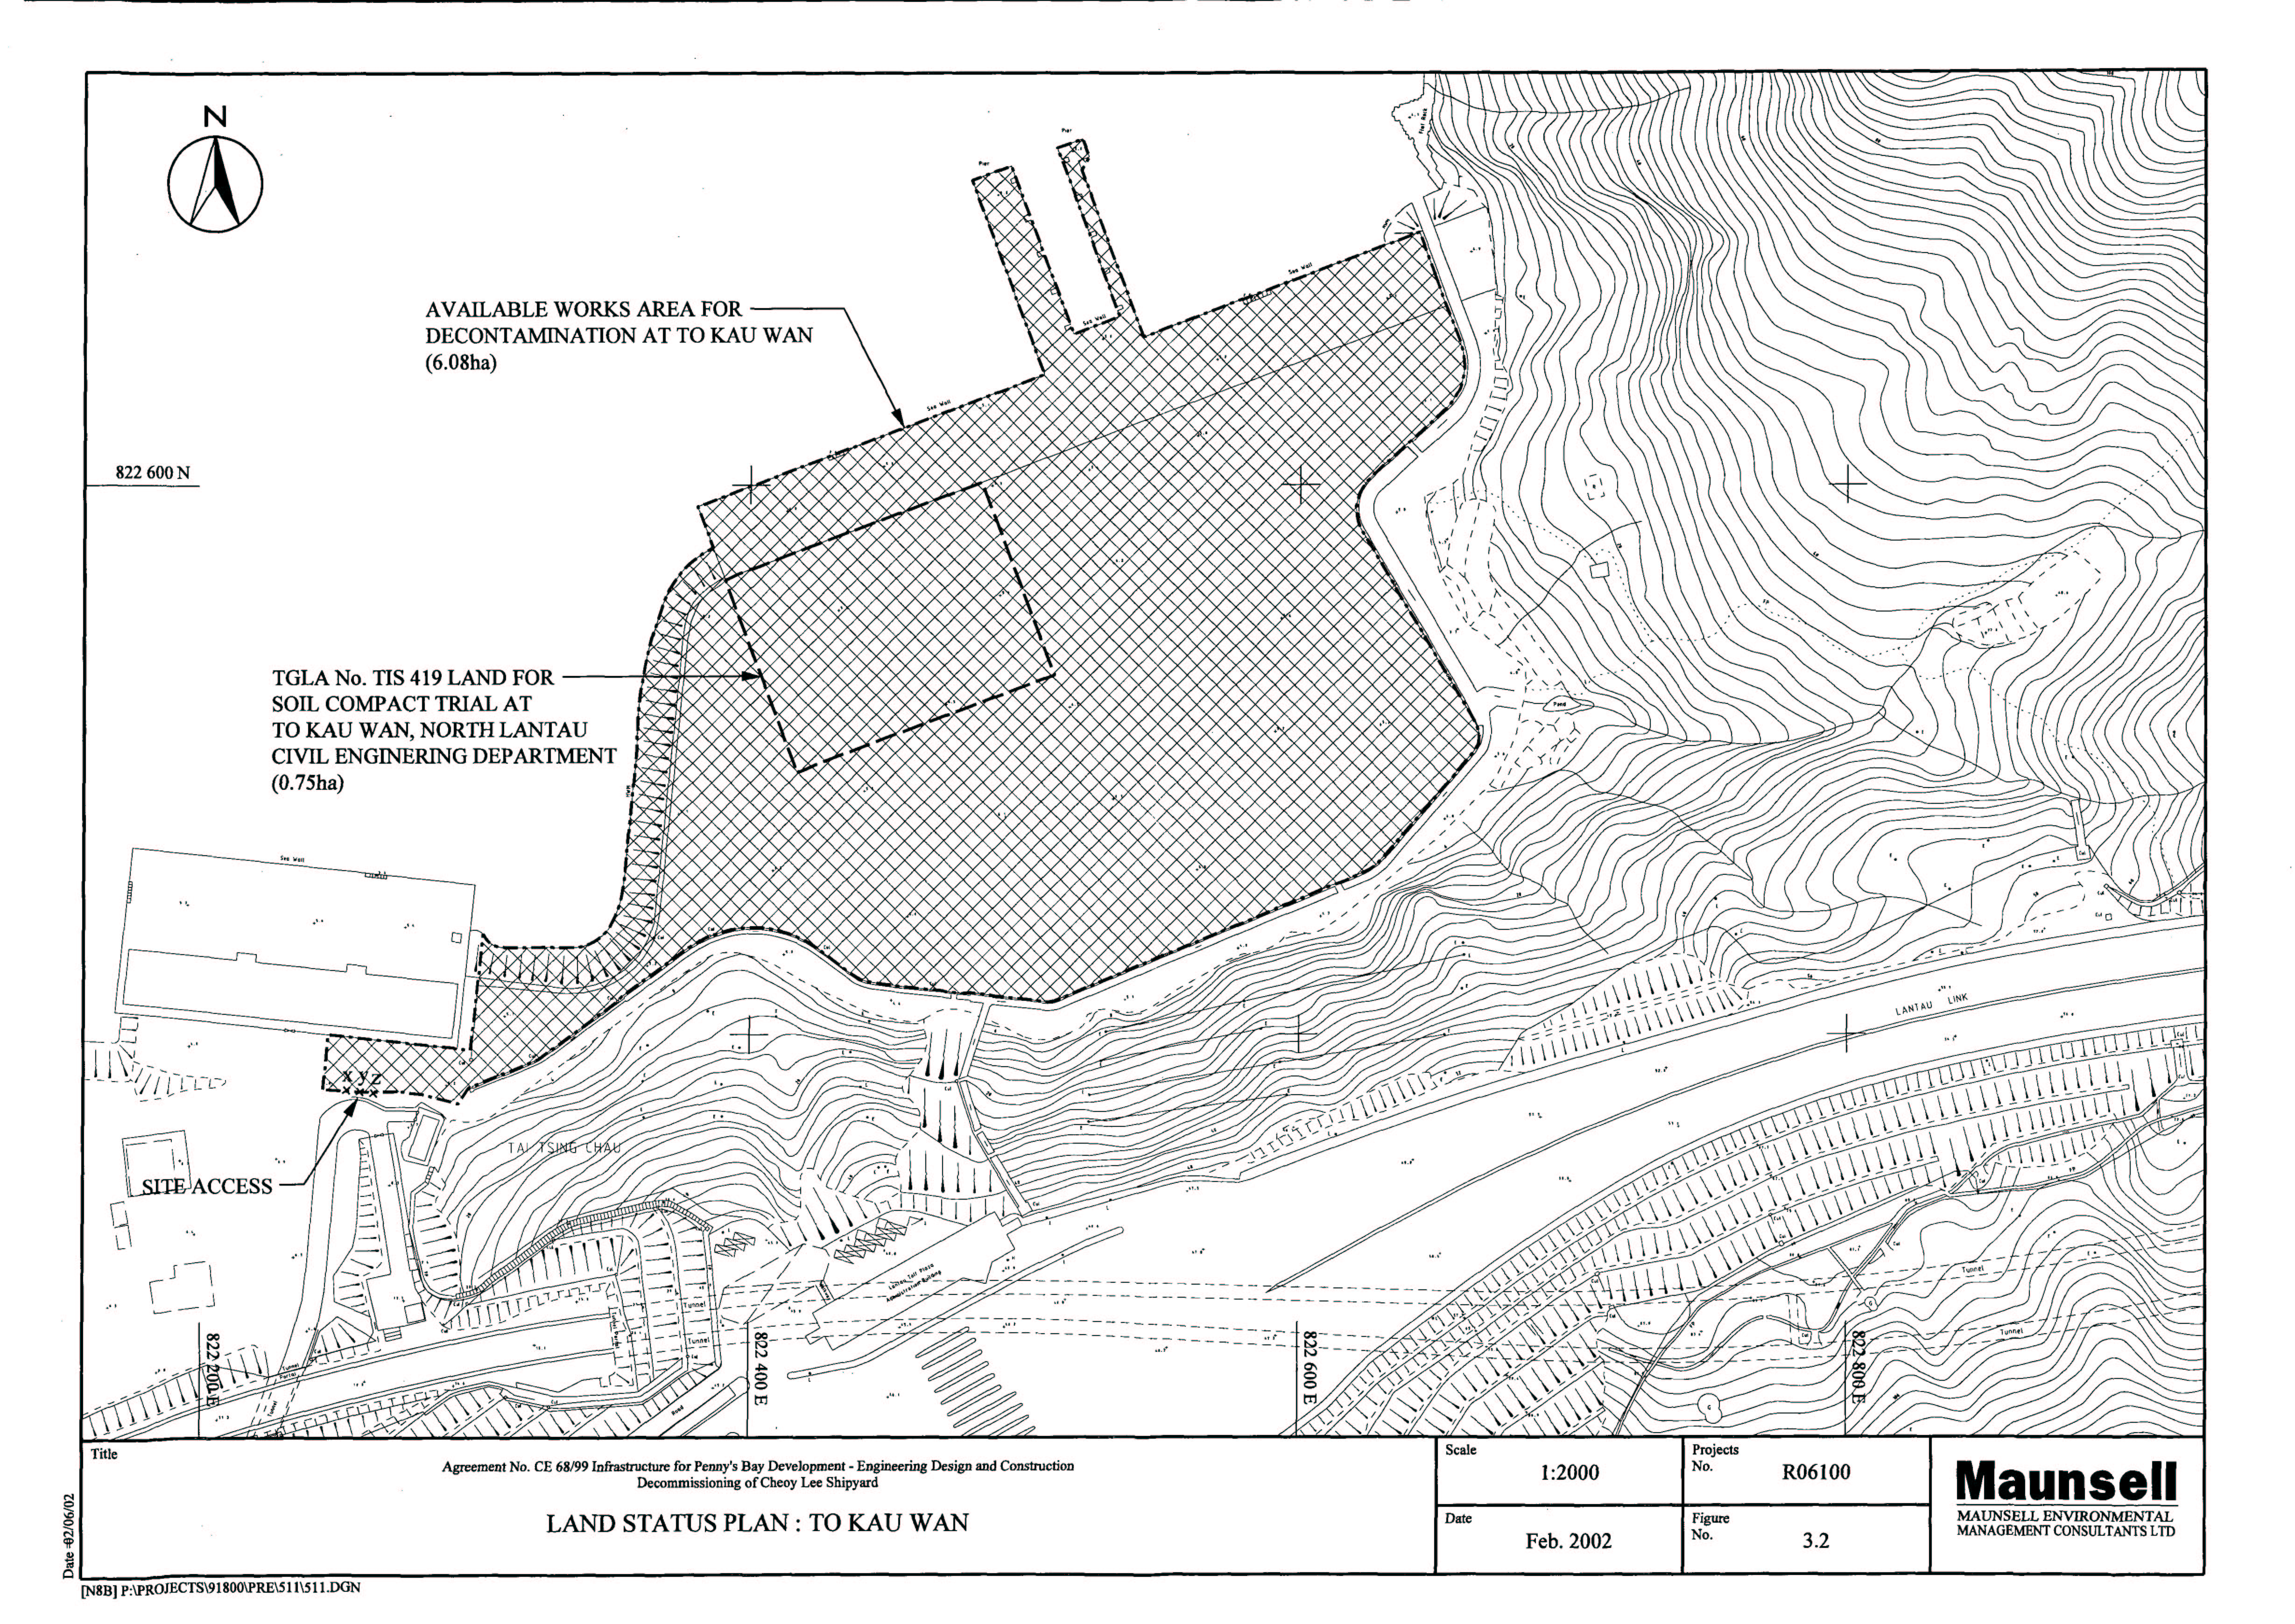
Figure 3.2 Land Status Plan: To Kau Wan
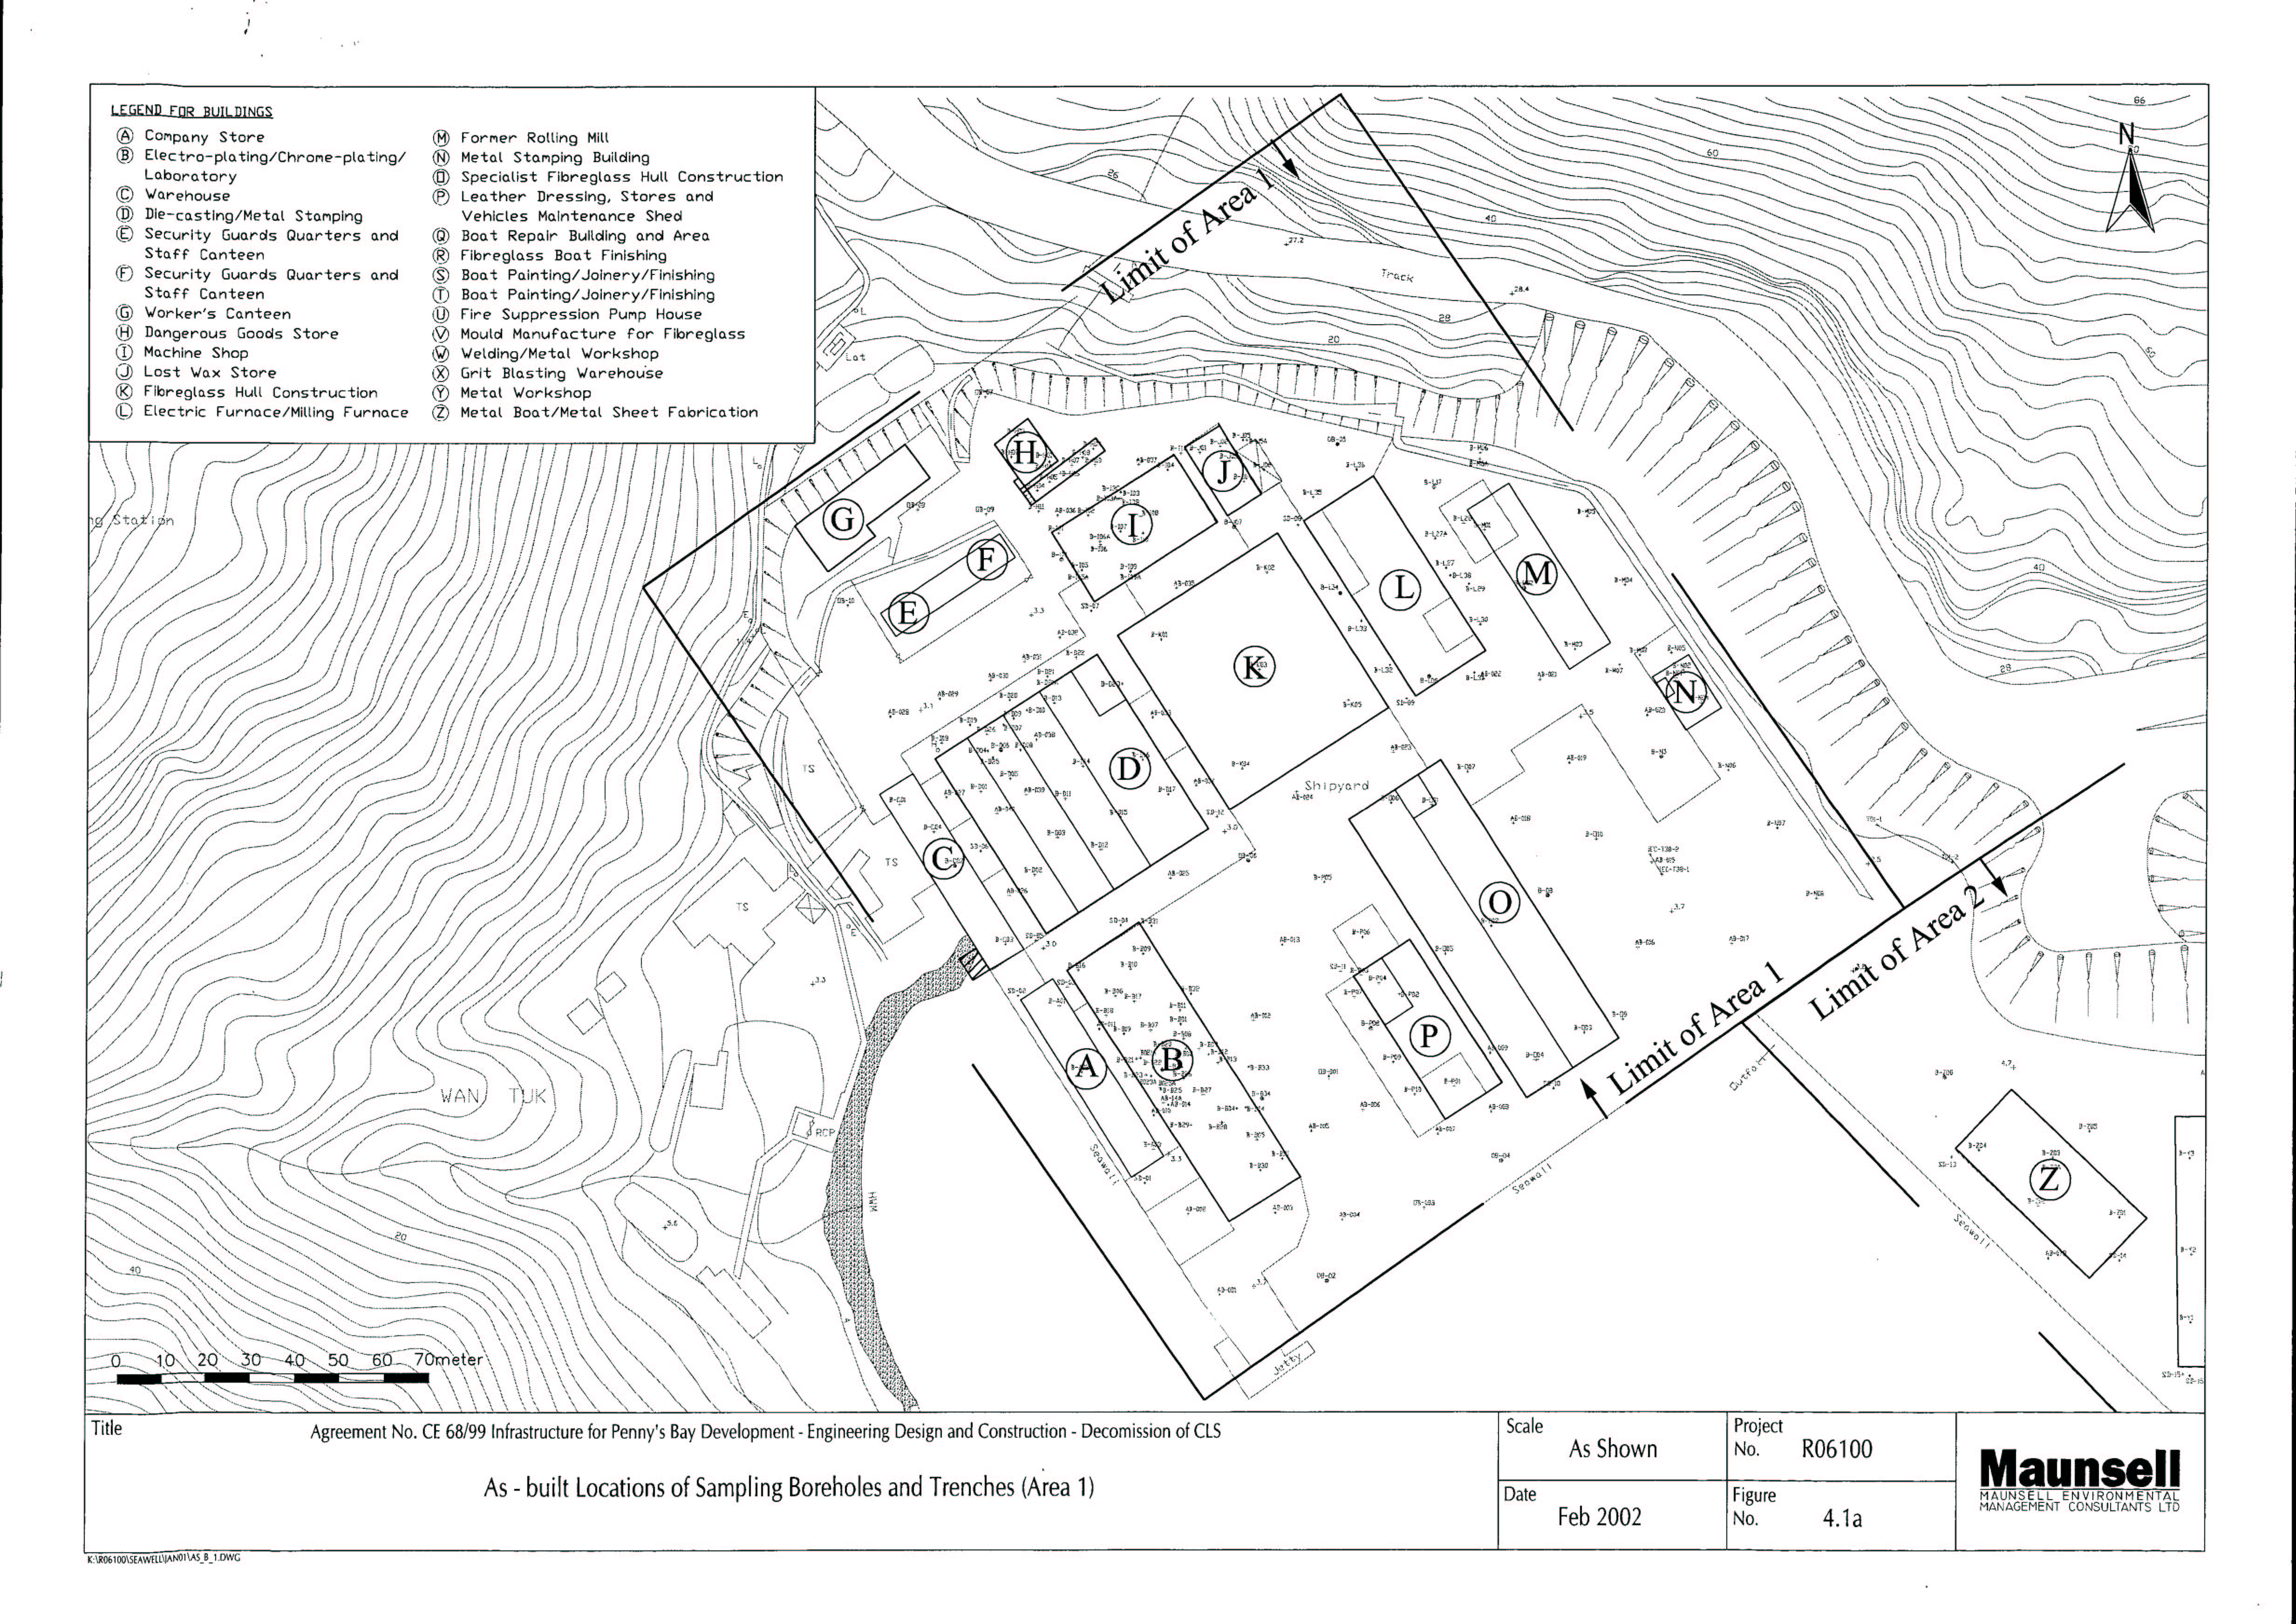
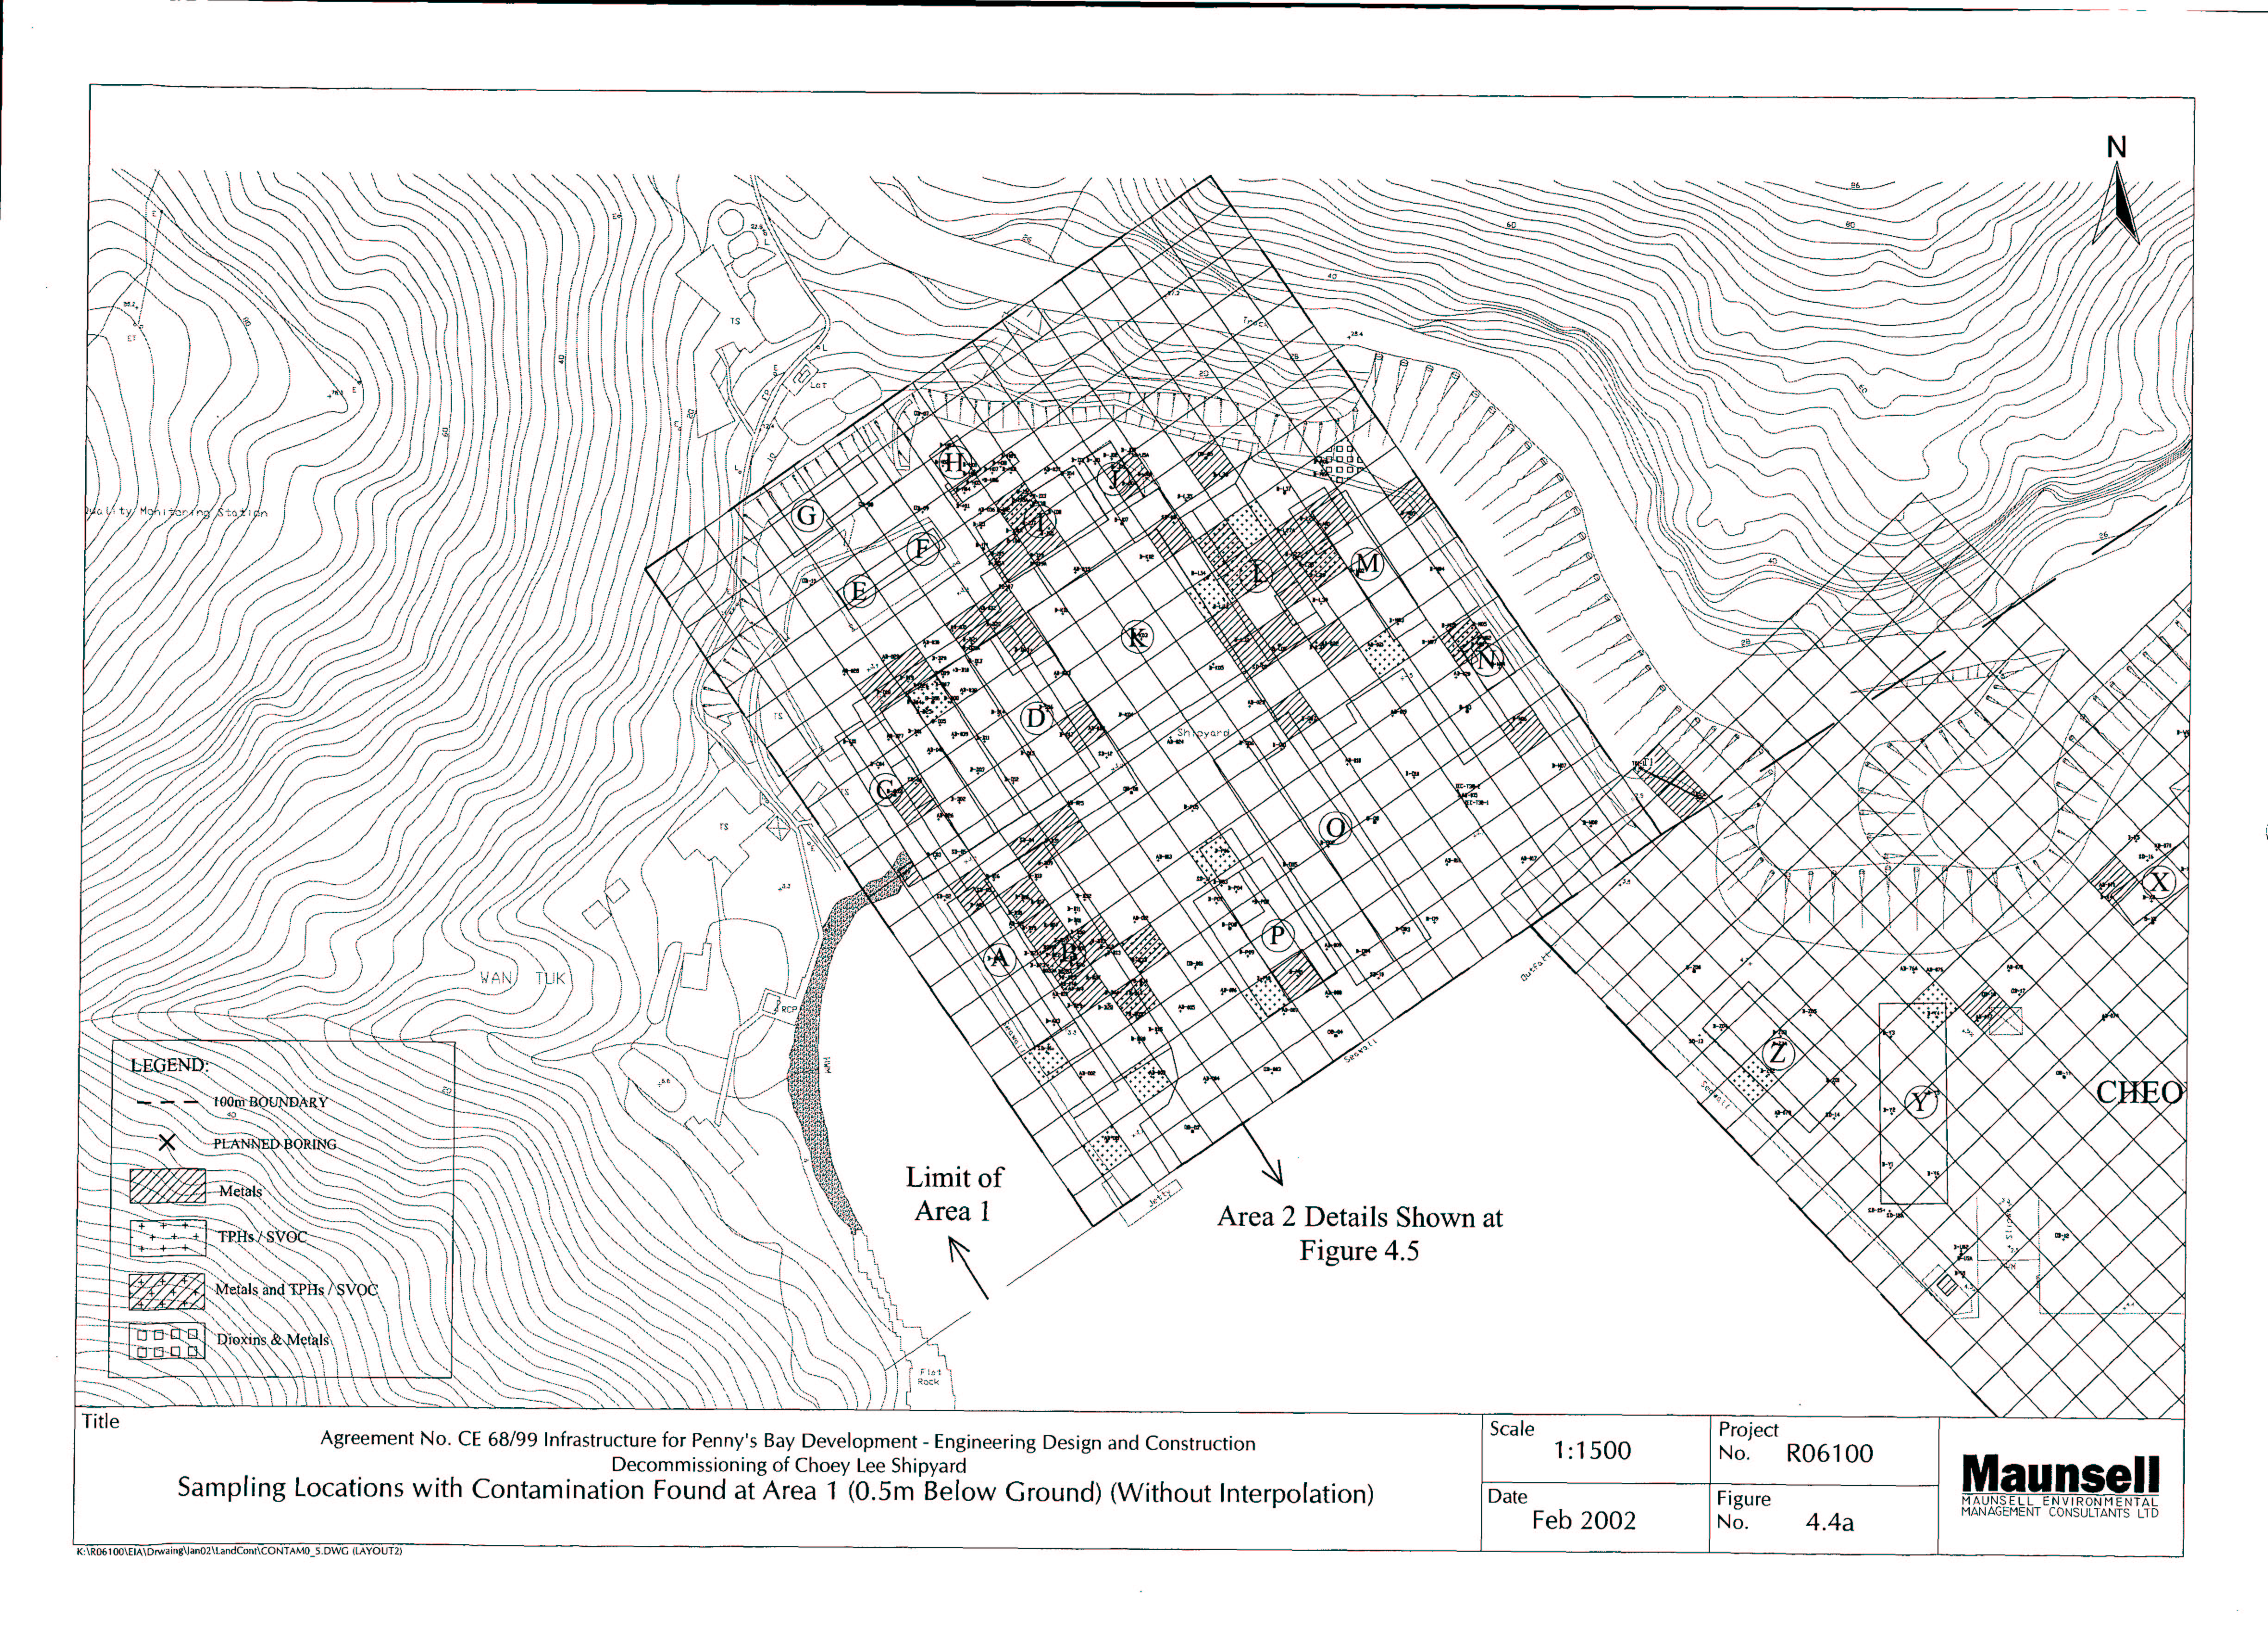
Figure 4.1a As-built Locations of Sampling Boreholes and Trenches (Area 1)
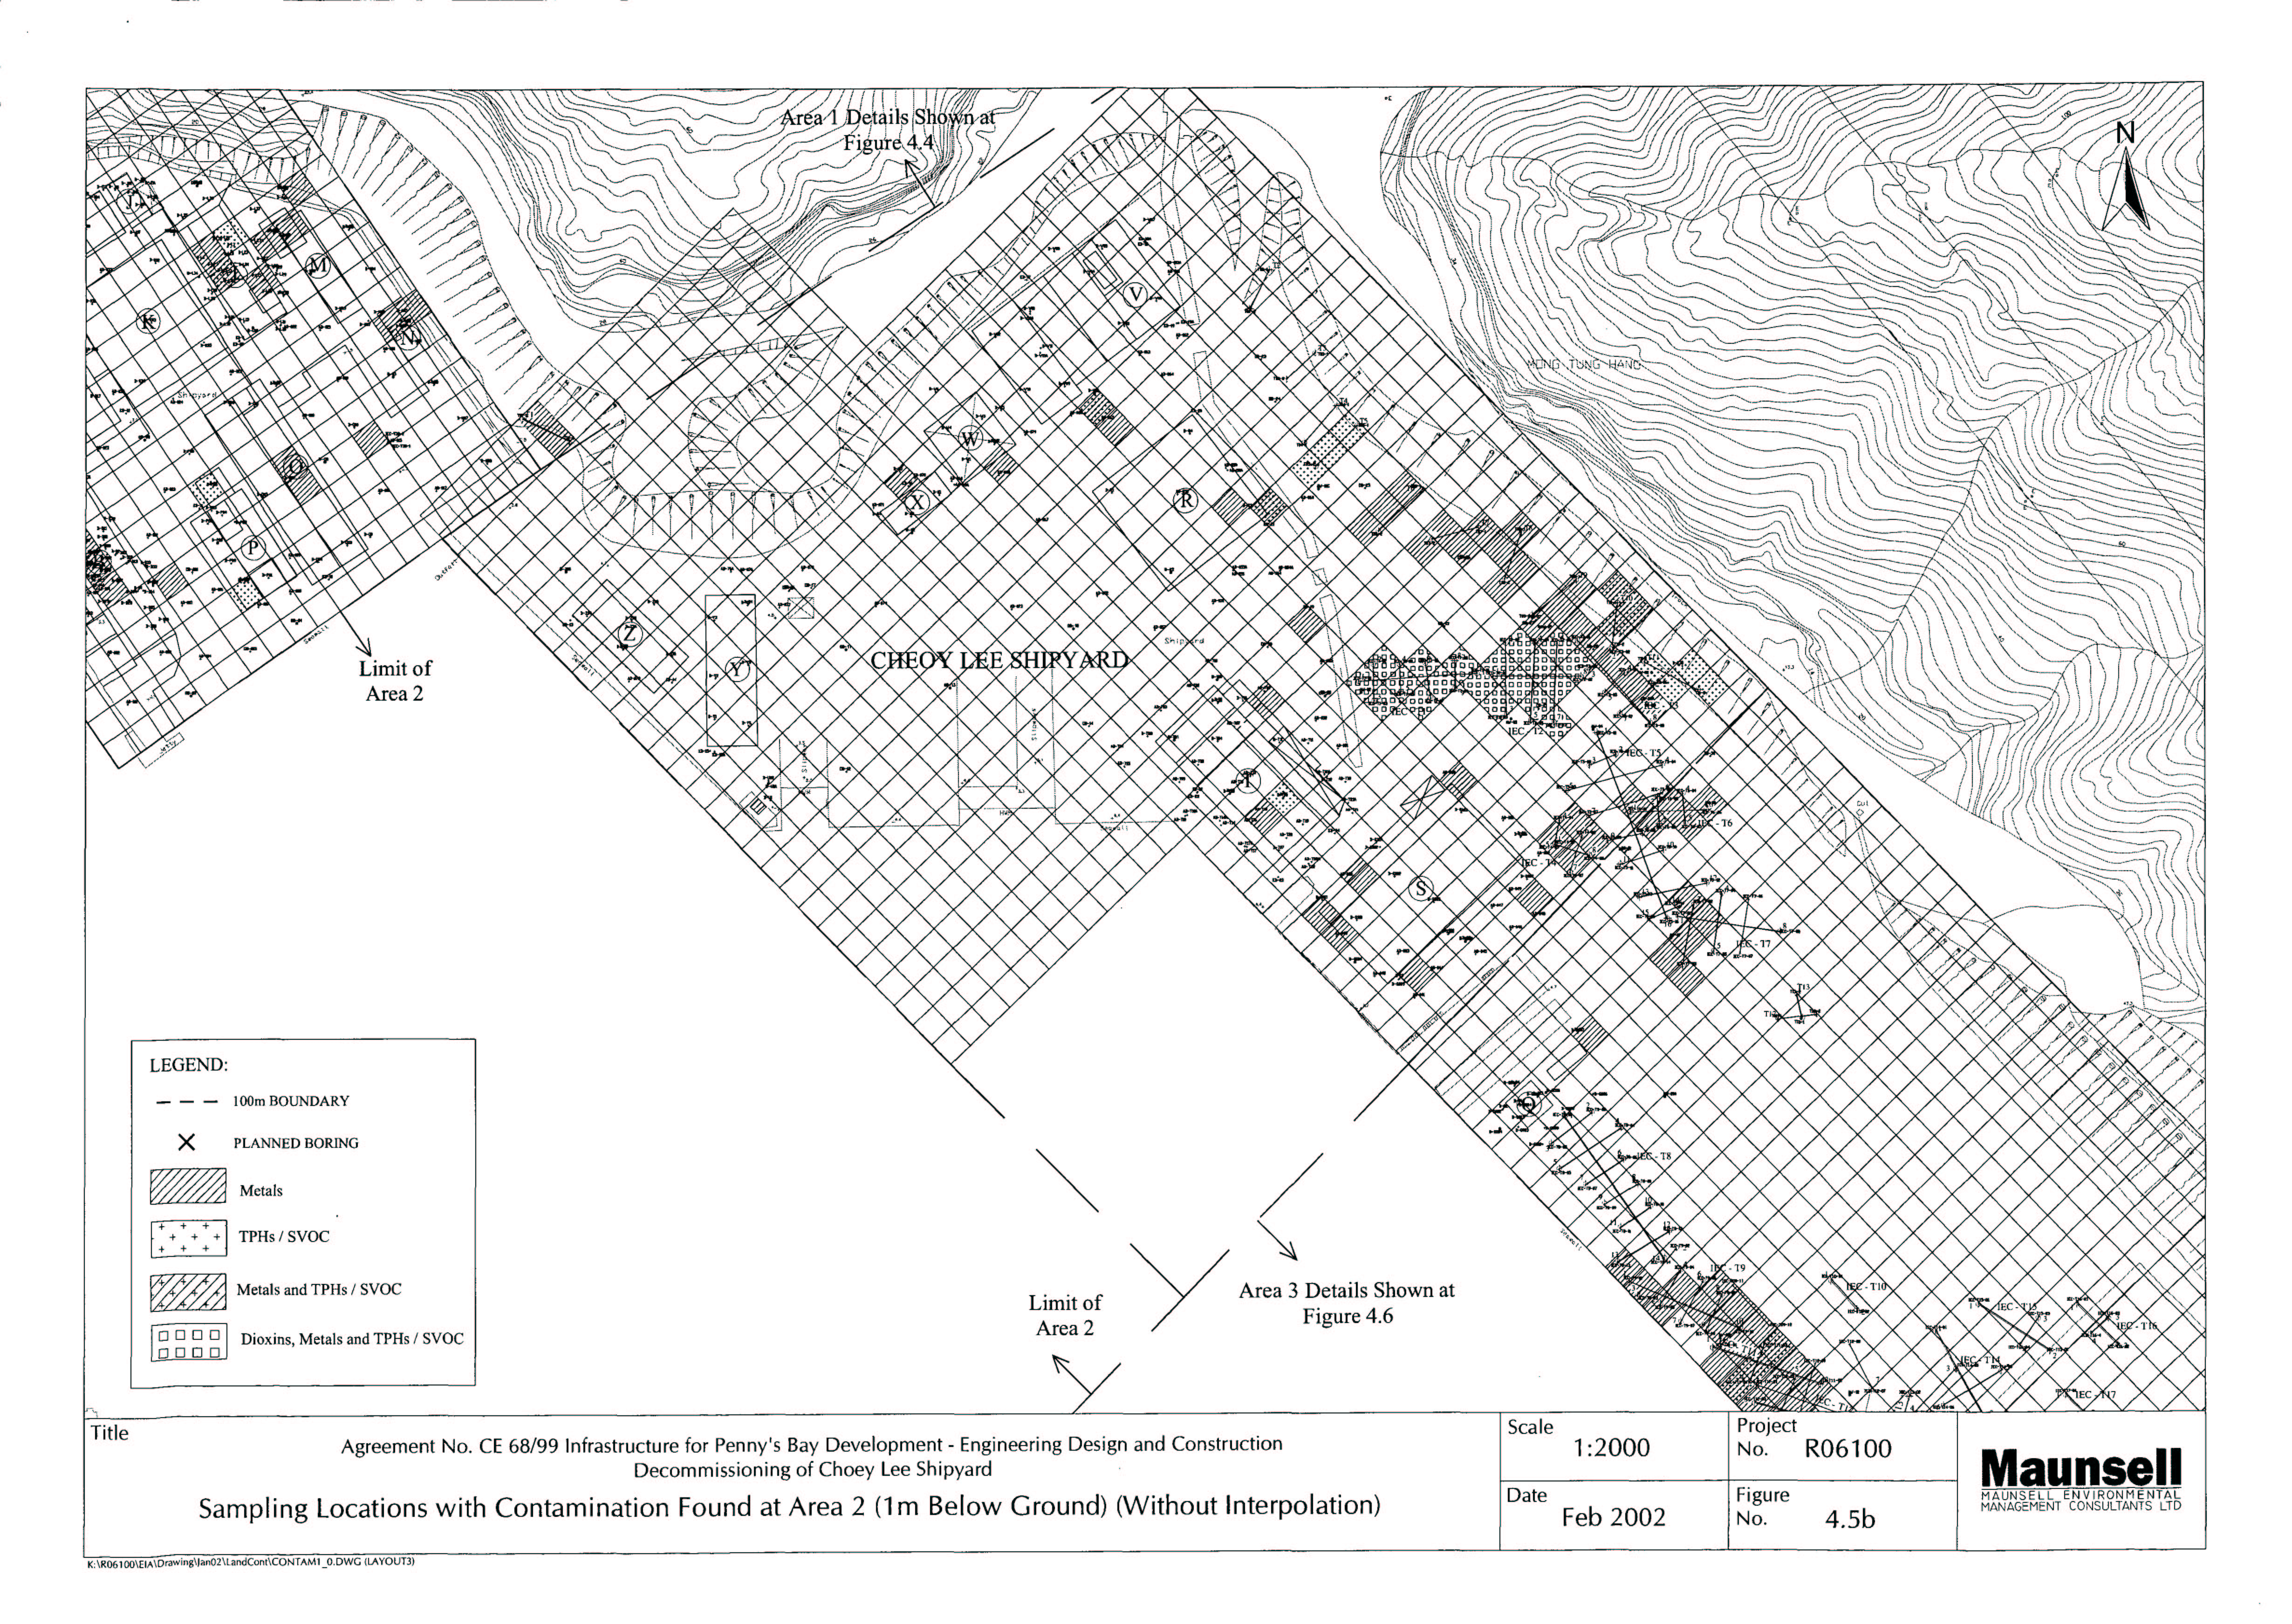
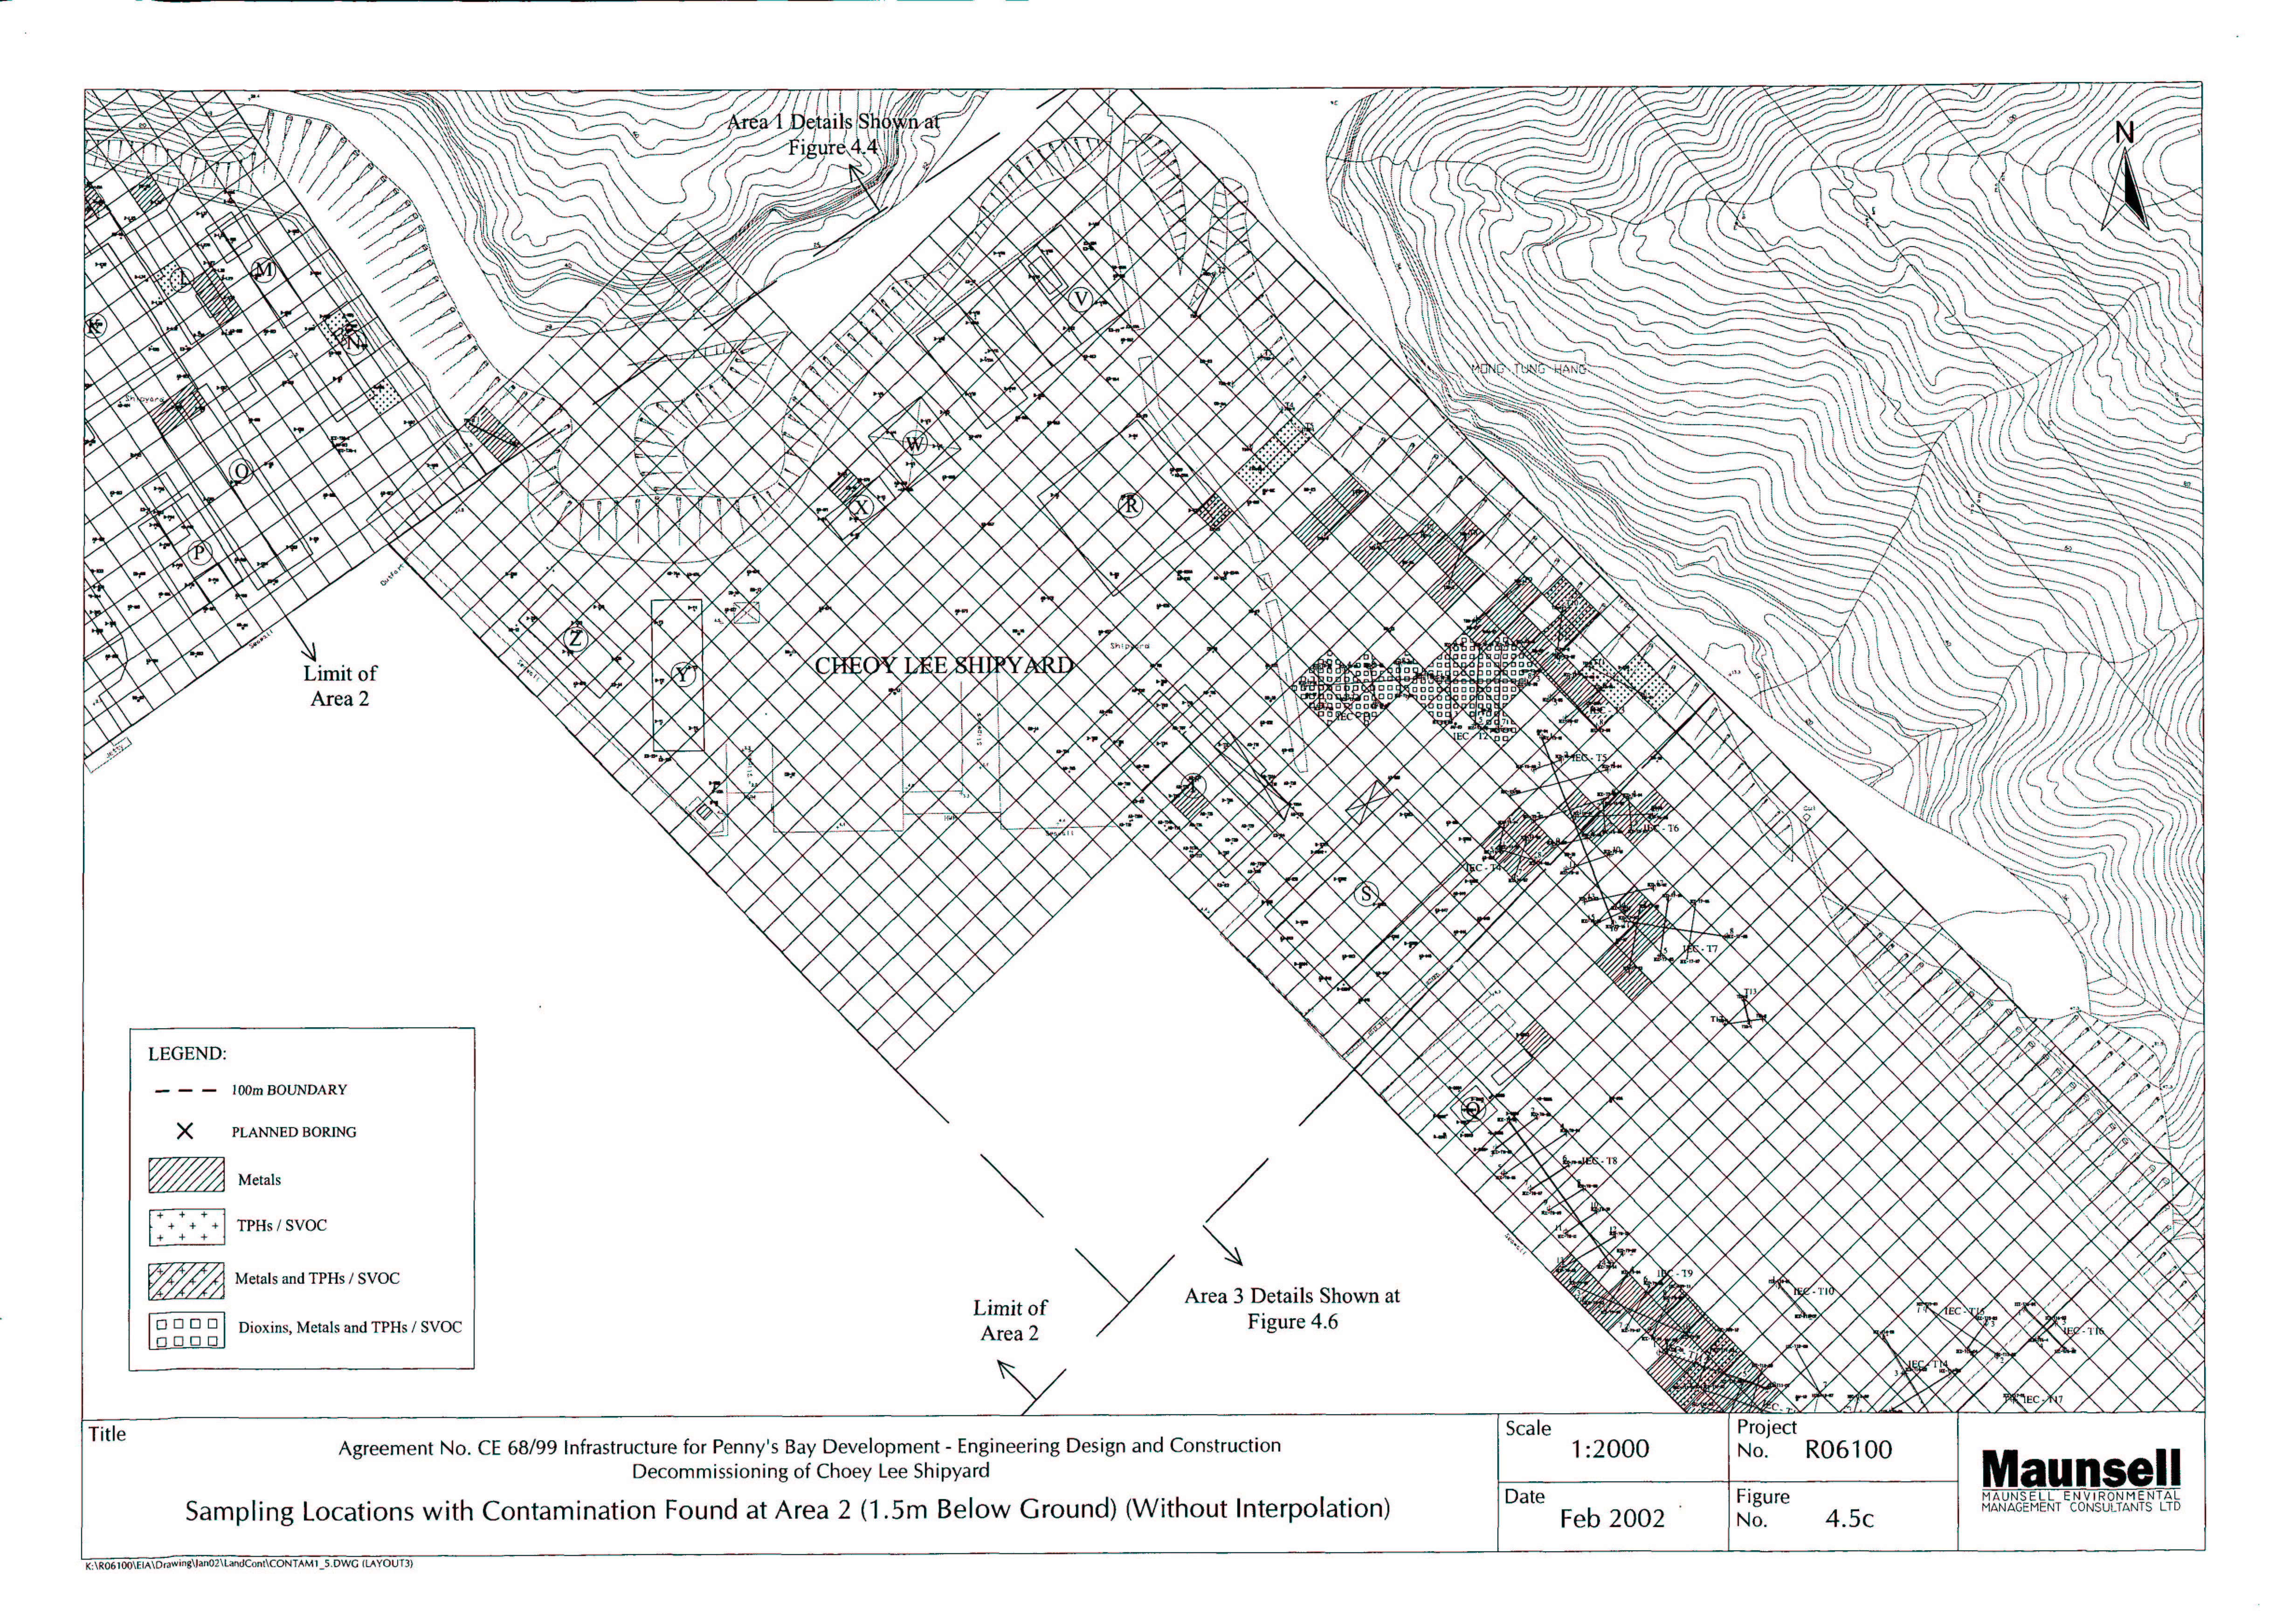
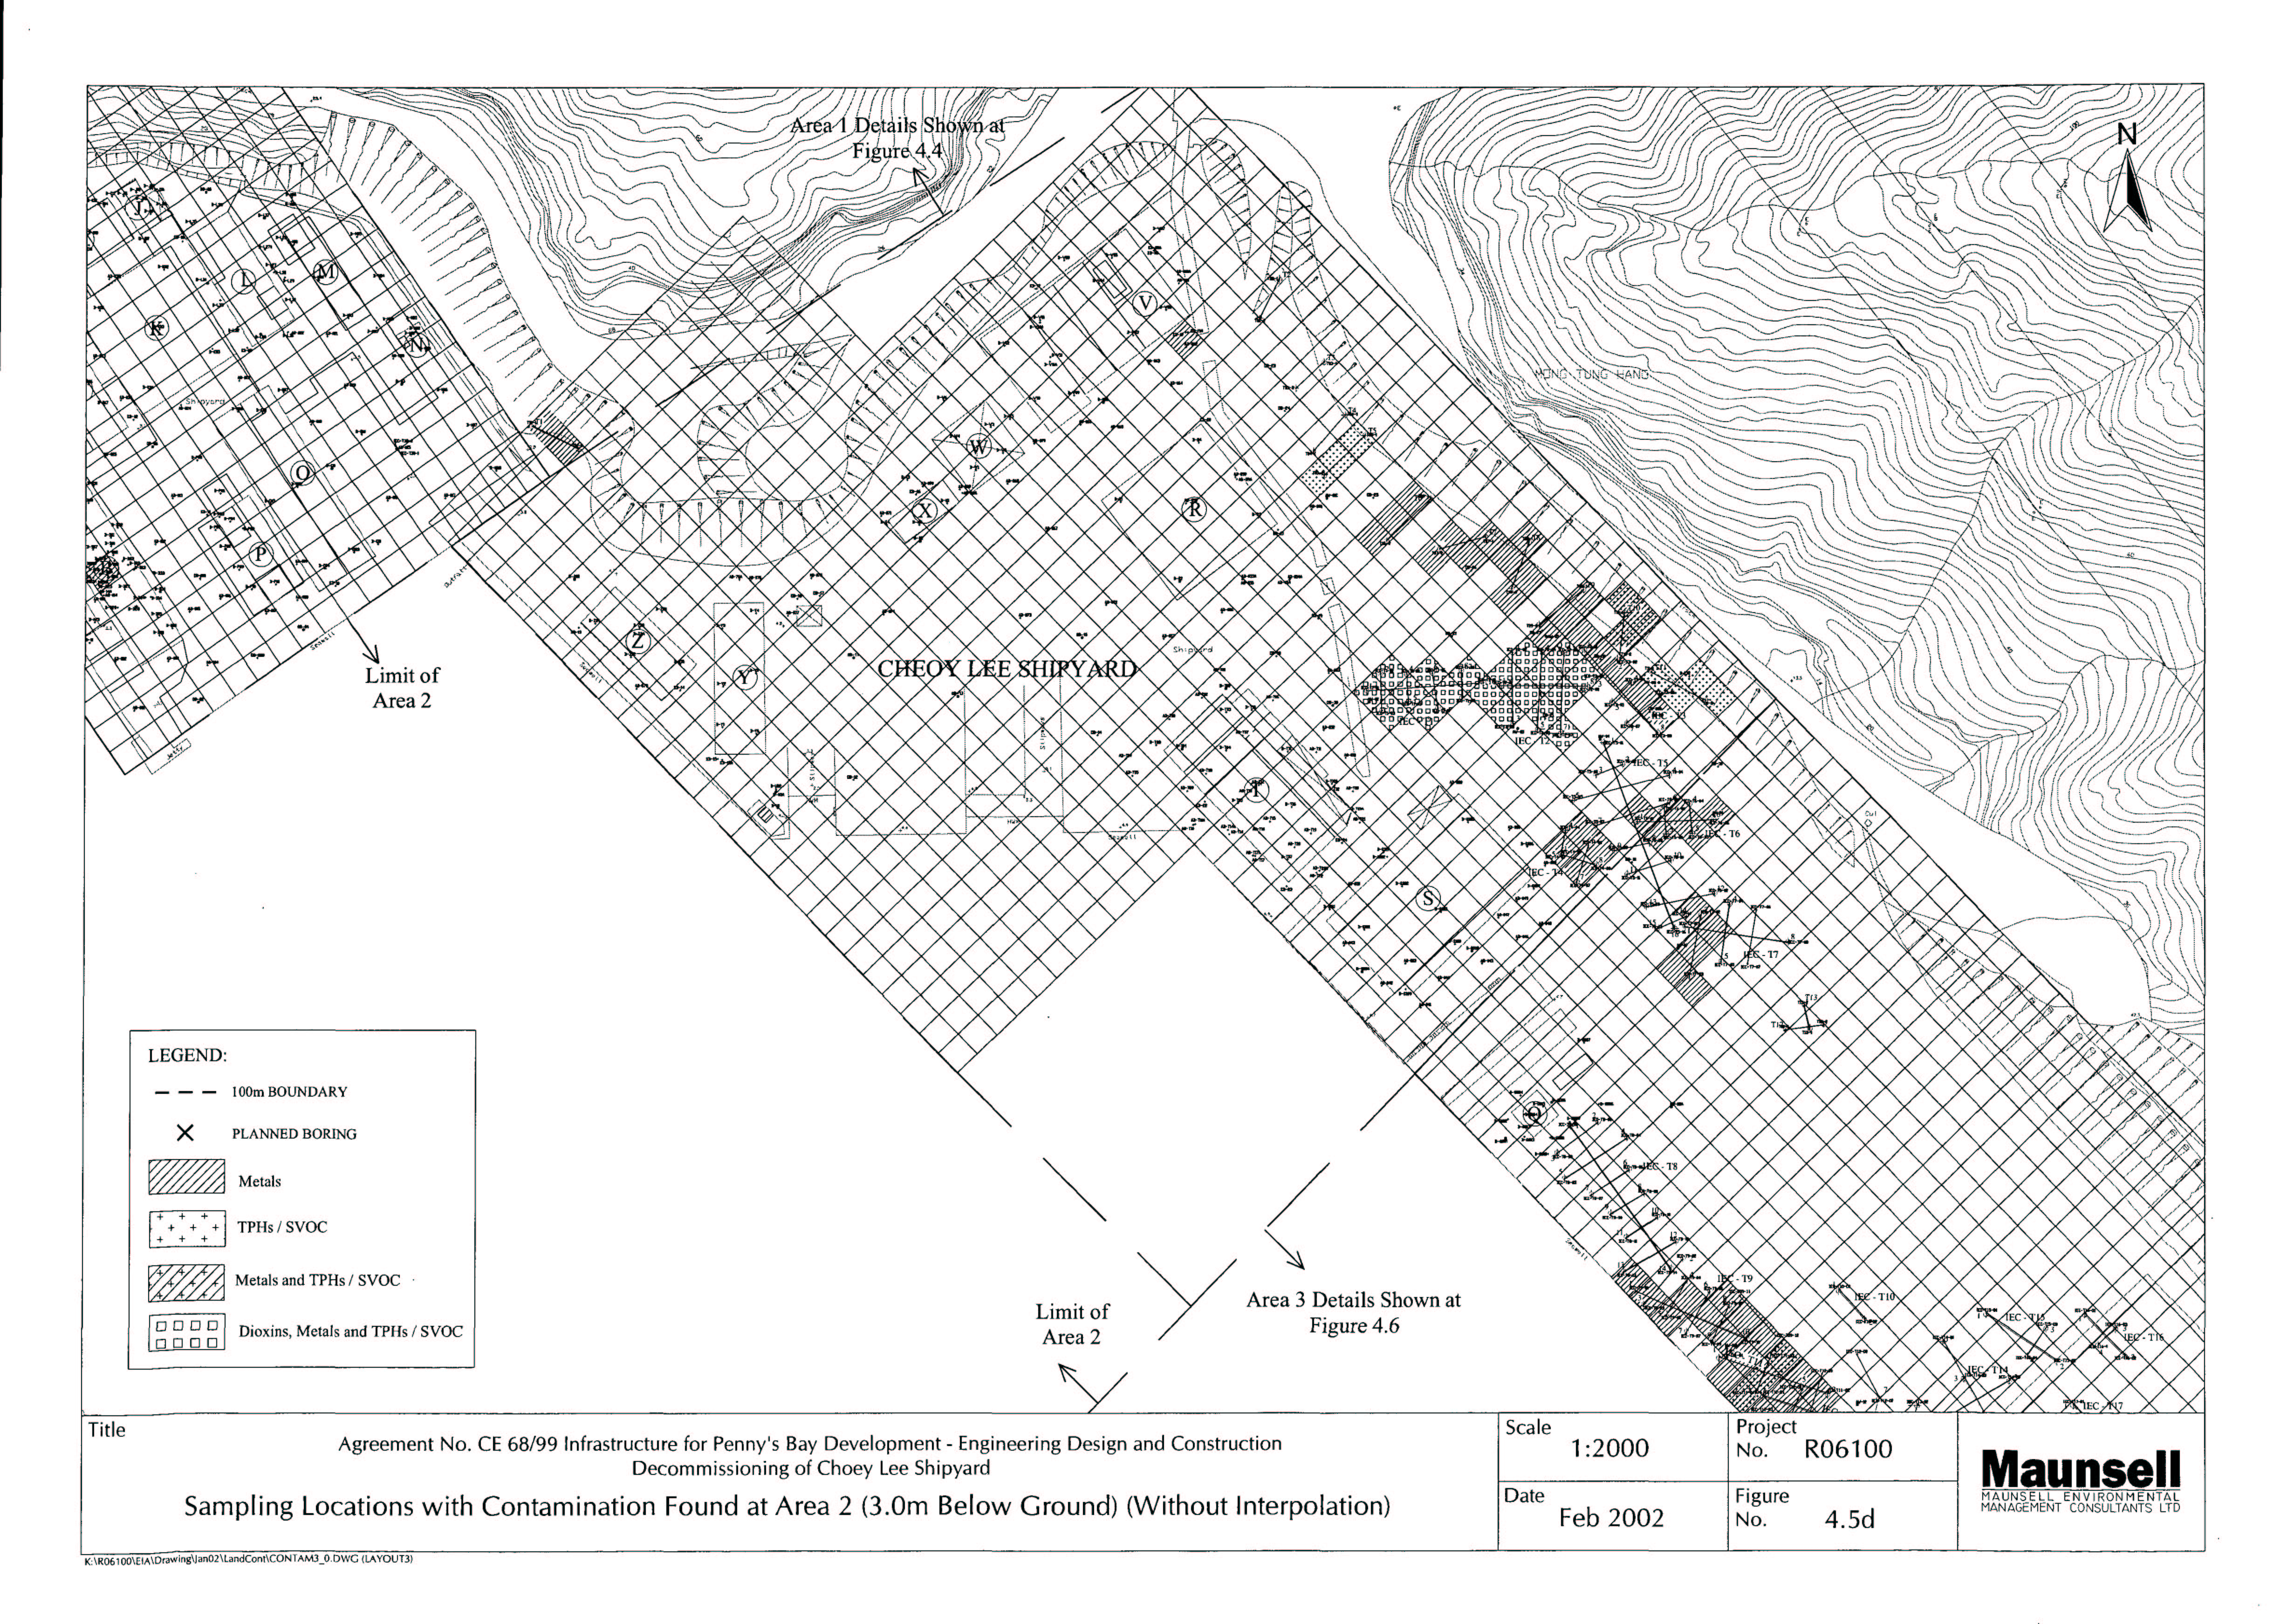
Figure 4.1b As-built Locations of Sampling Boreholes and Trenches (Area 2)
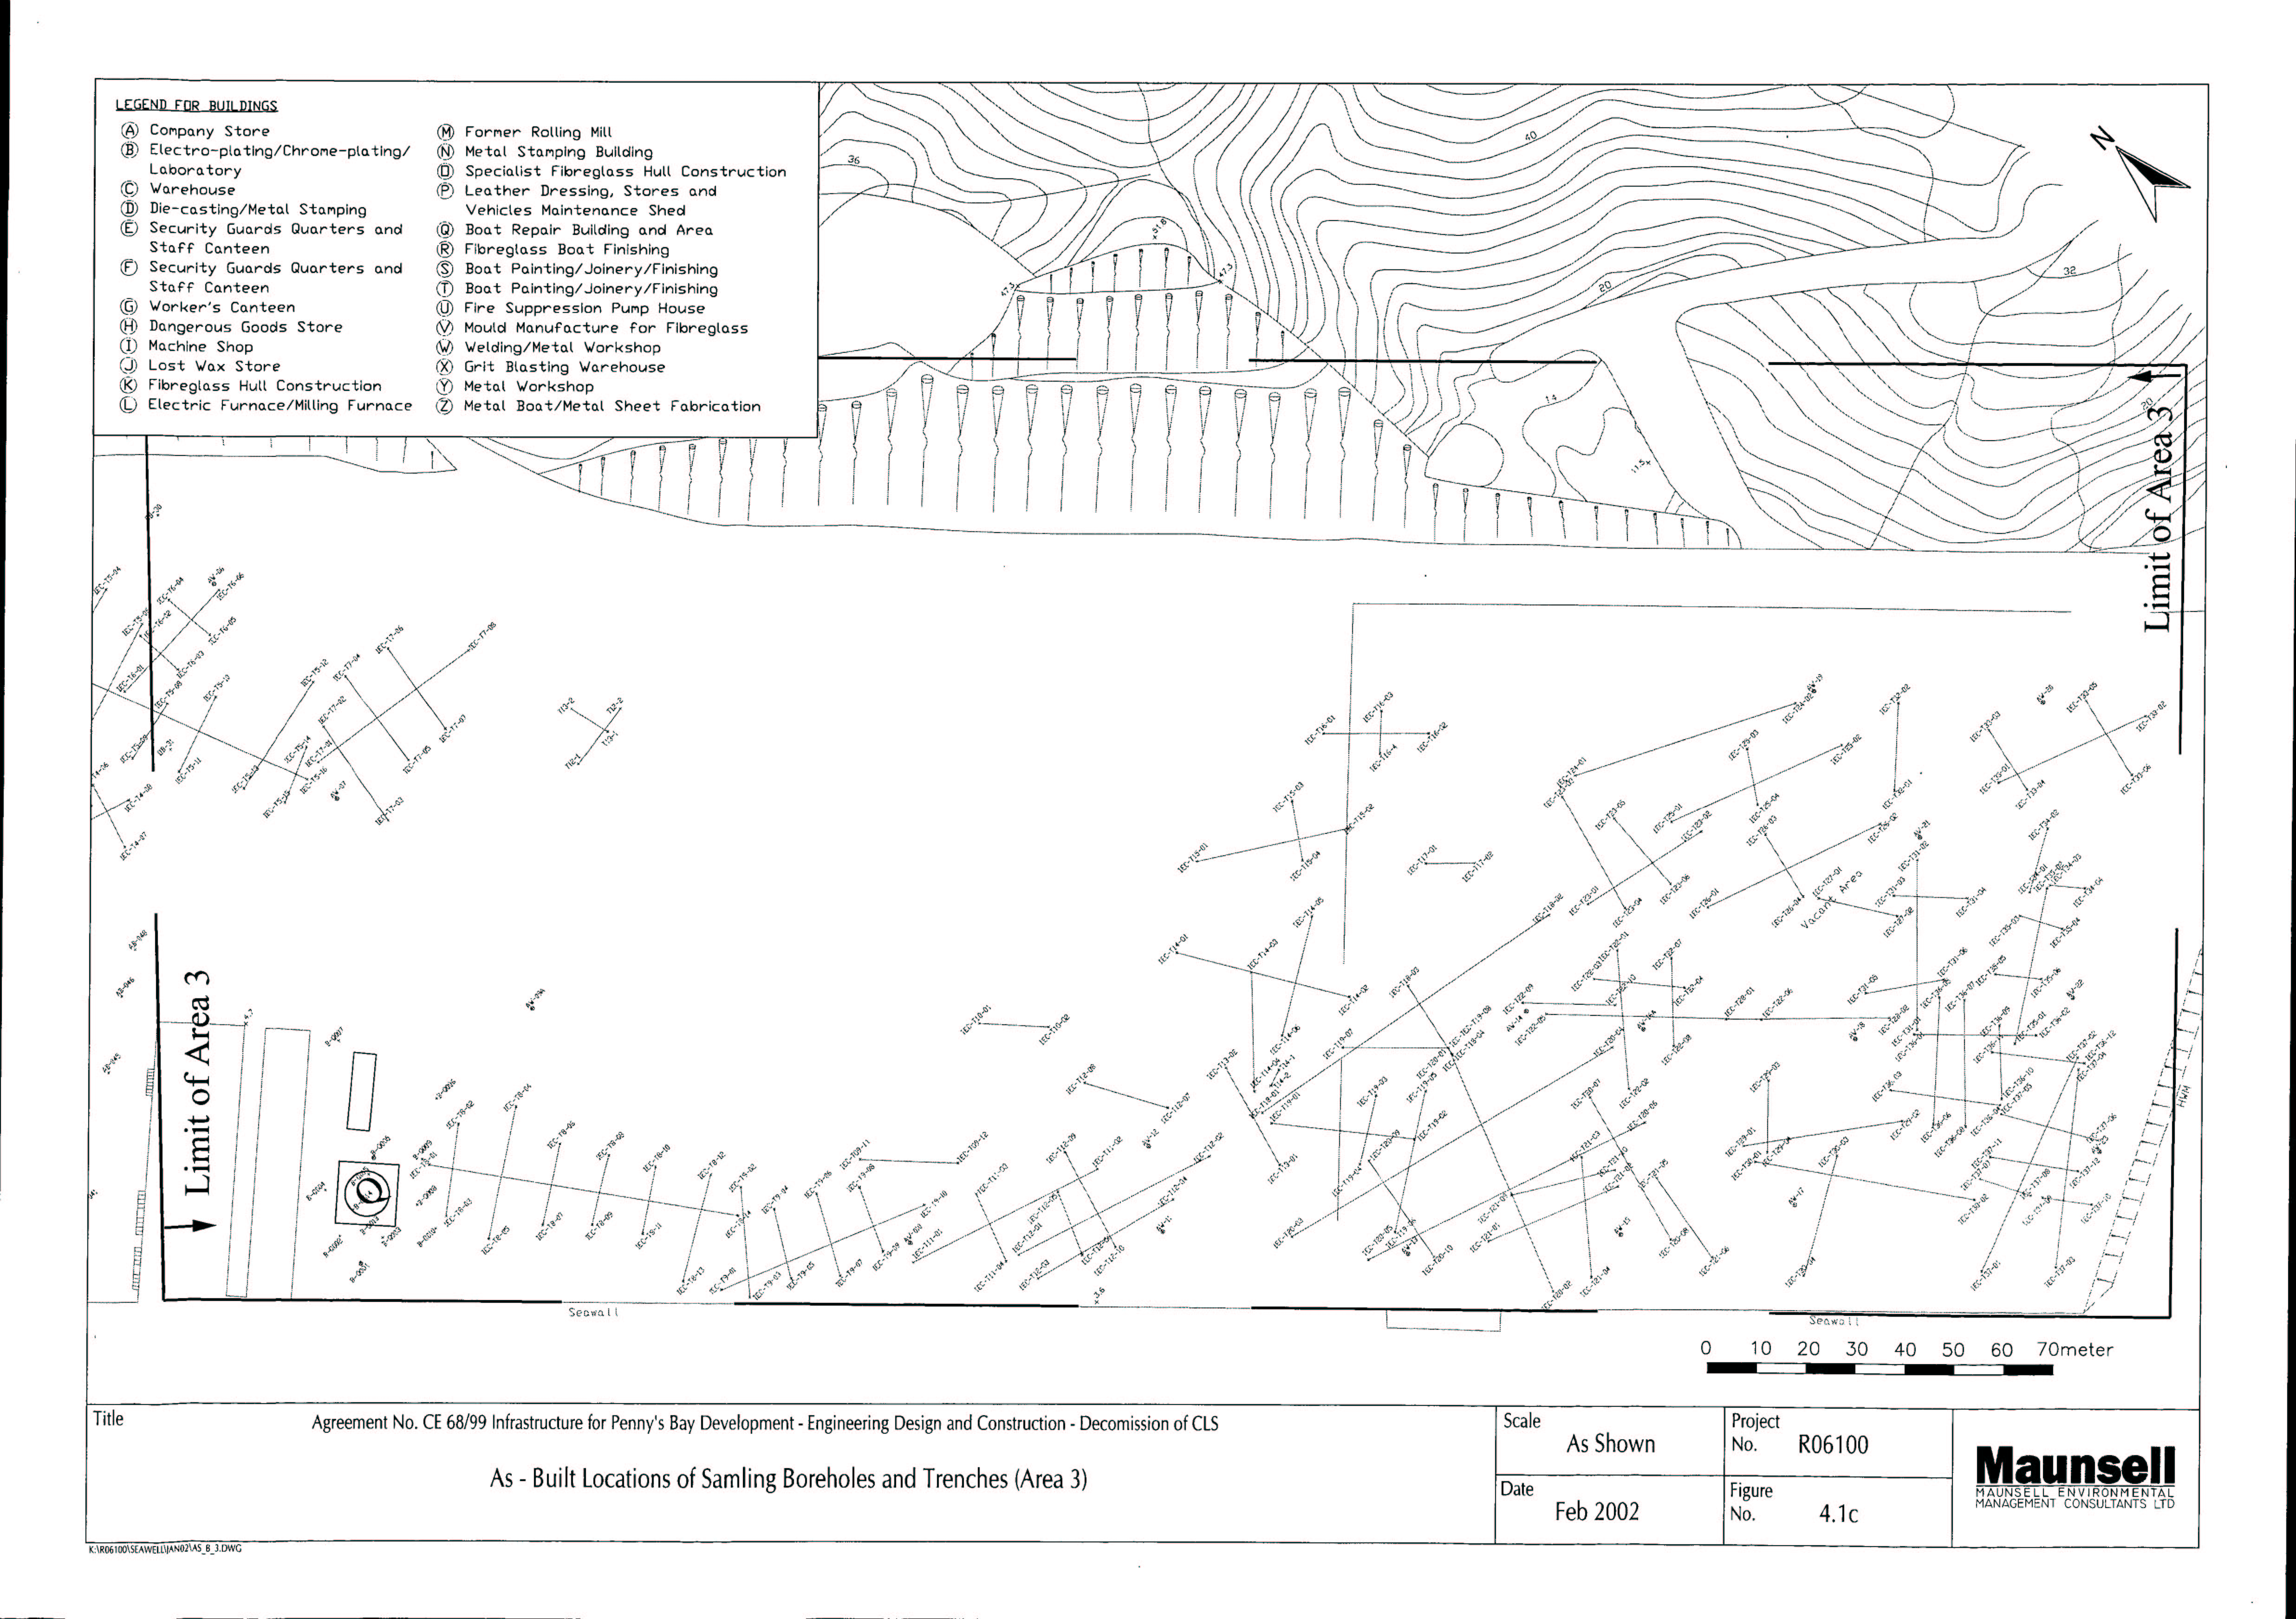
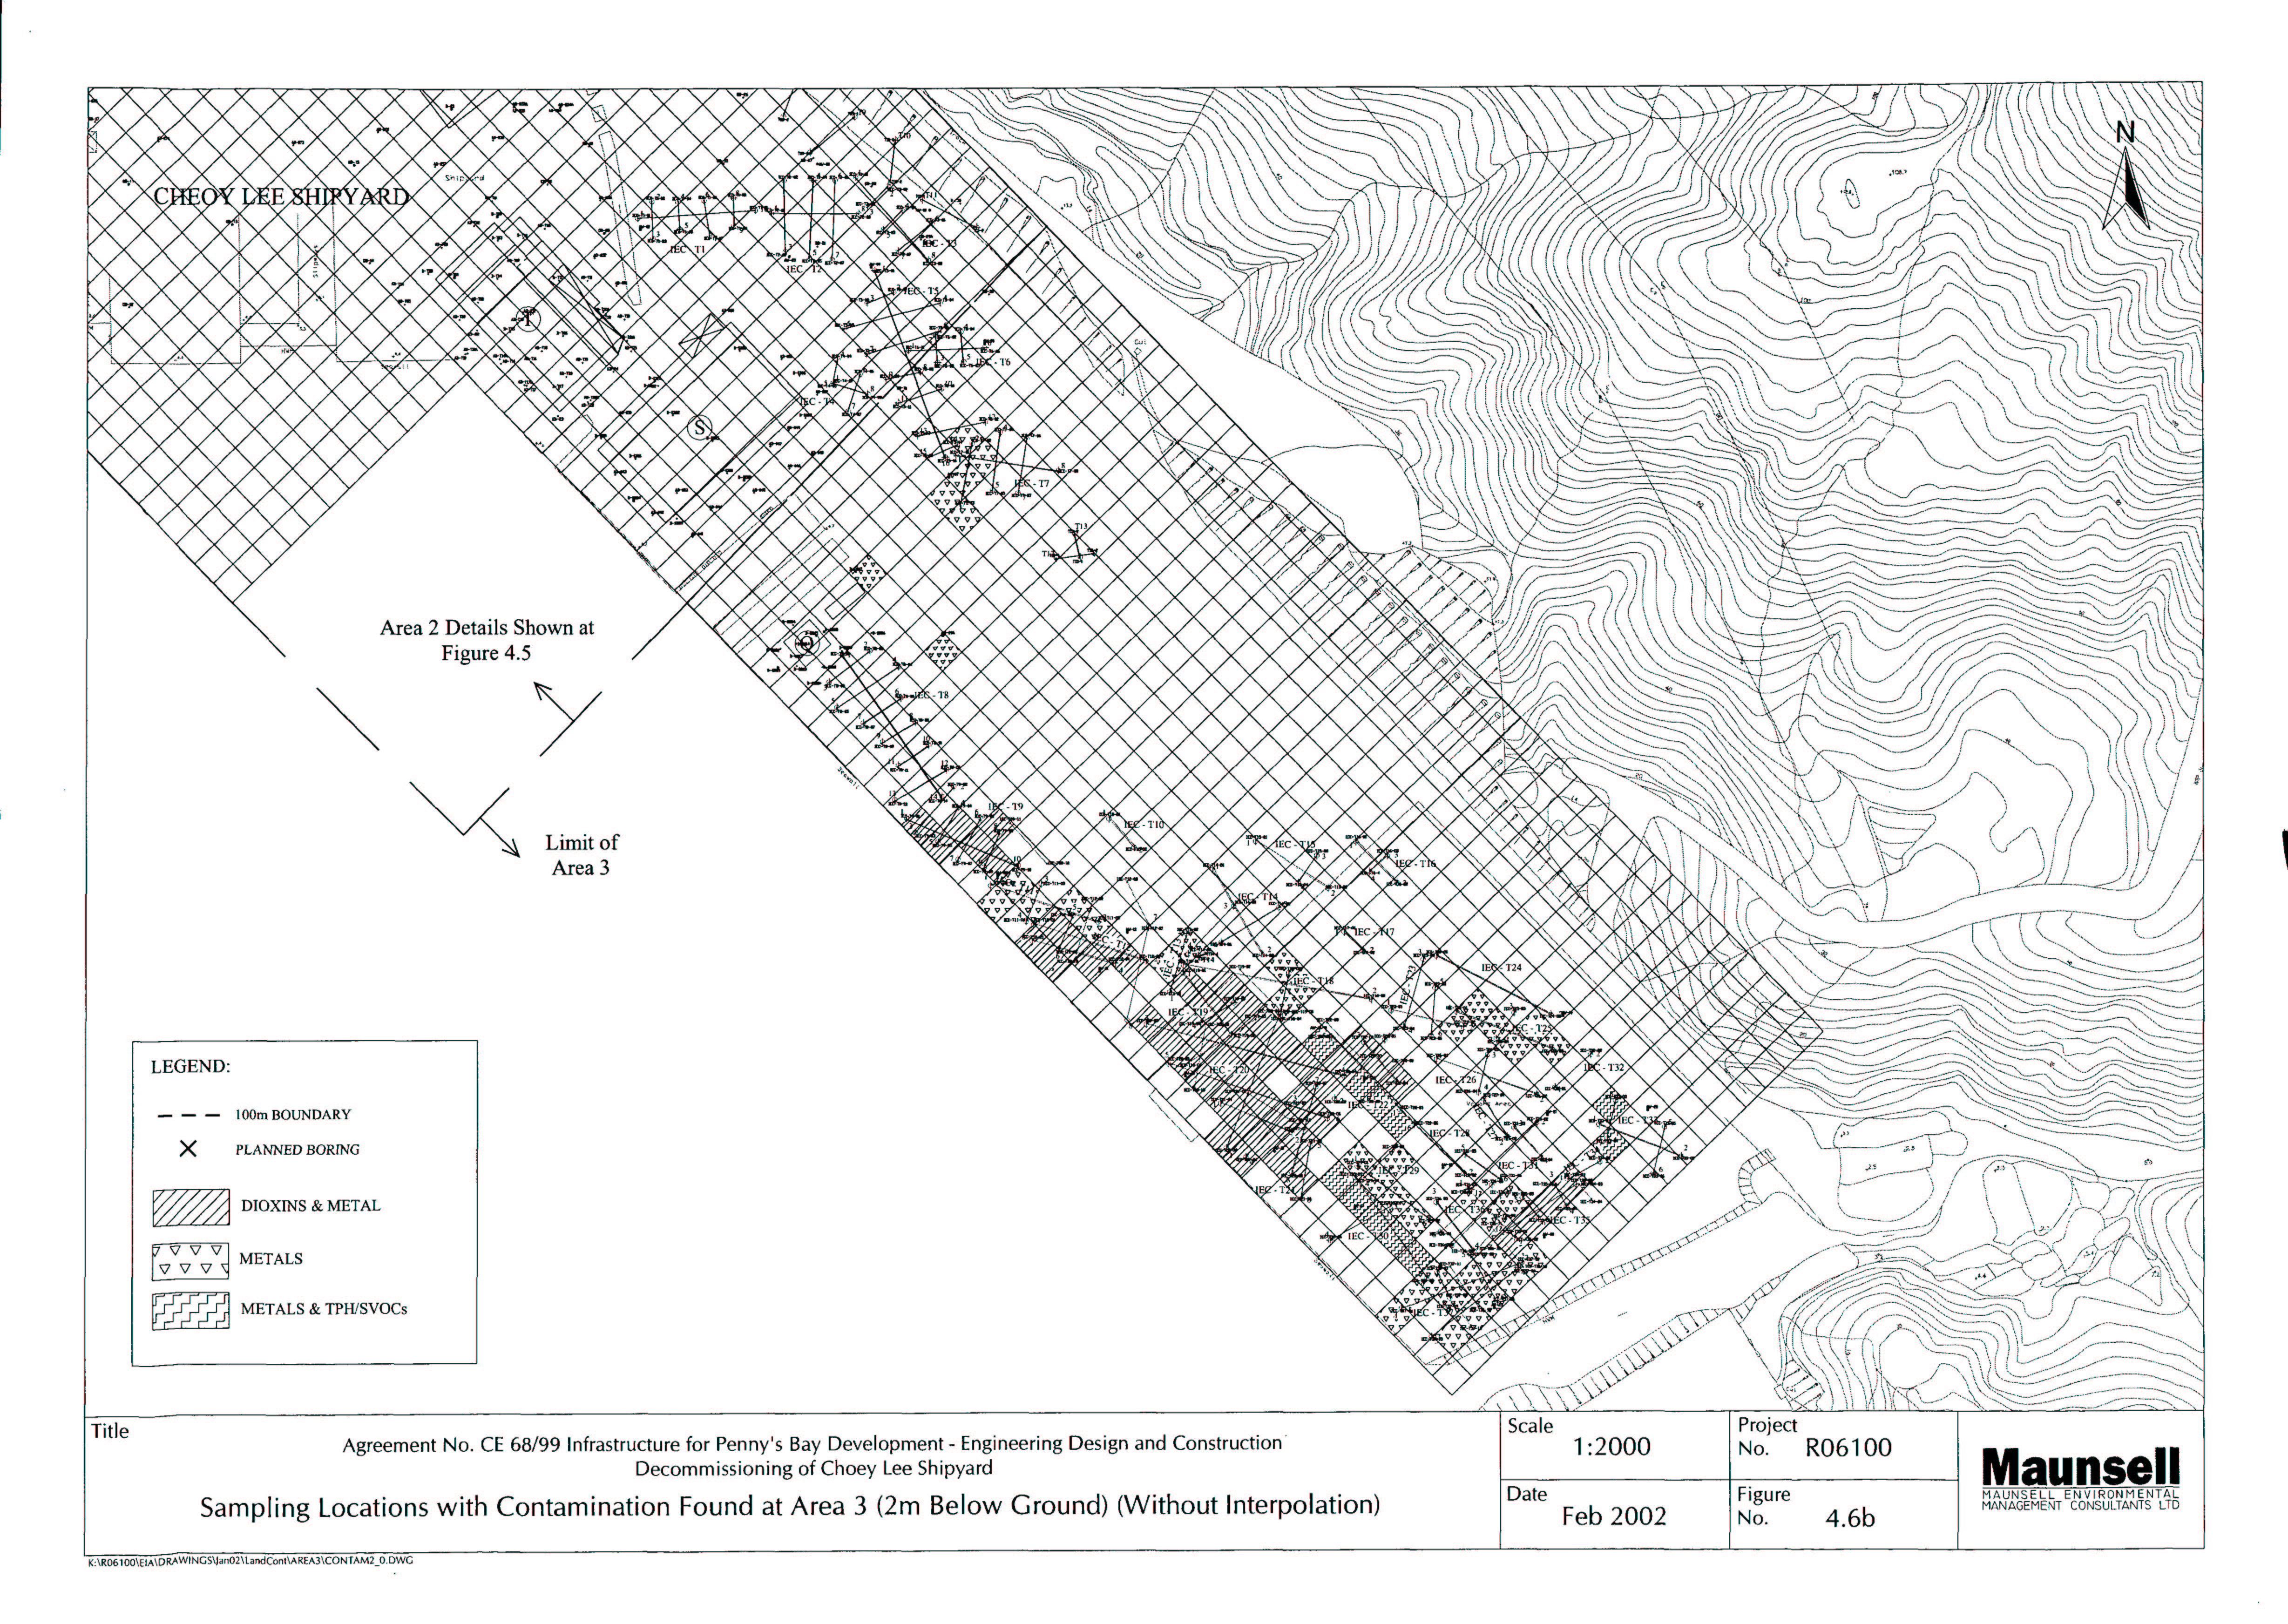
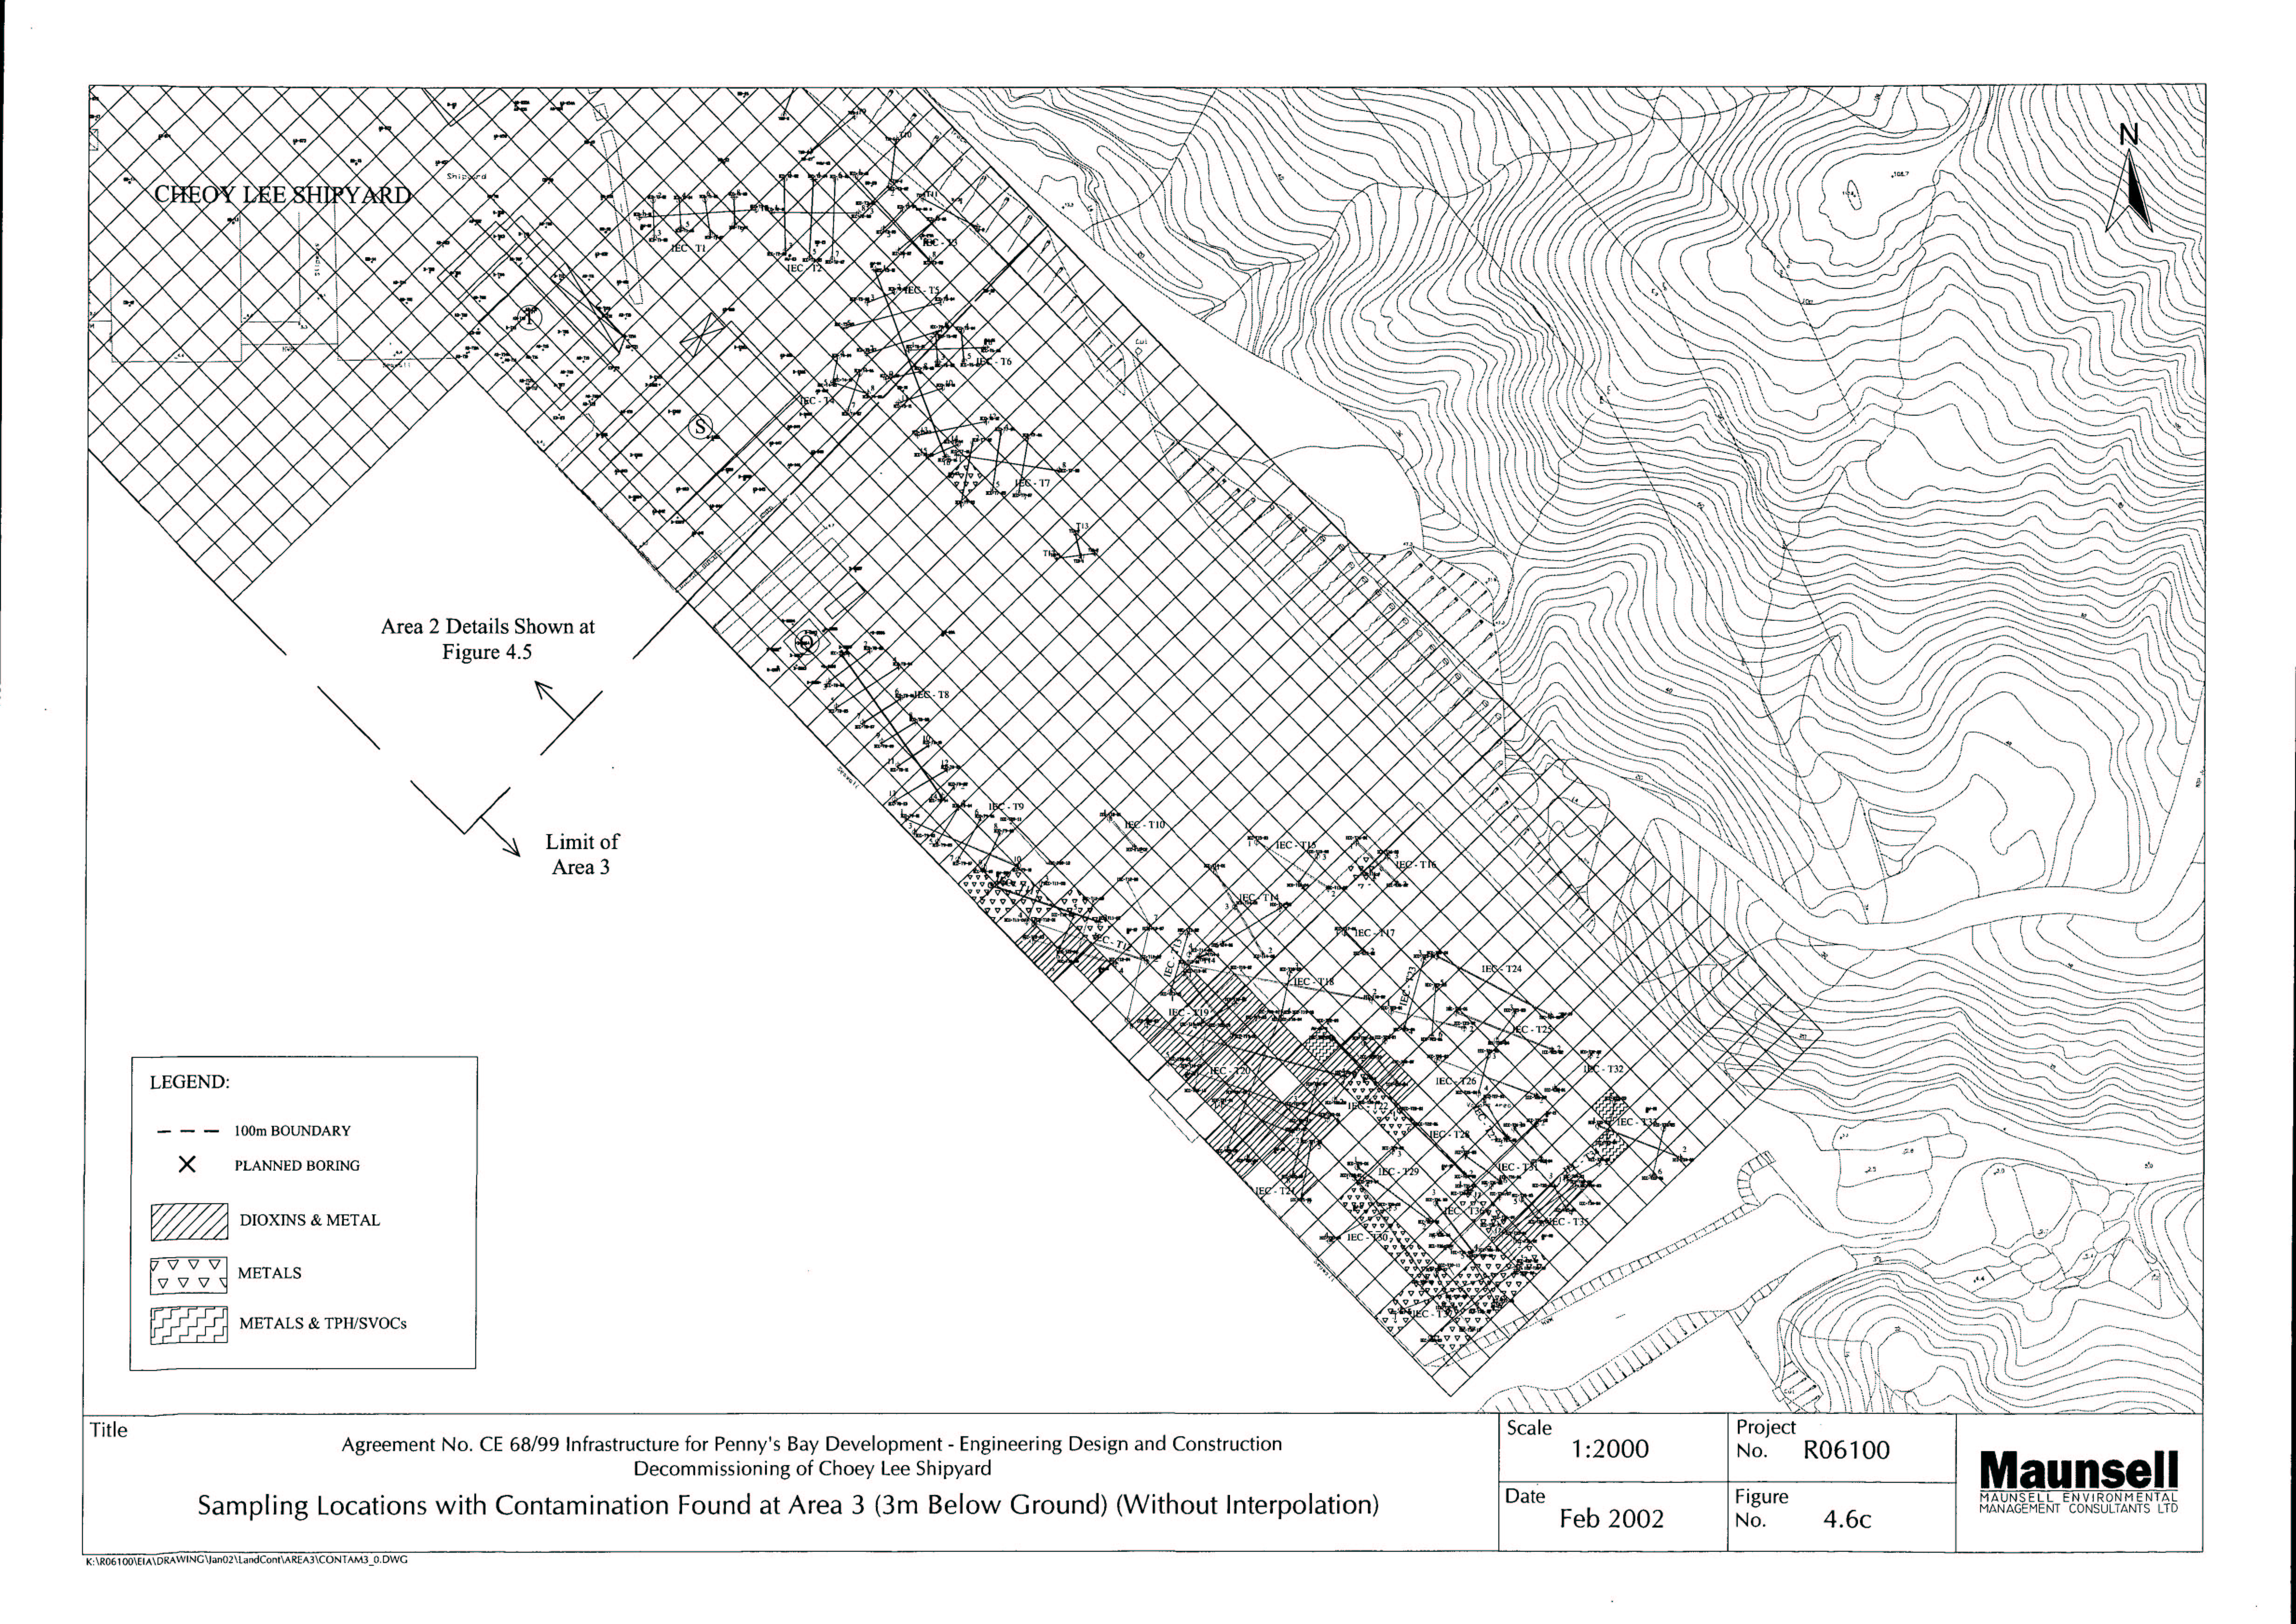
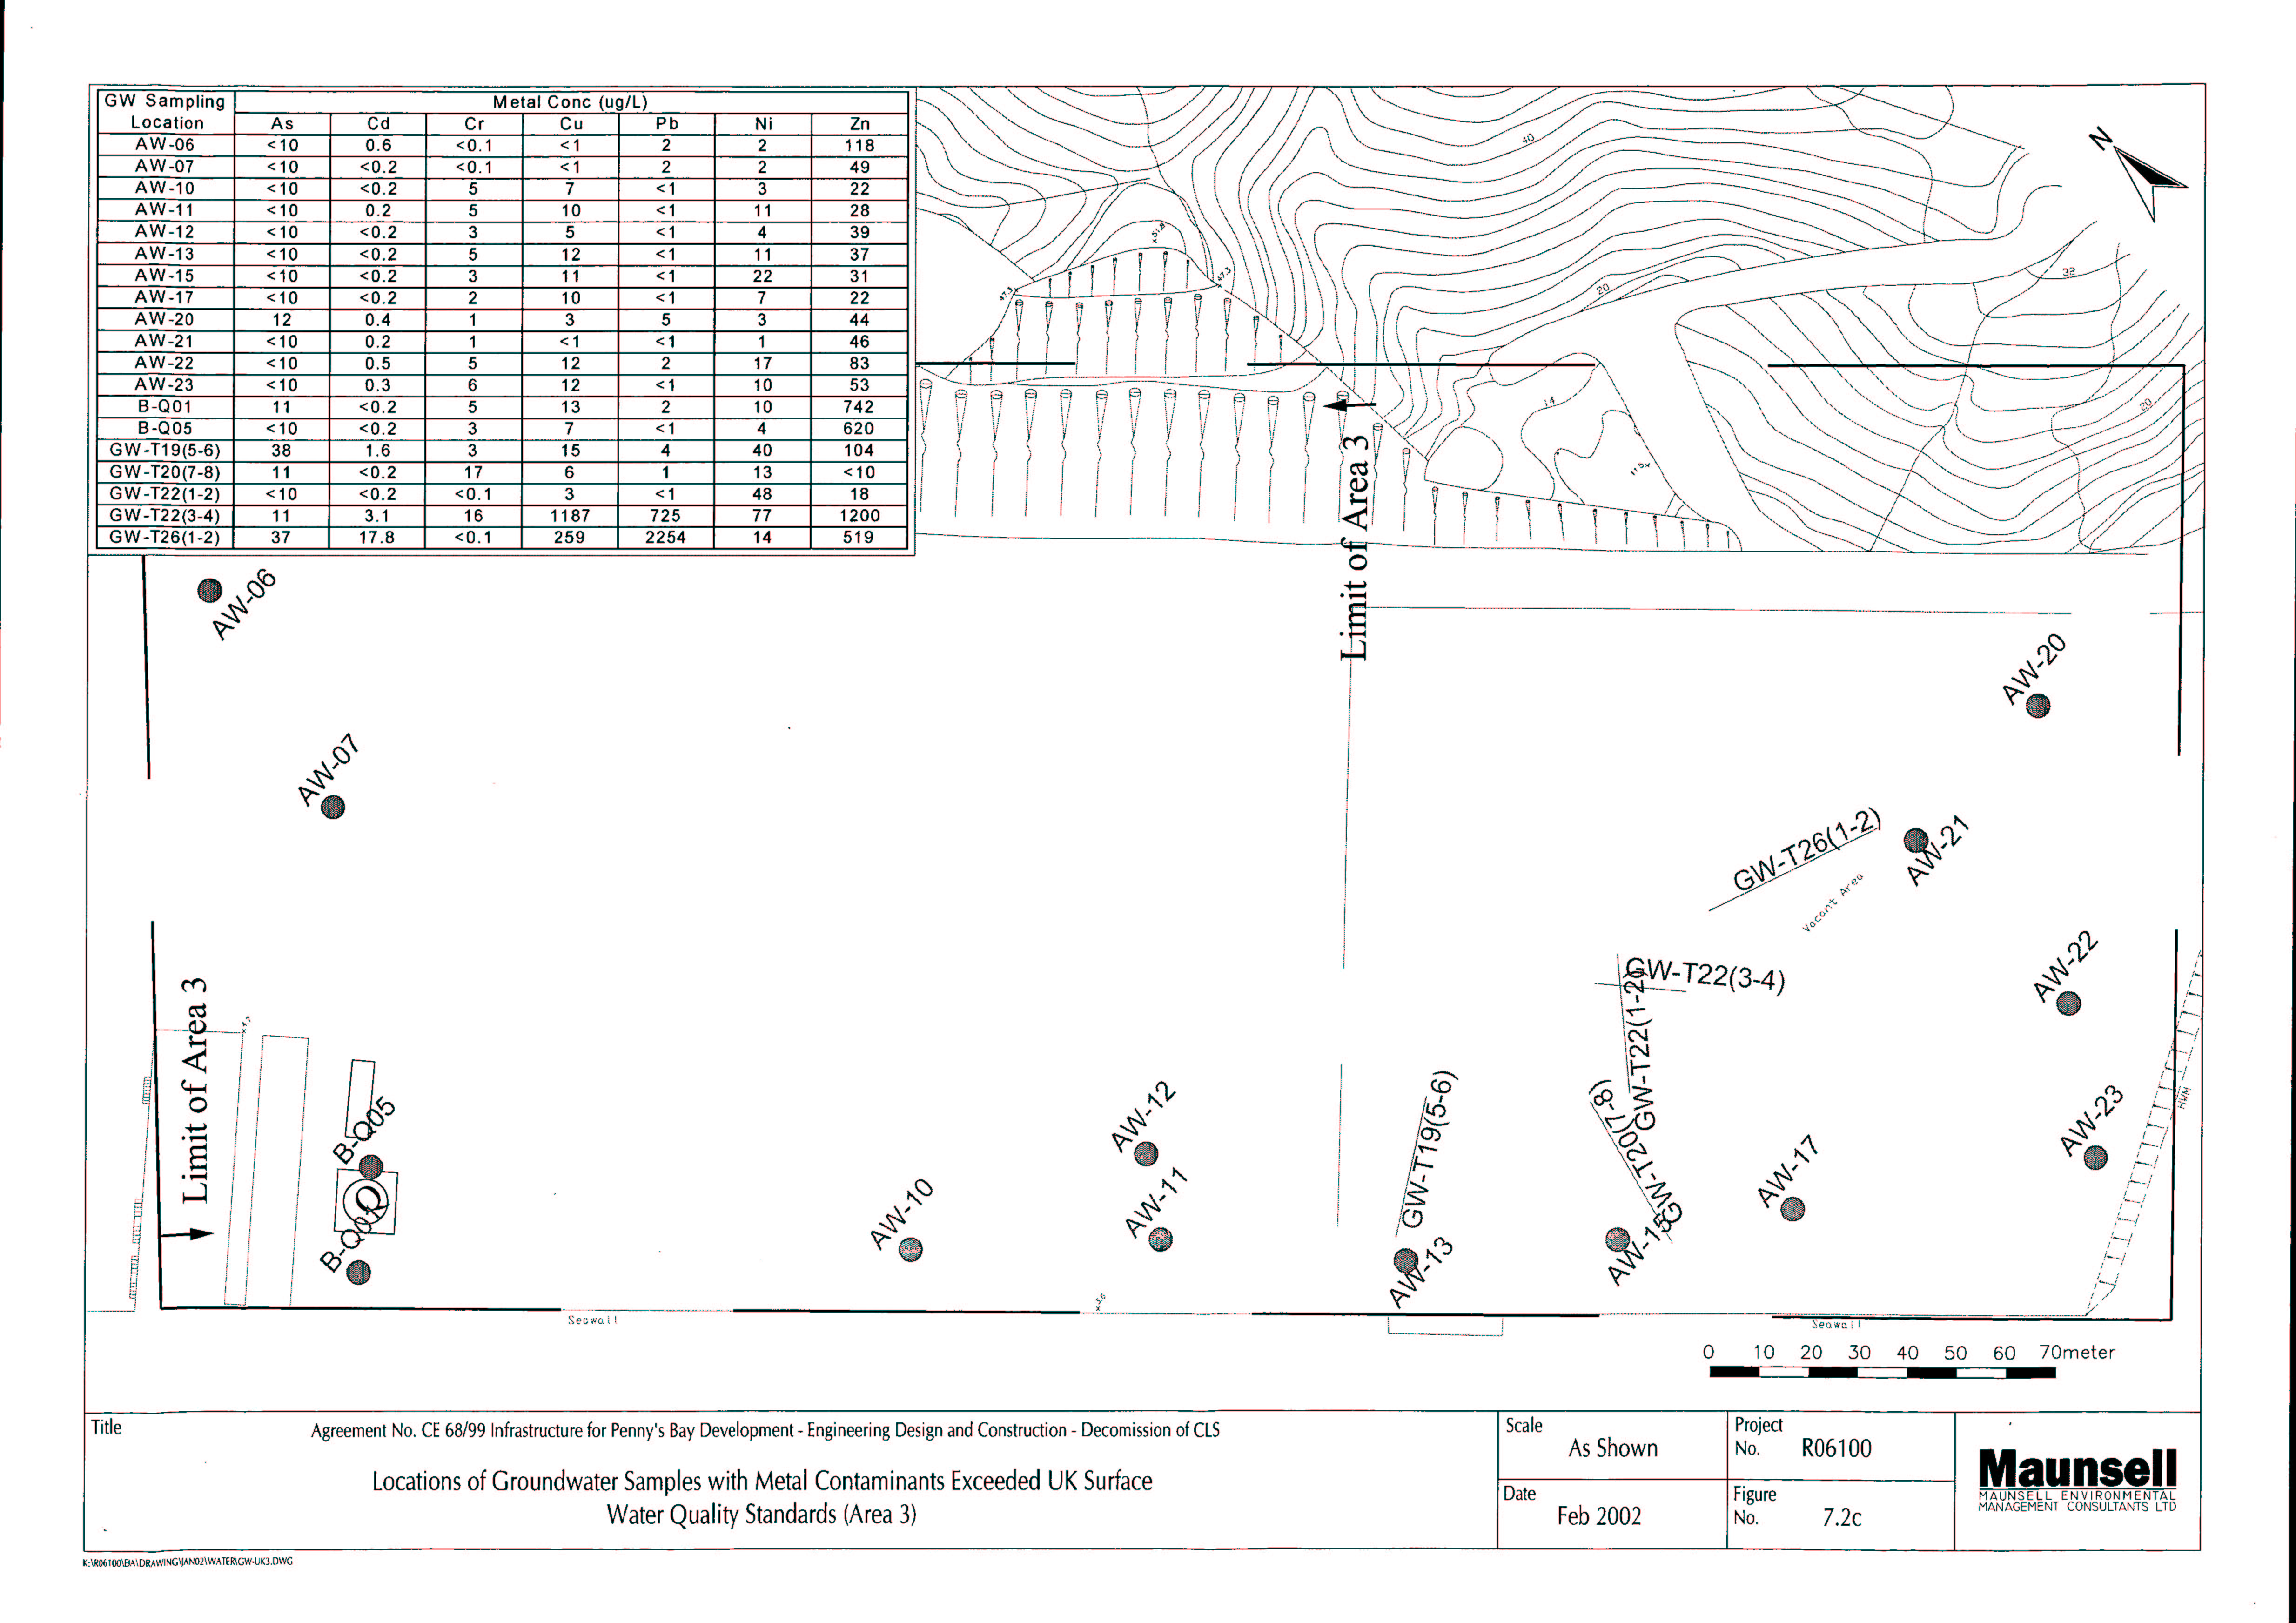
Figure 4.1c As-built Locations of Sampling Boreholes and Trenches (Area 3)
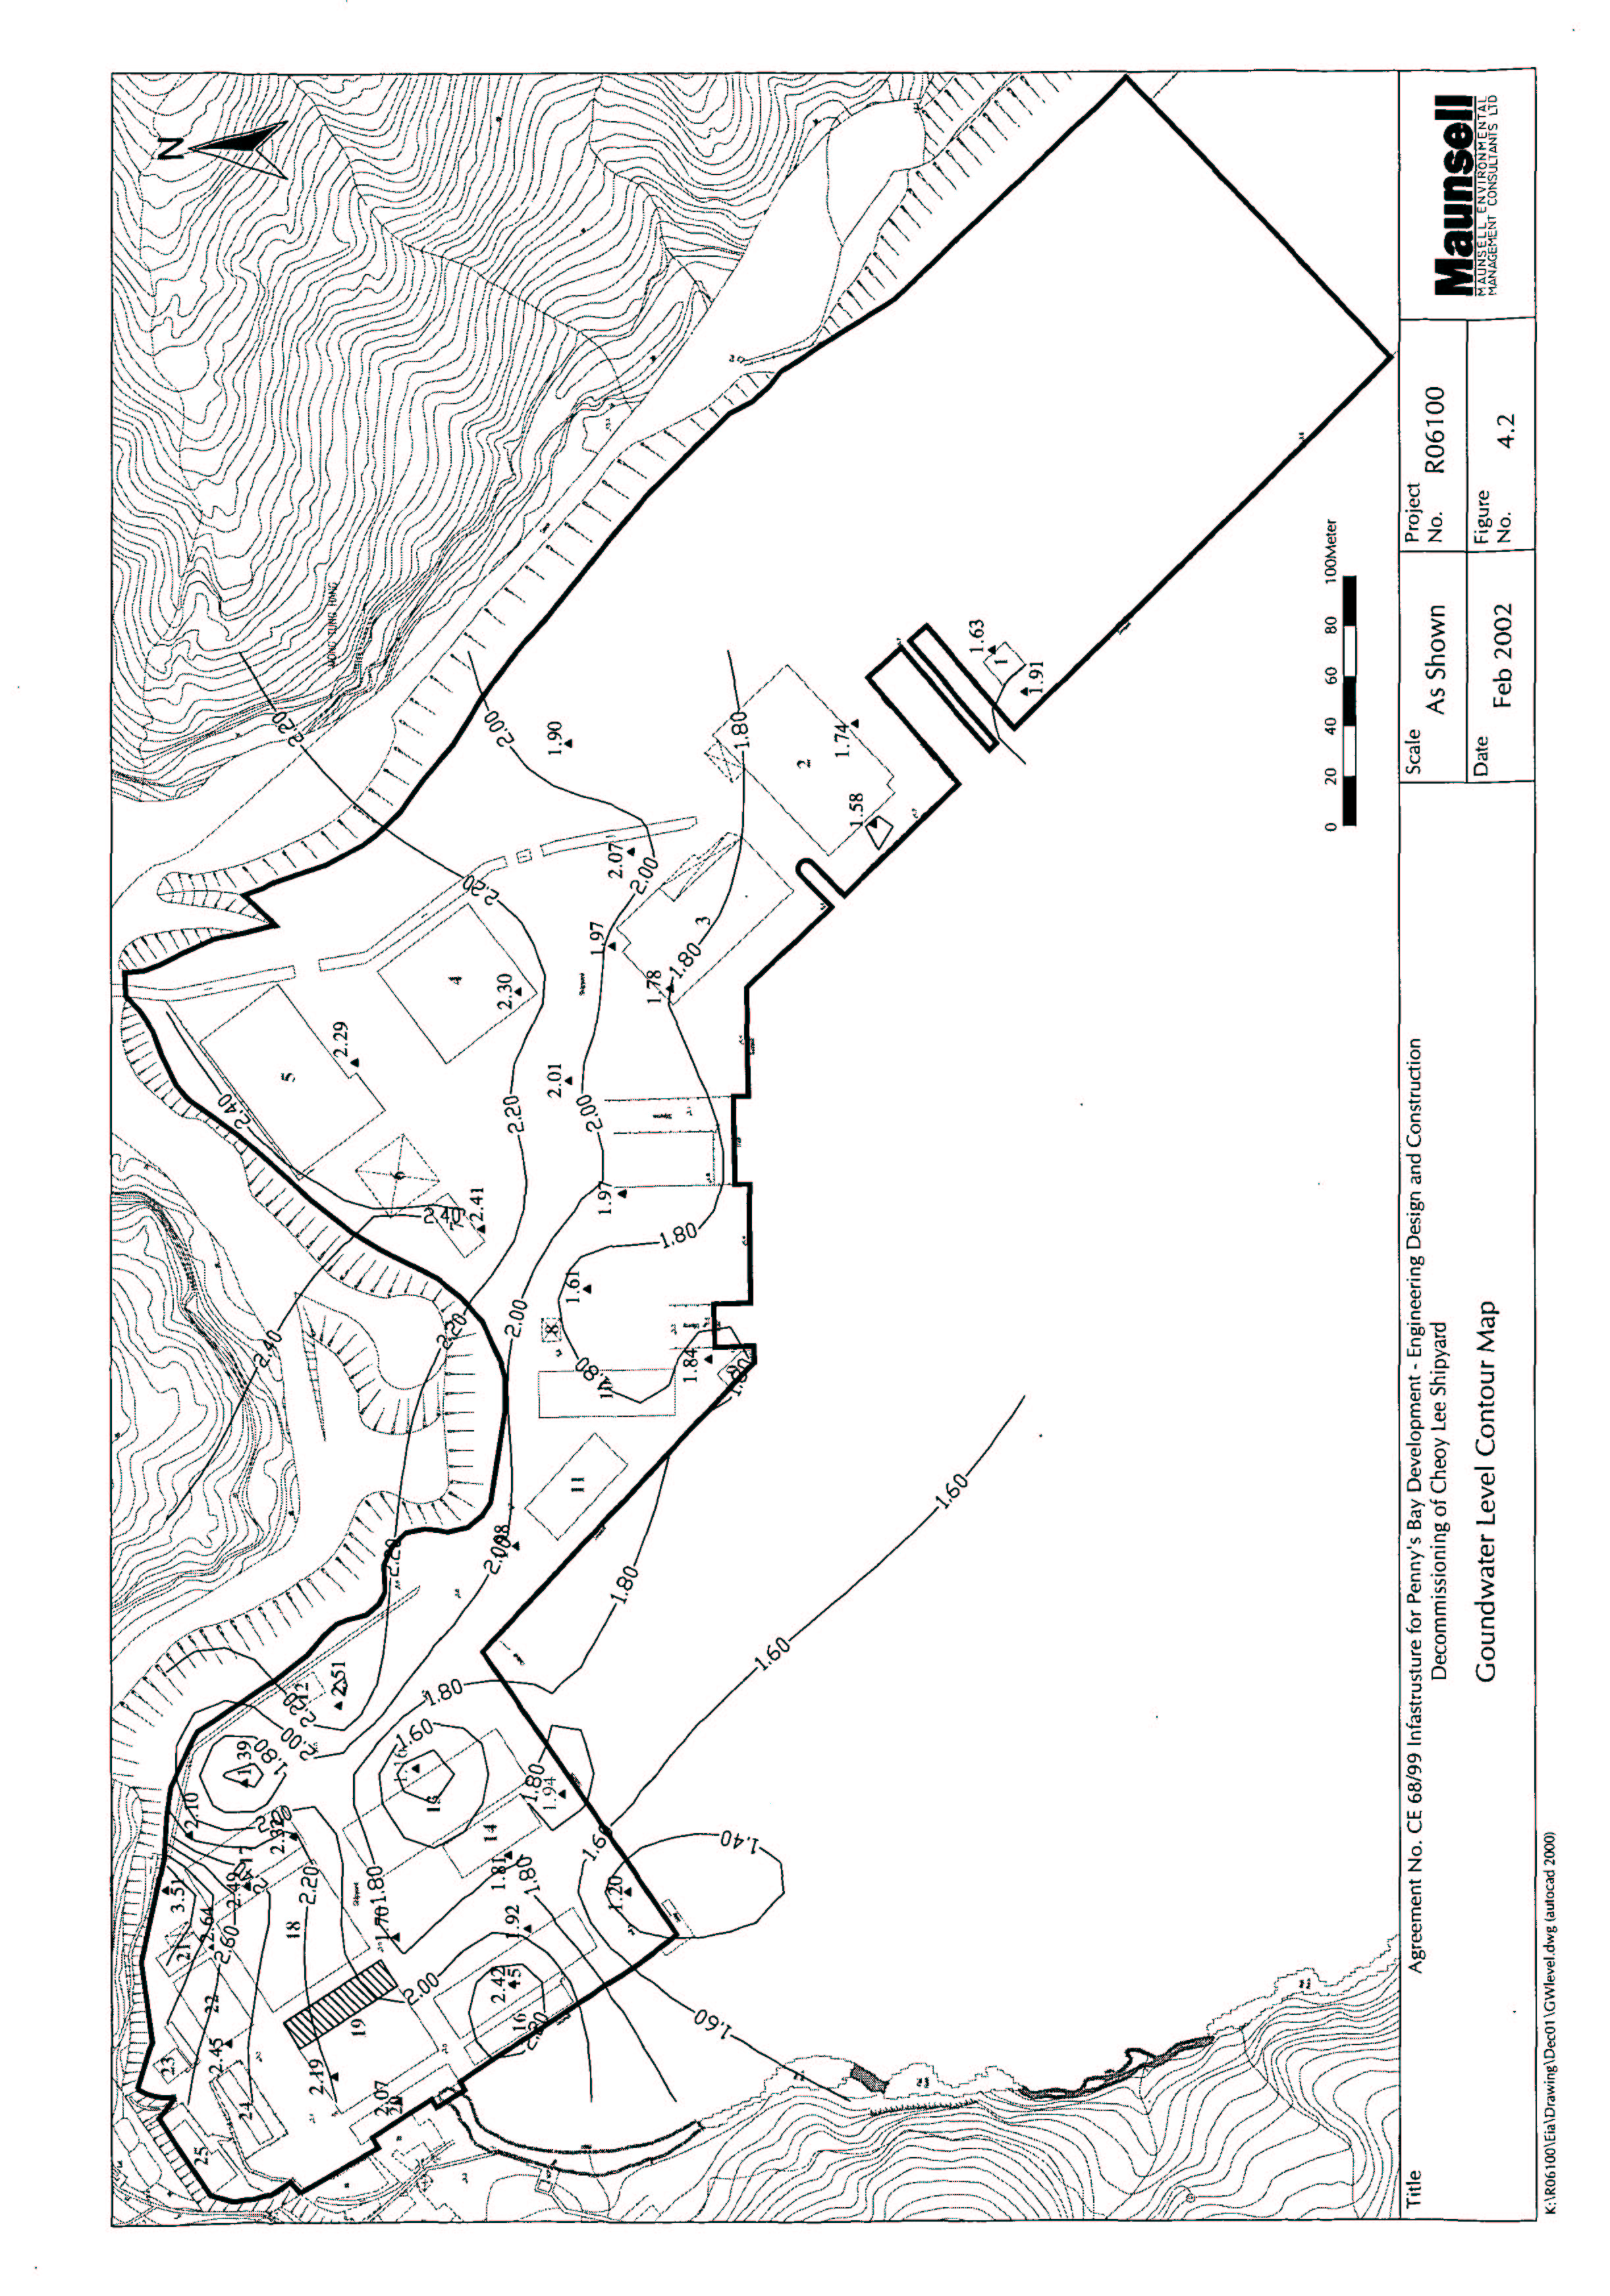
Figure 4.2 Groundwater Level Contour Map
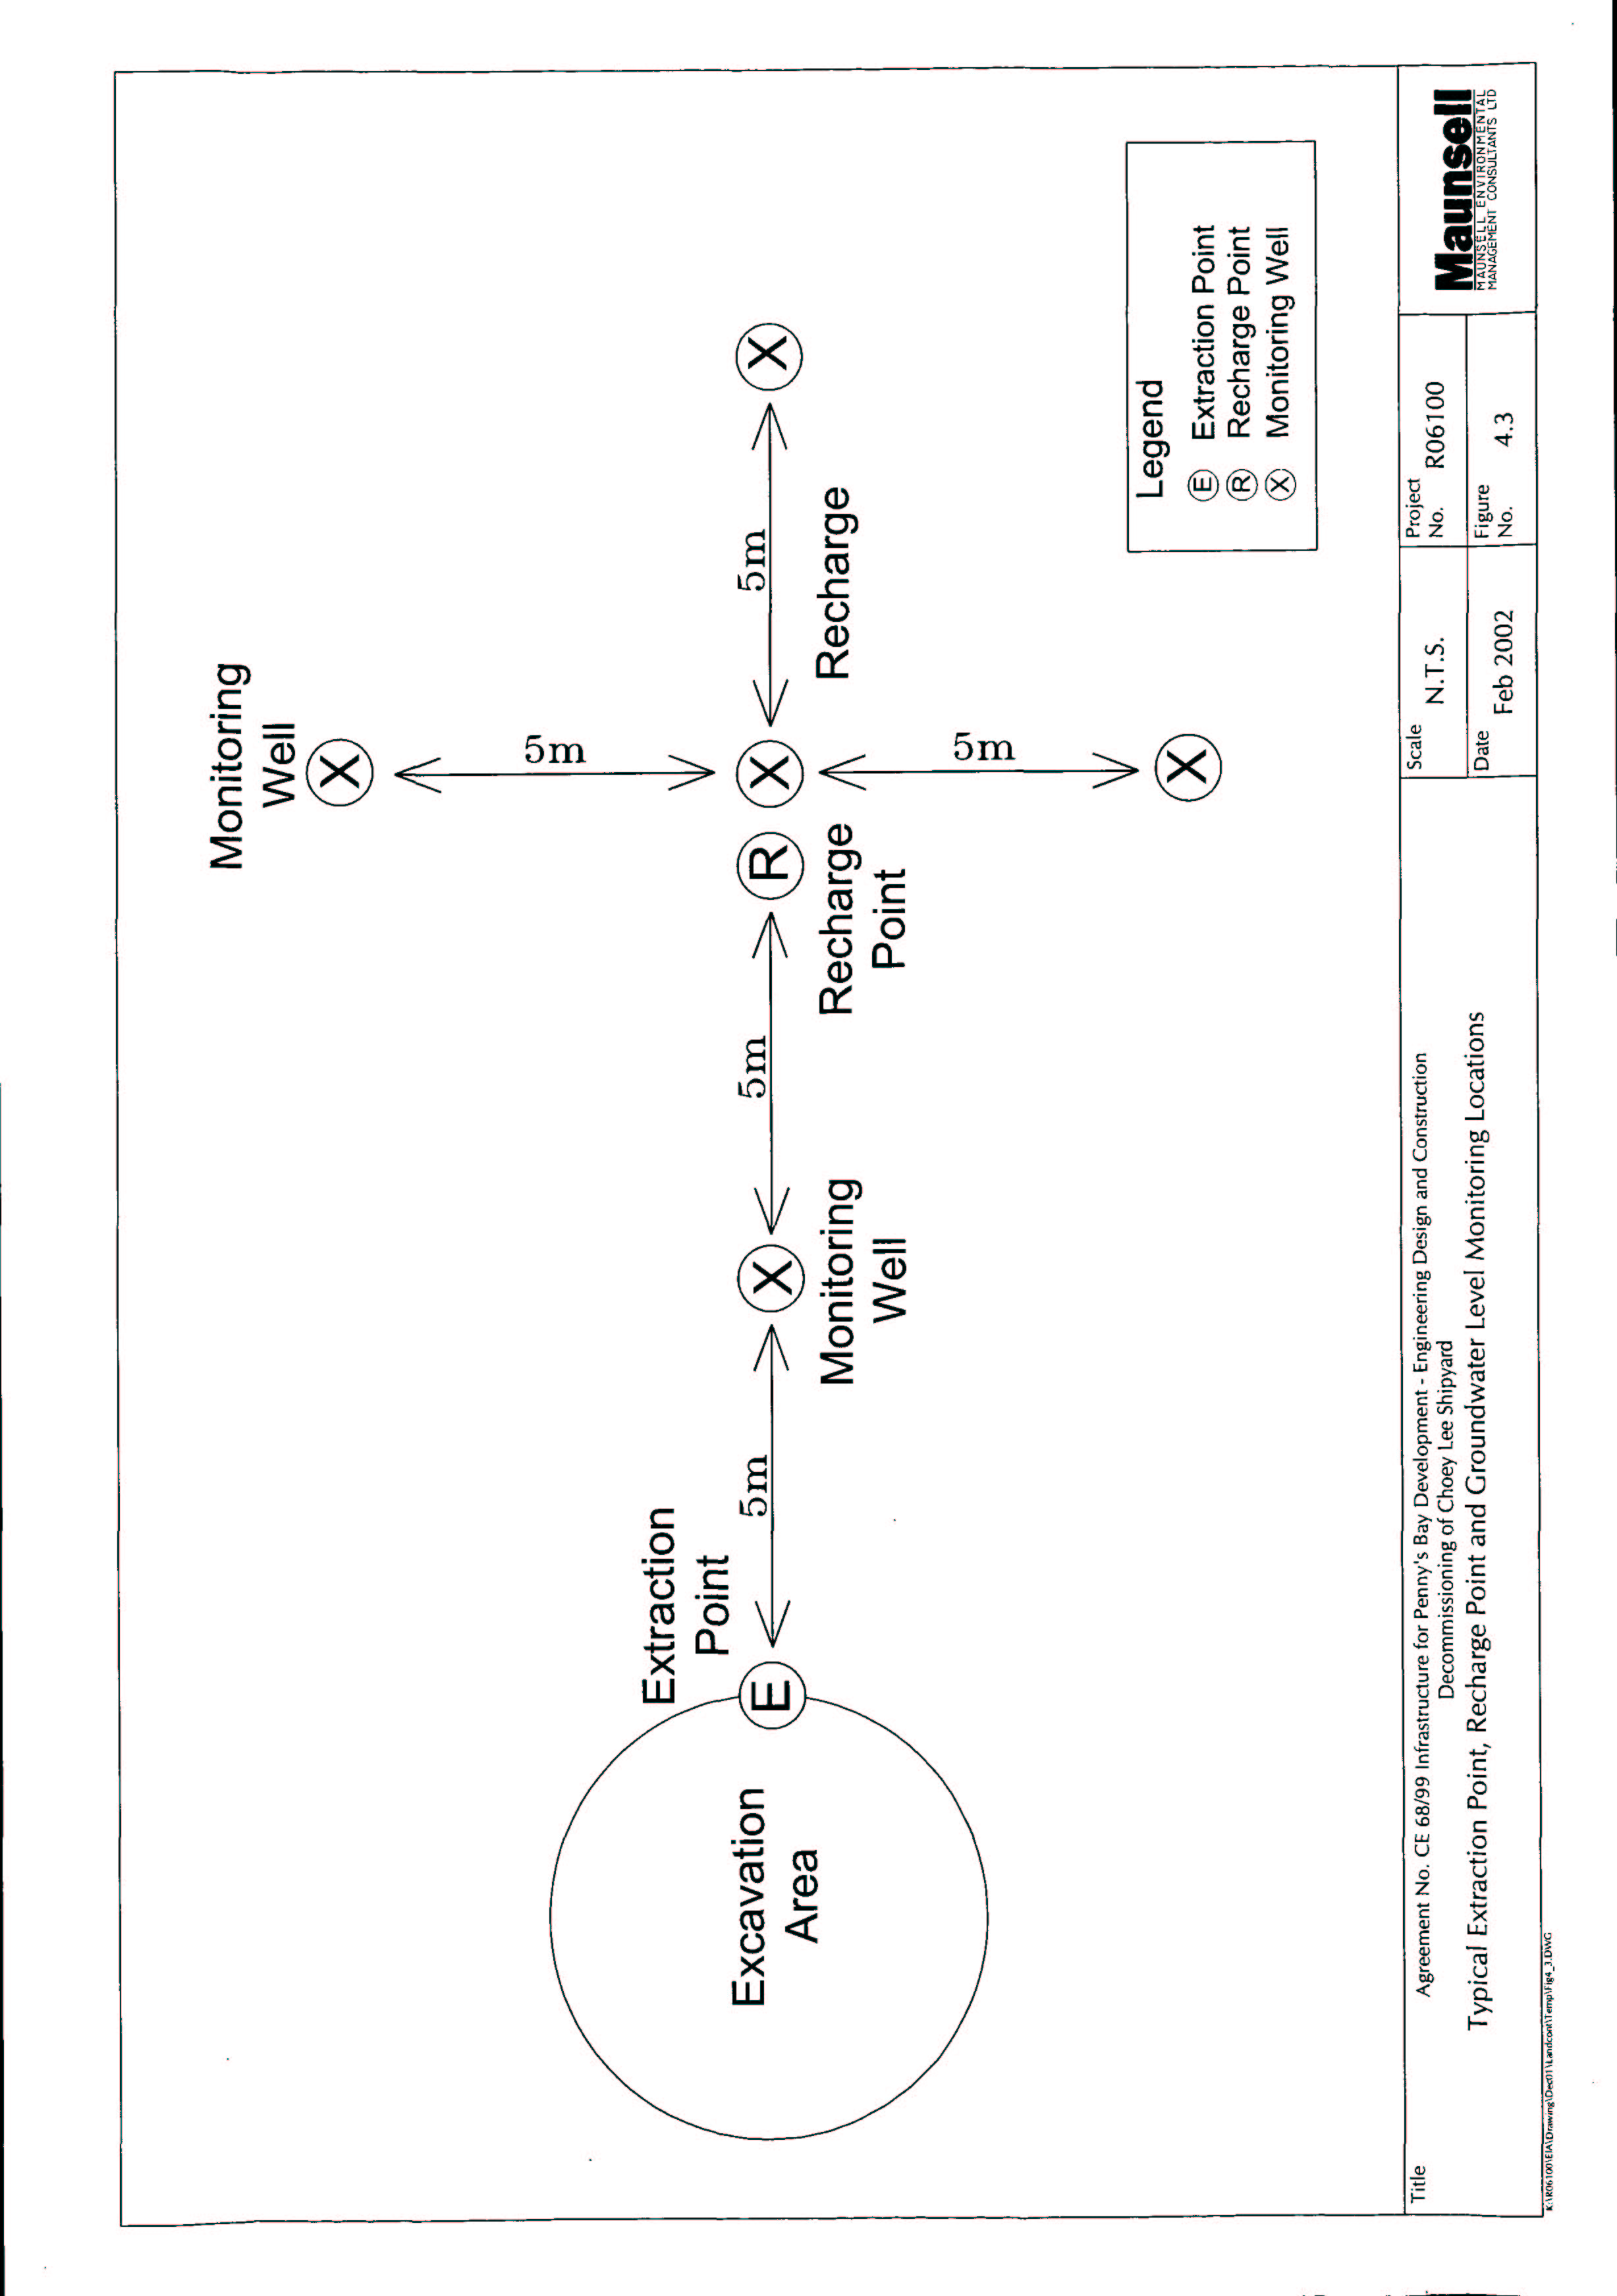
Figure 4.3 Typical Extraction Point, Recharge Point and Groundwater Level Monitoring Locations
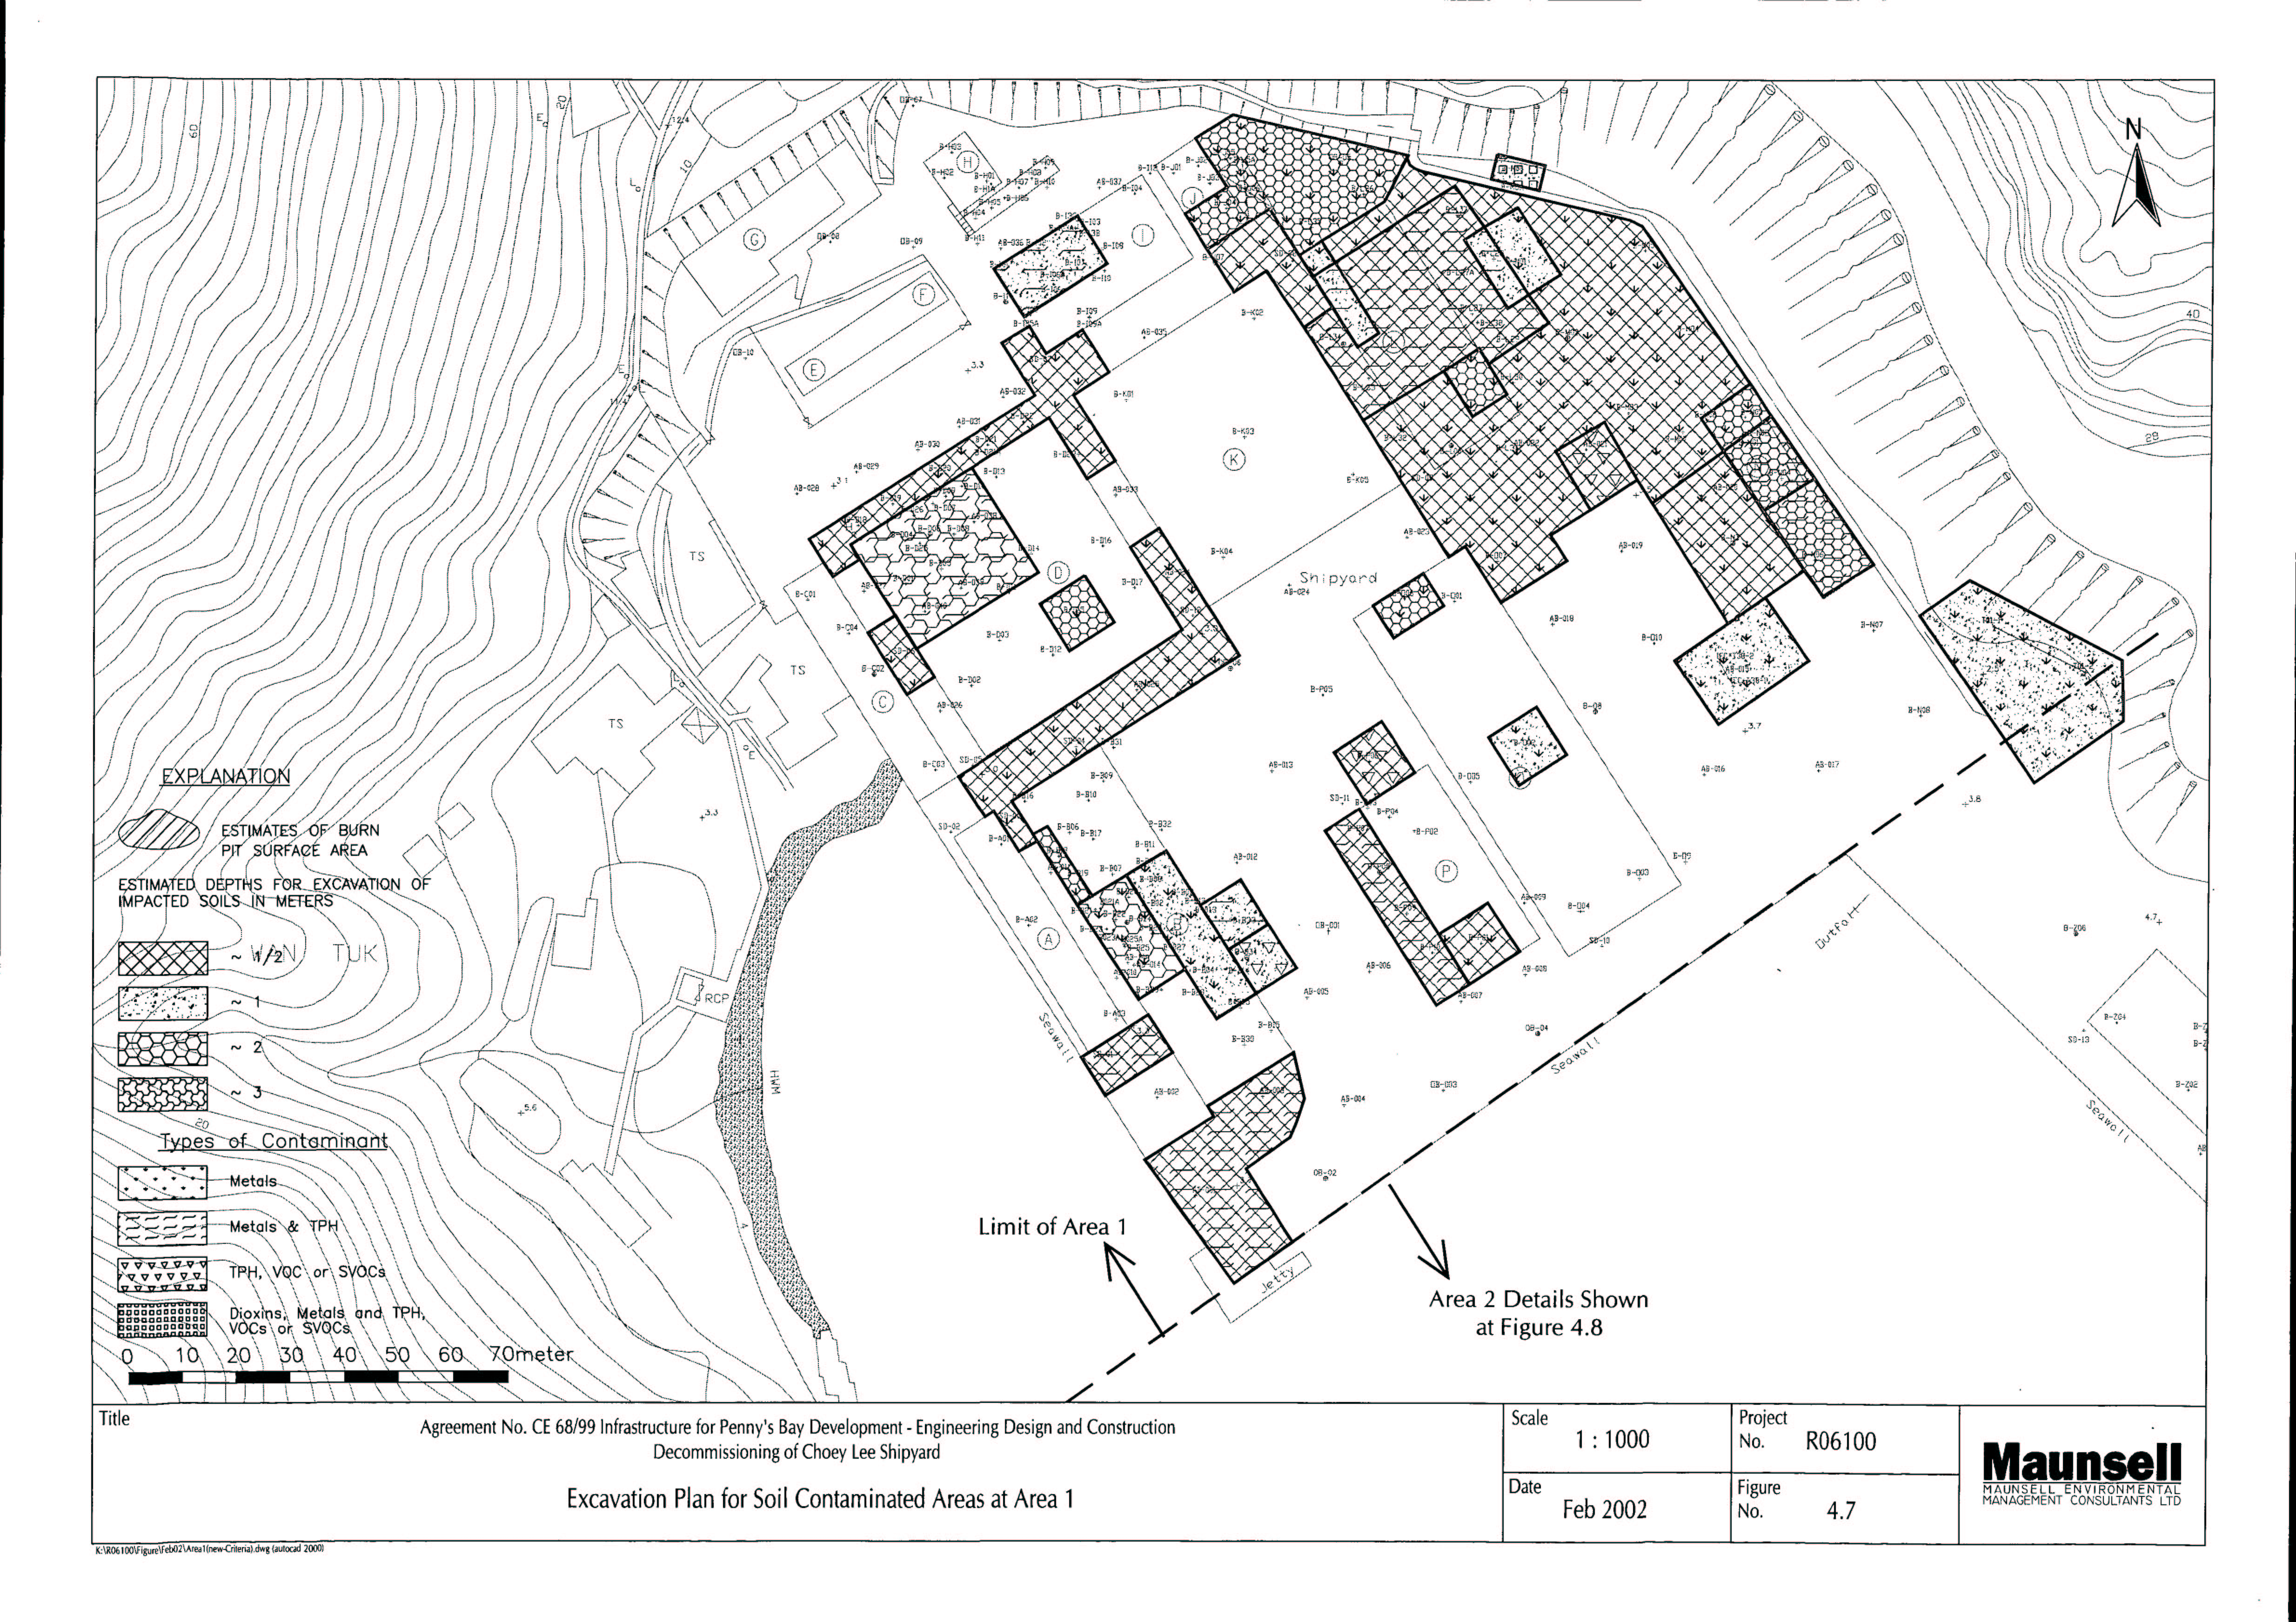
Figure 4.7 Excavation Plan for Soil Contaminated Areas at Area 1
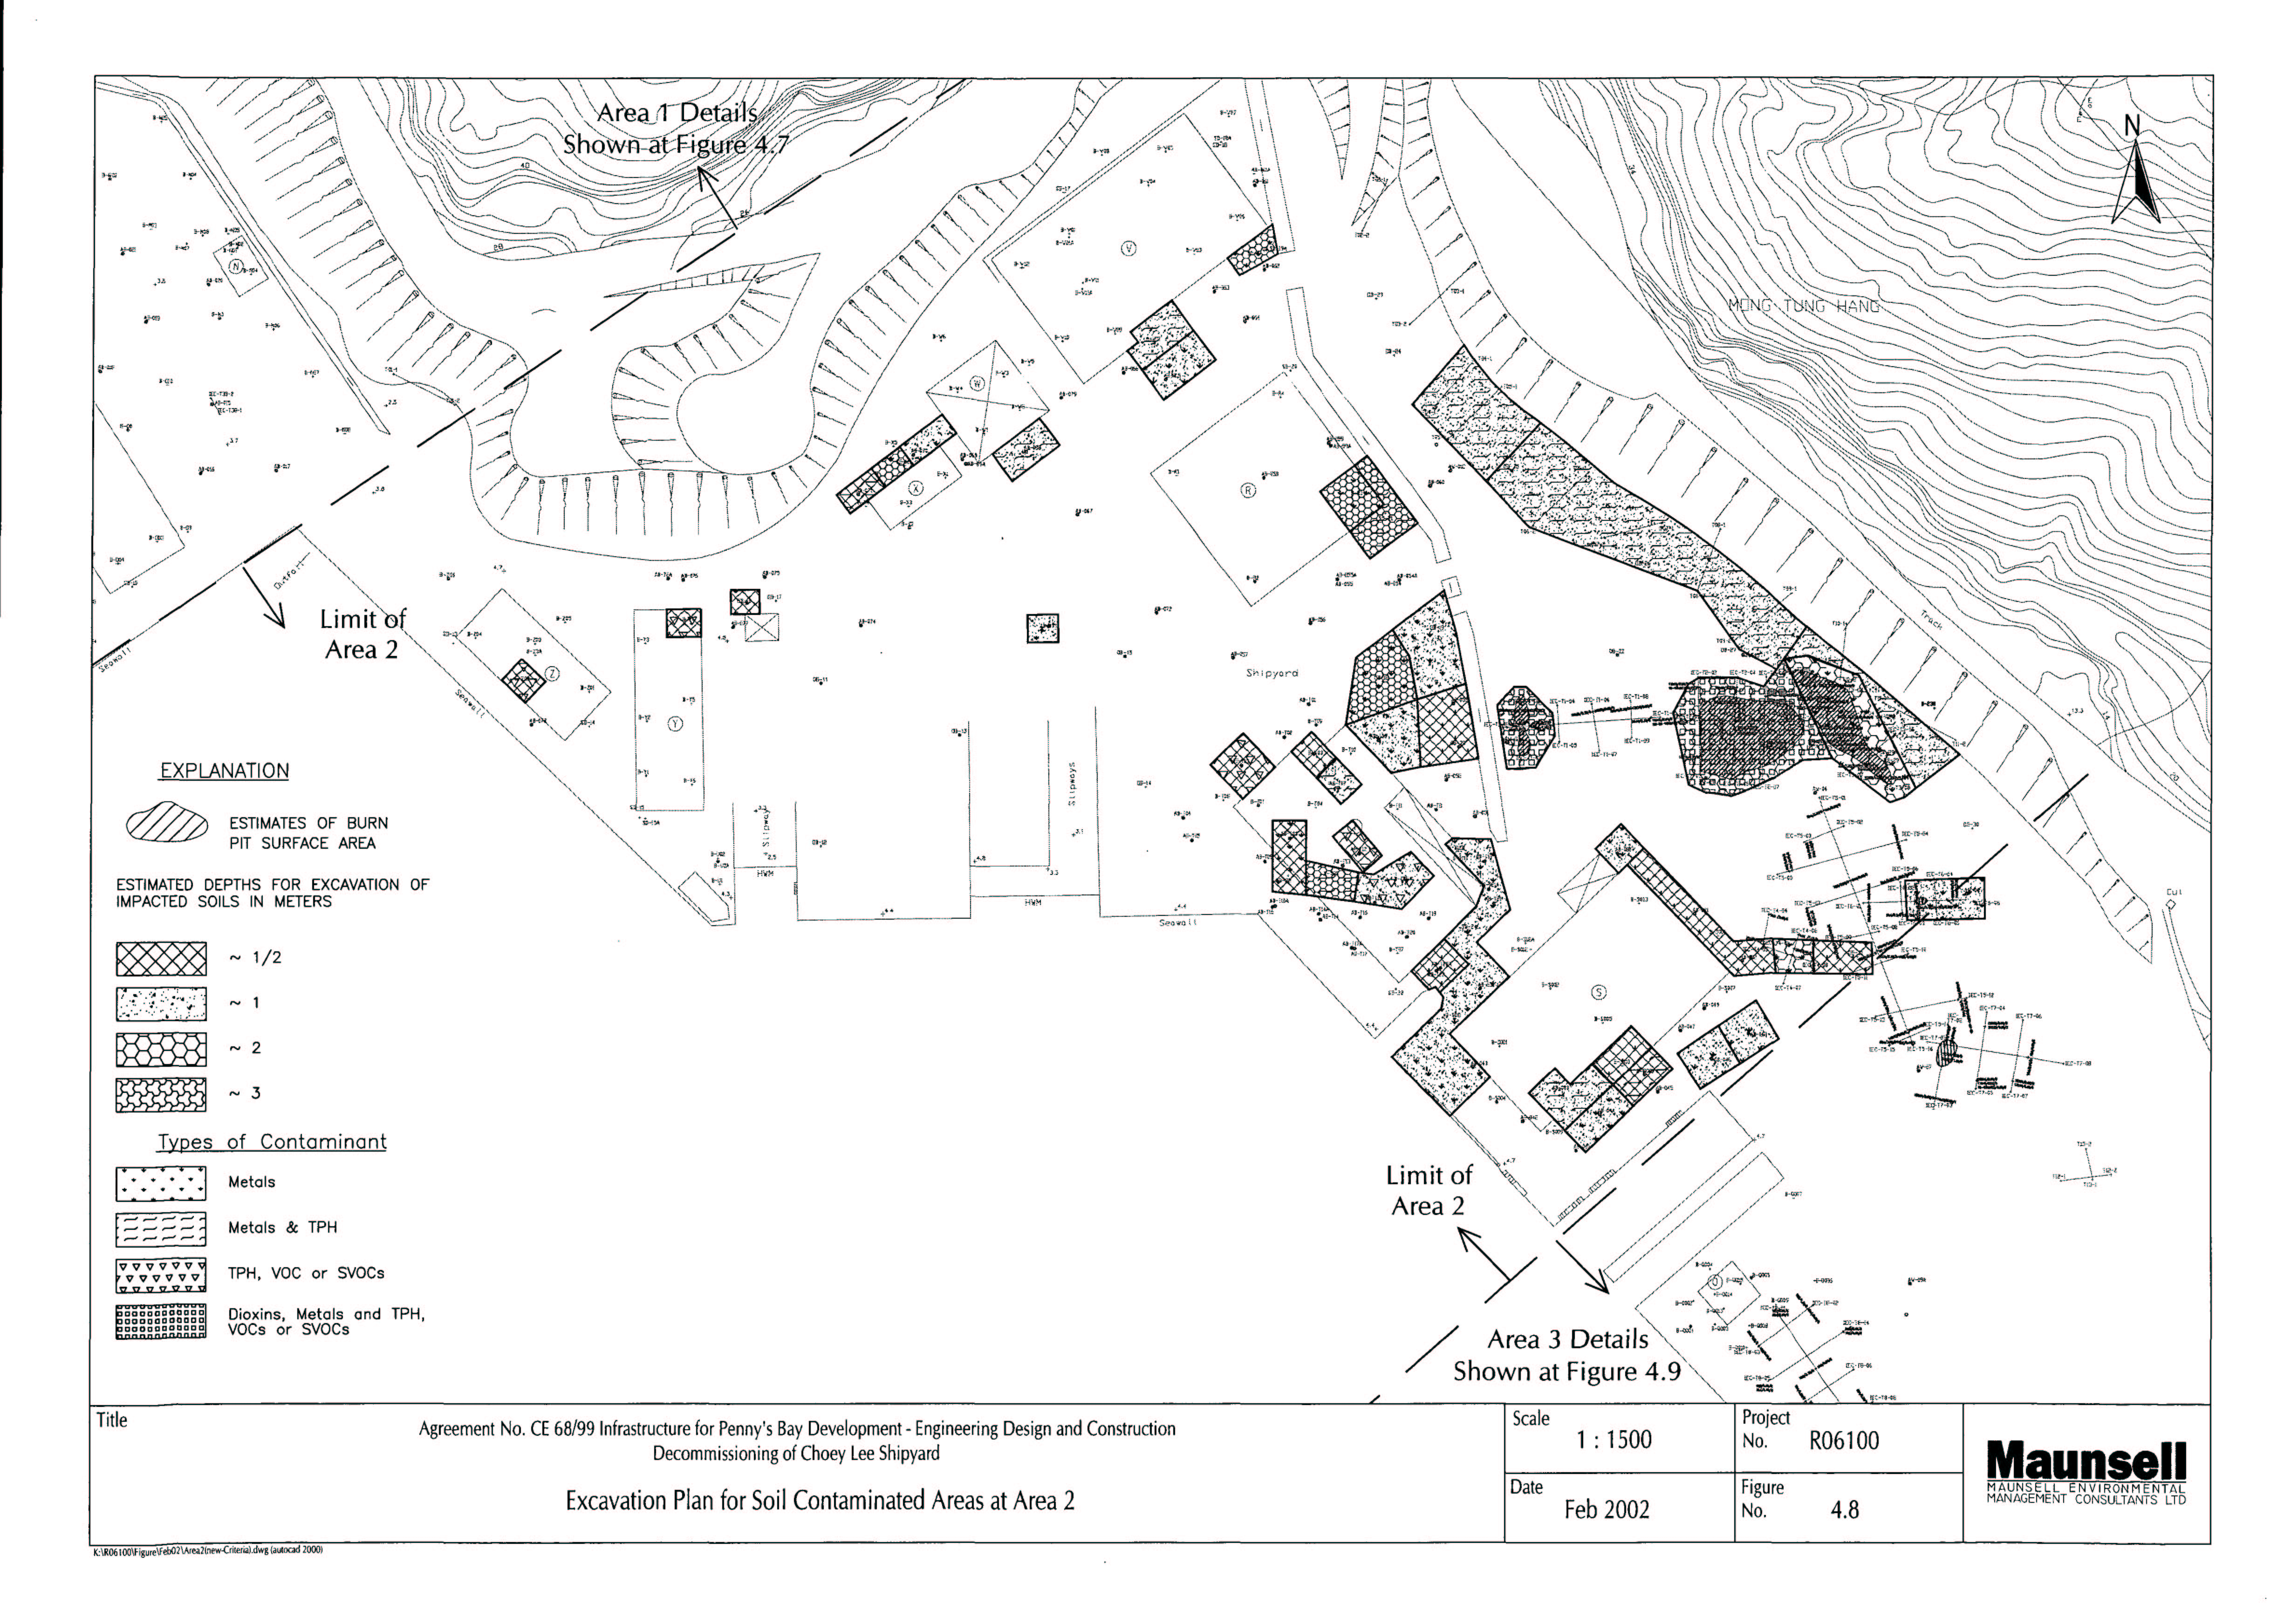
Figure 4.8 Excavation Plan for Soil Contaminated Areas at Area 2
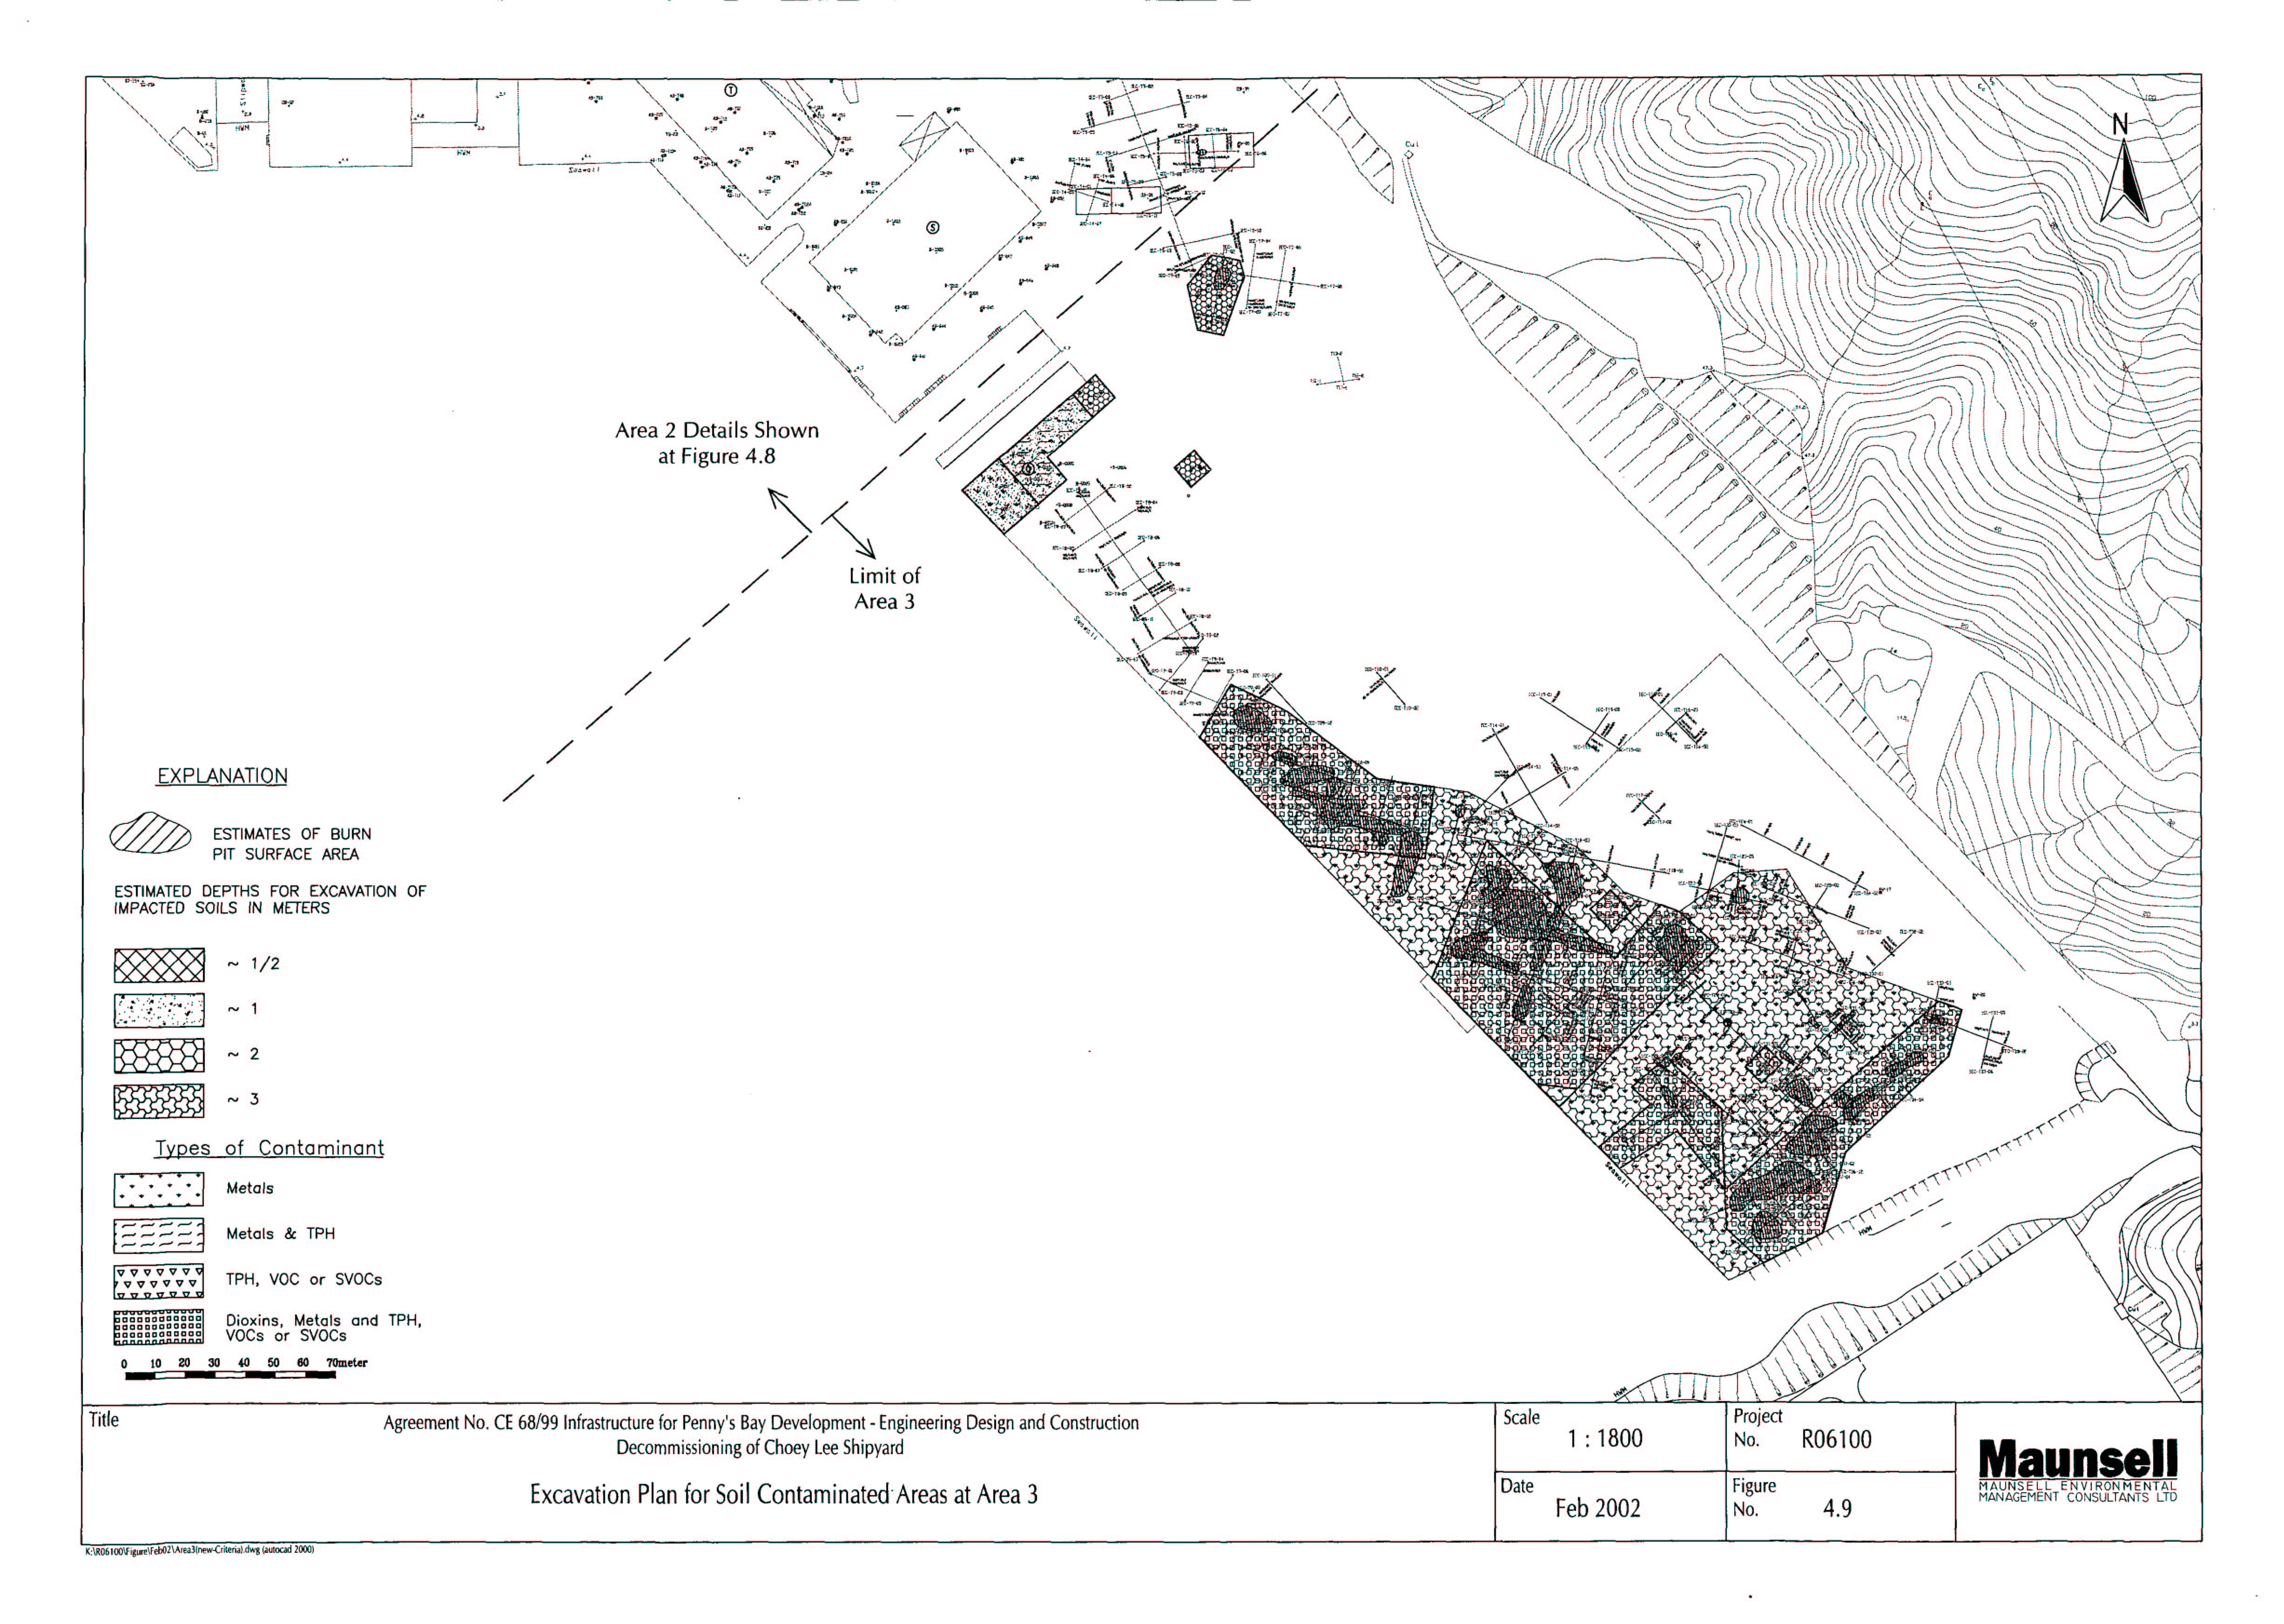
Figure 4.9 Excavation Plan for Soil Contaminated Areas at Area 3
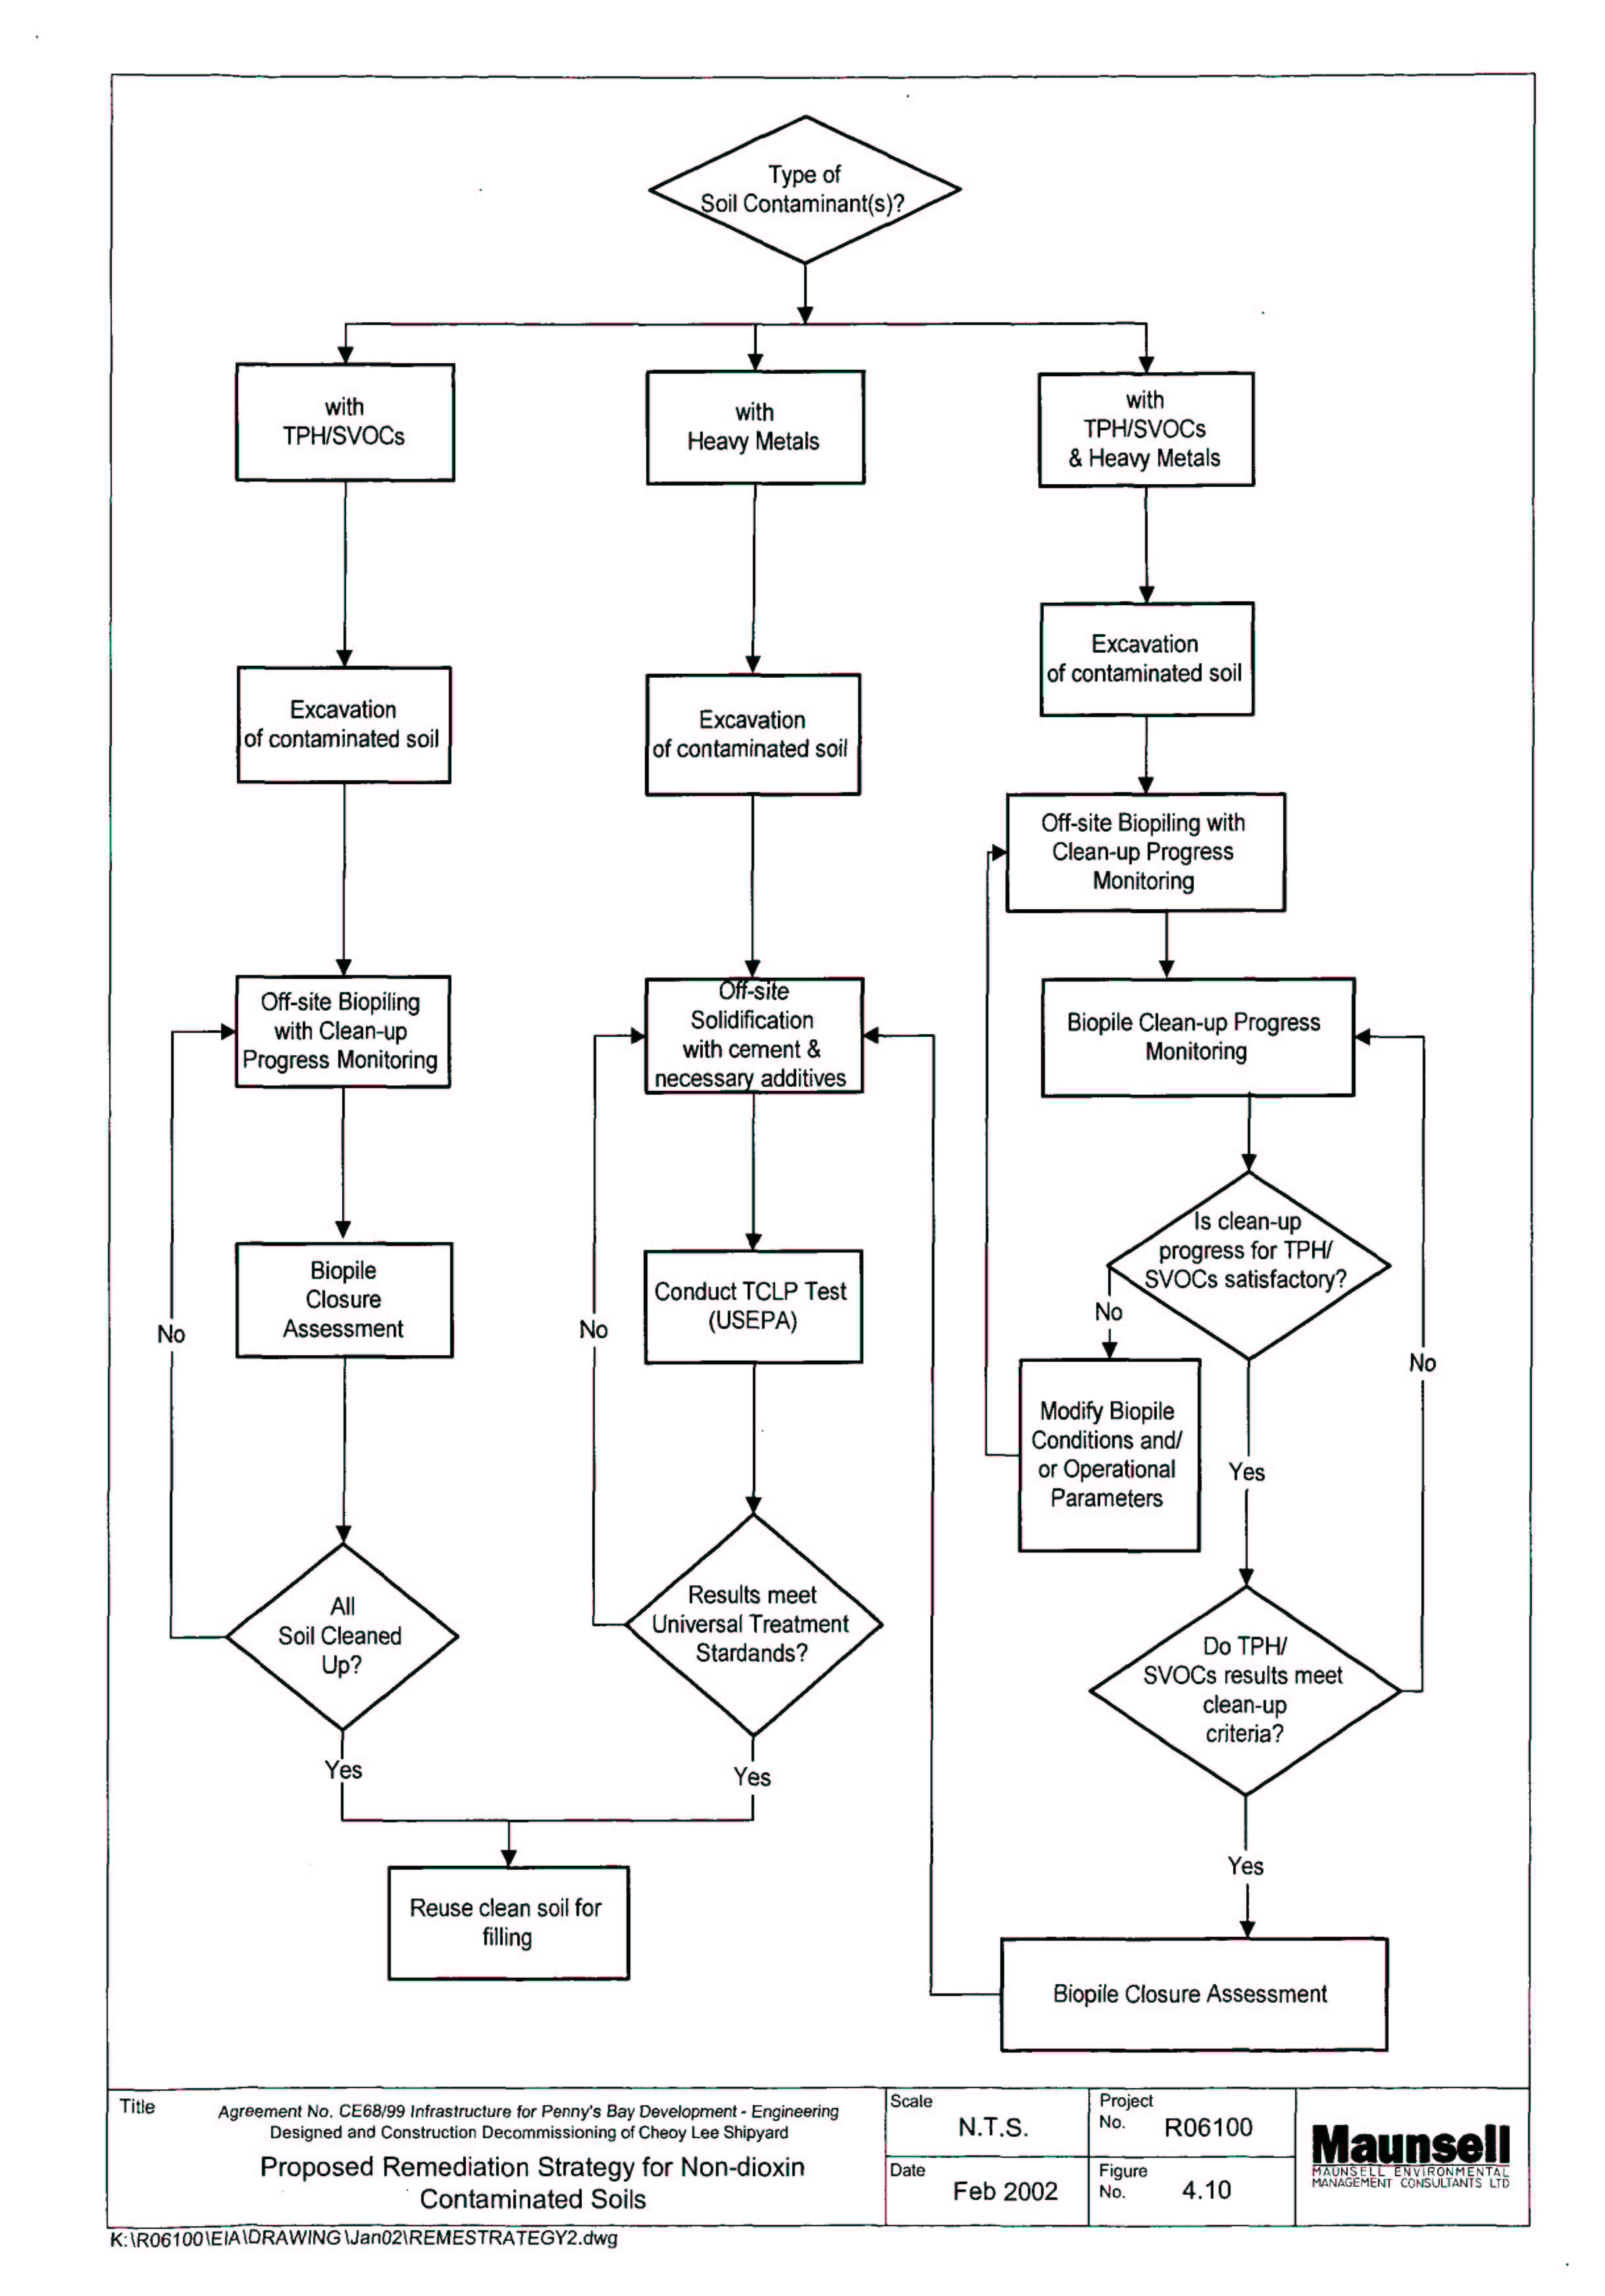
Figure 4.10 Proposed Remediation Strategy for Non-Dioxin Contaminated Soils
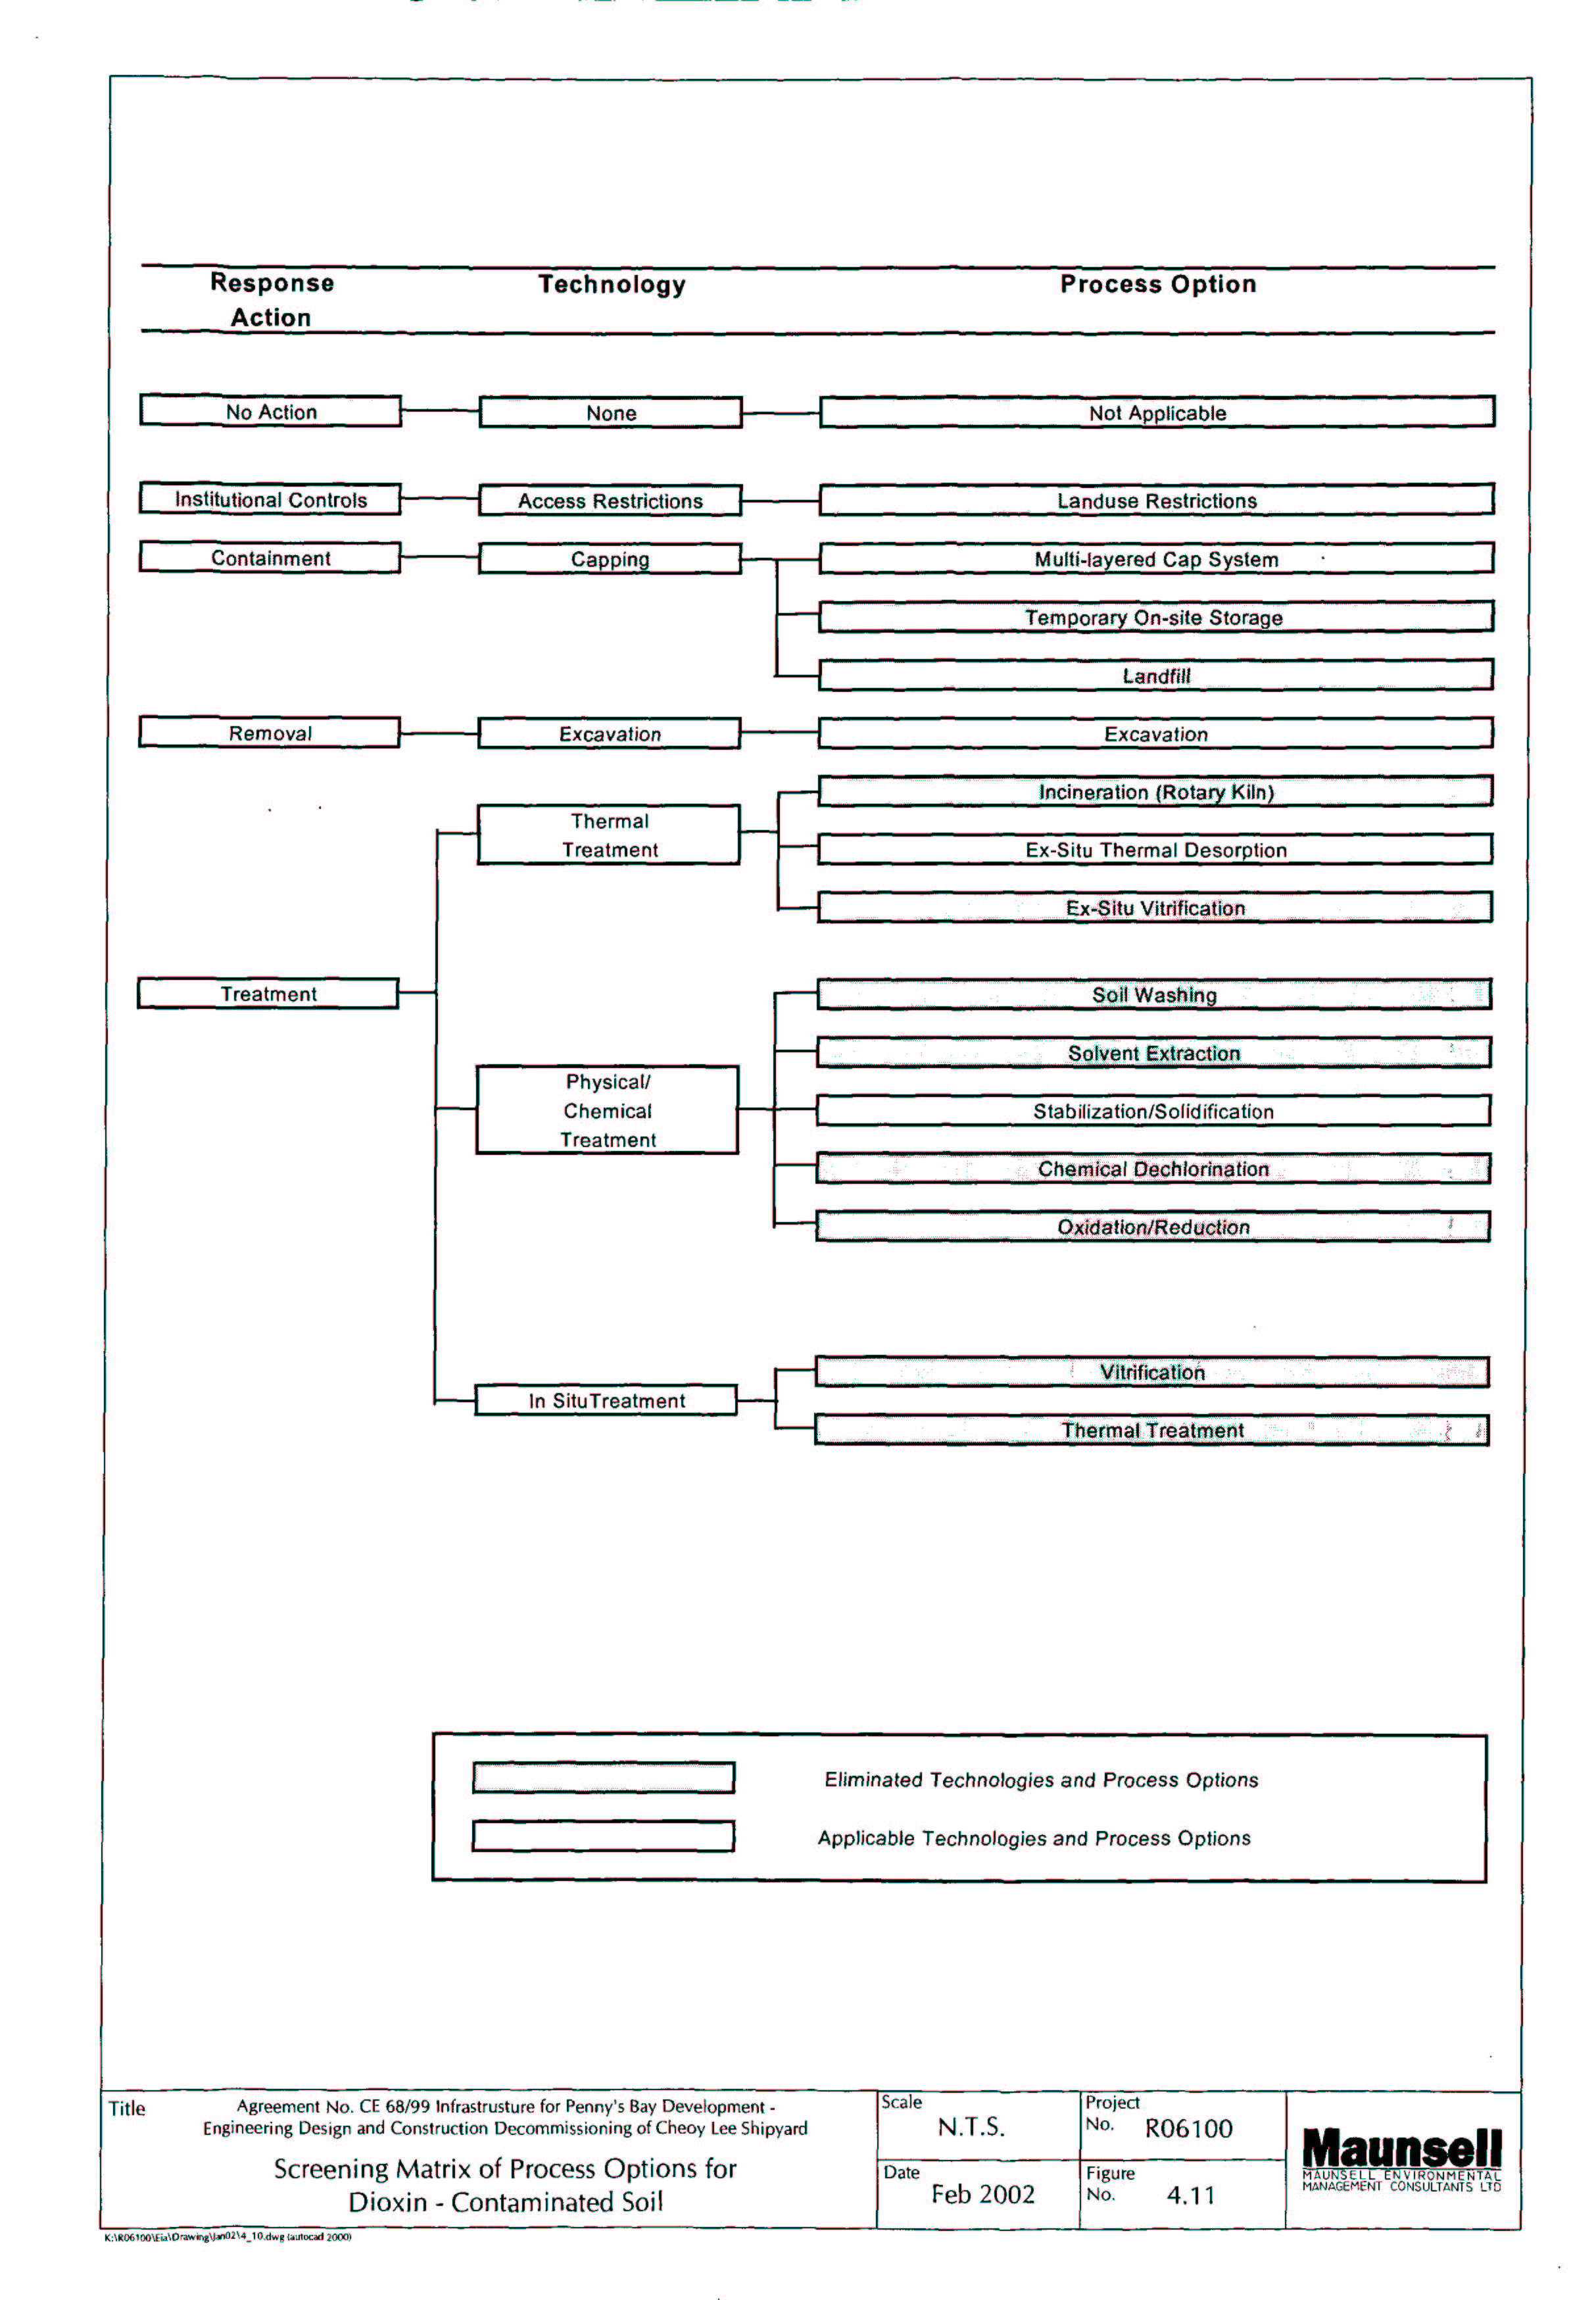
Figure 4.11 Screening Matrix of Process Options for Dioxin Contaminated Soil
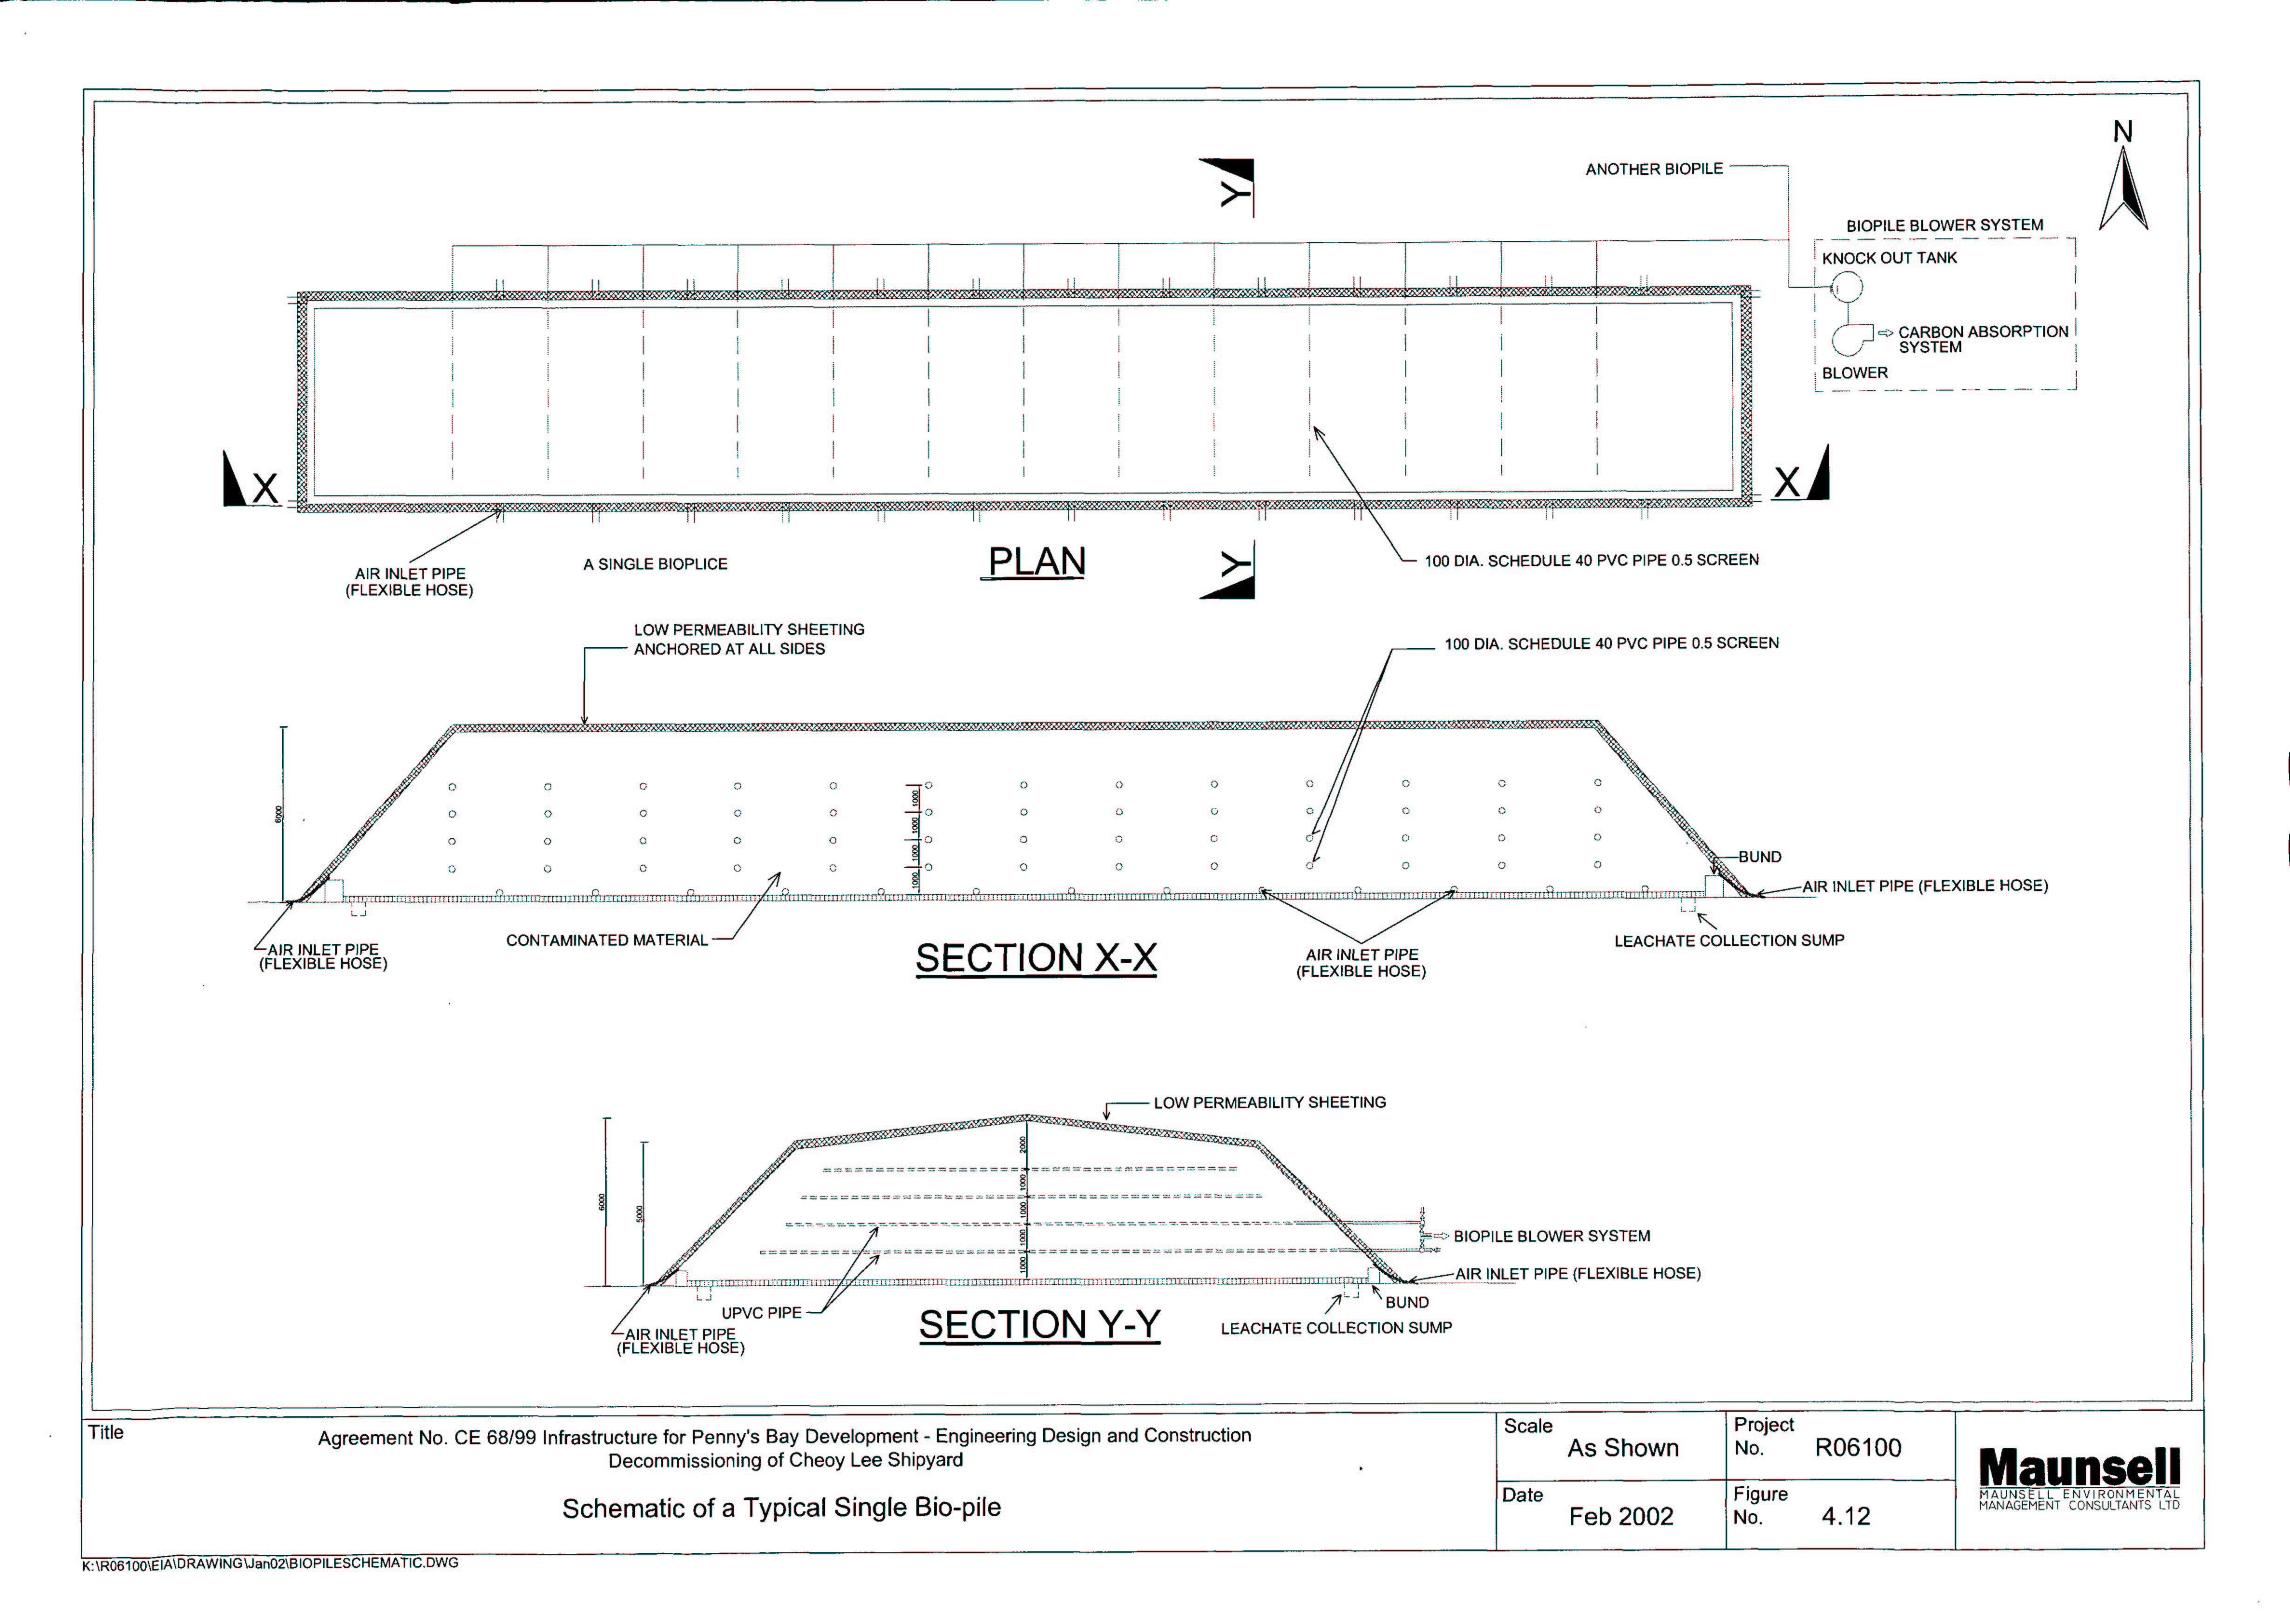
Figure 4.12 Schematic of a Typical Single Bio-pile
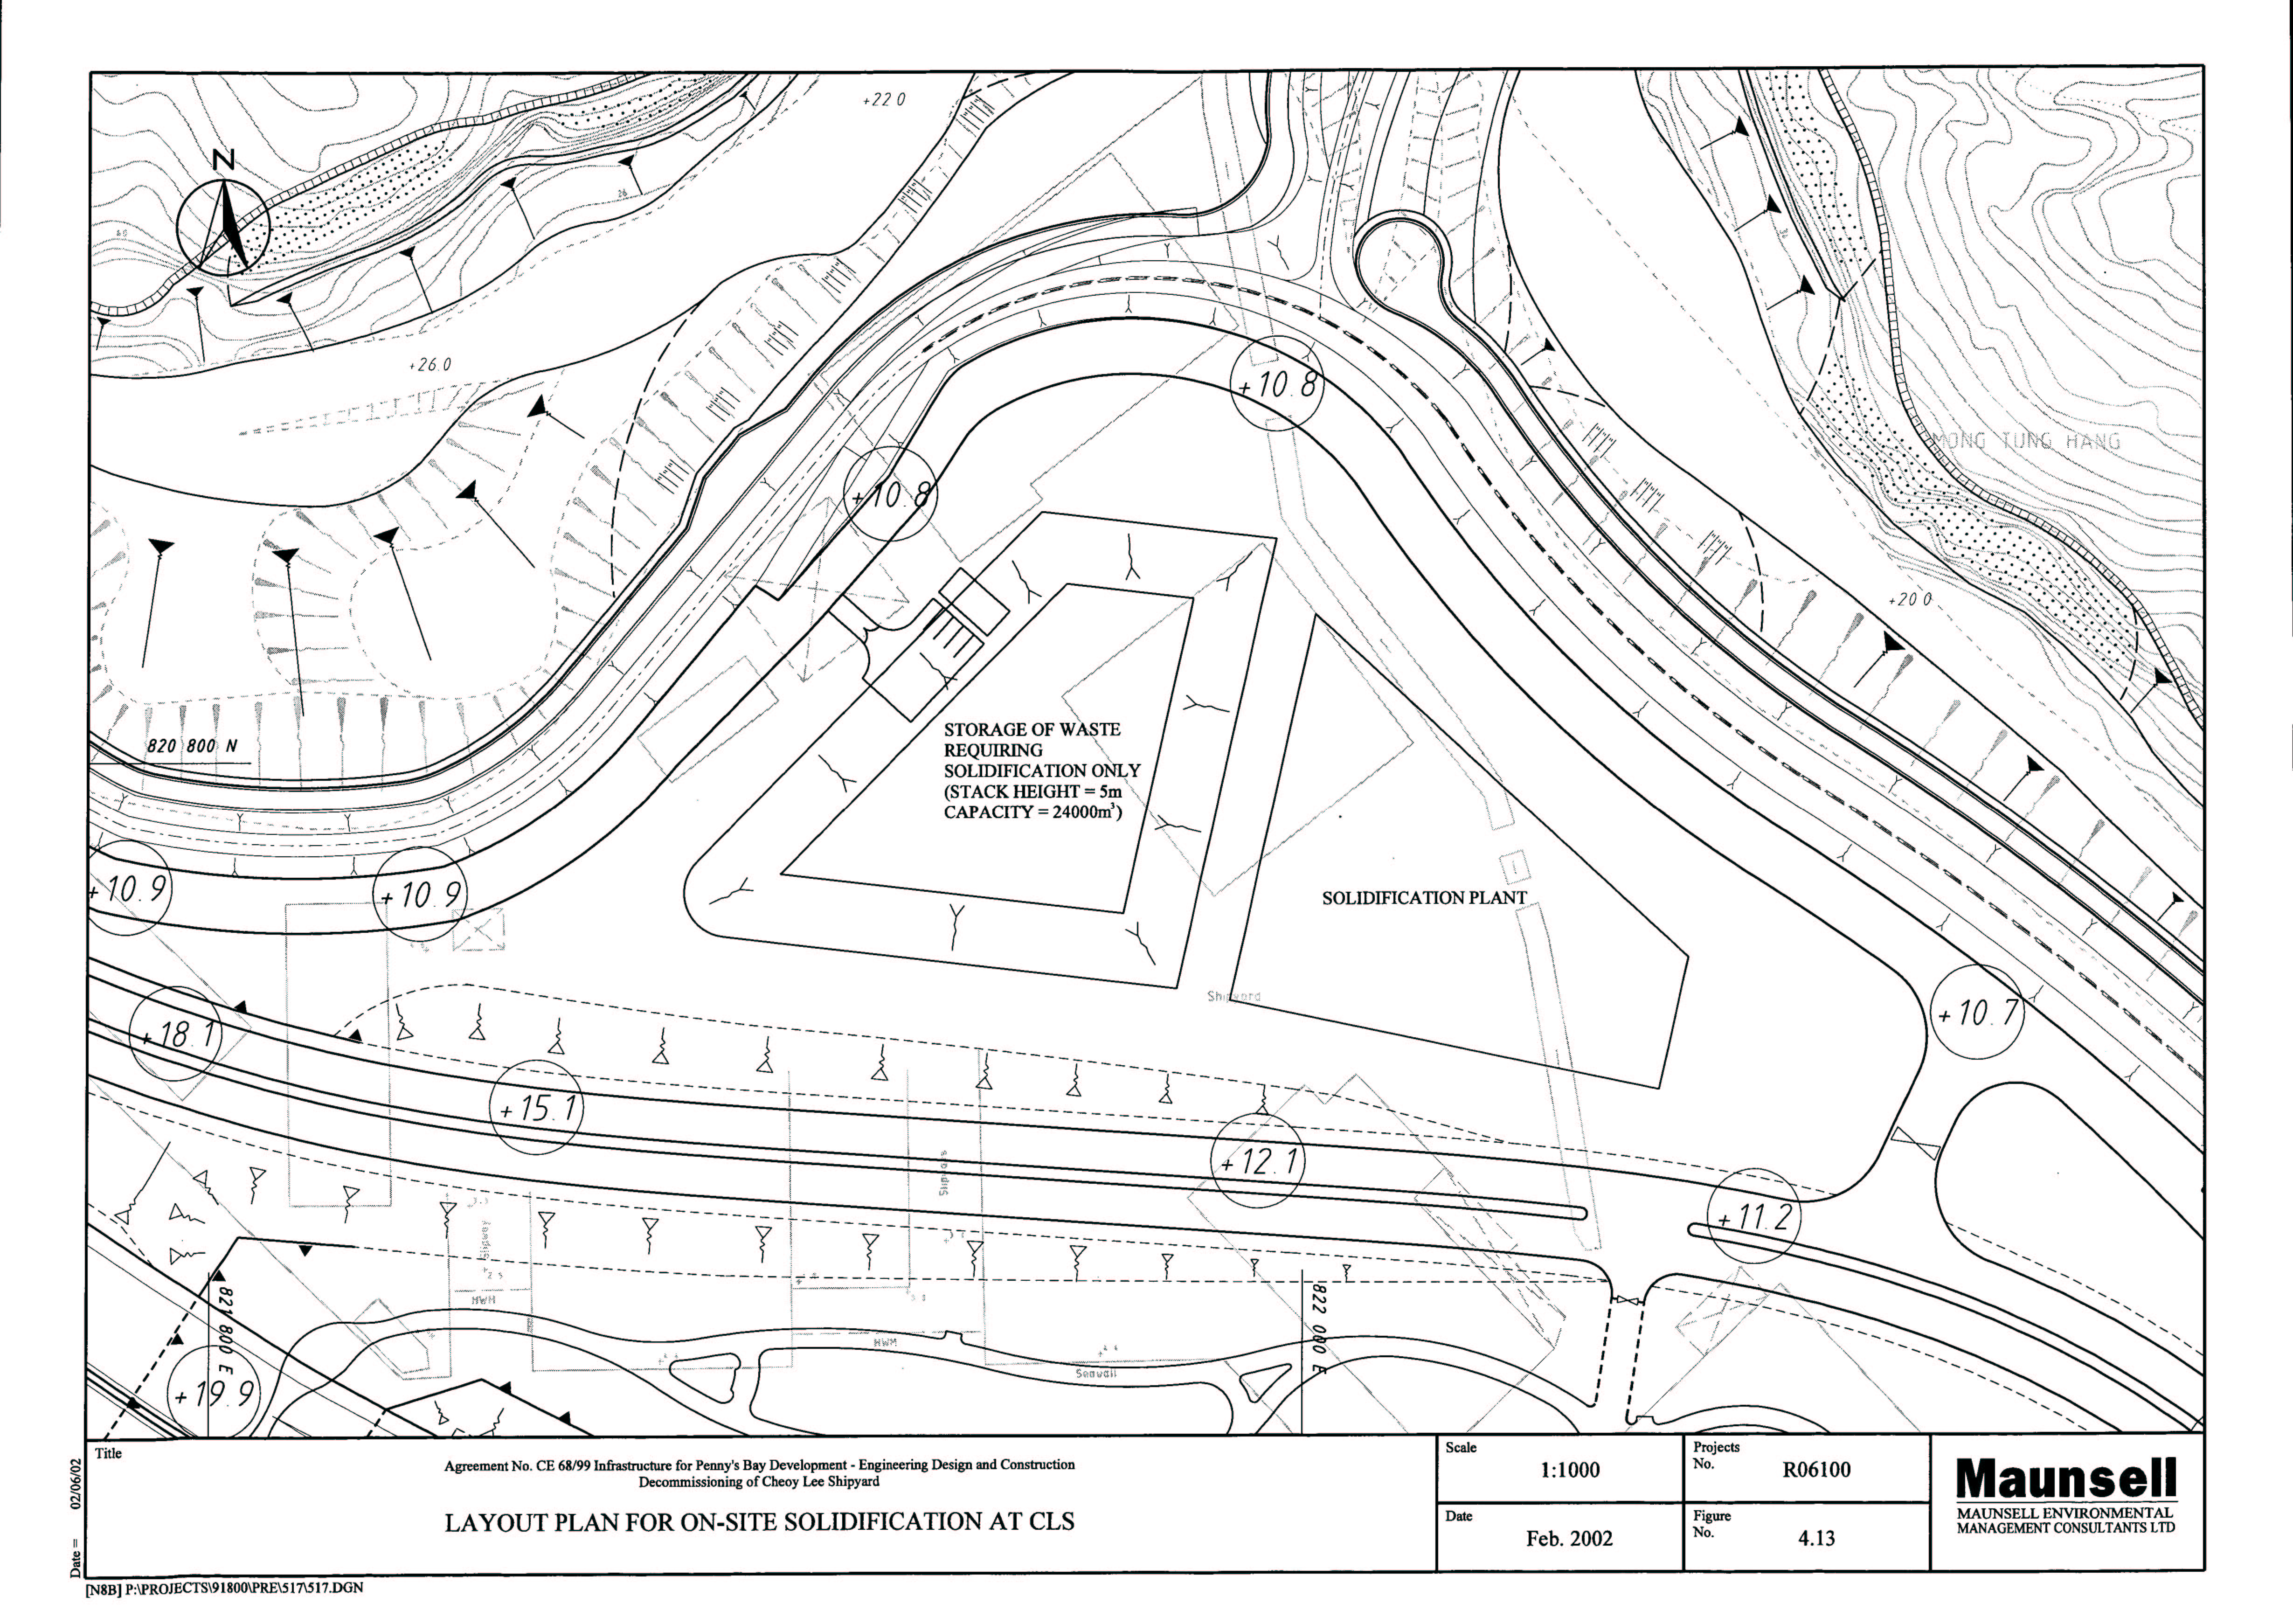
Figure 4.13 Layout Plan for On-site Solidification at CLS
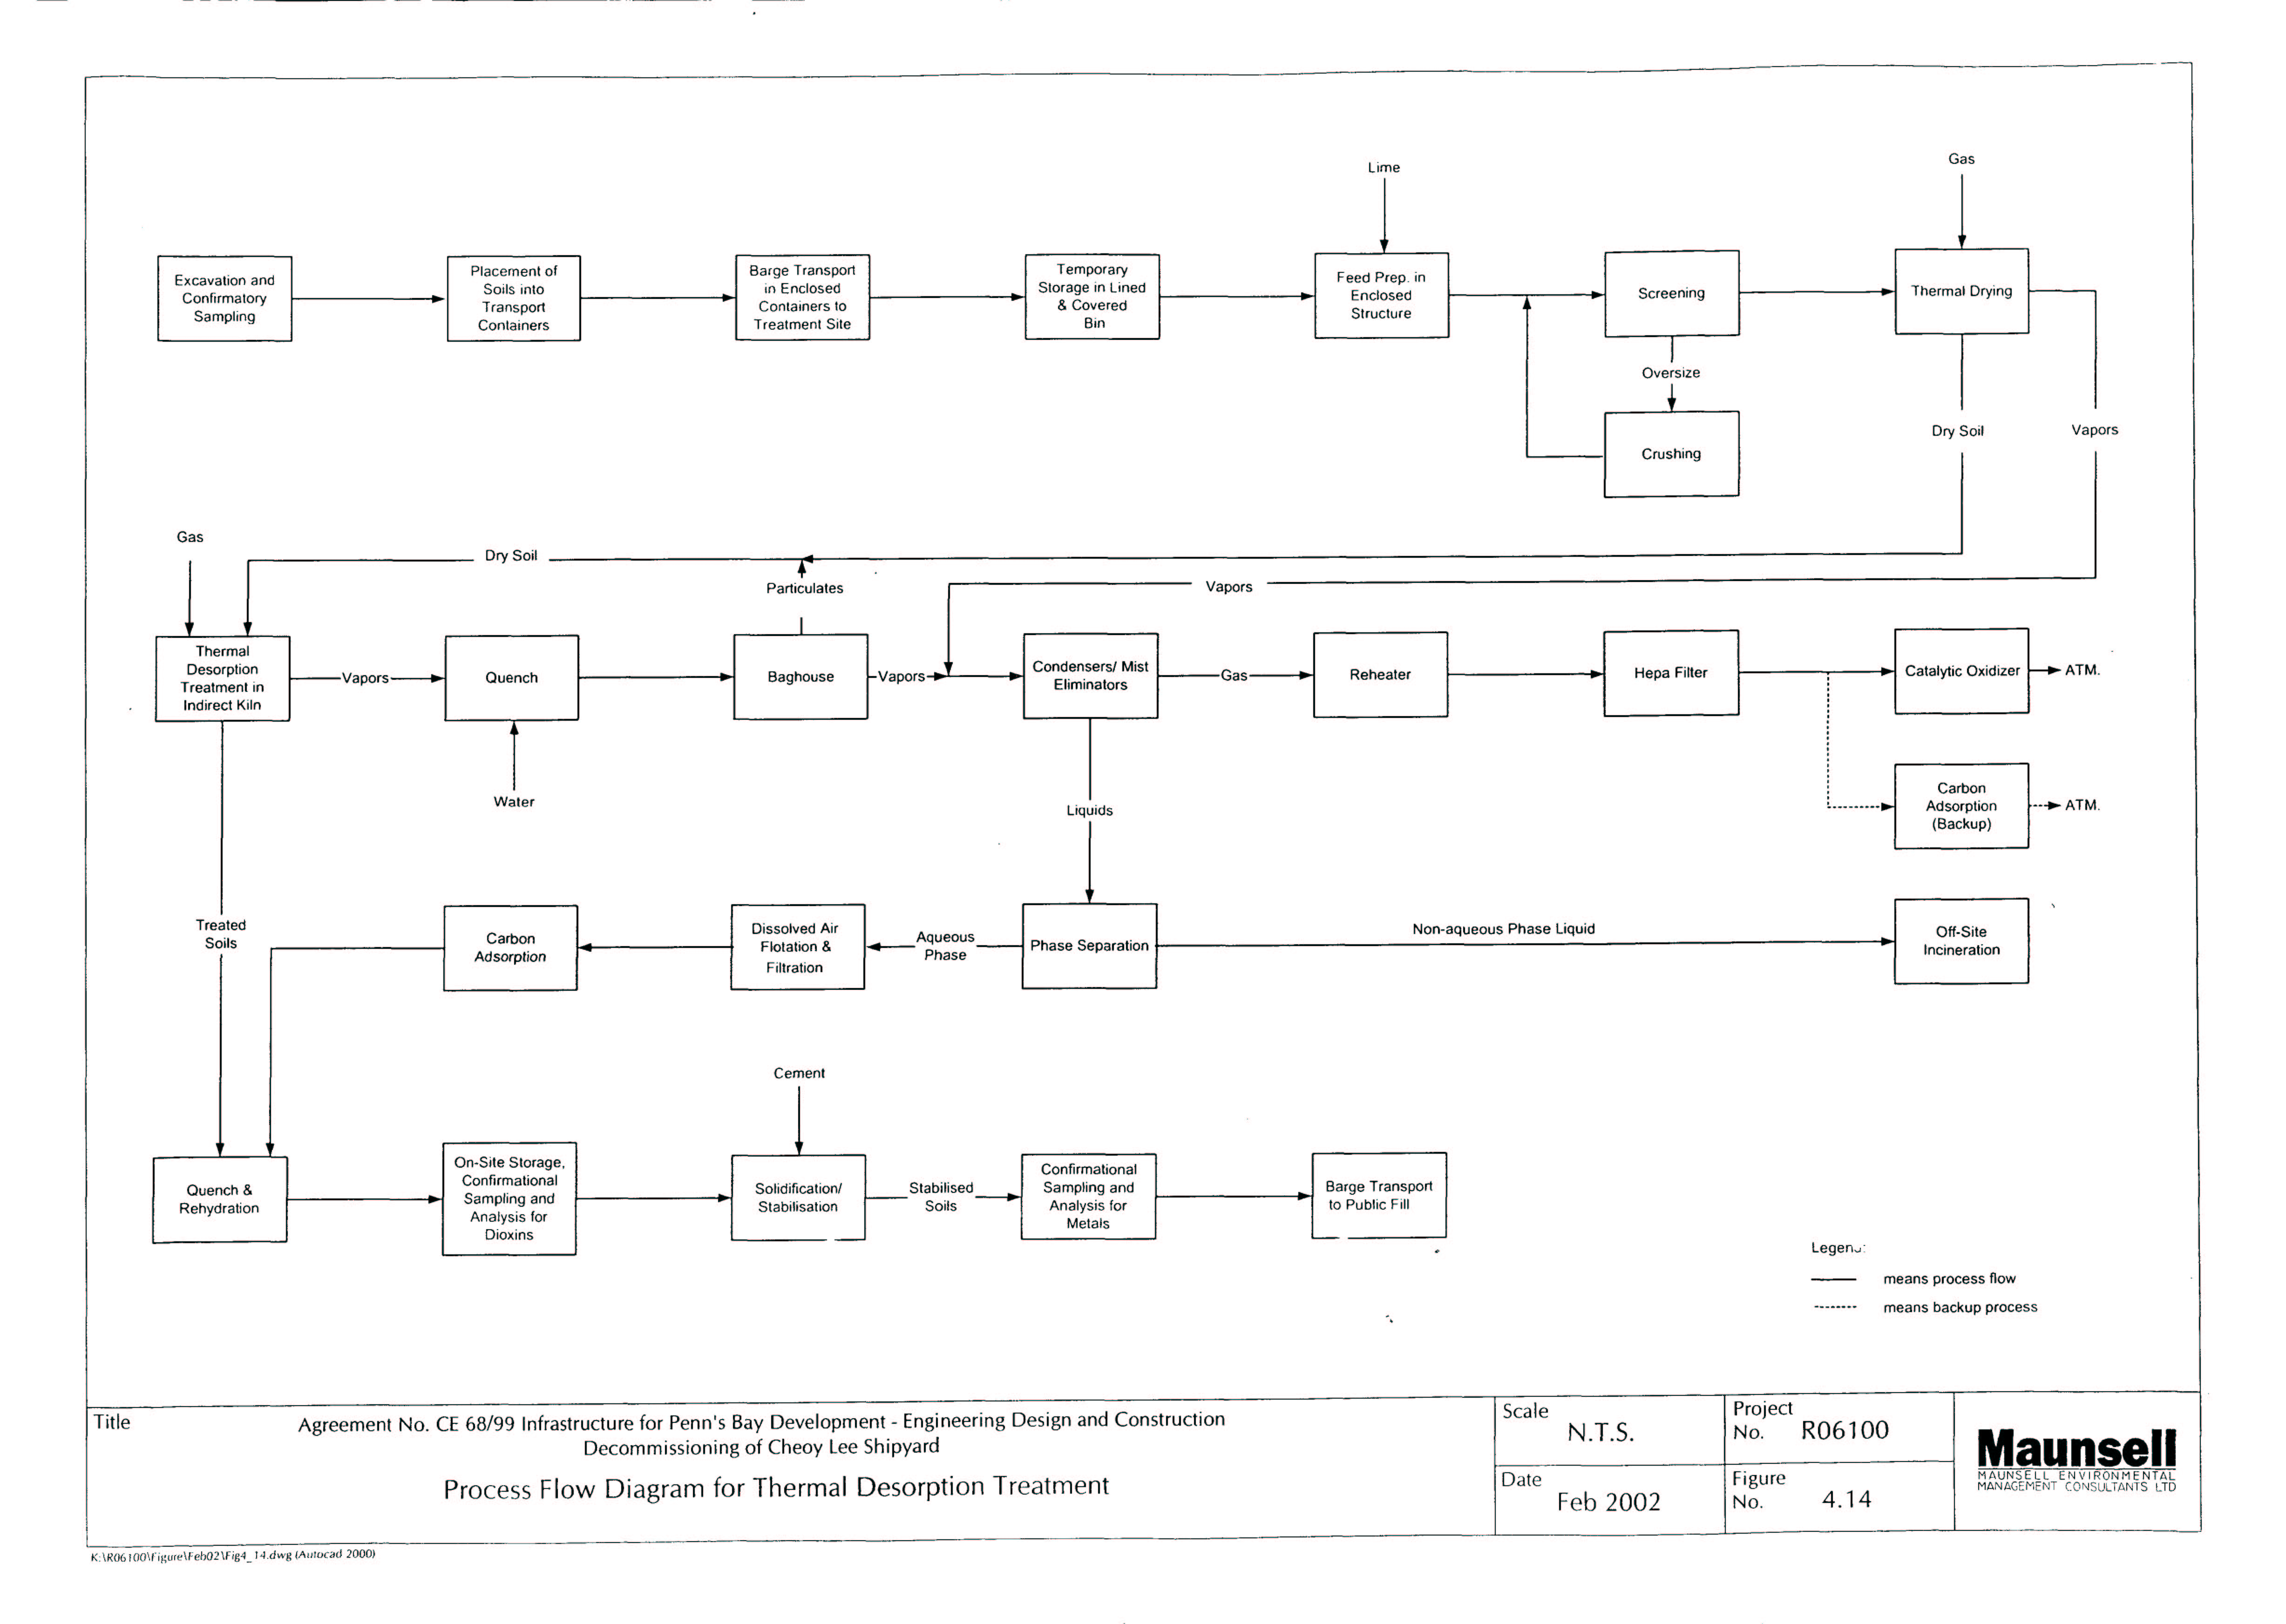
Figure 4.14 Process Flow Diagram for Thermal Desorption Treatment
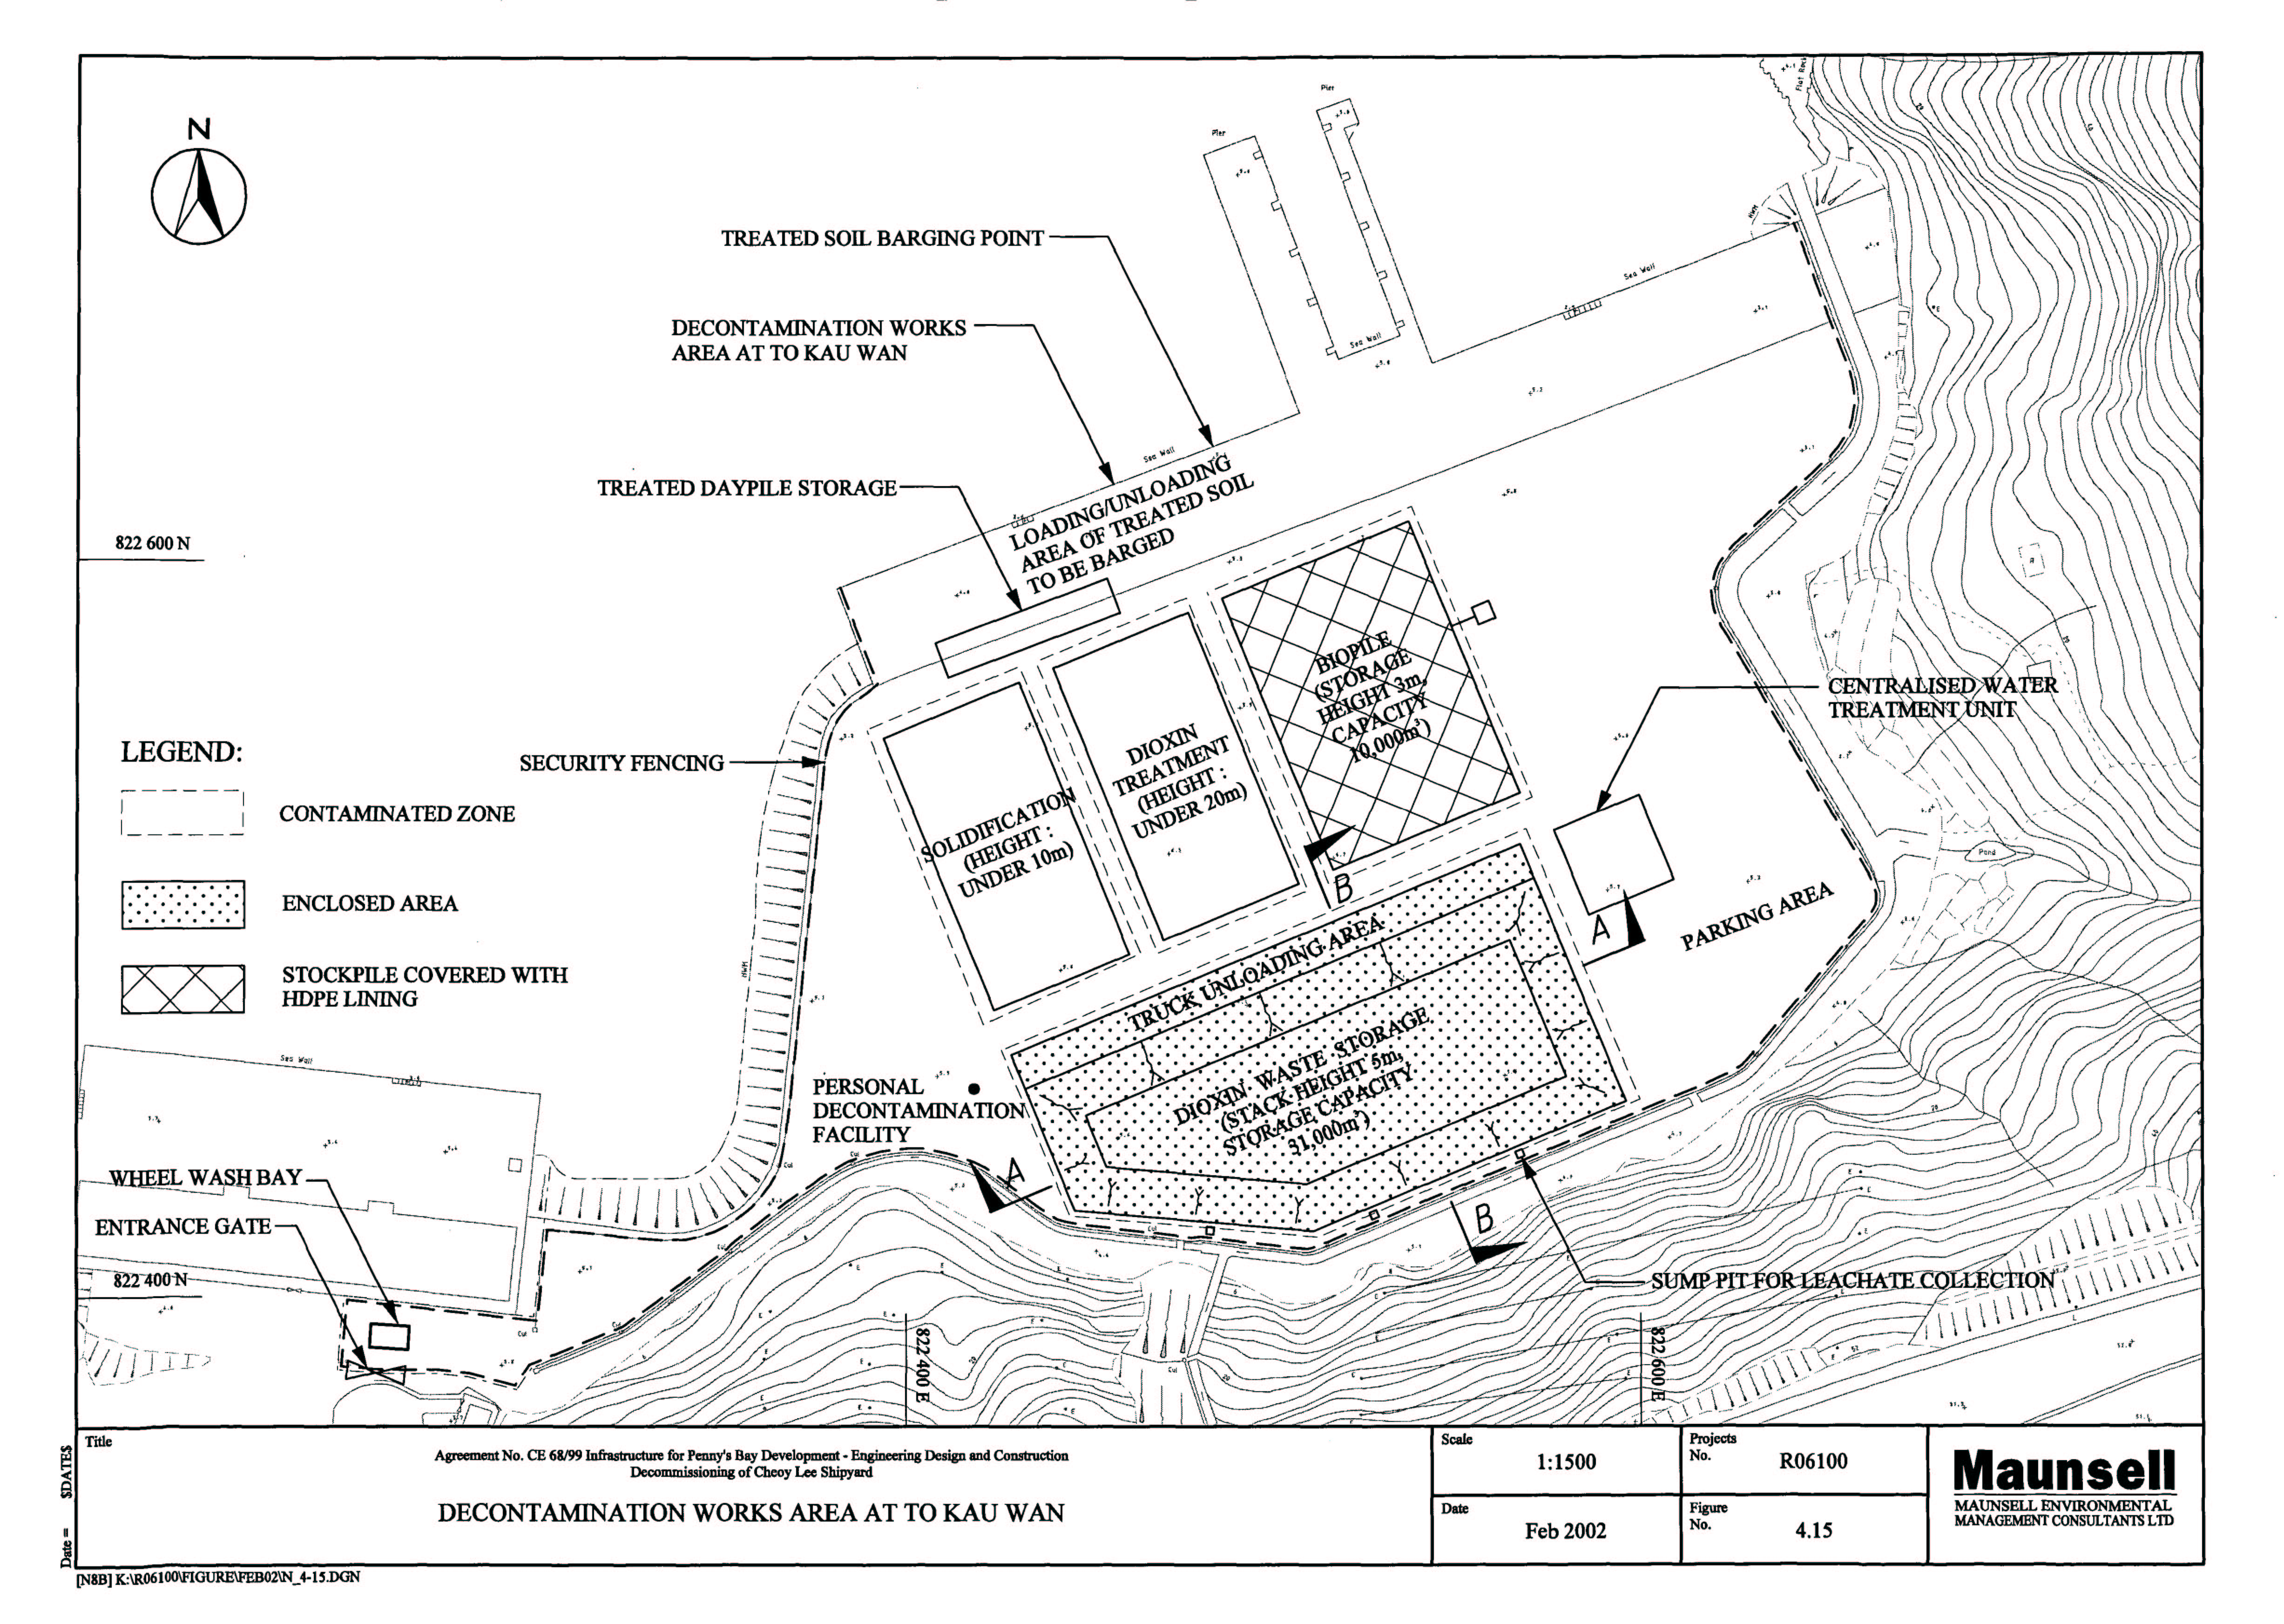
Figure 4.15 Decontamination Works Area at To Kau Wan
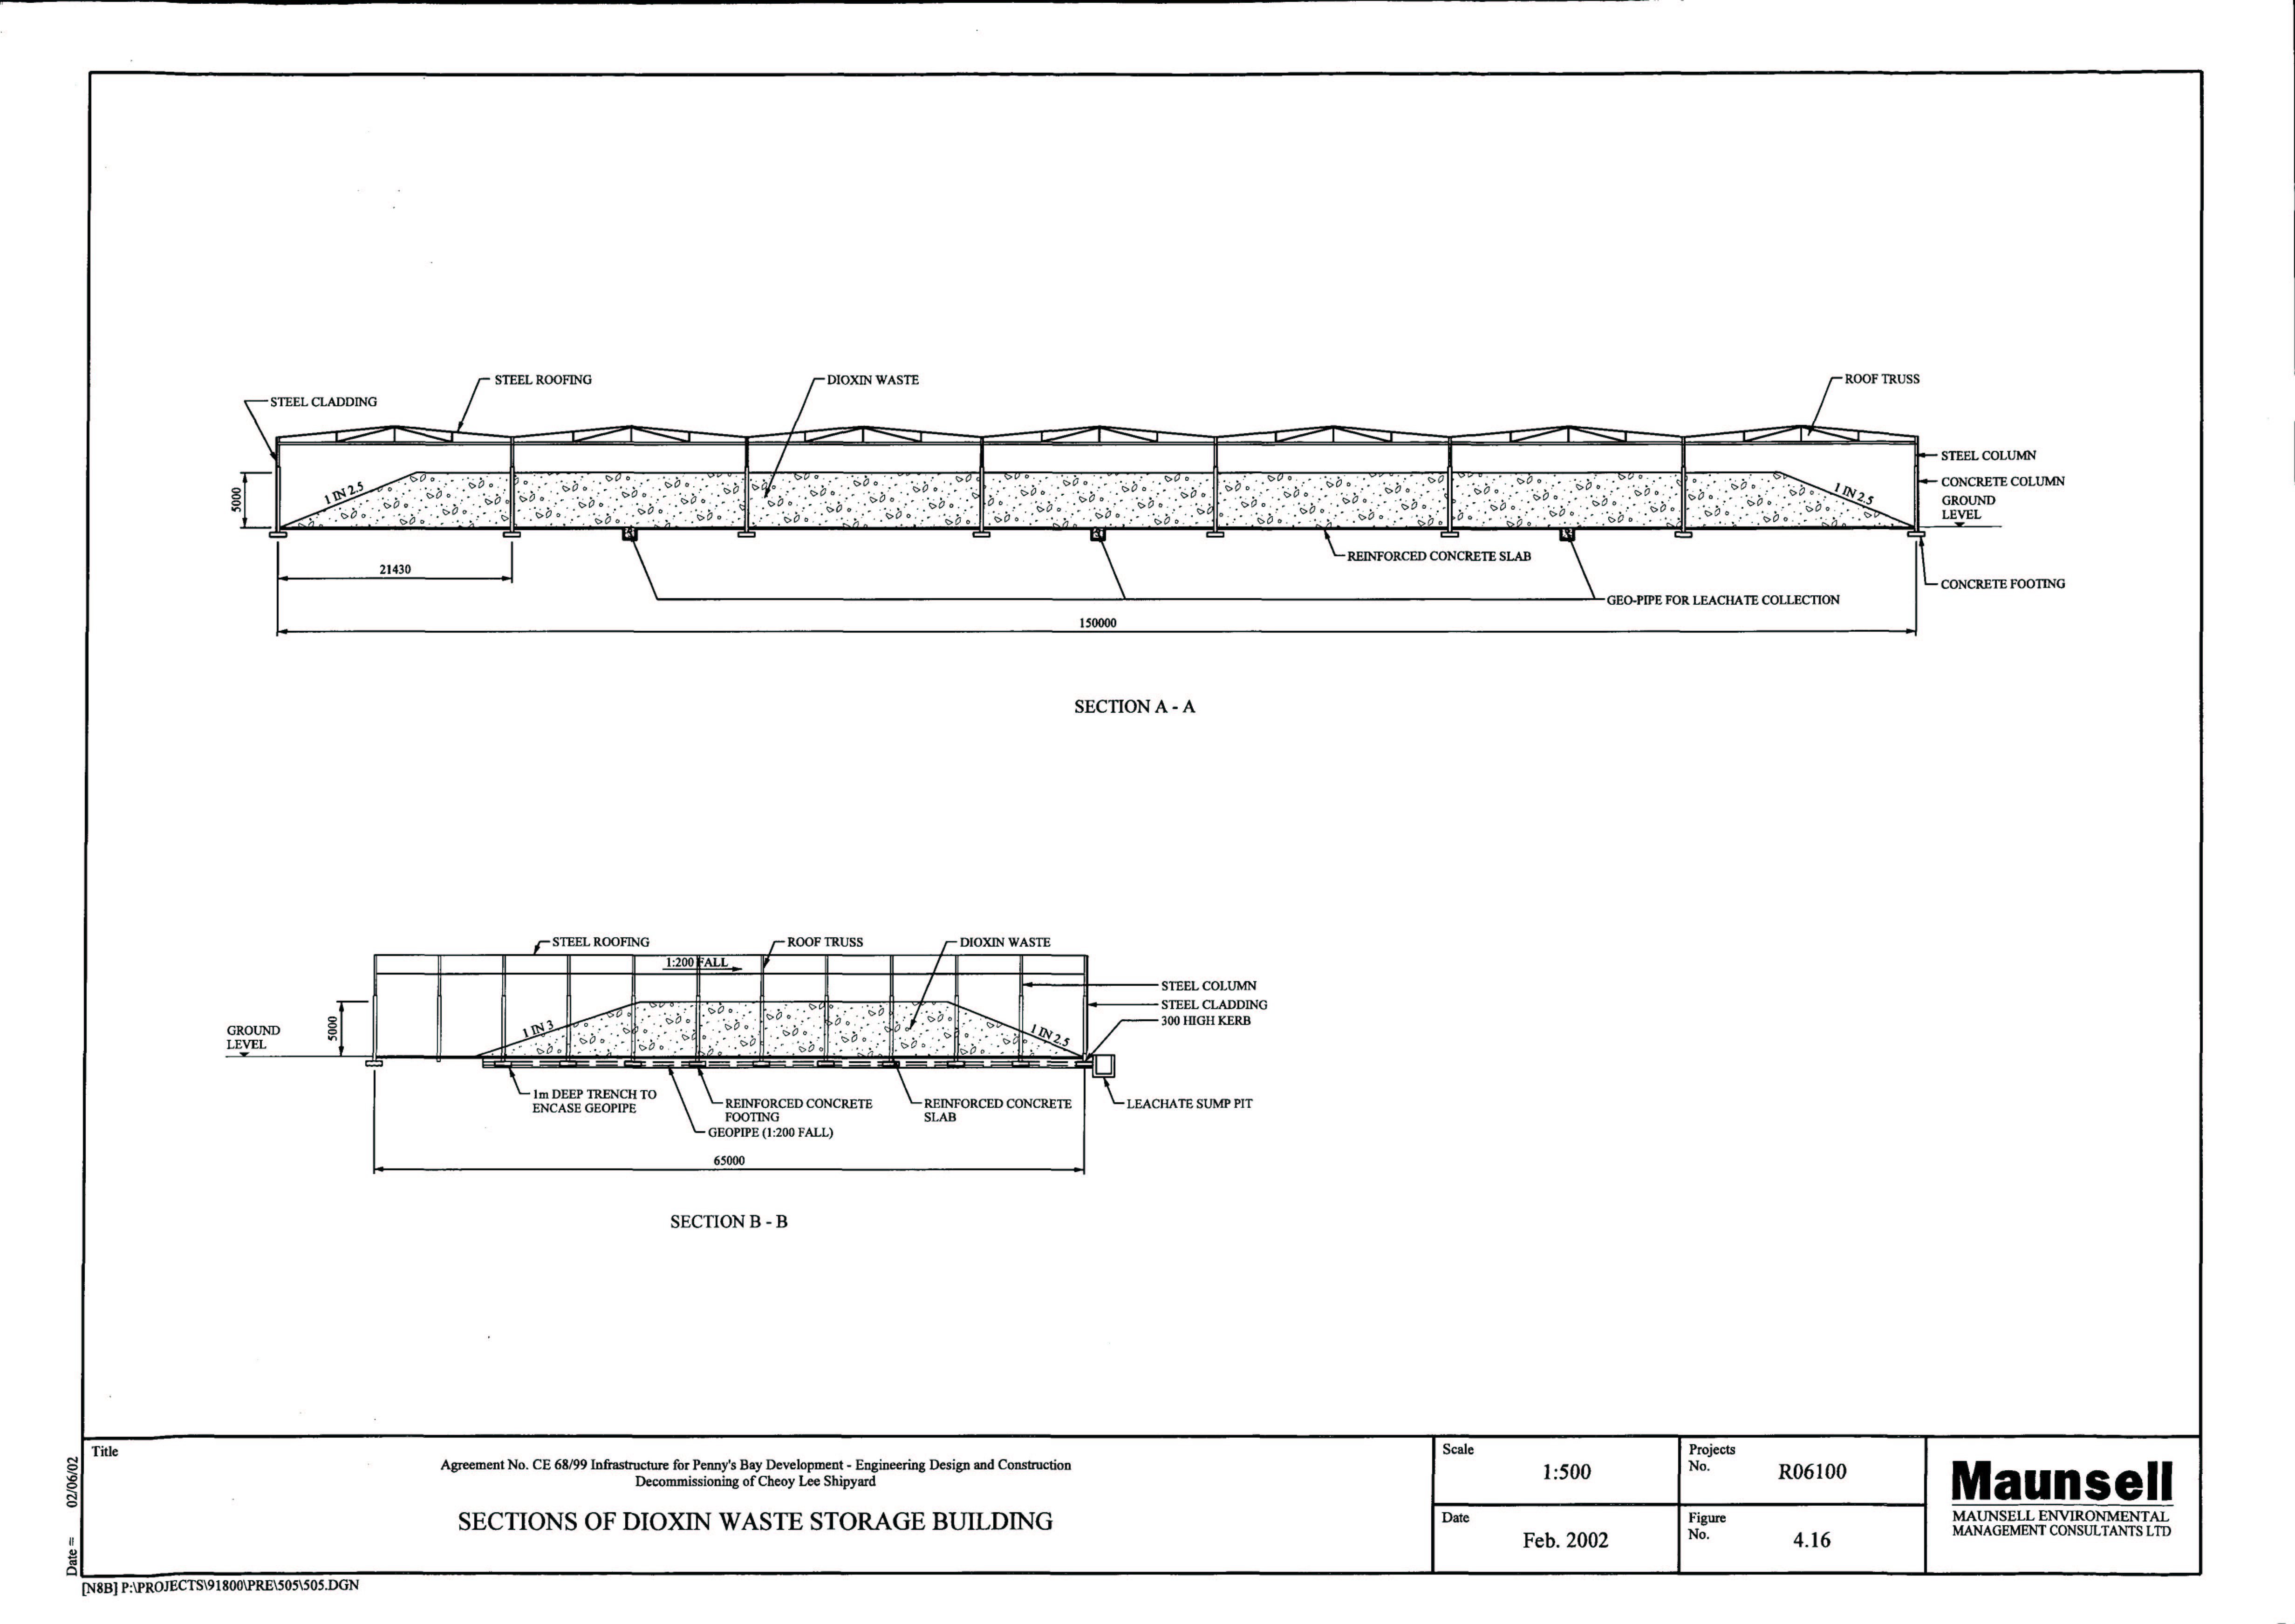
Figure 4.16 Sections of Dioxin Waste Storage Building
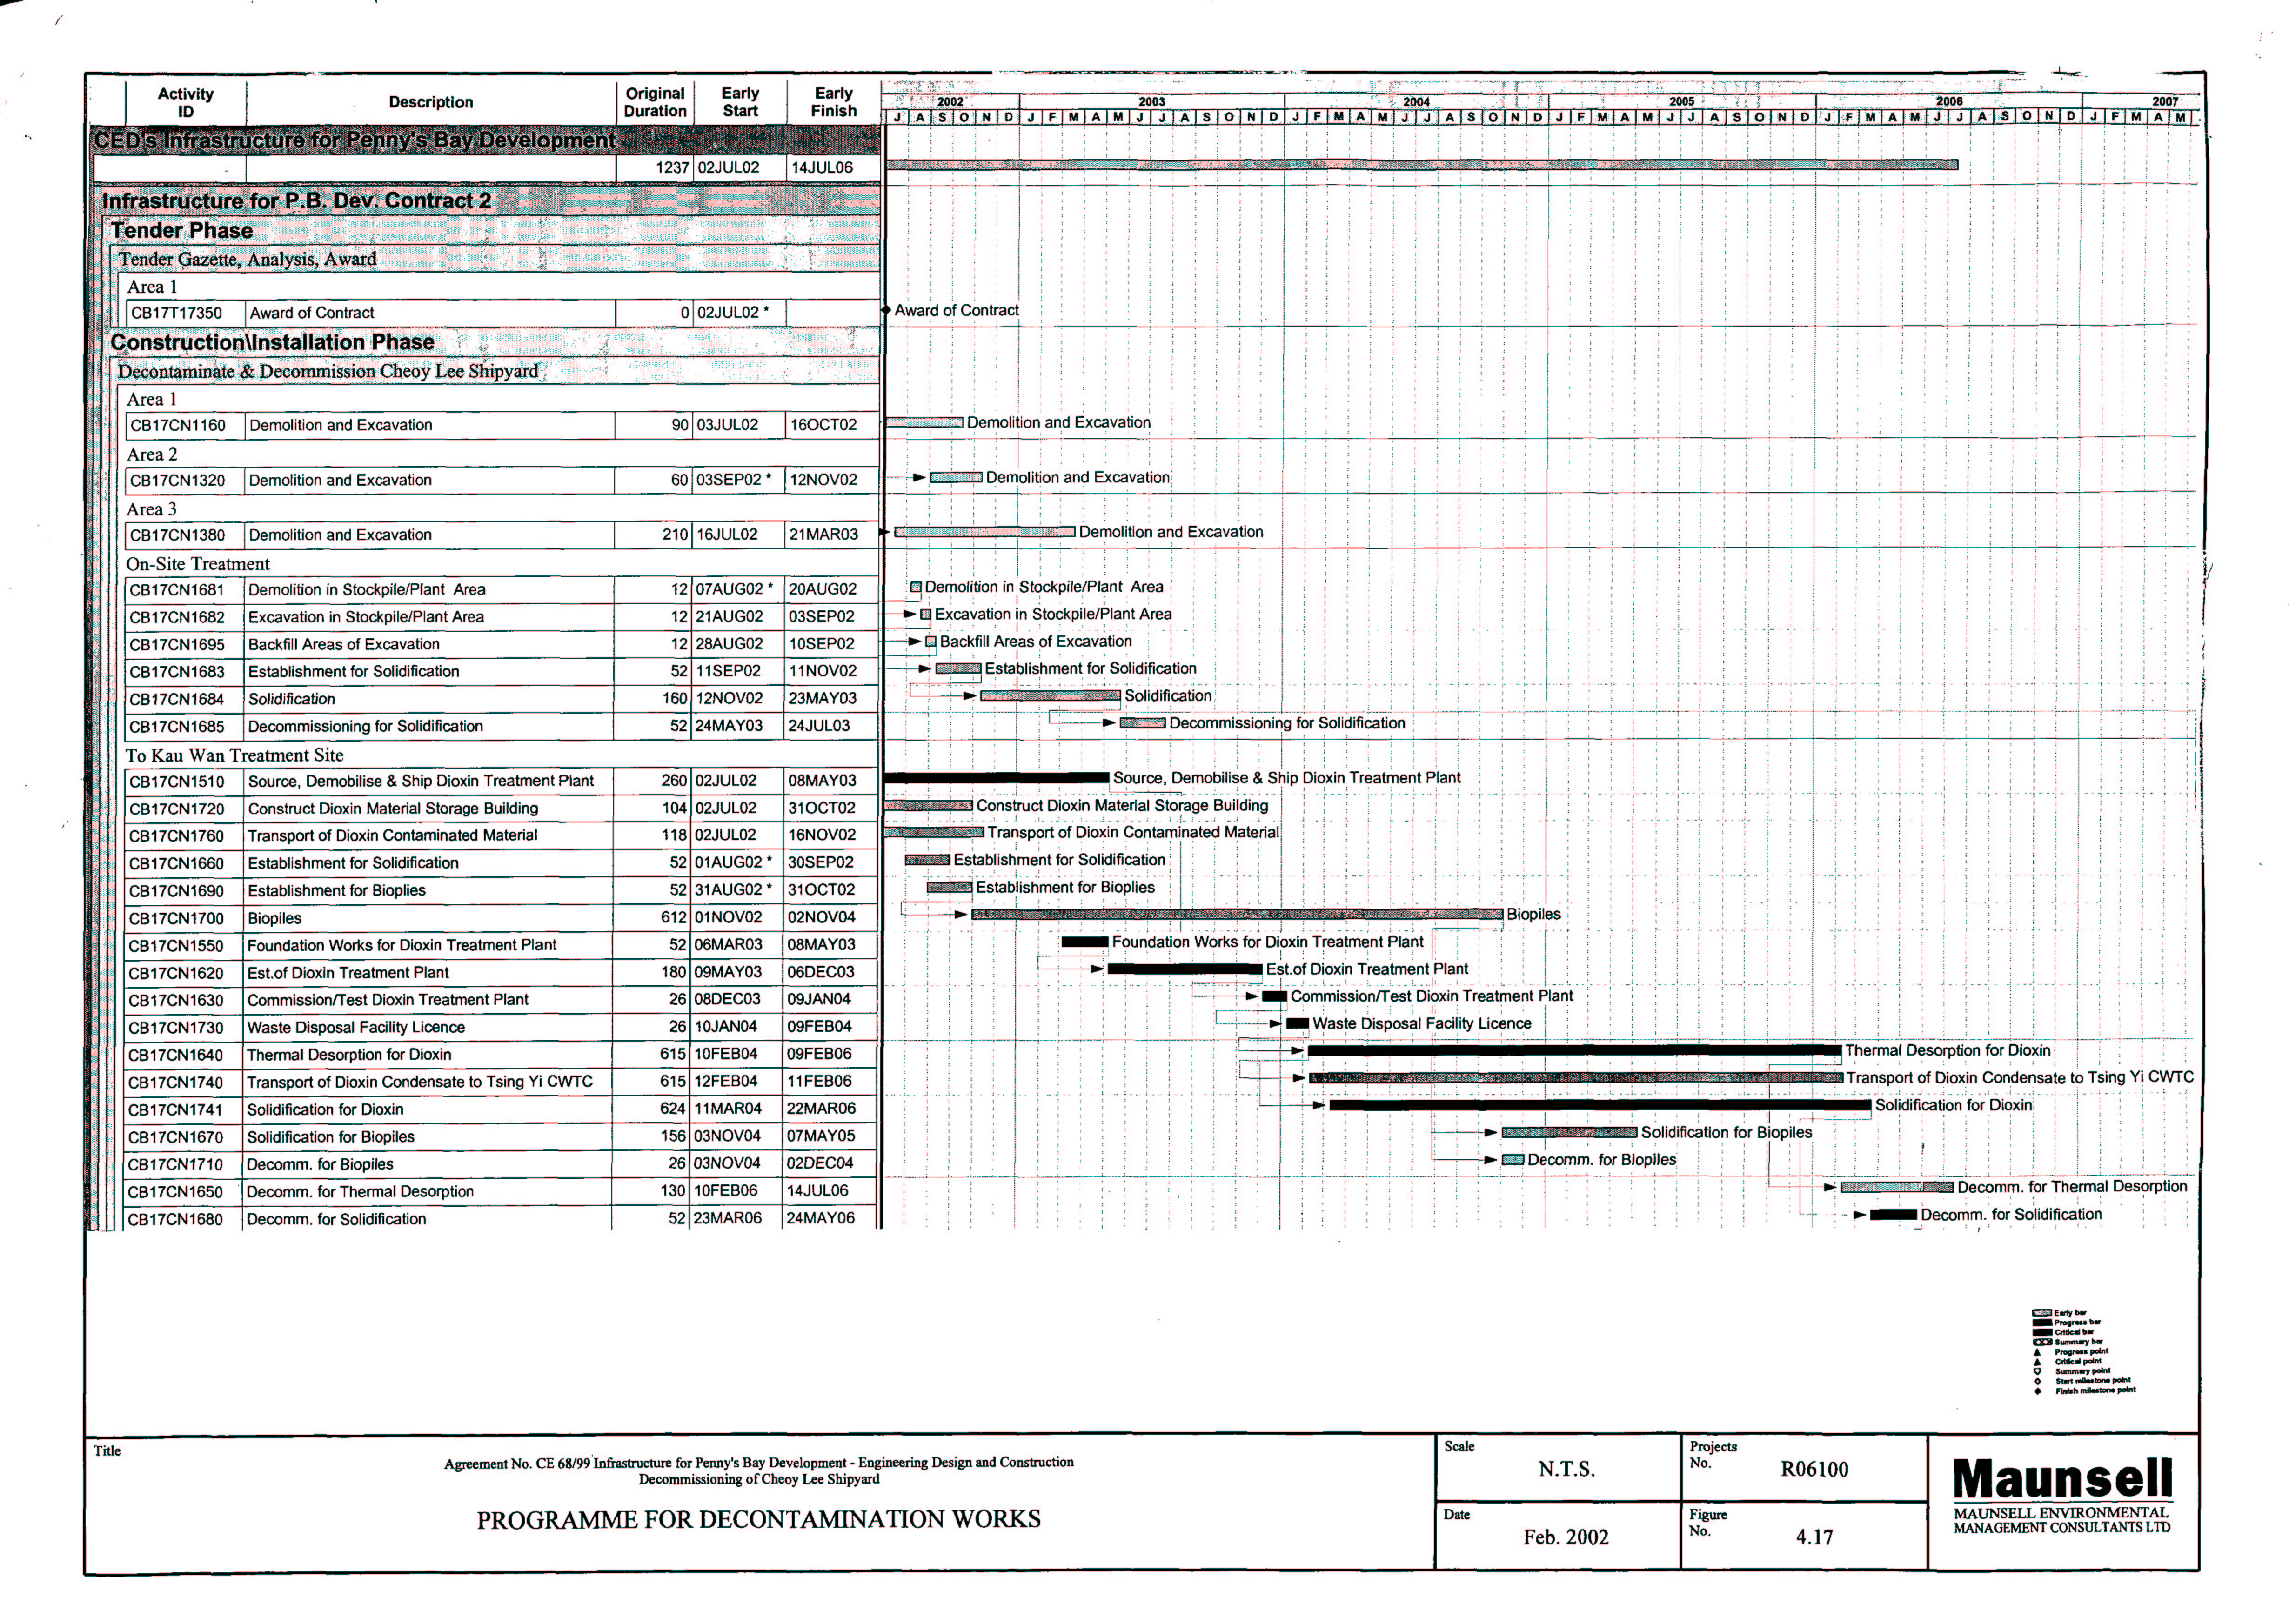
Figure 4.17 Programme for Decontamination Works
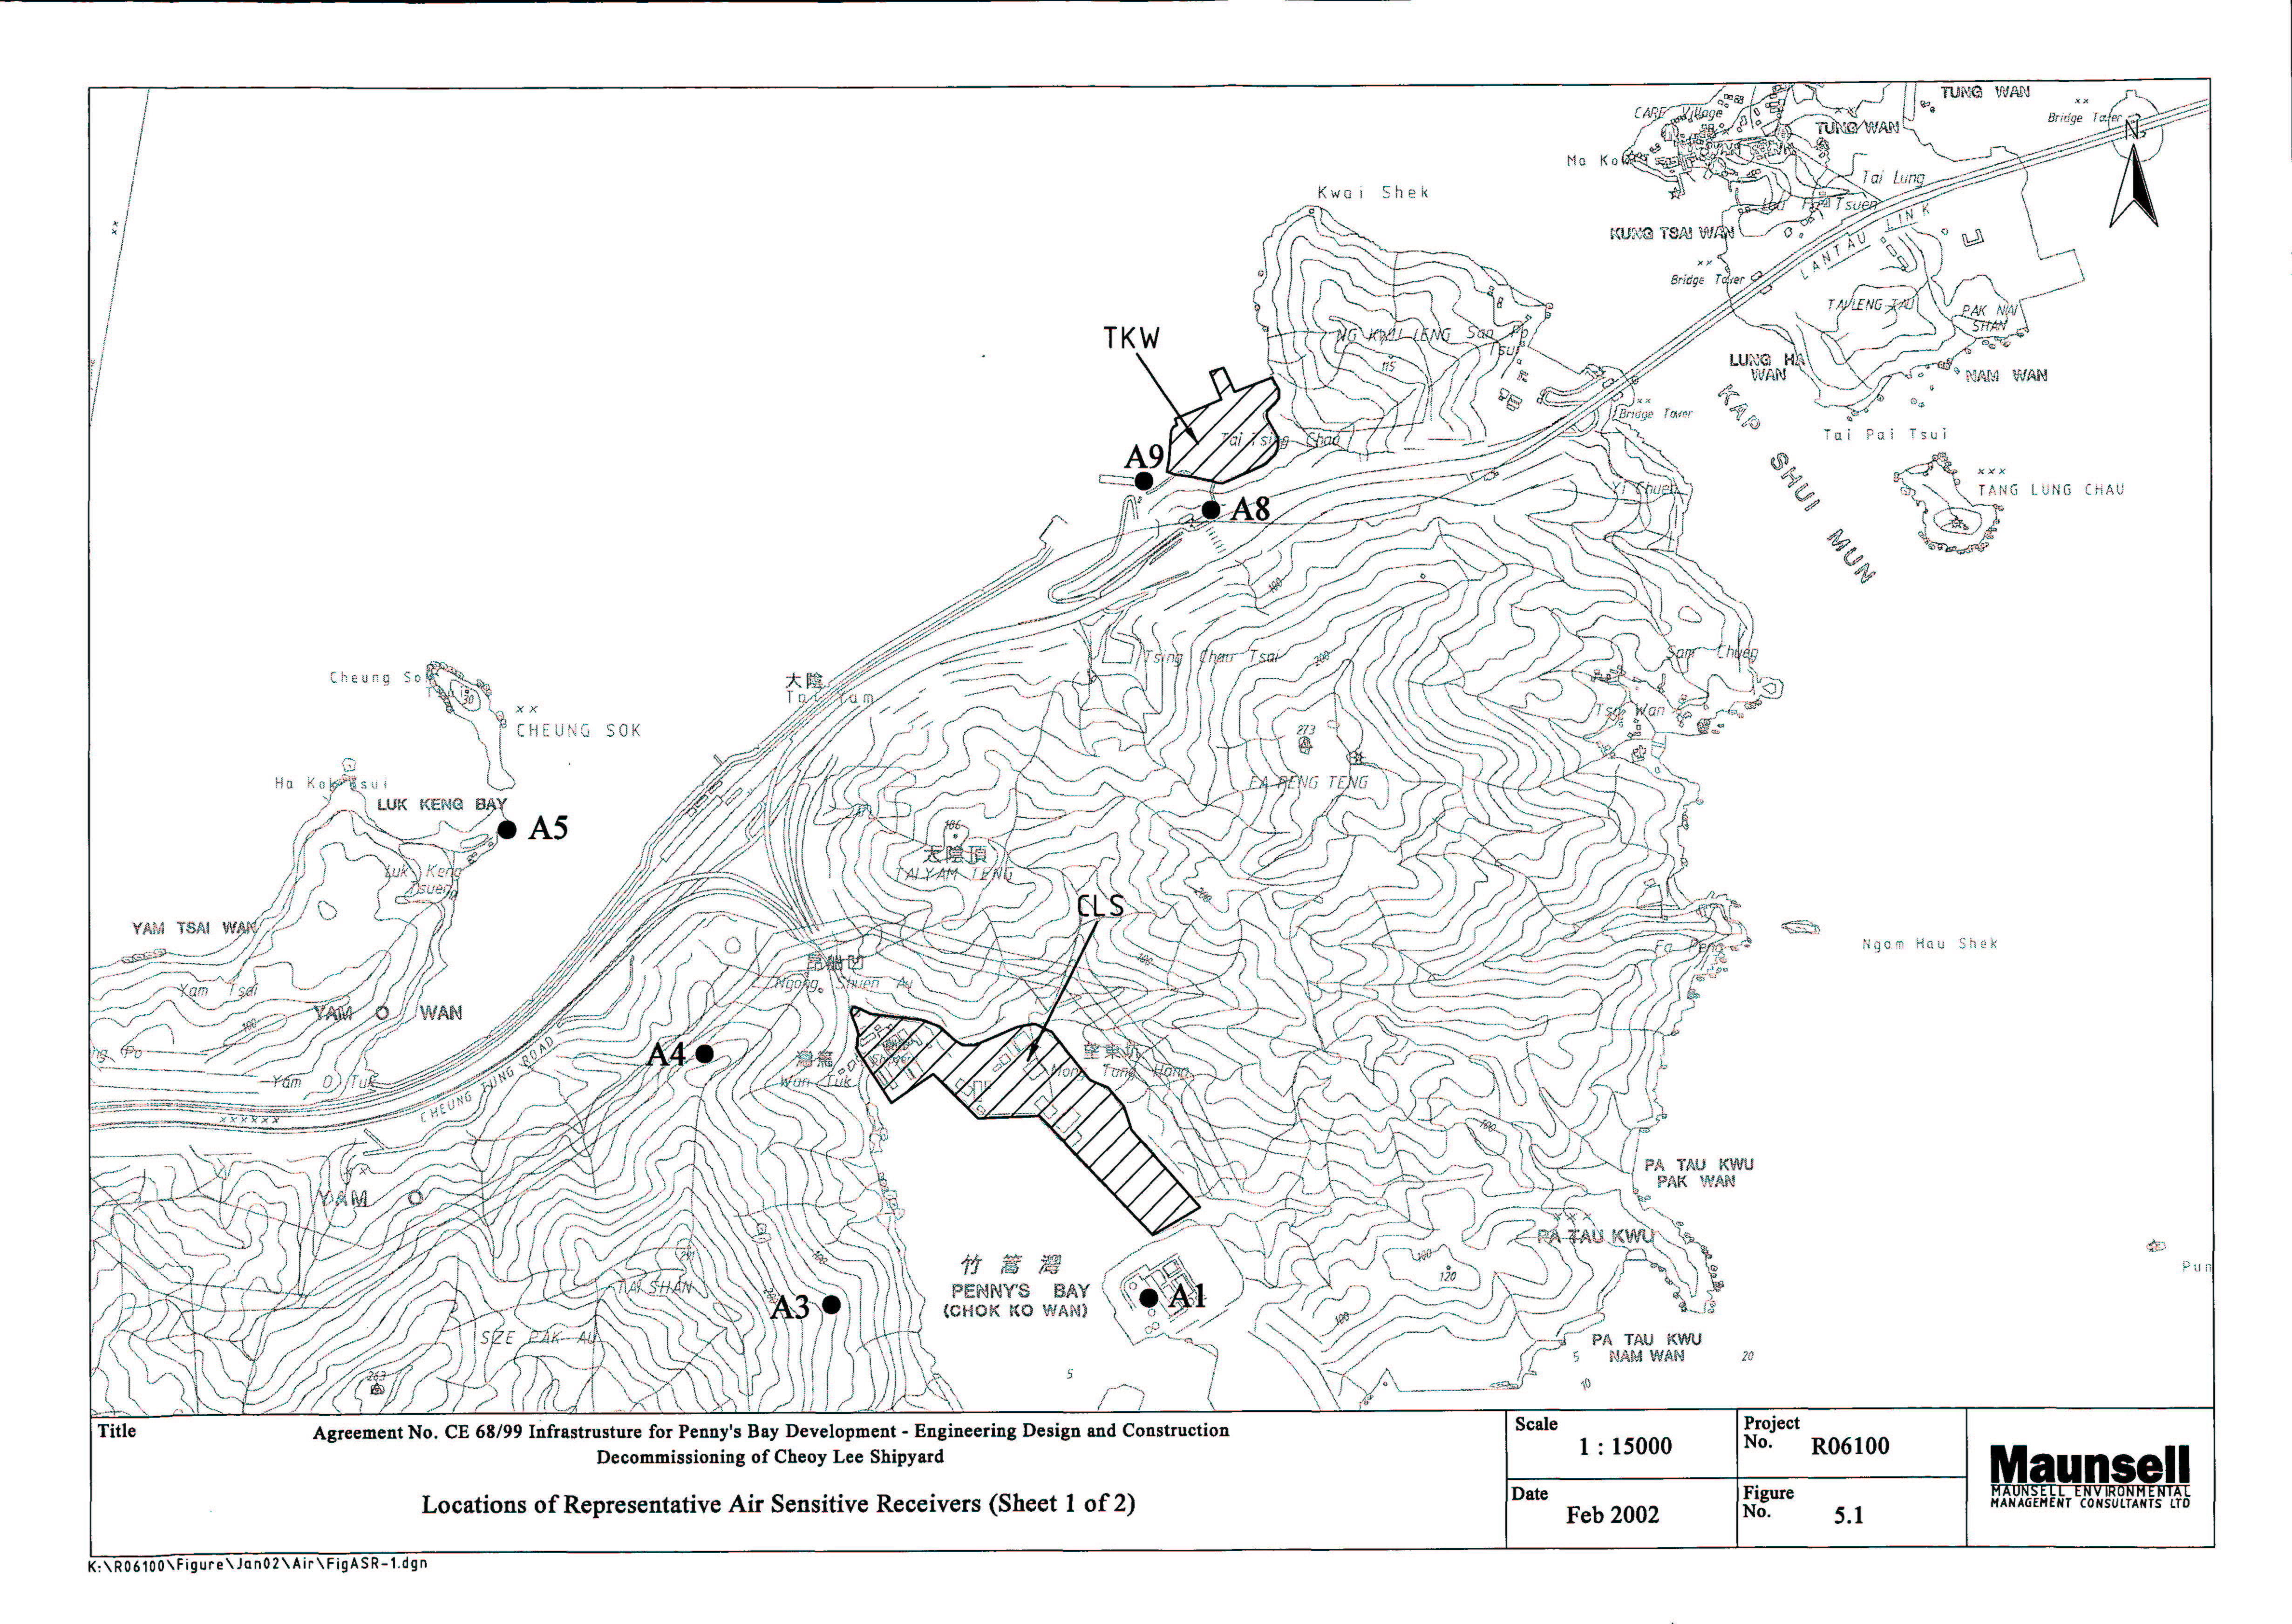
Figure 5.1 Locations of Representative Air Sensitive Receivers
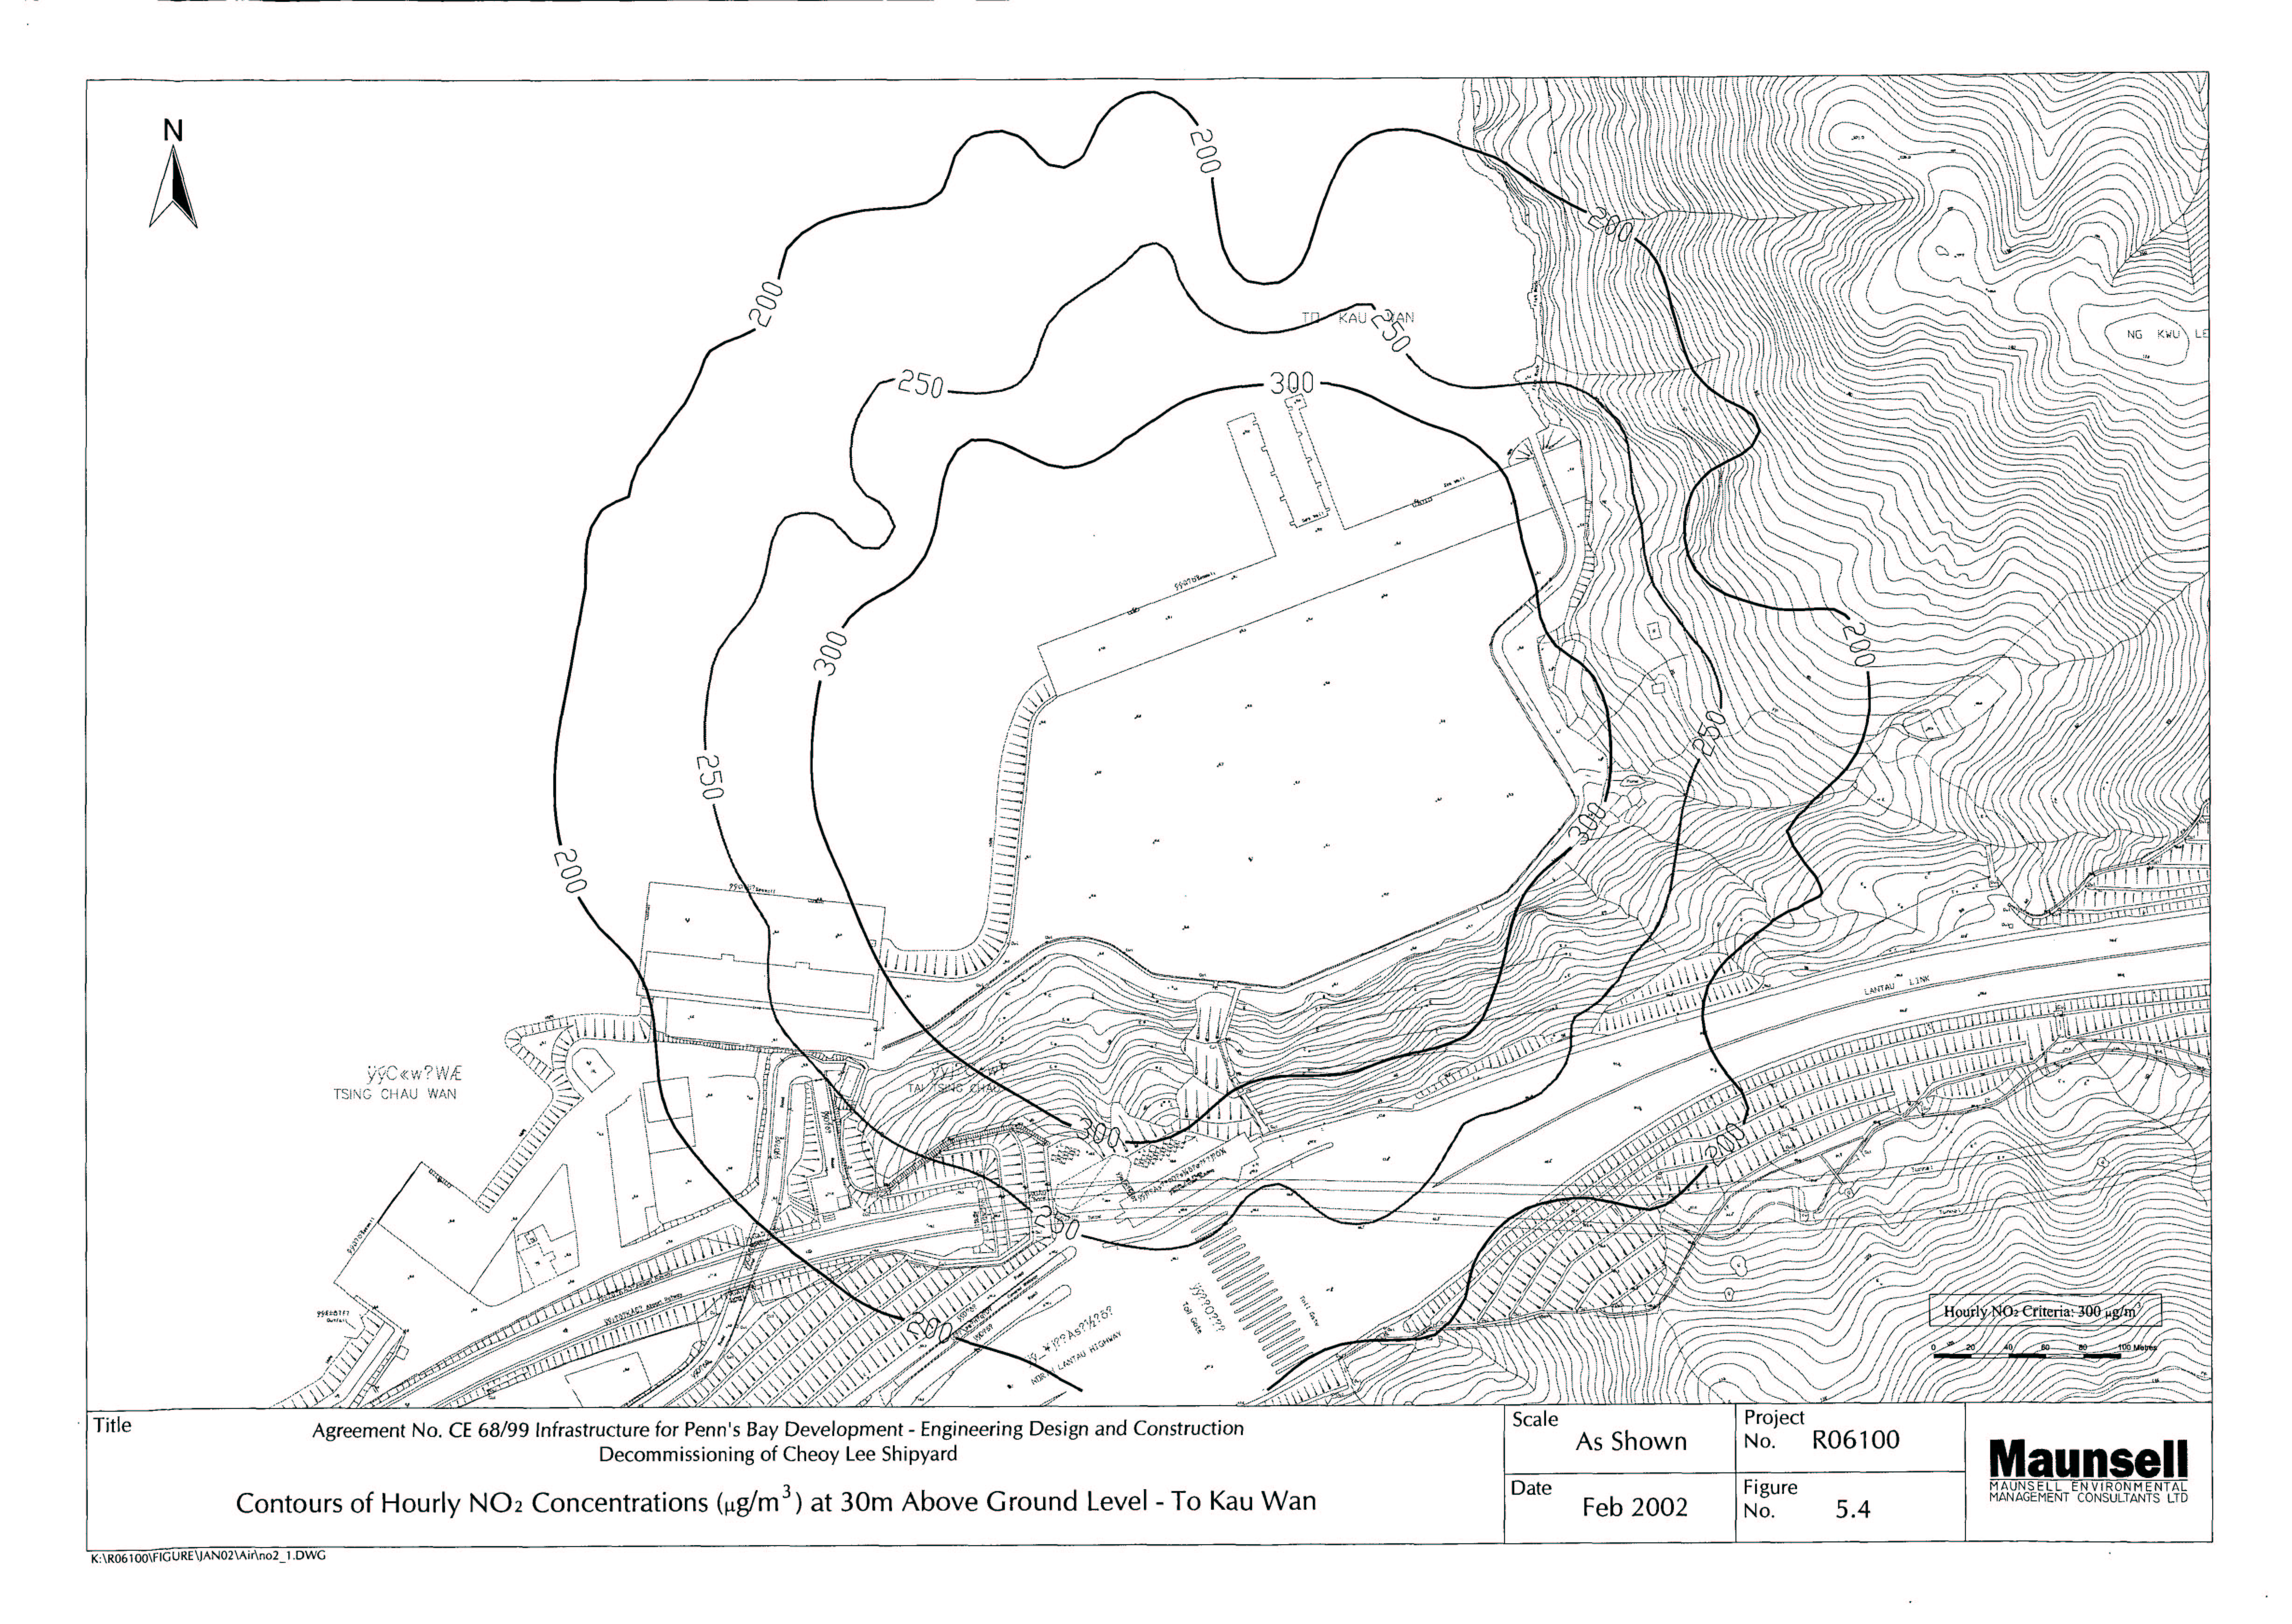
Figure 5.4 Contours of Hourly NO2 Concentration (mg/m3) at 30m Above Ground Level – To Kau Wan
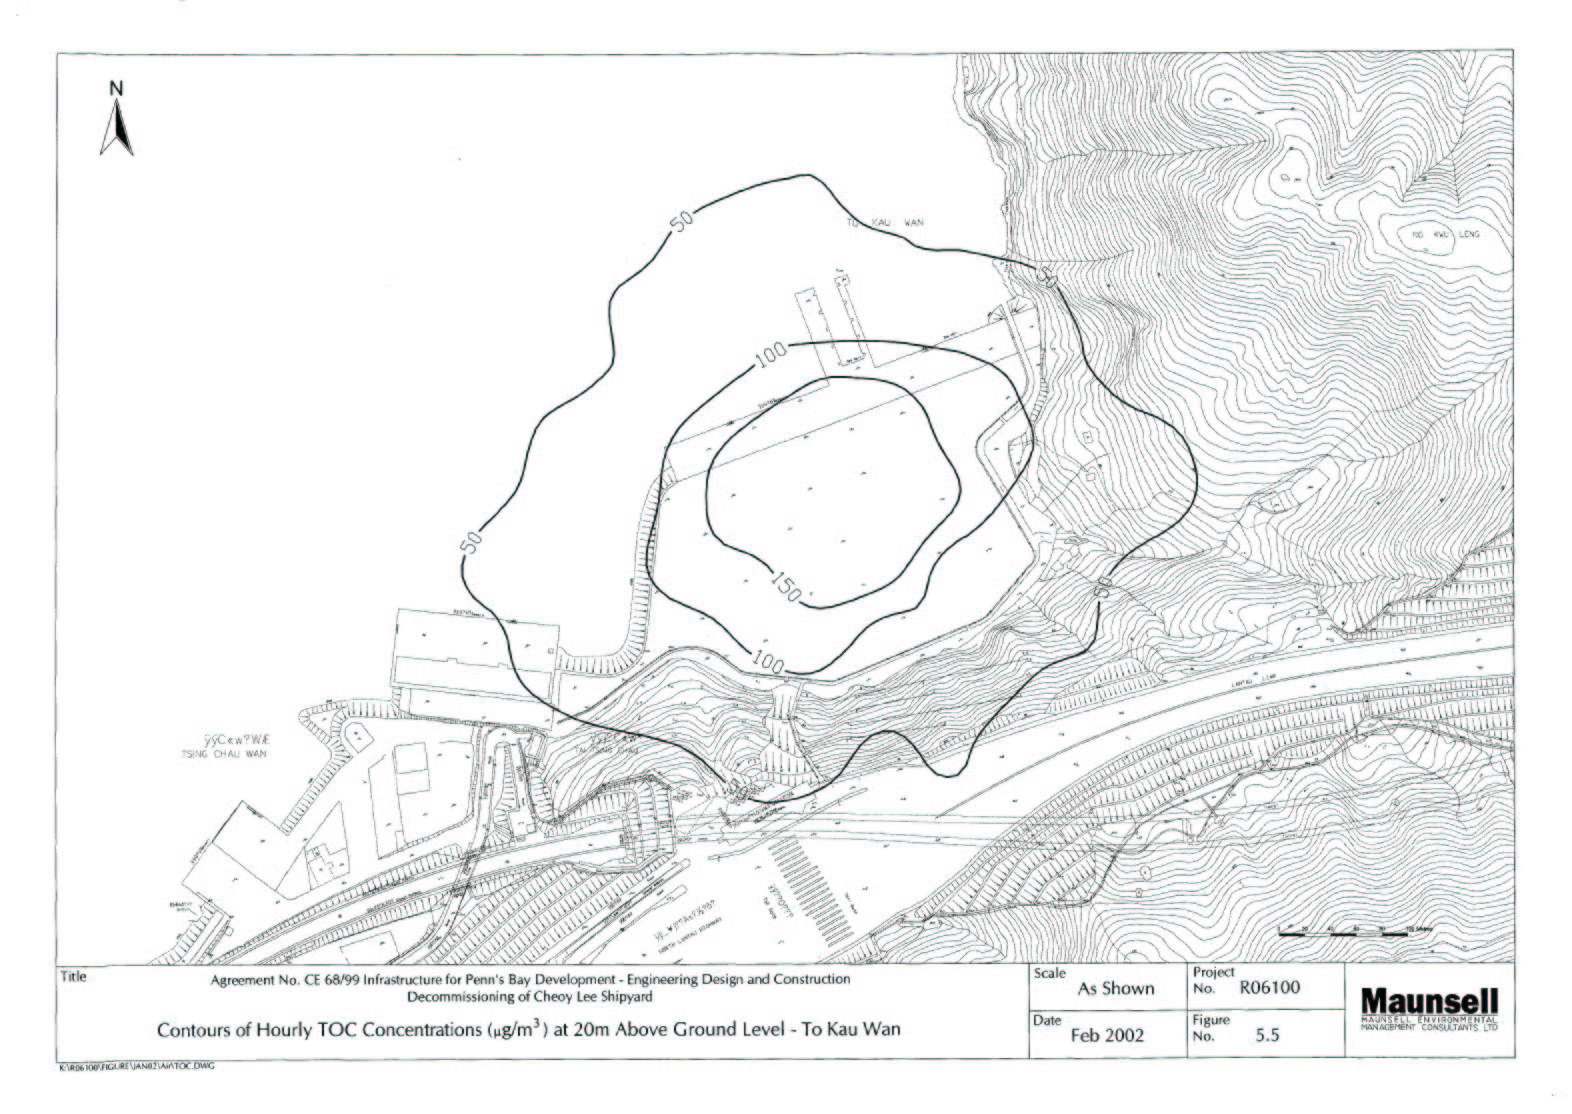
Figure 5.5 Contours of Hourly TOC Concentration (mg/m3) at 20m Above Ground Level – To Kau Wan
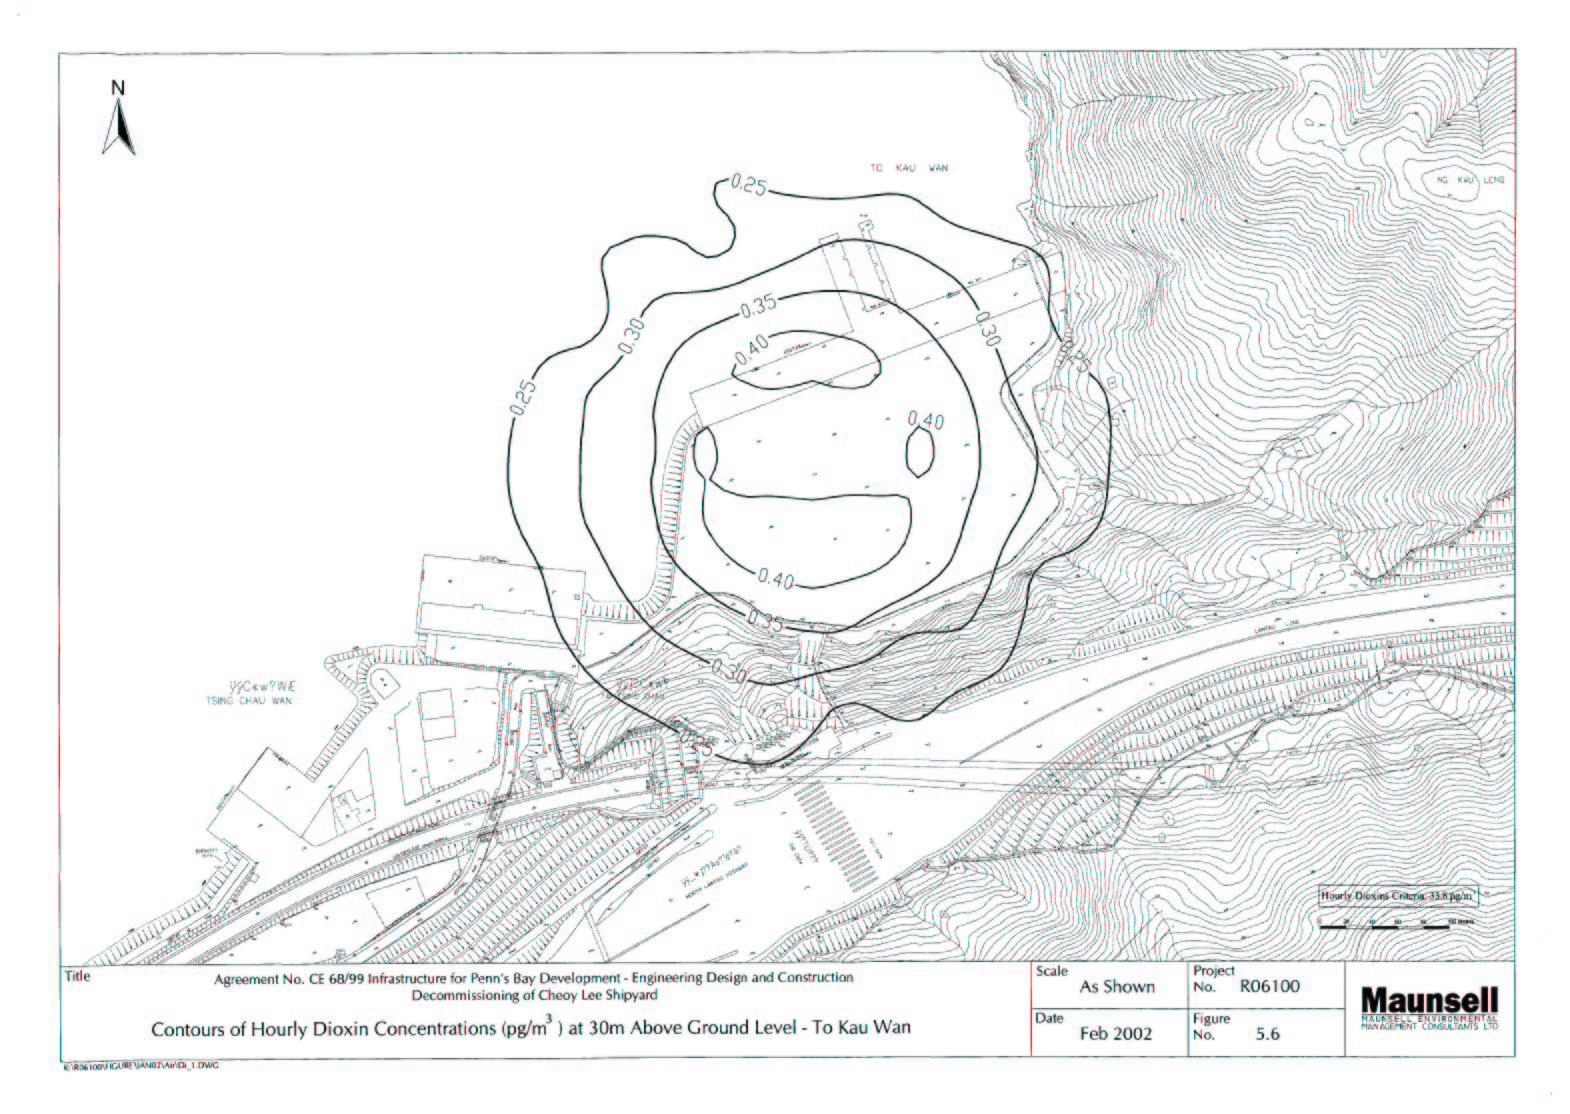
Figure 5.6 Contours of Hourly Dioxin Concentrations (pg/m3) at 30m Above Ground Level – To Kau Wan
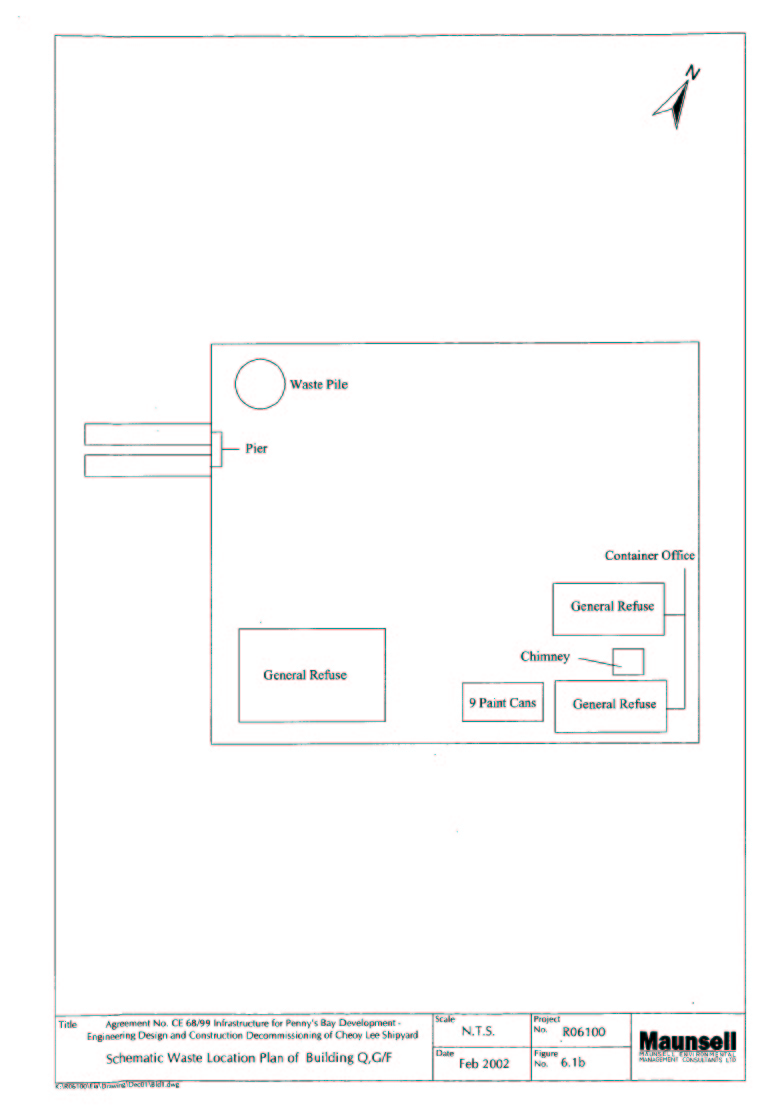
Figure 6.1b Schematic Waste location Plan of Building Q, G/F
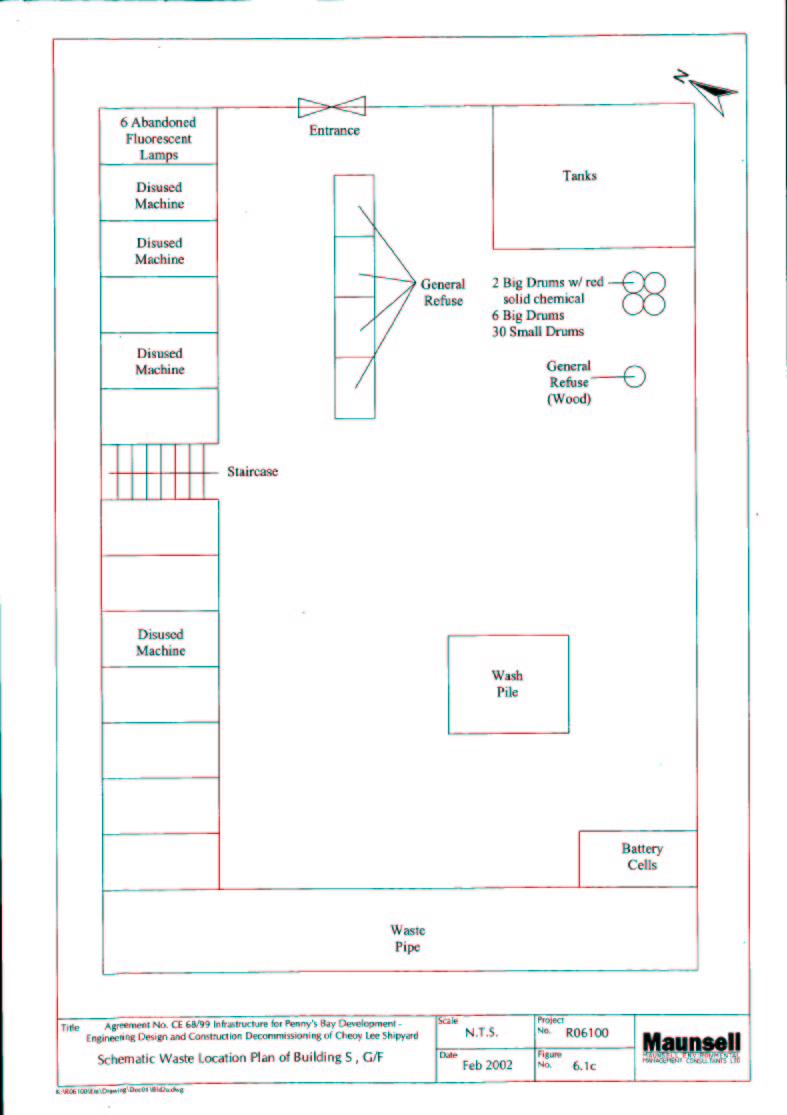
Figure 6.1c Schematic Waste location Plan of Building S, G/F
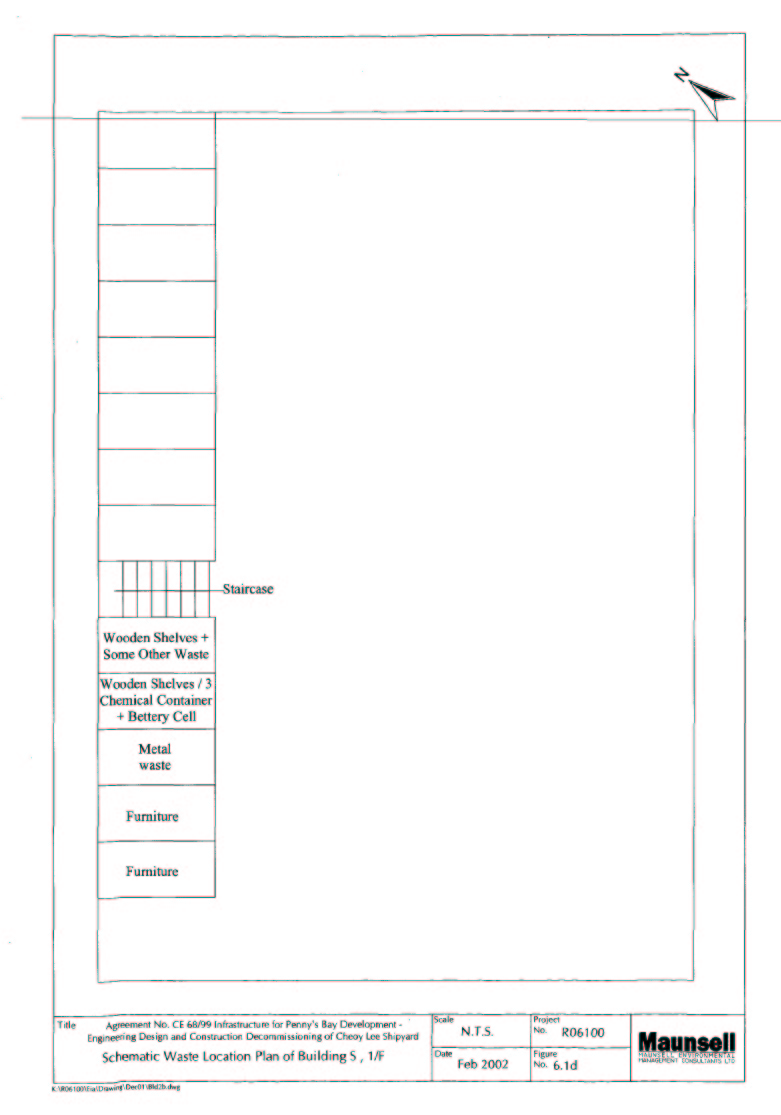
Figure 6.1d Schematic Waste location Plan of Building S, 1/F
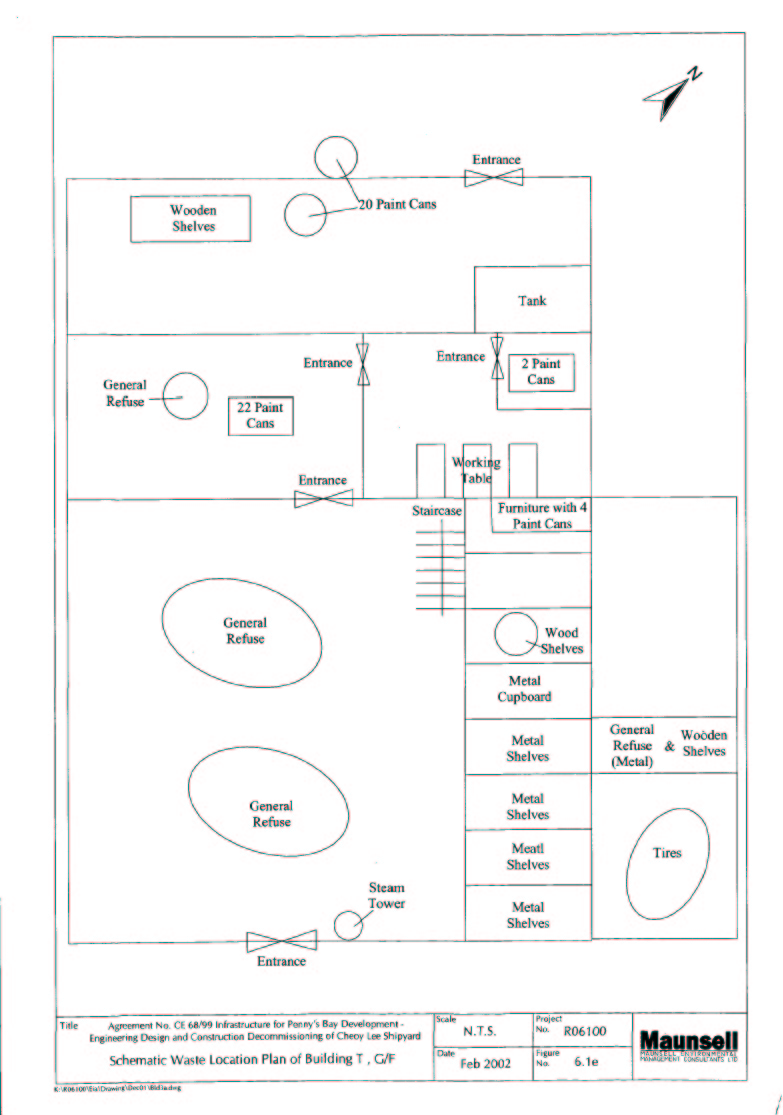
Figure 6.1e Schematic Waste location Plan of Building T, G/F
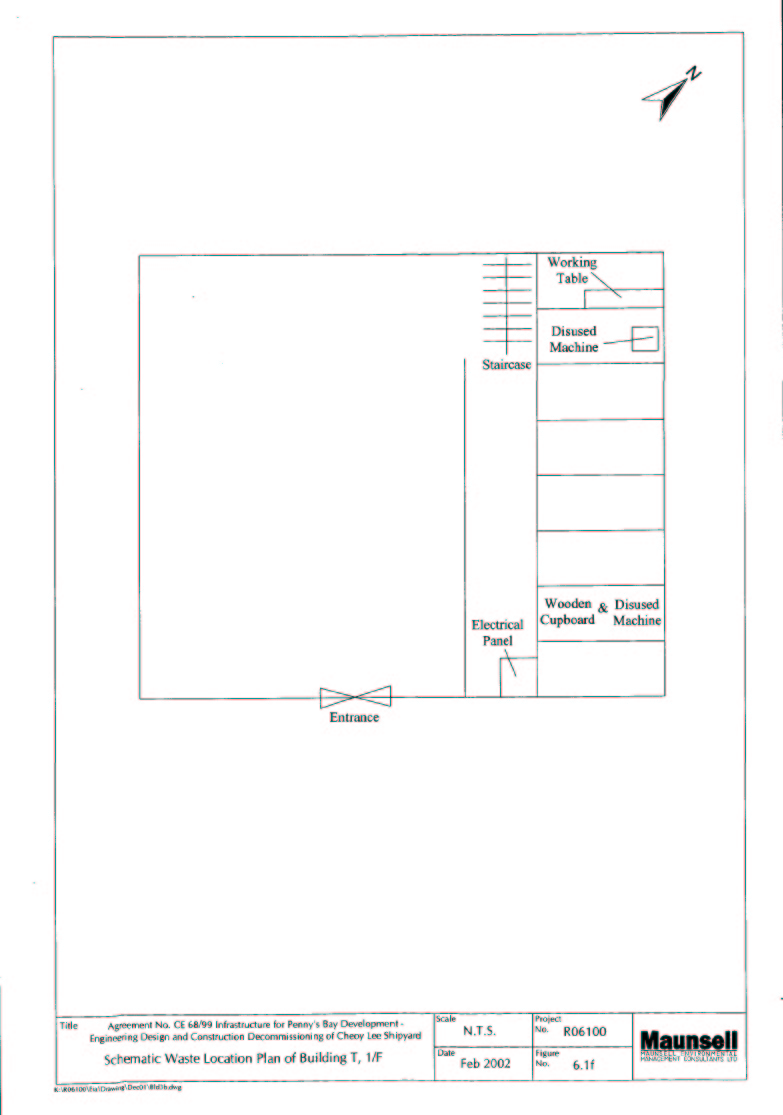
Figure 6.1f Schematic Waste location Plan of Building T, 1/F
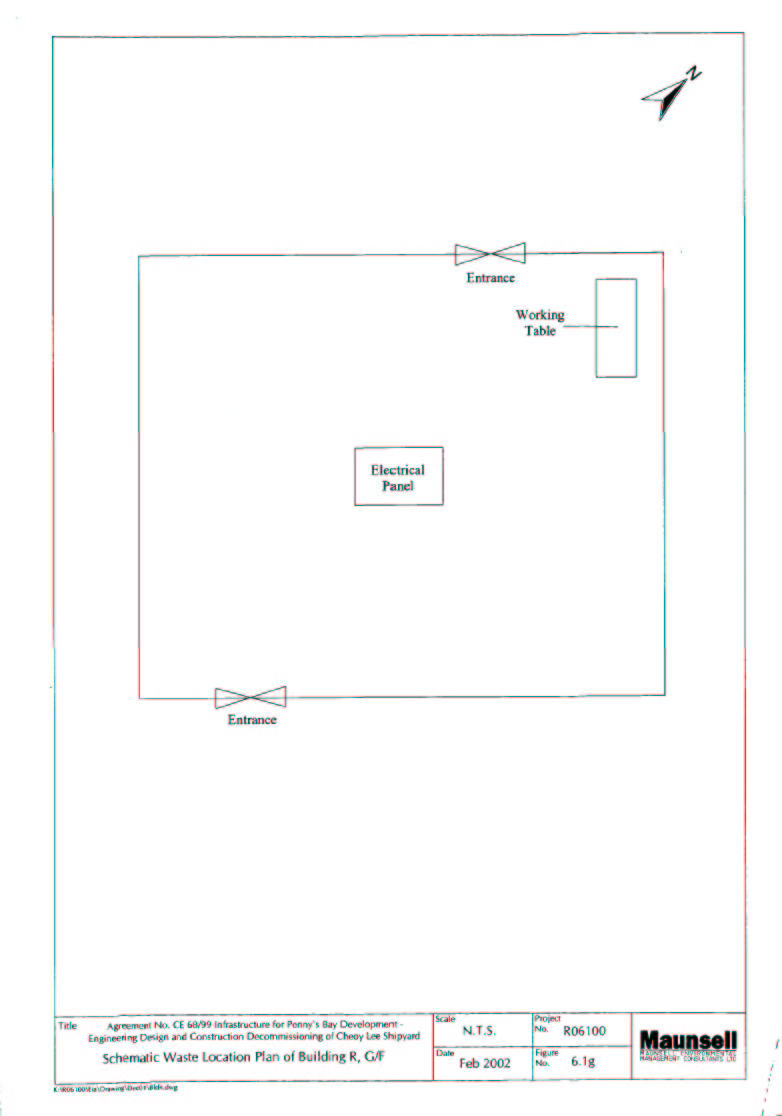
Figure 6.1g Schematic Waste location Plan of Building R, G/F
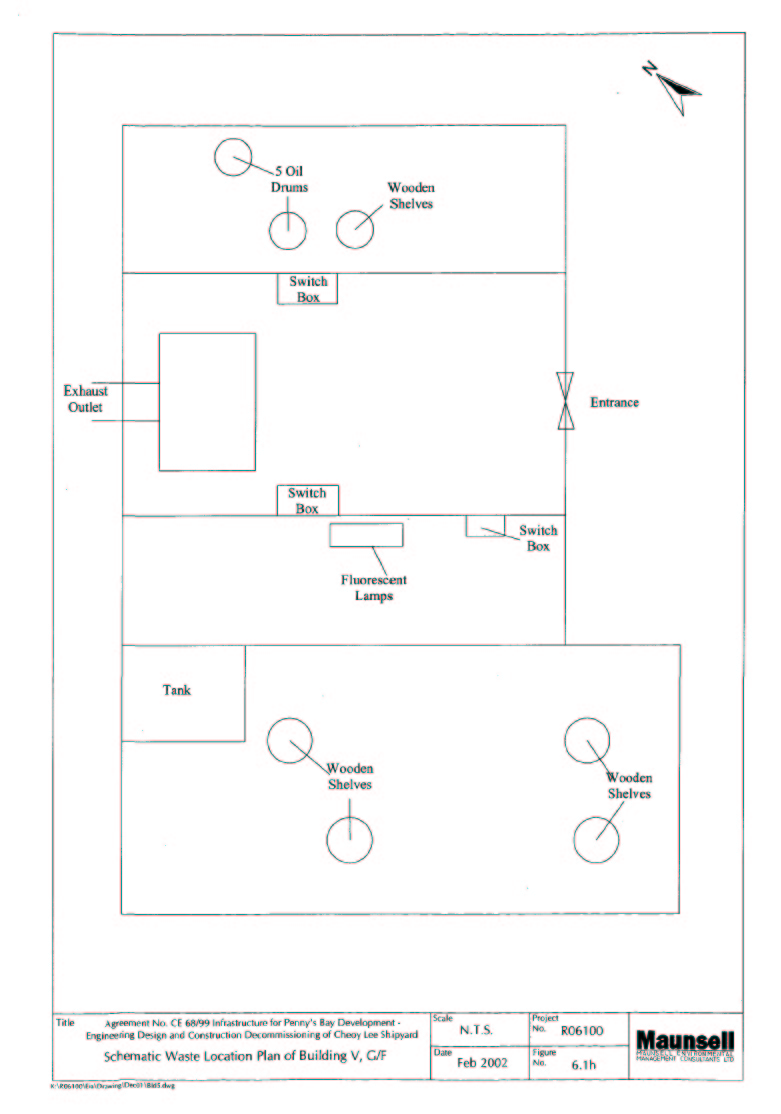
Figure 6.1h Schematic Waste location Plan of Building V, G/F
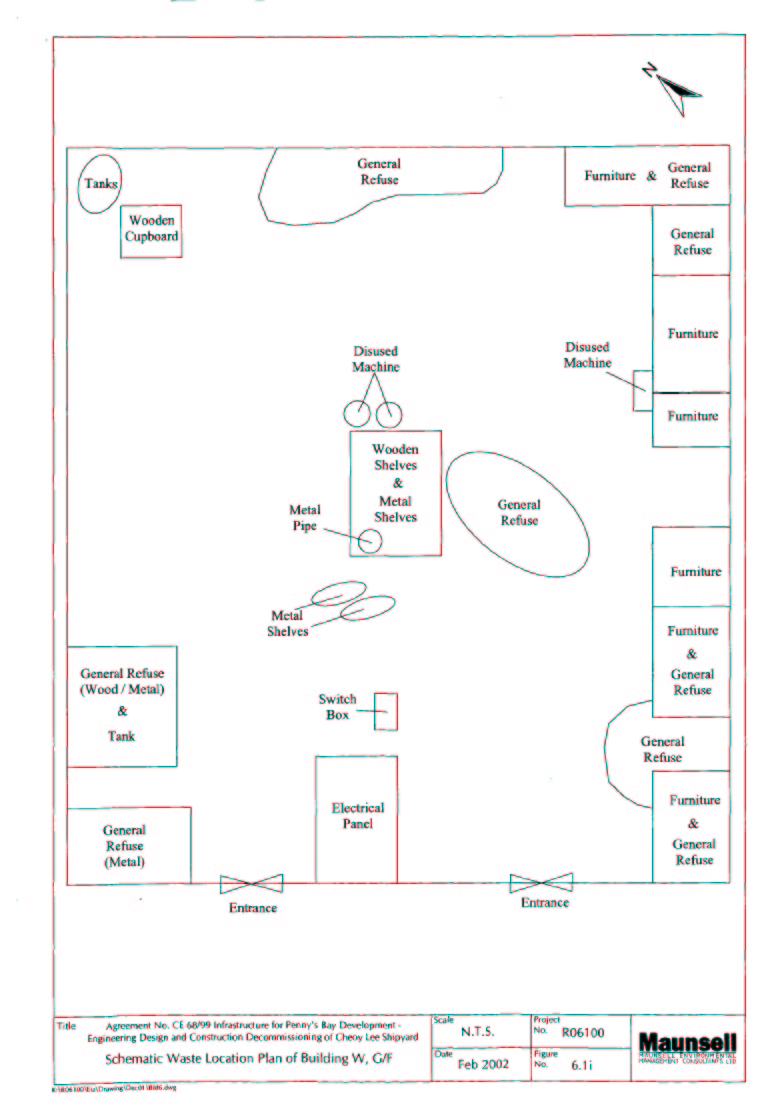
Figure 6.1i Schematic Waste location Plan of Building W, G/F
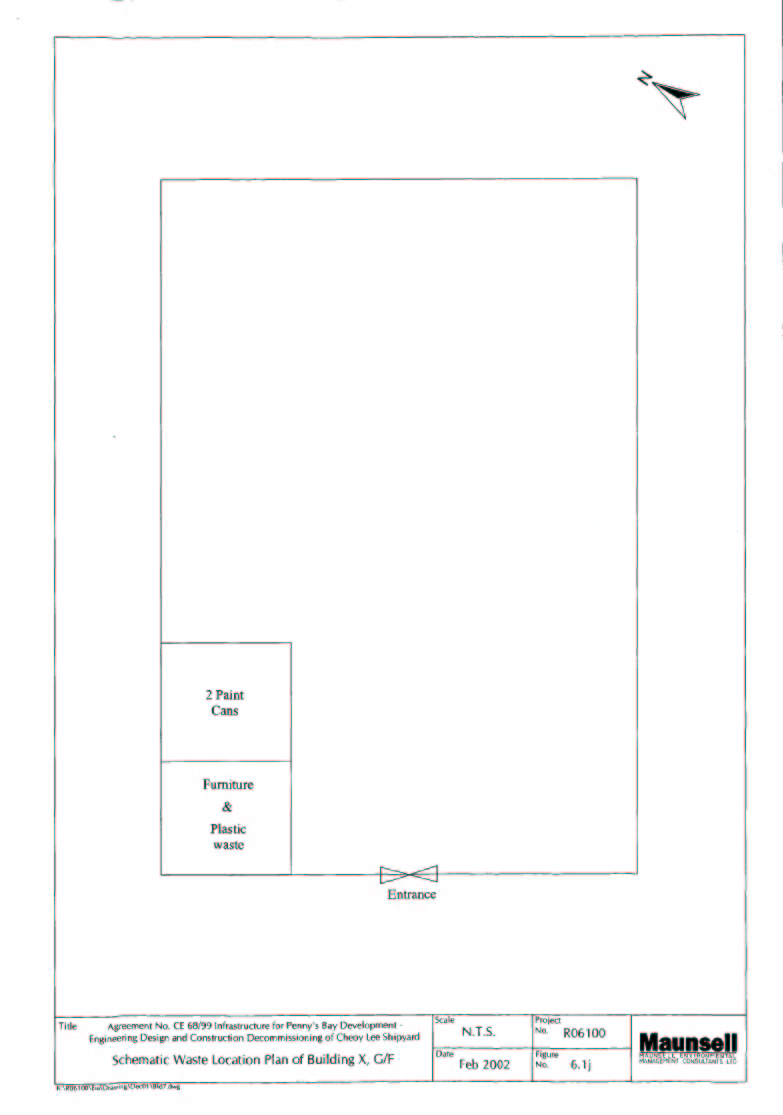
Figure 6.1j Schematic Waste location Plan of Building X, G/F
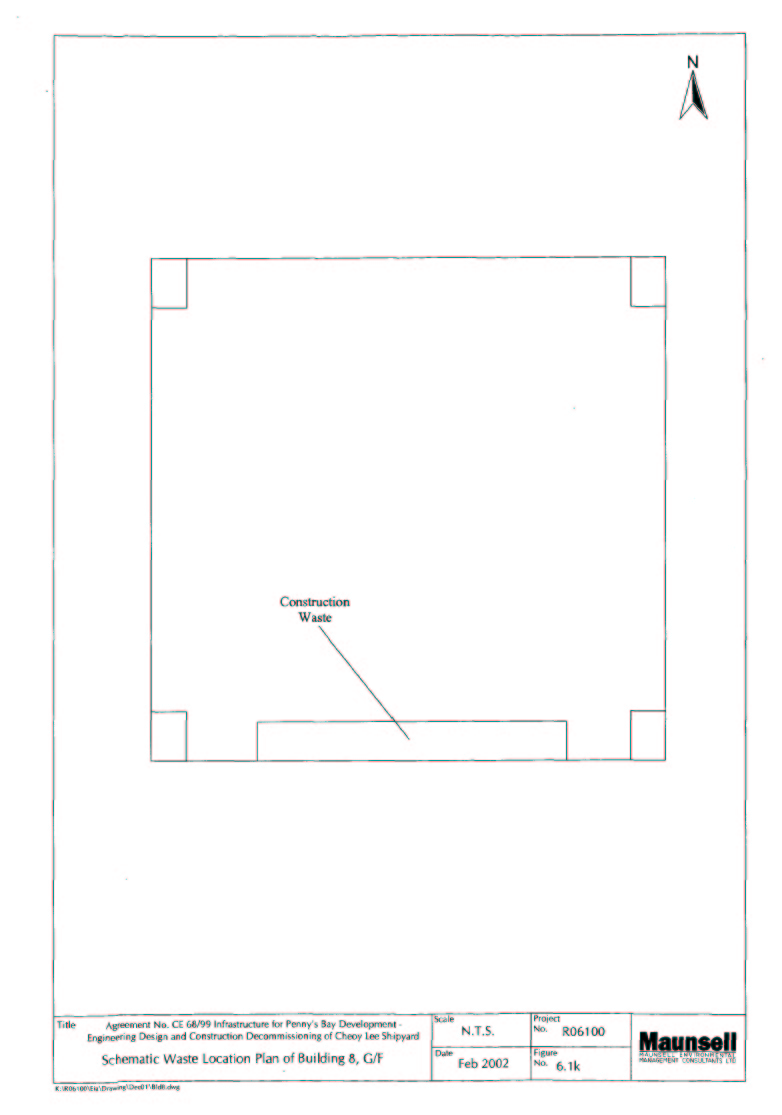
Figure 6.1k Schematic Waste location Plan of Building 8, G/F
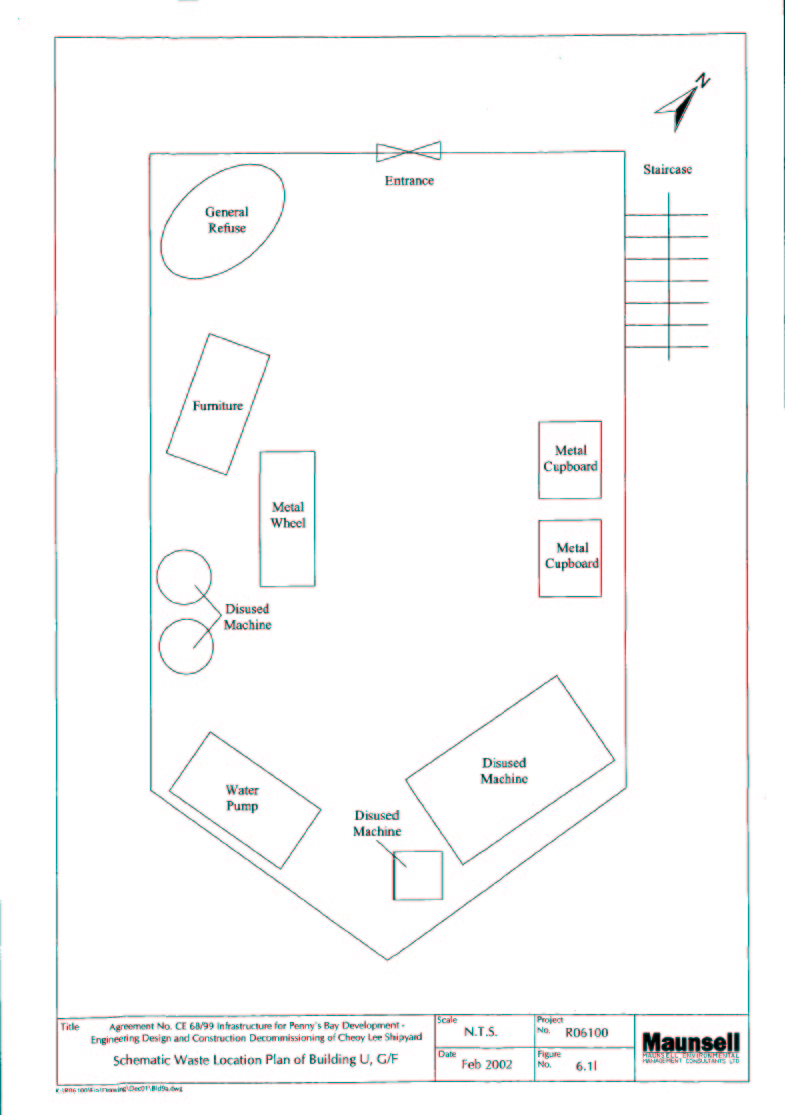
Figure 6.1l Schematic Waste location Plan of Building U, G/F
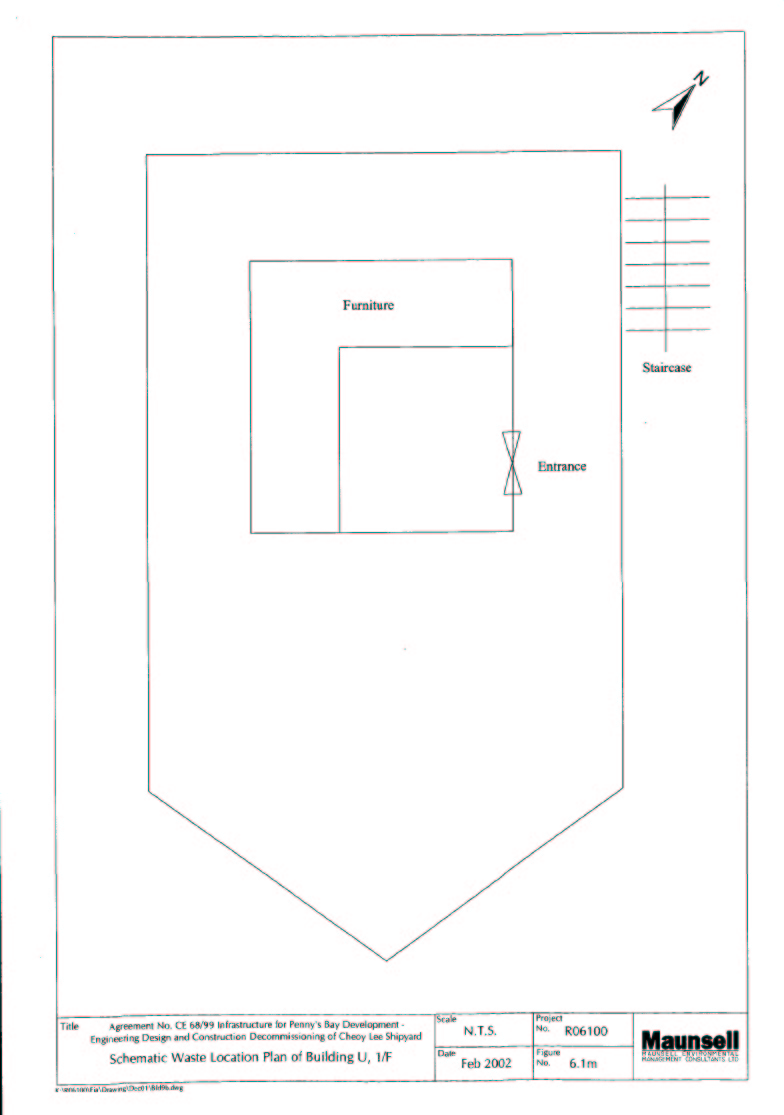
Figure 6.1m Schematic Waste location Plan of Building U, 1/F
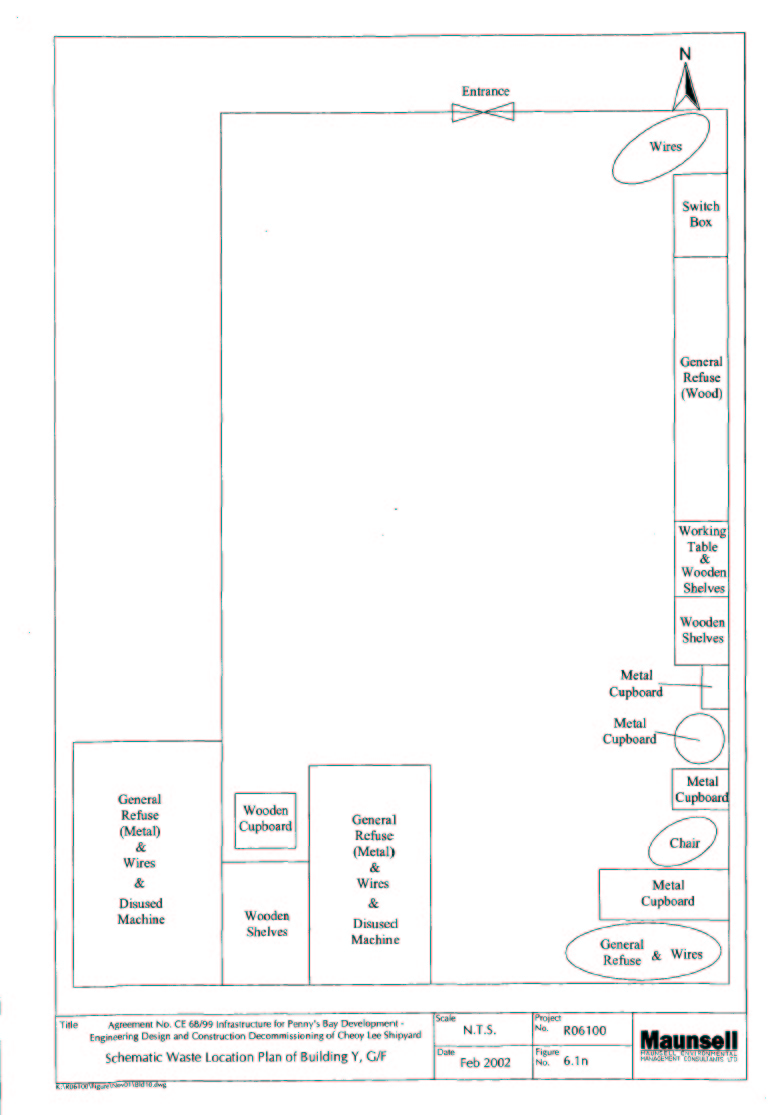
Figure 6.1n Schematic Waste location Plan of Building Y, G/F
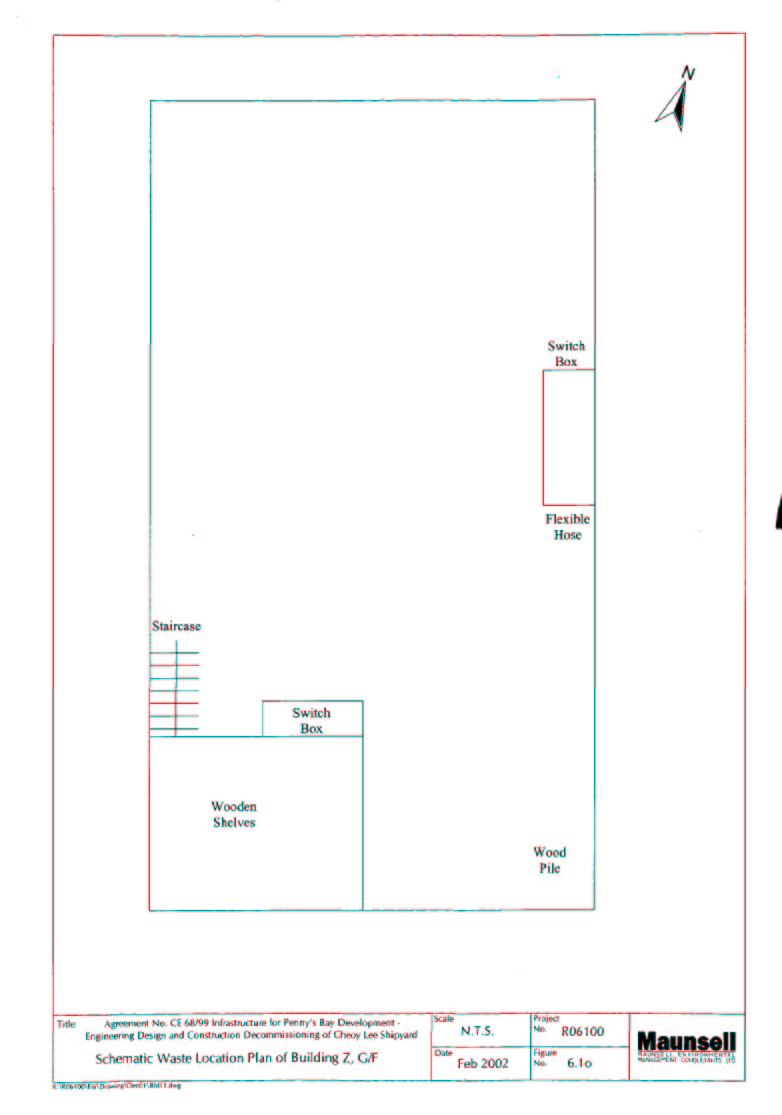
Figure 6.1o Schematic Waste location Plan of Building Z, G/F
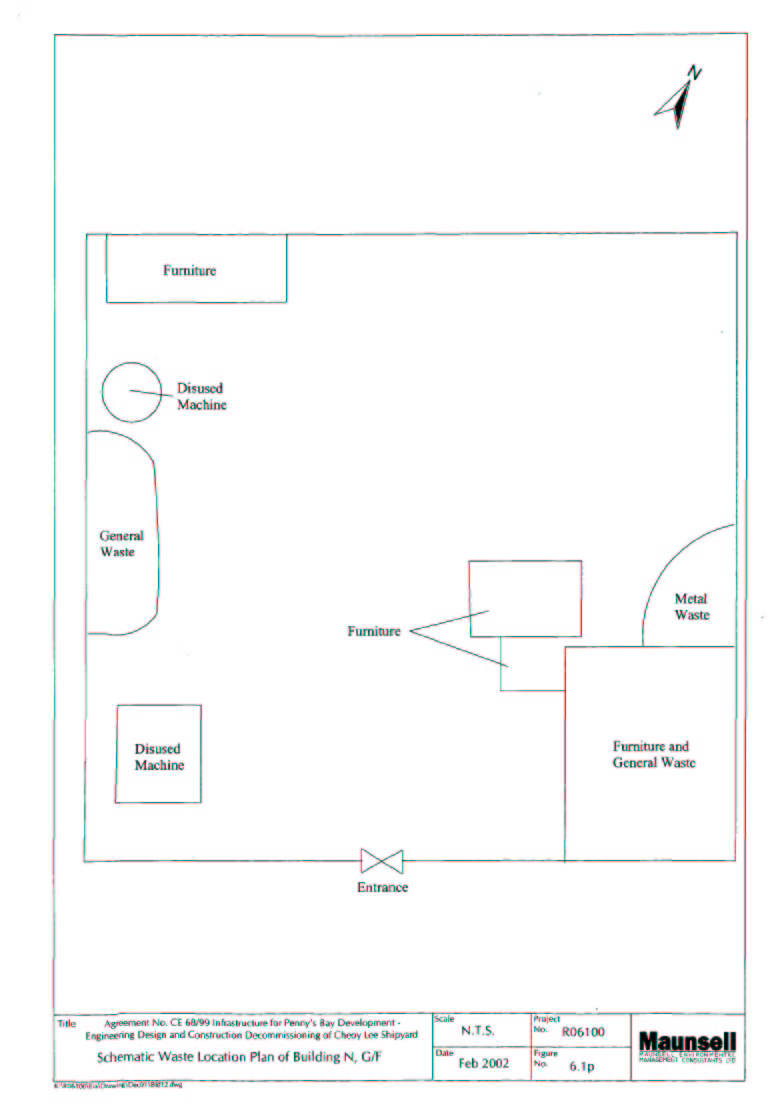
Figure 6.1p Schematic Waste location Plan of Building N, G/F
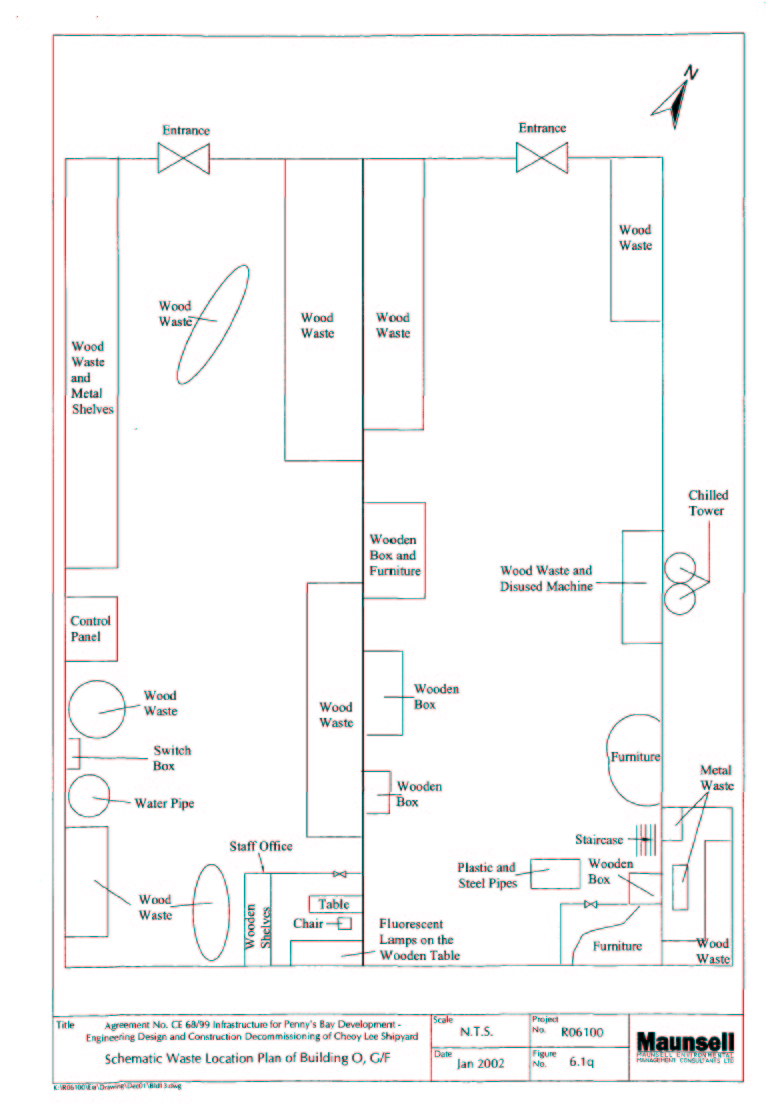
Figure 6.1q Schematic Waste location Plan of Building O, G/F
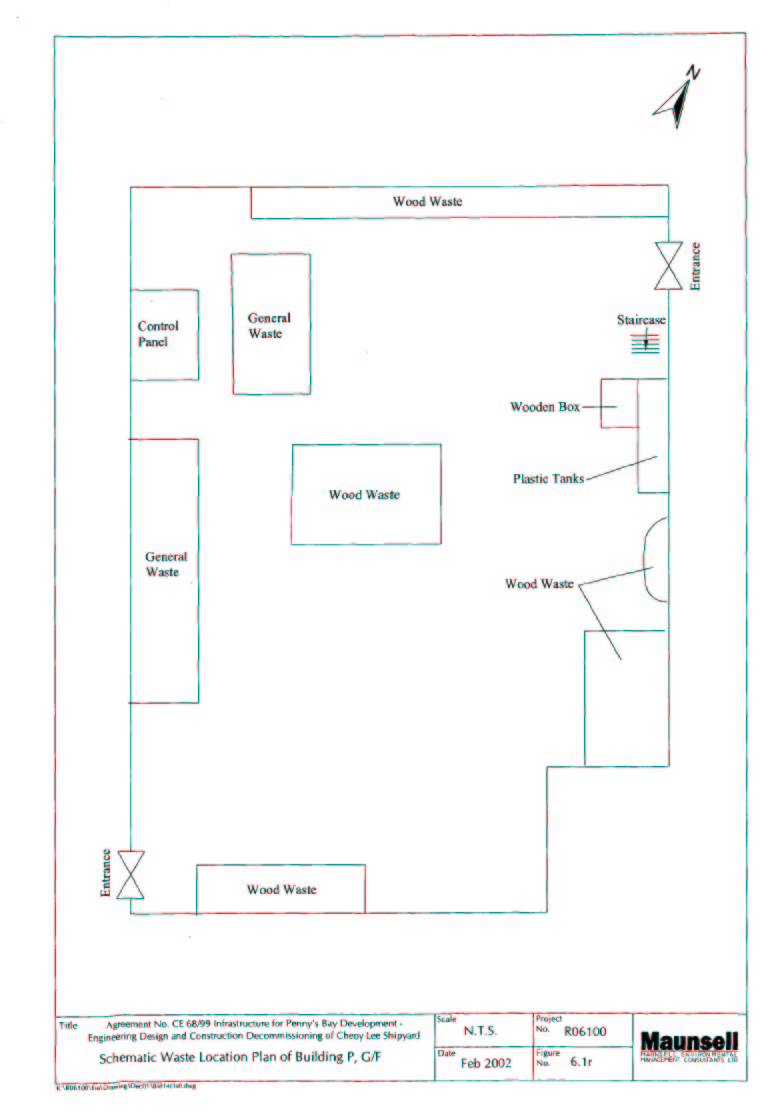
Figure 6.1r Schematic Waste location Plan of Building P, G/F
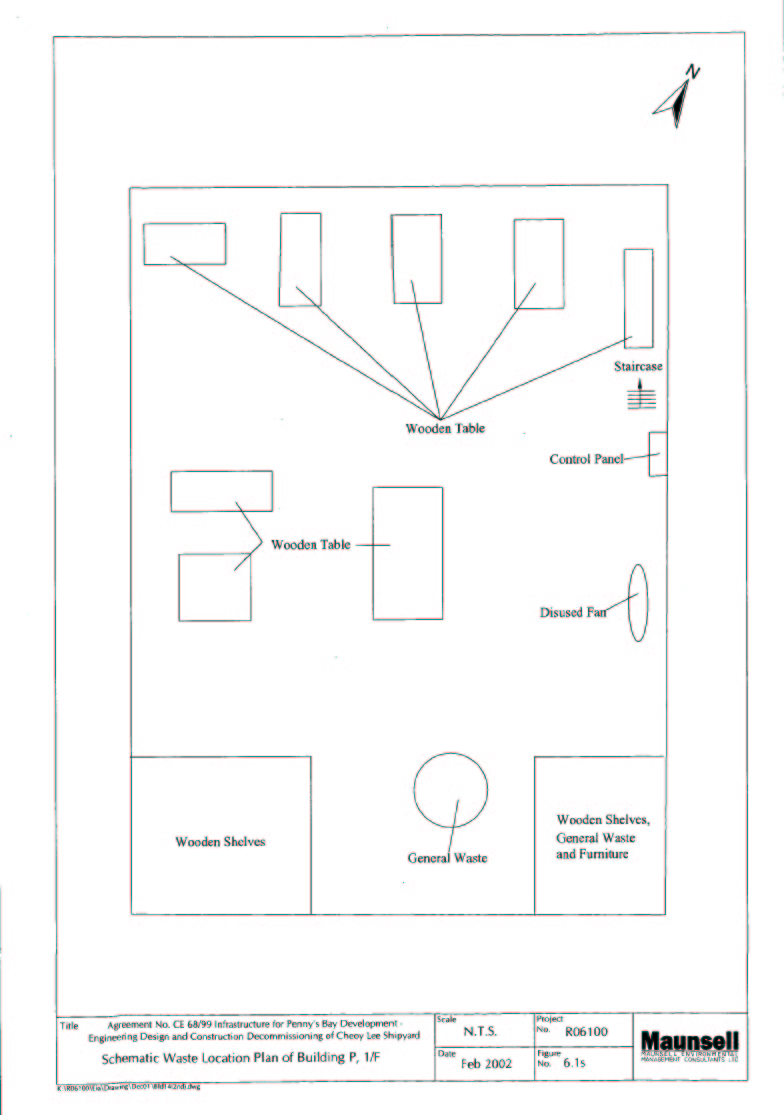
Figure 6.1s Schematic Waste location Plan of Building P, 1/F
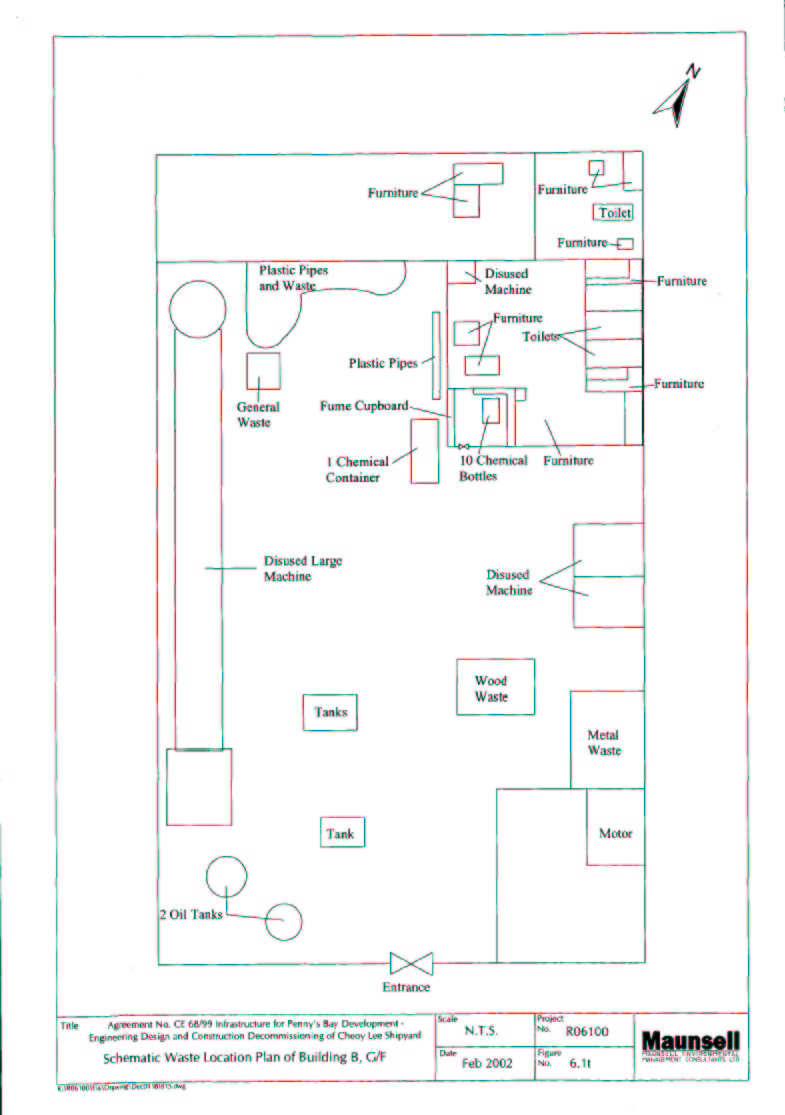
Figure 6.1t Schematic Waste location Plan of Building B, G/F
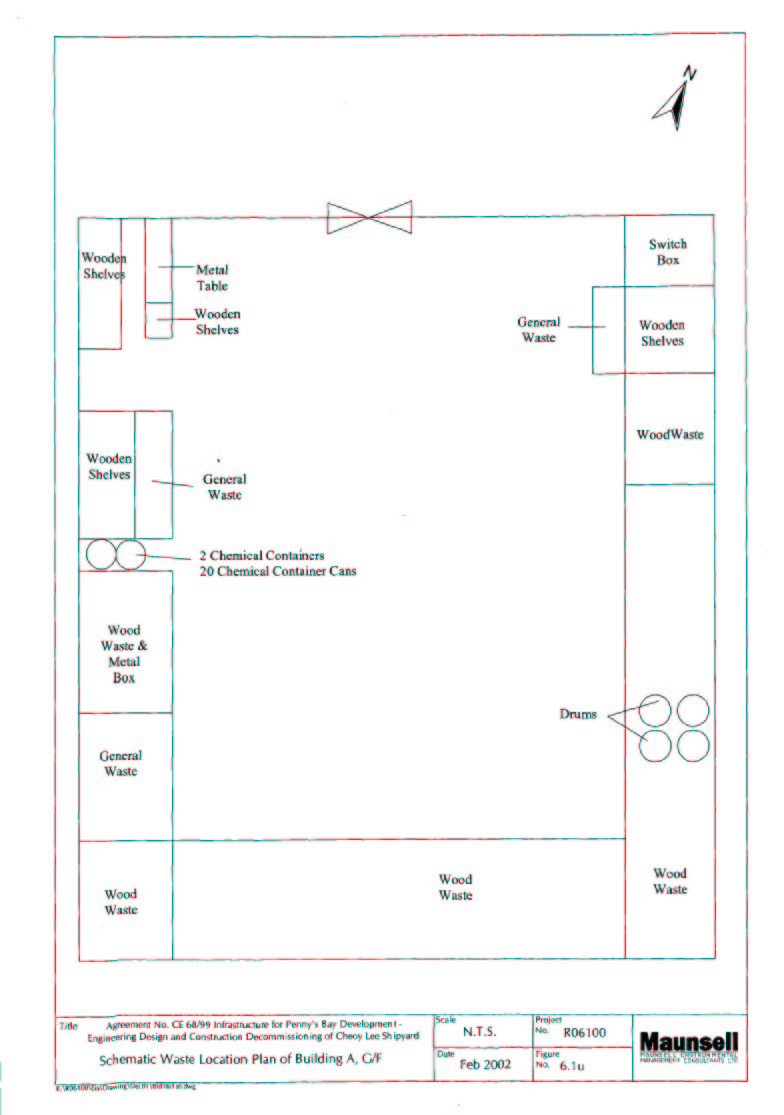
Figure 6.1u Schematic Waste location Plan of Building A, G/F
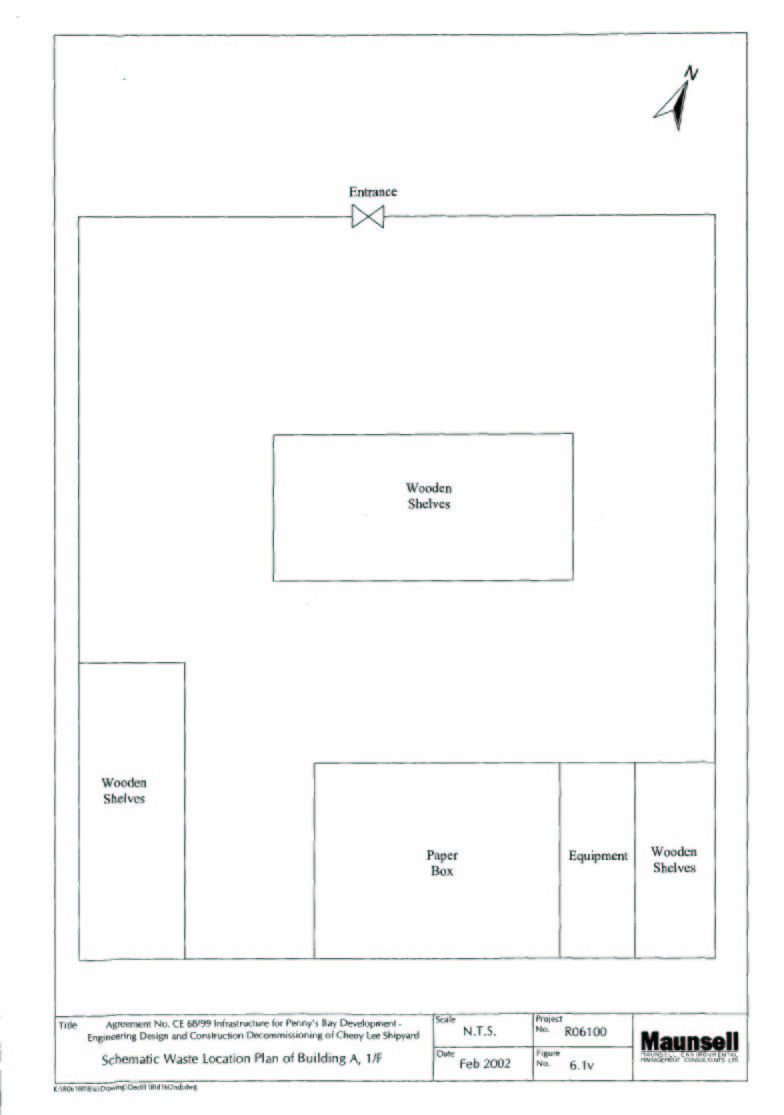
Figure 6.1v Schematic Waste location Plan of Building A, 1/F
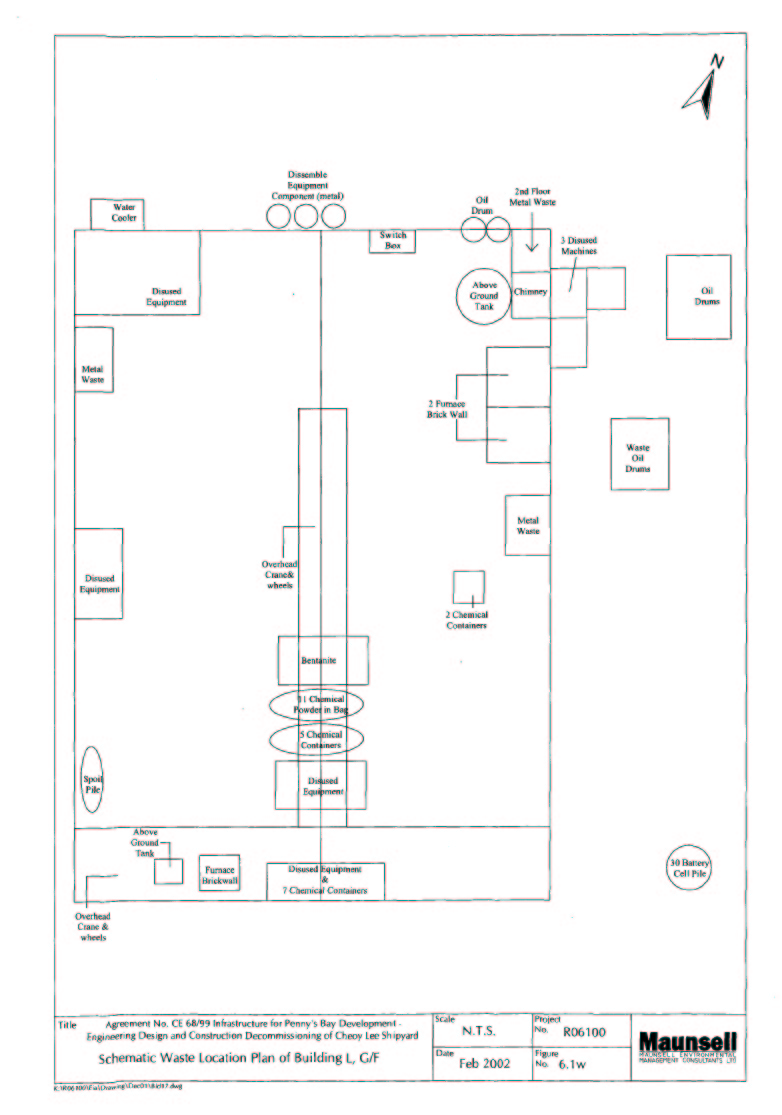
Figure 6.1w Schematic Waste location Plan of Building L, G/F
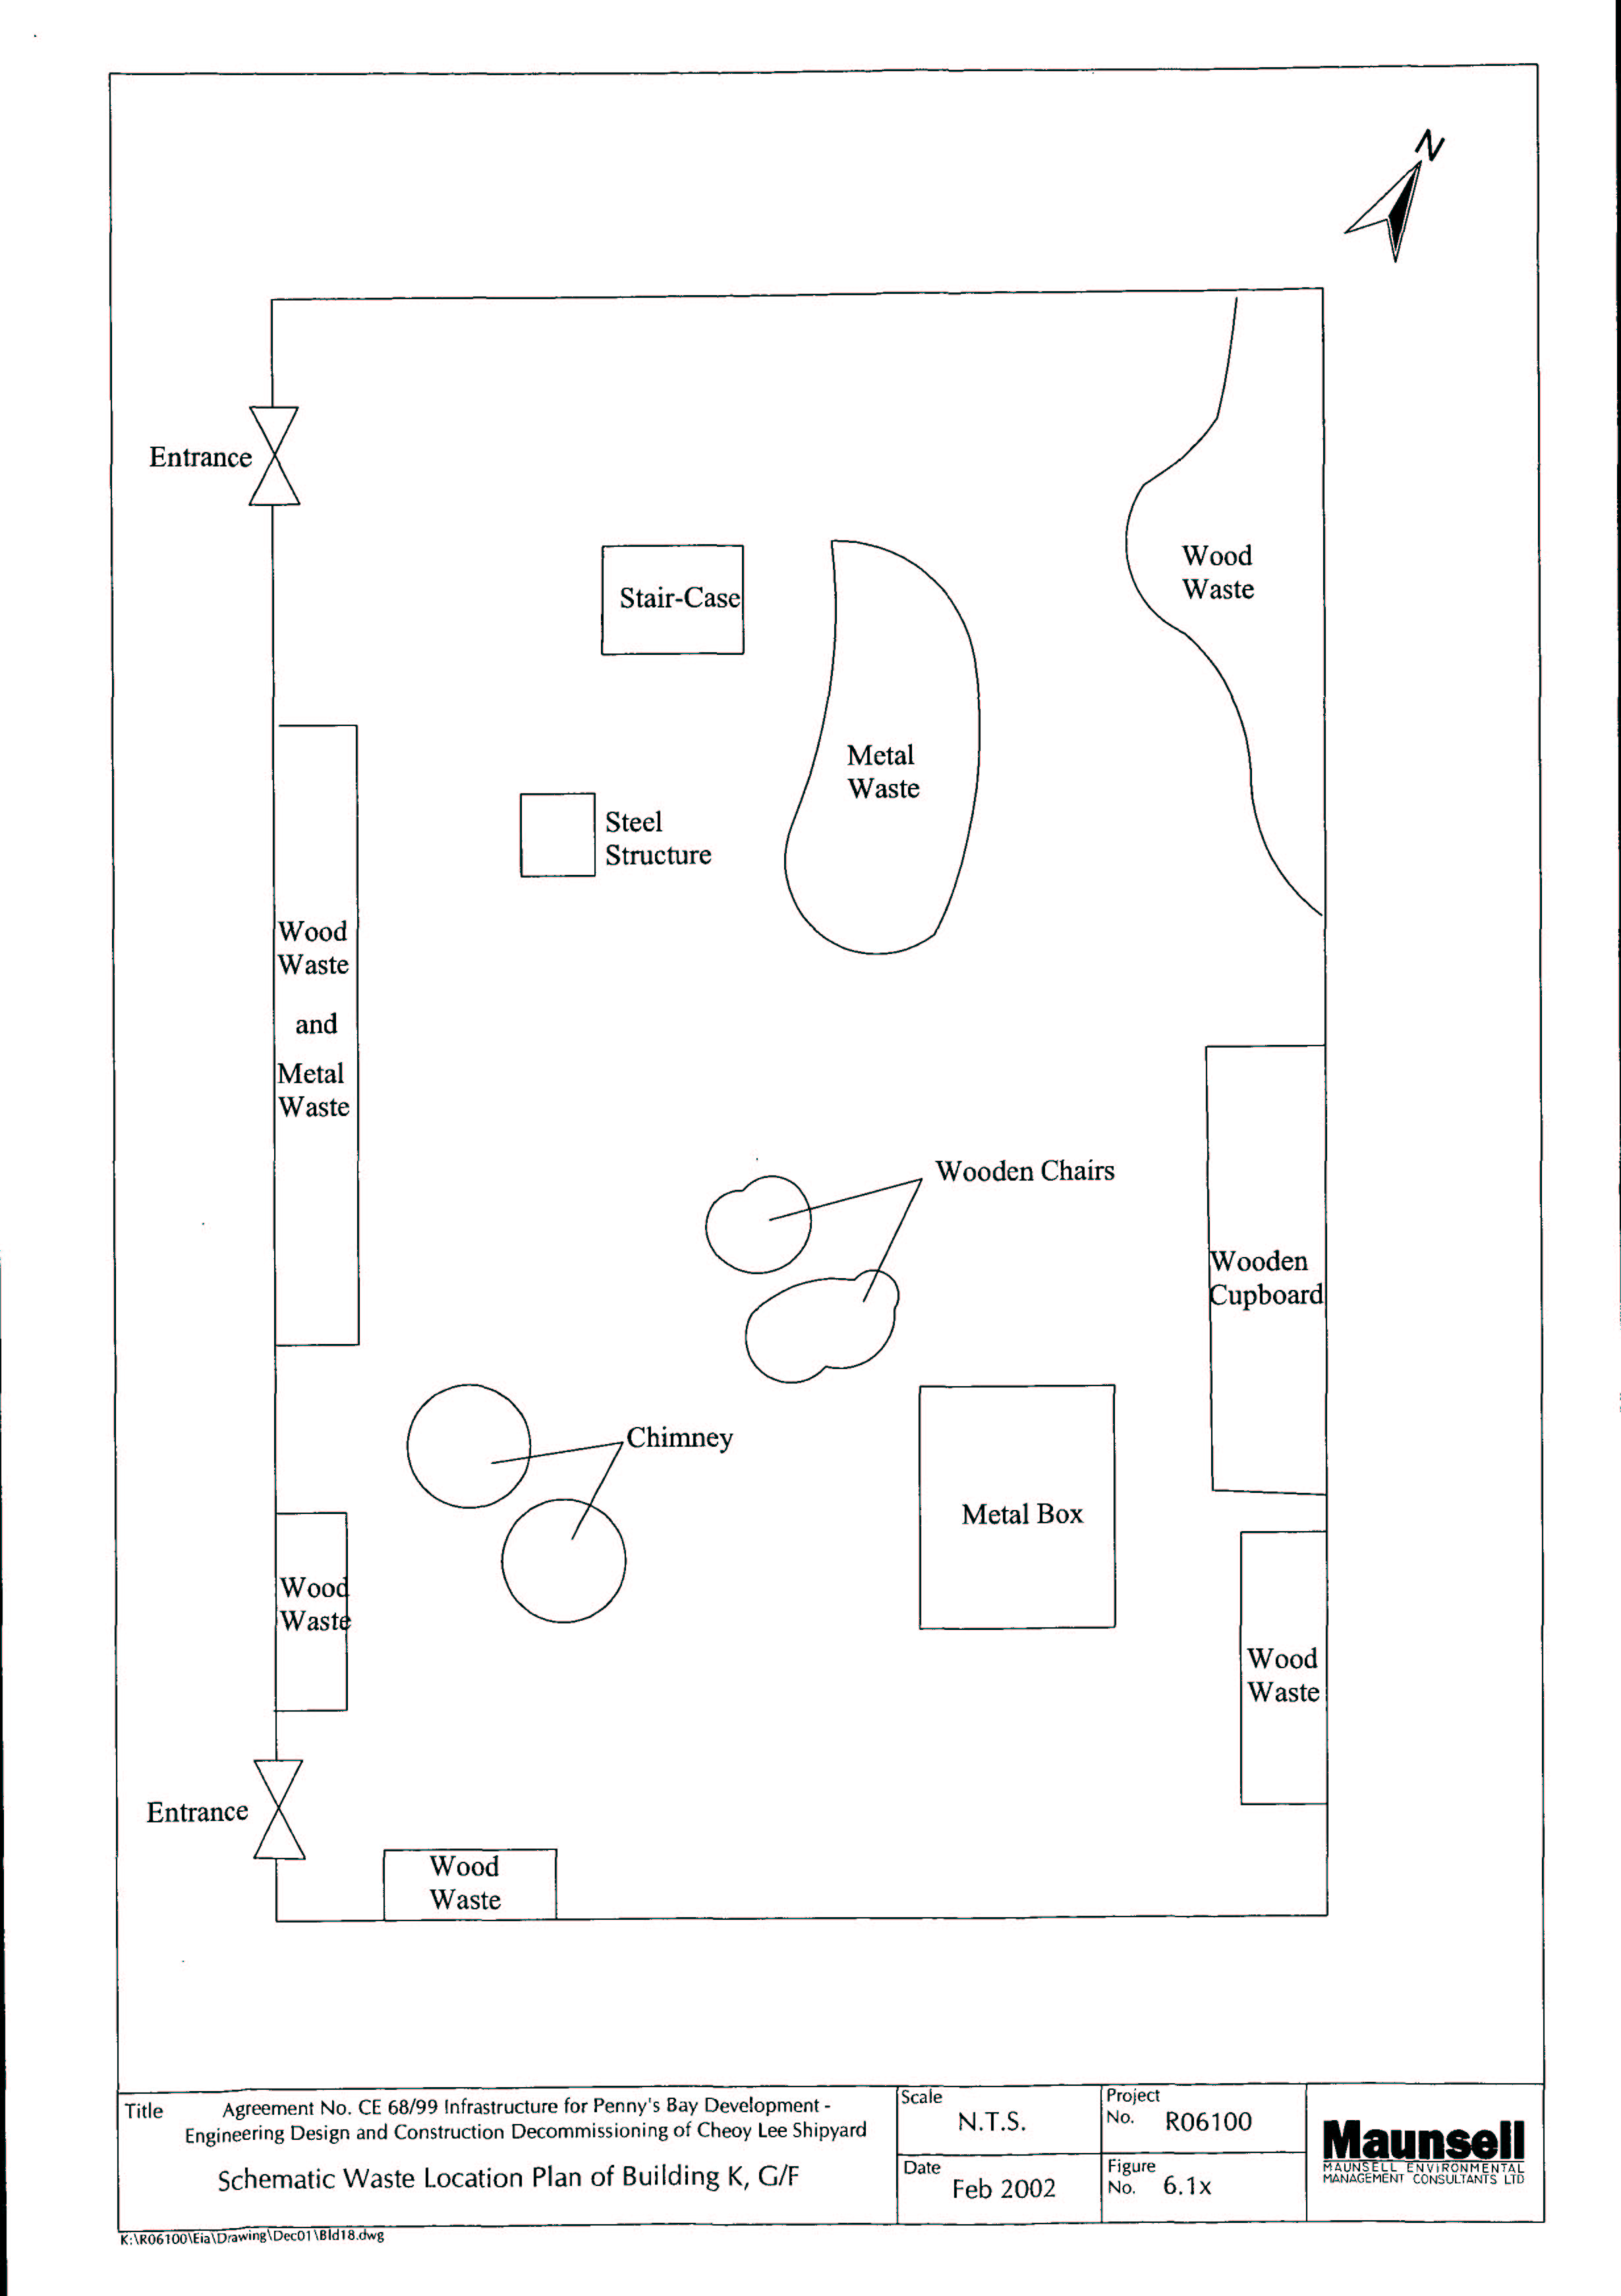
Figure 6.1x Schematic Waste location Plan of Building K, G/F
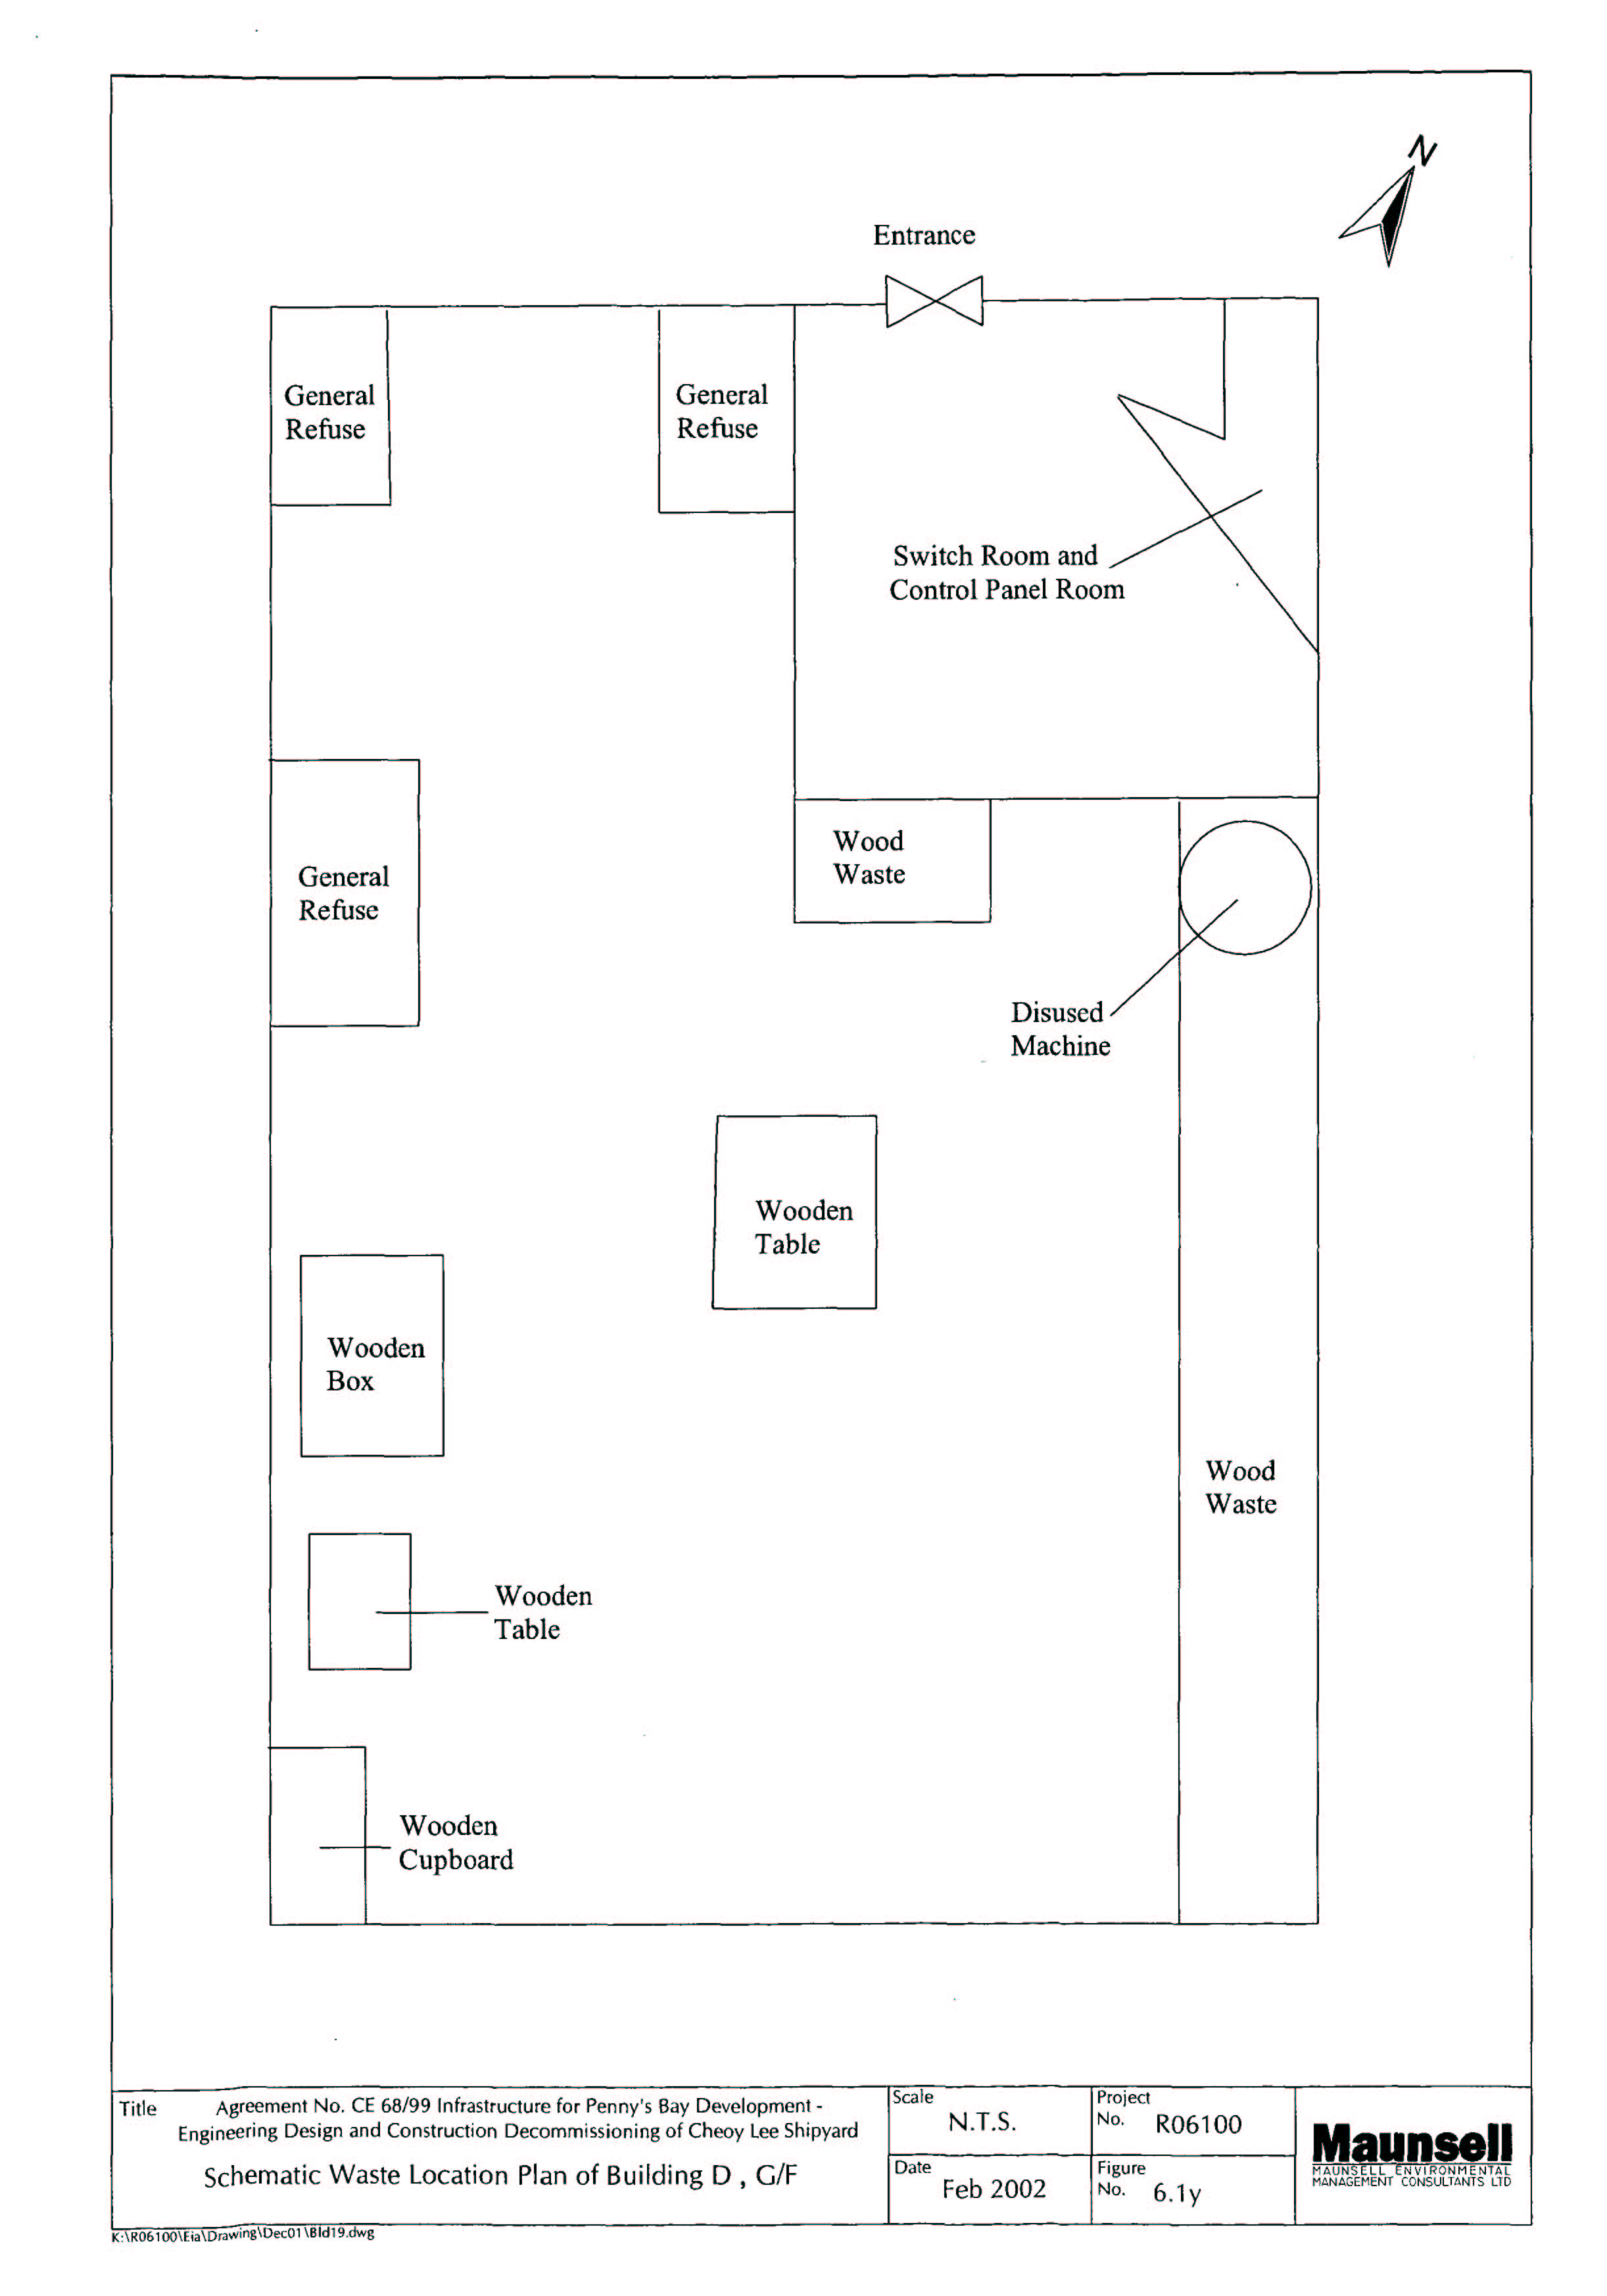
Figure 6.1y Schematic Waste location Plan of Building D, G/F
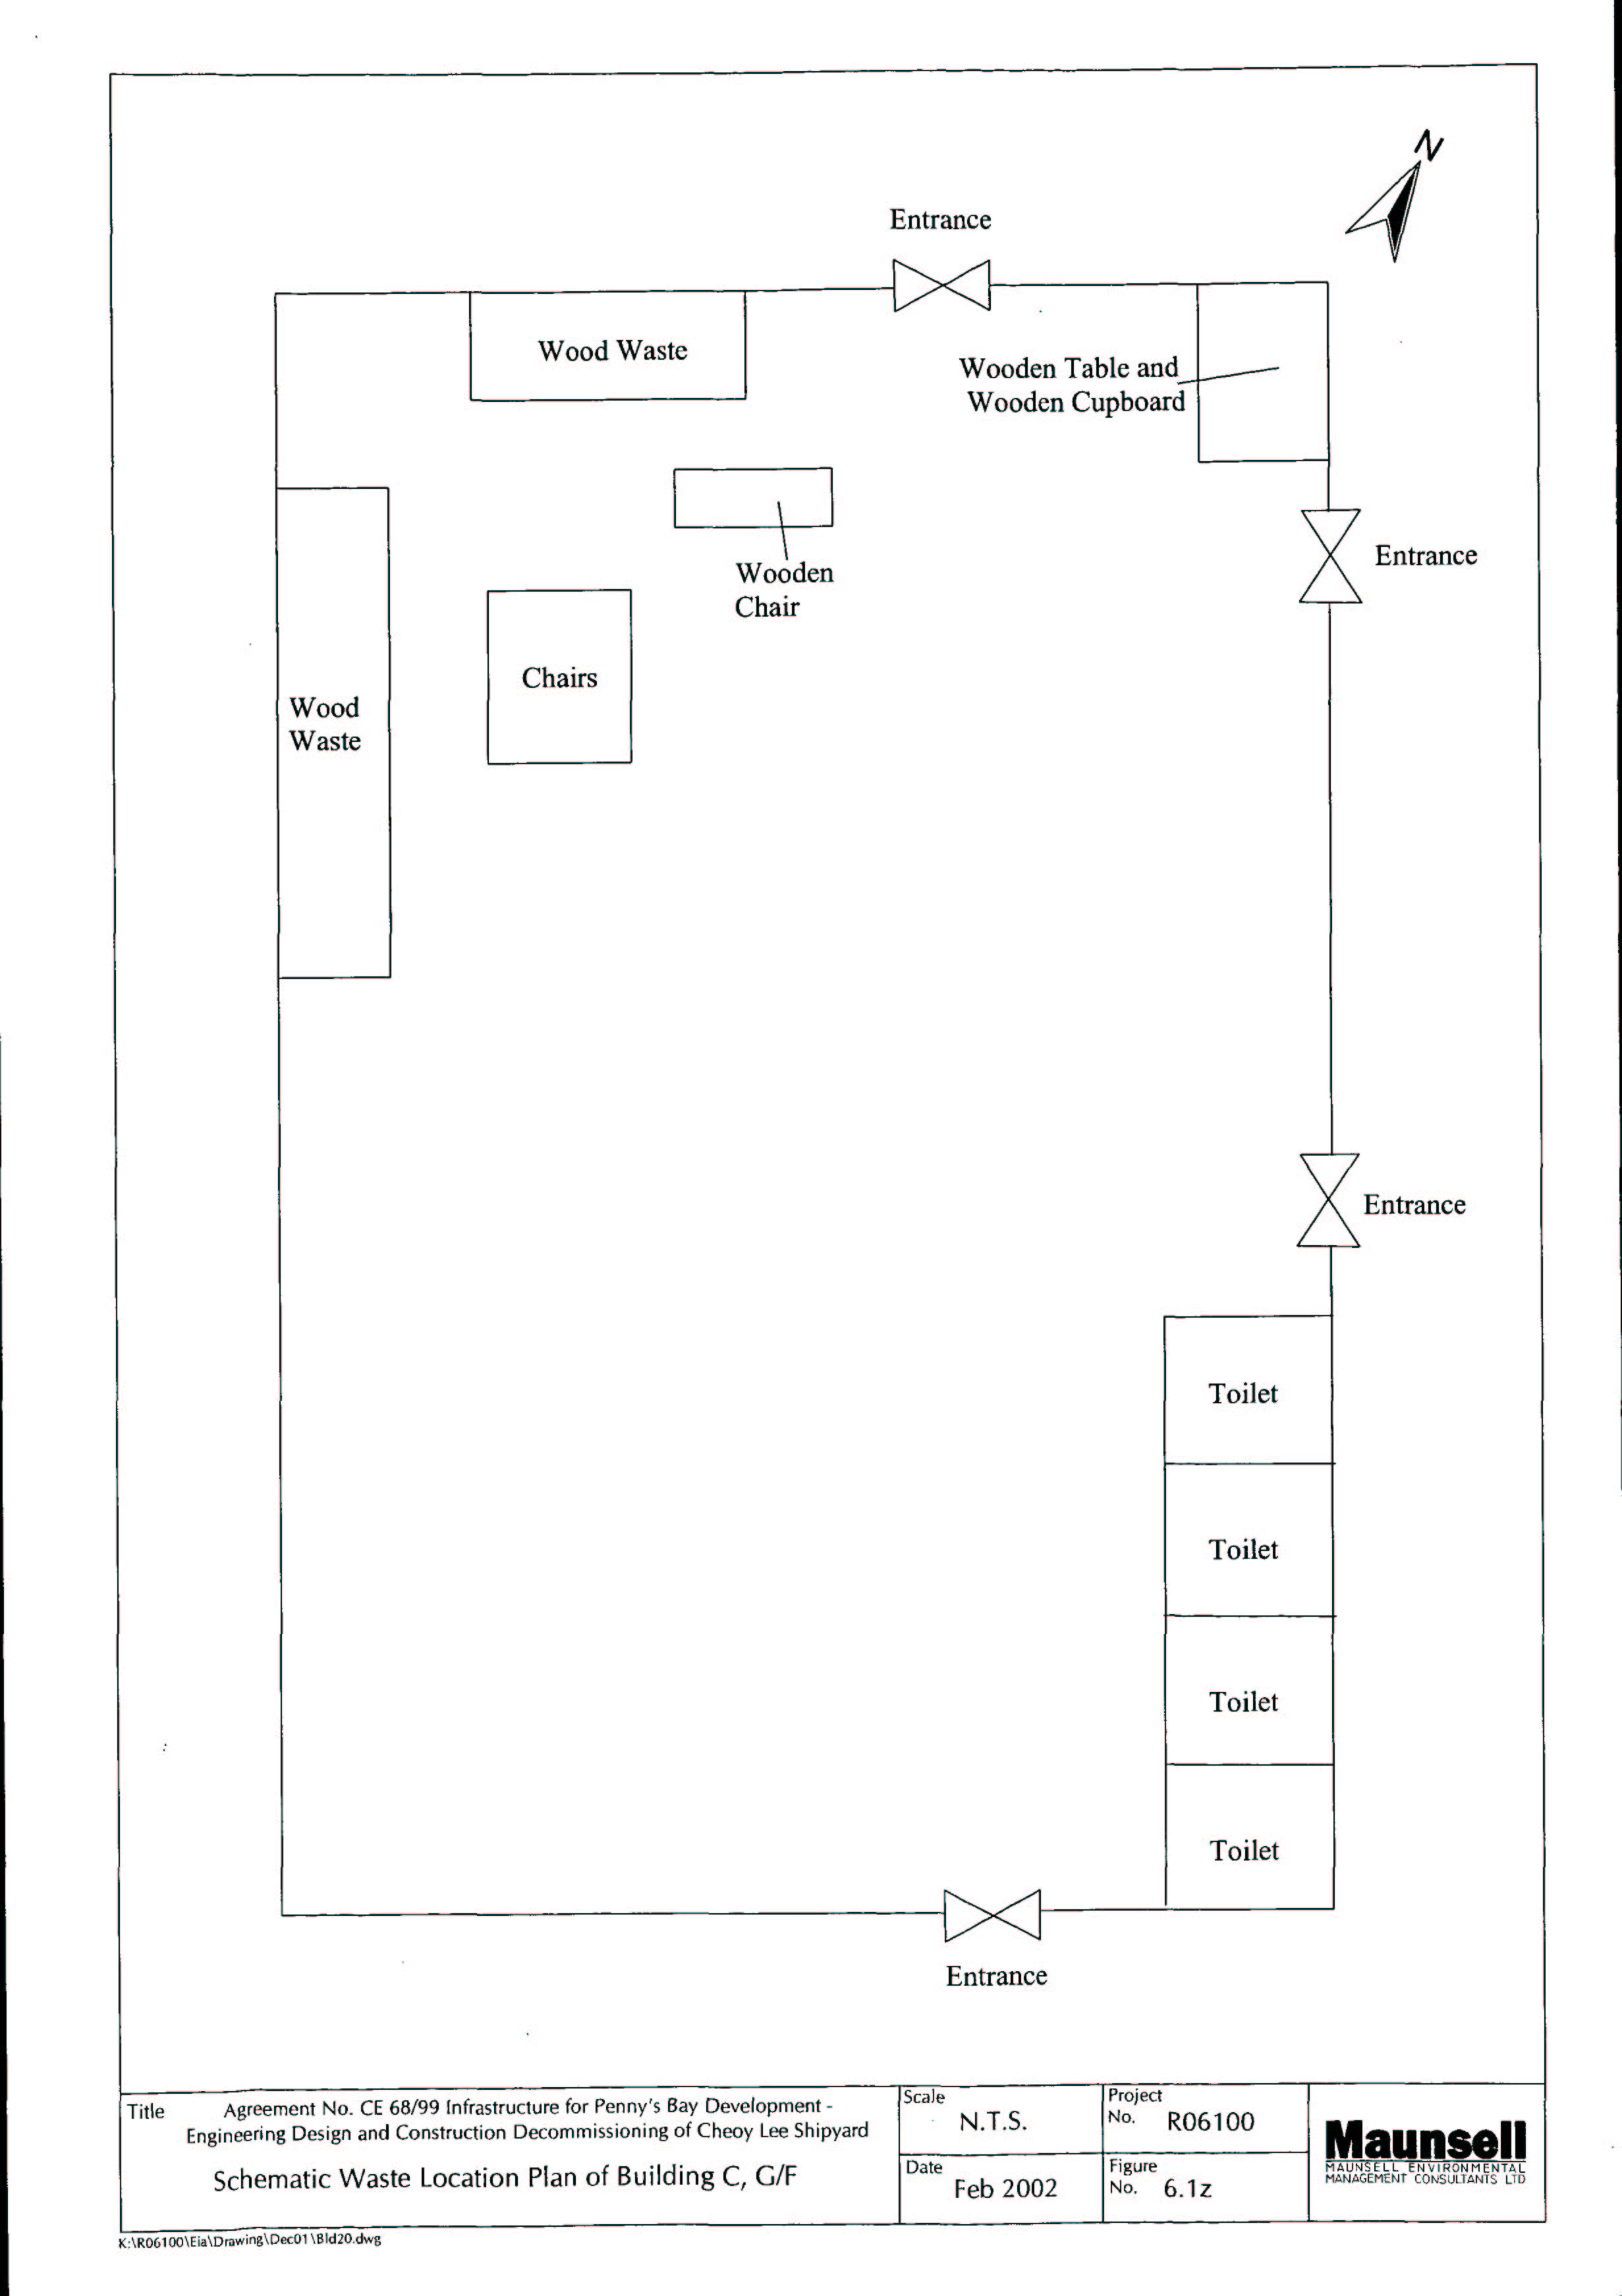
Figure 6.1z Schematic Waste location Plan of Building C, G/F
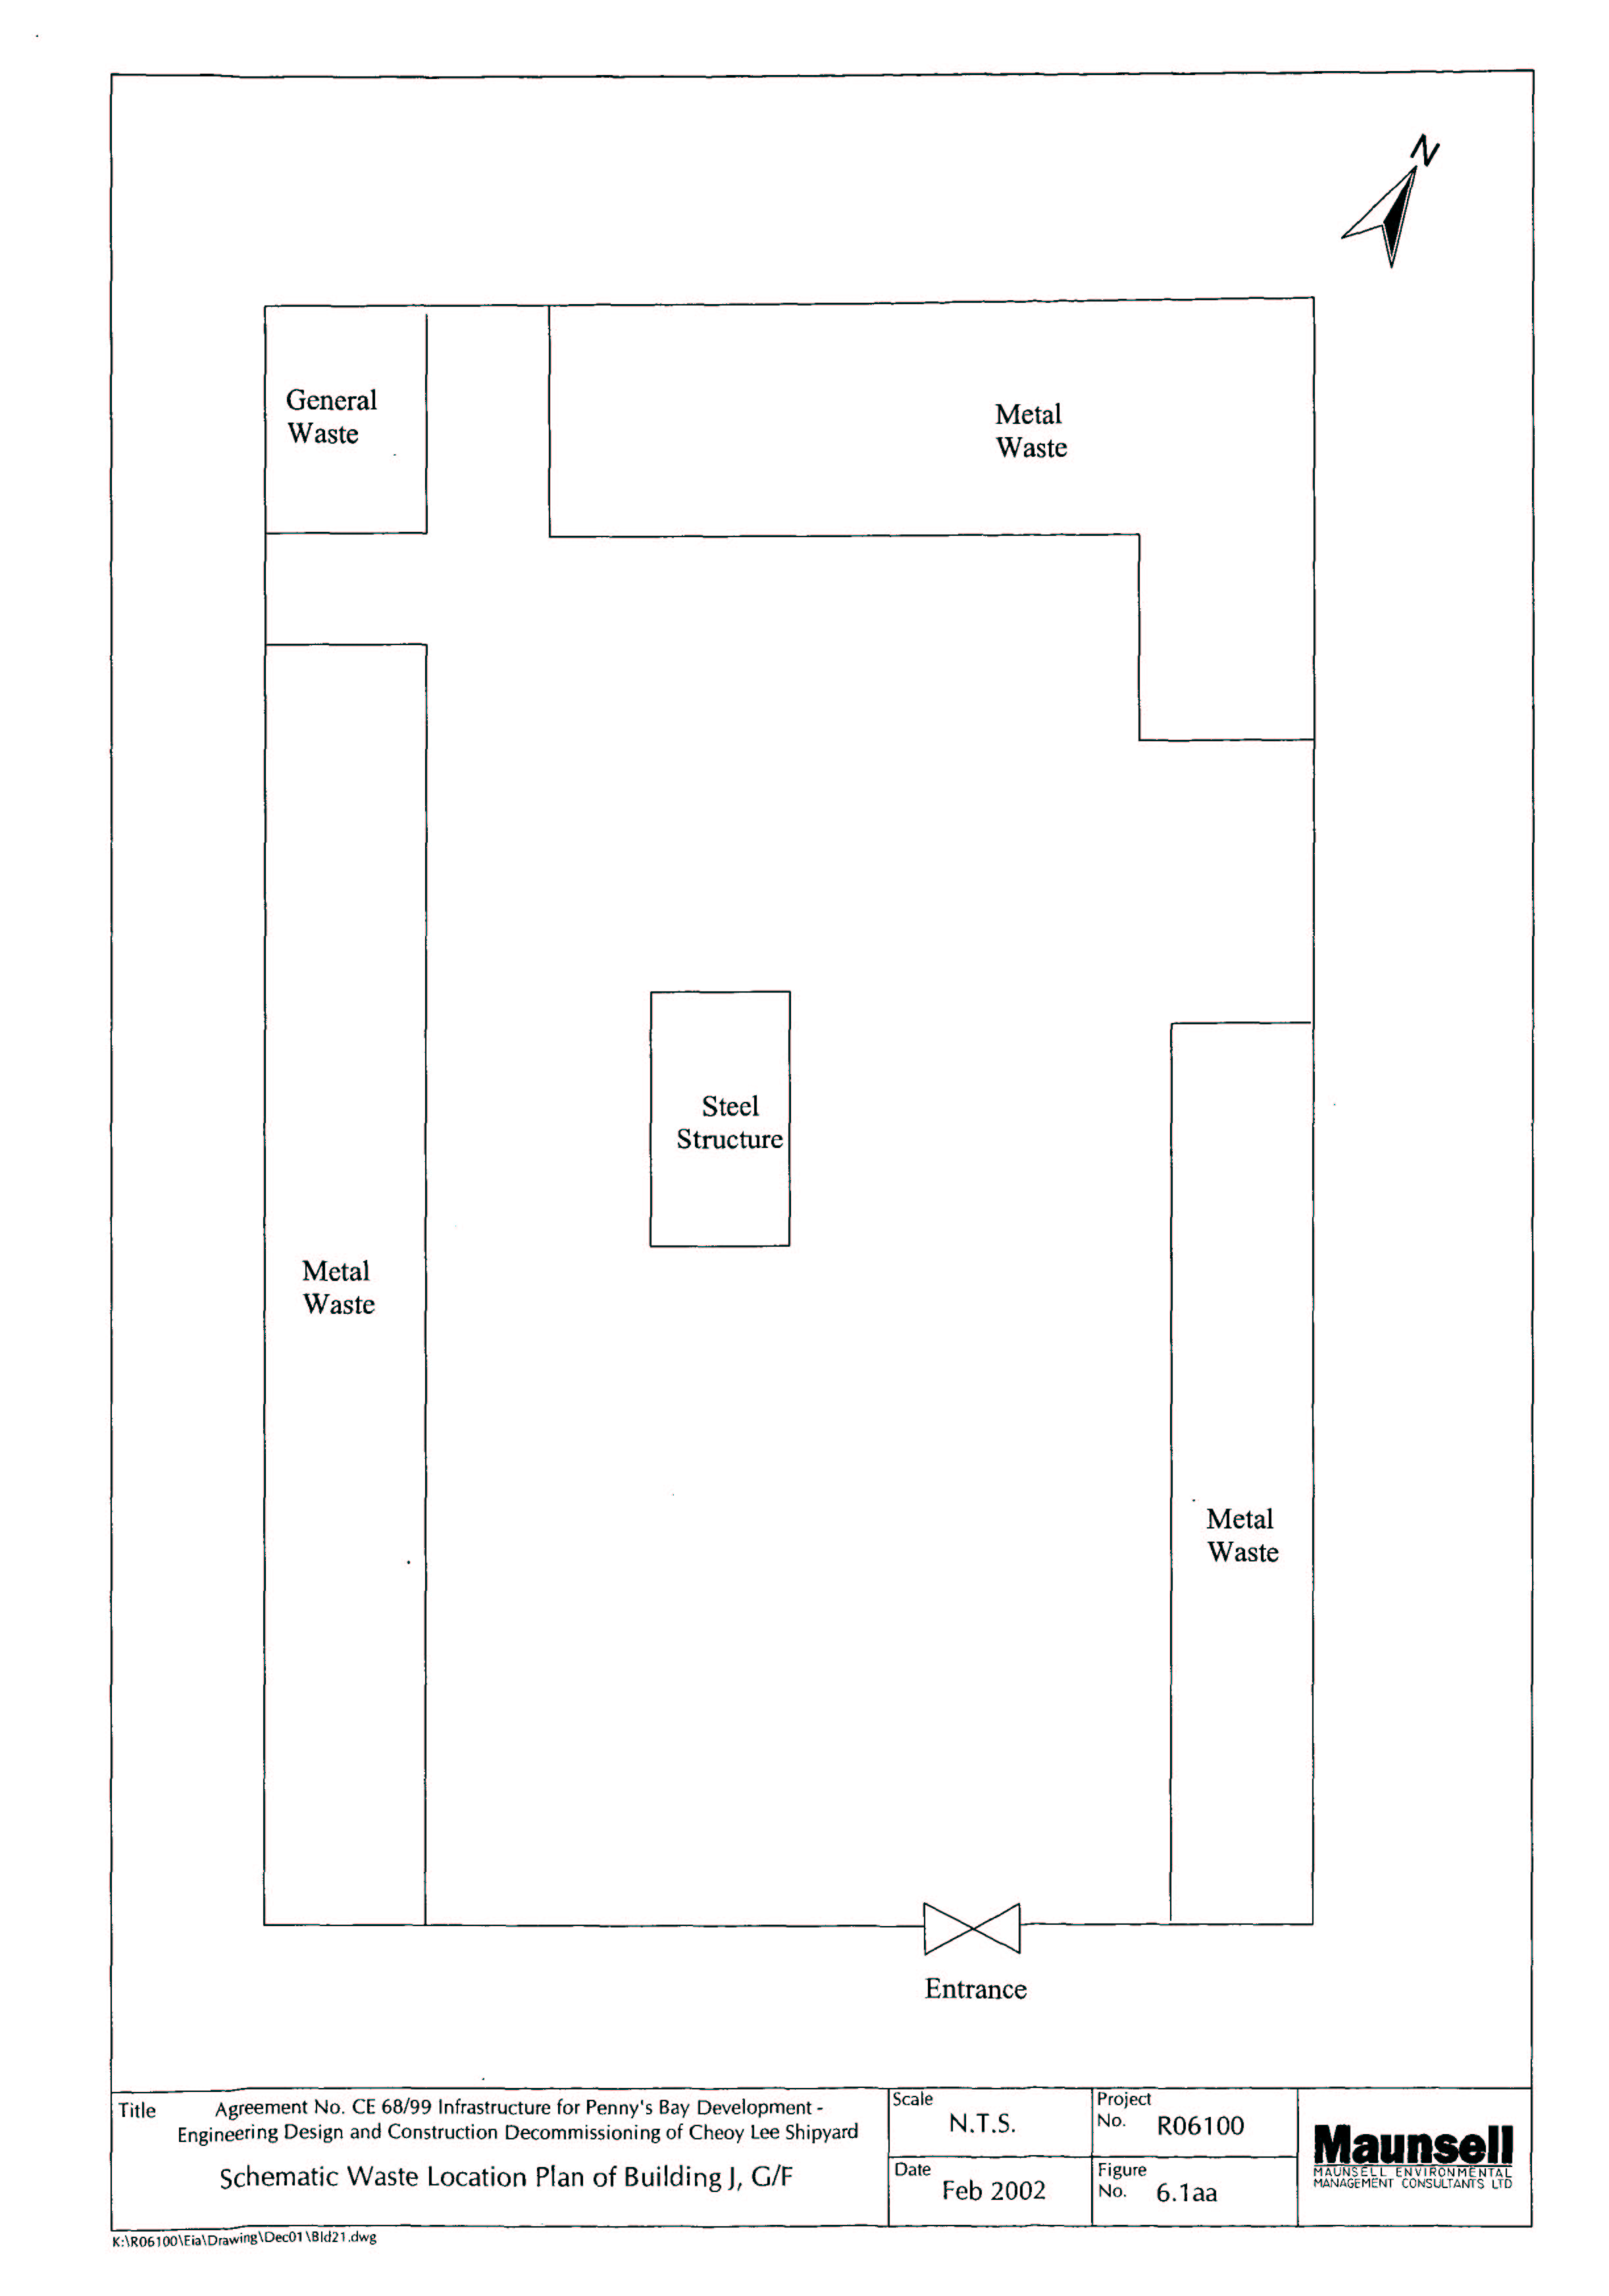
Figure 6.1aa Schematic Waste location Plan of Building J, G/F
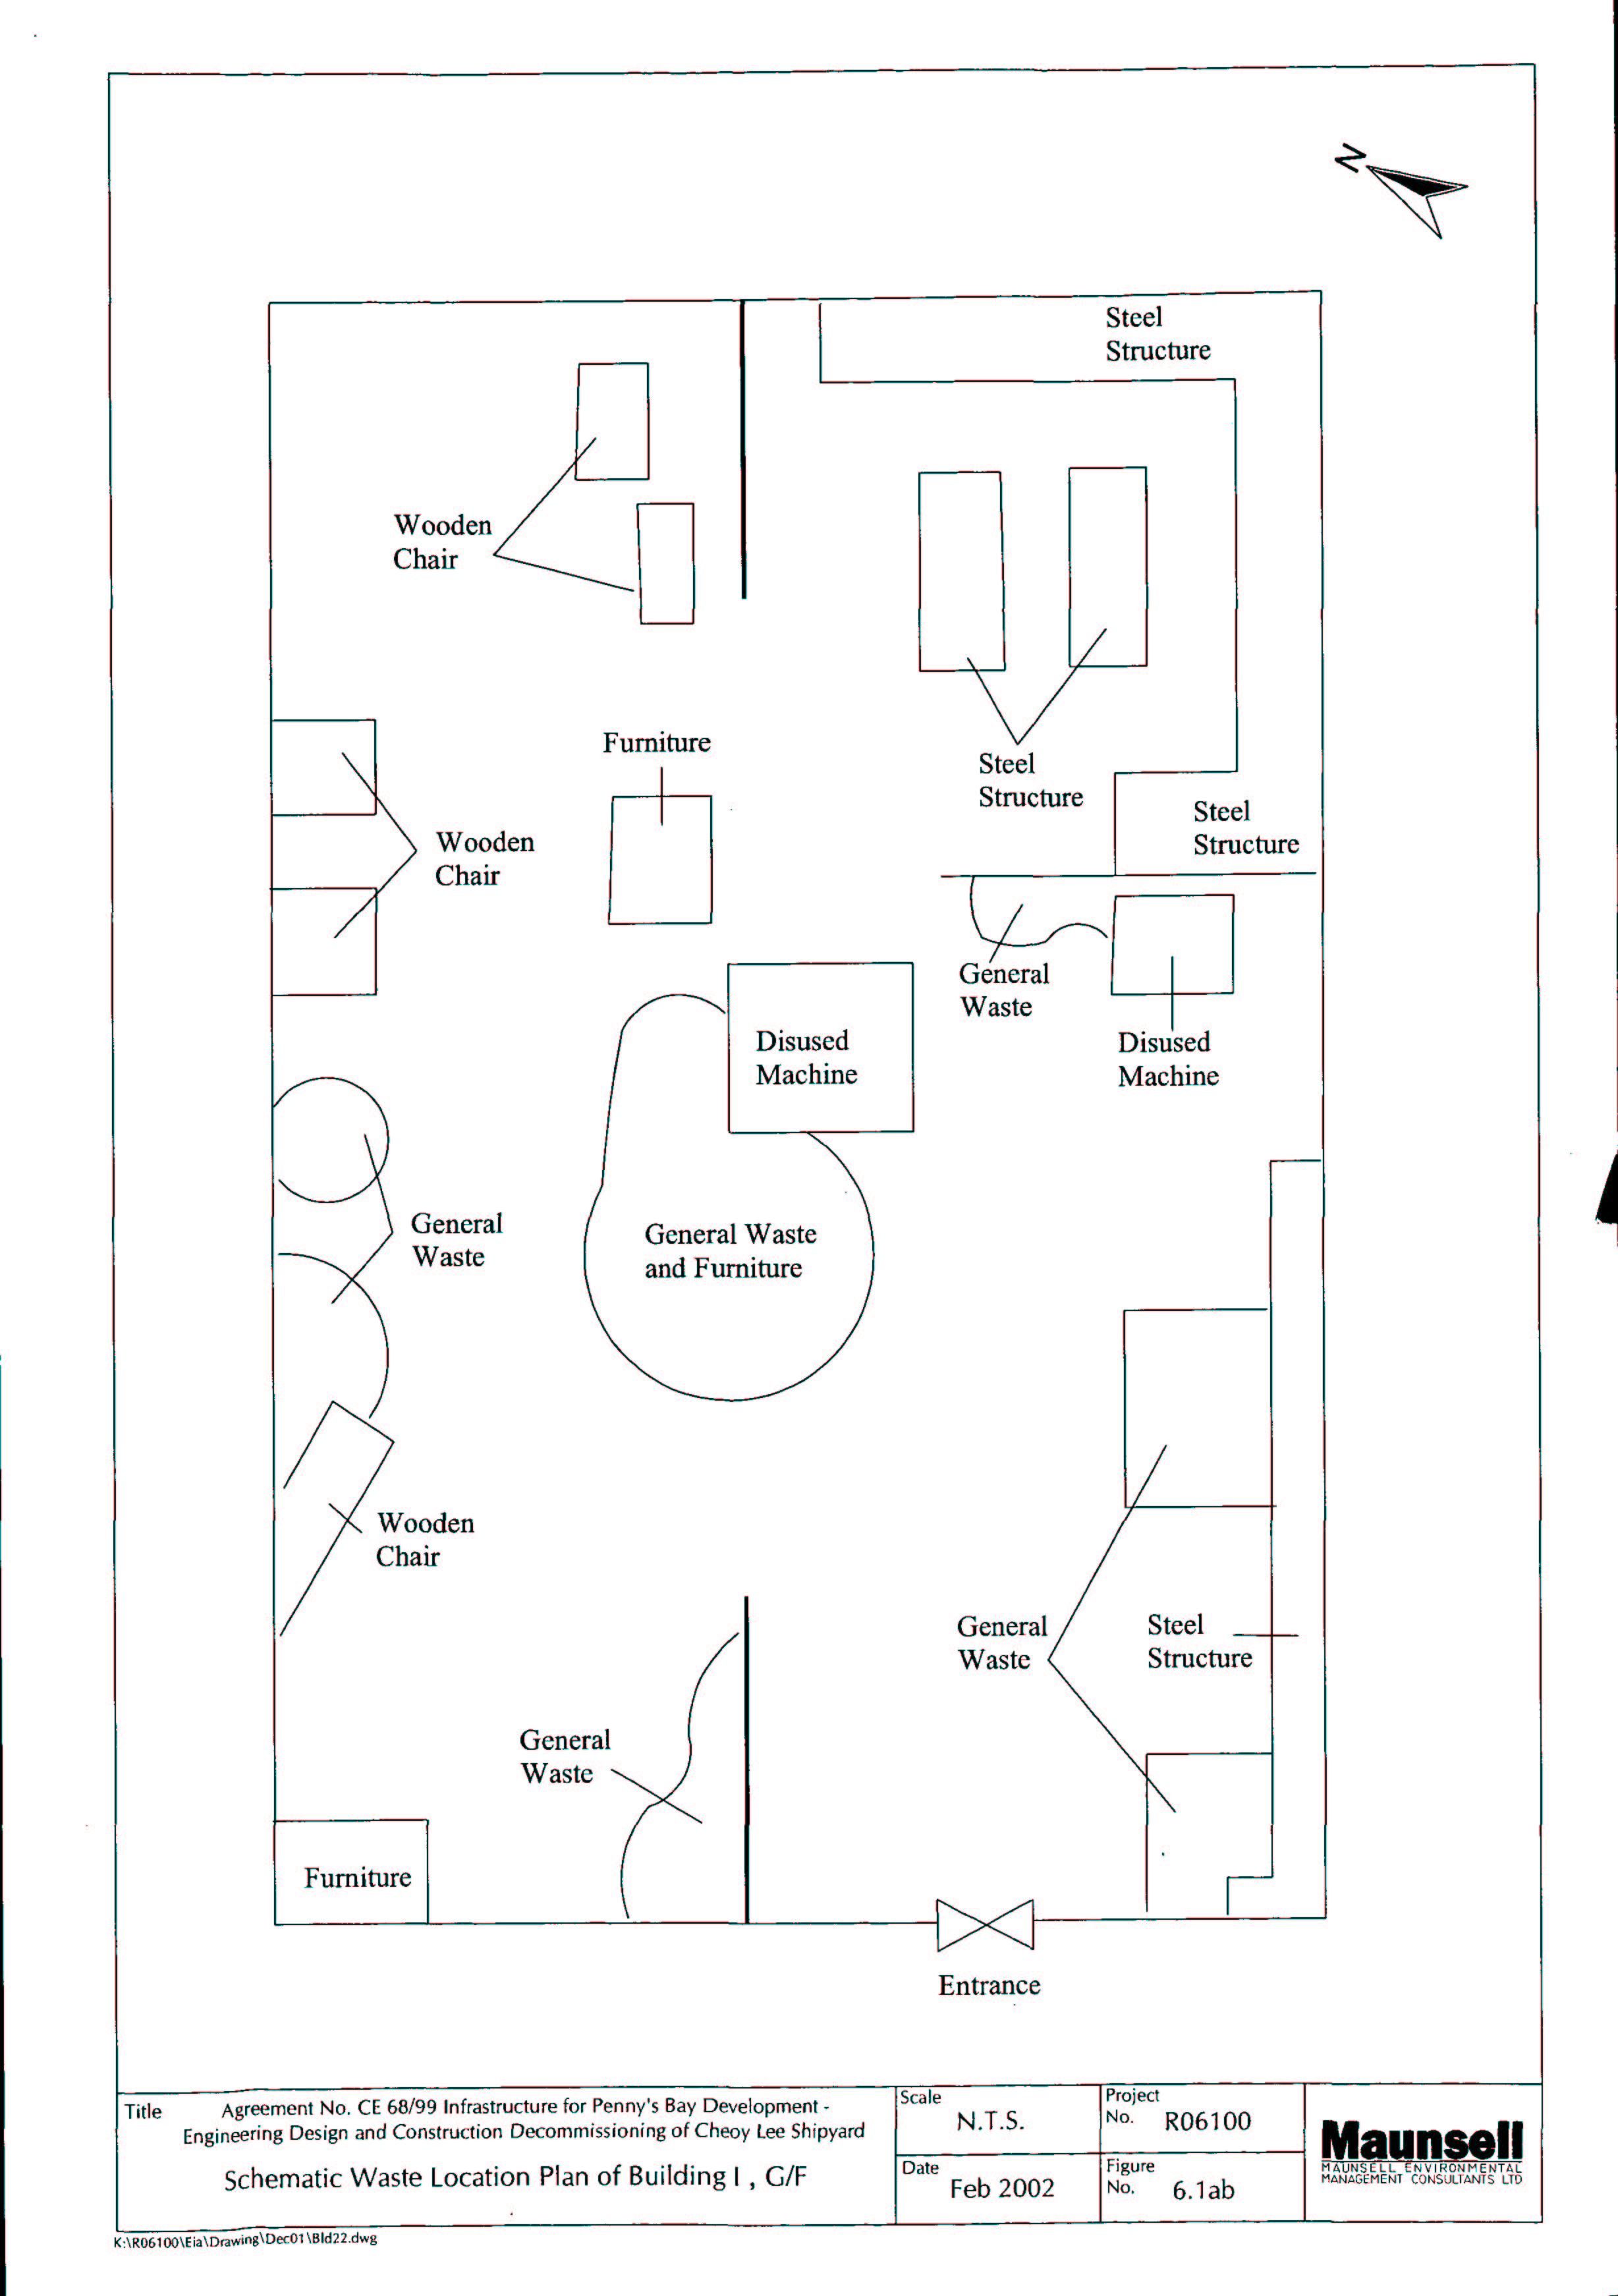
Figure 6.1ab Schematic Waste location Plan of Building I, G/F
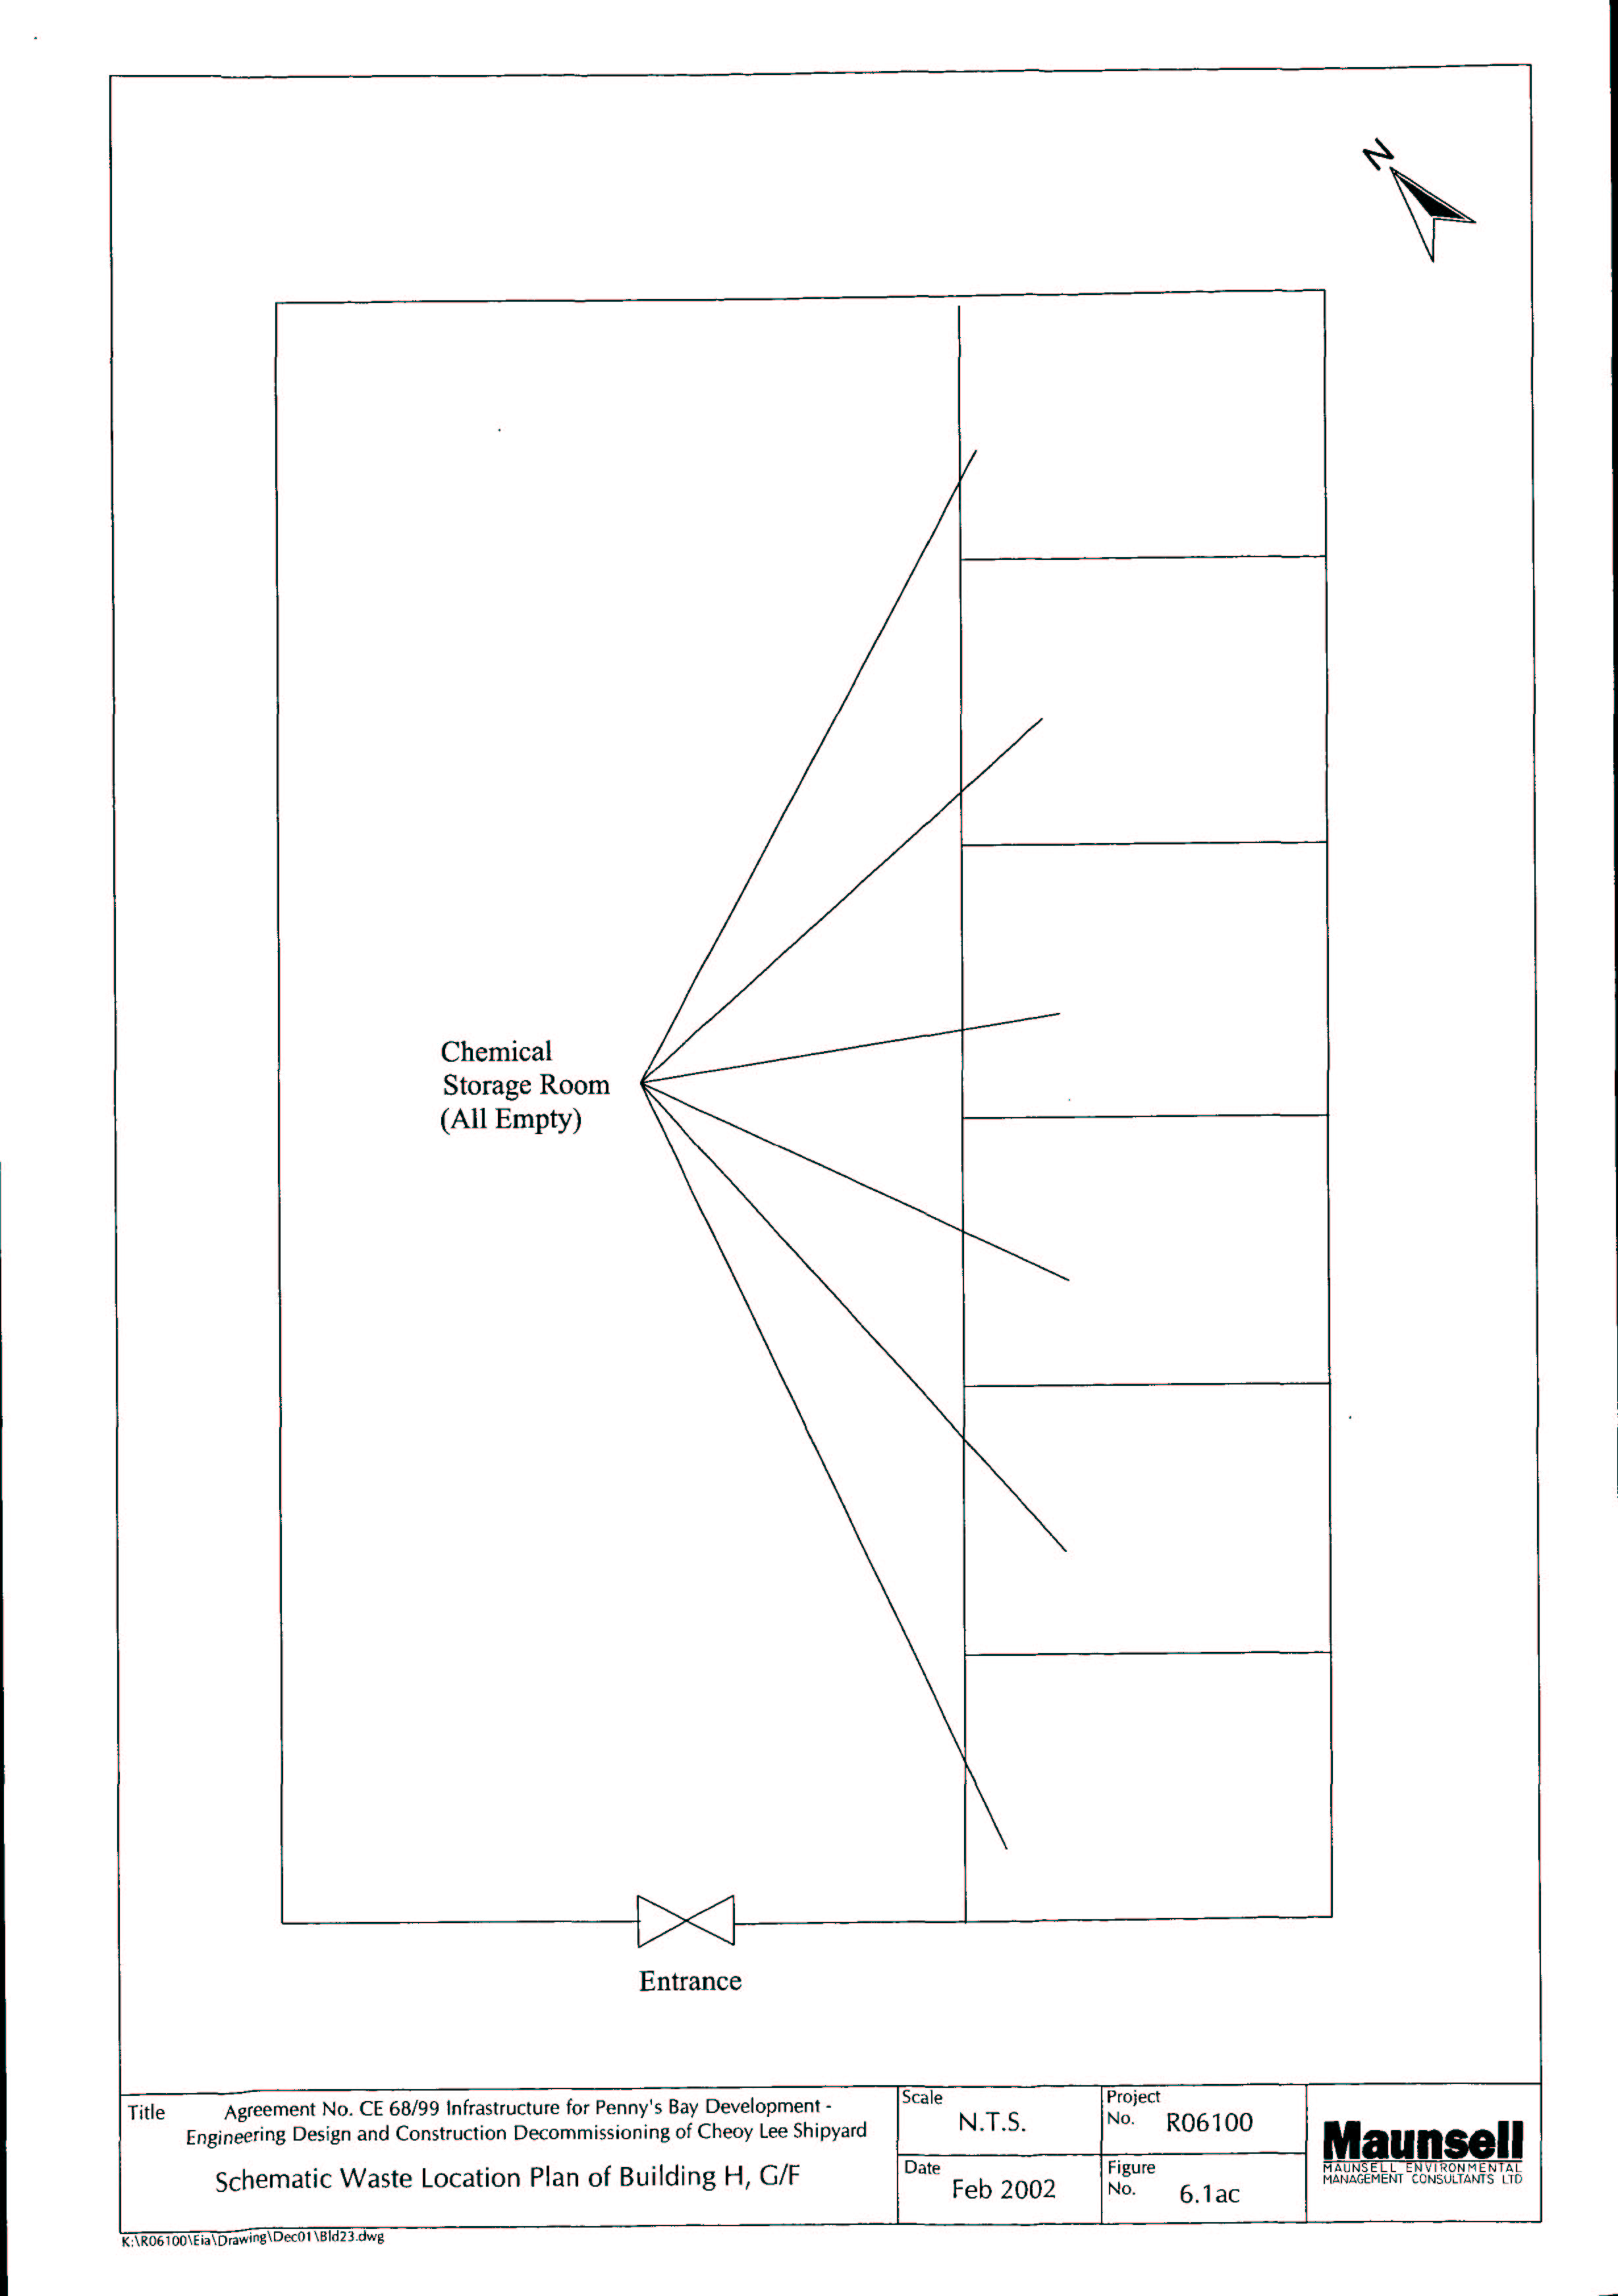
Figure 6.1ac Schematic Waste location Plan of Building H, G/F
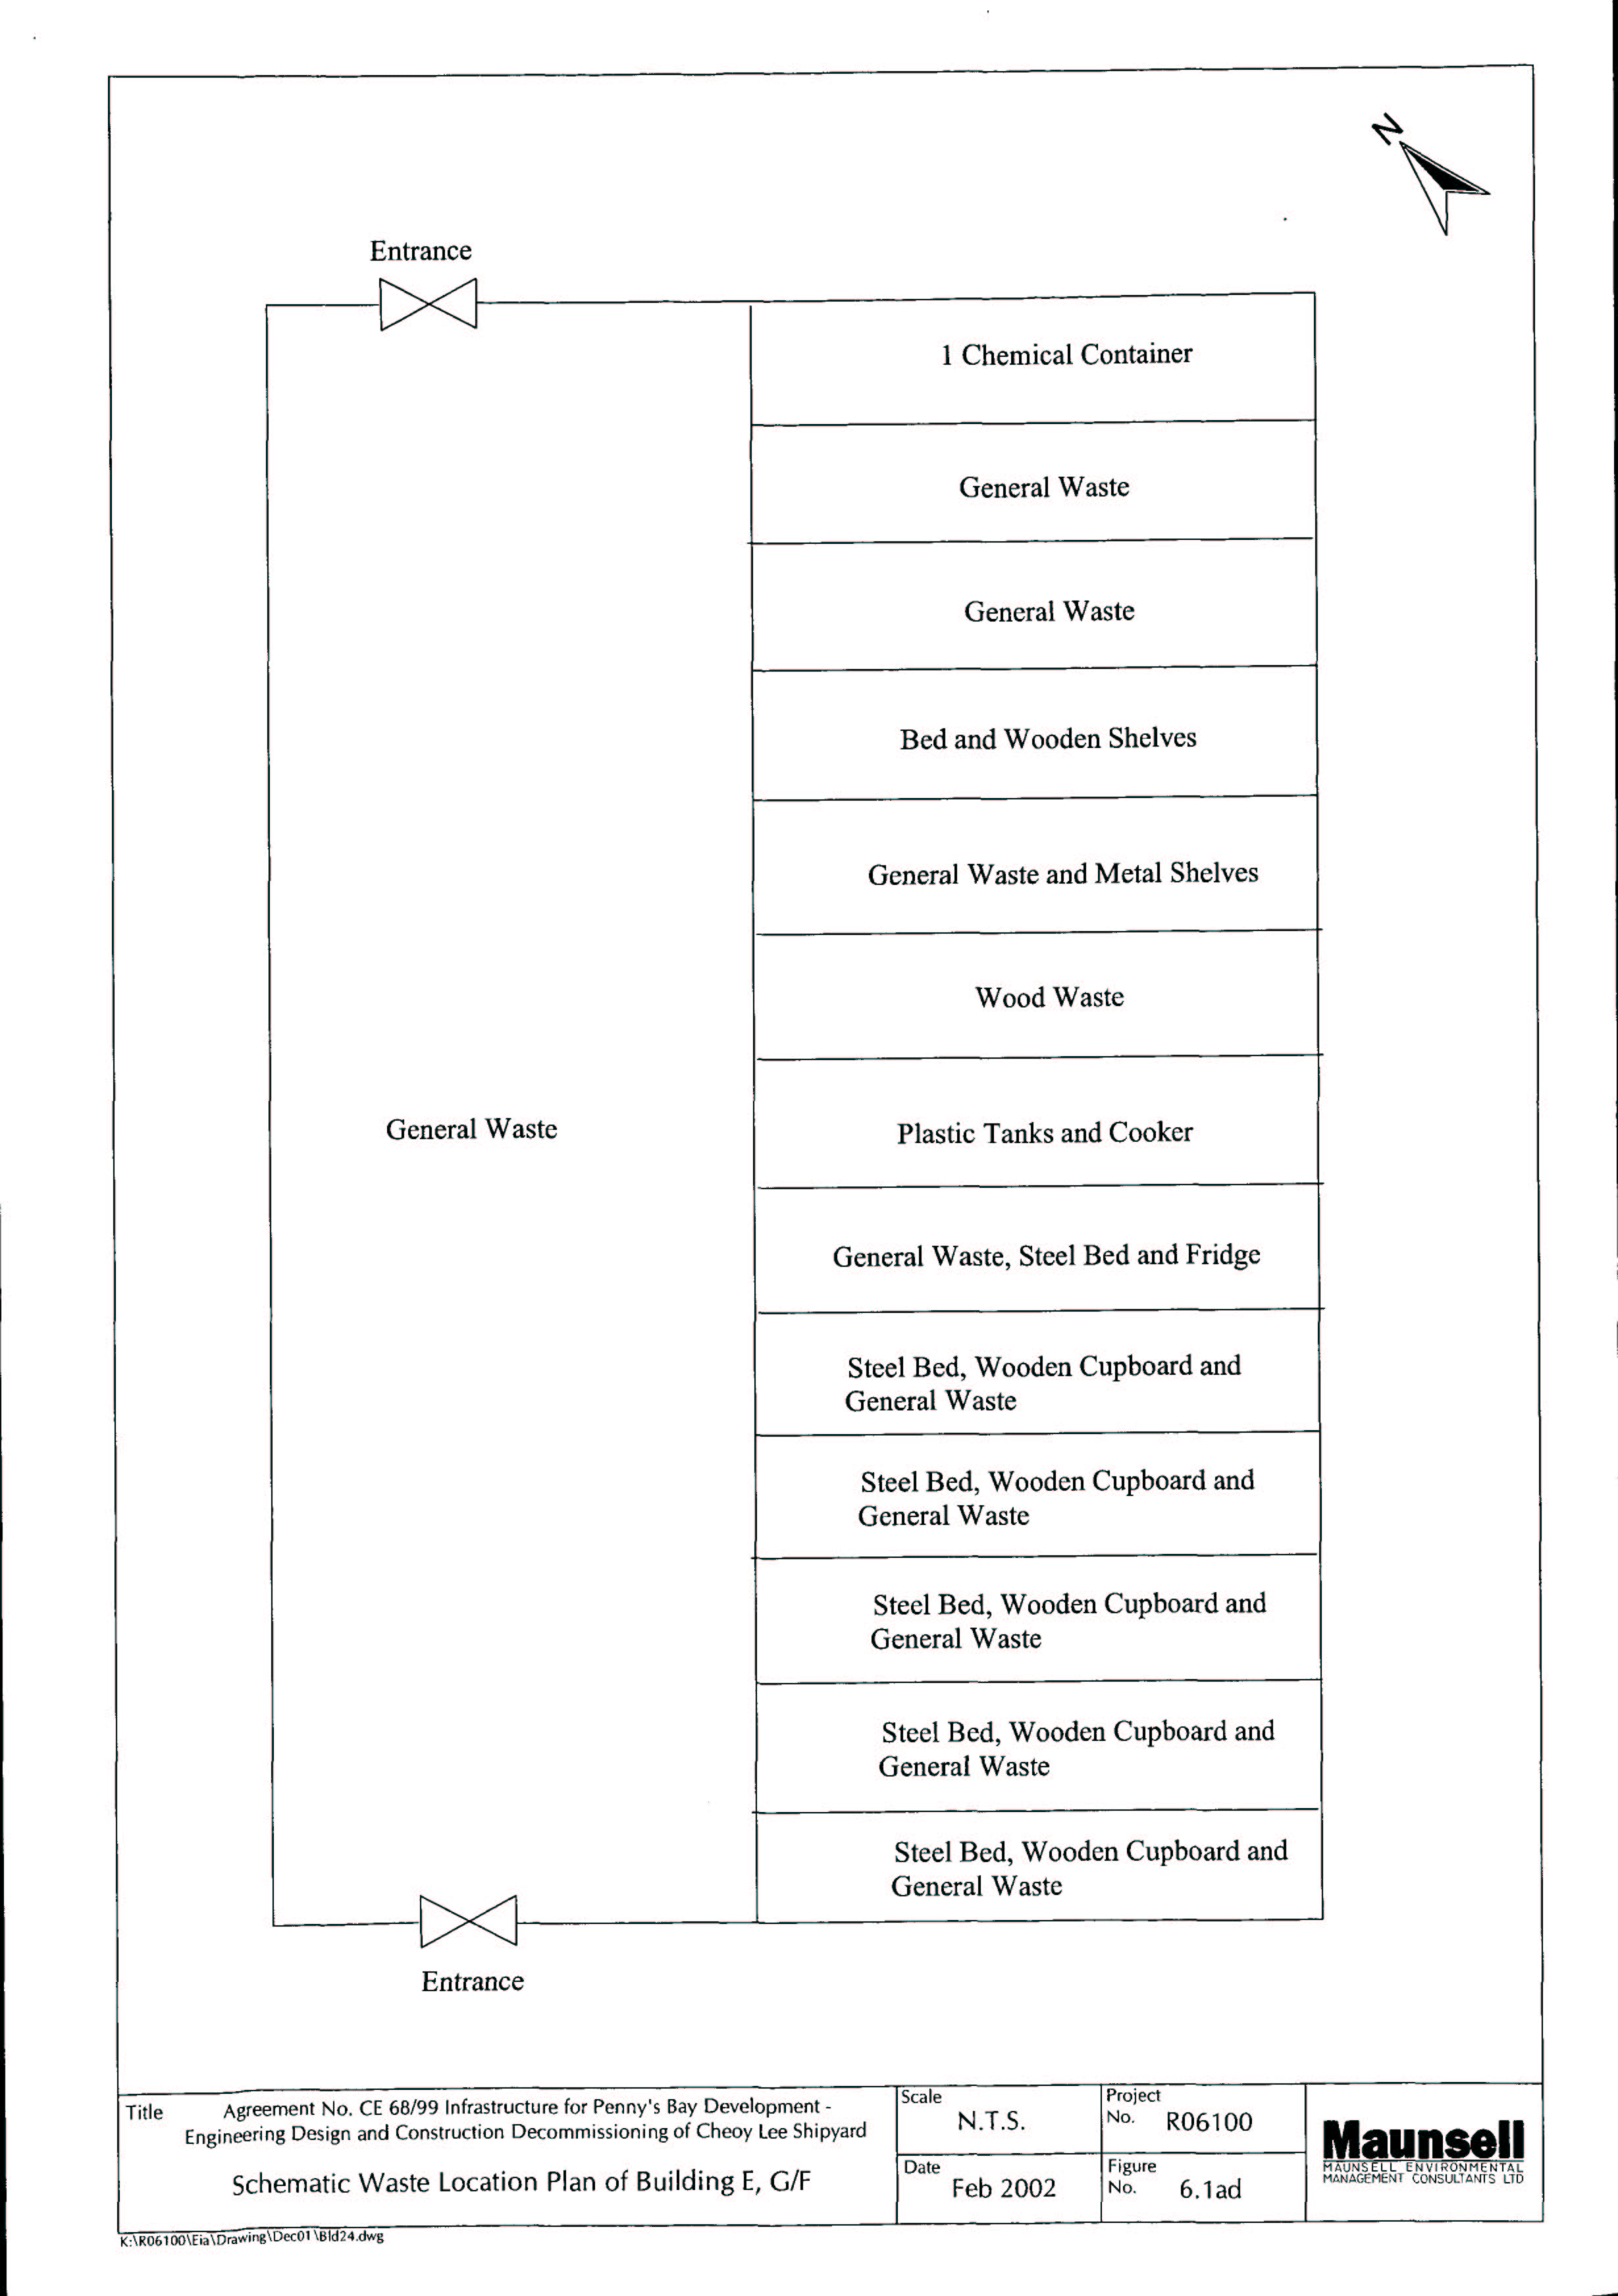
Figure 6.1ad Schematic Waste location Plan of Building E, G/F
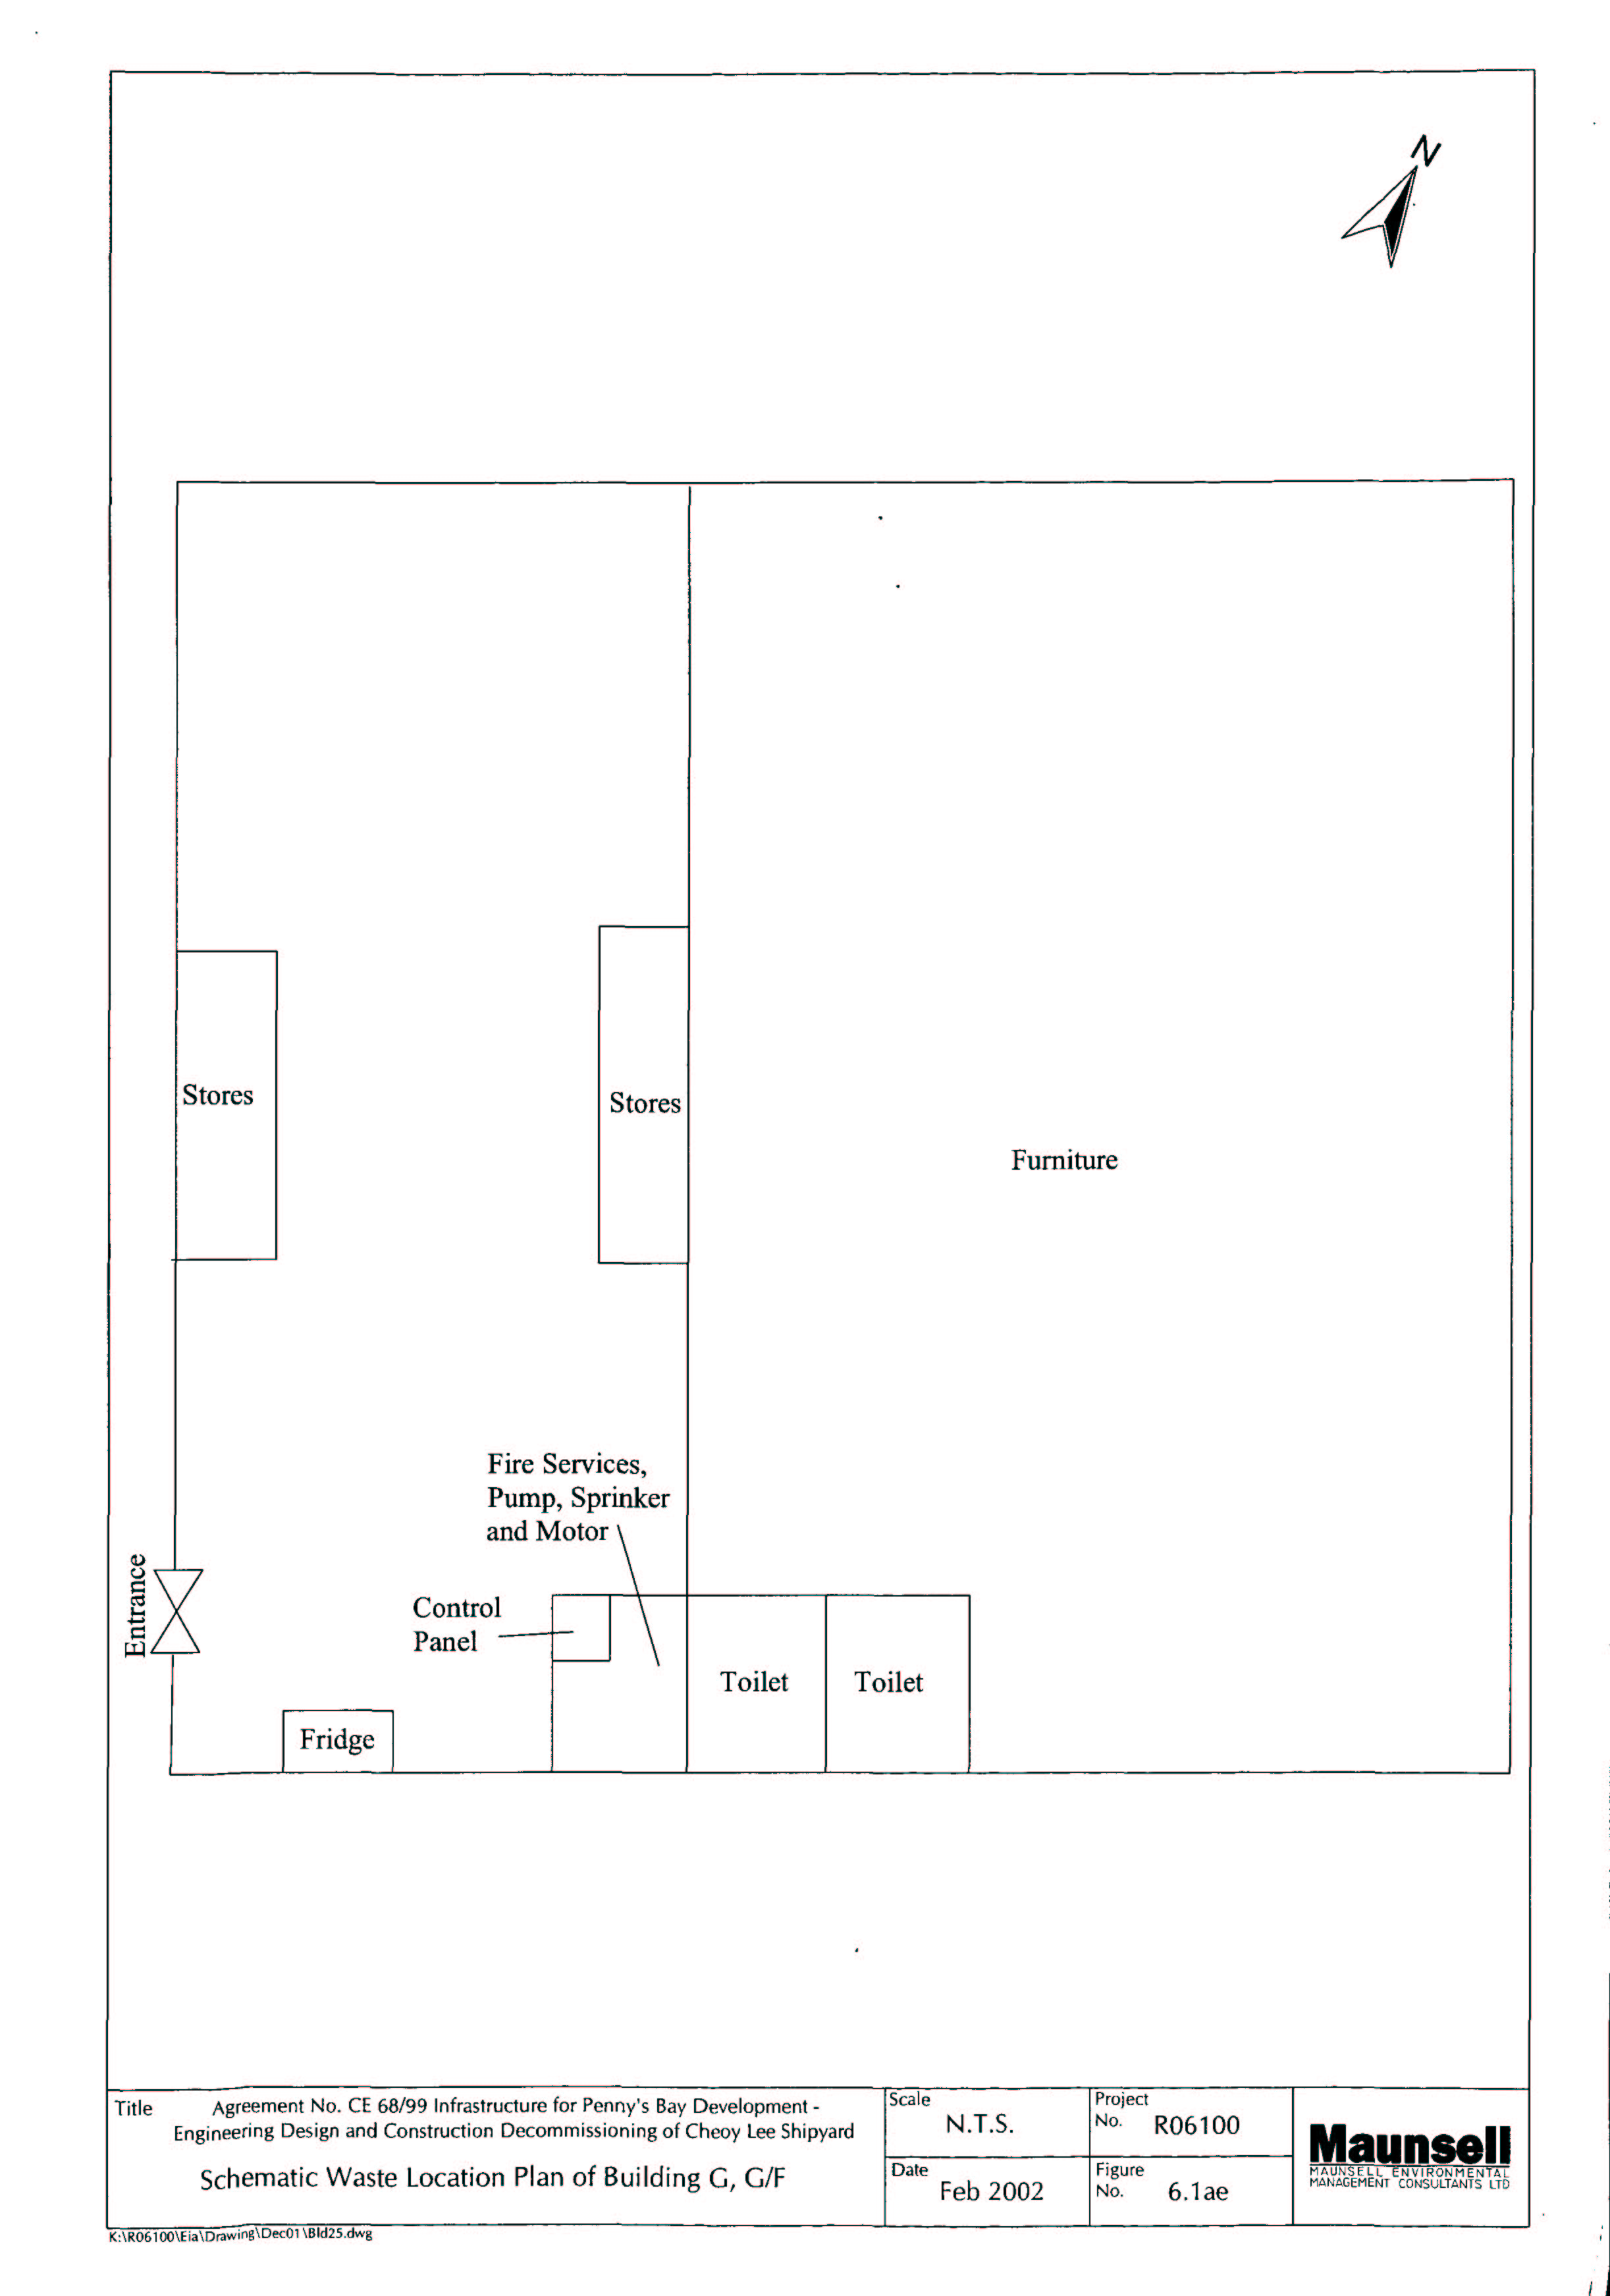
Figure 6.1ae Schematic Waste location Plan of Building G, G/F
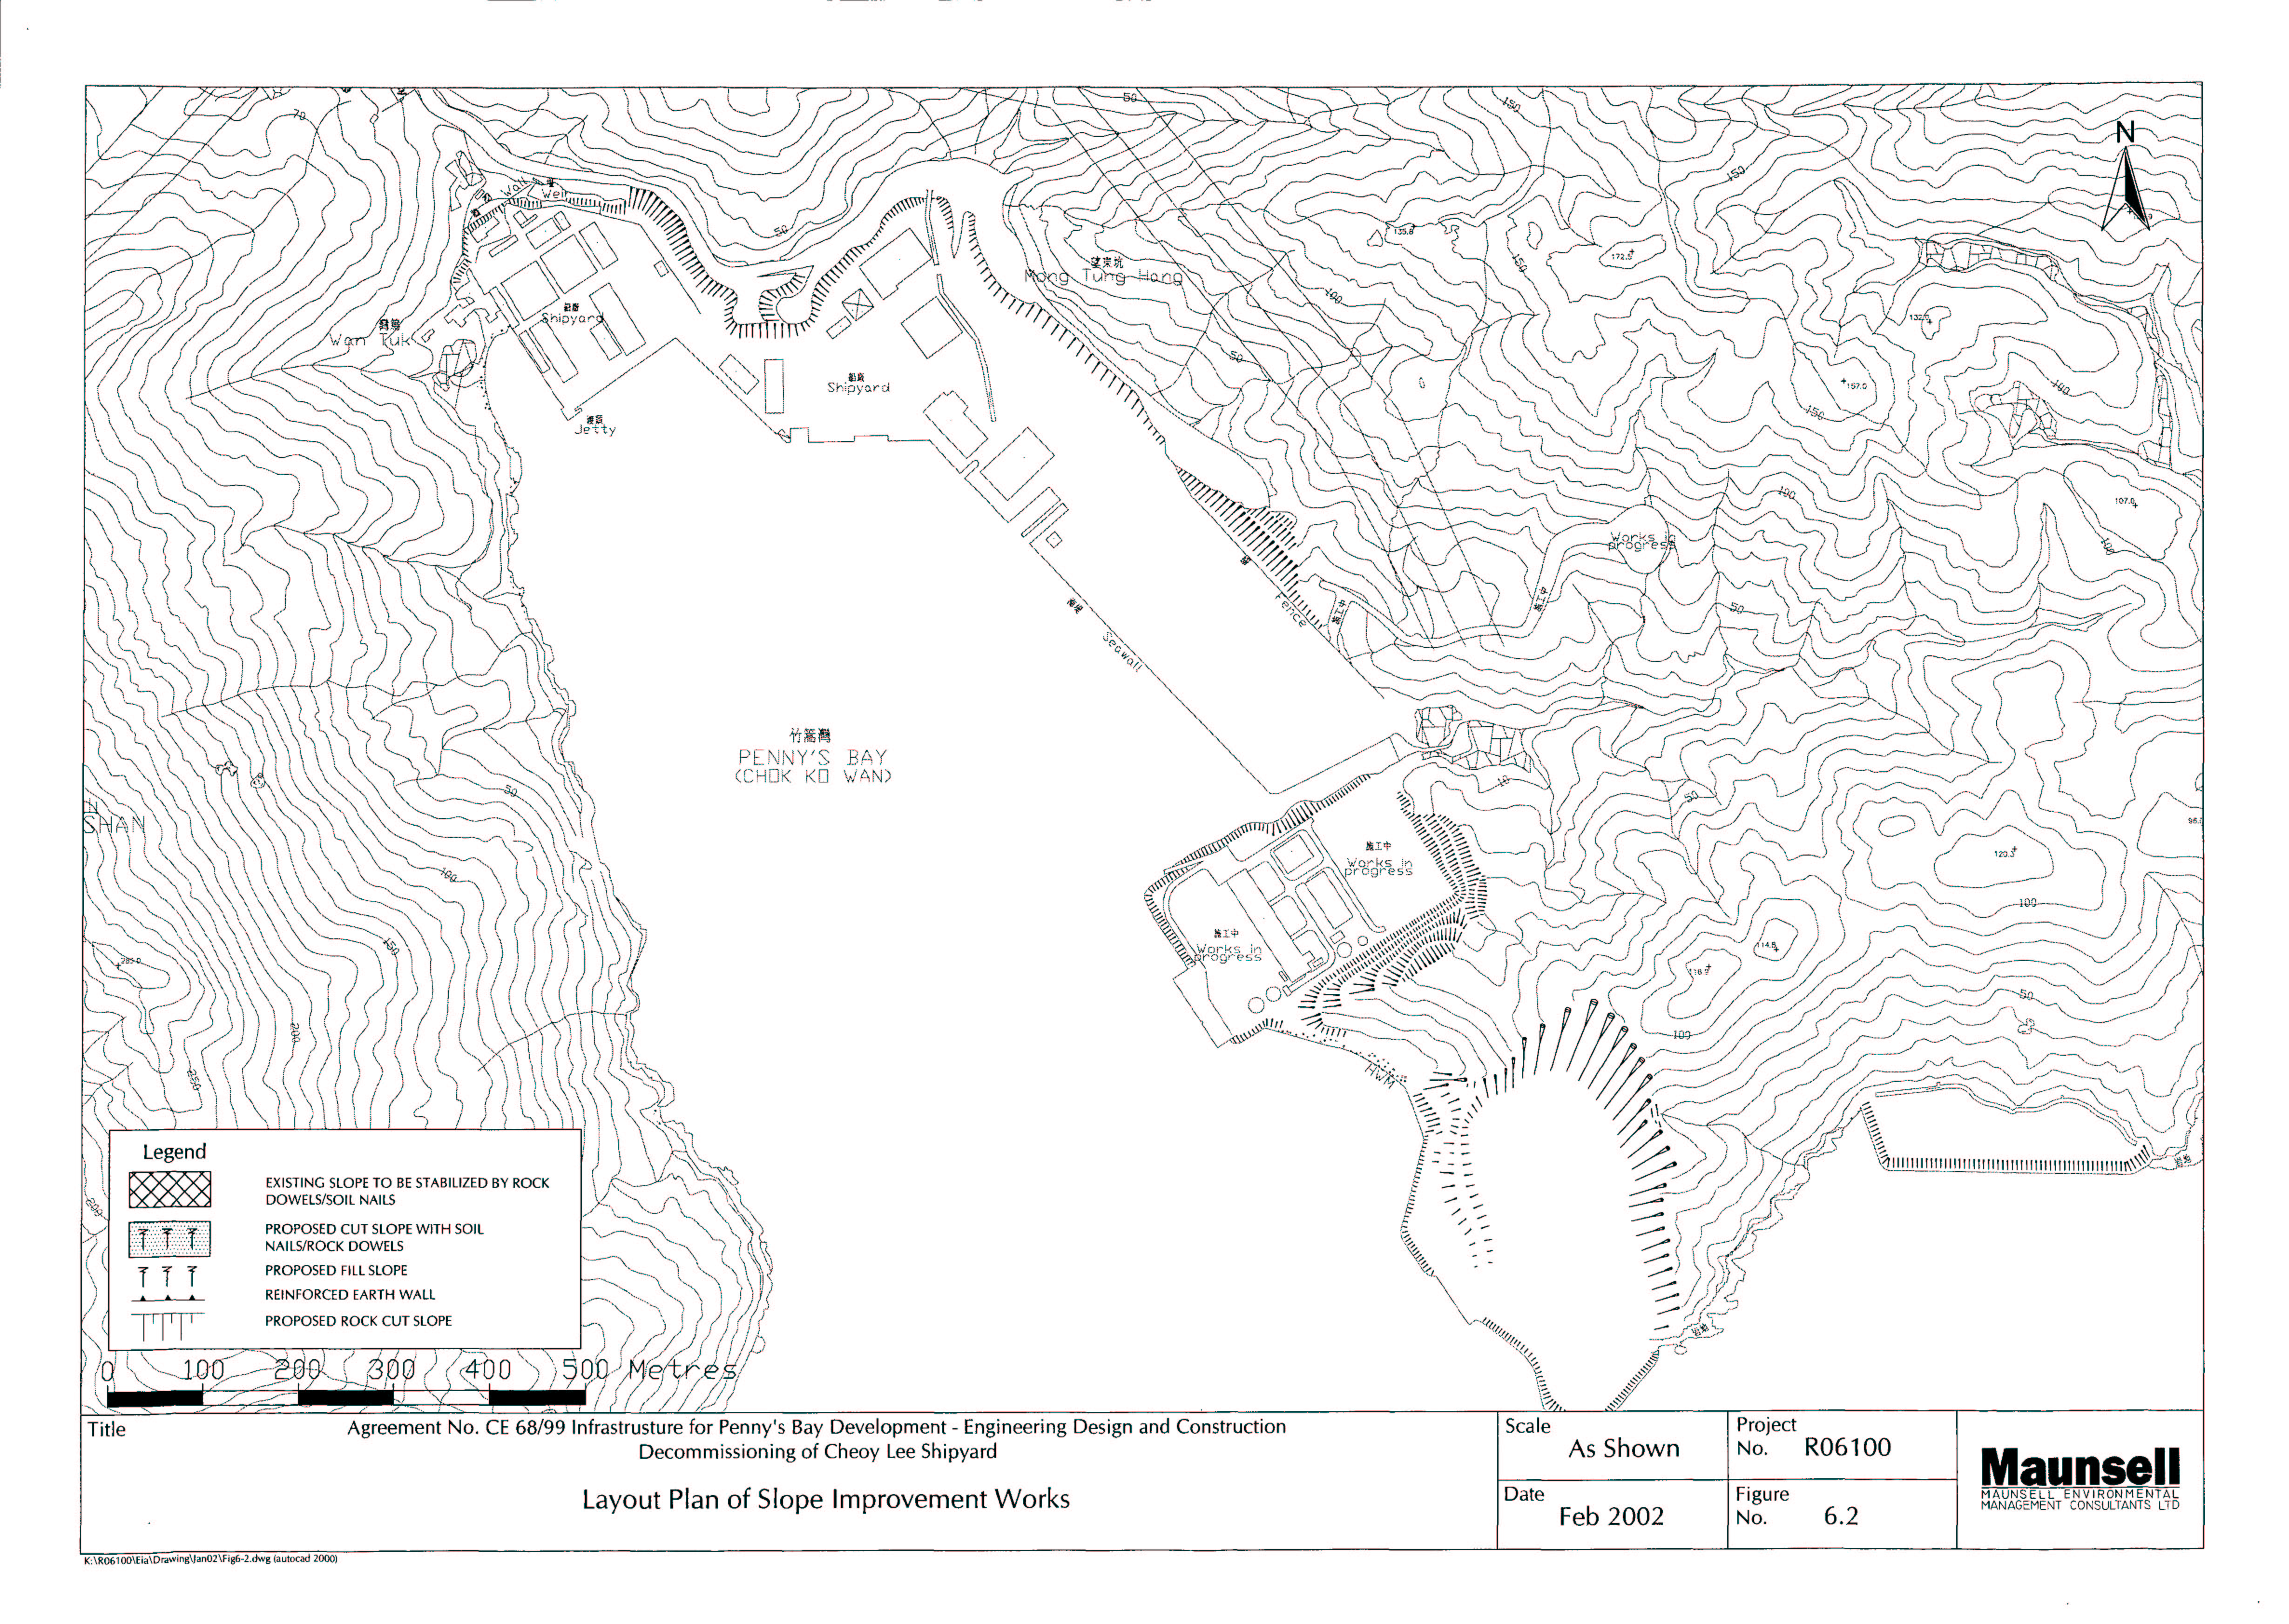
Figure 6.2 Layout Plan of Slope Improvement Works
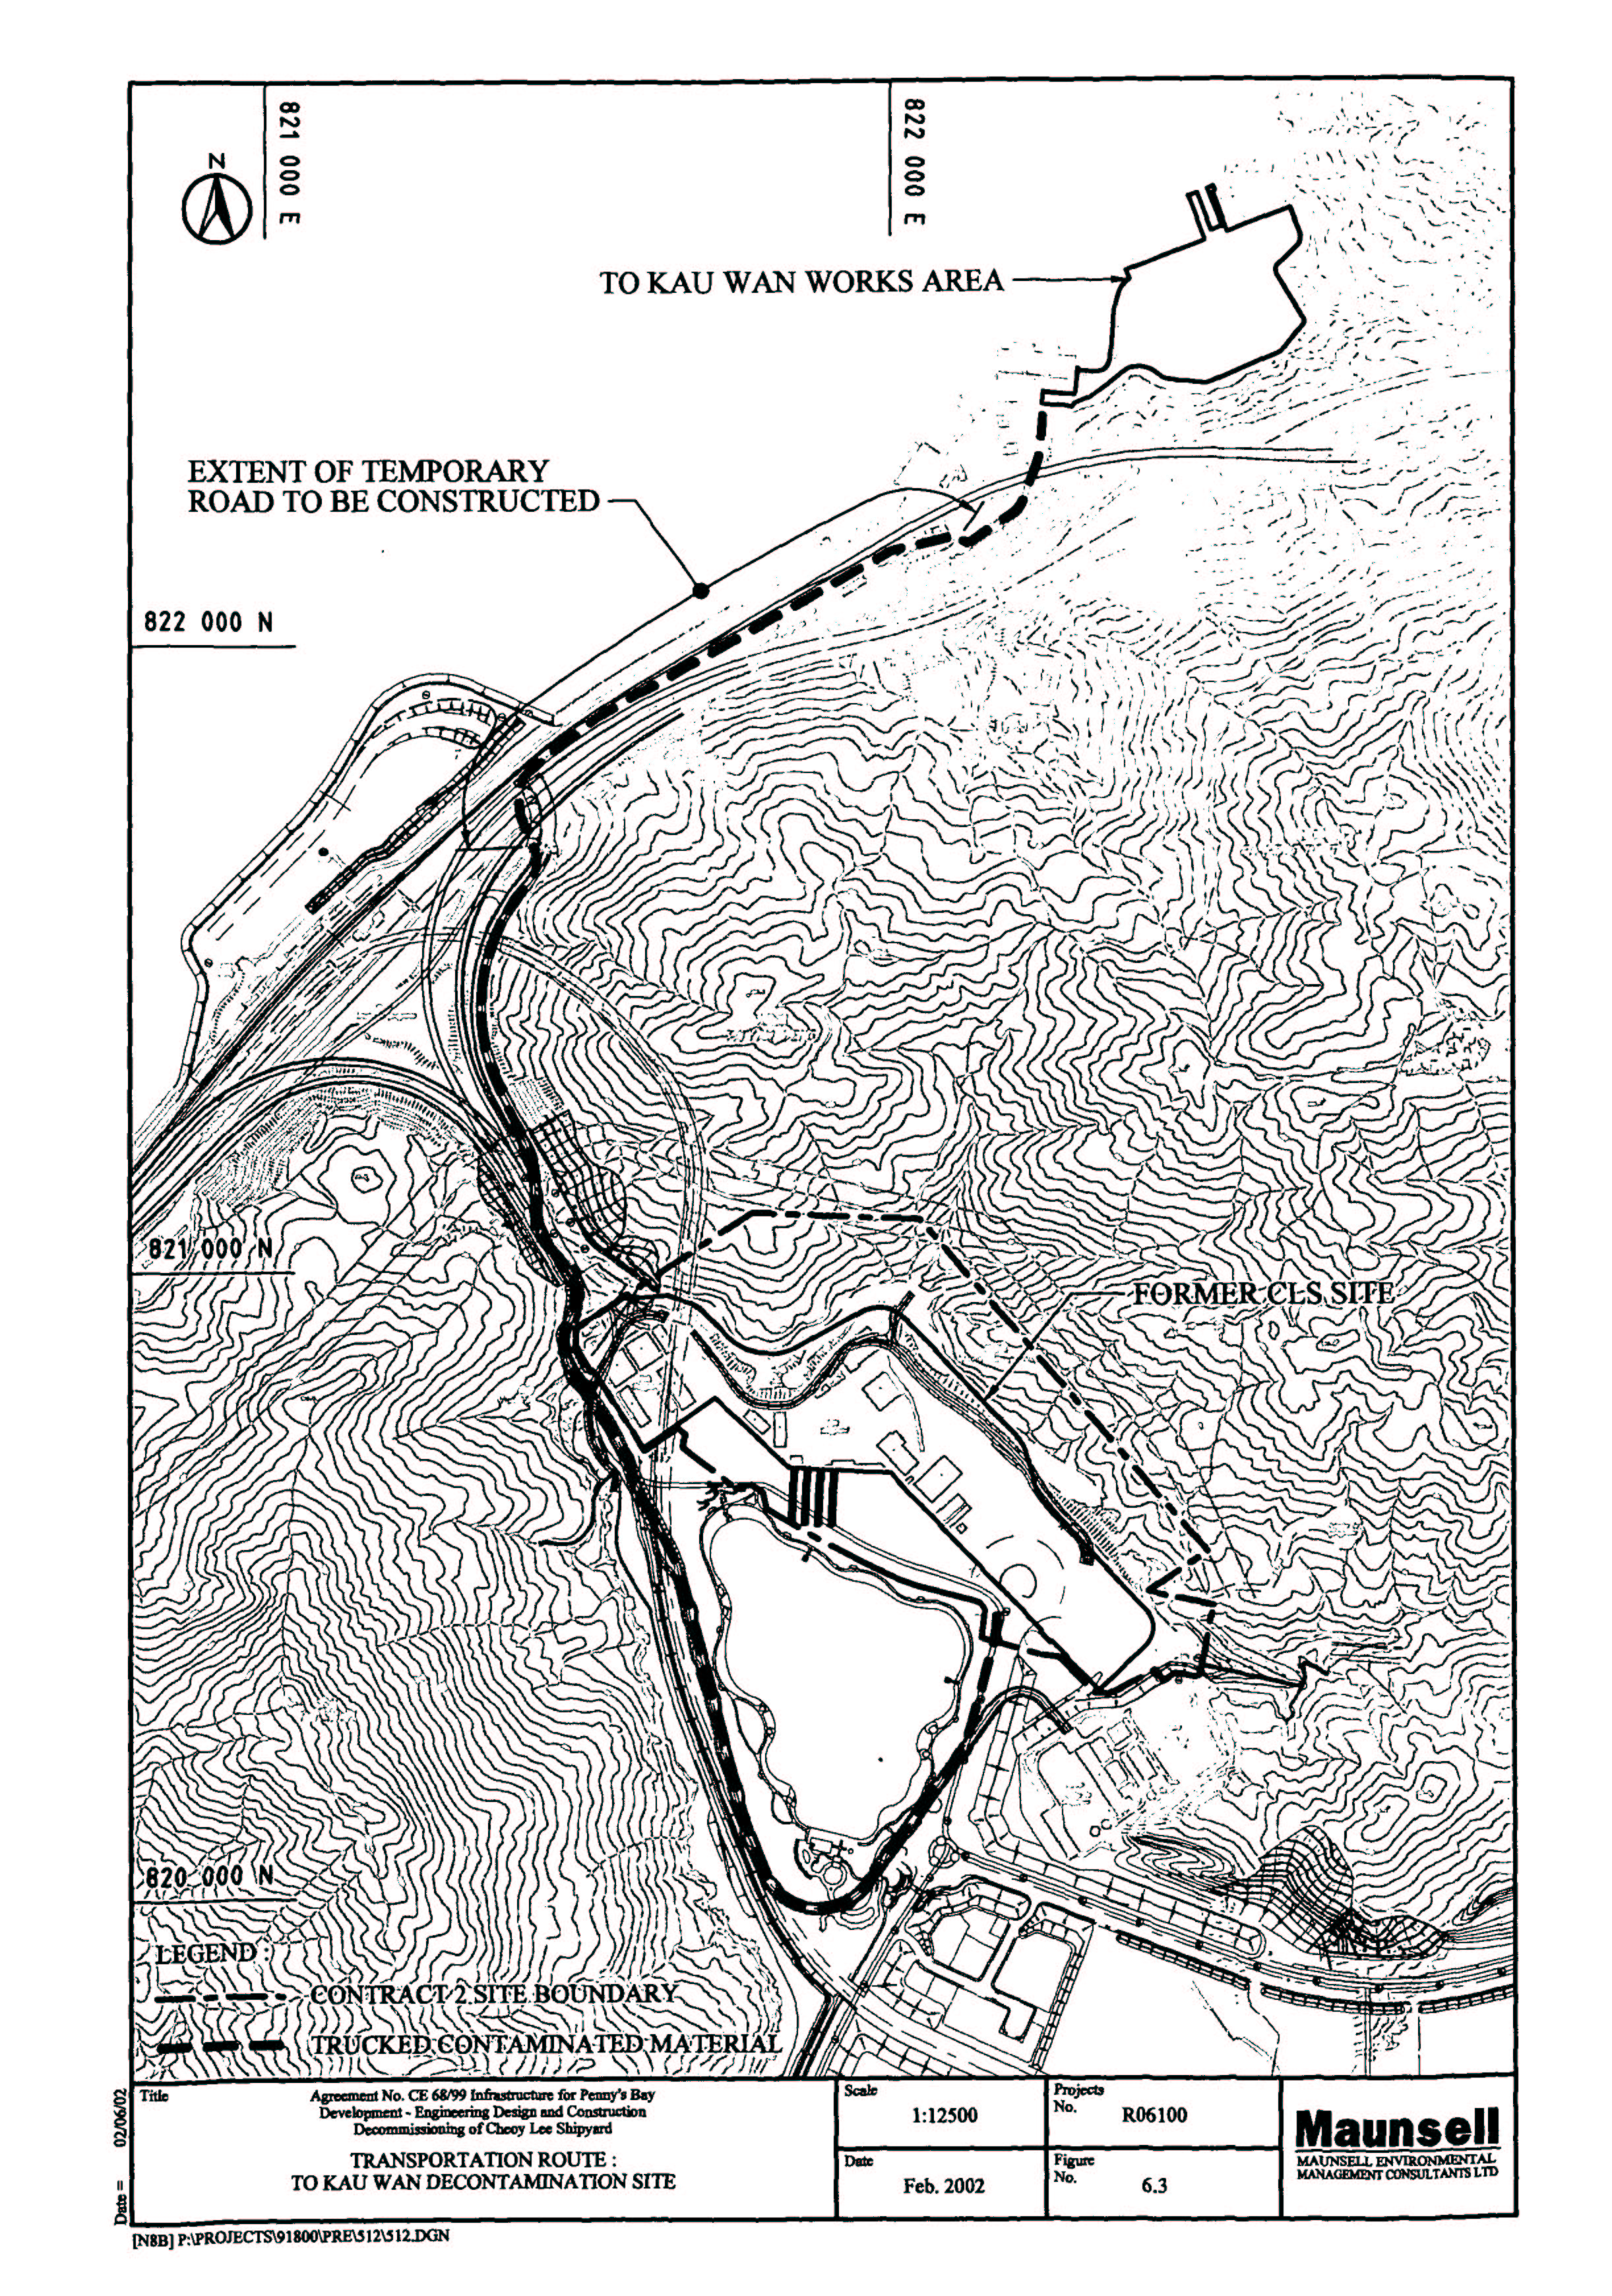
Figure 6.3 Transportation Route : To Kau Wan Decontamination Site
Figure 6.4a Material Handling Methods – General Contaminated Material Requiring Solidification Only
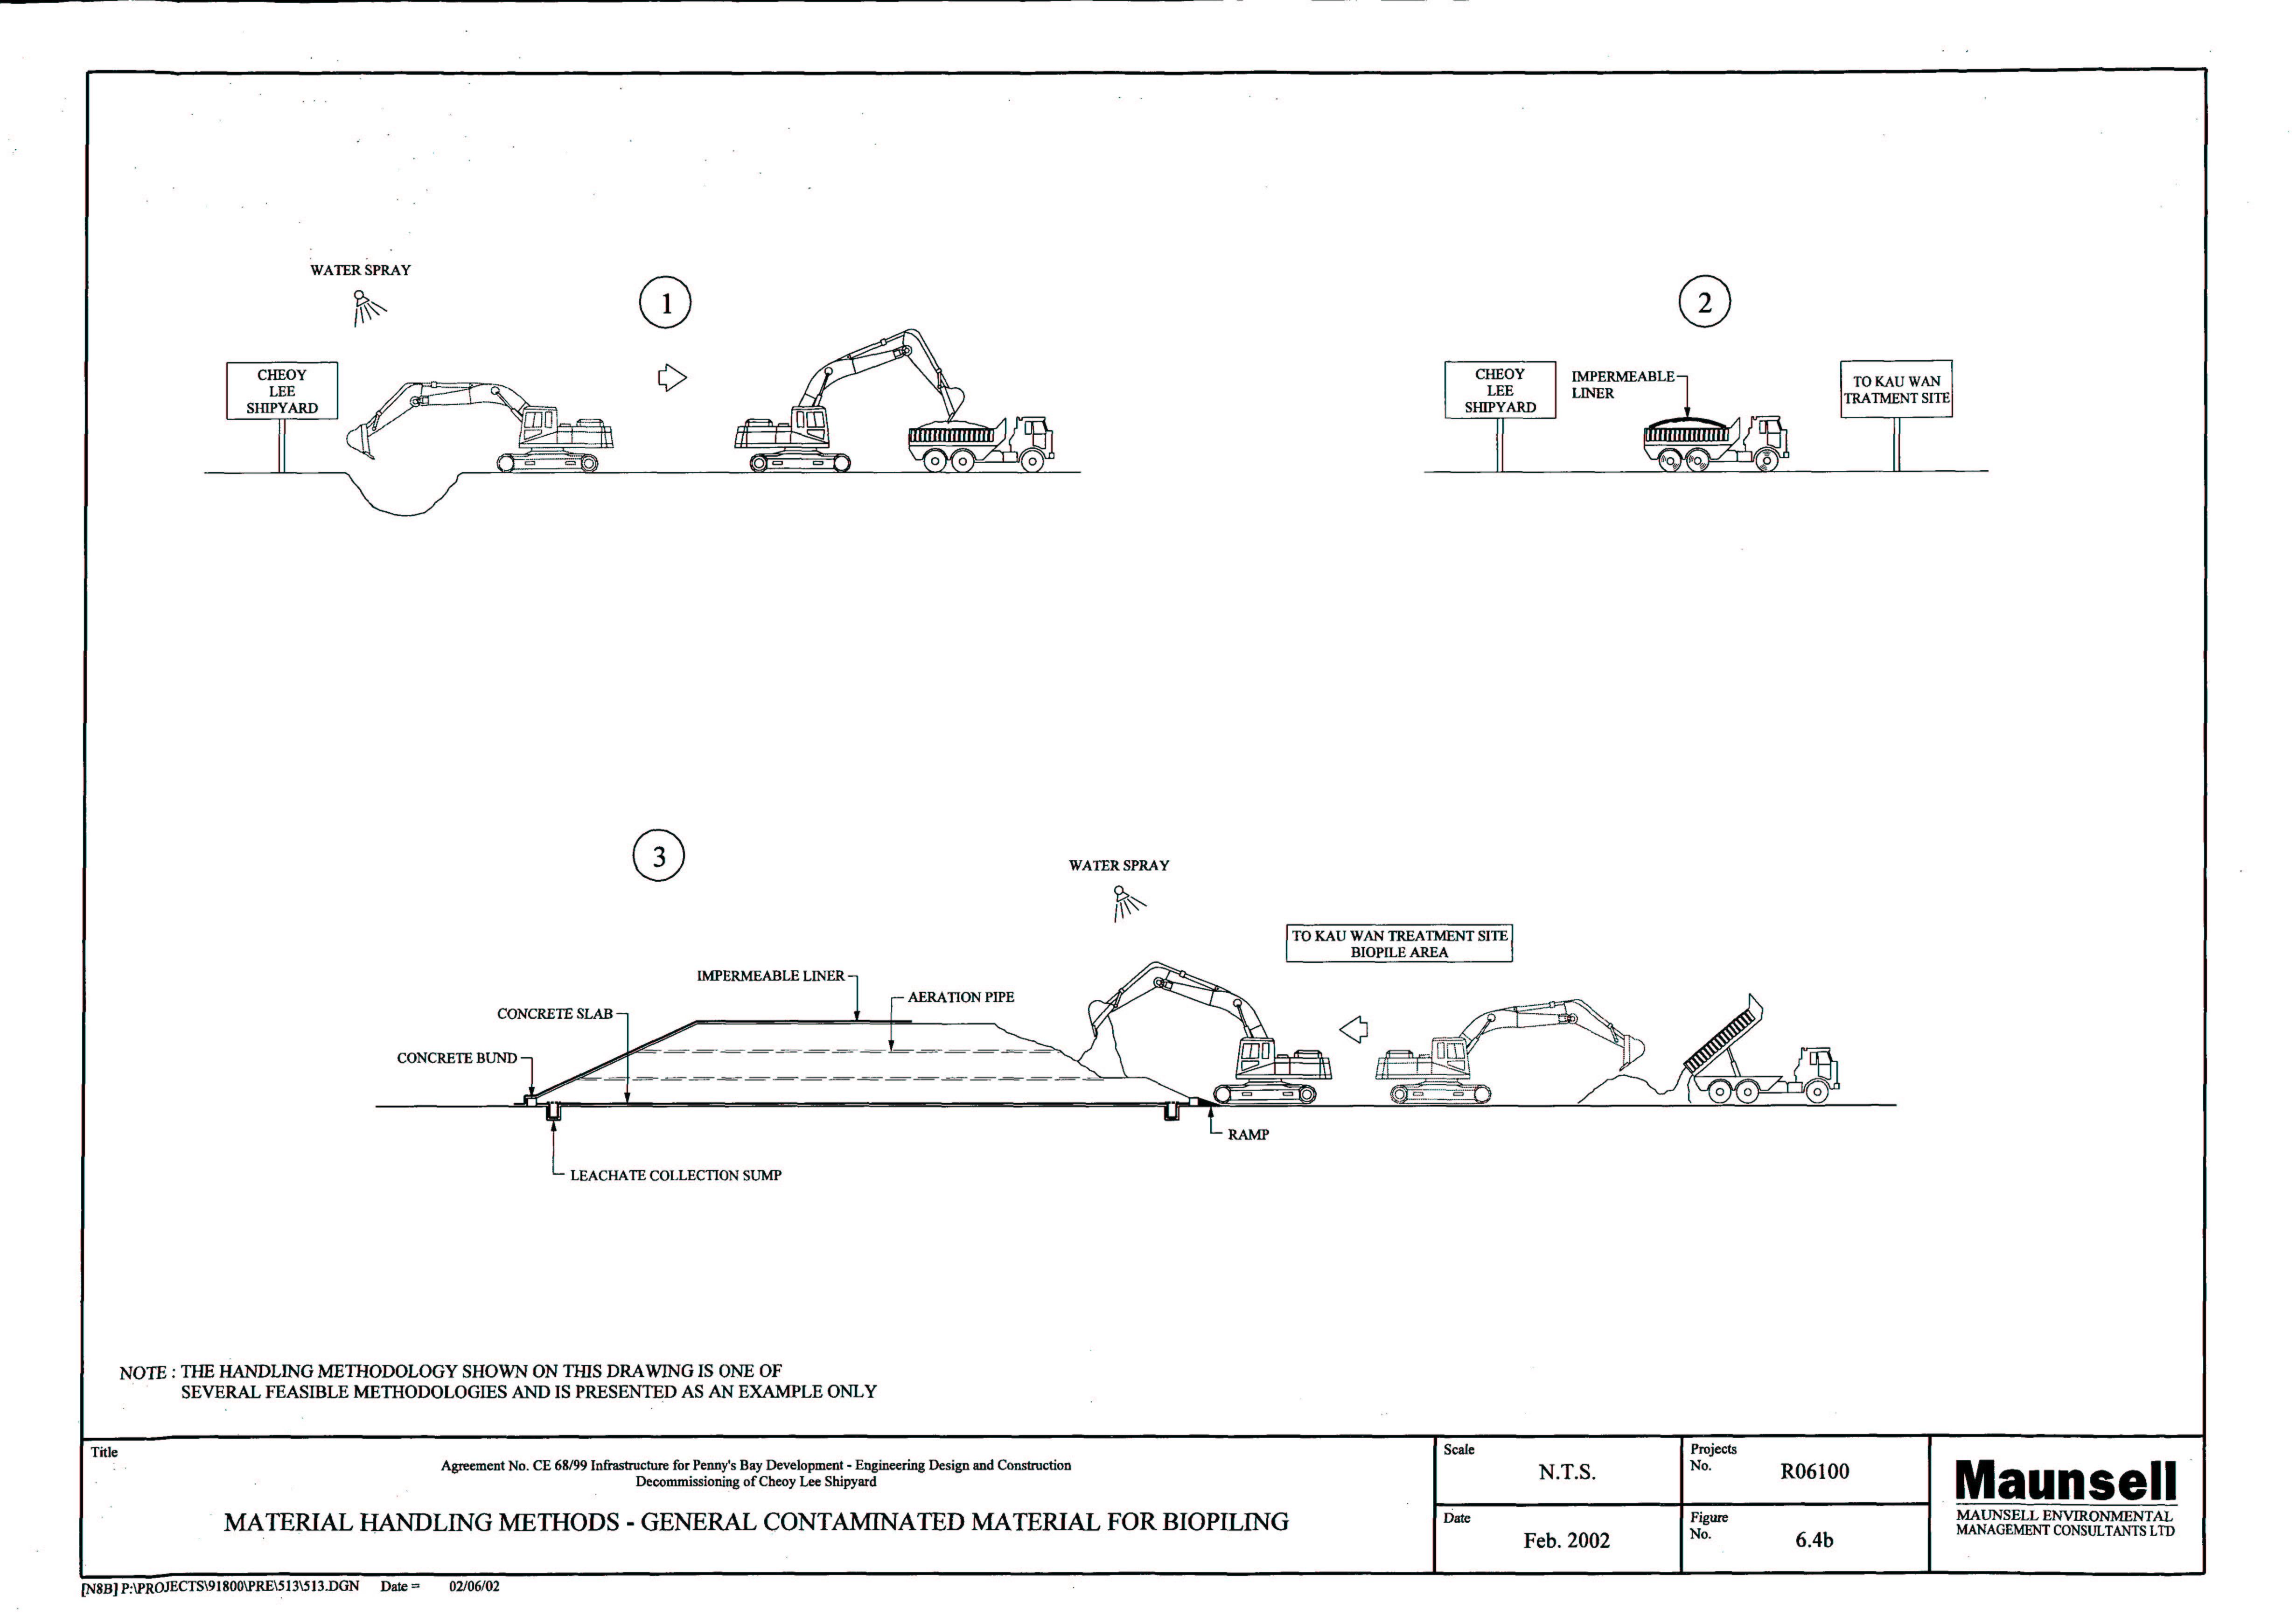
Figure 6.4b Material Handling Methods – General Contaminated Material for Biopiling
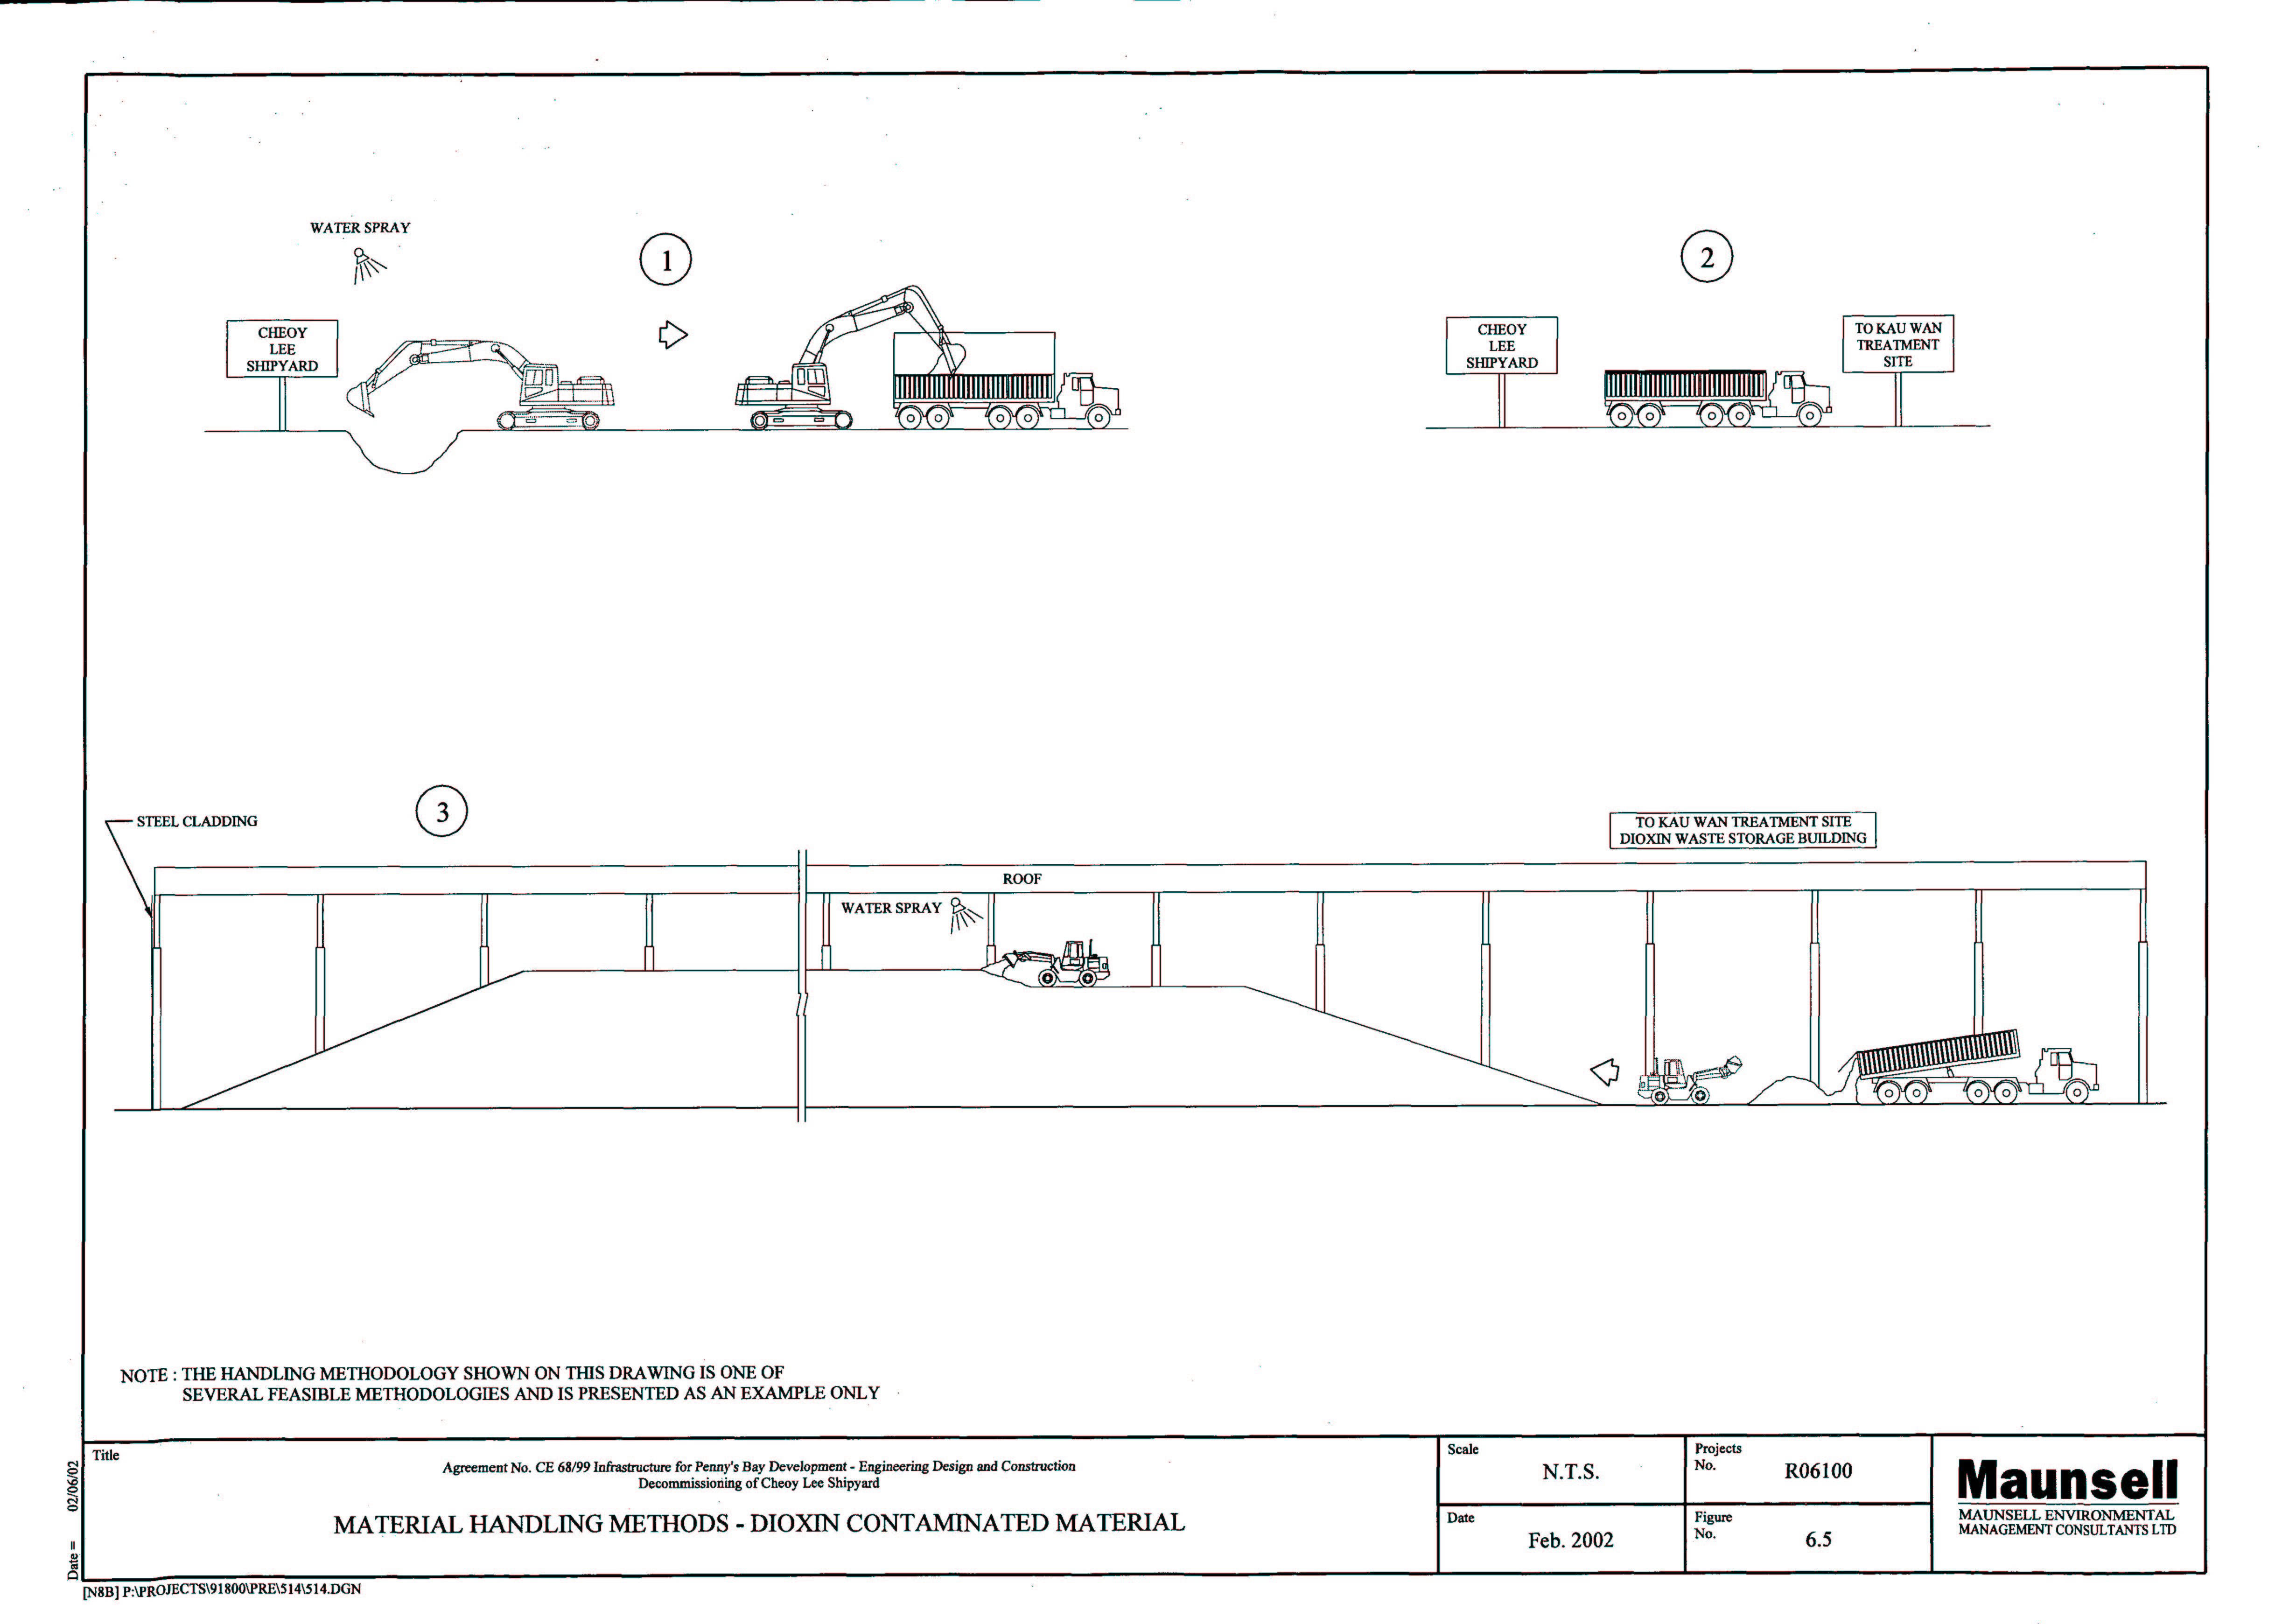
Figure 6.5 Material Handling Methods – Dioxins-contaminated Material
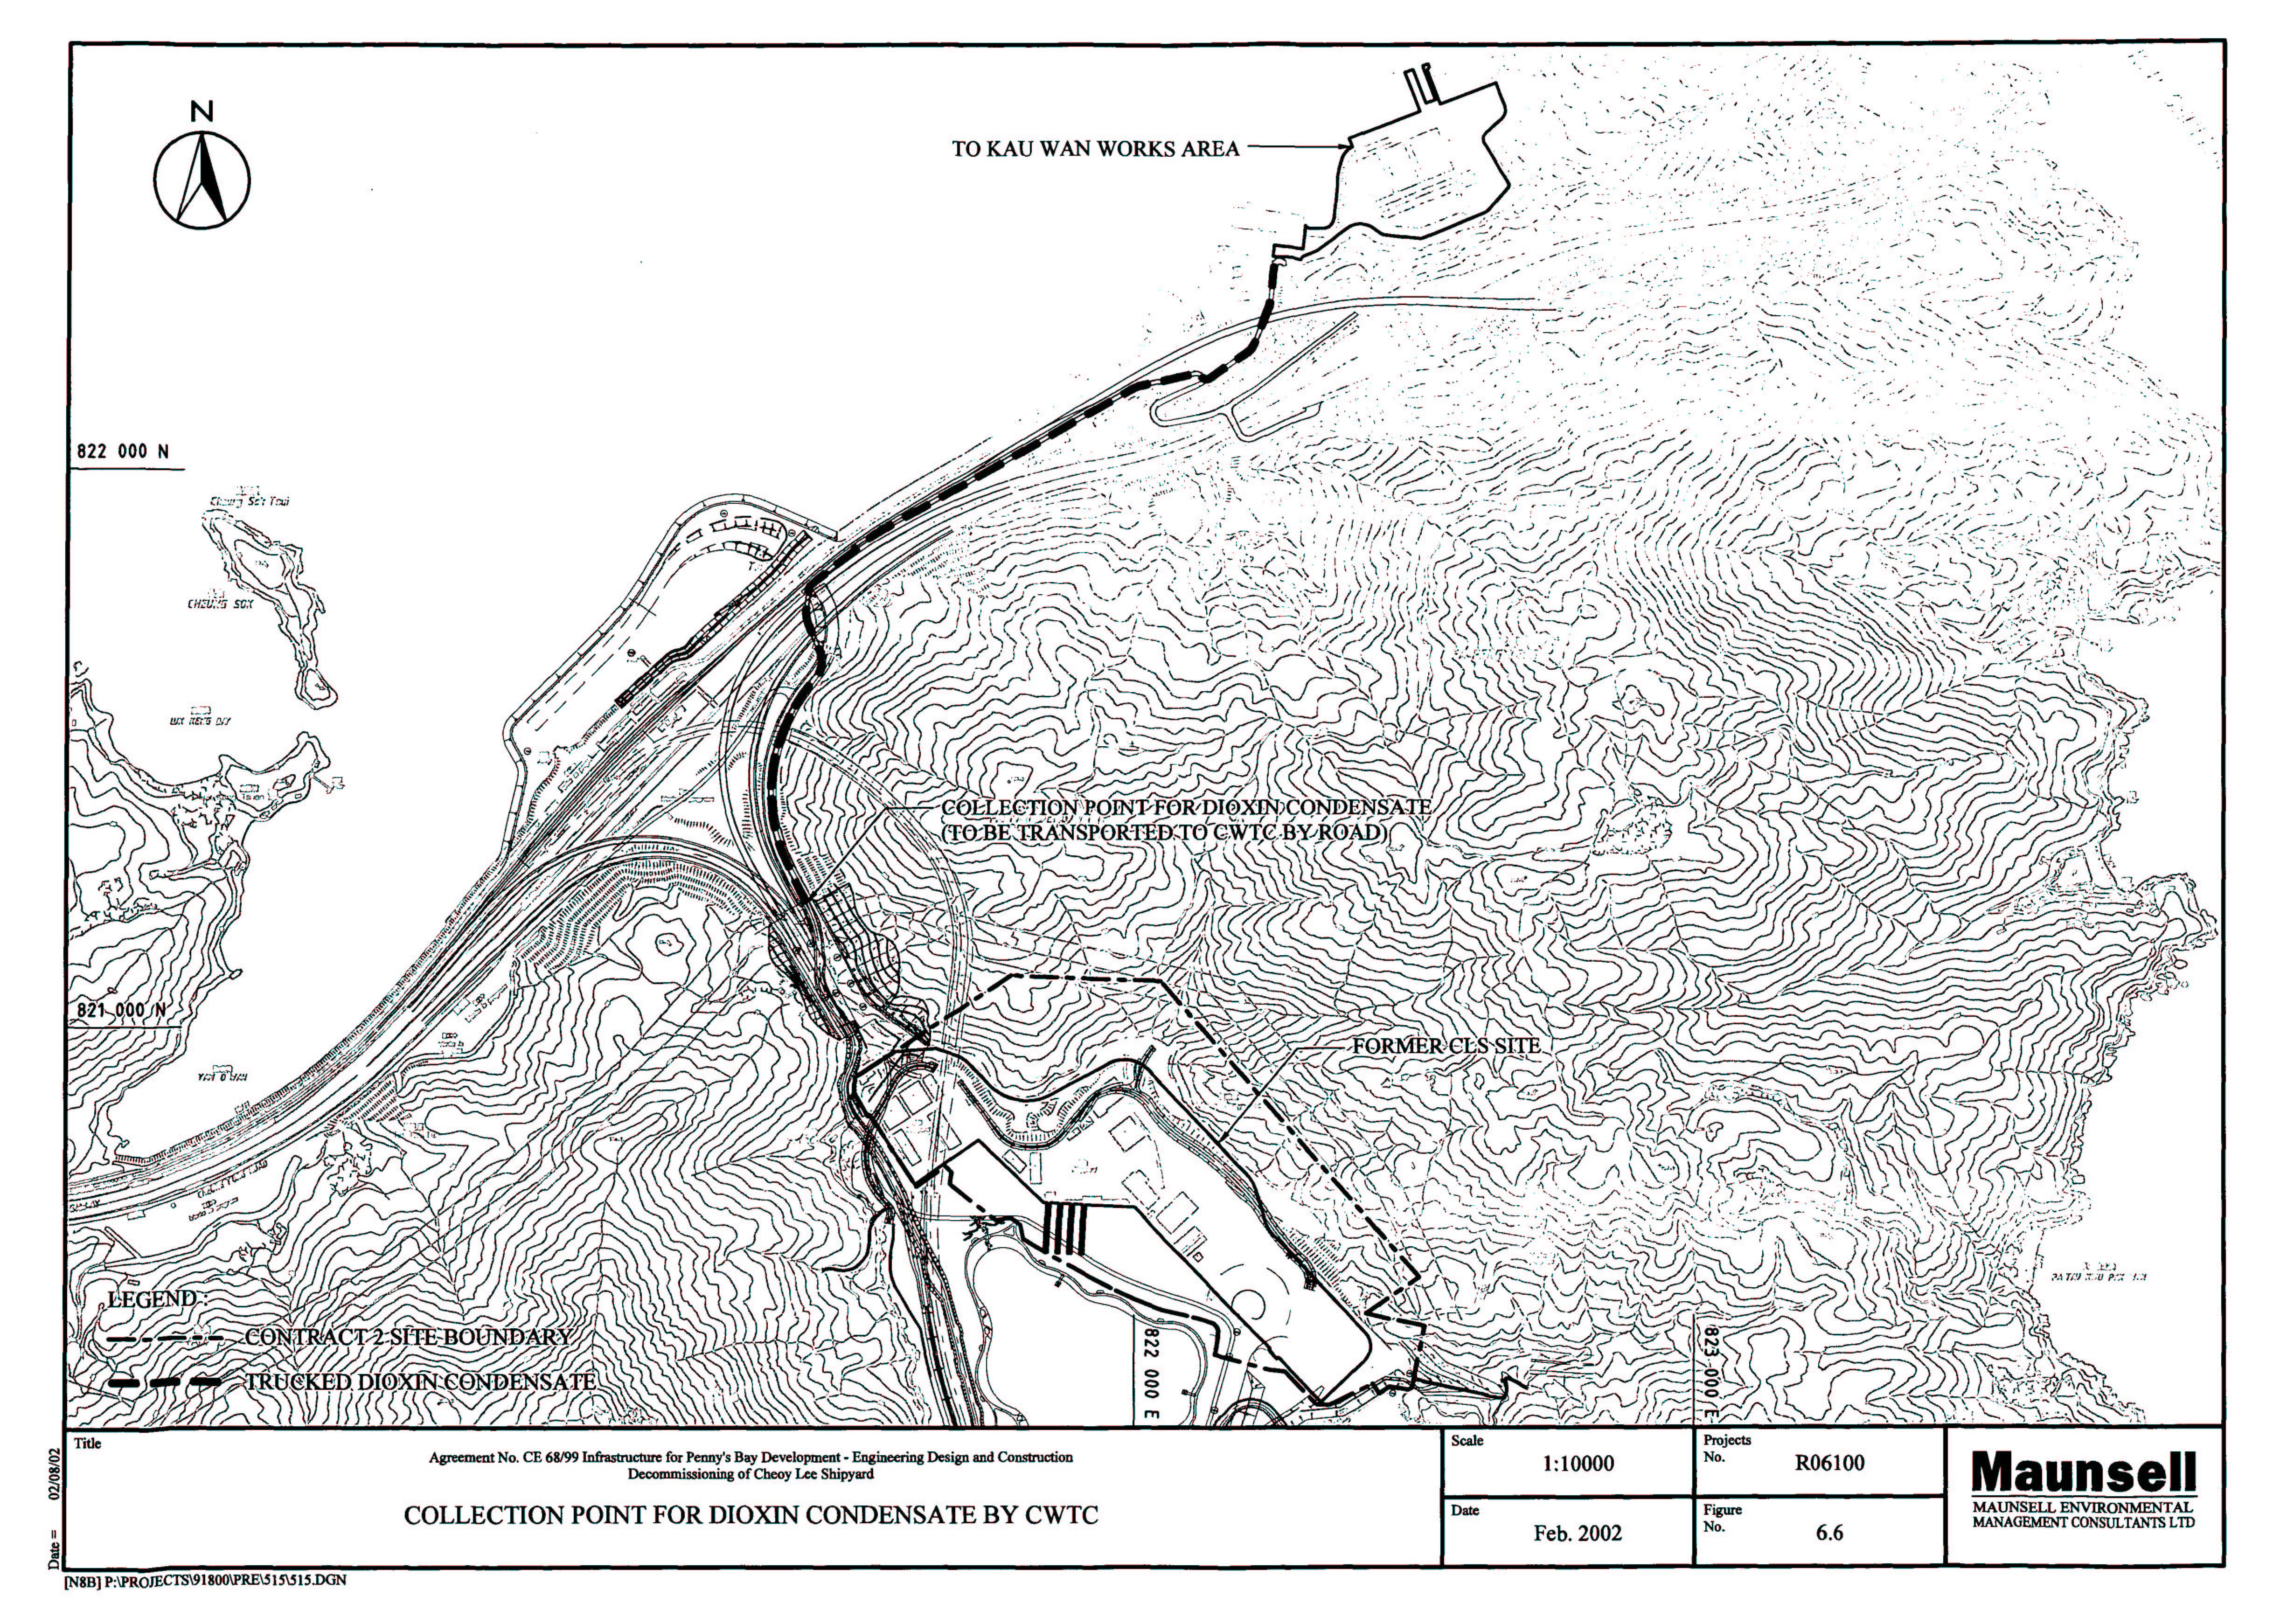
Figure 6.6 Transportation Route : Dioxin Condensate to be Tsing Yi CWTC
Figure 7.1 Locations of Reference Routine Water Quality Monitoring Stations
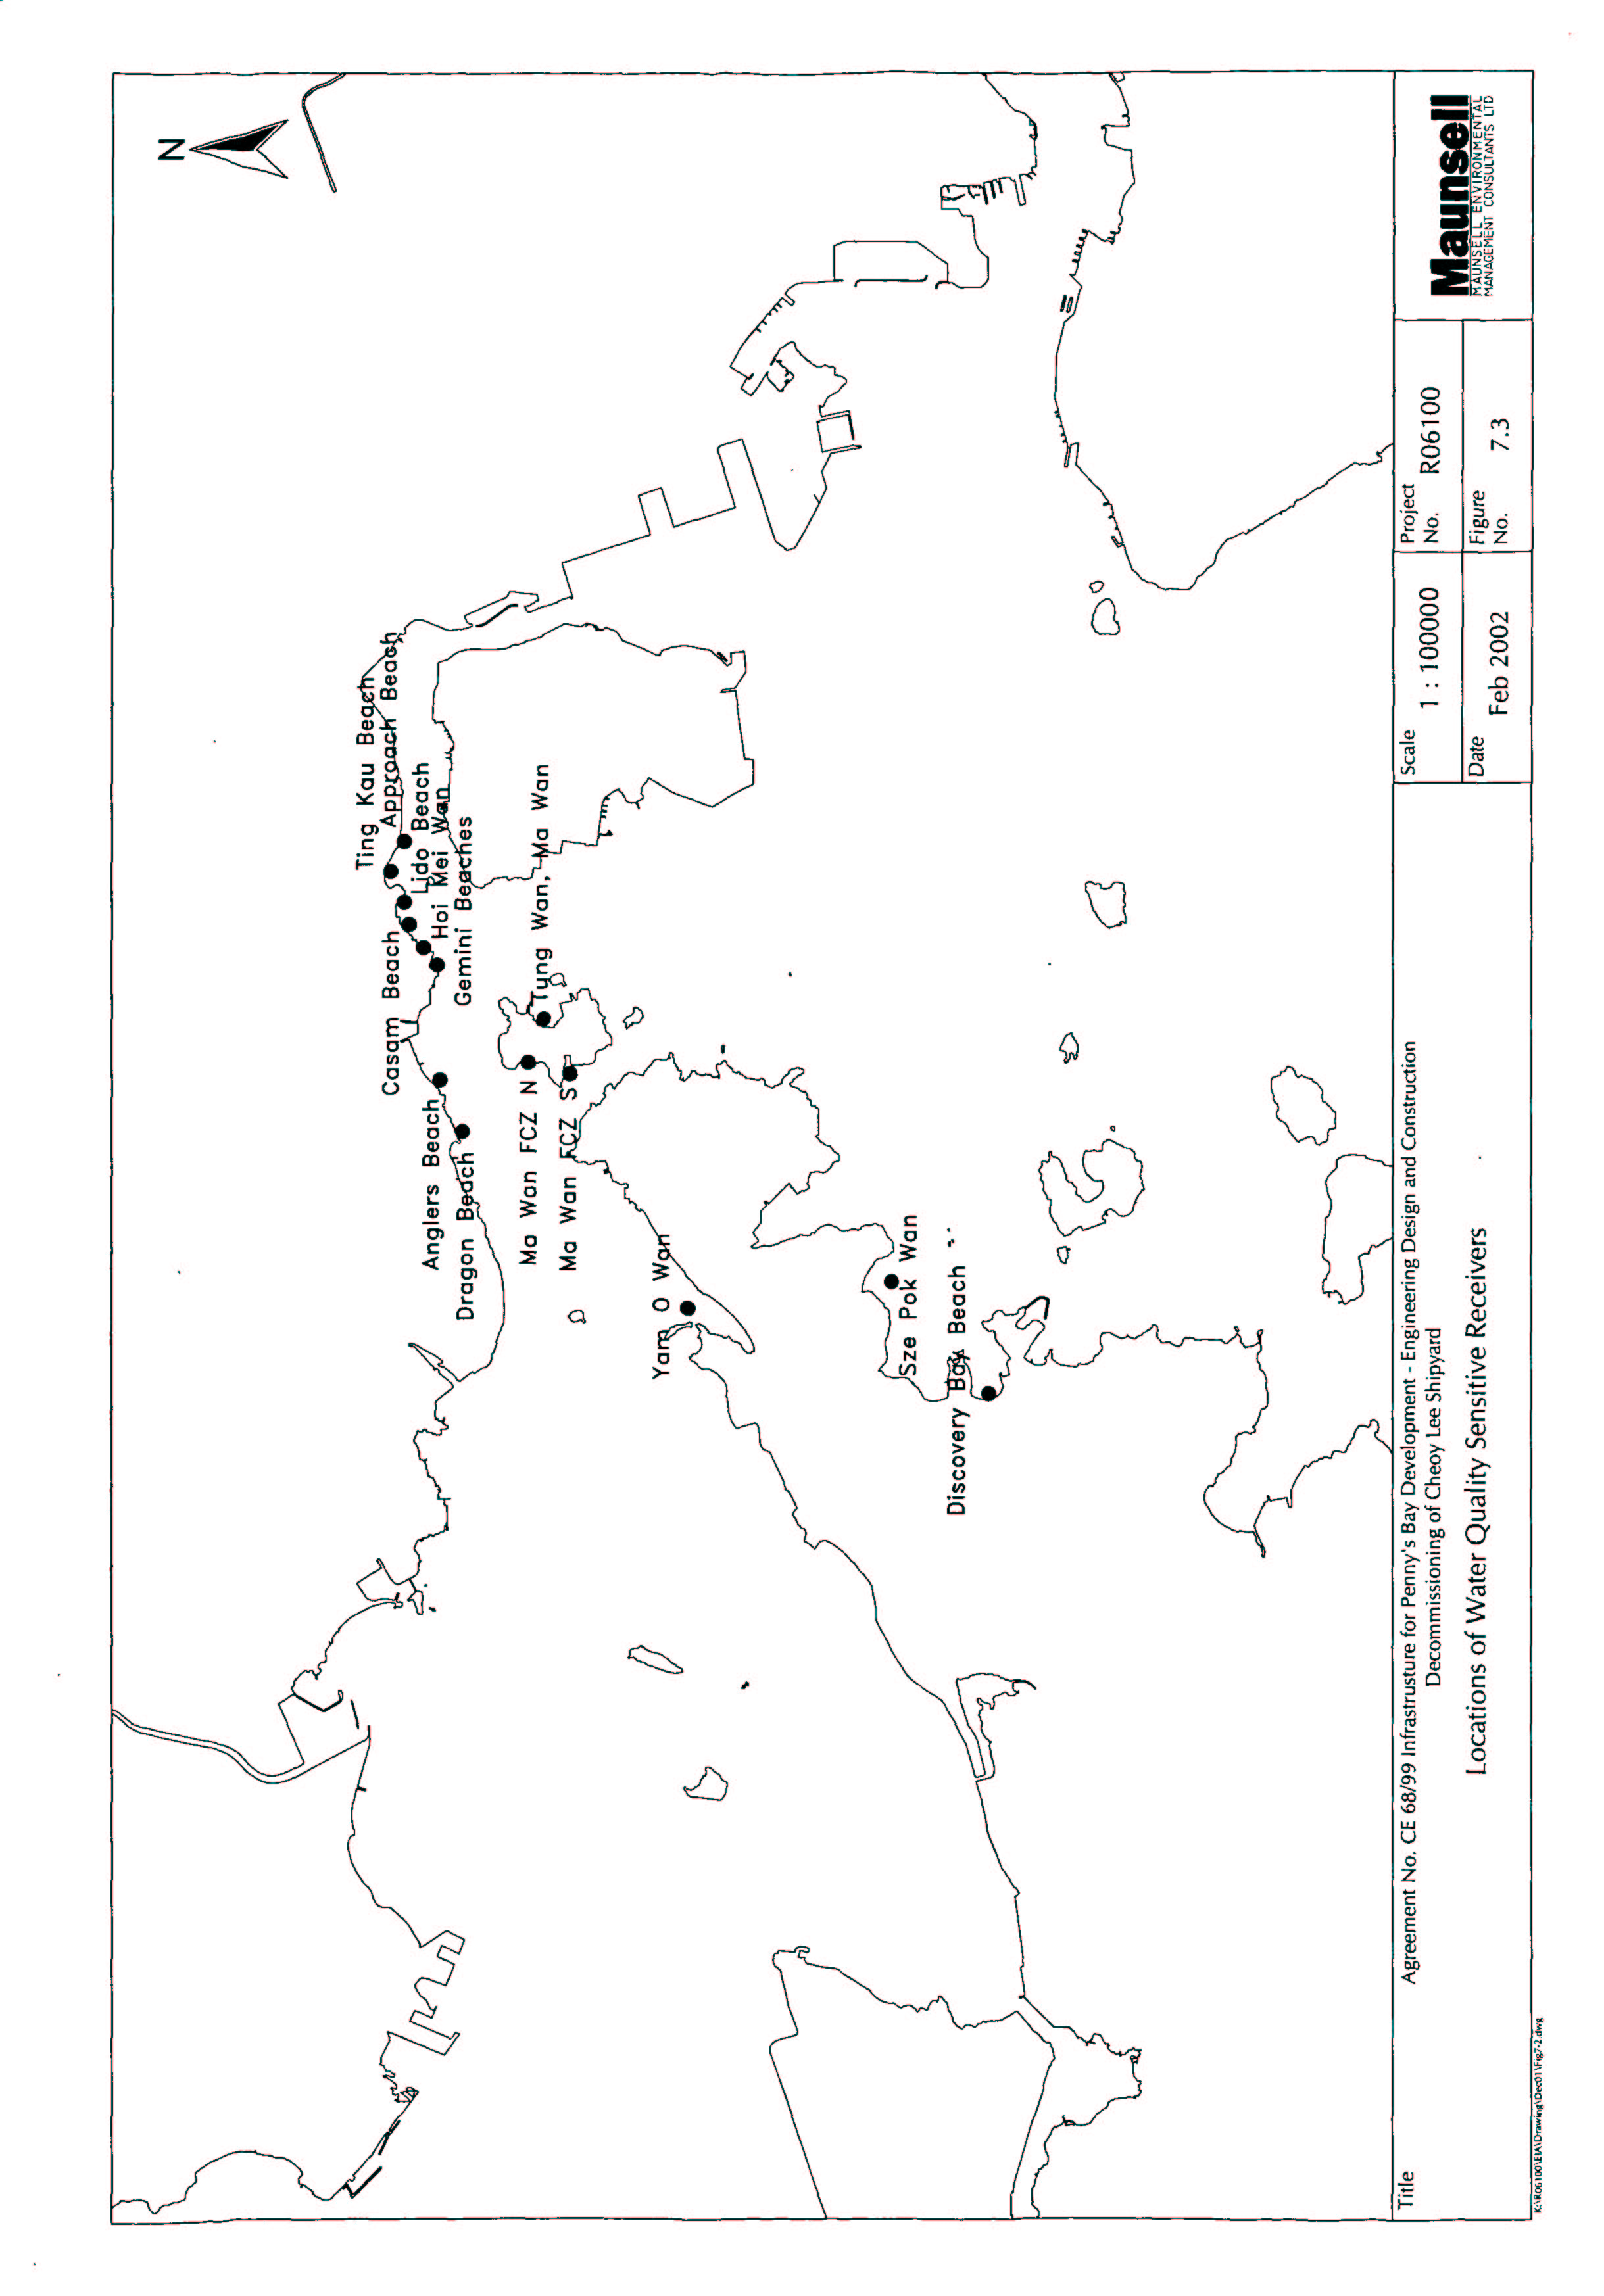
Figure 7.3 Locations of Water Quality Sensitive Receivers
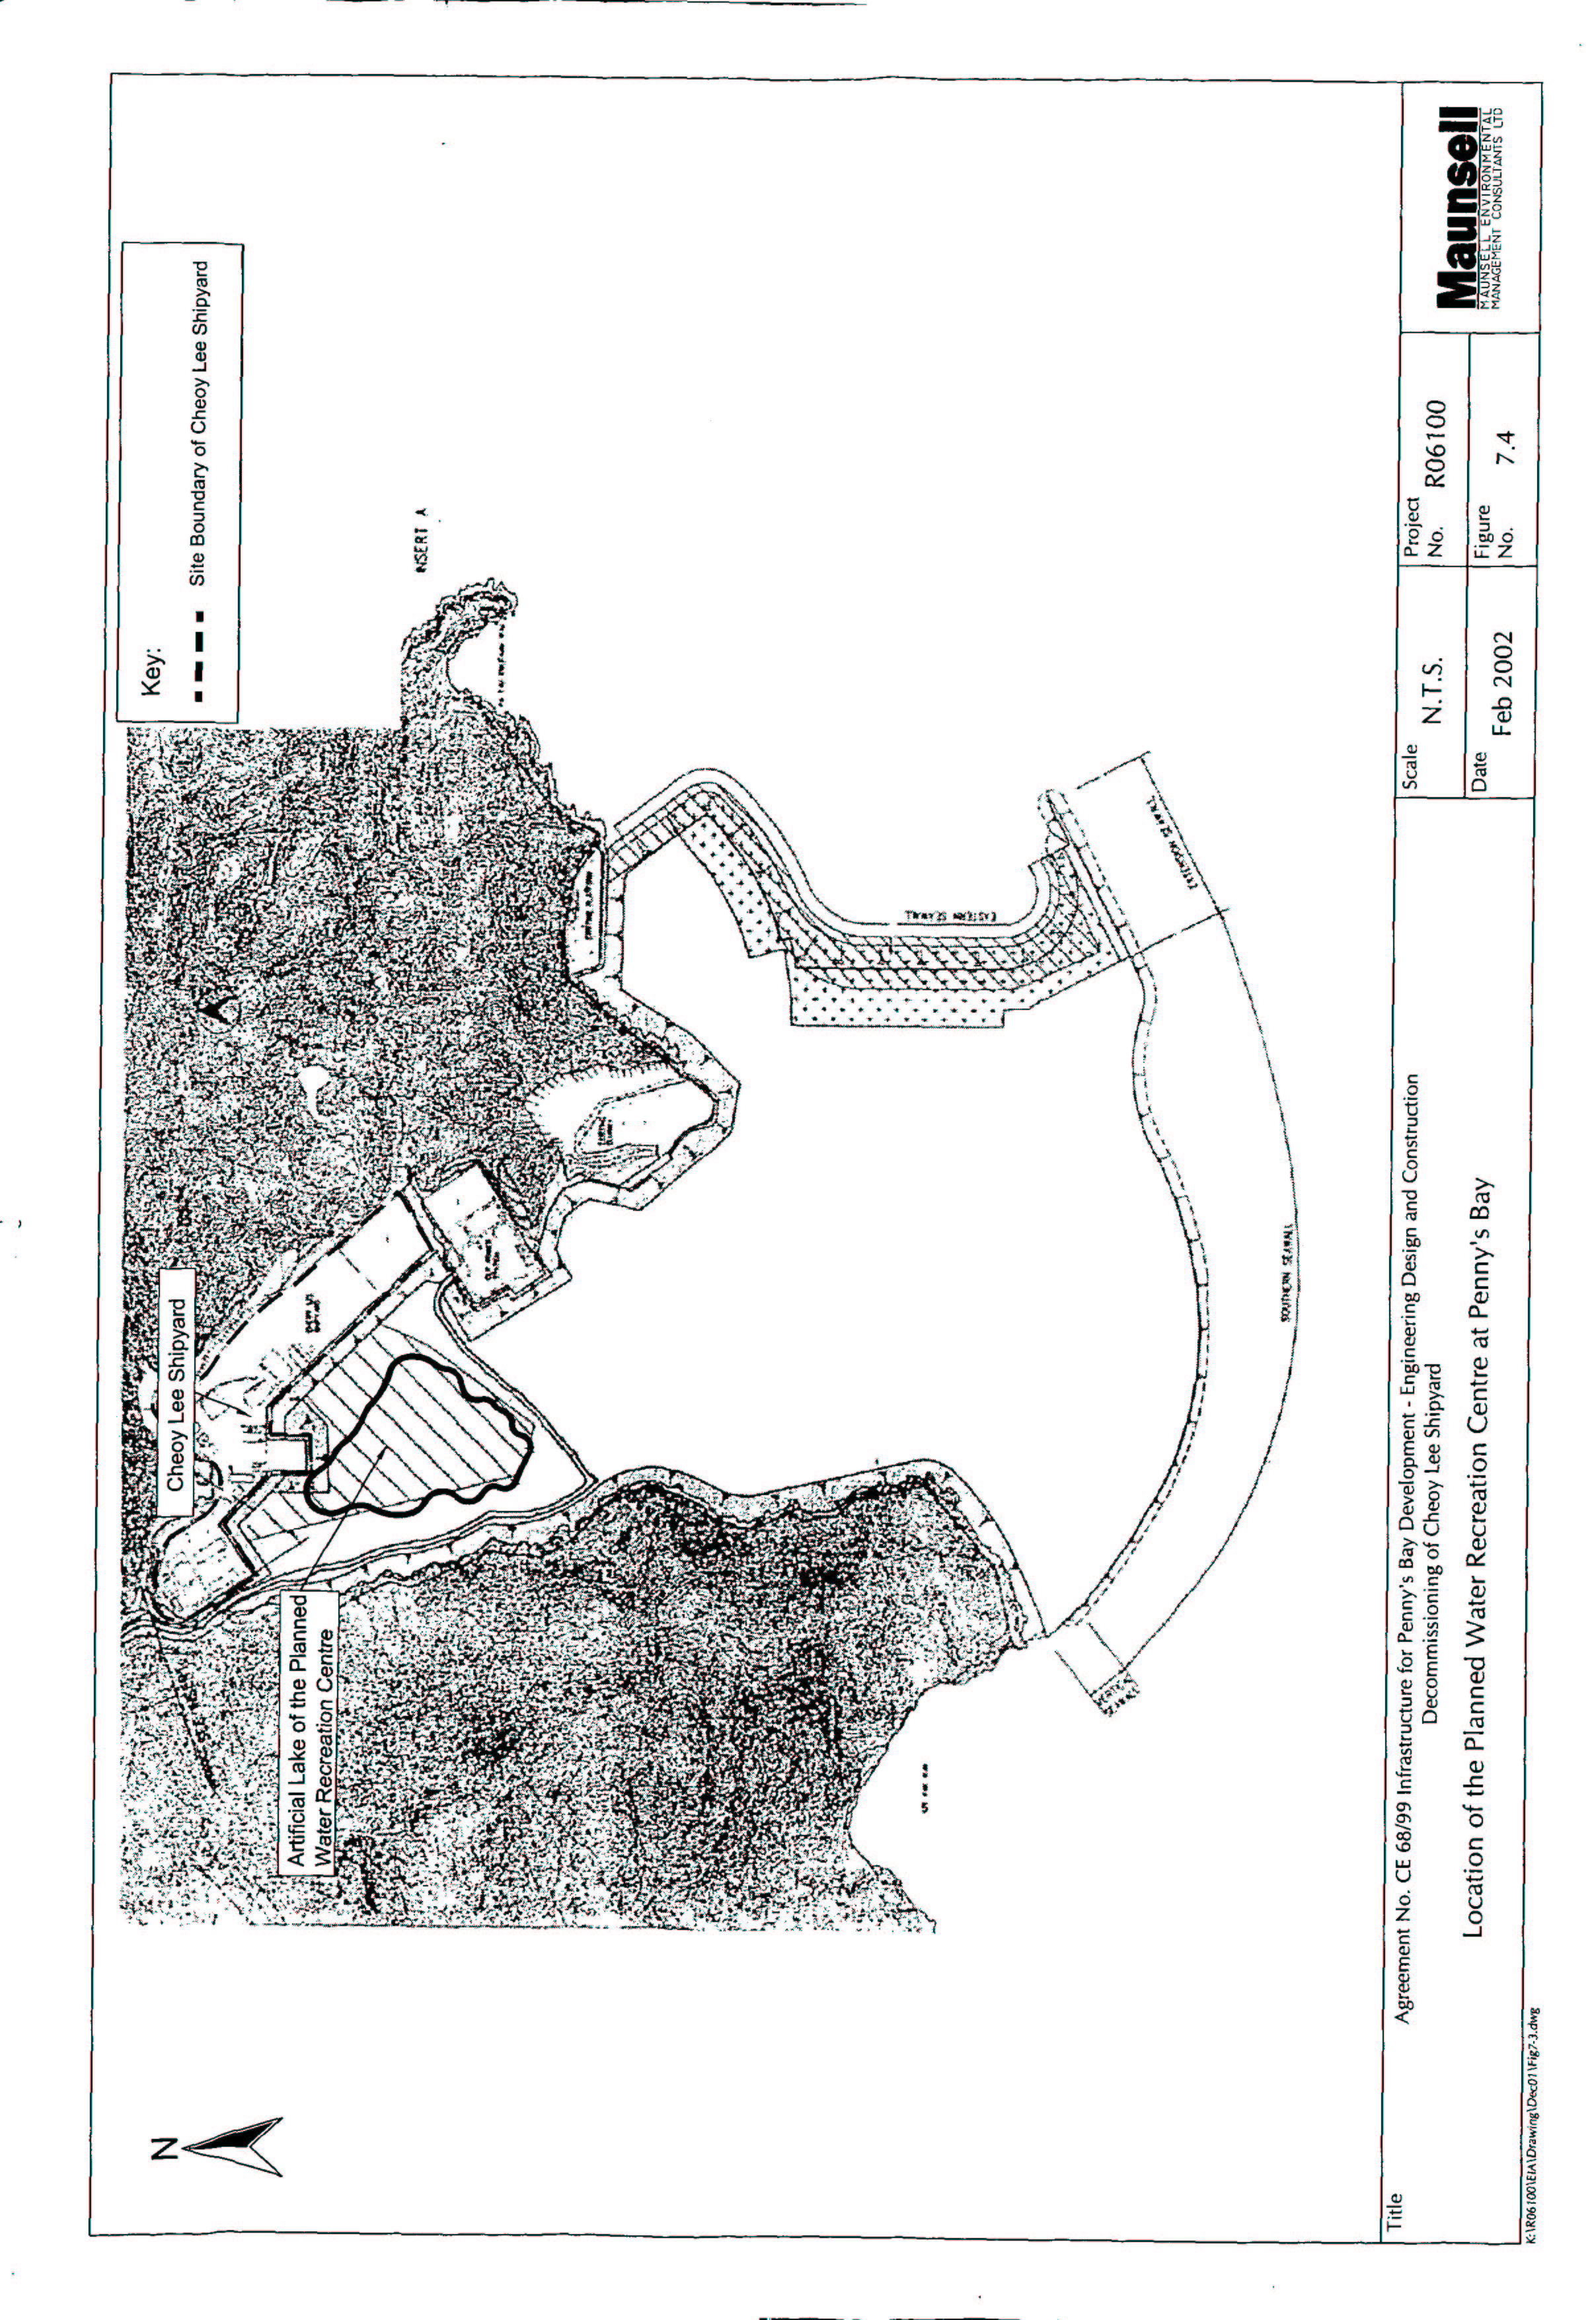
Figure 7.4 Location of the Planned Water Recreation Centre at Penny’s Bay
Figure 8.1 Habitat Map – Cheoy Lee Shipyard (2 Sheets)
Figure 8.2 Habitat Map – To Kau Wan (2 Sheets)
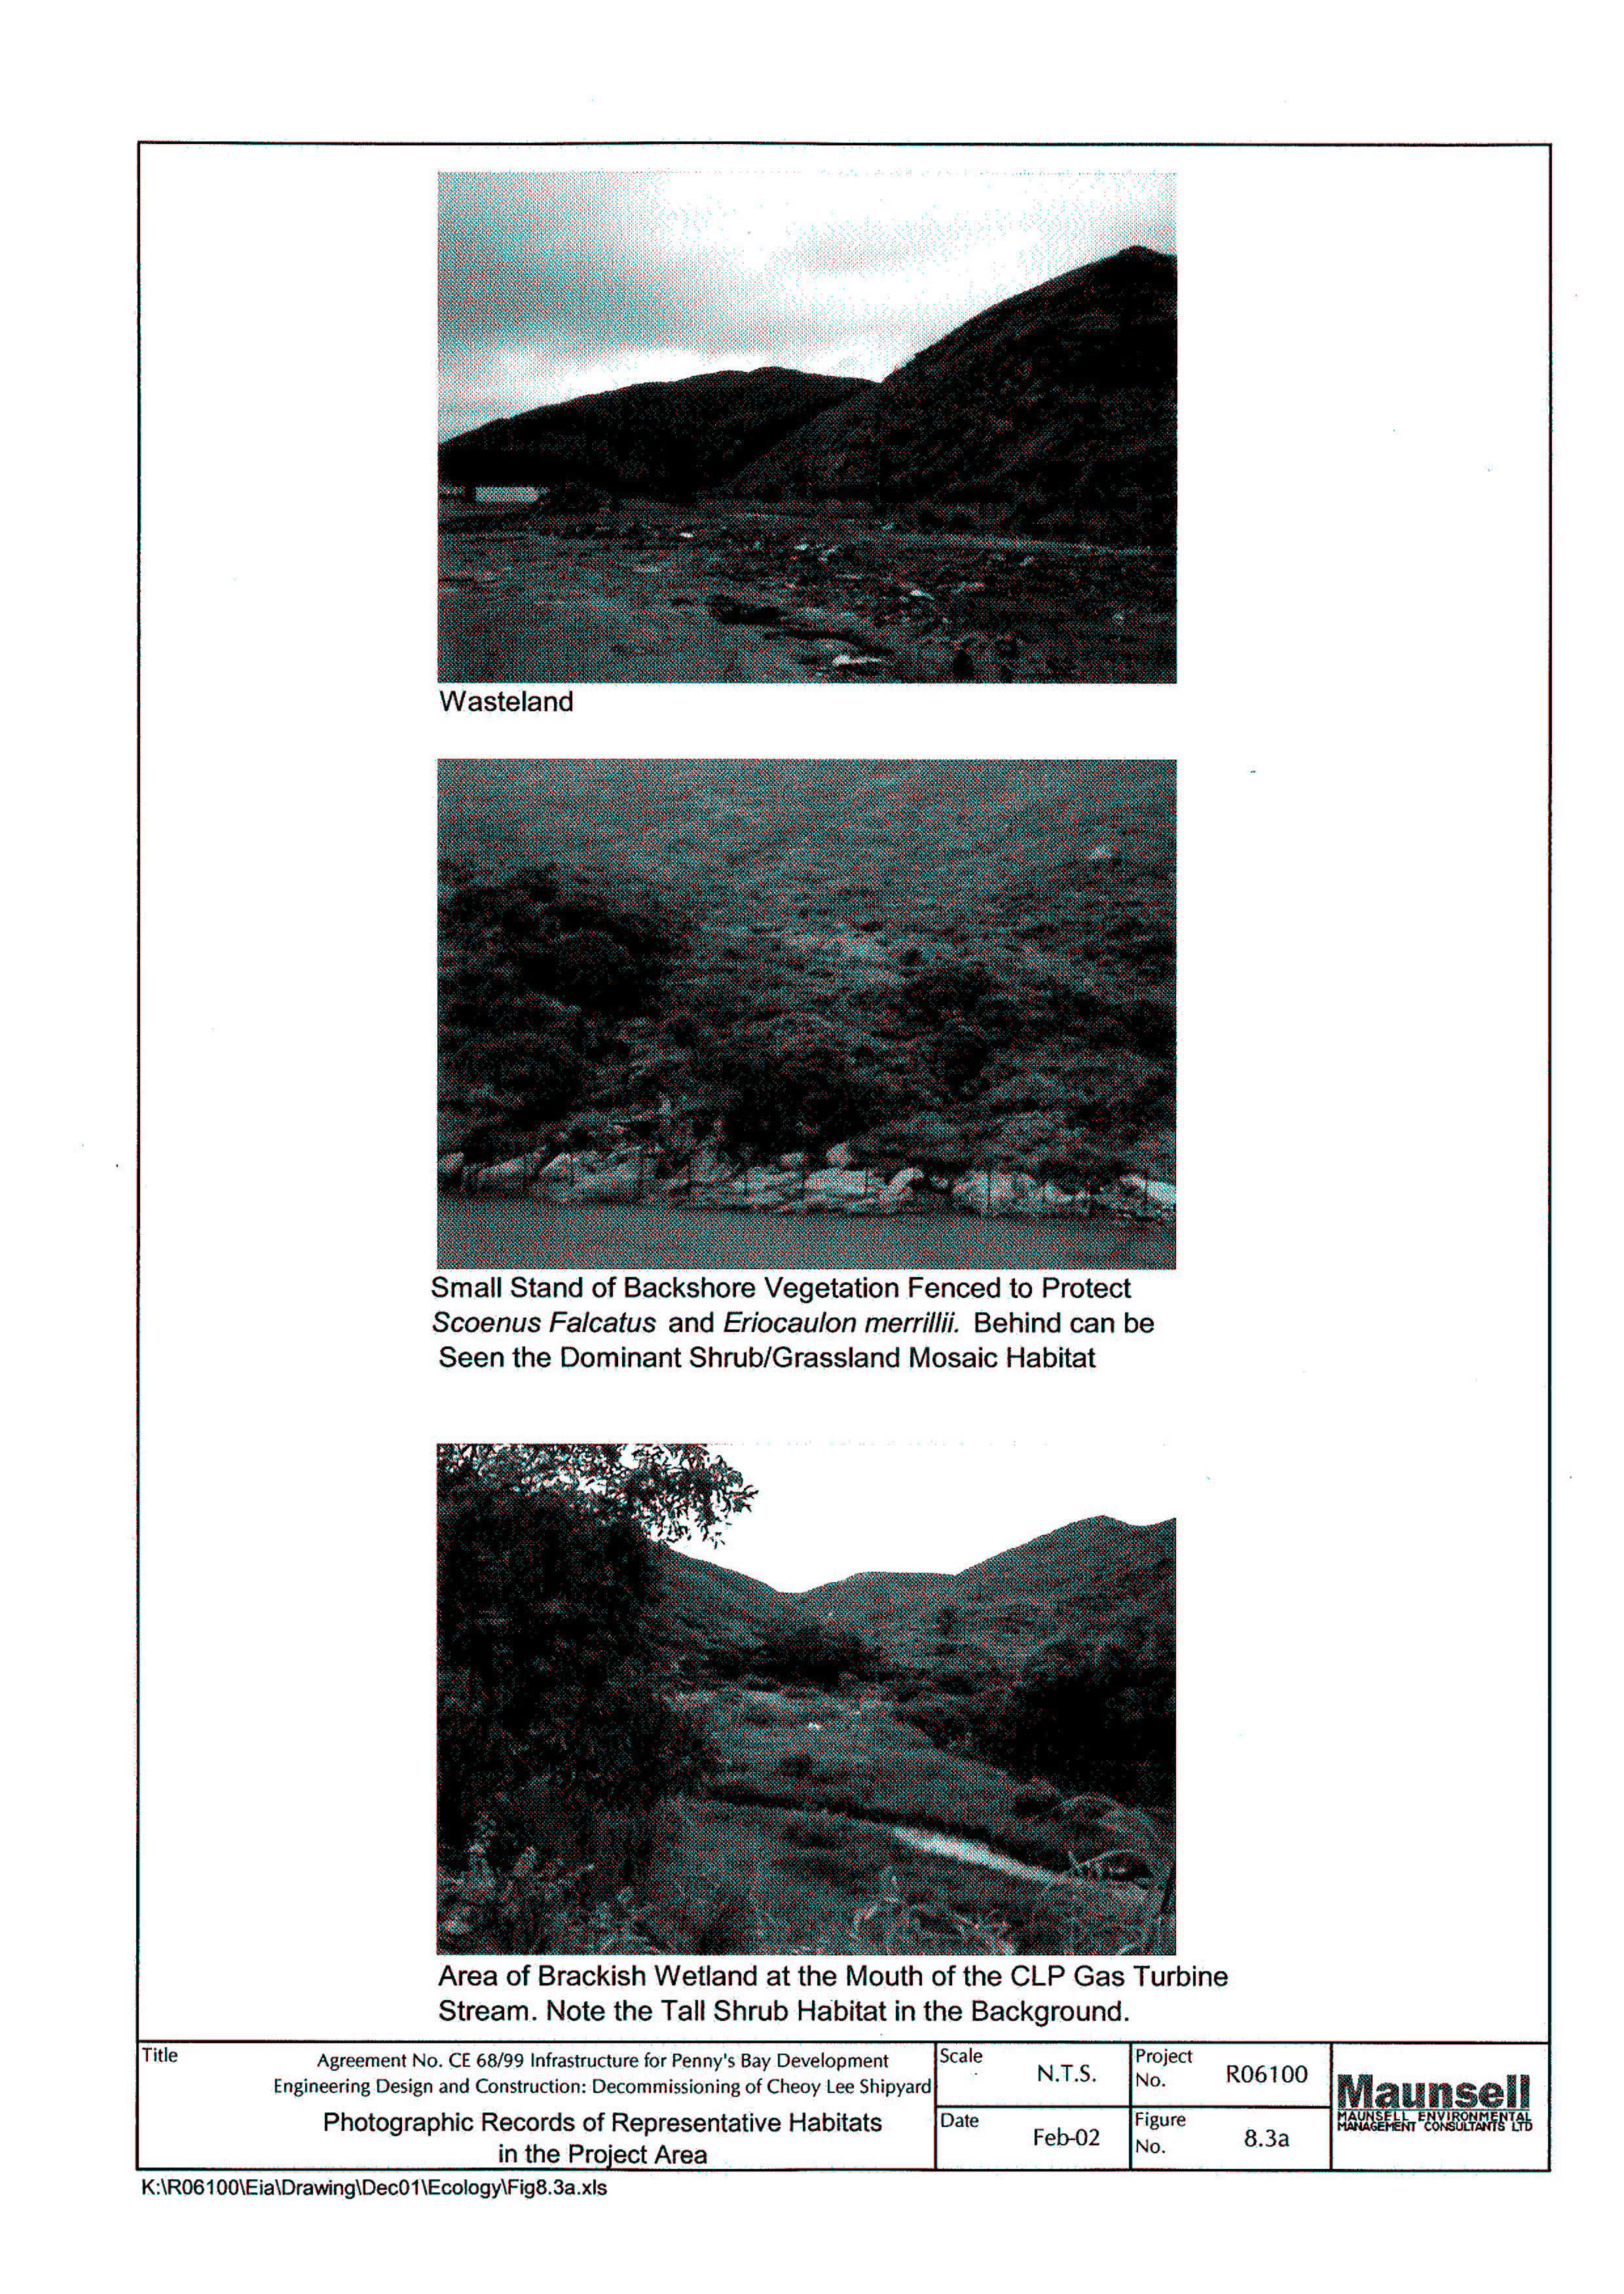
Figure 8.3a Photographic Records of Representative Habitats in the Project Area
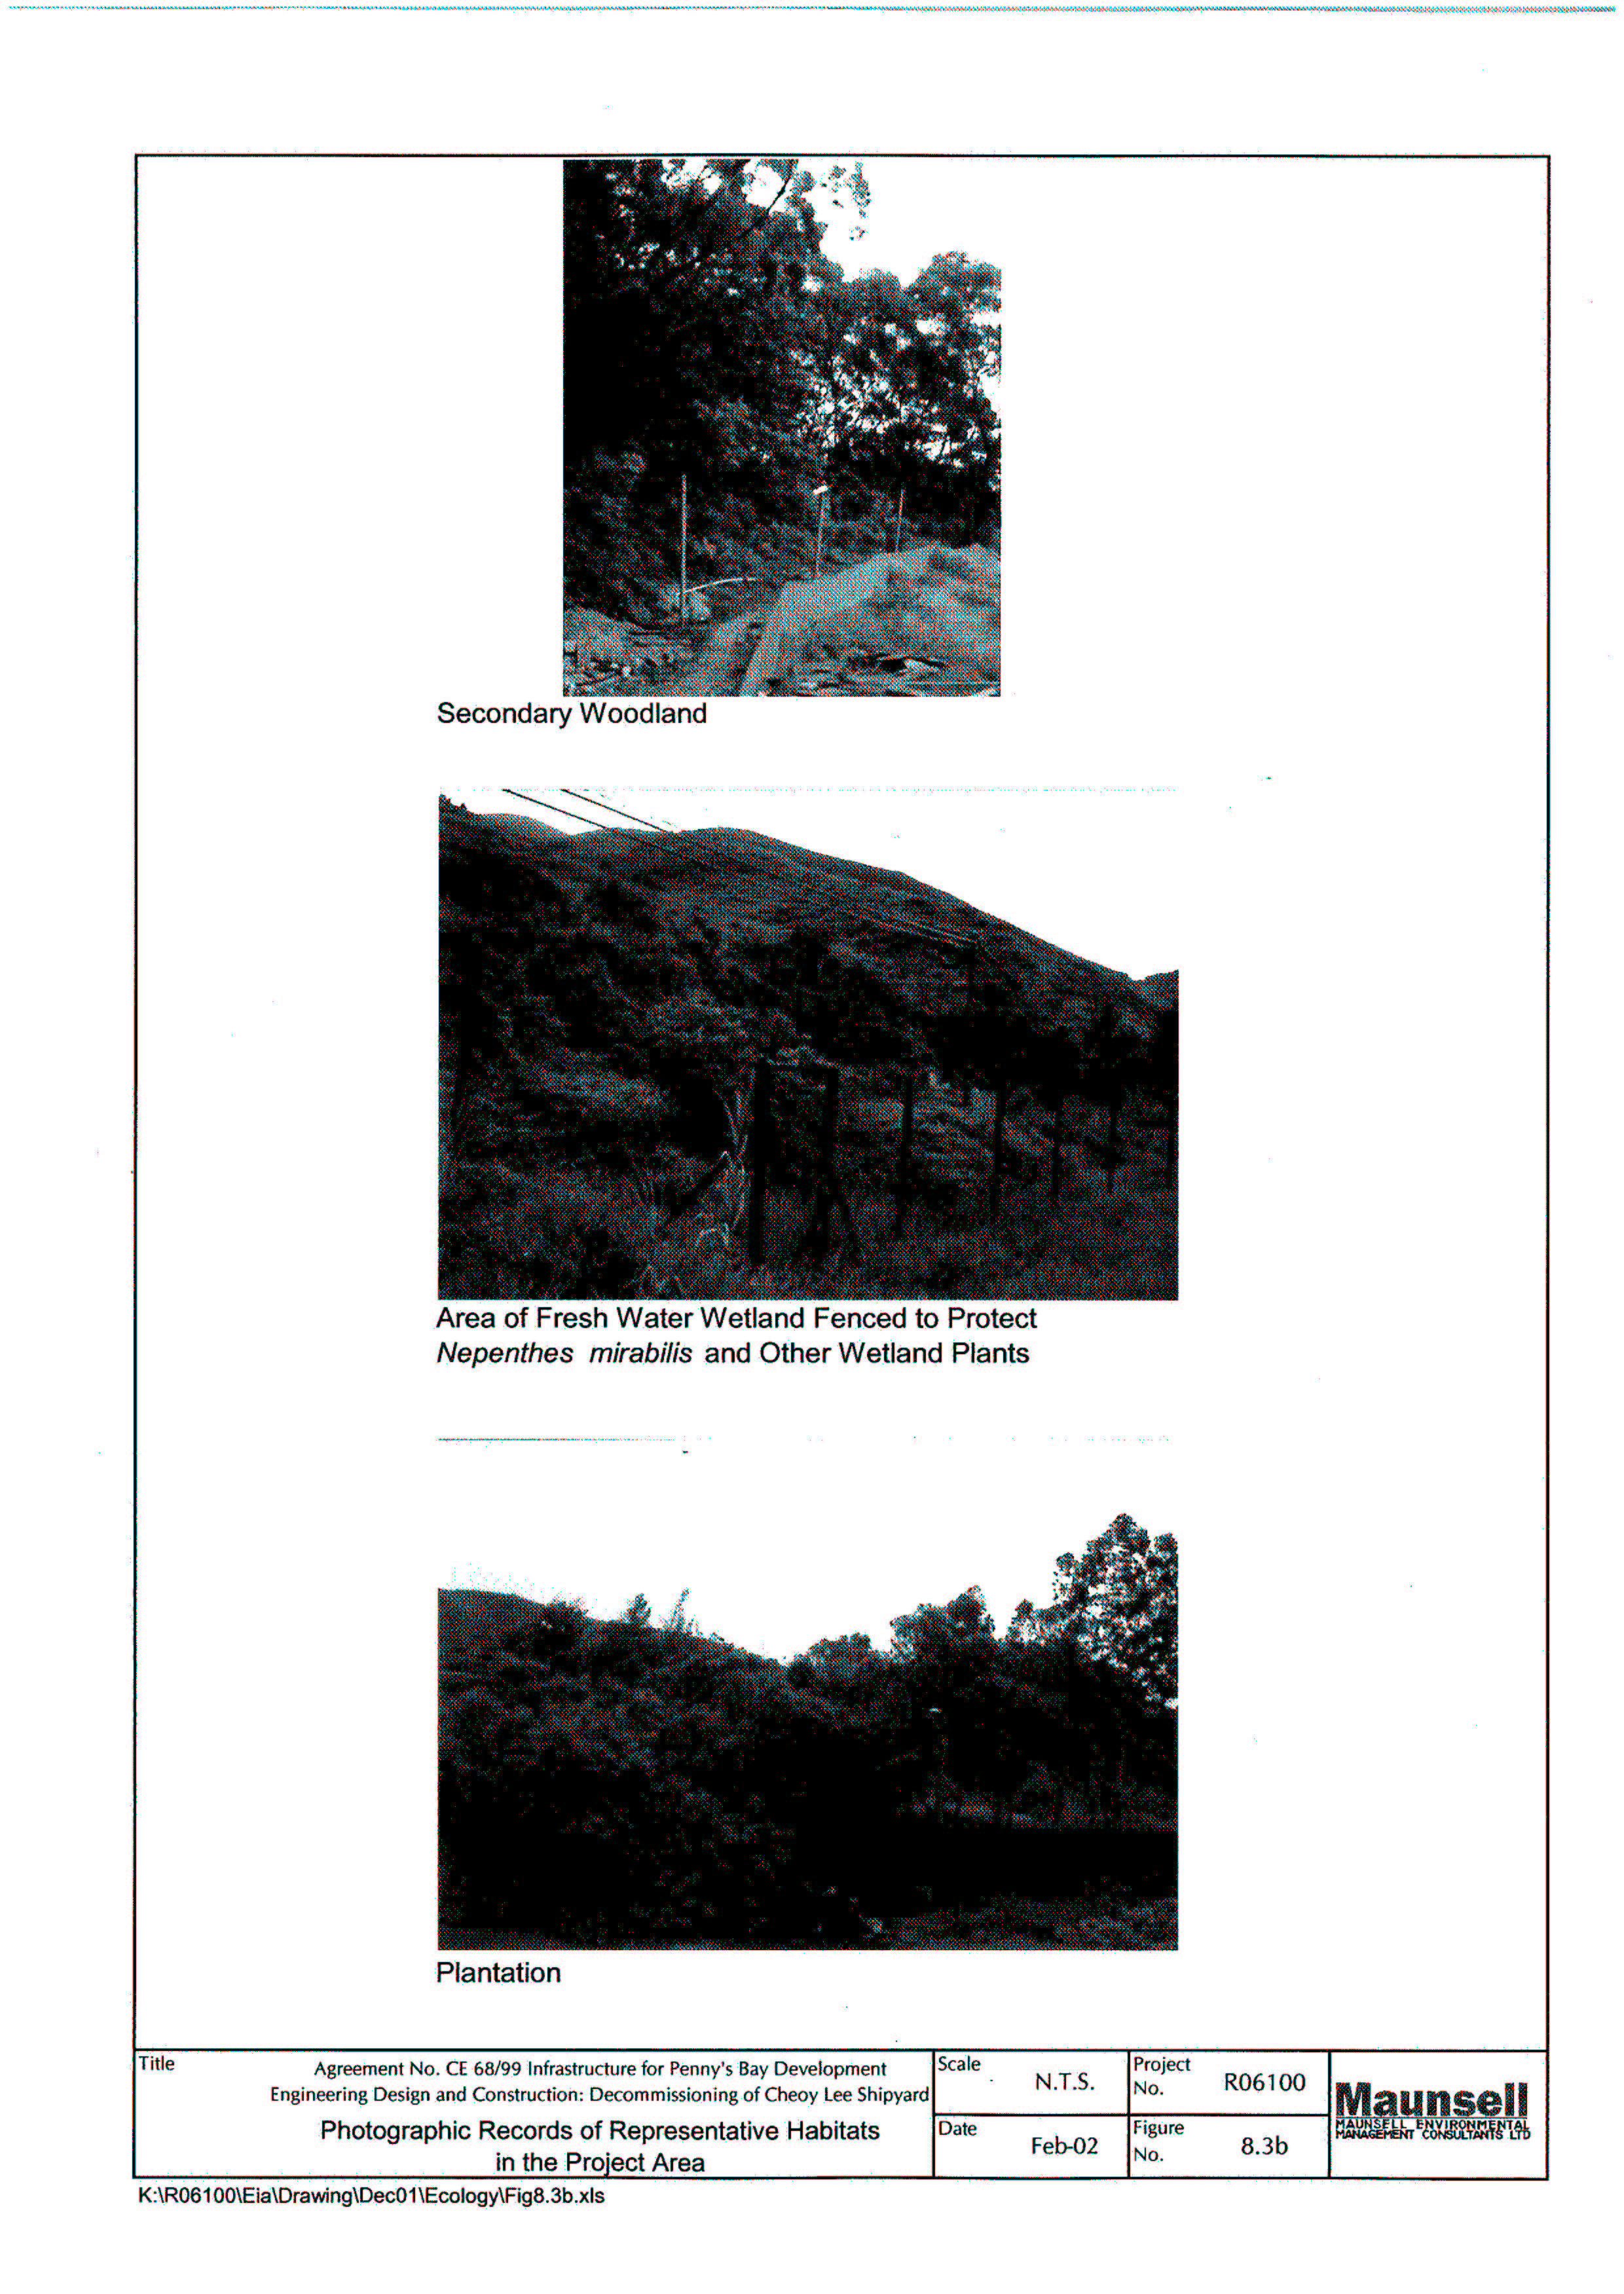
Figure 8.3b Photographic Records of Representative Habitats in the Project
Area
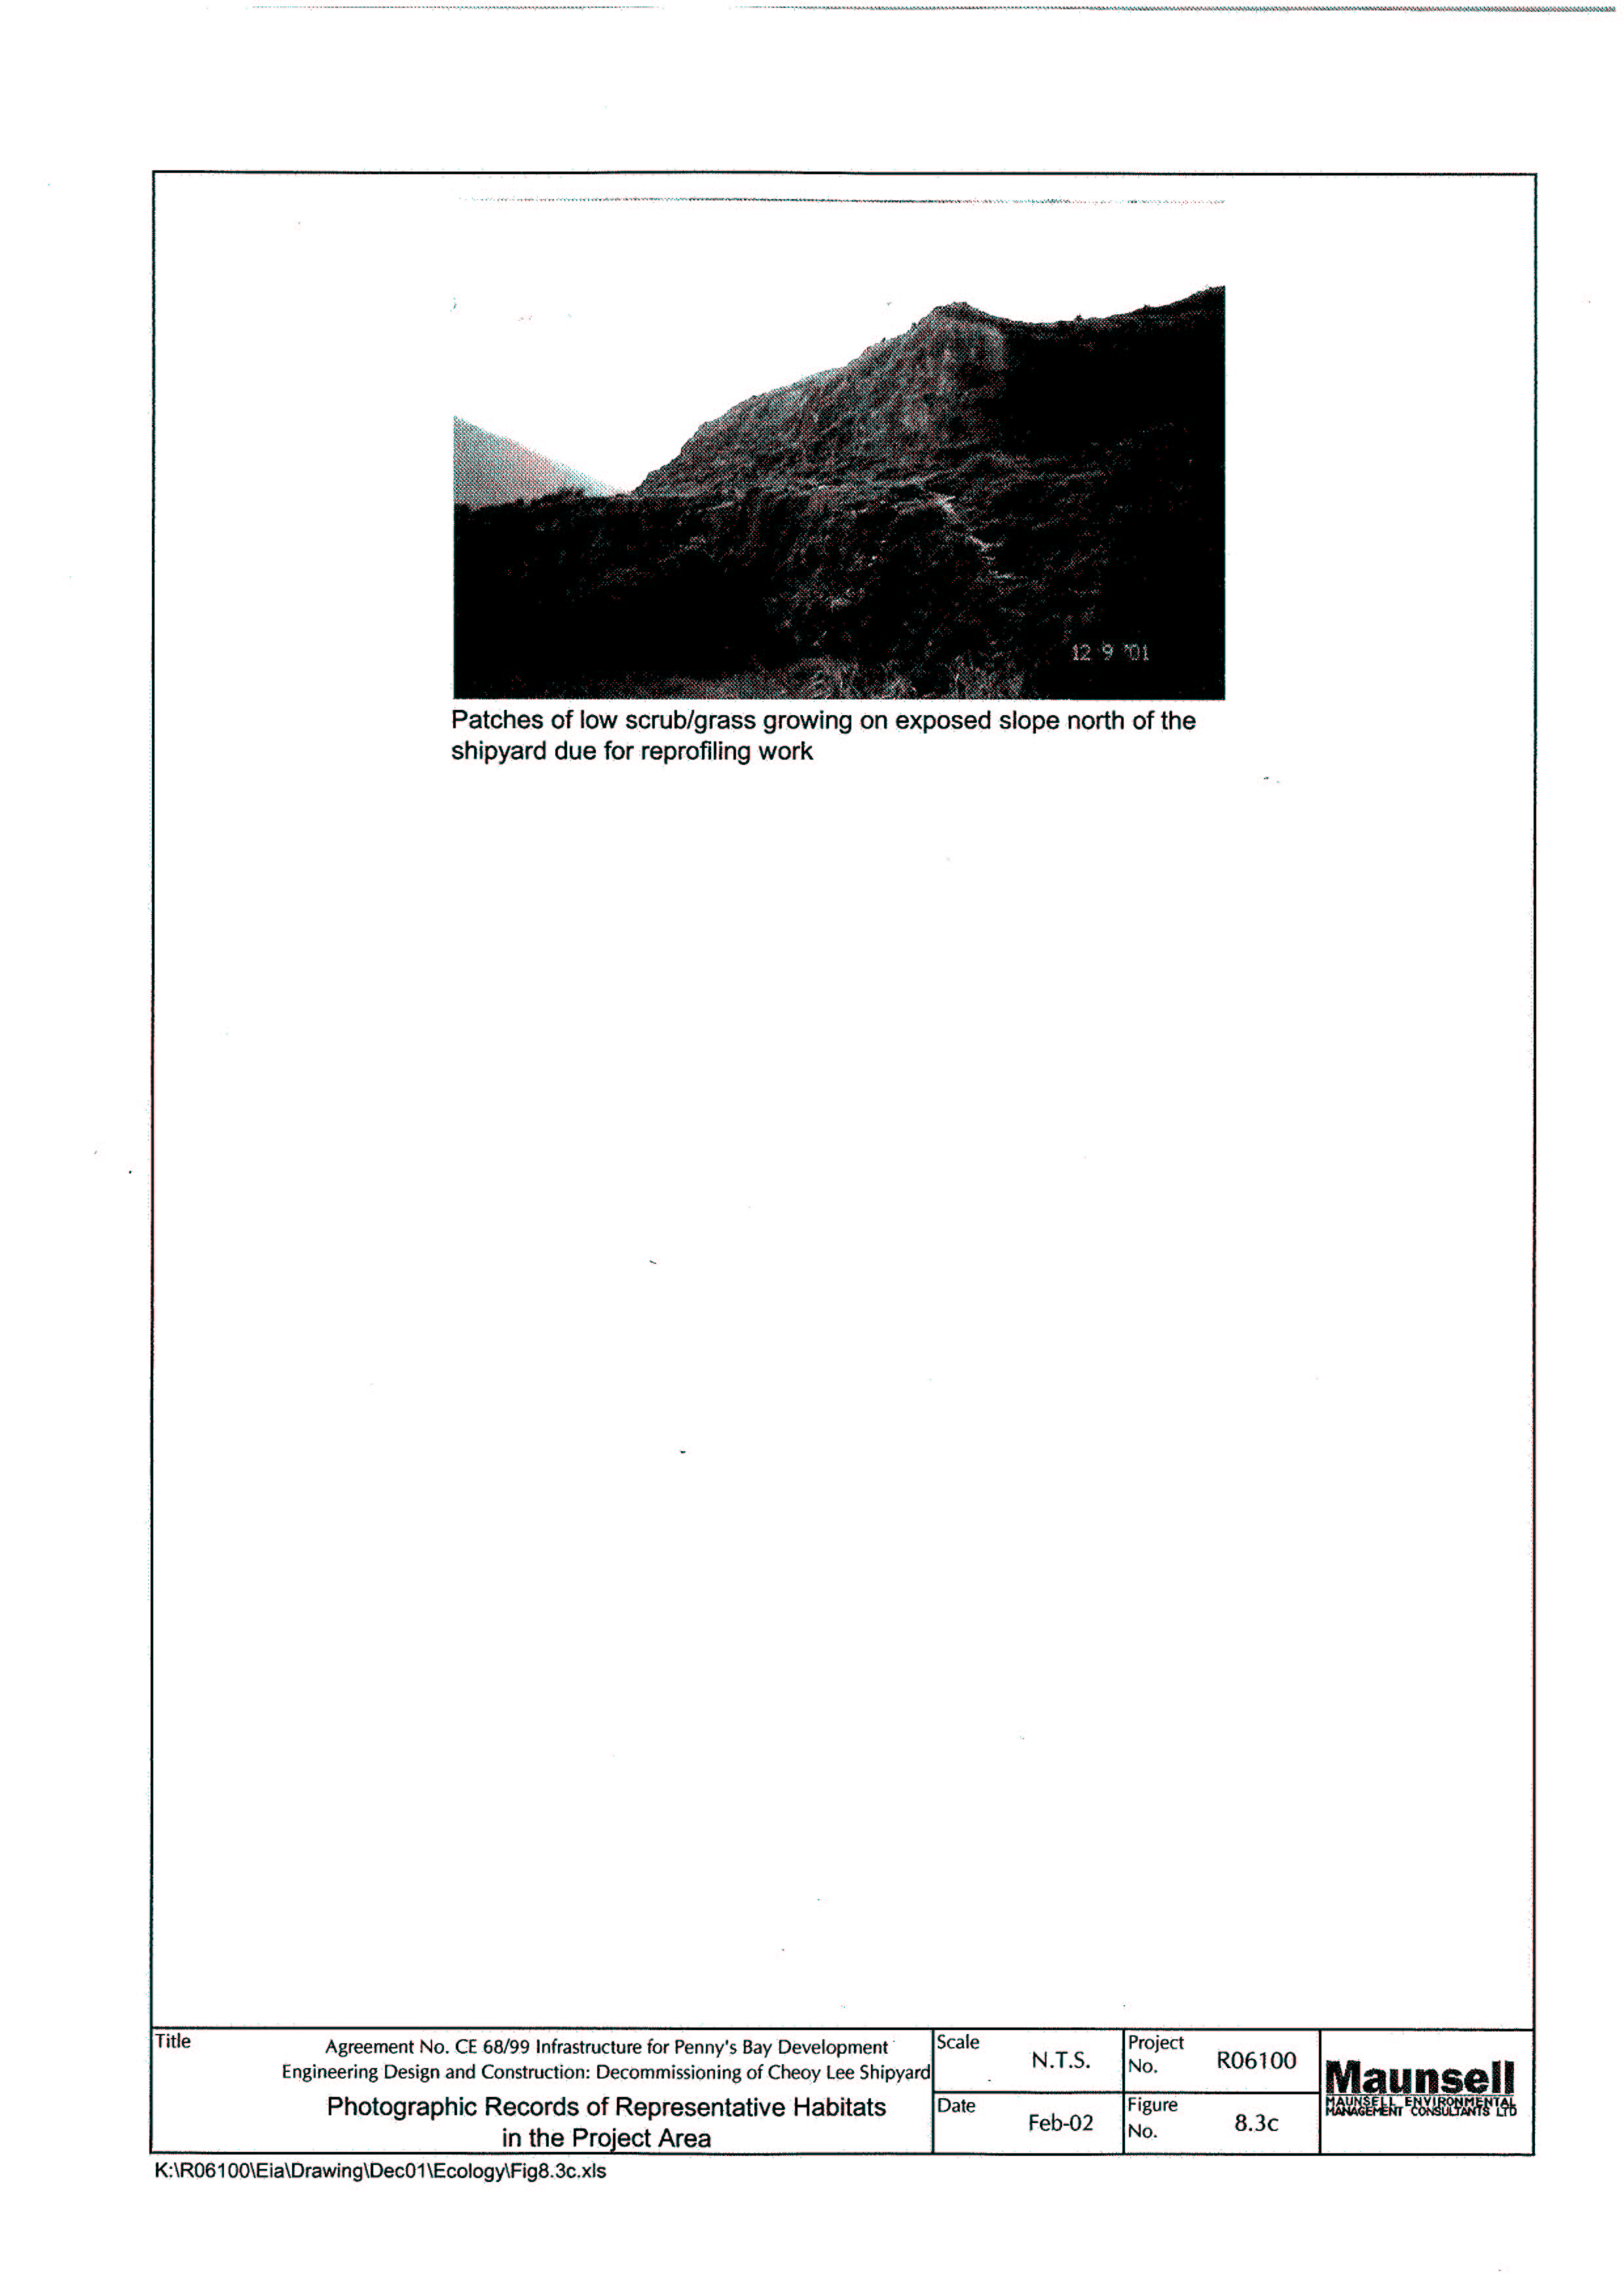
Figure 8.3c Photographic Records of Representative Habitats in the Project Area
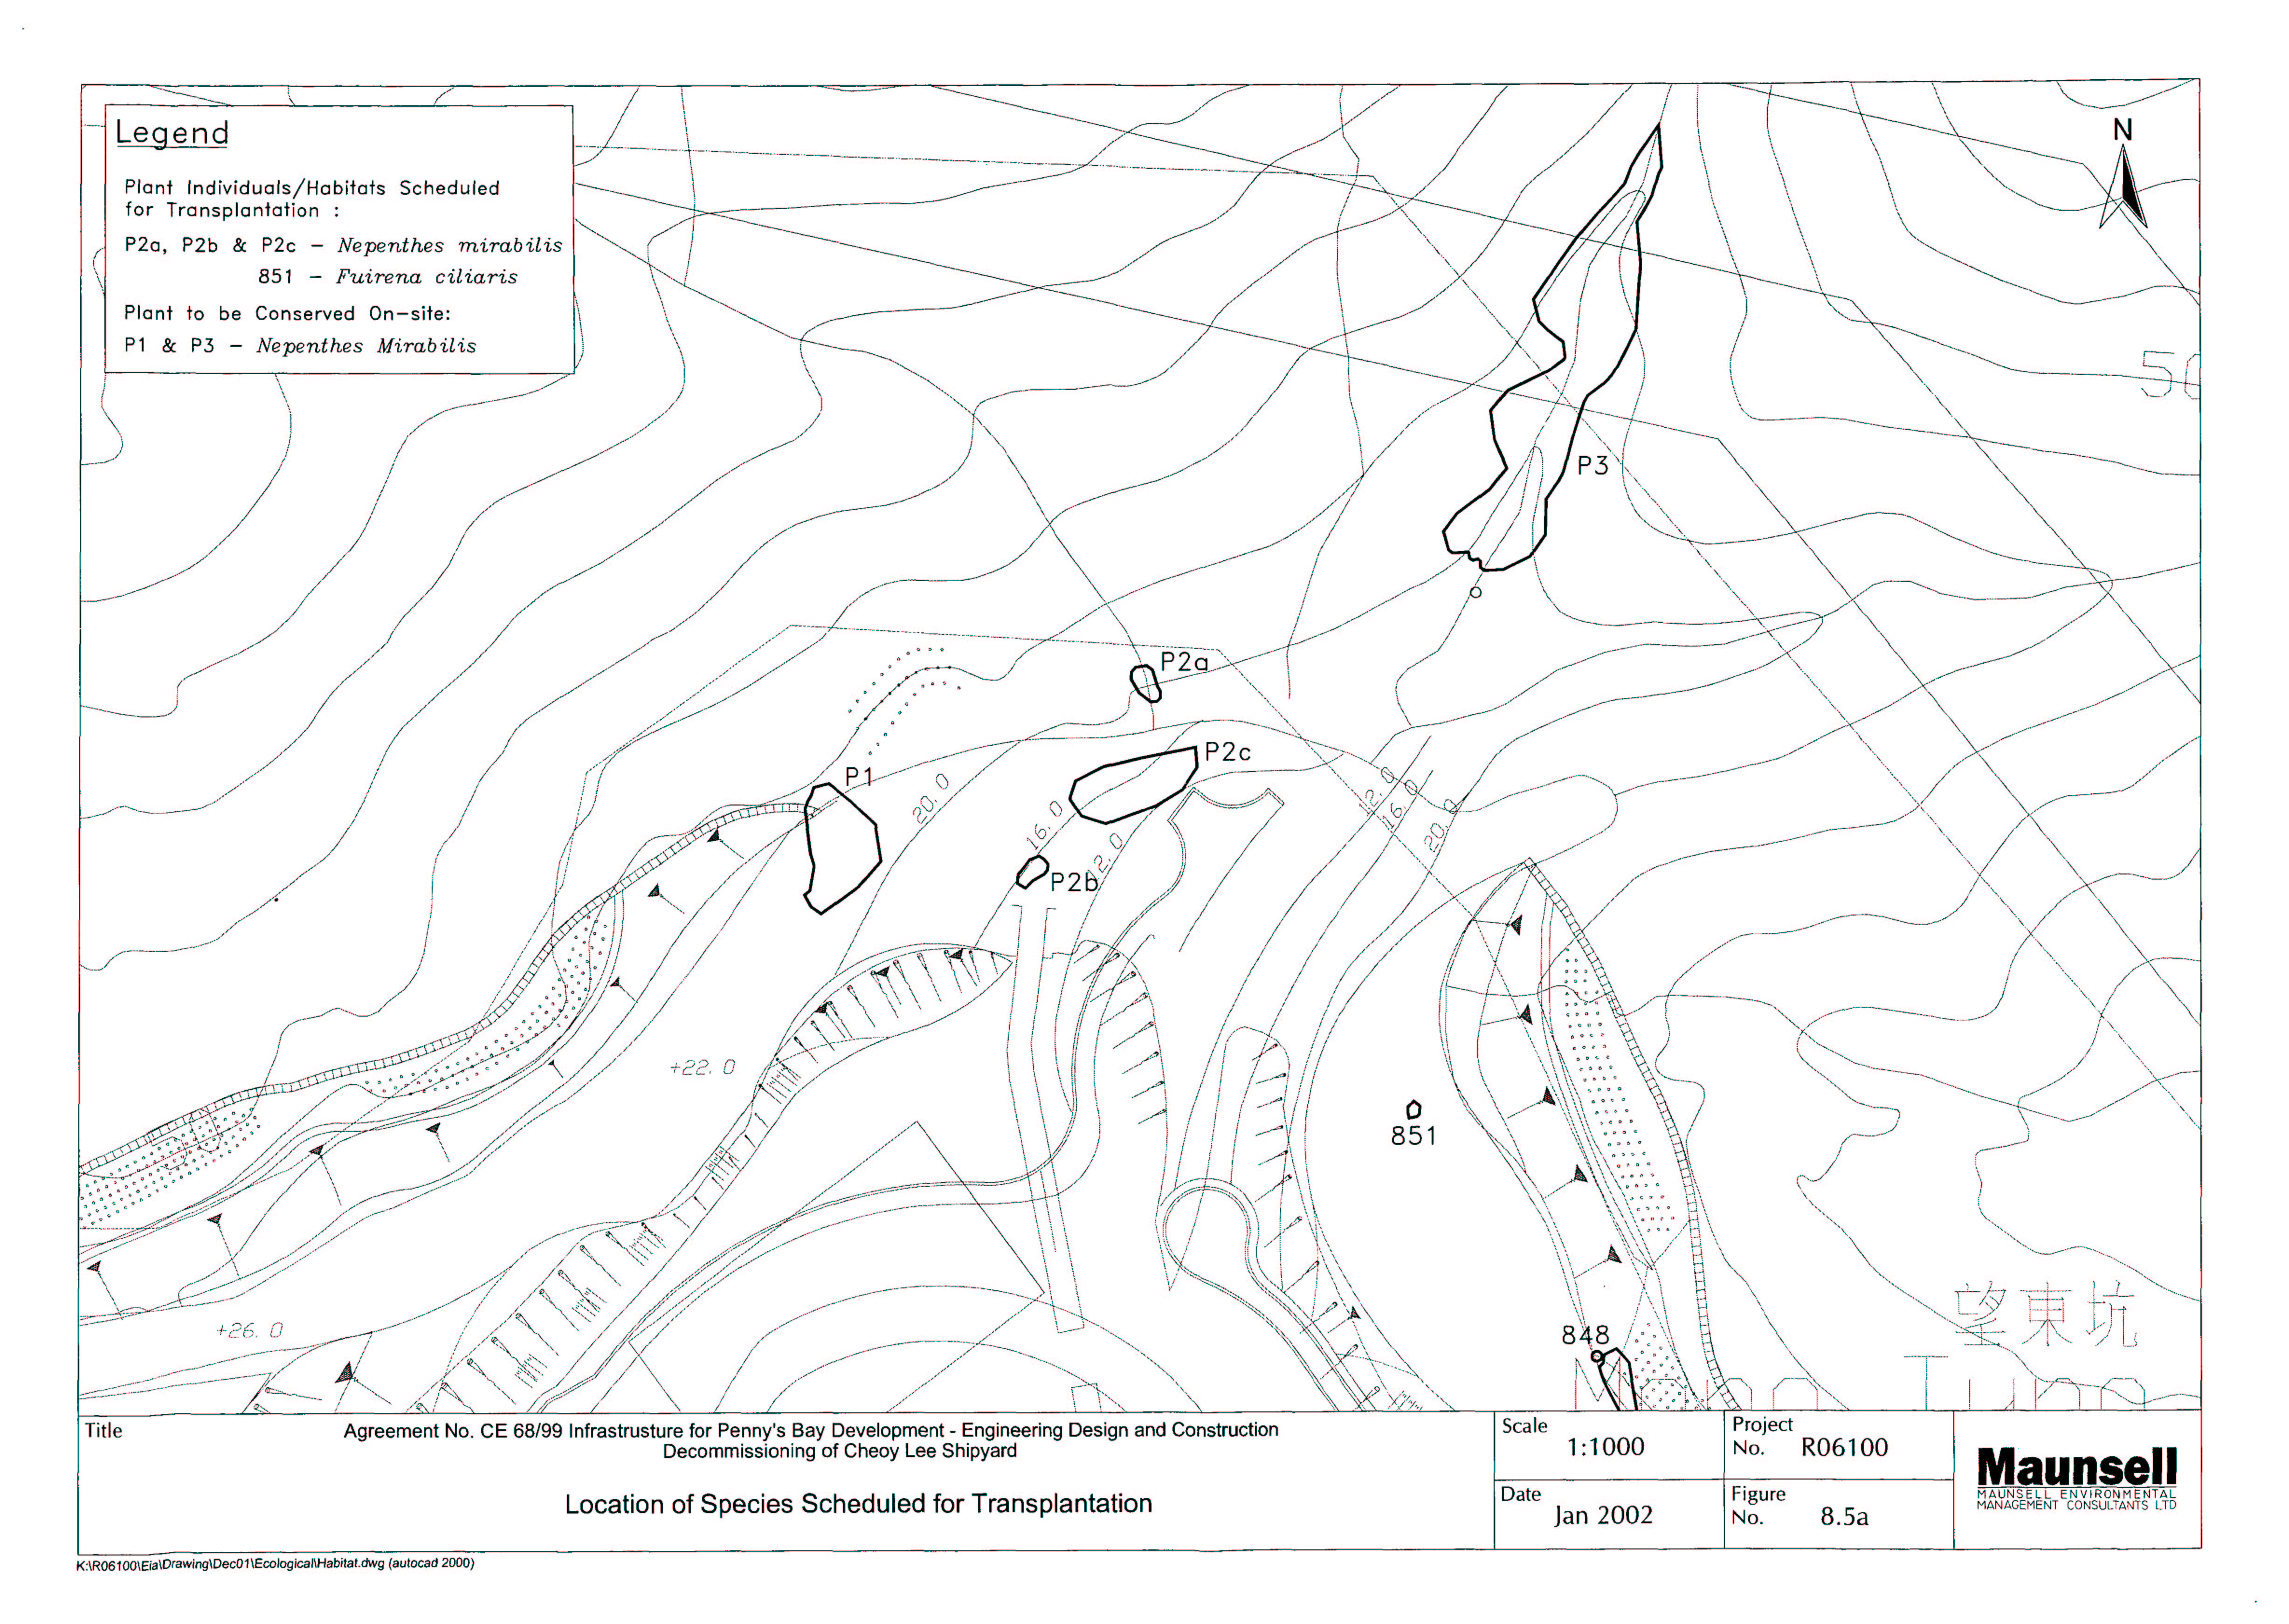
Figure 8.5a Location of Species Scheduled for Transplantation
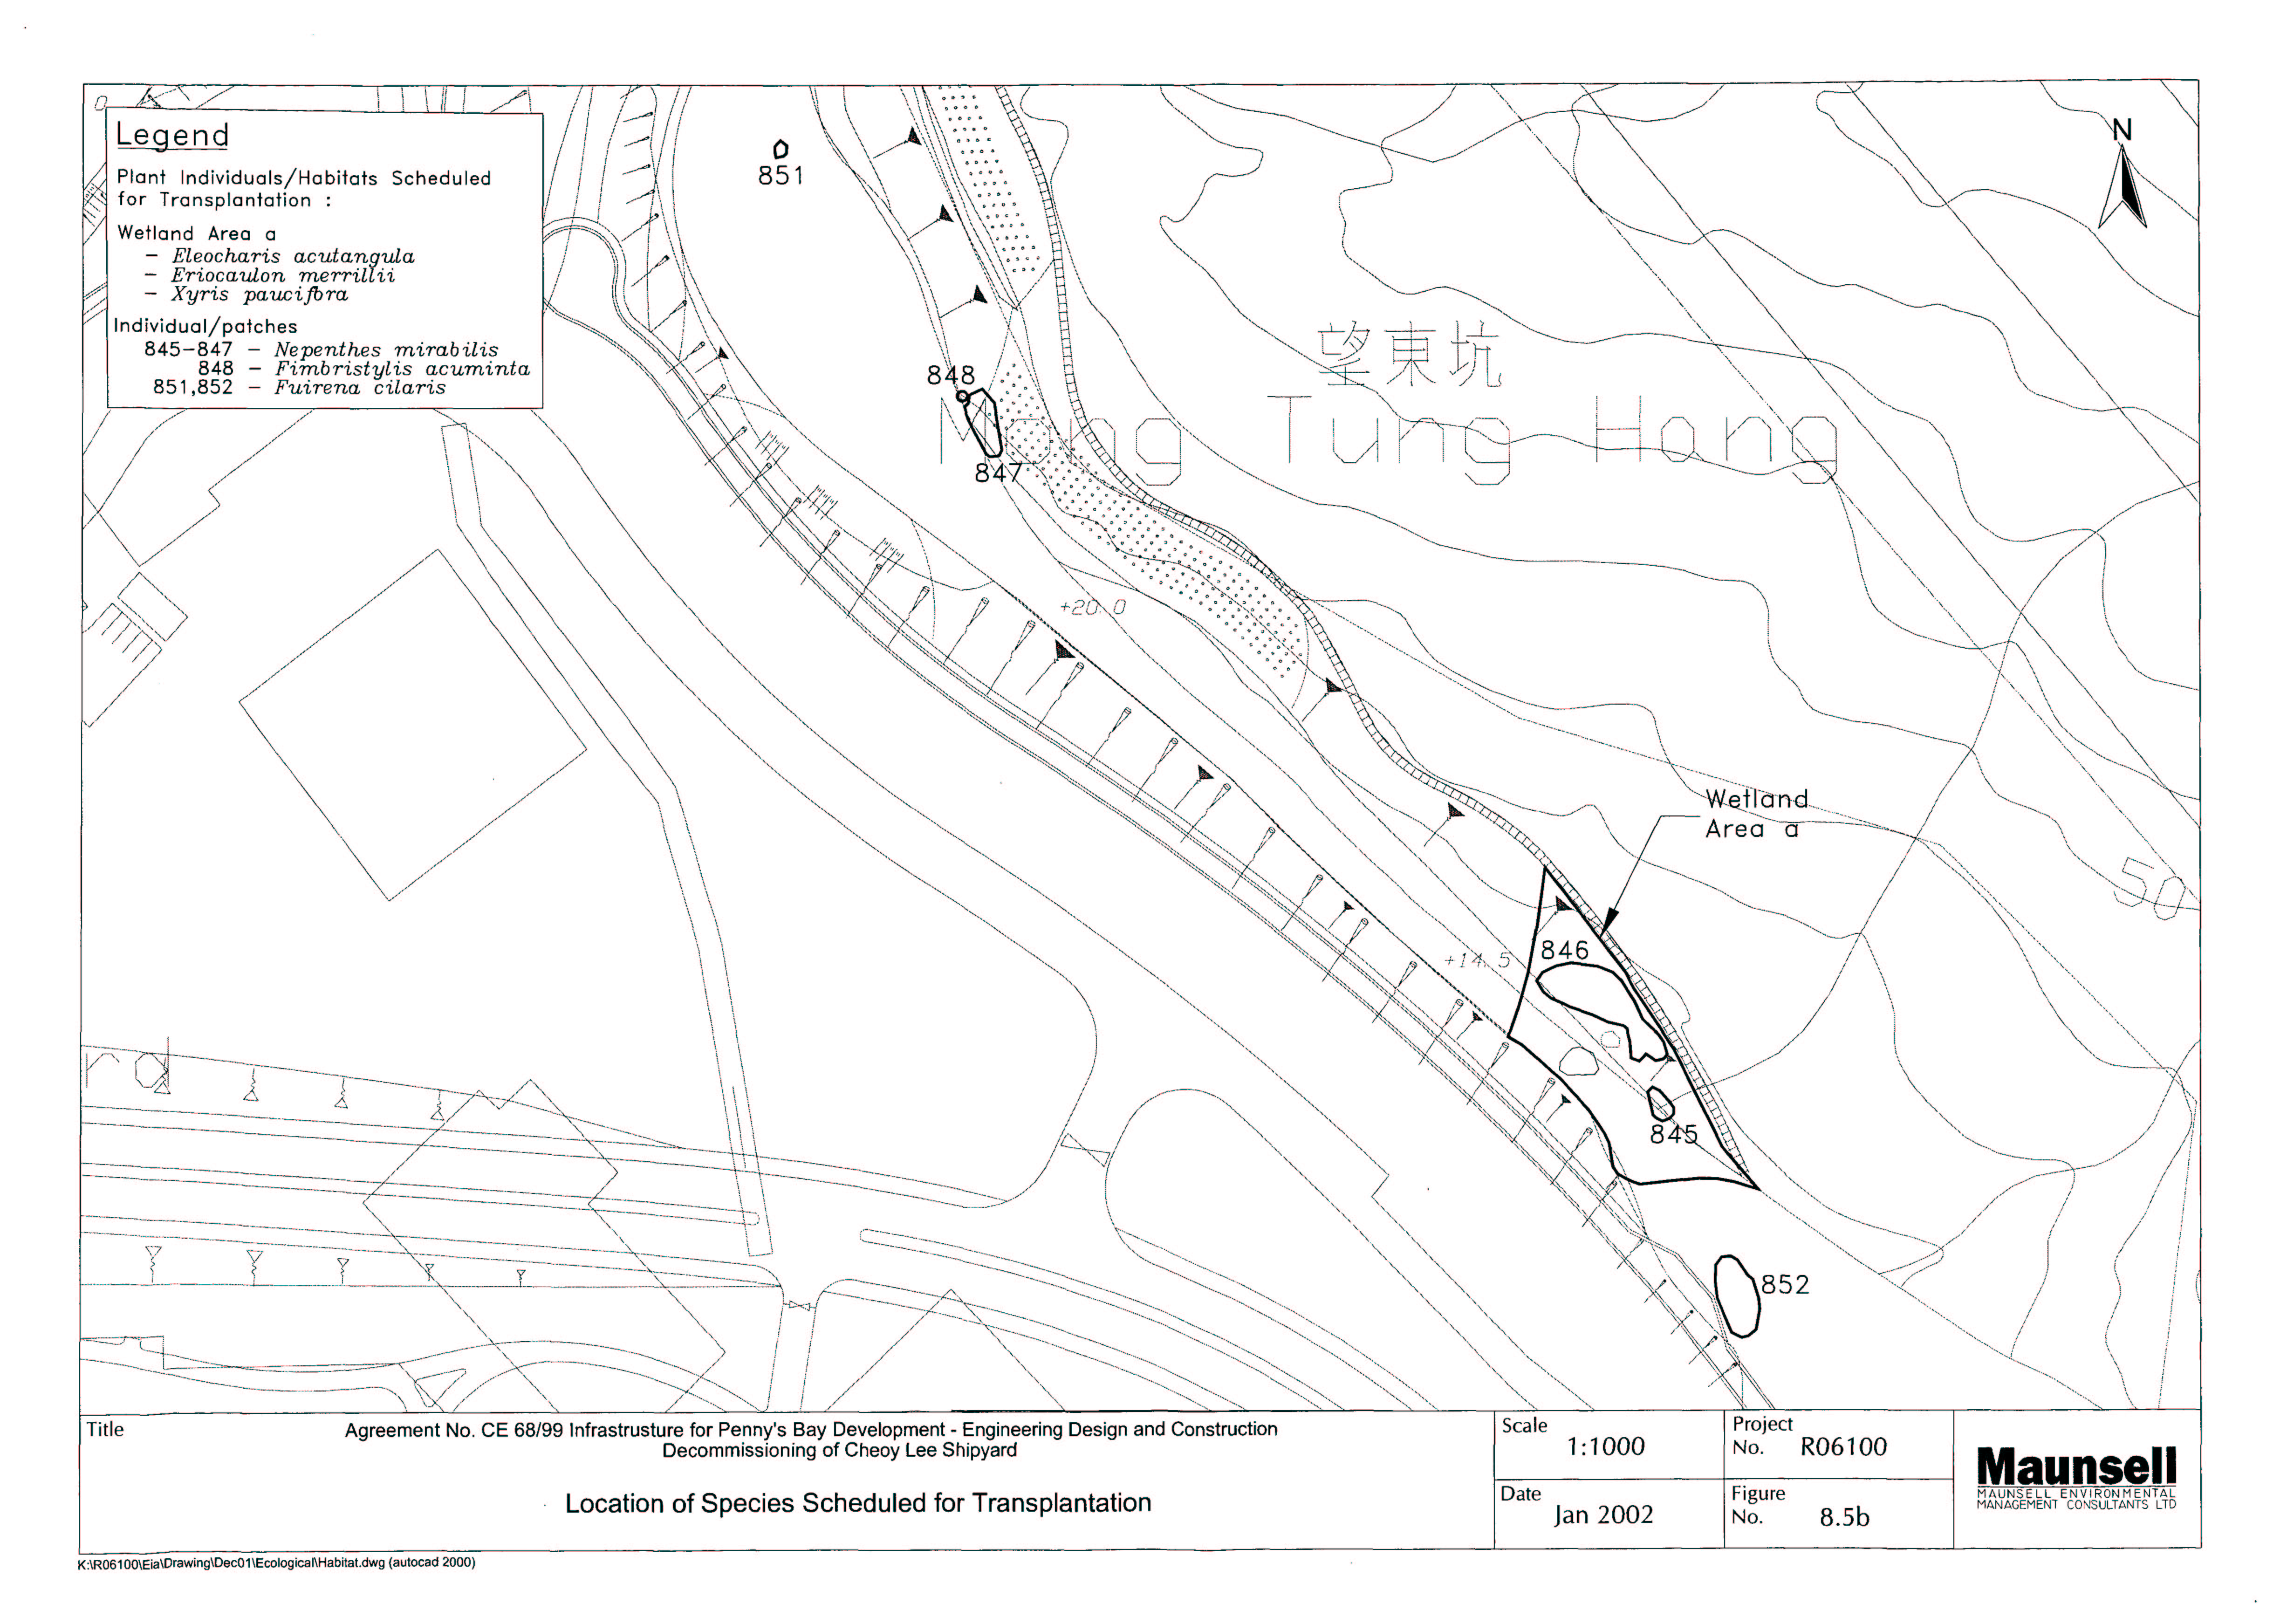
Figure 8.5b Location of Species Scheduled for Transplantation
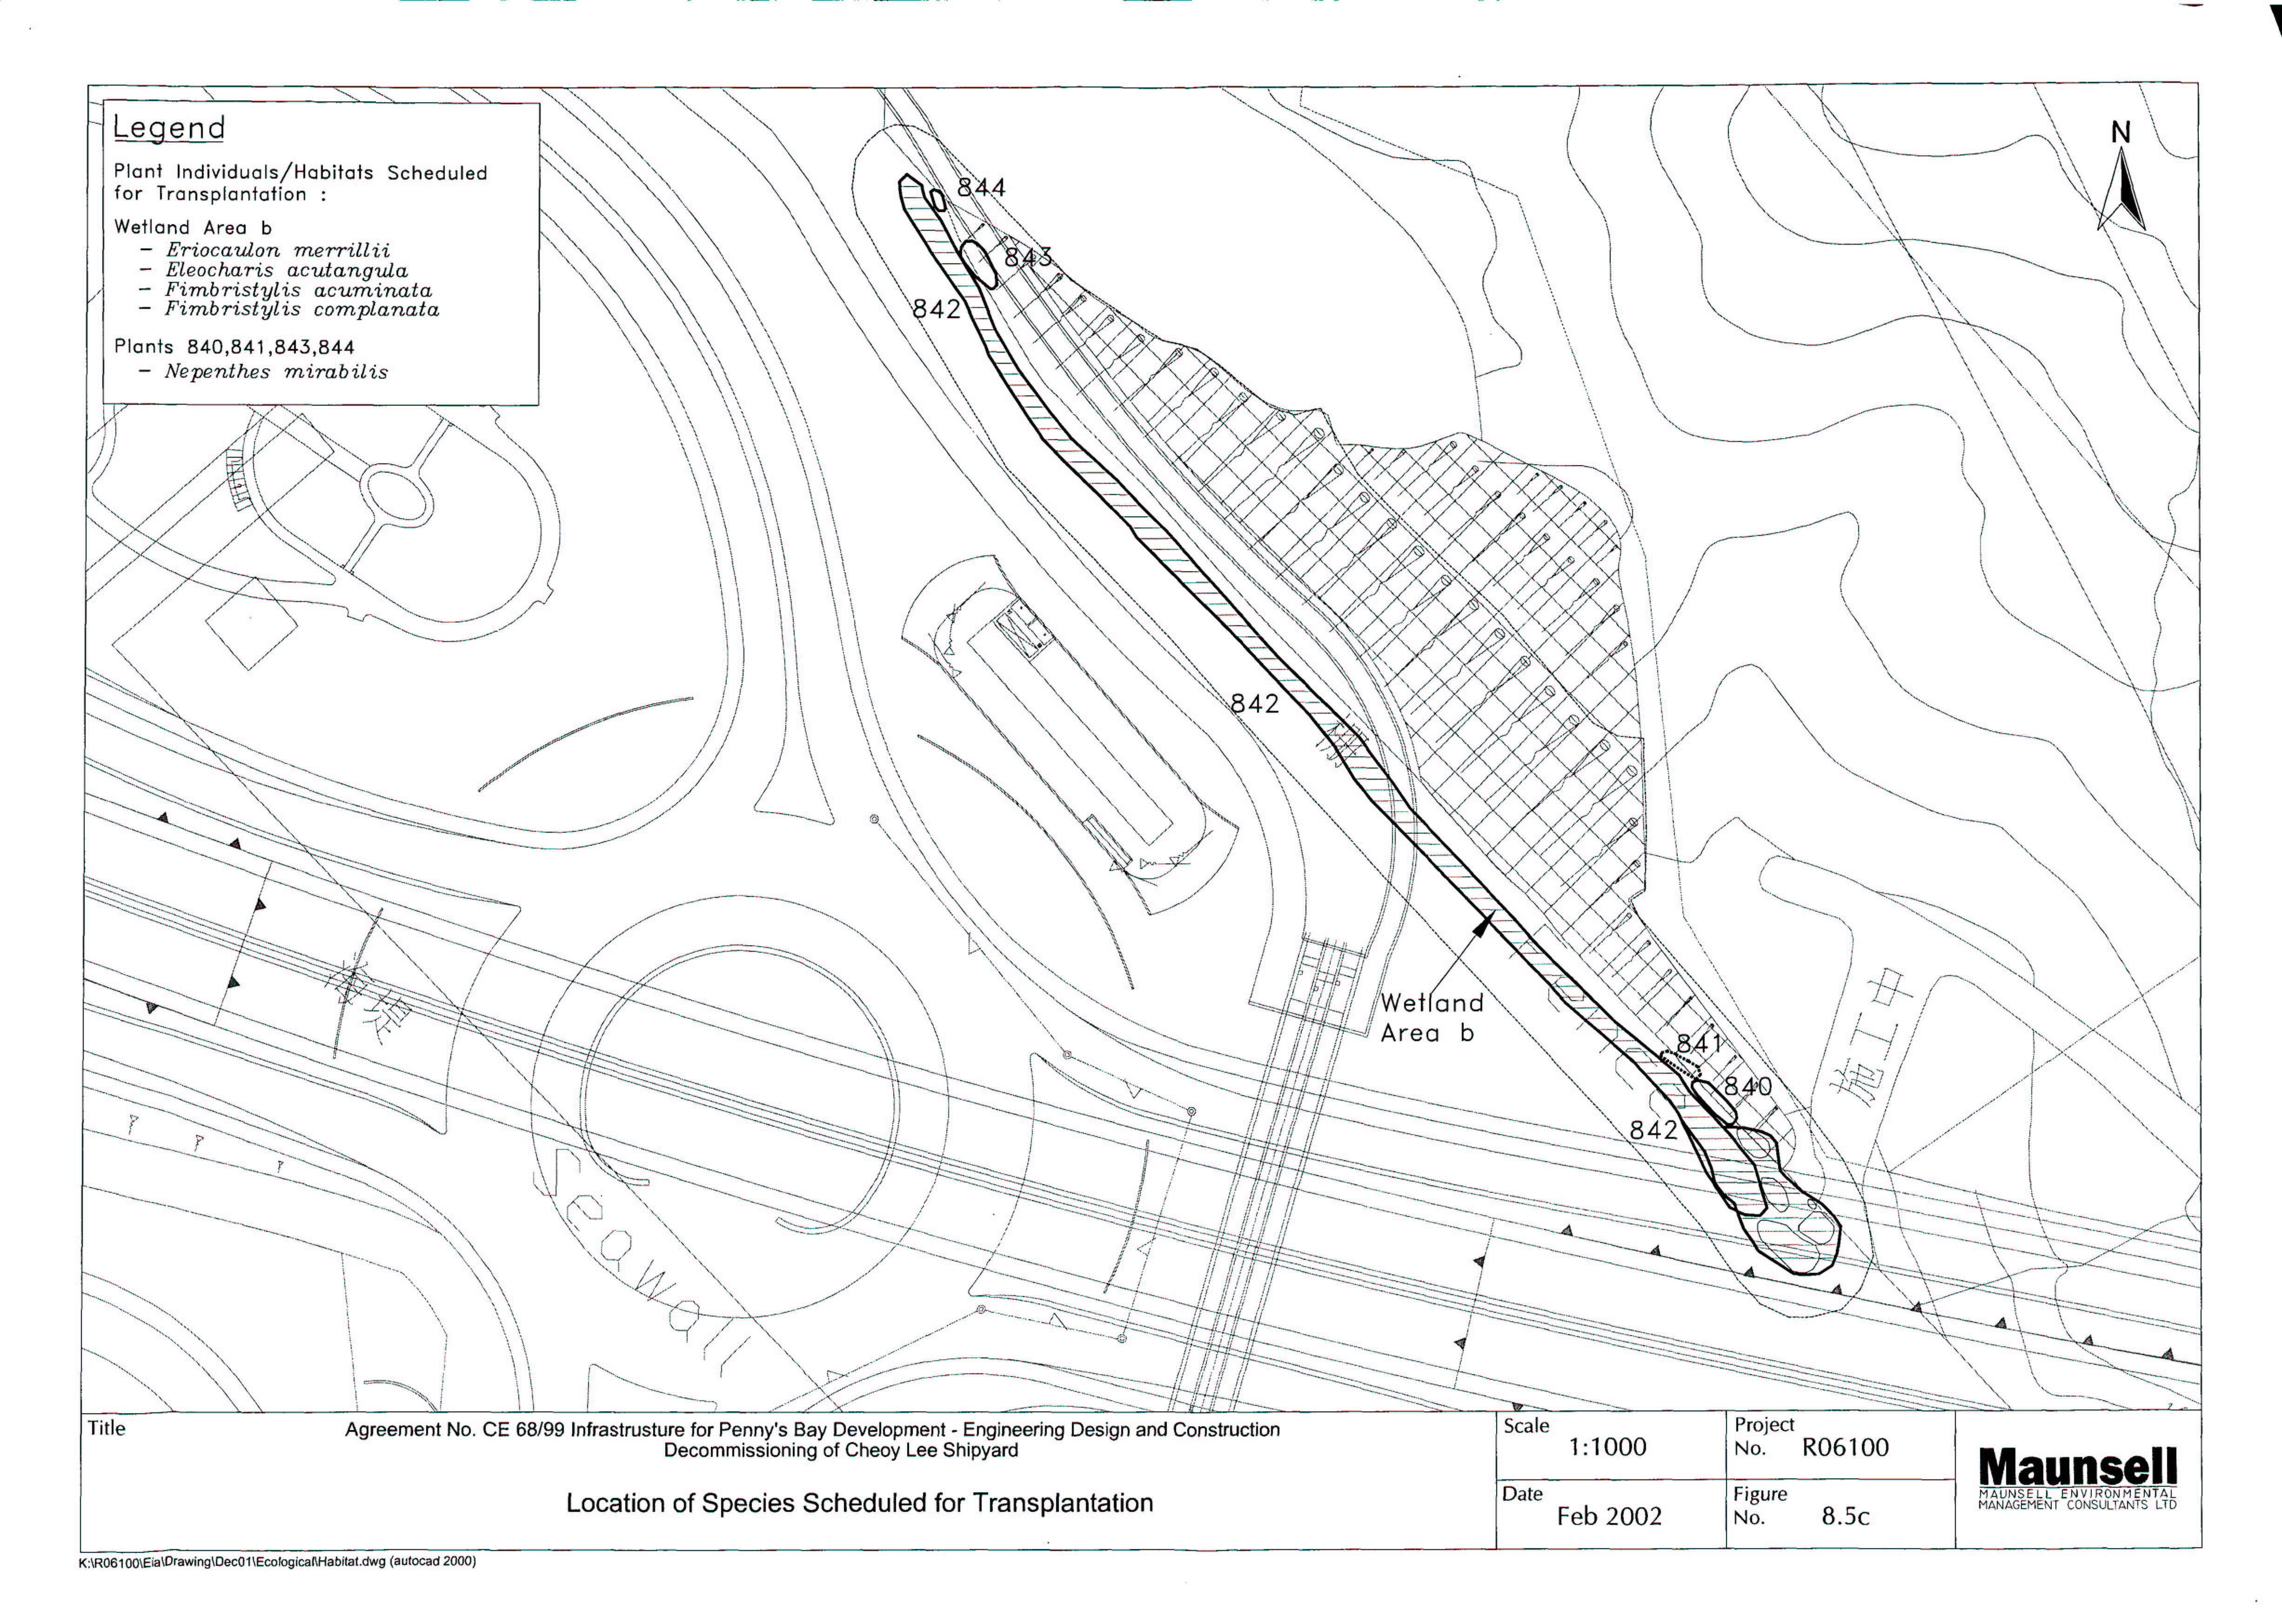
Figure 8.5c Location of Species Scheduled for Transplantation
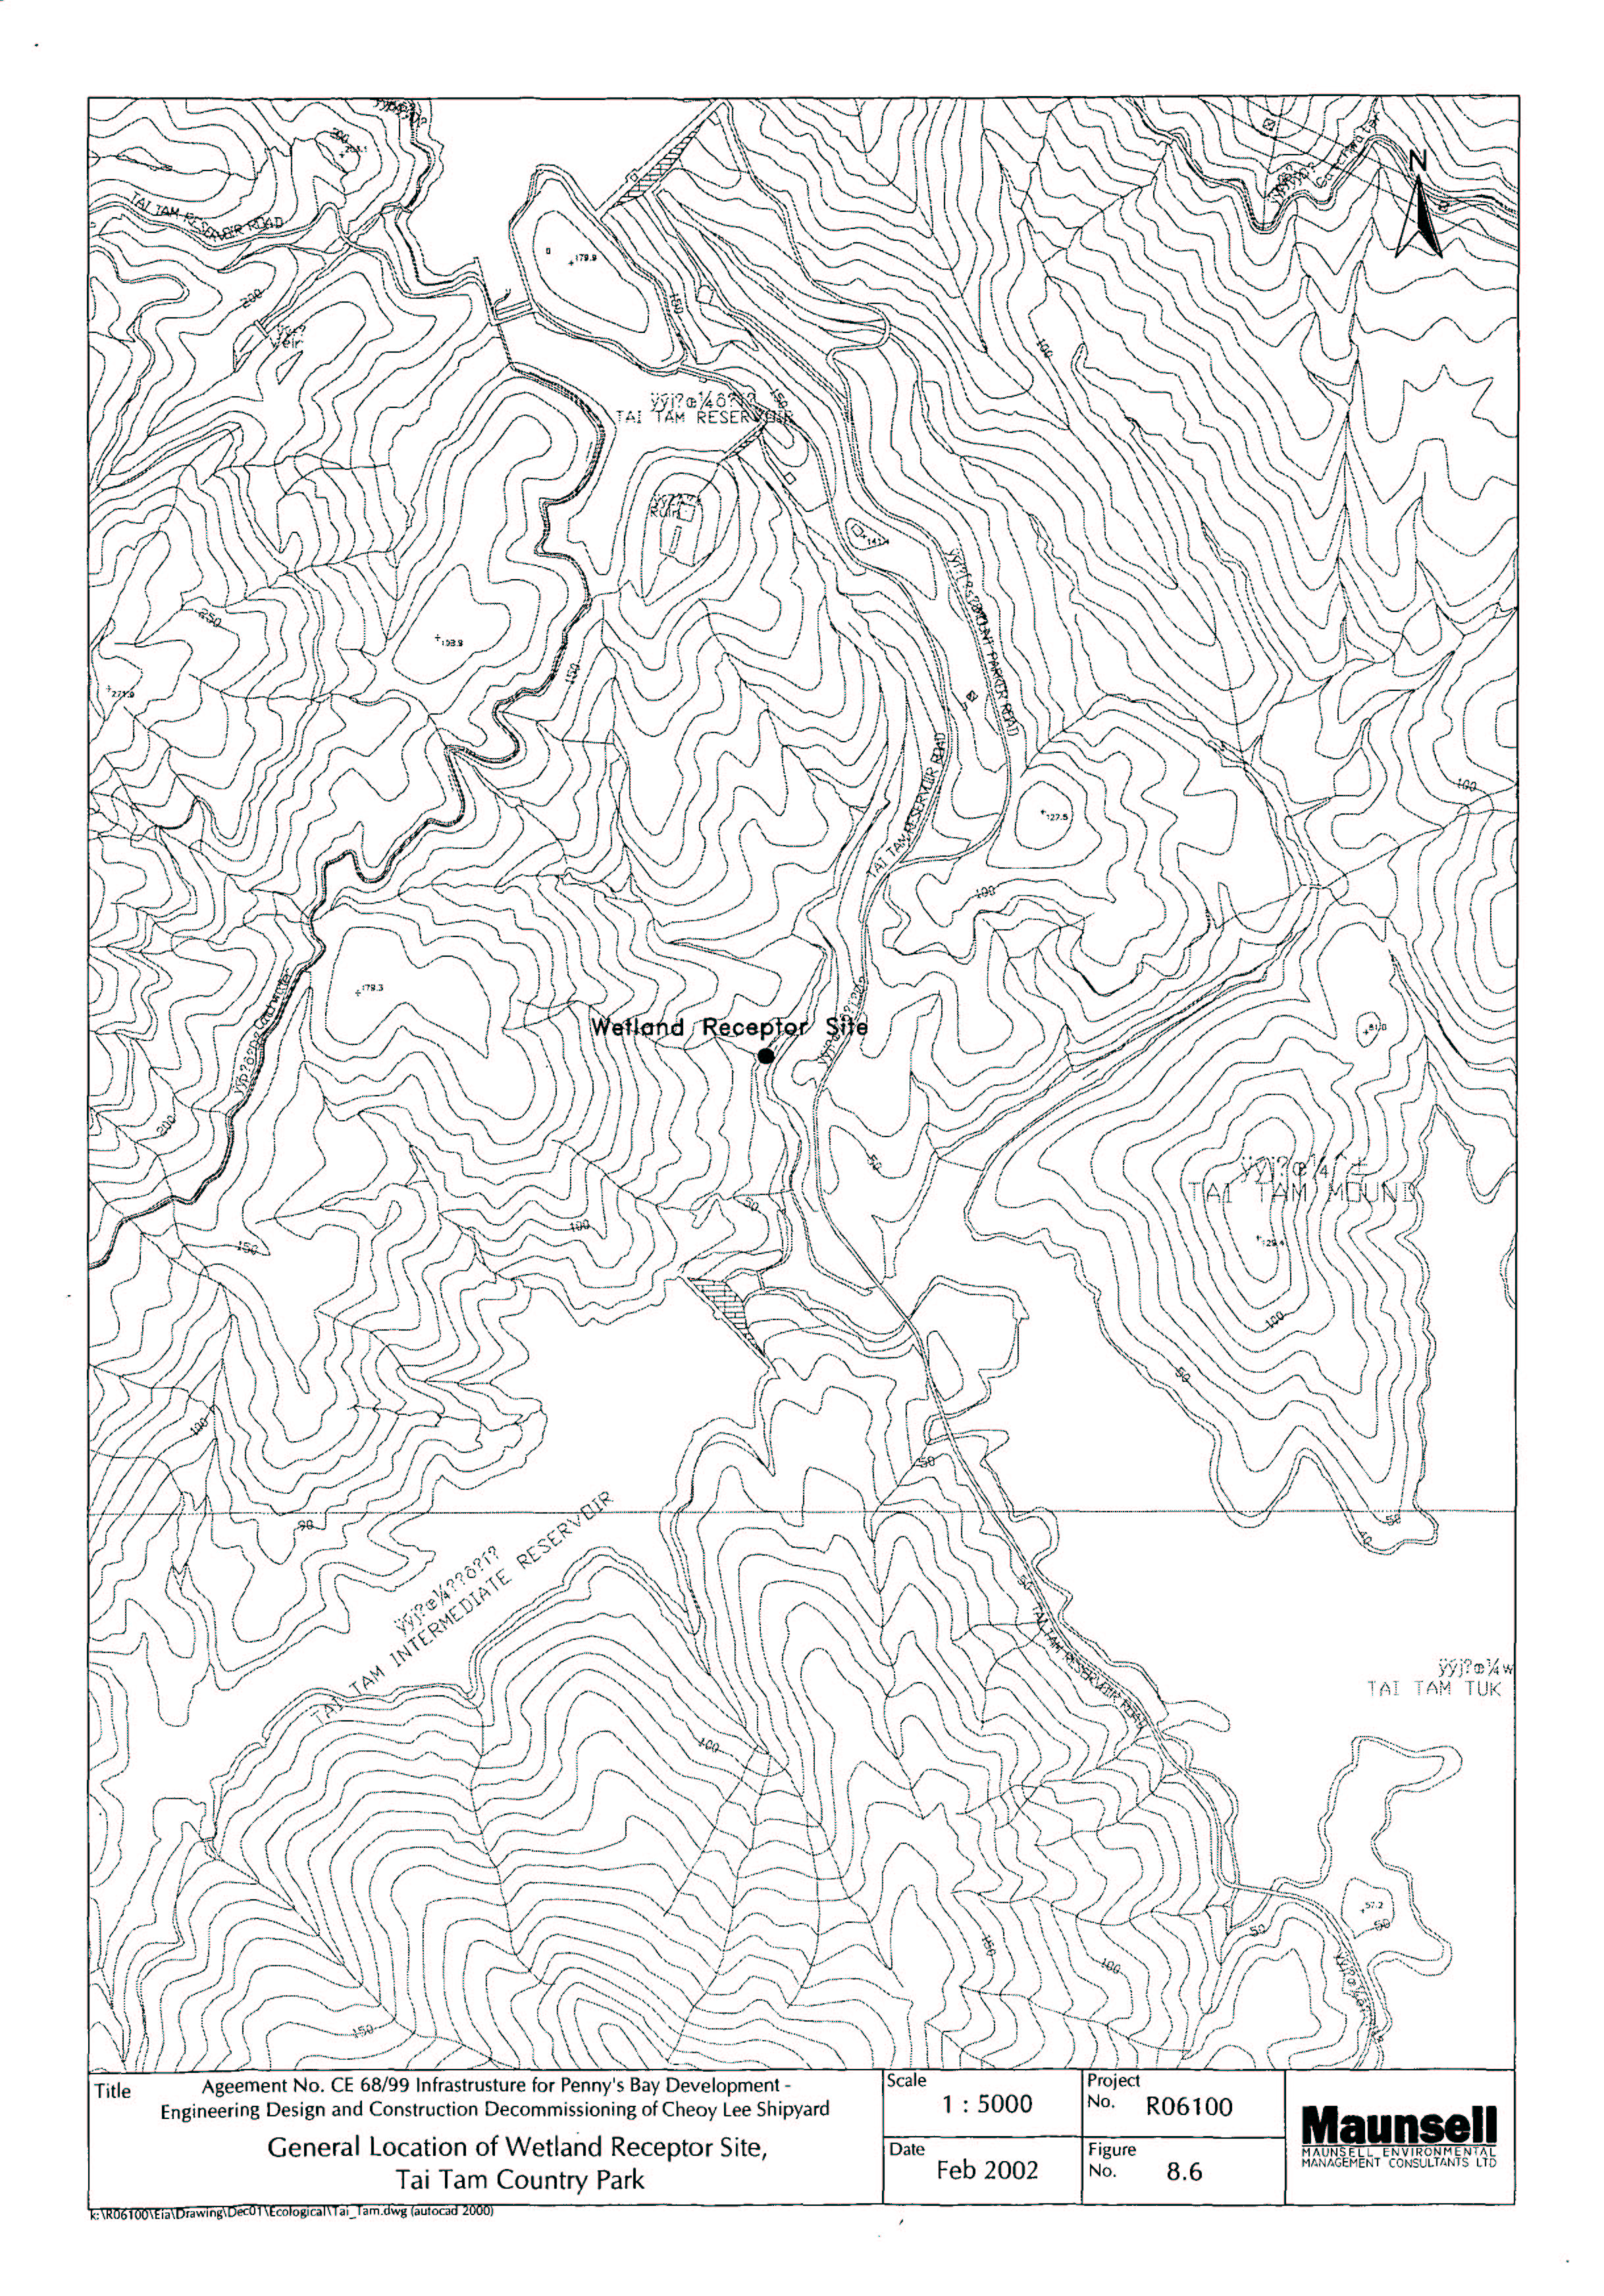
Figure 8.6 General Location of Wetland Receptor Site, Tai Tam Country Park
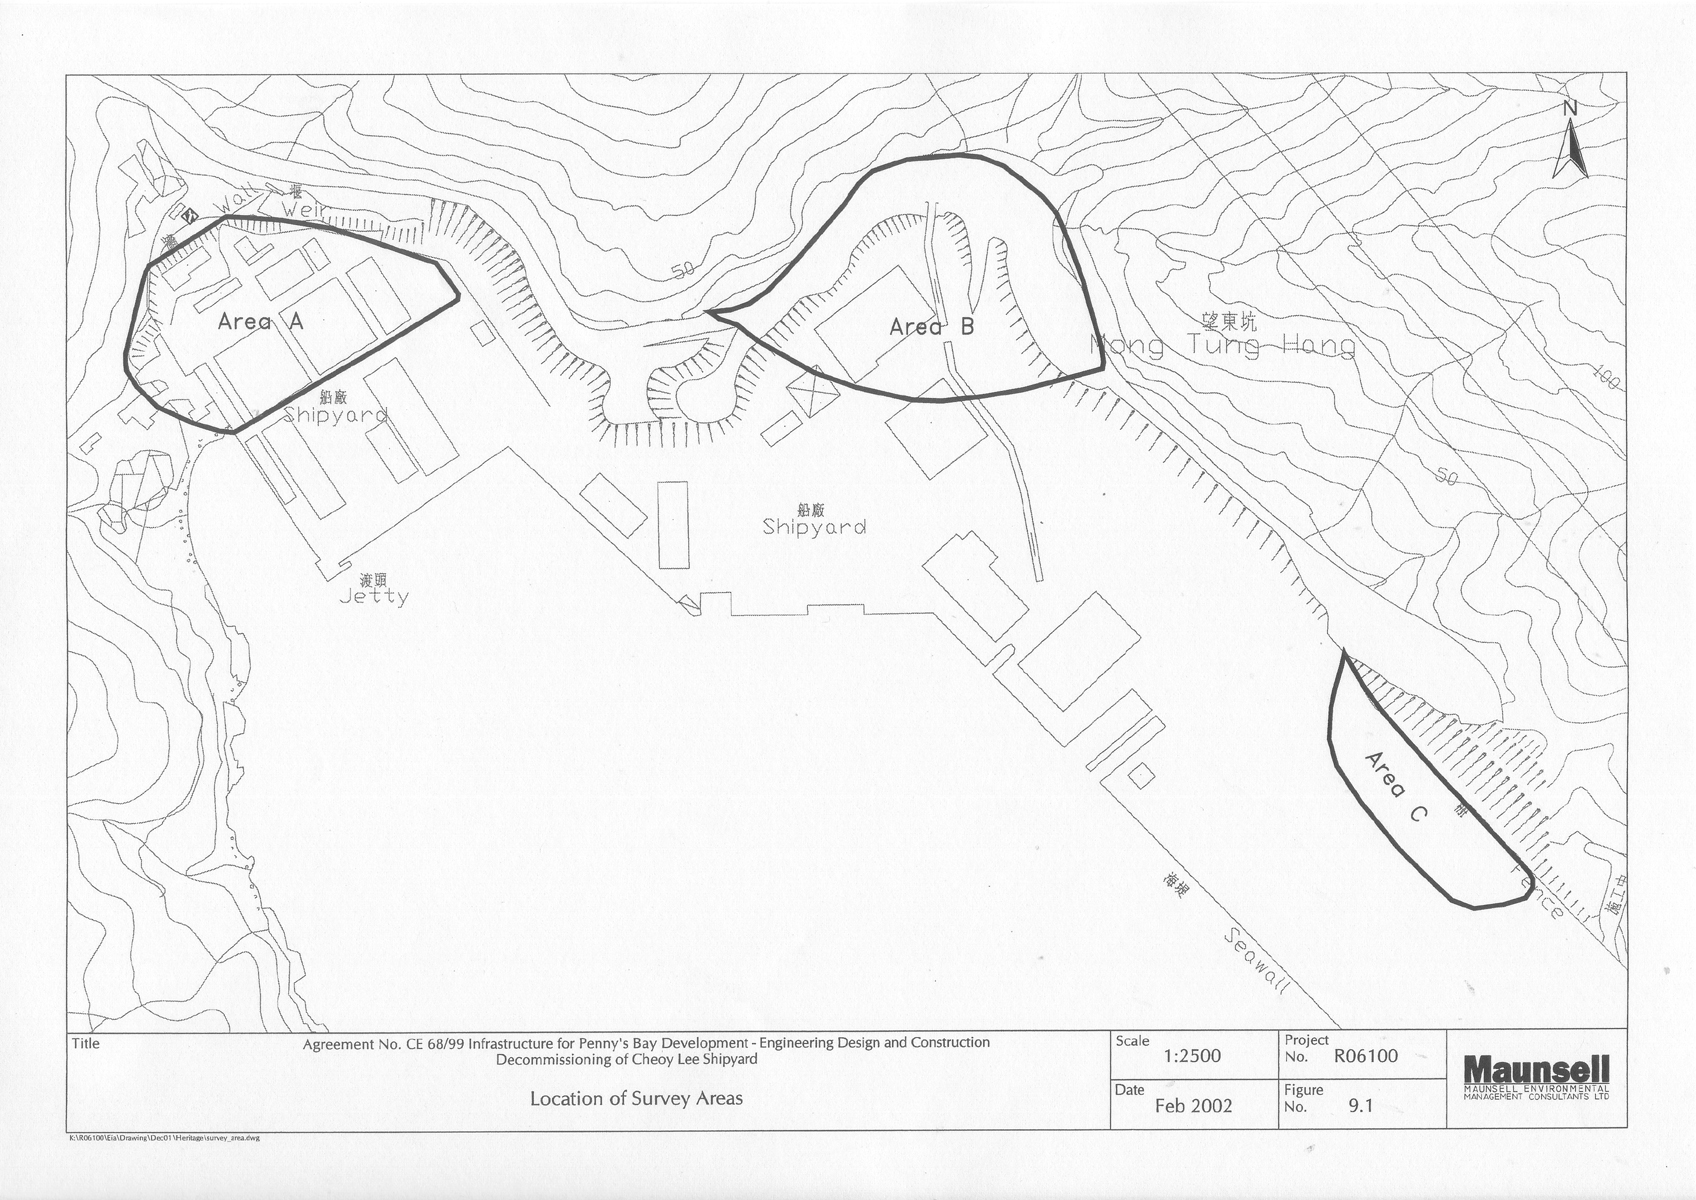
Figure 9.1 Locations of Survey Areas
Figure 9.2 Artifacts Recovered at Cheoy Lee Shipyard (4 Sheets)
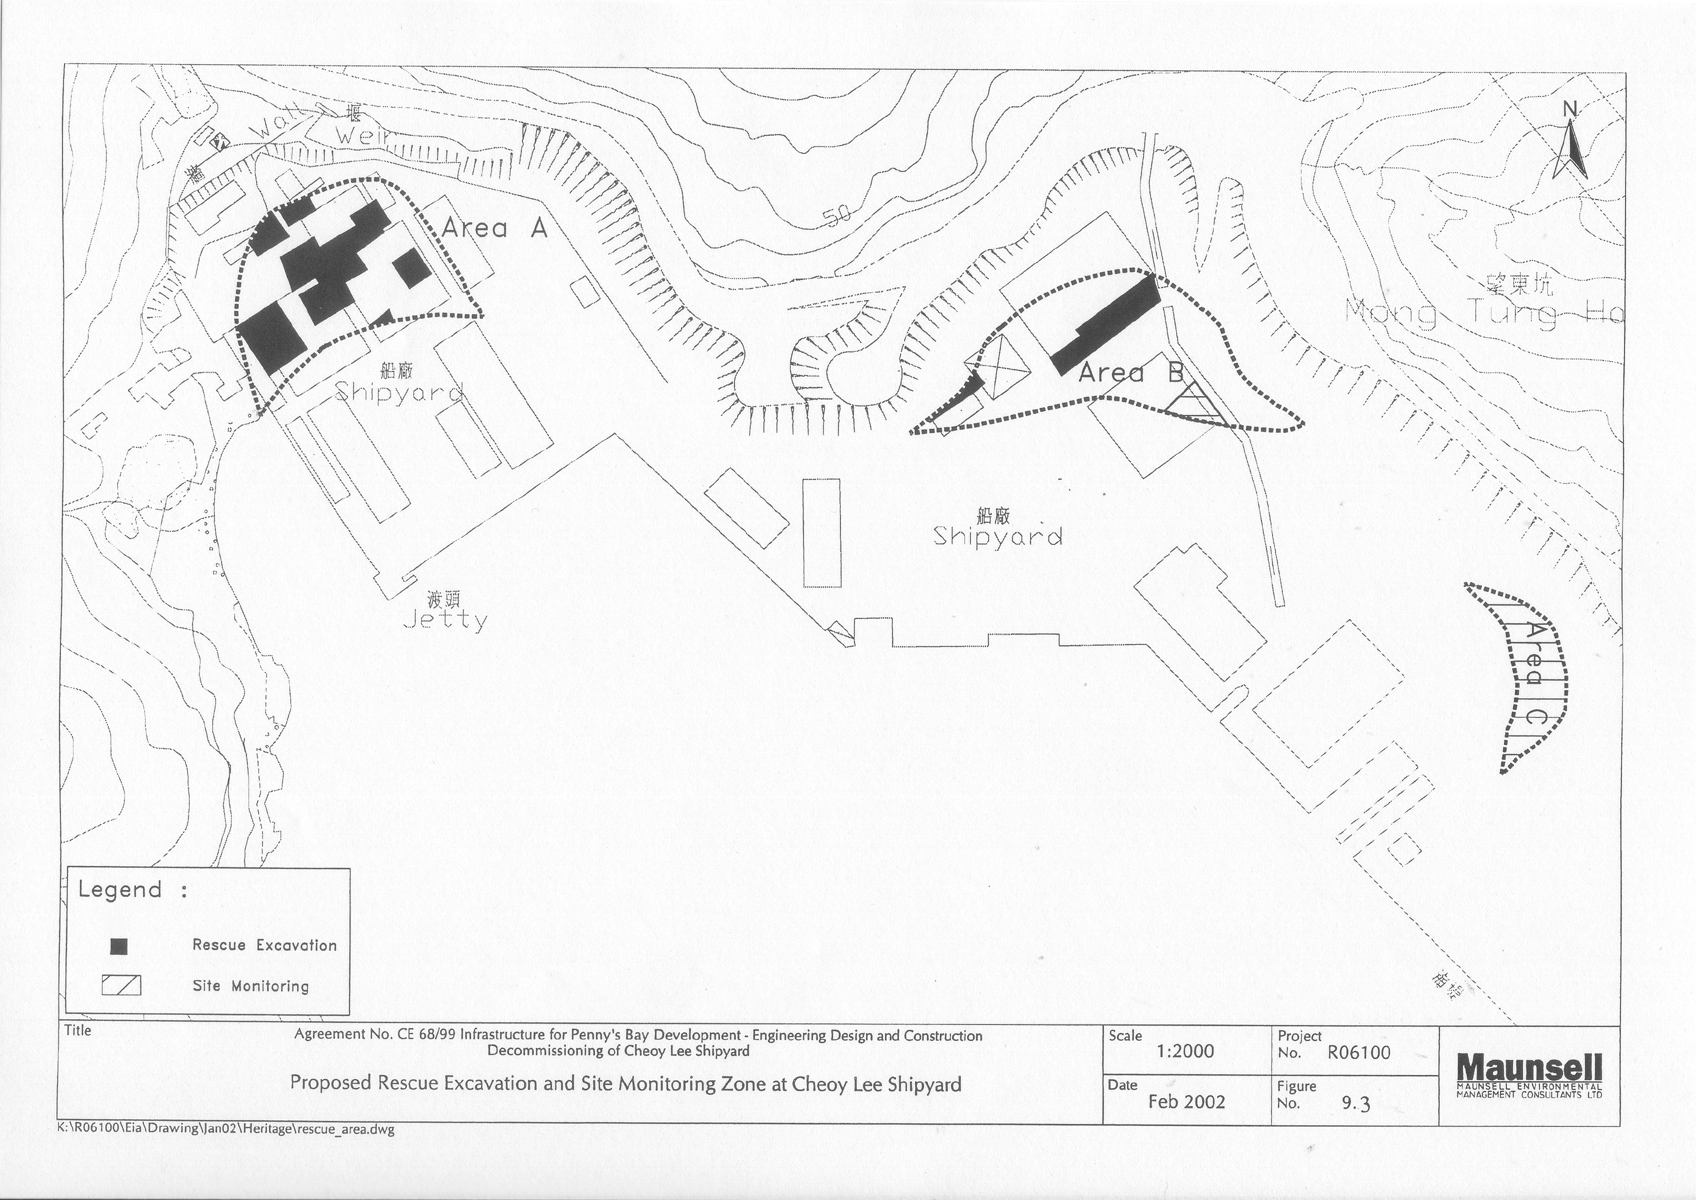
Figure 9.3 Proposed Rescue Excavation and Site Monitoring Zone at Cheoy Lee Shipyard