This Project, Yuen Long and Kam Tin Sewerage and Sewage Disposal Stage 1 Sewers, Rising Mains and Ancillary Pumping Stations EIA and TIA (CE 31/99), is part of the Yuen Long and Kam Tin Sewerage and Sewage Disposal (YLKTSSD) scheme. The overall scheme provides for the phased development of the sewerage system to cater for the existing and additional developments in the NWNT area up to the year 2016. The scheme was recommended under the Review of Yuen Long and Kam Tin Sewerage and Sewage Treatment Requirements completed in January 1999 by the Environmental Protection Department (EPD) (the Review Report).
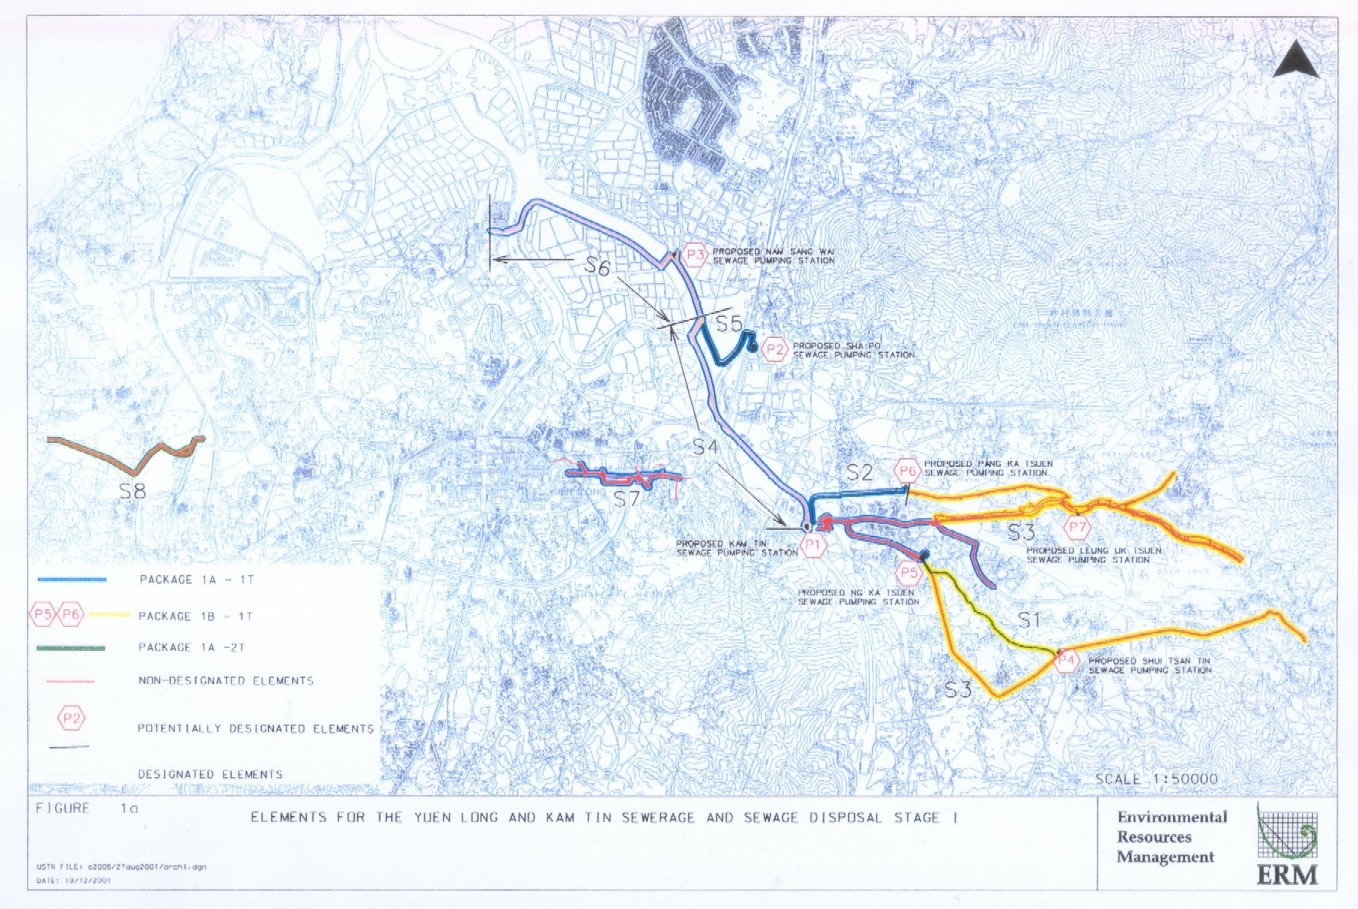
This Project is divided into the (i) Designated and Potentially Designated Elements and (ii) the Non-Designated Element by virtue of Schedule 2 of the Environmental Impact Assessment Ordinance (EIAO). The sewers, rising main and pumping stations which fall under the scope of this Study are presented in Figure 1a.
Detailed water quality modelling will be undertaken of the effects of the implementation of Stage 1 on water quality in Deep Bay and the Urmston Road. Stage 1 of the sewerage scheme will connect currently unsewered areas to the Yuen Long Sewage Treatment Works (STW). The scheme will result in a significant reduction in the discharge of untreated wastewater to inland waterways and will thus result in a reduction of the total pollution load to Deep Bay. For the purpose of the water quality modelling, both the Designated and Potentially Designated and the Non-Designated Elements will be considered.
This Technical Note presents the water quality modelling methodology, under the following broad categories:
· background of the water quality model;
· description of the water quality modelling scenarios;
· derivation of the water quality model input data; and
· format of the water quality modelling results.
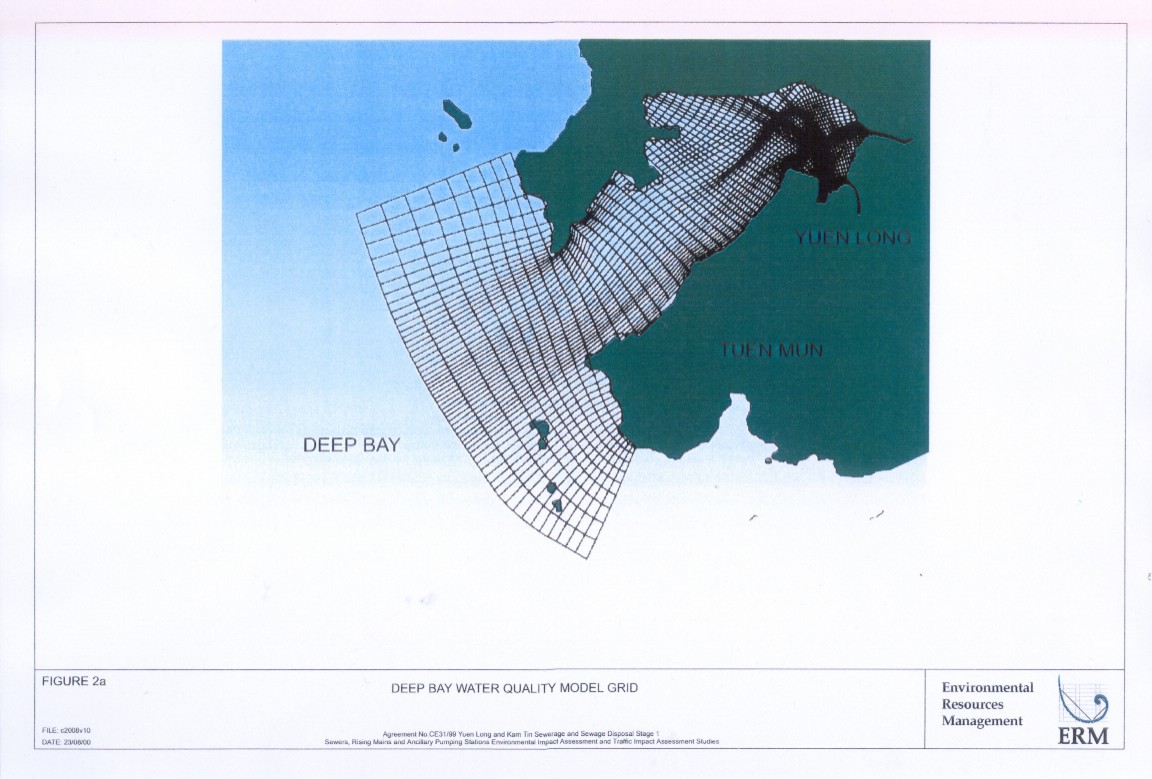
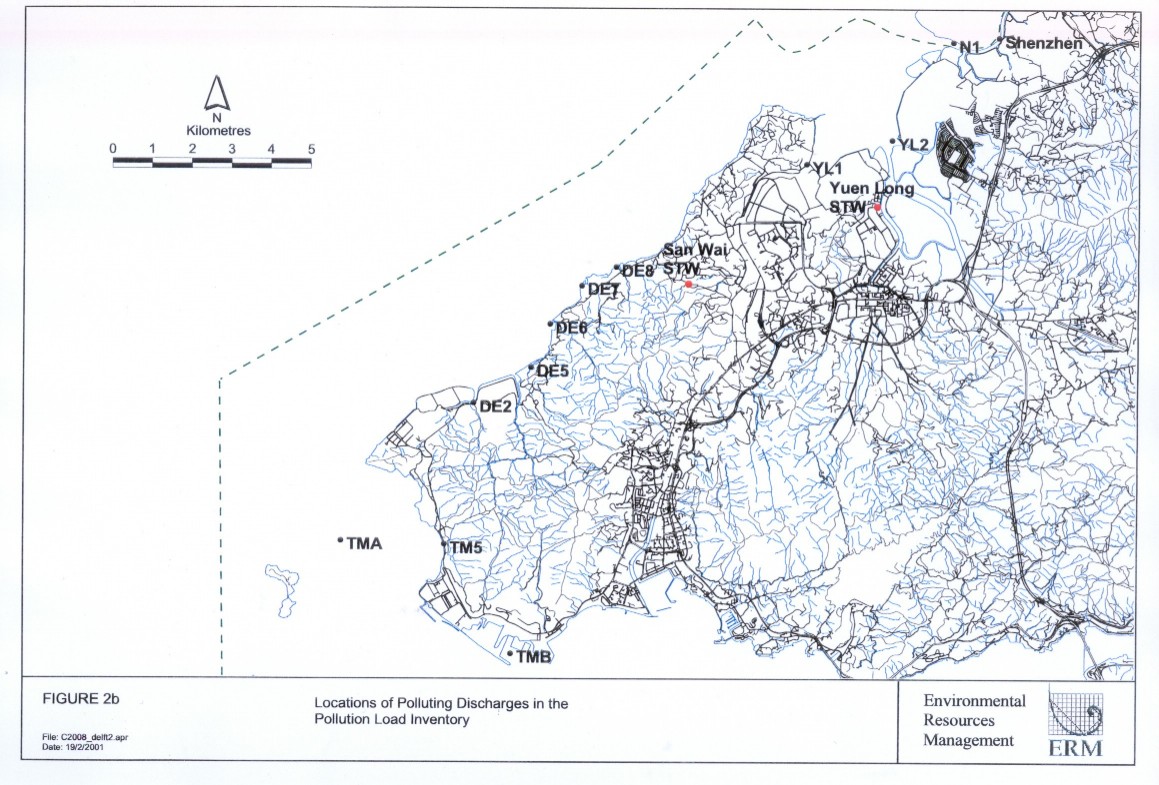
The modelling will be undertaken using the Delft 3D water quality model, which has been set up and calibrated for Deep Bay as part of the study Deep Bay Water Quality Regional Control Strategy Study (1997). This detailed model covers the whole of Deep Bay and extends beyond the mouth of the bay, as shown in Figure 2a. Data on pollution loads into Deep Bay are contained within the Pollution Load Inventory from the study Update on Cumulative Water Quality and Hydrological Effect of Coastal Development and Upgrading Assessment Tool (1997). The locations of the sources of polluting discharges to Deep Bay and the surrounding area contained in the Pollution Load Inventory are shown in Figure 2b. The implementation of the Project will result in changes in the loading input at source YL2 (due to connection of unsewered areas to the Yuen Long STW and increasing discharges from the Yuen Long STW).
The water quality model will be used to simulate two scenarios:
· A Commissioning Scenario, which will simulate the pollution loads following implementation of the Stage 1 works in 2007; and
· A Non-Commissioning Scenario, which will simulate the pollution loads in 2007 if the Stage 1 works were not implemented.
These two scenarios will allow the water quality conditions after completion of the works and the differences in water quality prior to the construction of the works to be quantitatively predicted. Both of these scenarios will be simulated for representative wet and dry season conditions, in order to simulate the range of seasonal variation in the hydrodynamic/oceanographic conditions in Deep Bay.
3.1
Commissioning Scenario
The loadings for source YL2 (see Figure 2b) in the Commissioning Scenario have been derived as part of this Study. In order to define the future loads the areas to be connected to the Yuen Long STW have been represented by the pumping stations that will transport the flows, the locations of which are shown on Figure 1a. Sources of wastewater discharges include domestic, commercial and industrial effluents. Data on the future flows and loads transported by the pumping stations to the Yuen Long STW have been provided by DSD(1) The data also includes a breakdown of the future domestic, commercial and industrial flows that will not be connected to the STW. It has been assumed that these flows will be discharged to inland waterways. In the case of the commercial and industrial flows it has been assumed that those flows not connected to the STW will undergo treatment prior to discharge to inland waterways.
The loads at source YL2 in the Commissioning Scenario comprise the following elements:
· discharges of treated sewage effluent from the Yuen Long STW;
· untreated sewage effluent discharges to inland waterways from unsewered domestic areas; and
· treated effluent discharges from unsewered commercial and industrial sources to inland
waterways.
3.2
Non-Commissioning Scenario
The loadings for source YL2 (see Figure 2b) in the Non-Commissioning Scenario have been derived as part of this Study. In this scenario only the domestic, commercial and industrial effluent discharges from the existing Yuen Long Town cathchment will be connected to the STW. All other wastewaters will be discharges to inland waterways. Domestic sewage effluents are assumed to be untreated, while commercial and industrial effluents will receive treatment prior to discharge.
The loads at source YL2 in the Non-Commissioning Scenario comprise the following elements:
· discharges of treated sewage effluent from the Yuen Long STW, receiving only effluent flows from its existing catchment;
· untreated sewage effluent discharges to inland waterways from unsewered domestic areas; and
· treated effluent discharges from unsewered commercial and industrial sources to inland waterways.
4.1
Commissioning Scenario
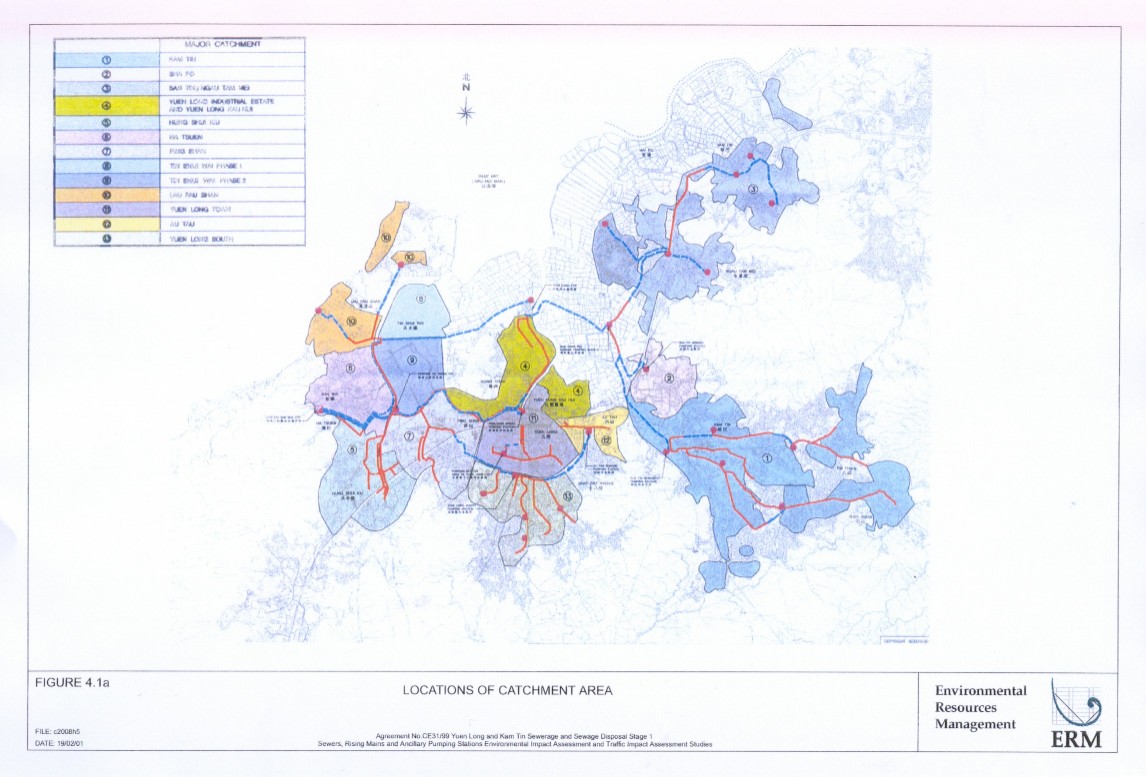
Data on the predicted domestic populations and sewage effluent flows from the 7 proposed pumping stations and 2 catchment areas in 2007 have been provided by DSD(1) and are summarised in Table 4.1a.
Table 4.1a Summary
of Domestic Flows and Populations in 2007
|
Pumping
Station/Area |
Sewered |
Unsewered |
||
|
|
Population |
Flow
(m3
day-1) |
Population |
Flow
(m3
day-1) |
|
Leung Uk Tsuen |
1,709 |
493 |
3,989 |
1,151 |
|
Shui San Tin |
2,082 |
1,829 |
4,859 |
4,269 |
|
Pang Ka Tsuen |
581 |
190 |
1,354 |
443 |
|
Ng Ka Tsuen |
0 |
0 |
0 |
0 |
|
Sha Po |
840 |
171 |
1,960 |
398 |
|
Kam Tin |
2,945 |
911 |
6,572 |
2,125 |
|
Nam Sang Wai |
0 |
0 |
31,380 |
9,888 |
|
Yuen Long Town Catchment (Catchment 11- Figure 4.1a) |
54,953 |
11,012 |
0 |
0 |
|
Yuen Long South Catchment (Catchment 13 - Figure 4.1a) |
0 |
0 |
17,775 |
6,577 |
|
Total |
63,110 |
14,606 |
67,889 |
24,851 |
Data on commercial and industrial flows have only been estimated for 2016 by DSD as part of their ultimate planning for sewerage system in the Yuen Long and surrounding areas. Data on these flows for 2007 has been calculated by assuming a pro-rata growth between 1996 and 2016. In 2007 all of the commercial and industrial flows from the existing Yuen Long Town catchment will be connected to the STW, while in the upstream areas (ie in Catchments 1, 2 and 3 shown in Figure 4.1a) 420 m3 day-1 of the industrial flows will be connected to the STW. The estimated commercial and industrial flows are shown in Table 4.1b.
Table 4.1b Summary
of Commercial and Industrial Flows (m3 day-1) in 2007
|
Year |
Commercial |
Industrial |
||
|
|
Yuen Long Town Catchment |
Upstream Areas |
Yuen Long Town Catchment |
Upstream Areas |
|
1996 |
848 |
732 |
19,555 |
510 |
|
2016 |
3,765 |
6,721 |
30,600 |
10,449 |
|
2007 |
2,452 |
4,026 |
25,630 |
5,976 |
|
|
Sewered |
Unsewered |
Sewered |
Unsewered |
|
2007 |
2,452 |
4,026 |
26,050 |
5,556 |
The total flows to the Yuen Long STW in 2007 are the sum of the sewered domestic, commercial and industrial flows, which is 43,108 m3 day-1. In order to determine the pollutant loadings from the STW reference has been made to DSD routine monitoring data for the existing STW. The average concentrations of pollutants in the treated sewage effluent have been calculated from the available monitoring data. The loads in 2007 may then be calculated by assuming that the concentrations in the effluent will be the same as that currently, ie the treatment standards at the STW will remain unchanged. The calculated pollutant flows and loads from the STW in 2007 are shown in Table 4.1c.
Table 4.1c Calculation
of Pollutant Flows and Loads from the Yuen Long STW in 2007
|
Parameter |
Monitored
Effluent Concentration |
Effluent
Load |
|
Flow |
|
43,108 |
|
Suspended Solids |
14.6 |
628.7 |
|
Biochemical Oxygen Demand |
7.6 |
326.2 |
|
Chemical Oxygen Demand |
56.5 |
2,436.7 |
|
Total Kjeldahl Nitrogen |
9.1 |
391.2 |
|
Ammonia |
5.4 |
233.5 |
|
Nitrite + Nitrate |
14.3 |
617.8 |
|
Total Phosphorous |
2.1 |
90.5 |
|
E.
coli |
1,000 |
4.31X10¹¹ |
|
Notes: 1.
The units of flow are m3 day-1. 2.
The units of concentration are mg L-1, except E. coli which is specified in cfu
100mL-1. 3.
The units of load are kg day-1, except E. coli which is specified in cfu day-1. |
||
The loads from unsewered domestic flows are calculated from the Global Unit Load Factors given in the DSD Sewerage Manual, based on the populations given in Table 4.1a. The unsewered domestic loads are shown in Table 4.1d.
Table 4.1d Unsewered
Domestic Pollutant Flows and Loads in 2007
|
Parameter |
Pollutant
Load |
|
Flow (m3 day-1) |
24,851 |
|
Suspended Solids (kg day-1) |
2,715.6 |
|
Biochemical Oxygen Demand
(kg day-1) |
2,851.3 |
|
Chemical Oxygen Demand (kg
day-1) |
6,110.0 |
|
Total Kjeldahl Nitrogen (kg
day-1) |
577.1 |
|
Ammonia (kg day-1) |
339.4 |
|
Nitrite + Nitrate (kg day-1) |
- |
|
Total Phosphorous (kg day-1) |
- |
|
E.
coli (cfu day-1) |
2.92x10¹⁵ |
In order to determine the loads from the treated commercial and industrial flows it is necessary to determine the quality of the effluent. It has been assumed that the treatment will at least result in an effluent meeting the standards for discharges to inland waterways given in the Technical Memorandum on Standards for Effluents Discharged into Drainage and Sewerage Systems, Inland and Coastal Waters. The standards for effluents discharged into Group B Inland Waters are summarised in Table 4.1e. In view of the fact that there is no standard for Total Kjeldahl Nitrogen (TKN) it has been assumed that TKN will be 1.675 times the concentration of ammonia. This ratio is based on monitoring data of the existing Yuen Long STW.
Table 4.1e Effluent
Concentrations for Commercial and Industrial Effluent Treatment
|
Parameter |
Pollutant
Load |
|
Suspended Solids (mg L-1) |
30 |
|
Biochemical Oxygen Demand
(mg L-1) |
20 |
|
Chemical Oxygen Demand (mg
L-1) |
80 |
|
Total Kjeldahl Nitrogen (mg
L-1) |
8.375 |
|
Ammonia (mg L-1) |
5 |
|
Nitrite + Nitrate (mg L-1) |
10 |
|
Total Phosphorous (mg L-1) |
5 |
|
E. coli (cfu 100ml-1) |
100 (0 for Industrial) |
The effluent flows and loads for commercial and industrial sources, based on the concentrations in Table 4.1e, are shown in Table 4.1f.
Table 4.1f Effluent
Flows and Loads for Commercial and Industrial Effluents to inland Waterways
|
Parameter |
Commercial |
Industrial |
|
Flow (m3 day-1) |
4,026 |
5,556 |
|
Suspended Solids (kg day-1) |
120.8 |
166.7 |
|
Biochemical Oxygen Demand
(kg day-1) |
80.5 |
111.1 |
|
Chemical Oxygen Demand (kg
day-1) |
322.1 |
444.5 |
|
Total Kjeldahl Nitrogen (kg
day-1) |
33.7 |
46.5 |
|
Ammonia (kg day-1) |
20.1 |
27.8 |
|
Nitrite + Nitrate (kg day-1) |
40.3 |
55.6 |
|
Total Phosphorous (kg day-1) |
20.1 |
27.8 |
|
E.
coli (cfu day-1) |
4.03x10⁹ |
0 |
The total flows and loads at YL2 are thus the sum of the treated effluent discharges from the Yuen Long STW (Table 4.1c), untreated domestic effluent discharges to inland waterways (Table 4.1d) and treated commercial and industrial effluent discharges to inland waterways (Table 4.1f). These flows represent the dry season flows. In the wet season flows will increase. The increase in flows from the dry season to the wet season has been derived from the Pollution Load Inventory by analysing the difference between the wet and dry season flows at YL2 in 2007, which is 186,420 m3 day-1. The wet season flows are derived by increasing the total dry season flows at YL2 by
186,420 m3 day-1. This is a reasonable assumption because the flows from the Yuen Long STW do not vary seasonally and thus the increase in flows represents increasing flows through inland waterways. The resulting wet and dry season flows and loads at YL2 are shown in Table 4.1g.
Table 4.1g Effluent
Flows and Loads at YL2 in the Wet and Dry Seasons for the Commissioning
Scenario
|
Parameter |
Wet
Season |
Dry
Season |
|
Flow (m3 day-1) |
263,957 |
77,542 |
|
Suspended Solids (kg day-1) |
3,632 |
3,632 |
|
Biochemical Oxygen Demand (kg day-1) |
3,369 |
3,369 |
|
Chemical Oxygen Demand (kg day-1) |
9,313 |
9,313 |
|
Total Kjeldahl Nitrogen (kg day-1) |
1,049 |
1,049 |
|
Ammonia (kg day-1) |
621 |
621 |
|
Nitrite + Nitrate (kg day-1) |
714 |
714 |
|
Total Phosphorous (kg day-1) |
138 |
138 |
|
E. coli (cfu day-1) |
2.92x10¹⁵ |
2.92x10¹⁵ |
4.2
Non -Commissioning Scenario
In the Non-Commissioning Scenario the only domestic effluents connected to the Yuen Long STW derive from the existing catchment area of the STW, while all the other domestic flows will not be connected and thus are assumed to discharge to inland waterways. A summary of the domestic flows connected to the Yuen Long STW (defined as sewered) and those discharging to inland waterways (defined as unsewered) is given in Table 4.2a.
Table 4.2a Summary
of Domestic Flows and Populations in 2007
|
Pumping
Station/Area |
Sewered |
Unsewered |
||
|
|
Population |
Flow
(m3 day-1) |
Population |
Flow
(m3 day-1) |
|
Leung Uk Tsuen |
0 |
0 |
5,698 |
1,644 |
|
Shui San Tin |
0 |
0 |
6,941 |
6,098 |
|
Pang Ka Tsuen |
0 |
0 |
1,935 |
633 |
|
Ng Ka Tsuen |
0 |
0 |
0 |
0 |
|
Sha Po |
0 |
0 |
2,800 |
569 |
|
Kam Tin |
0 |
0 |
9,517 |
3,036 |
|
Nam Sang Wai |
0 |
0 |
31,380 |
9,888 |
|
Yuen Long Town Catchment |
54,953 |
11,012 |
0 |
0 |
|
Yuen Long South Catchment |
0 |
0 |
17,775 |
6,577 |
|
Total |
54,953 |
11,012 |
76,046 |
28,445 |
As for the Commissioning Scenario, data on commercial and industrial flows have only been estimated for 2016 by DSD as part of their ultimate planning for sewerage system in the Yuen Long and surrounding areas. Data on these flows for 2007 has been calculated by assuming a pro-rata growth between 1996 and 2016. In 2007 all of the commercial and industrial flows from the existing Yuen Long Town catchment will be connected to the STW, while in the upstream areas none of the commercial and industrial flows will be connected to the STW. The estimated commercial and industrial flows are shown in Table 4.2b.
Table 4.2b Summary
of Commercial and Industrial Flows (m3 day-1) in 2007
|
Year |
Commercial |
Industrial |
||
|
|
Yuen Long Town Catchment |
Upstream Areas |
Yuen Long Town Catchment |
Upstream Areas |
|
1996 |
848 |
732 |
19,555 |
510 |
|
2016 |
3,765 |
6,721 |
30,600 |
10,449 |
|
2007 |
2,452 |
4,026 |
25,630 |
5,976 |
|
|
Sewered |
Unsewered |
Sewered |
Unsewered |
|
2007 |
2,452 |
4,026 |
25,630 |
5,976 |
The total flows to the Yuen Long STW in 2007 are the sum of the sewered domestic, commercial and industrial flows, which is 39,094 m3 day-1. Using the same assumptions regarding effluent quality as the Commissioning Scenario (refer to Table 4.1c), gives the flows and loads for the effluent from the STW shown in Table 4.2c.
Table 4.2c Pollutant Flows and Loads from the Yuen Long STW in 2007
|
Parameter |
Effluent Load |
|
Flow (m3 day-1) |
39,094 |
|
Suspended Solids (kg day-1) |
570.1 |
|
Biochemical Oxygen Demand (kg day-1) |
295.8 |
|
Chemical Oxygen Demand (kg day-1) |
2,209.8 |
|
Total Kjeldahl Nitrogen (kg day-1) |
354.8 |
|
Ammonia (kg day-1) |
211.8 |
|
Nitrite + Nitrate (kg day-1) |
560.3 |
|
Total Phosphorous (kg day-1) |
82.1 |
|
E. coli (cfu day-1) |
3.91X10¹¹ |
As for the Commissioning Scenario the loads from unsewered domestic flows are calculated from the Global Unit Load Factors given in the DSD Sewerage Manual, based on the populations given in Table 4.2a. The unsewered domestic loads are shown in Table 4.2d.
Table 4.2d Unsewered Domestic Pollutant Flows and Loads in 2007
|
Parameter |
Pollutant Load |
|
Flow (m3
day-1) |
28,445 |
|
Suspended Solids
(kg day-1) |
3,041.8 |
|
Biochemical
Oxygen Demand (kg day-1) |
3,193.9 |
|
Chemical Oxygen
Demand (kg day-1) |
6,844.1 |
|
Total Kjeldahl
Nitrogen (kg day-1) |
646.4 |
|
Ammonia (kg day-1) |
380.2 |
|
Nitrite +
Nitrate (kg day-1) |
- |
|
Total
Phosphorous (kg day-1) |
- |
|
E. coli (cfu day-1) |
3.27x10¹⁵ |
|
|
|
The same assumptions regarding the treatment of commercial and industrial effluents prior to discharge to inland waterways were made for the Non-Commissioning Scenario as for the Commissioning Scenario (see Section 4.1). The resulting flows and loads for commercial and industrial effluent to inland waterways are shown in Table 4.2e.
Table 4.2e Effluent Flows and Loads for Commercial and Industrial Effluents
|
Parameter |
Commercial |
Industrial |
|
Flow (m3 day-1) |
4,026 |
5,976 |
|
Suspended Solids (kg day-1) |
120.8 |
179.3 |
|
Biochemical Oxygen Demand
(kg day-1) |
80.5 |
119.5 |
|
Chemical Oxygen Demand (kg
day-1) |
322.1 |
478.1 |
|
Total Kjeldahl Nitrogen (kg
day-1) |
33.7 |
50.1 |
|
Ammonia (kg day-1) |
20.1 |
29.9 |
|
Nitrite + Nitrate (kg day-1) |
40.3 |
59.8 |
|
Total Phosphorous (kg day-1) |
20.1 |
29.9 |
|
E.
coli (cfu day-1) |
4.03x10⁹ |
0 |
|
|
|
|
The total flows and loads at YL2 are thus the sum of the treated effluent discharges from the Yuen Long STW (Table 4.2c), untreated domestic effluent discharges to inland waterways (Table 4.2d) and treated commercial and industrial effluent discharges to inland waterways (Table 4.2e). These flows represent the dry season flows. As in the Commissioning Scenario, the wet season flows are derived by increasing the total dry season flows at YL2 by 186,420 m3 day-1. The resulting wet and dry season flows and loads at YL2 are shown in Table 4.2f.
Table 4.2f Effluent Flows and Loads at YL2 in the Wet and Dry Seasons for the Non-Commissioning Scenario
|
Parameter |
Wet
Season |
Dry
Season |
|
Flow (m3 day-1) |
263,957 |
77,542 |
|
Suspended Solids (kg day-1) |
3,912 |
3,912 |
|
Biochemical Oxygen Demand
(kg day-1) |
3,690 |
3,690 |
|
Chemical Oxygen Demand (kg
day-1) |
9,854 |
9,854 |
|
Total Kjeldahl Nitrogen (kg
day-1) |
1,084 |
1,084 |
|
Ammonia (kg day-1) |
642 |
642 |
|
Nitrite + Nitrate (kg day-1) |
660 |
660 |
|
Total Phosphorous (kg day-1) |
132 |
132 |
|
E.
coli (cfu day-1) |
3.27x10¹⁵ |
3.27x10¹⁵ |
|
|
|
|
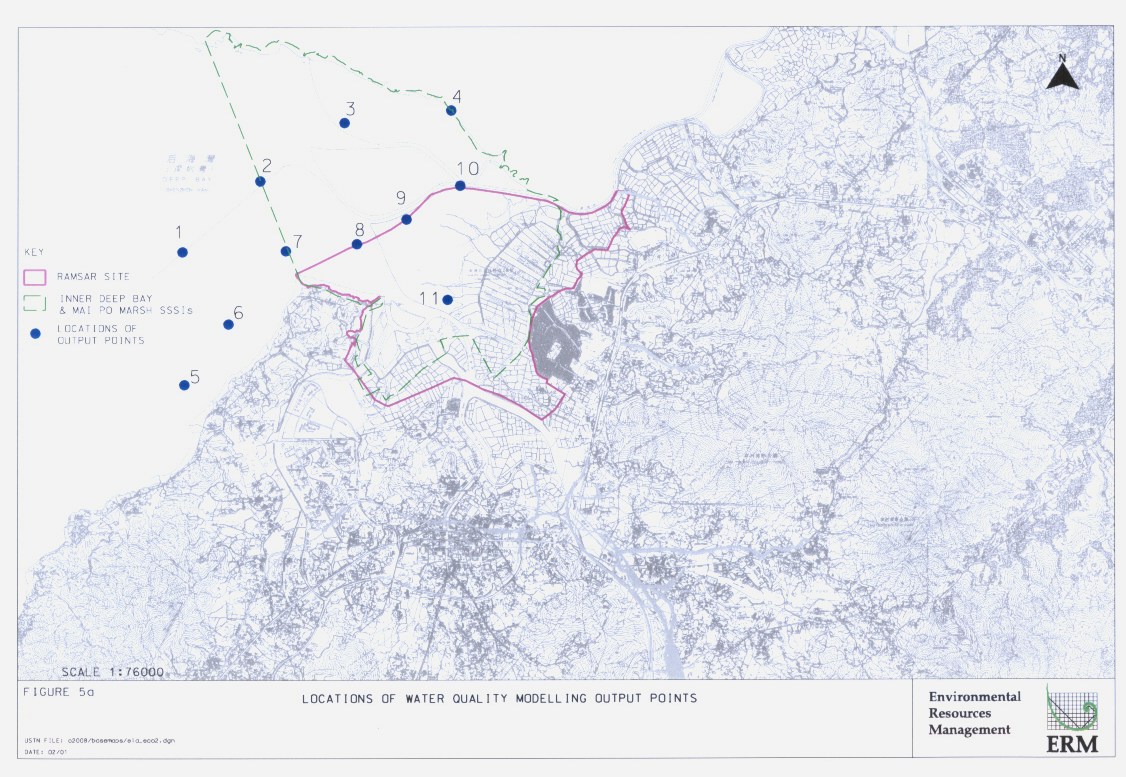
The modelling results will be produced as a series of contour plots and statistical analyses of key parameters at selected points. The contour plots and statistical analyses will be produced in the following formats:
· dissolved oxygen – depth averaged values which are exceeded for 90% of the simulation time;
· dissolved oxygen – bottom values which are exceeded for 90% of the simulation time;
· 5-day biochemical oxygen demand – depth averaged mean values;
· total inorganic nitrogen – depth averaged mean values;
· unionised ammonia – depth averaged mean values;
· chlorophyll-a – depth averaged mean values;
· coli – depth averaged geometric mean values; and
· suspended sediment – depth averaged mean values.
The above presentation of modelling results will allow a comparison to be made with the relevant Water Quality Objectives for both the Commissioning and Non-Commissioning Scenarios.
Based on previous experience, the selected locations (as shown in Figure 5a), represent the sensitive marine waters of Deep Bay will be specified for the model.