ATRIUM LINK EXTENSION
ENVIRONMENTAL IMPACT
ASSESSMENT
ENVIRONMENTAL IMPACT
ASSESSMENT REPORT
TABLE OF CONTENTS
Background of the Project
Purpose of the EIA Study
Structure of the Report
Location and Scale of the Project
Key Project Requirements
Need for the Project / Scenarios with or without the Project
/ Benefits of the Project
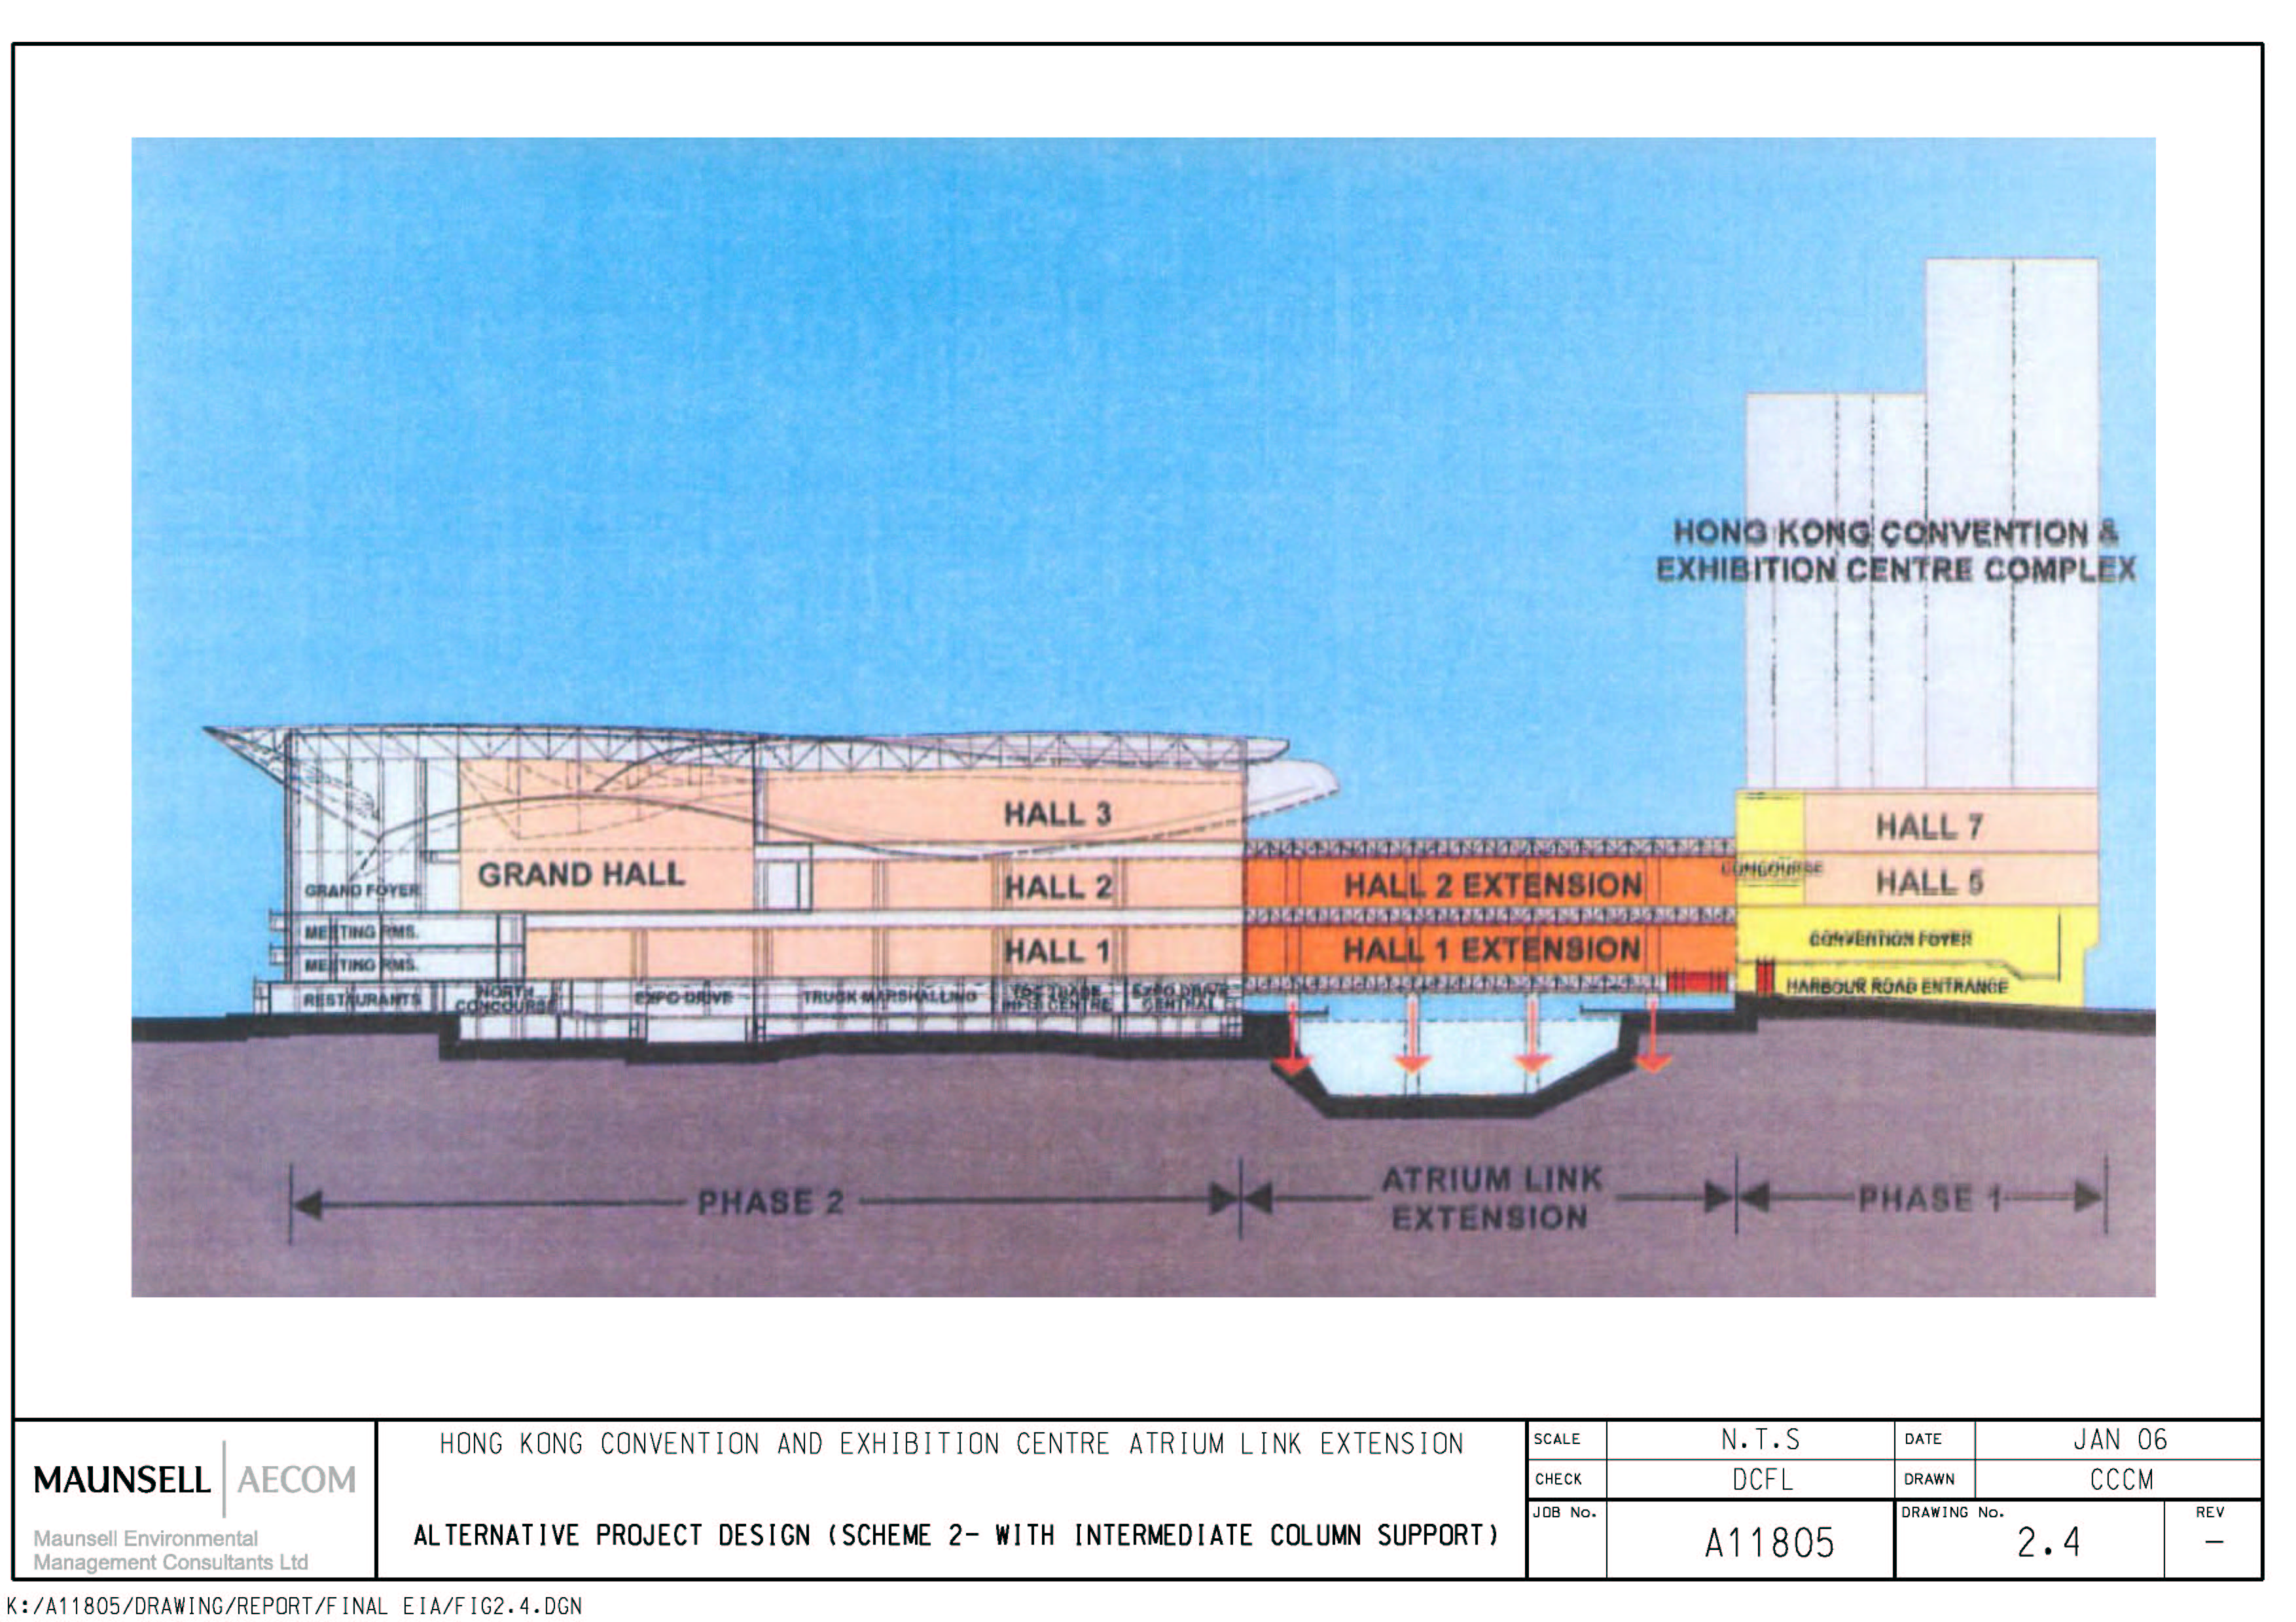
Design of the Project
Indirect/Secondary Impact on Traffic Generation
Consideration of Alternative Project Design
Consideration of Alternative Construction Method
Introduction
Environmental Legislation, Standards and Guidelines
Description of Environment
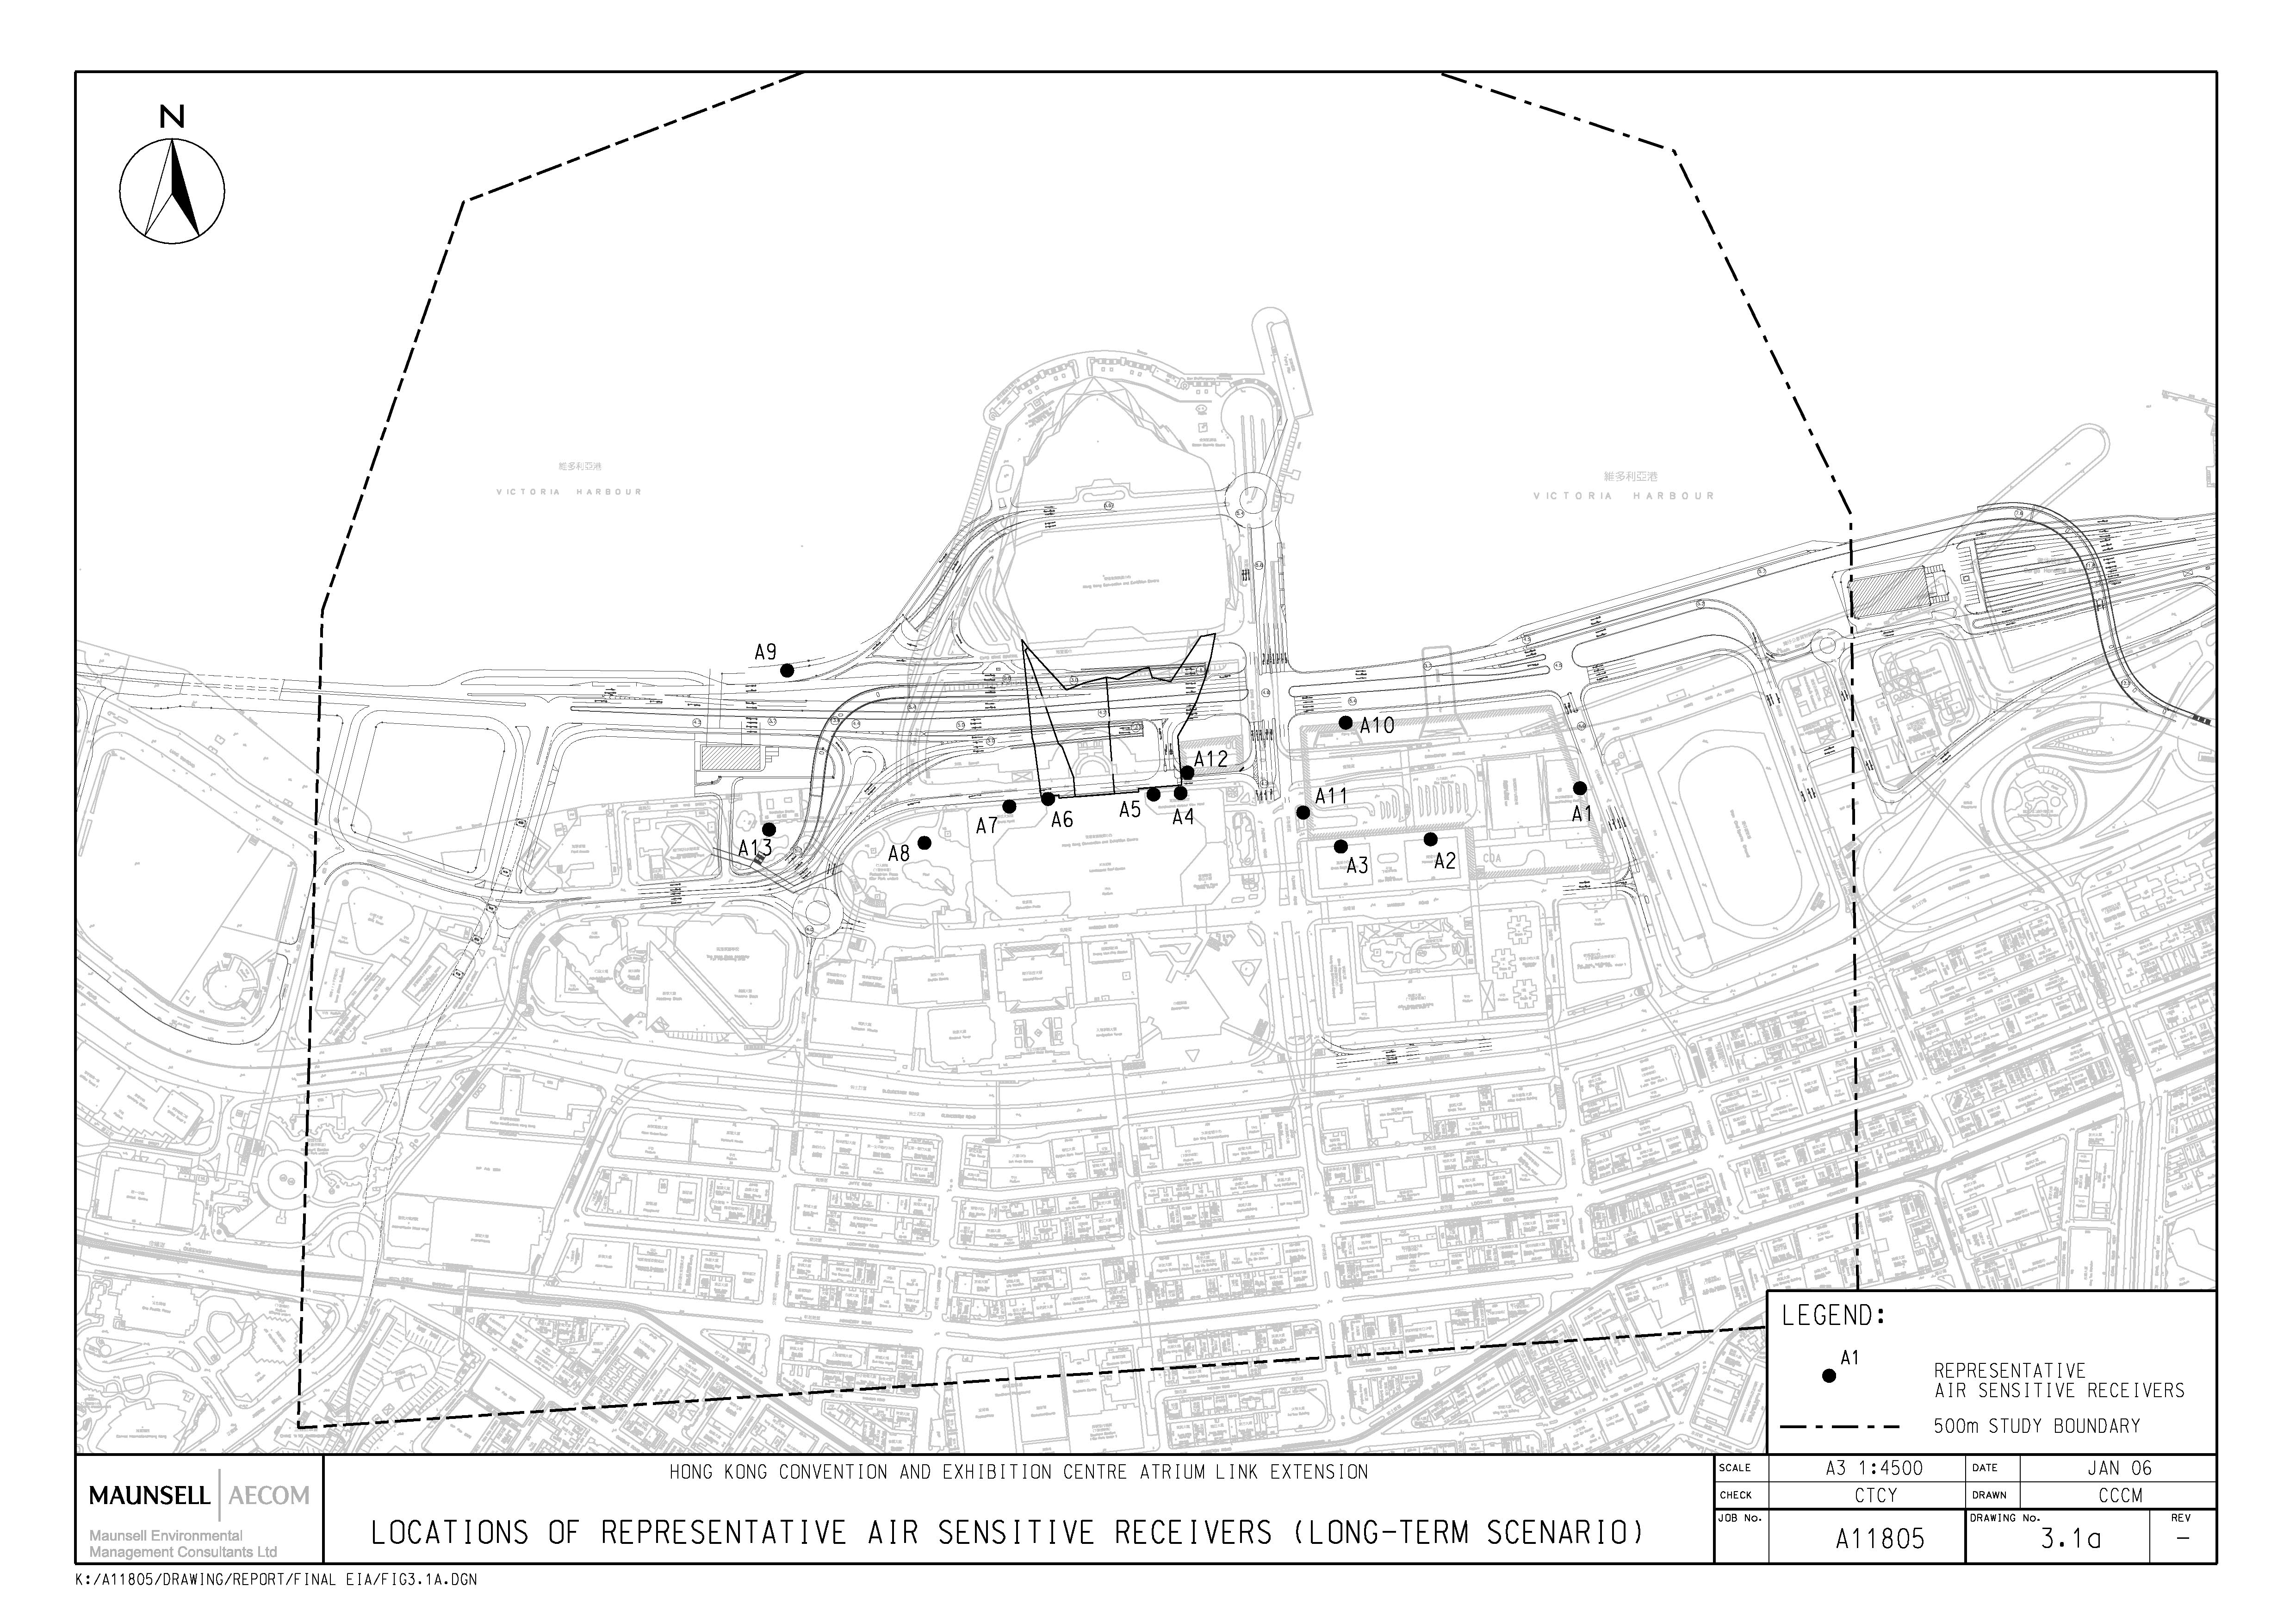
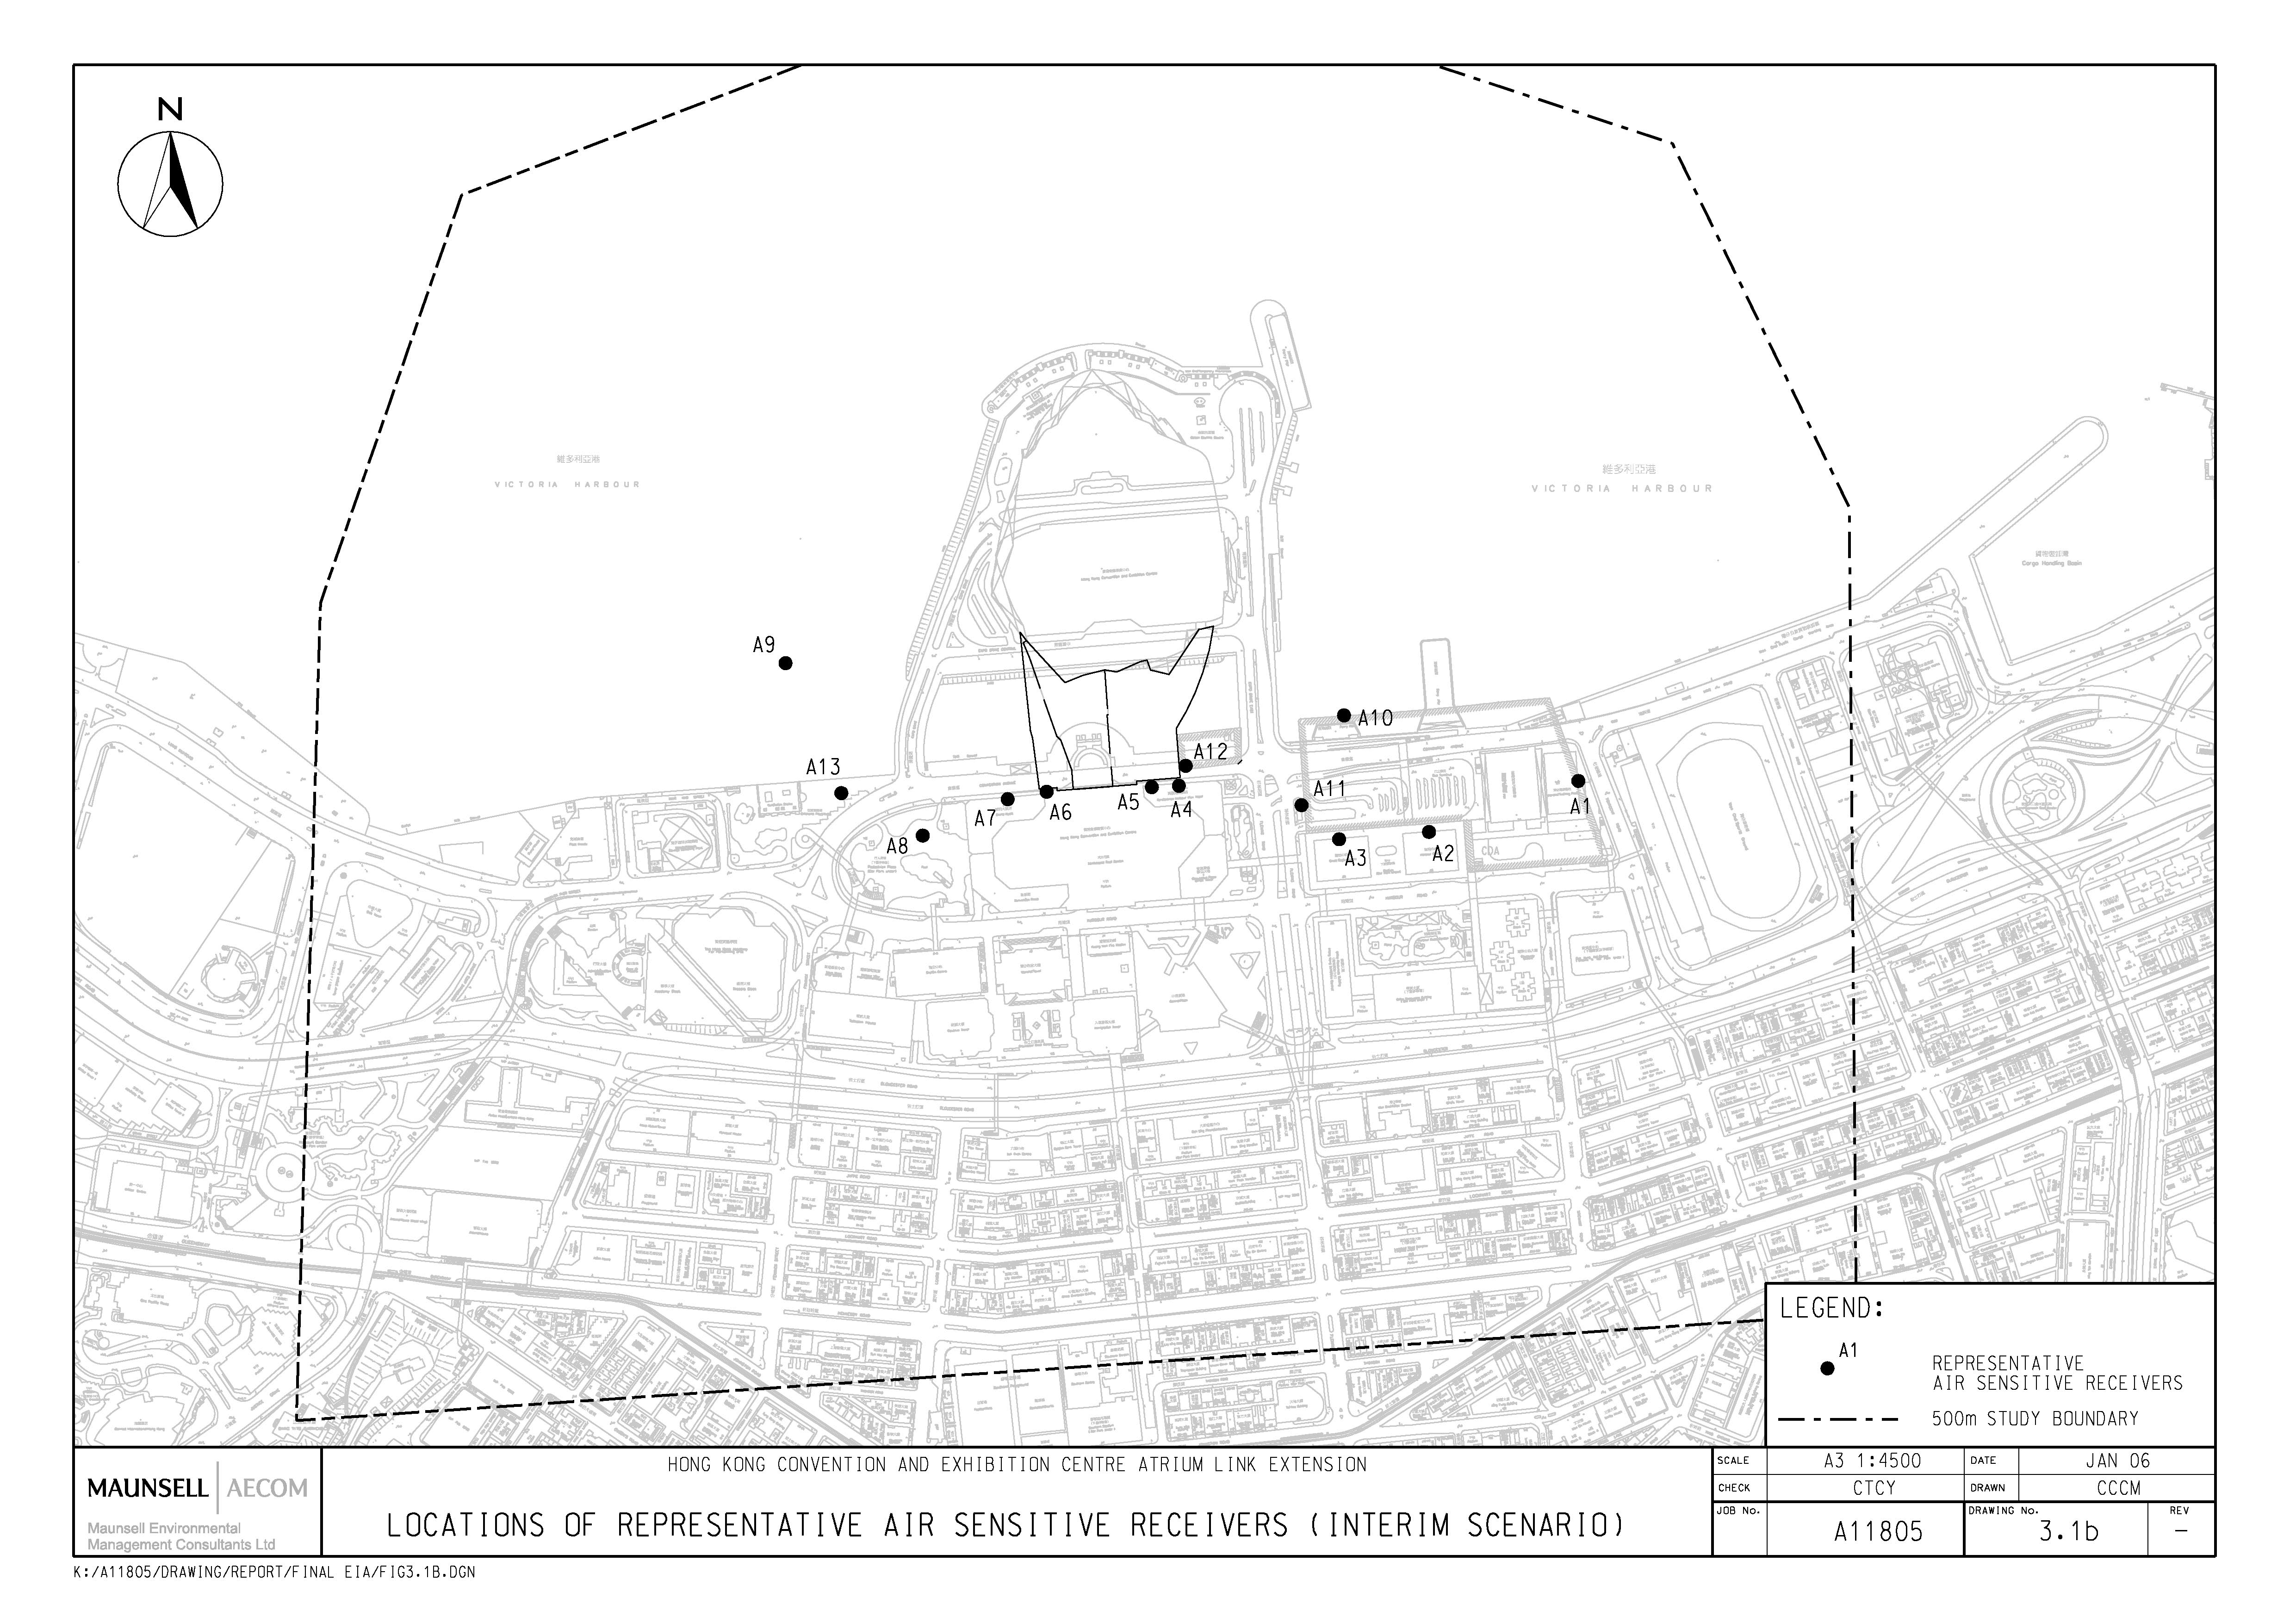
Air Sensitive Receivers
Identification of Impacts
Assessment Methodology
Identification, Prediction and Evaluation of Air Quality
Impacts
Mitigation Measures
Residual Environmental Impact
Environmental Monitoring and Audit
Conclusion
Introduction
Environmental Legislation, Standards and Guidelines
Description of Environment
Noise Sensitive Receivers
Identification of Impacts
Prediction and Evaluation of Impacts
Mitigation of Adverse Environmental Impacts
Evaluation of Residual Impacts
Environmental Monitoring and Audit
Conclusion
Introduction
Environmental Legislation, Policies, Plans, Standards and
Criteria
Description of the Environment
Water Sensitive Receivers
Identification of Environmental Impacts
Assessment Methodology
Evaluation of Environmental Impacts
Mitigation of Adverse Environmental Impacts
Evaluation of Residual Impacts
Environmental Monitoring and Audit
Conclusion
6 WASTE MANAGEMENT IMPLICATIONS
Introduction
Environmental Legislation, Policies, Plans, Standards and
Criteria
Waste Management
Construction and Demolition (C&D) Material
Assessment Methodology
Baseline Conditions
Identification and Evaluation of Environmental Impacts
Mitigation of Adverse Environmental Impacts
Evaluation of Residual Impacts
Environmental Monitoring and Audit
Conclusion
7 LANDSCAPE AND VISUAL IMPACT ASSESSMENT
Introduction
Project Description
Review of Planning and Development Control Framework
Environmental Legislation and Standards
Methodology of Assessment of Landscape Impacts
Methodology of Assessment of Visual Impacts
Baseline Study
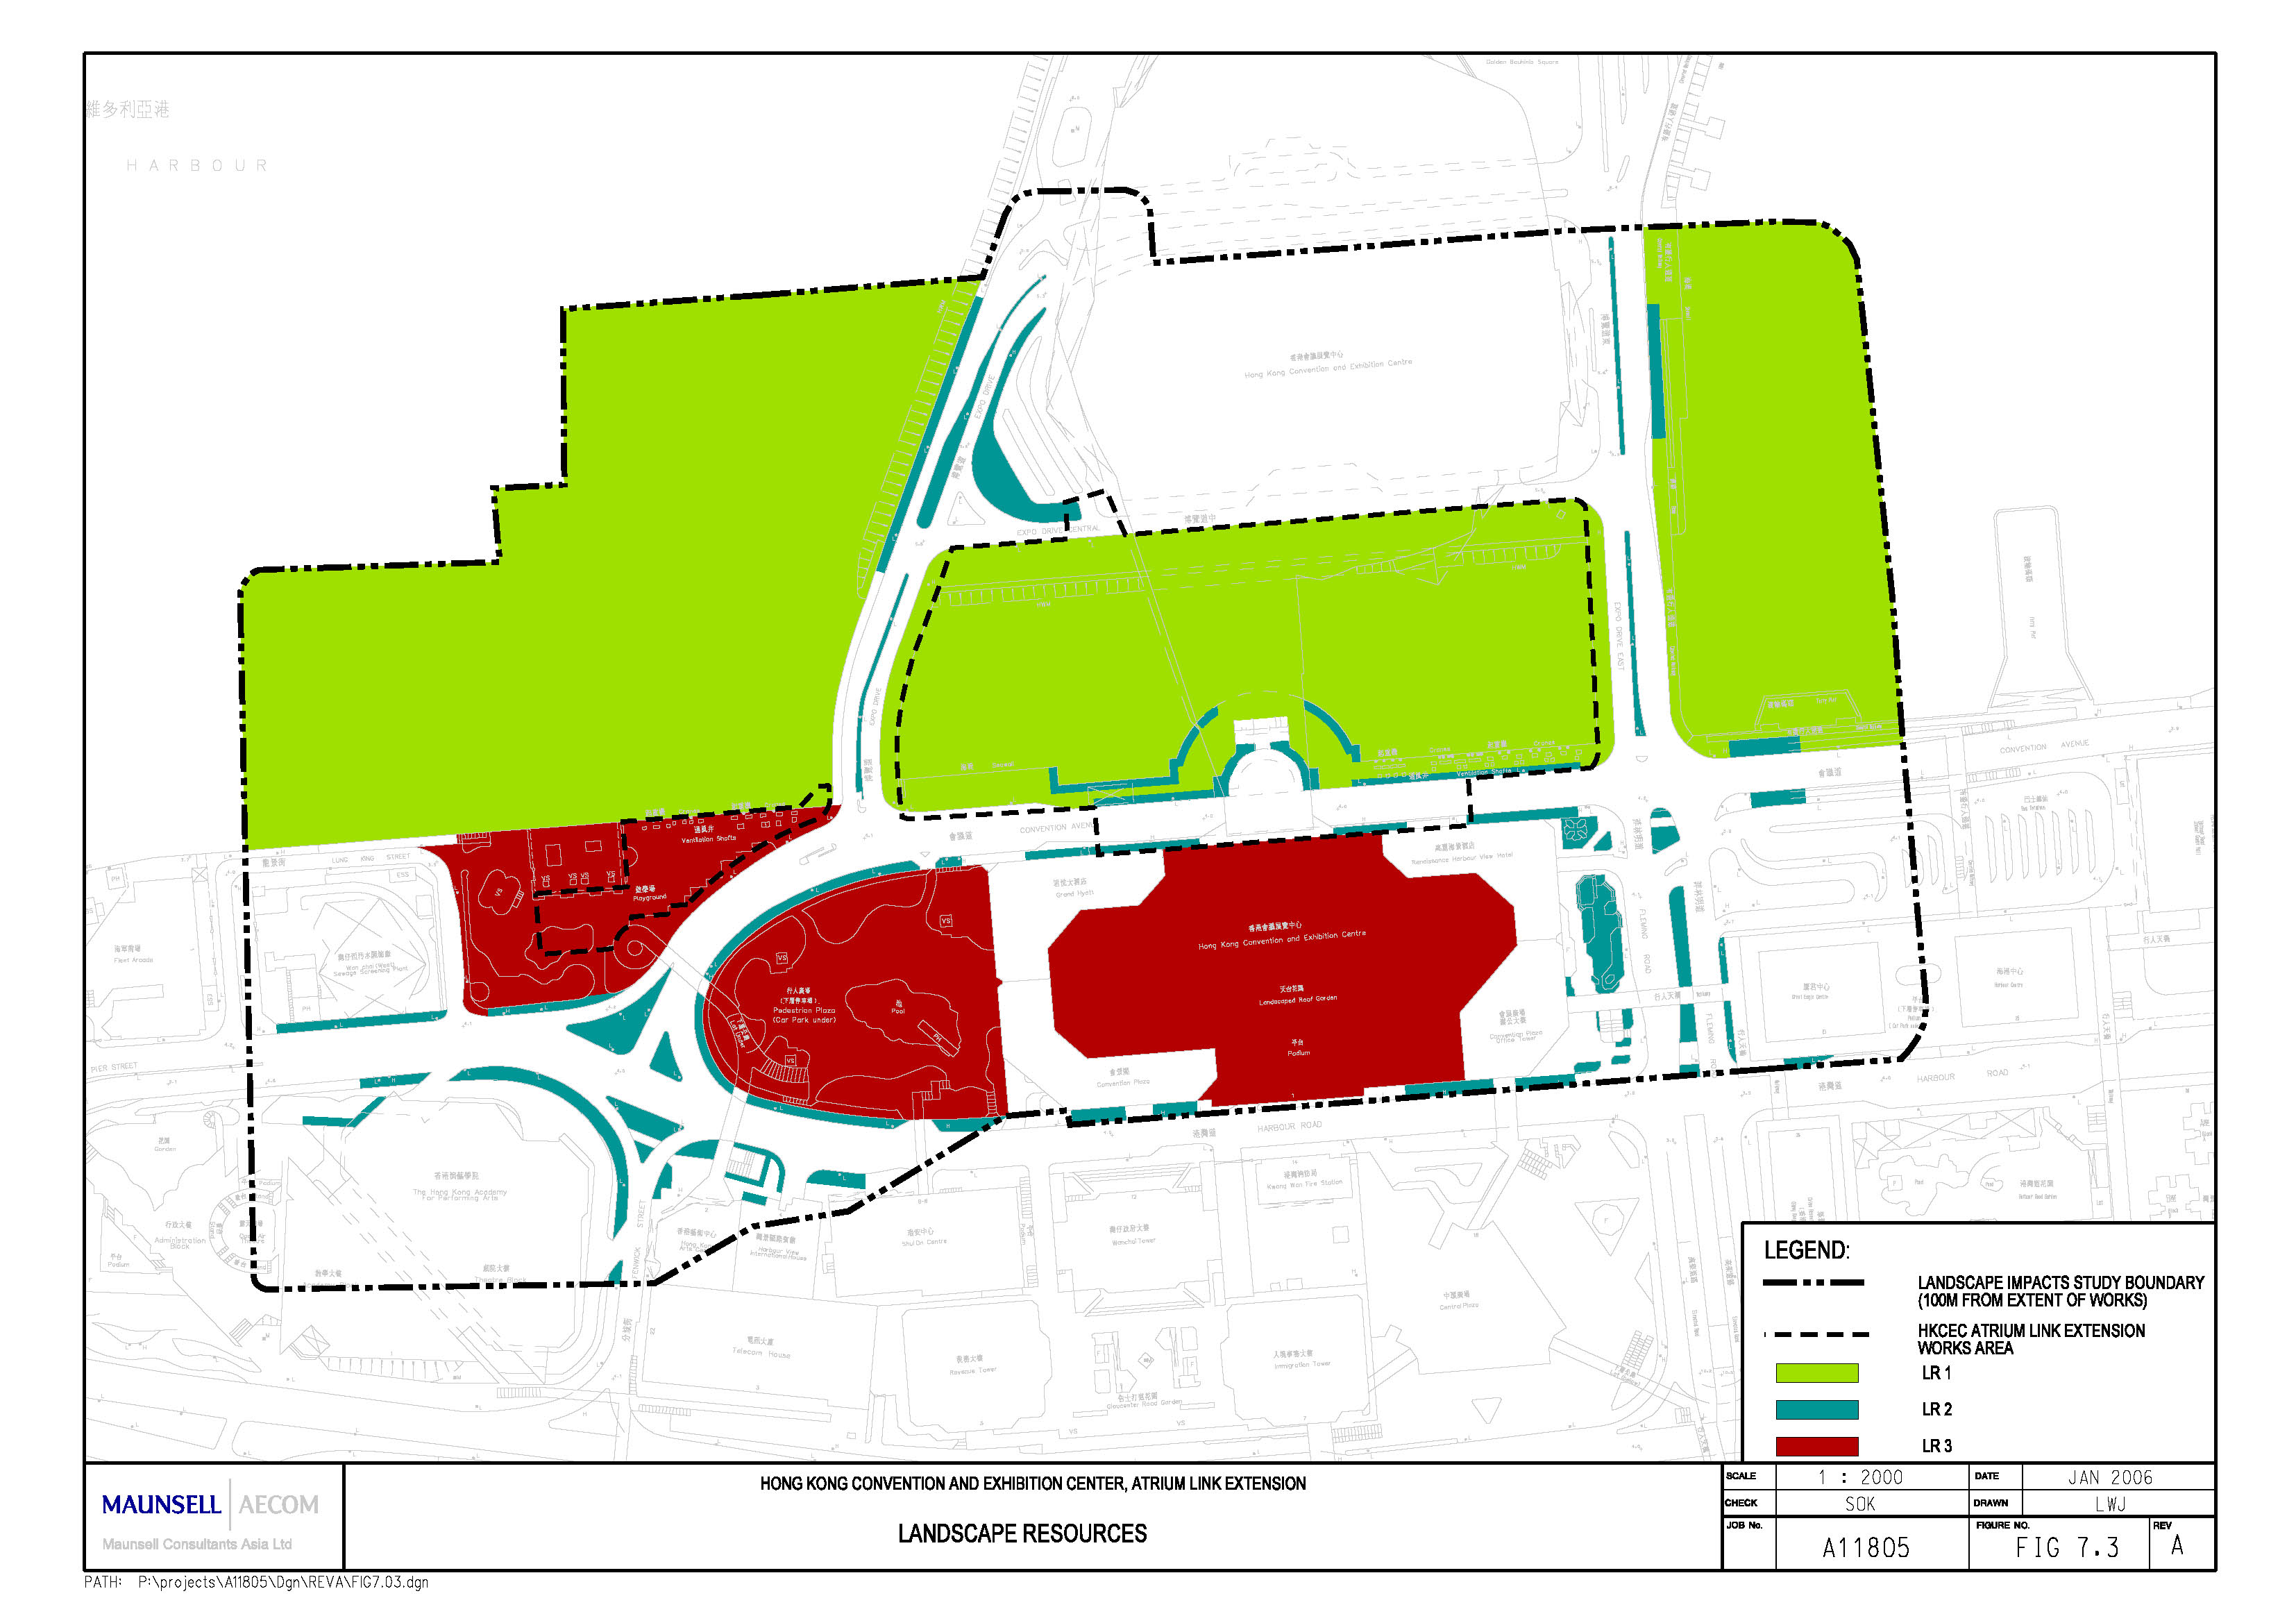
Landscape Resource
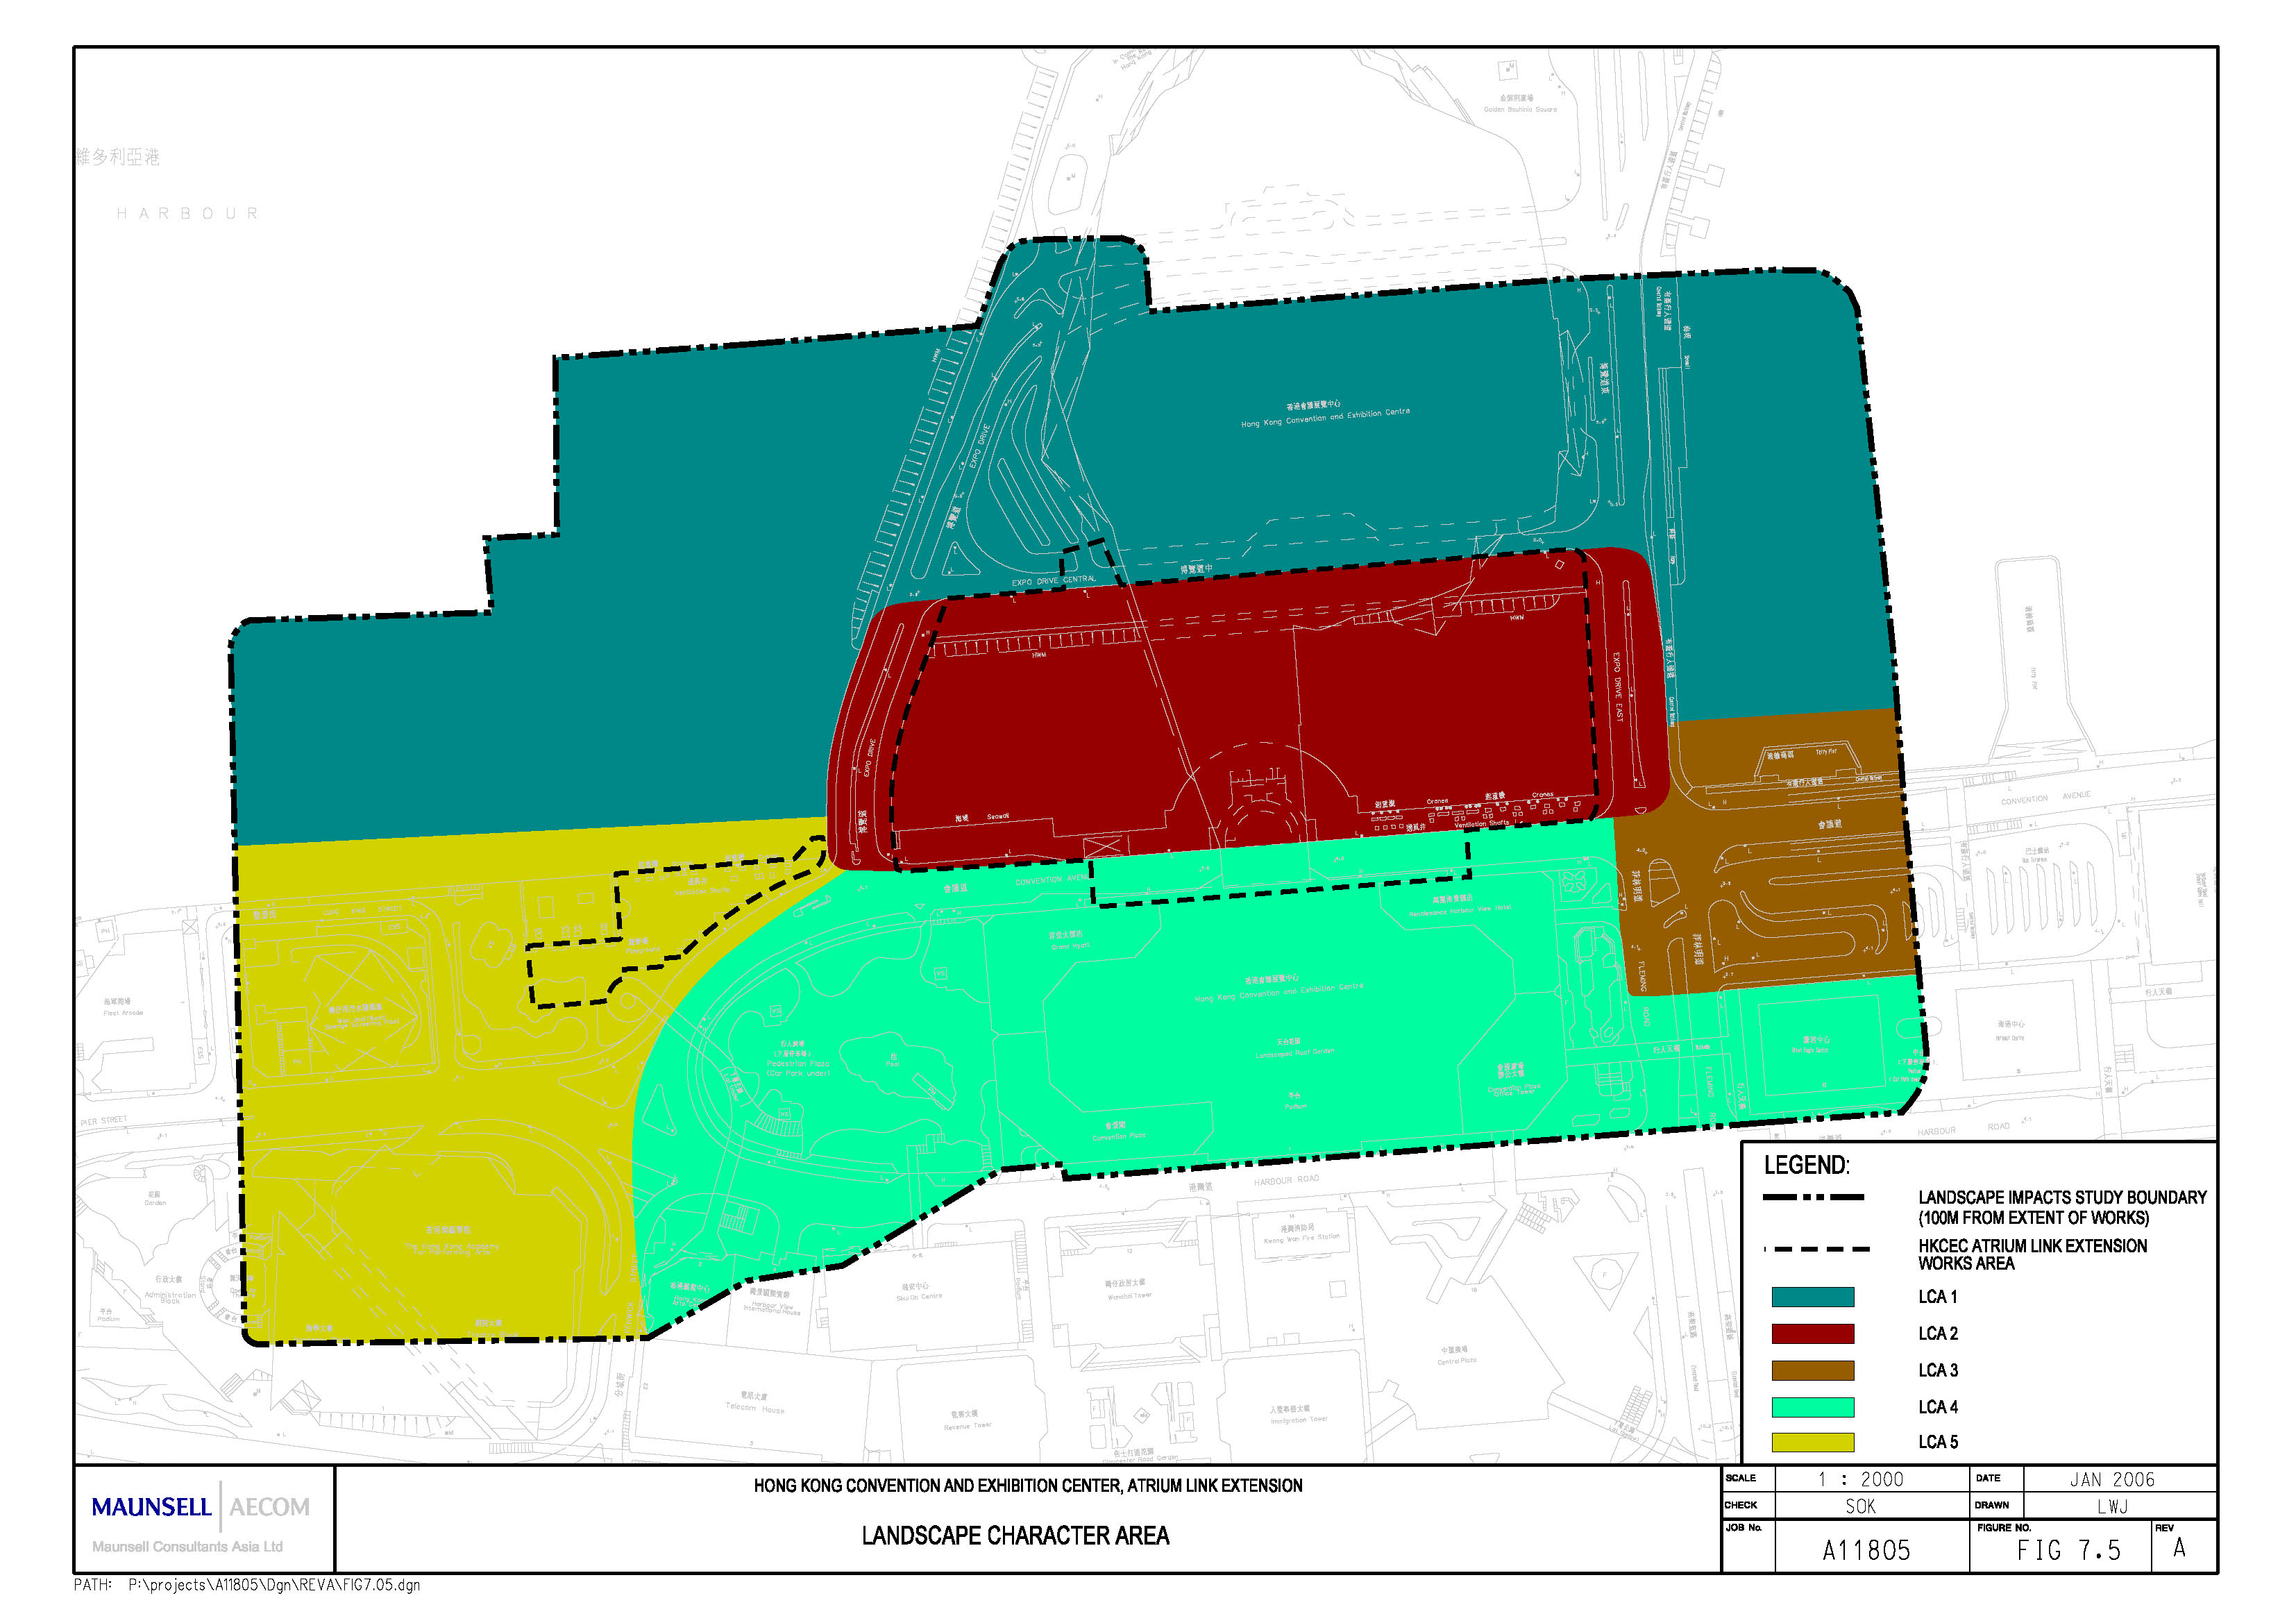
Landscape Character Area
Visually Sensitive Receiver
Landscape Impact Assessment (Before Mitigation)
Preliminary Tree Survey
Visual Impact Assessment (Before Mitigation)
Detail Visual Analysis for the lower levels of Renaissance Harbour View Hotel (Part of VSR1A)
Recommended Landscape and Visual Mitigation Measures
Residual Impacts
Photomontage of Residual Visual Impact
Three-dimensional Architectural/ Landscape Illustration
Conclusion
8 ENVIRONMENTAL MONITORING AND AUDIT
Introduction
Air Quality
Noise Impact
Water Quality
Waste Management
Landscape and Visual Impact
9 CONCLUSIONS AND RECOMMENDATIONS
Introduction
Air Quality
Noise Impact
Water Quality
Waste Management
Landscape and Visual Impact
Overall Conclusion
10 IMPLEMENTATION SCHEDULE OF PROPOSED
MITIGATION MEASURES
List of Tables
Table 2.1 Tentative Programme
for Atrium Link Extension Works
Table 3.1
Table 3.2 Tunnel Air Quality Guidelines (TAQG)
Table 3.3 EPD Air Quality Monitoring Data at
Central/Western Station in 2003
Table 3.4 Representative Air Sensitive
Receivers
Table 3.5 Annual Average Concentrations of
Pollutants in Past Five Years
Table 3.6 Emission Factors for Year 2011 for
Different Vehicle Categories (EURO4)
Table 3.7 Ventilation Buildings Emissions from
CWB
Table 3.8 Design of Central Ventilation
Buildings
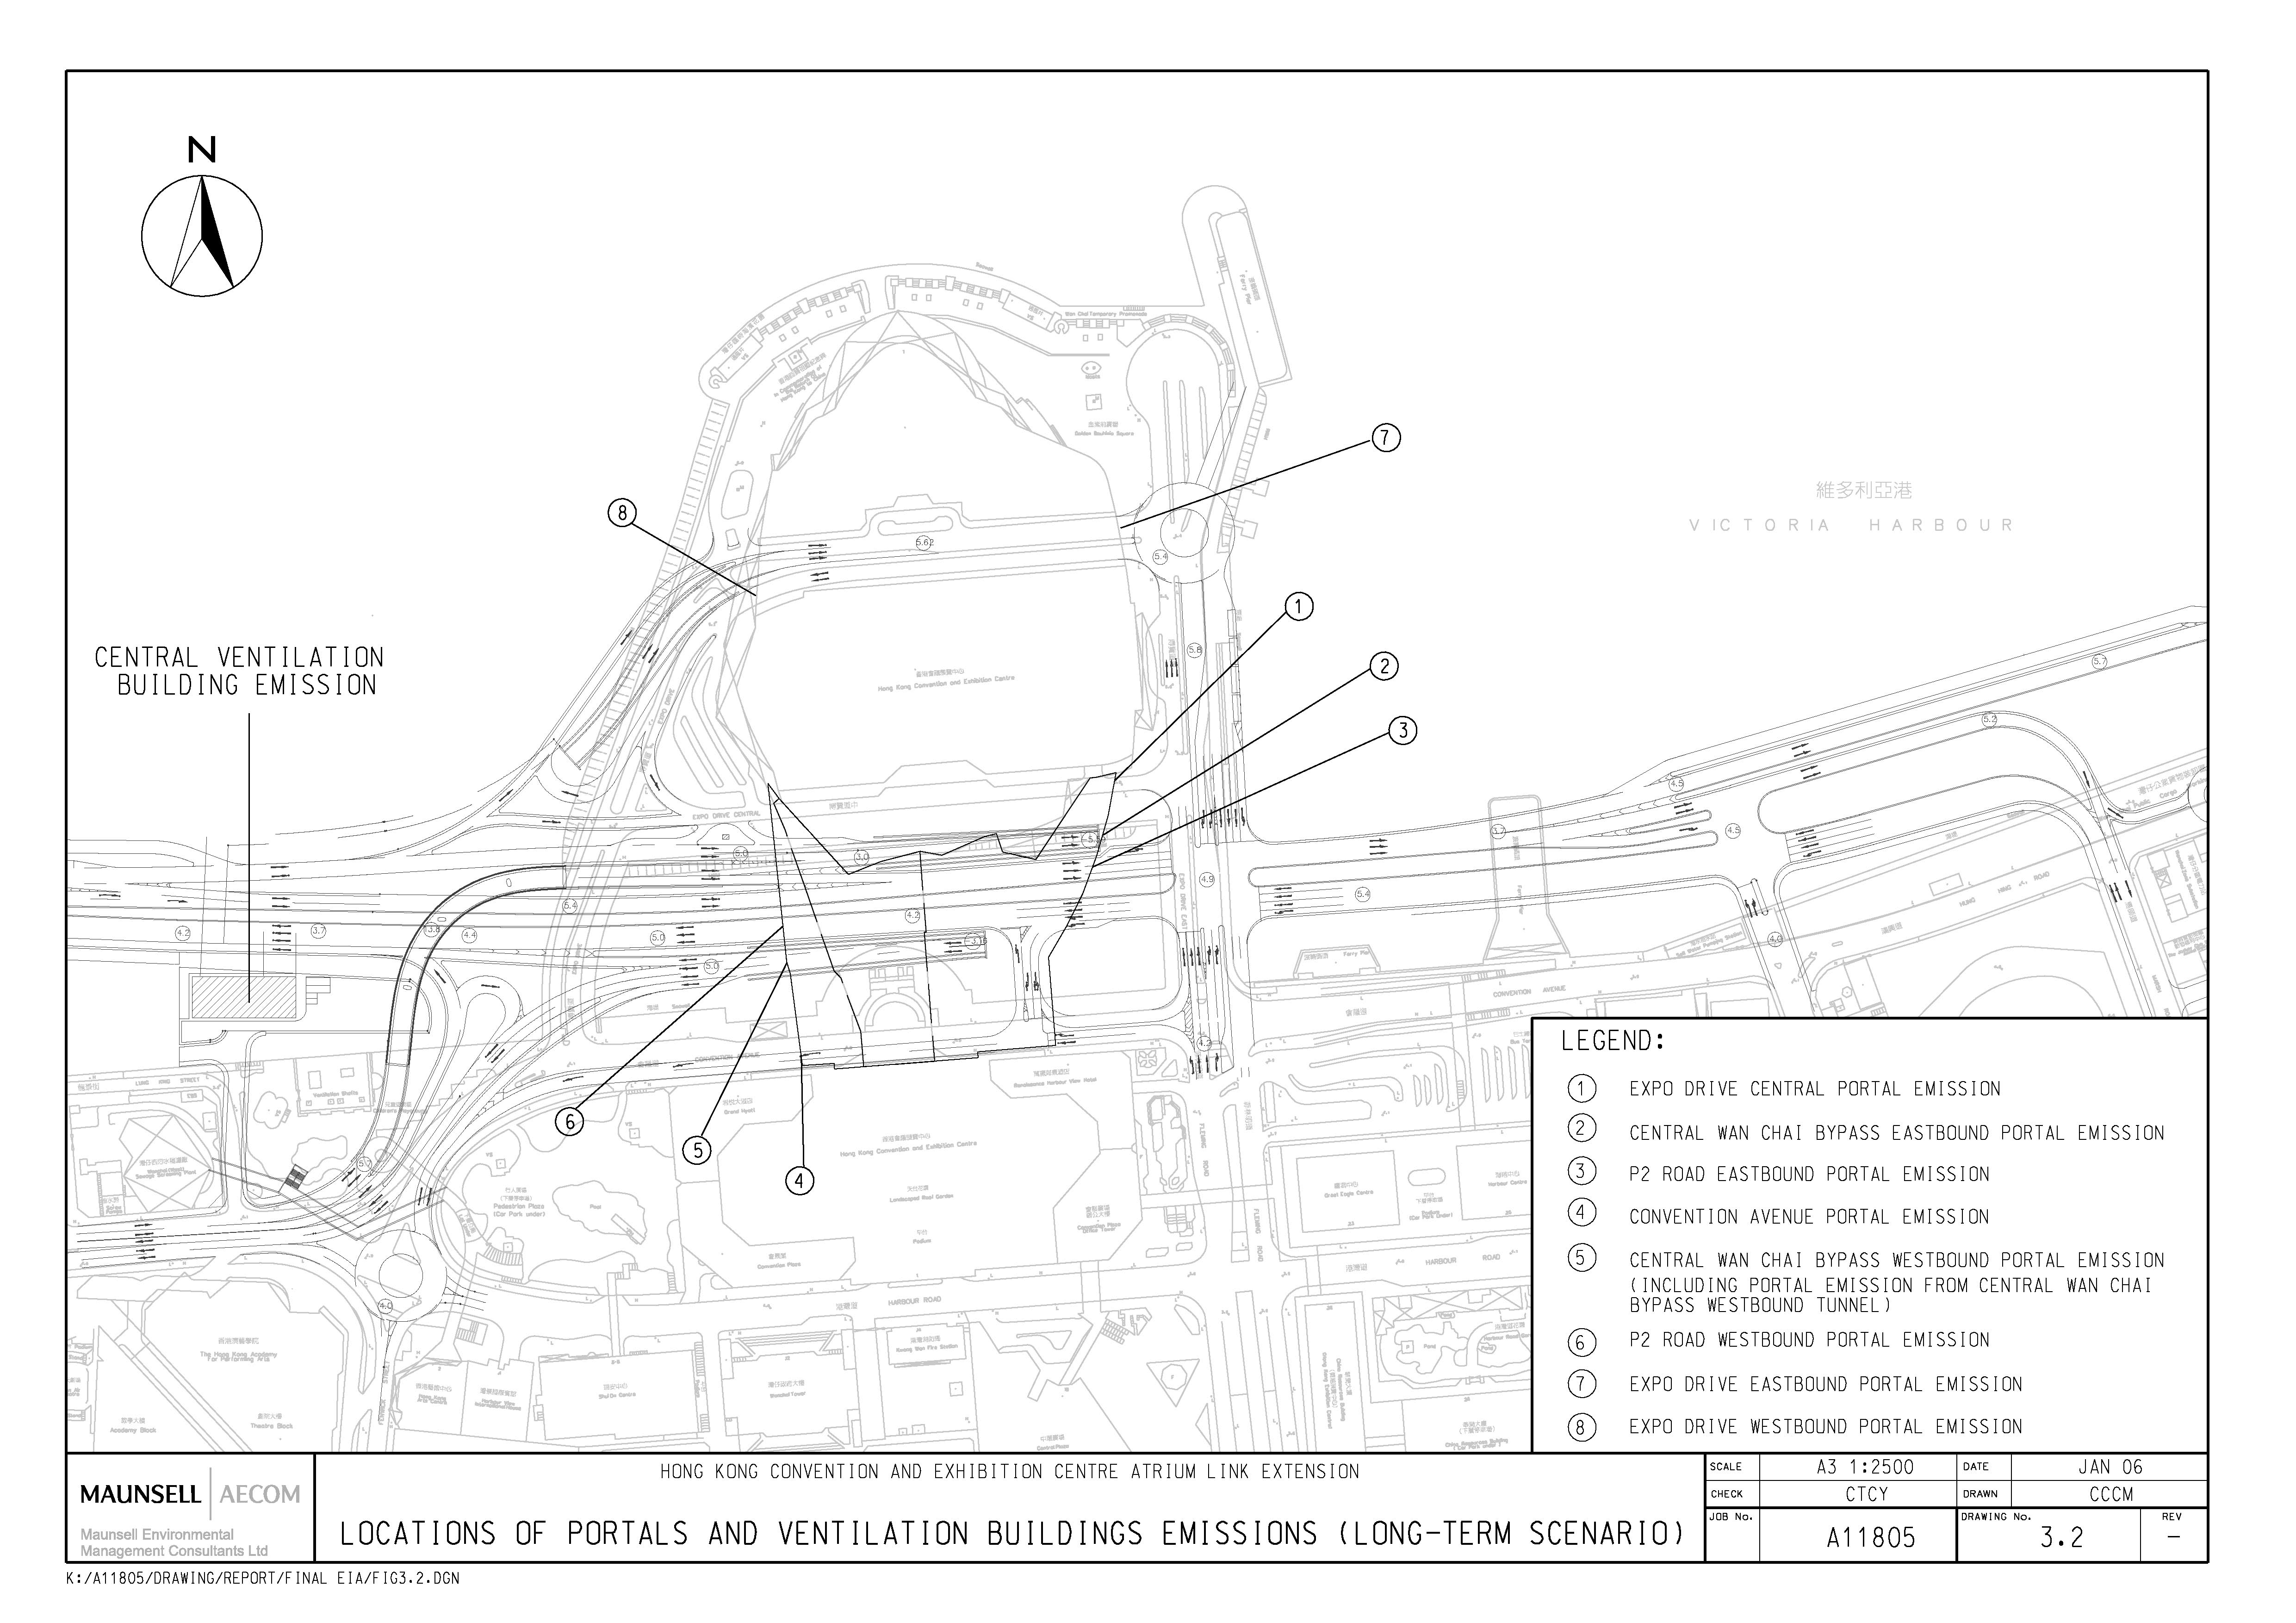
Table 3.9 Portals Emissions from Proposed Deckover (Long-term Scenario)
Table 3.10 Portals Emissions from Proposed Deckover (Interim Scenario)
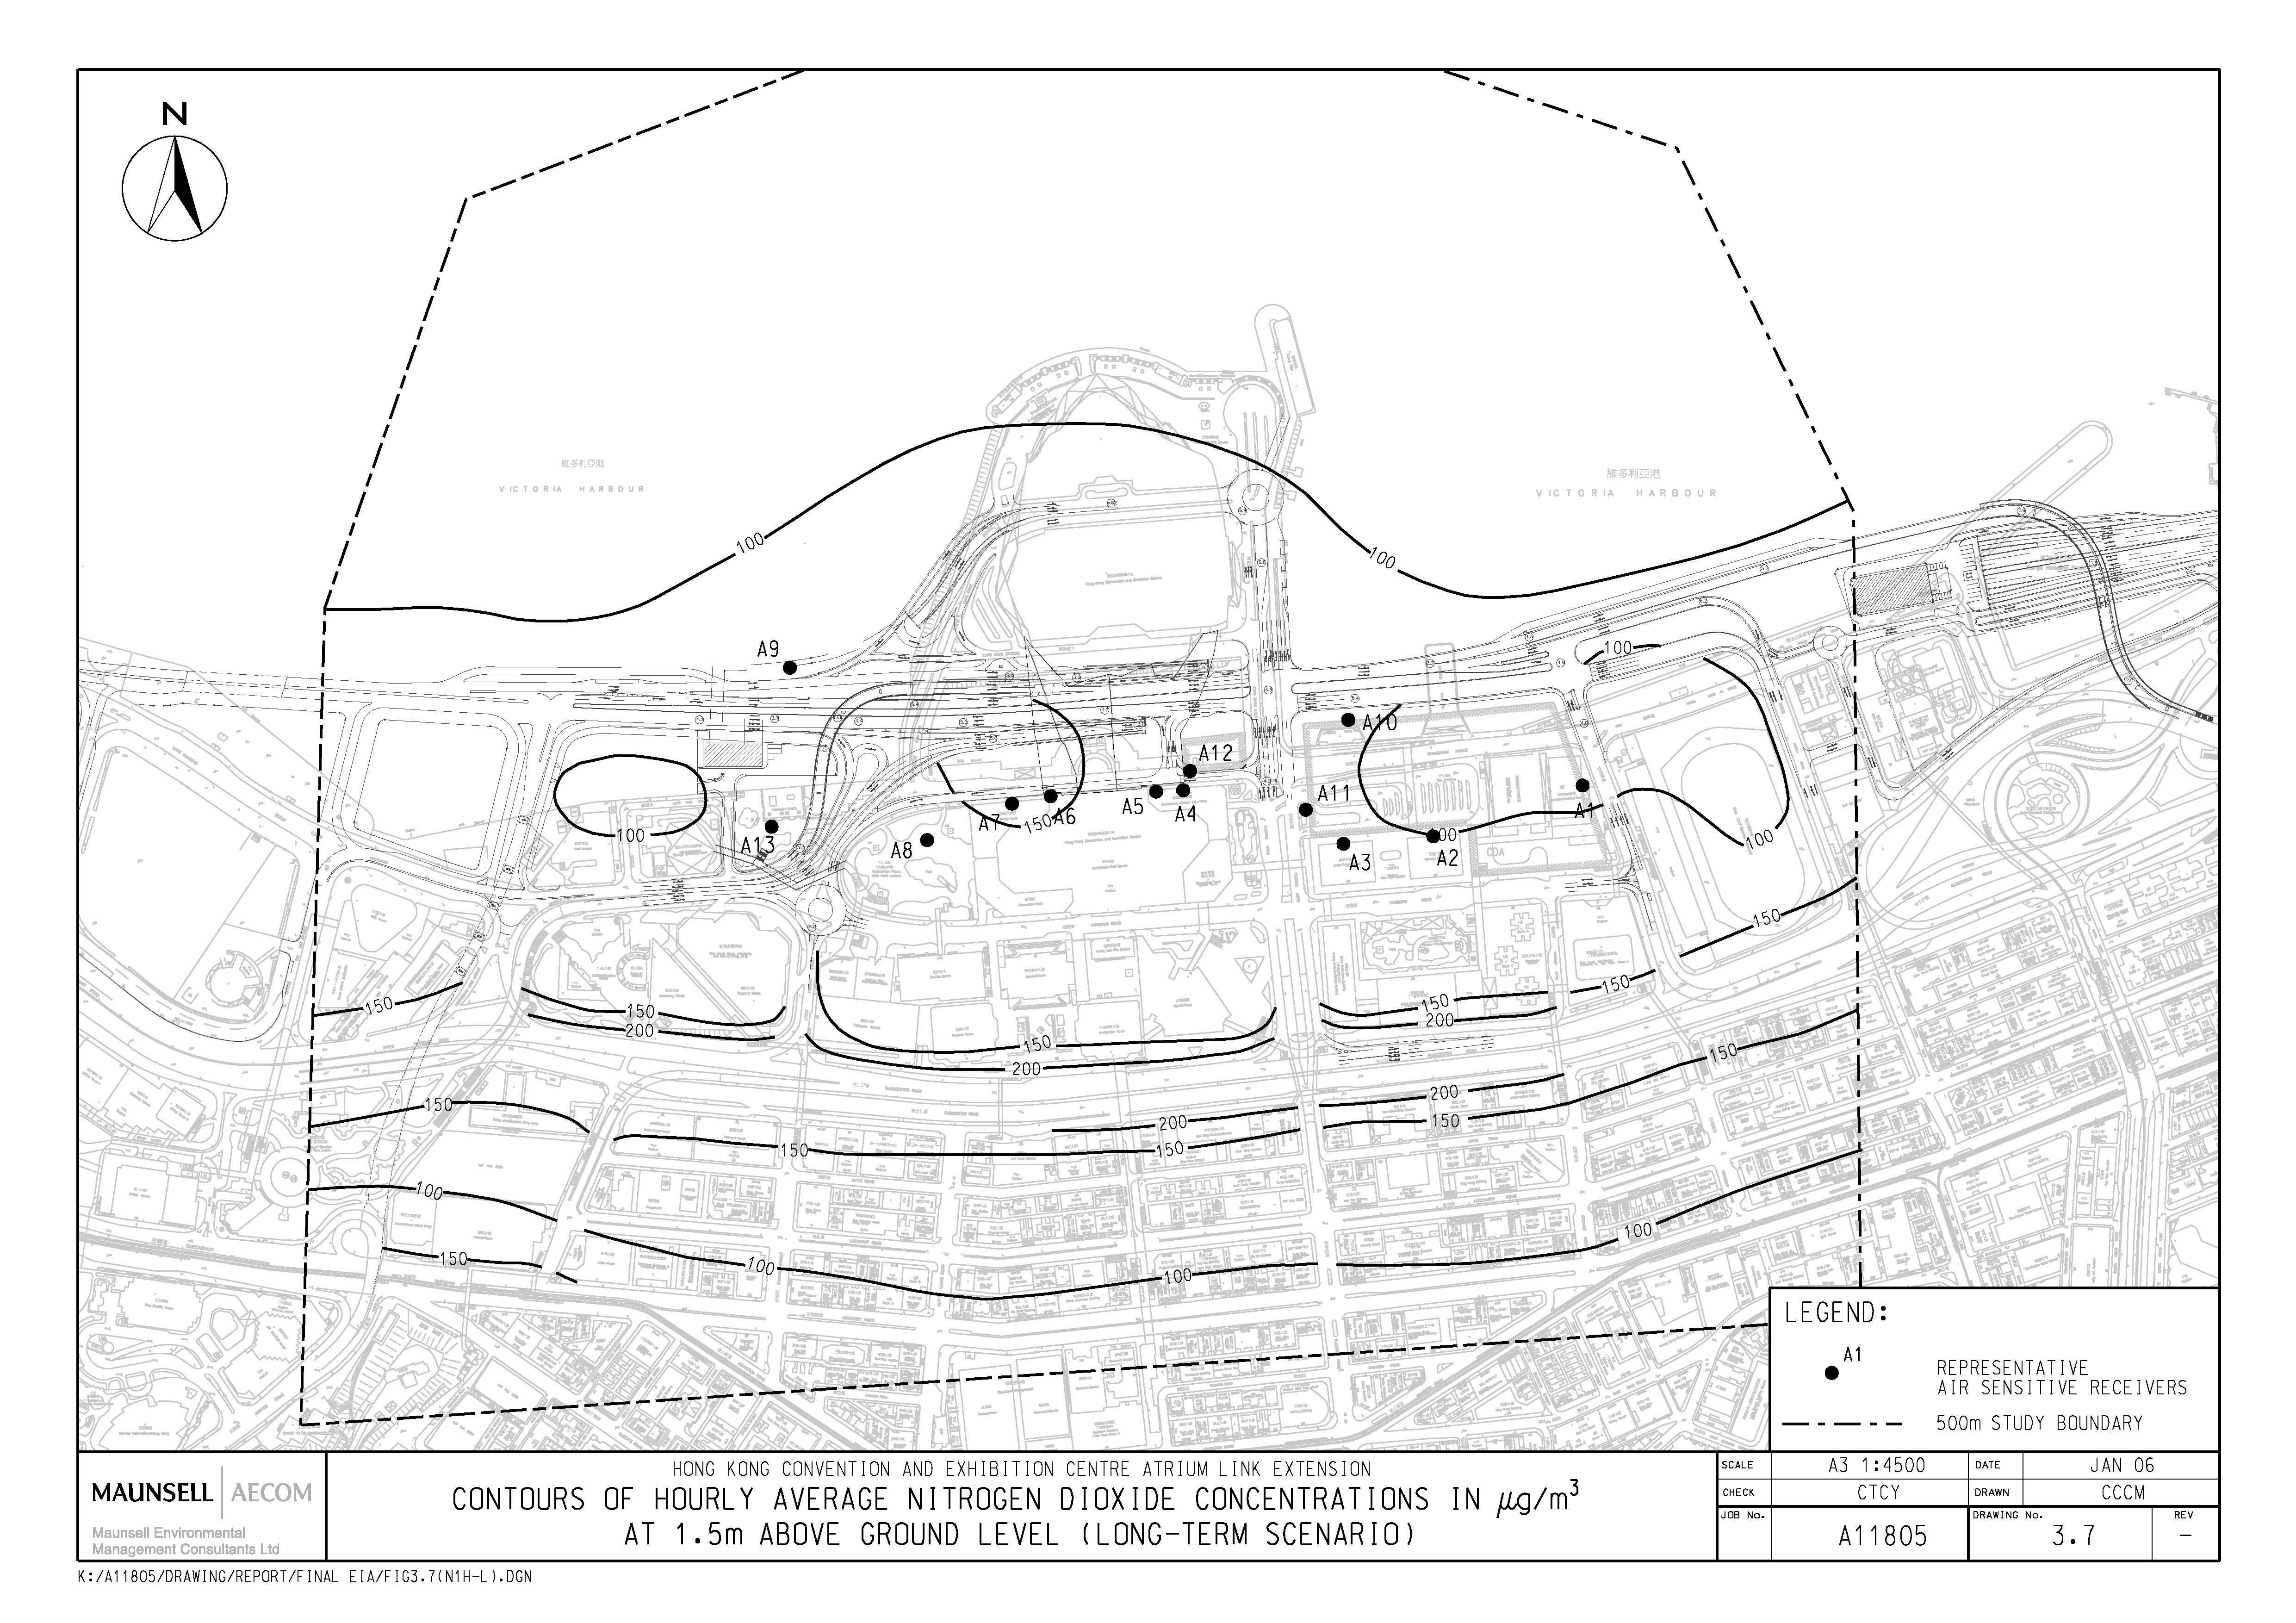
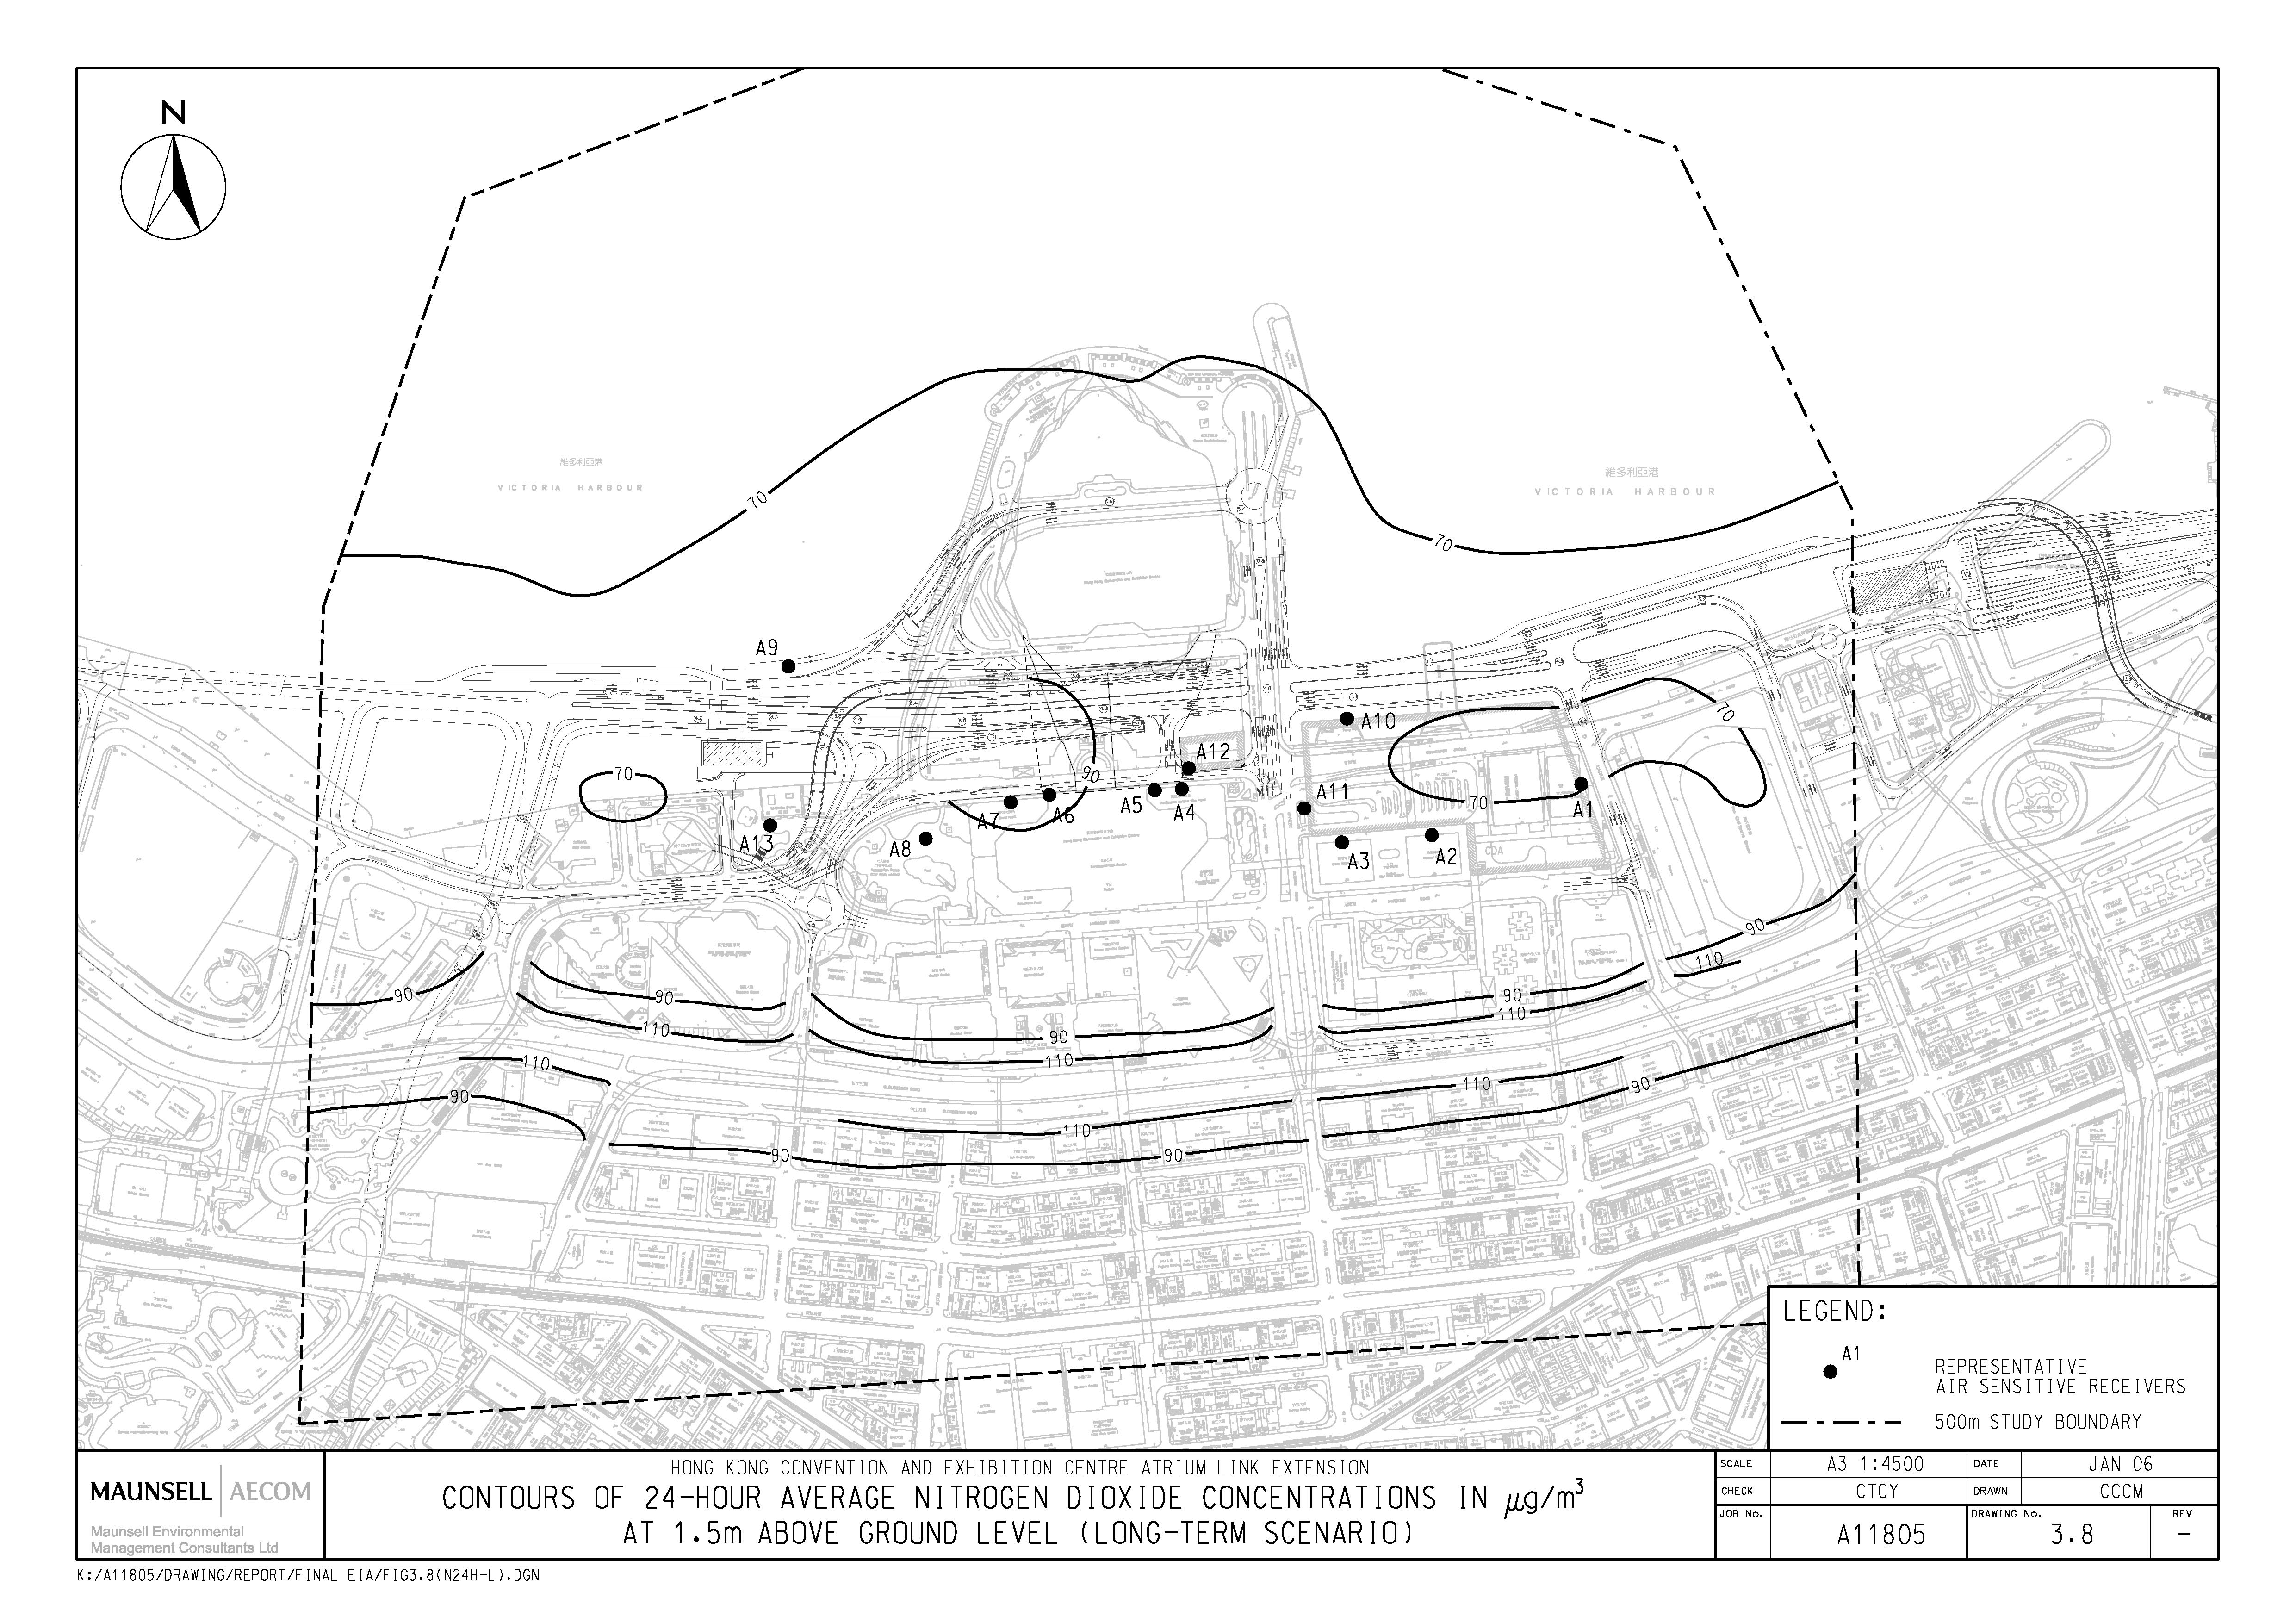
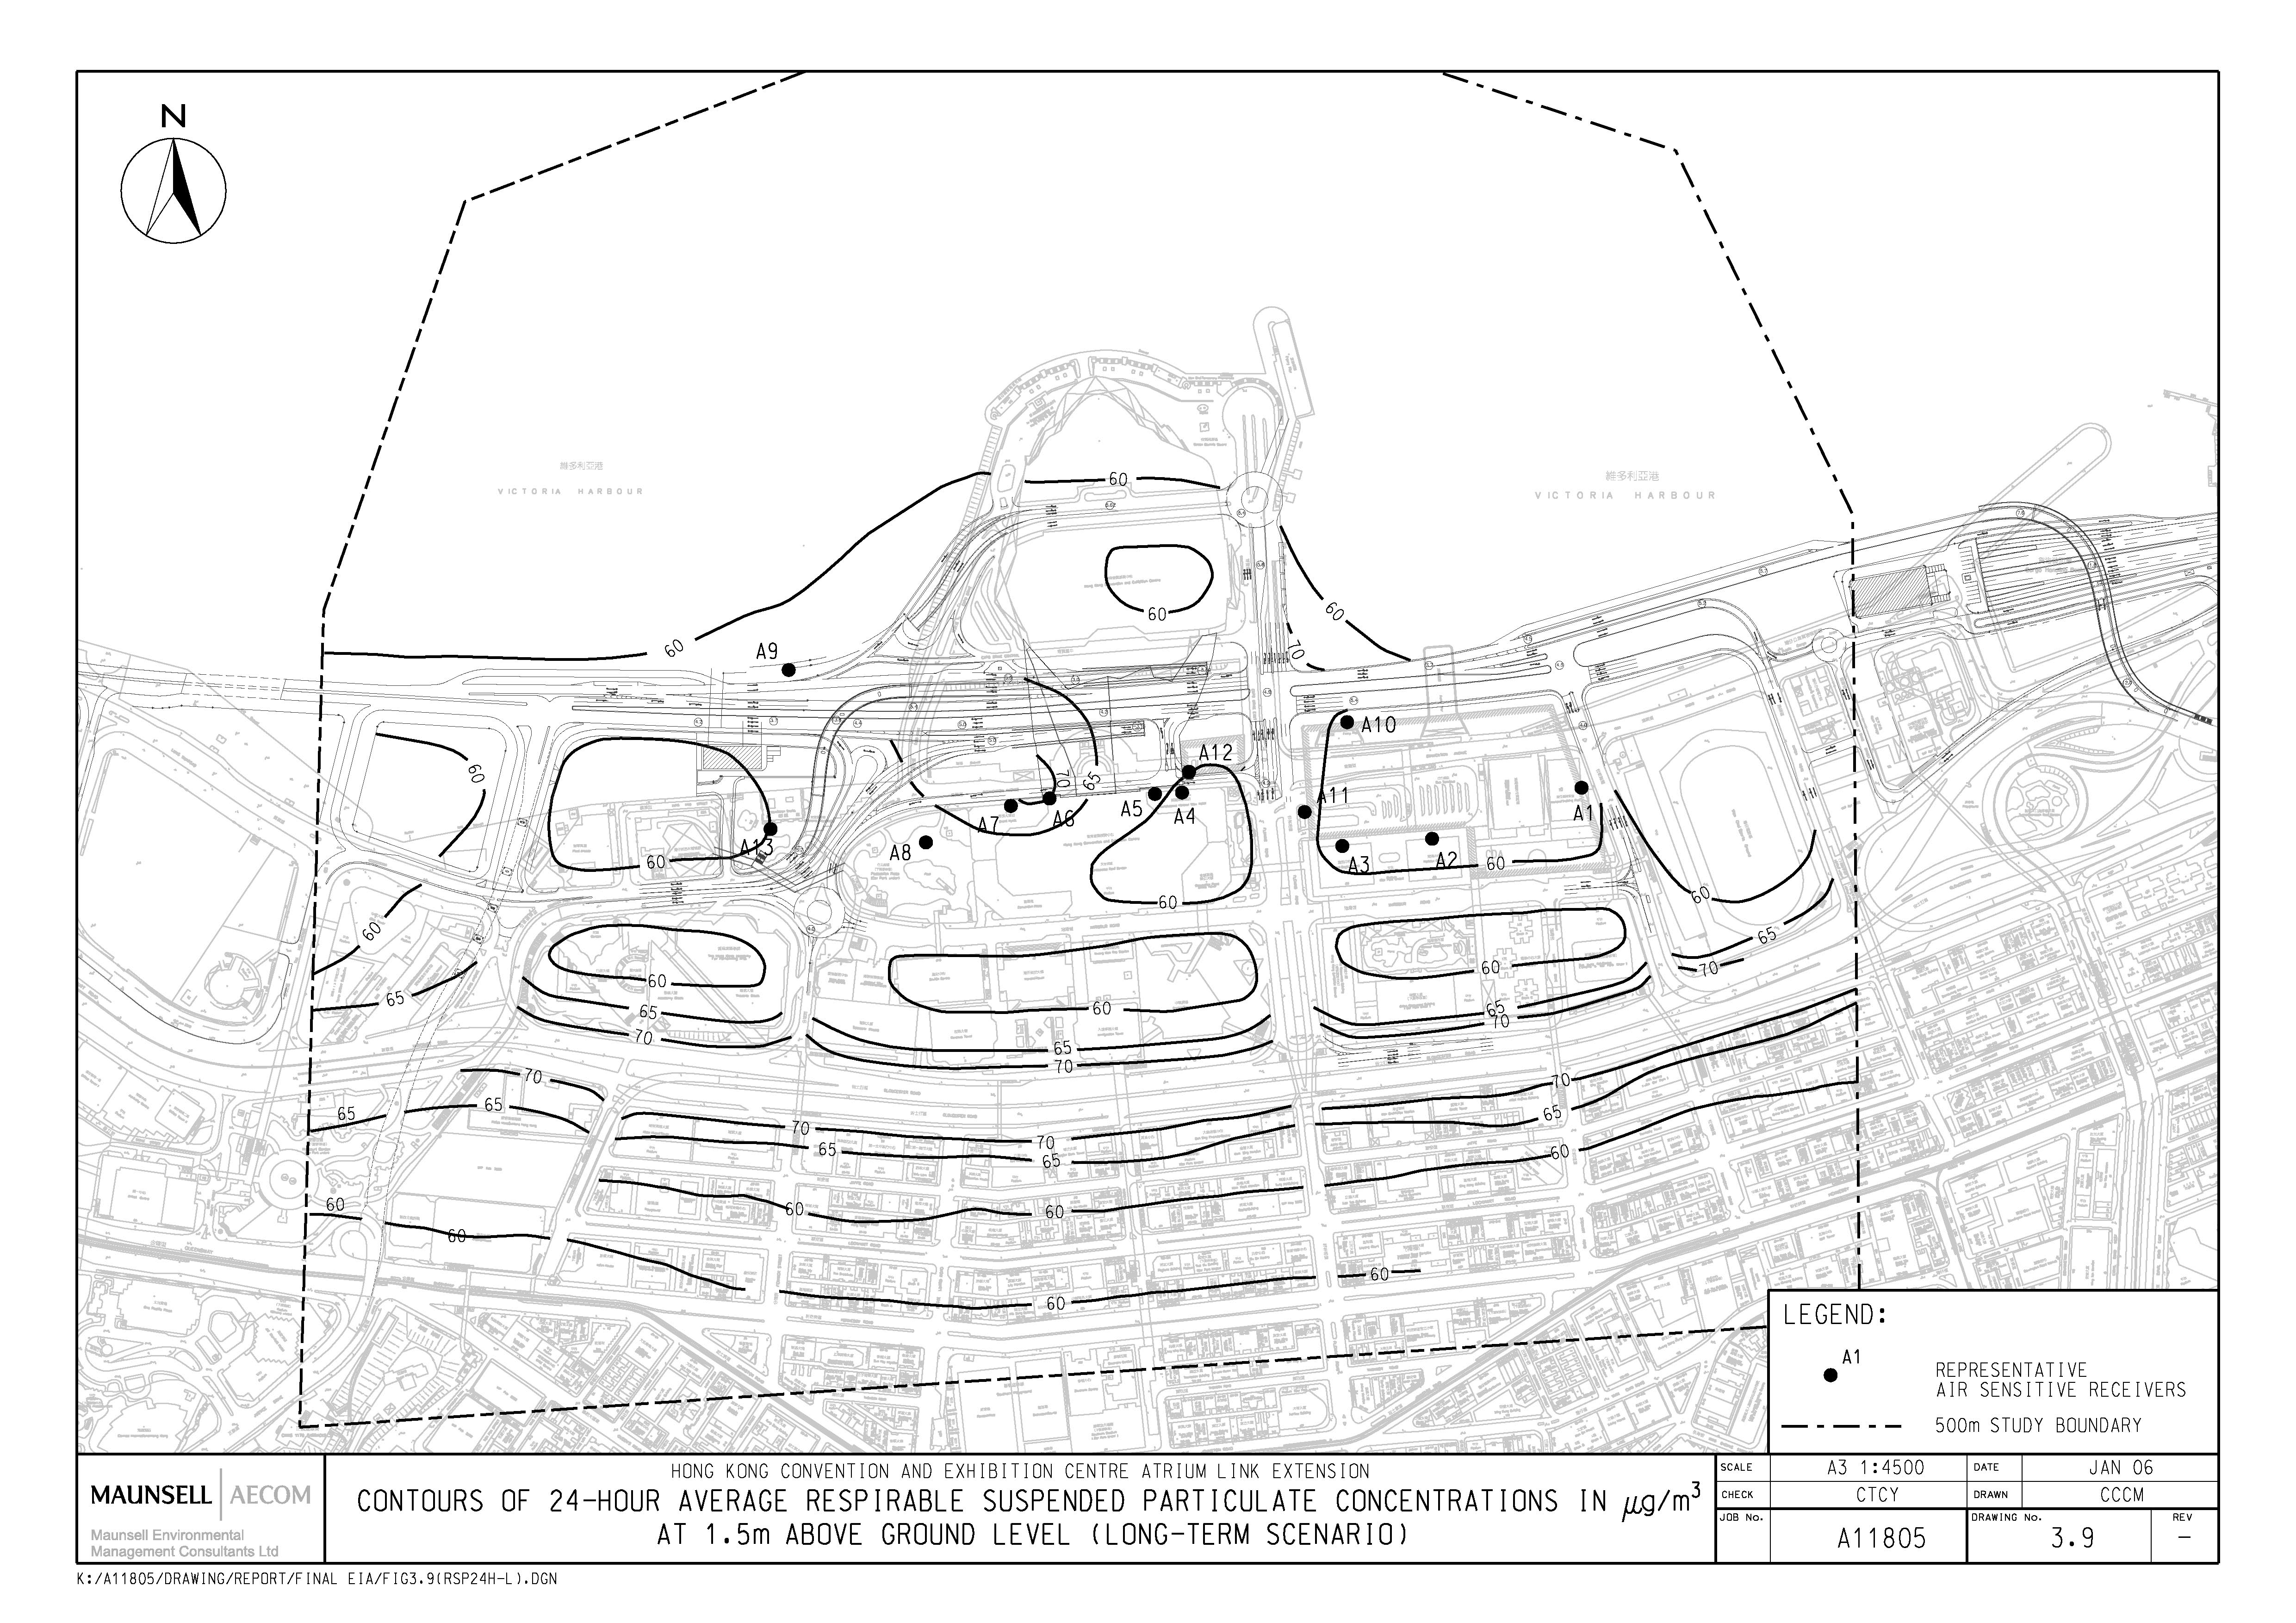
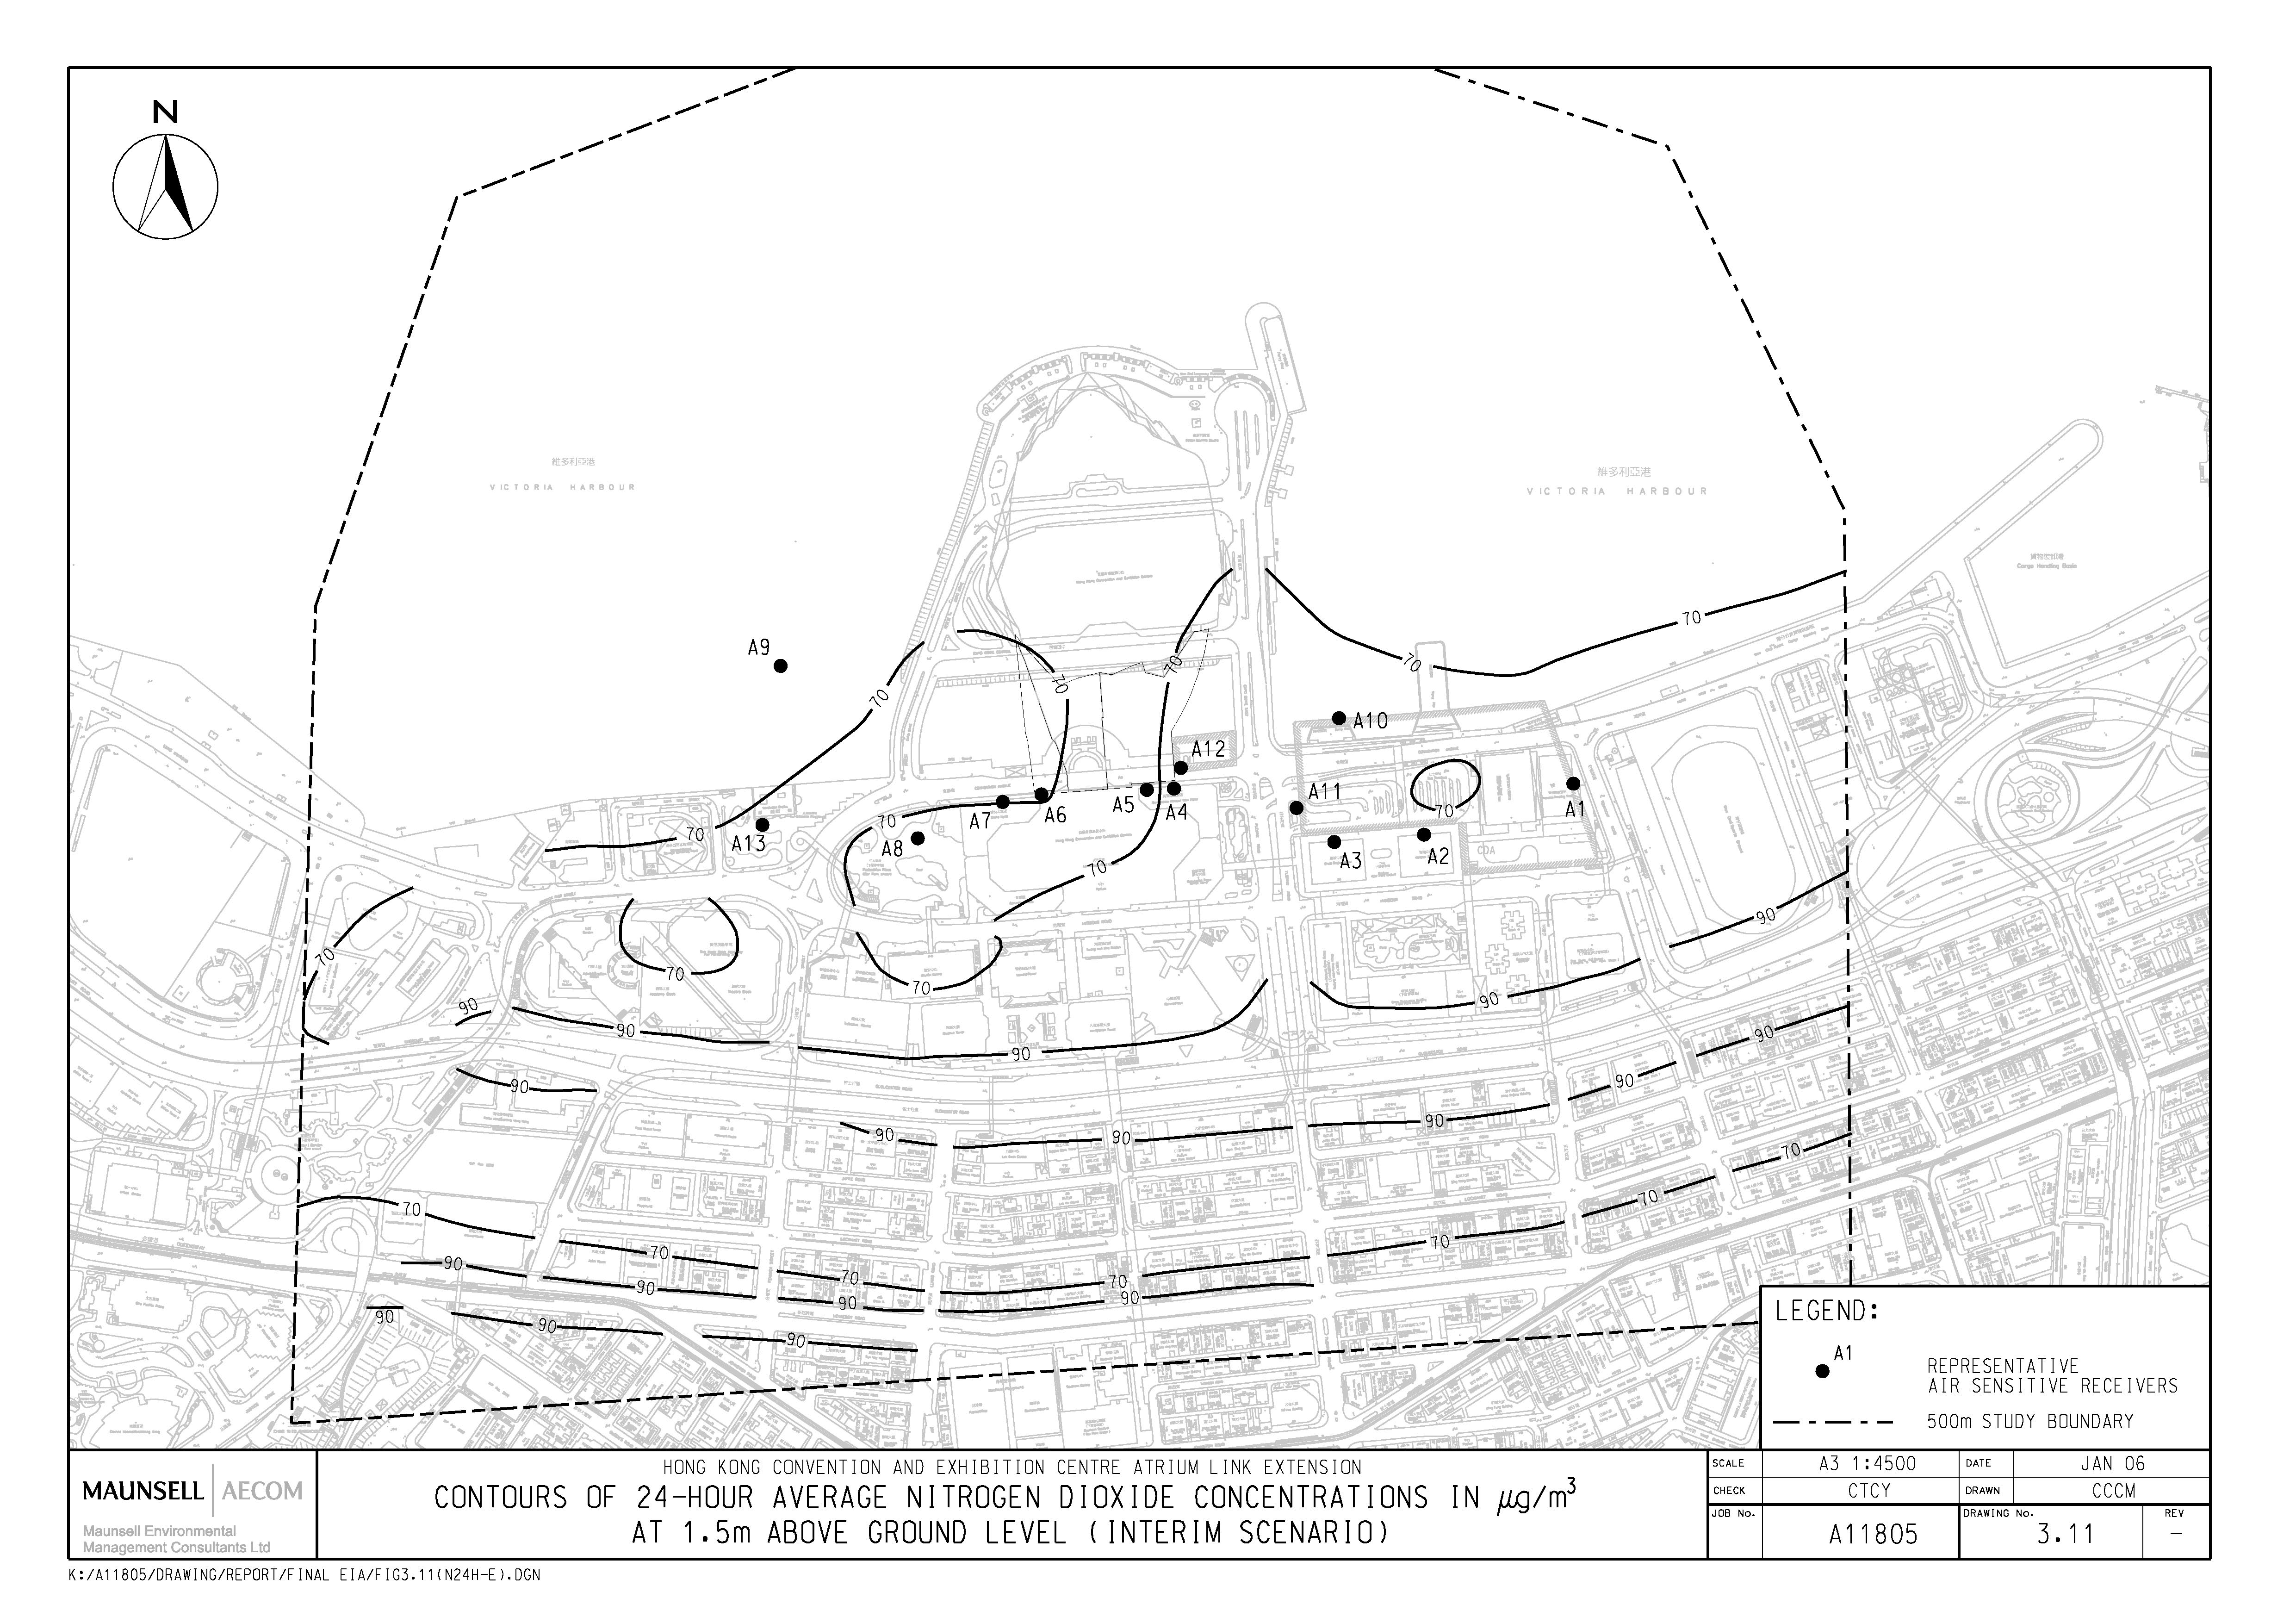
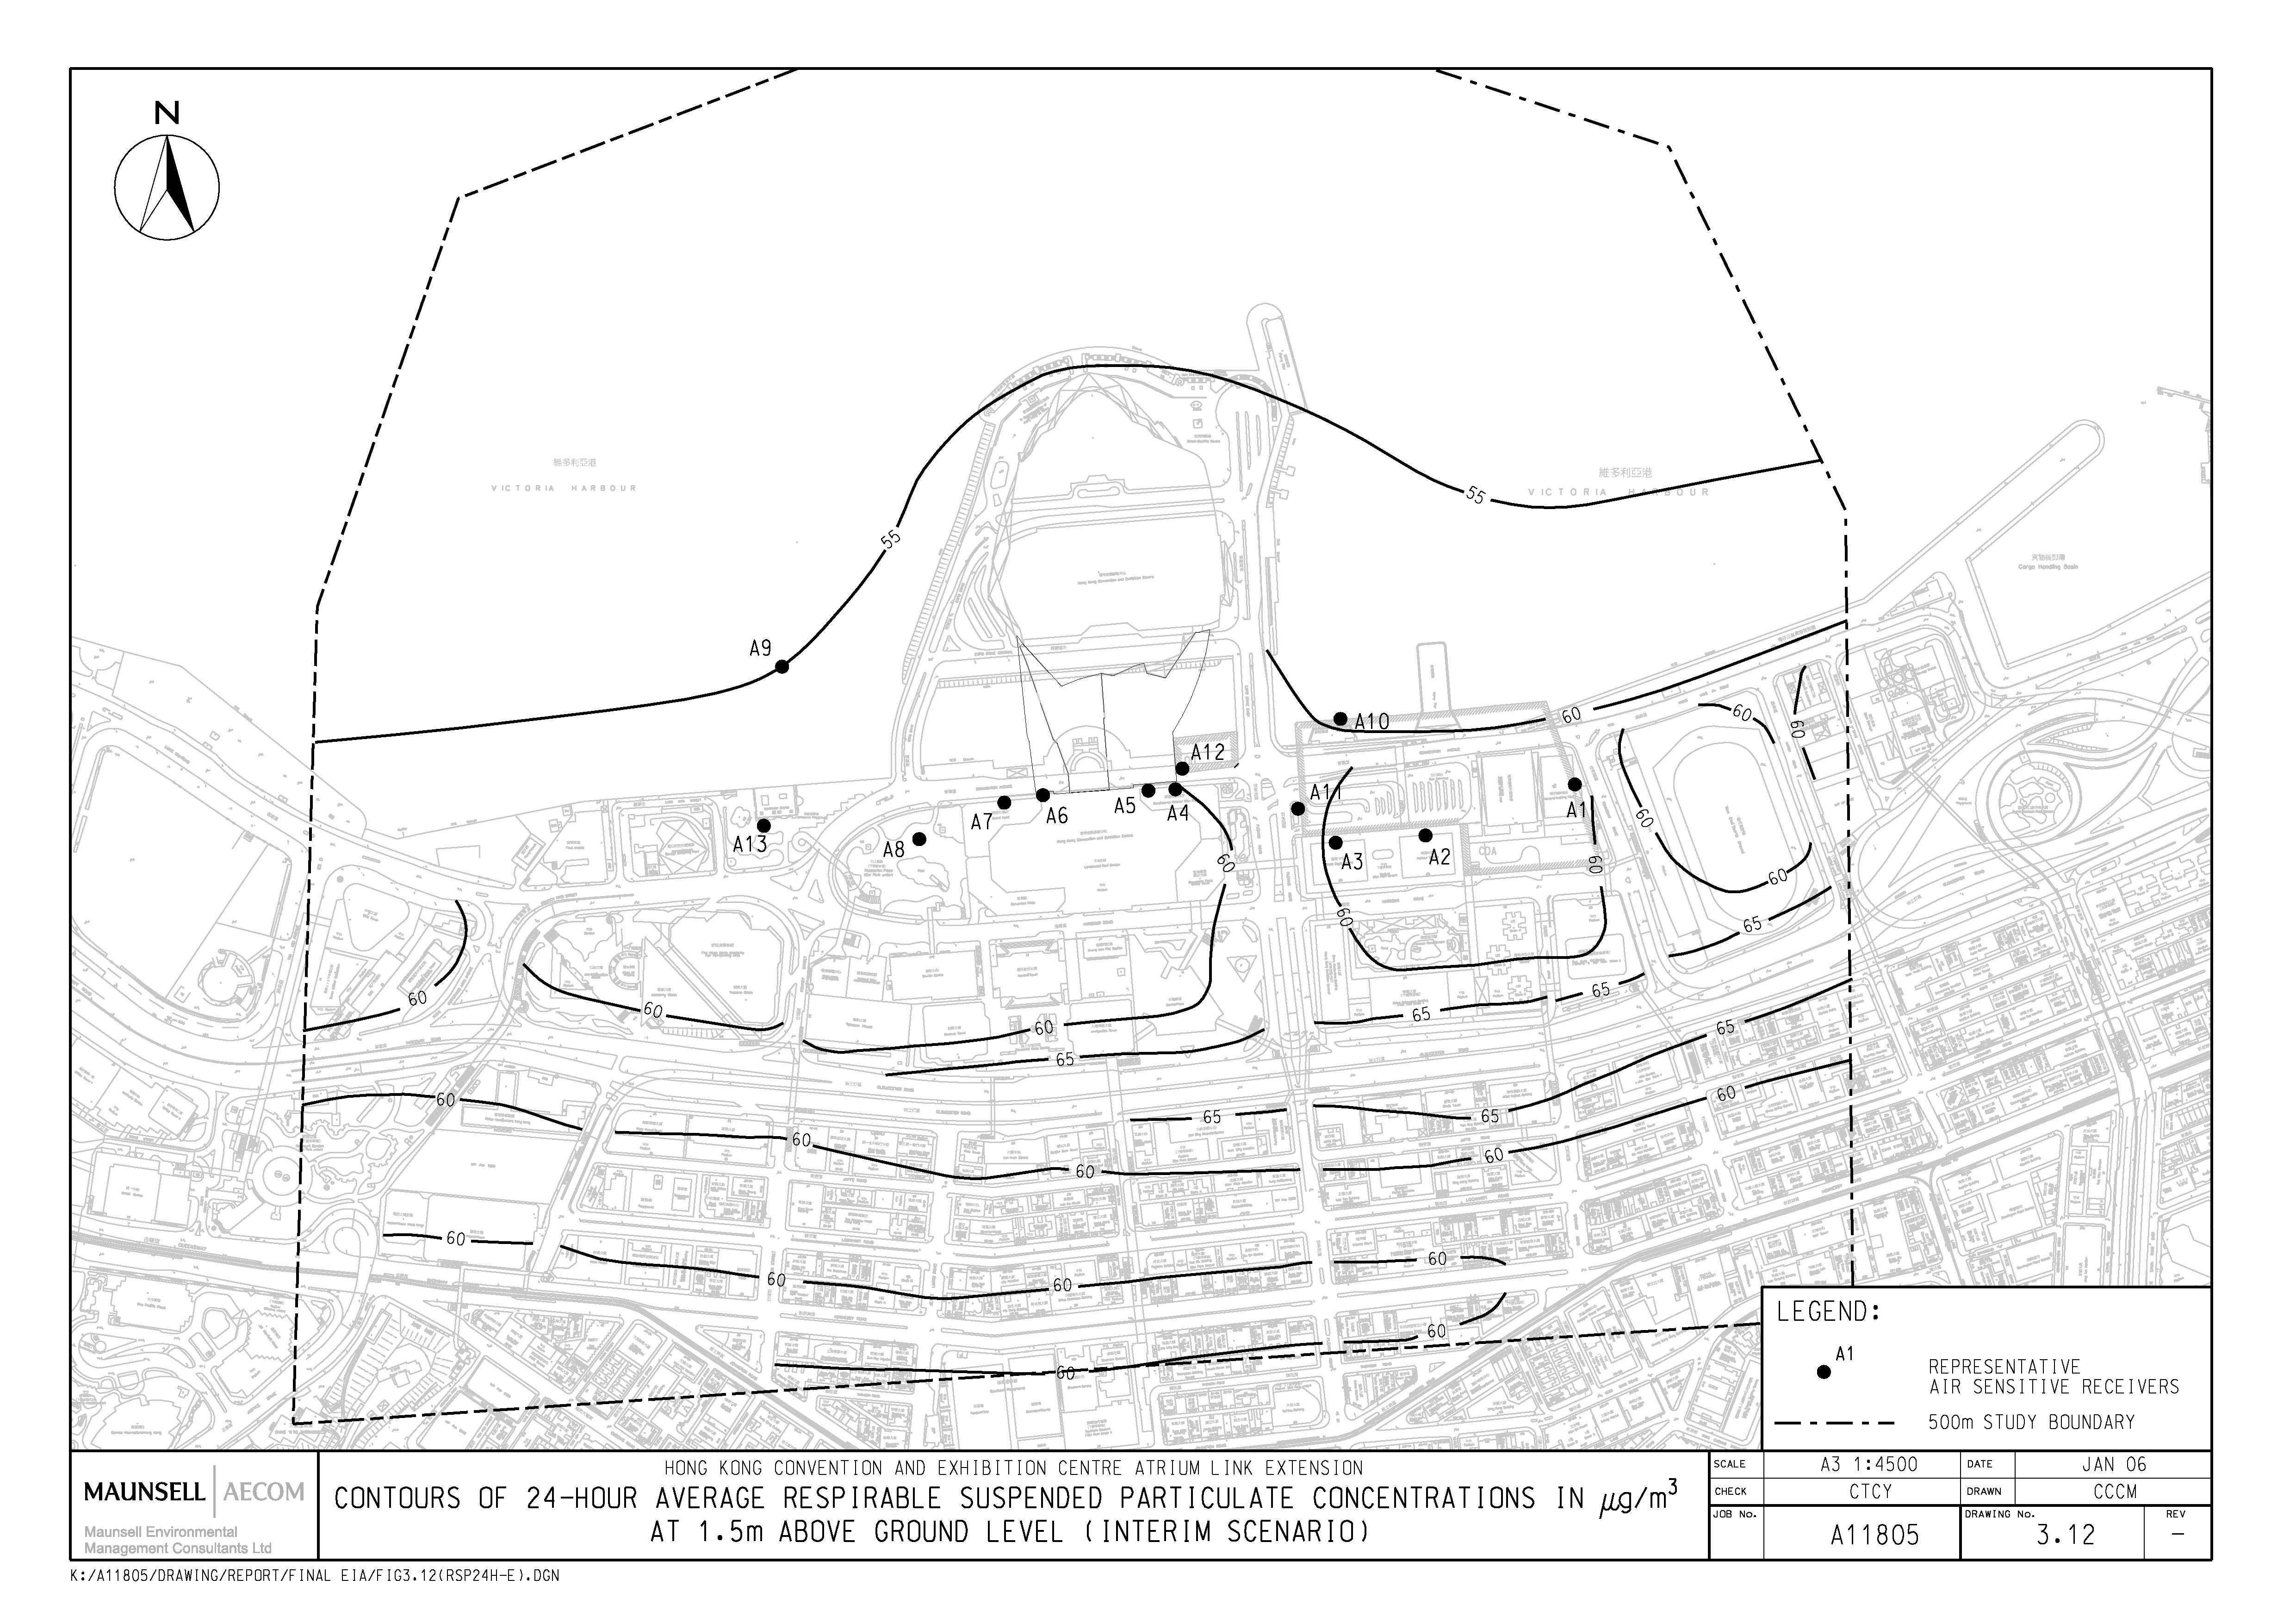
Table 3.11 Predicted Cumulative 1-hour Average
NO2, 24-hour Average NO2 and 24-hour Averaged RSP at the Representative ASRs
(Long-term Scenario)
Table 3.12a In-Tunnel Air Quality Results (Long-term
Scenario) – Nitrogen Dioxide (NO2)
Table 3.12b In-Tunnel Air Quality Results (Long-term
Scenario) – Carbon Monoxide (CO)
Table 3.12c In-Tunnel Air Quality Results (Long-term
Scenario) –
Table 3.13 Predicted Cumulative 1-hour Average
NO2, 24-hour Average NO2 and 24-hour Averaged RSP at the Representative ASRs
(Interim Scenario)
Table 3.14a In-Tunnel Air Quality Results (Interim
Scenario) – Nitrogen Dioxide (NO2)
Table 3.14b In-Tunnel Air Quality Results (Interim
Scenario) – Carbon Monoxide (CO)
Table 3.14c In-Tunnel Air Quality Results (Interim
Scenario) –
Table 4.1 Acceptable Noise Levels (ANLs) (dB(A))
Table 4.2 Representative Noise Sensitive
Receivers
Table 5.1 Summary of Water Quality Objectives
for
Table 5.2 WSD Standards at Sea Water Intakes
Table 5.3 Baseline Water Quality Condition for
Table 5.4 Estimated Pollution Flows and Loads
at Culvert L and Culvert M for 2003
Table 5.5 Estimated Pollution Flows and Loads
at Culvert L and Culvert M for 2011
Table 5.6 Predicted Tracer Contents at the Sea
Channel of HKCEC
Table 5.7 Proposed Development Schedule and
Flow Projection for the Proposed ALE
Table 5.8 Baseline Population and Flow
Projections in Wan Chai West and Wan Chai East Sewerage Catchments in 2011
Table 5.9 Peak flows to Wan Chai
East PTW
Table 5.10 Additional Runoff Estimates
Table 5.11 Summary of the Drainage Impact
Assessment
Table 6.1 Existing Waste Handling and Disposal
Arrangements at the HKCEC
Table 6.2 Analysis of Construction Activities
and Waste Generation
Table 6.3 Summary of Waste Handling Procedures
and Disposal Routes
Table 7.1 Matrix for Impact Significance
Threshold Before Mitigation: Relationship between Sensitivity to Change and
Magnitude of Change
Table 7.2 Significance of Landscape Impacts
Before Mitigation (Without All Adjacent Waterfront Developments)
Table 7.3 Significance of Landscape Impacts
Before Mitigation (Comparison With or Without All Adjacent Waterfront
Developments)
Table 7.4 Significance of Visual Impacts Before
Mitigation (Without All Adjacent Waterfront Developments)
Table 7.5 Significance of Visual Impacts Before
Mitigation (Comparison With or Without All Adjacent Waterfront Developments)
Table 7.6 Visual Impact for Lower Levels of
Renaissance Hotel View Hotel in VSR1A during Operation
Table 7.7 Recommended Landscape and Visual
Mitigation Measures
Table 7.8 Landscape Impacts After Mitigation
Table 7.9 Visual Impacts After Mitigation
Table 9.1 Summary of Key Environmental Outcomes
/ Benefits
Table 10.1 Implementation Schedule for Air
Quality Control
Table 10.2 Implementation Schedule for Noise
Control
Table 10.3 Implementation Schedule for Water
Quality Control
Table 10.4 Implementation Schedule for Waste
Management
Table 10.5 Implementation Schedule for Landscape
& Visual Impact
List of Figures
Figure 1.1 Location of Proposed Atrium Link
Extension
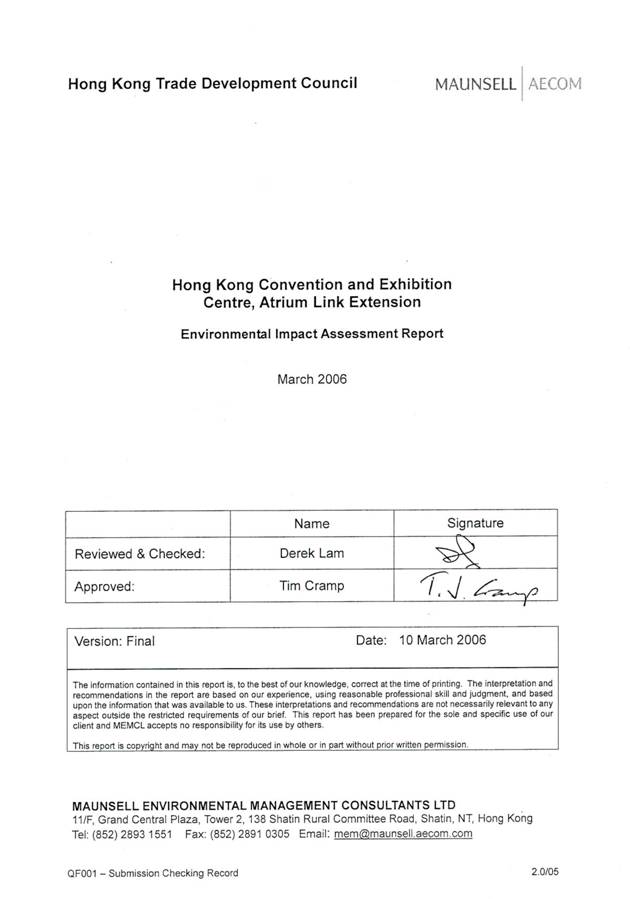
Figure 2.1 Longitudinal Section of Proposed
Atrium Link Extension
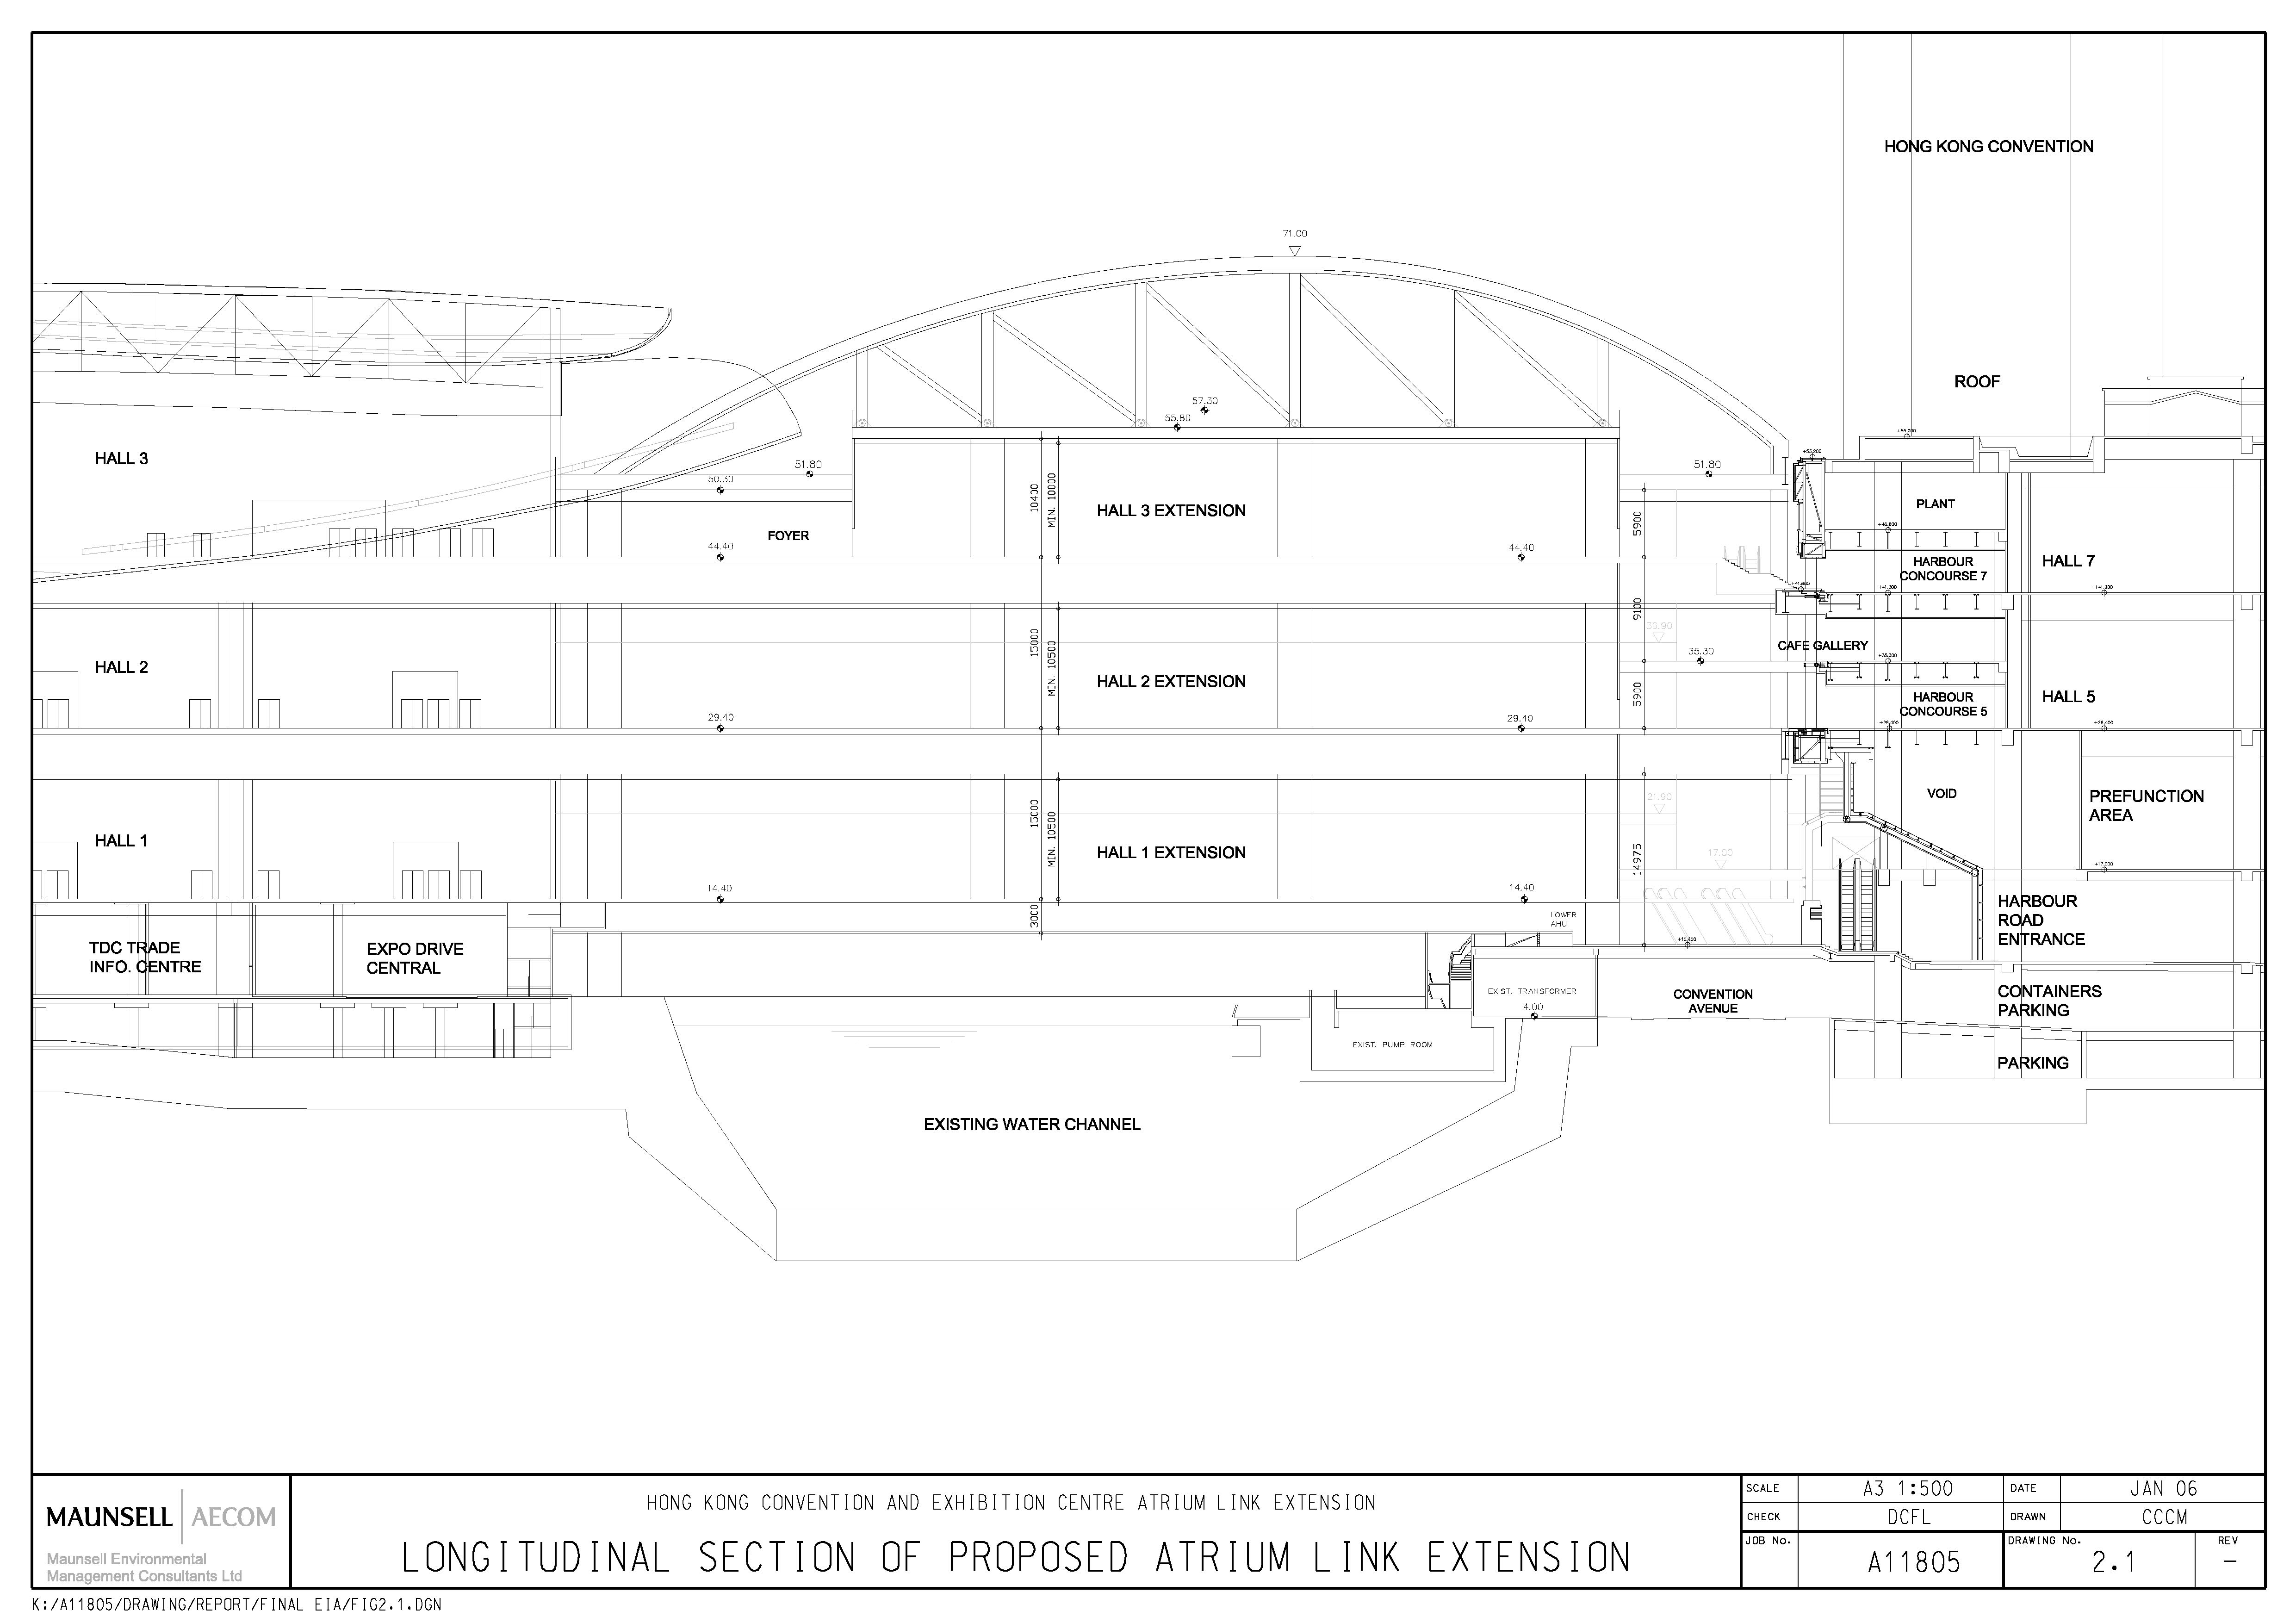
Figure 2.2 Alternative Project Design (Schemes
1 & 2 – With Larger Footprint)
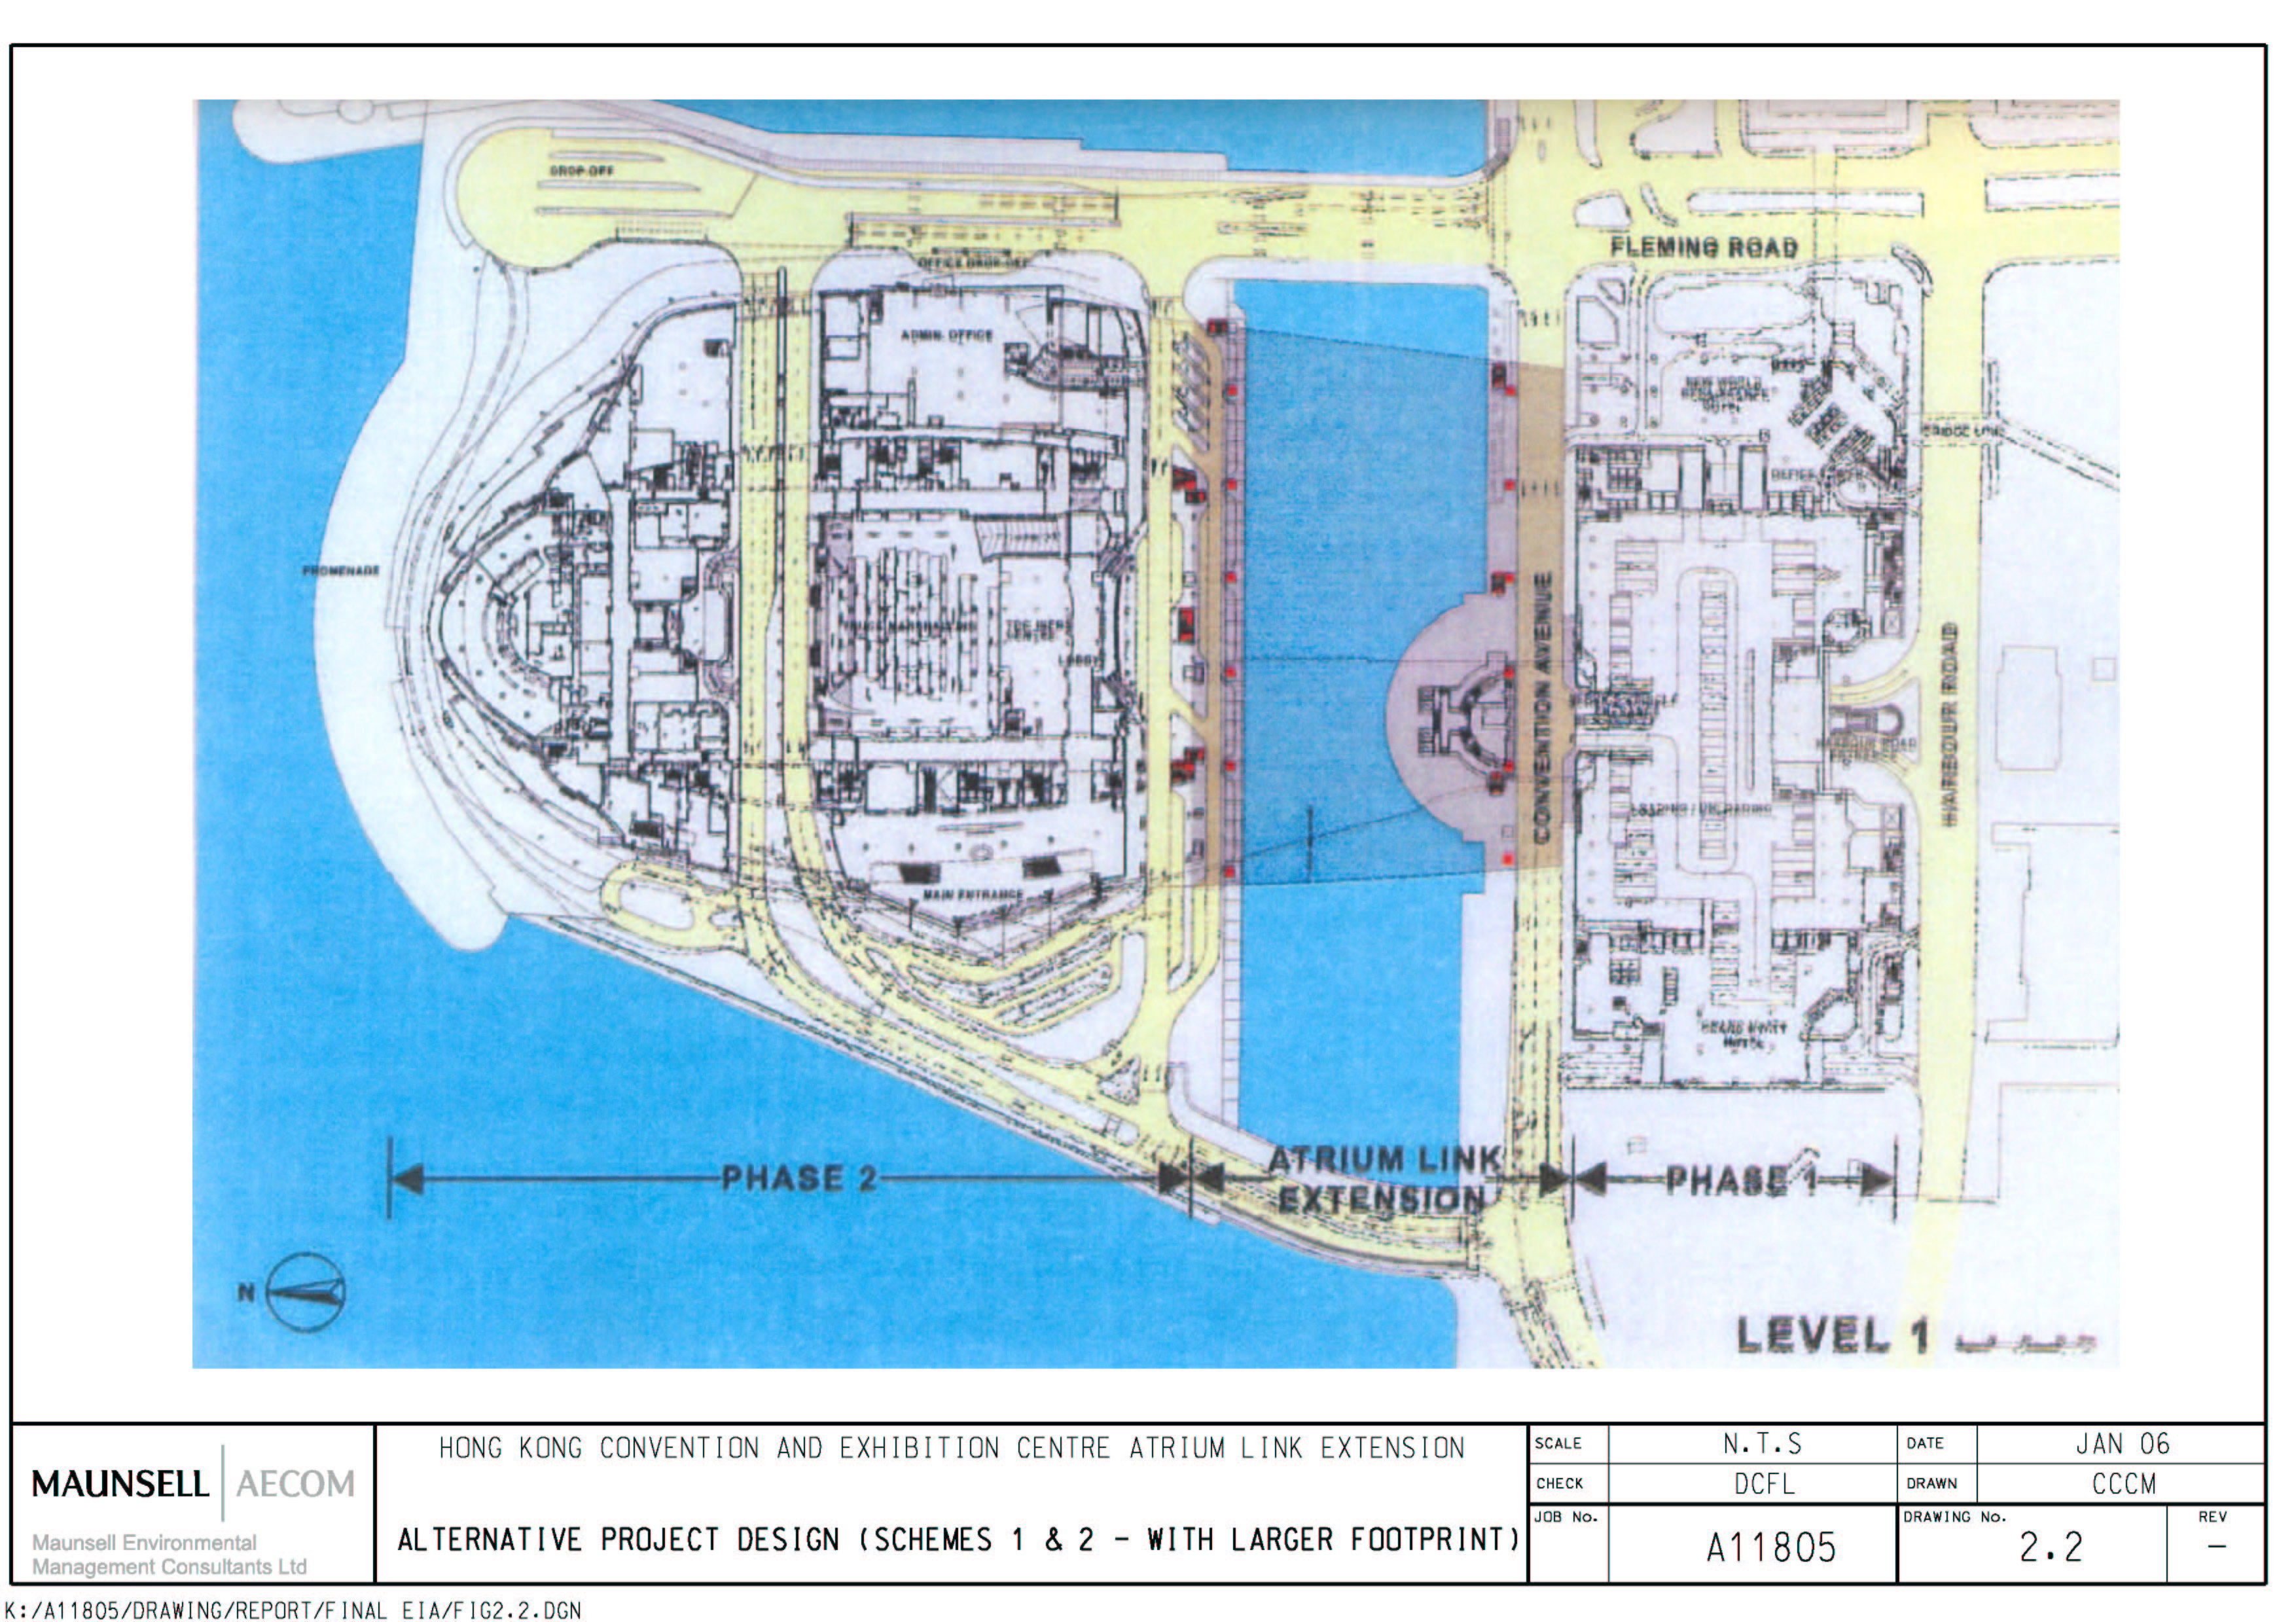
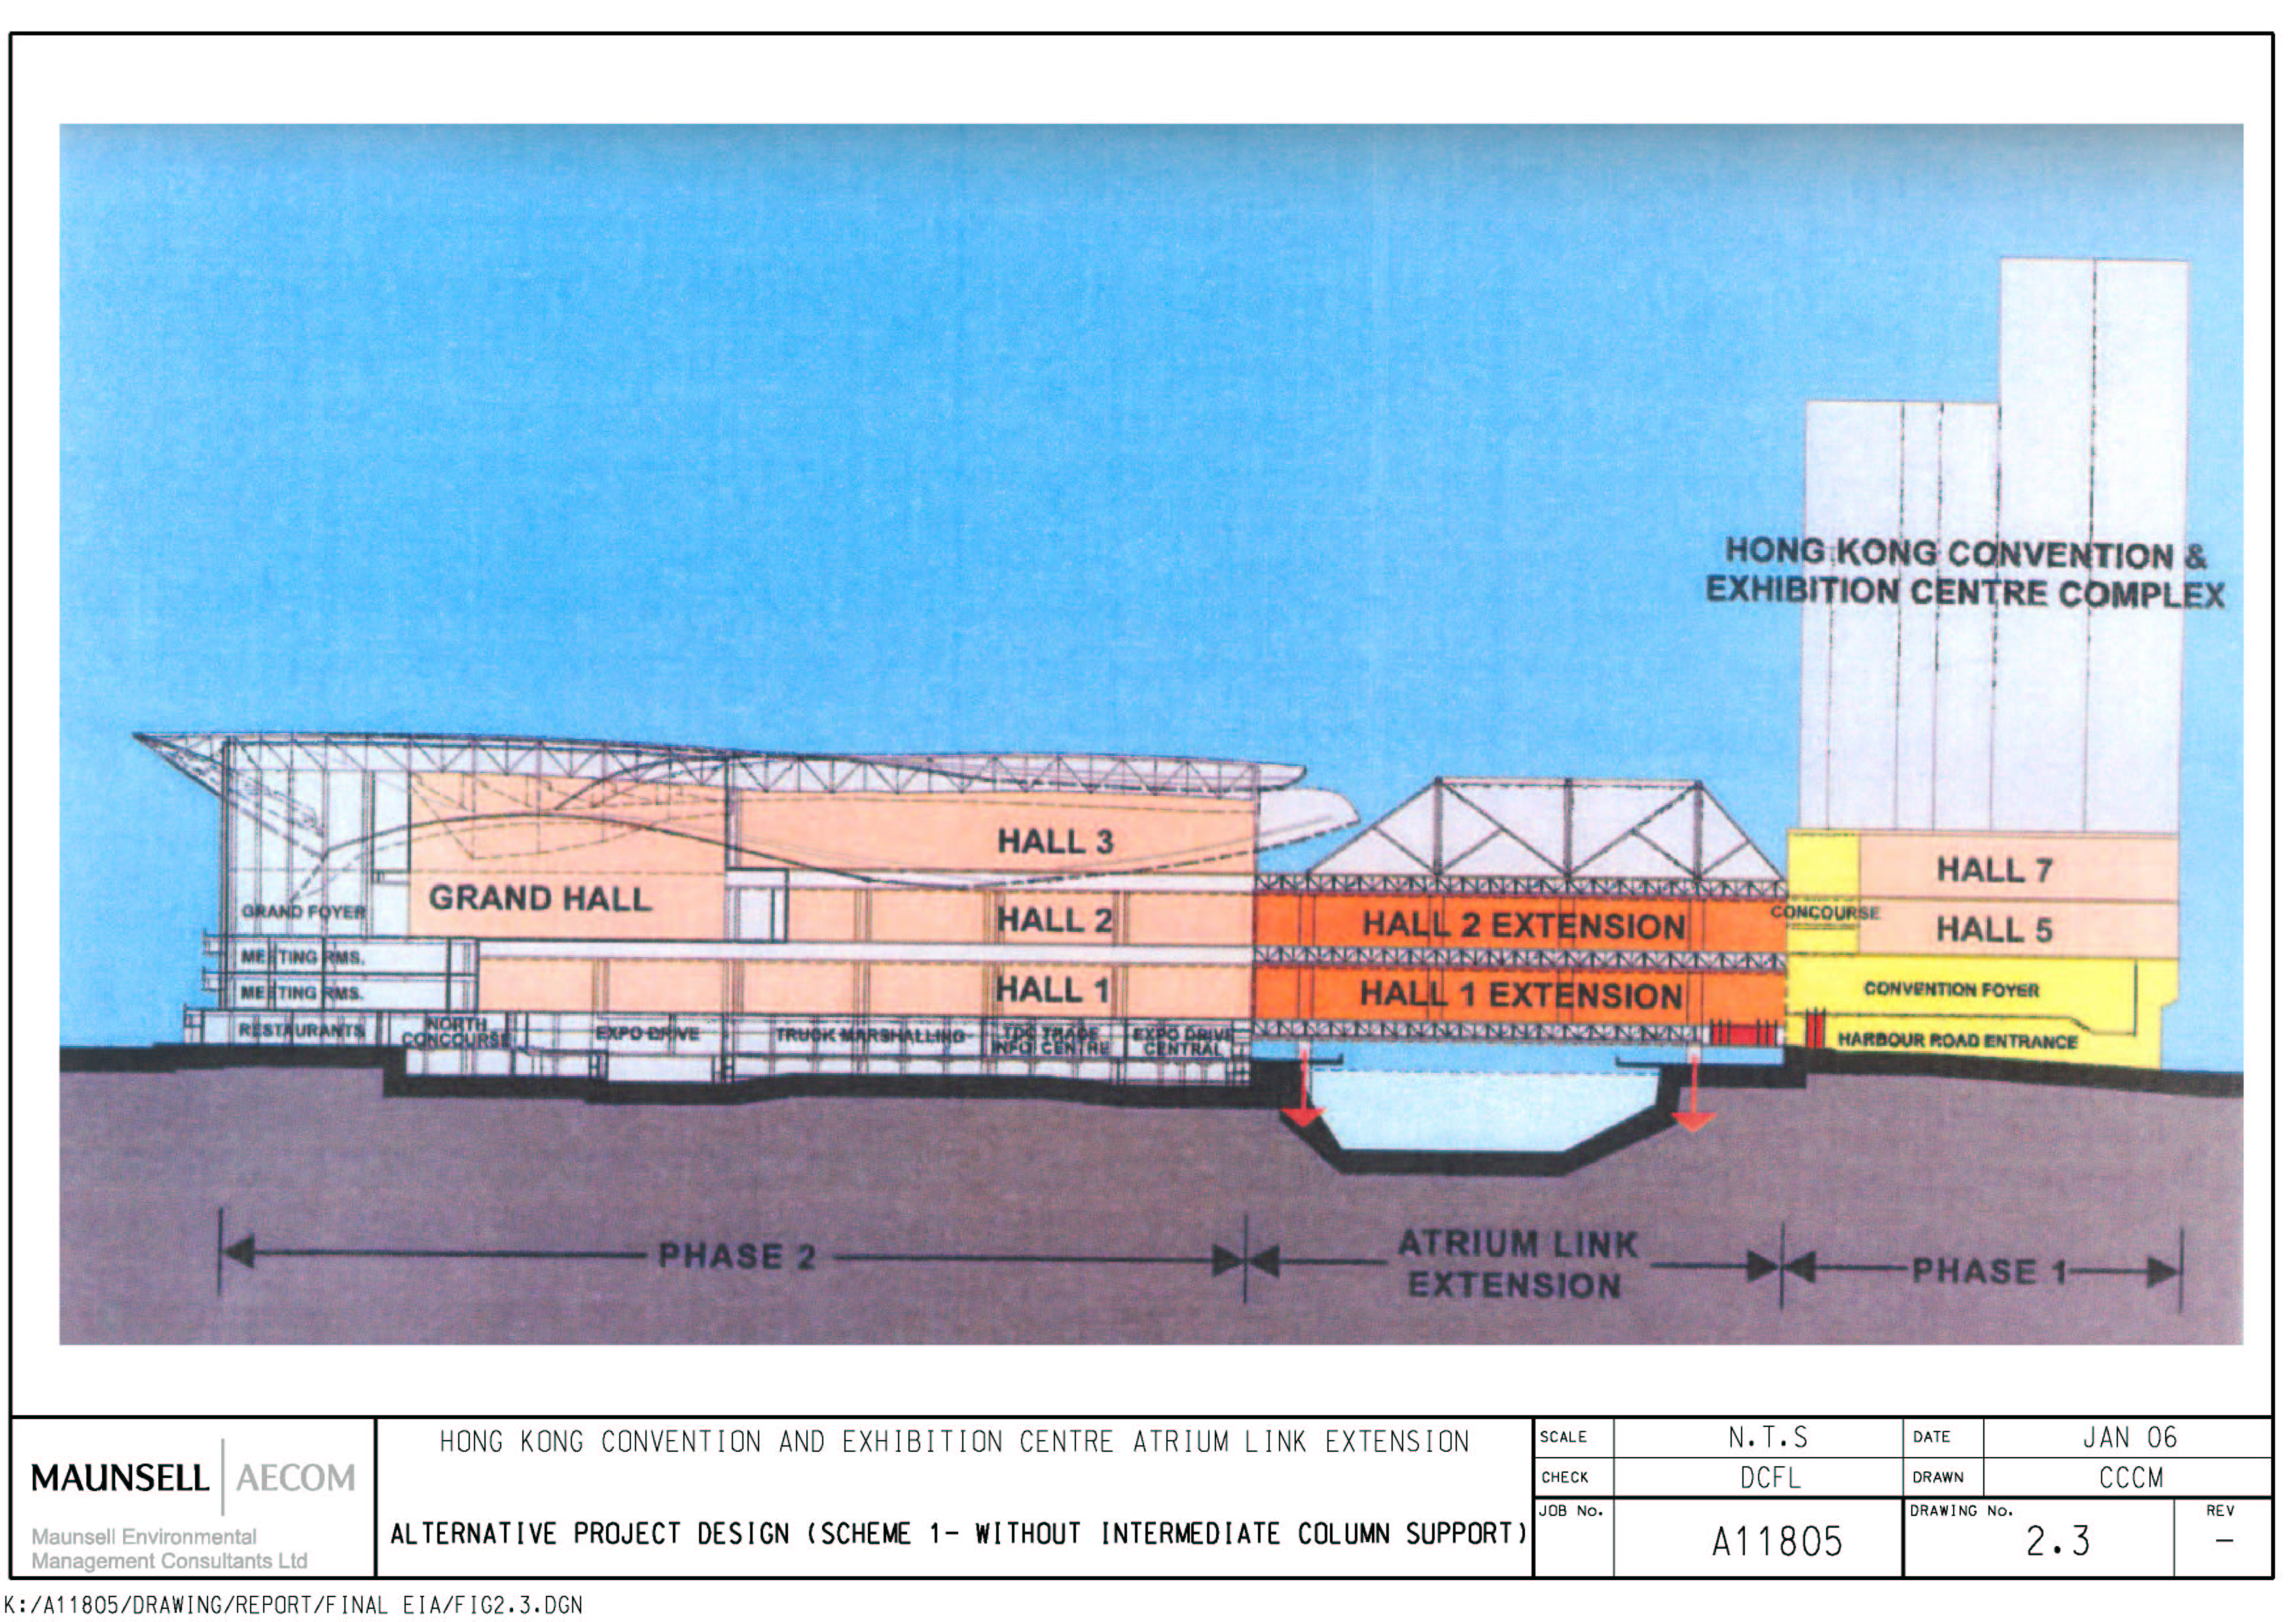
Figure 2.3 Alternative Project Design (Scheme
1 – Without Intermediate Column Support)
Figure 2.4 Alternative Project Design (Scheme
2 – With Intermediate Column Support)
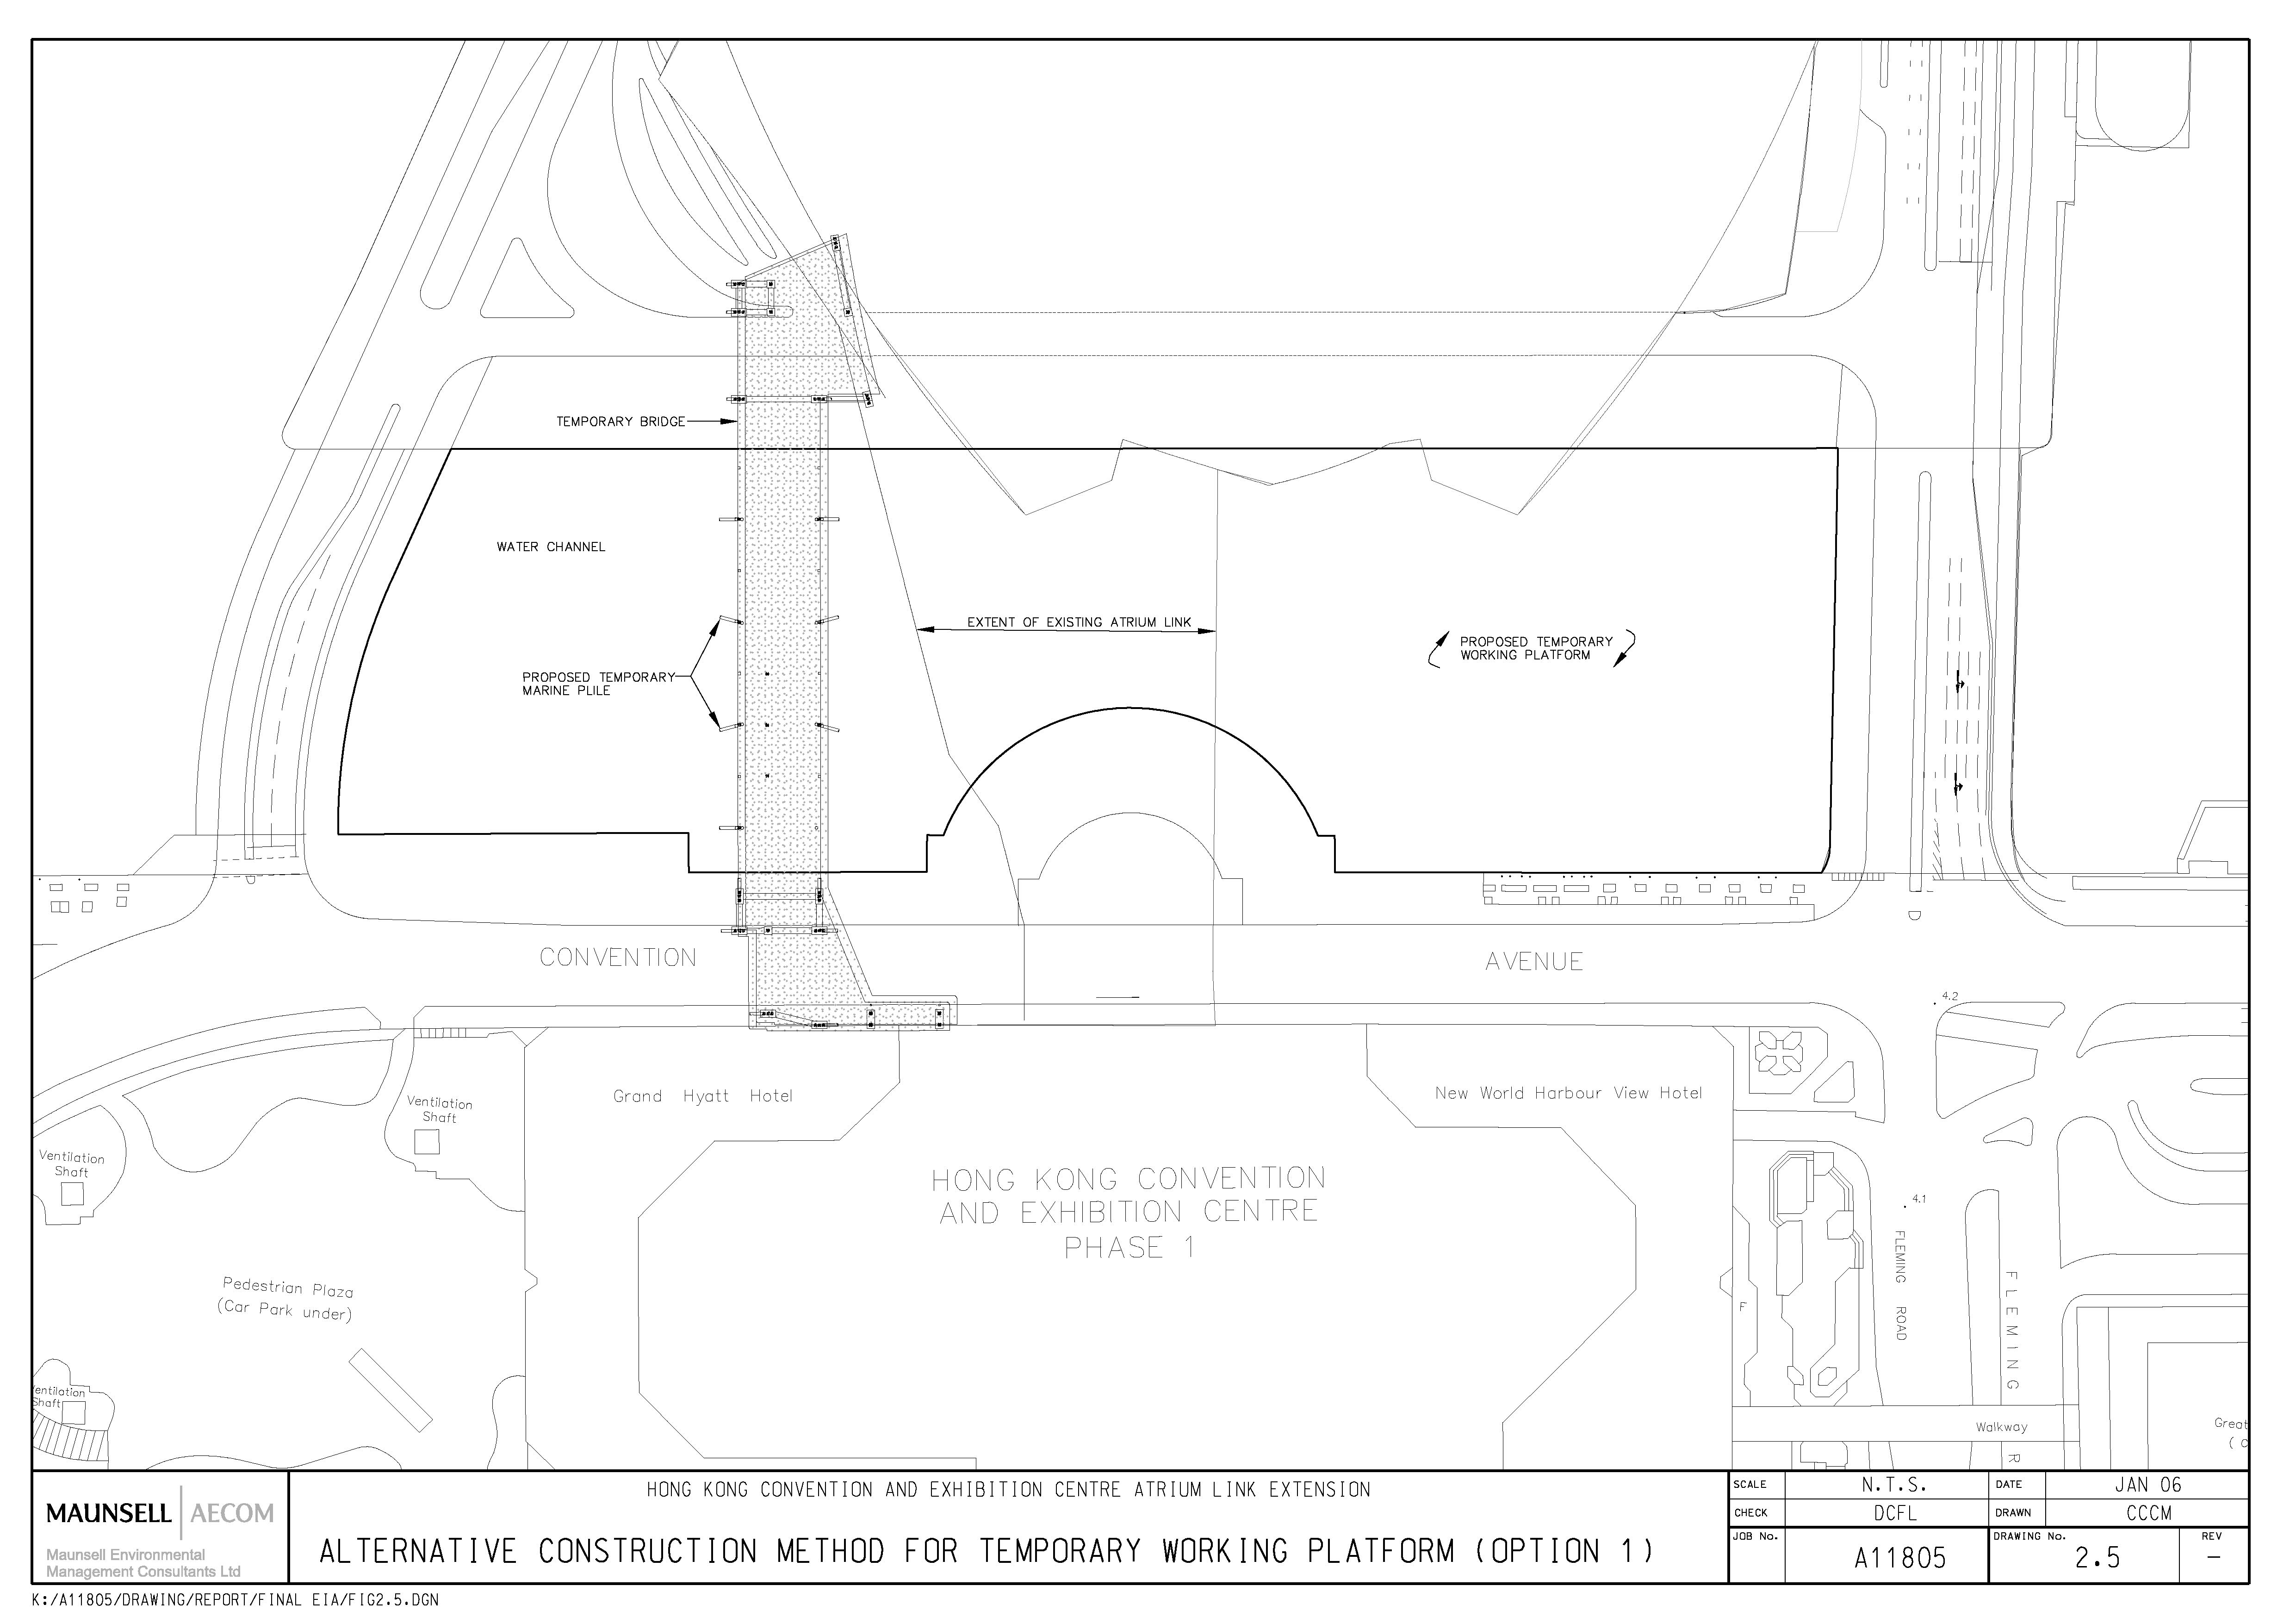
Figure 2.5 Alternative Construction Method for
Temporary Working Platform (Option 1)
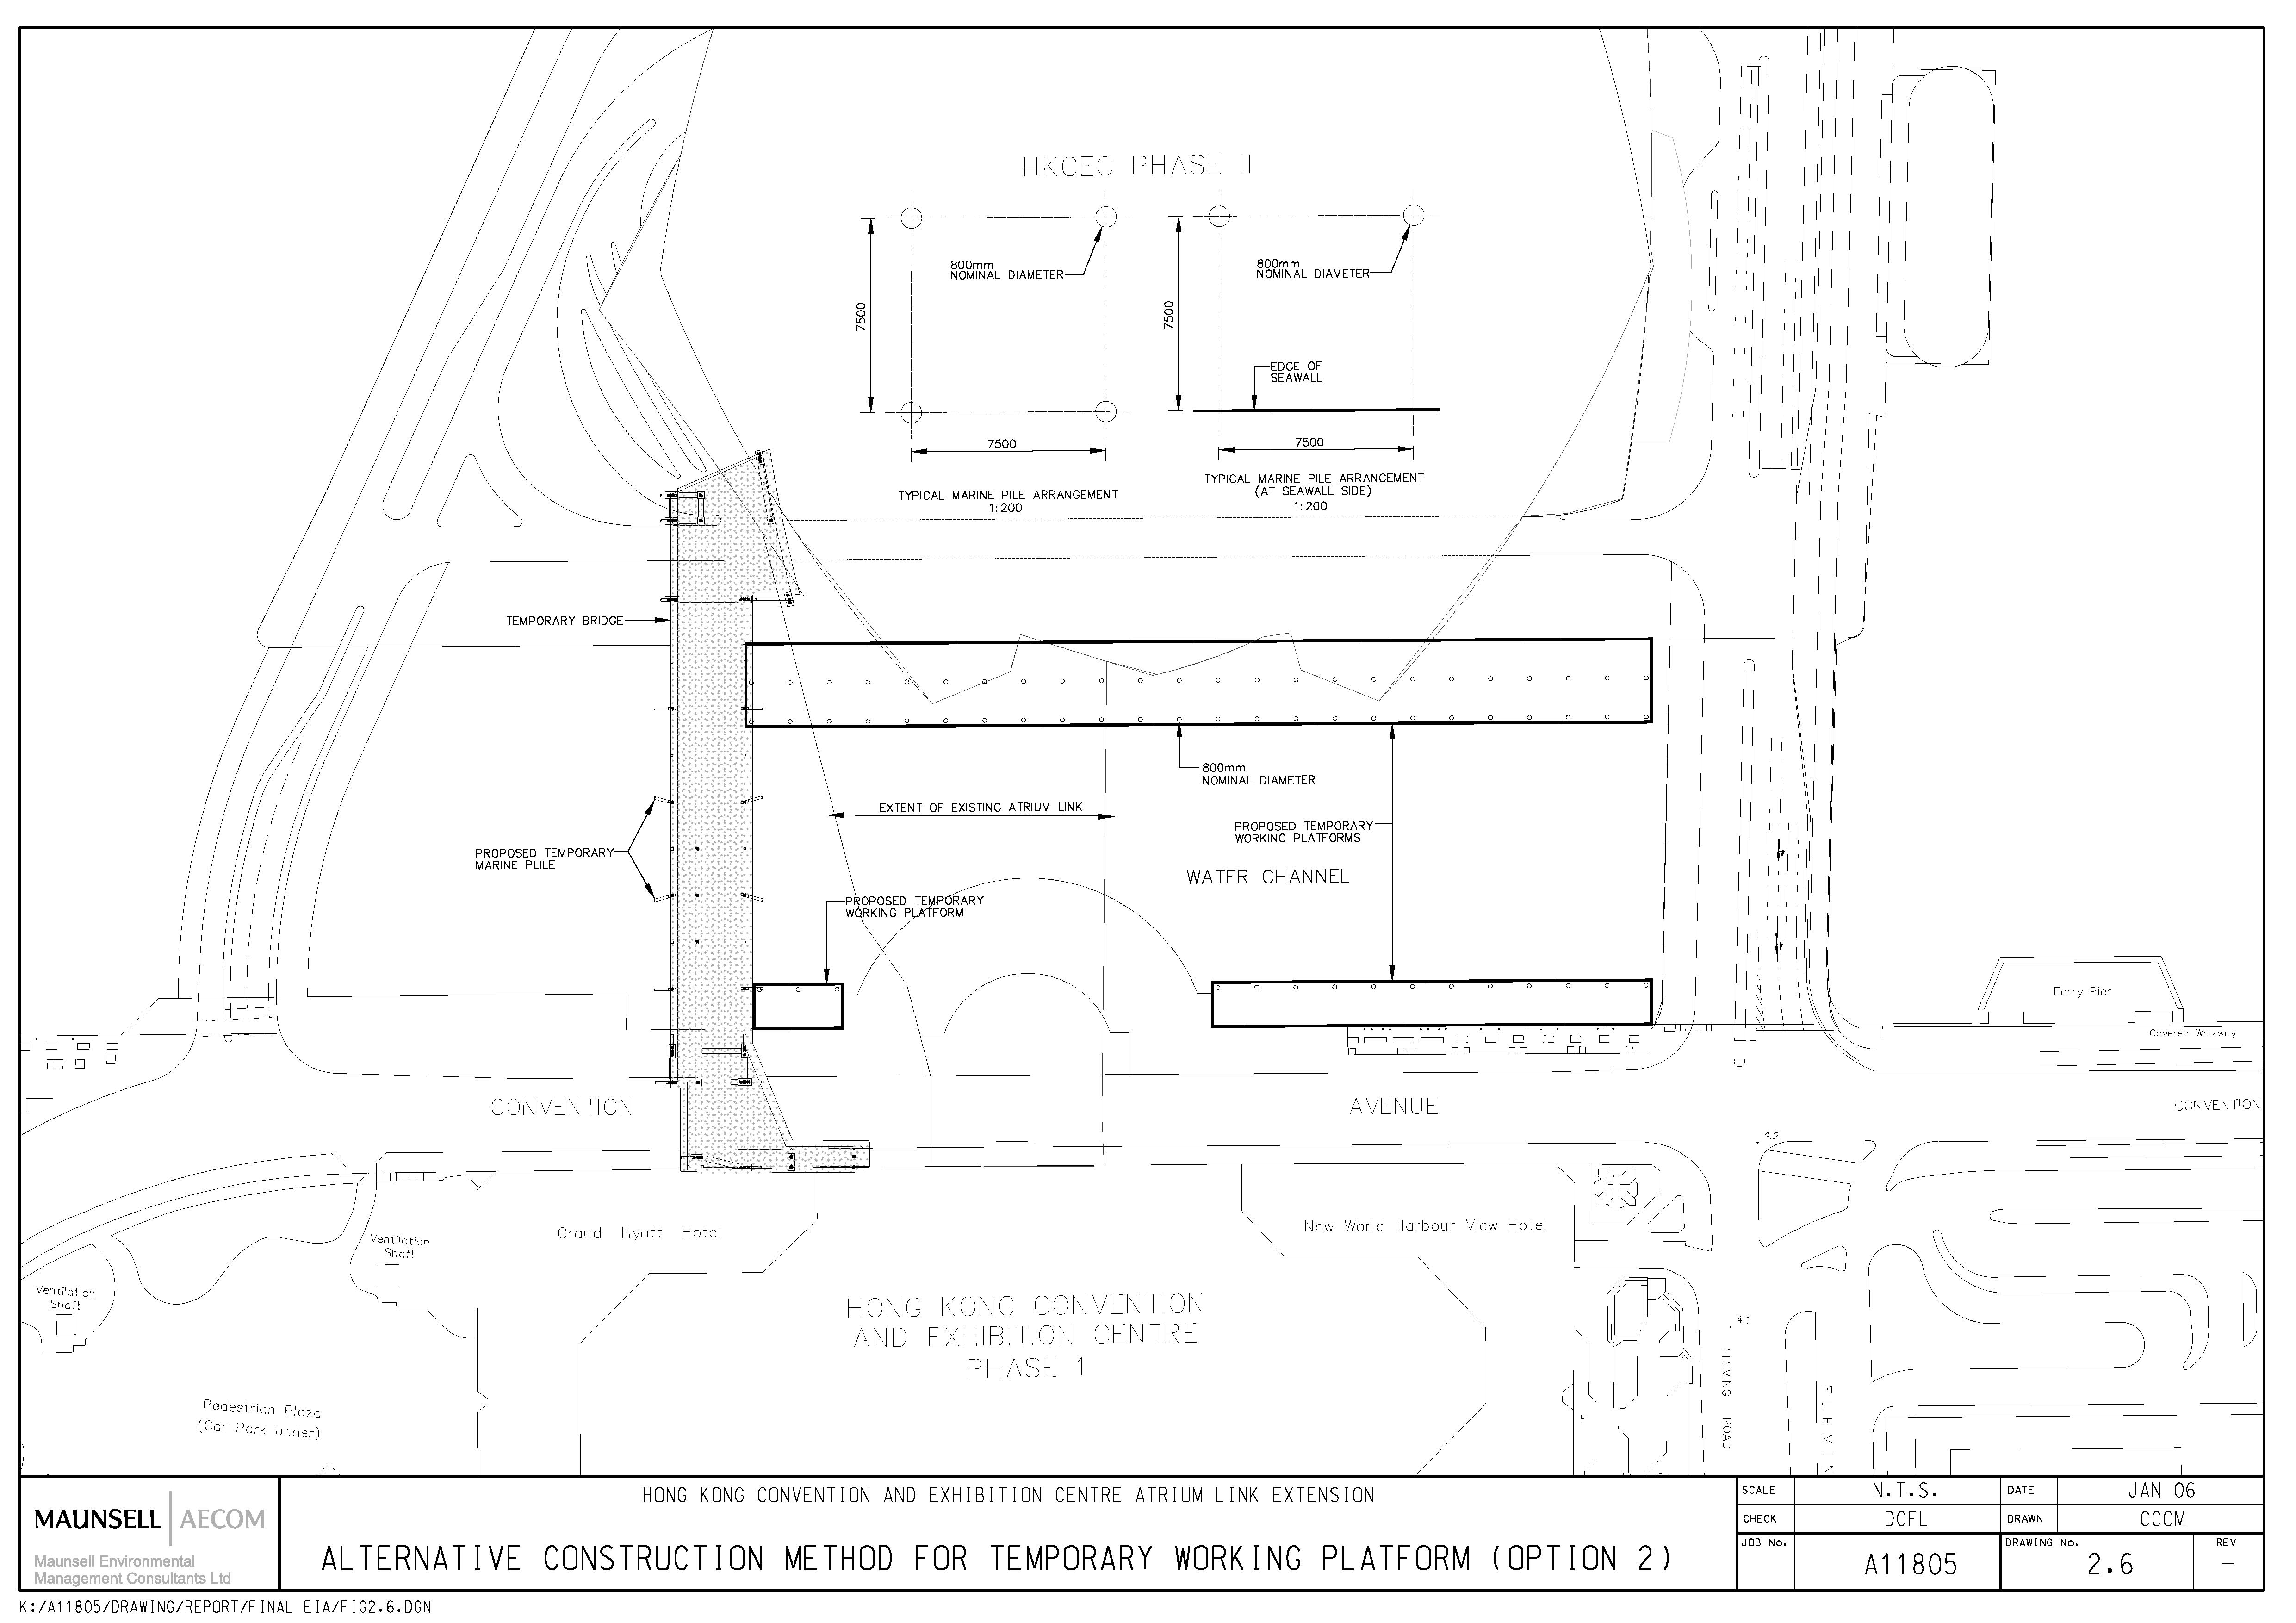
Figure 2.6 Alternative Construction Method for
Temporary Working Platform (Option 2)
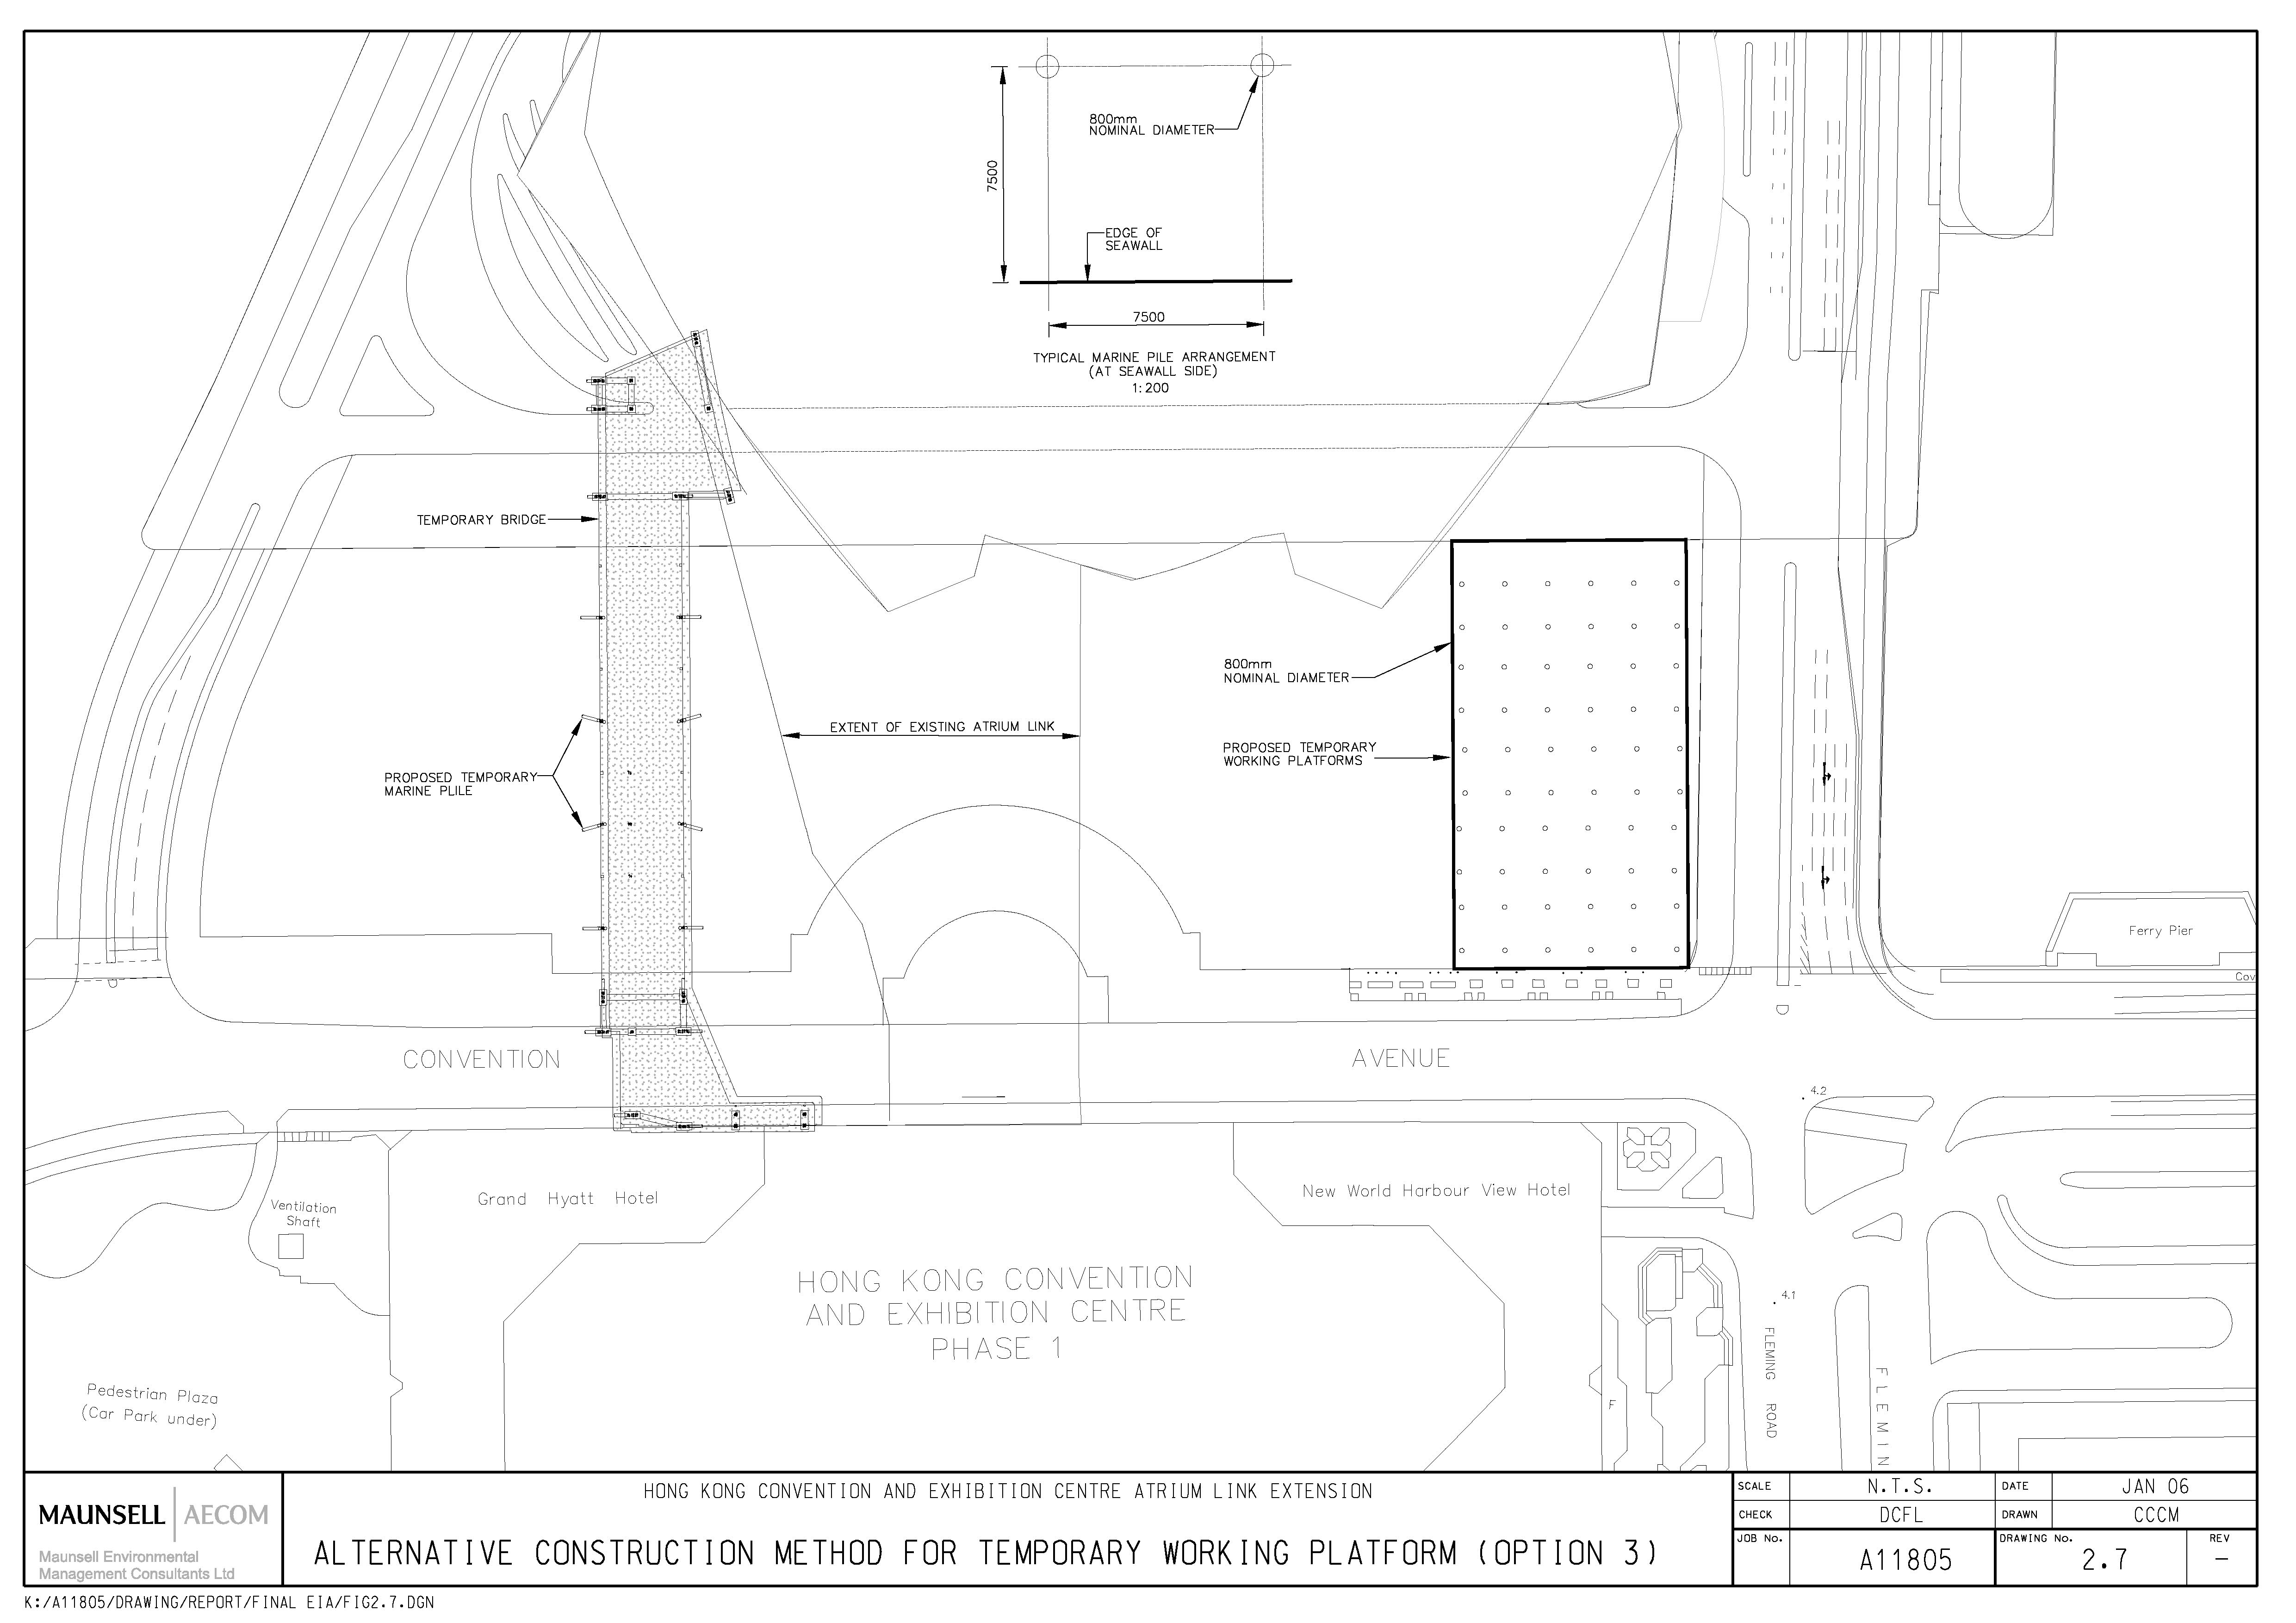
Figure 2.7 Alternative Construction Method for
Temporary Working Platform (Option 3)
Figure 3.1a Locations of Representative Air
Sensitive Receivers (Long-term Scenario)
Figure 3.1b Locations of Representative Air
Sensitive Receivers (Interim Scenario)
Figure 3.2 Locations of Portals and
Ventilation Buildings Emissions (Long-term Scenario)
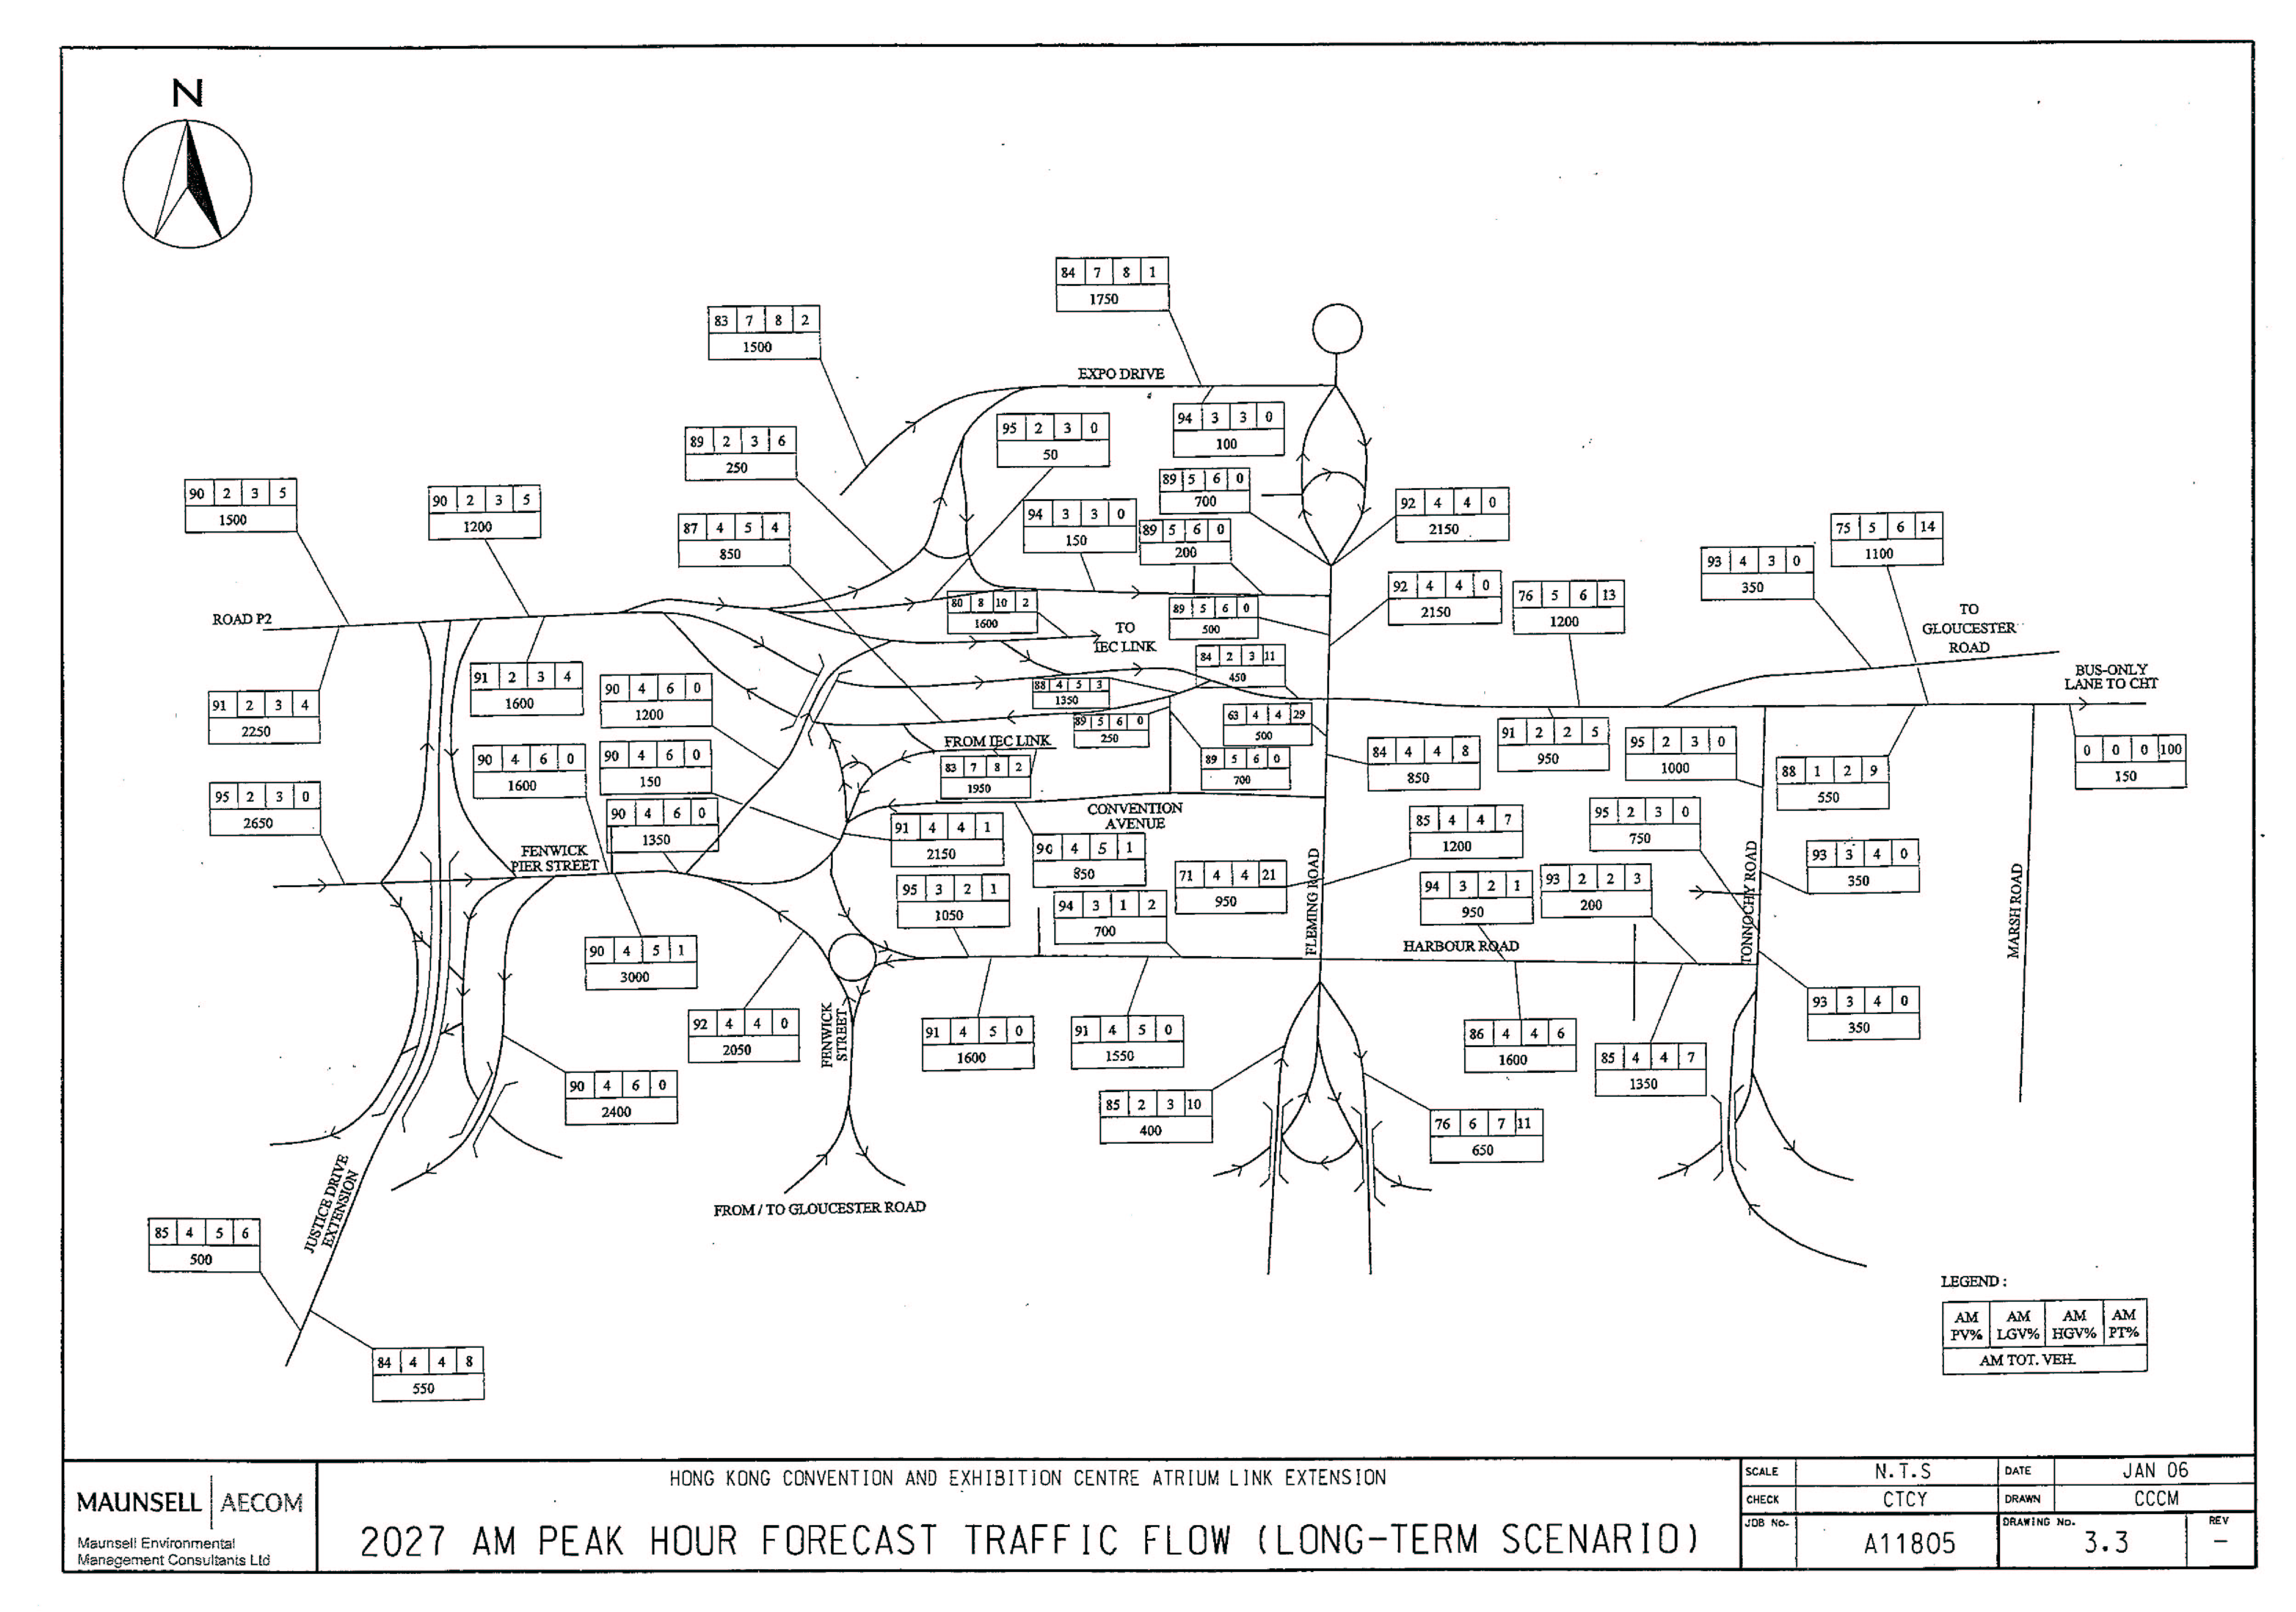
Figure 3.3 2027 AM Peak Hour Forecast Traffic
Flow (Long-term Scenario)
Figure 3.4 Locations of Portals and
Ventilation Buildings Emissions (Interim Scenario)
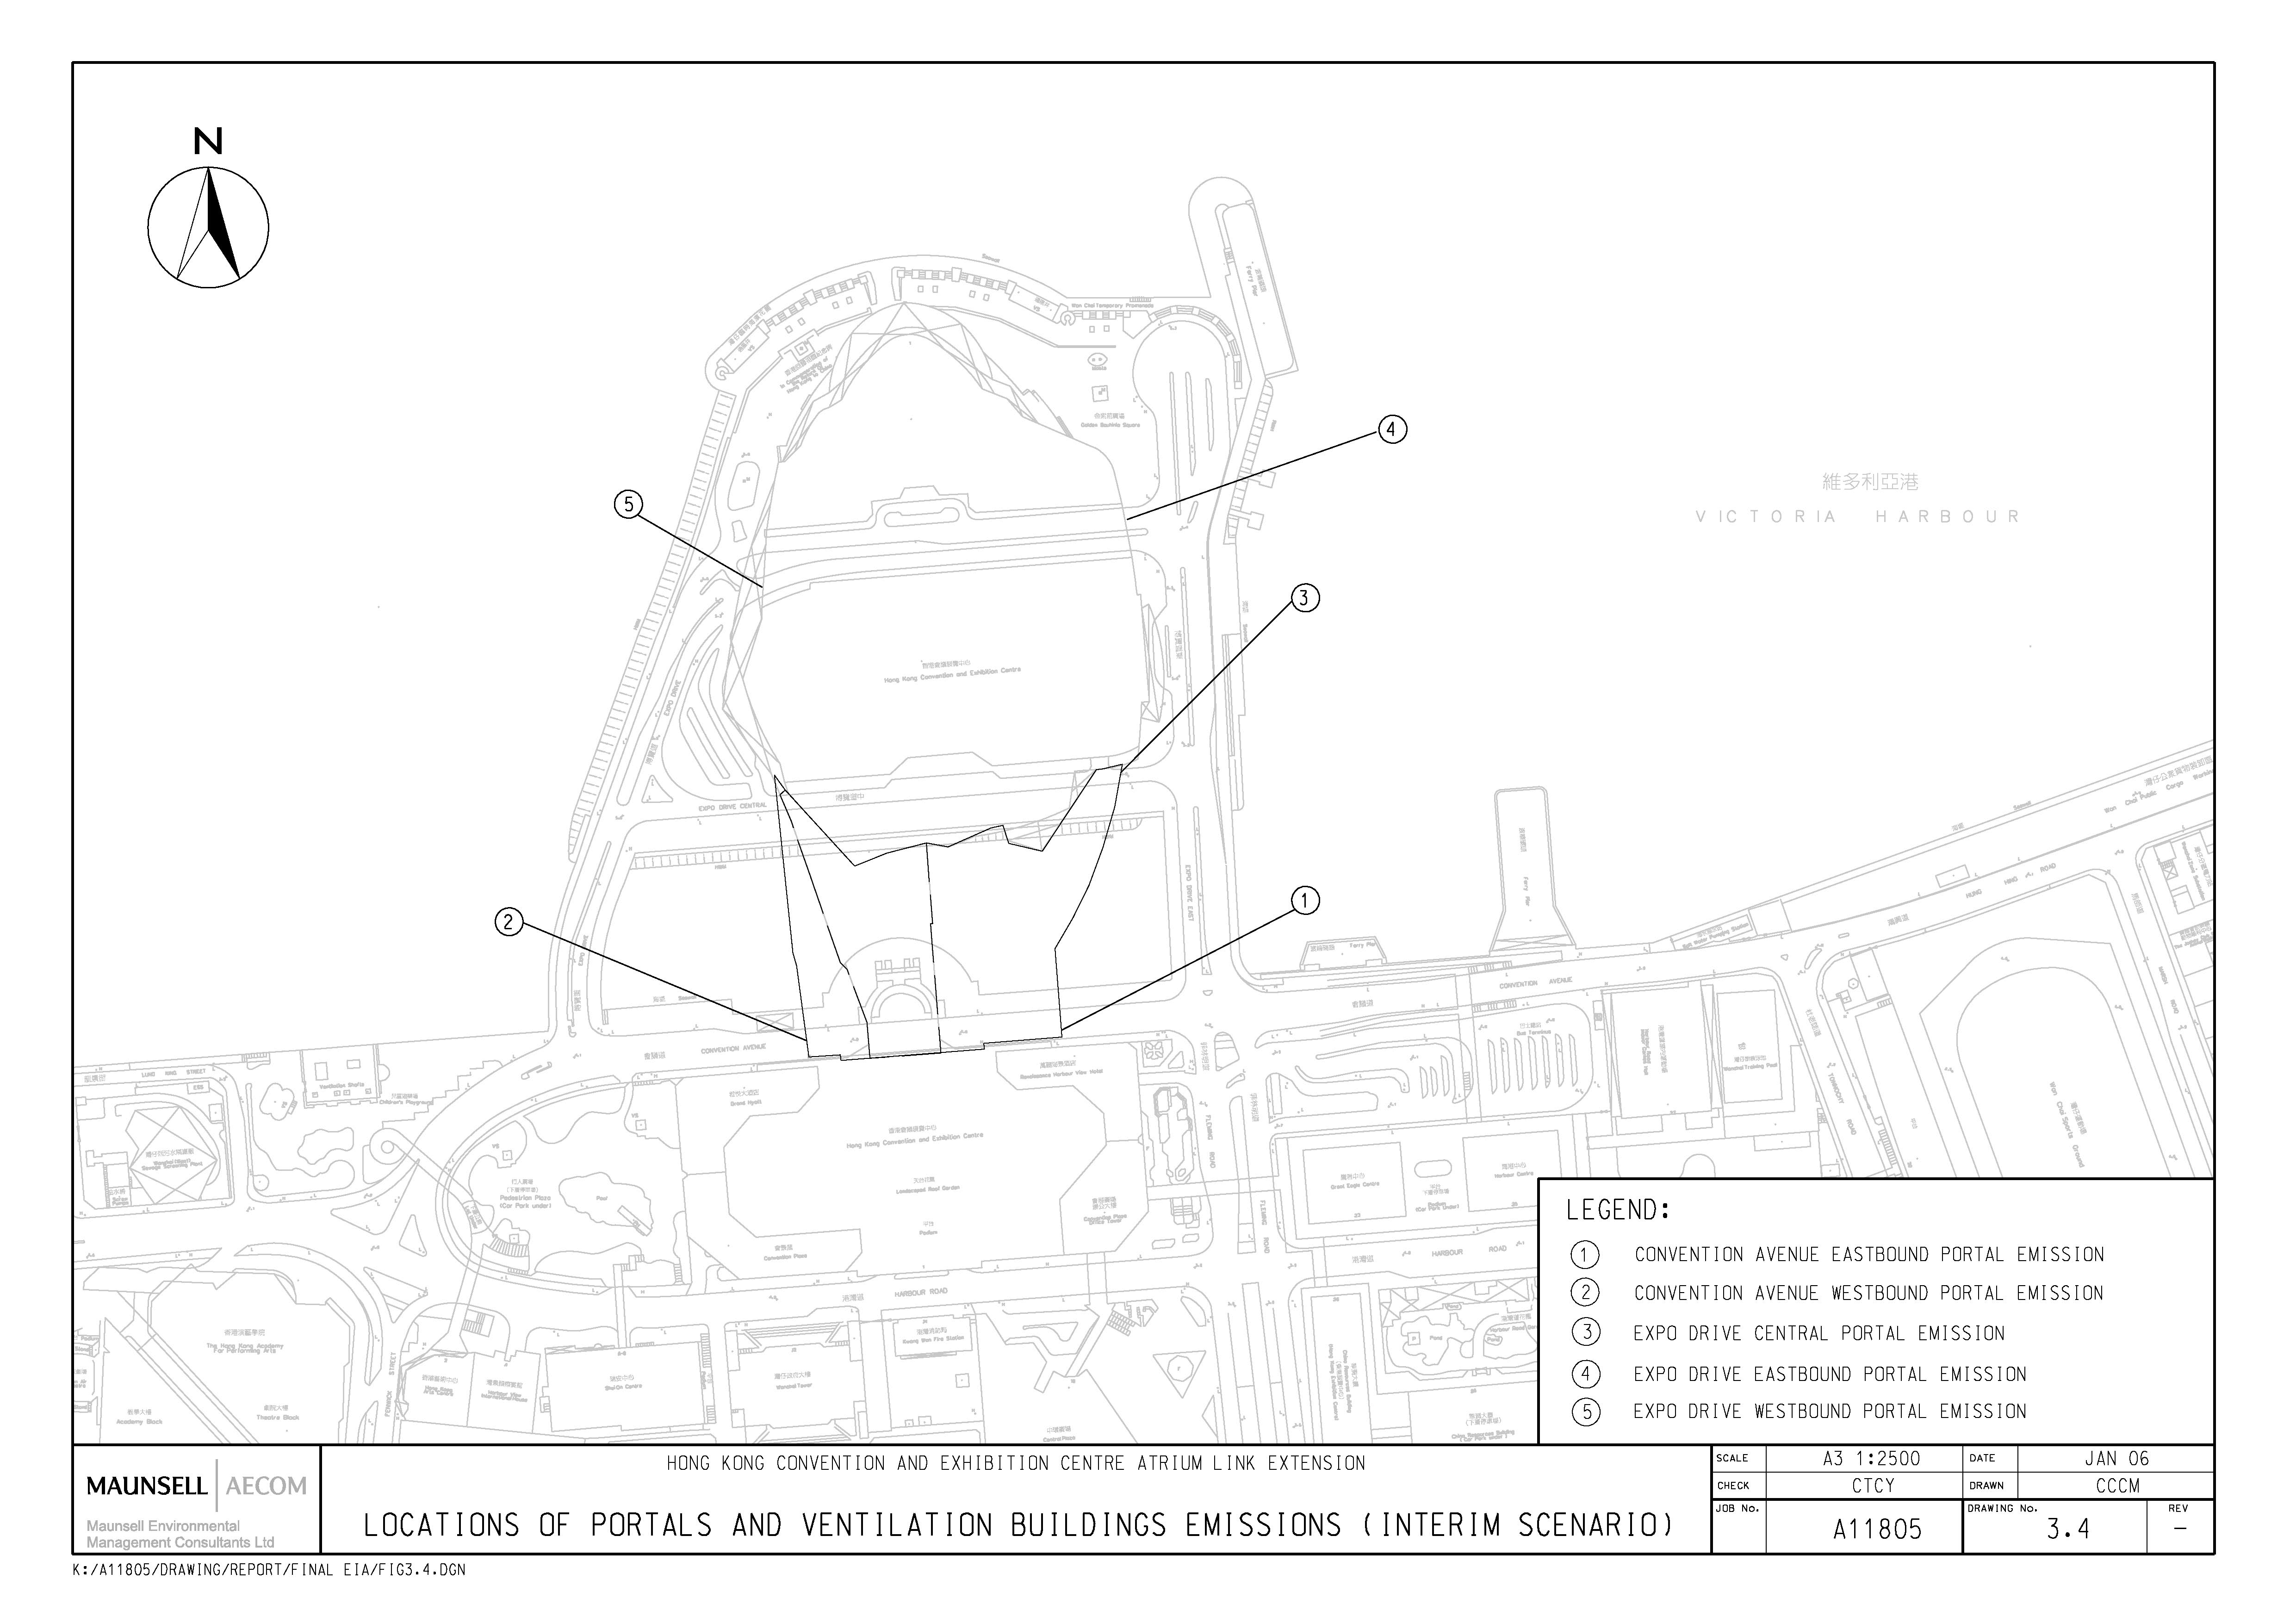
Figure 3.5 2024 AM Peak Hour Forecast Traffic
Flow (Interim Scenario)
Figure 3.6 Location of Proposed Fresh Air
Intake
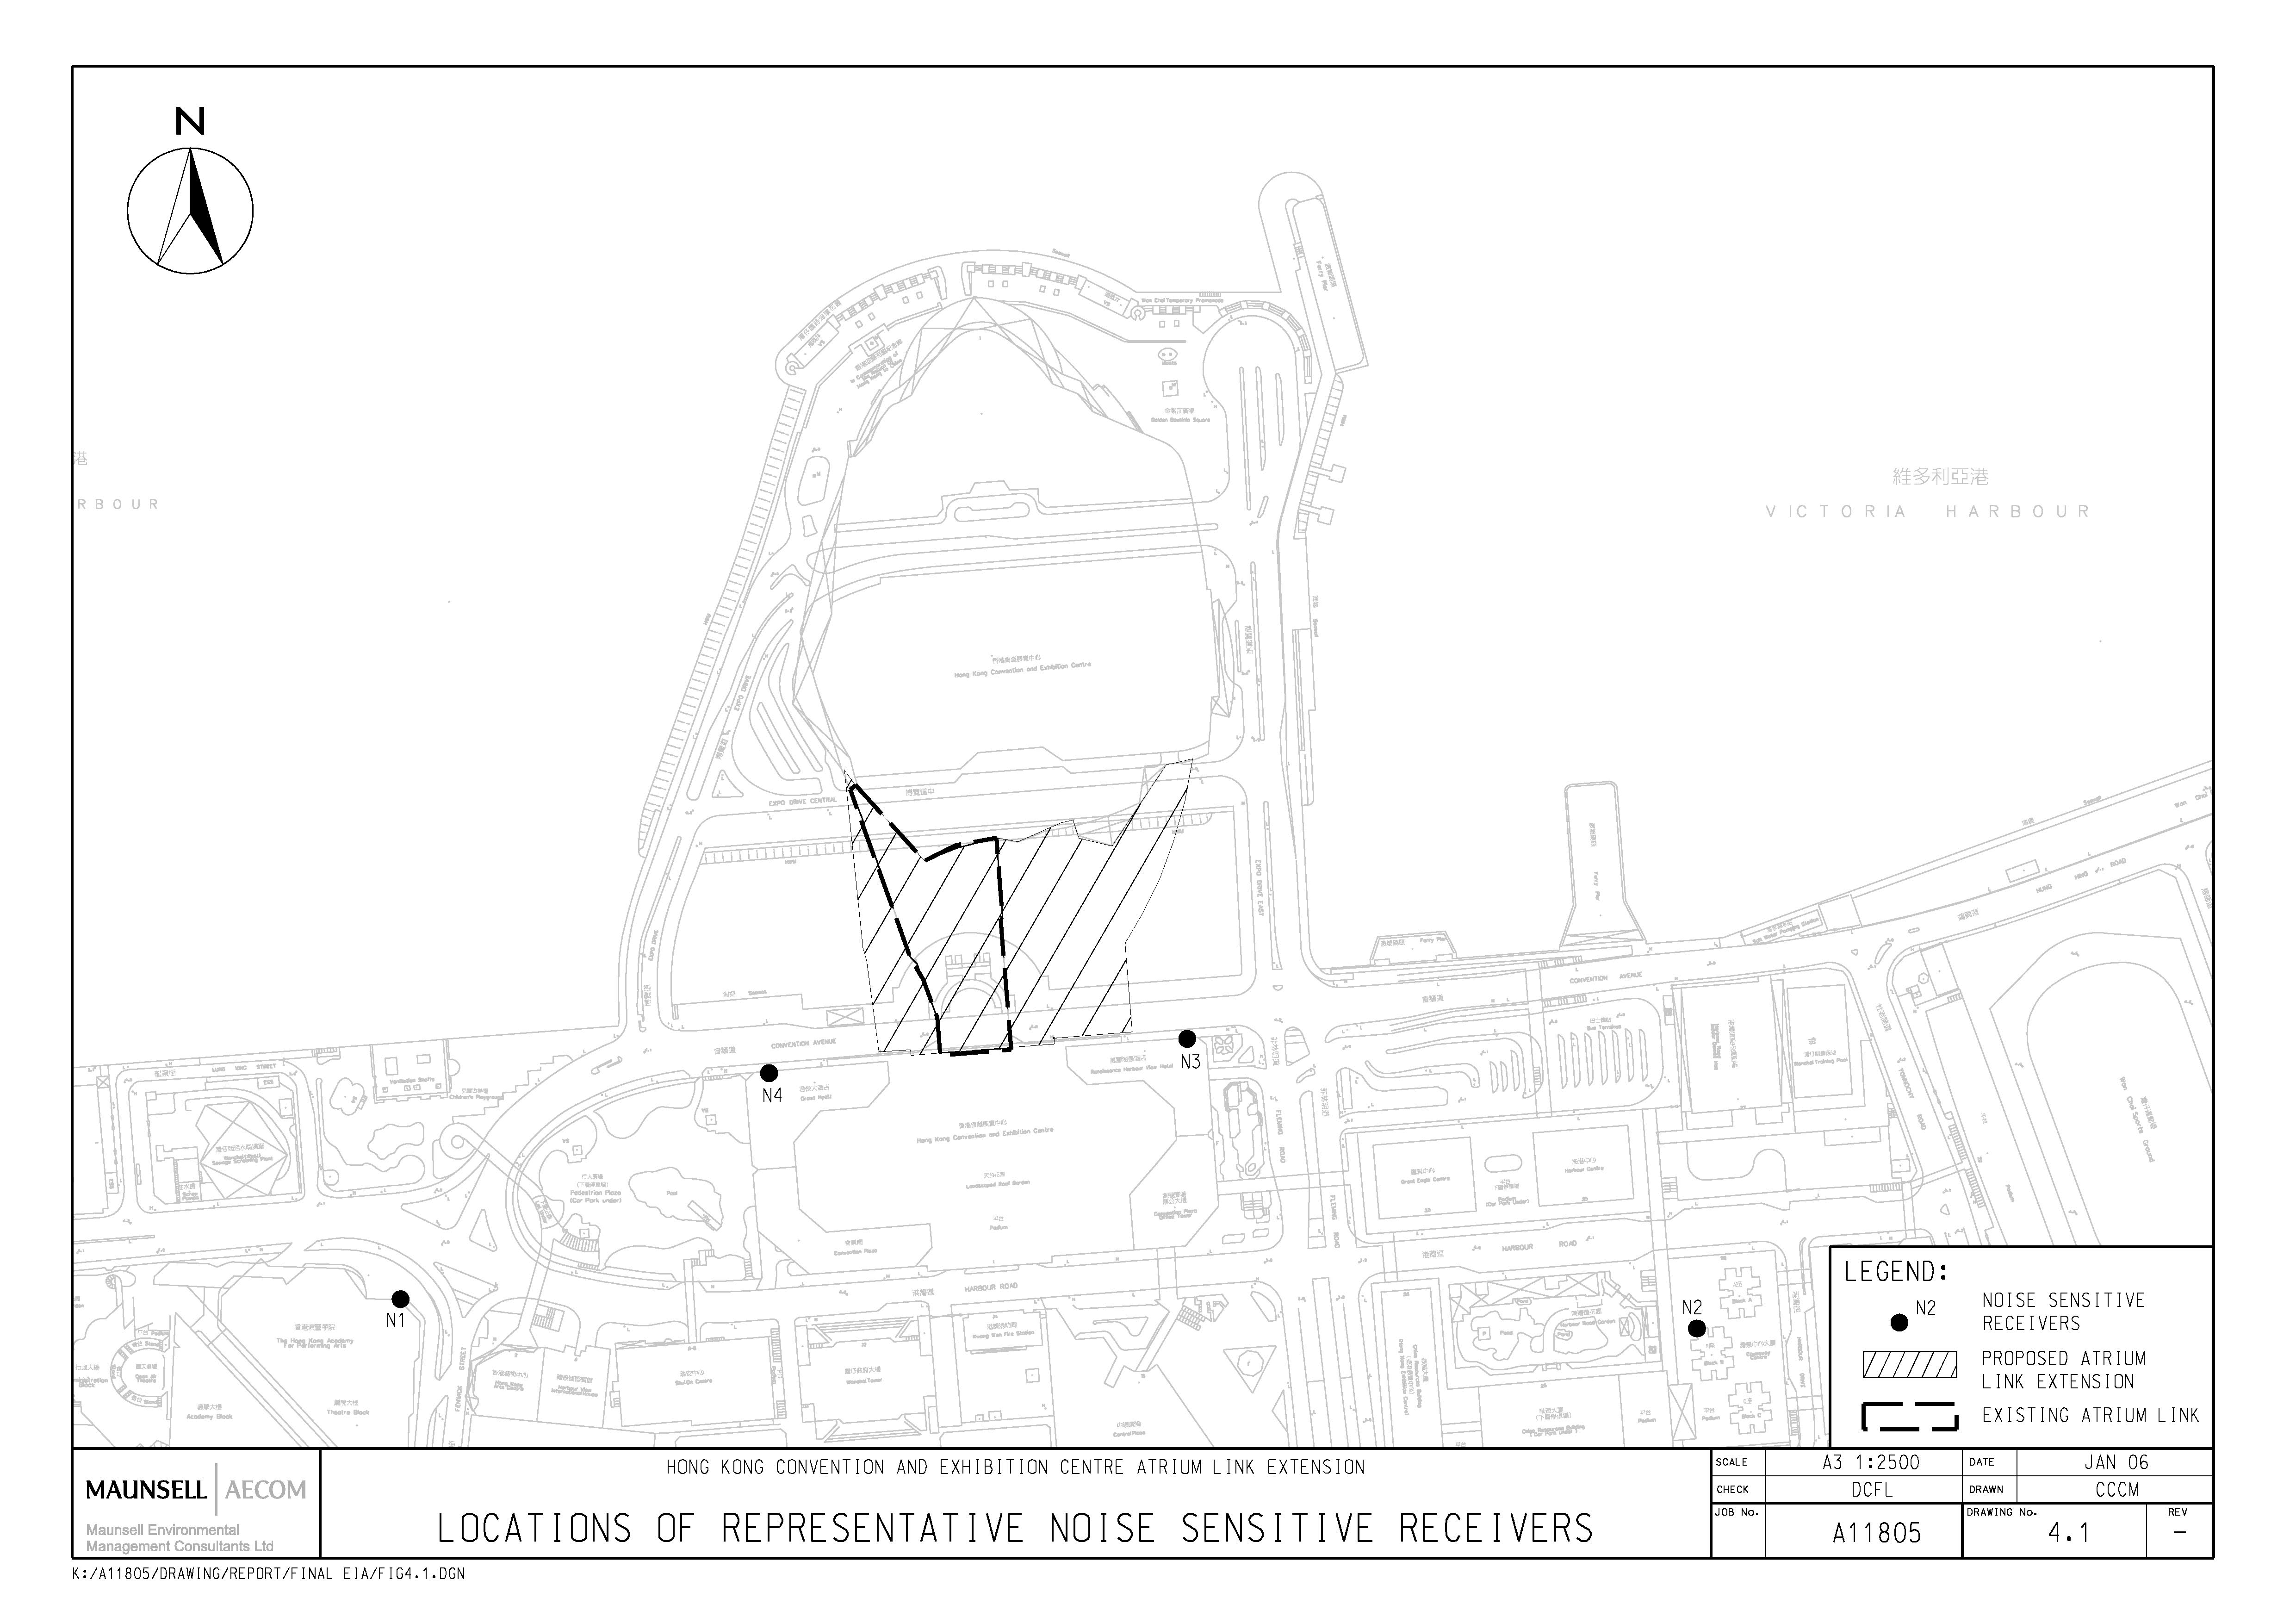
Figure 4.1 Locations of Representative Noise
Sensitive Receivers
Figure 4.2 Location of Proposed Plant Room
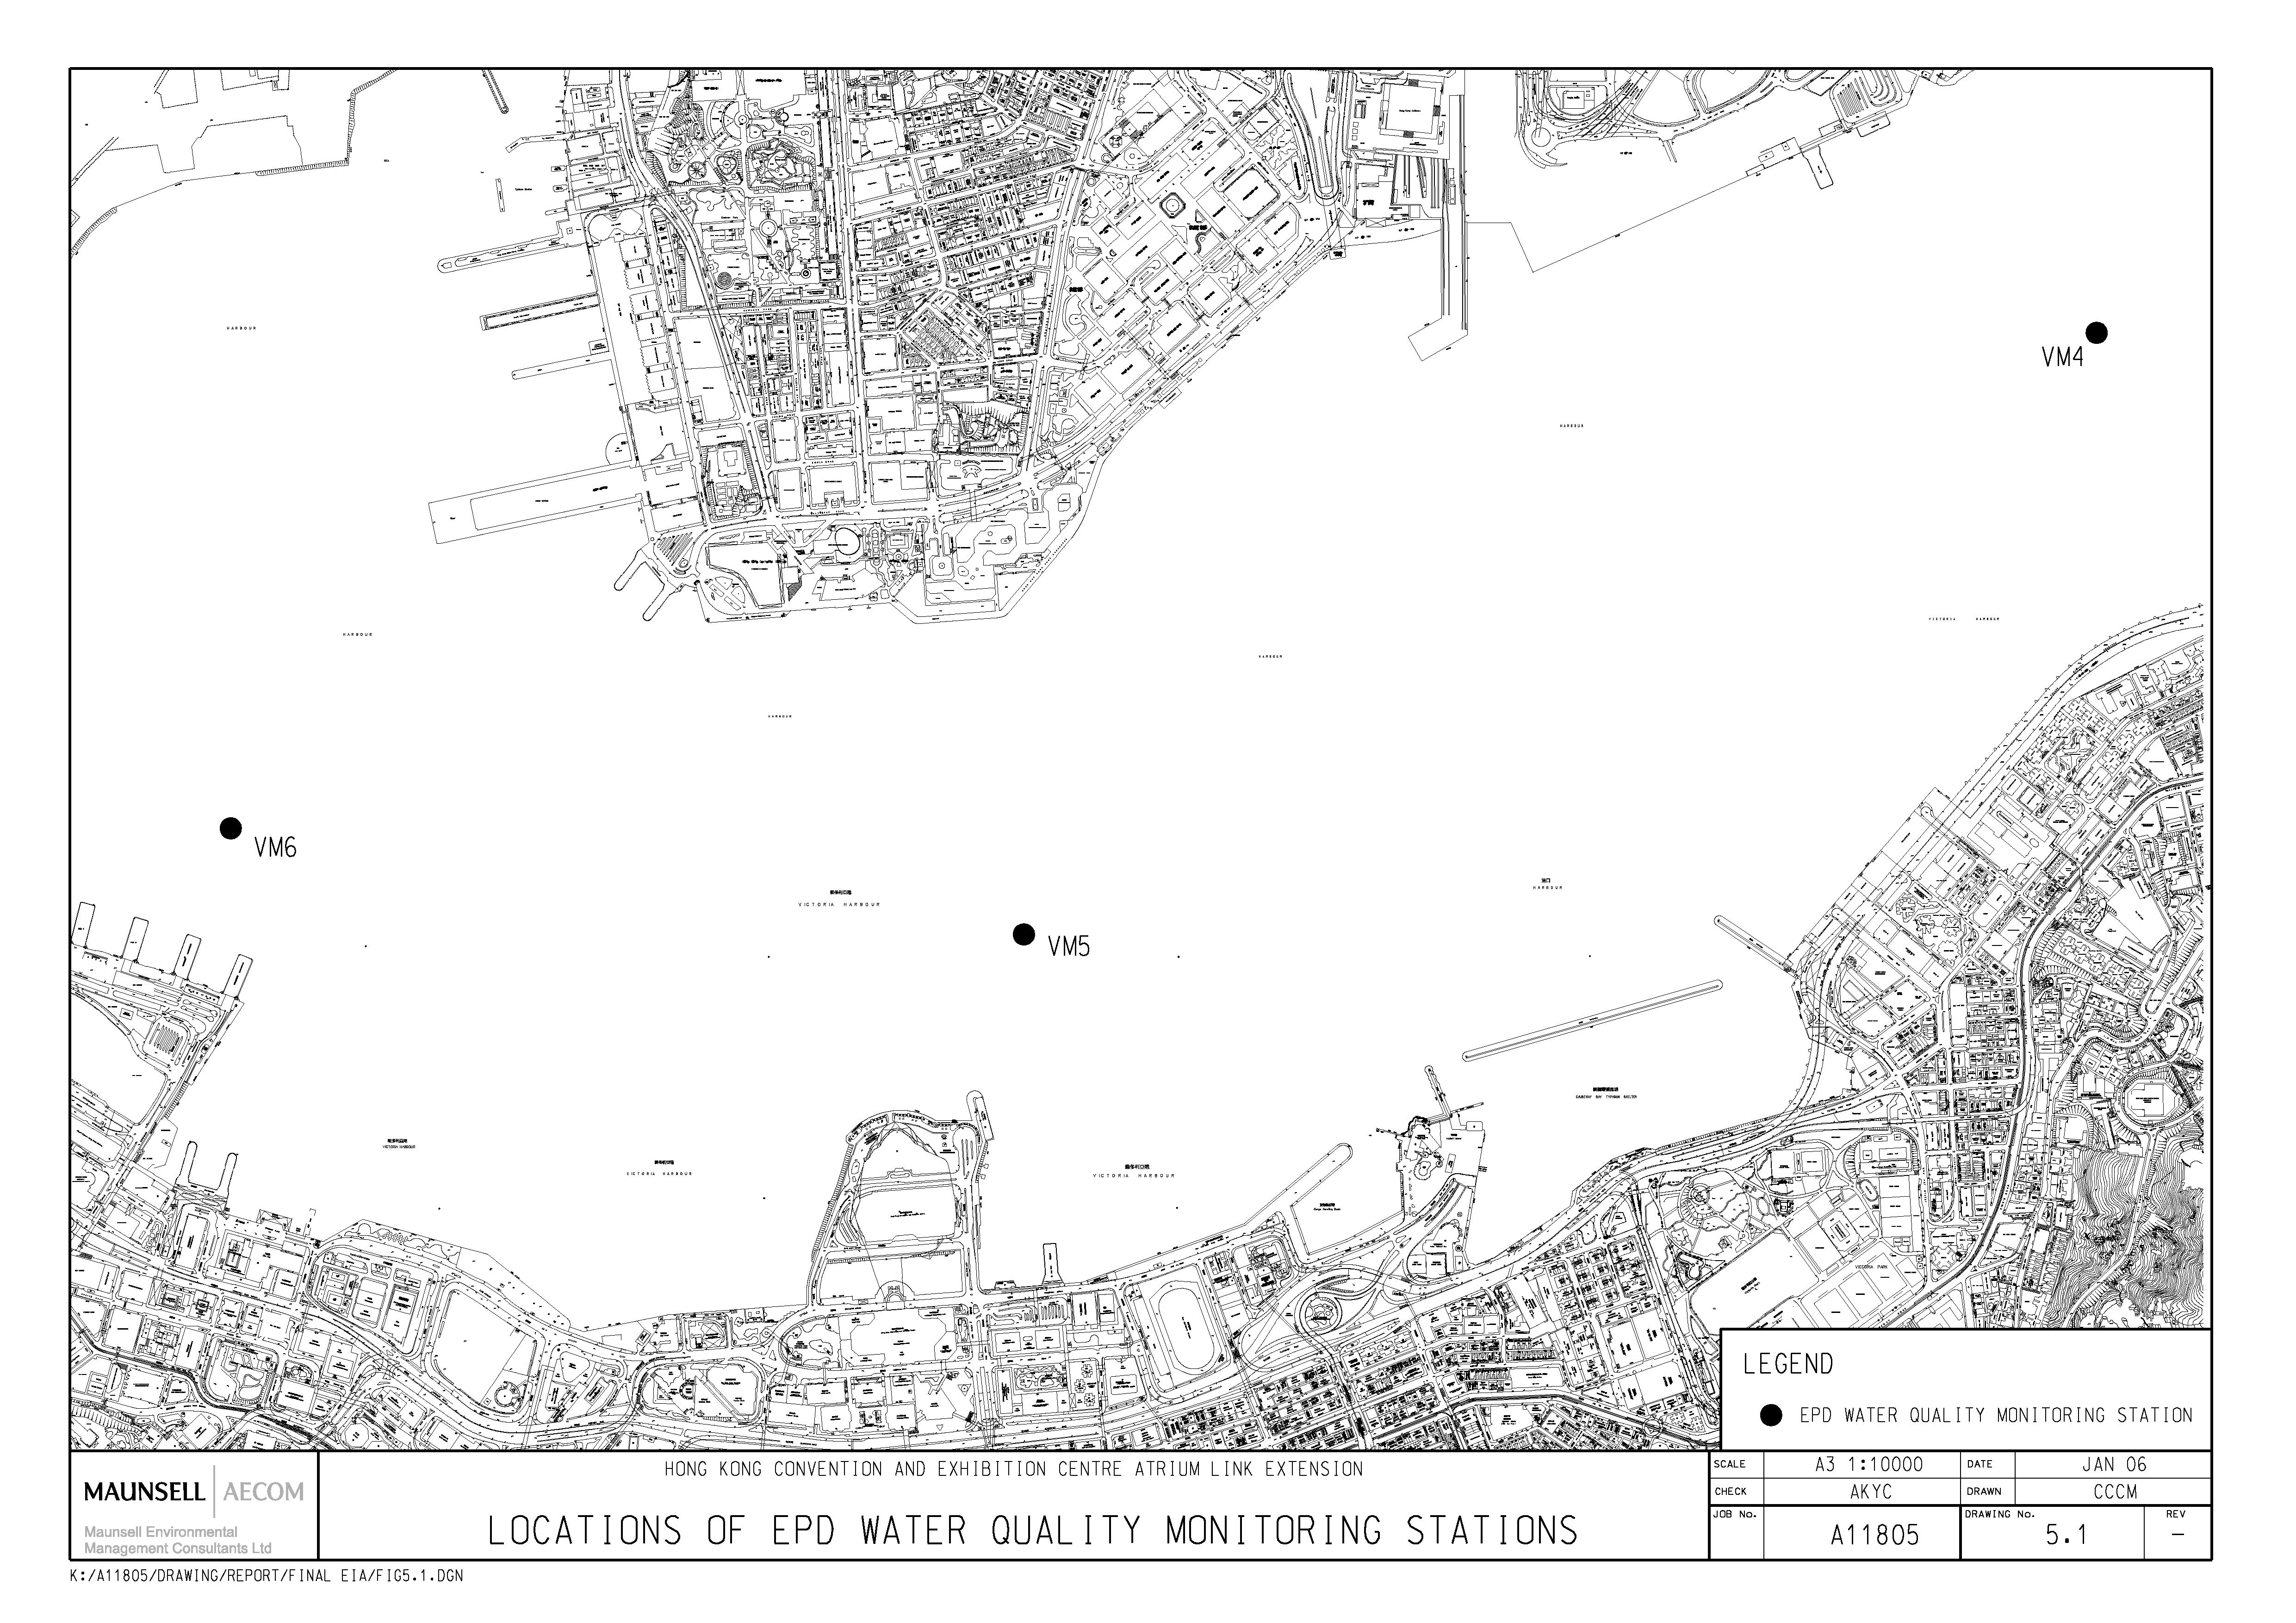
Figure 5.1 Locations of EPD Water Quality
Monitoring Stations
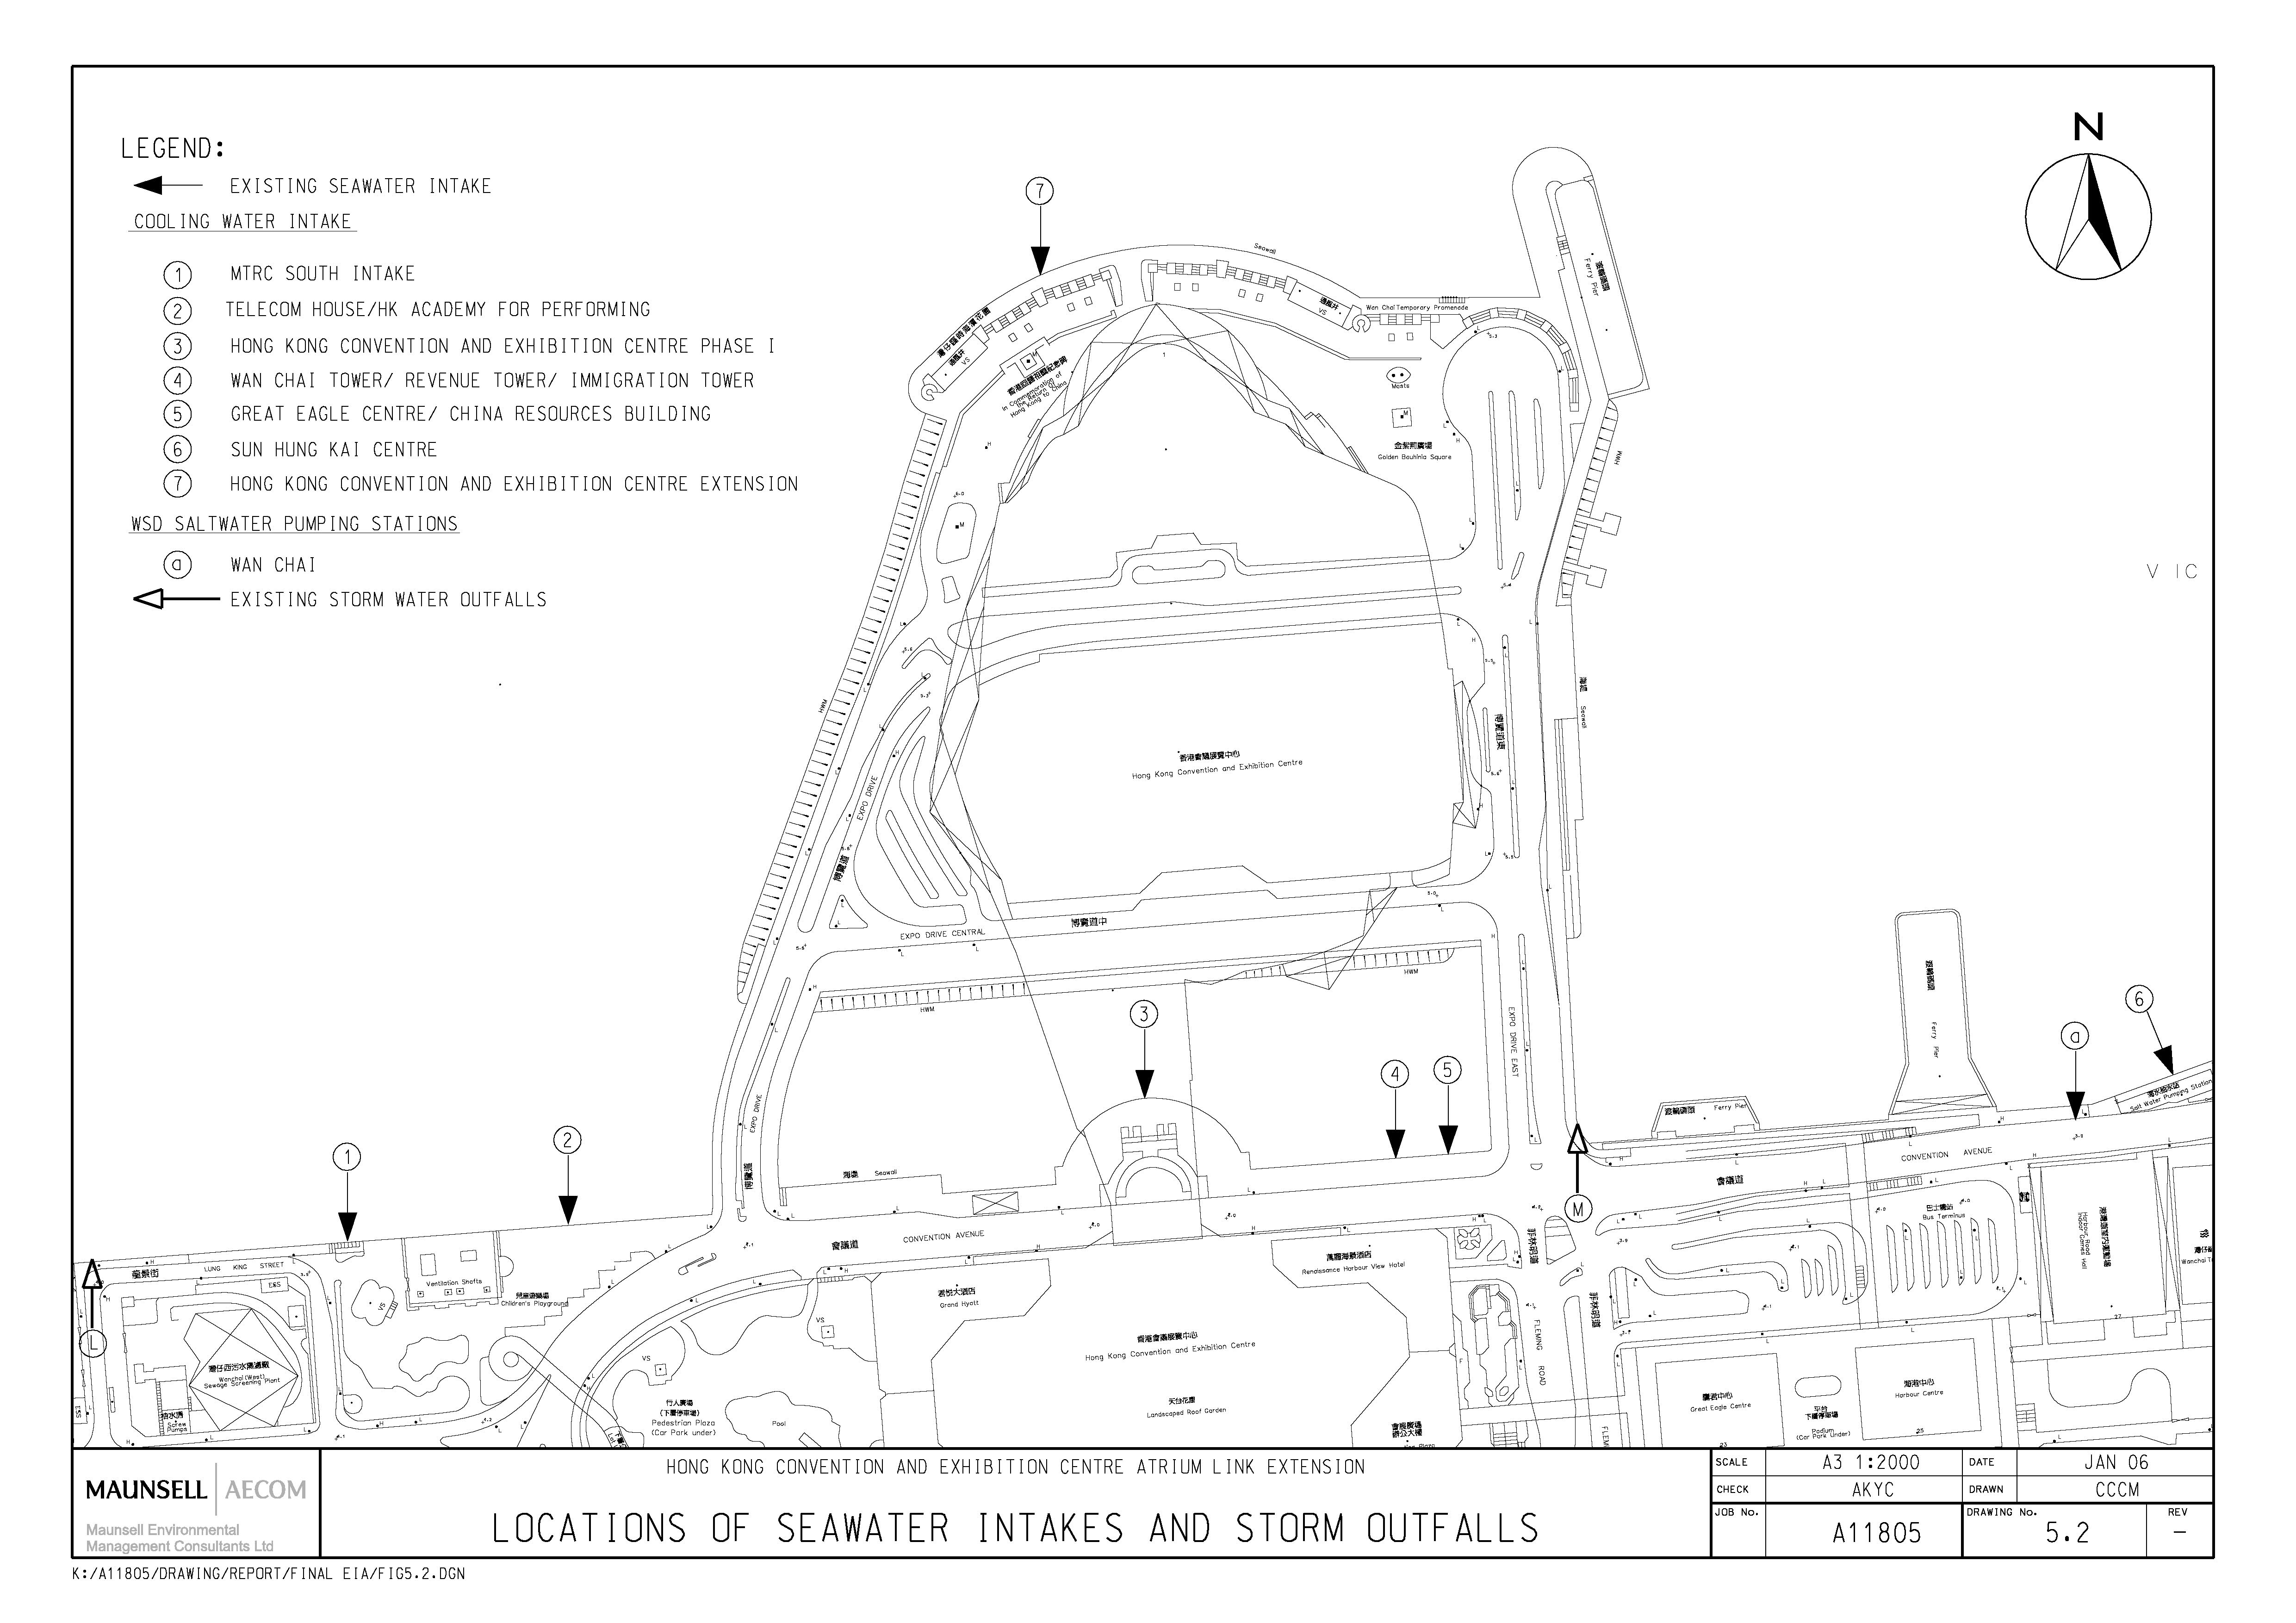
Figure 5.2 Locations of Seawater Intakes and
Storm Outfalls
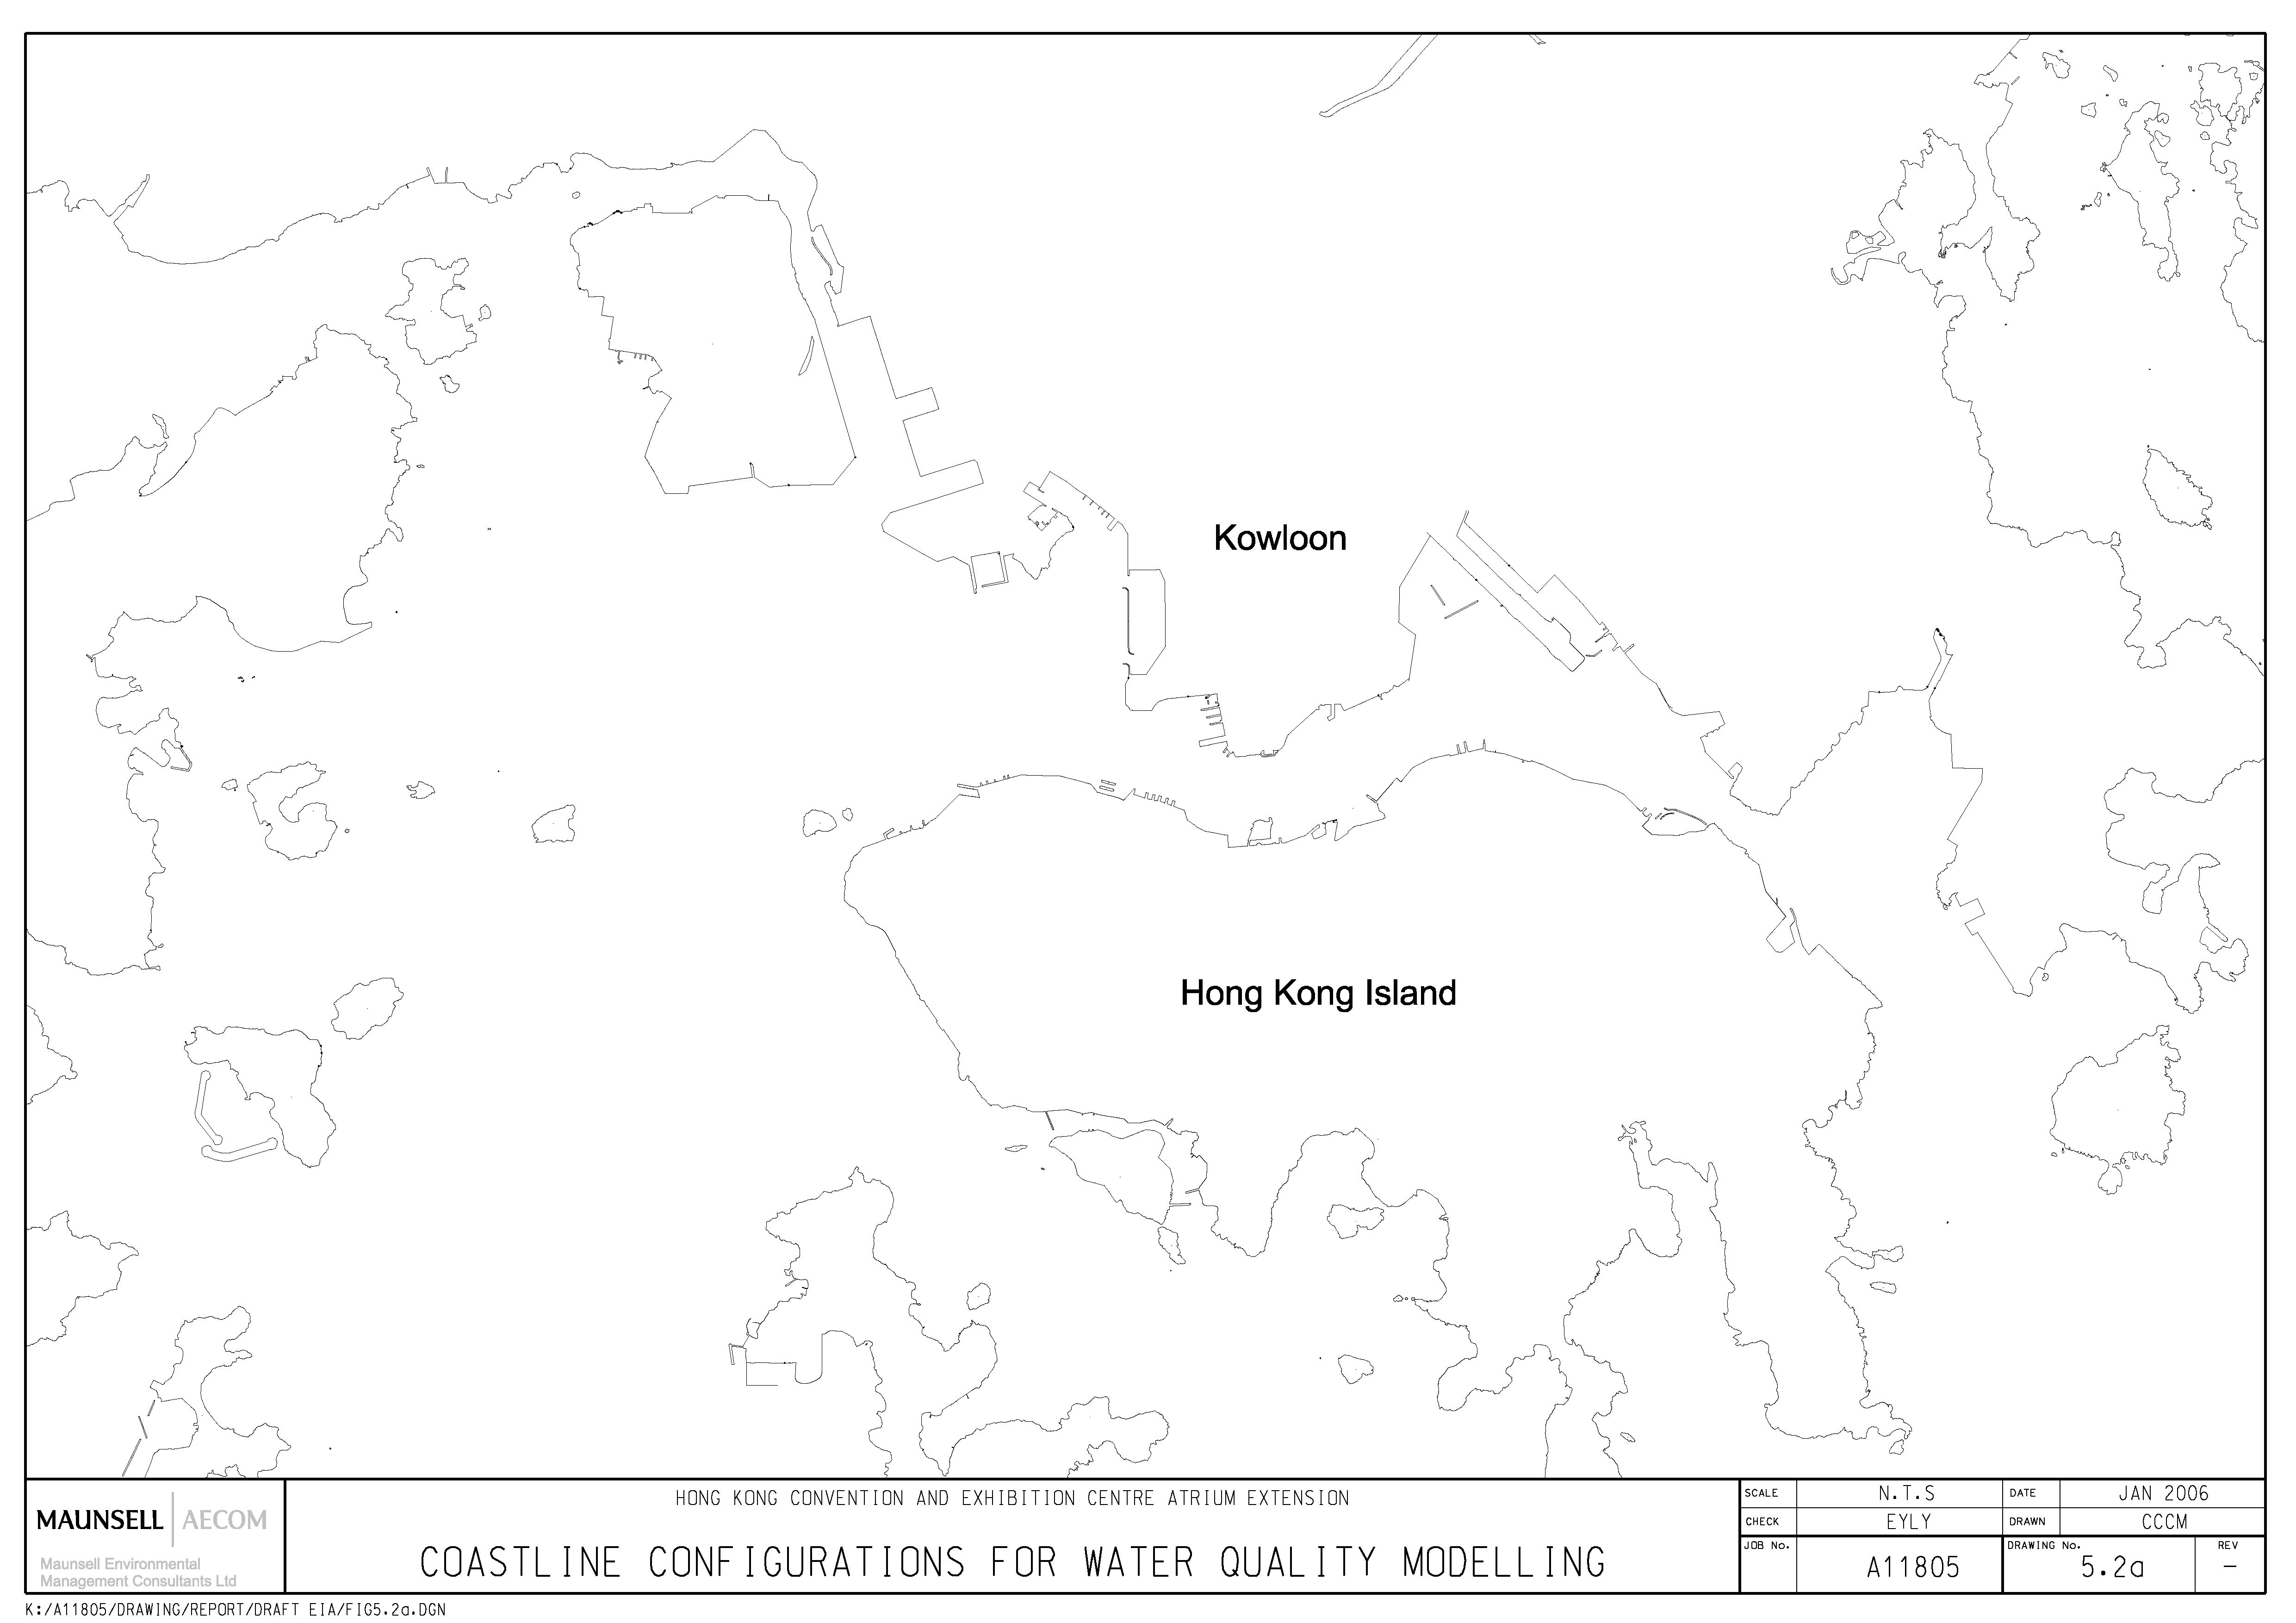
Figure 5.2a Coastline configurations for Water
Quality Modelling
Figure 5.3 Locations of Cross Sections
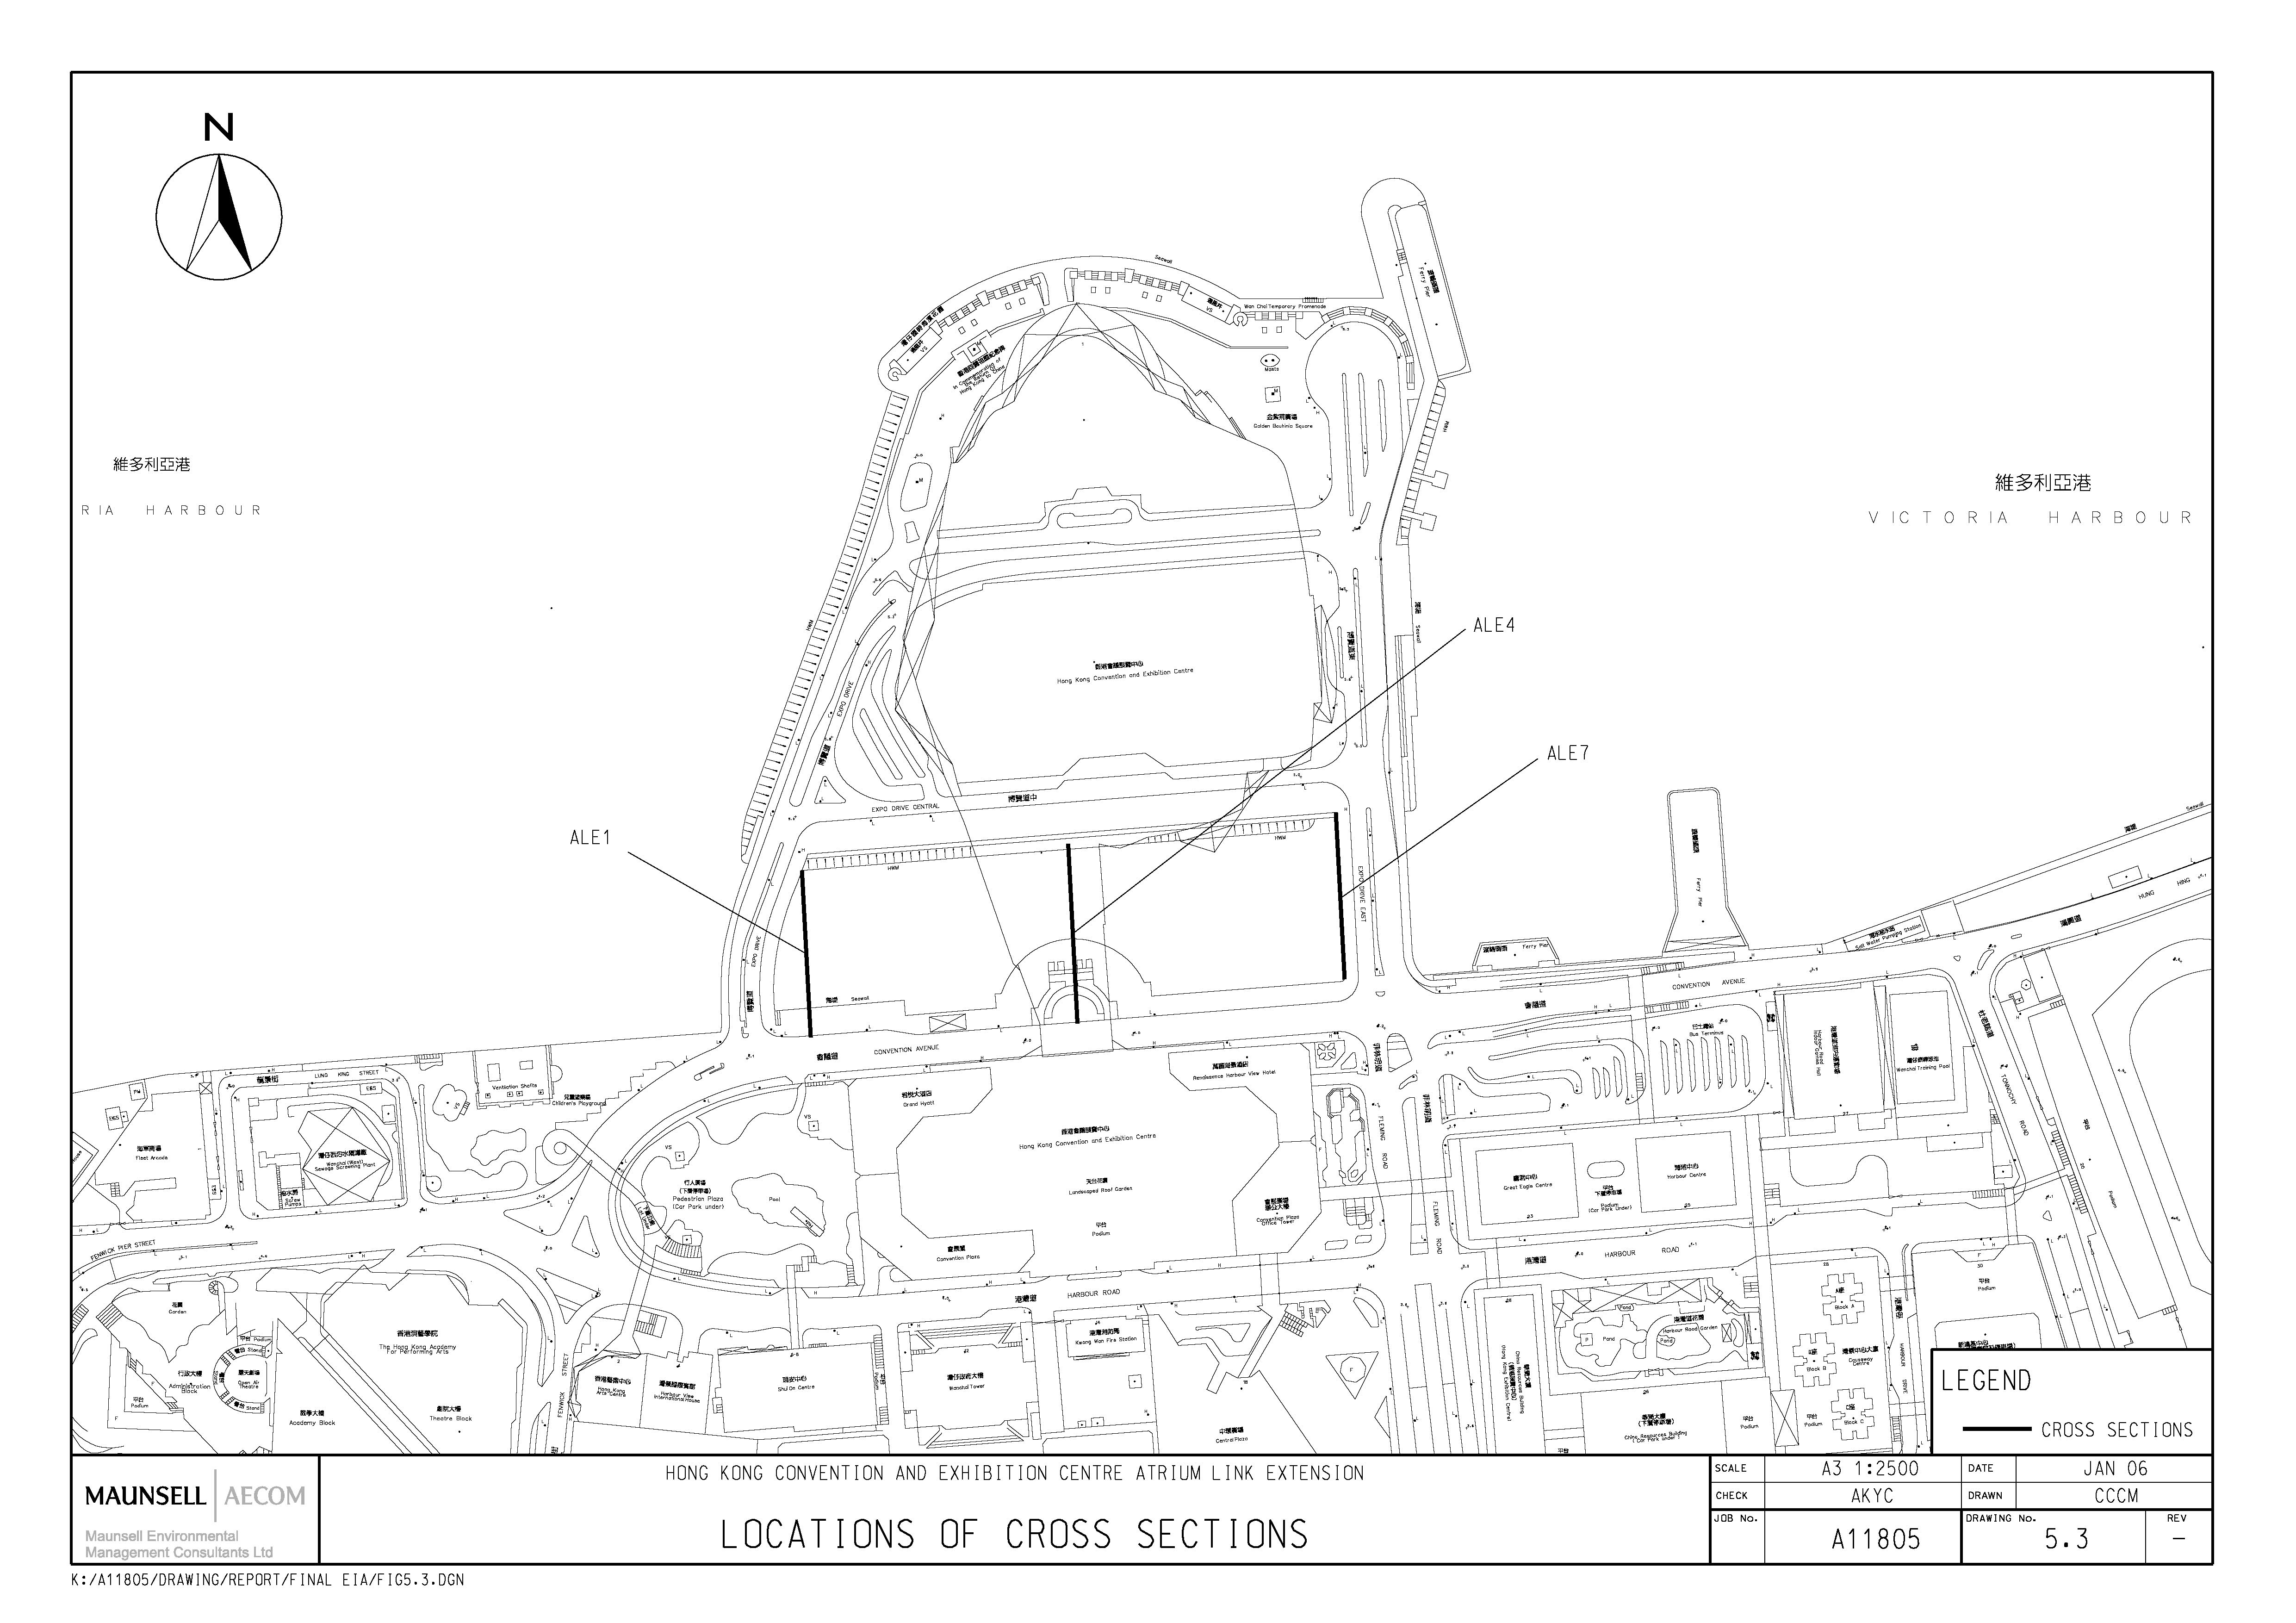
Figure 5.4 Locations of Marine Access Points
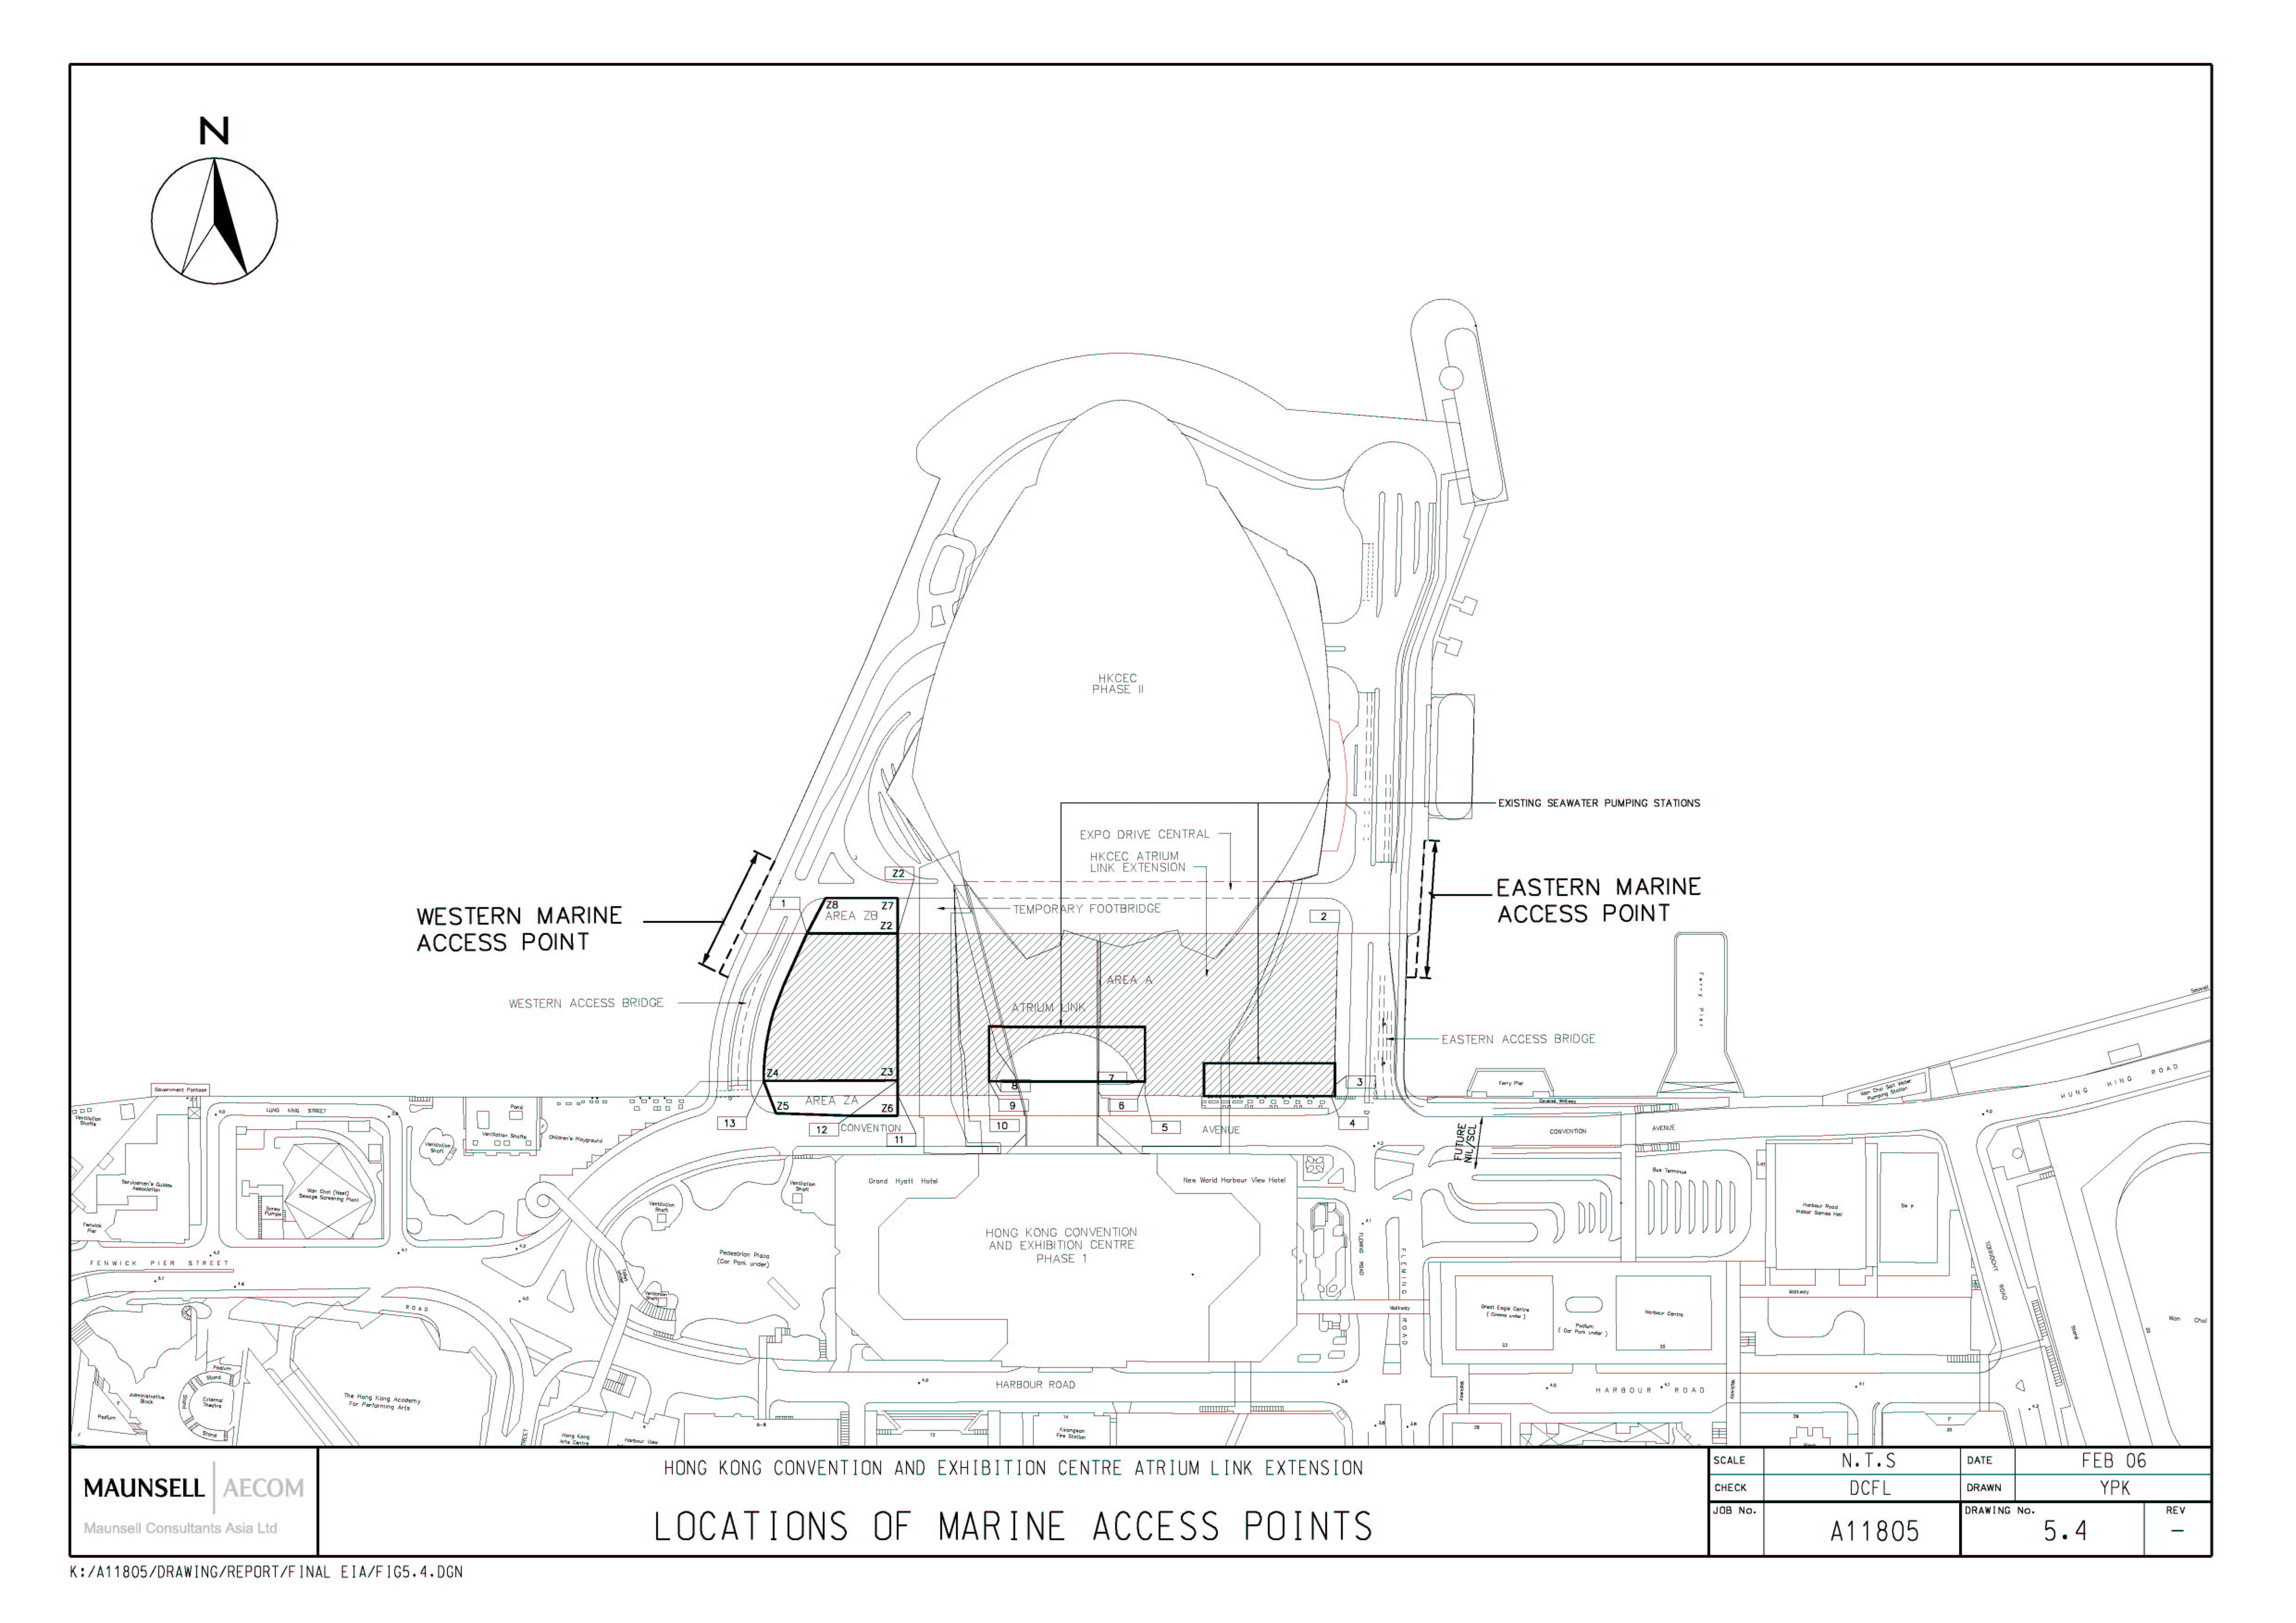
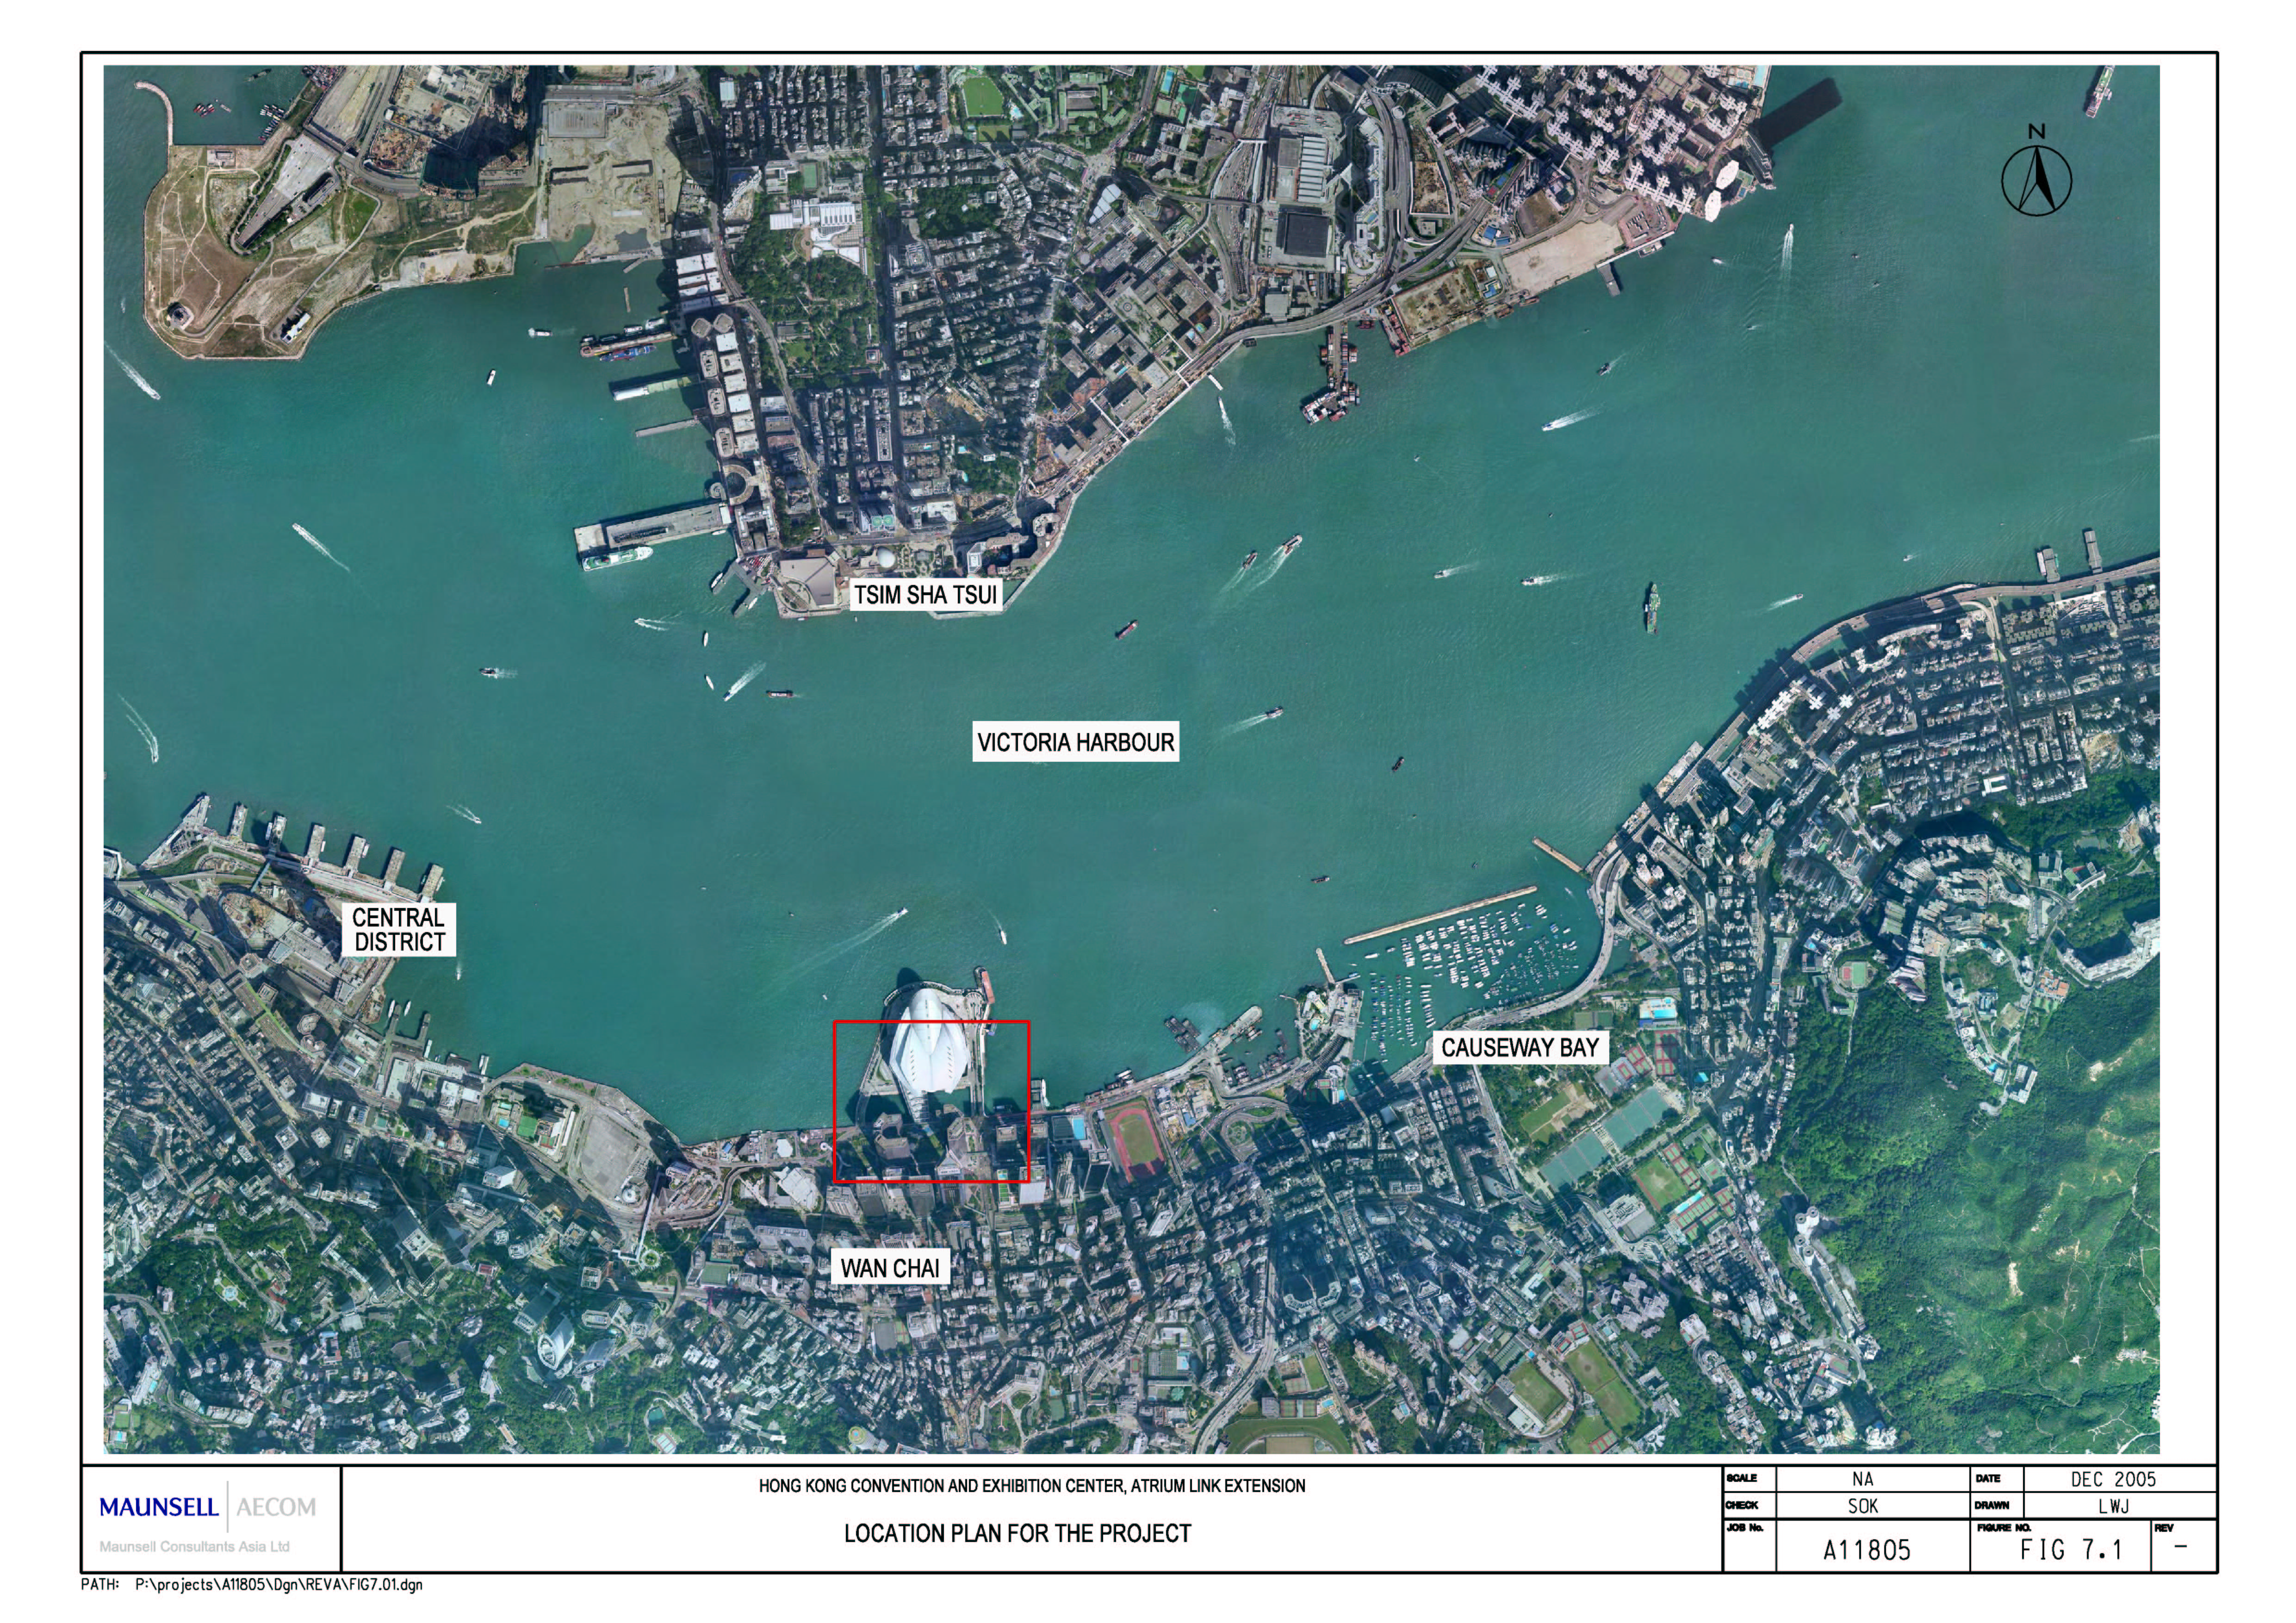
Figure 7.1 Location Plan for the Project
Figure 7.2 Planning & Development
Framework (OZP)
Figure 7.3 Landscape Resources
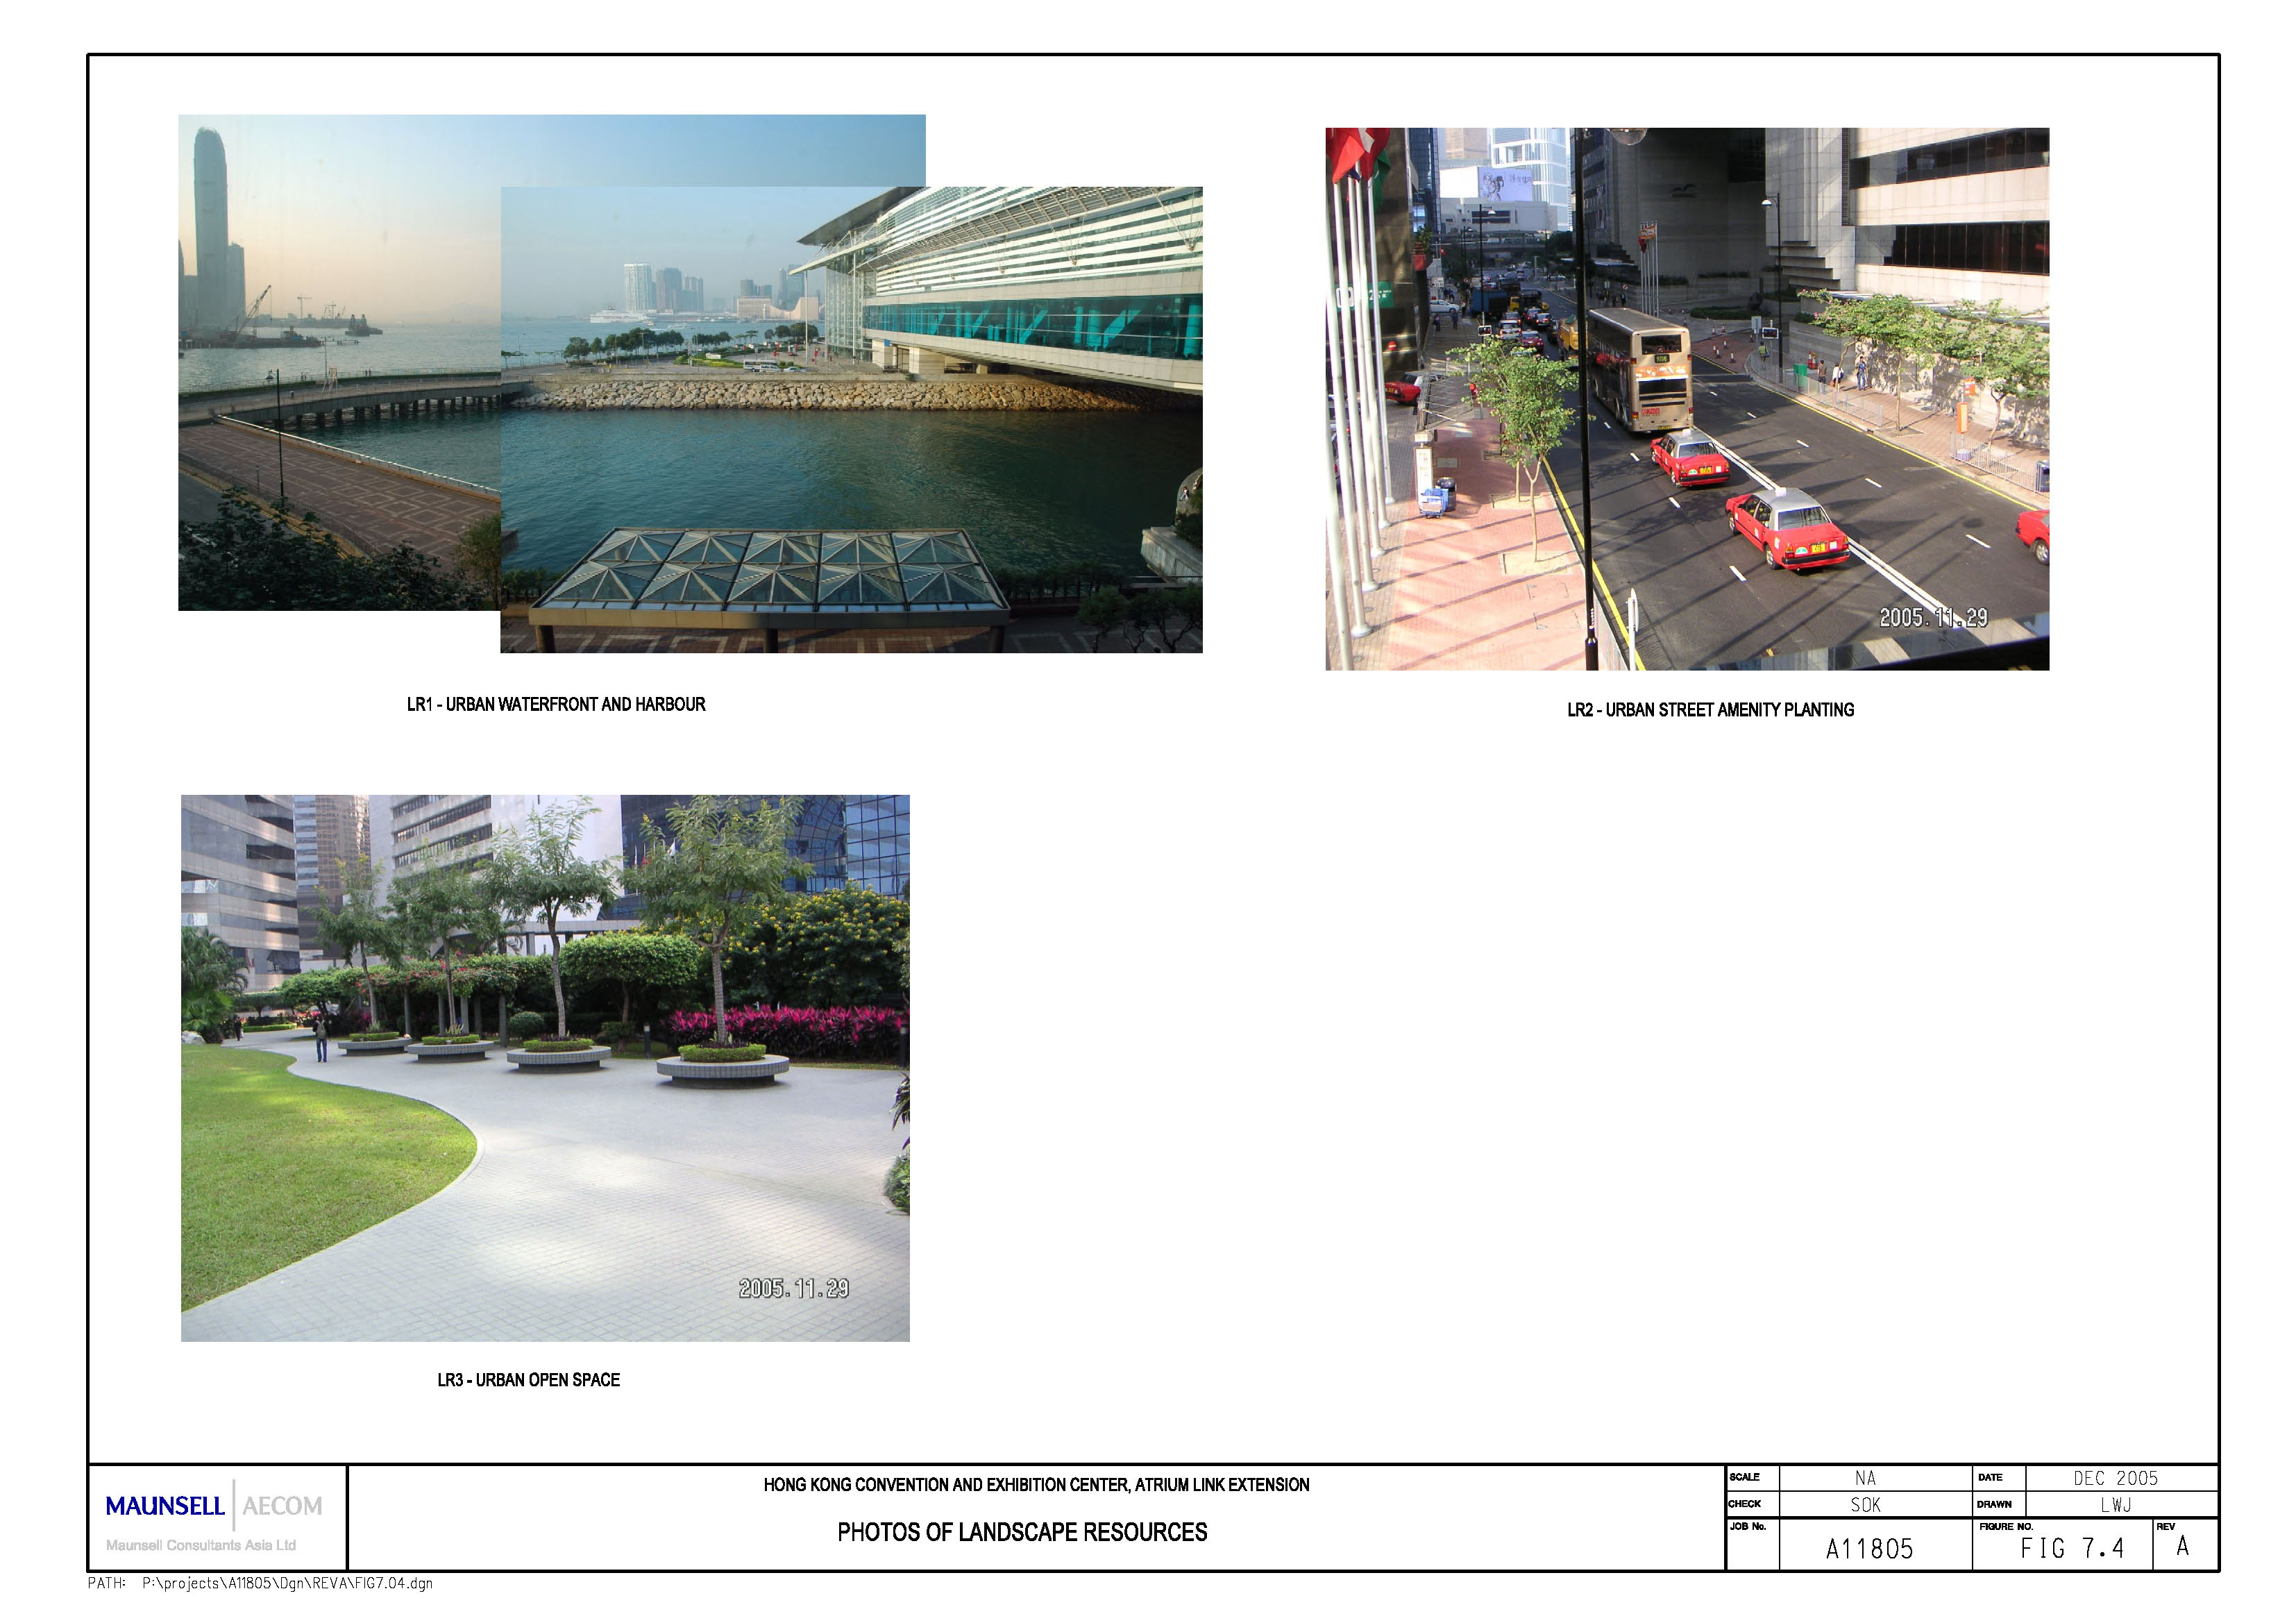
Figure 7.4 Photo of
Landscape Resources
Figure 7.5 Landscape Character Area
Figure 7.6 Photo of Landscape Character Area
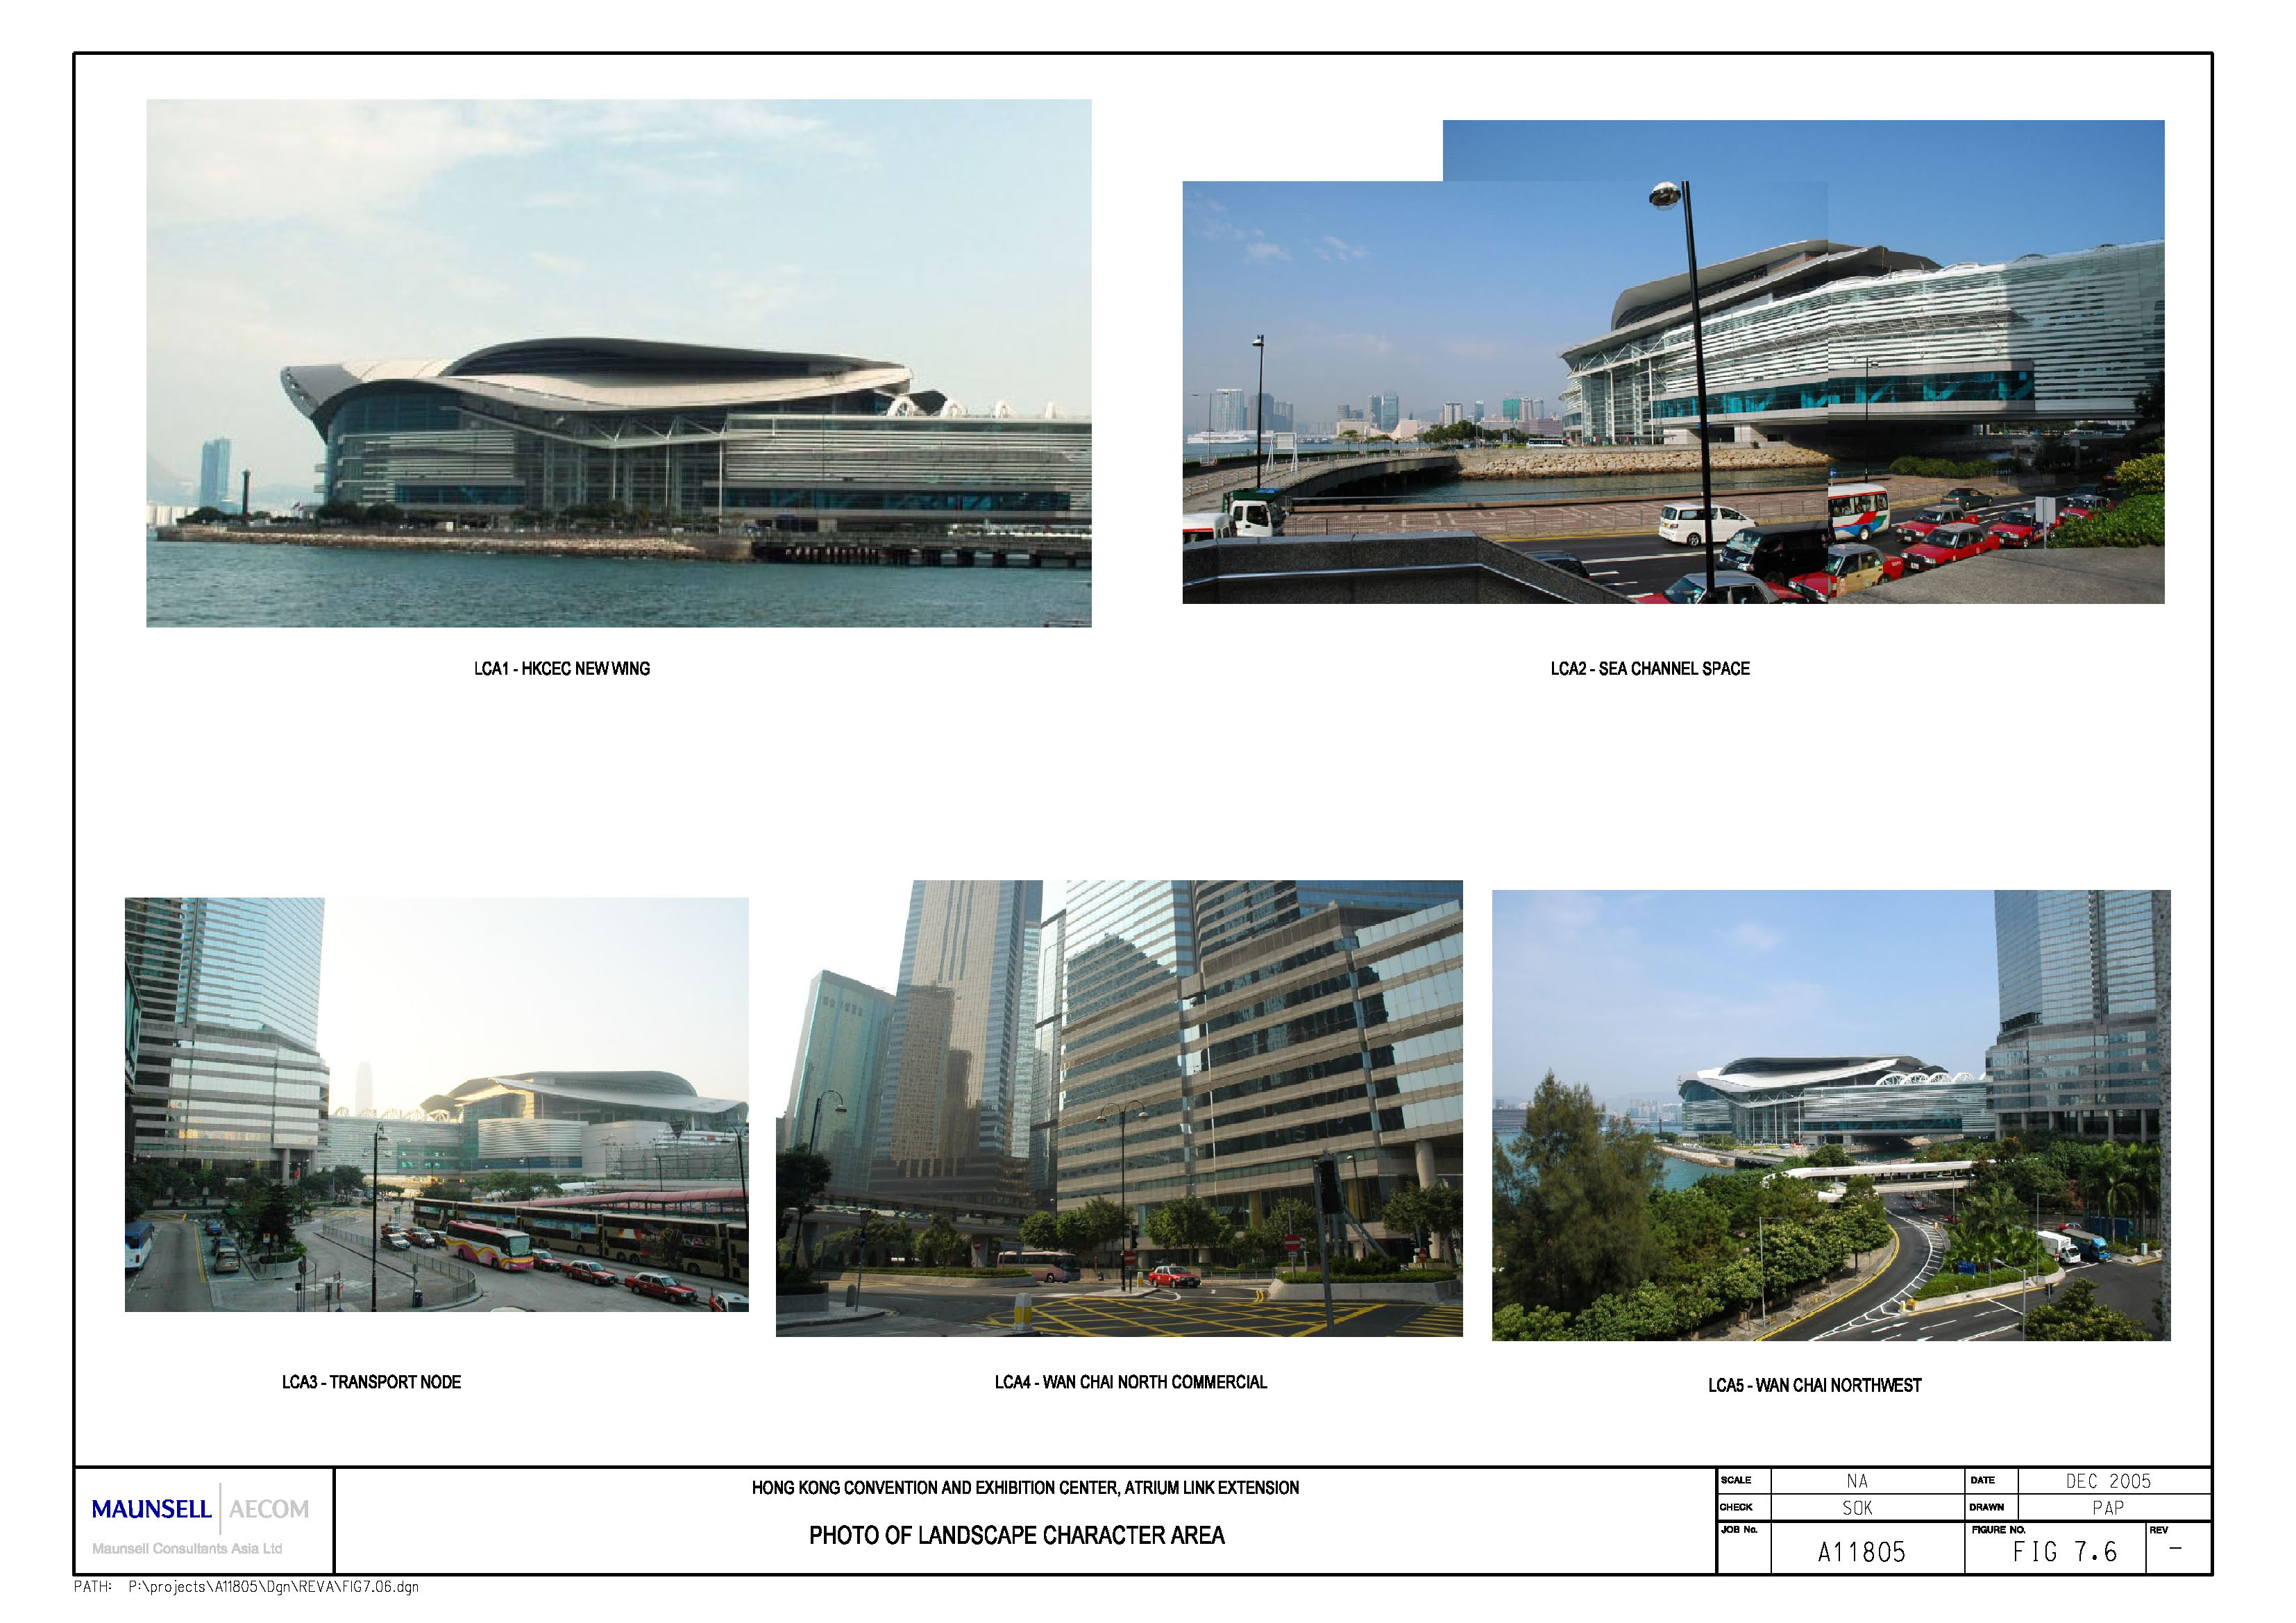
Figure 7.7 Visually Sensitive Receivers
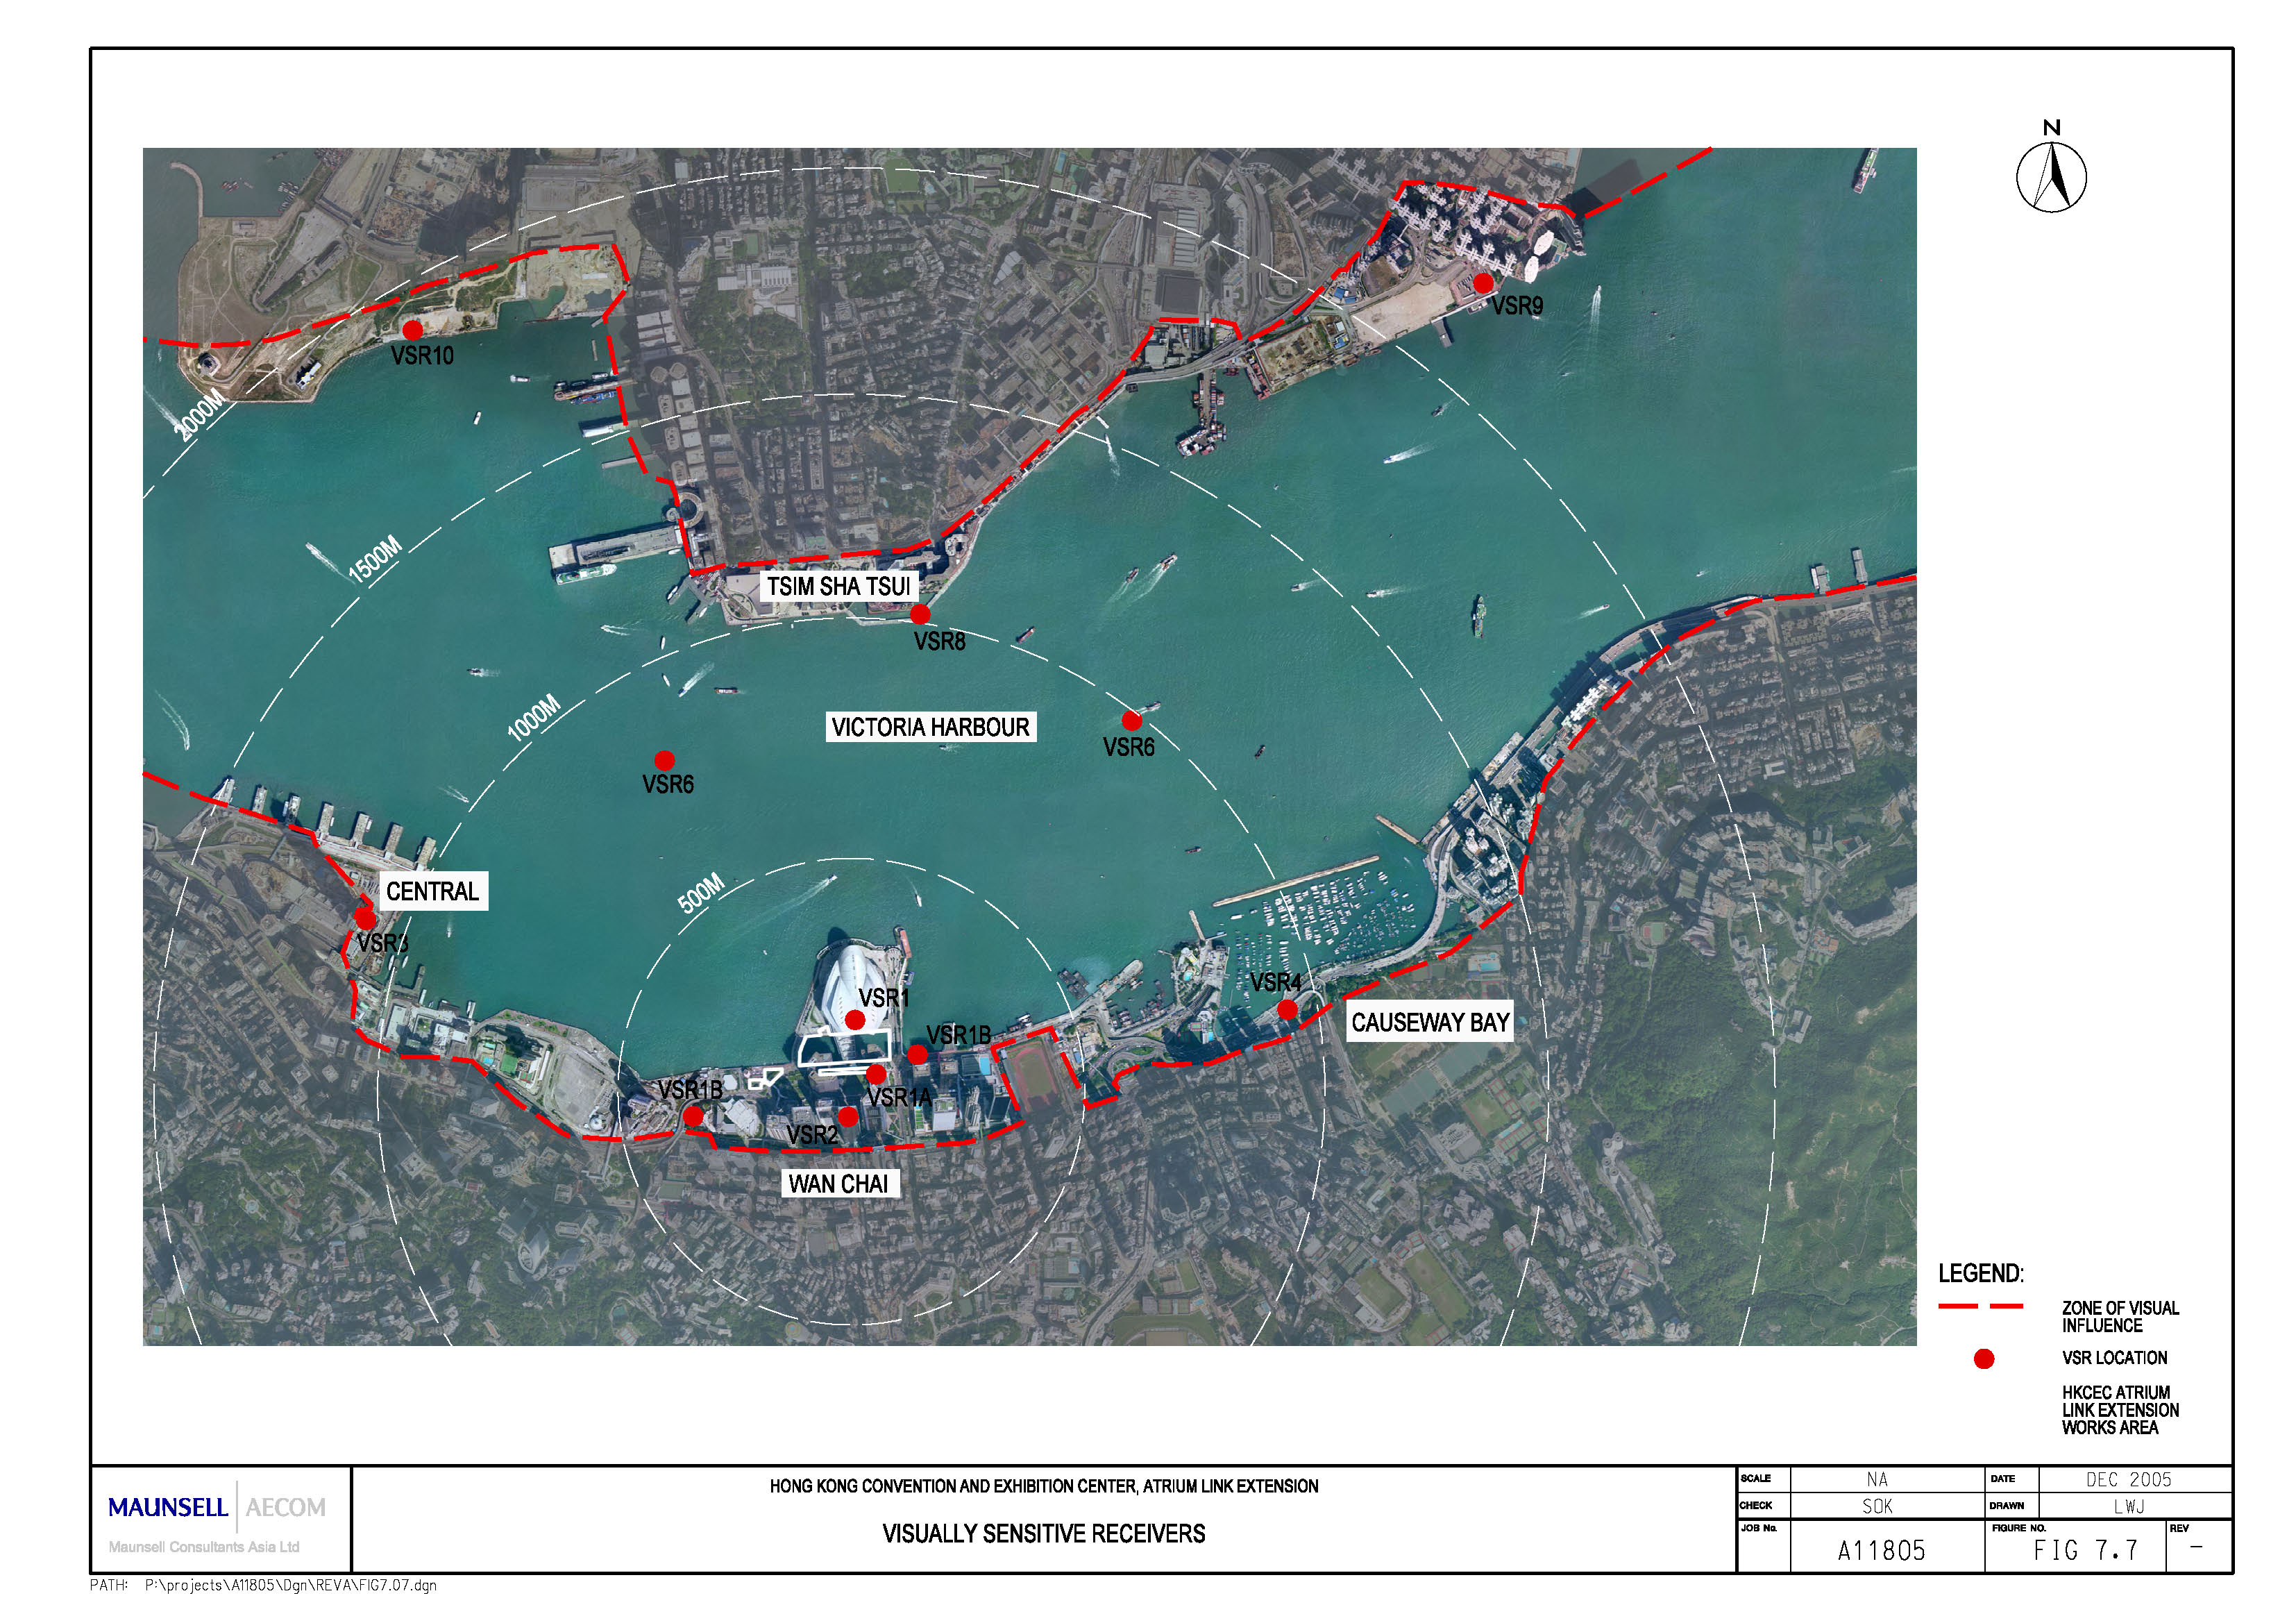
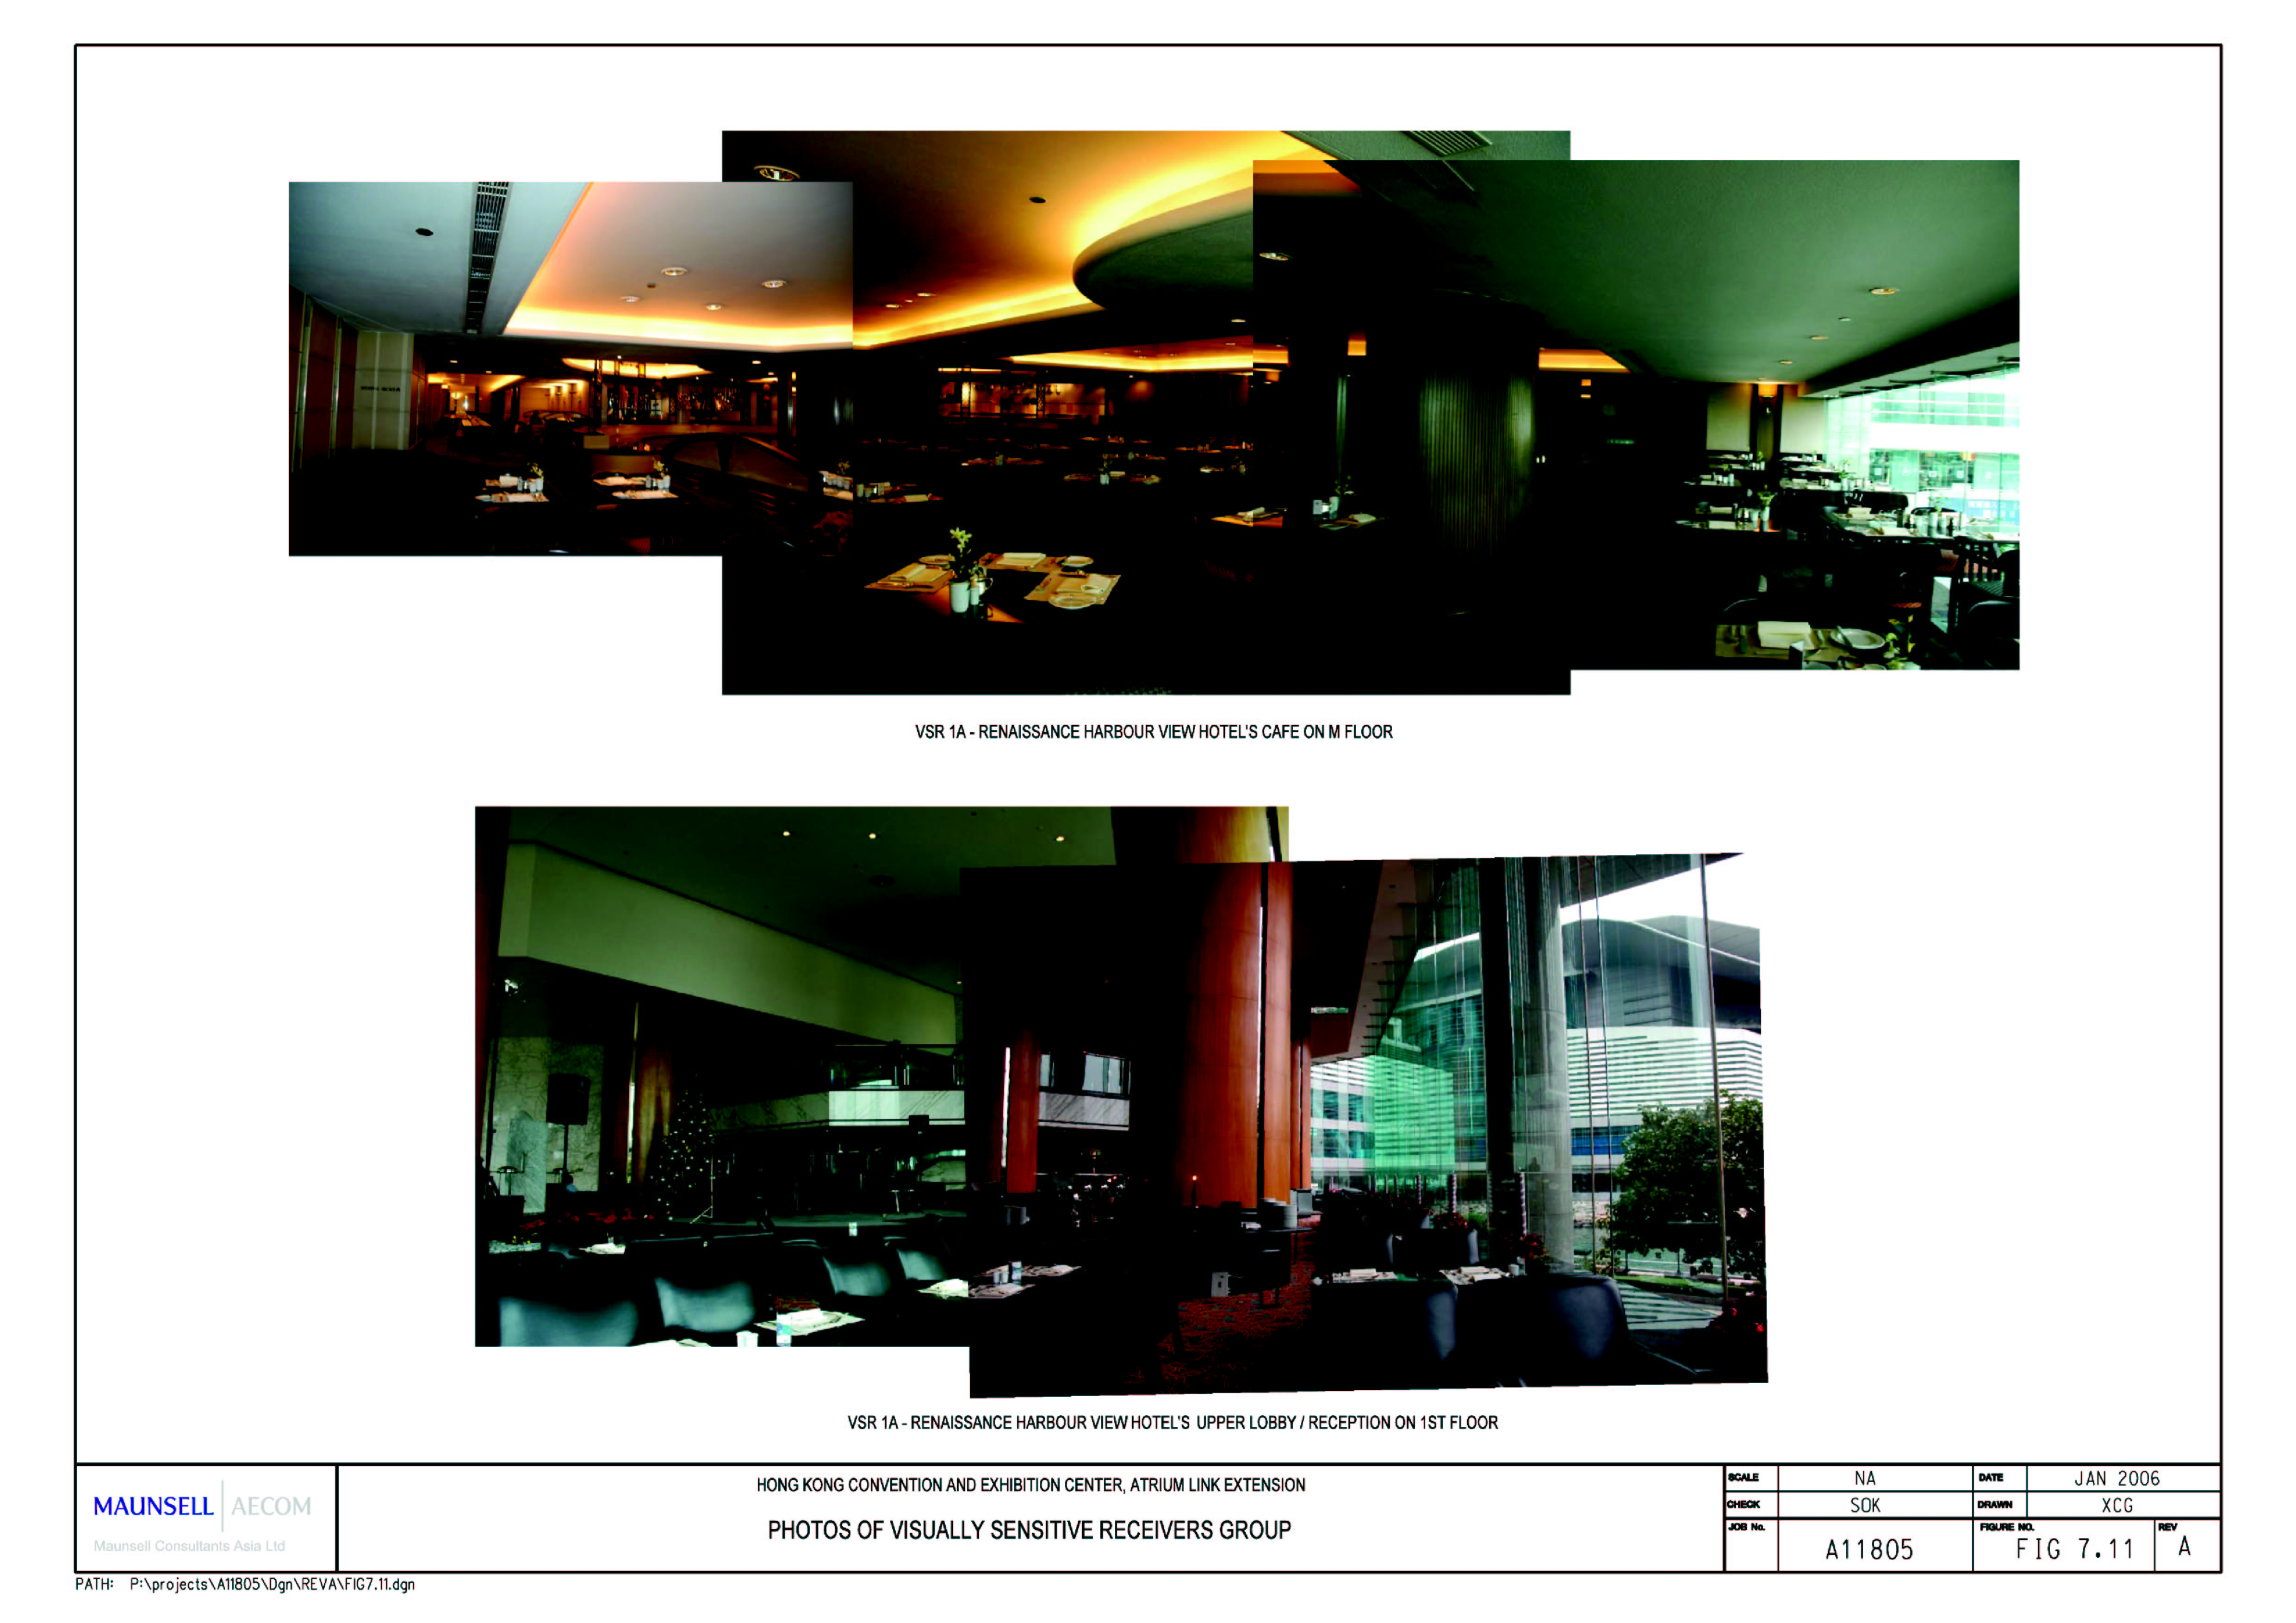
Figure 7.8 Photo of Visually Sensitive
Receivers Group
Figure 7.9 Photo of Visually Sensitive
Receivers Group
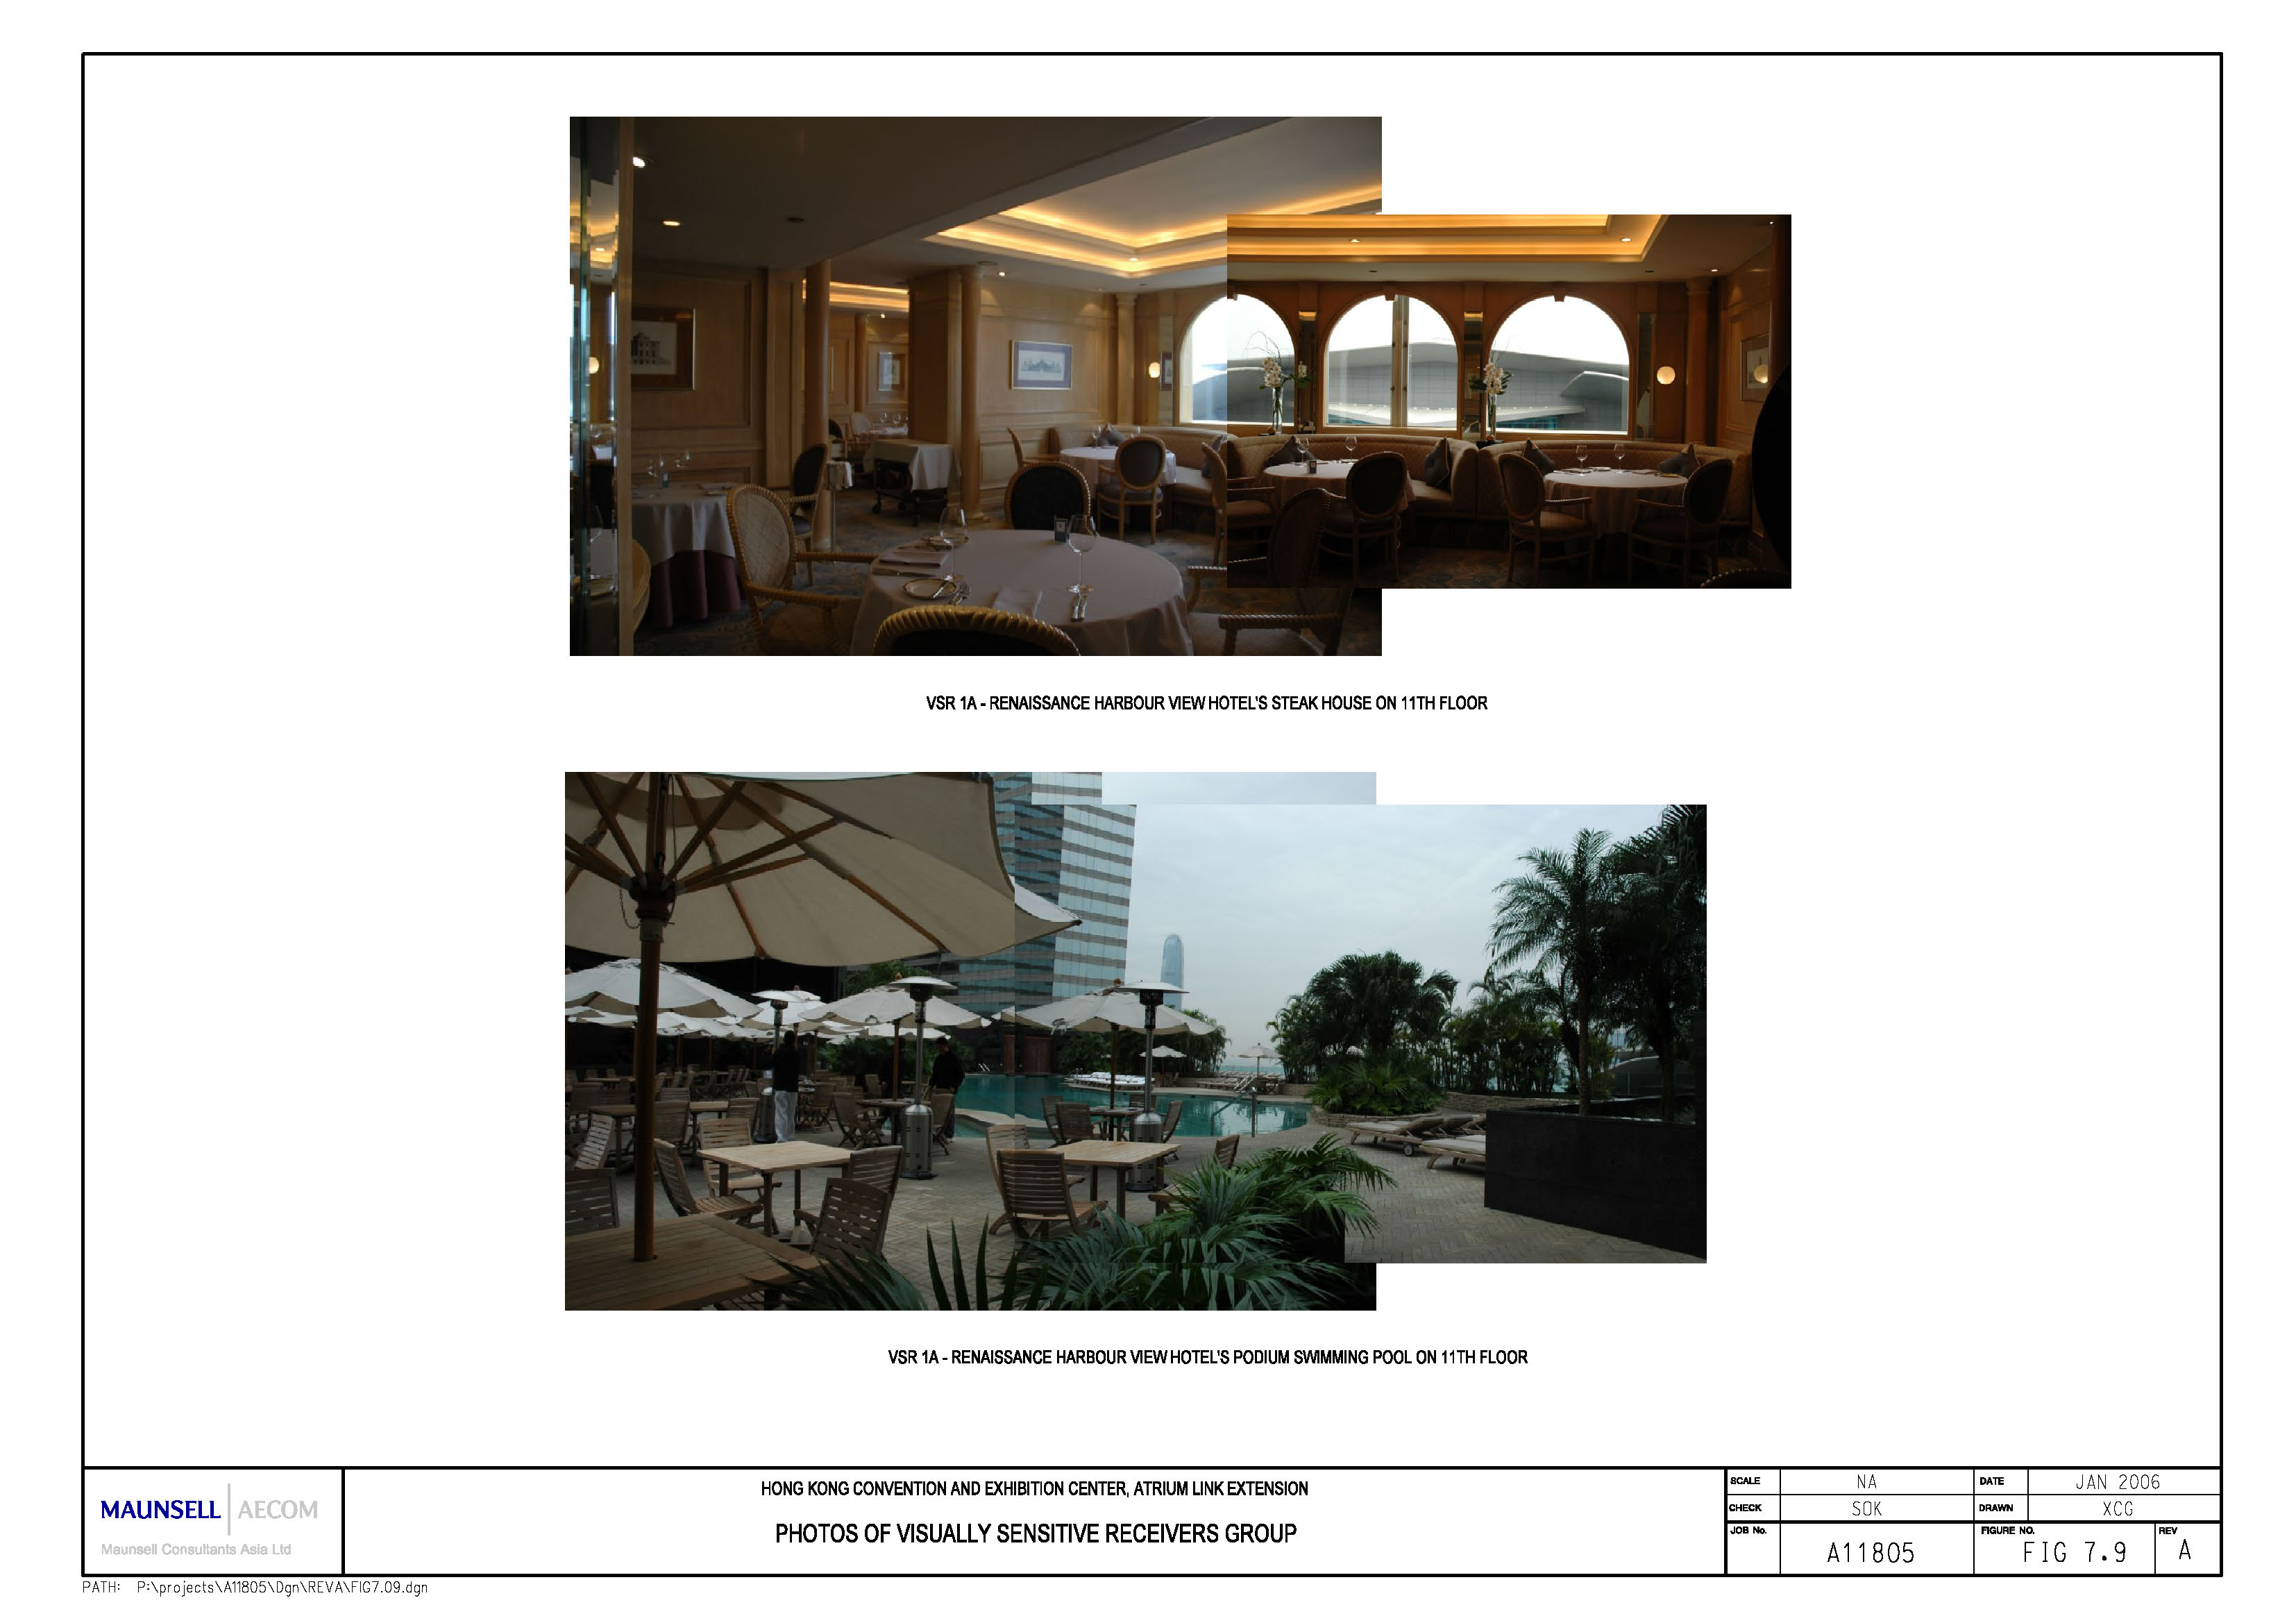
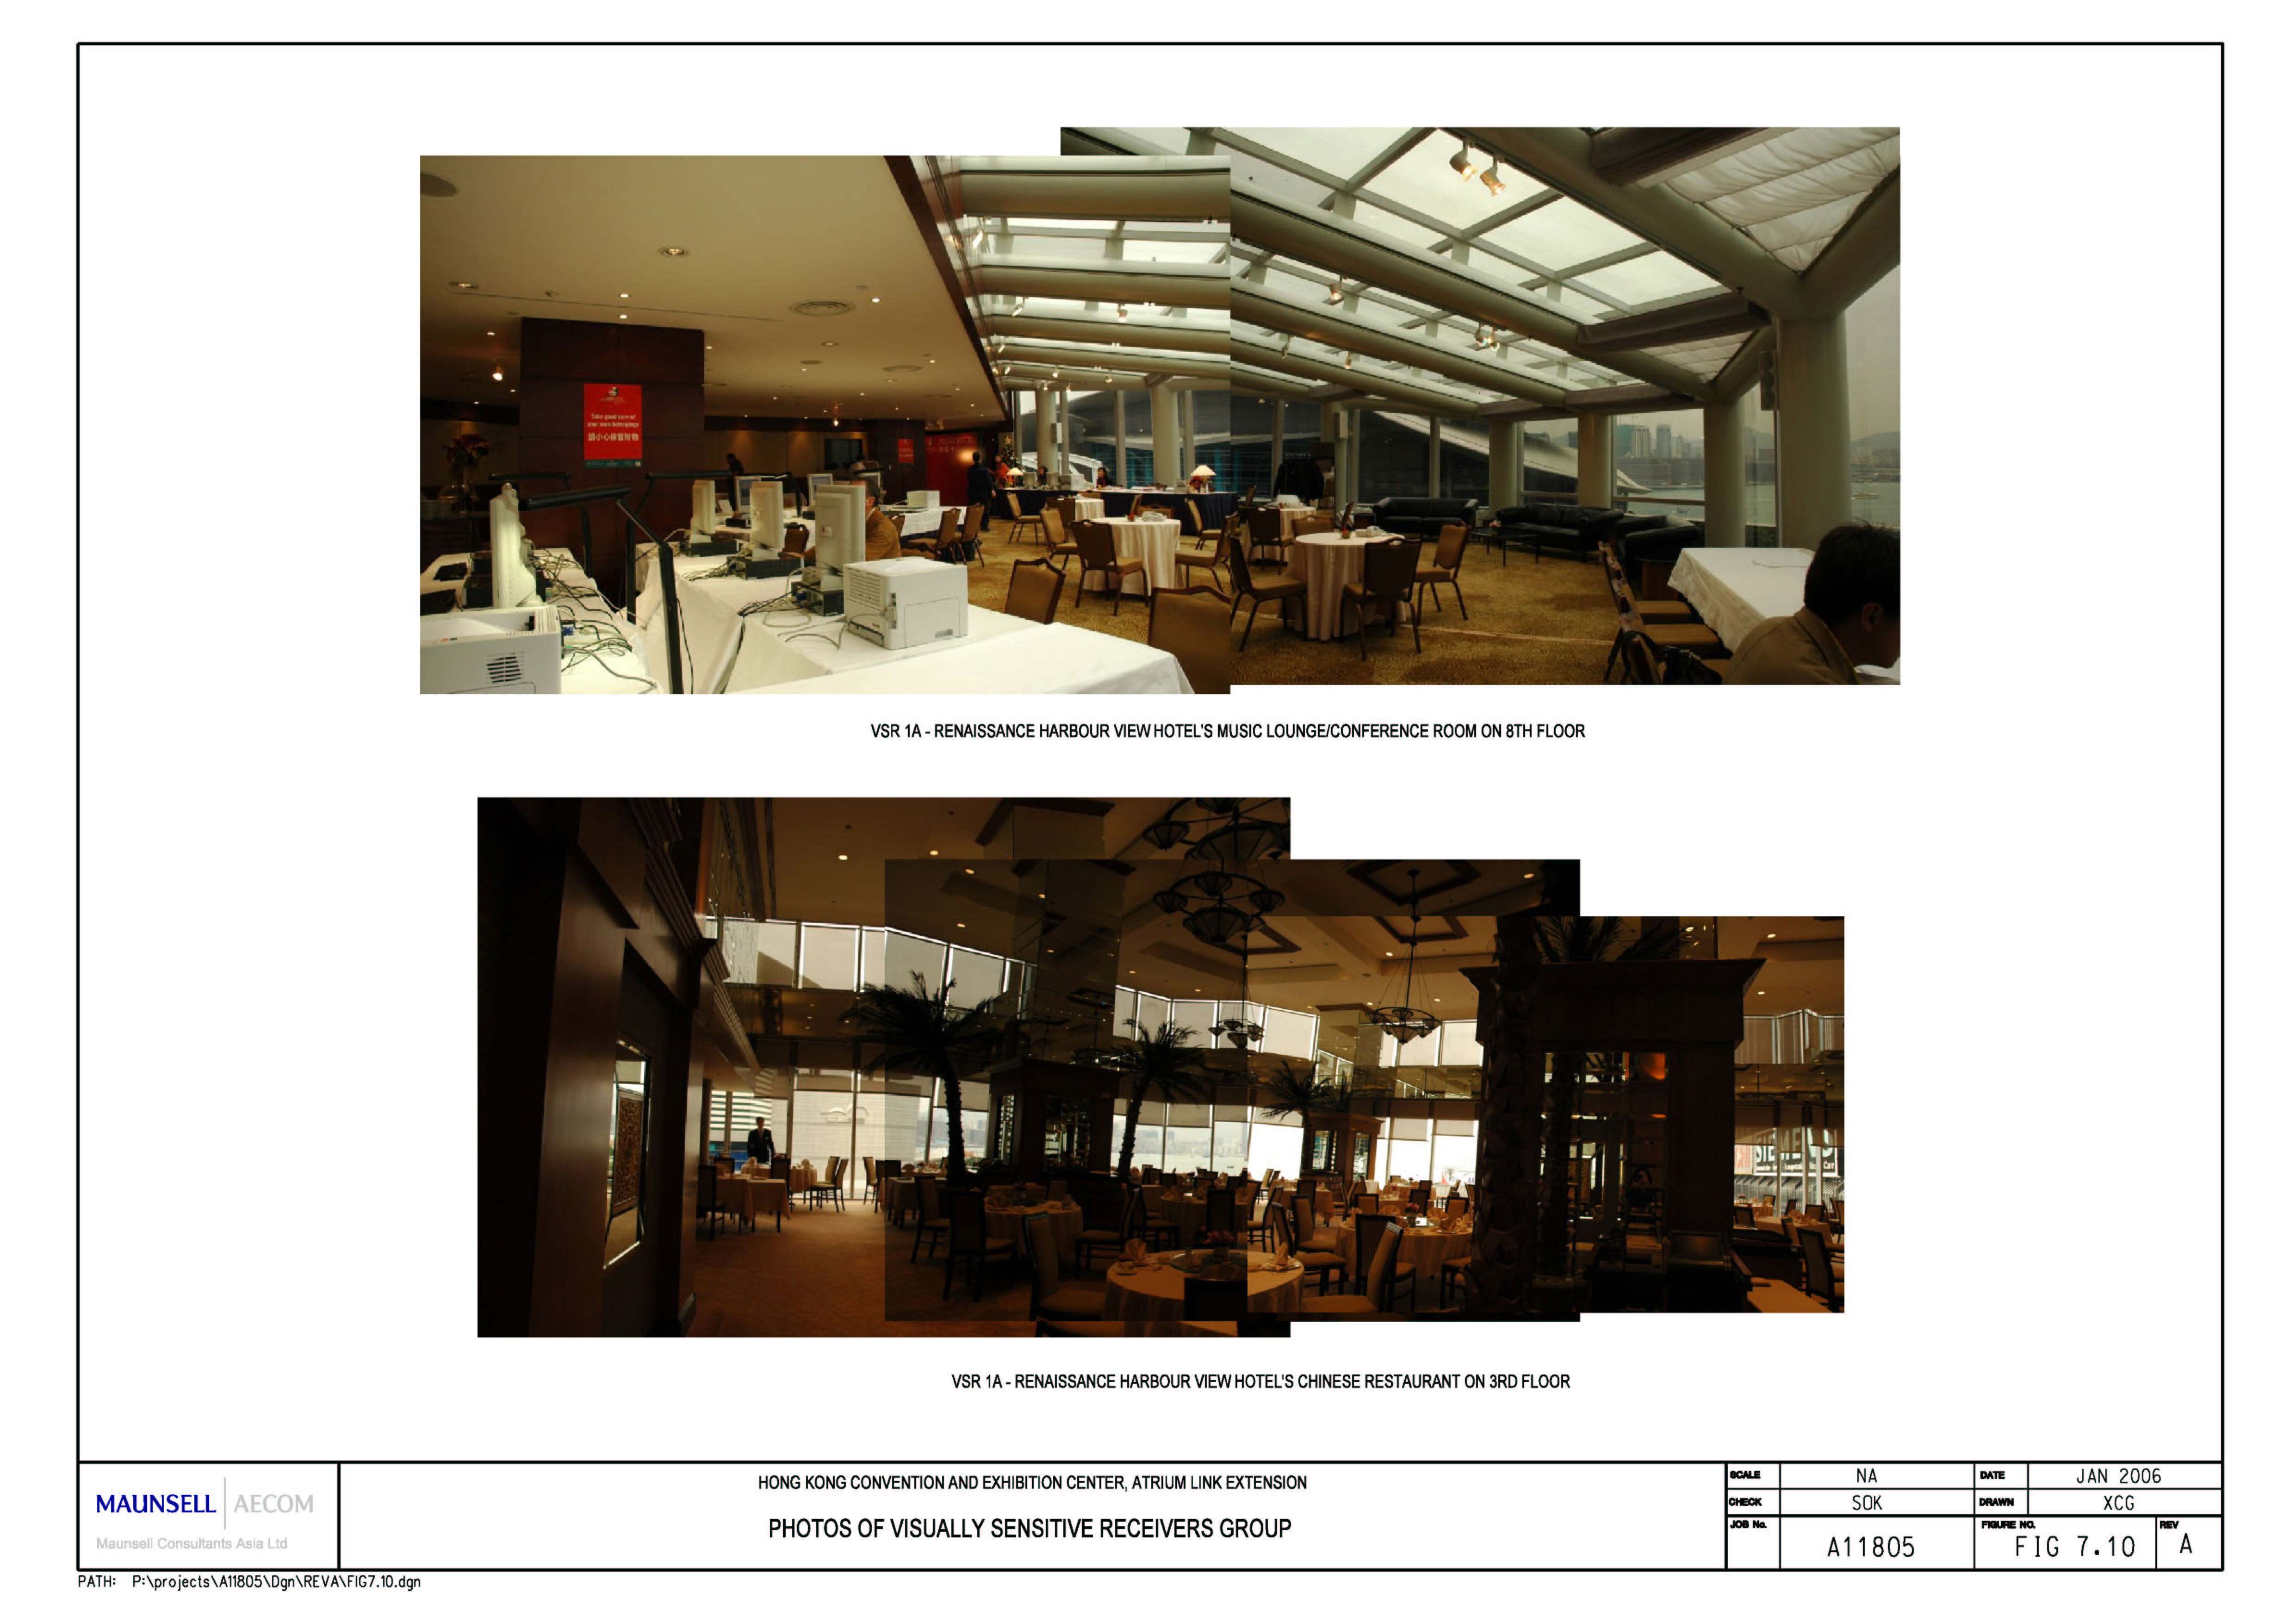
Figure 7.10 Photo of Visually Sensitive Receivers
Group
Figure 7.11 Photo of Visually Sensitive Receivers
Group
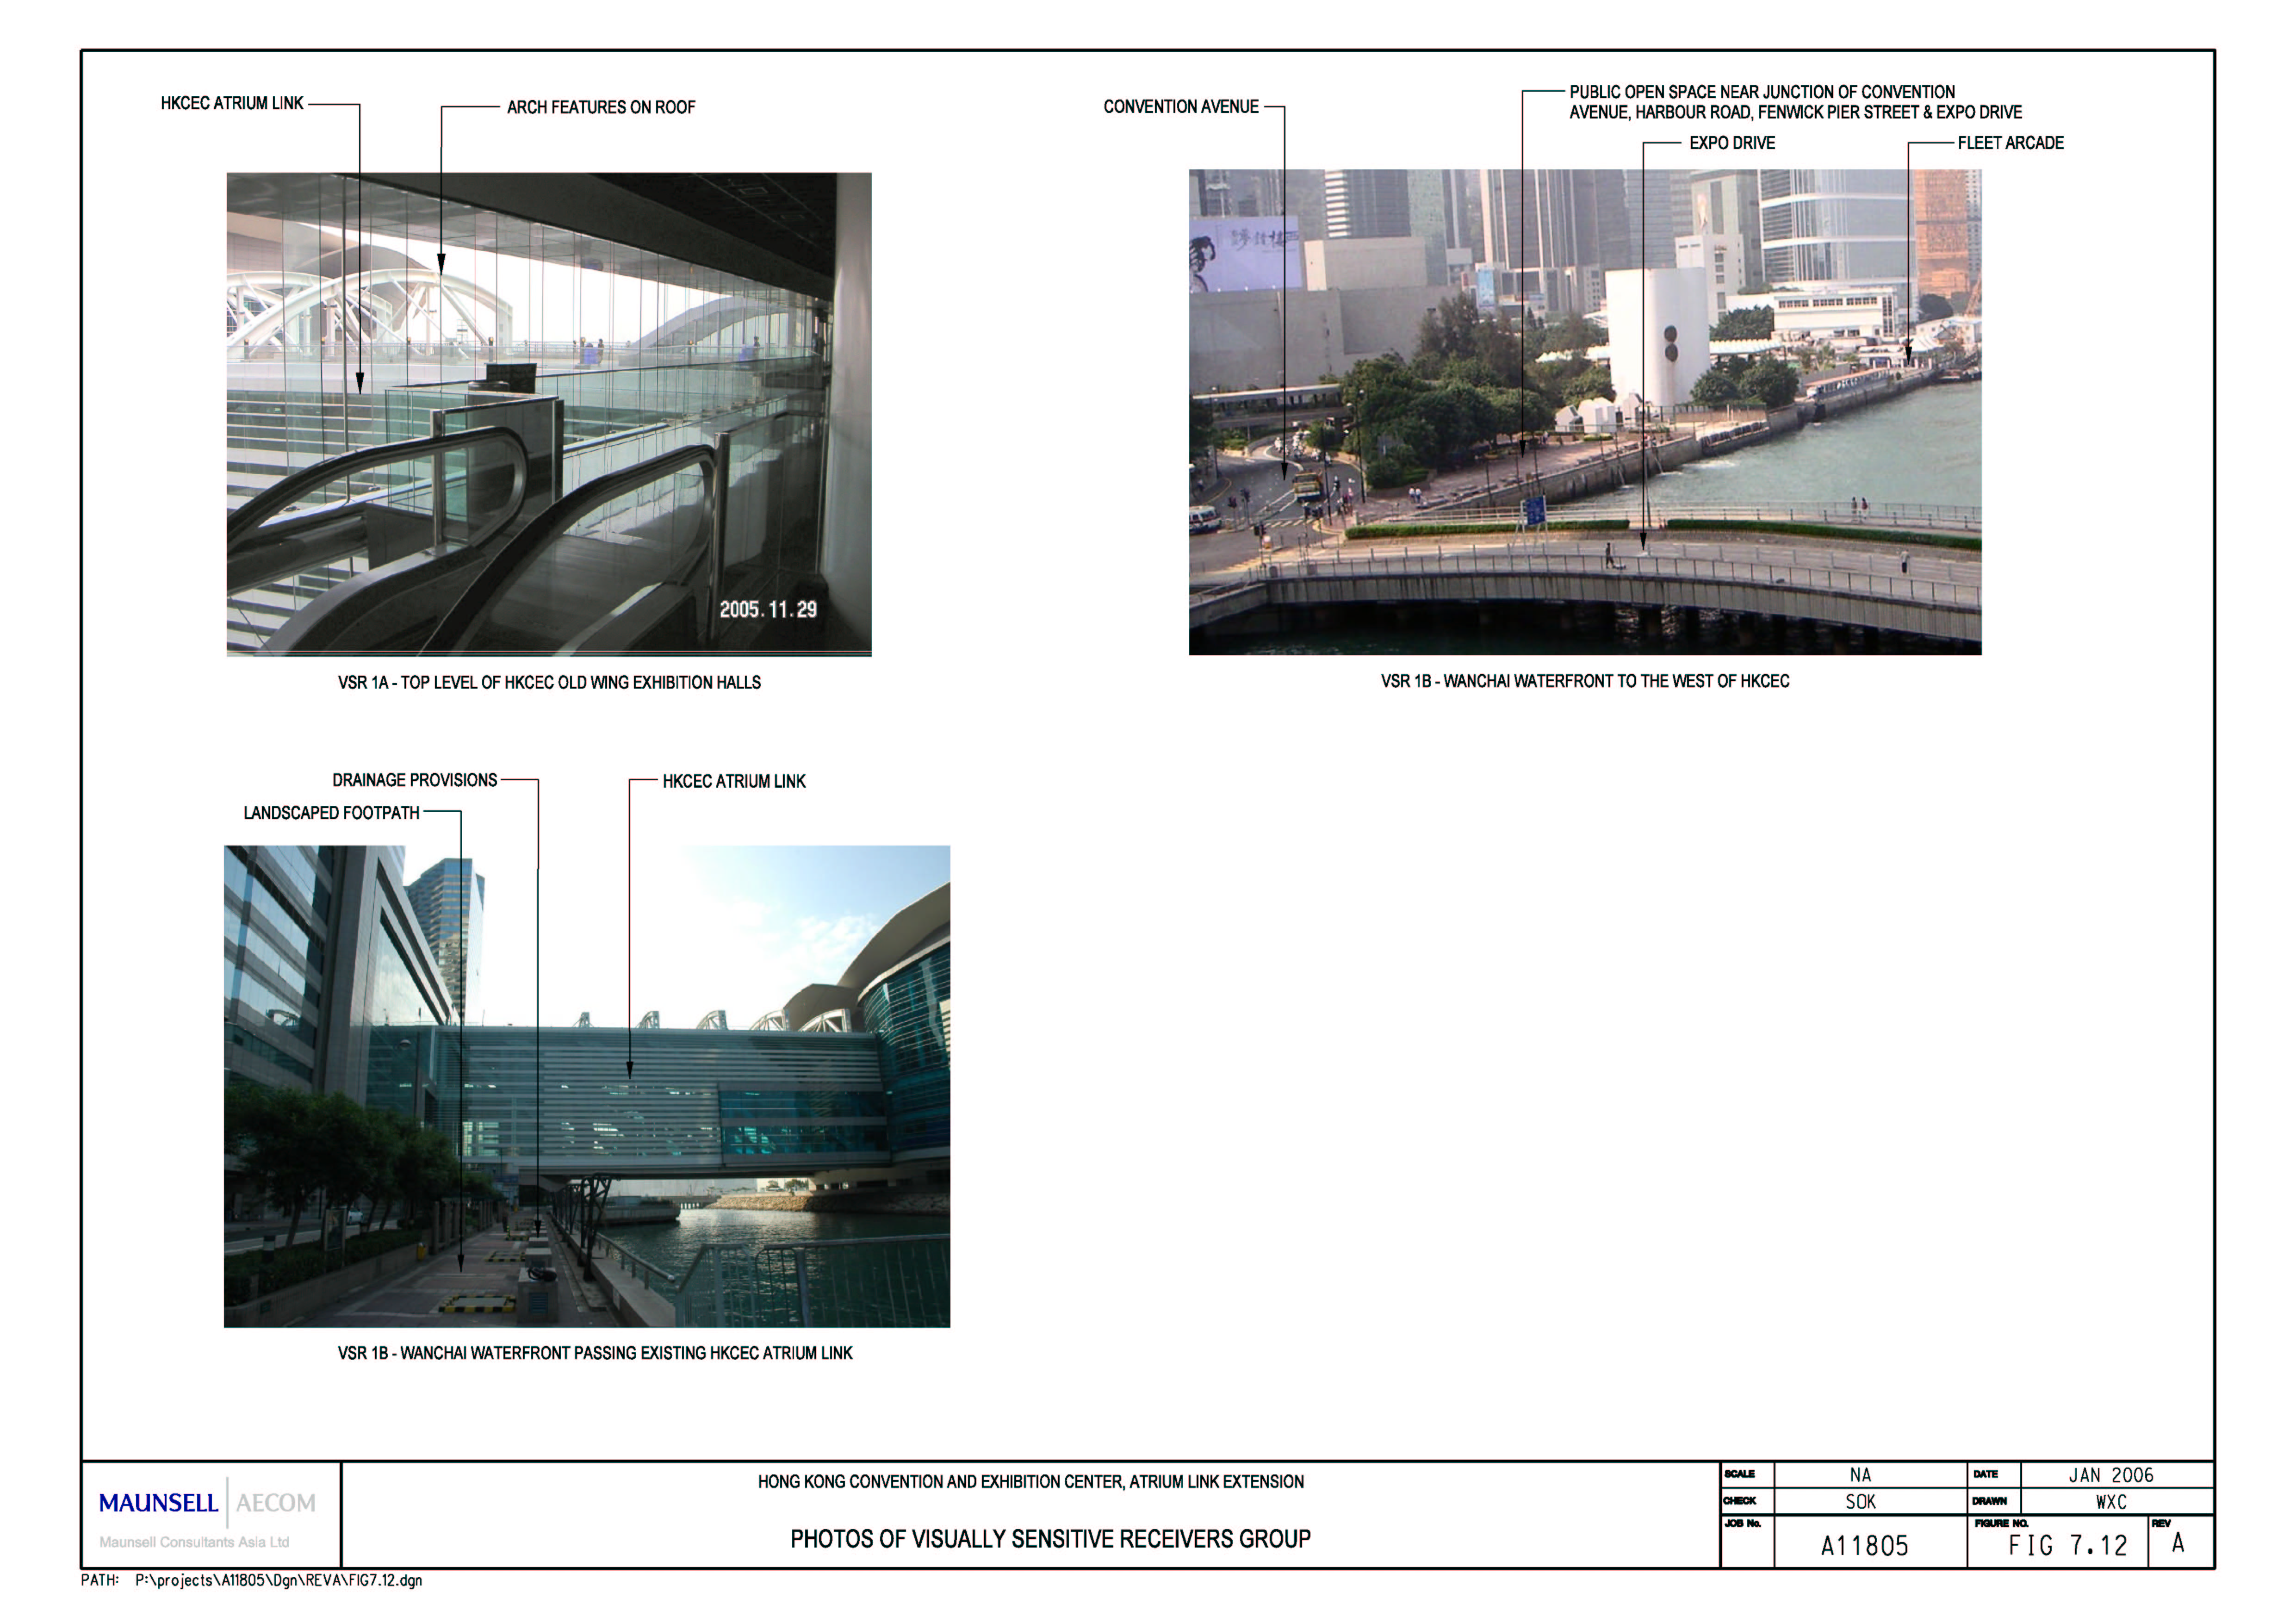
Figure 7.12 Photo of Visually Sensitive Receivers
Group
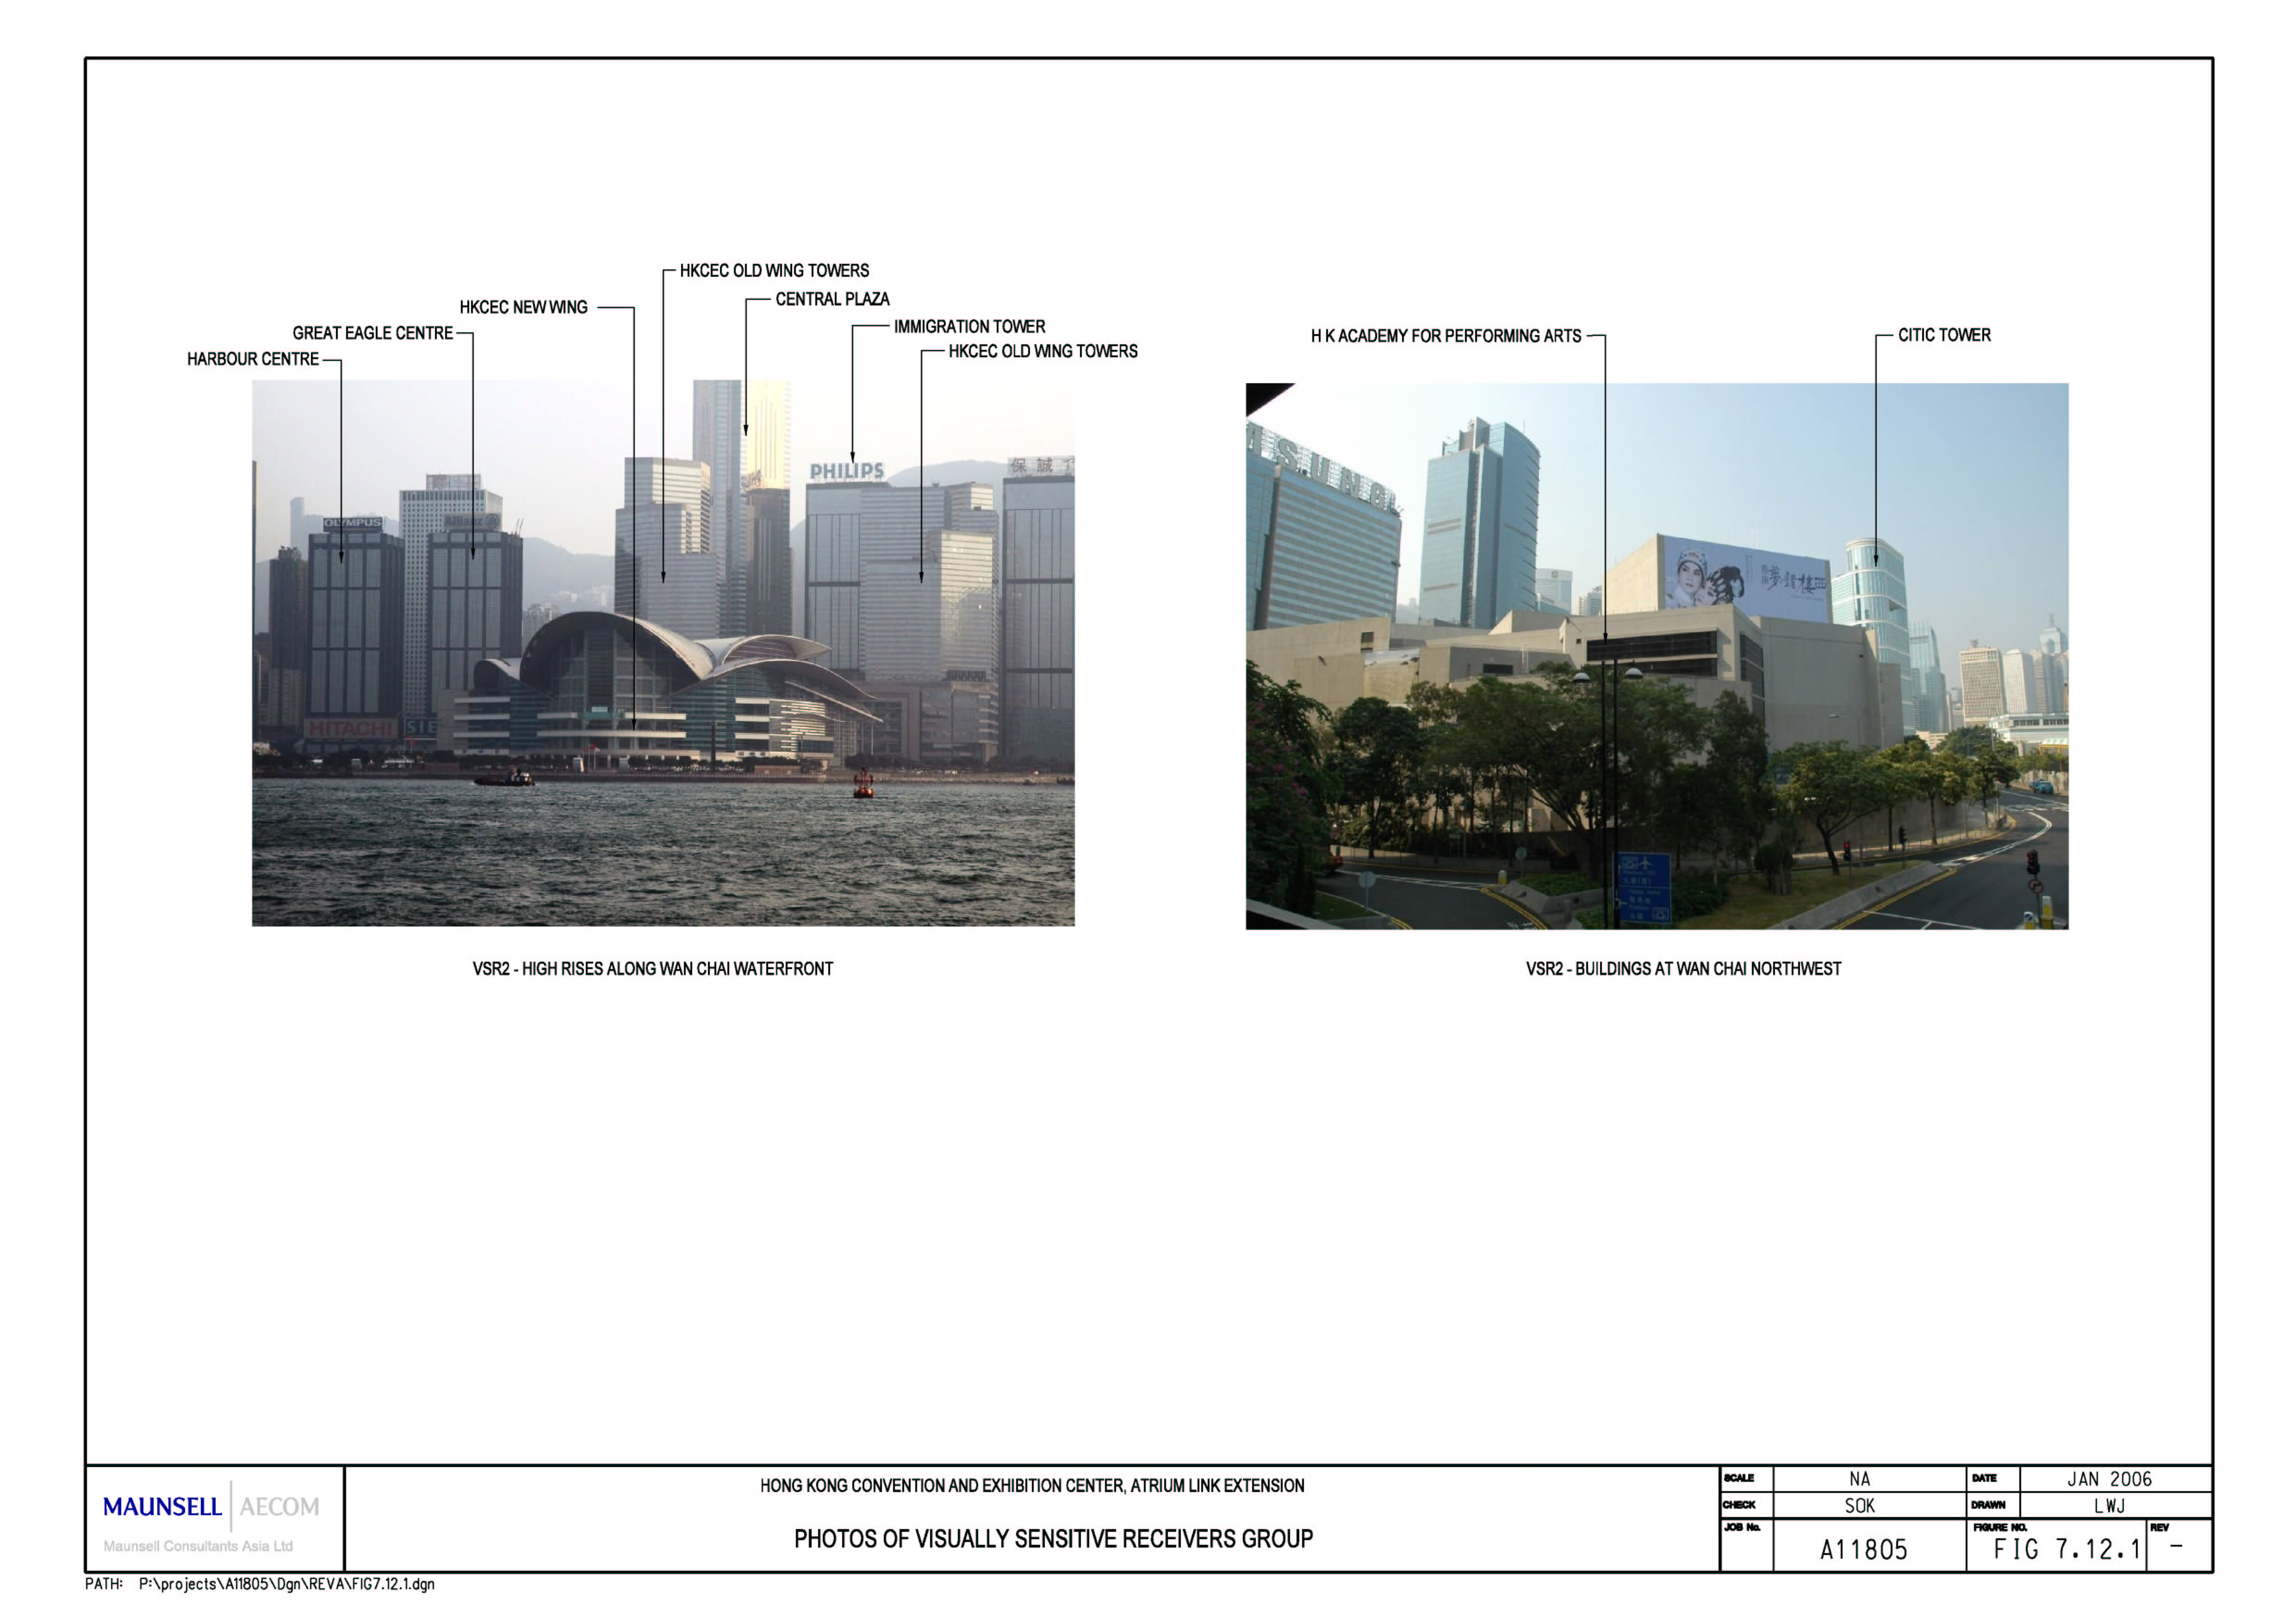
Figure
7.12.1 Photo of Visually Sensitive
Receivers Group
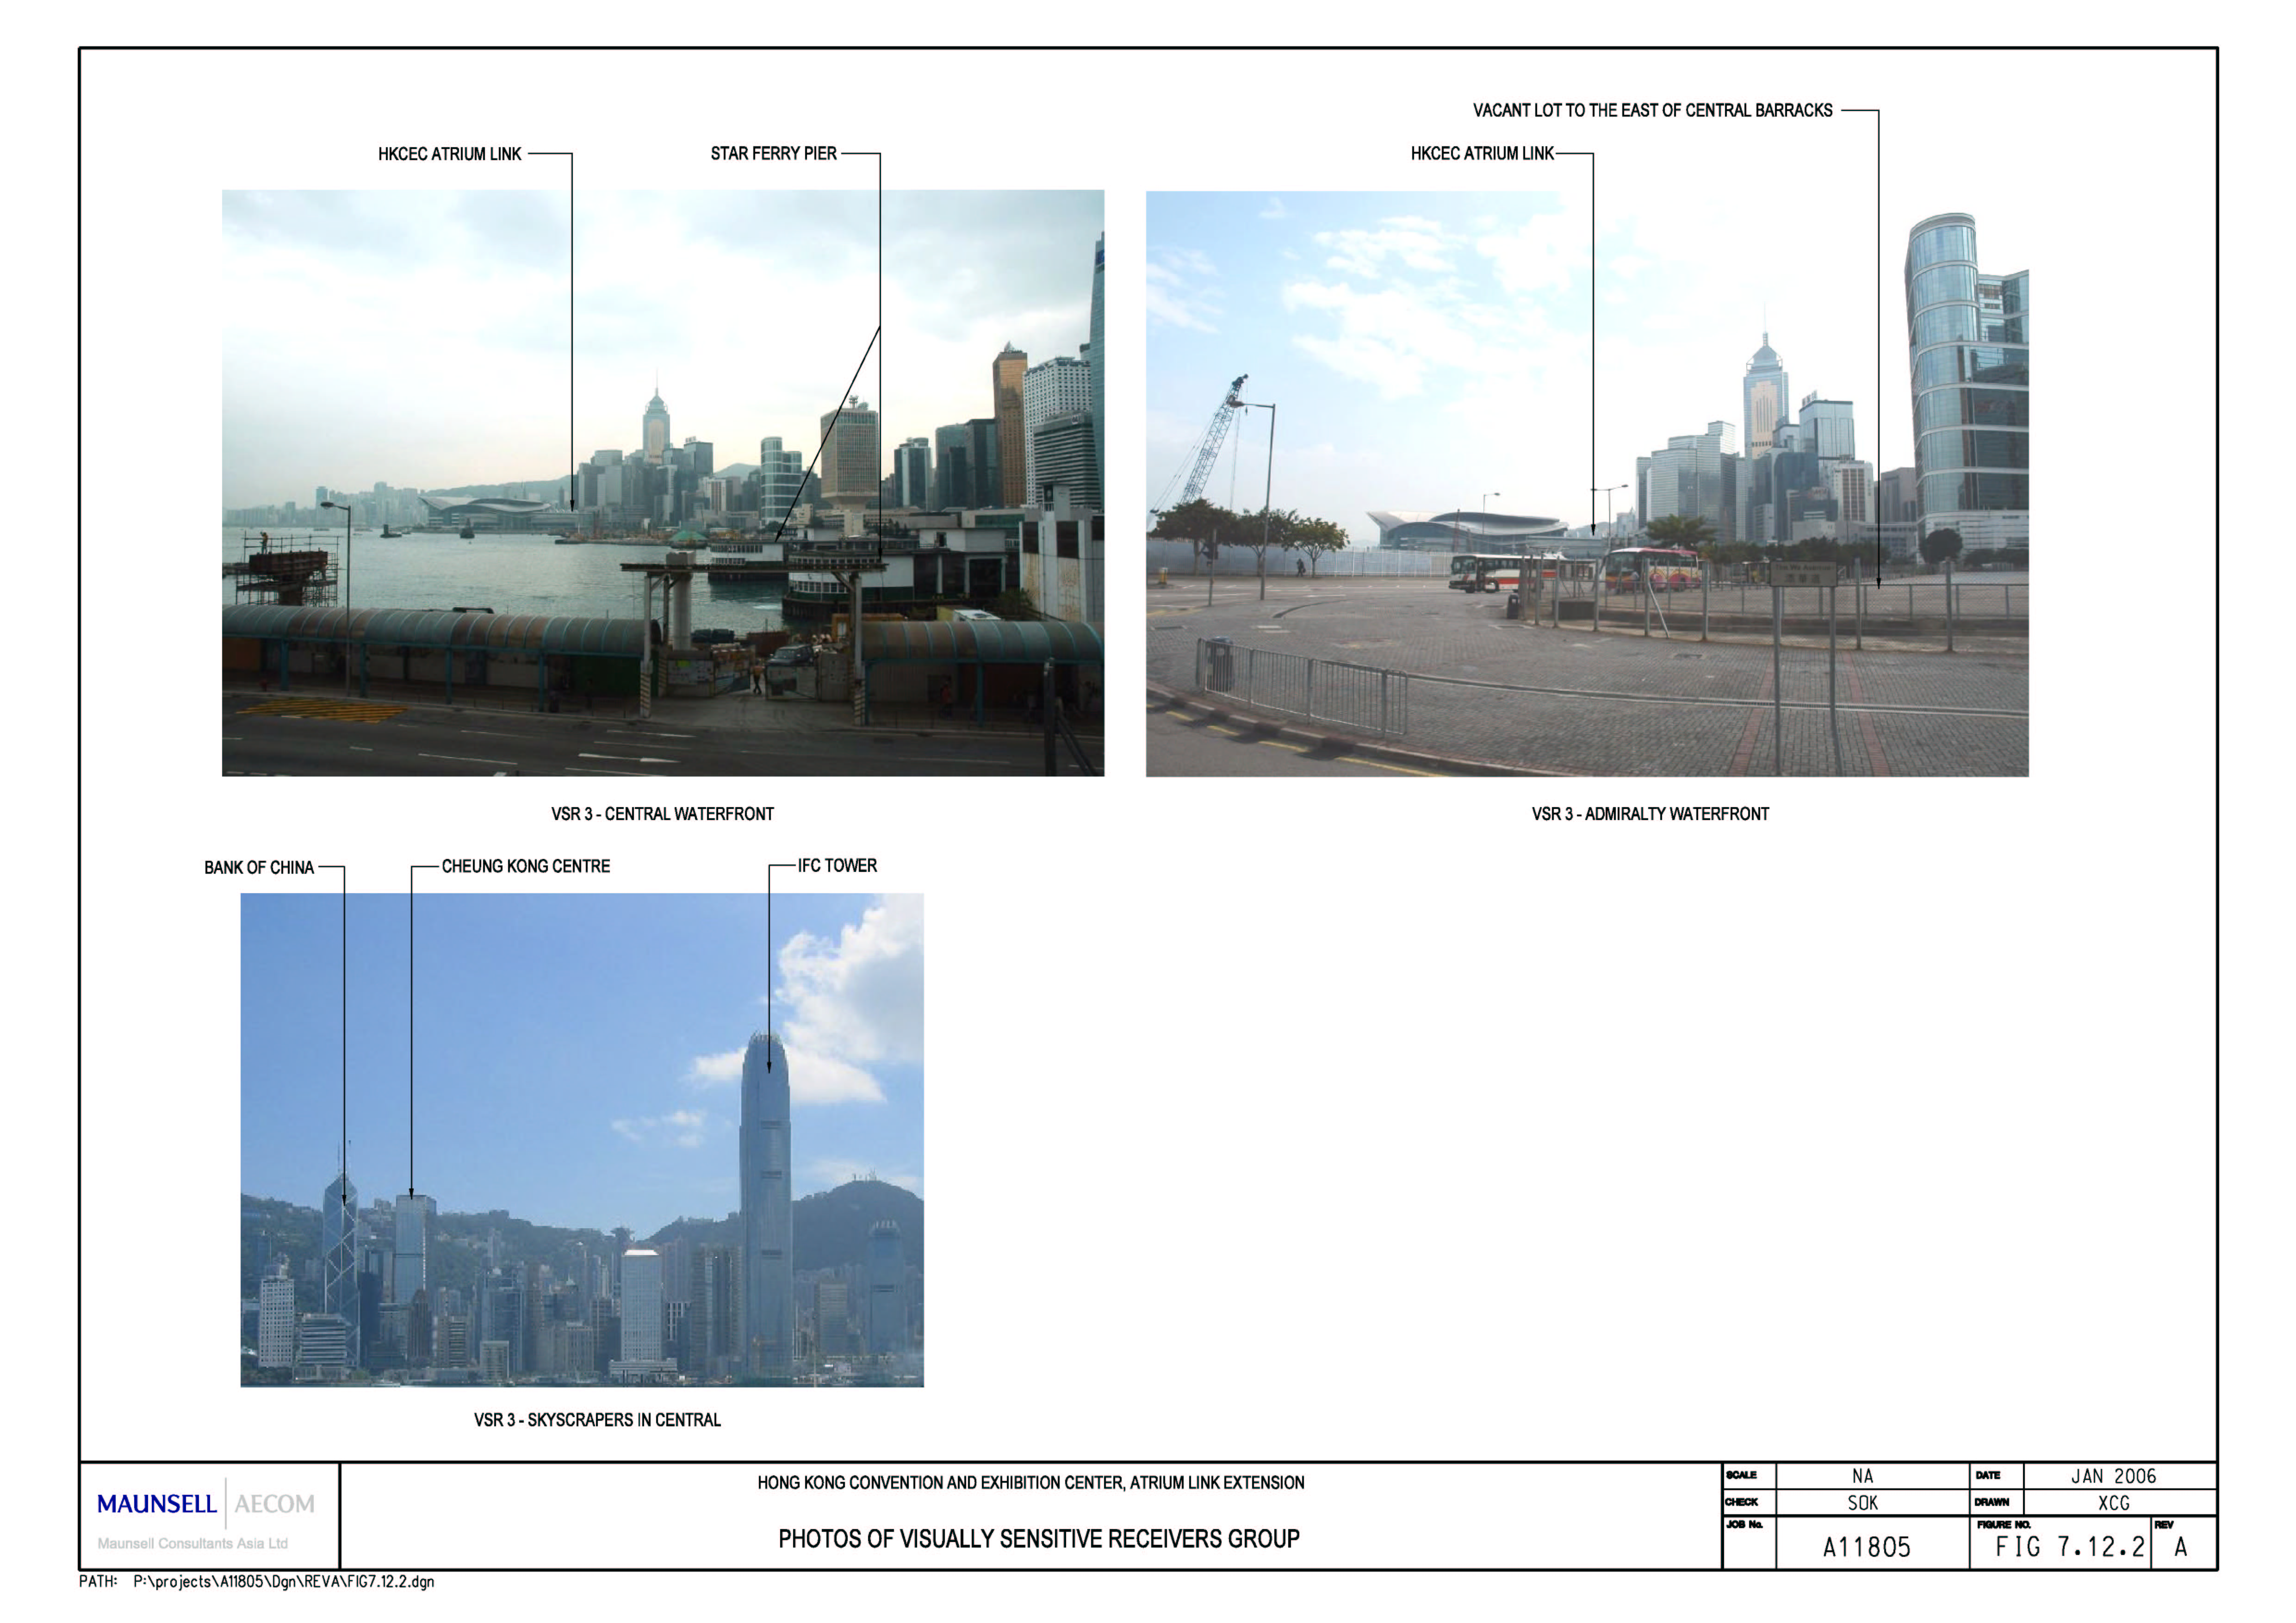
Figure
7.12.2 Photo of Visually Sensitive
Receivers Group
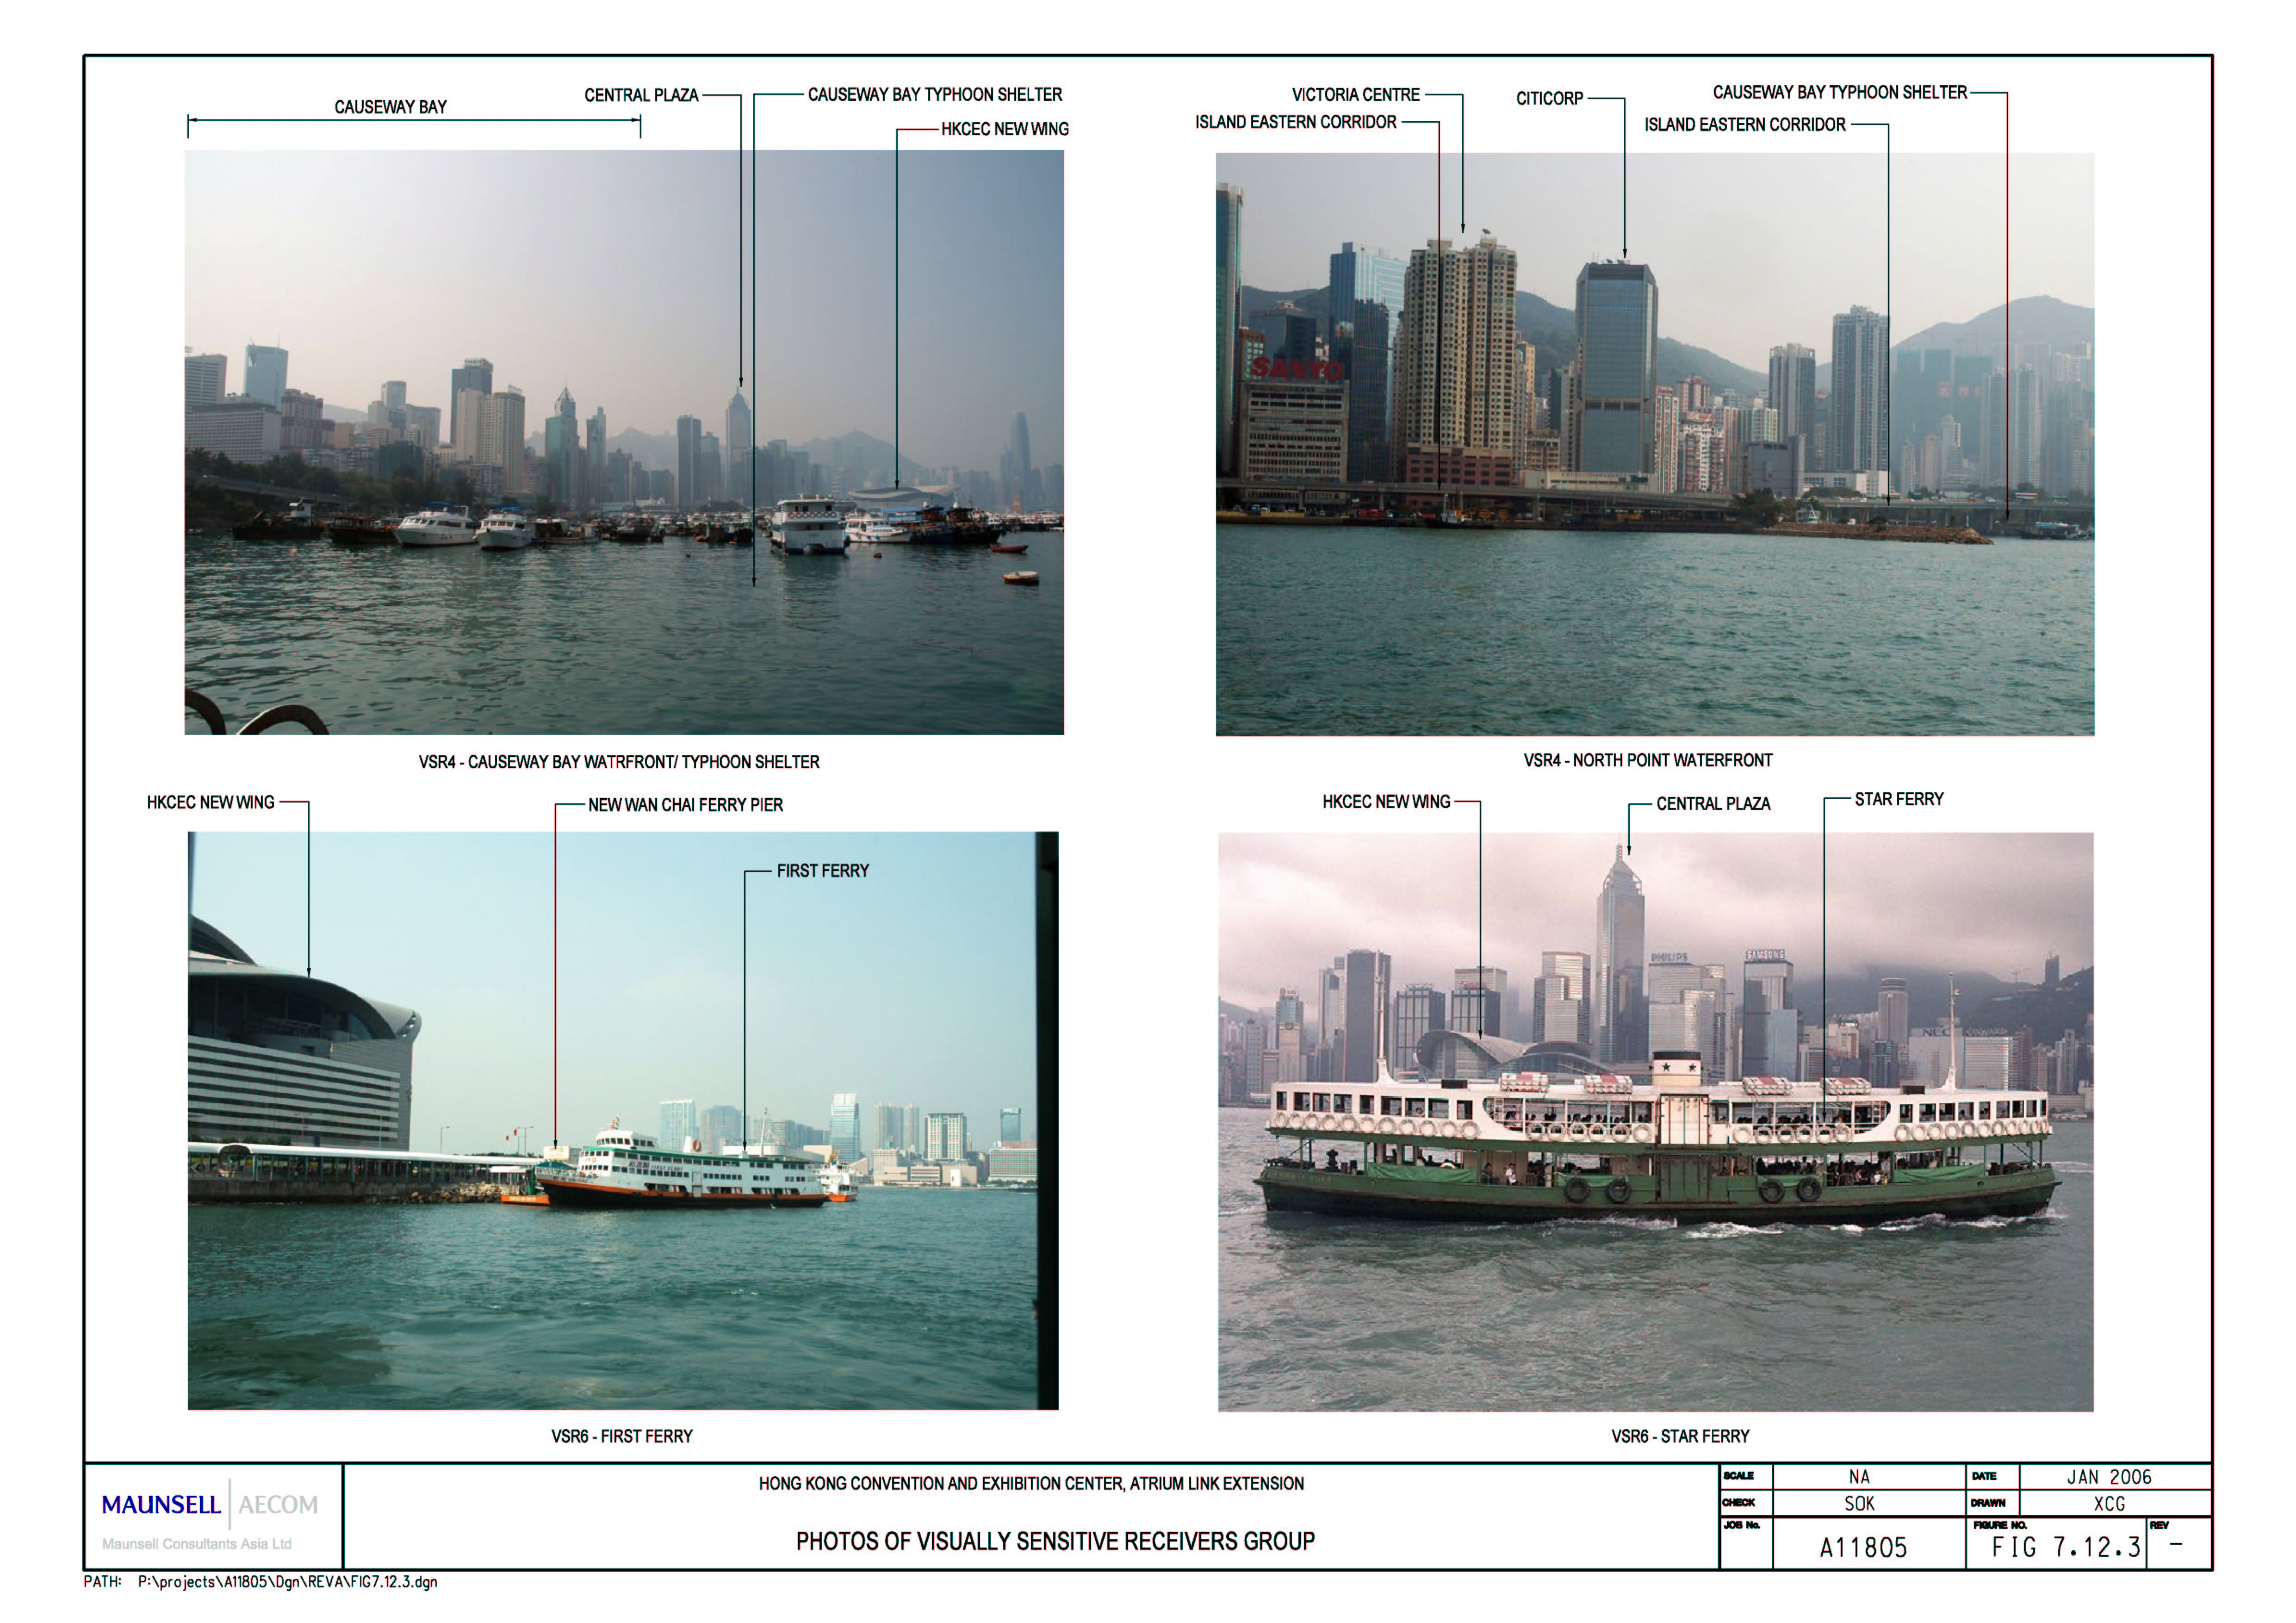
Figure
7.12.3 Photo of Visually Sensitive
Receivers Group
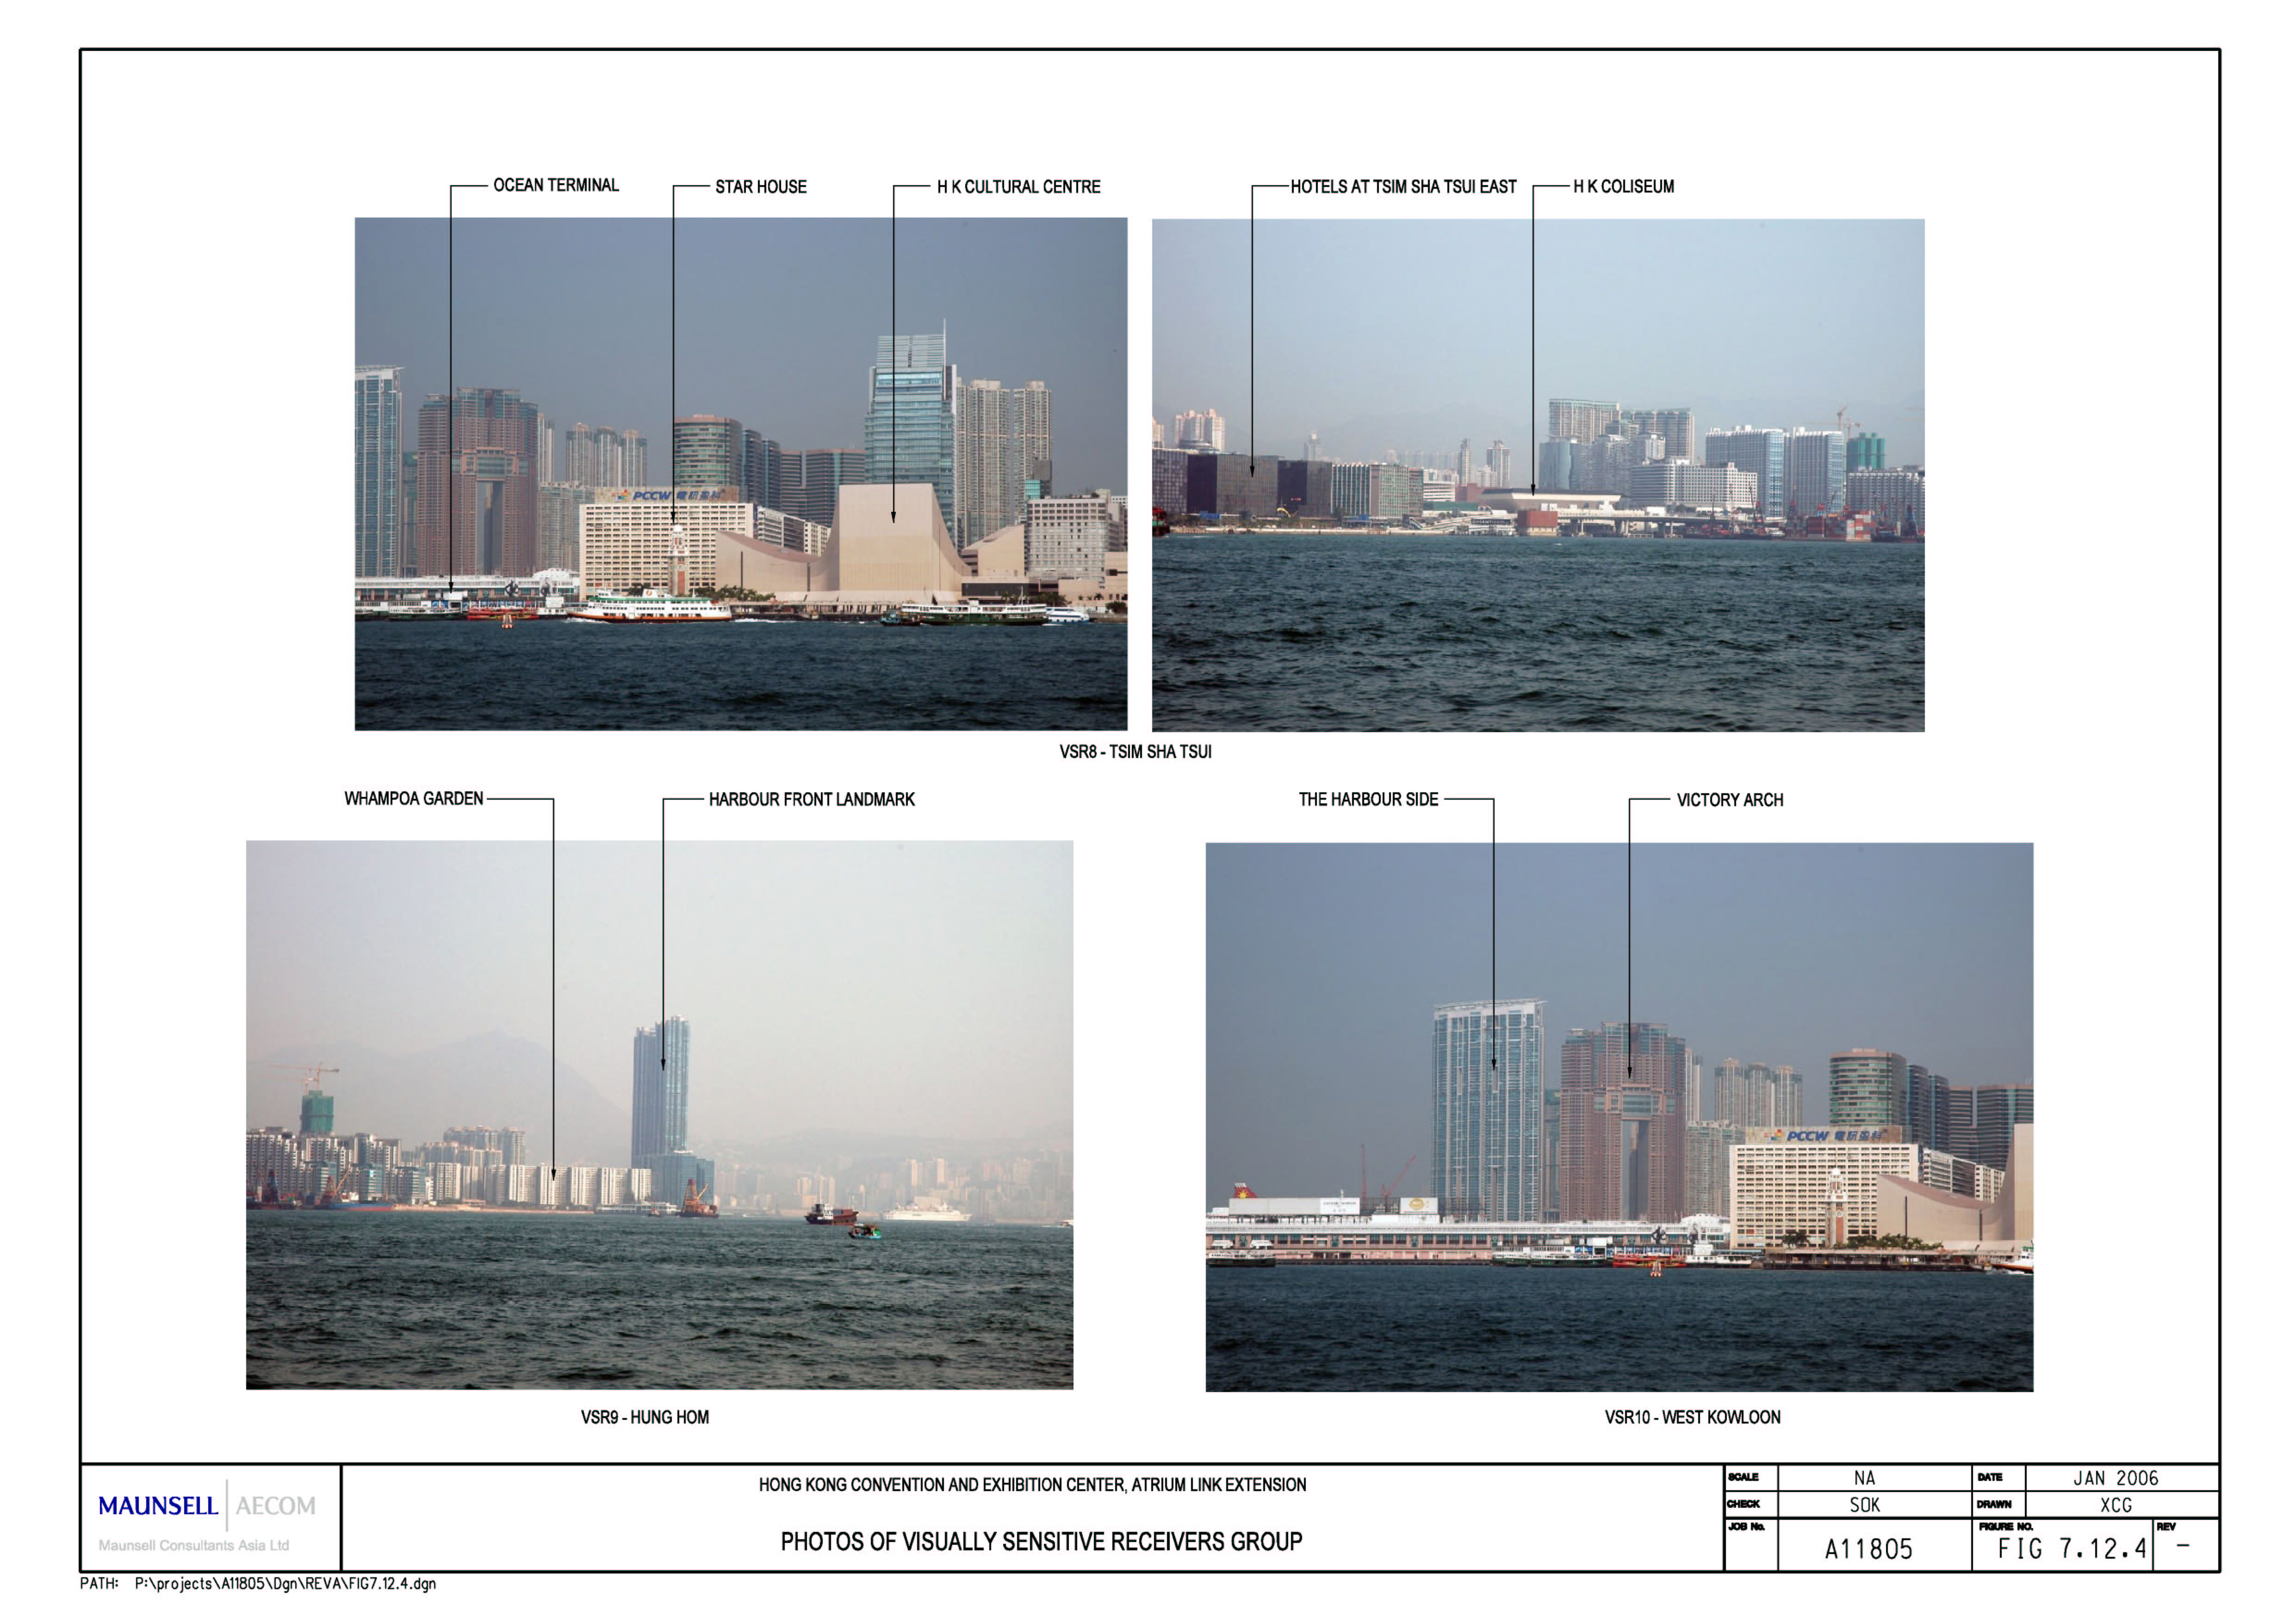
Figure
7.12.4 Photo of Visually Sensitive
Receivers Group
Figure 7.13 Views from Visually Sensitive
Receivers to HKCEC
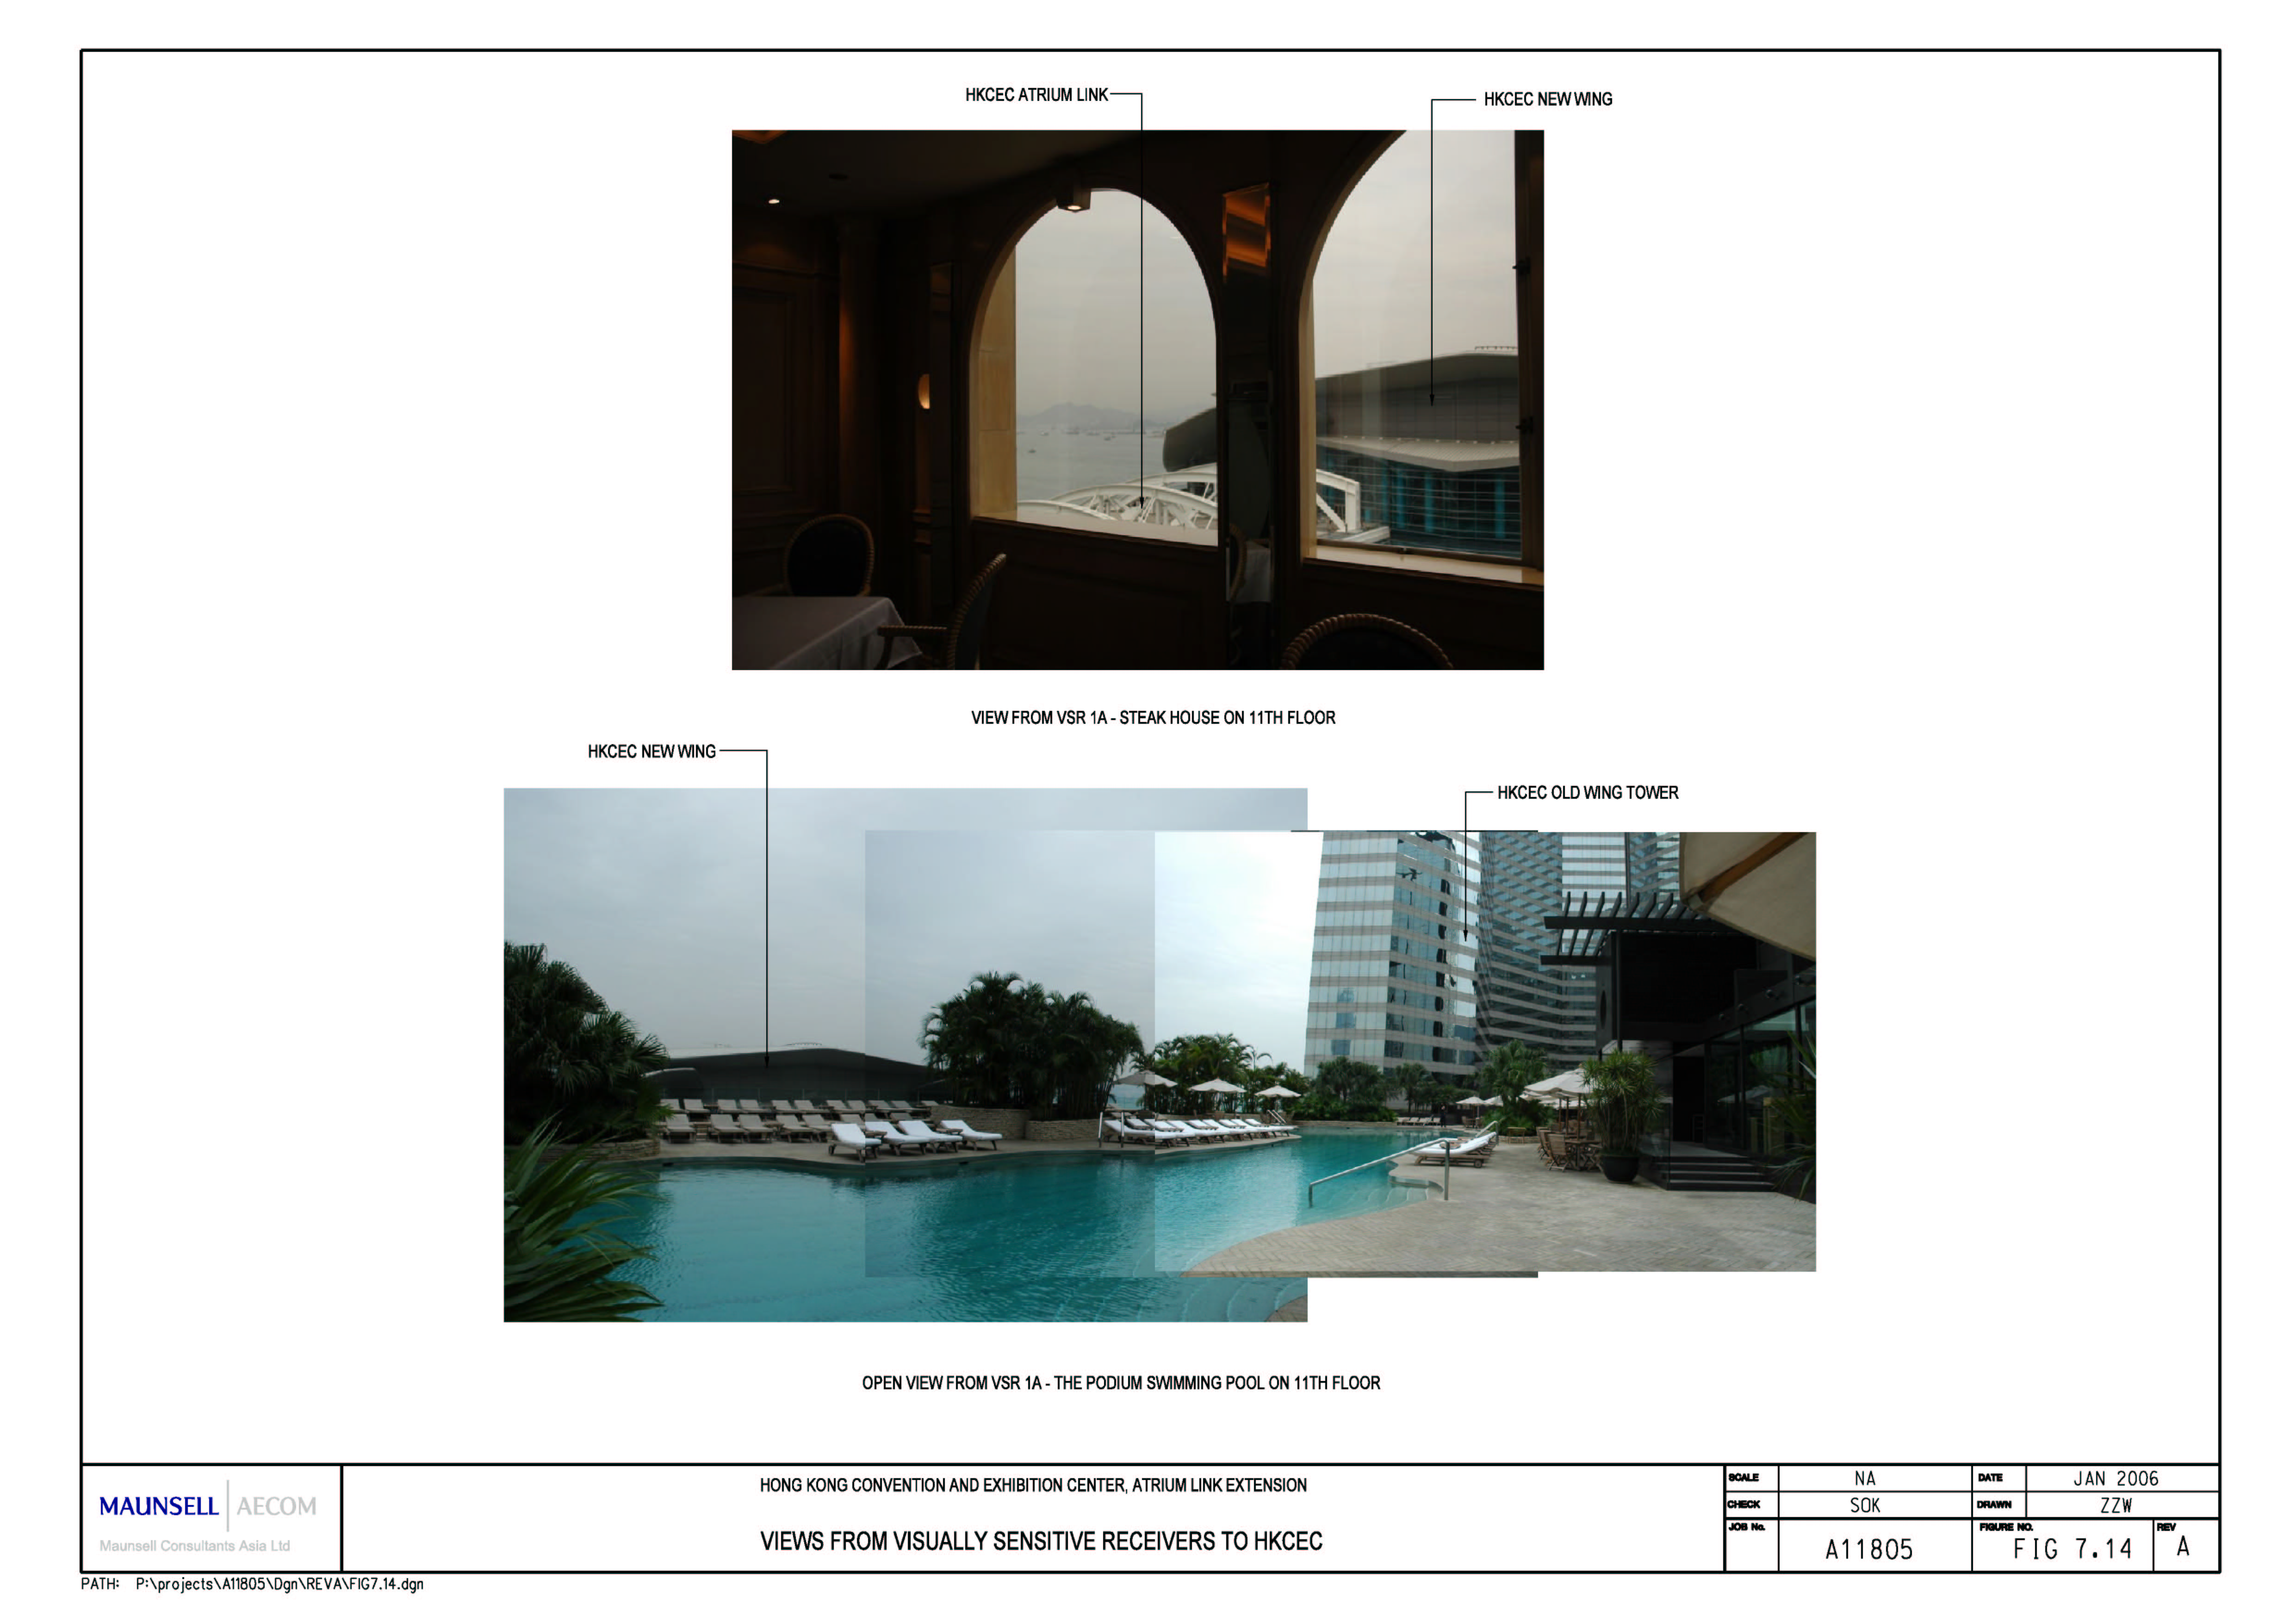
Figure 7.14 Views from Visually Sensitive
Receivers to HKCEC
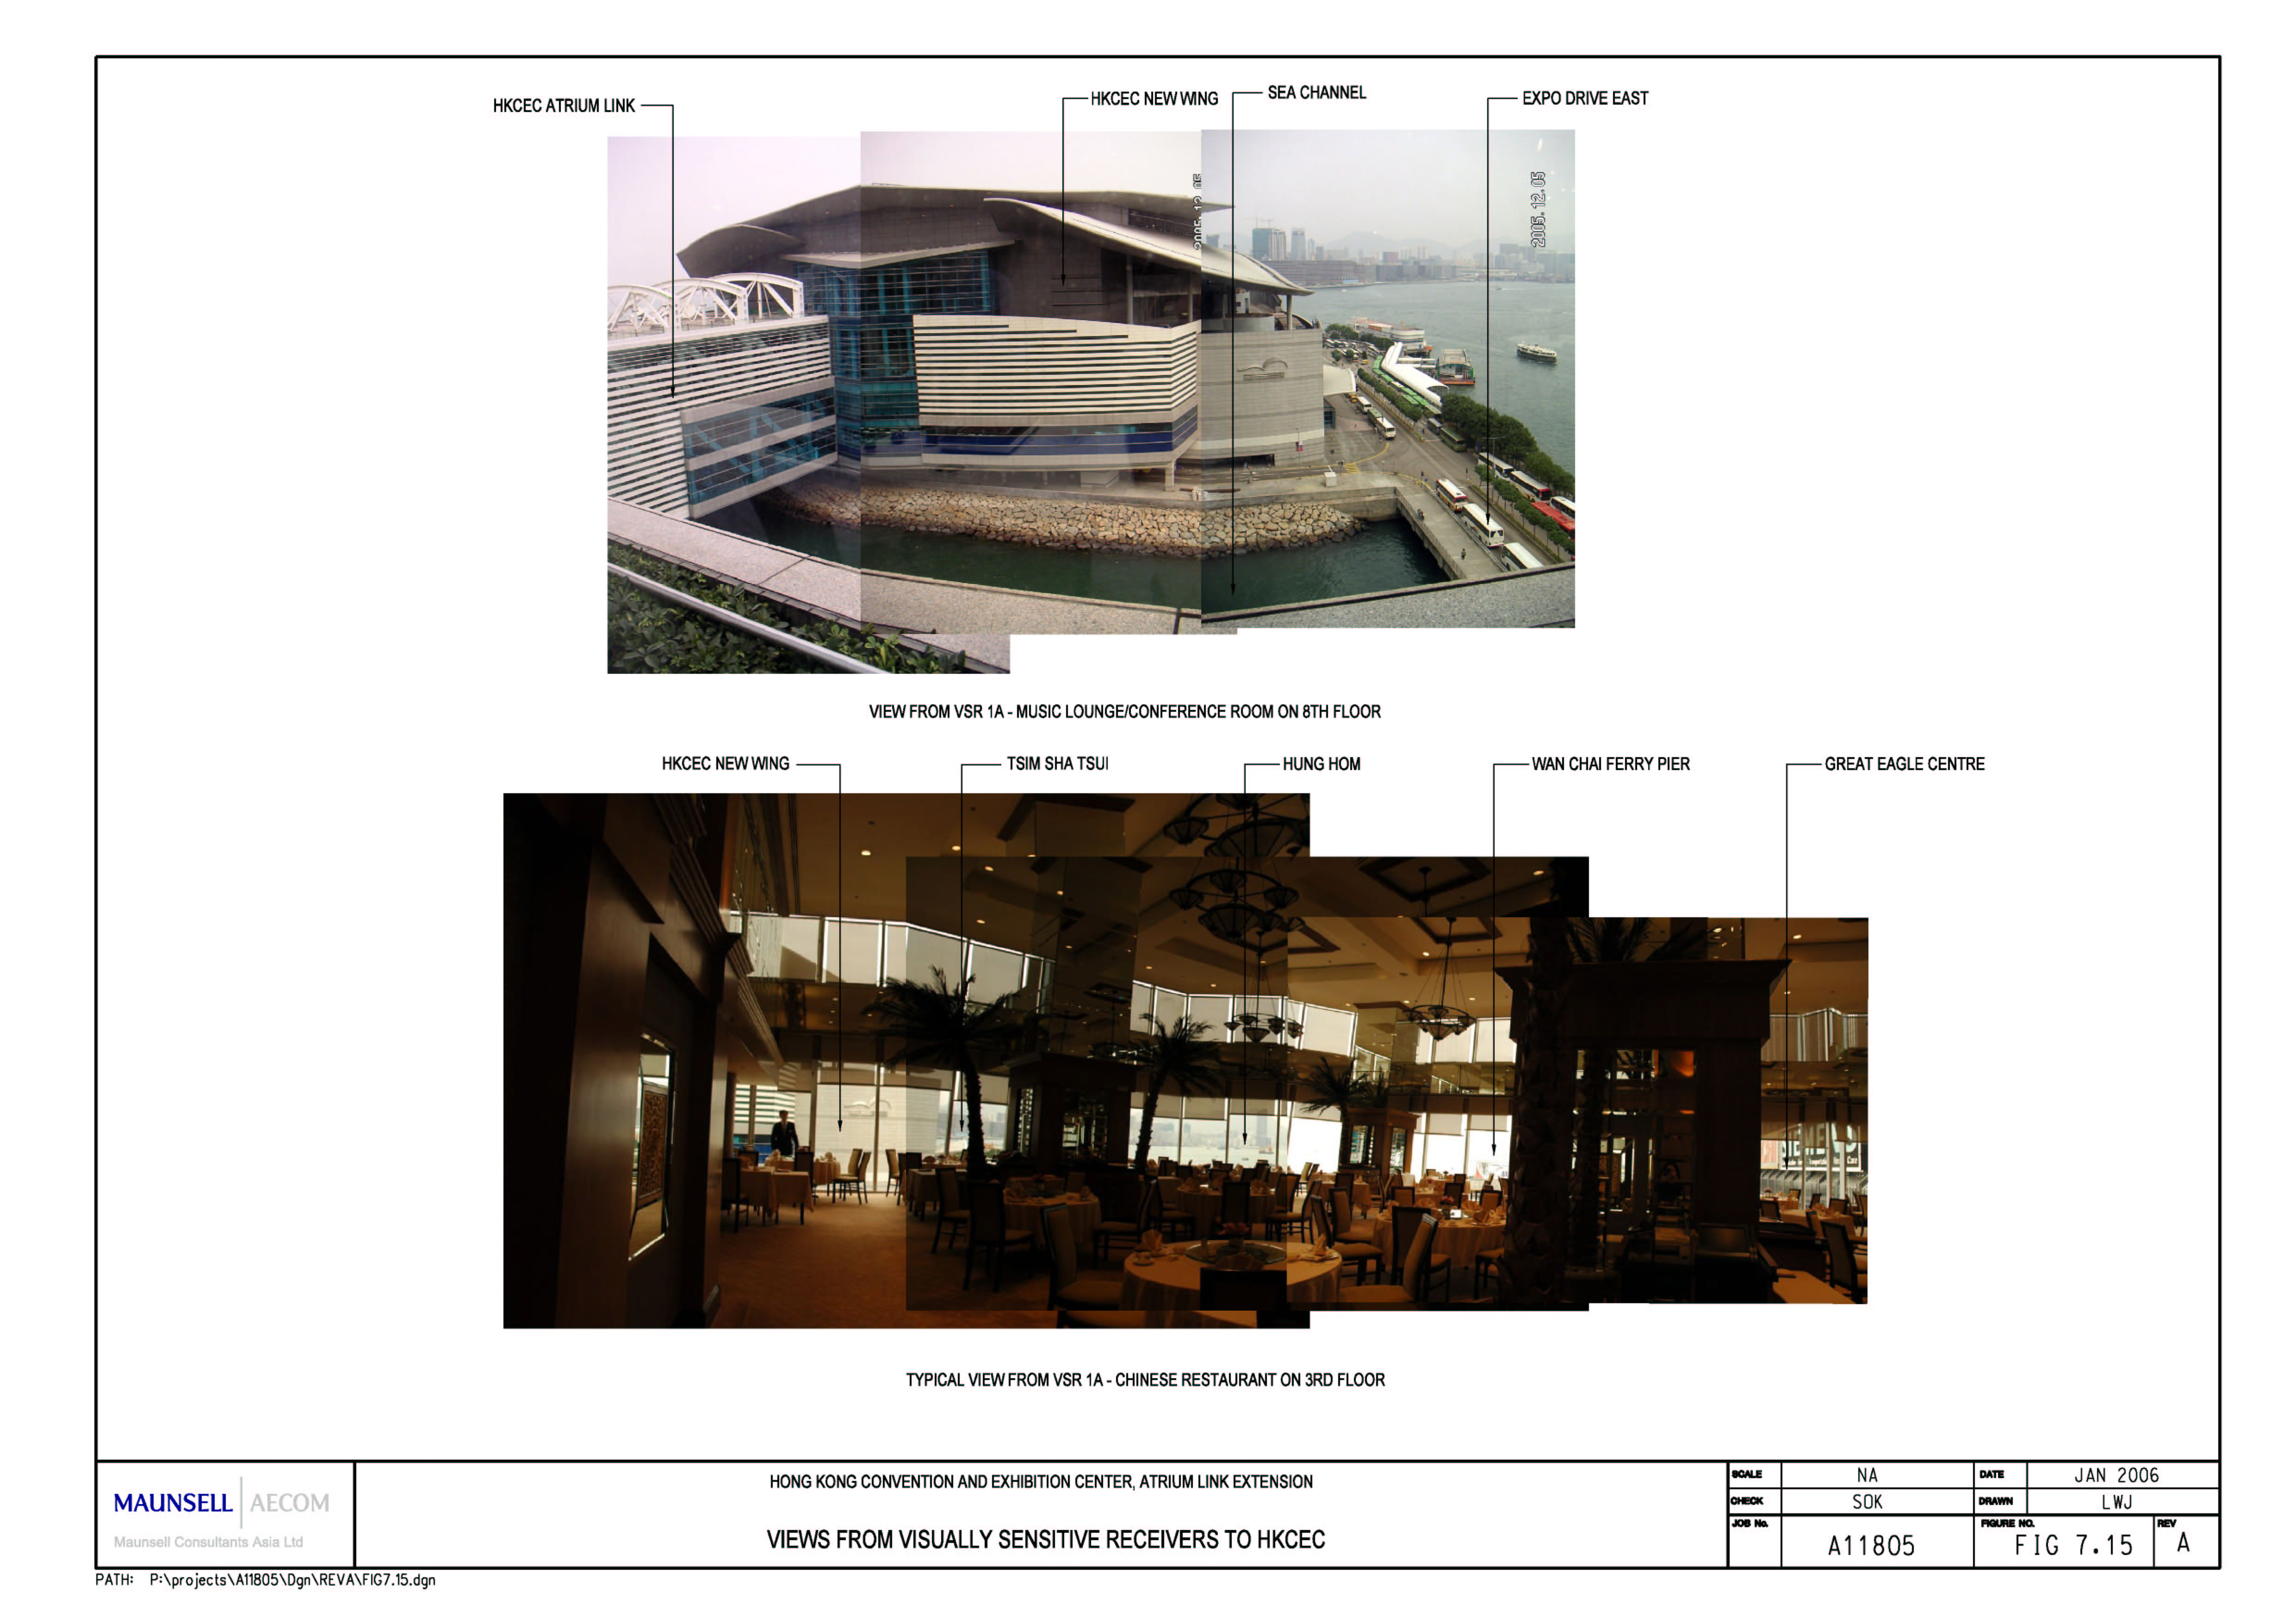
Figure 7.15 Views from Visually Sensitive
Receivers to HKCEC
Figure 7.16 Views from Visually Sensitive
Receivers to HKCEC
Figure 7.17 Views from Visually Sensitive
Receivers to HKCEC
Figure 7.18 Views from Visually Sensitive
Receivers to HKCEC
Figure 7.19 Views from Visually Sensitive
Receivers to HKCEC
Figure 7.20 Views from Visually Sensitive
Receivers to HKCEC
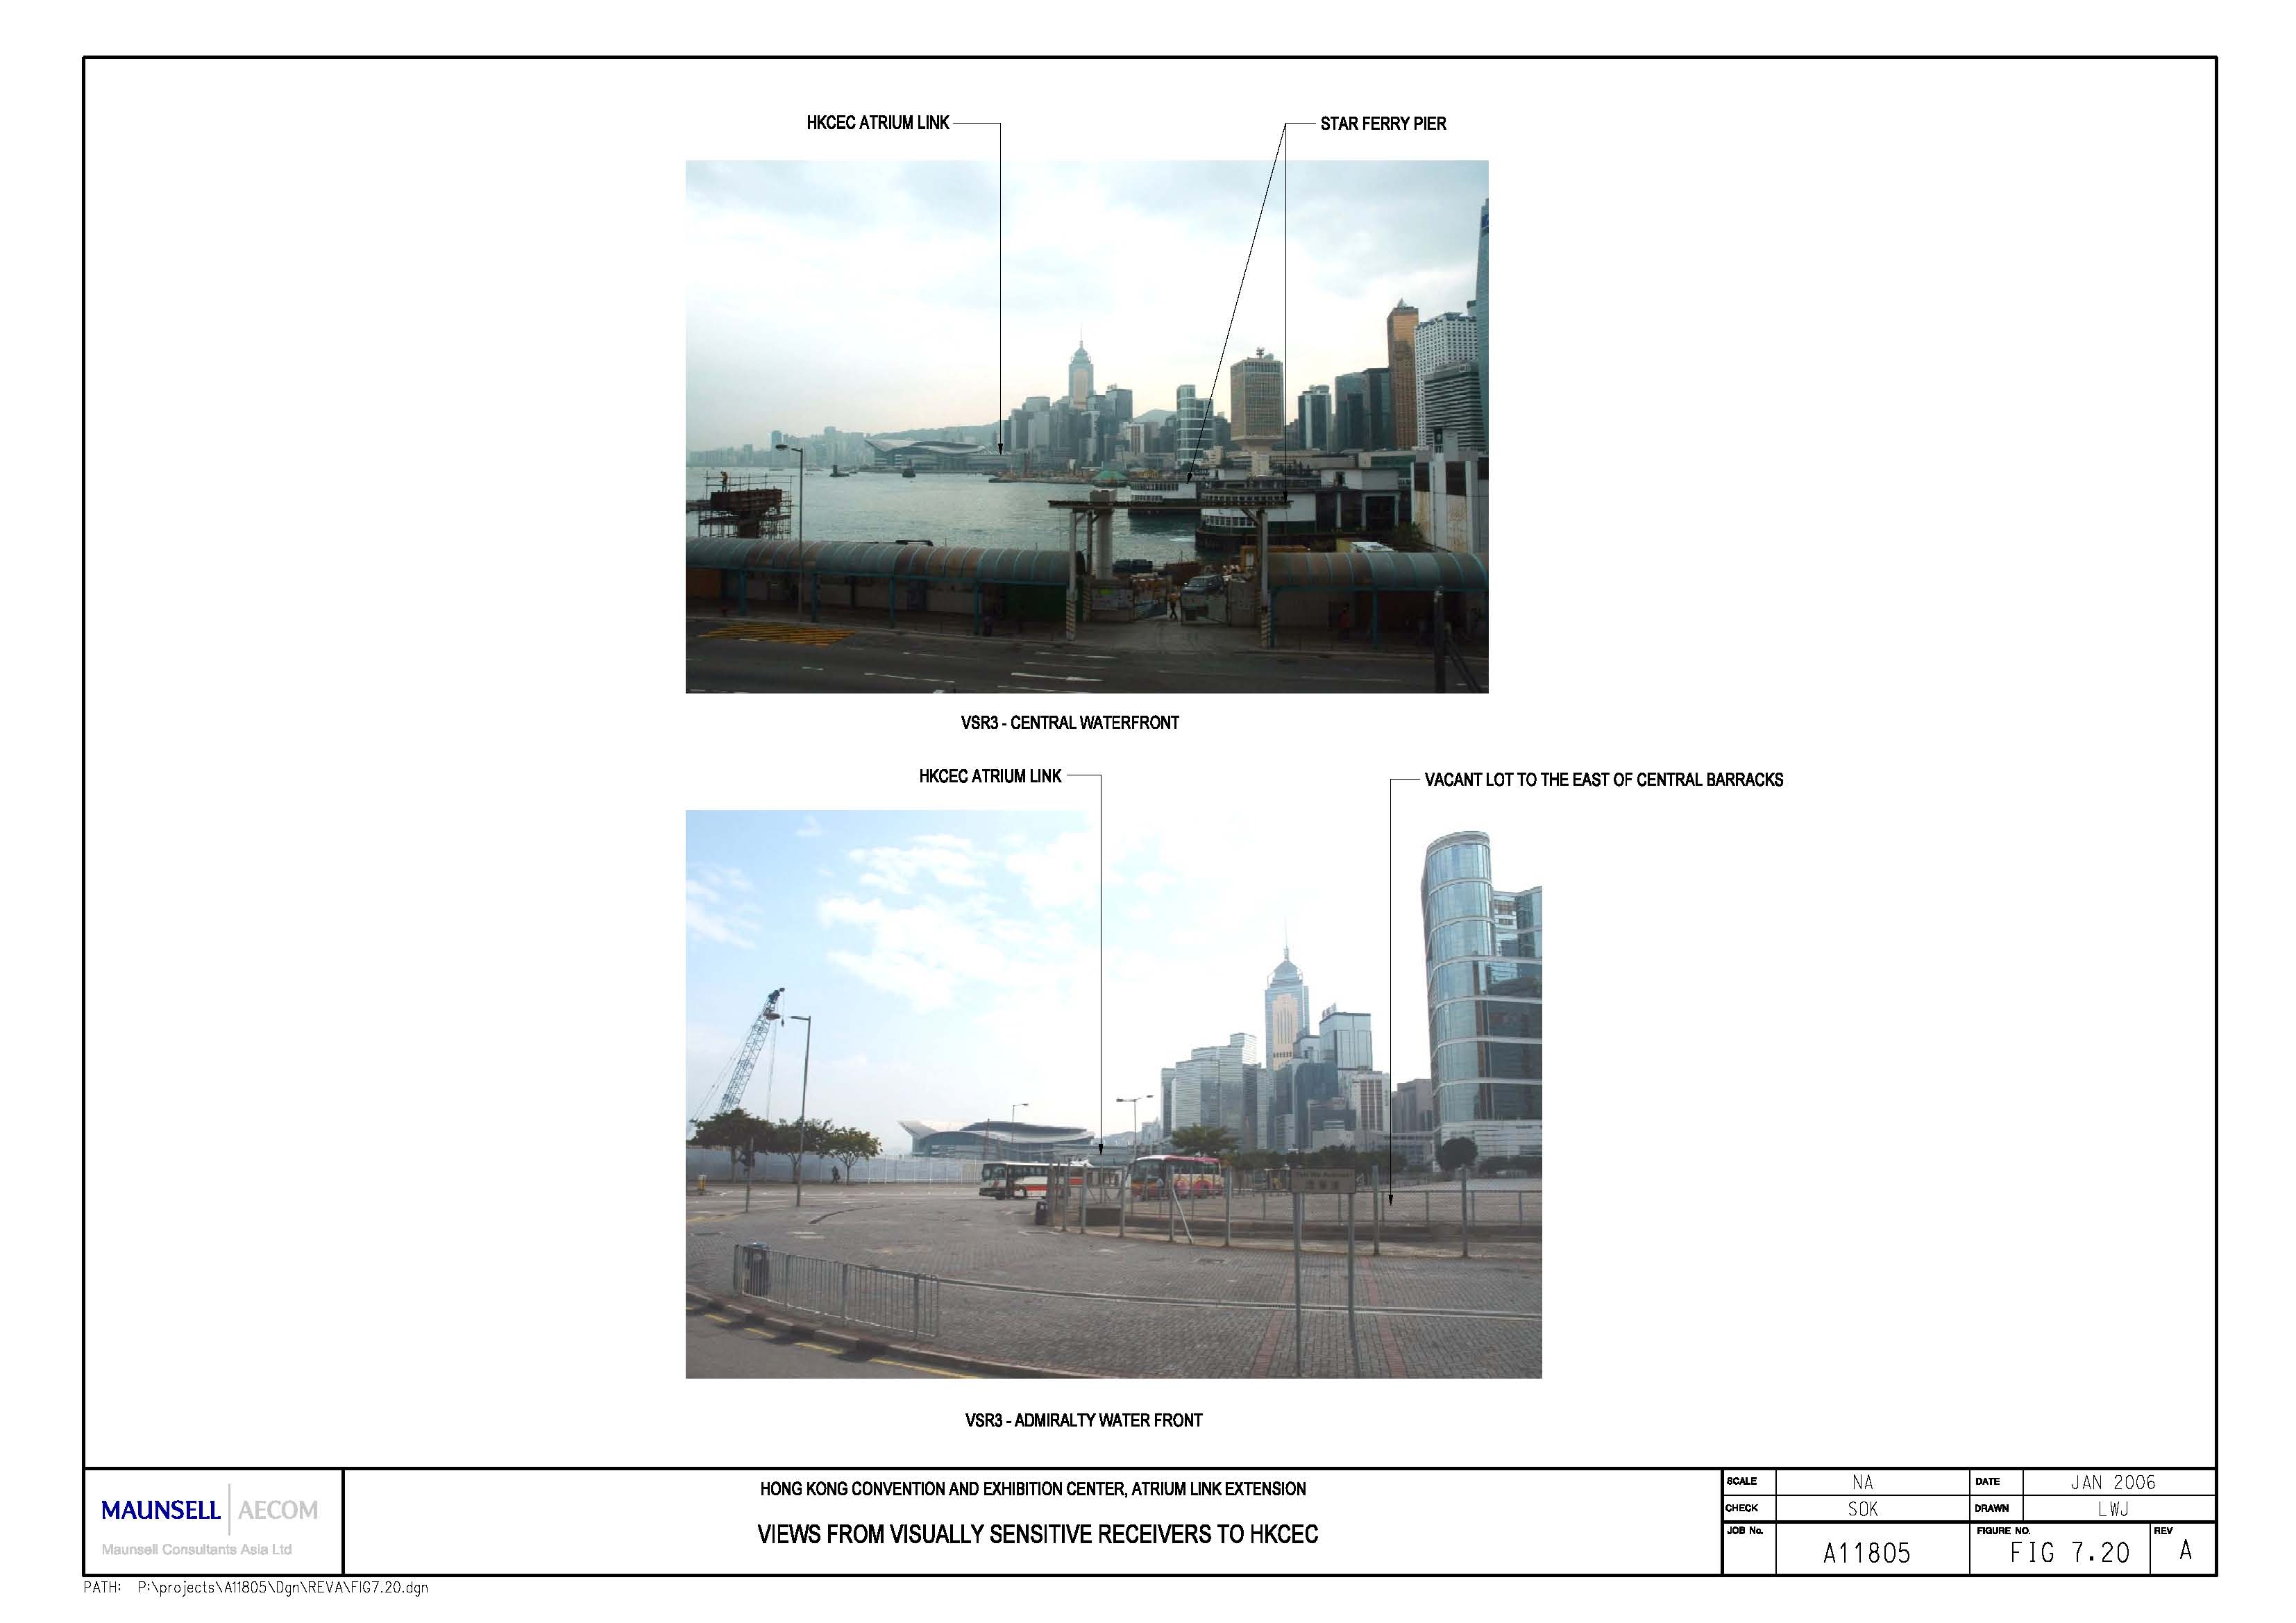
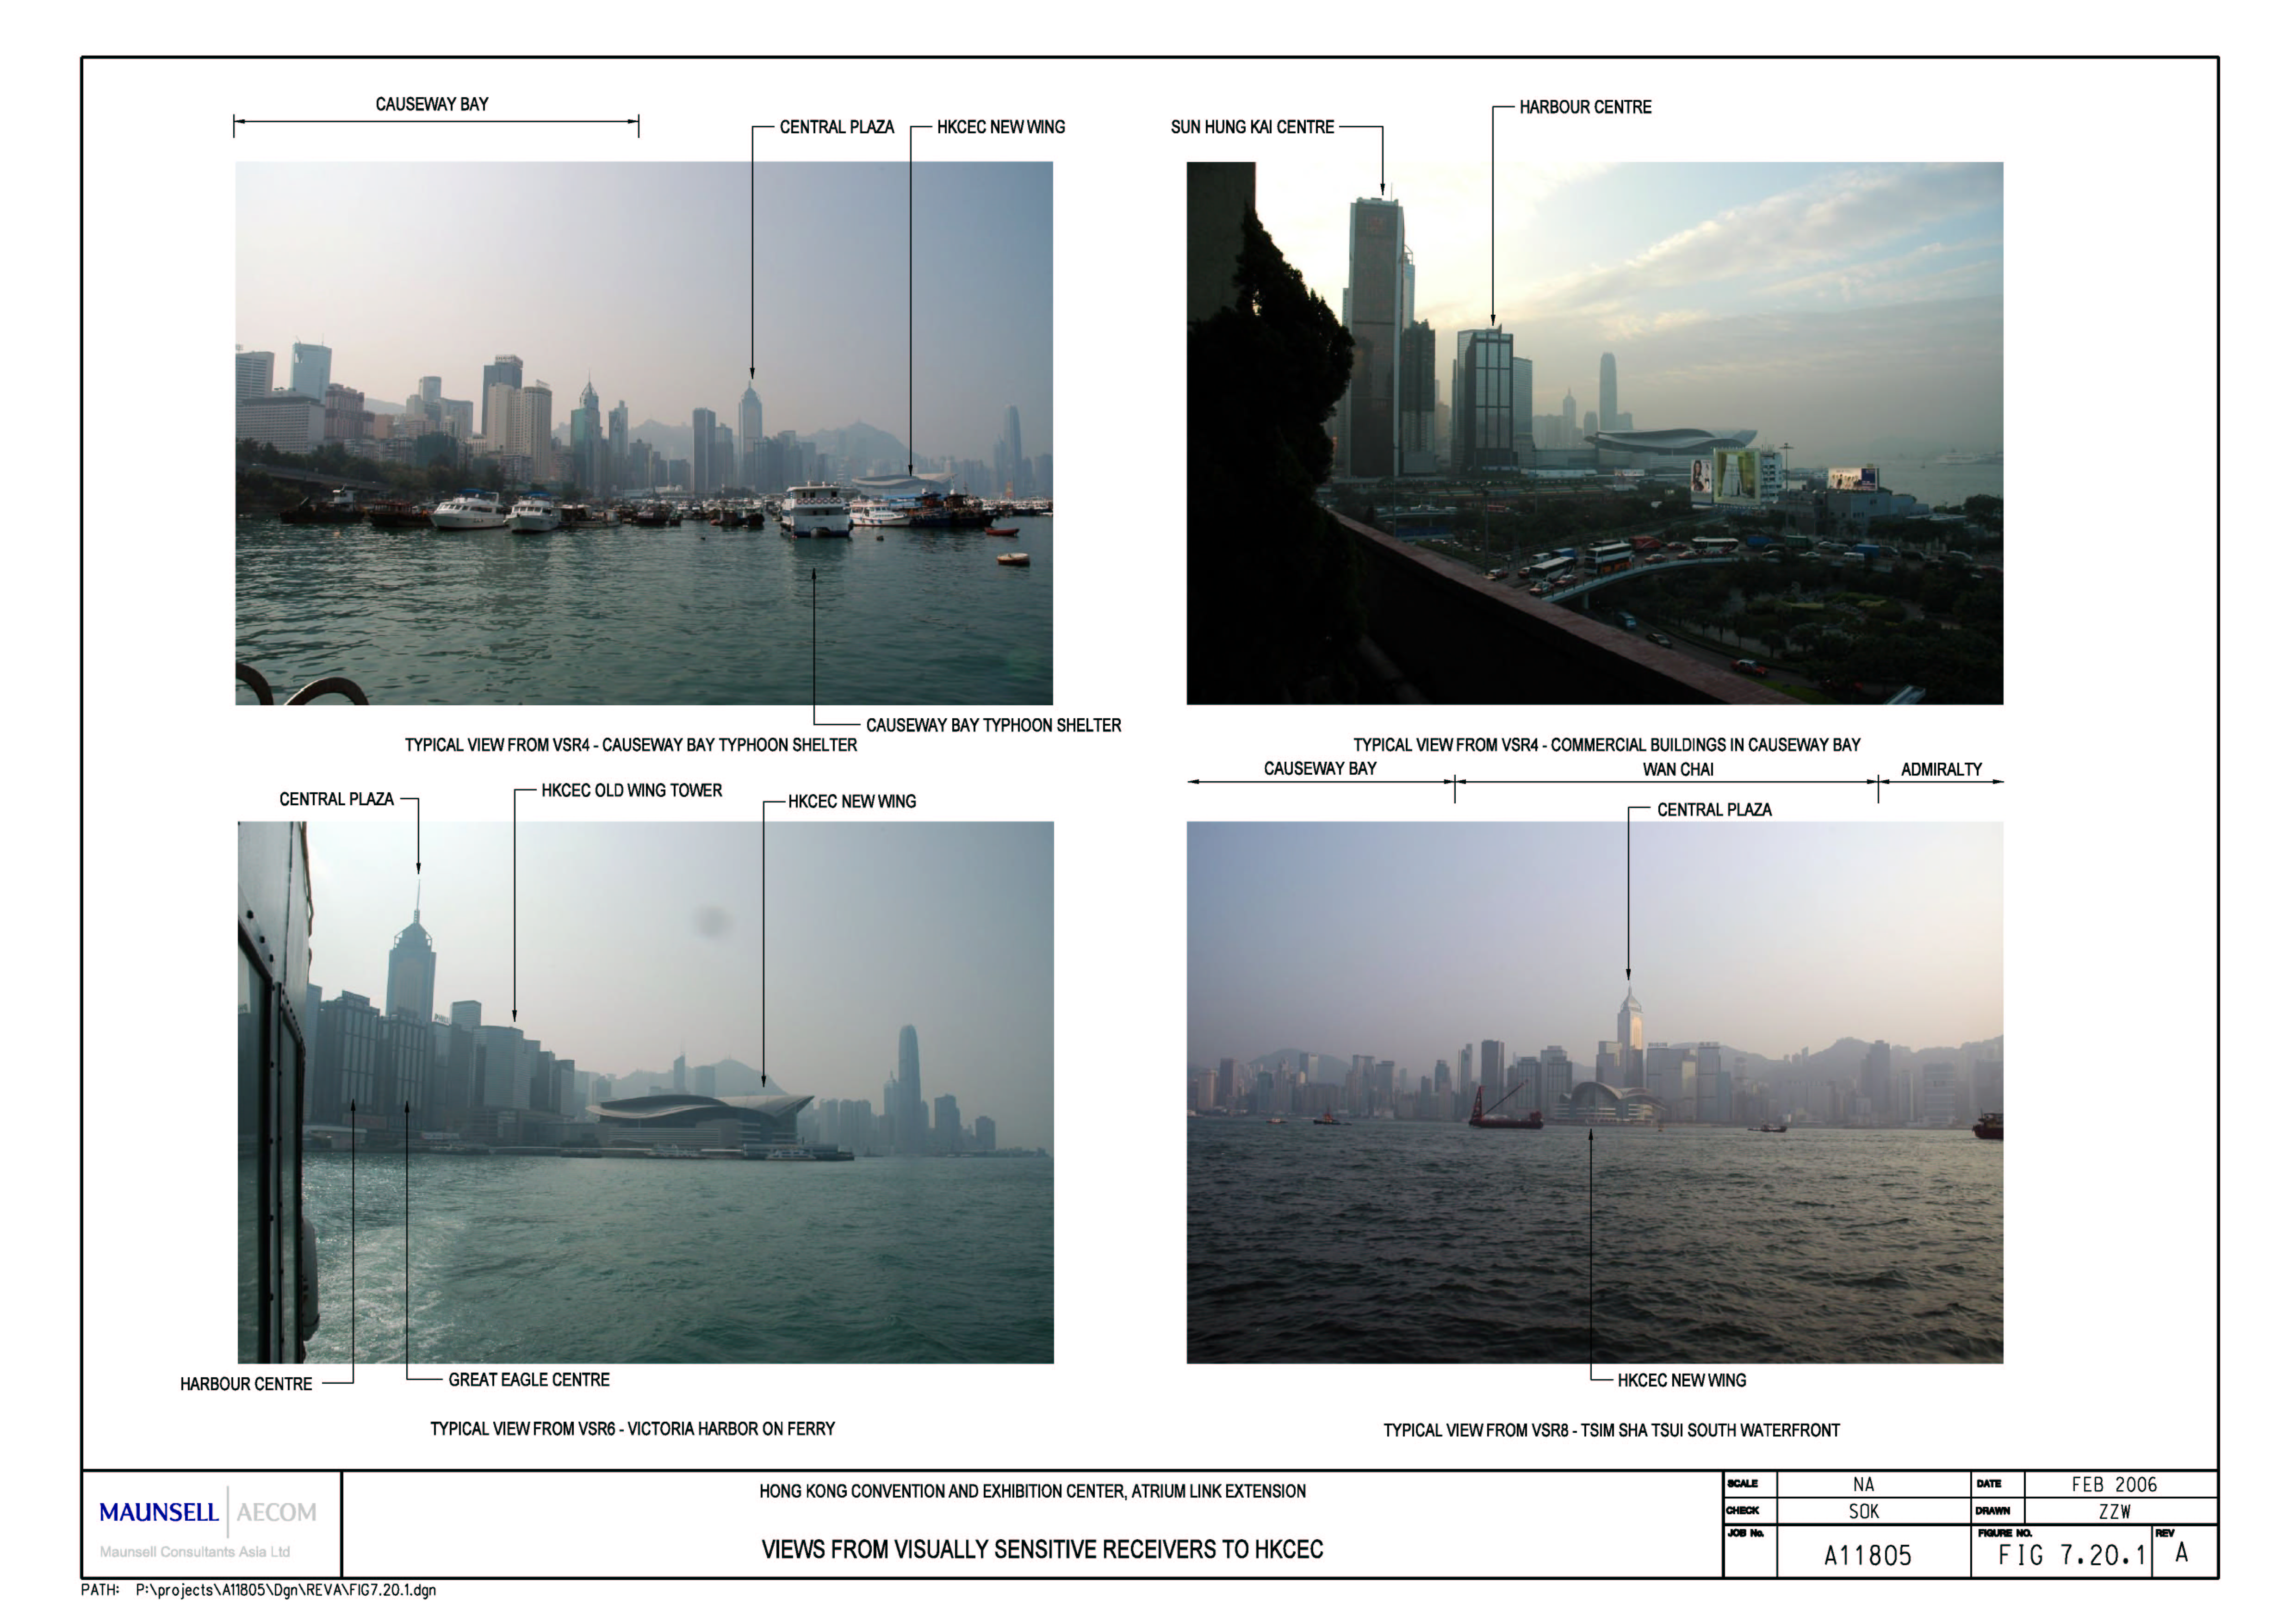
Figure
7.20.1 Views from Visually
Sensitive Receivers to HKCEC
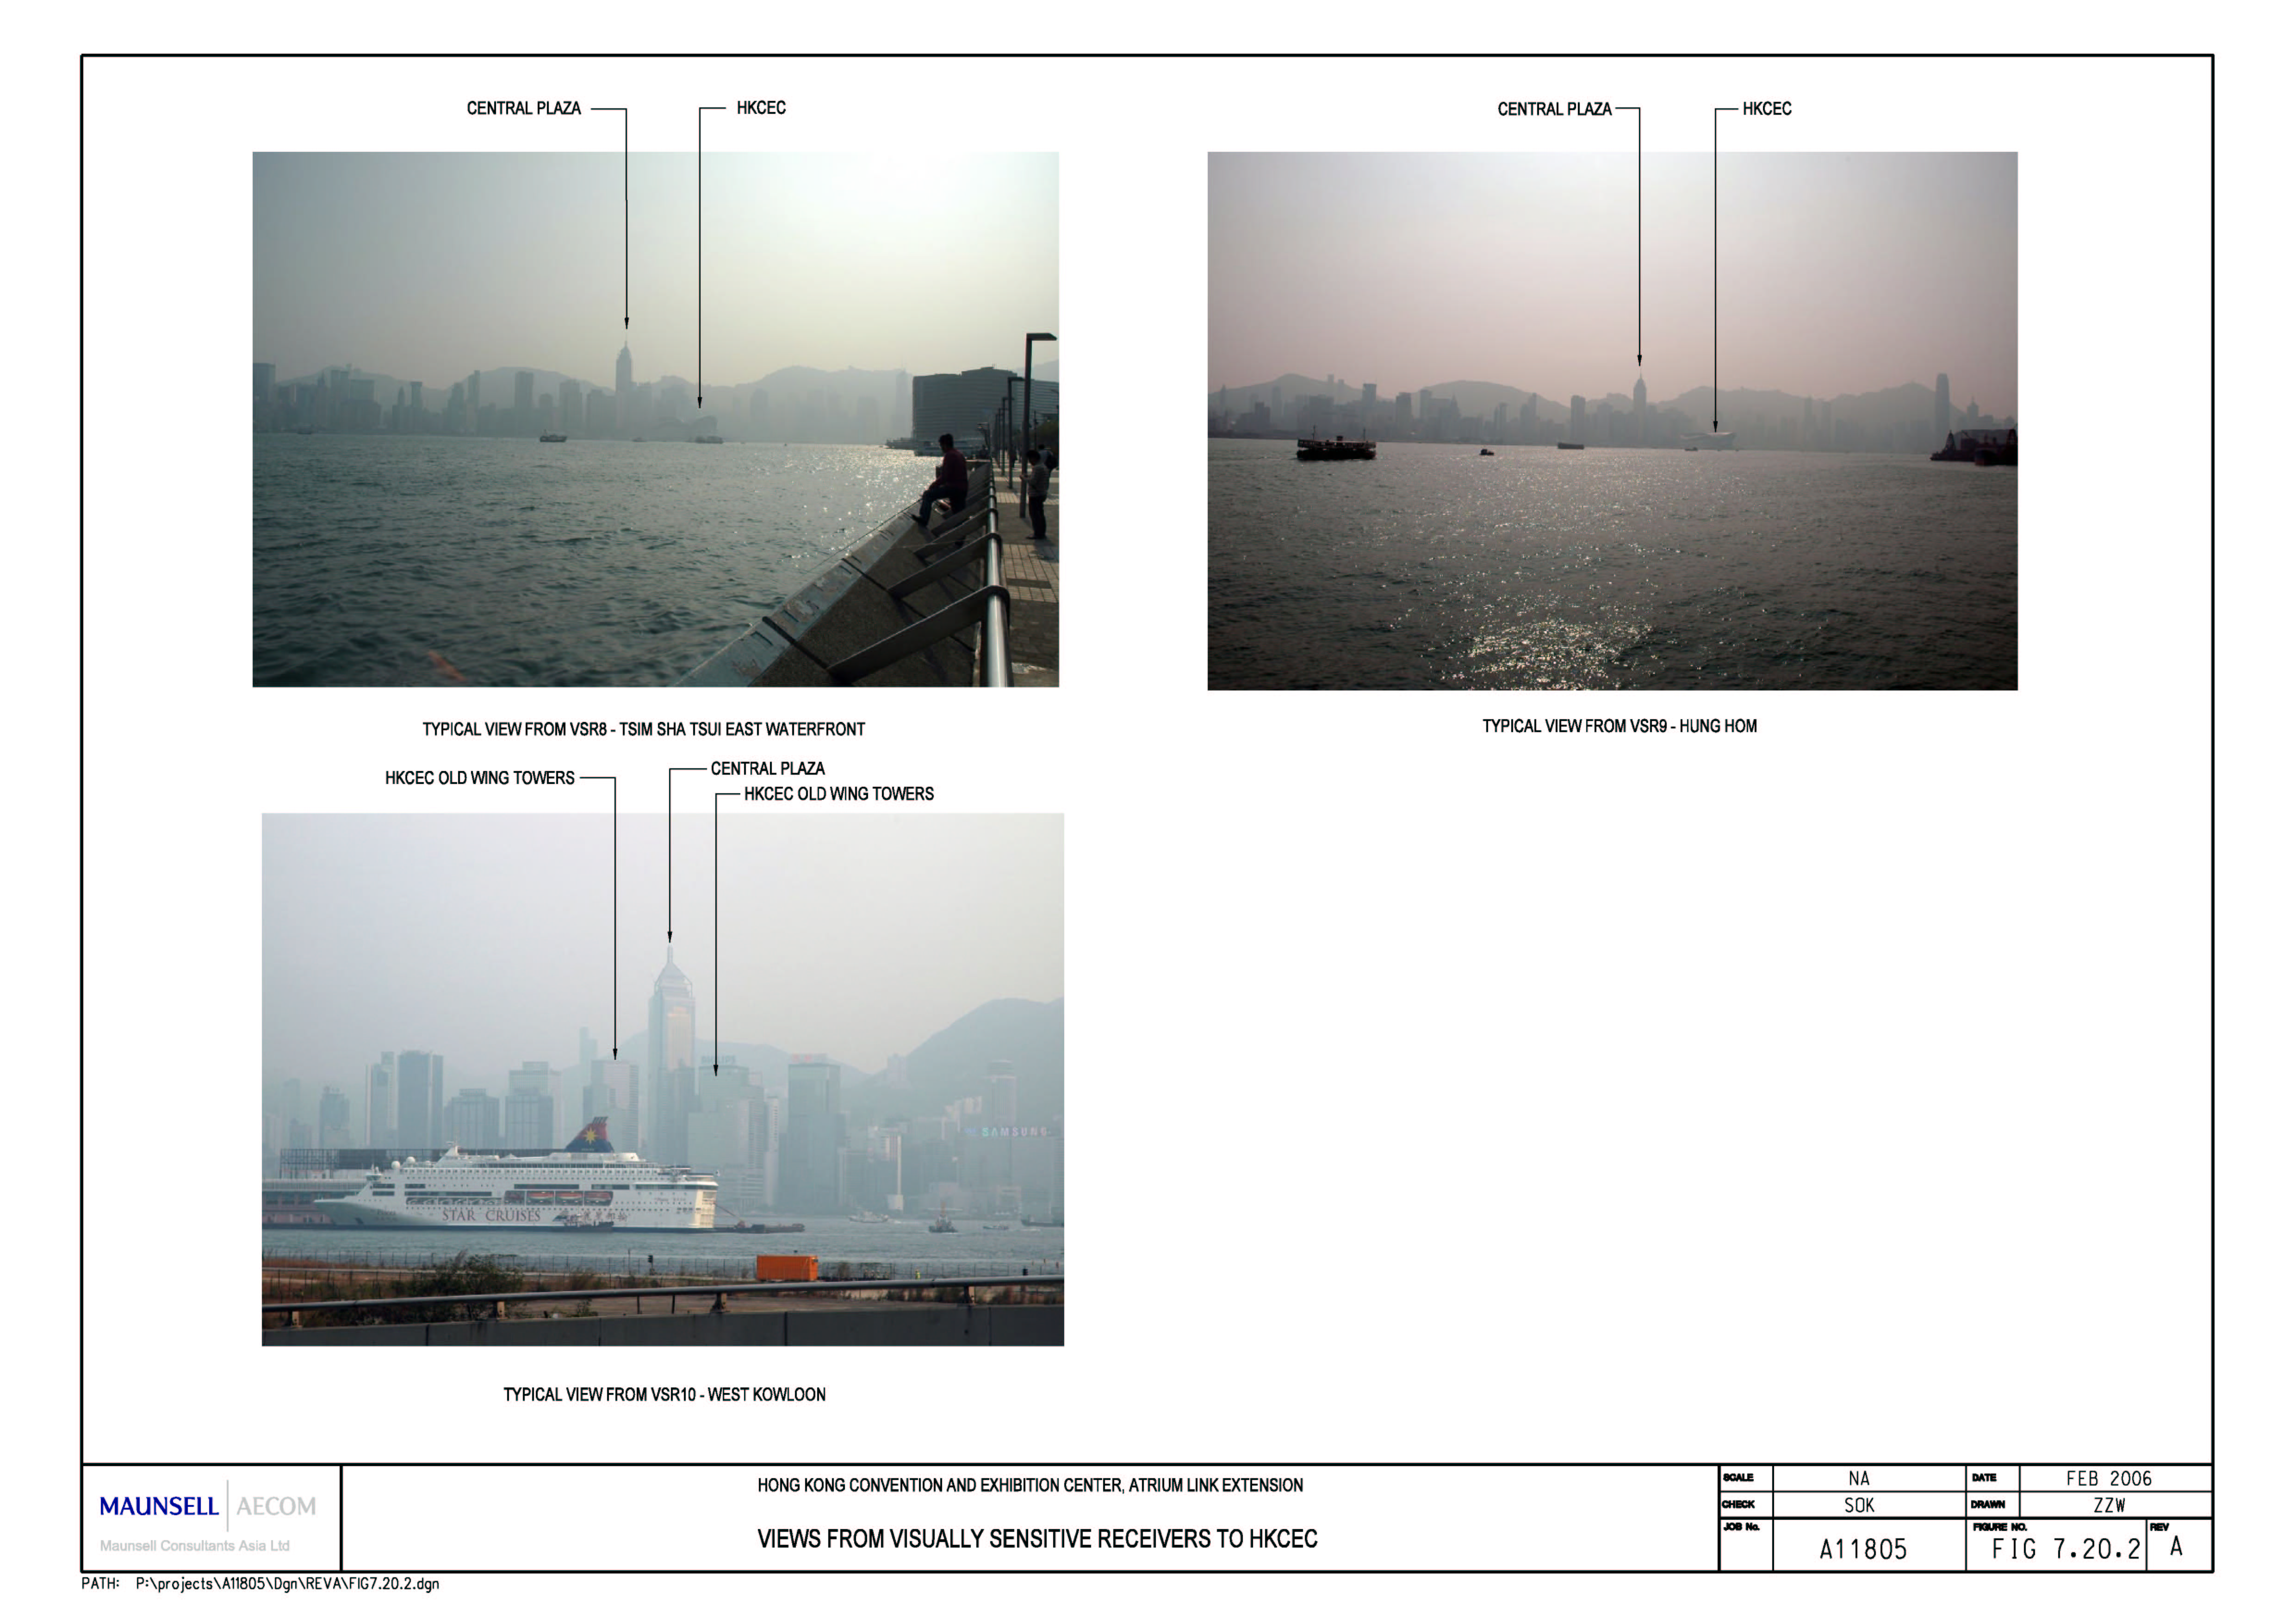
Figure
7.20.2 Views from Visually
Sensitive Receivers to HKCEC
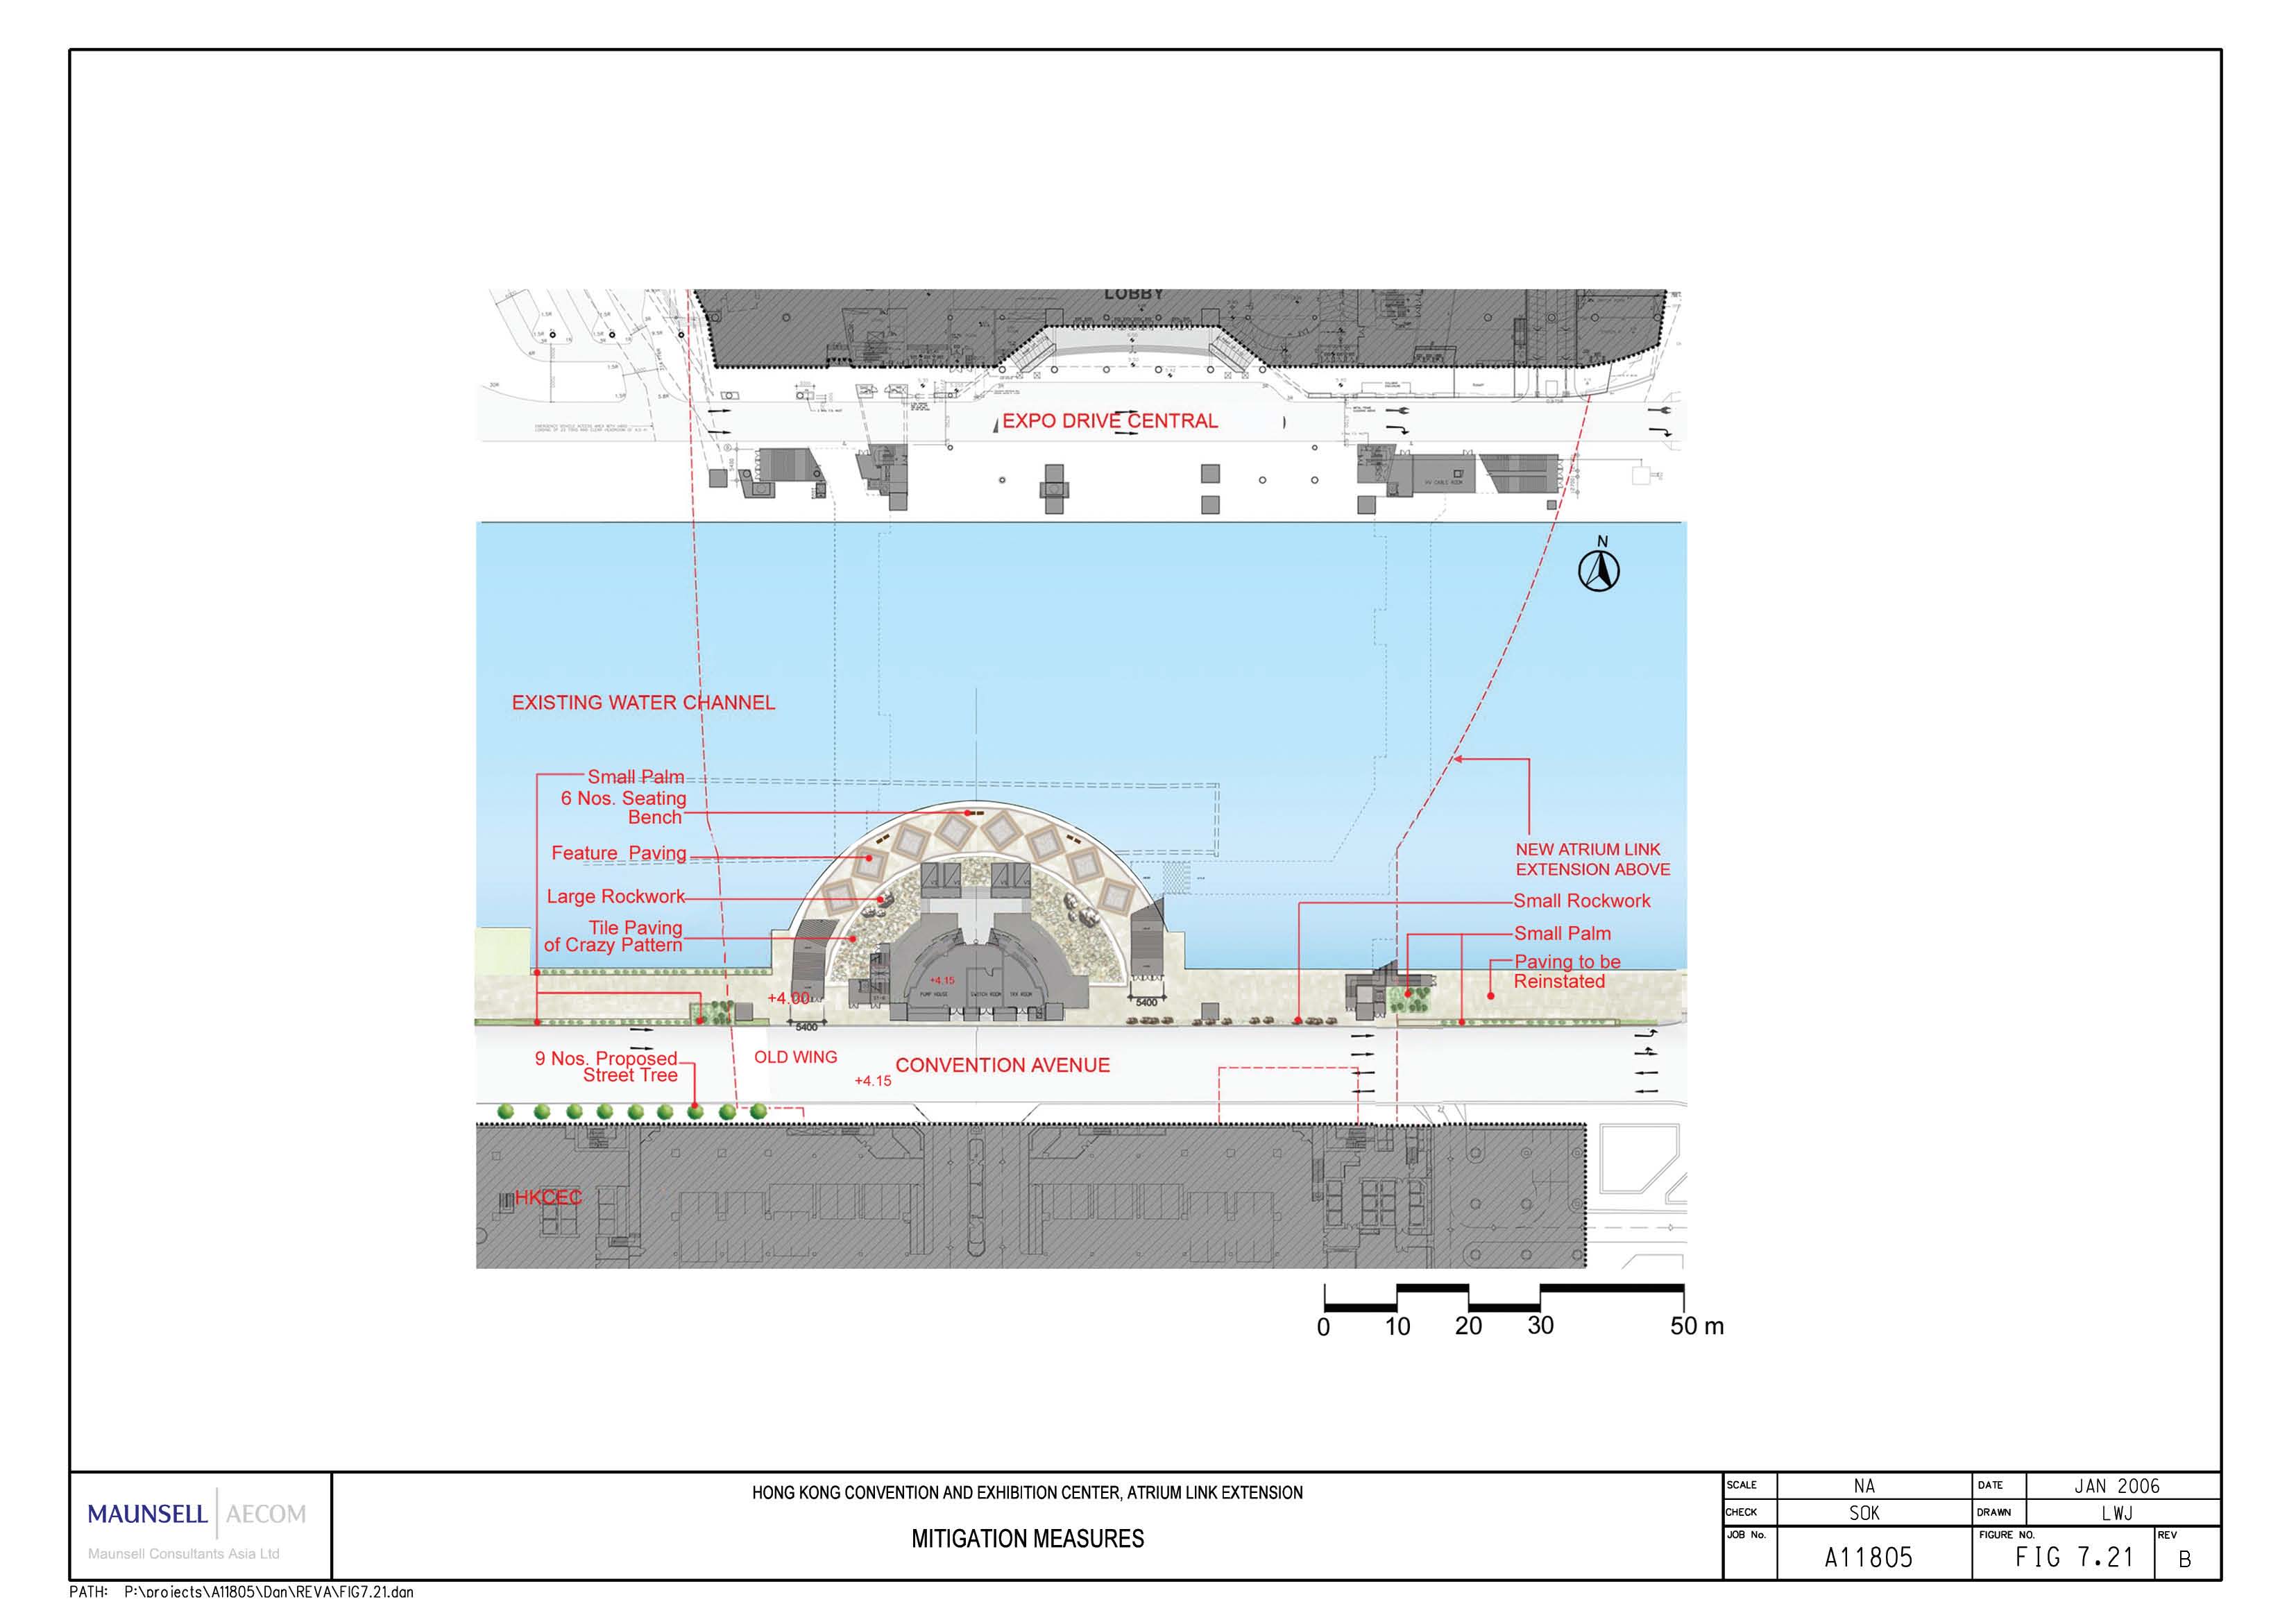
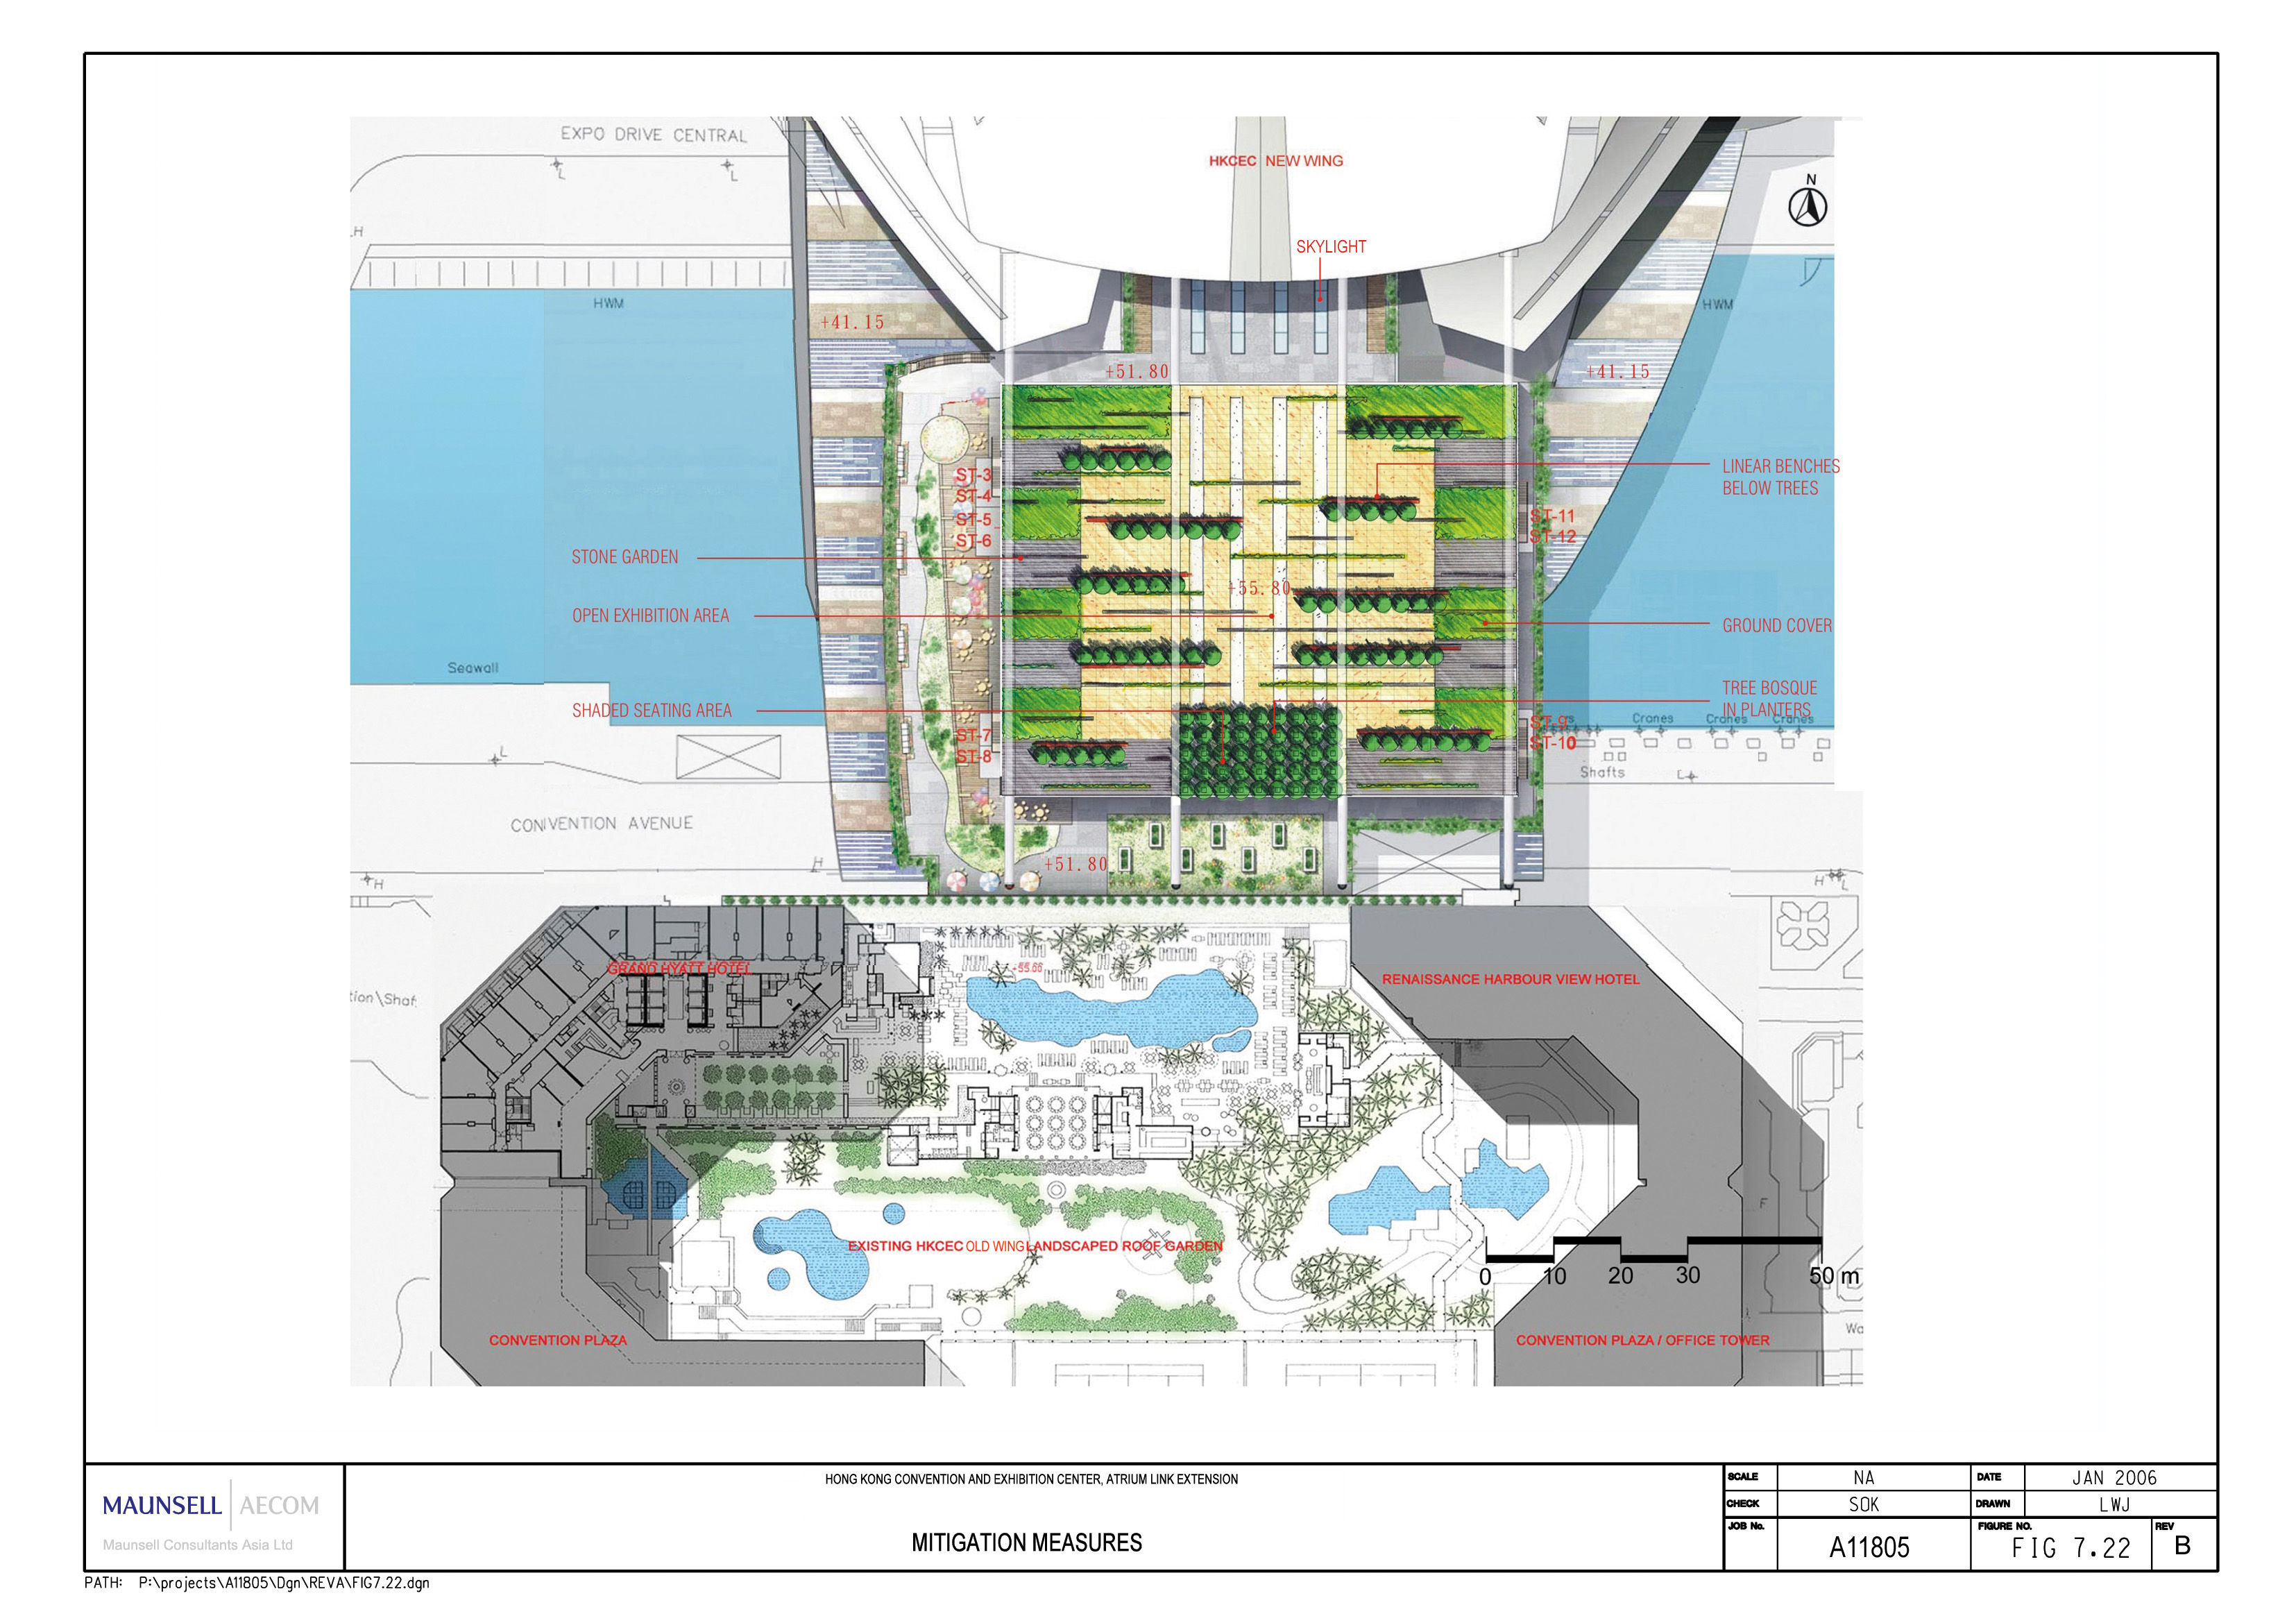
Figure 7.21 Mitigation measures
Figure 7.22 Mitigation measures
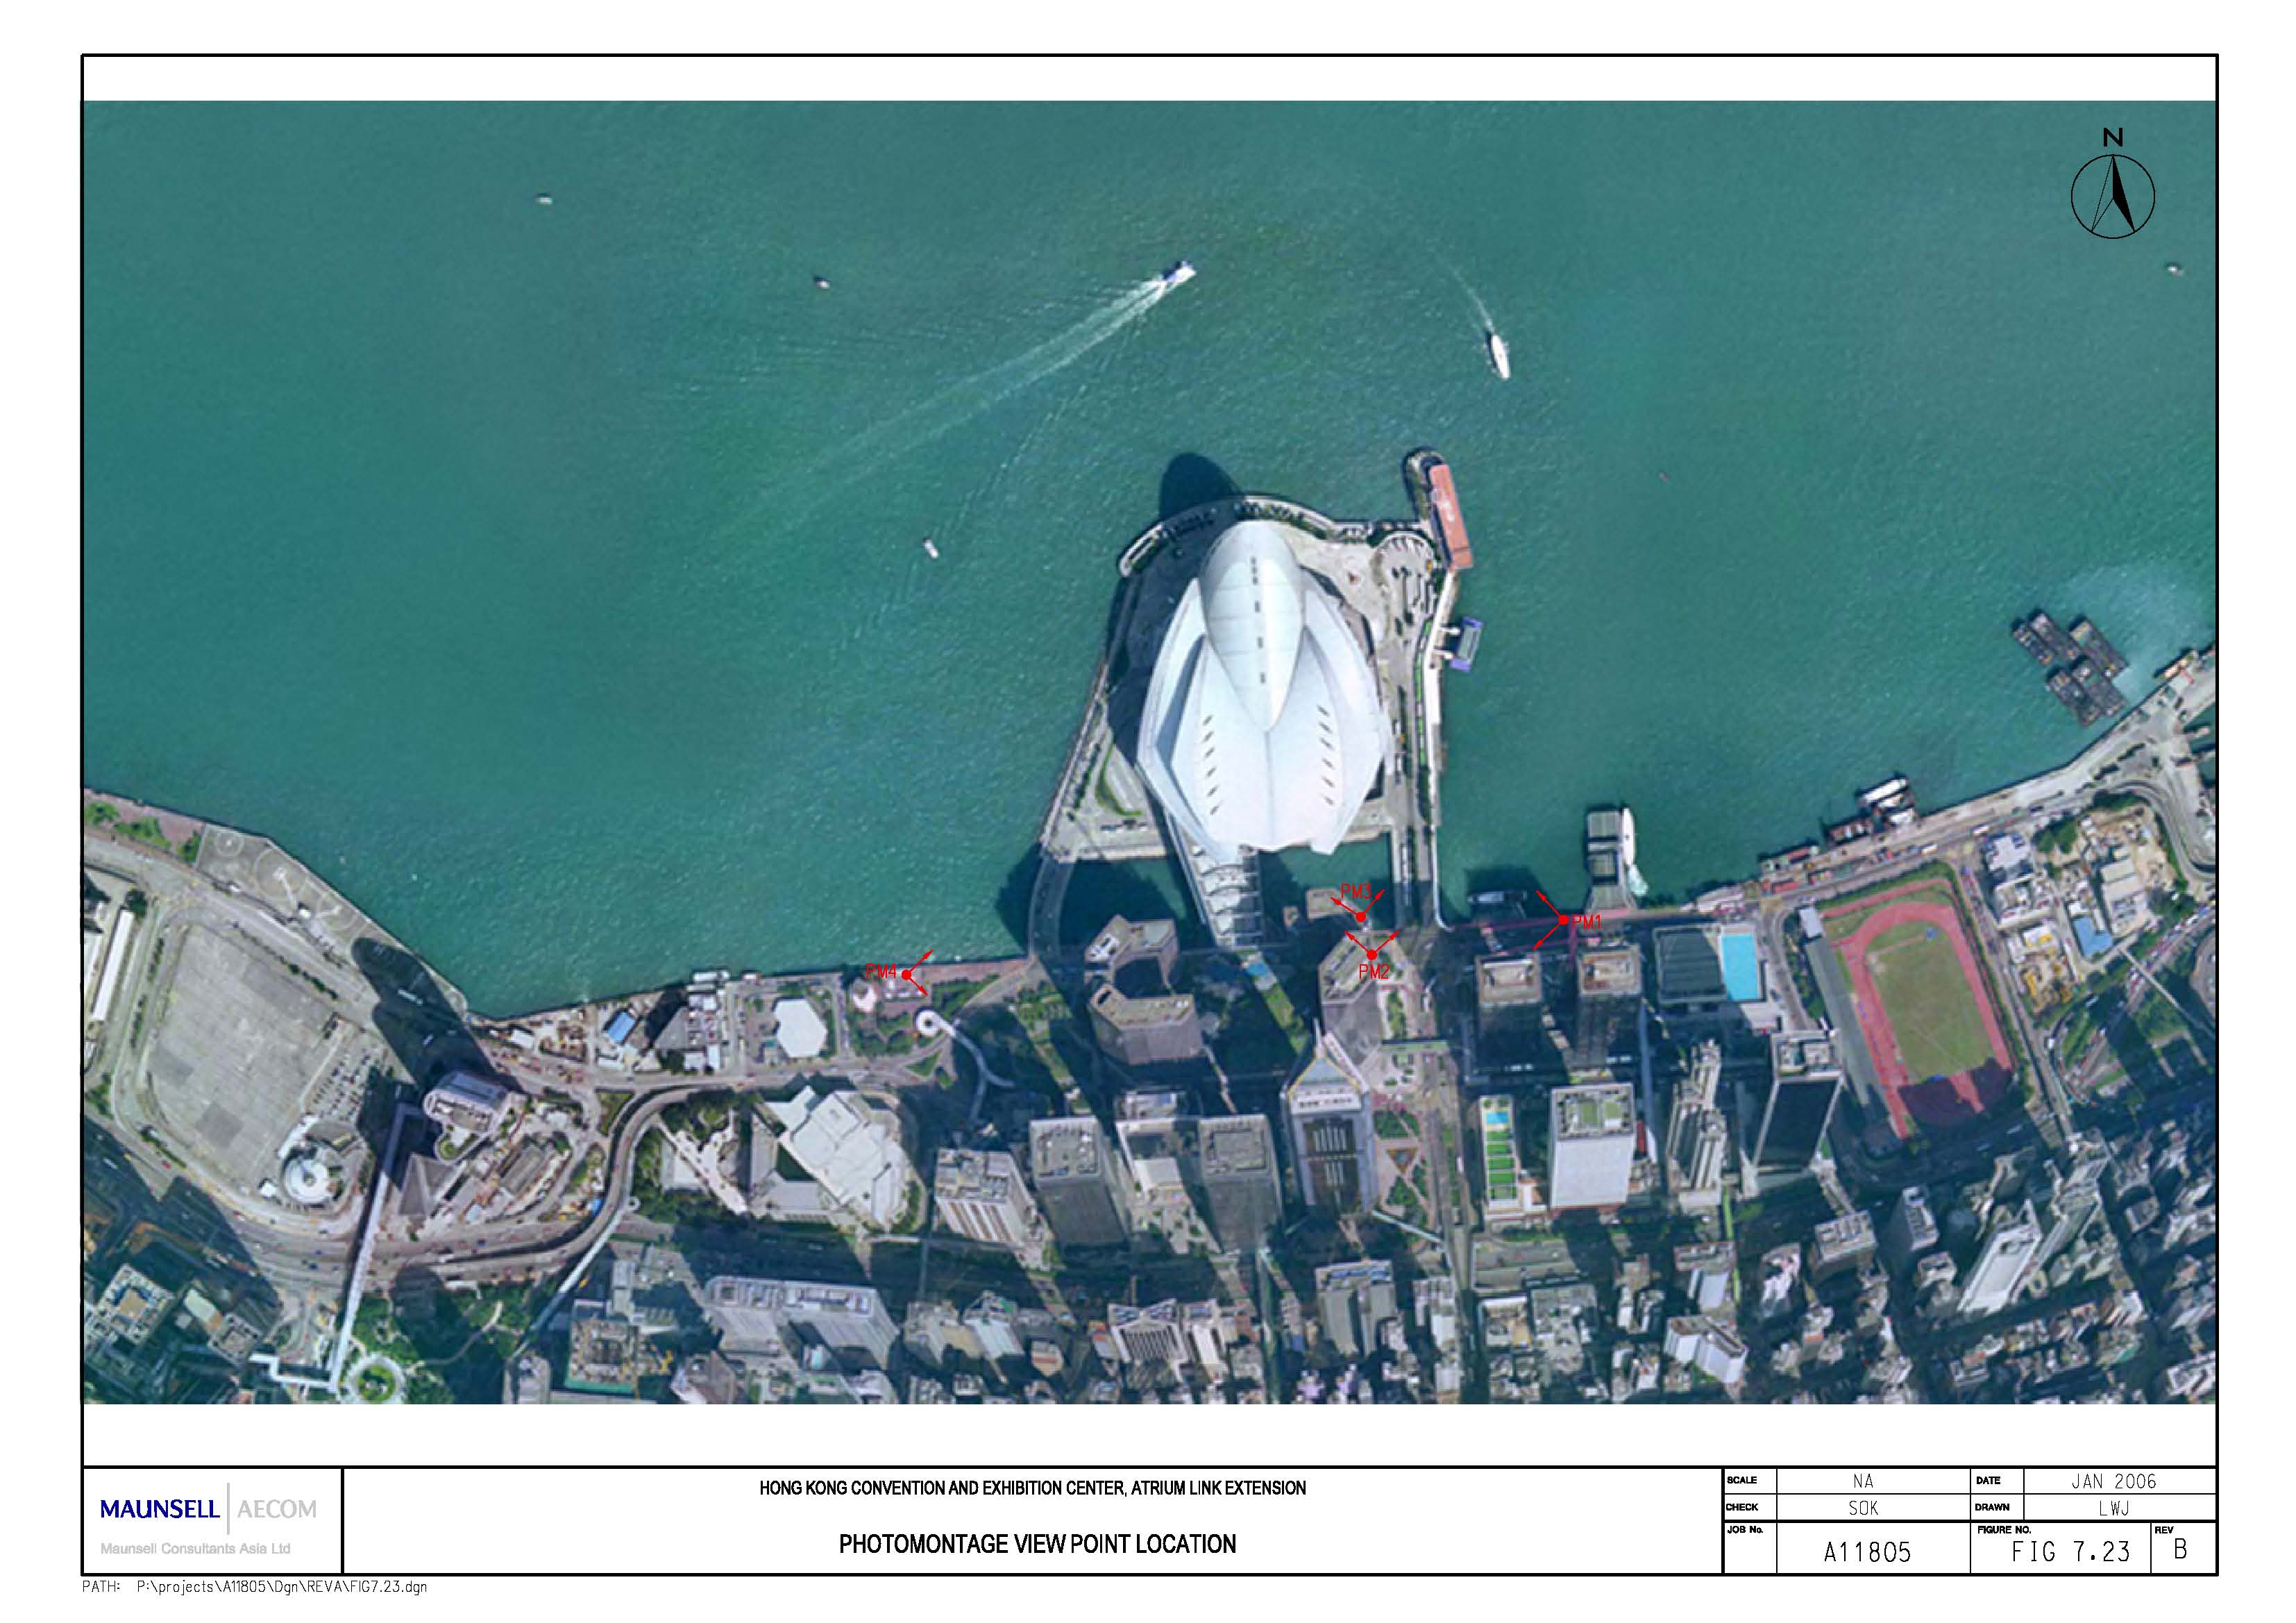
Figure 7.23 Photomontage View Point Location
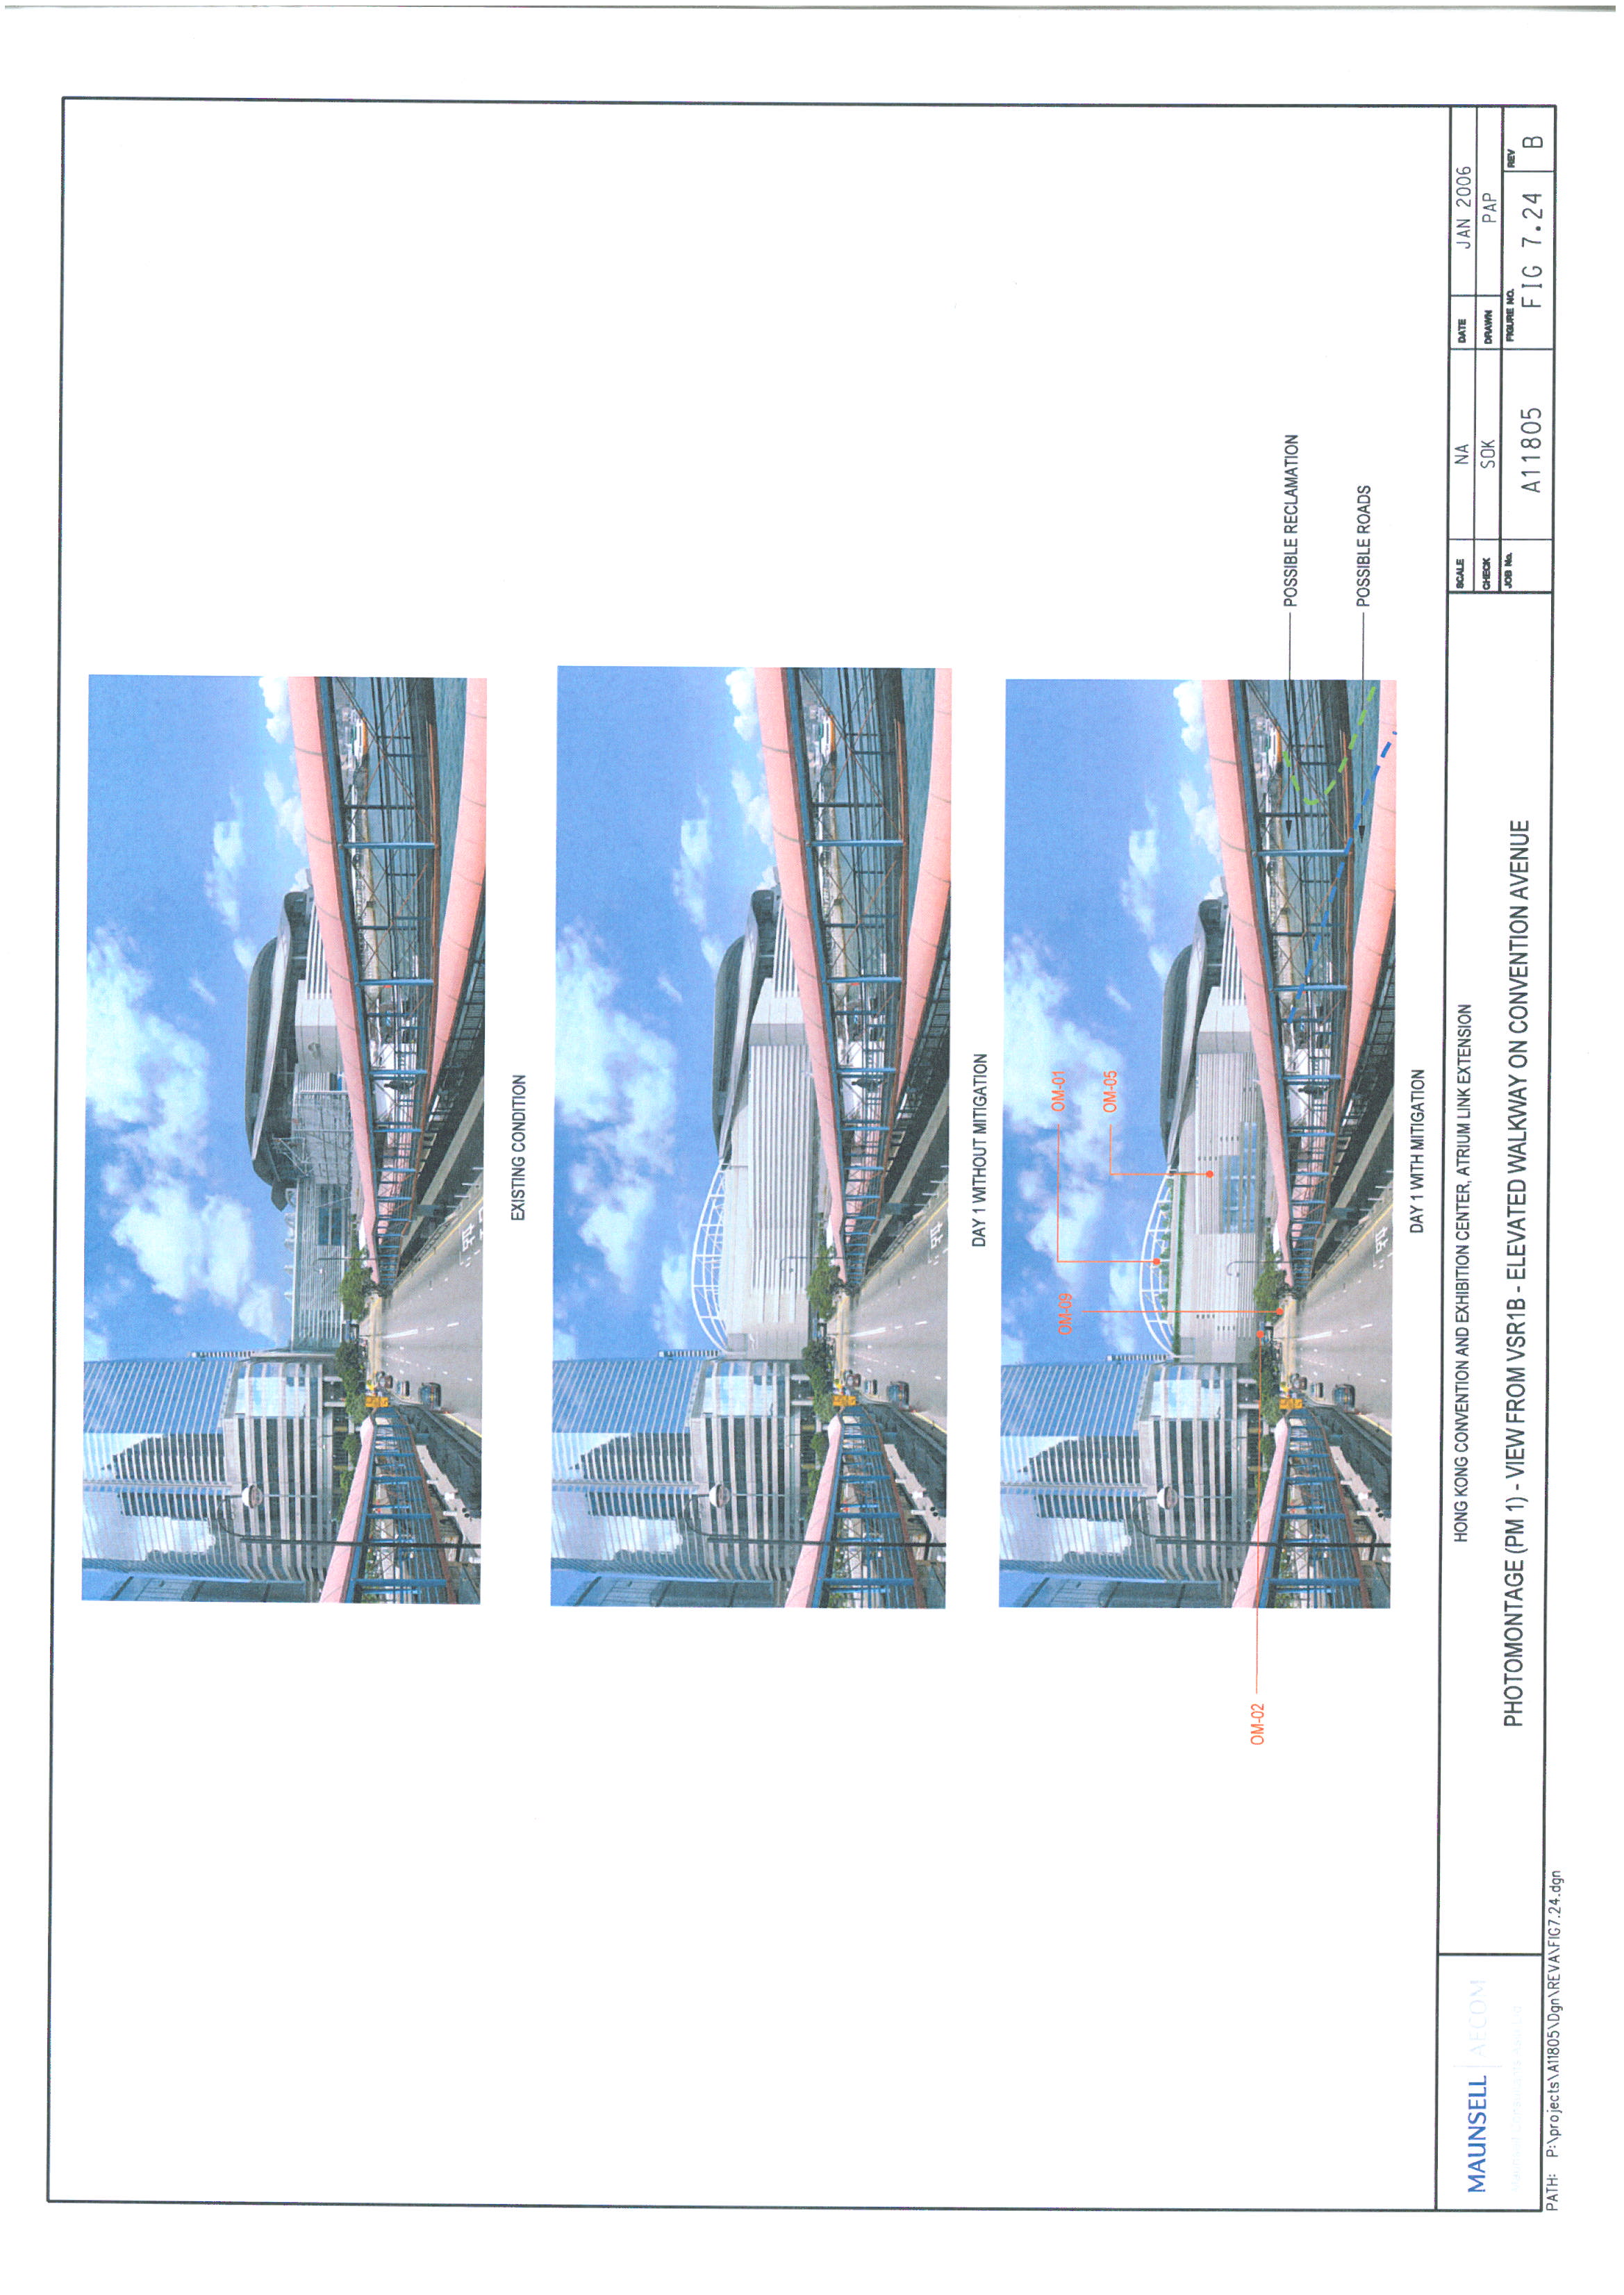
Figure 7.24 Photomontage (PM 1) – View from VSR
1B – Elevated Walkway on Convention Avenue
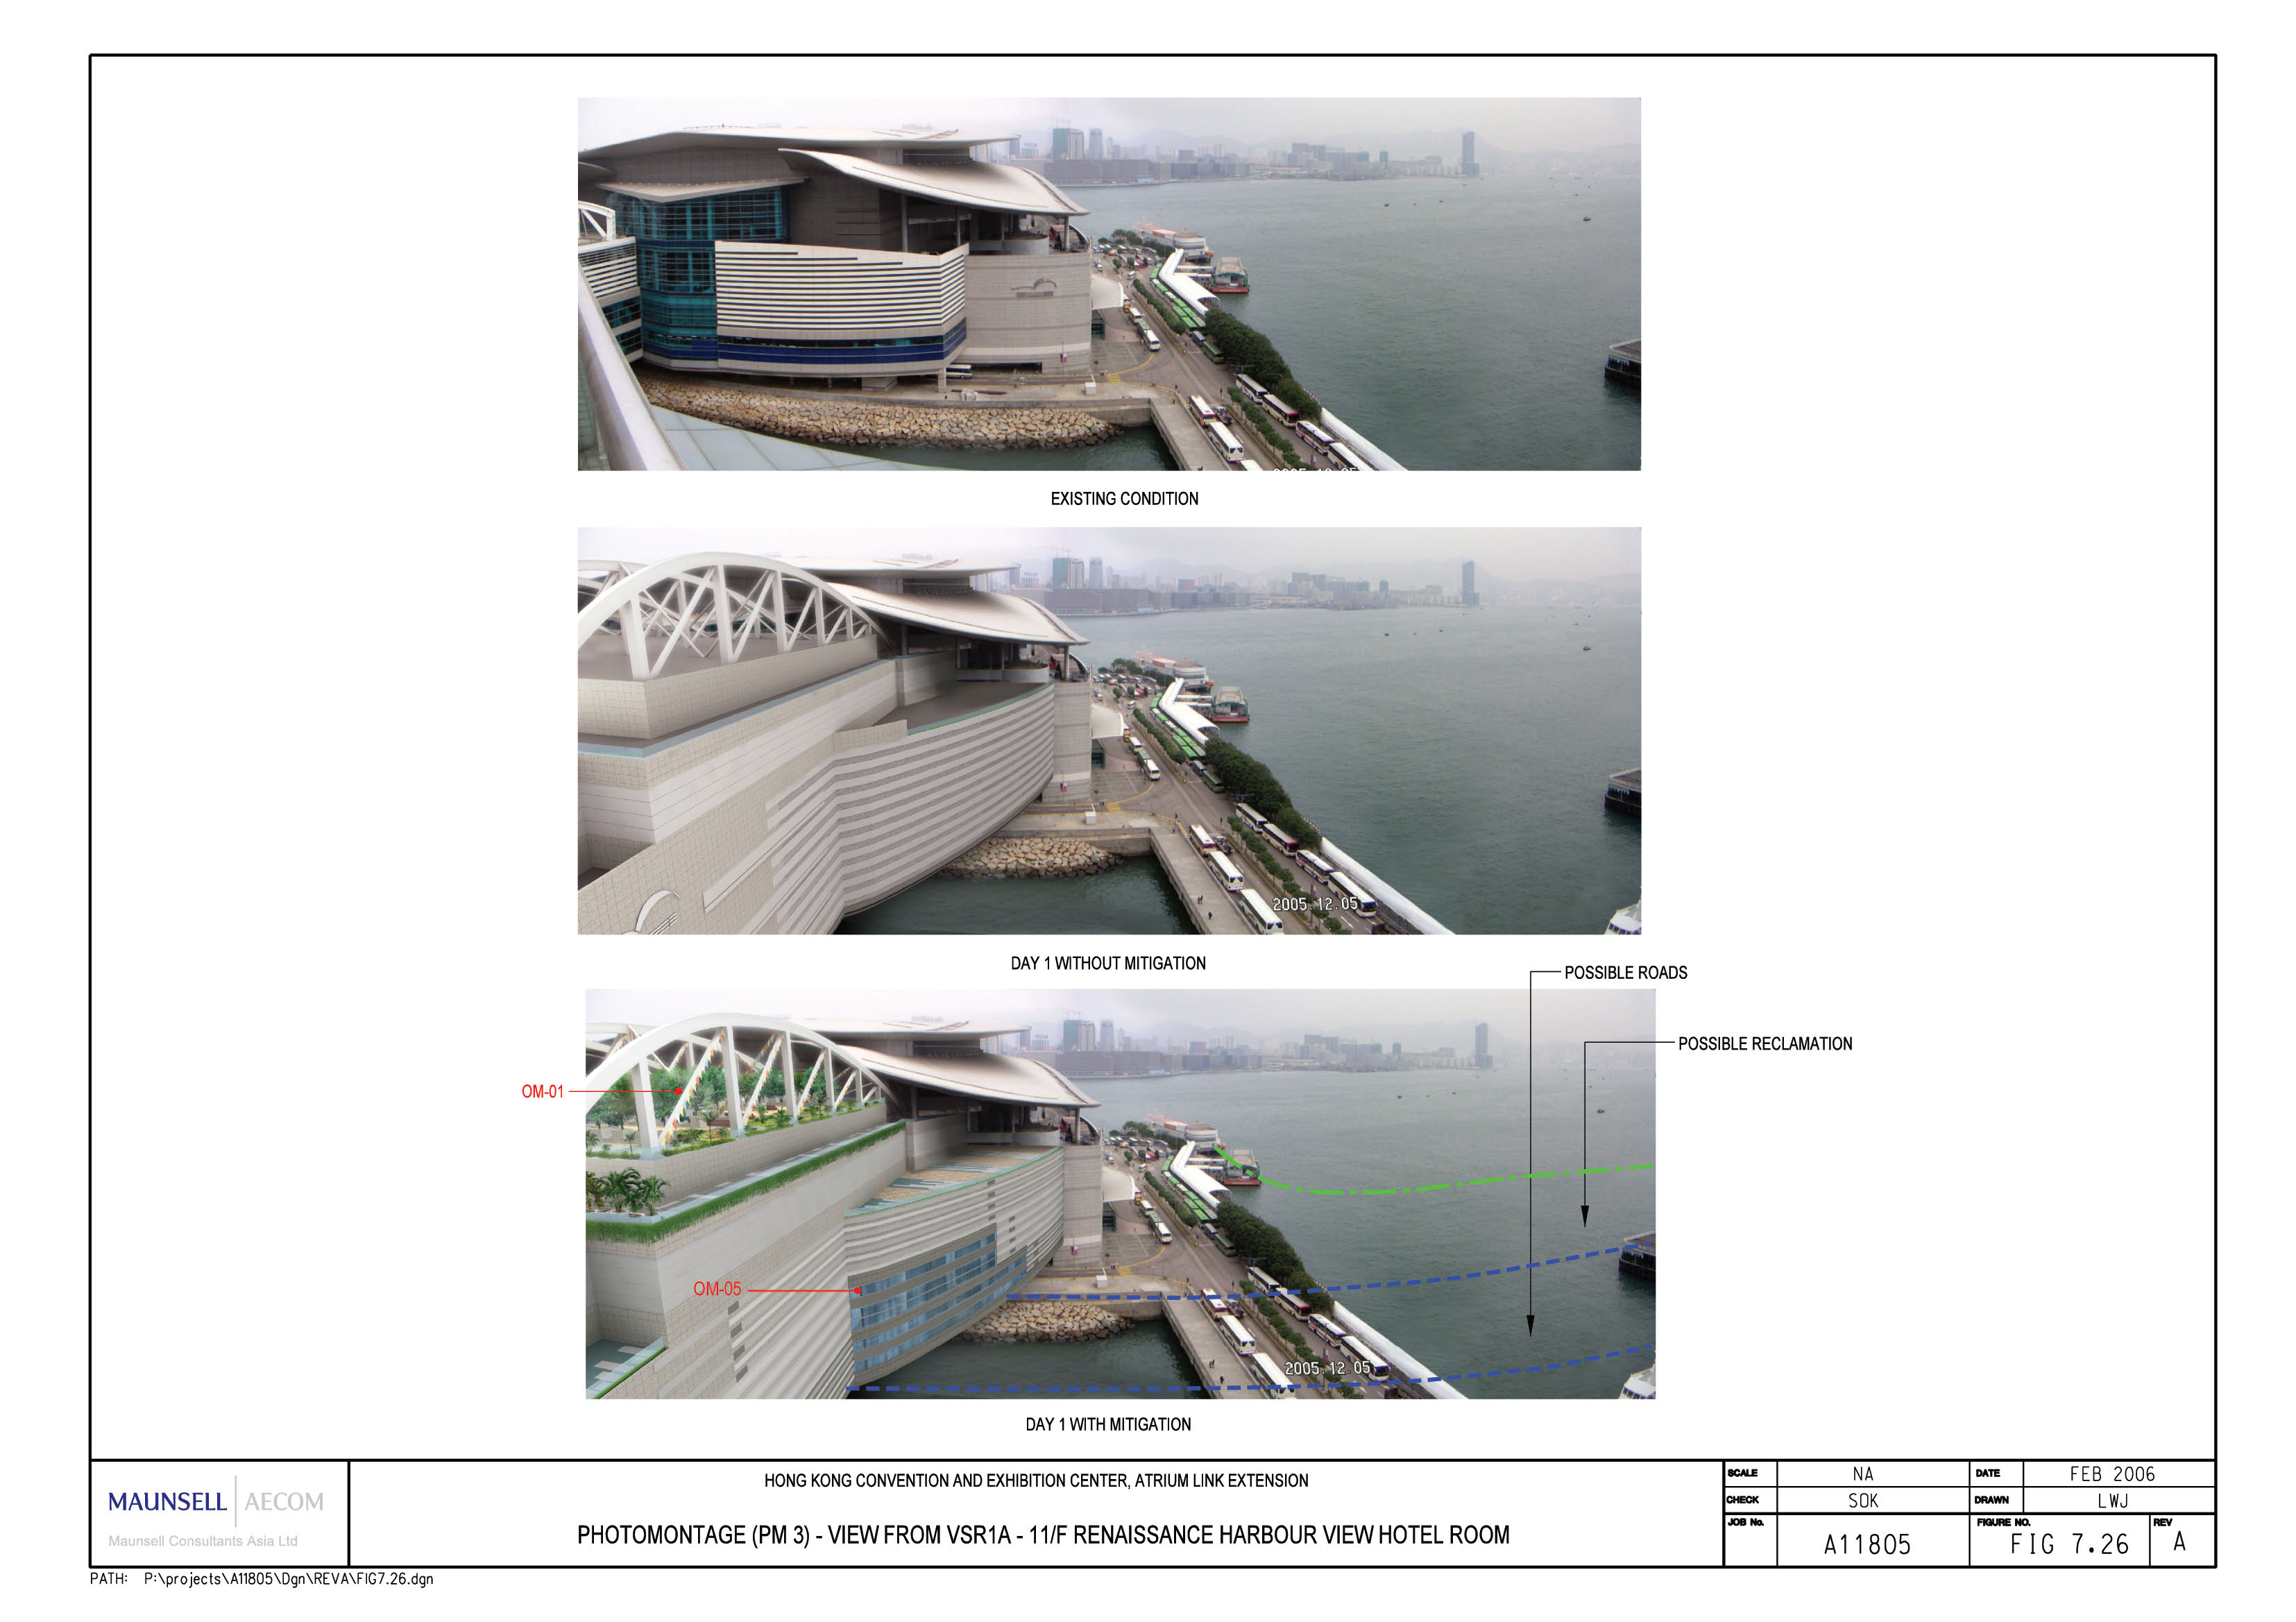
Figure 7.26 Photomontage (PM 3) – View from VSR
1A – 11/F Renaissance Harbour View Hotel Room
Figure 7.27 Photomontage (PM 4) – View from VSR
1B – Open Space Along Fenwick Pier Street
Figure 7.28 Three-dimensional Architectural/
Landscape Illustration
Figure 7.29 Photo Illustration
on Sensitive Design for Shady Area under ALE (OM-02)
Figure 7.30 Photo Illustration
on Sensitive Design for Rooftop Space on ALE (OM-01)
Figure 7.31 Landscape Section across the proposed
ALE
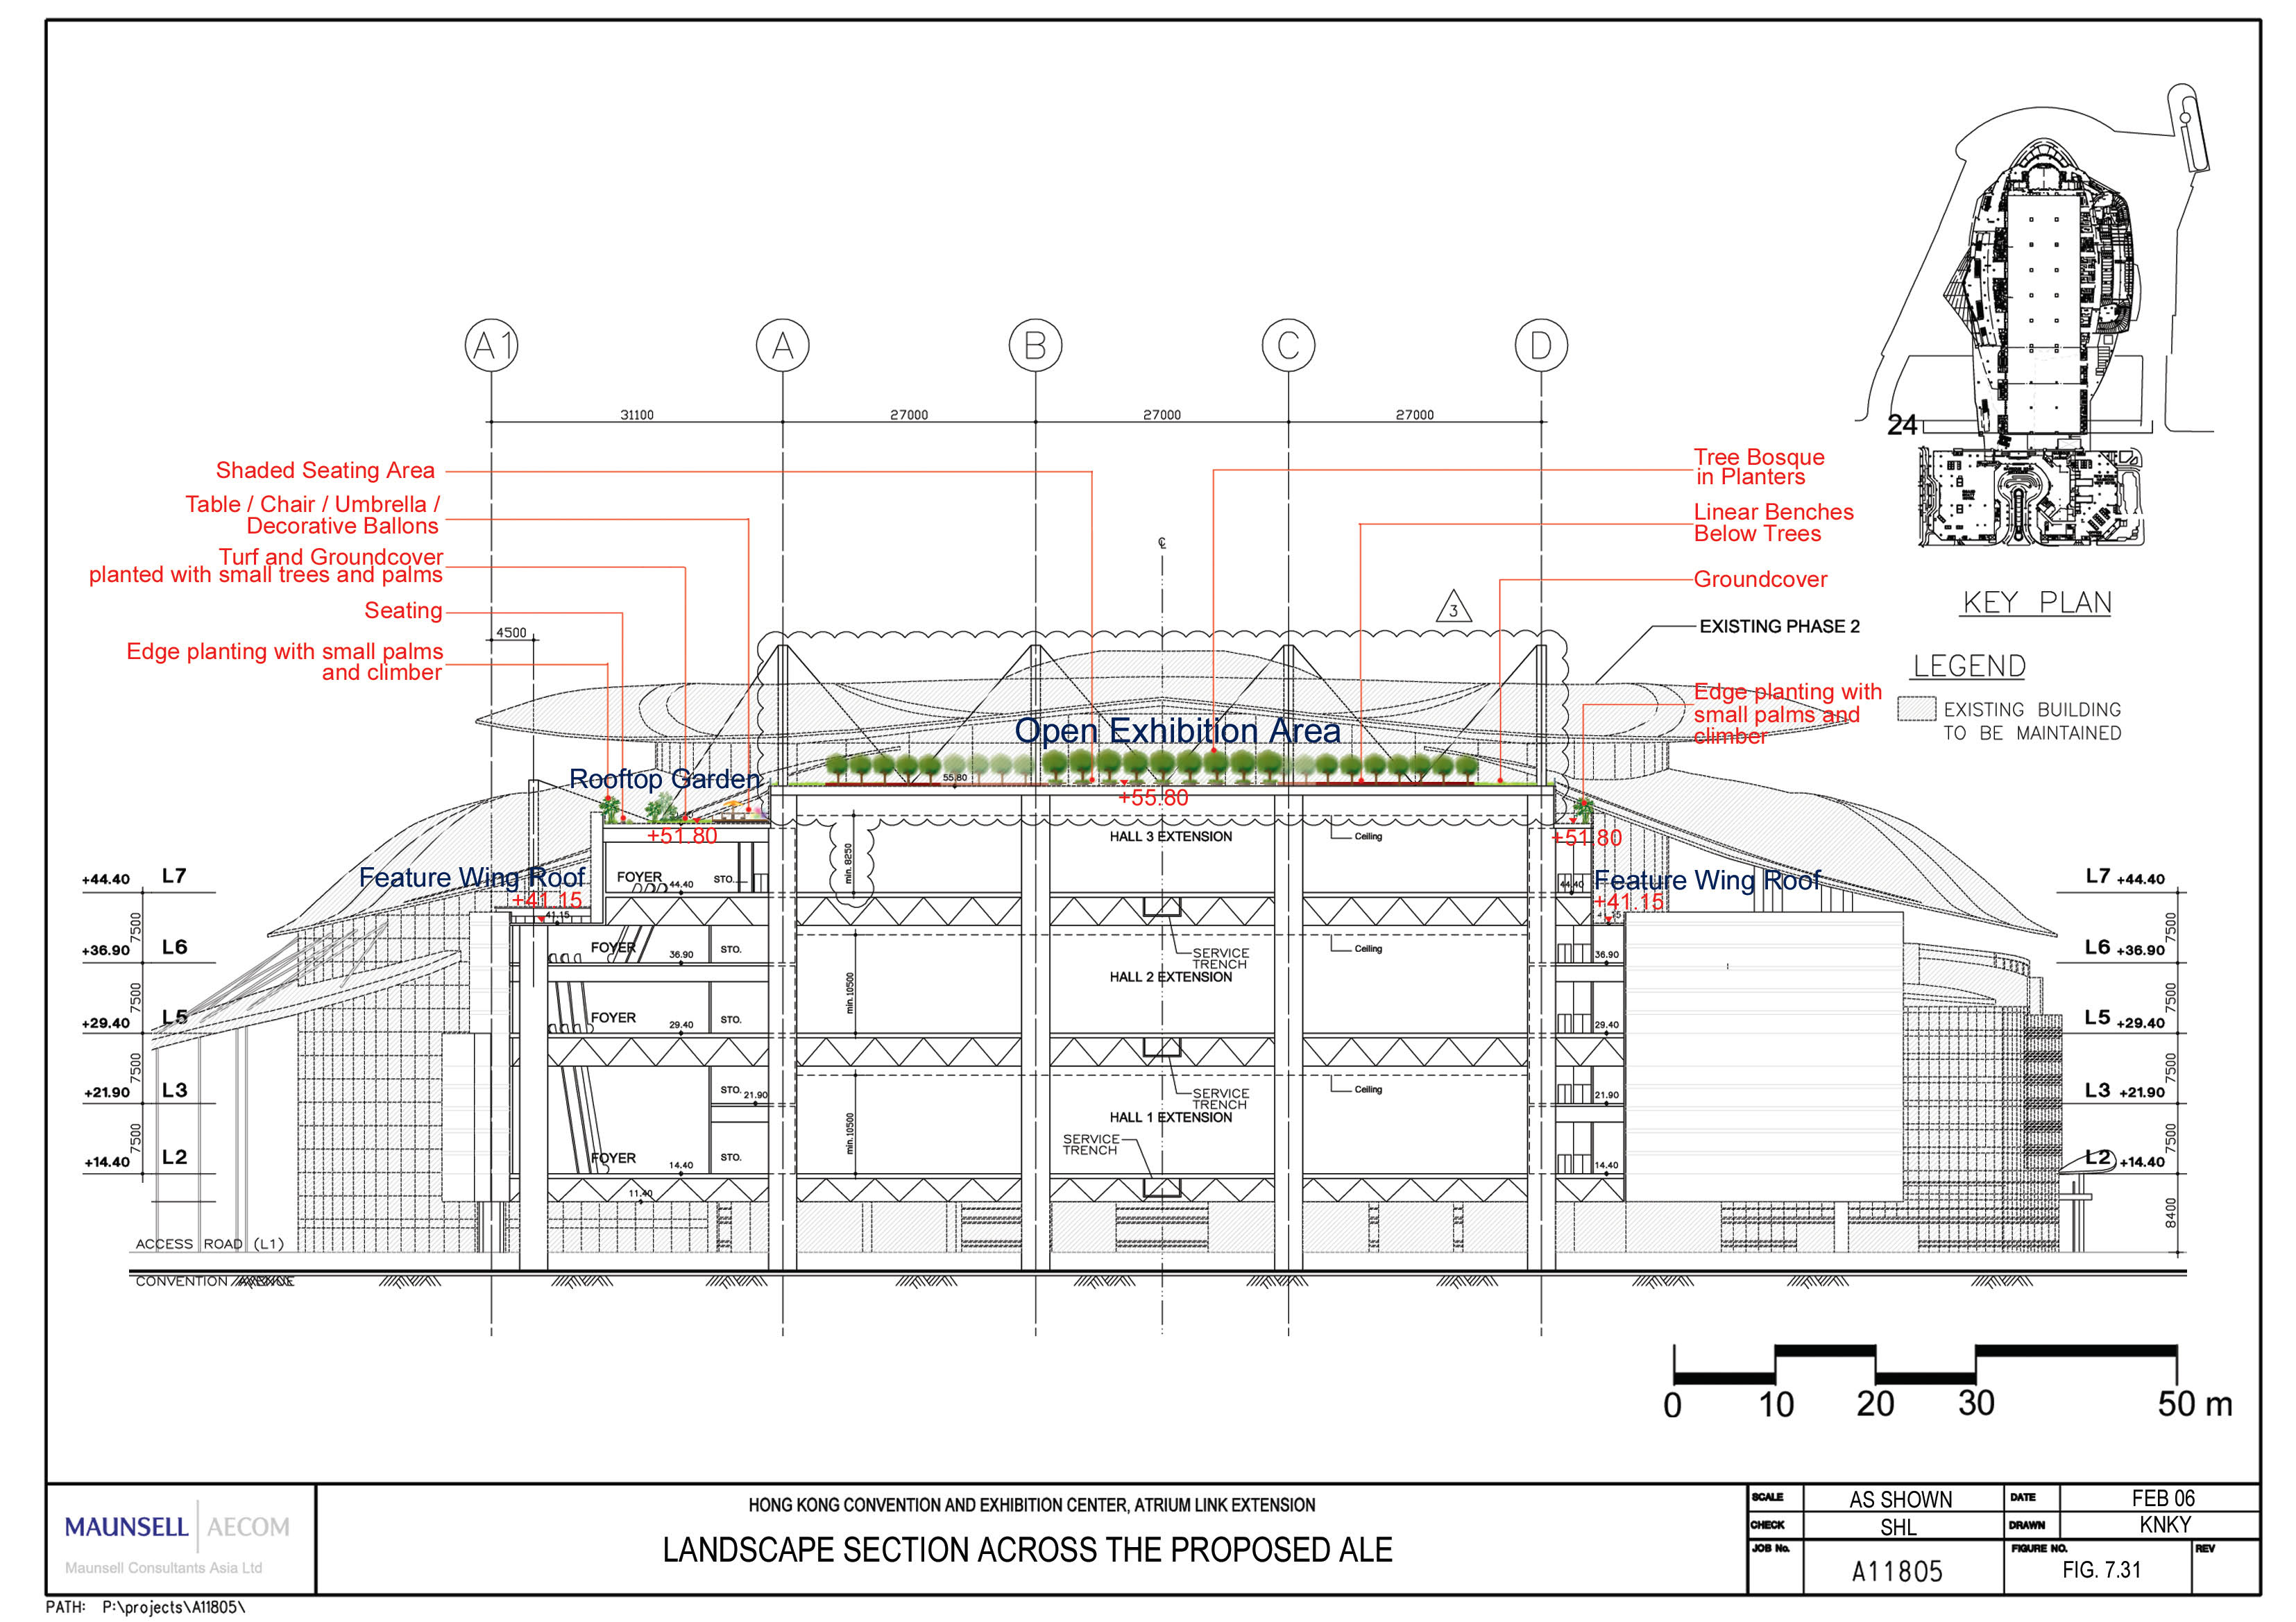
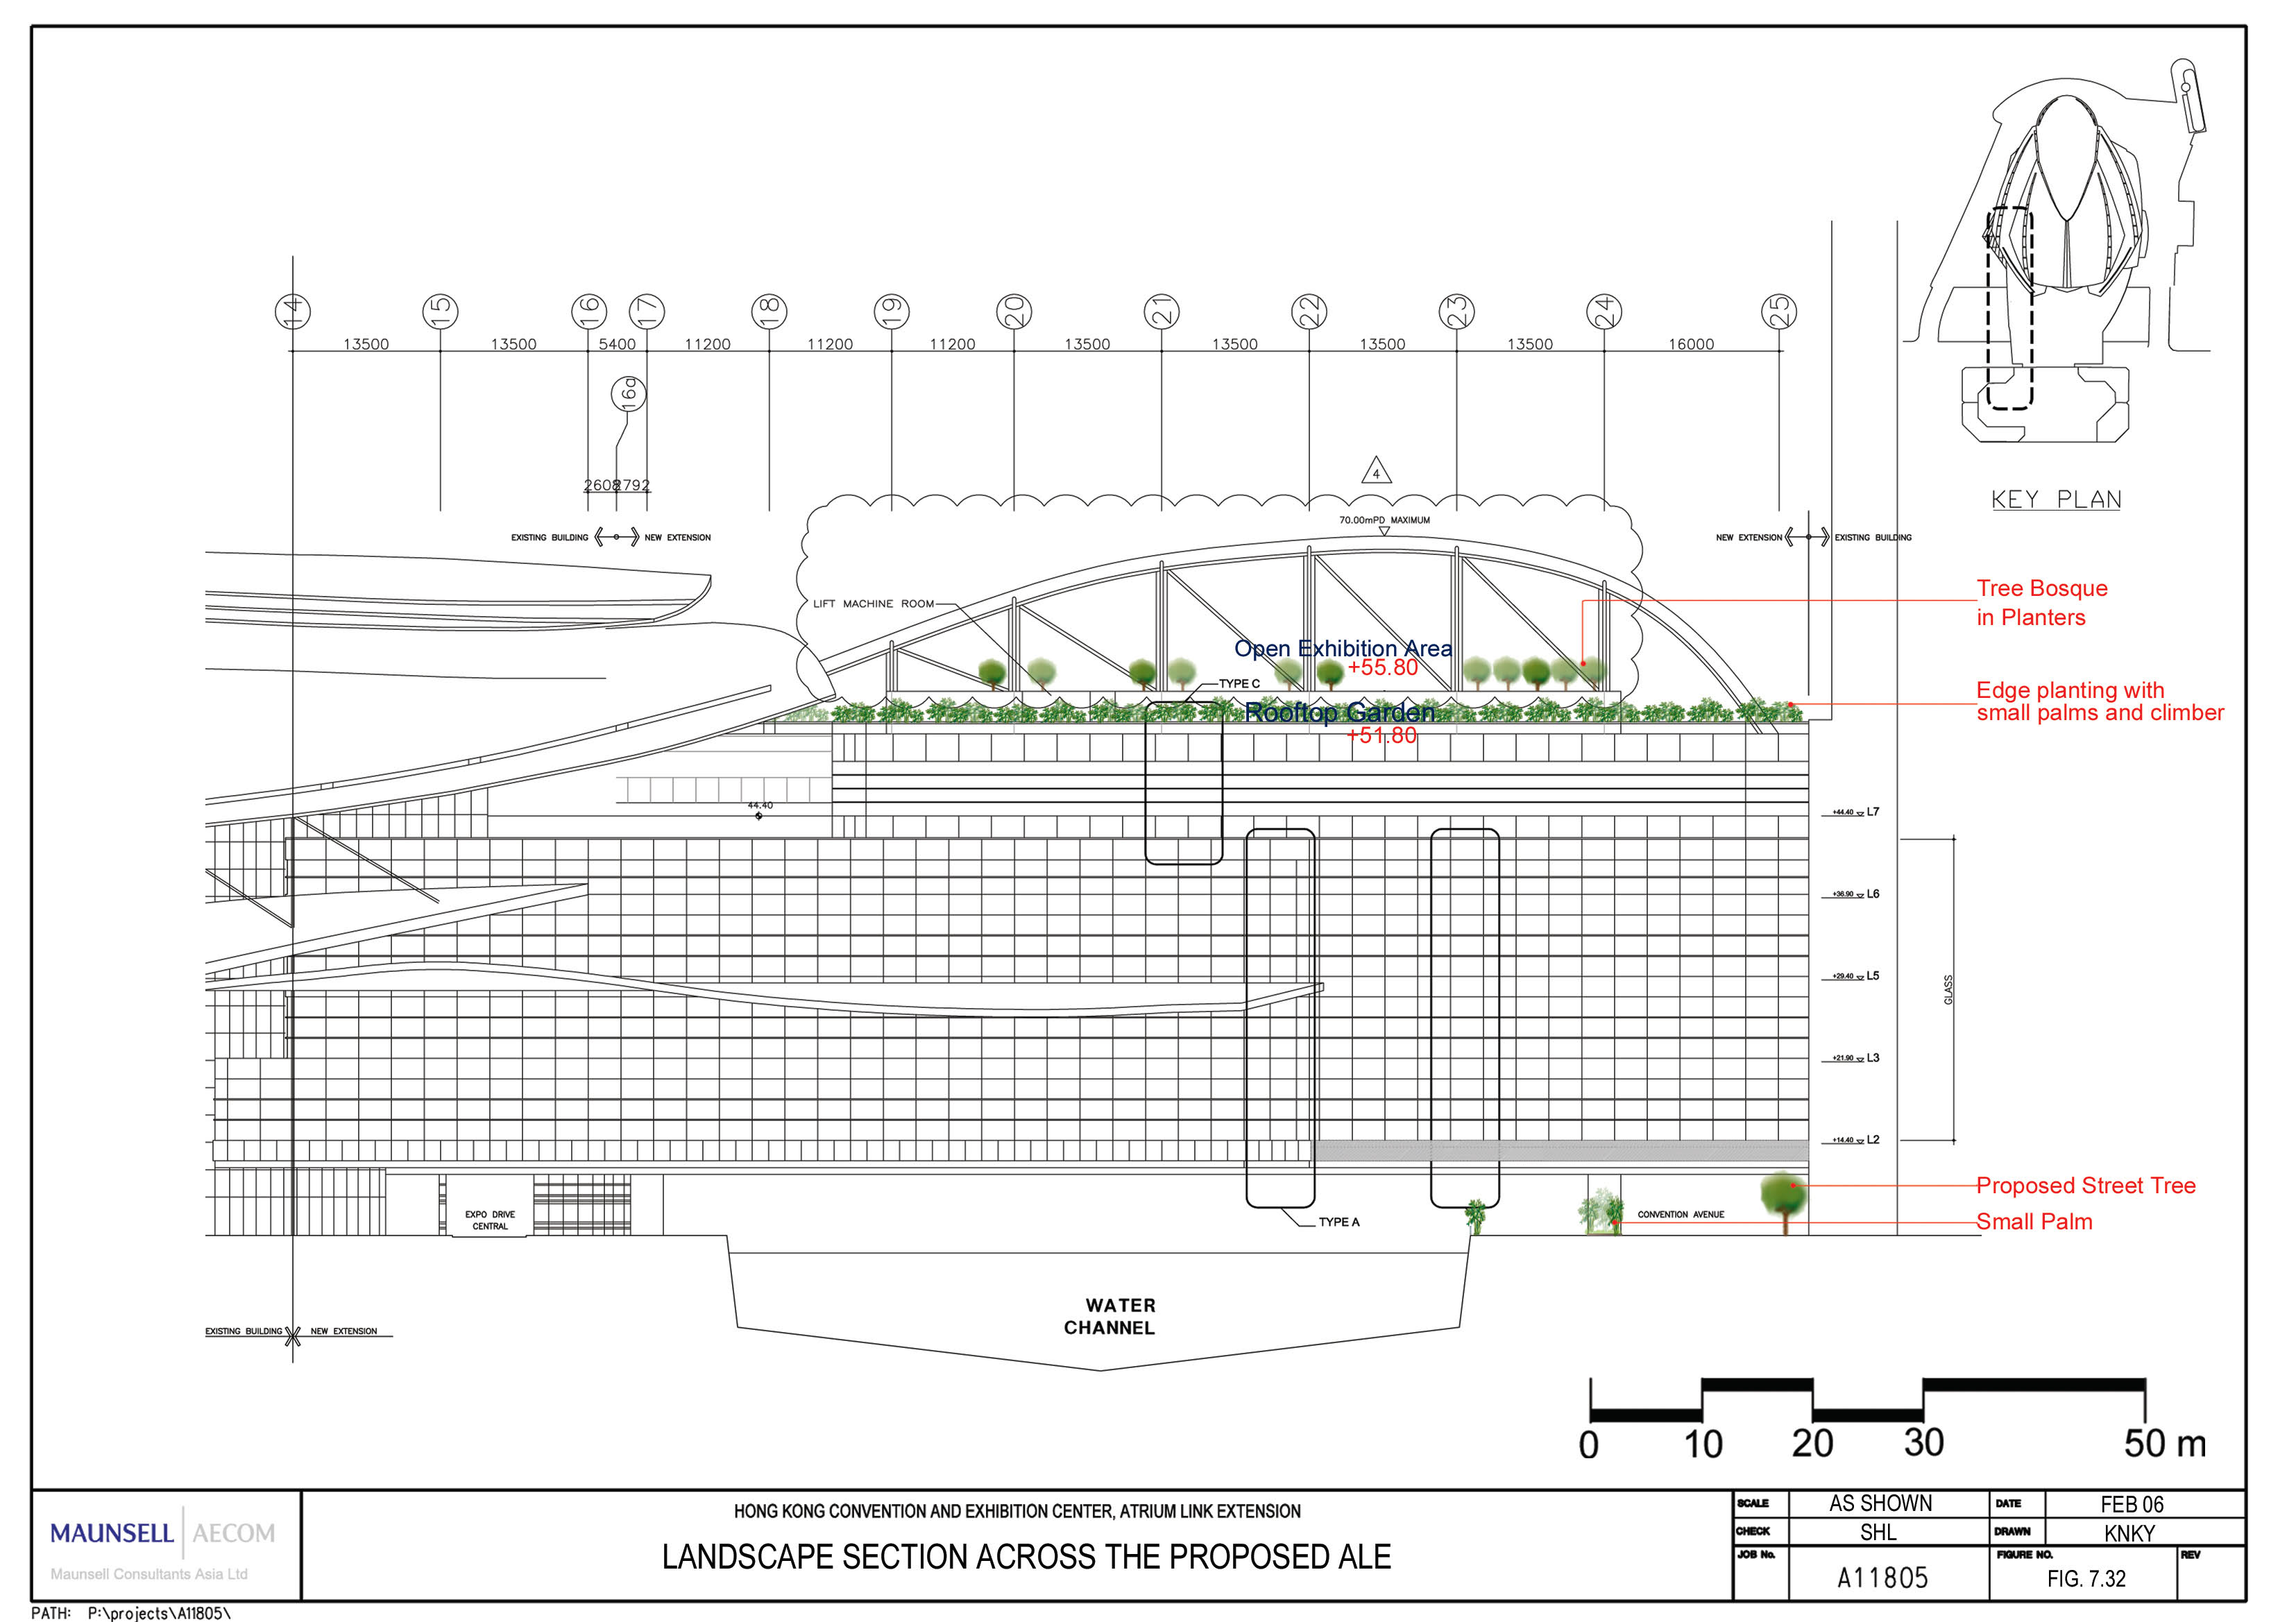
Figure 7.32 Landscape Section across the proposed
ALE
Appendices
Appendix 2.1 Details
of the Marine Pile Layout for Temporary Footbridge
Appendix 3.1 Sensitivity
Test for Emission Rates for Year 2024 and Year 2009
Figure A3.1 2009 AM Peak Hour Forecast Traffic Flow
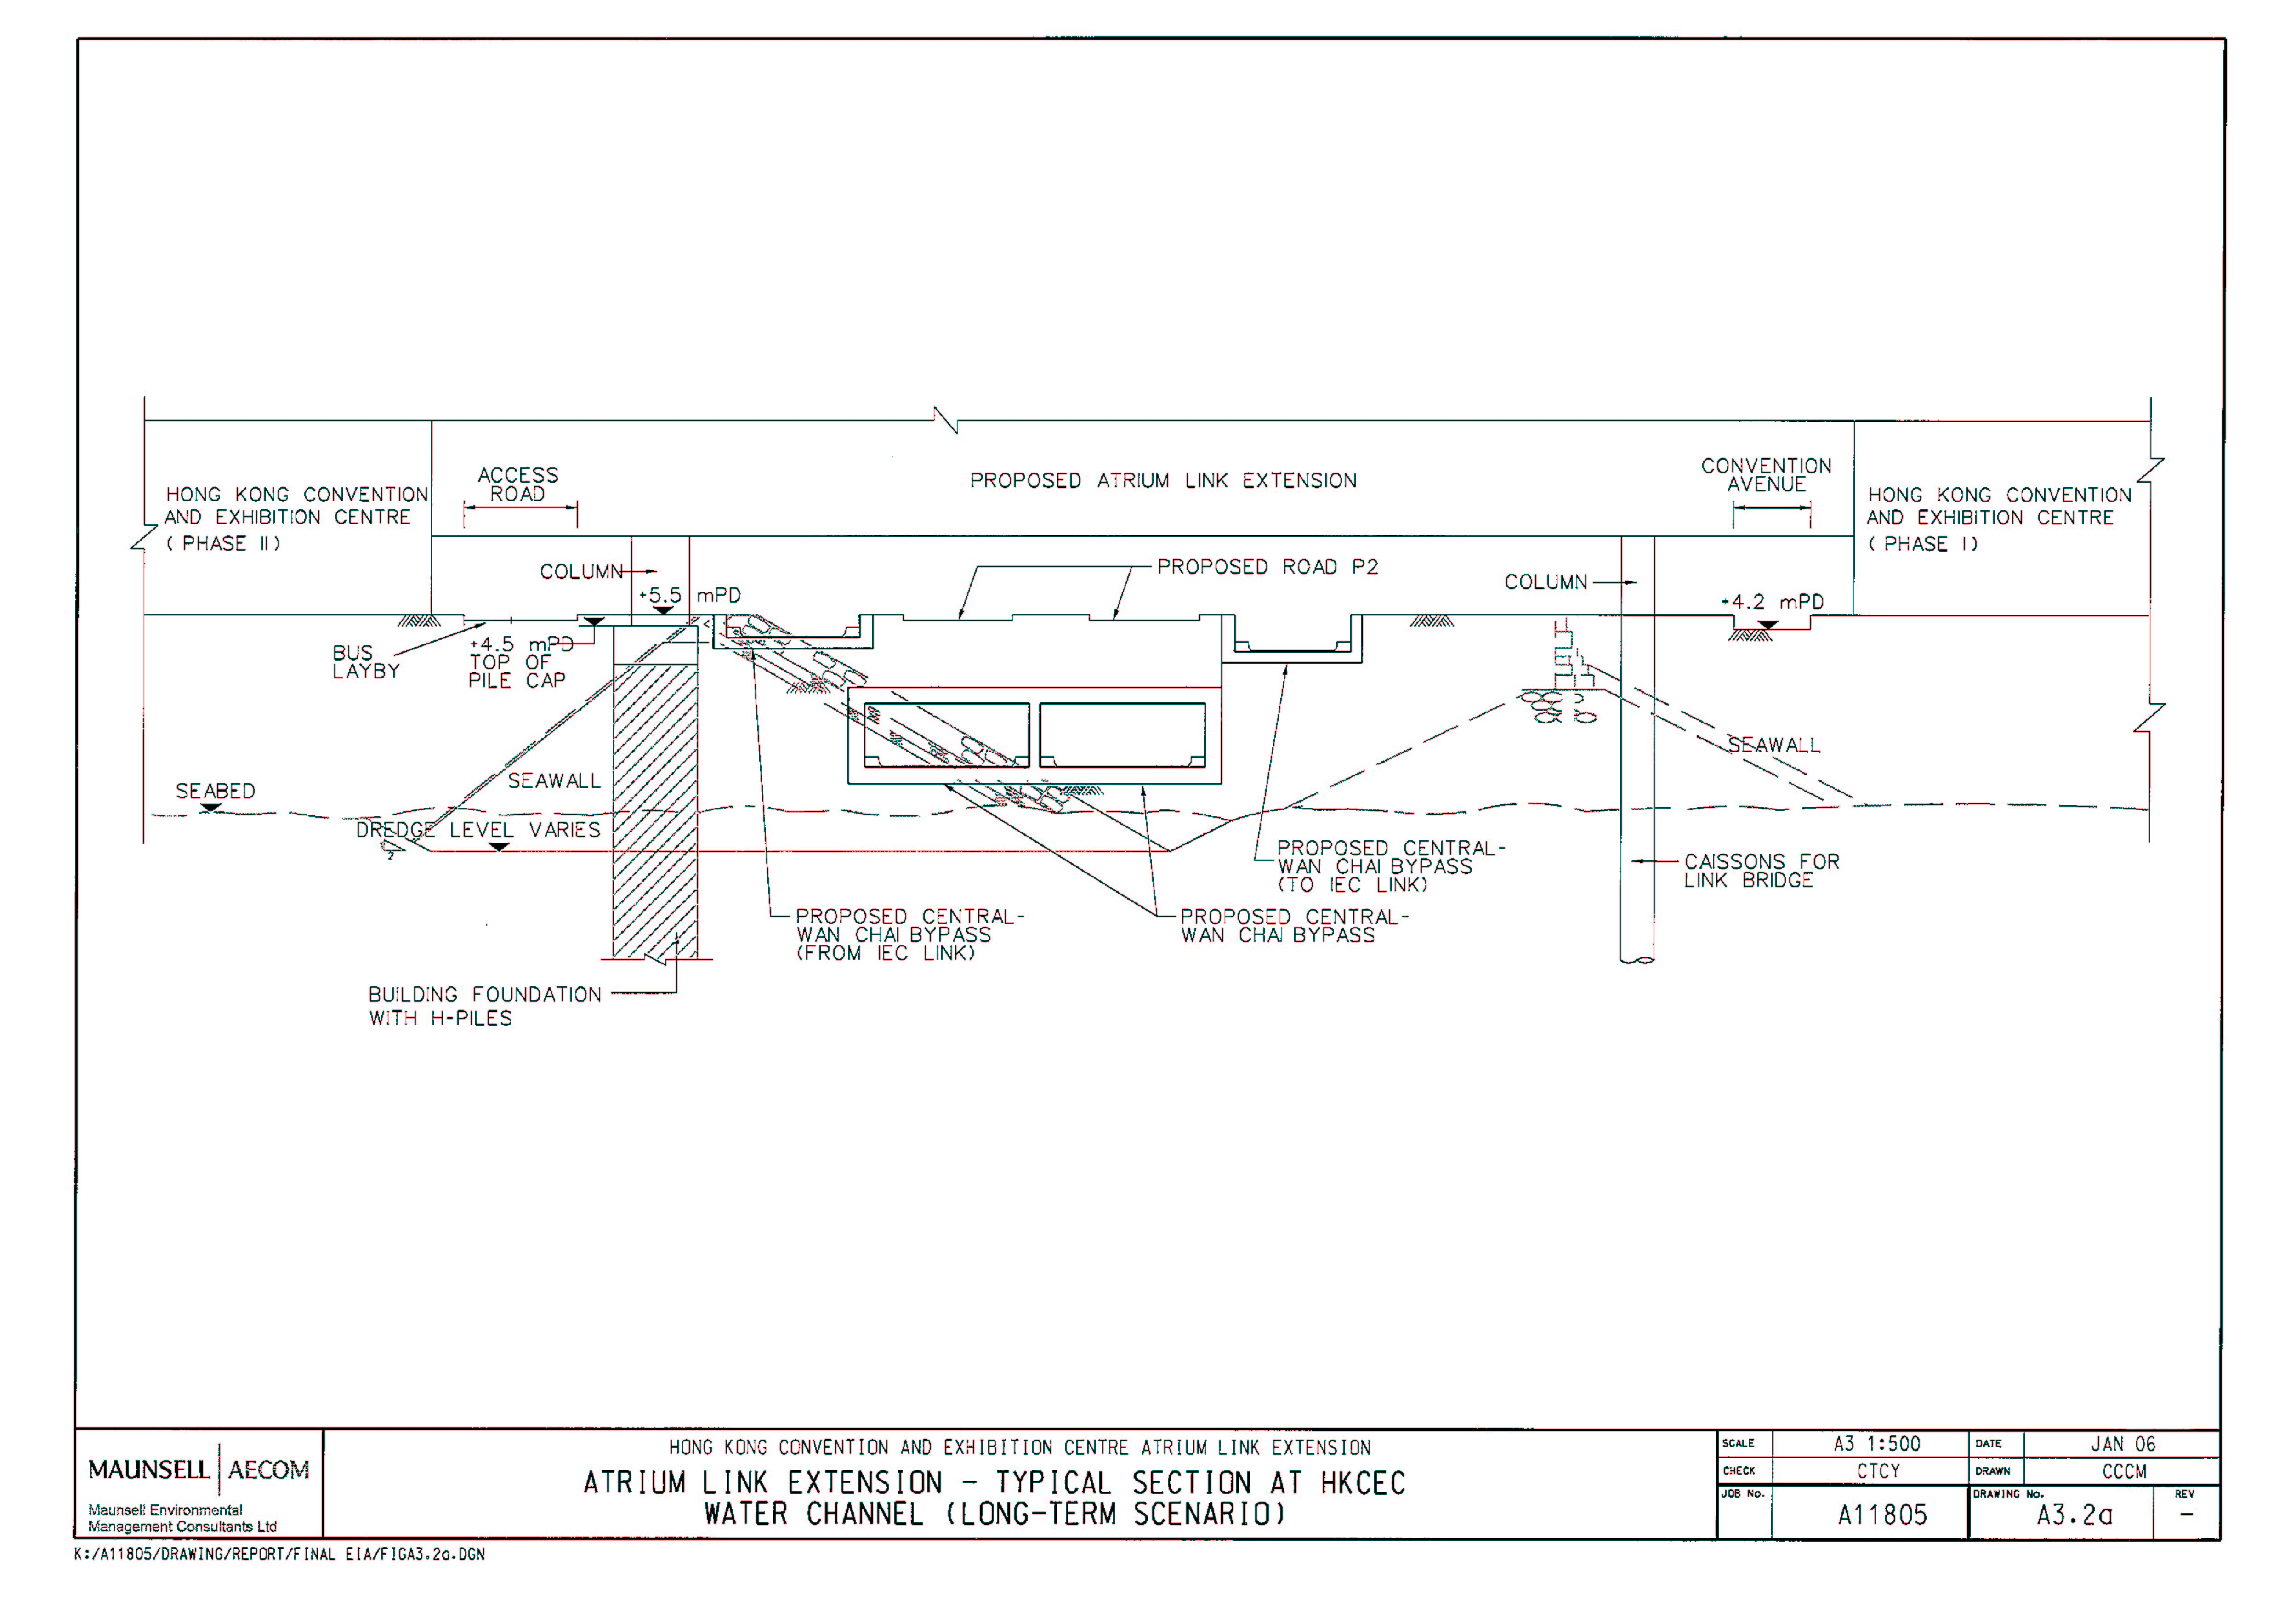
Appendix 3.2a Atrium
Link Extension – Typical Section at HKCEC Water Channel (Long-Term Scenario)
Appendix 3.2b Atrium
Link Extension – Typical Section at HKCEC Water Channel (Interim Scenario)
Figure A3.3 CALINE4 Road Plot & ISC3 Portal Location (Long-term Scenario)
Appendix 3.4 Details
for the calculations of Portals (Long-Term Scenario)
Figure A3.5 CALINE4 Road Plot & ISC3 Portal Location (Interim Scenario)
Appendix 3.6 Details
for the calculations of Portals (Interim Scenario)
Figure A3.7 Designated Assessment Points for Proposed Deckover Air Quality (Long-term Scenario)
Figure A3.8 Designated Assessment Points for Proposed Deckover Air Quality (Interim Scenario)
Appendix 3.9 Agreement
from Hotel Operators on Re-diversion of Fresh Air Intakes
Appendix
5.1 Grid Layout of Wan Chai Model
Appendix 5.2 Bathymetry Schematization of Wan Chai Model
Appendix 5.2a Model Performance Check
Appendix 5.3 Mathematical Expressions for Pile
Friction and Details of Porous Plates
Appendix
5.4 Momentary and Accumulated Flow
for Dry Season
Appendix
5.5 Momentary and Accumulated Flow
for Wet Season
Appendix
5.6 Tracer Contour Map for Dry
Season
Appendix
5.7 Tracer Contour Map for Wet
Season
Appendix
5.8 Baseline Population and Flows
Projection
Appendix
5.9 Existing and Committed Sewerage
System under Assessment
Appendix
5.10 Capacity Performance of Existing
Trunk Sewers in 2011 (Baseline Condition)
Appendix
5.11 Details of Drainage Impact
Assessment
Appendix 5.12 Details of Good Site Practice and Water Pollution Control
Measures
Appendix 7.1 The Proposed Work
Appendix 7.2 Preliminary Tree Survey