3
Additional
Analysis
This appendix presents additional analyses and further investigations
performed for unlikely events and sensitivities to some study assumptions.
The LNG carrier will be constructed in
compliance with the International Maritime Organization (IMO) Code for the
Construction and Equipment of Ships Carrying Liquefied Gases in Bulk. This standard
requires that the inner hull forming the cargo tanks be protected against embrittlement from liquid cargo through a combination of
proper material selection and insulation.
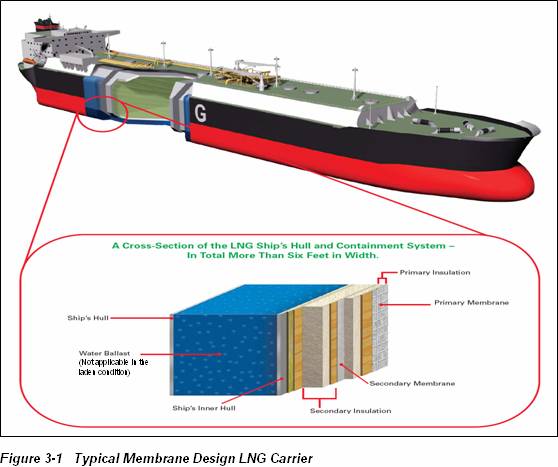
Figure 3‑1
illustrates the usual configuration of an example LNG membrane carrier. To protect the carrier’s inner hull
against embrittlement, there is a primary and
secondary membrane together with primary and secondary insulation. Material on the carrier that comes into
contact with LNG (typically at -162°C) is typically made of stainless steel or
Invar. This alloy is designed to
withstand LNG temperature and thus prevent embrittlement
of these surfaces. With more than 45,000 LNG shipments worldwide over the past four
decades, there have been no reports of collisions or groundings that have
resulted in a breach of containment.
However, the three
most likely scenarios envisioned which could potentially lead to LNG coming
into contact with steel not designed for low temperatures. These are:
1. Spillage from the LNG piping at the manifold
2. Seepage from a containment system
3. Breach of LNG containment
3.1.1
Scenario
1 – Spillage from LNG Piping at the Manifold
The first scenario
that could lead to the contact of LNG with non-cryogenic service steel is
spillage from the LNG piping at the manifold during disconnection of the cargo
transfer arms. The probability of this scenario is low given the operational
procedures and the double valve arrangement. These limit the possible release
volume to a small amount. As a
safeguard against localized damage to deck plating, and to ensure rapid
evaporation of any spill, a water curtain is provided during the cargo transfer
and while disconnecting the arms.
Although localized damage to deck plating may result, this would not
threaten the ship’s structure or the cargo containment. Operating history has
shown no escalation from this type of spillage and the resulting local embrittlement of the deck plate.
3.1.2
Scenario
2 – Seepage from Containment System
Seepage through
seams or small leaks in the containment system may occur. These are monitored
and detected by a nitrogen purging and monitoring system
provided in the space between the inner hull and containment membrane.
Experience has shown that the volumes involved vaporize rapidly without any
cryogenic damage occurring. When warranted, the carrier is then taken out of
service to repair the leak.
3.1.3
Scenario
3 – Breach of LNG Containment
![]()
Various low
probability scenarios resulting in a large leak of LNG have been postulated
(most notably following a high energy collision or grounding). These scenarios have
been included in the MQRA study, with their hazard zones being determined by
the extent of the vapor cloud or pool fire that would result from the primary
breach. In the context of this discussion regarding the risks associated with
cryogenic effects of an LNG release, the critical question is; can the cascade
events, caused by embrittlement due to the cryogenic
effect of the spilled LNG, be worse than the consequences of the initiating
breach event?
This issue is
addressed in the following section.
The question to be
answered is – can the cascade events, caused by embrittlement
due to the cryogenic effect of the spilled LNG, be worse than the consequences
of the initiating breach event?
There are two
hypothetical scenarios under which this would be the case:
·
Direct impact, leading to worse damage to the
leaking cargo tank or new damage to an adjacent cargo tank
·
Break up of the LNG Carrier structure leading to
collapse of the cargo tanks
The MQRA study has concluded that the answer to the critical question
expressed above is; no.
The impact of LNG
on the carrier’s structure or adjacent containment following such a release is
a complex sequence of events that to assess involves analysis of the following:
·
Likely interaction between potential water ingress
and LNG egress
·
Location of structural damage with respect to the
water line
·
Susceptibility of the materials to embrittlement
·
Identification of structural members/bulkheads
contacting the LNG
Given
the impracticality of replicating the events, no full scale tests have
simulated such scenarios. Hence,
analytical methods of the above factors and professional judgment must be
employed to assess and understand the impact of such an event as part of
MQRA.
The Sandia Report
(ref. 01) considers several incident scenarios and assesses
the potential for and impacts of LNG carrier damage. Sandia draws its conclusions from “embrittlement scoping analyses (that) were conducted to
assess the potential damage to an LNG carrier from small and large LNG spills
based on available fracture mechanics data and models”. Sandia concludes:
·
While accidental incidents could lead to minor to
moderate damage to a LNG carrier, they would not lead to severe structural
damage and the potential for cascading damage to other tanks.
·
Should there be a secondary event, “This cascading
release is not expected to increase significantly the overall fire size or
hazard ranges, but the expected fire duration would increase.”
As part of the
MQRA, further consideration has been given to the underlying basis in order to
substantiate the conclusions.
3.2.1
Direct
Impact of Cargo Tanks
The following
factors combine to ensure that the likelihood of worse damage (than the primary
containment breach) is sufficiently small to be discounted in the context of
the MQRA:
·
Mitigated where there is also a significant inflow
of seawater
·
Cargo tank construction materials designed to
contain LNG
·
Damage to adjacent tanks has the pre-requisite of
bulkhead failure
·
Cascade damage will not be instantaneous
·
Embrittlement damage mechanism
(cracking) results in much smaller leak sizes than from massive physical trauma
Where there is
also a significant influx of seawater, the LNG would be rapidly vaporized (thus
reducing the embrittlement that prolonged contact
with the cryogenic liquid could cause). This therefore reduces the potential
for such damage with grounding events or below the waterline breaches of
containment following high energy collisions.
For a secondary
loss of containment due to embrittlement, the
expected size of a secondary release is likely to be much smaller than that of
the initial event. Having
considered the smaller size/volume of the secondary leak along with the time
elapsed following the initial event, an embrittlement failure is not anticipated to increase the
size of the hazard zone that was created by the initial release assessed.
Therefore, the
potential for embrittlement related secondary leaks
is not expected to increase the transit risk levels assessed in the MQRA. The
potential for secondary leaks should, of course, still be considered when
developing prevention and mitigation strategies.
3.2.2
Impact
to Carrier Structure
The following
factors combine to ensure that the likelihood of significant damage to the
carrier structure is sufficiently small to be discounted in the context of the
MQRA:
·Mitigated
where there is also a significant inflow of seawater
·As in any ocean
going vessel, the primary strength consideration for an LNG Carrier is the
longitudinal strength that runs along the longitudinal axis of the vessel (ref.
02)
·Due to their
further distances away from the neutral axis, bottom, inner tank top and deck
plates with associated stiffeners contribute more to longitudinal strength than
vertical members like sideshell, longitudinal bulkheads with associated
stiffeners
·Vessel is
designed for damaged stability with certain flooded conditions.
·Bending
moment and shear forces are usually greatest amidships, so collisions towards
the bow and stern will be less critical
· Mitigated
where there is also a significant inflow of seawater
·
As in any ocean going vessel, the primary strength
consideration for an LNG Carrier is the longitudinal strength that runs along
the longitudinal axis of the vessel (ref. 02)
·
Due to their further distances away from the
neutral axis, bottom, inner tank top and deck plates with associated stiffeners
contribute more to longitudinal strength than vertical members like sideshell, longitudinal bulkheads with associated
stiffeners
·
Vessel is designed for damaged stability with
certain flooded conditions.
·
Bending moment and shear forces are usually
greatest amidships, so collisions towards the bow and stern will be less
critical
Again, where there
is also a significant influx of seawater, the LNG would be rapidly vaporized
(thus avoiding the embrittlement that prolonged
contact with the cryogenic liquid could cause). This therefore eliminates the
potential for such damage with grounding events or below the waterline breaches
of containment following high energy collisions.
LNG spilled from
an above waterline breach of containment will only come into contact with
structural members that are not critical to overall structure of the carrier.
Thus only localized damage will result.
There is considerable residual strength
available in the carrier, unless it is flooded. This can be assumed to exist
since flooding would mitigate the cryogenic damage.
3.2.3
Event
Tree Approach
An event tree approach was initially used to determine
the possible frequency related to cascade event failures. However, to populate the event tree
probabilities, a majority of the entries were decided by expert judgment or
assumptions as there has never been such an event in the historical record. Thus the above approach to logically
evaluate the mechanisms of such a release event and how these relate to the
scenarios that have been included in the current MQRA study has been adopted.
3.3
Tsing Ma Bridge Impact
3.3.1
Tsing Ma Bridge Description
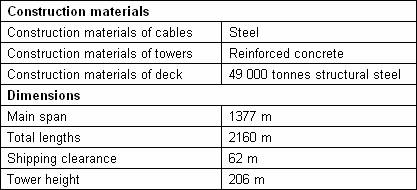
The Tsing Ma Bridge
links Tsing Yi Island on the east to Ma Wan Island on
the west over Ma Wan Channel. It is a suspension bridge with two deck levels
and carries both road and railway traffic. It has a main span of 1,377 meters
and a height of 206 meters. There are two towers with one located on Wok Tai
Wan on the Tsing Yi side and the other on a man-made
island 120 meters from the coast of
Table 3‑1 Details of the Tsing
Ma Bridge
3.3.2
Failure
Case Definition for Pool Fire
The
grounding and collision scenarios modeled for pool fire are defined in Appendix
I (Table I-33). Sensitivity analysis has shown that the small carrier and large
carrier result in almost the same pool size for the same scenario. Therefore,
the fire dimension and radiation to the bridge will be almost the same. In this study, the pool fire caused by
collision was modeled based on small carrier, and the pool fire caused by
grounding was modeled based on large carrier.
3.3.3
Calculation
of Pool Fire Impact
Flame Height
The pool fire is analyzed through fire consequence modeling described as
follows. The pool fire flame is modeled as a cylinder that is tilted by the
wind with a diameter D, height H, and tilt angle q (measured from the vertical), as shown in Figure 3‑2. The wind
can also cause the flame to extend downwind from the pool in addition to the
tilting effect.
Various correlations are available to model the flame height. SAFETI
uses the Thomas (ref. 03) correlation.

Where:
![]() : visible flame height (m)
: visible flame height (m)
![]() : equivalent pool diameter (m)
: equivalent pool diameter (m)
![]() : mass
burning rate (kg/m2s)
(0.35 kg/m2s)
: mass
burning rate (kg/m2s)
(0.35 kg/m2s)
![]() : air
density (1.2 kg/m3 at 20 OC and 1 atm)
: air
density (1.2 kg/m3 at 20 OC and 1 atm)
![]() : acceleration of gravity (9.81 m/s2)
: acceleration of gravity (9.81 m/s2)
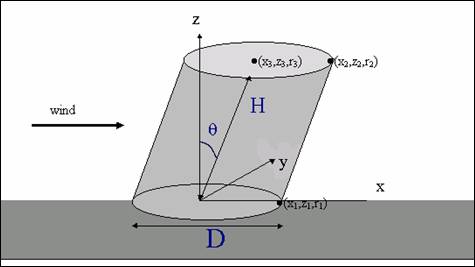
Figure 3‑2
Illustration of the Shape of Pool Fire Flame
Moorhouse (ref. 04) proposed another flame height correlation based on
large LNG tests and it includes the effect of wind on the flame length:


Where,
![]() : nondimensional wind speed
: nondimensional wind speed
![]() : measured
wind speed at 10m height (m/s)
: measured
wind speed at 10m height (m/s)
![]() : vapor
density at the boiling point of liquid (kg/m3) 1.80 kg/m3
: vapor
density at the boiling point of liquid (kg/m3) 1.80 kg/m3
LNGFIRE3 software was also employed to assess the flame height. For
circular pools, LNGFIRE3 also uses the Thomas (ref. 03) correlation.
The flame height results from SAFETI, Moorhouse,
and LNGFIRE3 are summarized in Table
3‑2 for the four weather cases modeled at the bridge
location.
Both SAFETI and LNGFIRE3 use the Thomas correlation, but different flame
heights resulted from the two models for the same scenario. The difference
could result from different values used in the two models for the same
parameters, especially the mass burning rate. SAFETI uses 0.35 kg/m2s
as the burning rate over water. The value used in LNGFIRE3 was not found in the
available documentation. It could
use a lower value, which would result in a lower flame height.
Table 3‑2 Pool Fire Flame Height for Different
Scenarios

Thermal Radiation
LNGFIRE3 was employed to calculate the thermal radiation to the bridge
structure. LNGFIRE3 has been validated against the results of large scale
experiments. It is recommended by NFPA 59A to calculate LNG thermal radiation
in LNG handling.
Most of the models/software can only calculate the thermal radiation for
target not higher than the flame height. To model the radiation to the bridge
above the flame, one assumption was made in the calculation: the radiation to
the above bridge deck A is the same as the radiation to the vertical deck B
beside the flame. As shown in Figure 3‑3, A and B are at the same distance h to the flame. For
example, if the pool fire flame height is 45 m, the distance of the target to
the flame is h=62 m – 45 m =17 m (where 62m is the clearance height of the
bridge).


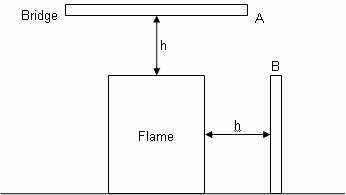
Figure 3‑3 Thermal Radiation to Bridge
In LNGFIRE3, the target exposed to a cylindrical fire will receive
radiation at a rate determined by the following equation:
![]()
Where:
![]() : Radiant
flux at receiver
: Radiant
flux at receiver
![]() : Atmospheric
transmissivity
: Atmospheric
transmissivity
![]() : Solid
plume view factor
: Solid
plume view factor
![]() : Average
surface emissive power at the flame centre
: Average
surface emissive power at the flame centre
Some assumptions were made in calculating the radiation using LNGFIRE3:
·
No tilt
in the pool fire flame, i.e., the flame height is equal to the length.
·
Thermal
radiation is different if the target point is at different height levels, even
the horizontal distance of the target from the flame is the same. According to
LNGFIRE3, the largest radiation occurs when the height is at about the same
level as the center of the flame. In this study, the bridge is assumed to be
exposed to the largest radiation that could occur at its distance to the flame.
·
If the
flame height is higher than bridge height, the bridge is engulfed by flame, and
the radiation is equal to the emissive radiation of the flame.
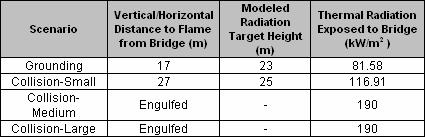
The thermal radiation to the bridge is shown in Table 3‑3.
Table 3‑3 Thermal Radiation to Bridge
Structure Failure due to Fire
As stated, the Tsing
Ma bridge has two deck levels. The
lower deck level will serve to protect the structure of the upper deck level as
well as the suspension cables. The deck is made of steel. For the damage
evaluation of structure steel elements, usually two levels are considered (ref.
05):
·Damage
level-1: Ignition
of surfaces exposed to heat radiation and then breakages or other types of
failures of structural elements
·Damage level-2: Damages
such as serious discoloration of the exposed material.
·
Damage
level-1: Ignition of surfaces exposed to heat radiation
and then breakages or other types of failures of structural elements
·
Damage level-2: Damages such as serious discoloration of
the exposed material.
For level 1 damage, the failure of structural steel is decided by the
failure temperature of the structure. For a conventionally dimensioned steel
element, the failure temperature value lies between 673 K and 873 K. For a
global average value a figure of 773 K can be retained (ref. 05).
With the help of a heat balance it is possible to establish a
relationship between the radiation intensity acting on the deck surface and the
temperature which will be reached on this surface. Since both the surface
exposed to radiation and the surface from which heat is discharged need to
be considered in the heat balance, the geometry of the structure is
important in the calculation. No detailed geometry information is available for
the Tsing Ma bridge, so a global average value for a
steel profile is assumed, and then the corresponding critical radiation
intensity can be calculated.
For level 1 damage, which requires the target temperature to
be 773 K, the critical thermal radiation is 100 kW/m2 (ref. 05); that is, if the radiation is less than 100 kW/m2,
the discharge
rate from the "cold" side of the steel will maintain the temperature
at a steady state at a temperature lower than 773 K.
In this study, the pool fire caused by
grounding results in a thermal radiation of 81.58 kW/m2, which is lower than the critical thermal
radiation, so the bridge can not reach the failure temperature and structure
damage will not occur due to the pool fire.
For the medium and large collision
scenarios, the bridge is engulfed by flame. The flame temperature is usually
1325 K. The engulfed bridge will
reach its failure temperature 773 K very quickly, and the structure could
potentially fail very quickly, within minutes. The probability is very low that a
collision event would occur directly under the bridge and also remain
stationary under the bridge. The
hazard to life of these scenarios has been included in the risk analysis. Implementation of collision mitigation
measures would further reduce the probability.
For the small collision scenario, the
radiation caused by the pool fire is 116.91 kW/m2. The time to reach the failure temperature is
calculated according to the following equation (ref. 05):

Where,
![]() : Increase
of the temperature of the steel during
: Increase
of the temperature of the steel during ![]() , K
, K
![]() : Time interval,
s
: Time interval,
s
![]() : Surface
of the steel profile per unit-length on which heat is supplied, m2
: Surface
of the steel profile per unit-length on which heat is supplied, m2
![]() : Specific
mass of steel (7850 kg/m3)
: Specific
mass of steel (7850 kg/m3)
![]() : Specific
heat of steel (510 J/kg*k)
: Specific
heat of steel (510 J/kg*k)
![]() : Contents
of steel per unit-length (m3)
: Contents
of steel per unit-length (m3)
![]() : Absorption
coefficient (0.85)
: Absorption
coefficient (0.85)
![]() : Acting
radiation intensity (116,910 W/m2)
: Acting
radiation intensity (116,910 W/m2)
![]() : Surface of the
steel profile per unit-length on which heat is discharged, m2
: Surface of the
steel profile per unit-length on which heat is discharged, m2
![]() : Emission
coefficient (0.84)
: Emission
coefficient (0.84)
![]() : Constant
of Stephan-Boltzmann (5.67E-08 Wm-2K-4)
: Constant
of Stephan-Boltzmann (5.67E-08 Wm-2K-4)
![]() : Temperature
of the steel at the beginning of the time interval, K
: Temperature
of the steel at the beginning of the time interval, K
![]() : Ambient
temperature, K
: Ambient
temperature, K
![]() : Coefficient
for convective heat transfer, Wm-2K-1
: Coefficient
for convective heat transfer, Wm-2K-1
For this case, the following assumptions were made:
·
the
bridge is assumed to be at the ambient temperature at the beginning of the pool
fire,
·
the
thickness of the lower deck of the bridge is assumed to be 0.33 m,
·
![]() is assumed to be
the global average value, 0.25
is assumed to be
the global average value, 0.25
Based on the calculation and assumptions, the time for the bridge to
reach 773 K is calculated to be 1.6 hr for the small collision scenario pool
fire.
3.3.4
Conservatism
of Pool Fire Impact Calculation
Different correlations result in different assessments on flame height.
SAFETI resulted in the most conservative assessment among the three
models/software used and only the SAFETI calculation resulted in a flame height
higher than the clearance height of the bridge. However, the flame height in
reality will be lower than the SAFETI modeled result due to the following
uncertainties:
1.
Release
scenario assumption
This study assumes that the LNG released underwater will remain in
liquid phase as it rises to the water surface. In reality, some of the LNG
released under water will be vaporized due to the heat input from the water,
therefore, in reality, smaller pools will be formed, and lower flame height
will be resulted.
2.
Nature
of the pool fire
A pool fire on the sea tends to burn down and to break up into small
patches of fire. Zukoski (ref. 06) and the Sandia Report (Section 5.5.1, page 51, last paragraph) (ref. 01) discussed that large pool fires are expected to
break up into smaller pool fires because the center of the pool will not have
enough oxygen to sustain combustion.
The pool fire will then break up into “flamelets”
which will have shorter flame heights and diameters, and thus smaller radiation
ellipses. This phenomenon is not included in the
modeling; rather the conservative, large, single pool is modeled.
3. Flame tilt effect
The flame tilt will reduce the flame height. The dominant weather condition during the
day is a “D” stability condition with a 7 m/s wind speed. Under that condition,
the flame height modeled by SAFETI for the small collision and grounding
scenarios is less than the clearance height of the bridge.
SAFETI is very conservative in modeling the
flame height. Due to those uncertainties mentioned above, the flame height would
be even lower than the height calculated by using the various models. The
calculations from the other two models/software, Moorhouse
correlation and LNGFIRE3, result in values lower than the clearance height of
the bridge. So the real flame height should be lower than SAFETI modeled
results. According to the
calculation on flame height, the bridge is not expected to be exposed to direct
flame impingement for a release caused by grounding or small collision. Direct
impingement could occur for medium and large collision accidents.
The thermal radiation exposure on the bridge is calculated by LNGFIRE3.
However, the radiation should be lower due to the following uncertainties and
conservatisms used in the radiation calculation:
1. Nature of large LNG pool fire flames
The
flame will be smoky to some extent, which will reduce the radiation flux, and
the real flame is not a homogeneous cylinder as modeled, so the radiation will
be less than the modeled result.
2. Steel bridge insulation
The
bridge insulation will reduce the radiant flux received.
3. Conservative assumptions in modeling
radiation flux using LNGFIRE3
The following outline the conservative assumptions mentioned in item 3
above.
Humidity attenuation
The presence of water vapor in the atmosphere will attenuate the thermal
radiation. For a conservative answer, a relative humidity of 0% is used in
calculating the thermal radiation. For example, in the grounding case, a
humidity of 79% will reduce the maximum radiation level to 61.36 kW/m2,
which is lower than 81.58 kW/m2, the radiation level when the
relative humidity is 0%.
Maximum radiation flux
The maximum radiation flux is calculated as the vector sum of the fluxes
to the vertical and horizontal targets assuming both the horizontal and
vertical targets are in full view of the flame. Most of the time the element can only
see a fraction of the flame, and the maximum flux can not be reached.
The vertical and horizontal
radiation
This calculation assumes the radiation to the side and above the flame
will cause the same radiation. However, in the grounding scenario, since the
flame height is 45 m, and the diameter is 24 m, the radiation area from the top
is much less than the radiation area to the side. So it is a conservative assumption that
the target at the top of flame will have the same radiation flux as the target
on the side of the flame if they are at the same distance from the flame.
Therefore, the calculated maximum thermal radiation that could be
exposed to the bridge is a very conservative assessment.
3.3.5
Conclusions Regarding
Effects of Pool Fires on the Tsing Ma Bridge
The largest possible thermal radiation to the bridge from pool fire
caused by grounding is 81.58 kW/m2, which is lower than the critical
radiation (100 kW/m2), so the bridge will not be damaged due to the
pool fire. For the pool fire caused by small collision, the bridge can reach
the failure temperature after 1.6 hr exposure to the pool fire. The pool fire
caused by medium or large collision will cause the bridge to reach its failure
temperature in a very short time.
However, these radiation and flame heights must be viewed as
conservative due to the unknown nature of the large LNG pool fire flame. In addition, the probability that a
collision event would occur directly under the bridge and also remain
stationary under the bridge is very low.
The risk calculation has included the people
present on the bridge given the assumed traffic levels on the bridge. SAFETI does not place populations at
height; thus the risk result is conservative in that the populations are
considered at the same height level of the pool fire. The impact of the thermal radiation on
the populations follows the impact criteria presented in Appendix I (Table
I-57).
3.4
Sensitivity
Analysis of Immediate Ignition Probability
The immediate ignition probability for the
collision scenarios is assumed to be 0.8.
The initiating event of the collision and the energy involved in
penetrating the cargo tank will be a strong potential ignition source. The immediate ignition probability for
the grounding scenarios is assumed to be 0.2. Since the grounding events occur underwater,
there is a much less probability for immediate ignition of the event.
A sensitivity study was performed regarding
the collision immediate ignition probability for the Black Point 2021E Small
Carrier case. The FN curve
generated based on the study immediate ignition probability (0.8 for collision
events) is shown in Figure
3‑4.
For a sensitivity case, an immediate
ignition of 0.5 for collision events was applied to the Black Point small LNG
carrier 2021E scenario. The
resulting FN curve for the sensitivity case is presented in Figure 3‑5.
Figure 3‑4 Base Case Result, 0.8 Immediate Ignition
for Collision Events
Figure 3‑5 Sensitivity Case Result, 0.5 Immediate
Ignition for Collision Events
The decrease in immediate ignition
probability results in the segments BP4 and BP5 remaining in the ALARP region
but shifting to the higher frequency level, and the BP2 segment moving into the
ALARP region between N = 12 and N = 30.
Segment BP3 approaches closer to the ALARP region but does not exceed
the criteria. Decreasing the
immediate ignition probability increases the frequency of events resulting in
flash fire, which has a larger hazard zone than a pool fire.
The justification for the 0.8 immediate
ignition is that for an event to breach the inner tank, the collision event
will have strong ignition characteristics associated with it.
3.5
Sensitivity Analysis of Population Analysis
3.5.1
High-rise
and Mid-rise Buildings
High-rise and mid-rise buildings compose a large portion of the
buildings within the
The development of appropriate factors depends upon the characteristics
of the resulting gas clouds and the dimensions of the subject buildings. The
development of relevant factors is presented in the next section. The buildings
categories to which this factor was applied and the assumed numbers of floors
if the actual numbers of floors are not available are the following:
Residential
(H): 35
Residential
(M): 25
Industrial
(H): 25
Industrial
(M): 15
Administrative/Commercial
(H):10
Hospital (H): 10
Another consideration that would potentially reduce the number of
affected populations is building shielding. In some areas, the buildings are
positioned close together and are situated such that one building shields the
buildings behind it from the potential consequences. As the flammable cloud disperses further
away from the source, the flammable concentration within the cloud will not be
homogeneous, may develop pockets (of no gas) and will not envelop all buildings
or building faces equally. Taking a
conservative approach, the shielding effect of buildings has not been credited
and all building populations are considered equally impacted.
3.5.2
Cloud
Height and Associated Building Impact
The cloud height analysis was applied based on the large release
cases. The small and medium release
cases have lesser cloud height and only partially impact the land-based populations. Thus only considering the large release
case was judged to be a conservative assumption.
The average cloud height of a large spill was calculated by factoring
the mean cloud height for each of the four different daytime weather conditions
modeled for Black Point by the probability of such a weather condition
occurring. The four weather conditions used in the consequence modeling are:
Stability Class B, 2.5 m/s wind
Stability Class D, 3.0 m/s wind
Stability Class D, 7.0 m/s wind
Stability Class F, 2.0 m/s wind
Using DNV’s SAFETI software, cloud heights
were then modeled as a function of downwind distance from the release point.
These results are presented on the graph illustrated as Figure 3‑6
and are shown separately for each of the four weather conditions at Black
Point. Therefore, in order to find the average cloud height on any given day,
the probabilities of each weather condition occurring on that day must be
factored.
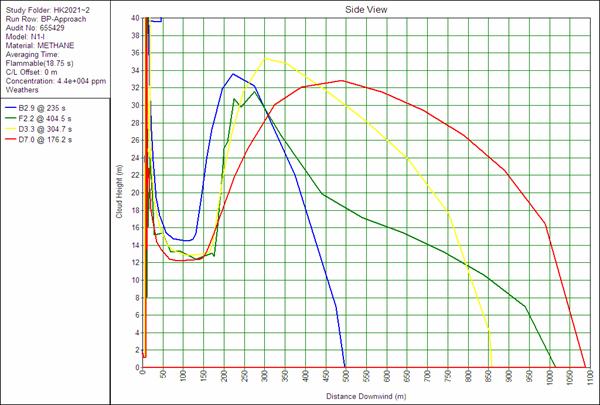
Figure 3‑6 Cloud Height as a Function of Downwind
Distance (for the Large Release Case)
The detailed meteorological data, upon which this study was based, is
provided in Appendix I.
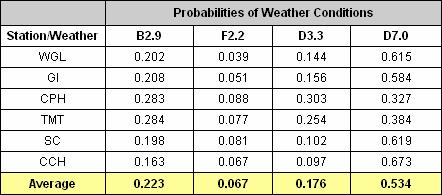
The probabilities of each weather condition occurring were arrived at by
analyzing meteorological data acquired from the Hong Kong observatory for the
six stations located along the Black Point and South Soko routes. These
stations are:
Shau Chau (SC) – BP1
and part of BP2
Tai Mo To (TMT) – BP2 and part of BP3
Ching Pak House (CPH) – BP3 and BP4
Cheung Chau (CCH)
– SK1, SK2, SK3
Table
3‑4 presents the probabilities of
each weather condition at the 6 different stations as well as the overall
probability of each weather condition. This overall probability was calculated
as an average of the 6 probabilities (one per station) associated to each
weather type:
Table 3‑4 Probabilities of Weather Conditions
Knowing the overall probabilities of these
weathers, the average cloud height for all weather conditions can then be
calculated.
First the mean cloud height for each weather
type is arrived at by averaging those heights over the distance of the cloud.
Then these average cloud heights are factored by the weather probabilities
presented above.
The details behind this calculation are presented in Table 3‑5 to establish a weighted average
cloud height of 22.5m. This was
assumed equivalent to 8 floors of a typical high-rise
Table 3‑5 Calculation of Cloud Height Weighted
Average (m)
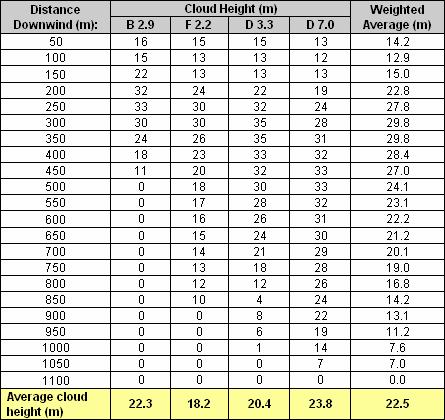
Thus the populations on 8 floors (assumed
equivalent to 22.5m) of the high-rise and mid-rise building categories in
Section 3.5.1 were used in the population analysis of the MQRA
study.
The maximum cloud height presented in Table 3‑5 is 35m for the weather category D 3.3m/s. This height would be equivalent to 12
floors of a high-rise building.
Using the Black Point 2021E Small Carrier case, a sensitivity was
performed using 12 floors instead of the 8 floors determined from the
average.
By using 12 floors
for the above building categories (if the buildings exceeded 12 floors), the
total indoor land population (for 2021) increased from 211,656 to 246,799
(increase of 35,143). The following figures present the FN curves
from the base case results using the weighted average cloud height, Figure 3‑7, and the results for the sensitivity case using the
maximum cloud height Figure
3‑8.
The differences are imperceptible and not
significant on the FN curve graphs.
Increasing the indoor population has a dual and contrary effect. It increases the strength of the indoor
population ignition factor; since the ignition presence is stronger, the vapor
cloud tends to ignite more often without traveling as far and encompassing
populations further away. However,
increasing the indoor population places more people in the hazard zones; but
hazards that impact a large fraction of the populations only occur at
frequencies well below the EIAO criteria and thus are not represented in the FN
result.
As a result, the method using the average
cloud height was utilized in the study.

Figure 3‑7
Base Case Result, Weighted Average Cloud Height

Figure 3‑8
Sensitivity Case Result, Maximum Cloud Height
3.6
Sensitivity Analysis
of Length Factor
Distribution of vessel arrivals LOA and recorded collision incidents in
fairways has been analyzed based on local and worldwide collision data. BMT believes the presence of corroborative
data provides a basis for adoption of a Factor of Safety of 2 for collision
against LNG carriers. This can be
attributed to the fact that vessels over 200m LOA are staffed with two pilots,
generally have trained crews, and due to their size generally command greater
care. The data analysis suggested a potential range of factors between 1.0 and
2.9. A sensitivity analysis was
performed on the 2021E Small Carrier case using a Length Factor of 1. The relative heading angle standard
deviation remained at 17 degrees.
The remaining variables were unchanged from the base case. Figure
3‑9 presents the sensitivity unmitigated case.
Figure 3‑9
Unmitigated, 2021E Small Carrier, Length Factor 1
The sensitivity analysis regarding the length factor was also performed
for the
Figure 3‑10
3.7
Sensitivity Analysis of Collision Angle
The relative heading angle with a standard deviation of 17 degrees has
been analyzed and is supported with work performed by BMT. Changing the relative heading angle
standard deviation from 17 to 30 degrees increases the collision frequency
(adding conservatism into the model and tests the sensitivity to this
parameter), and thus the unmitigated case presented displays higher risk
results than the study current base case results. A sensitivity analysis was performed on
the 2021E Small Carrier case using a relative heading angle standard deviation
of 30 degrees. The remaining
variables were unchanged from the base case, including a Length Factor of 2. Figure 3‑11 presents the sensitivity unmitigated case.
Figure 3‑11 Unmitigated, 2021E Small Carrier,
3.8
Sensitivity Analysis of Proposed Mitigation Method
BMT evaluated the proposed moving safety zone in the Working Paper #8
“LNG Specific Risk Issues & Safety Zones” (ref. 07). The
proposed mitigation excluded various collision events from the dynamic model,
in the form of head-on, crossing, and overtaking encounters, thus reducing the
collision risk by a factor of 10 – 16.
In the current study a reduction factor of 10 was applied to the
collision risk for all segments to reflect the impact of the mitigation measure
on the LNG Carrier transit.
BMT also evaluated another implementation of the safety zone.
The revised
mitigation method is presented in the BMT LNG Safety Zone paper (ref. 08). The
revised mitigation proposes different safety zones for the different segments
along the LNG carrier transit to Black Point. The following table presents the safety
zone implementation differences along the Black Point transit route.
Table 3‑6
Proposed Revised Mitigation Safety Zone
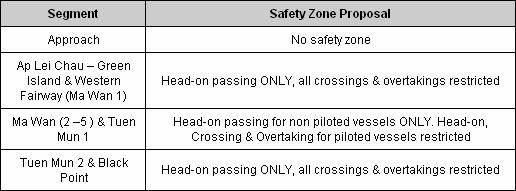
The revised safety zone effectively moves vessel encounters away from
the Ma Wan area as well as restricting crossing traffic encounters to
designated segments along the LNG carrier route. Two chase boats would be required and
deployed port and starboard of the flotilla to ward off wayward excursions of
small craft near the LNG carrier.
Although this mitigation measure has been implemented at other ports
around the world that receive LNG carriers, it would involve restrictions on
other marine traffic in the Ma Wan Channel. Implementation of these measures
are beyond CAPCO’s control. On the advice of the relevant
authority, due to uncertainties regarding the level of safety improvement, the
estimated impact to other port users, and the practicality of implementing
these measures in the busy marine environment of