13
Quantitative Risk Assessment
This section of the EIA presents a summary
of the analysis and findings of the Quantitative Risk Assessment (QRA) study
undertaken for the proposed LNG Terminal at South Soko and associated facilities
including a subsea pipeline from
This section is divided into four sub
sections: section 1 relates to the general aspects of the QRA study, section 2
relates to the LNG Terminal, section 3 relates to the subsea pipeline while
section 4 relates to the GRS.
Further details of the analysis pertaining
to each facility are presented in the respective annexes; Annex 13A covers the LNG Terminal QRA study details, Annex 13B covers the subsea pipeline
while Annex 13C covers the GRS.
Additional annexes are provided to
describe the Safety Management System (Annex
13D) and summarise all the assumptions adopted in the QRA study (Annex 13E).
13.1
Legislation
Requirement and Evaluation Criteria
The key legislation and guidelines that
are considered relevant to the development of the proposed LNG Terminal and
associated facilities are as follows:
·
Gas
Safety Ordinance, Chapter
51
·
·
Dangerous
Goods Ordinance, Chapter
295
·
Environmental
Impact Assessment Ordinance (EIAO), Chapter 499
·
The
EIA Study Brief, Section 3.7.9.1
There is some overlap in the requirements
of the various pieces of legislation and guidelines. The requirement for a
Quantitative Risk Assessment study is contained in the EIAO and HKPSG.
Such a study, although not required explicitly in the Gas Safety Ordinance,
is implied in the regulations and has been an established practice for similar
installations in the SAR.
13.1.1
EIAO Technical Memorandum (EIAO-TM)
The requirement for a QRA of projects
involving storage, use and transport of dangerous goods where risk to life is a
key issue with respect to Hong Kong Government Risk Guidelines (HKRG) is
specified in Section 12 of the EIAO-TM.
The relevant authority for an QRA study
relating to an LNG Terminal and associated facilities is the Gas Standards
Office (GSO) of the Electrical and Mechanical Services Department (EMSD), as
specified in Annex 22 of EIAO-TM.
Annex
4 of EIAO-TM specifies
the Individual Risk and Societal Risk Guidelines.
13.1.2
Risk Measures and
Individual risk is the predicted increase
in the chance of fatality per year to a hypothetical individual who remains 100% of the time at a
given stationary point.
The individual risk guidelines require
that the maximum level of off-site individual risk associated with a hazardous
installation should not exceed 1 in 100,000 per year i.e. 1 x 10⁻⁵
per year.
Societal risk expresses the risks to the
whole population. The HKRG is presented graphically in Figure 13.1. It is expressed in
terms of lines plotting the frequency (F) of N or more deaths in the population
from incidents at the installation. Two FN risk lines are used in the HKRG to
demark “acceptable” or “unacceptable” societal risks. The intermediate region indicates the acceptability of societal risk is
borderline and should be reduced to a level which is “as low as reasonably
practicable” (ALARP). It seeks to ensure that all practicable and
cost-effective measures which can reduce risks will be considered.
Figure 13.1
13.2
Study Objectives and
Methodology
The
objective of the QRA study is to assess the risk to life of the general public
including the workers of nearby plants from the proposed facilities during its
operational phase. The results of the QRA are compared with the HKRG.
The
detailed requirements of the study are (see Section
3.4.9.1 of the EIA study brief):
·
To identify all credible hazardous
scenarios associated with storage, handling and operation of the LNG facility,
which has potential to cause fatalities;
·
To carry out the QRA expressing
population risks in both individual and societal terms;
·
To compare the individual and societal
risks at the proposed development sites with the HKRG;
·
To identify and assess practical and
cost effective risk mitigation measures as appropriate;
·
To identify all LNG leakage scenarios
and propose a safety management system for the operational phase of the project
with an aim to contain any accidental leakage in short notice and to prevent
and/or minimise any leakage.
The elements of the QRA are shown
schematically in Figure 13.2.
An overview of the methodology employed is
provided
here to briefly introduce the
study approach, while the details are included in the respective sections/
annexes.
Relevant data on the proposed facilities
such as their preliminary layout drawings and design basis as well as
population data in the vicinity were
collected and reviewed.
A Hazard Identification (HAZID) Study was
conducted to identify all hazards,
both generic and site specific. A review of literature and accident databases
were also undertaken. These formed the basis for identifying all hazardous
scenarios for the QRA Study.
The frequencies, or the likelihood, of the
various outcomes resulting from an LNG/gas release scenario were derived from historical
databases and, where necessary, these were modified to take into account local
factors.
For all identified hazards assessed as
having a frequency of less than 10-9 per year, the frequency
assessment will be documented but no quantification of consequences will be
performed.
For hazards with frequencies greater than
10-9 per year, the consequences of each release were modelled.
Hydrocarbon releases have been modelled
using the PHAST consequence
modelling
package developed by Det
Norske Veritas, Inc. (DNV)
The consequence and frequency data were
subsequently combined using ERM’s proprietary software RiskplotTM to produce the required risk
calculations.
Finally, the results from the risk assessment
were compared with the HKRG and found to be acceptable. No mitigation measures
are therefore proposed.
Figure 13.2 Schematic Diagram of QRA Process
The QRA study for the terminal includes
all planned facilities at the site, including unloading operations at the
jetty, LNG storage tanks, sendout pumps, LNG vaporisers and the boil-off gas
system.
This section presents a summary of the QRA
study for the facilities at the terminal while Annex 13A gives further details.
As per the Study Brief, the QRA study for
the terminal is also required to include the marine transit risks for LNG
carriers within 500m of the jetty. A Marine Quantitative Risk Assessment (MQRA)
study has been separately conducted by DNV. The risk results from the MQRA
study for the 500m section at the jetty have been combined with the risk
results for the facilities at the terminal to produce an overall risk result
for the terminal, which is presented in this section. For further details on
marine transit risks, DNV’s report may be referred.
13.3.1
Site Facilities
The proposed LNG Terminal and associated
facilities will be built to provide a peak natural gas sendout capacity of 1000
million standard cubic feet per day (MSCFD).
The Terminal will comprise the following
primary components:
·
one
jetty with a berth for LNG carriers;
·
initially
up to two 180,000m3 full containment LNG storage tanks (for Phase
I,) followed by one additional tank (for Phase II);
·
two
in-tank LNG single stage centrifugal pumps for each tank, capable of delivering
LNG at about 7 barg;
·
four High Pressure LNG Booster pumps including one spare for
Phase I and three additional pumps for Phase II, to deliver at
about 101 barg;
·
four
including one spare (plus one additional for Phase II) open-rack
seawater vaporisers.
The key features of the proposed LNG
Terminal are depicted in the preliminary terminal layout diagram (See Figure 3.1 in Section 3). LNG is
transferred by pumps under cryogenic conditions from the carrier to the tanks
and from the tanks to the vaporisers. LNG is stored at near atmospheric
pressure under cryogenic conditions. The vaporisers convert the LNG into gas
phase for sendout to the pipeline.
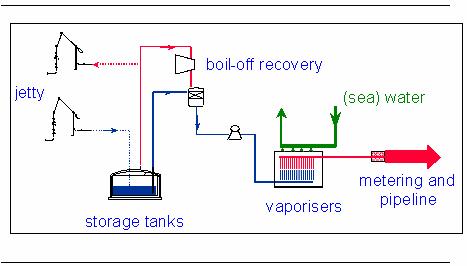
Figure 13.3 shows a schematic of the overall process in an LNG
terminal. A more detailed Process Flow Diagram for the Terminal, including
details on the design features and the operating philosophy are included in Annex 13A1. Further details of safety features and the Safety Management System
are provided in Annex 13D.
Figure 13.3 Process Overview
13.3.2
Land
Use in the Vicinity
On
South Soko Island, a number of unused Private Lots and derelict buildings are
present as well as a recently refurbished Tin Hau Temple, but there is no
permanent development or resident population at either South Soko or North
Soko. A government owned low level radioactive waste storage facility is
located on
There
is no residential population within 2km of
Marine
population in the vicinity has been considered based on the marine traffic data
provided by BMT [1]; approximately 0.4 person/km2 is estimated in
the vicinity of
Further
details on land use adjoining the proposed site, as well as the land and marine
population surrounding
13.3.4
Weather
Data
Weather
data for the
Hazards
associated with the LNG terminal have been identified based on a detailed review
of known incident records worldwide and experience gained from operations at
similar facilities. In addition, a systematic Hazard Identification (HAZID)
process was undertaken to identify any local or site specific
factors.
13.4.1
Hazards from LNG
LNG is an extremely cold, non-toxic,
non-corrosive and flammable substance. If LNG is accidentally released from a
temperature-controlled container, it will likely contact warm
surfaces and air that transfer heat into the liquid. The heat input
begins to vaporise some of the liquid, returning the liquid to the gaseous phase. The relative proportions of liquid and
gaseous phases immediately following a release depend on the release
conditions. The liquid phase will form an LNG pool on the
ground which will begin to “boil”, due to heat input from the surrounding
environment.
Immediately following vaporisation, the
gas is colder and heavier than the surrounding air and forms a vapour cloud. As the gas disperses,
it mixes with the surrounding air and warms up. The vapour cloud will only
ignite if it encounters an ignition source while concentrated within its
flammability range.
Downstream of the vaporisers the natural
gas will be in the gas phase. A release from this piping and equipment will
result in a gaseous phase release directly.
13.4.2
Hazard Effects
In the event of an accidental release of
LNG from piping or equipment, the characteristics of the possible hazardous
effects are described below.
Pool
Fire
A pool fire occurs when a flammable liquid
is spilt onto the ground and ignited. A pool formed from the release of liquid
LNG will initially spread due to the gravitational and surface tension forces
acting on it. As the pool spreads, it will absorb heat from its surroundings
causing evaporation from the pool surface. Ignition of this vapour leads to a
pool fire.
Jet
Fire
Jet fires result from ignited releases of
pressurised flammable gas or superheated/pressurised liquid. The momentum of
the release carries the materials forwards in a long plume entraining air to
give a flammable mixture. Jet fires only occur where the LNG is being handled
under pressure or when handled in gas phase and the release is unobstructed.
Flash
Fire
Following an LNG release, a large
proportion of the liquid will evaporate immediately to form a cloud of methane,
initially located around the release point. If this cloud is not ignited
immediately, it will move with the wind and be diluted as a result of air
entrainment. Similarly, a gas release may not be ignited immediately and will disperse
in the air.
The dispersing vapour cloud may
subsequently come in contact with an ignition source and burn rapidly with a
sudden flash. If the source of material which created the cloud is still
present, then the fire will flash back to the source giving a pool fire or, if
under pressure, a jet fire. Direct contact with the burning vapours may cause
fatalities but the short duration of the flash fire means that thermal
radiation effects are not significant outside the cloud and thus no fatalities
are expected outside of the flash fire envelope.
Vapour Cloud Explosion
A flash fire is the most likely outcome
upon ignition of a dispersing vapour cloud from an LNG release. If ignited in
open (unconfined) areas, pure methane is not known to generate damaging
overpressures (explode). However, if the gas is ignited in areas where there is
significant degree of confinement and congestion an explosion may result.
Fireball
Immediate ignition of releases caused by a
rupture in a gas piping may give rise to a fireball upon ignition. Fireballs
have very high thermal radiation, similar to jet fires although the duration of
the event is short.
To summarise, a liquid phase release may
result in a flash fire, vapour cloud explosion, pool fire or jet fire. A gas
phase release can result in a flash fire, fireball or jet fire.
13.4.3
Review of Industry Incidents
A review of industry incidents at LNG
terminal facilities was carried out. Incident records over the last few decades
show small LNG vapour releases and minor fires with impact limited to within
the plant boundary. These were associated with leaks from valves and process
equipment. There have been no instances of leaks to the environment from full
containment tanks. There have been no injuries or fatalities recorded outside a
plant boundary since 1944. Other incidents have occurred during the
construction and repair of LNG facilities but no LNG was directly involved.
In general LNG facilities have shown an
exceptionally high safety record due to the high level of safety features
incorporated in an LNG terminal design including the use of full containment
tanks and emergency shutdown systems.
13.4.4
HAZID Study
A Hazard Identification (HAZID) Study was
conducted in October 2005 involving representatives from the Project Proponent:
CLP and ExxonMobil and their expert consultants: ARUP, Foster Wheeler and ERM. The potential hazards posed by the
facility were identified based on the HAZID team’s expert opinion, past
accidents, lessons learnt and checklists. The details of the HAZID study can be
found in Annex 13A4.
A systematic approach was adopted, whereby the facility was divided
into a number of “subsystems” based on the layout and the process; guidewords
from the checklist (see Annex 13A4)
were then applied to each subsystem as relevant.
The Study considered each area of the LNG Terminal
and identified any potential hazards that apply to it. The study output served
as a basis for identification of scenarios for the QRA study.
13.4.5
Scenarios for QRA Study
Scenarios for the QRA study were
identified based on the HAZID Study as well as a review of incident records.
Loss of containment events have been identified for each section of the
terminal, corresponding to the relevant process conditions, as listed in Table 13.1.
A detailed discussion on the hazards,
particularly in relation to the LNG storage tanks, is given in Annex 13A5.
Table 13.1 Scenarios
for QRA Study
|
Plant Section |
Initiating Event |
Potential Outcome Scenario |
|
Jetty Area Unloading arm Piping & equipment at
the jetty |
Leak, rupture |
Pool fire/Jet fire, Vapour dispersion/ Flash fire |
|
Transfer Piping on Trestle Piping |
Leak, rupture |
Pool fire/Jet fire, Vapour dispersion/ Flash fire |
|
Tank Area Piping on tank roof Storage Tank |
Leak, rupture Rupture |
Pool fire/Jet fire, Vapour dispersion/ Flash fire Pool fire, Vapour dispersion/ Flash fire |
|
Process Area (HP Pumps, Recondenser, Vaporisers) Piping/equipment |
Leak, rupture |
Pool fire/Jet fire, Vapour dispersion/ Flash fire /Vapour cloud
explosion |
|
Process Area (Compressors) Piping/equipment |
Leak, rupture |
Jet fire, Gas dispersion/Flash fire, Fireball |
|
Sendout Piping |
Leak, rupture |
Jet fire, Gas dispersion/ Flash fire, Fireball |
|
|
|
|
This includes an assessment of the
likelihood or the frequency of events resulting in a hydrocarbon release from piping
and equipment and the subsequent potential outcomes such as fires. Details of
the frequency analysis are provided in Annex
13A6.
Release frequencies have been derived from
generic data on loss of containment events. Reference has been made to a number
of sources. A summary is presented in Table
13.2. Release scenarios include a range of hole sizes from small leaks to
catastrophic rupture.
The frequency of various outcomes
following a loss of containment event is estimated using an event tree model. The
various outcomes considered include pool fire, jet fire, flash fire and vapour
cloud explosions for liquid releases, jet fire and flash fire for continuous
gas releases and fireball and flash fire for instantaneous gas releases.
Table 13.2 LNG
Release Event Frequencies
|
Equipment |
Release Scenario |
Release Phase |
Release Frequency |
Unit |
Reference |
|
Process Vessels |
i) 10 & 25mm hole |
Liquid |
1.00E-05 |
per year |
Crossthwaite et al [2] |
|
|
ii) 50 & 100mm hole |
Liquid |
5.00E-06 |
per year |
Crossthwaite et al |
|
|
iii) Full bore rupture |
Liquid |
1.00E-06 |
per year |
Crossthwaite et al |
|
Pumps |
i) Leak |
Liquid |
1.00E-04 |
per year |
COVO Study [3] |
|
|
ii) Full bore rupture |
Liquid |
1.00E-05 |
per year |
COVO Study |
|
Unloading Arm |
i) Leak |
Liquid/ Gas |
4.05E-03 |
per year |
COVO Study |
|
|
ii) Full bore rupture |
Liquid/ Gas |
4.05E-05 |
per year |
COVO Study |
|
Pipe size 600mm to 750mm |
i) 10 & 25mm hole |
Liquid/ Gas |
1.00E-07 |
per meter per year |
Hawksley [4] |
|
|
ii) 50 & 100mm hole |
Liquid/ Gas |
7.00E-08 |
per meter per year |
Hawksley |
|
|
iii) Full bore rupture |
Liquid/ Gas |
3.00E-08 |
per meter per year |
Hawksley |
|
Pipe size 150mm to 500mm |
i) 10 & 25mm hole |
Liquid/ Gas |
3.00E-07 |
per meter per year |
Hawksley |
|
|
ii) 50 & 100mm hole |
Liquid/ Gas |
1.00E-07 |
per meter per year |
Hawksley |
|
|
iii) Full bore rupture |
Liquid/ Gas |
5.00E-08 |
per meter per year |
Hawksley |
|
LNG Storage Tank |
i) Rupture |
Liquid |
1.00E-08 |
per tank per year |
“Purple Book” [5] |
|
|
|
|
|
|
13.6
Consequence Analysis
This section gives a brief summary of the
approach adopted to model the consequences of an LNG/natural gas release.
Details are given in Annex 13A7.
A range of hole sizes from small leaks to
full bore ruptures is considered in the analysis. Discharge rates, dispersion
modelling, pool fire modelling, jet fire modelling, fire ball modelling and
vapour cloud explosion modelling are considered and are all performed using the
PHAST suite of models.
The plant was divided into twenty three
isolatable process sections based on the provision of emergency shutdown
valves. Physical properties of the fluid (pressure, temperature, density,
phase) and equipment dimensions (pipe diameter and length) for each section
were applied from the heat and mass balances to estimate the maximum release
rate and the inventory in each section.
Fire radiation contours are calculated to
7.3, 14.4, 20.9 and 35.5 kW/m2, and the fatality to people within
each contour calculated. Overpressure effects from vapour cloud explosions are
calculated to 5psi and 2psi contours. Dispersion of vapour clouds is determined
to 0.85 of the lower flammability limit. A range of weather conditions is also
considered, to represent a full year of conditions that occur within
13.7.1
Individual Risk Results
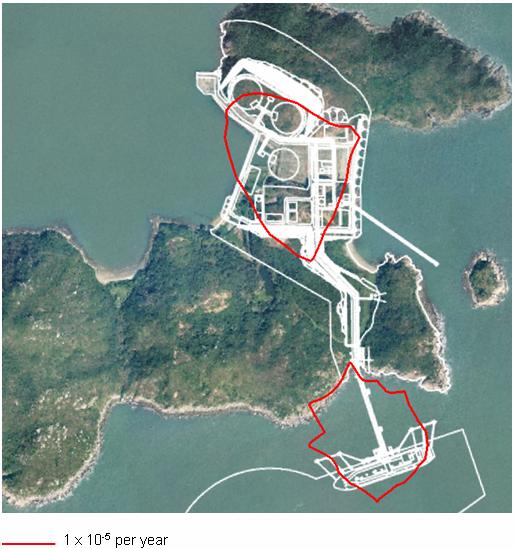
The individual risk (IR) contours associated
with the LNG terminal are shown in Figure
13.4. The maximum off-site risk is less than 1 x 10⁻⁵ per year at
the site boundary, and hence meets the HKRG requirements.
Figure 13.4 Individual Risk Contours
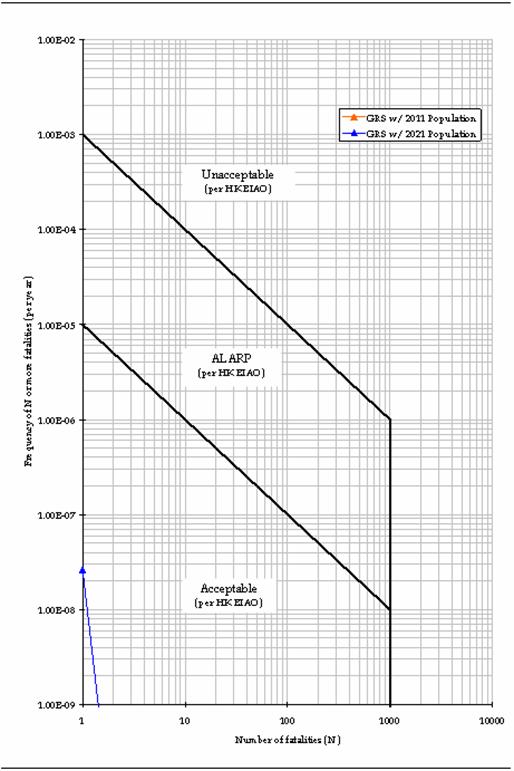
13.7.2
Societal Risk Results
The
societal risk for the
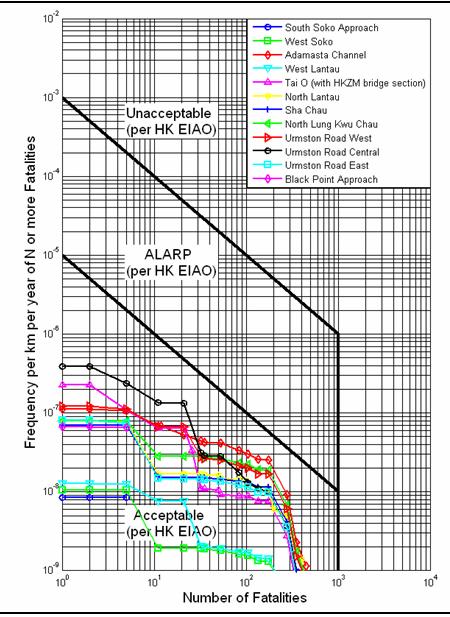
The societal risk results for the onshore
terminal facilities have been combined with the risk results for the LNG
carrier during berthing manoeuvres within 500m of the jetty to produce the overall societal risk
results (Figures 13.5-13.7).
The results for the berthing manoeuvres are taken from the Marine Quantitative
Risk Assessment (MQRA).
Most of the points
on the curve arise from scenarios involving the catastrophic failure of the LNG
storage tanks. This is a very low frequency event but shows up in the FN curves
because
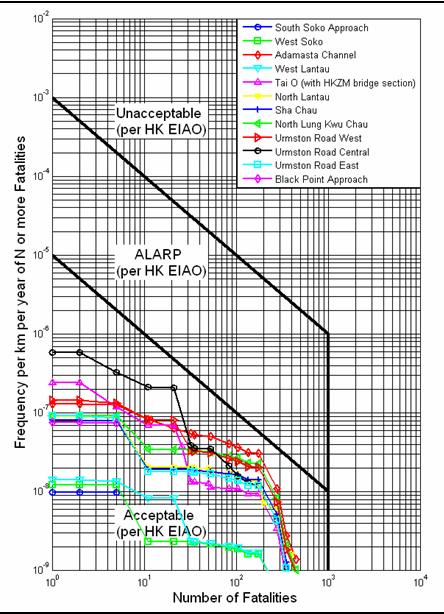
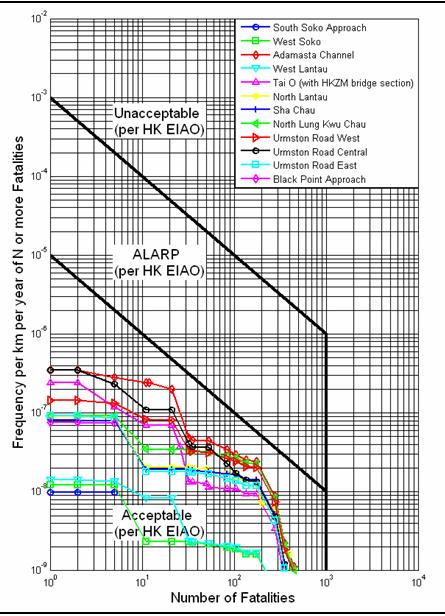
Slight changes in the marine traffic for
the three cases have resulted in small differences in the risk. The 2021 “No
Tonggu” case has an increase in marine traffic predicted compared to 2011 and
so the risks increase slightly. For 2021 “with Tonggu”, the marine population
in the vicinity of South Soko is the same as the 2021 “No Tonggu” case, but the
increased traffic south of South Soko increases the frequency of carrier
collisions. Hence, the risks increase slightly (Figure 13.7). Also shown in the figures are results for large
(215,000 m3) and small (145,000 m3) carriers. If LNG is
delivered from smaller carriers, the number of transfers required per year will
be higher. The frequency of possible releases therefore increases, but the
consequences would be less severe.
The risks for all cases are well within
the Acceptable Region as per HK EIAO.
The Potential Loss
of Life (PLL), or equivalent fatalities per year, are given in Table 13.3. The total PLL for the whole
terminal is very low at 3.4 x 10⁻⁷ per year, or equivalently, one
fatality every 3 million years.
13.3 Potential
Loss of Life
|
Section |
2011 |
2021 |
|||
|
|
|
PLL |
% |
PLL |
% |
|
T2 T1 T3 L05 |
LNG tank 2 LNG tank 1 LNG tank 3 Liquid unloading line from shore to tank |
1.18 x 10⁻⁷ 1.14 x 10⁻⁷ 1.08 x 10⁻⁷ 1.13 x 10⁻¹⁰ |
34.7 33.5 31.8 0.07 |
1.18 x 10⁻⁷ 1.14 x 10⁻⁷ 1.08 x 10⁻⁷ 1.13 x 10⁻¹⁰ |
34.7 33.5 31.8 0.07 |
|
|
Total |
3.39 x 10⁻⁷ |
100 |
3.39 x 10⁻⁷ |
100 |
Figure 13.5 FN
Curve for 2011
Figure 13.6 FN
Curve for 2021 "No Tonggu"

Figure 13.7 FN
Curve for 2021 "With Tonggu"

13.8
Conclusions of QRA Study
for Terminal
The results indicate
that the societal risks from the proposed facility are within the Acceptable Region of the HK EIAO. The individual risks also meet the requirements of the HKRG.
The
proposed subsea pipeline will transport compressed natural gas from the LNG
terminal in
Three marine traffic scenarios are
considered in the analysis. The base case uses marine traffic data for 2011. To
take into consideration the impact of future developments, predictions for 2021
traffic volume are also used, with and without the development of the Tonggu
Waterway.
13.9.1
Pipeline
Route
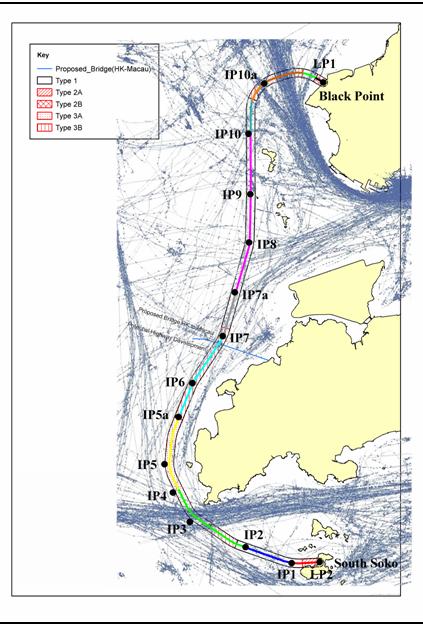
The proposed pipeline takes a subsea route
from the LNG terminal at
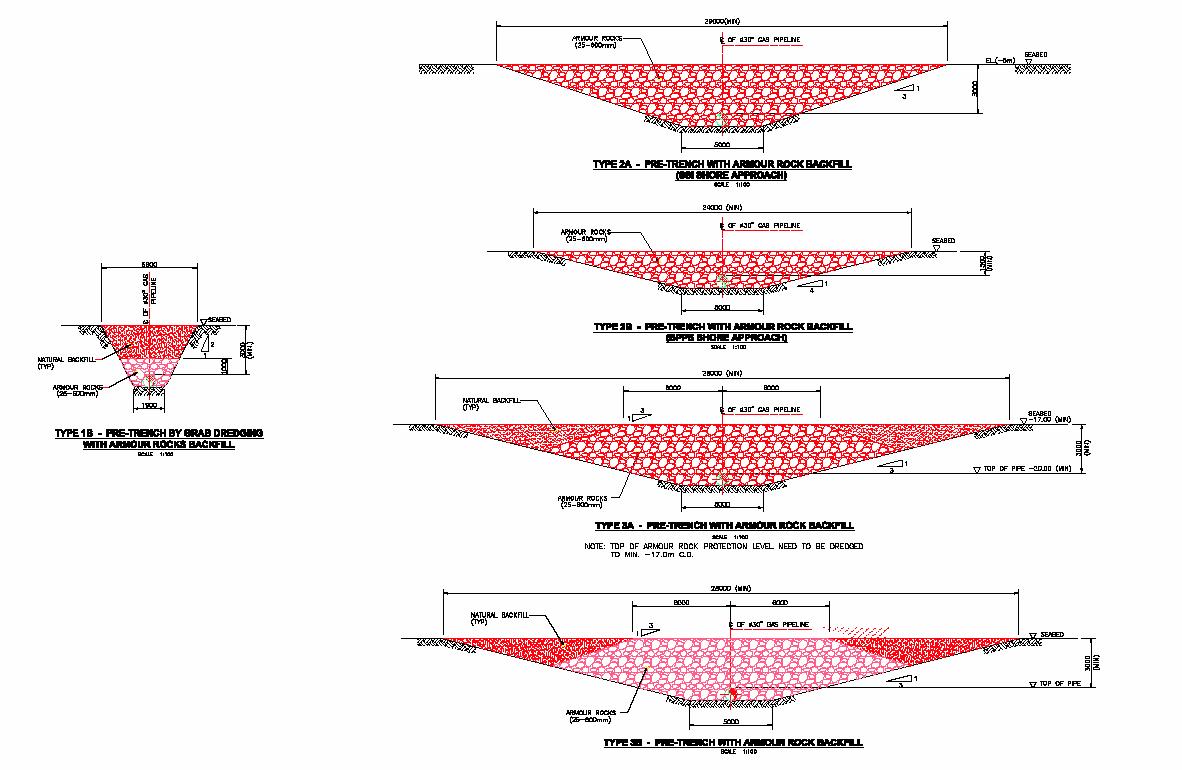
The pipeline with a total length of about
38km will be buried to 3m below the seabed with varying levels of rock armour
protection (Figures 13.8 and 13.9). Type 1B protection
provides 1m of rock armour backfill and 2m of natural backfill above the
pipeline. This provides protection for anchors up to 2 tonnes, essentially
protecting against anchors from all ships below about 10,000 dwt. Trench types
2A/B are used on the shore approaches and are designed for protection from 2
tonne anchors and any future construction vessels. Trench types 2A/B are also
designed to protect against scouring effects from wave action so that the
pipeline is sufficiently protected when it makes the transition from subsea to
land. The waterways of
13.9.2
Marine Traffic
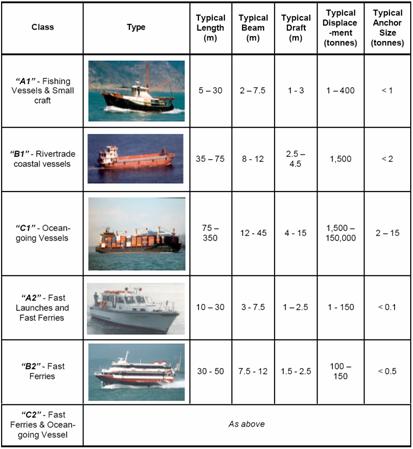
The marine traffic report [1] divides the
pipeline route into sections using ‘gate posts’ that roughly correspond to key
locations along the route. Radar tracks of marine vessel movements are then
used to determine the number of vessels crossing between pairs of gate posts
each day. Based on the vessel speed and apparent size from the radar returns,
vessels are also divided into six categories (Table 13.4). The same marine vessel classes as that used in the
marine traffic report are used in this QRA study, although some interpretation
of the data was required; to distinguish between fast ferries and fast launches
in vessel class A2, for example.