Data on local meteorology
such as wind speed, wind direction, weather stability, ambient temperature and
humidity was obtained from the Hong Kong Observatory.
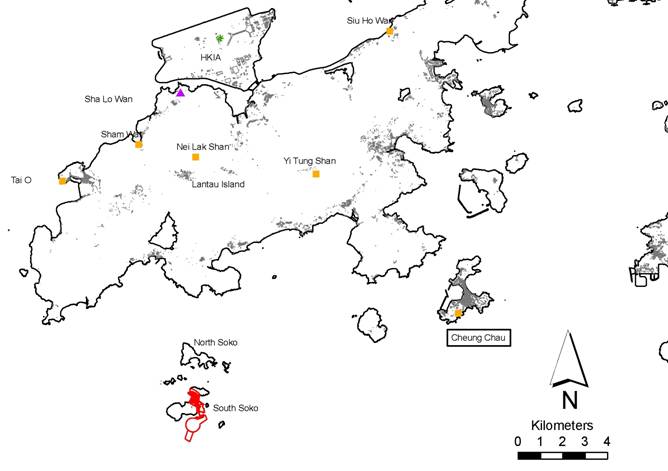
The location of weather
stations in the vicinity of the LNG Terminal at
Data from Cheung Chau weather station was adopted for the site, as it is
closest to the proposed terminal and also the most relevant based on the
topography.
The meteorological data used
in this study is based on data recorded by the stations over a five year
period.
The raw data from the
Observatory is a series of readings taken every hour for a period of one year.
This data has been rationalized into different combinations of wind direction,
speed and atmospheric stability class, as per the following:
· Each data record is rated
with a stability class A through F. For simplicity, this study has used 3
stability classes, B, D and F. Accordingly, the data records have been assigned
to these 3 classes;
· Each data record has an associated
wind speed. For simplicity, this study has used 4 wind speed classes.
Accordingly, the data records have been assigned to these 4 classes;
· Each data record has an
associated wind direction. For simplicity, this study has used 12 wind
directions. Accordingly, the data records have been assigned to these 12
classes;
· The data has been split into
night and day times encompassing day time from 7am to 7pm and night time from
7pm to 7am.
The annual average temperature for the Soko site is 22.4°C. The relative humidity is 78%. Table
1.1 below tabulates the temperature statistics.
Table 1.1 Temperature Statistics for Soko
|
|
|
Min. |
Max. |
Average |
|
Ambient air (T°C)1 |
Soko |
6.2 |
33.1 |
22.4 |
|
Surface (T°C)1 |
|
20.9 |
25.7 |
23 |
|
Seawater (T°C)2 |
Soko |
18.0 |
27.6 |
23.5 |
|
Humidity (%)1 |
|
65 |
82 |
77 |
Source: 1.
2.
HK EPD, “Summary water quality statistics of the
Figure 1.1 Weather Stations near
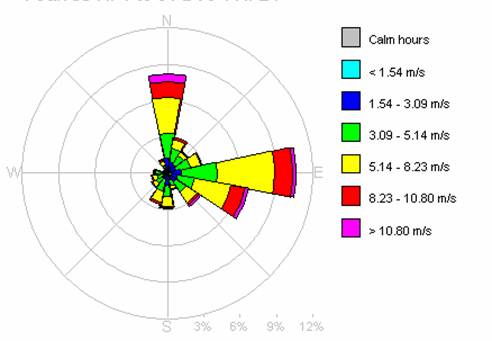
The percentage of occurrence
for each combination of wind direction, speed and atmospheric stability during
day and night are presented in Table 1.2. In addition, the percentage
frequencies are plotted in the form of a wind rose in Figure 1.2.
Table 1.2 Data for Cheung Chau
Weather Station
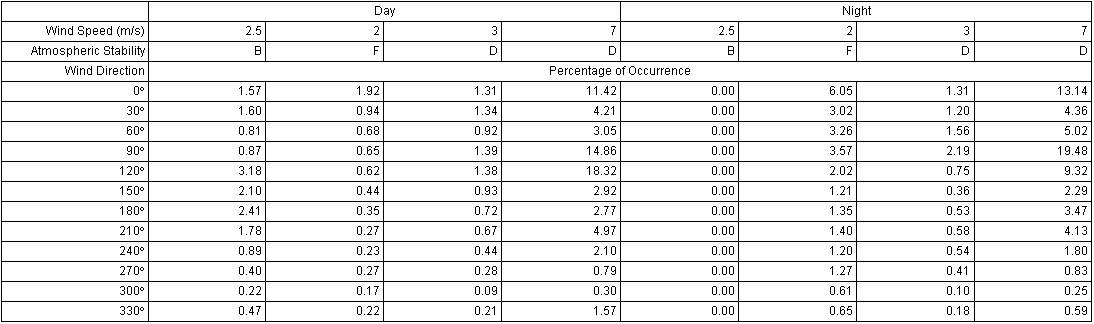
Figure 1.2 Wind Rose for Cheung Chau
Weather Station (1999-2004)
Wind directions, such as 90°,
refer to the direction of the prevailing wind. For example, 90°
refer to an easterly wind, 0° is northerly, 180°
is southerly and 270° is westerly.
Note
on Atmospheric Stability
The Pasquill-Gifford
atmosphere stability classes range from A through F.
A: Turbulent
B: Very unstable
C: Unstable
D: Neutral
E: Stable
F: Very stable
Wind speed and solar
radiation interact to determine the level of atmospheric stability, which in
turn suppresses or enhances the vertical element of turbulent motion. The
latter is a function of the vertical temperature profile in the atmosphere; the
greater the rate of decrease in temperature with height, the greater the level
of turbulence.
Class A represents extremely
unstable conditions, which typically occur under conditions of strong daytime insolation. Class D is neutral and neither enhances nor
suppresses atmospheric turbulence. Class F on the other hand represents
moderately stable conditions, which typically arise on clear nights with little
wind.