Tables of Assumptions
This section summarizes the assumptions
adopted in the QRA study. These are broadly categorised as population,
meteorological, frequency, consequence and plant data assumptions.
1
Terminal
Table 1.1 Residential
Population
|
Location |
Approx.
Distance from Terminal Site |
2011
Population |
2021 Population |
|
Fan
Lau Tai
Long Wan Tseun Shek Pik Prison Tung
Wan School Shui Hau Ma
Po Ping Prison Tong
Fuk Cheung
Sha Villas Cheung
Sha San
Shek Wan Pui Wo Ham
Tin Mong Tung Wan Sea
Ranch Tai
Long Shek Kwu Chau |
7km 7km 7km 6km 6km 6km 7km 9km 9km 10km 11km 11km 11km 10km 11km 8km 9km |
52 293 824 152 375 1,728 1,133 665 597 156 2,628 859 43 313 34 43 90 |
52 293 824 152 375 1,728 1,133 665 597 156 2,628 859 43 313 34 43 90 |
Table 1.2 Road
Population
|
Location |
Approx.
Distance from Terminal Site |
2011
Population |
2021 Population |
|
|
7km |
5/km |
5/km |
Table
1.3 Population
Time Periods Definitions
|
Time Period |
Description |
|
Night time Weekday Peak hours Weekend day |
7:00pm until 7:00am 9:00am till 5:00pm, Monday through Friday 7:00am to 9:00am and 5:00pm to 7:00pm, Monday to Friday 7:00am to 9:00am and 1:00pm to 3:00pm, Saturdays 3:00pm to 7:00pm Saturdays, and 7:00am to 7:00pm Sundays |
Table
1.4 Land
Population Occupancy and Indoor/Outdoor Fractions
|
Population |
Occupancy |
% Outdoors |
||||||
|
Type |
Night |
Peak |
Weekday |
Weekend
day |
Night |
Peak |
Weekday |
Weekend
day |
|
Residential Prison Hospital School Road |
100 % 100 % 100 % 0 % 10 % |
50 % 110 % 120 % 10 % 100 % |
20 % 100 % 110 % 100 % 50 % |
80 % 110 % 120 % 10 % 20 % |
0 % 5 % 0 % 0 % 0 % |
30 % 100 % 30 % 100 % 0 % |
10 % 50 % 10 % 20 % 0 % |
20 % 50 % 30 % 20 % 0 % |
Table
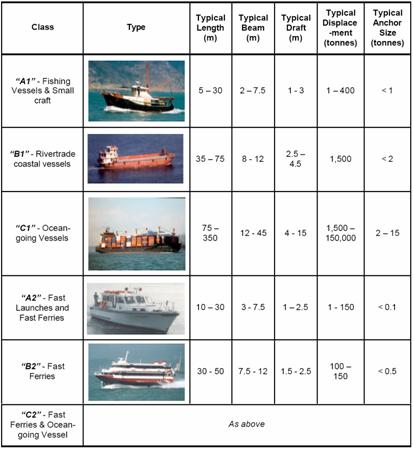
1.5 Marine Vessel Population
|
Type of Vessel |
Average Population per Vessel |
% of Trips |
|
Ocean-Going Vessel Rivertrade
Coastal vessel Fast Ferries Tug and Tow Others |
21 5 450 (largest ferries with max
population) 350 (typical ferry with max
population) 280 (typical ferry at 80% capacity) 175 (typical ferry at 50% capacity) 105 (typical ferry at 30% capacity) 35 (typical ferry at 10% capacity) 5 5 |
3.75 3.75 22.5 52.5 12.5 5.00 |
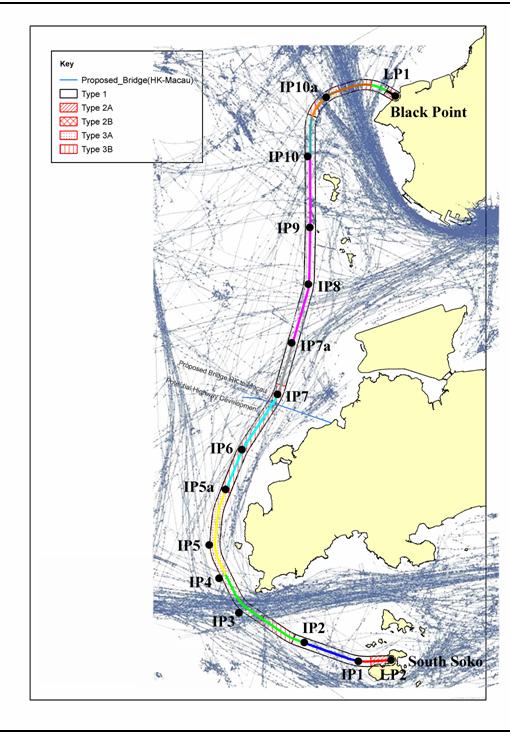
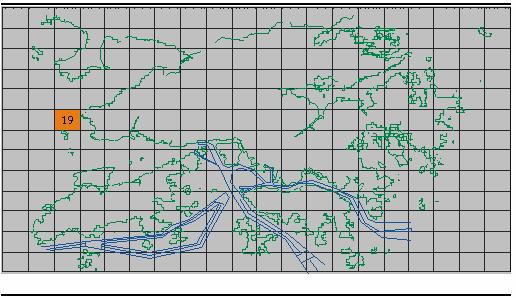
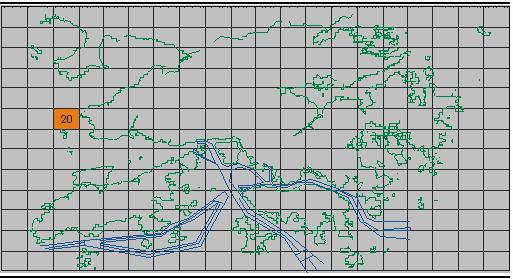
Figure 1.1 Marine
Population at Risk by Grid, Year 2011 (excluding fast ferries)
Figure 1.2 Marine
Population at Risk by Grid, Year 2021 (excluding fast ferries)

Figure 1.3 Number
of Fast Ferries Per Day*, 2011

* 75% in daytime, 25% in night time
Figure 1.4 Number
of Fast Ferries Per Day*, 2021
* 75% in daytime, 25% in night time
Table
1.6 Fast
Ferry Population Distribution for Day and Night Time
Periods
|
Population |
Population at Risk |
% of Day Trips |
% of Night Trips |
% of All Trips (= 0.75 x day + 0.25 x night) |
|
450 350 280 175 105 35 |
135 105 84 53 32 11 |
5 5 30 60 - - |
- - - 30 50 20 |
3.75 3.75 22.5 52.5 12.5 5.0 |
Table
1.7 Helicopter
Population
|
Population |
Daytime Flights |
Night time flights |
|
12 per flight |
2 return flights per hour |
0 |
Table
1.8 Fatality Factors
|
Population Type |
Fatality Probability |
|
Land Population Indoor Outdoor Road
vehicles Marine Population Ocean-Going
Vessel Rivertrade
Coastal Vessel Fast
Ferries Tug and
Tow Others Helicopters |
0.1 1 0.5 0.1 0.3 0.3 0.9 0.9 1 |
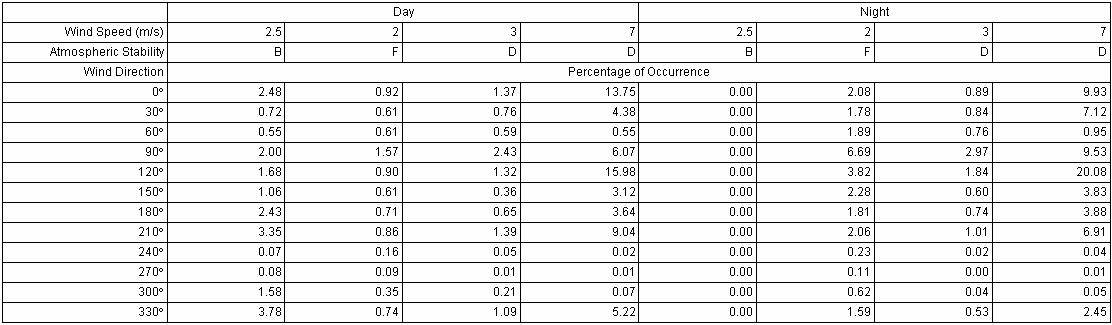
Table 1.9 Weather
Data Adopted from Cheung Chau Weather Station (2003)
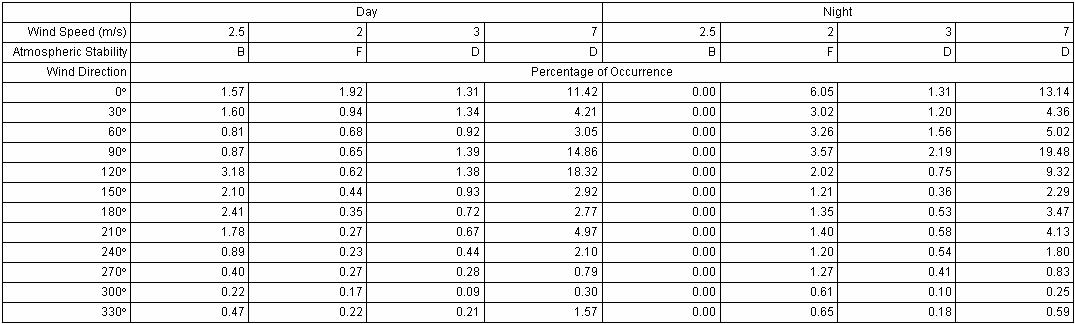
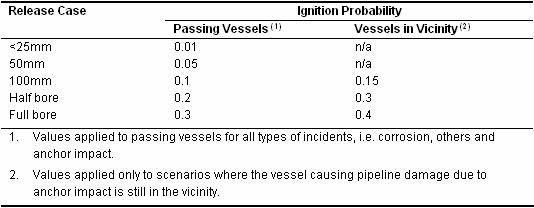
Table 1.10 Ignition
Probabilities
|
|
Immediate Ignition |
Delayed Ignition 1 |
Delayed Ignition 2 |
Delayed Ignition Probability |
Total Ignition Probability |
|
Liquid small leak |
0.01 |
0.035 |
0.005 |
0.04 |
0.05 |
|
Liquid large leak/rupture |
0.08 |
0.18 |
0.02 |
0.2 |
0.28 |
|
Gas small leak |
0.02 |
0.045 |
0.005 |
0.05 |
0.07 |
|
Gas large leak/rupture |
0.1 |
0.2 |
0.02 |
0.22 |
0.32 |
* Small leak = 10 and 25mm. Large
leak = 50 and 100mm holes
Table
1.11 LNG
Storage Tank Release Ignition Probabilities
|
|
Ignition Probability |
|
Immediate ignition Delayed ignition 1 Delayed ignition 2 |
0.3 0.1 0.6 |
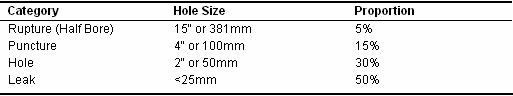
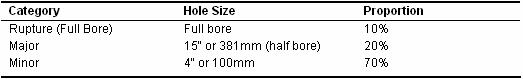
Release Size
For piping and equipment, a range of
release sizes are considered, including 10mm, 25mm, 50mm, 100mm holes and full
bore ruptures.
For LNG storage tanks, all failures
are modelled at catastrophic failures.
1.4
Consequence
Analysis/Plant Data
Table
1.12 Process Conditions used for
Calculating Discharge Rate
|
Code |
Scenario Name |
Fluid Phase |
Nature of Section |
No. of Items |
Length of Section (m) |
Pipe Diameter (mm) |
Pressure (bara) |
Temperature (ºC) |
Density (kg/m3) |
Inventory (kg) |
Pumping Rate (kg/s) |
|
L01 |
Liquid Piping from Tank to HP Pump |
Liquid |
Piping |
1 |
450 |
500 |
7.50 |
-161.5 |
464 |
40,977 |
248 |
|
L02 |
Liquid Unloading Arm |
Liquid |
Unloading Arm |
3 |
20 |
400 |
5.50 |
-161.5 |
464 |
1,166 |
601 |
|
L03 |
Liquid Transfer Pipe from Jetty to Shore End |
Liquid |
Piping |
2 |
300 |
700 |
5.50 |
-161.5 |
464 |
53,543 |
601 |
|
L04 |
Liquid from HP Pump Discharge to Vaporisers (ORV/SCV) |
Liquid |
Piping |
1 |
30 |
400 |
106 |
-155.2 |
464 |
1,748 |
251 |
|
L05 |
Liquid Transfer Pipe from Shore End to Tank |
Liquid |
Piping |
2 |
900 |
700 |
5.50 |
-161.5 |
464 |
160,630 |
601 |
|
L06 |
Liquid in Recondenser |
Liquid |
Process Vessel |
1 |
N/A |
N/A |
6.50 |
-160.5 |
463 |
46,300 |
100 |
|
G07 |
Gas from Metering Station to |
Gas |
Piping |
1 |
390 |
750 |
102 |
5.0 |
79.4 |
13,680 |
251 |
|
G08 |
Gas from Vaporisers (ORV/SCV) Outlet to Metering Station |
Gas |
Piping |
1 |
108 |
750 |
104 |
5.8 |
80.8 |
3,851 |
251 |
|
G09 |
Vapour Piping from Tank to Compressor |
Gas |
Piping |
1 |
450 |
600 |
1.08 |
-110.0 |
1.43 |
182 |
2.93 |
|
G10 |
Gas Piping from Compressor to Recondenser |
Gas |
Piping |
1 |
24 |
400 |
6.80 |
57.0 |
4.46 |
13 |
2.93 |
|
G11 |
Recycle Gas Piping from Compressor to Ship (till Shore End) |
Gas |
Piping |
1 |
720 |
500 |
1.05 |
-120.2 |
1.49 |
211 |
4.74 |
|
G12 |
Recycle Gas Piping from Compressor to Ship (Shore End to Jetty) |
Gas |
Piping |
1 |
300 |
500 |
1.05 |
-120.2 |
1.49 |
88 |
4.74 |
|
G13 |
Gas Piping from HP Compressor Discharge to Vaporiser Outlet |
Gas |
Piping |
1 |
30 |
150 |
104 |
5.8 |
80.8 |
43 |
0.78 |
|
G14 |
Vapour Unloading Arm |
Gas |
Unloading Arm |
1 |
20 |
400 |
1.05 |
-120.2 |
1.49 |
4 |
4.54 |
|
P15 |
Ship Compressor |
Gas |
Pump |
1 |
1 |
450 |
23.0 |
35.0 |
16.2 |
51 |
3.00 |
|
P16 |
BOG Compressor |
Gas |
Pump |
1 |
1 |
400 |
6.80 |
57.0 |
4.46 |
11 |
1.50 |
|
P17 |
SCV Inlet/Outlet Piping |
Gas |
Piping |
5 |
10 |
400 |
106 |
5.8 |
82.3 |
103 |
25.0 |
|
P18 |
ORV Inlet/Outlet Piping |
Gas |
Piping |
5 |
10 |
400 |
106 |
5.8 |
82.3 |
103 |
50.3 |
|
P19 |
HP Pump Suction/Discharge Piping |
Liquid |
Piping |
10 |
10 |
400 |
106 |
-155.2 |
464 |
583 |
51.6 |
|
P20 |
In-Tank Pump Discharge Piping (on Tank Roof up to ESD Valve) |
Liquid |
Piping |
1 |
150 |
400 |
7.30 |
-161.5 |
464 |
8,742 |
87.0 |
|
P21 |
Piping at Jetty between ESD Valves |
Liquid |
Piping |
1 |
300 |
600 |
5.50 |
-161.5 |
464 |
39,338 |
601 |
|
P22 |
HPBOG Compressor |
Gas |
Pump |
1 |
1 |
450 |
102 |
35.0 |
71.7 |
228 |
0.78 |
|
T23 |
LNG Storage Tank |
Liquid |
Tank |
3 |
N/A |
N/A |
1.08 |
-161.5 |
464 |
83,520,000 |
N/A |