Figure 3.1 Pipeline
Route
This annex covers details of the
Quantitative Risk Assessment (QRA) for the subsea
pipeline from
The following information was reviewed and
formed the basis of the study:
·
Basis
of Design Report, Aker Kvaerner [1];
·
Drawing
8028-PLD-008 detailing the pipeline route, trenching and backfilling details,
Aker Kvaerner [2];
·
Input
to EIA Study Report on pipeline design, Aker Kvaerner [3];
·
Marine
vessel density data, BMT [4];
·
Marine
traffic data in
·
·
Hydrographic & Geophysical Survey of the Seabed,
EGS [8].
This section of the report describes the subsea pipeline, its environment and details of marine
traffic along the proposed route.
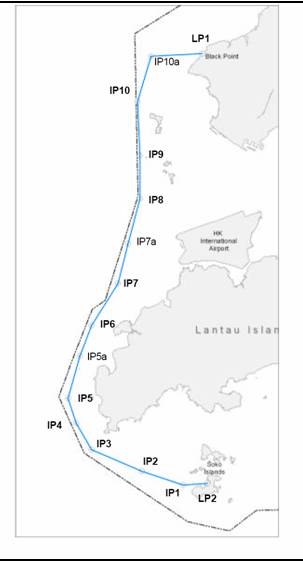
The proposed pipeline takes a subsea route from the LNG terminal at South Soko, passing around the western edge of
The proposed pipeline system will consist
of a single 30” OD (762mm outer diameter) API 5L Grade X65 pipeline, with wall
thickness of 1” (25.4mm). It is designed to have a peak flow rate of 1000 MSCFD
(million standard cubic feet per day) with a supply pressure of 101barg. The
pipeline will have an asphalt enamel coat and wrap and sacrificial anodes for
external corrosion protection and an outer layer of reinforced concrete for
buoyancy control and to provide mechanical protection during pipeline
installation and trenching operations. The pipeline is designed in accordance
with the DNV 1981 design code [9]. A summary of the pipeline details is given
in Table 3.1.
Table 3.1 Summary
of Pipeline Details
|
Parameter |
Details |
|
Location Length Outside
diameter Nominal
wall thickness Line pipe
grade External
coating Internal
coating Cathodic
protection Design flowrate Design
pressure LNG
terminal delivery pressure Minimum
terminal delivery pressure Minimum
delivery pressure to BPPS Pressure
assumed for analysis Minimum
operating temperature Maximum
operating temperature Temperature
assumed for this study Water
depth Seabed
soil Pipeline
protection Design
life |
38.3 km 30”
(762mm) 1”
(25.4mm) API 5L
grade X65 Asphalt
enamel coat & wrap and steel reinforced concrete Epoxy Aluminium
based sacrificial anodes 1000
MSCFD 111 barg 101 barg 85 barg 38 barg 101 barg 5 °C 85 °C 20 °C 1.6 – 25
m Very soft
clay becoming firmer with depth 3m cover
with rock armour backfill of varying thickness 30 years |
The composition of the gas is mainly
methane (87.57-96.13 mol%). The composition of the gas is such that no internal
corrosion is expected.
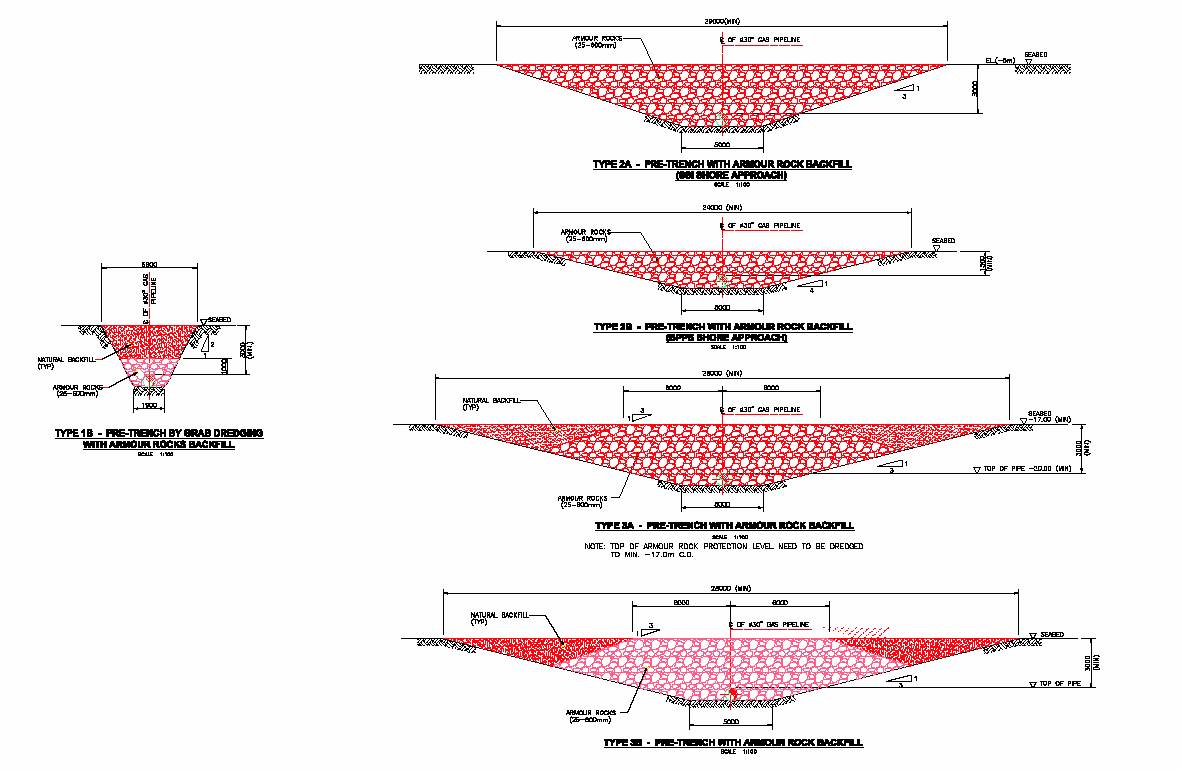
The water depth along the route varies
between 1.6 and 25m, with much of the route characterised by shallow water
below 6m deep. The pipeline will be buried 3m below the seabed with varying
levels of rock armour protection (Figures
3.1 and 3.2). Type 1B trenching
will be used for the shallow water areas away from the busy marine fairways.
The type 1B trench involves jetting with 1m of rock armour backfill and 2m of
natural backfill (to the top of the pipeline). This provides protection for
anchors up to 2 tonnes, essentially protecting against anchors from all ships
below about 10,000 dwt. Trench type 2A is used on the
shore approach to South Soko Island and consists of
pre-trenching with 3m of armour rock backfill. Trench type 2B, used on the BPPS
approach utilizes 1.5m of rock backfill. These are also designed for protection
from 2 tonne anchors and any future dredging work.
The waterways of Urmston Road and the Adamasta Channel will have type 3A or 3B trenches. These
consist of pre-trenching with 3m of rock backfill. The only difference between
3A and 3B is that the seabed will be dredged so that the top of the rock armour
is at least -17m for type 3A. For the purpose of this study, they are
essentially similar and are designed to protect against 20 tonne anchors. This
covers the full range of ships currently operating in Hong Kong and also those
expected in future.
Figure 3.1 Pipeline
Route
Figure 3.2 Pipeline
Trench Types
The marine traffic influences the risks
from the pipeline in two ways:
·
It
increases the potential for damage due to interference such as anchor drop/drag
incidents; and
·
In
the event of a pipeline failure, marine traffic could exacerbate the
consequential effects causing fatalities.
The marine vessel traffic volume was
surveyed by BMT [4] using tracks of vessel movements obtained from radar. The
important details pertinent to the current study are repeated here for
completeness.
3.2.1
Marine Vessel Activity along Pipeline
Route
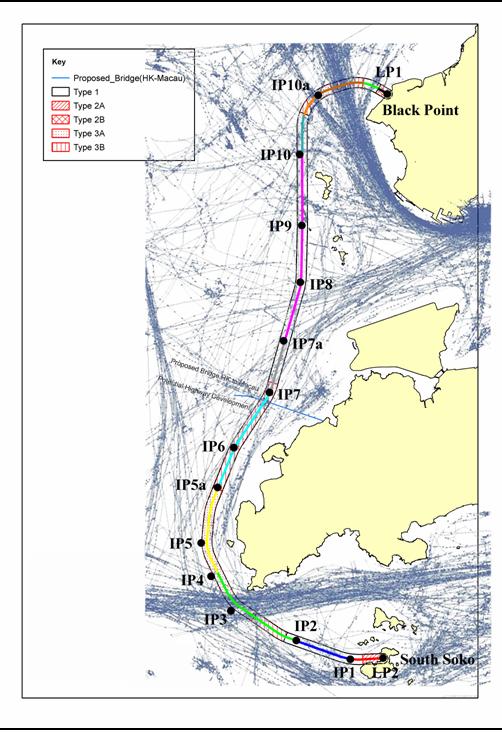
The marine traffic report [4] divides the
pipeline route into sections using ‘gate posts’ that roughly correspond to key
locations along the pipeline route. These same gate posts are adopted in the
current study (Figure 3.3).
The South Soko approach
(LP2-IP1) is characterised by local fishing activities and the movement of
small craft. The pipeline heads westwards and crosses the Adamasta
Channel between gates IP2-IP4. The marine traffic in this area is dominated by
fast ferries and rivertrade activity. These fast
ferries service Macau and Zhuhai and travel at 40-45
knots. There is also a traffic separation scheme (TSS) and turning buoy in this
area. Section IP4-IP5a around the western edge of Lantau
Island consists mainly of fishing vessels currently. IP5a-IP7 passes by the Y3
Anchorage area. It is understood that this anchorage is used by large oil
tankers transferring their load to smaller vessels that service the Pearl River
[10]. There is very little information available regarding this since the
anchorage is outside Hong Kong waters, but the presence of such activity is
confirmed by the existence of anchor marks on the seabed [8]. There are also
plans to develop a container terminal (CT10) in this area. Although these plans
are very tentative at the moment, a high level of pipeline protection (type 3B)
is maintained through this section.
IP7-IP10 is used by fishing vessels and rivertrade vessels en route between Tuen
Mun and Macau/Zhuhai. The
water is shallow in this region, ranging from 4-8m deep. This precludes its use
by large draft vessels. This section also runs along the edge of the Sha Chau/Lung Kwu
Chau Marine Park.
Gate post IP10a lies near the centre of
Urmston Road. This is the main route for container ships, rivertrade
vessels and fast ferries plying between Hong Kong and the ports of the Eastern
Pearl River Delta.
Figure 3.3 Reference
Points for Proposed Pipeline
3.2.2
Vessel Types
The marine traffic consultant has calculated
the marine traffic volume between pairs of gate posts based on radar tracks
[4]. The vessel speeds and apparent size from the radar returns are interpreted
into 6 marine vessel categories (Table.
3.2). The same categories are used for the current study.
Table 3.2 Vessel Classes
Adopted for Assessment
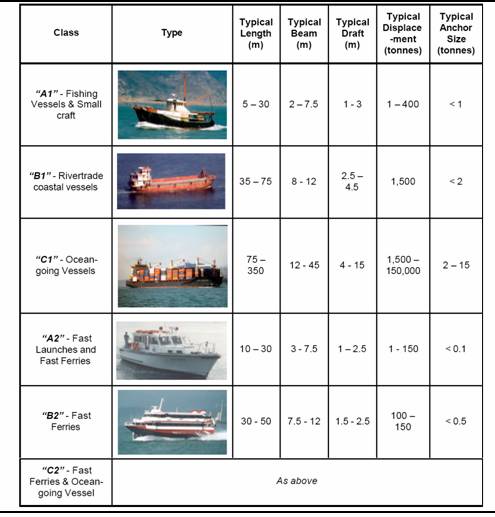
Based on this vessel classification, the
population used in this study are as given in Table 3.3. The maximum population of fast ferries is assumed to be
450, based on the maximum capacity of the largest ferries operating on routes
to Macau and Pearl River ports. However, the average load factor of fast
ferries to Macau is 52% and Pearl River ports is 37% [11] while the overall
average load factor considering all ferries is about 50% [10]. Hence, a
distribution in ferry population was assumed as indicated in Table 3.3. This distribution gives an
overall load factor of about 58% which is conservative and covers any future
increase in vessel population. There is an additional category in the traffic volume
data called ‘Others’ (see Section 3.2.3).
These are assumed to be small vessels with a population of 5.
Table 3.3 Vessel Population
|
Class |
Population |
|
|
|
Fishing
vessel Rivertrade
coastal vessels Ocean-going
vessels Fast
launches Fast
ferries Other |
5 5 21 5 450
(largest ferries in peak hours, 4 hours a day) 350
(average ferry in peak hours, 4 hours a day) 280 (80%
capacity, peak hours, 4 hours a day) 175 (50%
capacity, daytime operation, 9 hours a day) 105 (30%
capacity, late evening, 4 hours a day) 35 (10%
capacity, night time, 7 hours a day) 5 |
3.75% of
trips 3.75% of
trips 22.5% of
trips 52.5% of
trips 12.5% of
trips 5.0% of
trips |
|
3.2.3
Traffic Volume
The traffic volume as provided by BMT [4] is
given in Table 3.4. This is for the
year 2003. BMT also provide predictions for the years 2011 and 2021 (Table 3.5). In this study, 2011 is used
as the base case and 2021 as the future scenario. Two future scenarios are
considered: with and without the development of the Tonggu
Waterway.
The data in Table 3.4 required further interpretation. Vessel class A2 is
described as fast launches and fast ferries. The population of a fast launch is
very different from that of a fast ferry and so a more precise breakdown is
required. Some of these A2 fast ferries clearly belong in class B2 with the
other fast ferries. Taking into consideration the timetable of ferries serving
Macau and the Pearl River ports and information provided by the marine
consultant [10], it was assumed that 55% of fast vessels along Urmston Road and
75% of fast vessels along the Adamasta Channel are
fast ferries. For intermediate sections, such as near Sha
Chau, an intermediate value of 65% was assumed.
Class C2 is described as fast ferries and
ocean-going vessels. Since all fast ferries have now been accounted for, class
C2 are assumed to comprise of cargo ships only. This is consistent with
assumptions made in the marine activity report [4,10].
The data shows a small number of
ocean-going vessels (class C1 and C2) along the route between gates IP6 and
IP10. The shallow water along these sections negates the possibility that these
are large vessels. They must be vessels at the smallest end of the distribution
of ocean-going vessels, no more than 100m long [10]. More likely, they are rivertrade vessels. They were therefore treated as smaller
vessels in the analysis by reclassifying them as either rivertrade
or ‘other’ vessels.
Table 3.4 Traffic Volume
across Gate Sections (Daily Average, 2003)
|
|
Table 3.5 Traffic Growth
Forecast
|
Vessel Type |
2011 compared to 2003 |
2021 compared to 2003 |
|
Ocean-going
Vessel Rivertrade
Coastal Vessel Fast
Ferry Fishing
Vessel/ Small Craft/ Fast launch Others |
-5% +5% +10% +5% +5% |
+10% +15% +30% +15% +15% |
Based on the above discussions, the
pipeline route was divided into 12 sections for analysis (Table 3.6, Figure 3.4). The first section is from LP2 to IP1, named
South Soko Approach. Similarly the second section is chosen
between gates IP1 and IP2, and named West Soko. The Adamasta channel spans IP2 to IP4 and so these are grouped
into one section for analysis. Similar grouping is performed for the remainder
of the pipeline.
Gate IP10a warranted extra interpretation since
it lies in the centre of Urmston Road. The section from IP10 to IP10a spans a
change in rock armour protection from type 1 to type 3A/B. A careful
examination of the radar tracks from marine vessels (overlaid in Figure 3.4) shows a higher density of vessels
along this section pass close to gate IP10a i.e. within Urmston Road where
there is greater rock armour protection on the pipeline. This section was
therefore split into two, denoted North Lung Kwu Chau and Urmston Road West, and some assumptions made
regarding the distribution of vessels between the two parts. It was assumed
that roughly equal numbers of vessels traverse each part, the shorter length of
the Urmston Road West section therefore getting a higher density of ships as
observed in the radar tracks. Large vessels such as ocean-going vessels were
assumed to pass entirely through Urmston Road West since the water would be too
shallow in North Lung Kwu Chau.
Similarly, the final section of pipeline
from IP10a to LP1 was split into 3 sub-sections to reflect changes in rock
armour protection on the pipeline. These were named Urmston Road Central,
Urmston Road East and Black Point Approach. Based on the radar tracks, about
95% of vessels were assumed to pass within Urmston Road Central. Of the remaining
5% of vessels, most were assumed to traverse the Urmston Road East section.
Table 3.6 Pipeline
Segmentation
|
|
Section |
Gate |
Kilometre Post |
Length (km) |
Typ. Water depth (m) |
Trench type |
||
|
From |
To |
From |
To |
|||||
|
1 2 3 4 5 6 7 8 9 10 11 12 |
South Soko Approach West Soko Adamasta
Channel West Lantau Tai O North Lantau Sha
Chau North
Lung Kwu Chau Urmston
Road West Urmston
Road Central Urmston
Road East Black
Point Approach |
LP2 IP1 IP2 IP4 IP5a IP7 IP7a IP10 IP10a |
IP1 IP2 IP4 IP5a IP7 IP7a IP10 IP10a LP1 |
0 1.6 4.5 9.8 14.2 19.5 22.2 31.6 33.5 34.7 37.0 37.8 |
1.6 4.5 9.8 14.2 19.5 22.2 31.6 33.5 34.7 37.0 37.8 38.3 |
1.6 2.9 5.3 4.4 5.3 2.7 9.4 1.9 1.2 2.3 0.8 0.5 |
5 8 25 20 17 7 6 4 20 20 5 4 |
2A 1 3B/3A 3A 3B 1 1 1 3B/3A 3A/3B 1 2B |
Figure 3.4 Segmentation
of the Route
Based on the above discussion, the marine
traffic volume used in the present analysis is summarized in Table 3.7. Additional ocean-going vessels
were injected into Urmston Road as indicated in the marine consultant report
[4].
Table 3.7 Traffic Volume
Assumed for Base Case 2011
|
|
Traffic volume (ships per day) |
|
|||||||
|
Section |
Fishing |
River-trade |
Ocean-going |
Fast Launch |
Fast ferry |
Other |
Total |
||
|
1 2 3 4 5 6 7 8 9 10 11 12 |
South Soko Approach West Soko Adamasta
Channel West Lantau Tai O North Lantau Sha
Chau North
Lung Kwu Chau Urmston
Road West Urmston
Road Central Urmston
Road East Black
Point Approach |
0 21 126 11 42 37 79 21 21 250 11 2 |
0 0 16 2 1 12 22 3 2 265 13 3 |
0 0 7 3 4 0 0 0 6 144 0 0 |
1 2 83 4 7 5 28 24 23 117 5 2 |
0 6 260 9 12 11 44 31 30 150 7 0 |
0 4 4 4 4 6 27 8 2 5 2 0 |
1 33 496 33 70 71 200 87 84 931 38 7 |
|
|
|
Total |
621 |
339 |
164 |
301 |
560 |
66 |
2051 |
|
Tables of traffic
volume for the 2021 future scenarios were created in a similar manner. These
are given in the main text (Section
13.9.3).
3.3.1
Ocean-Going Vessel Distribution
All classes of ship, with the exception of
ocean-going vessels, have anchor sizes below 2 tonnes (Table 3.2), and it is noted that the entire length of the proposed
pipeline will have rock armour protection designed to protect against at least
2 tonne anchors. Ocean-going vessels cover a very wide range of size. A
breakdown of the size distribution for this class of marine vessels is given in
Table 3.8 [4, 10]. These vessels are
predominantly found in Urmston Road which has type 3A/B rock armour protection to
protect against anchors up to 20 tonnes. From the size distribution, it can be
seen that the majority of these ships are below about 100,000 tonnes
displacement and so the majority of anchors are below about 10 to 12 tonnes.
Table 3.8 Size Distribution of
Ocean-Going Vessels
|
Size Range (dwt) † |
Displacement (tonnes)* |
Length |
Anchor Size |
Proportion of Ships (%) |
|
1,500 –
25,000 25,000 –
75,000 75,000 –
100,000 |
1,500
– 35,000 35,000
– 110,000 |
75
– 200 200
– 300 300
– 350 |
2
– 5 5
– 12 12
– 15 |
60 35 5 |
|
† Dead
Weight (dwt) = Cargo + Fuel + Water + others *
Displacement = Total Weight = Hull + Machinery + Outfit + Dead Weight Displacement has been assumed to be ~ 1.4 x dwt |
||||
This section identifies the main hazards
from the subsea gas pipeline during the operational
phase. Hazard identification is based on a literature review as well as HAZID
studies conducted for the proposed pipeline.
4.1.1
Incident Databases and Pipeline Reports
The Consultants (ERM) have examined
incident databases such as the MHIDAS [12] and the IChemE
Accident Database [13]. Only two pipeline incidents in offshore Vietnam have
been reported in the Asia-Pacific region. These occurred at White Tiger and Vung Tau, both in 1994 and both
were caused by anchor damage. No injuries were reported.
Relevant reports on major subsea pipeline failures (that caused fatality) by the
National Transportation Safety Board have also been reviewed [14, 15]. A
summary of a few main incidents from these sources are included in the
following paragraphs.
Tiger
Pass, Louisiana, 1996
On October 23, 1996, in Tiger Pass,
Louisiana, the crew of the dredge Dave
Blackburn dropped a stern spud (a spud is a large steel shaft that is
dropped into the river bottom to serve as an anchor and a pivot during dredging
operations) into the bottom of the channel in preparation for continued
dredging operations. The spud struck and ruptured a 12" diameter submerged
natural gas steel pipeline. The pressurised (about 930 psig) natural gas
released from the pipeline enveloped the stern of the dredge and an
accompanying tug. Within seconds of reaching the surface, the natural gas
ignited and the resulting fire destroyed the dredge and the tug. All 28 crew
members from the dredge and tug escaped into water or onto nearby vessels. No
fatalities resulted.
The incident occurred due to incorrect
information on the location of the gas pipeline that was passed on by the gas
company to the dredging operator. The investigation report on the incident (by
the National Transportation Safety Board) recommended that all pipelines
crossing navigable waterways are accurately located and marked permanently.
Mississippi River Delta, 1979
In an incident in the Mississippi River
Delta in 1979, four workers drowned attempting to escape a fire that resulted
when a crane barge dropped a mooring spud into an unmarked high pressure
natural gas pipeline.
Louisiana, 1987
In July 1987, while working in shallow
waters off Louisiana, a fishing vessel, the menhaden purse seiner
Sea Chief struck and ruptured an 8" natural gas liquids pipeline operating
at 480 psi. The resulting explosion killed two crew
members. Divers investigating found that the pipe, installed in 1968, was
covered with only 6" of soft mud, having lost its original 3-foot cover of
sediments.
Sabine Pass, Texas, 1989
A similar accident occurred in October
1989. The menhaden vessel Northumberland struck a 16" gas pipeline in
shallow water near Sabine Pass, Texas. The vessel was engulfed in flames; 11 of
the 14 crew members died. The pipeline, installed in 1974 with 8 to 10 feet of
cover, was found to be lying on the bottom, with no cover at all.
4.1.2
Pipeline Failure Databases
There are a few international failure
databases for gas and liquid transmission pipelines which are useful in
identifying potential hazards and estimating the frequency of loss of
containment incidents.
The most comprehensive database on
offshore gas pipeline failures is available in a report published by the UK
Health and Safety Executive entitled 'PARLOC 2001' [7]. The most recent version
of this database covers incidents from the 1960s up to 2000. The information in
this database is based on data obtained from regulatory authorities in the UK,
Norway, the Netherlands, Denmark and Germany, Operators in the UK, Dutch and
Danish sectors and published sources. The main causes of pipeline failure, as
identified from a review of the PARLOC 2001 data, are listed in Table 4.1. Based on this, it can be seen
that anchor/impact followed by internal corrosion are the main contributors to subsea pipeline failures.
A similar database on incidents involving
offshore pipelines in the US has also been referred to [16]. This is based on
incidents that are required to be reported to the US Department of
Transportation (DOT) under the Federal Regulations. Out of 109 incidents
reported during the period 1985 to 1994, only one incident involved a fatality,
and only one incident involved leak ignition. The main causes of pipeline
failure, as identified from a review of the US DOT database, are listed in Table
4.2. Based on this, it can be seen that third party damage and internal
corrosion (characteristic of well fluid pipelines) are the main contributors to
subsea pipeline failures.
Table 4.1 Causes
of Subsea Pipeline Incidents from PARLOC 2001 [7]
|
Main cause |
Detail |
No. of Incidents of Loss of Containment |
||
|
|
|
Platform Safety Zone(1) |
Subsea Well Safety Zone(2) |
Mid-line |
|
ANCHOR |
Supply Boat |
6 |
- |
- |
|
|
Rig or Construction |
- |
- |
- |
|
|
Other/ Unknown |
0 |
- |
2 |
|
|
Total |
6 |
- |
2 |
|
IMPACT |
Trawl |
- |
- |
6 |
|
|
Dropped Object |
- |
- |
- |
|
|
Wreck |
- |
- |
1 |
|
|
Construction |
1 |
- |
- |
|
|
Other/ Unknown |
- |
- |
1 |
|
|
Total |
1 |
- |
8 |
|
CORROSION |
Internal |
3 |
4 |
7 |
|
|
External |
1 |
- |
2 |
|
|
Unknown |
1 |
- |
2 |
|
|
Total |
5 |
4 |
11 |
|
STRUCTURAL |
Expansion |
- |
- |
- |
|
|
Buckling |
- |
- |
- |
|
|
Total |
- |
- |
- |
|
MATERIAL |
Weld Defect |
2 |
- |
1 |
|
|
Steel Defect |
2 |
1 |
1 |
|
|
Total |
4 |
1 |
2 |
|
NATURAL HAZARD |
Vibration |
- |
- |
- |
|
|
Storm |
- |
- |
- |
|
|
Scour |
- |
- |
- |
|
|
Subsidence |
- |
- |
- |
|
|
Total |
- |
- |
- |
|
FIRE/ EXPLOSION |
Total |
- |
- |
- |
|
CONSTRUCTION |
Total |
- |
- |
- |
|
MAINTENANCE |
Total |
- |
- |
- |
|
OTHERS |
Total |
2 |
1 |
4 |
|
TOTAL |
|
18 |
6 |
27 |
|
(1) Platform safety zone and subsea
safety zone refer to pipelines located within 500m of an offshore platform
and subsea well respectively (2) Mid-line refers to pipelines located
more than 500m from a platform or subsea well. |
||||
Table 4.2 Causes
of Subsea Pipeline Incidents from US DOT Database [16]
|
Cause of Failure |
Description of Cause |
No. of Incidents |
% of Total Incidents |
Incidents Considered
(1) |
||
|
1. EXTERNAL FORCE |
25 |
29.8% |
24 |
|||
|
Earth Movement |
Subsidence, landslides |
2 |
2.4% |
2 |
||
|
Heavy Rains/Floods |
Washouts, floatation, scouring |
1 |
1.2% |
|
||
|
Third Party |
|
21 |
25.0% |
21 |
||
|
Previously Damaged Pipe |
Where encroachment occurred in the past |
1 |
1.2% |
1 |
||
|
|
|
|
|
|
||
|
2. CORROSION |
45 |
53.6% |
3 |
|||
|
External Corrosion |
Failure of coating/CP |
3 |
3.6% |
3 |
||
|
Internal Corrosion |
|
42 |
50.0% |
|
||
|
|
|
|
|
|
||
|
3. WELDS & MATERIALS |
4 |
4.8% |
4 |
|||
|
Defective Fabrication Weld |
Welds in branch connections, hot taps, weld-o-lets,
sleeve repairs |
2 |
2.4% |
2 |
||
|
Defective Girth Weld |
|
2 |
2.4% |
2 |
||
|
|
|
|
|
|
||
|
4. EQUIPMENT & OPERATIONS |
3 |
3.6% |
|
|||
|
Equipment Failure |
Malfunction of control or relief equipment, failure
of threaded components, gaskets & seals |
3 |
3.6% |
|
||
|
|
|
|
|
|
||
|
5. OTHERS |
7 |
8.3% |
7 |
|||
|
Unknown |
|
7 |
8.3% |
7 |
||
|
|
|
|
|
|
||
|
TOTAL |
84 |
100% |
38 |
|||
|
1.
Only
these incidents are considered relevant to the proposed pipeline. |
||||||
4.1.3
Incident Records and Protection Measures
for Pipelines in Hong Kong Waters
A review of existing and proposed subsea pipelines in
Hong Kong waters including the level of protection provided are reviewed in the
following paragraphs.
Subsea Pipelines
Existing subsea
pipelines in
·
The
28" natural gas pipeline from Yacheng Field, South China Sea (90km south of
·
the
20" dual aviation fuel pipelines
between Sha Chau jetty and
the airport (about 5km length), installed in 1997, are laid in a 2.2m trench and
provided with sand cover plus rock armour protection. The water depth along the
route varies from 4-7m. There has been no incident of damage reported;
·
the
Airport Authority propose to construct another 5km submarine aviation fuel pipeline from Sha Chau jetty to the new tank
farm in Tuen Mun. The
pipeline will be crossing the Urmston Road shipping route and similar
protection as for the existing pipelines (i.e. rock armour protection) is
proposed. It is understood that the rock armour protection will be designed for
22 tonne anchors;
·
the town gas subsea
pipelines are also reported to have no damage record. These pipelines are laid at a depth of 2 to
3m below seabed and protected by engineering backfill materials;
·
the
Hong Kong Electric Company recently laid a pipeline from its Lamma Power Station Extension to Shenzhen LNG Terminal. The
pipeline is jetted to 3m below seabed and protected with rock armour in high
risk areas near the anchorages and shore approaches; and
·
the
recently installed town gas subsea pipeline from Shenzhen to Tai Po is jetted to 3m
below seabed with additional rock armour protection in high risk areas.
By comparison, the proposed CAPCO pipeline
will be laid in waters between 4 and 25m deep. The pipeline will be provided
with 3m of rock cover except in areas of shallow water where it will have 1m of
rock cover. These rock cover requirements are based on water depth (which
determines the size of vessels) and marine traffic volume. The measures
proposed are in line with, or exceed, comparable pipeline installations.
A Hazard Identification (HAZID) workshop
was held on 15th February 2006 as part of this QRA Study for the
pipeline. Representatives from CLP Power, ExxonMobil and BMT participated in the
hazard sessions. Various hazards considered relevant for this pipeline are
discussed in the worksheets presented in Table
4.3.
Table 4.3 HAZID
Worksheet
|
System: 1. Pipeline – General |
|
|||||
|
Subsystem: 1. Third party |
|
|||||
|
Hazards/ Keywords |
Description/ Causes |
Consequences |
Safeguards |
Recommendations |
|
|
|
1.
Anchor Drag |
1.
Emergency anchoring for vessel underway due to loss of steerage, power or control,
either due to mechanical problems or due to collision events. |
1.
Possibility of damage to external coating, damage to pipe requiring remedial
action. |
1.
Engineered rock protection with respect to vessel sizes/types. |
1. Periodic
survey along the route to be carried out to ensure integrity of the
protection. |
|
|
|
2.
Depth of cover. |
|
|||||
|
2.
Potential loss of containment leading to gas release. Impact on passing vessels
and shore population. Vessel involved in the incidents may sink due to loss
of buoyancy caused by the gas bubbling. |
|
|||||
|
3.
Route avoiding anchorage areas. |
|
|||||
|
2.
Drag from anchorage areas under storm condition. |
|
|||||
|
4. Concrete
external coating. |
|
|||||
|
5.
Heavy wall pipe in shore approaches. |
|
|||||
|
3.
Disturbance to the rock cover protection. Possible exposure of the pipe. |
|
|||||
|
6.
Marking marine charts of the pipeline route. |
|
|||||
|
7. Shore
population is at least 3km away along the route except near the shore
approach. |
|
|||||
|
3.
Anchoring by vessels outside anchorages. |
|
|||||
|
||||||
|
||||||
|
||||||
|
||||||
|
2.
Anchor Drop |
1.
Same as cause 1 & 3 of anchor drag hazard |
1.
Same as consequence 1, 2 & 3 of anchor drag hazard but less severe. |
1.
Same as for anchor drag hazard. |
|
|
|
|
3.
Dropped Object |
1.
Loss of cargo |
1.
Same as consequence 1, 2 & 3 of anchor drag hazard but less severe. |
1. Same
as safeguards 1, 2, 4, 5, & 7 of anchor drag hazard. |
|
|
|
|
2.
Construction activities |
|
|
||||
|
4.
Dumping |
1.
Dumping of construction waste and other bulk materials outside of designated
dumping grounds. |
1.
Minor surface damage. |
1. Same
as safeguards 1, 2, 4, 5, & 7 of anchor drag hazard. |
|
|
|
|
5.
Grounding |
1.
Navigation error, loss of control due to mechanical or adverse weather. |
1.
Same as consequence 1,2 & 3 of anchor drag hazard. |
1. Burial
depth appropriate to the type of shipping activities |
|
|
|
|
2.
Displacement of the pipeline leading to exposure |
|
|
||||
|
6.
Vessel Sinking |
1.
Collision, foundering. |
1.
Same as consequence 1, 2 & 3 of anchor drag hazard. |
1. Route
avoids shipping channel where possible. |
|
|
|
|
7.
Fishing & Trawling |
1. Operation of trawl board and other
fishing/trawl gear. |
1.
No damage to the pipeline. |
1.
Pipeline is buried to 3m below the seabed with rock cover flush with seabed. With
respect to shore area at BPPS, it is buried to 1.5m with rock cover flush
with seabed. |
|
|
|
|
8.
Dredging |
1.
Impact from dredge bucket or drag head. Expected location of maintenance
dredging are Adamasta Channel, along the Urmston road,
along the TSS |
1.
Same as consequence 1, 2 & 3 of anchor drag hazard but less severe. |
1.
Burial depth appropriate to the type of shipping activities. |
|
|
|
|
2.
Engineered rock protection with respect to vessel sizes/types. |
|
|
||||
|
3. Depth
of cover. |
|
|
||||
|
4.
Marking marine charts of the pipeline route. |
|
|
||||
|
5.
Concrete external coating. |
|
|
||||
|
9.
Service crossing or other services in the vicinity |
1.
No crossings envisaged |
|
|
|
|
|
|
10.
HZMB Construction |
1. Piling
for bridge structures near the pipeline, dredging, construction vessel
movement, anchoring and dropped object |
1.
Same as consequence 1,2 & 3 of anchor drag hazard |
1.
Interface with HZMB project owner to co-ordinate designs and schedule |
2. Develop
and implement procedures for safeguarding the pipeline during HZMB
construction |
|
|
|
2.
Engineered rock protection with respect to vessel sizes/types. |
|
|
||||
|
3.
Depth of cover. |
|
|
||||
|
4.
Concrete external coating. |
|
|
||||
|
11. HZMB
Operation |
1.
Vehicle fall off the bridge |
1.
Same as consequence 1 & 3 of anchor drag hazard |
1.
Same as safeguards 1, 2 & 4 of anchor drag hazard |
|
|
|
|
System: 1. Pipeline – General |
||||
|
Subsystem: 2. Natural |
||||
|
Hazards/ Keywords |
Description/ Causes |
Consequences |
Safeguards |
Recommendations |
|
1.
Scouring |
1.
Current and wave actions |
1.
Possible reduction of cover |
1.
Alignment is away from areas of high currents |
|
|
2. Engineered
rock cover |
||||
|
3.
Periodic surveys along the route |
||||
|
2.
Seismic event |
1.
Low seismic area |
1.
No damage |
1.
None required |
|
|
3.
Subsidence |
1.
No issue |
|
|
|
|
System: 1. Pipeline – General |
||||
|
Subsystem: 3. Construction |
||||
|
Hazards/ Keywords |
Description/ Causes |
Consequences |
Safeguards |
Recommendations |
|
1.
Damage to pipeline during construction |
1.
Damage after pipelay |
1.
Possible release if gas taken in |
1. Pre-commissioning
procedures to ensure integrity of pipeline before gas-in |
|
|
System: 1. Pipeline – General |
||||
|
Subsystem: 4. Operational |
||||
|
Hazards/ Keywords |
Description/ Causes |
Consequences |
Safeguards |
Recommendations |
|
1. Internal
corrosion |
1.
No issue for regassified LNG since it is clean and
dry gas |
|
|
|
|
2.
External corrosion |
1.
Sea-water; corrosive environment |
1.
Loss of wall thickness leading to potential leak |
1.
Coating system |
|
|
2. Sacrificial
anode system |
||||
|
3.
Designed for intelligent pigging |
||||
|
3.
Pressure cycling |
1.
Pipeline pressure will vary with time of day, loads etc |
1.
Metal fatigue leading to crack |
1.
Design will consider pressure cycles |
|
|
4. Material
defect/ construction defect |
|
1.
Possible leaks |
1.
Quality control during manufacture and construction |
|
|
System: 1. Pipeline – General |
||||
|
Subsystem: 5. Interface at Terminal
End |
||||
|
Hazards/ Keywords |
Description/ Causes |
Consequences |
Safeguards |
Recommendations |
|
1.
South Soko option will include a pig launching
facility. This includes piping and valving which is
covered in the TQRA |
|
|
|
|
|
System: 1. Pipeline – General |
||||
|
Subsystem: 6. Interface at GRS End in
BPPS |
||||
|
Hazards/ Keywords |
Description/ Causes |
Consequences |
Safeguards |
Recommendations |
|
1.
To be covered as part of GRS |
|
|
|
|
|
System: 2. Pipeline - Future
Developments |
||||
|
Subsystem: 1. All |
||||
|
Hazards/ Keywords |
Description/ Causes |
Consequences |
Safeguards |
Recommendations |
|
1.
Potential future CT10 construction |
1.
Dredging to create a new access channel, building of sea wall in proximity to
the pipeline, construction vessel movement, introduction of more shipping
activity, anchoring |
1.
Damage to pipeline |
1.
Current alignment is based on existing seabed profile. Flexibility for
alternative measures to be designed |
|
|
2. Tonggu channel |
1.
As currently shown, this channel is outside HK waters |
1.
No impact along the proposed route |
|
|
|
System: 3. GRS |
||||
|
Subsystem: 1. All |
||||
|
Hazards/ Keywords |
Description/ Causes |
Consequences |
Safeguards |
Recommendations |
|
1.
Leak from tappings, flanges and piping |
1.
Corrosion, mechanical failure, etc |
1.
Potential loss of containment |
1.
Gas and fire detection |
|
|
2. Maloperation during maintenance (including dropped
object), pigging |
2.
Shutdown system |
|||
|
3. Operating
and maintenance procedures |
||||
|
2.
Overpressure downstream of letdown valve |
|
1.
Potential loss of containment |
1.
Active/monitor and slam shut system |
|
4.3
Hazardous
Properties of Natural Gas
The natural gas to be transmitted by the
pipeline predominantly contains methane (87.6 - 96.1 mol%). Other components of
the gas include ethane (3.4 – 7.6 mol%), propane (0.4 - 3.1%) and butane (0.07
– 1.7%). It is a flammable gas that is lighter than air (buoyant). The
properties of natural gas are summarised in Table
4.4.
Table 4.4 Properties of
Natural Gas
|
Property |
Natural Gas |
|
Synonyms State Molecular
Weight Density
(kg/m3) Flammable
Limits (%) Auto-ignition
Temperature (°C) |
Methane Gas 16.7 -
18.7 0.55 (at
atmospheric conditions) 5 - 15 540 |
4.4
Discussion on
Subsea Pipeline Hazards
The incident records highlight the
potential for damage to subsea pipelines from marine
activity such as fishing, dredging and anchoring as well as the potential for
the vessel (that caused damage) to become involved in the fire that follows.
A review of subsea
pipeline incidents in Europe and the US suggests that third party damage
(including anchor and impact incidents) and internal corrosion are the main
contributors to subsea pipeline failures.
It is noted that the above databases
covers a large proportion of well fluid pipelines where internal corrosion is
relevant as compared to clean natural gas transported from an LNG terminal as
considered in this study.
Most existing pipelines in Hong Kong
waters have some rock cover protection in addition to being buries, although it
is noted that these pipelines are either crossing shipping channels or laid in
waters with high levels of marine activity.
A brief description of the main causes of
failure of a subsea pipeline is included in the
following paragraphs.
4.4.1
External Impacts
Anchor drop/drag is the dominant cause of
potential failure or damage to a subsea pipeline.
This occurs when a ship anchor is dropped inadvertently across the pipeline.
The type of damage that could be caused will vary depending on the size of
anchor and other factors such as pipeline protection.
Anchor Drop
The decision for a mariner when to drop an
anchor depends on the particular circumstances and the proximity of the
pipeline route to the flow of marine traffic, port/harbour areas and designated
anchorage locations. In fairways, traffic will normally be underway where the
necessity to drop anchor is expected to be low. Consistent with normal
practice, the pipeline route will be identified on nautical charts. The mariner
is then provided with the necessary information to avoid anchoring where the
pipeline could be damaged.
Emergency situations may arise such as
machinery failure or collision thereby limiting the choice where to drop
anchor. Such a decision will, as part of a mariner’s responsibility, be
influenced by the particular circumstances and the pipeline route delineated on
the navigation chart.
Anchorage area Y3 is believed to be used
by oil tankers transferring their load to smaller vessels. Although it is
expected that vessels should be aware of all subsea
installations (including gas pipelines) since these are marked on the admiralty
nautical charts, erroneous dropping of anchor (i.e. error in position at the
time of deployment) are known to occur. Under adverse weather conditions, it is
also possible for a vessel anchored at the anchorage area to drift with its
anchor dragging along the seabed.
Anchoring activity along the pipeline
route is taken into consideration in the analysis when assigning failure
frequencies for anchor damage (Section
5.3)
Anchor Drag
Anchor drag occurs due to poor holding
ground or adverse environmental conditions affecting the holding power of the
anchor. The drag distance depends on properties of the seabed soil, the mass of
ship and anchor and the speed of the vessel. If there is a subsea
pipeline along the anchor drag path, anchor dragging onto the pipeline may result
in localised buckling or denting of the pipeline, or over-stressing from
bending if the tension on the anchor is sufficient to laterally displace the
pipeline. A dragged anchor may also hook onto a pipeline during retrieval
causing damage as a result of lifting the pipeline.
Anchor dragging is taken into
consideration when assigning anchor damage frequencies in the analysis (Section 5.3).
Vessel Sinking
Vessel sinking in the vicinity of the
pipeline may cause damage to the pipeline resulting in loss of containment.
Vessel sinking will depend on the intensity of marine activity in a given area.
For the years 1990 to 2005, there were 446 incidents of vessel sinking in Hong
Kong waters [17]. This averages 28 cases per year. Most of the recorded incidents
occurred in Victoria Harbour and the Ma Wan Channel and involved mainly smaller
vessels of less than 1,000 dwt, which will have less
impact on a pipeline buried 3m below the seabed. The probability that a vessel
sinking incident will impact the proposed pipeline is therefore considered to
be low, in comparison to anchor impact damage. Additionally, pipeline damage
due to vessel sinking is included in the historical pipeline failure data for
external impact used in this study (see
Table 4.1).
Dropped Objects
Objects other than anchors may be dropped
from vessels passing over the pipeline or vessels operating in the vicinity,
e.g. those carrying out construction of new subsea
installations, new harbour developments, etc. The dropped objects may include
construction tubulars, shipping containers,
construction/maintenance equipment, etc.
The pipeline will be lowered to 3m below
seabed and protected by at least 1m of rock armour. Given the likely sizes of
dropped objects and the level of pipeline protection provided, loss of
containment due to dropped objects is not considered to be a significant
contributor to the risk and is not included in the analysis.
Aircraft Crash
The pipeline route runs within 3.7km of
the threshold of runway 07L at Chep Lap Kok Airport. Although rare, the possibility exists for
aircraft to crash on final approach to landing, or shortly after take-off. Such
a crash may be onto the pipeline, albeit with a small probability.
The water along this section of the
pipeline route is about 7m deep with the pipeline buried 3m below the seabed
and protected by 1m of rock armour and 2m of natural backfill. Aircraft are
constructed from light weight materials such that even a fully loaded Boeing
747 weighs only 400 tonnes. Aircraft also readily breakup
on impact with water, scattering the debris over a larger area. Given that the
pipeline is buried and protected and aircraft have limited weight, it is
considered not possible for an aircraft to damage the pipeline.
Fishing Activity
Based on the BMT report [4], there is
active fishing along much of the proposed pipeline route. Many of the
techniques involve towing of a variety of equipment along the seabed. Pipeline
damage from fishing gear can occur due to impact, snagging of nets or trawl
door on the pipeline or a "pull over" sequence. Impact loads mainly
cause damage to the coating whilst pull over situations can cause much higher
loads, which could lead to damage of the steel pipeline itself.
The vessels of concern are stern trawlers
with lengths up to 30m. Considering the size and weight of trawl gear and since
the pipeline will be lowered to 3m below seabed and protected by rock armour
for the entire route, pipeline damage due to trawling activities are not
possible and are not considered further.
Dredging Activities
Dredging vessels could cause damage due to
dredging operations involving cutting heads. They could also cause damage to
the pipeline by anchoring.
It is assumed that dredging operations
will be closely monitored and controlled and therefore there is no potential
for pipeline damage due to dredging.
4.4.2
Spontaneous Failures
Corrosion
Corrosion is one of the main contributors
to pipeline failures. Corrosion is attributed mainly to the environment in which
they are installed (external) and the substances they carry (internal).
The proposed pipeline will be protected
against external corrosion by sacrificial anodes in addition to an asphalt
coating. However, ineffective corrosion protection due to a failure or
breakdown of the protection system could cause external corrosion resulting in
general or local loss of wall thickness leading to pipeline failure.
Historically, internal corrosion is a
greater cause of pipeline failure compared to external corrosion. However, the
proposed pipeline will transport gas that does not contain components that
induce corrosion such as water/moisture, carbon dioxide, hydrogen sulphide,
etc. This will largely alleviate the effects of internal corrosion.
Despite these considerations, loss of
containment due to corrosion (both internal and external) remains a possibility
and is included in the analysis.
Mechanical Failure
Mechanical failure of the pipeline could
occur for various reasons, including material defect, weld failure, etc.
Stringent procedures for pipeline material procurement, welding and hydrotesting should largely mitigate against these hazards.
In any case, it remains a credible scenario and is included in the frequency
data.
4.4.3
Natural Hazards
Natural hazards such as subsidence,
earthquake and typhoon may cause varying degrees of damage to pipelines.
Soft soil can sometimes suffer from
localised liquefaction which can result in pipelines floating out of their
trenches. The pipeline will be designed to withstand such loads, based on
detailed seabed investigations.
Environmental loads (currents and waves)
on the pipeline during the construction phase can compromise the lateral and
vertical on-bottom stability of the pipeline on the seabed. This problem
becomes more acute in shallower waters (near the shore) where the pipeline
attracts a higher level of environmental loads. The pipeline will be designed
to withstand these environmental loads. Once it is jetted/lowered to 3m below
the seabed, it would not be exposed directly to 100 year return wave loads.
Based on the above considerations,
pipeline damage due to natural hazards is considered negligible and is not
assessed further in this study.
This section presents the base failure
frequency data for the hazards identified as having damage potential in Section 4. The approach to frequency
analysis is based on the application of historical data worldwide for similar
systems, modified suitably to reflect local factors such as proximity of the
pipeline route to busy shipping channels and anchorages.
Event tree analysis was used to determine
the probabilities of various hazard outcomes (such as flash fire) occurring,
following a release.
The international database that is most
comprehensive in its coverage of subsea pipelines is
PARLOC 2001 [7]. The most recent version of this database which was used in
this study covers incidents from the 1960s until 2000. Incidents recorded in
the database have been classified according to several categories, including:
·
Failure
location, i.e. risers, pipelines within 500m of an offshore platform, pipelines
within 500m of a subsea well and mid-line (pipelines
located more than 500m from a platform or a subsea
well). Failure data pertaining to risers is not relevant to this study and has
therefore been excluded;
·
Pipeline
contents. The database includes both oil and gas pipelines. Where the contents
in the pipeline have an impact on failure rate, such as corrosion, only
incidents pertaining to gas pipelines are considered; and
·
Pipeline
type, i.e. steel pipelines (both pipe body and fittings) and flexible lines.
Only failures involving the pipe body of steel pipelines are considered here.
A breakdown of the incidents recorded in
PARLOC 2001 by failure location is shown in Table
5.1. The number of incidents of loss of containment that have occurred
within 500m of a platform or a subsea well is almost
equal to the number of incidents that have occurred away from it (i.e.
mid-line). The higher failure rate in the vicinity of an offshore installation
(an order of magnitude higher than mid-line) is due to the effect of increased
ship/barge movements in the vicinity and the potential for anchor damage as a result.
The proximity of some sections of the
proposed pipeline route to high marine traffic environment could be regarded as
similar to the environment in the vicinity of the platform safety zone although
it is not strictly comparable.
Table 5.1 Failure
Rate Based on PARLOC 2001 [7]
|
Region of Pipeline |
Operating Experience |
No. of Incidents |
Failure Rate |
|
Mid-line |
297,565 km-years |
27 |
9.1 x 10⁻⁵ /km/year |
|
Platform safety zone |
16,776 years |
18 |
1.1 x 10⁻³ /year |
|
Subsea well safety zone |
2,586 years |
6 |
2.3 x 10⁻³ /year |
|
Total |
307,246 km-years* |
51 |
1.66 x 10⁻⁴ /km/year |
* The number of years in the case of platform and subsea well safety zone is multiplied by 0.5km of safety
zone to obtain corresponding km-years
The main causes of pipeline failure are
summarised in Table 5.2, based on the causes identified in
PARLOC 2001. As discussed earlier,
anchor/impact followed by internal corrosion are the main contributors to
pipeline failure.
Table 5.2 Main
Contributors to Subsea Pipeline Failure (PARLOC 2001)
|
Cause |
Platform Safety Zone |
Subsea Well Safety Zone |
Mid-line |
Total |
|
Anchor/Impact |
7 (39%) |
- |
10 (37%) |
17 (33%) |
|
Internal corrosion |
3 (17%) |
4 (67%) |
7 (26%) |
14 (27%) |
|
Corrosion -others |
2 (11%) |
- |
4 (15%) |
6 (12%) |
|
Material defect |
4 (22%) |
1 (17%) |
2 (7%) |
7 (14%) |
|
Others |
2 (11%) |
1 (17%) |
4 (15%) |
7 (14%) |
|
Total |
18 |
6 |
27 |
51 |
5.2.1
Analysis of Failure Causes
The failure frequency derived from the
PARLOC 2001 data is further filtered to discount those factors that do not
apply to the proposed pipeline. In the case of factors that could have greater influence
on the failure rate for the proposed pipeline (such as anchor/impact),
appropriate increase factors are adopted.
Corrosion
and Material Defect
Based on experience in Europe (Table 5.2), internal corrosion tends to
be a greater problem than external corrosion. For the proposed pipeline,
failures due to internal corrosion are expected to be less likely as the gas
handled is clean, unlike gas transported from wells/platforms which may contain
moisture and hydrogen sulphide. Also, it is assumed that the condition of the
pipeline will be monitored periodically and maintenance work carried out as
necessary.
Failures due to defects in materials and
welds are also expected to be lower than implied by the historical record due to
technological improvements. The database for PARLOC 2001 dates back to the
1960s; there have been significant improvements in pipe material and welding
over the last 10 to 20 years. An 80% reduction is therefore assumed for all
forms of corrosion and material defects.
Taking the mid-line data as the most
representative for the proposed pipeline, the failure rate is therefore derived
as 13 incidences in 297,565 km-years with 80% reduction, giving 8.7 x 10⁻⁶
/km/year.
The PARLOC 96 report [18] provides a
breakdown of loss of containment incidents due to corrosion and material defect
for gas pipelines greater than 5km in length. The failure rate for such
pipelines is lower at 5.9 x 10⁻⁶ /km/year (0.7 failures in 119,182 km-years;
the km-years are lower because only gas pipelines are considered). This value
is considered more appropriate for the proposed pipeline. Unfortunately, a more
current value could not be extracted from PARLOC 2001 due to a difference in
presentation format of the data. However, a downward trend in failure
frequencies is to be expected as technology improves and so 5.9 x 10⁻⁶
/km/year is considered to be reasonable. Incorporating an 80% reduction again
gives a corrosion/defect frequency of 1.18 x 10⁻⁶ /km/year.
Anchoring/Impact Incidents
There is a significant difference in the
failure rate due to anchor/impact incidents for pipelines within 500m of an
offshore platform (8.3 x 10⁻⁴/km/year) as compared to mid-line (3.4
x 10-5 /km/year). A further breakdown of incidents based on pipeline
diameter is given in Table 5.3.
Table 5.3 Frequency
of Loss of Containment Incidents due to Anchor/Impact- Breakdown by Pipe
Diameter & Location
|
|
Frequency (per km per
year) |
|||
|
Location |
<10" diameter |
10 to 16" diameter |
18 to 24" diameter |
24 to 40" diameter |
|
Mid-line |
1.53 x 10⁻⁴ |
2.26 x 10⁻⁵ |
1.76 x 10⁻⁵ |
1.37 x 10⁻⁵ |
|
Safety zone |
6.68 x 10⁻⁴ |
1.94 x 10⁻³ |
4.24 x 10⁻⁴ |
8.6 x 10⁻⁴ |
It is seen from the above that the failure
rate (for mid-line) for larger diameter pipelines is lower by an order of
magnitude in comparison to smaller diameter pipelines.
As
discussed previously, it is considered that the likelihood of pipeline damage
due to anchor/impact incidents may be related to the level of marine activity
(this is taken to be a combination of marine traffic and anchoring activity).
The frequency of pipeline failure due to these causes has therefore been
derived as a function of three levels of marine activity: high, medium and low.
Frequency values are based on the large diameters pipes of 24-40” as given in Table 5.3 since these are the most relevant
to the proposed CAPCO pipeline.
For locations with high marine
activity, a frequency of 8.6 x 10⁻⁴ /km/year is adopted. For low
marine activity, 1.37 x 10⁻⁵ /km/year is used. An intermediate value
of 10-4 /km/year is also applied to locations with medium levels of
marine activity. This is discussed further in Section 5.3 where alternative calculations based on emergency
anchor deployment frequency are also presented for comparison.
These failure frequencies from PARLOC
assume minimal protection for the pipeline. The proposed CAPCO pipeline will be
provided with rock armour protection over its entire length. To allow for this,
the failure frequencies are reduced by appropriate factors as discussed in Section 5.4.
Other Causes
“Other” causes include blockages,
procedural errors, pressure surges etc. As with corrosion, improvements in
technology and operating practices are expected to reduce this significantly
and so a general 90% reduction is assumed for failures due to other causes.
This gives a frequency of
1.34 x 10⁻⁶/km/year (4 cases in 297,565 km-years with 90%
reduction).
5.3
Alternate Approach
to Anchor Damage Frequency
While international data is commonly
applied to infer failure rates for Hong Kong subsea
pipelines, in this section an alternative approach is adopted for comparison.
This is based on the marine traffic incident rate, since such incidents are
more likely to result in emergency anchoring. In the first instance, the
effects of rock armour protection are neglected to allow these calculations to
be compared with historical data from PARLOC. The effects of rock armour protection
are then incorporated as described is Section
5.4.
5.3.1
Frequency of Anchor Drop
Emergency Conditions
Vessels may drop anchor due to emergency
conditions such as fog, storm, or due to collisions or machinery failure. The
likelihood of anchoring due to adverse weather conditions is expected to be low
especially for the larger vessels who will determine whether dropping an anchor
is the safest option. Furthermore, knowledge of vessel position from onboard
navigation systems should prevent inadvertent dropping of an anchor onto a
pipeline delineated on the navigation chart.
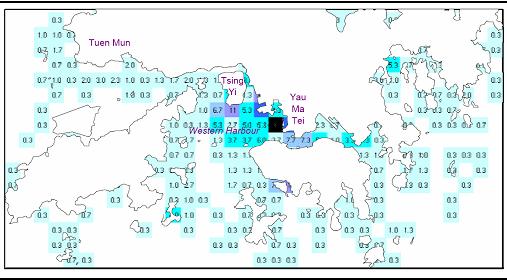
To
estimate the frequency of emergency anchoring, data from the Marine Department
of Hong Kong [6] is used. The distribution of incidents of all types (Figure 5.1) shows that most incidents are
concentrated in the harbour regions near Yau Ma Tei, Tsing Yi and Tuen Mun. The region near the
proposed pipeline indicates low incident rates for much of the pipeline but
slightly higher values near Urmston Road. This is due to the higher traffic
density in this area. An average value of 0.3 for the period from 2001 to 2003
clearly refers to a single incident that occurred during this 3-year period.
The size of each cell in Figure 5.1
is one arc-minute of latitude and longitude, or approximately 1.86 x 1.73 = 3.2 km2. A
value of 0.3 refers then to an incident frequency rate of 0.09 /km2/year.
For comparison, the total number of incidents from 1990-2004 in the 1830 km2
area of Hong Kong waters was 5161 [17]. This gives an average of 0.19 /km2/year.
So, the incident rate along much of the proposed pipeline route is lower than
average, while the fairway of Urmston Road is a little higher than average.
Based on the above discussion, an incident
rate of 0.1 /km2/year is assumed for most of the pipeline and 0.3
/km2/year is assumed for Urmston Road. Although few incidents are
shown for the Adamasta Channel, the higher traffic
volume here is assumed to give a higher incident rate and so
0.3 /km2/year is assumed for this region also.
Figure 5.1 Average
Annual Incident Distribution (2001-2003)
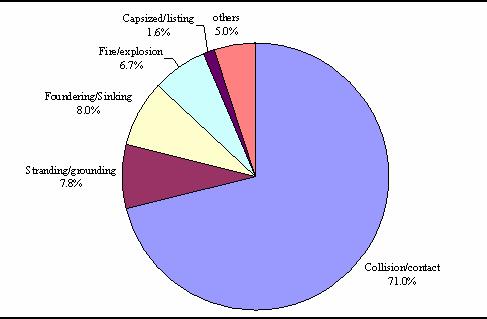
The distribution by types of incidents (Figure 5.2) shows that most incidents
are collisions or contact. Not all incidents will result in an anchor drop. Most
collisions, for example, are not serious. It is assumed therefore that only 10%
of incidents will result in an emergency anchor drop.
Figure 5.2 Distribution
of Incident Types (1990-2004)
Once the anchor is dropped, it may fall
directly on the pipeline causing damage. A greater concern is the possibility
of an anchor being dragged across the seabed and into the pipeline. In an
emergency situation such as mechanical failure, it is possible that the vessel
is still moving when the anchor is deployed. Since anchors can be dragged
significant distances, the resulting pipeline contact frequencies tend to be
higher compared to a simple anchor drop. In most instances, however, the ship
master’s first action will be to reduce speed to near stationary and then drop
anchor if necessary. For the purpose of this analysis, it was assumed that 90%
of ships drop anchor at near rest (1 knot), while the other 10% drop anchor at
4 knots due to mechanical failure and the uncontrolled advance of the vessel.
The efficiency of an anchor is defined
according to its holding capacity:
Holding
capacity = anchor weight ´ efficiency
The efficiencies for different classes of
anchor [20] are given in Table 5.4.
It is believed that types E and F are common on large commercial vessels.
Table 5.4 Anchor Efficiency
|
Class |
Efficiency |
|
A |
33-55 |
|
B C D E F G |
17-25 14-26 8-15 8-11 4-6 <6 |
This definition can be used to calculate the
drag distance. The work done in dragging an anchor through some distance must
be equal to the change in kinetic energy in bringing the ship to rest.
Anchors are designed to penetrate into the
seabed for maximum holding capacity. As an anchor is dragged across the seabed,
it will begin to penetrate into the mud; the softer the soil, the greater the
penetration. Maximum holding capacity is only reached once the maximum
penetration depth has been reached i.e. the efficiency is a function of
penetration depth. As a conservative approach, the lowest efficiency anchor,
type E, is assumed for the calculations. The efficiency is halved again to
allow for the varying restraining force with depth. The efficiency is therefore
assumed to be 2. Table 5.5 gives some
drag distances resulting from these calculations.
It can be seen that most vessels will drag
an anchor for less than about 20m. Ocean-going vessels can drag an anchor over
significantly greater distances due to the larger mass and hence kinetic energy
of the ship. This class of ship is subdivided into different sizes to reflect
the distribution of ships expected along the proposed pipeline route (see Table 3.8). A 150,000 tonne ship is the
largest of ships visiting Hong Kong and this provides the upper limit to the
drag distance of about 170m.
Table 5.5 Drag Distances
|
Class |
Size Range (dwt) |
Displacement (tonnes) |
|
Anchor |
Drag Distance (m) |
|
Fishing
vessel Rivertrade
coastal vessels Ocean-going
vessels Fast
Launches Fast
ferries Other |
1,500
– 25,000 25,000
– 75,000 75,000
– 100,000 |
400 1,500 1,500
– 35,000 35,000
– 110,000 110,000
– 150,000 150 150 200 |
(60%) (35%) (5%) |
1 2 2
– 5 5
- 12 12
- 15 0.1 0.5 0.2 |
7 13 13
– 118 118
– 154 154
– 168 25 5 17 |
The frequency of anchor drag impact can
then be calculated as:
Impact
freq =
incident
freq (/year/km2) ´ probability
of anchor drop ´ drag
distance/1000 (1)
where the drag distance is in meters. This
gives the impact frequency per km of pipeline per year. If an impact occurs,
the damage may not be severe enough to cause containment failure. Based on
PARLOC 2001, approximately 22% of anchor /impact incidents result in
containment failure when considering all pipe diameters. Larger pipes, however,
fail three times less often. This suggests that 7% of incidents would result in
a loss of containment.
This approach was applied to each section
of the pipeline and to each class of vessel. The marine traffic incident rate
was assumed to apply equally to all classes of vessel.
The hydrographic
survey [8] identifies seabed conditions as very soft clay for most of the
route. Under these conditions, significant anchor penetration can occur [20].
For example, a 15 tonne anchor can penetrate to 17m, and a 2 tonne anchor can
penetrate to 9m. These data apply to high efficiency anchors and less
penetration is to be expected for the commonly used types E and F, but
nevertheless, it is likely that a wide range of anchors sizes will be able to
achieve 3m penetration during emergency anchoring scenarios and hence may
interact with the proposed pipeline.
MARAD
Study
An alternative to using the incident
frequency from Figure 5.1 is to use
data from the MARAD study [19] which reported that the frequency of collisions
in Hong Kong waters of ocean-going vessels as 56 per million vessel-km. Since
only 71% of incidents are collisions, this value of 56 per million vessel-km
was scaled upwards to estimate the number of incidents of all types. 90% of
these incidents resulted in only minor damage and so again it is assumed that
only 10% will result in an emergency anchor drop. The approach is then similar
to that described above for anchor dragging.
Routine Anchoring
Estimating anchor drop frequencies from
marine vessel incidents fails to take into account routine anchoring. Routine
anchoring is not expected in the busy fairways but may take place at other
positions along the pipeline route. The EGS seabed survey [8] indicates the presence
of trawling marks from fishing activities and also anchor marks. This data was
used also to estimate anchoring frequencies.
It was assumed that anchor marks persist
for 2 years and so the frequency of anchoring damage for each km of pipeline was
estimated as:
Routine
anchoring damage freq =
number
of anchor marks / 2 x (anchor width
x 0.64 + 0.762)/500m survey width / length of pipeline section. (2)
Anchor dimensions were estimated from the Vyrhof anchor manual [20] for each class of ship. The
factor of 0.64 arises because the anchor may fall at some random angle relative
to the pipeline so the width of the anchor is effectively smaller by a factor
equal to the mean of cosine of the angle = 0.64. It was assumed that the
frequency of anchoring will decrease by 90% once the pipeline is installed and
marked on navigation charts. Also, it was assumed that only 7% of impacts would
result in loss of containment as before.
The results from this analysis are
compared in Figure 5.3. Also shown
are the loss of containment frequencies obtained from PARLOC 2001 for the
platform safety zone and mid-line. These are assumed to be representative of
areas of high and low marine activity respectively. It can be seen that there
is some spread in the predictions. The platform safety zone and mid-line
frequencies differ by almost two orders of magnitude but effectively bound most
of the other predictions.
Figure 5.3 Anchor Damage
Frequency Based on Marine Incidents
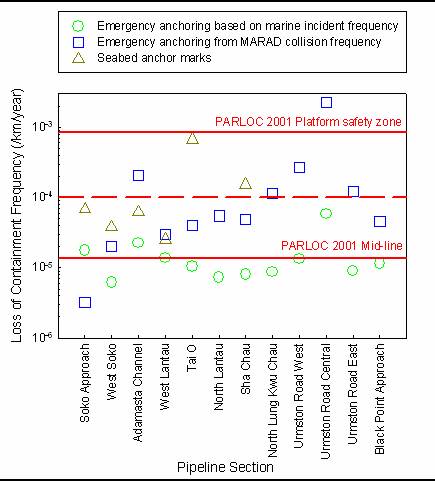
Predictions based on the MARAD collision
rate are regarded as being a little high because they are simply proportional
to vessel-km (and hence the traffic density) and do not take into account local
conditions along the route. The marine activity in Urmston Road for example is
about 19 times higher than Sha Chau,
but according to Figure 5.1, the
marine vessel incident rate is only about three times higher. On the other
hand, calculations based on emergency incidents are likely low because they
neglect indiscriminate anchoring or anchoring due to mistaken location.
The anchor marks on the seabed are the
least reliable indicator of anchoring activity due to the low number of marks,
the difficulty in distinguishing anchor marks from numerous trawling scars and the
uncertainty over how long the marks will persist in the soft seabed.
Nevertheless, anchor marks on the seabed do show two areas of high activity:
Tai O and Sha Chau. The Y3
anchorage area near Tai O accounts for one of these high activity areas. The second
occurs near Sha Chau. This
is most likely activity from smaller vessels since the water is shallow in this
region.
The calculations are broadly consistent
with failure frequencies from PARLOC 2001. The frequency obtained from PARLOC
2001 for the mid-line is appropriate for regions of low marine vessel volume
and low anchoring activity. The platform safety zone frequency is regarded as a
more appropriate choice for the failure frequency in locations of high marine
traffic or near anchorage areas. Some sections have intermediate levels of
marine activity and so a frequency of 10-4 per km-year is adopted
for these sections.
Based on the above considerations, the
failure frequencies due to anchor impact used in this study are as summarized
in Table 5.6. South Soko Approach and West Soko show
some anchor marks but these are few in number and are from the anchoring of
small vessels in the shallow water. The marine vessel activity is low n the
area so these sections were assigned a low anchor damage frequency. The Adamasta Channel is borderline between a medium and high
failure frequency and Figure 5.1
suggests that the marine incident rate is actually low in this region, perhaps
because of the traffic separation scheme. However, as a conservative measure, a
high frequency is assigned to this section. Tai O has a fairly low volume of
traffic but its position next to the Y3 anchorage and the numerous anchor marks
observed on the seabed warranted a high anchor damage frequency assigned to
this section.
Table 5.6 Anchor Damage
Frequencies used in this Study
|
Pipeline section |
Frequency (/km/year) |
Comment |
|
South Soko Approach West Soko Adamasta
Channel West Lantau Tai O North Lantau Sha
Chau North
Lung Kwu Chau Urmston
Road West Urmston
Road Central Urmston Road
East Black
Point Approach |
1.37 x 10⁻⁵ 1.37 x 10⁻⁵ 8.6 x 10⁻⁴ 1 x 10⁻⁴ 8.6 x 10⁻⁴ 1 x 10⁻⁴ 1 x 10⁻⁴ 1 x 10⁻⁴ 8.6 x 10⁻⁴ 8.6 x 10⁻⁴ 1 x 10⁻⁴ 1 x 10⁻⁴ |
Low
marine traffic Low
marine traffic High
marine traffic Medium
marine traffic Next to
anchorage Medium
marine traffic Medium
marine traffic + some anchoring Medium
marine traffic High
marine traffic High
marine traffic Medium
marine traffic Medium
marine traffic |
5.4
Pipeline
Protection Factors
Many pipelines are trenched to protect them
from trawling damage. In the pipeline database in PARLOC 2001, 57% by length of
all lines have some degree of protection, either trenching (lowering) or burial
(covering) over part or all of their length. Considering large and small
diameter lines, the proportion of lines with some degree of protection are 59%
by length for lines <16" diameter and 68% for larger diameter lines. It
is, however, concluded in the PARLOC report that there have been insufficient
incidents to determine a clear relationship between failure rate and the degree
of protection.
The loss of containment frequencies given
in Table 5.6 assume minimal
protection since they are based on the PARLOC data. The proposed CAPCO pipeline
has rock armour protection specified for its whole length. To allow for this,
protection factors were applied. Based on the classes of marine vessel found
along the proposed route (Table 3.2),
most classes of ship have anchors below 2 tonnes in weight. Only ocean-going
vessels have anchors up to 15 tonnes. The rock armour protection along the
route is designed to protect against either 2 tonne anchors (trench type 1 and
2A/B) or 20 tonne anchors (trench type 3A/B). Rock armour protection factors
were therefore applied based on whether a ship’s anchor is smaller than or
larger than 2 tonnes.
Trench types 1 and 2A/B (designed to
protect against 2 tonne anchors) were assumed to provide 99%protection for
anchors smaller than 2 tonnes. This trench type should also offer some
protection against larger anchors. For ocean-going vessels, 60% of them have
anchors below about 5 tonnes (Table 3.8)
and so trench type 1 should offer reasonable protection against these vessels.
50% protection was assumed for ocean-going vessels.
Trench type 3A/B (deigned to protect
against 20 tonne anchors) was assumed to provide 99% protection for anchors
greater than 2 tonnes, and 99.9% protection for anchors below 2 tonnes.
5.5
Summary of
Failure Frequencies for CAPCO Pipeline
Based on the above discussions, the
failure frequencies used in this study are as summarized in Table 5.7.
Table 5.7 Summary of Failure
Frequencies used in this Study
|
Pipeline section |
Trench type |
Corrosion /defects (/km/year) |
Anchor/Impact |
Others /km/year |
Total /km/year |
||
|
Frequency (/km/year) |
Protection factor (%) |
||||||
|
anchor<2 |
Anchor>2 |
||||||
|
South Soko Approach West Soko Adamasta
Channel West Lantau Tai O North Lantau Sha
Chau North
Lung Kwu Chau Urmston
Road West Urmston
Road Central Urmston
Road East Black
Point Approach |
2A 1 3B/3A 3A 3B 1 1 1 3B/3A 3A/3B 1 2B |
1.18 x 10⁻⁶ 1.18 x 10⁻⁶ 1.18 x 10⁻⁶ 1.18 x 10⁻⁶ 1.18 x 10⁻⁶ 1.18 x 10⁻⁶ 1.18 x 10⁻⁶ 1.18 x 10⁻⁶ 1.18 x 10⁻⁶ 1.18 x 10⁻⁶ 1.18 x 10⁻⁶ 1.18 x 10⁻⁶ |
1.37 x 10⁻⁵ 1.37 x 10⁻⁵ 8.6 x 10⁻⁴ 1 x 10⁻⁴ 8.6 x 10⁻⁴ 1 x 10⁻⁴ 1 x 10⁻⁴ 1 x 10⁻⁴ 8.6 x 10⁻⁴ 8.6 x 10⁻⁴ 1 x 10⁻⁴ 1 x 10⁻⁴ |
99 99 99.9 99.9 99.9 99 99 99 99.9 99.9 99 99 |
50 50 99 99 99 50 50 50 99 99 50 50 |
1.34
x 10-6 1.34
x 10-6 1.34
x 10-6 1.34
x 10-6 1.34
x 10-6 1.34
x 10-6 1.34
x 10-6 1.34
x 10-6 1.34
x 10-6 1.34
x 10-6 1.34
x 10-6 1.34
x 10-6 |
2.66
x 10-6 2.66
x 10-6 3.49
x 10-6 2.70
x 10-6 3.82
x 10-6 3.52
x 10-6 3.52
x 10-6 3.52
x 10-6 3.93
x 10-6 4.58
x 10-6 3.52
x 10-6 3.52
x 10-6 |
The outcome of a hazard can be predicted
using event tree analysis to investigate the way initiating events could
develop. This stage of the analysis involves development of the release cases
into discrete hazardous outcomes. The
following factors are considered:
·
Failure
cause;
·
Hole
size;
·
Vessel
position and type; and
·
Ignition
probability.
The probabilities used in the event trees
are discussed below.
5.6.1
Failure Cause
Failures due to corrosion and other events
are considered separately from failures caused by anchor impact. This is
because the hole size distribution is different in both cases, as described
below. Also, in the event of failure due to anchor impact, the probability of
vessel presence is assumed to be higher, as discussed later.
5.6.2
Hole Size Distribution
The data on hole size distribution in
PARLOC 2001 is summarised in Table 5.8.
Table 5.8 Hole
Size Distribution from PARLOC 2001
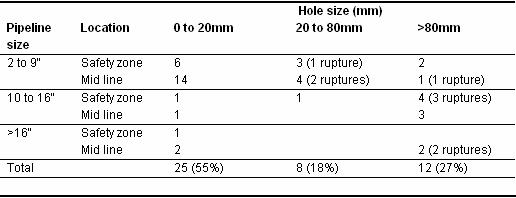
This data on hole
size distribution is clearly limited, particularly for large diameter
pipelines. One approach is to compare this distribution with that for onshore
pipelines, which include a much larger database of operating data and failure
data. For example, the US Gas database [16] is based on 5 million pipeline
km-years of operating data as compared to 300,000 km-years in the PARLOC study.
An analysis of hole size distribution for
onshore pipelines as given in the US Gas database [16] and European Gas
Pipelines database [21] provides a hole size distribution as given in Table 5.9.
Table 5.9 Hole
Size Distribution Adopted for Corrosion and Other Failures
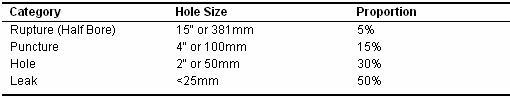
The above distribution is largely similar
to the distribution derived in the PARLOC report [7]. The only difference is
the consideration of a small percentage of ruptures. It is a matter of debate
whether ruptures could indeed occur although ruptures extending over several
metres are reported in the various failure databases.
In this study, it is proposed that the
hole size distribution given in Table 5.9
be adopted for failures caused by corrosion and other failures (including
material/weld defect). In the case of failures caused by anchor damage, the
hole sizes are expected to be larger. The distribution given in Table 5.10 is adopted.
Table 5.10 Hole
Size Distribution for Anchor Impact
|
Category |
Hole Size |
Proportion |
|
Rupture (Full Bore) |
Full bore |
10% |
|
Major |
15" or 381mm (half bore) |
20% |
|
Minor |
4" or 100mm |
70% |
5.6.3
Vessel Position
In the case of failures due to
corrosion/other events, the probability of a vessel being affected by the leak
is calculated based on the traffic volume and the size of the flammable cloud.
Dispersion modelling using PHAST [22] is used to obtain the size of the
flammable cloud for each hole size scenario and four weather scenarios covering
atmospheric stability classes B, D and F. Once the cloud size is known, the prob
ability that a passing marine vessel will travel
through this area within a given time can be calculated. A time period of 30
minutes is used since it is assumed that if a leak occurs, warnings will be
issued to all shipping within 30 minutes. Further details on the dispersion
modelling are given in Section 6.
In the case of failures due to anchor
impact, the following two scenarios are considered:
·
“Vessels
in vicinity” - the vessel that caused damage to the pipeline (due to anchoring)
is still in the vicinity of the incident zone. The probability of this is
assumed to be 0.3; and
·
“Passing
vessels” - ships approach or pass the scene of the incident following a
failure. In this case, the probability of a vessel passing through the plume is
calculated using the same method as for a corrosion failure; i.e. based on
cloud size and traffic volume.
Event trees showing these scenarios are given
in Figures 5.4 and 5.5. If a vessel passes through the flammable gas cloud, a
distinction is further made between vessels passing directly over the release
area and vessels passing through other parts of the cloud. This is discussed
further in the following section.
It is assumed that at most, only one
vessel will be affected by a pipeline failure. Once the flammable plume is
ignited, the resulting fire will be visible and other ships will naturally
avoid the area. Given the likely size of plume and separation of shipping, the
likelihood that two ships will be affected is deemed negligible. As an example,
the highest density of marine vessels occurs along
Figure 5.4 Event
Tree for External Damage from Anchors
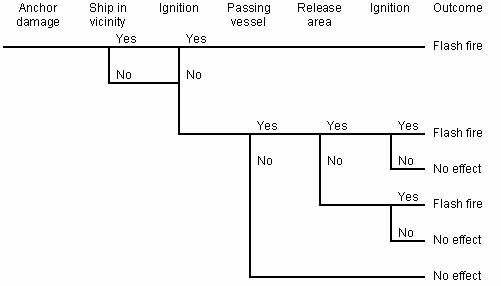
Figure 5.5 Event
Tree for Spontaneous Failures
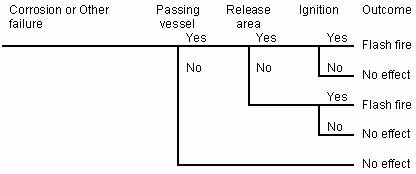
5.6.4
Vessel Type
The
categorisation of vessel types follows those identified from the radar tracks (Table 3.2), namely:
·
Fishing
vessels and small crafts;
·
Rivertrade coastal vessels;
·
Ocean-going
vessels;
·
Fast
Launches;
·
Fast
ferries;
·
‘Others’
(assumed to be small vessels)
The
relative proportion of the different vessel types will vary along the pipeline
route, as indicated in Table 3.4.
5.6.5
Ignition Probability
Ignition
of the release is expected only from passing ships or ships in the vicinity.
Ignition probabilities derived for offshore pipeline releases in the vicinity
of an offshore platform is given in Table
5.11 [23]. Similar values are adopted in this study, as given in Table 5.12.
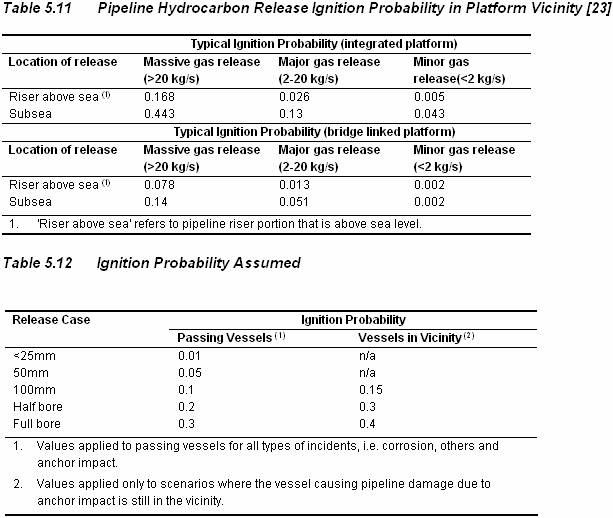
In
the event of loss of containment, the gas will bubble to the surface of the sea
and then disperse. If it comes in contact with an ignition source, most likely
from a passing marine vessel, it could lead to a flash fire which will
propagate through the cloud to the point of release and result in a gas fire
above the water surface.
If
a marine vessel passes into a plume of gas and ignites it, then there is the
possibility of fatalities on that ship due to the flash fire. If a vessel
passes through the ‘release area’ of the release, the vessel will likely be
affected also by the ensuing fire and the consequences will be more severe. If
the release gets ignited, it is presumed that no further ships will be involved
because the fire will be visible and other ships will naturally avoid the area.
In other words, it is assumed that at most, only one ship will be affected.
Further
details are described in the following paragraphs.
The
release rate is estimated based on standard equations for discharge through an
orifice. The empirical correlation developed by Bell and modified by Wilson
[24] is adopted. A maximum operating pressure of 101barg is assumed.
The
results are presented in Figure 6.1.
For holes with equivalent diameter smaller than about 100mm, the discharge rate
diminishes rather slowly because of the large inventory in the pipeline (about
1,200 tonnes). For half and full bore failures, the discharge rate diminishes
more quickly over a period of about 30-60 minutes.
Figure 6.1 Variation
of Release Rate with Time
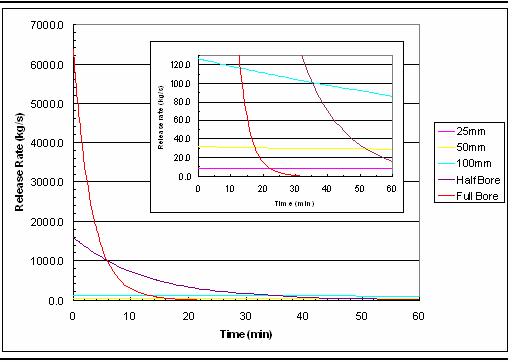
6.3
Dispersion
Modelling
In the event of a release from the subsea pipeline, the gas jet is expected to lose momentum
and bubble to the surface. The simplest form of modelling applied to subsea releases is to assume that the dispersing bubble
plume (driven by gas buoyancy) can be represented by a cone of fixed angle (Figure 6.2) [24]. The typical cone angle
is between 10 to 12°. However, Billeter
and Fannelop [24] suggested that the 'release area'
(where bubbles break through the surface) is about twice the diameter of the
bubble plume. Hence, an angle of 23° was recommended and is used in this
study.
Based on the EGS Survey [8], the water
depth is between 5-8m for much of the proposed pipeline route, increasing to
20m in Urmston Road and 25m in the Adamasta Channel.
The shallowest water occurs on the South Soko
approach and is about 1.6m deep. For this range of water depths, the cone model
predicts the ‘release area’ to be in the range of 0.6 to 10m diameter.
Figure 6.2 Simple
Cone Model for Subsea Dispersion
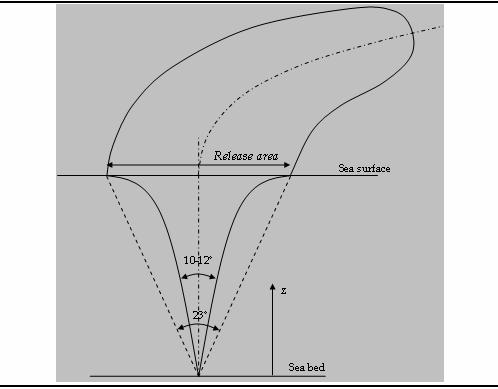
6.4
Dispersion above Sea Level
The gas will begin to disperse into the atmosphere
upon reaching the sea surface. The distance to which the flammable envelope of
gas extends will depend on ambient conditions such as wind speed and
atmospheric stability as well as source conditions. The extent of the flammable
region is taken as the distance to 0.85 LFL (Lower Flammable Limit).
Conditions at the source such as momentum
and buoyancy are important. At lower depths and high release rates, the gas
will have a large momentum at the sea surface resulting in a plume extending
rapidly upwards into the atmosphere. For smaller releases, the gas will lose
all momentum by the time it reaches the sea surface resulting in a plume of
greater horizontal extent. Dimensional analysis using the Froude number [24]
suggests that momentum and buoyancy are both important over most release
scenarios considered in the current study. Only full bore ruptures in shallow
water result in a momentum dominated jet release.
The above sea dispersion was modelled
using PHAST [22]. Based on the above discussion, to achieve realistic
simulations it is important to give due consideration to the momentum and
buoyancy of the source. The gas was assumed to gain heat from the sea water,
during transport and following a release. The gas was therefore assumed to be
released at 20°C and 101barg. Being lighter than air, natural gas
lifts away from the sea surface under all atmospheric conditions.
The cone model is believed to be a
reasonable approach for estimating the ‘release area’ for small to moderate
releases. The worst scenario is deep water, which produces a large ‘release
area’ and hence low efflux momentum for a given mass release rate. The deepest
water case of 25m was therefore chosen for analysis. A low momentum gives a
lower plume rise and hence a larger hazardous area near the sea surface. The
cone model, however, has not been validated for massive releases such as would
occur in a half bore or full bore rupture. To err on the cautious side, a
larger ‘release area’ was assumed for massive releases. The diameter of the
release area was increased by 50% for half bore rupture and by 100% for full
bore rupture scenarios. This lowers the source momentum and gives conservative
results.
PHAST was used to model the plume
dispersion as an area source on the surface of the ocean. The mass release
rate, the release velocity and temperature were specified and the release was
assumed to be vertical. The surface roughness parameter was assumed to be
0.043, a value appropriate for dispersion over water. Even though the release is
a transient, particularly for the large release scenarios, the time constant
for the release is still longer than the dispersion time scale. The modelling
therefore assumed a steady release of gas at the maximum release rate. Again,
this is conservative. Simulations were performed for atmospheric stability
classes of B, D and F to cover the range of meteorological conditions expected.
Given that the plume in all cases lifted away from the surface due to buoyancy,
the length of the plume was taken to be the maximum extent of the plume in the
windward direction up to the ship height which is assumed to be a maximum of
50m.
The relative occurrence of weather
conditions 2F, 3D, 7D and 2.5B were taken to be 0.1654, 0.1023, 0.6333 and
0.099 respectively to match conditions measured at the Sha
Chau meteorology station.
6.5.1
Impact on Population on Marine Vessels
The hazardous distance was taken to be the
distance to 0.85 LFL as discussed above. It was assumed that ships would be at risk
for 30 minutes before warnings could be issued to advice vessels to avoid the
area. Knowing the marine vessel traffic (in ships per day per km of pipeline),
the probability that a passing ship will cross through the flammable plume
during this 30 minutes is calculated as:
Prob. = traffic
(/km/day) x length of plume (km) x
0.5 (hour) / 24 (hour/day) (3)
If a marine vessel comes in contact with
the flammable plume and causes ignition, the resulting flash fire may lead to
fatalities depending on the type of ship. Small open vessels such as fishing
boats are expected to provide less protection to its occupants. Large
ocean-going vessels will provide better protection. Fatality factors are
therefore applied to each class of vessel to take into account the protection
offered by the vessel. These take into consideration:
·
The
proportion of the passengers likely to be on deck or in interior compartments.
·
The
materials of construction of the vessel and the likelihood of secondary fires.
·
The
size of the vessel and hence the likelihood that it can be completely engulfed
in a flammable gas cloud.
·
The
speed of the vessel and hence its exposure time to the gas cloud.
·
The
ability of gas to penetrate into the vessel and achieve a flammable mixture.
Considering fast ferries; they are air
conditioned and travel at high speeds in excess of 30 knots (15m/s). If the
occupants are to be affected by a flash fire, gas must penetrate into the
interior of the vessel, achieve a flammable mixture and ignite. The time to
transit the largest gas cloud of 130m is of the order of 10 seconds. Assuming
typical air ventilation rates of 6 to 10 volume changes per hour, a time
constant for changes in gas concentration within a ferry can be derived as 6 to
10 minutes. This implies that it would take several minutes for the gas
concentration within a ferry to respond to changes in concentration in the
ambient air. Given that the exposure time is mere seconds, it becomes apparent
that it is very difficult to achieve a flammable mixture of gas within a ferry.
Based on these considerations, the fatalities assumed in the current study for
fast ferries and other vessels are as given in Table 6.1.
If a ship enters the ‘release area’ and
ignites the gas cloud, the vessel is more likely to be caught in the ensuing
fire. This is assumed to result in more severe consequences with potential for
100% fatality of occupants. The probability of this is calculated using a
similar equation as above (Equation 3)
but replacing the cloud size with the release area diameter.
Table 6.1 Fatality
Probabilities
|
Class |
|
Fatality |
|
|
|
|
‘Release area’ |
‘Cloud area’ |
|
Fishing
vessels Rivertrade
coastal vessels Ocean-going
vessels Fast
launches Fast
ferries Others |
1 1 1 1 1 1 |
0.9 0.3 0.1 0.9 0.3 0.9 |
|
If the failure is caused by corrosion, a
passing ship may pass through the flammable plume or release area with a
probability given by Equation 3. If
the failure is caused by third party damage, then two scenarios are considered
as mentioned in Section 5. The vessel
that caused the incident may still be in the area and may ignite the plume, or
if this vessel is no longer present, a passing ship may pass through the plume.
The probability that the vessel causing the incident is still present is
assumed to be 0.3 and this is assumed to result in 100% fatality.
The analysis limits the number of ships
involved to one. It is assumed that once the plume is ignited, other ships will
avoid the area.
6.5.2
Impact on Population on Hong Kong Zhuhai Macau Bridge
The proposed Hong Kong to Zhuhai Macau (HKZM) bridge will straddle the CAPCO pipeline
within the Tai O section (Figure 3.1),
although the precise alignment and construction schedule of the bridge has yet
to be finalised. It is assumed that the pipeline can be laid between bridge
support columns or that bridge construction procedures will take the necessary
precautions to avoid damage to the pipeline. It is noted also that the Tai O
section of the pipeline will be provided with 3m of rock armour protection. The
bridge, therefore, is not expected to have any effect on pipeline failure
frequencies during construction or operation.
If a pipeline failure does occur for other
reasons, such as external corrosion or anchor impact, the transient road
traffic population on the bridge may be affected. This scenario was considered
in the consequence analysis for the Tai O section of the pipeline.
There are no official estimates available
for the vehicle traffic expected on the bridge; it was therefore assumed that
20,000 vehicles per day will traverse the bridge. This is equivalent to 50% of
the vehicles crossing all land borders currently [25]. The same vehicle mix was
assumed as currently crossing the land borders, namely: 24% cars, 9%
coaches/shuttle buses and 67% goods/container vehicles. It was further assumed
that cars and goods vehicles have a population of 2, while buses have a
population of 50.
Considering the vehicle traffic volume,
the size of gas clouds expected from various release scenarios as predicted by PHAST,
and assuming an average vehicle speed of 80 km/h, it was calculated that
between 1 to 2 vehicles may be affected by the flash fire following ignition of
the gas cloud. The ignition probability is assumed to be one due to the high
traffic on the bridge. The possibility of both vehicles being buses was also
considered, with an associated probability of 0.0081. 50% fatality was assumed
for the vehicle occupants.
6.5.3
Impact on Aircraft Approaching Chep Lap Kok
The North Lantau
section of the pipeline passes within about 3.7km of the threshold for runways
07L and 4.5km from runway 07R at Chep Lap Kok International Airport. Commercial aircraft have an
approach angle of about 3° which puts their altitude above the
pipeline at about 200m. Large gas releases from the pipeline, such as those
that occur from a full bore or half bore rupture, have the potential to produce
a gas cloud that extends higher than 200m. It is therefore possible that
aircraft on the approach to landing may pass through a gas cloud within the
flammability limits. This scenario was considered in the analysis. Aircraft
taking off from runways 25L and 25R are not a concern because modern commercial
jets gain altitude very quickly.
If a commercial airliner does pass through
a flammable gas cloud, it could be impacted in several ways. The jet engines
would very likely ignite the cloud but since the flame speed in natural gas is
about 10 m/s and the aircraft speed on approach is typically 160 knots (80
m/s), the plane is unlikely to be caught in the flash fire. The difference in
density of natural gas compared to air would impact the aircraft in a manner
similar to turbulence. The flow of natural gas through the engines may also
upset the combustion process although the concentration of natural gas at
aircraft altitudes will be low. There is uncertainty in these issues so for the
purpose of analysis, a conservative approach is adopted and the gas cloud is
assumed to cause sufficient upset to result in an aircraft crash with 100%
fatality.
The hazardous distance is taken as the
maximum size of the gas cloud above 200m from the sea surface. The probability
that the gas cloud will cross the approach flight path is calculated from this
hazard distance. If a gas cloud is present on the approach path, the probability
that an aircraft will fly through the cloud is taken to be 1, since aircraft
are landing every few minutes at Chep Lap Kok. In a similar manner as before, it is assumed that at
most one aircraft will be affected.
A distribution of population is assumed in
the analysis to take into account the varying size of aircraft using the
airport. According to the Civil Aviation Department Annual Report [26], there
are 263,506 take-off and landings per year and 39,799,602 passengers. This
gives an average population of 151 passengers, plus crew, on each flight. It is
further stated that 16% of flights are cargo flights. The distribution assumed
is given in Table 6.2. This
distribution gives an average population per flight as 165 which is close to
the 151+crew published by the Civil Aviation Department.
Table 6.2 Aircraft
Population Distribution
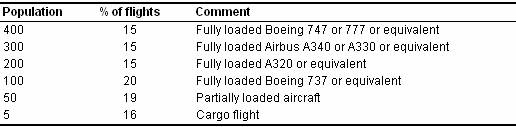
6.5.4
Impact on Macau Helicopters
Helicopters shuttling to and from Macau
pass over the Adamasta Channel section of the
pipeline at about 500 feet (150m) altitude. In the same way that accidental gas
releases may affect aircraft on the approach to the airport, a release from the
Adamasta Channel section may impact on helicopters.
The hazard distance is taken to be the maximum width of the gas cloud above 150m
altitude. Although there is only one flight every 30 minutes and the return
flights pass further south missing the pipeline route, it is again assumed that
one helicopter is certain to be affected if the gas cloud lies across the
flight path. The methodology is the same as that used for aircraft (Section 6.5.3). It is further assumed
that all helicopters are filled to capacity with 12 passengers and crew.
This is a conservative treatment for
helicopters but given that they are not expected to make a significant
contribution to the risk results, this simple approach is sufficient.
Hazard distances are determined from the
dispersion modelling for both marine vessels and aircraft (Figure 6.3). The hazard distance for marine vessels is defined as
the maximum width of the gas cloud below a height of 50m above sea level.
Similarly, the hazard distance for commercial airliners is defined above 200m
and helicopters above 150m from sea level since this is the expected altitude
of these aircraft. Based on this, the hazard distances obtained from dispersion
modelling are summarised in Table 6.3.
Figure 6.3 Hazard
Distance Definitions
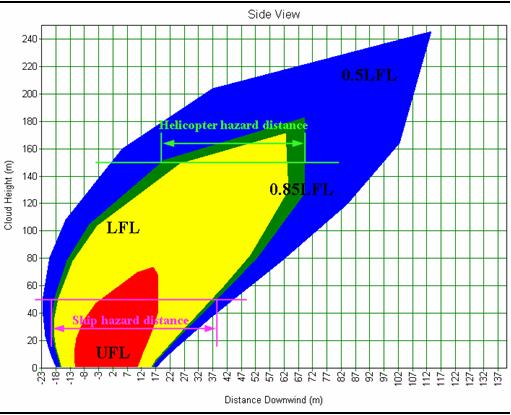
Table 6.1 Hazard
Distances for Gas Cloud Dispersion
|
Hole Size mm |
End Point Criteria |
Marine Vessel Hazard Distance (m) |
Helicopter Hazard Distance |
Airliner Hazard Distance |
Cloud Maximum Height |
||||||||||||
|
|
|
Weather
conditions |
Weather
conditions |
Weather
conditions |
Weather
conditions |
||||||||||||
|
|
|
2F |
3D |
7D |
2.5B |
2F |
3D |
7D |
2.5B |
2F |
3D |
7D |
2.5B |
2F |
3D |
7D |
2.5B |
|
Full bore |
LFL 0.85LFL |
61 65 |
62 68 |
108 115 |
69 75 |
216 261 |
154 187 |
158 194 |
125 140 |
180 220 |
138 173 |
0 84 |
113 130 |
260 290 |
350 380 |
185 210 |
360 390 |
|
Half bore |
LFL 0.85LFL |
54 60 |
55 62 |
121 131 |
54 60 |
0 67 |
45 72 |
0 0 |
38 51 |
0 0 |
0 0 |
0 0 |
0 0 |
147 155 |
165 185 |
95 102 |
170 185 |
|
100 |
LFL 0.85LFL |
54 60 |
51 59 |
74 84 |
41 47 |
0 0 |
0 0 |
0 0 |
0 0 |
0 0 |
0 0 |
0 0 |
0 0 |
52 55 |
42 48 |
24 27 |
43 47 |
|
50 |
LFL 0.85LFL |
35 38 |
36 40 |
48 55 |
32 34 |
0 0 |
0 0 |
0 0 |
0 0 |
0 0 |
0 0 |
0 0 |
0 0 |
29 31 |
20 24 |
12 13 |
20 22 |
|
25 |
LFL 0.85LFL |
21 25 |
24 29 |
33 36 |
24 26 |
0 0 |
0 0 |
0 0 |
0 0 |
0 0 |
0 0 |
0 0 |
0 0 |
16 18 |
11 11 |
5 6 |
10 11 |
* Values of zero for aircraft hazard distances mean
that the gas cloud does not reach sufficient height to affect aircraft
The frequencies and consequences of the
various outcomes of the numerous accident scenarios are integrated at this
stage, to give measures of the societal risk (FN curves and Potential Loss of
Life) and individual risk.
Risk results are compared with the criteria
for acceptability as laid down in the Hong Kong Planning Standards and
Guidelines, chapter 12 [27] and also in Annex 4 of the Technical Memorandum of
EIAO. However, these risk guidelines cannot be applied directly for transport
operations (such as pipeline transport). Since transport operations extend over
several kilometres and communities, they cannot be equated with risks from
fixed installations (such as an LPG plant, refinery or a petrochemical plant)
which have a defined impact zone. As a result, a pipeline of 1km length is
considered as equivalent to a fixed installation for the application of risk
criteria. This approach is adopted internationally [28] and was adopted by the
consultant in similar studies for onshore and offshore high pressure gas
pipelines. Based on this approach, the results are presented on a per-kilometre
basis for each section of the pipeline.
The individual risk (IR) criterion for a
potentially hazardous installation specifies that the risk of fatality to an
offshore individual should not exceed
1 x 10⁻⁵ per year. It is generally accepted that the same IR
criteria should also apply for transport operations.
Risk results are given in the main text of
this report (Part 2, section 13.11).
[1] Kvaerner Petrominco Sdn Bhd, LNG Receiving Terminal
Project Offshore Pipeline from South Soko Island to
BBPS, Basis of Design Report, 2005.
[2] Kvaerner Petrominco Sdn Bhd, Drawing 8028-PLD-008,
revision 3, 2006.
[3] Kvaerner Petrominco Sdn Bhd, LNG Receiving Terminal
Project Offshore Pipeline from South Soko island to
BPPS, Input to EIA Study, 17th Feb 2006.
[4] BMT Asia Pacific Ltd, Marine Impact Assessment for Black Point
& Sokos islands LNG Receiving Terminal &
Associated Facilities, Pipeline Issues, Working Paper #3, Issue 6, Sep 2006.
[5] http://www.info.gov.hk/mardep.index.htm
[6] Marine Department, Marine Traffic Risk Assessment for Hong Kong
Waters (MARA Study), March 2004.
[7] Health & Safety Executive, PARLOC 2001 The Update of Loss of
Containment Data for Offshore Pipelines, 5th Edition, 2003.
[8] EGS Earth Sciences & Surveying, Hydrographic
and geophysical Survey for Proposed LNG Terminal, Final Survey Report, 2005.
[9] DnV, Rules for Submarine Pipeline
Systems, 1981.
[10] Personal communication with BMT.
[11] Marine Department, Hong Kong Government, Passenger
Arrivals/Departures and Passenger Load Factors at Cross-Boundary Ferry
Terminals, January – December 2005. www.mardep.gov.hk
[12] UKAEA, Major Hazard Incident Database (MHIDAS) Silver Platter.
[13] Institution of Chemical Engineers UK, The Accident Database,
Version 2.01.
[14] National Transportation Safety Board, Natural gas Pipeline Rupture
and Fire During Dredging of Tiger Pass, Lousiana,
October 23, 1998.
[15] National Research Council, Improving Safety of Marine Pipelines,
1994.
[16] PRC International American Gas Association, Analysis of DOT
Reportable Incidents for Gas Transmission and Gathering Pipelines – January 1,
1985 Through December 31, 1994 Keifner &
Associate Inc., 1996.
[17] Marine Department, Hong Kong Government,
Statistics on Marine Accidents, 1990-2004, www.mardep.gov.hk.
[18] Health and Safety Executive UK, PARLOC 96: The Update of Loss of
Containment Data for Offshore Pipelines,
[19] Marine Department, The MARAD Strategy Report Comprehensive Study
on Marine Activities Associated Risk Assessment and Development of a Future
Strategy for the Optimum Usage of Hong Kong Waters, 1997.
[20] Vryhof, Vryhof
Anchor Manual, www.vryhof.com,
2005.
[21] European Gas Pipeline Incident Data Group 3rd
EGIG-Report 1970-1997.
[22] DnV Technica,
PHAST Release Notes, DnV Technica
Inc., Temecula, CA., 1993.
[23] Centre of Chemical Process Safety, Guidelines for Use of Vapour
Cloud Dispersion Models, 1996.
[24] P J Rew, P Gallagher, D M Deaves, Dispersion of Subsea Releases: Review of Prediction
Methodologies, Health and Safety Executive, 1995.
[25] Transport Department, Monthly Traffic and Transport Digest, March
2006, 2006.
[26] CAD Annual Report 2004/5, www.cad.gov.hk
[27] Planning Department, Hong Kong Planning Standards & Guidelines
Chapter 12, Hong Kong Risk Guidelines for Potential Hazardous Installation,
1992.
[28] M J Pikaar, M A Seaman, A Review of Risk
Control, Ministerie VROM (1995/27A), 1995.