This Method Statement presents
information on the approach for the water quality assessment and modelling
works for the study. The
methodology has been based on the following three focus areas, as follows:
·
Model
Selection;
·
Input
Data; and,
·
Scenarios.
1.1
Interpretation of
the Requirements: Key Issues and Constraints
The objectives of the modelling exercise
are to assess:
·
Effects
of construction, which comprises the study of the dispersion of sediments released
during construction, including the installation of a submarine pipeline, water
main and power cables;
·
Effects
of operation due to reclamations (affecting flows and potentially water quality
due to changing flows); discharges (potentially affecting temperatures and
water quality due to chlorine or other antifoulants);
and maintenance dredging (potentially increasing suspended solids in water
column);
·
Any
residual impacts, which include any change in hydrodynamic regime; and,
·
Any
cumulative impacts due to other projects or activities within the study area.
The construction and operational effects
have been studied by means of mathematical modelling using existing models that
have been set up by WL | Delft Hydraulics (Delft) on behalf of the
Environmental Protection Department (EPD) or approved by the EPD for use in
environmental assessments.
1.2
Model Selection
The existing Western Harbour Model of the Delft 3D water quality
(WAQ) and hydrodynamic suite of models have been used to simulate effects on
hydrodynamics and water quality.
These models have been calibrated as part of the Landfill Extension
Study.
The WAQ model has been used to simulate water quality
impacts during construction and operation of the facility. The existing Update model has the required
spatial extent. The existing grid
of the model in the vicinity of South Soko and Black
Point are shown in Figure A1.1 and
Figure A1.2.
Figure A1.1 Model
Grid of the Update Model in the Vicinity of
Soko
Islands

Figure A1.2 Model
Grid of the Update Model in the Vicinity of Black Point
As seen in Figures
A1.1 and A1.2, the grid size of the
existing model near the site is in the order of about 300 m. It was, therefore, considered
appropriate to carry out refinement of the water quality and hydrodynamic grids
to provide improved resolution (less than 75 m) in key areas of interest. The refinements of the model grid of the
Update Model in the vicinity of Soko Islands
and Black Point are shown in Figure A1.3
and Figure A1.4 respectively.
Figure A1.3 Refinement
of Model Grid of the Update Model in the Vicinity of
Soko
Islands
Figure A1.4 Refinement
of Model Grid of the Update Model in the Vicinity of Black Point
1.3
Coastline
& Bathymetry
Hydrodynamic data have been obtained using coastline
and bathymetry for a time horizon representative of the construction and
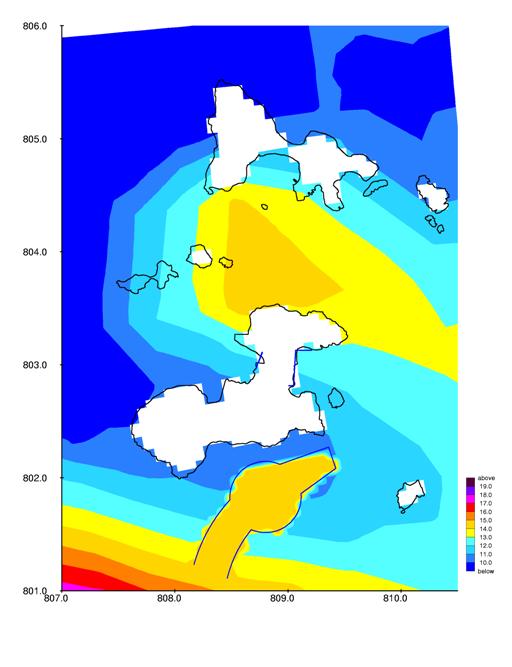
operation of the facility (i.e., 2007 onwards). Figures
A1.5a, A1.5b and A1.6 show the
bathymetry and coastline during construction phase, whereas Figure A1.7 during operational phase at
the LNG terminal at South Soko
Island.
Figure
A1.5a Bathymetry
and Coastline in the Vicinity of Black Point (2007 onwards)
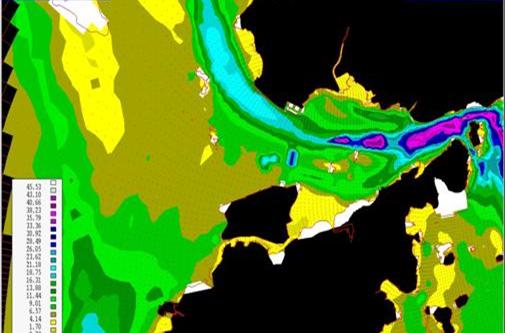
Figure A1.5b Coastline
Used in the Model for the Project Area (2007 onwards)

Figure A1.6 Bathymetry and
Coastline in the Vicinity of South Soko
Island (2007 onwards)
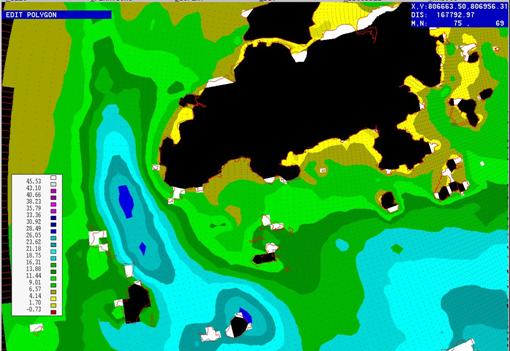
Figure A1.7 Operational
Bathymetry at South Soko
1.4
Vector
Information
The current patterns in the project area are
presented in Figures SK_B01-B08 (pre-project
situation) and Figures SK_F01-08 (post-project
situation).
Under pre-project situation, the plots indicate that,
in general, for the area in around the LNG terminal in South Soko Island current velocities rarely exceed 0.2 m s-1
in the dry season and 0.3 m s-1
in the wet season. Maximum current velocities appear to be
in the order of 0.6 m s-1 in the
dry season and 2 m s-1
in the wet season, in areas
predominantly offshore, or on the south western headland of South Soko Island.
Under post-project situation, the current velocities
are likely of similar magnitude at both seasons.
1.5
Information on
Model Inputs
Details on the model input parameters are presented
in Appendix A in this Annex.
1.6
Uncertainties in
Assessment Methodologies
Uncertainties in the assessment of the impacts from
suspended sediment plumes should be considered when drawing conclusions from
the assessment. In carrying out the
assessment, the worst case assumptions have been made in order to provide a
conservative assessment of environmental impacts. These assumptions are as follows:
·
The
assessment is based on the peak dredging and filling rates. In reality, these will only occur for
short period of time; and,
·
The
calculations of loss rates of sediment to suspension are based on conservative
estimates for the types of plant and methods of working.
The conservative assumptions presented above allow a prudent
approach to be applied to the water quality assessment.
The
following uncertainties have not been included in the modelling assessment.
·
Ad
hoc navigation of marine traffic;
·
Near shore scouring of bottom sediment; and
·
Access of marine barges back and forth the
site.
The water quality sensitive receivers (SRs) have been identified in the EIA (Part 2 - Section 6: Water Quality Assessment) in accordance
with Annex 14 of the Technical Memorandum on EIA Process (EIAO, Cap.499, S.16). These SRs are illustrated in Figure A2.1 and listed in Table A2.1. In addition to the SRs, there are other additional water modelling output
points at some representative locations are selected for further analysis
(thereinafter regarded as MPs) and they are shown in Table A2.2 and also presented in Figure A2.1. EPD routine water quality monitoring
stations are shown in Table A2.3 for
reference.
Table A2.1 Water
Quality Sensitive Receivers (SRs) around Proposed LNG
Terminal at South Soko and Black Point and the
Submarine Pipeline Section from South Soko to Black
Point
|
Sensitive
Receiver
|
Name
|
Water Quality
Modelling Output Location
|
Included
in the Model
|
|
Fisheries
Resources
|
|
|
|
|
Spawning/
Nursery Grounds
|
Fisheries
Spawning/
Nursery Grounds in South Lantau
|
SR16b,
SR24, SR27
|
Yes
|
|
Fisheries
Spawning Ground in North Lantau
|
SR8
|
Yes
|
|
Artificial
Reef Deployment Area
|
Sha Chau and Lung Kwu Chau
|
SR6e
|
Yes
|
|
Northeast Airport
|
SR7d
|
Yes
|
|
Fish Fry
Habitat
|
Pak Tso Wan
|
SR16b
|
Yes
|
|
Fish
Culture Zone
|
Cheung Sha Wan
|
SR38
|
No
|
|
|
Ma Wan
|
SR40a-b
|
No
|
|
Marine
Ecological Resources
|
|
|
|
Seagrass Beds
|
Pak Nai
|
SR2
|
Yes
|
|
Marine Park
|
Designated Sha Chau and Lung Kwu Chau
|
SR6a-d
|
Yes
|
|
Potential Marine
Park
|
South West Lantau
|
SR19a-c
|
Yes
|
|
Mangroves
|
Pak Nai
|
SR2
|
Yes
|
|
Intertidal
Mudflats
|
Pak Nai
|
SR1
|
Yes
|
|
Tai O
|
SR12
|
Yes
|
|
Yi O
|
SR14
|
Yes
|
|
Shui Hau Wan
|
SR33
|
Yes
|
|
Horseshoe
Crab Nursery Grounds
|
Pak Nai
|
SR1
|
Yes
|
|
Sham Wat Wan
|
SR10
|
Yes
|
|
Tai O
|
SR12
|
Yes
|
|
Yi O
|
SR14
|
Yes
|
|
Sha Lo Wan
|
SR18
|
Yes
|
|
Tong Fuk Miu Wan
|
SR33
|
|
|
Tung Chung
Bay
|
SR39
|
Yes
|
|
Protection
Zone
|
Chinese
White Dolphin Protection Zone in Mainland Waters
|
SR11,
SR11a-b
|
Yes
|
|
Water
Quality Sensitive Receivers
|
|
|
|
Gazetted
Beaches
|
Butterfly Beach
|
SR5c
|
Yes
|
|
Tuen Mun Beaches
|
SR5d
|
No
|
|
Tong Fuk
|
SR34
|
Yes
|
|
Upper Cheung
Sha
Beach
|
SR35
|
Yes
|
|
|
Lower Cheung
Sha
Beach
|
SR36
|
No
|
|
|
Pui O Wan
|
SR37
|
No
|
|
Non-gazetted
Beaches
|
Lung Kwu Sheung Tan
|
SR5a
|
Yes
|
|
|
Lung Kwu Tan
|
SR5b
|
Yes
|
|
|
Fan Lau Sai Wan
|
SR15a
|
Yes
|
|
|
Fan Lau Tung Wan
|
SR15b
|
Yes
|
|
|
Tsin Yue Wan
|
SR15c
|
Yes
|
|
Seawater
Intakes
|
Black Point
Power Station
|
SR4
|
Yes
|
|
Castle Peak Power Station
|
SR7a
|
Yes
|
|
Tuen Mun Area 38
|
SR7b
|
Yes
|
|
Airport
|
SR7c-f
|
Yes
|
|
|
Tuen Mun WSD
|
SR7h
|
No
|
Table A2.2 Water
Quality Modelling Output Points (MPs) around Proposed LNG Terminal at South Soko and Black Point and the Submarine Pipeline Section
from South Soko to Black Point
|
Sensitive Receiver
|
Name
|
Water Quality Modelling Output Points
|
Included
in the Model
|
|
Representative
Intertidal & Subtidal
Coastal Location
|
Kau Ling Chung
(Rocky)
|
MP23,
MP25-26, MP28-30
|
Yes
|
|
Tai Long
Wan (Sandy)
|
MP20-21
|
Yes
|
|
Kau Ling
Chung
|
MP23
|
Yes
|
|
Operational
Seawater Intake
|
South
Soko
Island
|
MP40
|
Yes
|
Table A2.3 EPD
Routine Water Quality Monitoring Stations in the Vicinity of the Project Area
|
EPD
Monitoring Stations
|
Respective
WCZ
|
Included in
the Model
|
|
DM4, DM5
|
Deep Bay WCZ
|
No
|
|
NM5, NM6, NM8
|
North Western WCZ
|
No
|
|
SM13,
SM17, SM20
|
Southern
WCZ
|
No
|
For the construction phase the WAQ model has been
used to directly simulate the
following parameters:
·
suspended
sediments; and
·
sediment
deposition.
It is assumed that the worst-case construction phase impacts
will be at the commencement of dredging, when there is no depression formed to
trap sediments disturbed during works.
Note that DO, TIN and NH3-N are calculated
using the modelled maximum SS concentrations as shown in Section 6: Water Quality Impact Assessment.
3.1
Working
Time
South Soko
Island is relatively remote in nature and for water
quality modelling a 24 working hours per day and 7 working days per week is
assumed. Exception is given to
submarine water mains construction and cable circuit installation. The former assumed 16 working hours per
day at all locations except at the land and launching point where 24 working
hours per day were assumed, and 7 working days per week while the latter
assumed 12 working hours per day and 6 working days per week. These time differences relate to typical
practices by contractors in Hong Kong that
would be involved in these works.
Working hours for gas receiving station at Black Point are assumed to be
16 per day and 7 working days per week.
The assumption of working time in the model is
summaries in Table A3.1.
Table A3.1 A
Summary of Working Time Assumed in the Model for Various Construction
Activities
|
Construction
Activities
|
Locations
|
Assumption
of Working Time
|
|
Seawall Construction
|
Eastern berth at South Soko Island
|
24 hours per day and 7 days per week
|
|
|
Western berth at South Soko Island
|
24 hours per day and 7 days per week
|
|
Approach
Channel and Turning
Basin
|
South
of South Soko Island
|
24 hours per day and 7 days per week
|
|
Submarine
Water Main
|
Landing point (using the common shore
approach with cable)
|
24 hours per day and 7 days per week
|
|
|
Other
section in the open waters
|
16
hours per day and 7 days per week
|
|
Submarine
Cable Circuit
|
Landing point (using the common shore
approach with cable)
|
24
hours per day and 7 days per week
|
|
|
Other section in the open waters
|
12
hours per day and 6 days per week
|
|
Submarine
Gas Pipeline
|
From South Soko
Island to Black Point
|
For grab dredging, 12 hours per day
(daytime) and 7 days per week
For
THSD dredging, 24 hours per day and 7 days per week
|
|
Submarine
Gas Pipeline (Gas Receiving Station)
|
Black
Point
|
16
hours per day and 7 days per week
|
3.2
Overview
of Dredging Plants
3.2.1
Grab Dredgers
Grab dredgers will be utilised in the dredging works
for the reclamation works at the terminal as well as the navigation channel,
turning circle and berthing box. Also
the submarine water mains, some sections of the submarine pipeline and the gas receiving
station may need to be pre-trenched and this is likely to be done utilising a
grab dredger.
Grab dredgers may release sediment into suspension by
the following mechanisms:
·
Impact
of the grab on the seabed as it is lowered;
·
Washing
of sediment off the outside of the grab as it is raised through the water
column and when it is lowered again after being emptied;
·
Leakage
of water from the grab as it is hauled above the water surface;
·
Spillage
of sediment from over-full grabs;
·
Loss
from grabs which cannot be fully closed due to the presence of debris;
·
Release
by splashing when loading barges by careless, inaccurate methods; and
·
Disturbance
of the seabed as the closed grab is removed.
In the transport of dredging materials, sediment may
be lost through leakage from barges.
However, dredging permits in Hong Kong
include requirements that barges used for the transport of dredging materials
have bottom-doors that are properly maintained and have tight-fitting seals in
order to prevent leakage. Given
this requirement, sediment release during transport is not proposed for
modelling and its impact on water quality is not addressed under this Study.
Sediment is also lost to the water column when
discharging material at disposal sites.
The amount that is lost depends on a large number of factors including
material characteristics, the speed and manner in which it is discharged from the
vessel, and the characteristics of the disposal sites. As impacts due to disposal operations at
potential disposal sites have been assessed under separate studies, they are
not addressed further in this document.
Loss rates have been taken from previously accepted EIAs in Hong Kong () ()
and has been based on a review of world wide data on loss rates from dredging
operations undertaken as part of assessing the impacts of dredging areas of Kellett Bank for mooring buoys ().
The assessment concluded that for 8 m3 (minimum) grab dredgers
working in areas with significant amounts of debris on the seabed (such as in
the vicinity of existing mooring buoys) that the loss rates would be 25 kg m-3
dredged, while the loss rate in areas where debris is less likely to hinder
operations would be 17 kg m-3 dredged.
For this Study it is proposed that the loss rate of
17 kg m-3 dredged for grab dredging (grab size of 12/16 m3)
be used as geophysical surveys have shown that there are no significant
quantities of debris in the vicinity of the dredging works ().
Generally, a split-bottom barge could have a capacity
of 900 m³. A bulk factor of 1.3 would normally be applied, giving a dredging
rate of 700 m³ per barge. The hopper dry density for an 800 to 1,000 m3
capacity barge is around 0.75 to 1.24 ton m-3.
The average release rates will, in fact, be somewhat
less than those indicated above. The instantaneous dredging (and loss) rates
will also decrease as the depth increases. This is because the assumed dredging
production rates are instantaneous rates that will not be maintained due to
delays for breakdowns, maintenance, crew changes and time spent relocating the
dredgers. The release rates that are to be modelled area, therefore, considered
to represent conservative conditions that will not prevail for any great length
of time.
A review of the vector plots at the sites allowed
identification of areas that would disperse sediment further than other areas
due to higher current velocities.
These areas were consequently chosen as the locations of the sources of
sediment in the model.
3.2.2
Trailing Suction Hopper Dredgers
Trailing Suction Hopper Dredgers (TSHD) will be used
mainly for the approach channel and turning circle. It may also be deployed
during the dredging for the submarine gas pipeline.
The hopper dry density for a TSHD is typically 0.75
ton m-3. TSHD could dredge at a faster rate than grab dredgers
(typical dredging rate of 5,400 m3 per trip per TSHD with a maximum
dredging rate up to 7,200 m3 per trip depending on the vessel
size). For the modelling scenarios
it has been assumed that the Contractor will utilise a small (<5,000 m3)
to medium (5,000 – 10,000 m3) TSHD.
A review of international data on losses from trailer
dredgers has determined that a loss rate of 7 kg m-3 dredged would
be appropriate irrespective of the size of the dredger, assuming no overflowing
but that the Lean Mixture Overboard (LMOB) systems are in operation () () (). LMOB is used at the beginning and end of
the dredging cycle when the suction arm is being lowered and raised. At these times the majority of the
material entering the hopper will be water with small amounts of fine
sediments, which is discharged to the sea via the overflow system.
Overflowing refers to the discharge of fine sediment
and water during bulk dredging and results in high losses of sediment to
suspension. Overflowing is not usually permitted when dredging in marine mud
and is usually only allowed during dredging of sand deposits, when overflowing is
utilised to increase the density of the material in the hopper.
The value of 7 kg m-3 (1)
(2) (3) dredged for dredging using trailing suction hopper dredgers will
be appropriate for this Study as LMOB will be used but overflowing will not be
permitted. It has also been assumed that no more than one THSD dredger will be
operating at any one time.
During dredging the drag head will sink below the level
of the surrounding seabed and the seabed sediments will be extracted from the
base of the trench formed by the passage of the draghead. The main source of sediment release is
the bulldozing effect of the draghead when it is
immersed in the mud. This mechanism
means that sediment is lost to suspension very close to the level of the
surrounding seabed and a height of 1 m has been adopted for the initial
location of sediment release in the model.
Disposal site at South Cheung Chau
is assumed to be available at the time of dredging works commissioned. Contractor should confirm the
availability of the disposal site prior to any disposal events. Based on this assumption, the cycle time
for a TSHD is calculated as presented in Table
A3.2.
Table A3.2 Cycle
Time for a TSHD
|
Disposal Site
|
TSHD Works Site
|
Distance (km)
|
Sailing Speed (km hr-1)
|
Off-site (Travel) Time (hr)
|
On-site Dredging Time (hr)
|
On-site Idle Time (hr)
|
Total Cycle Time (hr)
|
Working hours per day (hr)
|
Number of Cycles per day
|
|
(a)
|
(b)
|
(c)
|
(d)
|
(e) = 2* (c)/(d)
|
(f)
|
(g) = 2 hr - (f)
|
(h) = (e) + (f) + (g)
|
(i)
|
(j) = (i)/(h)
|
|
South Cheung Chau
|
South Soko
|
11
|
28.34
|
0.78
|
0.75
|
1.25
|
2.78
|
24
|
9
|
|
South Cheung Chau
|
Fan Lau Crossing
|
17
|
28.34
|
1.20
|
0.75
|
1.25
|
3.20
|
24
|
8
|
|
South Cheung Chau
|
Lantau
Channel
|
24
|
28.34
|
1.69
|
0.75
|
1.25
|
3.69
|
24
|
6
|
|
South Cheung Chau
|
West Lantau
|
30
|
28.34
|
2.12
|
0.75
|
1.25
|
4.12
|
24
|
6
|
3.3
Jetting
The speed of the machine will progress depending on
the construction type. Jetting speeds have been taken as 65 m hr-1
for water mains construction, 150 m hr-1 for cable circuit installation and 21 m hr-1 for gas pipeline
installation. These rates relate to typical practices
by contractors in Hong Kong that would be
involved in these works.
The maximum burial depth for each installation will
be 5 m. For water mains and gas
pipeline, it is envisaged that it will require three passes of the jetting
machine to reach the required burial depth. The volumes of sediment disturbed will
vary depending upon whether it is the first, second or third pass. The consecutive passes may uplift the
bottom sediment in a short period of time.
Despite, this will be temporary and instantaneous disturbance to the
seabed since the disturbed sediment is expected to settle on the seabed in a
short period after the jetting machine has passed.
For the water main, if we assume a
conservative case for the third pass (17.5 m3 per m), the rate of
disturbance will be 0.32 m3 s-1 (1). Similarly, for the cable circuit
installation, the rate of disturbance will be 0.06 m3 s-1
(1.5 m3 per m) (1).
The rate of disturbance for the pipeline will be 0.09 m3 s-1
(15 m3 per m)
().
The disturbed sediment will constitute a layer of
fluid mud flowing across the seabed either side of the jetting machine and only
a small portion of this sediment will enter the water column.
It is conservatively assumed that 20% of the disturbed
sediment enters suspension and this would give a loss rate.
The loss rate used here has been used in previous projects for submarine
utility installations under the EIAO
that have been installed using jetting methods and have obtained Environmental
Permits:
·
The
Proposed Submarine Gas Pipelines from Cheng Tou Jiao
Liquefied Natural Gas Receiving Terminal, Shenzhen to Tai Po Gas Production
Plant, Hong Kong – EIA Study (AEIAR-071/2003). EP granted on 23
April 2003 (EP-167/2003).
·
132kV
Submarine Cable Installation for Wong Chuk Hang -
Chung Hom Kok 132kV
Circuits (AEP-126/2002). EP granted on 2 April 2002
(EP-126/2002).
·
FLAG
North Asian Loop
(AEP-099/2001). EP granted on 18
June 2001 (EP-099/2001).
·
East
Asian Crossing (EAC) Cable System (TKO), Asia
Global Crossing (AEP-081/2000). EP granted on 4 October 2000
(EP-081/2000).
·
East
Asian Crossing (EAC) Cable System, Asia Global
Crossing (AEP-079/2000). EP granted on 6 September 2000
(EP-079/2000).
·
Submarine
Cable Landing Installation in Tong Fuk Lantau for Asia Pacific
Cable Network 2 (APCN 2) Fibre Optic Submarine Cable System, EGS. EP granted on 26 July 2000 (EP-069/2000).
·
Telecommunication
Installation at Lot 591SA in DD 328, Tong Fuk, South Lantau Coast and the Associated Cable Landing Work in Tong Fuk, South Lantau for the North
Asia Cable (NAC) Fibre Optic Submarine Cable System
(AEP-064/2000). EP granted in June
2000 (EP-064/2000).
To calculate the mass entrainment rate it is necessary to apply a dry
density for the material, which is conservatively assumed to be 700 kg m-3. The sediment will be entered into the
model in the model layer closest to the seabed because this will represent the
entrainment of sediment to suspension from the layer of fluid mud flowing over
the existing seabed. This approach
is considered valid as the jetting machine is fluidising the seabed sediments
and not excavating the sediments, consequently there will be little vertical
entrainment of sediment into the water column.
The sediment will be entered into the model within a
series of grid cells to represent the jetting machine moving along the pipeline
route. Thus each grid cell will
represent a section of the pipeline route and sediment will be entered into
that grid cell for the length of time it takes the jetting machine to pass the
length of that cell, based on the jetting machine speeds given above. Once the jetting machine has passed that
grid cell, sediment will then be entered in the next grid cell on the
route. The sediment release in the
bed layer (constitute 10 %) of the water column is assumed in the model.
It should be noted that the assumptions in the model
has been adopted in the previous approved EIAs and a
number of jetting contractors have confirmed that the assumptions adopted in
the model for the jetting are reasonable and practical. Further information of the jetting
operation is presented in Annex 6K.
3.4
Dredging Scenarios
3.4.1
Construction Works for Seawall and
Reclamation Areas (Scenario 1)
Dredging
Dredging works will be carried out at eastern and
western side of South Soko Island (Figure
A3.1). The estimated
dredged volume under the seawalls and for the approach channel at western berth
is approximately 0.28 Mm3 in total.
With the assumption of 24 hours working at South Soko Island, the average dredging rate would become, 6,300
m3 (based on 12 m3 grab size) or 8,400 m3 day-1
(based on 16 m3 grab size).
At the site, taking a conservative assumption when the grabs are just
commencing dredging in relatively shallow water and hence a higher production
output, the maximum daily rate of
production (with a minimum grab size of 8 m3) will be about 10,000 m3
day-1, giving a rate of release for the dredger of 1.97 kg s-1.
Hence, two grab dredgers will be used for the continuous dredging with an emission
of 1.97 kg s-1 (whole
column).
In view that the inshore part of the eastern berth is
too narrow that it does not cover a complete grid cell in the model. A stationary emission point, SS01, is
defined at the offshore breakwater.
Continuous release at SS01 is considered to be conservative and
representative for the dredging area.
A stationary emission point, SS02, (Figure A3.1) is chosen at a
location that has the shortest distance to the nearby sensitive receiver, i.e.,
fish fry habitat at Pak Tso Wan. This will prevent any underestimation of
the impacts to the habitat.
Backfilling
Sandfilling for seawall trench and the reclamation at western
berth by a pelican barge (rainbowing) is simulated by
assuming a filling rate of 75,000 m3 day-1. Working hours have been assumed to be 24
per day. The fill material will be
marine sand which generally has a fine content ranging from 2% to 10%. As the source of material could not be
confirmed at time of EIA compiled, the upper bound of the fine content, i.e.
10% is assumed for the conservative case.
The dry density of sand fill will be approximately 1,938 kg m-3. A highly conservative loss rate of 10%
is assumed, giving a rate of release of 16.8
kg s-1 (continuous in whole column).
Since the seawall trench and reclamation area is
small and close to the shore which is covered by approximately two grid cells
in the model, a stationary emission point, SS32, (Figure A3.1) has
been chosen at a cell that well represents both the seawall trench and the
reclamation.
3.4.2
Construction Works for Water Main Installation
(Scenarios 2 and 3)
The estimated dredged volume for the utility shore
approach at South Soko and at Shek
Pik is approximately 35,000 m3 and 37,000
m3, respectively. At the existing marine sand borrow area and
navigation channel, the estimated dredged volume is approximately 140,500 m3. Working hours have been conservatively
assumed to be 16 hours per day and 7 working days per week.
The grab dredging will be operated at South Soko shore approach; Shek Pik shore approach; and waterway crossing sand borrow area and marine
navigation channel and will be followed by backfilling operations. Jetting will be used for post trenching
near South Soko and Shek Pik.
Grab Dredging (Scenario 2)
Grab dredging at three
sections, i.e., South Soko Island
shore approach, Shek Pik
shore approach and waterway across sand borrow and marine channel, is modelled
in Scenario 2. Working hours have been conservatively
assumed to be 16 per day. Using the
dredging rate of 8,000 m3 day-1 a continuous emission
rate of 2.36 kg s-1 has
been modelled throughout the whole water column.
Figure A3.2 indicates the location of the water mains
as well as the emission sources.
The dredging area at the shore is small and hence two stationary
emission sources, SS09 and SS10, are chosen for the shore approaches at South Soko Island and Shek Pik respectively. A moving source, SS08, is defined in the
model to represent a longer section in the waterway.
Jetting (Scenario 3)
Following grab dredging there will be post trenching
jetting at South Soko and Shek
Pik sections.
Although the jetting works will be carried out one by one without
overlapping, Scenario 3 simulates the most conservative case, i.e. the jetting
works is conducted simultaneously at the two sections.
Two moving sources (SS09 and SS10 in Figure
A3.3) with continuous emission rates of 14.7 kg s-1, 29.5
kg s-1 and 44.2 kg s-1 are defined for
the 1st, 2nd and 3rd passes respectively
whereas the jetting rate to be 10,400 m3 day-1 and the
dry density of sediment to be 700 kg m-3. Working hours have been assumed to be 16
per day. One of the moving sources
(SS09) will start at west South Soko (extent seawards
following the curve of the watermain over a distance
of 1,700 m) and another (SS10) will begin at Shek Pik (extend seawards following the curve of the watermain over a distance of 2,300 m). The speed of progress will be 65 m h-1
and three passes will be made without down time between passes. As the disturbed layer would be confined
to the seabed the emission will be put at bed layer (10% of the water column).
3.4.3
Construction Works for Approach Channel and
Turning Basin
(Scenarios 4a and 4b)
It is estimated that dredged volume along the
approach channel and turning basin is approximately 1.07 Mm3 in
total. There are two dredging options which were defined
as Scenarios 4a and 4b. Figures A3.4 and A3.5 illustrate the location
of the emission for these two options:
·
Scenario 4a: Deployment of 2 grab dredgers; and,
·
Scenario 4b: Combination of 1 grab dredger and 1 TSHD.
Deployment of Grab Dredgers (Scenario 4a)
Three grab dredgers will
be used to dredge the material within Areas C and D (Figure A3.4). On the same basis of the grab dredging
of seawall, the emission rate
of the grab dredgers is 1.97 kg s-1
(emitted continuously at the whole water column).
A stationary emission point, SS03, is defined in the
model to represent the grab dredgers for the jetty whereas SS04a and SS05 are
chosen for Areas C and D (the approach channel and basin) respectively. SS04a and SS05, which are also
stationary points, are well represent the most conservative case in view of
their proximity to the shore and hence the sensitive receiver, i.e., the coral
habitat. In reality, the grab dredgers
will move around the approach channel and turning basin, i.e., farther away
from the sensitive receiver, and hence less impacts to the coral are expected.
Combination of Grab Dredgers and TSHD
(Scenario 4b)
As indicated in Figure A3.5, a TSHD (SS04b) will be
used at Area C while two grab
dredgers (SS03 and SS05) will be deployed at Area D. The emission
rate of the grab dredgers is 1.97 kg
s-1 as discussed above.
It is assumed that the TSHD will move at a speed of 0.3 m s-1 starting at utmost
northeast of the approach channel along the direction of the channel. The suggested size of trailer dredger is
approximately 8,000 m3 and the effectively capacity is 5,400 m3, which commonly operate in Hong Kong. The TSHD is expected to dispose of the
material off-site, potentially at South Cheung Chau
disposal site. The number of trips
per day varies depending on the distances between the working locations and the
disposal site (Table A3.2). For each trip, the dredging volume
will be 7,200 m3, the most
conservative case, lasting for approximately 45 minutes. Based upon the loss rate assumption of 7
kg m-3, the calculated loss rate will be 18.67 kg s-1 (about
10% bottom of water column).
3.4.4
Construction Works for Submarine Cable
Installation (Scenario 5)
Grab Dredging
Dredging will be carried out at Shek
Pik and South Soko shore
Approach. The dredging works for
submarine cable will be done together with the dredging works for water main
detailed in Section 3.4.2. In Scenario 2, it has been conservative
assumed that a 16 hour working day will be employed with a 6 day working week
throughout the works. Using the dredging rate of 8,000 m3
day-1 a continuous emission rate of 2.36 kg s-1 has been modelled throughout the whole water
column.
Jetting
Working hours have been assumed to be 12 per
day. One jetting machine, moving at
speed of 150 m hr-1, will work along the cable alignment from Shek Pik to South Soko Island.
The dry density of sediment is assumed to be 700 kg m-3. The submarine cable will be installed by
direct burying with a rate of 150 m hr-1 per machine and thus the
jetting rate will be 2,700 m3 day-1, which equates to a
continuous emission rate of 8.75 kg s-1 (bed layer). Figure A3.6 presents the start
point of the moving source (SS14) and it will move seawards following the curb
of the cable.
3.4.5
Construction Works for Submarine Intake
and Outfall (Scenario 5)
The approach is similar to that for seawall construction. It is conservative to assume that two
separate grab dredgers will be used for the dredging at the submarine intake
and outfall locations respectively although the dredging works is likely to
occur one followed one without overlapping. Working hours have been assumed to be 24
per day. The estimated dredged
volume is approximately 0.03 Mm3 in total.
As seen from Figure A3.6, a stationary point
source at each of the intake (SS15) and outfall (SS28) will release at a
continuous emission rate of 1.97 kg s-1.
3.4.6
Construction Works for Gas Receiving
Station (Scenarios 6)
Scenario 6 simulates the concurrent dredging and sandfilling works at the GRS.
Grab
Dredging
Dredging volume is approximately 0.29 Mm3. Working hours have been assumed to be 16
per day. Assuming the deployment of
two dredgers and using the dredging
rate of 8,000 m3 day-1 a continuous emission rate of 2.36 kg s-1 has been modelled
throughout the whole water column.
In view of the small size of dredging area (covered
by two grid cell in the model), two stationary emission points are defined
(SS29 and SS30 shown in Figure A3.7).
Sandfilling
Sandfilling for seawall trench and the reclamation at GRS by a
pelican barge (rainbowing) is simulated by assuming a
filling rate of 50,000 m3 day-1 with working hours to be
16 per day. The fill material will
be marine sand which generally has a fine content ranging from 2% to 10%. As the source of material could not be
confirmed at time of EIA compiled, the upper bound of the fine content, i.e.
10% is assumed for the conservative case.
The dry density of sand fill will be approximately 1,938 kg m-3. A highly conservative loss rate of 10%
is assumed, giving a rate of release of 16.8
kg s-1 (continuous in whole column).
Since the seawall trench and reclamation area is
small and close to the shore which is covered by approximately one grid cells
in the model, a stationary emission point, SS31, (Figure A3.7) has
been chosen at a cell that well represents both the seawall trench and the
reclamation.
3.4.7
Construction Works for Gas Pipeline
(Scenarios 7 to 13)
The estimated dredged volume, the number of plant and
the distance apart between each plant at the associated pipeline section is
shown in Table A3.3. The working hours have been assumed to
be 24 per day for TSHD dredging and 12 hour per day for grab dredging. The route is shown in Figure
A3.8.
Table A3.3 Submarine
Gas Pipeline Construction Details
|
Zone
(KP)
|
Scen-ario
|
Plant
Used
|
Dredged Volume
(Mm3)
|
Moving Speed
(m h-1)
|
Number of Plant
|
Minimum Distance Apart between
Each Plant (m)
|
|
South Soko Approach
(0-1)
|
7
|
Grab Dredger (a)
|
0.07
|
2.5
|
1
|
N/A
|
|
West of South Soko to West Lantau
(1-24.5)
|
8
|
TSHD (b)
|
1.28
|
33
|
1
|
N/A
|
|
Northwest Lantau to Urmston Road Crossing (24.5-31)
|
9
|
Grab Dredging (a)
|
0.17
|
2.5
|
3
|
2,167
|
|
Urmston Road Crossing (31-33.5)
|
10
|
Grab Dredging (a)
|
0.07
|
2.5
|
1
|
N/A
|
|
West of Black
Point
(33.5-37)
|
11
|
Grab Dredger (a)
|
0.30
|
2.6
|
3
|
1,167
|
|
West of Black
Point
(37-37.803)
|
12
|
Grab Dredger (a)
|
0.02
|
2.5
|
1
|
N/A
|
|
Black Point
Shore Approach
(37.803-38.303)
|
13
|
Grab Dredger (a)
|
0.02
|
4.75
|
1
|
N/A
|
|
Notes:
(a)
Grab
dredger denotes a closed grab with a minimum grab size of 8 m3.
(b)
TSHD denotes Trailer Suction Hopper
Dredger with hopper capacity of 11,300 m3.
|
Combination
of Grab Dredge and TSHD Dredging
Grab Dredging: The
dredging will be carried by one to three closed grab dredgers. It is assumed that the grab
dredging rate is 4,000 m3 day-1 for the pipeline
dredging, which gives a loss rate of 0.79
kg s-1 per plant respectively throughout the whole water column.
TSHD Dredging: The dredging will be carried by one
TSHD. It is assumed that the
dredging rates are 7,200 m3 per trip and each dredging event lasts
approximately 0.75 hour, which gives a loss rate of 18.7 kg s-1 for KP1 – KP24.5 respectively releasing at
the bed layer (10% of the water column).
Alternative
Gas Pipeline Route
Potentially, a container port, CT10, will be built to
the west of Lantau (near Tai O). If this is the case, it will hence be
necessary to alter the LNG submarine gas pipeline in order to avoid the
intersection with the CT10 which may require dredging the port area to
substantial depth for reclamation.
An alternative pipeline route was designed to bypass the CT10. To assess any potential impacts due to
the alternative pipeline route was thus simulated by Delft3D model. The modelling is mainly carried
out for KP7 – 14, KP14 – KP20 and KP20 – KP34.5 since the changes are mainly at
these three zones. The model
results are presented in Appendix 6C
in this Annex.
3.4.8
Construction
Programme and Sequence
Tentative construction
programme and indicative construction sequence are shown in Figures
A3.9 and A3.10 respectively.
3.5
Sewage Discharge
During construction of the LNG terminal the maximum work
force is estimated to be around 1,600 people maximum. Based on Table 2 of the
Drainage Service Department’s (DSD’s) Sewerage
Manual for domestic type
sewage, the unit flow factor for an employed population is 150 L per head per day. A calculation of the
Average Dry Weather Flow (ADWF) is given in Table
A3.4. According to the Sewerage
Manual, a peaking factor of 6 should be applied to the average flow to
determine the peak flow which is also shown.
Table A3.4 Calculation
of Sewage Flow LNG Construction Phase
|
Population
|
Unit
Flow Factor
(L/head/day)
|
Average Dry Weather Flow (ADWF)
(m3/day)
|
Peak Flow
(6 x ADWF)
(m3/day)
|
|
1,600
|
Domestic Type
150 L/head/day
|
240
|
1,440
|
|
|
Total
|
240
|
1,440
|
From the above, the effluent discharge consent
standard, based on the ADWF, can be obtained from Table 10a of
the TM and is summarised in Table A3.5. As the sewage from the LNG terminal at
South Soko Island
is of domestic sewage type, the parameters as shown in Table A3.5 are applicable to the sewage treatment process. The other parameters that comprise
restrictions on chemicals are not a concern for domestic type sewage and are
therefore considered. For oil and
grease this requires to be controlled by fitting grease traps to the sewage
outlets from the kitchens. The
design load of the sewage discharge is the same as the effluent discharge
standard and also shows in Table A3.6.
Table A3.5 Effluent
Discharge Standard and Design Load for the Sewage Treatment Works during
Construction Phase
|
Site
|
Corresponding
WCZ
|
BOD
(mg/L)
|
SS
(mg/L)
|
Total Nitrogen
(mg/L)
|
E.Coli
(count/100mL)
|
|
South Soko
|
Southern
|
20
|
30
|
100
|
1,000
|
3.6
Hydrotest
Discharge
An assessment of the impacts from hydrotest discharges is required. These tests are needed to check the
integrity of the pipeline from Soko Island
to Black Point. In the freshwater
testing additives are used. At this
stage an assessment of the initial dilution suffices because the discharge is
relatively small and decay rates of the additives are unknown. A most conservative approximation is
thus applied because dilution only provides the upper bound of concentrations
in the discharge plume.
3.6.1
Discharge Location
There are two alternative locations where
the hydrotest water will be discharged:
·
Black
Point, where the hydrotest discharge water is
combined with the existing thermal effluent flow from the Black Point Power
Station; or
·
Soko
Island, where the discharge is located at the south
of Soko
Island (proposed
outfall).
3.6.2
Discharge Rate
It is estimated that 20,000 m3 hydrotested water from the pipeline with a rate of 0.19 m3
s-1 will be discharged (last for about 1.2 days).
3.6.3
Modelling Approach
Near-field model, CORMIX, is used to investigate
dilution of discharges in varying but steady state conditions for both the dry
and wet seasons. The area of the
diluted plume (in terms of distance from the source) has been assessed.
For the study of operational effects, the approach
requires several steps:
1) Running
a near-field model (i.e. CORMIX) for the operational discharges to characterise
the initial mixing of the effluent discharge. The results of the near-field model has
been used to define the manner in which the discharge would be included in the
far-field hydrodynamic and the water quality models (at which depth, the number
of cells over which the discharge will be distributed). The results from the CORMIX analysis have
also provided information of the near field dispersion and dilution of the
effluent plumes and hence chlorine and/or other biocide concentrations.
The details of CORMIX
simulation is presented in Appendix B
of this Annex.
2) Adapting
the hydrodynamic model for the new conditions, including the reclamations and
discharges.
3) Running
the hydrodynamic model for the specified conditions (wet/dry season). Both sites can be implemented within one
hydrodynamic run for a dry and wet seasons spring-neap cycle, since there will
be no significant interaction between the effects of the two sites.
4) Running
the water quality model (i.e. Delft3D-WAQ). The objectives are twofold:
a) to qualitatively assess the concentrations of
residual chlorine or other biocides: to this end up to 5 decayable
tracers may be defined, which will be released from the two candidate sites
(the analysis has been carried out assuming that the background concentration
is zero); and
b) to qualitatively assess the potential changes
in water quality as a result of changes in the circulation near the project
sites: to this end up to 5 conservative, i.e. non-decayable,
tracers have been defined, which will be discharged from a number of locations
representing main pollution sources (e.g. Hong Kong as a whole, major point
sources in the vicinity of the candidate sites).
The general water quality is the result of transport
phenomena and transformation and retention processes. The operation of the project may locally
affect the transport patterns.
Transformation and retention processes are not affected. Consequently, validation of the
Delft3D-WAQ model is not required.
The analysis under 4b) requires the running of a baseline scenario to
assess the pre-project conditions.
4.1
Thermal and
Antifoulant Discharge
Stored LNG will
need to be re-gasified in order for it to be conveyed
along the gas pipeline to the point of use. Seawater discharged from the LNG
terminal is expected to have a decreased temperature of approximate D 12.5°C at the discharge point.
The flow rate is expected to be equivalent to 18,000 m3 hr-1
(peak flow).
The dosing level of Chlorine is expected to be at
approximately 3 mg L-1.
Residual Chlorine level is expected to be less than 0.3 mg L-1. Hence 0.3 mg L-1 is simulated
in the model for both maximum discharge flow and the seasonal varied discharge
flow as shown in Table A4.1.
Table A4.1 Cooling
Water Discharge Flow Rate
|
Hour
|
Summer (m3
hr-1)
|
Winter (m3
hr-1)
|
|
0
|
13500
|
9000
|
|
1
|
13500
|
6750
|
|
2
|
11250
|
4500
|
|
3
|
11250
|
4500
|
|
4
|
11250
|
4500
|
|
5
|
11250
|
4500
|
|
6
|
11250
|
4500
|
|
7
|
11250
|
6750
|
|
8
|
15750
|
9000
|
|
9
|
18000
|
11250
|
|
10
|
18000
|
15750
|
|
11
|
18000
|
18000
|
|
12
|
18000
|
18000
|
|
13
|
18000
|
18000
|
|
14
|
18000
|
18000
|
|
15
|
18000
|
18000
|
|
16
|
18000
|
18000
|
|
17
|
18000
|
18000
|
|
18
|
18000
|
18000
|
|
19
|
18000
|
18000
|
|
20
|
18000
|
18000
|
|
21
|
18000
|
18000
|
|
22
|
18000
|
15750
|
|
23
|
15750
|
11250
|
Residual chlorine is known to decay rapidly in the marine
environment, as the chlorine demand of the receiving waters is likely to be
high. A preliminary review of
literature on chlorine decay has indicated that there are a number of factors
that determine decay, including reactivity of organic matter, temperature, (UV)
light, pH and salinity. However,
chlorine decay has been studied mostly for freshwater systems and in
distribution system.
Based on this review, a conservative rate of decay
has been taken as first order decay (i.e., 100 day-1) at 30°C. As chlorine will be discharged in cooled
water from the gas warming vaporisation system, a similarly conservative
temperature dependency of 1.0996 has been used in the modelling ().
4.2
Sewage Discharge
During operation of the LNG receiving terminal the maximum
work force is estimated to be around 100 people maximum. Based on Table 2 of the Drainage Service Department’s (DSD’s)
Sewerage Manual, the unit
flow factor for an employed population is 60 L per head per day.
However, this unit flow rate does not comprise
wastewater generated from staff showers or any canteen facilities to be
provided. Considering the nature of
the work and remote locations, some of the work force may use shower facilities
and also canteen facilities will be required. In this case subject to discussion and
agreement with Environmental Protection Department (EPD) a commercial unit flow
factor may be applied to the work force on top of the employed population unit
flow factor. Table A4.2 shows a calculation of the Average Dry Weather Flow
(ADWF) and the peak flow for which a peaking factor of 6 is applied.
Table A4.2 Calculation
of Sewage Flow LNG Operational Phase
|
Population
|
Unit
Flow Factor
(L/head/day)
|
Average Dry Weather Flow (ADWF) (m3/day)
|
Peak Flow
(6 x ADWF) (m3/day)
|
|
100
|
Employed Population
60L/head/day
|
6.0
|
36.0
|
|
100
|
Commercial Activities
|
29.0
|
174.0
|
|
|
Total
|
35.0
|
210.0
|
From the above, the effluent discharge standard,
based on the ADWF, can be obtained from Table
10a of the TM and is summarised in Table A4.2. As the sewage from the LNG Plant is of
domestic sewage type, the parameters as shown in Table A4.3 are applicable to the sewage treatment process. The other parameters that comprise
restrictions on chemicals are not a concern for domestic type sewage and are
therefore considered. For oil and
grease this requires to be controlled by fitting grease traps to the sewage
outlets from the kitchens. The
design load of the sewage discharge is decided to be same as the effluent discharge
standard.
Table A4.3 Effluent
Discharge Standard and Design Load for the Sewage Treatment Works during
Operational Phase
|
Site
|
Corresponding
WCZ
|
BOD
(mg/L)
|
SS
(mg/L)
|
Total Nitrogen
(mg/L)
|
E.Coli
(count/100mL)
|
|
South Soko
|
Southern
|
20
|
30
|
100
|
1,000
|
4.3
Maintenance
Dredging
The study has considered the following
three steps that steer sedimentation.
Two types of material have been taken into account, i.e. mud (cohesive)
and sand (non-cohesive). Mud is transported
in suspension and sand is transported as suspended load or bed load, depending
on the grain size and wave/current conditions.
1) To estimate the rate of sediment supply,
data on bed composition in the vicinity of the LNG terminals (if available also
sediment cores), data on suspended sediment concentration (preferably also
during or just after typhoons) and data on the sediment load and the extent of
the sediment transport of Pearl River has been
analysed. From the mineralogical
composition, sediment sources can be identified.
2) The current velocity in and around the
navigation channel and the resulting bed shear stress. To this end, results from existing
hydrodynamic model simulations can be used.
·
The
influence of waves has been evaluated based on a combination of wave climate
data analysis from measurements, existing wave model results and desk analysis.
·
An
analysis of recirculation patterns by wind and tide to identify transport
pathways. The tidal excursion
length is also an important parameter to consider.
·
Based
on available data, it has been assessed what the effect of seasonal variations
is and what the importance of density-driven effects is, e.g. salinity, fluid
mud, temperature.
3)
From the analysis on sediment supply and transport,
an estimate can be made on the sedimentation rate in the navigation channel and
in the neighbourhood of the terminal.
From the average and maximum shear stress in the trench induced by
currents and waves, the sediment trapping efficiency can be estimated. The product of supply and trapping
efficiency yields the sedimentation rate.
Following the
above approach, the frequency of the maintenance dredging has been
estimated. For the impact
assessment of the maintenance dredging, the qualitative assessment has been
conducted (discussed in the Section 6 –
Water Quality Impact Assessment) since the scale of the maintenance
dredging would be much less than the dredging works for the approach channel
and turning basin during construction phase which has been modelled as
described in the previous section.
4.4
Accidental Fuel Spillage
4.4.1
Locations
A release point (808503
easting, 801160 northing) is defined just in from the boundary of Hong Kong waters on the approach to the island. This point is on the potential LNG
carrier route and thus chosen for the impact assessment. To be conservative, the release point is
assumed to be just above the waterline.
4.4.2
Fuel Type
Based on the information, it
is assumed that the fuel is Heavy Fuel Oil (HFO i.e., 100% No 6).
4.4.3
Volume to be spilled
The most conservative case
scenario was modelled, i.e. the largest single HFO
storage tank from a 210 km3 SSD propulsion vessel which is 5,043 m3. The
inventory released should equate to 60% of the tank contents.
4.4.4
Discharge Rate
It is assumed the large
carrier will be used and its large collision event has a release rate of 8,060
kg s-1, even though the small carrier will also be adopted in
reality, giving a large collision event having a lower release rate of 7,720 kg
s-1.
4.4.5
Model Selection
The oil spillage has been
simulated using hydrodynamic and particle tracking models (oil module of
Delft3D-PART) to assess the movement of the oil spill. This Delft3D-PART forms part of the
well-calibrated Delft
3D suite of models, as described in Section
1 of this Annex. This particle
tracking model has been adopted in the EIA of Permanent Aviation Fuel Facility
().
4.4.6
Key Modelling Assumptions
Fuel spill is modelled by surface
particles (floating since the density of the oil is less than that of the
water). The initial radius is calculated on the basis of the Fay and Hoult equation ()
that calculates the extent of the patch after gravitational spreading. This spreading occurs in a matter of
minutes rather than hours. The radius is related to the density difference
between the oil and the water and the volume of spilled oil). The spill as used
in the present case, of heavy fuel oil would lead to an initial patch of a
diameter of 440 m. This implies a
thickness of about 5 mm. In addition, no evaporation rate and emulsification is
assumed in the model. The wind data at Cheung Chau
and Sha Chau as shown in Annex 13A3 in Section 13
is used in the model.
4.4.7
Scenarios
The PART model has
been simulated for the dry and wet seasons with typical real time wind time
series. The simulations were run for periods of 5 days to capture the transport
route of the oil spill in the first 24 hours to facilitate the development of
an emergency contingency plan.
At present there are no planned projects that could
have cumulative impacts with the construction of the terminal at South Soko and the gas pipeline. The construction of the HK-Zhuhai-Macau
Bridge and potential
Western Port Development (CT10) are unlikely to be carried out concurrently
with the construction works of the gas pipeline. With reference to the Project Profile
for the Lantau Logistic Park (LLP), the exact layout
of the proposed LLP reclamation is the subject of further study and will be
confirmed by the detailed investigations which are ongoing. The way forward and
construction programme of the LLP are also uncertain at this stage. No other projects are planned to be
constructed in sufficient proximity to the Project to cause cumulative effects. In light of the above, cumulative
impacts are not expected to occur.
6.1
Sediment
Parameters
For simulating sediment impacts the following general
parameters has been used:
·
Settling
velocity – 0.5 mm s-1
·
Critical
shear stress for deposition – 0.2 N m-2
·
Critical
shear stress for erosion – 0.3 N m-2
·
Minimum
depth where deposition allowed – 1 m
·
Resuspension rate – 30 g m-2 d-1
·
Wave
calculation method – Tamminga
·
Chezy calculation method – White/Colebrook
·
Bottom
roughness – 0.001 m ()
·
Fetch
for wave driven erosion – 35 km
·
Depth
gradient effect on waves - absent
The above parameters have been used to simulate the
impacts from sediment plumes in Hong Kong
associated with uncontaminated mud disposal into the Brothers MBA ()
and dredging for the Permanent Aviation Fuel Facility at Sha
Chau (). The critical shear stress values for
erosion and deposition were determined by laboratory testing of a large sample
of marine mud from Hong Kong as part of the
original WAHMO studies associated with the new airport at Chek
Lap Kok.
7
Scenarios
7.1
Construction
Phase
The scenarios are constructed in accordance with the
tentative construction programme (Figure A3.9). To simulate conservative worse cases
potential concurrent activities would be simulated at the same time regardless
the reality that they may not all occur simultaneously.
The proposed scenarios for the construction phase of
the South Soko Option are presented in Table A7.1.
Table A7.2 summarises the
inputs defined in the water quality model.
