Figure 1.1 Aerial
Photo of Black Point Site
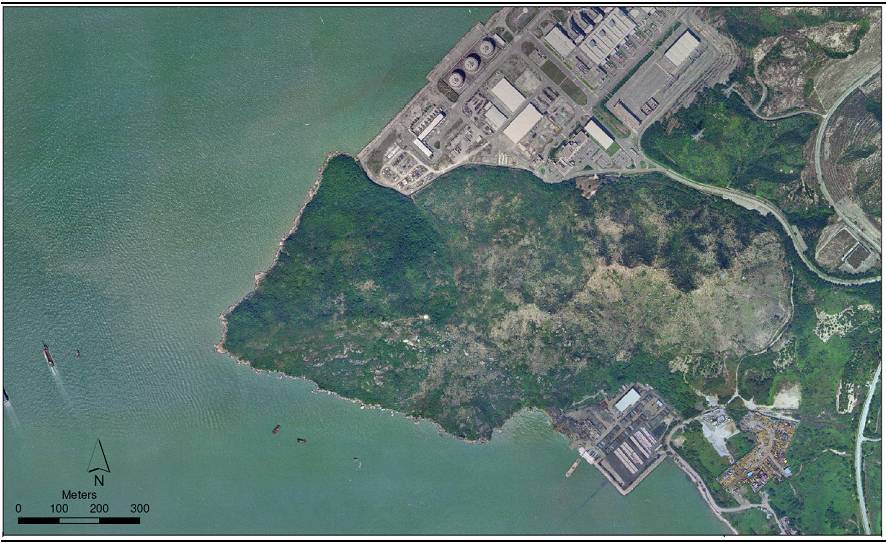
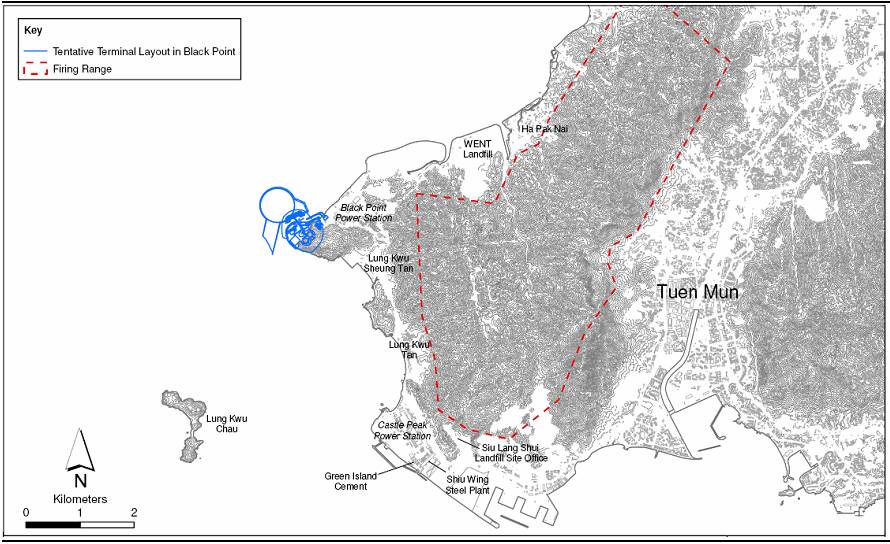
Figure 1.2 Population in Vicinity of Black Point
This
section describes the methodology employed to determine the population in the
vicinity of the proposed site at Black Point as well as the population to be
adopted in the Quantitative Risk Assessment (QRA) study. The QRA considers the years 2011 and 2021 in the
analysis and so the population was estimated for these years.
The
proposed site for the LNG Terminal at Black Point is located adjacent to the
existing Black Point Power Station in the west of the
The
current land use within a 2km radius of the proposed site at
Black Point includes Lung Kwu Sheung
Tan village and
Further from the site, there is Lung Kwu Tan village at about 3km. Castle Peak Power Station and
the neighbouring industrial sites lie about 4km from the proposed terminal site
(Figure 1.2).
1.3
Land Population Estimation
The
following information sources were referred to for population estimation:
·
Site Survey Data [1]
·
Population Survey Report [2]
·
Census Data [3]
·
Land Records from Lands Department
·
Road Traffic Data [4]
·
Data on Key Individual Developments
·
Marine Traffic Data [5-7]
Figure 1.1 Aerial
Photo of Black Point Site
Figure 1.2 Population in Vicinity of Black Point
1.3.1
Residential Population
There is no residential population within
2km of the Black Point site, apart from the
The population in other nearby villages
was obtained from site survey data [1] and scaled by appropriate growth factors
for their respective Planning Vision Strategy (PVS) [9] zone to give the
predicted populations for 2011 and 2021 (Table
1.1). The dense urban areas of Tuen Mun and Yuen Long are about 7km away, too far from the
terminal for even the worst case accident scenarios to have an impact at a
frequency greater than 10-9 per year.
Table 1.1 Estimated
Residential Population Data
|
Location |
Approx.
Distance from Terminal Site |
2011
Population |
2021 Population |
|
Lung Kwu Tan village Ha Pak Nai village Lung Kwu Chau |
3km 3.7km 4km |
753 216 0 |
1,297 372 0 |
1.3.2
Industrial Population
According to data provided by Planning
Department, Lung Kwu Sheung
Tan and the government land allocated for temporary use (part of TPU432) are
the only areas assumed to hold population within 2km radius of the Terminal
[9]. As mentioned above, the
A
similar 30% increase was applied to other industrial sites to give the data
presented in Table 1.2 [1].
Table 1.2 Industrial
Facility Population
|
Location |
Approx.
Distance from Terminal Site |
2011
Population |
2021
Population |
|
Black Point Site Surrounding WENT Landfill Shui Wing Steel Plant Siu Lang Shui Landfill Site Office |
1km 3km 3.5km 4.5km 4.8km 4.9km |
100 194 1,102 177 390 7 |
100 194 1,102 177 390 7 |
Ammonium Nitrate Facility
A site for manufacturing and storage of Ammonium
Nitrate Emulsion Compound, trade name EP Gold Emulsion, is located near the
Black Point site to the southeast of the proposed LNG terminal, about 1km away
behind a hill.
The population of this site is included in
“Black Point Site Surrounding”, however, the facility has a licence to store
2x20 tonne containers of Ammonium
Nitrate and 1 x 5 tonne containers of Ammonium Nitrate Emulsion (‘EP Gold”), both classified
as UN Class 5.1, Oxidising
Substance.
Because of its distance from the terminal,
together with the shielding effect provided by the hill, the impact on the LNG
terminal due to the ammonium nitrate storage is considered to be negligible.
1.3.3
Road Traffic Population
Access to Black Point Power Station is via
The population estimation for
No.
of persons =
(AADT x Vehicle Occupancy / 24 / Speed)
=
4,380 x 3 / 24 / 50 = 11 persons/km
The traffic along this section of road has
increased at an average rate of 4.3% in recent years. Assuming this trend
continues, the traffic will increase by 30% by the year 2011, and by 100% by
the year 2021. The future population for both 2011 and 2021 is therefore
conservatively estimated as 11 x 2 = 22 persons/km.
1.3.4
Occupancy and Indoor/Outdoor Fractions
The land population is categorised further
into 4 time periods: night time, weekday, peak hours and weekend day. These are
defined in Table 1.3.
Table 1.3 Population
Time Periods
|
Time Period |
Description |
|
Night
time Weekday Peak
hours Weekend
day |
7:00pm to 7:00am 9:00am to 5:00pm Monday through Friday, 9:00am to
1:00pm Saturdays 7:00am to 9:00am and 5:00pm to 7:00pm, Monday to
Friday 7:00am to 9:00am and 1:00pm to 3:00pm, Saturdays 3:00pm to 7:00pm Saturdays, and 7:00am to 7:00pm
Sundays |
The occupancy assumed [2] during these
time periods is given in Table 1.4. Different
occupancy figures are assumed for industrial, residential and road types of
population. The proportion of the population outdoors is also assumed to vary
according to type of population and time period (Table 1.4).
The hazards that can potentially affect
offsite population are flash fires and thermal radiation from pool fires.
Buildings are assumed to offer protection to its occupants for these events.
The protection factor used is 90%, or equivalently the exposure factor is 10%.
Scenarios are therefore assumed to affect 100% of the outdoor population and
10% of the indoor population.
Road vehicles are also assumed to offer
some protection, although less than a building. An exposure factor of 50% is
used for vehicles.
Table 1.4 Land
Population Occupancy and Indoor/Outdoor Fractions
|
Population |
Occupancy |
% Outdoors |
|||||||||
|
Type |
Night |
Peak |
Weekday |
Weekend day |
Night |
Peak |
Weekday |
Weekend day |
|||
|
Industrial Residential Road |
10 % 100 % 10 % |
10 % 50 % 100 % |
100 % 20 % 50 % |
10 % 80 % 20 % |
5 % 0 % 0 % |
10 % 30 % 0 % |
10 % 10 % 0 % |
10 % 20 % 0 % |
|||
1.4
Marine Population Estimation
Black Point is situated near
1.4.1
Vessel Population
The vessel population used in this study
are as given in Table 1.5. The
figures are based on BMT’s Marine Impact Assessment
report [6] except those for fast ferries. The maximum population of fast
ferries is assumed to be 450, based on the maximum capacity of the largest
ferry operating in
Table 1.5 Vessel
Population
|
Type of Vessel |
Average Population per Vessel |
% of Trips |
|
Ocean-Going
Vessel Rivertrade
Coastal vessel Fast
Ferries Tug and
Tow Others |
21 5 450
(largest ferries with max population) 350
(typical ferry with max population) 280
(typical ferry at 80% capacity) 175
(typical ferry at 50% capacity) 105
(typical ferry at 30% capacity) 35
(typical ferry at 10% capacity) 5 5 |
3.75 3.75 22.5 52.5 12.5 5.00 |
1.4.2
Marine Vessel Protection Factors
The population on marine vessels is
assumed to have some protection from the vessel structure, in a similar way
that buildings offer protection to their occupants. The degree of protection offered
depends on factors such as:
·
Size
of vessel
·
Construction
material and likelihood of secondary fires
·
Speed
of vessel and hence its exposure time to the flammable cloud
·
The
proportion of passengers likely to be on deck or in the interior of the vessel
·
The
ability of gas to penetrate into the interior of the vessel and achieve a
flammable mixture.
Small vessels such as fishing boats will
provide little protection but larger vessels such as ocean-going vessels will
provide greater protection. Fast ferries are air conditioned and have a limited
rate of air exchange with the outside. Based on these considerations, the
fatality probabilities assumed for each type of vessel are as given in Table 1.6.
Table 1.6 Population
at Risk
|
Marine Vessel Type |
Population |
Fatality Probability |
Population at Risk |
|
Ocean-Going
Vessel Rivertrade
Coastal Vessel Fast
Ferries Tug and
Tow Others |
21 5 450 350 280 175 105 35 5 5 |
0.1 0.3 0.3 0.3 0.3 0.3 0.3 0.3 0.9 0.9 |
2 2 135 105 84 53 32 11 5 5 |
1.4.3
Methodology
In this study, the marine traffic
population in the vicinity of Black Point has been considered as both point
receptors and average density values. The population of all vessels are treated
as an area average density except for fast ferries which are treated as point
receptors.
The marine area around Black Point was
divided into 12.67km2 grid cells, each grid being approximately
3.6km x 3.6km. The transit time for a vessel to traverse a grid is calculated based
on the travel distance divided by the vessel’s average speed. The average speed
[5] and transit time for different vessel types are presented in Table 1.7.
Table 1.7 Average
Speed and Transit Time of Different Vessel Type [5]
|
Type of Vessel |
Assumed Speed (m/s) |
Transit
Time (min) |
|
Ocean-going vessel |
6.0 |
9.9 |
|
Rivertrade Coastal vessel |
6.0 |
9.9 |
|
Fast Ferries |
15.0 |
4.0 |
|
Tug and Tow |
2.5 |
23.7 |
|
Others |
6.0 |
9.9 |
|
|
|
|
The number of vessels traversing each grid
daily was provided by the marine consultant [5]. These are given in Table 1.8, where the grid cell reference
numbers are defined according to Figure
1.3. The number of marine vessels present within each grid cell at any
instant in time is then calculated from:
Number
of vessels = No. of vessels per day x grid
length / 86400 / Speed (1)
This was calculated for each type of
vessel, for each grid and for years 2011 and 2021. The values obtained
represent the number of vessels present within a grid cell at any instant in
time. Values of less than one are interpreted as the probability of a vessel
being present.
Figure 1.3 Grid
Cell Numbering Scheme
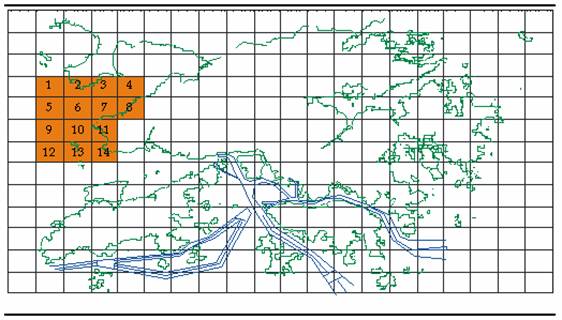
Table 1.8 Number of Marine Vessels Per Day
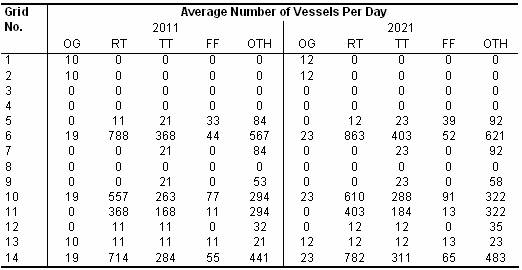
OG = Ocean-going vessels
RT = Rivertrade coastal
vessels
TT = Tug & tow vessels
FF = Fast ferries
OTH = others
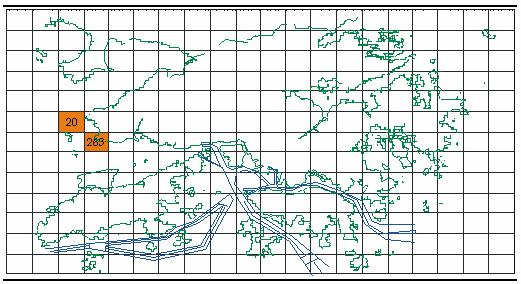
Average Density Approach
The average
marine population for each grid is calculated by combining the number of
vessels in each grid (from Equation 1) with the population at risk for
each vessel (Table 1.6). The results are shown in Figures 1.4 and 1.5. This grid population is
assumed to apply to all time periods. Note however that fast ferries are
excluded since ferries are treated separately in the analysis (see below).
When simulating
a possible release scenario, the impact area is calculated from dispersion
modelling. In general, only a fraction of the grid area is affected and hence
the number of fatalities within a grid is calculated from:
Number of fatalities = grid
population x impact area / grid area (2)
Figure 1.4 Marine Population at Risk by Grid, Year 2011

Figure 1.5 Marine Population at Risk by Grid, Year 2021
Point Receptor Approach
The
average density approach, described above, effectively dilutes the population
over the area of the grid. Given that ferries have a much higher population
than other classes of vessel, combined with a relatively low presence factor
due to their higher speed, the average density approach would not adequately
highlight the impact of fast ferries on the FN curves. Fast ferries are therefore treated a little
differently in the analysis.
In reality, if a fast ferry is affected by
an accident scenario, the whole ferry will likely be affected. The likelihood
that the ferry is affected, however, depends on the size of the hazard area and
the density of ferry vessels. To model this, the population is treated as a
concentrated point receptor i.e. the entire population of the ferry is assumed
to remain focused at the ferry location. The ferry density is calculated the
same way as described above (Equation 1),
giving the number of ferries per grid at any instant in time, or equivalently a
“presence factor”. A hazard scenario, however, will not affect a whole grid,
but some fraction determined by the area ratio of the hazard footprint area and
the grid area. The presence factor, corrected by this area ratio is then used
to modify the frequency of the hazard scenario:
Prob.
that ferry is affected = presence factor x impact area / grid area (3)
The fast ferry population distribution
adopted was described in Table 1.5.
Information from the main ferry operators suggests that 25% of ferry trips take
place at night time, while 75% occur during daytime. Day and night ferries are
therefore assessed separately in the analysis. The distribution assumed is
given in Table 1.9.
Table 1.9 Fast
Ferry Population Distribution for Day and Night Time
Periods
|
Population |
Population at Risk |
% of Day Trips |
% of Night Trips |
% of All Trips (= 0.75 x day + 0.25 x night) |
|
450 350 280 175 105 35 |
135 105 84 53 32 11 |
5 5 30 60 - - |
- - - 30 50 20 |
3.75 3.75 22.5 52.5 12.5 5.0 |
The ferry presence factor (Equation 1) and probability that a ferry
is affected by a release scenario (Equation
2) are calculated for each ferry occupancy category and each time period.
1.4.4
Stationary Marine Population
Stationary marine population in the
vicinity of Black Point was also considered. Contributions to these populations
come from the Tuen Mun
Immigration Anchorage, Tuen Mun
Rivertrade terminal, Tuen Mun Area 38 and
Figure 1.6 Stationary
Marine Population at Risk (2011)
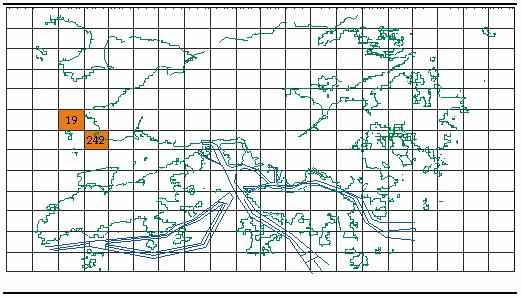
Figure 1.7 Stationary
Marine Population at Risk (2021)
[1] ERM,
Environmental and Risk Assessment Study for a Liquefied natural gas (LNG) Terminal
in the Hong Kong SAR – Population Update Report, Dec 2004.
[2] ERM,
Liquefied Natural Gas (LNG) Terminal and Associated Facilities – Marine
Quantitative Risk Assessment, Population Survey Report, Jun 2006.
[4] The
Annual Traffic Census 2005, Transport Department, Hong Kong SAR, Jun 2006.
[5] BMT Asia Pacific Ltd.,
personal communication, 2006
[6] BMT Asia Pacific Ltd,
Marine Impact Assessment for Black Point & Sokos
islands LNG Receiving Terminal & Associated Facilities, Pipeline Issues,
Working Paper #3, Issue 6, May 2006
[7] Passenger
Arrivals/Departures and Passenger Load Factors at Cross-Boundary Ferry
Terminals, January to December 2005, Marine Department, Hong Kong SAR.
[8] Hong Kong 2030,
Planning Vision and Strategy, Planning Department, Hong Kong SAR.
[9] Projected
Hong Kong Resident Population by TPU, Planning Department, Hong Kong SAR, 2004