This section
presents an assessment of the potential air quality impacts arising from the construction,
operation, restoration and aftercare of the proposed Extension.
During the
construction phase, dust nuisance arising from blasting, excavation and
filling, slope stabilisation, site formation, stone crushing and vehicle
movements on the site is a potential concern. Potential sources of air quality and
odour impacts during the operation, restoration and aftercare phases of the
Extension will include waste filling activities, the landfill gas (LFG) treatment
facility, the new leachate treatment plant (LTP) and
the LFG generator.
Representative Air
Sensitive Receivers (ASRs) have been identified and an assessment of the
potential air quality impacts has been conducted. Adjacent emission sources such as
industrial emissions from Tseung Kwan O Industrial
Estate (TKOIE), restoration of existing SENT Landfill and the future operations
in TKO Area 137 during construction operation/restoration and aftercare phases
of the Extension have also been taken into consideration. Mitigation measures have been
recommended, where appropriate, to reduce the impacts.
4.2.1
Air Pollutants Covered by Hong Kong Air Quality Objectives (HKAQOs)
The principal legislation for the
management of air quality in Hong Kong is the Air Pollution Control Ordinance (APCO)
(Cap. 311). Under the APCO, the Hong Kong Air Quality Objectives (HKAQOs),
which are presented in Table 4.2a, stipulate
the statutory limits for air pollutants and the maximum allowable numbers of exceedences over specific periods.
Table 4.2a Hong
Kong Air Quality Objectives (mg m-3) (a)
|
Air Pollutant
|
Averaging Time
|
|
|
1 Hour (b)
|
8 Hour (c)
|
24 Hour (c)
|
1 Year (d)
|
|
Total Suspended Particulates (TSP)
|
-
|
-
|
260
|
80
|
|
Respirable Suspended Particulates (RSP) (e)
|
-
|
-
|
180
|
55
|
|
Sulphur Dioxide (SO2)
|
800
|
-
|
350
|
80
|
|
Nitrogen Dioxide (NO2)
|
300
|
-
|
150
|
80
|
|
Carbon Monoxide (CO)
|
30,000
|
10,000
|
-
|
-
|
|
Notes:
(a)
Measured
at 298K (25°C) and 101.325 kPa (one
atmosphere)
(b)
Not
to be exceeded more than three times per year
(c)
Not
to be exceeded more than once per year
(d)
Arithmetic
means
(e)
Suspended
airborne particulates with a nominal aerodynamic diameter of 10 micrometres
or smaller
|
The Technical Memorandum on
Environmental Impact Assessment Process (EIAO-TM) also includes an hourly TSP criterion of 500 mg m-3 for construction dust
impacts and an odour criterion of 5 Odour Units (OUs)
for a 5-second averaging period for odour impact assessment.
The criteria outlined in Table 4.2a and in the EIAO-TM were used to assess the
potential air quality impacts associated with the Extension.
The measures set out in the Air Pollution Control (Construction Dust)
Regulations should be followed to reduce dust impacts from this Project.
If a stone crushing plant of a capacity
greater than 5,000 tonnes per year is needed, a licence must be obtained under
the Air Pollution Control (Specified
Process) Regulation and the control measures set out in the Guidance Note on the Best Practicable Means
for Mineral Works (Stone Crushing Plants) (BPM 11/1) should be followed.
Should the fuel consumption rate of a
premises/process with chimney emission exceed the specified fuel consumption
rates stated in the Air Pollution Control
(Furnaces, Ovens and chimneys) (Installation and Alternation) Regulations,
an approval of chimney installation/alternation should be obtained from the EPD
prior to the operation.
4.2.2
Air Pollutants Not Covered by HKAQOs
For those pollutants not covered by the HKAQOs, health risk criteria recommended in the
international guidelines, such as those promulgated by the World Health
Organisation (WHO), the United States Environmental Protection Agency
(US EPA) and the California Air Resources Board (CARB) have been
considered. The criteria/guideline
values were selected in the following order of preference:
·
WHO;
·
US
EPA; and
·
CARB.
Cancer Health Risk Assessment
Of the non-criteria substances emitted during
the operation/restoration and aftercare phases, benzene and vinyl chloride are
considered carcinogenic. Table
4.2b shows the Unit Risk Factors (URFs) for the
carcinogenic substances considered in this assessment.
Table 4.2b Guideline
Unit Risk Factors for Carcinogenic Substances
|
Substance
|
Unit Risk Factor (mg m-3)-1
|
|
Benzene
|
7.8x10⁻⁶ (a)
|
|
Vinyl Chloride
|
8.8x10⁻⁶ (b)
|
|
Notes:
(a)
Reference
to US EPA – Integrated Risk Information System – On-line data as in October
2007. The URF of benzene is in a
range of 2.2x10⁻⁶ – 7.8x10⁻⁶ per mg m-3. Upper range of URF is adopted for the
worst case assessment
(http://cfpub.epa.gov/iris/quickview.cfm?substance_nmbr=0276).
(b)
Reference
to US EPA – Integrated Risk Information System – On-line data as in October
2007. The URFs
of vinyl chloride are 4.4x10⁻⁶ per mg m-3 for the exposure during
adulthood and 8.8x10⁻⁶ per mg m-3 for the exposure from birth. Higher URF is adopted for the worst
case assessment (http://cfpub.epa.gov/iris/quickview.cfm?substance_nmbr=1001).
|
The risk assessment guidelines for
assessing the carcinogenic health risks from exposure to air toxics are
summarised in Table 4.2c.
Table 4.2c Risk
Assessment Guidelines for the Assessment of Carcinogenic Health Risks
|
Acceptability of Cancer
Risk
|
Estimated Individual
Lifetime Cancer Risk Level
|
|
Significant
|
> 10-4
|
|
Risk should be reduced to As Low As Reasonably
Practicable (ALARP)
|
> 10-6 – 10-4
|
|
Insignificant
|
£ 10-6
|
Non-Cancer Health Risk Assessment
Benzene and vinyl chloride have the
potential to cause chronic and/or acute impacts for long and/or short-term
exposures, respectively. The
reference chronic and acute concentrations of these pollutants are summarised
in Table 4.2d.
Table 4.2d Guideline
Values for Chronic and Acute Reference Concentrations
|
Substance
|
Chronic Reference Concentration (Annual Average in mg m-3)
|
Acute Reference Concentration (Hourly Average in mg m-3)
|
|
Benzene
|
30 (a)
|
1,300 (b)
|
|
Vinyl Chloride
|
100 (a)
|
1.8x10⁵ (b)
|
|
Notes:
(a)
US
EPA – Integrated Risk Information System – On-line data as in October 2007
(b)
California
Environmental Protection Agency, Air Resources Board (ARB)/Office of
Environmental Health Hazard Assessment (OEHHA)
(http://www.oehha.ca.gov/air/acute_rels/allAcRELs.html).
|
The risk assessment guidelines also recommend
criteria to assess the acceptability of chronic and acute non-cancer health
risks and these are summarised in Tables 4.2e and 4.2f,
respectively.
Table 4.2e Acceptability
of Chronic Non-Cancer Health Risks
|
Acceptability
|
Assessment Results (a)
|
|
Chronic non-cancer risks are considered
“Insignificant”
|
ACA £ RCc
|
|
Chronic non-cancer health risks are
considered “Significant”.
A more detailed assessment of the control requirements and further mitigation
measures are needed.
|
ACA > RCc
|
|
Note:
(a)
ACA
and RCc represent annual average
concentration and chronic reference concentration, respectively.
|
Table 4.2f Acceptability
of Acute Non-cancer Health Risks
|
Acceptability
|
Assessment Results (a)
|
|
Acute non-cancer risks are considered “Insignificant”
|
ACHM £ RCA
|
|
Acute non-cancer health risks are considered “Significant”. A more detailed assessment of the
control requirements and further mitigation measures are needed.
|
ACHM > RCA
|
|
Note:
(a)
ACHM
and RCA represent hourly average and acute reference
concentrations, respectively.
|
4.3.1
Baseline Conditions
The proposed Extension is located to the south
of the existing SENT Landfill. The
TKOIE is located to the north west
of the Extension (see Figure 4.4a). The TKO Area 137 Fill Bank currently
occupies part of the Extension site and the area south of the Extension. TKO Area 137 has been zoned for
industrial activity (Deep Waterfront Industry) according to the Outline Zoning
Plan (OZP) No. S/TKO/15 gazetted in November 2004.
No residential dwellings have been
identified within 500m of the Extension site boundary. The nearest residential use (LOHAS
Park), which is under construction, is located at about 1.8 km from the
Extension site boundary.
The existing air quality in the vicinity
of the Extension is affected by:
·
Emissions
from facilities in the TKOIE;
·
Dust,
odour and stack emissions from the SENT Landfill;
·
Dust
nuisance from TKO Area 137 Fill Bank;
·
Vehicular
emissions on Wan Po Road (both to and from the SENT Landfill and TKO Area 137
Fill Bank); and
·
Background
air quality in the Pearl River Delta.
During the operation of the Extension, the
existing SENT Landfill will be closed.
A capping system which will comprise (from bottom to top), as soil
layer, a non-woven geotextile, an HDPE liner
(impermeable liner), a sub-soil drainage layer and a final cover soil layer,
will be installed. The LFG and leachate generated from the existing SENT Landfill will be
collected by the leachate and LFG collection system
and conveyed to the new LTP and LFG treatment facility for treatment. Therefore, no odour will be anticipated
to be emitted from the restored area of the existing SENT Landfill.
4.3.2
Background Air Quality
EPD does not operate any Air Quality
Monitoring Stations (AQMSs) in the Tseung Kwan O area.
For TSP, RSP, NO2
and SO2, the past six years (2001 - 2006) of air pollutant data([1]) recorded at the Kwun Tong
AQMS (see Table 4.3a), which is the
nearest EPD AQMS to the Extension, have been used to characterise the
background air quality for the impact assessment. For CO, the past six years (2001 – 2006)
of air pollutant data recorded at the Mongkok AQMS
have been used as no CO monitored at Kwun Tong AQMS.
Table 4.3a Background
Air Quality
|
Air Pollutant
|
Background Concentration (mg m-3)
|
|
Total Suspended
Particulates (TSP)
|
78 (a)
|
|
Respirable Suspended Particulates (RSP)
|
57 (a)
|
|
Nitrogen Dioxide (NO2)
|
66 (a)
|
|
Sulphur Dioxide (SO2)
|
18 (a)
|
|
Carbon Monoxide (CO)
|
1,294 (b)
|
|
Benzene
|
2.1 (c)
|
|
Vinyl Chloride
|
5.1 (c)
|
|
Notes:
(a)
From
six years (2001-2006) annual average data on air pollutant concentrations
measured at the EPD Kwun Tong AQMS (http://www.epd-asg.gov.hk/english/report/aqr.php).
(b)
Since
no CO data is recorded at EPD Kwun Tong AQMS,
therefore, the CO data recorded at Mongkok AQMS is
used.
(c)
Reference
to Table 4.5f. The maximum average benzene and vinyl
chloride concentrations measured at the ambient VOC monitoring stations at the
existing SENT Landfill for the past 5 years (2002 – 2006) were used.
|
Ambient benzene and vinyl chloride
concentrations are measured at the ambient monitoring stations at the existing
SENT Landfill. The locations of the
ambient monitoring stations are shown in Figure 4.3a. In accordance with the Environmental
Management Plan (EMP) of the existing SENT Landfill, benzene and vinyl chloride
levels are measured at quarterly intervals. The measured data of benzene and vinyl
chloride at the existing SENT Landfill monitoring stations were used to
establish the background concentrations of these pollutants in the Study Area
(see Table 4.3a).
As the existing SENT Landfill will be closed
during the operation of the Extension, there will be no other similar odour
sources identified within 500m of the Extension site boundary. Hence, no background odour is
anticipated.
Table
4.4a and Figure
4.4a show the ASRs or those buildings that may be affected. Representative ASRs were identified in
line with the requirements set out in the EIA
Study Brief (ESB-199/2004) and
Annex 12 of the EIAO-TM. The list includes existing and planned buildings within
500m of the Extension and ASRs along the Wan Po Road and Chiu Shun Road, in
accordance with the requirements of Section
3.4.1.2 of the EIA Study Brief. Planned developments were identified
with reference to the latest Outline Zoning Plans (No. S/TKO/15 gazetted in
November 2004).
For the assessment of construction dust
and gaseous emission, the Study Area is defined as 500m from the Extension site
boundary.
Table 4.4a Identified
Representative Air Sensitive Receivers
|
ASR
|
Location
|
Approx. Distance from Extension
Site Boundary (m)
|
Type of Uses (a)
|
Approx. Max. Height above Ground
(m)
|
Construction Dust (d)
|
Gaseous Emission (d)
|
Odour
|
|
A1-1
|
Proposed
C&DM Handling Facility
|
150
|
I
|
30
(c)
|
Ö
|
Ö
|
Ö
|
|
A1-2 (1)
|
Planned
Industrial Uses in TKO 137 (south of Extension) – 1
|
10
|
I
|
30
(c)
|
Ö
|
Ö
|
Ö
|
|
A1-2 (2) (b)
|
Planned
Industrial Uses in TKO 137 (south of Extension) – 2
|
200
|
I
|
30
(c)
|
Ö
|
Ö
|
Ö
|
|
A1-3 (1)
|
Planned
Industrial Uses in TKO 137 (south of TVB City) – 1
|
90
|
I
|
30
(c)
|
Ö
|
Ö
|
Ö
|
|
A1-3 (2) (b)
|
Planned
Industrial Uses in TKO 137 (south of TVB City) - 2
|
200
|
I
|
30
(c)
|
Ö
|
Ö
|
Ö
|
|
A2
|
TVB City
|
110
|
C
|
30
|
Ö
|
Ö
|
Ö
|
|
A3
|
HAESL
|
410
|
I
|
30
|
Ö
|
Ö
|
Ö
|
|
A4
|
HAECO
Component Overhaul Building
|
470
|
I
|
30
|
Ö
|
Ö
|
Ö
|
|
A5
|
Exhibition
Services & Logistics Centre
|
690
|
I
|
30
|
-
|
-
|
Ö
|
|
A6
|
Gammon
Skanska
|
950
|
I
|
30
|
-
|
-
|
Ö
|
|
A7
|
Yan
Hing Machinery Industrial Building
|
400
|
I
|
30
|
Ö
|
Ö
|
Ö
|
|
A8
|
Apple
Daily
|
505
|
C
|
30
|
Ö
|
Ö
|
Ö
|
|
A9
|
Mei Ah
Industrial Building
|
530
|
I
|
30
|
-
|
-
|
Ö
|
|
A10
|
Asia
Netcom
|
590
|
C
|
30
|
-
|
-
|
Ö
|
|
A11
|
Wellcome
Storage
|
580
|
I
|
30
|
-
|
-
|
Ö
|
|
A12
|
Avery
Dennison Machinery
|
600
|
I
|
30
|
-
|
-
|
Ö
|
|
A13
|
Hitachi
|
700
|
I
|
30
|
-
|
-
|
Ö
|
|
A14
|
Next
Media Co. Ltd
|
740
|
C
|
30
|
-
|
-
|
Ö
|
|
A15
|
Varitronix
|
850
|
I
|
30
|
-
|
-
|
Ö
|
|
A16
|
Four Seas
Food Processing Co. Ltd
|
1,060
|
I
|
30
|
-
|
-
|
Ö
|
|
A17
|
Committed
HSBC Office
|
1,000
|
C
|
30
|
-
|
-
|
Ö
|
|
A18
|
Eastern
Pacific Electronics
|
1,250
|
I
|
30
|
-
|
-
|
Ö
|
|
A19
|
Committed
Tung Wah Group of Hospital Aided Primary & Secondary
School
|
1,470
|
E
|
20
|
-
|
-
|
Ö
|
|
A20
|
LOHAS
Park
|
1,830
|
R
|
200
|
-
|
-
|
Ö
|
|
A21
|
Chiaphua-Shinko
Centre
|
1,860
|
I
|
30
|
-
|
-
|
Ö
|
|
A22
|
Shaw Film
Studios
|
2,290
|
C
|
30
|
-
|
-
|
Ö
|
|
A23
|
Oscar by
the Sea
|
3,160
|
R
|
170
|
-
|
-
|
Ö
|
|
A24
|
Tseung
Kwan O Sport Ground
|
3,810
|
Rec
|
1.5
|
-
|
-
|
Ö
|
|
A25
|
Tseung
Kwan O Town Park
|
4,050
|
Rec
|
1.5
|
-
|
-
|
Ö
|
|
A26
|
Leung
Sing Tak Primary School
|
4,010
|
E
|
20
|
-
|
-
|
Ö
|
|
A27
|
Nan Fung
Plaza
|
4,070
|
R
|
130
|
-
|
-
|
Ö
|
|
A28
|
St
Andrew’s Church
|
4,160
|
Church
|
20
|
-
|
-
|
Ö
|
|
A29
|
Fung Ching Memorial Primary School
|
4,190
|
E
|
20
|
-
|
-
|
Ö
|
|
A30
|
On Ning Garden
|
4,260
|
R
|
120
|
-
|
-
|
Ö
|
|
A31
|
Sheung
Ning Playground
|
4,240
|
Rec
|
1.5
|
-
|
-
|
Ö
|
|
A32
|
Tseung
Kwan O Swimming Pool
|
4,530
|
Rec
|
1.5
|
-
|
-
|
Ö
|
|
A33
|
La Cite
Noble
|
3,930
|
R
|
140
|
-
|
-
|
Ö
|
|
A34
|
Yuk Ming
Court
|
3,980
|
R
|
110
|
-
|
-
|
Ö
|
|
A35
|
Ming Tak Estate
|
4,130
|
R
|
110
|
-
|
-
|
Ö
|
|
A36
|
Tin Ha Wan
Village
|
3,950
|
R
|
10
|
-
|
-
|
Ö
|
|
A37
|
Tseung
Kwan O Hospital
|
4,260
|
Hospital
|
25
|
-
|
-
|
Ö
|
|
A38
|
Ocean
Shore Phase I
|
3,900
|
R
|
160
|
-
|
-
|
Ö
|
|
A39
|
Choi Ming
Estate, Choi Yiu Court
|
3,820
|
R
|
155
|
-
|
-
|
Ö
|
|
A40
|
Park Central
Block 1
|
3,530
|
R
|
185
|
-
|
-
|
Ö
|
|
A41
|
Bauhinia
Garden Block 5
|
3,200
|
R
|
165
|
-
|
-
|
Ö
|
|
A42
|
Heng Fa Chuen
|
3,300
|
R
|
70
|
-
|
-
|
Ö
|
|
A43
|
Island Resort
|
2,400
|
R
|
160
|
-
|
-
|
Ö
|
|
Notes:
(a) I
= Industrial premises, R = Residential developments, C = Commercial premises,
and Rec = Recreational facilities
(b) As
the type of industrial uses in the TKO Area 137 is not available (except the
C&DM Handling Facility) at the time of the EIA Study, the HKPSG recommended
setback distance of 200m from the major odour source (ie
the SENT Landfill Extension) is included. The potential air quality impact
within and outside the 200m buffer area has been assessed.
(c) Planning
Department has been consulted with respect to the building height restriction
of TKO Area 137. It was agreed
that the consultant should assume that the maximum height of the buildings at
TKO Area 137 will be 30m.
(d) Representative
ASRs within 500m from the Extension site boundary will be included in the
assessment of the construction dust impact and impact due to gaseous
emission.
|
4.5.1
Construction Phase
Nuisance from dust generating activities
has the potential to arise during construction. The major construction works include
blasting, slope stabilization, excavation and filling, site formation, stone
crushing and vehicle movements on the site. Blasting, materials handling during
slope cutting and site formation, rock crushing and wind erosion of the filled
area will be the major dust generating activities during the construction of
the Extension. The construction works area is shown in Figure 4.5a.
Blasting will
take place for the slope cutting at the area currently occupied by the TKO Area
137 for about 107 days between the third quarter of 2011 and end of 2012. One blast will be made each day. A total of about 320,000 m3
of rock will be generated and approximately 3,000 m3 of rock will be
generated per day. It should be
noted that all construction works will be ceased during the blasting due to
site constraint and safety reason.
Due to limited space
at the Extension site, most of the rocks will be exported off-site. A small rock crushing plant will be
employed on-site to crush the blasted rocks (about 155,800 m3) into
25mm – 100mm in size and used as leachate drainage
stones for the Project and the rest of the blasted rock will be broken down to
about 250 mm in size for disposal off-site. During this process, watering will be
carried out and no fugitive emission will be generated. Dust will be generated from the rock
crushing activities screening and at the conveyor transfer point. With the provision of enclosure for the
conveyor belt and watering at the conveyor transfer point, no fugitive dust
emission is anticipated. Other dust
control measures recommended in the Guidance
Note on the Best Practicable Means for Mineral Works (Stone Crushing Plants)
(BPM 11/1) will also be implemented at the rock crusher, and hence dust
will only be emitted from the crushing and screening processes.
Should the processing capacity of the rock
crusher exceeded 5,000 tonnes per day, it will be classified as a Specified
Process (SP) and a licence will be required for the operation under the Air Pollution Control (Specified Process)
Regulations.
About 770,000 m3
of excavated soil will also be generated during the slope cutting period
between the third quarter of 2011 and end of 2012 (around one and a half
years). Some of which will be
reused for site formation works (about 475,000 m3). Due to limited space at the Extension, a
small portion of the surplus soils (10,000 m3) will be stockpiled
on-site for subsequent use as daily or intermediate cover materials for the
Phase 1 operation of the Extension.
Throughout the construction period, good
site practices and dust control measures stipulated in the Air Pollution Control (Construction Dust) Regulations will be
implemented to reduce the dust emission as much as possible. The site-specific good site practices
and dust control measures are recommended in Section 4.8.1.
4.5.2
Operational/Restoration Phase
Section
3 details the activities
that will take place during operation and restoration of the Extension. As the restoration will take place
progressively, whilst operations are ongoing on other parts of the site, these
two phases have been considered together in the assessment.
The potential sources of air quality and
odour impacts arising from the Extension during the operational/restoration
phase include:
·
Gaseous
emissions from the new LFG treatment facility, the thermal oxidizer of the LTP
and generator at the new infrastructure area;
·
Vehicular
emissions from traffic associated with the Extension;
·
Fugitive
emissions from the active tipping face; and
·
Odour
emissions arising from Waste Filling Activities and Operation of LTP.
Gaseous Emissions from the LFG Treatment Facility
LFG is a by-product of the
waste decomposition process when this takes place under anaerobic
conditions. Typically, this
comprises methane (CH4), carbon dioxide (CO2) and trace
amounts of other gases (eg volatile organic compounds
(VOCs), hydrogen sulphide (H2S),
etc). The proportions of these
compounds vary over the life of the landfill and from landfill to
landfill. The quantity also varies
from little or none in the early years of operation, rising to a peak during
the operational period, before gradually declining over time following
restoration of the landfill.
During the operation/restoration phase,
the majority of the LFG generated will be collected by the extensive LFG
collection system and used on-site (as the first priority) or flared off. The LFG will be pre-treated (removal of
moisture) prior to utilization or flaring in order to minimize corrosion to the
equipment.
The LFG
treatment facility will comprise two flares (each with a maximum capacity of
10,000 m3 hr-1) located at the south-eastern
boundary of the site (see Figure 4.5b). During the operation/restoration phase,
the LFG collected will mainly be used in the LTP and LFG generator (IMW) to
supply power for the facilities in the Infrastructure Area and the remainder
will be diverted to the on-site utilization plant or flares at the LFG
treatment facility. Based on the
outline design of the LTP, the plant will consume a maximum of 3,125 m3
of LFG per hour and the LFG generator will consume about 1,500 m3 of
LFG per hour. If not utilized for
other beneficial uses, the remaining LFG (a maximum of 15,375 m3 hr-1)
will be flared. For the worst case
assessment, it is assumed that the LFG flares will be operated at their maximum
design capacity (ie 10,000 m3 hr-1 each). The combustion temperature of the flares
will be about 850°C. At
this temperature, methane, VOCs and the trace
pollutants (such as H2S) will be oxidised and destroyed. After flaring, trace amount of nitrogen
dioxide (NO2), carbon monoxide (CO), sulphur dioxide (SO2)
from the oxidation of H2S, benzene, vinyl chloride and non-methane
organic compound (NMOCs) will be emitted and the
potential impacts of these air pollutants have been assessed in the following
section.
The diameter and height of each flare
stack will be 3.8m and 25m above the ground, respectively. The exit flowrate
and velocity of the exhaust gas for each flare will be about 499,582 m3 hr-1
and 12.24 m s-1 at 850°C.
Table 4.5a shows the
performance standards to which the flares will be operated to maintain a
destruction efficiency of at least 99%.
Table 4.5a Designed
Performance Standards of the LFG Flare
|
Parameter
|
Performance Standards
|
|
Emission
limit for nitrogen oxides (NOx)
|
11.28
mg m-3 (a) (b)
|
|
Emission
limit for carbon monoxide (CO)
|
28.19
mg m-3 (a) (b)
|
|
Emission
limit for sulphur dioxide (SO2)
|
1.55
mg m-3 (a)
|
|
Emission
limit for benzene
|
2.98x10⁻³
mg m-3 (a) (c)
|
|
Emission
limit for vinyl chloride
|
1.88x10⁻³
mg m-3 (a) (c)
|
|
No.
of flares
|
2
|
|
Stack
height
|
25
m
|
|
Stack
diameter
|
3.8
m
|
|
Exit
temperature (d)
|
850°C
|
|
Exhaust
gas flowrate
|
499,582
m3 hr-1 (a)
|
|
Exhaust
gas velocity
|
12.24
m s-1
|
|
Notes:
(a)
Emission limit of air pollutant in exhaust gas. For SO2, please refer to Annex A1 for detailed calculations.
(b)
Emission limits were estimated based on the
specification of flares operating in the existing SENT Landfill.
(c)
Emission limits for benzene and vinyl chloride were
estimated from the maximum concentrations of benzene and vinyl chloride in
raw LFG measured at the inlet of the flare at the existing SENT
Landfill. The maximum emissions
of vinyl chloride and benzene were 4.4 ppm and 5.6 ppm, respectively.
In accordance with the existing SENT Landfill Contract Specification,
at least 99% of VOC destruction efficiency should be maintained. The emission limits are estimated
based on the emission concentrations in the inlet, LFG flowrate,
exhaust flowrate and the VOC removal
efficiency. Please refer to Annex A1 for the detailed
calculations.
|
Gaseous Emissions from Thermal Oxidizer of
LTP
Leachate will be collected from the Extension and
the restored existing SENT Landfill and pumped to the LTP in the new
infrastructure area. The LTP will
consist of four buffer storage tanks, two ammonia stripping towers and two
thermal oxidisers (ie, one duty and one standby), a
stripped leachate storage tank, two SBR tanks and a
sludge holding tank. Except for the
SBRs, all tanks will be enclosed and the air exhaust
from the tanks will be diverted to the thermal oxidiser as part of the air
intake.
The raw leachate
will be stripped in the ammonia stripping towers. The ammonia laden air and the exhaust
air of the enclosed tanks will be oxidised and destroyed in the thermal
oxidiser (which will operate at 850°C) prior to discharge to the
atmosphere. Under this combustion
temperature, the ammonia gas will be completely destroyed ().
LFG will be used
as a fuel for the thermal oxidiser.
The estimated maximum LFG consumption will be 3,125 m3 hr-1
assuming that the LTP is operating at its maximum capacity of 1,500 m3d-1
([3]), and 50 m3 of LFG is required
for each cubic metre of leachate treated. A worst case assumption has been adopted
whereby the emissions of nitrogen oxides (NOx),
sulphur dioxide (SO2) (product of decomposition of any residual H2S
at high temperature), carbon monoxide (CO), benzene, vinyl chloride and NMOCs are assumed to be same as those for the flares (see Table 4.5a).
The physical parameters and emission data
of thermal oxidiser are summarized in Table
4.5b.
Table 4.5b Stack
Emissions and Physical Parameters of the Thermal Oxidiser
|
Parameter
|
Thermal Oxidiser of the LTP
|
|
Emission limit
for NOx
|
28.4 mg m-3
(a)
|
|
Emission limit
for CO
|
70.91 mg m-3
(a)
|
|
Emission limit
for SO2
|
3.9 mg
m-3 (a)
|
|
Emission limit for
benzene
|
7.51x10⁻³
mg m-3 (a)
|
|
Emission limit
for vinyl chloride
|
4.73x10⁻³ mg
m-3 (a)
|
|
No. of Stack
|
2 (one duty and
one standby)
|
|
Stack height
|
9.76 m (c)
|
|
Stack diameter
|
1.12 m (c)
|
|
Exit
temperature
|
171.6 °C (c)
|
|
Exhaust gas velocity
|
17.5 m s-1
(c)
|
|
Exhaust gas flowrate
|
62,068 m3
hr-1
|
|
Notes:
(a)
All emission limits are under its exhaust gas
condition.
(b)
Refer to the detailed calculations presented in Annex A1.
(c)
With reference to the design of the Thermal Catalytic
Units of the existing Bioplant at SENT Landfill.
|
Gaseous Emissions from LFG Generator
A generator fuelled by LFG will be
installed to provide power for on-site plant and equipment. Taking account of the anticipated power requirements
of the infrastructure area of the Extension, the capacity of the generator will
be about 1MW which is similar to the generator used in the existing SENT
Landfill. The physical parameters
and emission data of generator, reference to the LFG generator operating in the
existing SENT Landfill, are summarized in Table
4.5c.
Table 4.5c Stack
Emissions and Physical Parameters of the LFG Generator
|
Parameter
|
LFG Generator
|
|
Engine power
|
1MW (a)
|
|
LFG input to
generator
|
1,500 m3 hr-1
(a)
|
|
Emission limit
for NOx
|
0.14 lb mmBTU-1
(b)
|
|
Emission limit
for CO
|
0.44 lb mmBTU-1
(b)
|
|
Emission limit
for SO2
|
0.045 lb mmBTU-1
(b)
|
|
Emission limit
for benzene
|
2.1x10⁻⁵
lb mmBTU-1 (b)
|
|
Emission limit
for vinyl chloride
|
1.6x10⁻⁶
lb mmBTU-1 (b)
|
|
No. of Stack
|
2 (one duty and
one standby)
|
|
Stack height
|
28 m
|
|
Stack diameter
|
0.305 m (a)
|
|
Exit
temperature
|
454°C (a)
|
|
Exhaust gas
velocity
|
48.6 m s-1
(a)
|
|
Notes:
(a)
Reference to the generator being operated at the
existing SENT Landfill.
(b)
Reference to the Compilation
of Air Pollutant Emission Factors, AP-42, 5th Edition, Table 3.1-1
and 3.1-2b.
|
Summary: Under normal operations, LFG collected from the Extension
will be primarily used as fuel for the LTP and generator. The remainder will be utilised or
flared. Table 4.5d summarises the emission data of each facility and the
location of these facilities is shown in Figure 4.5b. The detailed calculation is
summarized in Annex A1.
Table 4.5d Summary
of Gaseous Emission Inventory for the Flares and Thermal Oxidiser During Operation/Restoration Phase (a)
|
Parameter
|
Flare
|
Thermal Oxidiser
|
LFG Generator
|
|
No. of emission points
|
2
|
1 (one duty and one standby)
|
1 (one duty and one standby)
|
|
Stack height (m)
|
25
|
9.76
|
28
|
|
Stack diameter (m)
|
3.8
|
1.12
|
0.305
|
|
Exhaust gas velocity (m s-1)
|
12.24
|
17.5
|
48.6
|
|
Exhaust gas flowrate (m3
s-1)
|
499,582
|
62,068
|
12,780
|
|
Exit temperature (°C)
|
850
|
171.6
|
454
|
|
Emission limit for NOx
(b)
|
11.28 mg m-3
|
28.4 mg m-3
|
0.14 lb mmBTU-1
|
|
Emission limit for CO (b)
|
28.19 mg m-3
|
70.91 mg m-3
|
0.44 lb mmBTU-1
|
|
Emission limit for SO2 (b)
|
1.55 mg m-3
|
3.90 mg m-3
|
0.045 lb mmBTU-1
|
|
Emission limit for benzene (b)
|
2.98x10⁻³ mg m-3
|
7.51x10⁻³ mg m-3
|
2.1x10⁻⁵ lb mmBTU-1
|
|
Emission limit for vinyl chloride (b)
|
1.88x10⁻³ mg m-3
|
4.73x10⁻³ mg m-3
|
1.6x10⁻⁶ lb mmBTU-1
|
|
Emission rate for NO2 (g s-1)
|
0.31 (c)
|
0.10 (c)
|
0.11 (c)
|
|
Emission rate for CO (g s-1)
|
3.91
|
1.22
|
1.721
|
|
Emission rate for SO2 (g s-1)
|
0.22
|
0.07
|
0.176
|
|
Emission rate for benzene (g s-1)
|
4.14x10⁻⁴
|
1.29x10⁻⁴
|
8.22x10⁻⁵
|
|
Emission rate for vinyl chloride (g s-1)
|
2.61x10⁻⁴
|
8.15x10⁻⁵
|
6.26x10⁻⁶
|
|
Notes:
(a)
Detailed calculations are summarized in Annex A1.
(b)
All emission limits are under its exhaust gas
condition.
(c)
Assuming 20% of NOx
is NO2.
|
Vehicular Emissions from Traffic
Associated with the Extension
The waste arising forecast indicates that
a maximum of 134 vehicles per hour() will be generated from the operation of the
Extension which will be about 19% on the Wan Po Road south of Chung Wang Street
and about 2.4% on the Wan Po Road south of Pak Shing Kok Road as compared to forecasted background traffic in
2018 (refer to Annex B2-3). It is anticipated that this limited
increase in traffic flow will not result in adverse air quality impacts at the
identified ASRs.
Fugitive Emissions at Landfilling
Area in the Extension
The landfill activities during the
operation/restoration phase of the Extension will generate fugitive dust and
gaseous emissions from (1) the construction of drainage channels and sumps, LFG
and leachate extraction wells and collection systems;
(2) haul roads; and (3) operation of the construction equipment. Landfill surface emission from the
active tipping face is also a potential fugitive emission source.
Fugitive
Dust Emissions: Fugitive dust will be emitted from the
placement of cover materials, construction of LFG and leachate
collection pipes and wells, traffic movements on the unpaved haul roads and
traffic movements at the waste reception area. The quantities of soil and rock to be
handled for different phases of the Extension are summarized in Table 4.5e.
Table 4.5e Total
Soil and Rock Fill Requirements
|
Phase
|
Total Fill Requirement (m3)
|
Fill Requirement Per Day (m3d-1)
(a)
|
|
|
Soil
|
Rock
|
Soil
|
Rock
|
|
1
|
365,600
|
60,500
|
1,000
|
165.8
|
|
2
|
453,100
|
60,500
|
1,240
|
165.8
|
|
3
|
478,700
|
60,500
|
1,310
|
165.8
|
|
4
|
557,900
|
60,500
|
1,530
|
165.8
|
|
5
|
590,800
|
60,500
|
1,620
|
165.8
|
|
6
|
658,800
|
60,500
|
1,800
|
165.8
|
|
Total
|
3,104,900
|
363,000
|
-
|
-
|
|
Note:
(a)
For each phase, no. of day is 365.
|
The management of fugitive dust at the Extension
will be similar to that being implemented at the existing SENT Landfill and
will include immediate compaction of the fill area; regular damping down of the
surface of the haul road; provision of vehicle washing facility for RCVs at the exit of the Extension (to ensure no significant
dust will be brought onto the public road); and regular cleaning of the main
access road and waste reception area by road sweeper.
Although the lining of side slopes will be
carried out concurrently with the waste tipping operation, no earthworks will
be required for the slope lining works.
Hence, there will be no cumulative dust impacts for these activities.
At the existing SENT Landfill, the average
ambient daily TSP concentration record at the ambient TSP monitoring stations
located at the site boundary ()
over the past five years
(2002-2006) was 89 µg m-3.
There were no exceedances of the daily dust
criterion of 260 µg m-3 due to the operation of the landfill.
As the majority of the Extension site will
be covered with impermeable liner, the potential areas from which dust can be
generated will be much lower when compared with the existing SENT Landfill
operation. Hence, it is anticipated
that the potential dust to be generated due to the operation of the Extension
will be much lower than that from the operation of the existing SENT
Landfill. With the implementation
of the dust control measures recommended in Section
4.8.2, it is expected that the TSP concentrations at the Extension site
boundary during the operation/restoration phase will be well below the daily
dust criterion and there will be no adverse dust impacts to the identified
ASRs.
Gaseous
Emissions from Construction Plant: Gaseous emissions such as nitrogen dioxide
(NO2) and sulphur dioxide (SO2) will be generated from
the operation of diesel-fuelled construction for the following activities.
·
Construction of drainage channels and
sumps – transportation of
materials, bar bending and cutting as well as concreting;
·
Road
construction – transportation
of materials, grading, road rolling;
·
Deposition
and compaction of waste –
transportation, deposition and compaction of waste;
·
Placement
and removal of daily covered materials – by excavator, bulldozer,
dump truck, vibratory roller and loader; and
·
Capping
and landscaping (progressive restoration) – by bulldozer, dump truck,
vibratory roller, loader and mobile crane.
These plants will be located across the
site, depending on need. The
nearest representative ASR, TVB City, is located at about 110 m away from the
nearest construction site boundary.
The total gaseous emissions generated by the plant over the construction
site area (ie, 20ha) are small and it will disperse
and diluted with the ambient air very rapidly. Therefore, the potential air quality
impact associated with operation of the construction plant on the identified
ASRs is envisaged to be limited and minor.
Emissions
of LFG including VOCs from Landfill Surfaces:
The predicted LFG generation rates have been discussed in Section 8.5.1. The LFG management system is designed to
collect LFG generated from the Extension as early as possible. Except the active tipping face and the
special waste trench, all the areas will be covered by 600mm of soil and an
impermeable liner. In addition to
the vertical LFG collection wells, a number of horizontal LFG collection wells
will be installed above the leachate drainage layer
and within the waste mass. The
majority of LFG will be captured by the collection system.
The composition
of LFG is anticipated to be similar to that from the existing SENT landfill,
given that the waste types accepted will be similar.
Samples obtained from the LFG abstraction
wells of the existing SENT Landfill contain about 40 to 60% methane, 30 to 45%
carbon dioxide and a trace amount of VOCs ().
In 2005 and 2006, out of the 39 VOCs ()
analysed, only dichlorodifluoromethane, vinyl
chloride, dimethyle sulphide, methylene
chloride, benzene, heptanes, trichloroethylene, toluene, octanes,
tetrachloroethylene, ethylbenzene,
xylenes, propyl benzene and
dichlorobenzene were detected. For
most of these, the measured concentrations were in the range 0.01 and 39.7 µg m-3.
The ambient concentrations of the 39 VOCs were also monitored on a quarterly basis at the ambient
air quality monitoring stations at the site boundary. A summary of the measured concentrations
of these 39 VOCs from 2002 to 2006 is presented in Table 4.5f. Benzene, chloroform,
dichlorodifluoromethane, ethylbenzene, methylene chloride, propyl benzene,
toluene and xylene were measured in most of the
samples. However, the
concentrations were well below the respective trigger levels. Other VOCs
were not detected or measured. Exceedances of the trigger levels for chloroform and propyl benzene were detected in one occasion at the ambient
VOC monitoring stations.
Investigations were conducted and it was considered that the abnormal
readings were caused by off-site sources such as vehicle exhaust.
Table 4.5f VOC
Concentrations at Site Boundary and On-site of the Existing SENT Landfill (2002
- 2006)
|
Pollutant
|
Trigger
Level
|
Monitored
VOC Concentration (µgm-3)
|
|
VOC/1
|
VOC/4
|
VOC/6
|
VOC/8
|
On-site
|
|
Min
|
Max
|
Average
|
Min
|
Max
|
Average
|
Min
|
Max
|
Average
|
Min
|
Max
|
Average
|
Min
|
Max
|
Average
|
|
1,1,1-Trichloroethane
|
19,000
|
ND
|
2.3
|
1.2
|
ND
|
2.9
|
1.5
|
ND
|
5.8
|
1.7
|
ND
|
4.1
|
1.2
|
ND
|
4.1
|
1.4
|
|
1,2-Dibromoethane
|
40
|
ND
|
ND
|
ND
|
ND
|
ND
|
ND
|
ND
|
ND
|
ND
|
ND
|
4.4
|
4.4
|
ND
|
ND
|
ND
|
|
1,2-Dichloroethane
|
400
|
ND
|
0.6
|
0.4
|
ND
|
2.1
|
0.9
|
ND
|
1.3
|
0.7
|
ND
|
2.5
|
1.2
|
ND
|
4.4
|
1.7
|
|
Benzene
|
160
|
ND
|
4.4
|
1.0
|
<0.5
|
10.1
|
1.5
|
<0.5
|
25.1
|
2.1
|
<0.5
|
13.1
|
1.5
|
<0.5
|
4
|
1.2
|
|
Butan-2-ol
|
3,000
|
ND
|
ND
|
ND
|
ND
|
ND
|
ND
|
ND
|
ND
|
ND
|
ND
|
ND
|
ND
|
ND
|
ND
|
ND
|
|
Buthanethiol
|
4
|
ND
|
ND
|
ND
|
ND
|
ND
|
ND
|
ND
|
ND
|
ND
|
ND
|
ND
|
ND
|
ND
|
ND
|
ND
|
|
Butyl Benzene
|
ND
|
ND
|
ND
|
ND
|
ND
|
ND
|
ND
|
ND
|
ND
|
ND
|
ND
|
ND
|
ND
|
ND
|
ND
|
ND
|
|
Carbon Disulphide
|
255
|
ND
|
0.9
|
0.9
|
ND
|
41.2
|
26.0
|
ND
|
5.5
|
5.1
|
ND
|
6.7
|
6.7
|
ND
|
6.8
|
6.3
|
|
Carbon Tetrachloride
|
126
|
ND
|
3.5
|
1.1
|
ND
|
0.9
|
0.7
|
ND
|
1.3
|
0.8
|
ND
|
5
|
1.2
|
ND
|
3.8
|
1.6
|
|
Chloroform
|
98
|
ND
|
67
|
9.5
|
ND
|
409.2
|
36.1
|
ND
|
19.1
|
3.4
|
ND
|
30.2
|
11.0
|
ND
|
67
|
17.2
|
|
Decane
|
1,000
|
ND
|
ND
|
ND
|
ND
|
<1
|
<1
|
ND
|
ND
|
ND
|
ND
|
ND
|
ND
|
ND
|
ND
|
ND
|
|
Dichlorobenzene
|
1500
|
ND
|
29
|
4.1
|
ND
|
95
|
19.3
|
ND
|
65
|
5.6
|
ND
|
137
|
13.8
|
ND
|
4
|
1.5
|
|
Dichlorodifluoromethane
|
49,500
|
1
|
37.1
|
3.7
|
ND
|
450
|
27.1
|
ND
|
159.4
|
11.0
|
ND
|
490
|
25.9
|
ND
|
8.1
|
1.9
|
|
Dimethyl Sulphide
|
11
|
ND
|
ND
|
ND
|
ND
|
9.4
|
5.0
|
ND
|
0.7
|
0.7
|
ND
|
ND
|
0.4
|
ND
|
0.2
|
0.2
|
|
Di-n-Propyl
Ether
|
2700
|
ND
|
ND
|
ND
|
ND
|
ND
|
ND
|
ND
|
ND
|
ND
|
ND
|
ND
|
ND
|
ND
|
ND
|
ND
|
|
Ethanethiol
|
1
|
ND
|
ND
|
ND
|
ND
|
ND
|
ND
|
ND
|
ND
|
ND
|
ND
|
ND
|
ND
|
ND
|
ND
|
ND
|
|
Ethanol
|
1,900
|
ND
|
ND
|
ND
|
ND
|
ND
|
ND
|
ND
|
ND
|
ND
|
ND
|
ND
|
ND
|
ND
|
ND
|
ND
|
|
Ethyl Butyrate
|
-
|
ND
|
ND
|
ND
|
ND
|
ND
|
ND
|
ND
|
ND
|
ND
|
ND
|
ND
|
ND
|
ND
|
ND
|
ND
|
|
Ethyl Propionate
|
ND
|
ND
|
ND
|
ND
|
ND
|
ND
|
ND
|
ND
|
ND
|
ND
|
ND
|
ND
|
ND
|
ND
|
ND
|
ND
|
|
Ethylbenzene
|
1,000
|
ND
|
160
|
14.1
|
ND
|
268
|
28.3
|
ND
|
562
|
32.3
|
ND
|
182
|
17.8
|
ND
|
160
|
16.7
|
|
Heptane
|
16,000
|
ND
|
21.9
|
7.2
|
ND
|
<1
|
0.8
|
ND
|
34
|
17.8
|
ND
|
49
|
17.0
|
ND
|
47.9
|
21.6
|
|
Limonene
|
57
|
ND
|
5.2
|
5.2
|
ND
|
ND
|
ND
|
ND
|
3.5
|
3.5
|
ND
|
2
|
2.0
|
ND
|
ND
|
ND
|
|
Methane
|
-
|
<1
|
480
|
31.2
|
<1
|
250
|
48.7
|
<1
|
97.9
|
21.1
|
<1
|
436.7
|
34.4
|
<1
|
130
|
10.2
|
|
Methanethiol
|
-
|
ND
|
ND
|
ND
|
ND
|
ND
|
ND
|
ND
|
ND
|
ND
|
ND
|
ND
|
ND
|
ND
|
ND
|
ND
|
|
Methanol
|
2,600
|
ND
|
ND
|
ND
|
ND
|
ND
|
ND
|
ND
|
ND
|
ND
|
ND
|
ND
|
ND
|
ND
|
ND
|
ND
|
|
Methyl Butyrate
|
ND
|
ND
|
ND
|
ND
|
ND
|
ND
|
ND
|
ND
|
ND
|
ND
|
ND
|
ND
|
ND
|
ND
|
ND
|
ND
|
|
Methyl Propionate
|
ND
|
ND
|
ND
|
ND
|
ND
|
ND
|
ND
|
ND
|
ND
|
ND
|
ND
|
ND
|
ND
|
ND
|
ND
|
ND
|
|
Methylene Chloride
|
3,500
|
<0.4
|
557.3
|
49.5
|
<0.4
|
174
|
28.9
|
<0.4
|
104.2
|
17.1
|
ND
|
680.6
|
97.9
|
<0.4
|
2885
|
197.5
|
|
n-Butyl Acetate
|
1,500
|
ND
|
ND
|
ND
|
ND
|
ND
|
ND
|
ND
|
ND
|
ND
|
ND
|
ND
|
ND
|
ND
|
ND
|
ND
|
|
Nonane
|
24,000
|
ND
|
5
|
1.8
|
ND
|
29
|
7.9
|
ND
|
<0.9
|
<0.9
|
ND
|
<0.9
|
<0.9
|
ND
|
26
|
16.0
|
|
Octane
|
14500
|
ND
|
13
|
4.5
|
ND
|
3
|
1.8
|
ND
|
37
|
25.9
|
ND
|
30
|
12.2
|
ND
|
14.5
|
6.2
|
|
Propyl Benzene
|
196
|
ND
|
74.9
|
11.1
|
<0.8
|
605.1
|
42.3
|
ND
|
340
|
31.0
|
ND
|
280
|
24.0
|
ND
|
282
|
21.9
|
|
Propyl Propionate
|
56,000
|
ND
|
ND
|
ND
|
ND
|
ND
|
ND
|
ND
|
ND
|
ND
|
ND
|
ND
|
ND
|
ND
|
ND
|
ND
|
|
Terpenes
|
ND
|
ND
|
ND
|
ND
|
ND
|
ND
|
ND
|
ND
|
ND
|
ND
|
ND
|
ND
|
ND
|
ND
|
ND
|
ND
|
|
Tetrachloroethylene
|
3,350
|
ND
|
94.5
|
10.1
|
ND
|
19.5
|
6.3
|
ND
|
24.5
|
3.8
|
ND
|
11.5
|
6.1
|
ND
|
7.5
|
2.7
|
|
Toluene
|
1,880
|
4
|
124
|
24.2
|
<0.5
|
463
|
89.6
|
<0.5
|
1003
|
74.2
|
<0.5
|
423
|
55.0
|
<0.5
|
264
|
50.4
|
|
Trichloroethylene
|
5,350
|
ND
|
2.2
|
1.4
|
ND
|
6
|
3.1
|
ND
|
4.8
|
2.8
|
ND
|
4.4
|
2.0
|
ND
|
<1.2
|
<1.2
|
|
Undecane
|
1,300
|
ND
|
ND
|
ND
|
ND
|
ND
|
ND
|
ND
|
ND
|
ND
|
ND
|
ND
|
ND
|
ND
|
ND
|
ND
|
|
Vinyl Chloride
|
78
|
0.4
|
0.4
|
0.4
|
ND
|
9.5
|
4.2
|
ND
|
36.5
|
5.1
|
ND
|
4.9
|
3.5
|
ND
|
<0.3
|
0.3
|
|
Xylene
|
4,350
|
ND
|
200
|
16.7
|
<0.5
|
479
|
50.1
|
<0.5
|
941
|
54.4
|
<0.5
|
271
|
29.8
|
<0.5
|
200
|
22.8
|
|
Notes:
(a)
“ND” means Not Detectable.
(b)
Bold and underlined
figure indicates the exceedance of the trigger
level.
|
As the majority of the Extension site will
be covered with an impermeable liner and LFG will be extracted via a comprehensive
LFG collection system during the operation phase, it is anticipated that the
fugitive LFG emission from the Extension due to waste tipping activities will
be significantly reduced relative to the existing SENT Landfill. Taking account of the ambient VOC
monitoring results at the existing SENT Landfill, it is expected that the
ambient VOC concentrations at the Extension Site boundary will be well below
the trigger levels for individual compounds. Further dilution of the VOC
concentration is expected due to dispersion off-site. The anticipated VOC concentrations at
the identified ASRs will be minimal and will not cause adverse impacts.
Odour Emissions from Waste Filling
Activities and Operation of LTP
The restoration of the landfill will take place
progressively, whilst operations are ongoing on other parts of the site,
therefore, these two phases have been considered together in the assessment.
Potential sources of odour impact during
operation/restoration phase included:
·
Waste
filling area; and
·
Operation
of the LTP and the LFG treatment facility.
In order to minimize the potential odour
emissions during the operational phase of the Extension, a number of odour
management and control measures have been incorporated into the outline
design. These measures are
summarized in Table 4.8a.
Odour Emissions from
Waste Filling Area
The Extension is scheduled to commence
operation in 2013 and will be designed to receive MSW, special waste ()
and construction waste. By that time, the Sludge Treatment
Facilities (STF) are scheduled to be in operation ()
and sludge from sewage
treatment works (STWs) will be diverted to the STF
for treatment and disposal.
The operational life of the Extension is
expected to be about 6 years. The
Extension will be developed in 6 phases (Phases 1 to 6) and each phase will be
in operation for approximately 1 year.
The ground level of the first phase will be at about +6mPD and the
highest level will be at +150 mPD. The Extension will open to receive
wastes from 8 am to 11 pm every day.
Waste
Reception Area: All incoming and outgoing refuse
collection vehicles (RCVs) will be weighed at the
enclosed weighbridge office at the waste reception area. All RCVs
visiting the Extension are of enclosed-type and expected to comply with
relevant regulations and to be properly maintained, therefore, the potential
odour emission from RCVs and at the waste reception
area are assumed to be minimal.
Active
Tipping Face: After weighing, the RCVs
will be directed to the active tipping face for unloading. The operation at the active tipping face
will be similar to that of the existing SENT Landfill. Two platforms (ie
lower and upper platforms) will be used for separate unloading of MSW (at the
lower platform) and construction waste (at the upper platform). The construction waste will overlay the
MSW. The wastes will be promptly
spread by bulldozer and compacted by a landfill compactor to minimize the
exposure time of MSW thus minimise the opportunity of odour emission to the
atmosphere. The tipping face area
will be 30m x 40m ().
After 11 pm, the Extension will be closed and the compacted waste will
be covered with 300mm of cover soil immediately. Therefore, odour emissions from the
active tipping face are expected during the operating hours; however, the
emissions will be much reduced thereafter.
Special
Waste Trench: A trench will be excavated into the
landfill mass for the disposal of waste that needs special handling. The trench will be located at least 50 m
from the active tipping face and the waste boundary. The trench will only operate when the
waste depth is at least 10m above the base to avoid damage to the leachate collection system. The size of the trench will vary in
accordance with the volume of special waste that has been pre-registered for
disposal by the special waste producers.
With reference to the operational experience at the existing SENT
Landfill and the quantity of special waste received, it is expected that the maximum
size of the trench will be about 6m x 2.5m. The trench will be open to receive
special waste from 9 am to 5 pm everyday.
After 5 pm, the trench will be backfilled with inert waste and covered
by 600 mm of soil and an impermeable liner to minimise odour emissions. Special waste for trench disposal is
normally required to be delivered in sealed bags and no odour will be generated
from the bagged waste. However,
odour will potentially be emitted from the side walls and the base of the
trench itself during operating hours.
In order to reduce the odour emission from the trench, the trench will
be covered by a movable cover with retractable or suitable opening so that the
trench is covered at all times except during waste deposition. The air trapped inside the trench will
be extracted and scrubbed by a mobile odour removal
unit prior to discharge to the atmosphere.
Therefore, the odour emitted from the trench
will be minimal. However, for the
worst-case assessment in this Study, it is assumed that the trench is open to
atmosphere without any odour removal.
Main
Haul Road to Active Tipping Face: The MSW will be delivered
in RCVs with enclosed compactor body. It is therefore anticipated that the
potential odour emission from the RCVs along the haul
road of the Extension will be minimal.
Daily
Covered Area: At the end of each working day (ie after 11 pm), the active tipping face will be covered
with 300 mm of soil and compacted.
Intermediate
Cover Area: Except for the active tipping face and
the final cover area (see below for details), all other areas of the Extension
will be covered with 600mm of soil ()
and an impermeable liner in
order to minimize rainwater infiltration into the waste and odour emission as
well as to enhance LFG extraction.
It is therefore anticipated that no odour will be emitted from this area
().
Final
Cover Areas: After waste tipping reaches the final
levels, a capping system will be installed. The capping system will comprise (from
bottom to top) a soil layer, a non-woven geotextile,
an HDPE liner (impermeable layer), a sub-soil drainage layer and a final cover
soil layer. Permanent gas
extraction system will be installed to extract LFG from the waste mass. Planting will also be provided for the
final covered area. It is therefore
anticipated that no odour will be emitted from this area ().
Operation of Leachate
Treatment Plant (LTP)
Leachate collected from the Extension and the
existing SENT Landfill will be pumped to the LTP in the new infrastructure
area. The LTP will consist of four
buffer storage tanks, two ammonia stripping towers, two thermal oxidisers
(i.e., one in operation and one standby), a stripped leachate
storage tank, two SBR tanks and a sludge holding tank. Except for the SBR tanks, all tanks will
be enclosed and the air exhaust from the tanks will be diverted to the thermal
oxidiser. The operation temperature
of the thermal oxidizer is about 850°C.
Odorous gas in the exhaust air (such as ammonia) will be oxidised and
destroyed at such high temperature ()
in the thermal oxidiser prior
to discharge to the atmosphere. The
SBR tanks will therefore be the only odour emission source in the LTP.
The dimension of each of the SBR tanks is
20m (width) x 35m (length). The
tank height is about 5m. The leachate temperature in the SBR will be maintained at about
40°C throughout
the year. The LTP will operate on a
24-hours per day basis.
Operation of LFG Treatment Facility
The LFG treatment facility will be
operated on a 24-hours per day basis.
The LFG collected from the LFG extraction system will be either diverted
to other utilization scheme for beneficial use or flared at the treatment
facility. The flaring temperature
is about 850°C and odorous compounds such as VOCs
or H2S in the LFG will be oxidised and destroyed at such
temperatures. Therefore, no odour
emission is expected from the LFG treatment facility.
Summary of Potential Odour Emission
Sources
As discussed above, the major potential
odour sources will include waste tipping activities at the active tipping face
and at the special waste trench as well as the operation of the LTP.
The odour emission sources during the
operation/ restoration phase are summarized in Table 4.5g.
Table 4.5g Summary
of Odour Emission Sources
|
Odour Emission Source
|
Area
|
Remarks
|
|
During Operation Hour (8am – 12 midnight)
|
|
Active tipping face for MSW +
construction waste
|
30m x 20m
|
·
From
8am to 11pm. Covering the active
tipping face after operation at 11pm to 12 midnight
|
|
Active tipping face for construction
waste
|
30m x 20m
|
·
From
8am to 11pm. Covering the active
tipping face after operation at 11pm to 12 midnight
|
|
Special waste trench
|
6m x 2.5m (plan area exposed to air) (a)
|
·
From
9am to 5pm. Covering the trench
at 5pm – 6pm
|
|
After Operation Hour (12 midnight – 8am on the next day)
|
|
Daily cover area
|
30m x 40m
|
12 midnight – 8am (on the next day)
|
|
24-hour Operation
|
|
SBR tanks of the LTP
|
20m x 35m
(2 nos.)
|
24 hours
|
|
Note:
(a)
Longer
side : 6m (l) x 2m (H); shorter side: 2.5m (l) x 2m (H); bottom: 6m x 2.5m
|
4.5.3
Aftercare Phase
Upon completion of final filling and
capping, the aftercare phase will commence and is estimated to last for up to
30 years. The LFG and leachate management systems as well as the LFG generator
will continue to operate during the aftercare phase.
Operation of LTP
It should be
noted that once the landfill is restored, the leachate
generation rate from the Extension will be significantly reduced and hence the
average daily volume of leachate to be treated will
be reduced from about 350 m3 d-1 to 23 m3 d-1,
ie approximately an 93% reduction). With respect to the small volume of leachate generated, it will be able to reduce the nitrogen
levels in the leachate using biological treatment (ie, nitrification and denitrification)
so that the effluent will comply with the discharge standards. The operation of the ammonia strippers
and thermal oxidisers will not be necessary.
The vent gas from the enclosed leachate storage and treatment tanks will be diverted to an
air scrubber or the flares prior to discharge to the atmosphere. The designed odour (including ammonia
gas) removal efficiency of the air scrubber will be at least 95%. Therefore, majority of the odorous gas
in the vent gas from enclosed tanks will be removed. The scrubbed vent gas will be used as
part of the air intake for the aeration system of the SBR tank. If the vent is diverted to the flare(s)
as part of the air intake, the odorous gas will be destroyed at high combustion
temperature (at 850oC).
The potential source of odour emission
during the aftercare phase will only be the open SBR tanks (please refer to Table 4.6e for the odour emission rate
of the SBR tanks).
Operation of LFG Treatment Facility
Together with the final capping system,
the permanent LFG extraction system will prevent fugitive emission of LFG from
the restored landfill. The LFG
abstracted will be utilised or flared.
Under a high combustion temperature (850oC) at the flare, the
odorous VOCs in the LFG will be completely oxidised
and destroyed.
Conversely, the
total LFG generated from the restored SENT Landfill and the Extension will
increase (maximum yield of about 17,000 m3 hr-1). A worst case scenario has been assumed
where the two flares will be operated at full load (20,000 m3 hr-1). The emission inventory of flares is
summarized in Table 4.5h. The detailed calculation is summarized
in Annex A1.
LFG Generator
LFG generator will continue to provide
power supply for the operation of LFG Treatment Facility, LTP and other
facilities at the infrastructure area.
The emission inventory of the LFG generator is summarized in Table 4.5h and detailed calculations are
presented in Annex A1.
Table 4.5h Summary
of Gaseous Emission Inventory for the Flares and Generator During
Aftercare Phase (a) (b)
|
Parameter
|
Flare
|
LFG Generator
|
|
No. of emission points
|
2
|
1 (one duty and
one standby)
|
|
Stack height (m)
|
25
|
28
|
|
Stack diameter (m)
|
3.8
|
0.305
|
|
Exhaust gas velocity (m s-1)
|
12.24
|
48.6
|
|
Exhaust gas flowrate (m3
s-1)
|
499,582
|
12,780
|
|
Exit temperature (°C)
|
850
|
454
|
|
Emission limit for NOx
(c)
|
11.28 mg m-3
|
0.14 lb mmBTU-1
|
|
Emission limit for CO (c)
|
28.19 mg m-3
|
0.44 lb mmBTU-1
|
|
Emission limit for SO2 (c)
|
1.55 mg m-3
|
0.045 lb mmBTU-1
|
|
Emission limit for benzene (c)
|
2.98x10⁻³ mg
m-3
|
2.1x10⁻⁵
lb mmBTU-1
|
|
Emission limit for vinyl chloride (c)
|
1.88x10⁻³ mg
m-3
|
1.6x10⁻⁶
lb mmBTU-1
|
|
Emission rate for NO2 (g s-1) (d)
|
0.31
|
0.11
|
|
Emission rate for CO (g s-1)
|
3.91
|
1.721
|
|
Emission rate for SO2 (g s-1)
|
0.22
|
0.176
|
|
Emission rate for vinyl chloride (g s-1)
|
4.14x10⁻⁴
|
8.22x10⁻⁵
|
|
Emission rate for benzene (g s-1)
|
2.61x10⁻⁴
|
6.26x10⁻⁶
|
|
Notes:
(a)
Detailed calculations are summarized in Annex A1.
(b)
Reference to Table
4.5d
(c)
All emission limits are under exhaust gas condition.
(d)
Assuming 20% of NOx
is NO2
|
4.5.4
Cumulative Impacts
According to the EIA Study Brief requirement,
major emission sources in the vicinity should be included to assess the
cumulative air quality impact.
Construction Phase
The operation of the existing SENT
Landfill (last year of operation) and the C&DM Handling Facility in TKO
Area 137 are identified as potential concurrent projects during the
construction phase of the Extension.
During the last year of the operation of
the existing SENT Landfill, most of the landfill area will be capped and
restored. Dust will be emitted from
the placement of cover materials, traffic movements on the unpaved haul roads
and traffic movements at the waste reception area (please refer to Figure
4.5a). As discussed in Section 4.5.3, due generation will be
minimised by implementation of dust control measures, including immediate
compaction of the fill area; regular damping down of the surface of the haul
road; provision of vehicle washing facility for RCVs
at the exit of the existing SENT Landfill (to ensure no significant dust will
be brought onto the public road); and regular cleaning of the main access road
and waste reception area by road sweeper.
The separation distance between the active
tipping area of the existing SENT Landfill and the dusty construction work area
of the Extension site is about 850m (refer to Figure 4.5a). As the worse wind angles which carry the
dust from dusty activity area of Extension and that for dust generated from the
active tipping area of the existing SENT Landfill are different, no cumulative
dust impacts are anticipated due to the operation of the existing SENT Landfill
and the construction of the Extension.
TKO Area 137 is currently planned for Deep
Water Front Industrial uses. A Construction
and Demolition Material (C&DM) Handling Facility is scheduled to be
commissioned in phases in TKO Area 137 (see Figure 3.9b) in 2009. The capacity of the C&DM Handling
Facility is about 20,000 tonnes per day.
However, the detailed design information is not available at this stage
but it is understood that the potential dust impacts associated with the
operation of the C&DM Handling Facility will be assessed as part of the
feasibility and engineering design of the facility. It is recommended that the cumulative
dust impact in the vicinity should be addressed in the environmental study
under that study. It is anticipated
that the facility will incorporate necessary dust control measures (as stipulated
in the Air Pollution Control
(Construction Dust) Regulations) in the design of the facility (which may
include enclosure of the dusty operations) and good site practices to control
dust emissions from the facility. It is expected that no adverse dust impact
will result from the operation of the facility.
As of the existing fill bank at TKO Area
137 will be decommissioned by the end of 2008, no cumulative dust impact will
be anticipated.
In summary, no cumulative dust impact is
anticipated during the construction of the Extension.
Operation/Restoration and Aftercare Phases
Odour Impact
When the Extension commences operation,
the existing SENT Landfill will be closed and will not generate odour. No other similar concurrent type of
odour source is identified within 500m of the Extension site boundary during
the operation/restoration and aftercare phases. Hence, no cumulative landfill odour
impact is expected.
Gaseous Emissions from the existing TKO
Industrial Estate
Within 500m from the Extension site
boundary, emissions from TVB City and HAESL may cause cumulative air quality
impact. On-site chimney survey
within the 500m area from the Extension site boundary was conducted in January
2008. Interviews were also conducted
to validate the stack operation and its emission inventory.
According to the information provided by
TVB City and the public information obtained from the EPD Regional Office
(East), the major gaseous emission sources identified at TVB City are the emergency
generators. As the emergency
generators will only operate when CLP’s grid is
suspended, the operating time of these generators is very limited and it will
not expected to cause cumulative air quality impact within the Study Area.
With reference to
the EIA Report of HAECO Aircraft Engine
Test Cell Facility at TKO, NO2, CO and SO2 are the
key air pollutants to be emitted during engine testing. These emission rates and stack
characteristics are summarized in Table
4.5i.
Table 4.5i Stack
and Emission Characteristics in Study Area (a)
|
Stack ID
|
No. of Stacks
|
Efflux Velocity (m s-1)
|
Stack Diameter (m)
|
Stack Height Above Ground
(m)
|
Exit Temp. (°C)
|
Emission Rate (g s-1)
|
|
|
|
|
|
|
|
NO2
|
CO
|
SO2
|
|
HAECO
/ HAESL (c)
|
1
|
16.4
for NO2 and SO2;
12 for CO
|
14.7
|
40
|
52
|
21.2
|
23.9
|
1.92
|
|
Notes:
(a)
Reference to the EIA Report of HAECO Aircraft Engine Test Cell Facility at TKO.
(b)
It is the equivalent diameter. The stack is in square shape with an
area of 13m x 13m.
|
The above stack characteristic, emission
inventory and engine type being tested at HAESL have been confirmed by HAESL.
The emissions of NO2, CO and SO2
from HAESL are included to assess the cumulative air quality impact during both
the operation/restoration and aftercare phases.
4.6
Assessment Methodology
4.6.1
Construction Phase
Dust will be generated from blasting,
materials handling, wind erosion, rock crushing and truck movements on paved
haul roads within the site. It
should be noted that no construction works will be carried out during blasting
due to the site constraint and safety reason. The dust impact from blasting will be
assessed individually.
TSP levels at
the identified ASRs were predicted using the Fugitive Dust Model (FDM). The 2006 meteorological data obtained
from the existing SENT Landfill weather station and TKO weather station
operated by the Hong Kong Observatory (HKO) were used for the model runs. Dust emission rates and associated
particle size distributions for the assessment were determined in accordance
with the Compilation of Air Pollutant
Emission Factors, AP-42, 5th Edition. One blast will be made each day and the
construction works would be carried out for 12 hours (from 7am to 7pm) per day
and 24 days per month. During
night-time (7pm to 7am on next day), only wind erosion of open fill area was
considered. Mitigation measures
recommended in Section 4.8.1 have
been considered in the dust emission rate estimation.
The mitigated TSP emission rates during
blasting, rock crushing, materials handling, wind erosion and truck movement on
unpaved haul road within the construction site are estimated and summarized in Table 4.6a and detailed calculations are
presented in Annex A2.
Table 4.6a Mitigated
Dust Emission Rates (a) (b) (c)
|
Construction Works
|
Dust Generating Activities
|
Dust Emission Rate
|
Remarks
|
|
Slope Cutting
|
Blasting
|
1.93 gs-1
|
· Blasting area = 1,000 m2
(estimated by the engineer)
· 1 blast per day during daytime
· Total no. of day = 107 days
· Emission height = 0,5m
|
|
Excavation
|
Materials
Handling
|
0.0103 gs-1
|
· Excavation period = 1.5 year
· Total volume of soil excavated = 770,000
m3
· Hourly soil generation rate = 148.5 m3/hr
· 50% dust removal efficiency by watering
· Working time: between 7am and 7pm
· Emission height: 0.5m
|
|
|
Rock crushing
|
· Crushing = 0.0098 gs-1
· Screening = 0.018 gs-1
|
· Rock to be crushed per day = 400m3
per day (max.)
· Working time: between 7am and 7pm
· Emission height = 5m
|
|
|
Truck movement on
unpaved haul road
|
0.00435 gm-2s-1
|
· Total no. of vehicle trip per hour = 70
(including return trip)
· Average truck weight = 21.5 tonnes
· 90% dust removal efficiency by watering
of main haul road, limiting vehicle speed and paving with aggregate/gravel
· Working time: between 7am and 7pm
· Emission height: 0.5m
|
|
Filling
|
Materials
Handling
|
0.0054 gs-1
|
· Filling period = 1.5 year
· Total volume of fill materials = 407,200
m3
· Hourly filling rate = 78.5 m3/hr
· 50% dust removal efficiency by watering
· Working time: between 7am and 7pm
· Emission height: 0.5m
|
|
|
Truck movement
unpaved haul road
|
0.00156 gm-1s-1
|
· Total no. of vehicle trip per hour = 26
(including return trip)
· Average truck weight = 20 tonnes
· 90% dust removal efficiency by watering of
main haul road, limiting vehicle speed and paving with aggregate/gravel
· Only carried out during daytime between
7am and 7pm
|
|
|
Wind erosion
|
§ Daytime : 1.35x10⁻⁶ gm-2s-1
§ Night-time : 2.7x10⁻⁶ gm-2s-1
|
· Total area = about 15 hectare
· 50% dust removal efficiency by watering
during daytime and no dust reduction at night-time
· 24-hour
|
|
Notes:
(a)
Detailed
calculations and location of the dust emission sources are presented in Annex A2.
(b)
Dust
emission factors in Compilation of Air Pollutant
Emission factors, (AP-42), 5th Edition by USEPA is used.
(c)
Dust
control measures recommended in Section
4.8.2 have been adopted.
|
Hourly and daily TSP concentrations were
predicted at 1.5m and 10m above ground of the representative ASRs A1 to A4, A7
and A8 which are located within 500m of the Extension site boundary as the dust
impact is localized. Daily TSP
concentrations predicted from blasting, construction works and night-time wind
erosion activities will be directly added to obtain an overall daily TSP
concentration at the ASRs. The
background TSP concentration, as presented in Table 4.3a, was also used to assess the cumulative TSP
concentrations.
4.6.2
Cumulative Gaseous Emissions During
Operation/Restoration and Aftercare Phases
An EPD approved air dispersion model,
ISCST3, was employed for the assessment.
The 2006 meteorological data obtained from the existing SENT Landfill
weather station and TKO weather station operated by the Hong Kong Observatory
(HKO) were used for the model runs.
The “rural” mode was used. Terrain effects within 500m of the
Extension site boundary have been included.
The emission
rates of NO2, CO, SO2, benzene and vinyl chloride from the
operation of the LFG treatment facility, LTP and LFG generator during
operation/restoration and aftercare phases, presented in Tables 4.5d and 4.5h,
respectively, were used for the prediction. The thermal oxidiser, LFG flares and LFG
generator will be operated 24 hours per day. It is conservatively assumed that the
engine testing at HASEL will be carried on a 24-hour basis. The locations of the LFG treatment facility,
LTP, LFG generator and the emission points at HASEL are shown in Figure
4.5b.
The hourly, daily and annual average
concentrations of the key air pollutants were predicted at 1.5m to 30m above
ground at the representative ASRs A1 to A4, A7 and A8 as the maximum height of
these ASRs is 30 m above ground.
The worst affected height was identified and isopleths showing the
levels of these key air pollutants at 1.5m above ground and the worst affected
height were plotted.
Background concentrations presented in Table 4.3a were included in the assessment
of the cumulative air quality impact.
4.6.3
Odour Emissions from Waste Filling
Activities and Operation of LTP During Operation/Restoration Phase
Selection of Emission Source Locations for
Worst Cases
The operation/restoration of the Extension
will be divided into six phases starting from the south and filling
progressively to the north (see Figures 4.6a-1 and 4.6a-2) in general. Three worst-cases (Cases 1 – 3) in each
phase (except Phase 6) have been identified for the odour impact assessment,
which have taken into account the worst case odour impacts to existing ASRs in
TKOIE (eg TVB City), planned ASRs in the TKO Area
137, and ASRs at higher elevations (eg LOHAS Park
(ASR A20)). Odour emission
inventory including type of source, source area, source height, duration and
the temperature of each worst-case are summarized in Table 4.6b.
Table 4.6b Odour
Emission Inventory in Each Worst Case
|
Source Height
|
Worst-case Scenario (b)
|
Odour Source
|
Area
|
Air Temperature of Odour
Emission (a)
|
|
Phase 1
· 10m above ground
Phase 2
· 30m above ground
Phase 3
· 50m above ground
Phase 4
· 70m above ground
Phase 5
· 100m above ground
Phase 6
· 130m above ground
|
In each phase, there will
be 3 worst cases (b):
·
Case
1
(southern end of Extension)
·
Case
2
(western side of Extension close to A1-1)
·
Case
3
(northern side of the Extension)
|
During Extension
Opening Hours (8am – 12 midnight)
|
|
Active tipping face for MSW + construction waste
|
· 30m x 20m
|
30°C
|
|
Active tipping face for construction waste
|
· 30m x 20m
|
30°C
|
|
Special waste trench
|
· 6m x 2.5m (plan area exposed to air)
|
30°C
|
|
After Extension Opening
Hours (12 midnight – 8am on the next day)
|
|
Daily cover area
|
· 30m x 40m
|
30°C
|
|
24-hour Operation
|
|
SBR tanks
|
· 35m x 20m
(2 nos.)
|
30°C
|
|
Notes:
(a)
Reference
to the sensitivity analysis summarized in Annex
A3.
(b)
For
Phase 6, since the waste tipping area is small, therefore, 2 worst cases are
assumed.
|
Reasonable Worst-case Odour Modelling
Parameter
Odour Sampling at SENT Landfill
Odour generated from landfill operation varies
from landfill site to landfill site; no general odour emission rates for landfilling activities are available. Odour samples were taken from the
existing SENT Landfill for olfactometry analysis by
the Odour Research Laboratory of the Hong Kong Polytechnic University to
establish a set of odour emission rates for this study.
Sampling
Time and Locations: Measurements
were taken between 9:00 am and 9:30 pm at four locations (see Table 4.6c). The sampling locations and the ambient
temperature during sampling are presented in Table 4.6c.
Table 4.6c Odour
Sampling Regime
|
Location
|
Sampling ID
|
Ambient Temperature (°C)
|
|
MSW + Construction Waste
(S1)
|
S1-1
|
30.83
|
|
|
S1-2
|
31.45
|
|
|
S1-3
|
26.01
|
|
|
S1-4
|
23.03
|
|
|
S1-5
|
20.85
|
|
|
S1-6
|
30.05
|
|
MSW + Construction Waste +
300mm Soil Cover (S2)
|
S2-1
|
30.97
|
|
|
S2-2
|
31.58
|
|
|
S2-3
|
26.16
|
|
|
S2-4
|
29.55
|
|
Special Waste Trench (S3)
|
S3-1
|
27.00
|
|
|
S3-2
|
26.47
|
|
SBR of LTP (S4)
|
S4-1
|
26.90
|
As the existing SENT Landfill receives
MSW, construction waste, special wastes as well as dewatered sludge from sewage
treatment works (STWs), the sampling locations for S1
and S2 were therefore selected away the existing active tipping face and at the
upwind location to avoid potential odour contamination. A new tipping platform was formed at the
sampling location and MSW and construction waste were disposed of using the
normal practices. The ratio of MSW
to construction waste disposed was the same as that predicted for the Extension
(ie the ratio of MSW to construction waste is about 1
: 2). For S2, the compacted MSW and
construction waste was covered with 300mm of cover soil. The odour samples for S3 and S4 were
taken at the base of the special waste trench and at the water surface of the
SBR tank of the SENT Bioplant, respectively.
The odour emission from construction waste
is very low and on a conservative basis, it is assumed that the odour emission
rate from construction waste tipping is the same as that for S2.
It should be noted that the existing SENT
Landfill also receives sewage sludge; therefore, the odour emission rate
measured at the trench will be much higher than that expected for the
Extension. Adopting the measured
odour emission rates measured at the existing special waste trench in the
assessment is a conservative approach.
Odour
Sampling and Analysis Methods: Odour samples were taken using the flux
chamber method which is the method recommended by the USEPA ()
and is also the most commonly
used odour sampling method for large surface emission source such as landfill
sites. The flux chamber used is a
circular chamber with a diameter of 0.41m and an area of 0.13 m2. It was tightly placed on the surface of
the odour source and the air inside the chamber was purged with nitrogen gas at
a sweeping rate of 5 litres per minute.
The odour sample was collected in a Tedlar bag
at a rate of 3 litres per minute.
Before taking the next sample, the flux chamber was cleaned with
distilled water and then flushed with nitrogen for about 10 minutes to remove
residual odour in the chamber. The
sampling system and the flux chamber are shown in Figure 4.6b.
The odour
samples were analysed within 24 hours of the sampling using the olfactometry method by the Odour Research Laboratory of the
Hong Kong Polytechnic University.
The odour concentration of the samples, measured in Odour Units (OU) per
m3, was determined by a Forced-choice Dynamic Olfactometer
in accordance with the European Standard Method EN 13725.

Odour emission rate was then calculated
using the following equation:
Odour
Sampling Results: The measured odour concentrations and
calculated odour emission rates of each odour source are summarized in Table 4.6d.
Table 4.6d Odour
Sampling Results
|
Location
|
Sampling ID
|
Onsite Ambient
Temperature During Sampling (°C)
|
Measured Odour
Concentration (OU/m3)
|
Odour Emission Rate (OU/m2/s)
|
|
MSW + Construction Waste (S1)
|
S1-1
|
30.83
|
1,092
|
0.70
|
|
S1-2
|
31.45
|
1,738
|
1.11
|
|
S1-3
|
26.01
|
1,521
|
0.98
|
|
S1-4
|
23.03
|
1,296
|
0.83
|
|
S1-5
|
20.85
|
264
|
0.17
|
|
S1-6
|
30.05
|
1,579
|
1.01
|
|
MSW + Construction Waste + 300mm Soil Cover (S2)
|
S2-1
|
30.97
|
80
|
0.051
|
|
S2-2
|
31.58
|
160
|
0.10
|
|
S2-3
|
26.16
|
169
|
0.11
|
|
S2-4
|
29.55
|
193
|
0.12
|
|
Special Waste Trench (S3)
|
S3-1
|
27.00
|
10,768
|
6.90
|
|
S3-2
|
26.47
|
16,830
|
10.79
|
|
SBR of LTP (S4)
|
S4-1
|
26.90
|
76
|
0.049
|
Definition of a Reasonable Worst-case
Odour Modelling Parameters
A sensitivity analysis was undertaken to determine
a reasonable worst-case scenario for the odour assessment. Details of the sensitivity analysis can
be found in Annex A3. The analysis shows that the reasonable
worst-case ambient temperature for estimating the odour emission rate is 30°C.
Therefore, the reasonable worst-case odour emission rates at this
temperature are summarized in Table 4.6e.
Table 4.6e Reasonable
Worst-case Odour Emission Rates Adopted in Odour Impact Assessment
|
Odour Source
|
Source Area
|
Odour Emission Rates at 30°C (OU/m2/s) (a)
|
Total Odour Emission (OU/s)
|
|
During Extension Opening Hours (8am – 12
midnight)
|
|
Active tipping face for MSW +
Construction Waste
|
30m x 20m
|
0.94
|
564
|
|
Active tipping face for construction
waste
|
30m x 20m
|
0.12
|
72
|
|
Special waste trench
|
6m x 2.5m (plan area exposed to air)
|
31.74 (c)
|
476
|
|
After Extension Opening Hours (12
midnight – 8am on the next day)
|
|
Daily cover area (b)
|
30m x 40m
|
0.12
|
144
|
|
24-hour Operation
|
|
|
|
|
SBR tanks
|
2 number of
35m x 20m
|
0.049
|
69
|
|
Notes:
(a)
Reference
to Annex A3.
(b)
Total
area of active tipping face.
(c)
Reference
to Annex A3 for the adjustment of
the odour emission rate at 30°C.
|
Air Dispersion Model and Worst-case Odour Modelling
Parameters
The AUSPLUME model, developed by the
Australian Government (Environmental Protection Agency, Victoria), was employed
for the odour impact assessment.
The use of the AUSPLUME model has been approved by the EPD.
As discussed in Annex A3, the modelling parameters are summarized in Table 4.6f.
Table 4.6f Worst-case
Odour Modelling Parameters
|
Modelling Parameter
|
Setting
|
|
Surface roughness
|
·
120
cm
|
|
Meteorological data
|
·
2006
hourly SENT landfill weather data : wind speed, wind direction and air
temperature
·
2006
HKO TKO weather data : stability class
·
2006
HKO King’s Park weather data : mixing height
·
90%
of data are valid
|
|
Terrain effect
|
·
Terrain
data within 500m from the Extension site boundary have been included in model
·
“Egan
half height” option is selected
|
|
Type of odour source in
model
|
·
Area
source : active tipping faces for MSW and construction waste, daily cover area
at night-time and special waste trench
·
Point
source : SBR tanks (with very low exit velocity of 0.001 m s-1) as
the leachate temperature is slightly higher than
ambient
|
Also, odour management and control
measures summarized in Table 4.8a have
been considered in the worst-case assessment.
Assessment Height and Presentation of
Predicted Results
5-second odour concentrations were
modelled at 1.5m, 10m, 20m, 30m, 50m, 70m and 90m ()
above ground level at the identified
ASRs and the worst affected heights under different worst-case scenarios are
also identified in the assessment.
Contours of the predicted odour concentrations at the worst affected
height within the Study Area (500m from the Extension site boundary) under
different scenarios were plotted.
Conversion of Modelled Results From
3-minute Averaging Time to 5-second Averaging Time
Under the EIAO-TM, the odour assessment criterion is defined as 5 OU under a
5-second averaging time. To convert
the AUSPLUME output (presented as the maximum 3-minute mean concentration) to a
maximum 5-second mean concentration, the approach suggested by the Warren
Spring Laboratory (WSL) ()
was adopted:
“Typical
maximum or peak 5-second average concentrations within any 3-minute period
appear to be of the order of 5 times the 3-minute average. During very unstable conditions larger
ratios, perhaps 10:1, are more appropriate…..”
It should be
noted that the ratios provided in the WSL report refer to peak to mean
concentrations for emissions from stacks.
Emissions from low-level area sources will fluctuate less and therefore
the peak to mean ratios will be lower.
The use of the peak to mean ratios provided in the WSL report therefore
provides a conservative estimate for the 5-second mean concentrations for area
sources.
For stable conditions (stability classes C
to F), a factor of 5 was applied whilst for unstable conditions (stability
classes A and B) a factor of 10 was applied to the emission rates input in the
model run. The modelled results
will be the 5-second odour concentrations.
The factored odour emission rates are
presented in Table 4.6g. These odour emission rates applied to
the three worst-cases described in Table
4.6b. An example showing hourly
emission rate file adopted in AUSPLUME model is presented in Annex A4.
Table 4.6g Odour
Emission Rates for AUSPLUME Model Run
|
Modelling
Period
|
Odour
Emission Source
|
Area Size in Model
|
Air Temperature of Odour Emission
|
Factored Odour Emission Rate to be used in Model Run to
obtain 5-second Results
(OU m-2 s-1) (b)
|
|
|
|
|
Stability Class A & B (c)
|
Stability Class C to F (d)
|
|
During Operation (8am – 12 midnight)
|
Active tipping face for MSW + Construction Waste
|
30m x 20m
|
30°C
|
9.4
|
4.7
|
|
Active tipping face for construction Waste (a)
|
30m x 20m
|
30°C
|
1.2
|
0.6
|
|
Special Waste Trench
|
6m x 2.5m (plan area exposed to
air)
|
30°C
|
317.41
|
158.7
|
|
Night-time (Midnight to 8am on the next day)
|
Daily Cover Area (a)
|
30m x 40m
|
30°C
|
1.2
|
0.6
|
|
24-hour Operation
|
2 numbers of SBR tanks
|
20m x 35m (each)
|
30°C
|
343 (OU s-1)
|
171.5 (OU s-1)
|
|
Notes:
(a) The
odour emission rates of daily cover area at night and the active tipping face
for construction waste during operation are similar due to the odour nature
of the ground is the same.
(b) Reference
to Tables 4.6b and 4.6e for original odour emission at 30°C.
(c) A
factor of 10 is applied to convert the results from 3 minutes to 5 seconds.
(d) A
factor of 5 is applied to convert the results from 3 minutes to 5 seconds.
|
4.7
Evaluation of Impacts
4.7.1
Construction Phase
The cumulative hourly and daily TSP concentrations at 1.5m and 10m above
ground of ASRs within 500m of the Extension site boundary were predicted taking
account of the implementation of the suitable dust control measures and the
predicted results are summarized in Tables
4.7a and 4.7b, respectively.
Table 4.7a Predicted
Mitigated Cumulative Hourly TSP Concentrations at ASRs within 500m of the
Extension Site Boundary
|
ASR
|
Description
|
Predicted
Mitigated Cumulative Maximum Hourly TSP Concentrations (µgm-3) (a)
|
|
|
|
Blasting
|
Construction Activities
|
|
|
|
1.5m
Above Ground
|
10m Above Ground
|
1.5m
Above Ground
|
10m Above Ground
|
|
A1-1
|
Proposed C&DM Handling Facility
|
310
|
204
|
272
|
174
|
|
A1-2 (1)
|
Planned Industrial Uses in TKO 137
(south of Extension) - 1
|
312
|
376
|
260
|
264
|
|
A1-2 (2)
|
Planned Industrial Uses in TKO 137
(south of Extension) - 2
|
195
|
243
|
183
|
218
|
|
A1-3 (1)
|
Planned Industrial Uses in TKO 137
(south of TVB City) - 1
|
462
|
424
|
371
|
309
|
|
A1-3 (2)
|
Planned Industrial Uses in TKO 137
(south of TVB City) - 2
|
336
|
254
|
297
|
217
|
|
A2
|
TVB City
|
363
|
345
|
312
|
282
|
|
A3
|
HAESL
|
214
|
213
|
202
|
201
|
|
A4
|
HAECO Component Overhaul Building
|
196
|
195
|
188
|
186
|
|
A7
|
Yan Hing
Machinery Industrial Building
|
179
|
200
|
172
|
193
|
|
A8
|
Apple Daily
|
170
|
190
|
165
|
186
|
|
Hourly TSP Criterion
|
500
|
500
|
500
|
500
|
|
Note:
(a) Background TSP concentration (ie 78 µgm-3)
has been included in the results.
|
Table 4.7b Predicted
Mitigated Cumulative Daily TSP Concentrations at ASRs within 500m of the
Extension Site Boundary
|
ASR
|
Description
|
Predicted Mitigated Cumulative Daily TSP
Concentrations (µgm-3)
|
|
|
|
1.5m Above Ground
|
10m Above Ground
|
|
|
|
Blasting
(i)
|
Daytime
Construction Works
(ii)
|
Night-time Wind
Erosion (iii)
|
Total = (i) + (ii) + (iii) + background (a)
|
Blasting
(i)
|
Daytime
Construction Works
(ii)
|
Night-time Wind
Erosion (iii)
|
Total = (i) + (ii) + (iii) + background (a)
|
|
A1-1
|
Proposed C&DM Handling Facility
|
28
|
24
|
9
|
139
|
25
|
19
|
6
|
128
|
|
A1-2 (1)
|
Planned Industrial Uses in TKO 137 (south of Extension) - 1
|
34
|
55
|
19
|
185
|
27
|
39
|
6
|
149
|
|
A1-2 (2)
|
Planned Industrial Uses in TKO 137 (south of Extension) - 2
|
16
|
24
|
5
|
123
|
15
|
20
|
4
|
117
|
|
A1-3 (1)
|
Planned Industrial Uses in TKO 137 (south of TVB City) - 1
|
36
|
48
|
11
|
173
|
31
|
35
|
6
|
150
|
|
A1-3 (2)
|
Planned Industrial Uses in TKO 137 (south of TVB City) - 2
|
29
|
23
|
7
|
138
|
26
|
20
|
6
|
130
|
|
A2
|
TVB City
|
39
|
27
|
7
|
151
|
31
|
22
|
6
|
136
|
|
A3
|
HAESL
|
15
|
10
|
4
|
107
|
14
|
10
|
4
|
105
|
|
A4
|
HAECO Component Overhaul Building
|
9
|
7
|
4
|
98
|
8
|
7
|
4
|
96
|
|
A7
|
Yan Hing
Machinery Industrial Building
|
8
|
13
|
7
|
106
|
7
|
13
|
6
|
104
|
|
A8
|
Apple Daily
|
10
|
15
|
5
|
107
|
9
|
14
|
5
|
106
|
|
|
Daily TSP Criterion
|
260
|
Daily TSP Criterion
|
260
|
|
Note:
(a) Background TSP concentration (ie 78 µgm-3)
has been included in the total results.
|
With the implementation of good construction site practices and dust control
measures recommended in Section 4.8.1,
the predicted cumulative hourly and daily TSP levels at identified ASRs within
500 m from the Extension site boundary are all well below the respective dust
criteria. Isopleths showing the
predicted cumulative hourly and daily TSP levels at the worst affected level (ie, 1.5m above ground) in the vicinity are illustrated in Figures 4.7a-1 to 4.7a-2 and 4.7b.
In particular for the blasting, exceedance of
hourly TSP levels was predicted at the area close to site boundary of TKO Area
137 (as shown in Figure 4.7a-1). It should be noted that the blasting
will last for very short instances (ie few second)
and one blast will be carried out each day for a total of 107 days, therefore,
the dust impact will be transient.
With the implementation of the mitigation measures during blasting, the
dust impact will be controlled to within the dust criteria.
Exceedance
of hourly TSP levels was predicted on a small section of the future road during
daytime construction works. No ASRs
are located within the affected area and the dust impact during daytime
construction works is within the dust criteria.
4.7.2
Gaseous Emissions from LFG Flares, Thermal
Oxidizer of LTP and LFG Generator During Operation/Restoration Phase
The highest predicted
maximum hourly average, daily average and annual average concentrations of NO2,
SO2, benzene and vinyl chloride are presented in Table 4.7c. The highest predicted hourly and 8-hour
average concentrations of CO are also presented in Table 4.7c. The
predicted concentrations of these air pollutants at different ASR elevations of
are summarized in Annex A5-1.
A sample input file of ISCST3 is attached
in Annex A6.
Table 4.7c Highest
Concentrations of NO2, CO, SO2, Benzene and Vinyl
Chloride in Different Averaging Times During the
Operation/Restoration Phase
|
ASR
|
Location
|
Highest
Hourly Average Concentration (µg m-3) (a) (b)
|
Highest
Daily Average Concentration (µg m-3) (a) (b)
|
Highest 8-hr
Average Concentration (µg m-3) (a) (b)
|
Highest Annual Average
Concentration
(µg m-3)
(a) (b)
|
|
|
|
NO2
|
CO
|
SO2
|
Benzene
|
Vinyl
Chloride
|
NO2
|
SO2
|
CO
|
NO2
|
SO2
|
Benzene
|
Vinyl
Chloride
|
|
A1-1
|
Proposed C&DM Handling Facility
|
75
|
1357
|
24.1
|
2.11
|
5.10
|
67.0
|
19.0
|
1326
|
66.10
|
18.11
|
2.100
|
5.100
|
|
A1-2 (1)
|
Planned Industrial Uses in TKO 137
(south of Extension) – 1
|
134
|
2273
|
118.1
|
2.19
|
5.16
|
90.3
|
51.2
|
1764
|
67.93
|
20.16
|
2.102
|
5.101
|
|
A1-2 (2)
|
Planned Industrial Uses in TKO 137
(south of Extension) - 2 (outside HKPSG
200m buffer distance)
|
77
|
1448
|
31.1
|
2.11
|
5.10
|
67.8
|
20.0
|
1361
|
66.12
|
18.14
|
2.100
|
5.100
|
|
A1-3 (1)
|
Planned Industrial Uses in TKO 137
(south of TVB City) – 1
|
71
|
1359
|
22.8
|
2.11
|
5.10
|
66.6
|
18.7
|
1312
|
66.09
|
18.09
|
2.100
|
5.100
|
|
A1-3 (2)
|
Planned Industrial Uses in TKO 137
(south of TVB City) - 2 (outside HKPSG
200m buffer distance)
|
71
|
1358
|
22.7
|
2.11
|
5.10
|
67.3
|
19.5
|
1325
|
66.11
|
18.11
|
2.100
|
5.100
|
|
A2
|
TVB City
|
71
|
1362
|
23.0
|
2.11
|
5.10
|
66.5
|
18.7
|
1312
|
66.08
|
18.09
|
2.100
|
5.100
|
|
A3
|
HAESL
|
71
|
1359
|
23.0
|
2.11
|
5.10
|
66.8
|
18.5
|
1310
|
66.24
|
18.08
|
2.100
|
5.100
|
|
A4
|
HAECO Component Overhaul
Building
|
75
|
1358
|
23.0
|
2.11
|
5.10
|
67.0
|
18.7
|
1308
|
66.15
|
18.08
|
2.100
|
5.100
|
|
A7
|
Yan Hing
Machinery Industrial Building
|
74
|
1360
|
23.1
|
2.11
|
5.10
|
67.5
|
19.6
|
1323
|
66.15
|
18.13
|
2.100
|
5.100
|
|
A8
|
Apple Daily
|
84
|
1358
|
23.1
|
2.11
|
5.10
|
67.3
|
19.2
|
1322
|
66.16
|
18.12
|
2.100
|
5.100
|
|
Background Concentration
|
66
|
1294
|
18
|
2.1
|
5.1
|
66
|
18
|
1294
|
66
|
18
|
2.1
|
5.1
|
|
AQO / Chronic or Acute Reference Concentration
|
300
|
30,000
|
800
|
1,300 (c)
|
180,000 (c)
|
150
|
350
|
10,000
|
80
|
80
|
30 (c)
|
100 (c)
|
|
Notes:
(a)
Detailed Assessment Results are summarized in Annex A5-1.
(b)
Background NO2, CO, SO2, benzene and
vinyl chloride (presented in Table 4.3a)
concentrations were included in the results.
(c)
Acute/Chronic Reference Concentrations are referred to Table 4.2d.
|
NO2, CO and SO2
The highest
predicted NO2, CO and SO2 concentrations at different
elevations of ASRs are low and well within the respective AQO criteria. Isopleths showing cumulative maximum
hourly concentrations of NO2, CO and SO2 at 1.5m above
ground and the worst affected height (30m above ground) within 500m of the
Extension site boundary are plotted and presented in Figures 4.7c to 4.7e, respectively ([18]). The
isopleths show that the concentrations of NO2, CO and SO2
at the identified ASRs under different averaging time are within the respective
AQO criteria. It is therefore
concluded that the operation of LFG flares, thermal oxidiser(s) and the LFG
generator during the operation/restoration phase will not cause adverse air
quality impact to the identified ASRs.
Benzene and Vinyl Chloride
Non-cancer
Health Risk Assessment: The predicted maximum hourly and annual
average benzene and vinyl chloride concentrations (see Tables 4.7c and Annex A5-1),
taking account of the background, are well below the respective reference acute
and chronic concentrations (see Table
4.2d), hence, the acute and chronic health effect of benzene and vinyl
chloride is considered to be insignificant (refer to Tables 4.2e and 4.2f).
Cancer
Health Risk Assessment: Benzene and vinyl chloride are
considered to be carcinogenic. A
cancer health risk assessment was undertaken using the predicted annual average
benzene and vinyl chloride concentrations and the guideline unit risk factors,
as shown in Table 4.2b. The highest calculated individual cancer
health risk levels of benzene and vinyl chloride and total cancer health risk
levels are presented in Table 4.7d
and the calculated individual cancer risk level of benzene and vinyl chloride
and total cancer health risk levels at different ASR elevations are summarized
in Annex A5-2. The calculated total cancer health risk
levels are low than 10-6 at different elevations of all identified
ASRs and the total health risks are considered to be insignificant at all identified
ASRs.
Table 4.7d Highest
Calculated Cancer Health Risk Levels of Benzene and Vinyl Chloride During Operation/Restoration Phase
|
ASR
|
Location
|
Individual Highest
Calculated Cancer Health Risk Level (a) (b)
|
Total Cancer Health Risk
Level
|
|
|
|
Benzene
|
Vinyl Chloride
|
|
|
A1-1
|
Proposed
C&DM Handling Facility
|
7.0E-10
|
3.5E-10
|
1.1E-09
|
|
A1-2
(1)
|
Planned
Industrial Uses in TKO 137 (south of Extension) – 1
|
1.6E-08
|
7.8E-09
|
2.3E-08
|
|
A1-2
(2)
|
Planned
Industrial Uses in TKO 137 (south of Extension) - 2
|
9.4E-10
|
4.4E-10
|
1.4E-09
|
|
A1-3
(1)
|
Planned
Industrial Uses in TKO 137 (south of TVB City) – 1
|
6.2E-10
|
3.5E-10
|
9.8E-10
|
|
A1-3
(2)
|
Planned
Industrial Uses in TKO 137 (south of TVB City) - 2
|
8.6E-10
|
4.4E-10
|
1.3E-09
|
|
A2
|
TVB
City
|
6.2E-10
|
2.6E-10
|
8.9E-10
|
|
A3
|
HAESL
|
4.7E-10
|
2.6E-10
|
7.3E-10
|
|
A4
|
HAECO
Component Overhaul Building
|
4.7E-10
|
2.6E-10
|
7.3E-10
|
|
A7
|
Yan Hing Machinery Industrial
Building
|
1.0E-09
|
5.3E-10
|
1.5E-09
|
|
A8
|
Apple
Daily
|
8.6E-10
|
4.4E-10
|
1.3E-09
|
|
Notes:
(a)
Detailed calculated cancer health risk levels are
summarized in Annex A5-2.
(b)
Unit risk factors of benzene and vinyl chloride (as presented
in Table 4.2b) have been used for
the calculation.
|
4.7.3
Odour Emissions from Waste Filling
Activities and Operation of LTP During Operation/Restoration Phase
The predicted 5-second odour concentrations
at different elevations of identified ASRs (where appropriate) are summarized
in Annex A7-1 and the highest
predicted 5-second odour concentration at the identified ASRs are presented in Table 4.7e. The numbers of events of exceedance predicted at different elevations at A1-1 to A3
for the different emission source heights are summarized in Annex A7-2. The AUSPLUME input file is presented in Annex A8.
The results indicate that exceedances of the 5-second odour criterion were predicted
at the ASRs located in the immediate vicinity of the Extension, ie A1-1 to A3.
For those ASRs in TKO Town (ASRs A24 to A41) and in Siu
Sai Wan and Hang Fa Chuen (ASRs A42 to A43), the predicted odour concentrations
are very low relative to the odour criterion.
As shown in Annex A7-1, the worst affected height at the ASRs will be at 1.5m
above ground and the predicted 5-second odour concentrations decrease with the
increase in the height of ASRs.
Isopleths of the maximum 5-second odour concentrations at the worst
affected height, ie, 1.5m above ground within 500m
from the Extension Site boundary for the six phases of waste tipping activities
are plotted (see Figures 4.7f to 4.7k) ().
It can be seen that the area outside the site boundary in which peak
5-second odour concentrations exceed the criterion diminishes over time.
The zone of possible impact (the area with
a potential for exceedance of the odour criterion)
due to odour emissions during each waste tipping phase are illustrated in Figures
4.7l-1 and 4.7l-2. The predicted highest 5-second odour
levels and numbers of exceedances predicted at the
representative ASRs A1-1 to A2 are also summarized in Figures 4.7l-1 and 4.7l-2. The figures show that the potential
odour impact is localized to within about 500 of the Extension boundary. It should be noted that zones shown on
the figures are an indication of the overall extent of the potential odour
impact for that particular phase of waste tipping and on any waste tipping
day. Only the ASRs that are located
downwind of the tipping face may experience an odour level exceeding the odour
criterion. The actual affected area
would be a much smaller than that bounded by the 5OU contour line (see Figure
4.7l-1 and 4.7l-2). The summary tables in the figures also
show that highest number of exceedance predicted at
the ASRs is 71 (1.5m above ground of A1-3 (1)). When the waste tipping face moves to
higher levels as the Extension is developed, the number of exceedances
decreases to zero over a six-year period.
For this assessment, the special waste
trench is assumed to be open to the atmosphere. In the outline design, the trench will
be covered and the air extracted from the trench will be scrubbed prior to
discharge to atmosphere. As
mentioned in Section 4.6.2, the odour
emission rate of the trench adopted in the assessment is very
conservative. In reality, the
predicted odour levels should be lower and the number of exceedances
will be less than predicted.
Table 4.7e Predicted
Highest 5-second Odour Concentrations at the
Identified Representatie ASRs During
Operation/Restoration Phase
|
ASR
|
Location
|
Highest 5-second Odour Level (a) (b)
|
|
|
|
Worst-case 1
|
Worst-case 2
|
Worst-case 3 (c)
|
|
|
|
Source Height = 10m
|
Source Height = 30m
|
Source Height = 50m
|
Source Height = 70m
|
Source Height = 100m
|
Source Height = 130m
|
Source Height = 10m
|
Source Height = 30m
|
Source Height = 50m
|
Source Height = 70m
|
Source Height = 100m
|
Source Height = 130m
|
Source Height = 10m
|
Source Height = 30m
|
Source Height = 50m
|
Source Height = 70m
|
Source Height = 100m
|
|
A1-1
|
Proposed
C&DM Handling Facility
|
6.1
|
6.3
|
5.9
|
5.0
|
1.5
|
2.0
|
6.3
|
4.1
|
3.2
|
2.3
|
1.5
|
1.3
|
3.2
|
2.2
|
1.8
|
1.4
|
1.2
|
|
A1-2 (1)
|
Planned
Industrial Uses in TKO 137 (south of Extension) - 1
|
8.9
|
7.0
|
6.0
|
5.7
|
2.7
|
1.9
|
2.3
|
2.9
|
2.8
|
3.0
|
1.9
|
1.4
|
2.3
|
2.4
|
2.4
|
2.1
|
1.7
|
|
A1-2 (2)
|
Planned
Industrial Uses in TKO 137 (south of Extension) - 2
|
2.7
|
3.3
|
3.1
|
3.0
|
1.5
|
1.0
|
1.9
|
2.1
|
1.8
|
1.8
|
0.9
|
0.7
|
1.3
|
1.6
|
1.5
|
1.2
|
0.7
|
|
A1-3 (1)
|
Planned
Industrial Uses in TKO 137 (south of TVB City) - 1
|
2.4
|
2.2
|
2.2
|
2.9
|
3.6
|
3.4
|
5.5
|
6.4
|
7.0
|
6.2
|
3.8
|
2.2
|
23.2
|
14.4
|
11.2
|
6.4
|
2.9
|
|
A1-3 (2)
|
Planned
Industrial Uses in TKO 137 (south of TVB City) - 2
|
1.7
|
2.0
|
2.2
|
2.1
|
2.2
|
2.0
|
5.1
|
6.4
|
3.9
|
2.8
|
2.6
|
2.4
|
11.4
|
7.3
|
6.9
|
3.3
|
2.6
|
|
A2
|
TVB City
|
1.9
|
1.8
|
1.9
|
2.0
|
3.8
|
2.3
|
4.1
|
3.9
|
4.6
|
4.6
|
3.3
|
3.2
|
12.5
|
13.1
|
14.0
|
6.5
|
5.4
|
|
A3
|
HAESL
|
1.1
|
1.2
|
1.2
|
1.2
|
1.7
|
1.9
|
1.9
|
1.9
|
2.1
|
2.2
|
2.6
|
2.3
|
3.3
|
4.2
|
5.2
|
3.1
|
3.8
|
|
A4
|
HAECO Component
Overhaul Building
|
1.1
|
1.1
|
1.1
|
1.2
|
1.5
|
2.4
|
1.8
|
1.6
|
1.4
|
1.6
|
1.9
|
1.8
|
2.4
|
2.8
|
3.5
|
4.4
|
2.3
|
|
A5
|
Exhibition
Services & Logistics Centre
|
0.9
|
0.8
|
0.8
|
0.9
|
1.1
|
1.3
|
1.2
|
1.2
|
1.3
|
1.3
|
2.2
|
0.9
|
1.7
|
1.8
|
3.0
|
1.9
|
1.1
|
|
A6
|
Gammon Skanska
|
0.6
|
0.6
|
0.8
|
0.8
|
0.7
|
0.9
|
1.0
|
1.0
|
1.0
|
0.8
|
1.1
|
0.7
|
1.2
|
1.6
|
1.7
|
1.1
|
0.8
|
|
A7
|
Yan Hing
Machinery Industrial Building
|
1.0
|
1.2
|
1.3
|
1.3
|
1.5
|
2.1
|
1.6
|
1.9
|
2.0
|
1.9
|
2.1
|
4.1
|
2.7
|
3.3
|
3.4
|
3.5
|
3.7
|
|
A8
|
Apple Daily
|
0.9
|
1.0
|
1.1
|
1.2
|
1.2
|
1.5
|
1.2
|
1.5
|
1.6
|
1.6
|
1.6
|
2.5
|
1.9
|
2.4
|
2.7
|
2.6
|
2.8
|
|
A9
|
Mei Ah
Industrial Building
|
1.0
|
1.1
|
1.1
|
1.0
|
1.1
|
1.6
|
1.5
|
1.6
|
1.4
|
1.3
|
1.9
|
2.4
|
2.4
|
2.2
|
2.4
|
3.0
|
3.8
|
|
A10
|
Asia Netcom
|
0.9
|
1.0
|
0.9
|
1.1
|
1.0
|
1.4
|
1.5
|
1.3
|
1.4
|
1.3
|
1.8
|
1.7
|
1.8
|
1.7
|
2.4
|
2.5
|
2.7
|
|
A11
|
Wellcome Storage
|
1.0
|
1.0
|
1.0
|
1.1
|
1.1
|
1.5
|
1.5
|
1.4
|
1.5
|
1.2
|
1.5
|
1.7
|
1.9
|
2.2
|
2.1
|
2.1
|
2.3
|
|
A12
|
Avery Dennison
Machinery
|
0.8
|
0.8
|
0.9
|
1.1
|
1.1
|
1.4
|
1.0
|
1.2
|
1.3
|
1.4
|
1.5
|
1.7
|
1.5
|
1.7
|
2.1
|
2.3
|
1.8
|
|
A13
|
Hitachi
|
0.7
|
0.8
|
1.0
|
0.9
|
0.8
|
1.0
|
1.0
|
1.1
|
1.2
|
1.2
|
1.1
|
1.6
|
1.4
|
1.7
|
1.8
|
1.5
|
1.6
|
|
A14
|
Next Media Co.
Ltd
|
0.7
|
0.7
|
0.8
|
0.8
|
0.9
|
1.0
|
0.8
|
1.0
|
1.1
|
1.2
|
1.3
|
1.2
|
1.2
|
1.3
|
1.5
|
1.6
|
1.6
|
|
A15
|
Varitronix
|
0.6
|
0.7
|
0.7
|
0.7
|
0.8
|
0.8
|
0.8
|
0.9
|
0.9
|
1.1
|
1.1
|
1.2
|
0.9
|
1.2
|
1.3
|
1.3
|
1.2
|
|
A16
|
Four Seas Food
Processing Co. Ltd
|
0.5
|
0.5
|
0.6
|
0.7
|
0.7
|
0.7
|
0.7
|
0.7
|
0.8
|
0.8
|
0.8
|
1.0
|
0.9
|
0.9
|
1.1
|
1.0
|
0.9
|
|
A17
|
Committed HSBC
Office
|
0.6
|
0.6
|
0.6
|
0.6
|
0.7
|
0.8
|
0.7
|
0.7
|
0.8
|
0.9
|
0.9
|
0.9
|
0.8
|
1.0
|
1.0
|
1.2
|
1.1
|
|
A18
|
Eastern Pacific
Electronics
|
0.5
|
0.5
|
0.5
|
0.6
|
0.6
|
0.5
|
0.6
|
0.6
|
0.7
|
0.7
|
0.7
|
0.8
|
0.7
|
0.7
|
0.9
|
0.8
|
0.7
|
|
A19
|
Committed Tung Wah Group of Hospital Aided Primary & Secondary
School
|
0.4
|
0.5
|
0.5
|
0.5
|
0.5
|
0.4
|
0.5
|
0.6
|
0.6
|
0.5
|
0.6
|
0.6
|
0.6
|
0.7
|
0.7
|
0.7
|
0.6
|
|
A20
|
LOHAS Park
|
0.3
|
0.4
|
0.3
|
0.3
|
0.4
|
0.3
|
0.4
|
0.4
|
0.3
|
0.3
|
0.4
|
0.4
|
0.5
|
0.4
|
0.4
|
0.5
|
0.4
|
|
A21
|
Chiaphua-Shinko Centre
|
0.3
|
0.3
|
0.3
|
0.4
|
0.4
|
0.4
|
0.4
|
0.4
|
0.4
|
0.5
|
0.4
|
0.4
|
0.4
|
0.4
|
0.6
|
0.5
|
0.5
|
|
A22
|
Shaw Film Studios
|
0.3
|
0.3
|
0.3
|
0.3
|
0.3
|
0.3
|
0.3
|
0.4
|
0.4
|
0.4
|
0.3
|
0.3
|
0.4
|
0.4
|
0.4
|
0.4
|
0.4
|
|
A23
|
Oscar by the Sea
|
0.2
|
0.2
|
0.2
|
0.2
|
0.2
|
0.2
|
0.2
|
0.2
|
0.2
|
0.2
|
0.2
|
0.2
|
0.2
|
0.2
|
0.2
|
0.2
|
0.2
|
|
A24
|
Tseung Kwan O
Sport Ground
|
0.2
|
0.2
|
0.2
|
0.2
|
0.1
|
0.1
|
0.2
|
0.2
|
0.2
|
0.1
|
0.2
|
0.2
|
0.2
|
0.2
|
0.2
|
0.2
|
0.2
|
|
A25
|
Tseung Kwan O
Town Park
|
0.1
|
0.1
|
0.1
|
0.1
|
0.1
|
0.2
|
0.2
|
0.1
|
0.1
|
0.1
|
0.1
|
0.2
|
0.1
|
0.2
|
0.2
|
0.1
|
0.2
|
|
A26
|
Leung Sing Tak Primary School
|
0.2
|
0.2
|
0.2
|
0.2
|
0.1
|
0.1
|
0.2
|
0.2
|
0.2
|
0.1
|
0.1
|
0.2
|
0.2
|
0.2
|
0.2
|
0.2
|
0.1
|
|
A27
|
Nan Fung Plaza
|
0.2
|
0.2
|
0.2
|
0.1
|
0.1
|
0.1
|
0.2
|
0.2
|
0.2
|
0.1
|
0.1
|
0.2
|
0.2
|
0.2
|
0.2
|
0.2
|
0.2
|
|
A28
|
St Andrew's Church
|
0.2
|
0.1
|
0.1
|
0.1
|
0.1
|
0.1
|
0.2
|
0.1
|
0.1
|
0.1
|
0.1
|
0.2
|
0.2
|
0.1
|
0.1
|
0.1
|
0.2
|
|
A29
|
Fung Ching Memorial Primary School
|
0.1
|
0.2
|
0.1
|
0.1
|
0.1
|
0.1
|
0.2
|
0.2
|
0.1
|
0.1
|
0.1
|
0.2
|
0.2
|
0.2
|
0.2
|
0.1
|
0.1
|
|
A30
|
On Ning Garden
|
0.1
|
0.1
|
0.1
|
0.1
|
0.1
|
0.1
|
0.2
|
0.1
|
0.1
|
0.1
|
0.1
|
0.2
|
0.2
|
0.1
|
0.1
|
0.1
|
0.2
|
|
A31
|
Sheung Ning Playground
|
0.1
|
0.1
|
0.1
|
0.1
|
0.1
|
0.2
|
0.1
|
0.1
|
0.1
|
0.1
|
0.1
|
0.2
|
0.1
|
0.1
|
0.1
|
0.1
|
0.2
|
|
A32
|
Tseung Kwan O
Swimming Pool
|
0.1
|
0.1
|
0.1
|
0.1
|
0.1
|
0.2
|
0.1
|
0.1
|
0.1
|
0.1
|
0.1
|
0.2
|
0.1
|
0.1
|
0.1
|
0.2
|
0.2
|
|
A33
|
La Cite Noble
|
0.2
|
0.2
|
0.2
|
0.2
|
0.2
|
0.1
|
0.2
|
0.2
|
0.2
|
0.2
|
0.2
|
0.2
|
0.2
|
0.2
|
0.2
|
0.2
|
0.2
|
|
A34
|
Yuk Ming Court
|
0.2
|
0.2
|
0.2
|
0.2
|
0.2
|
0.2
|
0.2
|
0.2
|
0.2
|
0.2
|
0.2
|
0.2
|
0.2
|
0.2
|
0.2
|
0.2
|
0.2
|
|
A35
|
Ming Tak Estate
|
0.2
|
0.2
|
0.2
|
0.2
|
0.2
|
0.2
|
0.2
|
0.2
|
0.2
|
0.2
|
0.2
|
0.2
|
0.2
|
0.2
|
0.2
|
0.2
|
0.2
|
|
A36
|
Tin Ha Wan Village
|
0.2
|
0.2
|
0.2
|
0.2
|
0.2
|
0.2
|
0.2
|
0.2
|
0.2
|
0.2
|
0.2
|
0.2
|
0.2
|
0.2
|
0.2
|
0.2
|
0.2
|
|
A37
|
Tseung Kwan O
Hospital
|
0.1
|
0.2
|
0.2
|
0.2
|
0.2
|
0.2
|
0.2
|
0.2
|
0.2
|
0.2
|
0.2
|
0.2
|
0.2
|
0.2
|
0.2
|
0.2
|
0.2
|
|
A38
|
Ocean Shore Phase I
|
0.2
|
0.2
|
0.2
|
0.2
|
0.2
|
0.2
|
0.2
|
0.2
|
0.2
|
0.2
|
0.2
|
0.2
|
0.2
|
0.2
|
0.2
|
0.2
|
0.2
|
|
A39
|
Choi Ming Estate, Choi Yiu Court
|
0.1
|
0.1
|
0.1
|
0.1
|
0.2
|
0.2
|
0.1
|
0.1
|
0.2
|
0.2
|
0.2
|
0.2
|
0.2
|
0.2
|
0.2
|
0.2
|
0.2
|
|
A40
|
Park Central Block 1
|
0.2
|
0.1
|
0.1
|
0.2
|
0.2
|
0.1
|
0.2
|
0.2
|
0.2
|
0.2
|
0.2
|
0.2
|
0.2
|
0.2
|
0.2
|
0.2
|
0.2
|
|
A41
|
Bauhinia Garden
Block 5
|
0.2
|
0.2
|
0.2
|
0.2
|
0.2
|
0.2
|
0.2
|
0.2
|
0.2
|
0.2
|
0.2
|
0.2
|
0.2
|
0.2
|
0.2
|
0.2
|
0.2
|
|
A42
|
Heng Fa Chuen
|
0.3
|
0.2
|
0.2
|
0.2
|
0.2
|
0.2
|
0.2
|
0.2
|
0.2
|
0.2
|
0.2
|
0.2
|
0.2
|
0.2
|
0.2
|
0.2
|
0.2
|
|
A43
|
Island Resort
|
0.5
|
0.4
|
0.4
|
0.2
|
0.3
|
0.2
|
0.4
|
0.3
|
0.3
|
0.3
|
0.2
|
0.2
|
0.2
|
0.2
|
0.2
|
0.1
|
0.1
|
|
5-second Odour Criterion
|
5
|
5
|
5
|
5
|
5
|
5
|
5
|
5
|
5
|
5
|
5
|
5
|
5
|
5
|
5
|
5
|
5
|
|
Notes:
(a) 5-second
odour concentrations predicted at different elevations of ASRs in different
worst case for different source heights are presented in Annex A6-1.
(b) Bold and
underlined figures show exceedance of
5-second odour criterion.
(c) Since
the waste filling area will be small when the waste filling height is at
130m, therefore, only 2 worst cases were identified in the assessment.
|
4.7.4
Gaseous Emissions from LFG Flares and LFG
Generator During Aftercare Phase
During aftercare phase, landfilling will no longer take place but the LFG flares,
the LTP and the LFG generator will continue to operate. However, as described in Section 4.5.3, the operation of the
thermal oxidiser will not be required during the aftercare phase and hence
there will be no gaseous emissions from the thermal oxidizer.
The highest predicted maximum hourly
average, daily average and annual average concentrations of NO2, SO2,
benzene and vinyl chloride are presented in Table
4.7f. The highest hourly and
daily average concentrations of CO are also presented in Table 4.7f. The
predicted concentrations of these air pollutants at different elevations of
ASRs are summarized in Annex A9-1. The emissions from HAESL and the general
background were included in the predictions.
NO2, CO and SO2
The highest
predicted NO2, CO and SO2 concentrations at different
elevations of the identified ASRs are low and well within the respective AQO
criteria. The worst affected height
within TKOIE is at 30m above ground.
Isopleths showing cumulative maximum hourly concentrations of NO2,
CO and SO2 at the 1.5 m above ground and the worst affected height
(30m above ground) within 500m of the Extension site boundary are plotted and
presented in Figures 4.7m to 4.7o, respectively. It is therefore concluded that the
operation of LFG flares, thermal oxidiser(s) and the LFG generator during the
aftercare phase will not cause adverse air quality impact to the identified
ASRs.
Benzene, Vinyl Chloride and VOCs
Non-cancer
Health Risk Assessment: The predicted maximum hourly and annual
average benzene and vinyl chloride concentrations (see Tables 4.7g and Annex A9-1)
are well below the respective reference acute and chronic concentrations (see Table 4.2d). Hence, the acute and chronic health
effects of benzene and vinyl chloride are considered to be insignificant (see Tables 4.2e and 4.2f).
Cancer
Health Risk Assessment: The highest calculated individual cancer
health risk levels of benzene and vinyl chloride and the total health risk
levels are presented in Table 4.7g.
The calculated individual cancer risk level of benzene and vinyl
chloride and total health risk levels at different elevations of ASRs during
each phase are summarized in Annex A9-2. The calculated total cancer health risk
levels are lower than 10-6 and they are considered to be low and
insignificant.
Table 4.7f Highest
Concentrations of NO2, CO, SO2, Benzene and Vinyl
Chloride in Different Time Averaging During the
Aftercare Phase
|
ASR
|
Location
|
Highest Hourly Average
Concentration (µg m-3) (a) (b)
|
Highest Daily Average
Concentration (µg m-3) (a) (b)
|
Highest 8-hr Average Concentration
(µg m-3) (a) (b)
|
Highest Annual Average
Concentration (µg m-3) (a) (b)
|
|
|
|
NO2
|
CO
|
SO2
|
Benzene
|
Vinyl Chloride
|
NO2
|
SO2
|
CO
|
NO2
|
SO2
|
Benzene
|
Vinyl Chloride
|
|
A1-1
|
Proposed
C&DM Handling Facility
|
75
|
1350
|
24
|
2.103
|
5.100
|
66.5
|
18.8
|
1315
|
66.1
|
18.08
|
2.100
|
5.100
|
|
A1-2 (1)
|
Planned
Industrial Uses in TKO 137 (south of Extension) - 1
|
129
|
2273
|
118
|
2.147
|
5.104
|
85.7
|
49.5
|
1764
|
67.0
|
19.48
|
2.101
|
5.100
|
|
A1-2 (2)
|
Planned Industrial
Uses in TKO 137 (south of Extension) - 2
|
73
|
1395
|
28
|
2.105
|
5.102
|
67.2
|
19.6
|
1342
|
66.1
|
18.10
|
2.100
|
5.100
|
|
A1-3 (1)
|
Planned
Industrial Uses in TKO 137 (south of TVB City) – 1
|
68
|
1328
|
21
|
2.102
|
5.100
|
66.4
|
18.6
|
1306
|
66.1
|
18.07
|
2.100
|
5.100
|
|
A1-3 (2)
|
Planned
Industrial Uses in TKO 137 (south of TVB City) - 2
|
68
|
1326
|
21
|
2.102
|
5.100
|
66.7
|
19.1
|
1311
|
66.1
|
18.07
|
2.100
|
5.100
|
|
A2
|
TVB City
|
68
|
1326
|
21
|
2.102
|
5.100
|
66.4
|
18.5
|
1306
|
66.0
|
18.06
|
2.100
|
5.100
|
|
A3
|
HAESL
|
68
|
1325
|
21
|
2.102
|
5.100
|
66.7
|
18.4
|
1302
|
66.2
|
18.06
|
2.100
|
5.100
|
|
A4
|
HAECO
Component Overhaul Building
|
75
|
1326
|
21
|
2.102
|
5.100
|
67.0
|
18.4
|
1302
|
66.1
|
18.06
|
2.100
|
5.100
|
|
A7
|
Yan Hing Machinery Industrial Building
|
74
|
1326
|
21
|
2.102
|
5.100
|
66.7
|
19.0
|
1308
|
66.1
|
18.09
|
2.100
|
5.100
|
|
A8
|
Apple Daily
|
84
|
1326
|
21
|
2.102
|
5.100
|
67.3
|
18.8
|
1309
|
66.1
|
18.09
|
2.100
|
5.100
|
|
Background
Concentration
|
66
|
1294
|
18
|
2.1
|
5.1
|
66
|
18
|
1294
|
66
|
66.1
|
2.1
|
5.1
|
|
AQO /
Chronic or Acute Reference Concentration
|
300
|
30,000
|
800
|
1,300 (c)
|
180,000 (c)
|
150
|
350
|
10,000
|
80
|
80
|
30 (c)
|
100 (c)
|
|
Notes:
(a)
Detailed Assessment Results are summarized in Annex A9-1.
(b)
Background NO2, CO and SO2
(presented in Table 4.3a)
concentrations were included in the results.
(c)
Acute/Chronic Reference Concentrations are referred to Table 4.2d.
|
Table 4.7g Highest
Calculated Cancer Health Risk Levels of Benzene and Vinyl Chloride During the Aftercare Phase
|
ASR
|
Location
|
Individual
Highest Calculated Cancer Health Risk Level (a) (b)
|
Total
Cancer Health Risk Level
|
|
|
|
Benzene
|
Vinyl
Chloride
|
|
|
A1-1
|
Proposed C&DM Handling
Facility
|
3.1E-10
|
8.8E-11
|
4.0E-10
|
|
A1-2 (1)
|
Planned Industrial Uses in
TKO 137 (south of Extension) - 1
|
5.9E-09
|
8.8E-10
|
6.7E-09
|
|
A1-2 (2)
|
Planned Industrial Uses in
TKO 137 (south of Extension) - 2
|
4.7E-10
|
8.8E-11
|
5.6E-10
|
|
A1-3 (1)
|
Planned Industrial Uses in
TKO 137 (south of TVB City) - 1
|
3.1E-10
|
8.8E-11
|
4.0E-10
|
|
A1-3 (2)
|
Planned Industrial Uses in
TKO 137 (south of TVB City) - 2
|
3.1E-10
|
8.8E-11
|
4.0E-10
|
|
A2
|
TVB City
|
2.3E-10
|
8.8E-11
|
3.2E-10
|
|
A3
|
HAESL
|
2.3E-10
|
8.8E-11
|
3.2E-10
|
|
A4
|
HAECO Component Overhaul
Building
|
2.3E-10
|
8.8E-11
|
3.2E-10
|
|
A7
|
Yan Hing Machinery Industrial
Building
|
3.9E-10
|
8.8E-11
|
4.8E-10
|
|
A8
|
Apple Daily
|
3.9E-10
|
8.8E-11
|
4.8E-10
|
|
Notes:
(a)
Detailed calculated health risk levels are
summarized in Annex 9-2.
(b)
Unit risk factors of benzene and vinyl chloride (as
presented in Table 4.2b) have been
used for the calculation.
|
4.7.5
Odour Emissions from the Operation of LTP
during Aftercare Phase
As
discussed in Section 4.5.3, during
this phase, the sources of odour emissions will be the two SBR tanks. With reference to the total odour
emission rates summarized in Table 4.6e,
the total odour emission rate of SBRs is only 6% of
the total during landfill operation.
According
to the odour impacts predicted for the last waste tipping phase (ie Phase 6, the source height at 130m), no exceedance of odour criterion was predicted at any of the
ASRs and the odour impact is confined within the Extension. During the aftercare phase (without
waste tipping activities), as the odour emission rate is lower than that estimated
during the last tipping phase (see Table
4.7e), the predicted odour levels at the ASRs will be lower than those
predicted for the last tipping phase.
Hence, no adverse odour impact is anticipated during the aftercare
phase.
4.8.1
Construction Phase
The following control measures are set out
in the Air Pollution Control
(Construction Dust) Regulations and will be implemented to limit the dust
emissions from the construction works.
Blasting
·
The
area within 30m of the blasting area will be wetted prior to blasting.
·
Blasting
will not be carried out when the strong wind signal or tropical cyclone warning
signal No. 3 or higher is hoisted, unless this is with the express prior
permission of the Commissioner of Mines.
·
Loose
material and stones in the Site will be removed prior to the blast operation.
·
Blast
nets, screens and other protective covers will be used to prevent the
projection of flying fragments and material resulting from blasting.
Rock Drilling
·
Watering
will be carried out at the rock drilling activities to avoid fugitive dust
emissions.
Site Access Road
·
The
main haul road will be kept clear of dusty materials or sprayed with water.
·
The
main haul road will be laid with aggregate or gravel.
·
Vehicle
speed will be limited to 10 kph.
Stockpiling of Dusty Materials
·
Any
stockpile of dusty materials will be covered entirely by impervious sheeting or
placed in an area sheltered on the top and three sides or sprayed with water so
as to ensure that the entire surface is wet.
Loading, unloading or transfer of dusty
materials
·
All
dusty materials will be sprayed with water immediately prior to any loading,
unloading or transfer operation so as to maintain the dusty material wet.
Site Boundary and Entrance
·
Where
a site boundary adjoins a road, street, service lane or other area accessible
to the public, hoarding of not less than 2.4m from ground level will be
provided along the entire length of that portion of the site boundary except
for the site entrance or exit.
Excavation
Works
·
Working
area of any excavation or earth moving operation will be sprayed with water
immediately before, during and immediately after the operation so as to ensure
that the entire surface is wet.
Building
Demolition
·
The
area where the demolition works are planned to take place will be sprayed with
water immediately prior to, during and immediately after the demolition
activities.
·
Any
dusty materials remaining after a stockpile is removed will be wetted with
water and cleared from the surface of roads or street.
Construction of the Superstructure of
Building
·
Effective
dust screens, sheeting or netting will be provided to enclose the scaffolding
from the ground level up to the highest level of the scaffolding.
The control measures recommended in the Best Practicable Means Requirement for
Mineral Works (Stone Crushing Plants) BPM
11/1 will be implemented during the operation of the stone crushing plant.
Good site practices such as regular
maintenance and checking of the diesel powered mechanical equipment will be
adopted to avoid any black smoke emissions and to minimize gaseous emissions.
4.8.2
Operation/Restoration Phase
Fugitive Emissions at Landfilling
Area at the Extension
The following measures will be implemented
to minimize any fugitive emissions during landfilling
at the Extension:
·
The
main haul road to the waste filling area will be watered regularly to keep wet
at any time.
·
The
exposed daily and intermediate covered areas will be compacted well to avoid fugitive
dust emission.
·
The
vehicle speed will be limited within the Extension.
·
Vehicle
washing bay will be provided to avoid vehicles carrying dust to public roads.
·
The
engine will be switched off when the diesel-driven equipment is idling.
·
The
construction equipment will be properly maintained to avoid any black smoke
emission.
·
Sufficient
underground landfill gas collection system will be provided to capture the
landfill gas generated as much as possible.
·
Periodic
inspections of the final cover will be undertaken to ensure that the capping
layer is in good conditions at all times.
Gaseous Emissions from the Operation of
LFG Treatment Facility, LTP and LFG Generator
No mitigation measures are required
associated with the gaseous emissions from the operation of LFG treatment
facility LTP and LFG generator as no exceedance of
criteria are predicted.
Odour Emissions from Waste Filling
Activities and Operation of LTP
Exceedance of the 5-second odour criterion was
predicted at some ASRs, mitigation measures are recommended to minimize the
odour impacts.
Odour management and control measures, as
summarized in Table 4.8a, will be
incorporated into the outline design.
These measures will be implemented during the operation/restoration
phase of the Extension to minimize the potential odour impacts to identified
ASRs.
Table 4.8a Summary
of Odour Management and Control Measures During
Operation/Restoration Phase
|
Proposed Odour Management and Control Measures (a)
|
|
(i)
Installing
deodorizers along the site boundary adjacent to the ASRs
|
|
(ii)
Erecting
a vertical barrier, wall or structure soften by planting rows of trees/shrubs
or landscape feature along the site boundary, particularly in the areas near
the ASRs
|
|
(iii)
Enclosing
the weighbridge area
(iv)
Providing
a vehicle washing facility before the exit of the landfill and providing
sufficient signage to remind RCV drivers to pass through the facility before
leaving the landfill
|
|
(v)
Reminding
the RCV drivers to empty the liquor collection sump and close the valve
before leaving the tipping face.
|
|
(vi)
Washing
down the area where spillage of RCV liquor is discovered promptly
|
|
(vii)
Reminding
operators to properly maintain their RCVs properly
and that liquor does not leak from the vehicles
|
|
(viii)
Installation
of vertical and/or horizontal LFG extraction system to enhance extraction of LFG
from the waste mass and hence minimise odour associated with fugitive LFG
emissions
|
|
(ix)
Progressive
restoration of the areas which reach the finished profile (a final capping
system including an impermeable liner will be put in place) and installation of
a permanent LFG extraction system
|
|
(x)
Maintaining
the size of the active tipping face only not greater than 40 m x 30 m, of
which the size of the active tipping face for MSW + construction waste will be
limited to 20 m x 30 m and the size of the active tipping face for
construction waste only will be limited to 20 m x 30 m
|
|
(xi)
Promptly
covering the MSW with soil or selected inert materials to reduce odour
emissions
|
|
(xii)
Maintaining
the size of the special waste trench not greater than 6m x 2.5m
|
|
(xiii)
Covering
daily covered area with 300mm of soil at 11pm
|
|
(xiv)
Covering
special waste trench with 600 mm of soil and an impervious liner after 5 pm
|
|
(xv)
Covering
the non-active tipping face with 600mm of soil and an impermeable liner (on
top of the intermediate cover), which will not only prevent odour emissions
from landfilled waste but also enhance LFG
extraction by the LFG extraction system
|
|
(xvi)
Applying
deodorizers or odour suppression agents to control odour emissions from the
active tipping face and special waste trench, if any, through spraying or
fogging equipment
|
|
(xvii) Providing a mobile
cover with retractable or suitable opening to cover the special waste trench
except during waste deposition.
The air trapped inside the trench will be extracted and scrubbed by a
mobile odour removal unit prior to discharge to the
atmosphere
|
|
(xviii) Providing thermal oxidizer (one duty and
one standby) for the LTP
|
|
(xix)
Enclosing
all the leachate storage and treatment tanks
(except for the SBR tanks) and diverting the exhaust air from these tanks to
a thermal oxidizer to avoid potential odour emissions from the LTP
|
|
Note:
(a)
Items
(iii) to (xv), (xviii) and (xix) have been considered in the assessment. As the removal efficiency of
deodorizer cannot be quantified, it was not included in the odour modelling. As a conservative assessment, the
odour modelling assumed that there were no cover and air scrubbing for the
special waste trench.
|
In particular, rephasing
of the waste tipping activities on-site has been considered to minimize the
potential odour impact at A1-3 and A2 as far as practicable. By avoiding waste tipping activities at
the northern area of the site in the months between July to November (see Figures 4.9a-1 and 4.9a-2), the number of exceedances can be reduced by 70% (maximum) at A2.
4.8.3
Aftercare Phase
No mitigation measures regarding gaseous
emission are required.
Odour management and control measures to
be carried out during aftercare phase are summarized in Table 4.8b.
Table 4.8b Summary
of Odour Management and Control Measures During
Aftercare Phase
|
Proposed Odour Management and Control Measures
|
|
(i)
Continue
to maintain the integrity of the capping system
|
|
(ii)
Provision
of vertical and/or horizontal LFG extraction system to enhance extraction of
LFG from the waste mass and hence minimise odour associated with fugitive LFG
emissions
|
|
(iii)
Enclosing
all the leachate storage and treatment tanks
(except for the SBR tanks) and diverting the exhaust air from these tanks to
an air scrubber or the flares to avoid potential odour emissions from the LTP
|
4.9
Residual Impacts
4.9.1
Construction Phase
No residual impact is anticipated after
the implementation of the recommended mitigation measures described in Section 4.8.1.
4.9.2
Operational/Restoration Phase
Gaseous Emissions from LFG Treatment
Facility and Thermal Oxidizers, Vehicle Emissions from Traffic associated with
the Extension and Fugitive Emissions from Active Tipping Face
No residual impact is anticipated
associated with the gaseous emissions from LFG treatment facility and LTP,
vehicle emissions and fugitive emissions from active tipping face.
Odour Emissions Arising from Waste Filling
Activities and Operation of LTP
As noted above the predicted odour levels
exceed the odour assessment criterion at those ASRs in close proximity to the
Extension and hence residual impacts are predicted.
TKO Area 137 (ie
A1-1 to A1-3) has been zoned “Other Specified Uses” annotated “Deep Waterfront
Industry”. The intent is for the
land adjacent to the Extension to be used for industrial uses. Under Column 1 in the OZP Explanatory
Note, 23 types of uses ()
are always permitted to be
located at TKO Area 137. Among
them, some of the permitted uses including government refuse collection point, public vehicle park and warehouse are considered less
sensitive to odour impacts than land zoned for residential, commercial or
institutional development.
Furthermore, under the HKPSG “acceptable uses” of land within 200m of
odour sources include industrial development. The waste tipping activities will be scheduled
to avoid waste tipping at the northern sectors of the Extension between July
and November in order to reduce the number of exceedances
of the odour criterion at A2 to the greatest extend feasible (please refer to Figures 4.9a-1 and 4.9a-2). Annex
A11-1 presents the reduction of odour levels and Annex A11-2 shows the reduction of the number of exceedances after rephasing. It also shows that the number of exceedances gradually reduces to zero over six years.
A2 is the nearest location of TVB City to
the Extension. It is predicted to
have residual impacts at this location when waste is being disposed in the
northern sector of the landfill (ie, Worst Case
3). No exceedances
are predicted at A2 when landfilling is in the middle
and southern sectors of the site.
With the proposed rephasing of landfilling activities (ie by
avoiding waste tipping at northern sector of the site between July and November),
the predicted highest odour concentrations at A2 will reduce from 14 OU to
9.5OU and the number of exceedances at A2 will
decline by 58% from 26 to 11 events in the first year and 71% from 21 to 6
events in the second year of operation (please see Annexes A10, A11-1 and A11-2). This is an upper bound estimate due to
the adoption of a series of conservative assumptions in the impact
assessment. As the landfill works
progress, the frequency of exceedances of the odour
criterion at A2 will diminish to zero over the six year period (ie, from 11 events in the first year of operation to 0
events in the last year).
Table 4.9a presents an assessment of
the residual impacts at the representative assessment points of the TKO Area
137 and TVB City (ie A1-1, A1-2 (1), A1-2 (2), A1-3
(1), A1-3 (2) and A2) with respect to the guidelines described in Section 4.4.3 and Annex 20 of the EIAO-TM.
Figures
4.9b-1 and 4.9b-2 show the zones of possible impact (the area with a
potential for exceedance of odour
criterion) and summarize the predicted highest odour
levels at A1-1 (the only committed facility at TKO Area 137 as identified
during the EIA Study) to A3 and the number of exceedances
during different waste tipping phases after rephasing. The figures indicate that the size of
the zones of possible impact (the area with a
potential for exceedance of odour
criterion) close to A1-3 and A2 are slightly reduced. It should be noted that only the ASRs located
downwind of the active tipping face may experience an odour level exceeding the
odour criterion and the actually affected area at any given time would be a
much smaller than the area within the 5OU contour line (see Figures
4.9b-1 and 4.9b-2).
In addition, the number of exceedances will be
reduced (ie, 71 instances will be reduced to 21
instances at A1-3 (1) in the first year) after rephasing
of the waste tipping activities for Phase 1. As the waste tipping face moves further
away from the ASRs as the Extension is developed, the number of exceedances decreases to zero over a six-year period. The southern and eastern areas of TVB
City may also be affected by emissions from the operation/restoration of the
Extension.
The residual
impacts will be infrequent, transient and limited to the areas within 350m from
the Extension and will not affect any residential developments. As discussed in Section
4.7.2, the odour emission rate of the special waste trench adopted in the
assessment is conservative and the actual rate is expected to be much lower as
the trench will be covered and the air inside the trench will be scrubbed prior
to discharge to the atmosphere.
Furthermore, no sludge will be received in the Extension. Hence, the residual impacts will be
lower and the number of exceedances will be less than
those predicted.
Taking account of
the nature of the developments affected (industrial and commercial premises),
the number of people impacted, the transient nature, low frequency and
magnitude of the exceedances, the residual impacts
are considered acceptable.
Odour assessment
criteria adopted by other countries was also referenced and the comparison with
the assessment results and different odour assessment
criteria adopted by other countries are summarized in Annex A12.
Table 4.9a Evaluation of Residual
Odour Impacts
|
Factors to Evaluate Residual
Impacts
|
TKO Area 137 (A1-1, A1-2 (1),
A1-2 (2), A1-3 (1) and A1-3 (2))
|
TVB City (A2)
|
|
Effects on public health and health of biota or risk
to life
|
TKO Area 137 has been zoned
”Other Specified Uses” annotated “Deep Waterfront Industry” for industrial
uses and some of the
permitted uses in this area under Column 1 in the OZP Explanatory Note (such
as government refuse collection point, public vehicle park and warehouse) are
not considered to be particularly sensitive to odour
impacts.
Impacts to public health
are not predicted and there is no reliable evidence linking odour to adverse health outcomes. Any health issues would be related to
emissions of substances such as VOCs. Regular monitoring at the boundary of
the existing SENT Landfill shows that concentrations of such substances
remain well within the trigger level.
Odour is widely considered to be related to
amenity value rather than public health.
No impact to the health of biota, are predicted
(including rare and/or endangered species).
|
Impacts to public health
are not predicted and there is no reliable evidence linking odour to adverse health outcomes. Regular monitoring at the boundary of
the existing SENT Landfill shows that concentrations of such substances
remain well within the trigger level.
Odour is widely considered to be related to
amenity value rather than public health.
No impact to the health of biota, are predicted
(including rare and/or endangered species).
|
|
Magnitude of the adverse
environmental impacts
|
The affected areas at the
worst affected height of the representative assessment points (ie A1-1, A1-2(1), A1-2(2), A1-3(1), and A1-3(2), at TKO
Area 137 during different waste tipping phases are indicated in Figures 4.7f to 4.7k and the zones of possible
impacts (the area with a potential for exceedance
of odour criterion) during different waste tipping
phases are also illustrated in Figures 4.7l-1 and 4.7l-2.
As discussed above,
industrial premises are planned for development in TKO Area 137 and 23 types
of uses are always permitted to be located at TKO Area 137 under Column 1 in the OZP Explanatory
Note. Some of the permitted uses
such as government refuse collection point, public vehicle park and warehouse are not
considered to be particularly sensitive to odour impacts.
There will be no concurrent
projects that generated similar type of odour in
the vicinity; therefore, no cumulative odour
impacts are predicted.
|
Without rephasing, the
affected areas at the worst affected height of the representative assessment
point (ie A2, which is the nearest point to the
Extension) at TVB City during different waste tipping phases are indicated in
Figures 4.7f to 4.7k and the affected zone during
different waste tipping phases are also illustrated in Figures 4.7l-1to 4.7l-2.
After rephasing of the
waste tipping activities (by avoiding waste tipping at northern sector
between July and November), the numbers and levels of exceedance
at the representative assessment point of TVB City will be significantly
reduced (please also refer to Annexes
A10-1 and A10-2 for detail).
|
Waste Tipping
|
No. of Exceedance
of 5-sec Odour Criterion
|
Highest 5-sec Odour Concentration
|
|
|
Without Rephasing
|
With Rephasing
|
% Reduction
|
Without Rephasing
|
With Rephasing
|
|
Phase 1
|
26
|
11
|
58
|
12.5
|
8.9
|
|
Phase 2
|
21
|
6
|
71
|
13.1
|
9.5
|
|
Phase 3
|
10
|
5
|
50
|
14.0
|
8.6
|
|
Phase 4
|
4
|
2
|
50
|
6.5
|
6.5
|
|
Phase 5
|
1
|
1
|
0
|
5.4
|
5.4
|
|
Notes:
(a)
Each
phase will last for about 1 year.
(b)
Please
refer to Annex A5 for detailed
calculation.
|
After rephasing
of the tipping operation, the highest 5-second odour
concentration predicted at A2 will be reduced to 9.5 OU and the number of exceedance per year will be reduced by about 70%
(maximum) at A2 and will diminish over time.
There will be no concurrent
projects that generated similar type of odour in
the vicinity; therefore, no cumulative odour
impacts are predicted.
|
|
Geographic extent of the
adverse environmental impacts
|
The residual impacts will be
localized and limited to the area in close proximity to the Extension (refer
to Figures 4.7f to 4.7k). Out of 43 ASRs assessed, only 4 ASRs
(in TKO Area 137 (consisting of group of 3 planned ASRs which are industrial
developments) and TVB City) will experience residual impacts. The Extension will not cause
widespread adverse odour impact to residential
developments. For all other ASRs,
the predicted odour impacts are well within the odour criterion.
The areas in TKO Area 137
which exceed the odour criterion are limited to a
distance of about 350 m from the Extension site boundary.
Long range transportation
of odour is not predicted.
|
The area which exceeds the odour criterion is limited to the southern and eastern
areas of the TVB City.
|
|
Duration and frequency of
the adverse environmental impacts
|
The predicted residual
impacts are intermittent and will last for about five years (from 2013 to
2017). The number and level of exceedance will reduce over time as the tipping area
moves to higher levels and further away from the ASRs. The residual impacts will be reduced
to zero.
|
After rephasing,
the number of exceedance of the 5-second odour criterion at the
representative assessment point of TVB City (ie A2,
nearest point to the Extension) will be reduced to a maximum of 11 events per
year and gradually decline to zero over six years. The predicted residual impacts are
intermittent and will last for about five years (from 2013 to 2017).
|
|
Likely size of the
community or the environment that may be affected by the adverse impacts
|
The number of workers in
the industrial developments at TKO Area 137 to be impacted by the residual
impacts will depend on future developments. The only committed development in the
TKO Area 137 is the CEDD’s C&DM Handling
Facility. With respect to the
nature of this development, it is anticipated that the number of workers
impacted will be less than 50.
According to the Adopted
Departmental Plan, L/TKO-137/1, TKO Area 137 is planned for PHI
development. With reference to
its explanatory note, it is stated that the maximum worker density should not
exceed 20 workers per hectare.
Based on the contour plots in Figures 4.7f to 4.7k, the maximum affected area
(area within contour line of 5OU) for all assessment cases is approximately
13.5 ha. Therefore, it is
estimated that up to 270 workers will be impacted.
|
It is estimated that the
total number of people working within the affected zone of A2 will be about
1,000.
According to the predicted odour levels at different elevations of A2 (refer to Annex A10-1), the worst affected
heights are 1.5m and 10m above ground during different waste tipping
phases. The buildings within the
affected area are equipped with centralised air
conditioning system and the fresh air intakes are located at the rooftop of
the TVB main building (ie 30m above ground) and at
the level of about 13m above ground for the buildings (which is the lowest)
along Wan Po Road. As the odour levels predicted at levels higher than 10m above
ground at A2 are well below the odour criterion,
there will be no adverse odour impact to the people
(about 900) working indoor.
In conclusion, 100 people
who are working outdoor will be potentially affected.
It should be noted that the
number of people affected will reduce when the waste tipping activities will
move higher and further away from the TVB City.
|
|
Degree to which the adverse
environmental impacts are reversible or irreversible
|
Odour impact is
transient in nature and therefore is reversible. After the Extension is closed and
restored, no residual impacts are anticipated.
|
Odour impact is transient
in nature and therefore is reversible.
After the Extension is closed and restored, no residual impacts are
anticipated.
|
|
Ecological context
|
N/A - Odour
nuisance will not cause adverse ecological impacts.
|
N/A - Odour
nuisance will not cause adverse ecological impacts.
|
|
Degree of disruption to
sites of cultural heritage
|
N/A – The Project will not
impact on cultural heritage resources.
|
N/A – The Project will not
impact on cultural heritage resources.
|
|
International and regional importance
|
It is not anticipated that
the residual odour impact will affect an issues of
international and regional concern.
|
It is not anticipated that
the residual odour impact will affect an issues of
international and regional concern.
|
|
Both likelihood and degree of uncertainty of adverse
environmental impacts
|
As the odour impact
assessment (including the odour modeling and odour sampling) has adopted a number of conservative
assumptions, it is considered that the predicted odour
impacts are overstated.
The odour emission rate of
construction waste tipping is conservative. The construction waste comprises
mainly wood and some inert materials and the odour
generated from this kind of waste is low compared to that generated from the
MSW covered with 300mm soil.
The number of exceedances
may vary due to the different meteorological condition in the future six
years of operation.
The odour emission rate of the trench adopted in
the assessment is conservative and the emissions will be much lower as the
trench will be covered and the air trapped inside the trench will be scrubbed
prior to discharge to the air as well as no sludge will be received in the
Extension. Hence, the level and
number of exceedances will be less than the
predicted in reality.
In Annex A3,
the sensitivity test demonstrated that doubling the odour emission rate of
the trench will only cause a slightly increase of the residual impact. Therefore, the uncertainty in the
odour emission rate of the trench at 30 °C would not cause significant increase
of residual impact.
Resolving uncertainties in the assessment would tend
to lead to a lowering of the predicted impacts.
|
As the odour impact
assessment (including the odour modeling and odour sampling) has adopted a number of conservative
assumptions, it is considered that the predicted odour
impacts are overstated.
The odour emission rate of
construction waste tipping is conservative. The construction waste comprises
mainly wood and some inert materials and the odour
generated from this kind of waste is low compared to that generated from the
MSW covered with 300mm soil.
The number of exceedances
may vary due to the different meteorological condition in the future six
years of operation.
The odour emission rate of the trench adopted in
the assessment is conservative and the emissions will be much lower as the
trench will be covered up and the air trapped inside the trench will be
scrubbed prior to discharge to the air as well as no sludge will be received
in the Extension. Hence, the
level and number of exceedances will be less than
the predicted in reality.
In Annex A3,
the sensitivity test demonstrated that doubling the odour emission rate of
the trench will only cause a slightly increase of the residual impact. Therefore, the uncertainty in the
odour emission rate of the trench at 30 °C would not cause significant increase
of residual impact.
Resolving uncertainties in the assessment would tend
to lead to a lowering of the predicted impacts.
|
4.9.3
Aftercare Phase
No adverse residual impacts are
anticipated.
4.10.1
Construction Phase
Excavation and filling activities for site
formation and blasting works are the major sources of dust nuisance. Dust levels, in terms of Total Suspended
Particulates (TSP) will be monitored, at A2 (TVB City) and the A1-3 (Planned
Industrial Uses in TKO 137 (south of TVB City) – 1) if industrial premise is
occupied during construction phase.
The proposed dust monitoring stations are illustrated in Figure 4.10a.
Dust monitoring will be conducted once every six days throughout the
site formation and blasting works to ensure that there will be no exceedance of dust criteria at the ASRs. Detailed EM&A requirements for dust
monitoring are presented in the EM&A Manual.
4.10.2
Operation/Restoration Phase
During operation/restoration phase, the
following monitoring activities should be undertaken:
Ambient TSP Monitoring at Site Boundary
24-hour TSP concentrations will be
monitored at the four designated air monitoring stations along the Extension
Site boundary (as shown in Figure 4.10a) once every six
days throughout the landfill operation/restoration phase.
Ambient VOC, Ammonia and Hydrogen Sulphide
(H2S) Monitoring at Site Boundary
Ambient VOCs (a
suite of VOCs same as identified in the existing SENT
Landfill, listed in EM&A Manual), ammonia and hydrogen sulphide (H2S)
concentrations will be monitored at the designated air monitoring stations (see
Figure
4.10a) along the site boundary at quarterly intervals throughout the
operation/restoration and aftercare phases.
Monitoring of Flares and Thermal Oxidizer
Stacks
The NO2,
CO, SO2, benzene, vinyl chloride and NMOC concentrations in flue gas
of the flares and thermal oxidiser stack will be monitored at monthly intervals
for the first 12 months of operation and thereafter at quarterly intervals
throughout the operation/restoration phase. Gas combustion temperature, exhaust gas
temperature and exhaust gas velocity will be monitored continuously.
Under the combustion temperature of the
thermal oxidiser, all ammonia will be destroyed. To confirm this design assumption, it is
recommended that the ammonia concentration in the flue gas of the thermal
oxidiser be monitored during the commissioning stage of the thermal
oxidiser. If required, an emission
standard will be set for ammonia for the thermal oxidiser based on the
monitoring results. If no ammonia
is detected in the flue gas during the decommissioning stage, the monitoring of
ammonia in the flue gas of the thermal oxidiser could be discontinued.
Monitoring of LFG Generator Stack
The NO2,
CO, SO2, benzene and vinyl chloride concentrations in flue gas of
the LFG generator stack will be monitored at monthly intervals for the first 12
months of operation and thereafter at quarterly intervals throughout the
operation/restoration phase.
Exhaust gas temperature and exhaust gas velocity will be monitored
continuously.
Odour Patrol
Odour patrols along the Extension site
boundary will be conducted on daily basis to detect any odour nuisance caused
by the operation of the Extension.
Detailed odour patrol requirement is presented in the Environmental Monitoring & Audit
(EM&A) Manual.
On-site Meteorological Station
A meteorological station will be
constructed on site to capture the wind data (wind speed and wind direction),
air temperature, rainfall and relative humidity as supporting information for
the EM&A data analysis. The
meteorological station will be erected at least 10m above ground located at the
highest point of the Extension and will not be obstructed by surrounding
structures.
Detailed EM&A requirements during
operation/restoration phase are presented in the EM&A Manual.
4.10.3
Aftercare Phase
Periodic inspections of the final cover will
be undertaken to ensure that the capping layer is in good conditions at all
times. As LFG and leachate will still be generated from the landfill, the
monitoring, summarized in Table 4.10a
will be conducted.
Table 4.10a Monitoring Programme During Aftercare Phase
|
Parameter
|
Monitoring Programme
|
|
24-hr TSP
|
· once every 6 days at four designated
locations along the site boundary when major maintenance works is required
|
|
Ambient VOCs, Ammonia and H2S
|
· VOCs, ammonia and H2S
· Monitoring frequency : quarterly
|
|
Stack emission
from flares
|
· NO2, CO, SO2,
benzene, vinyl chloride and NMOC
· Monitoring frequency : quarterly
· Gas combustion temperature, exhaust gas
temperature and exhaust gas velocity will be monitored continuously
|
|
Stack emission
from LFG generator
|
· NO2, CO, SO2,
benzene, and vinyl chloride
· Exhaust gas temperature and velocity
· Monitoring frequency : quarterly
|
|
Odour Patrol
|
· weekly patrol
along the Extension site boundary when major maintenance works is required
|
|
Meteorological
Station
|
· continue to
operate
|
Detailed monitoring and audits
requirements are presented in the EM&A Manual.
4.11.1
Construction Phase
Potential dust nuisance from blasting, rock
crushing, excavation and filling and gaseous emissions from construction plant
during construction of the Extension have been evaluated. With the implementation of the
recommended dust control measures and good construction site practices as
recommended in Section 4.8.1, it is
not anticipated that the construction of the Extension will cause adverse dust
and air quality impacts.
4.11.2
Operation/Restoration Phase
Gaseous Emissions
NO2, CO, SO2, and benzene
and vinyl chloride are the key air pollutants of concerns from the operation of
the LFG treatment facility, LTP and LFG generator. Taking account of the emissions from
HAESL and the general background, the predicted cumulative NO2, CO,
SO2, benzene and vinyl chloride are well within relevant AQOs, international chronic/acute reference and health risk
guidelines at different elevations of the identified ASRs throughout the
operation/restoration phase of the Extension. The predicted total cancer health risks
of benzene and vinyl chloride at the identified ASRs are very low.
The past 5-year monitoring data of the
ambient VOC concentrations at the site boundary of the existing SENT Landfill
indicates that the ambient VOC concentrations are low and within the respective
trigger levels. As the types waste
to be received at the Extension; the operation of the Extension will be similar
to the existing SENT Landfill; and the non-active tipping area will be covered
with 600 mm of soil and an impermeable liner which couples with a comprehensive
LFG collection system, it is anticipated that VOC emission will be lower. It is therefore not envisaged that the
operation of the Extension will cause adverse air quality impact to the
identified ASRs with respect to potential VOC emissions from the landfill.
Odour Impacts
The outline design of the Extension has
incorporated a number of good odour management and control measures (see Table 4.8a) which aim to minimise the
potential odour emissions during the operation/restoration phase of the
Extension. During the
operation/restoration phase, the landfilling
activities at the active tipping face and the special waste trench; and the
operation of the SBR tanks of the LTP have the potential to cause odour impacts
to the identified ASRs.
With the implementation of odour
management and control measures recommended in Table 4.8a, the maximum
5-second odour concentrations at various heights (from 1.5m to 90m above
ground) of all identified ASRs were predicted. No exceedances
of the odour criterion were predicted except those ASRs in the close vicinity
of the Extension site boundary (within 350m). Residual impacts were predicted in a
small area zoned for industrial development covering part of TKO Area 137 and TVB
City (A2) adjacent to the Extension boundary. The frequency of the exceedances
at TVB City will be reduced through the
adoption of rephrasing of waste tipping activity ().
Over the six year operation period, the number of exceedances
at this ASR is expected to diminish to zero as the separation distances and
heights between the active tipping face and the ASR increases. It should be noted that the odour
emission rate of the special waste trench adopted in the assessment is
conservative and the emissions will be much lower as the trench will be covered
and the air trapped inside the trench will be scrubbed prior to discharge to
the atmosphere ().
Hence, it is anticipated that the actual odour level and number of exceedances will be less than the predicted in this
assessment.
The residual
impacts will be infrequent, transient and limited to the areas within 350m from
the Extension and will not affect any residential developments. Taking account of the nature of the
developments affected (industrial and commercial premises), the number of
people impacted, the transient nature, low frequency, magnitude of the exceedances, and odour assessment
criteria adopted by other countries the residual impacts are considered
acceptable.
EM&A Requirement
Ambient TSP,
VOC, ammonia and H2S concentrations will be monitored at the
Extension Site boundary; stack emissions from flares, thermal oxidizers and LFG
generator will also be monitored and odour patrols will be conducted along the
Extension Site boundary on daily basis to detect any odour nuisance caused
throughout this phase.
4.11.3
Aftercare Phase
During aftercare
phase, air emission sources are primarily associated with the LFG treatment
facility and LTP. The Extension will
be sealed with a capping system (including an impermeable liner) and LFG will
be extracted and flared or utilised.
The vent gas produced in the enclosed tanks will be either diverted to
the flares or to an air scrubber prior to discharge to the atmosphere. If the vent gas is treated at the flare
(combusted at a temperature of 850oC), the odour compounds
(including ammonia) in the vent gas will be destroyed (similar to the situation
when the thermal oxidiser is in operation). If the flare is not in operation, the
vent gas will be treated by an air scrubber. The designed odour (including ammonia
gas) removal efficiency of the air scrubber will be at least 95%. The anticipated odour impact from the
scrubber emissions will be minimal.
In order to further minimise potential odour impacts, the scrubbed air
will be diverted to the air blower of the SBR tanks and used it as part of the
air source for the aeration process. The odour source will be
limited to the SBR tanks of the LTP.
As the emission strength and scale of the Extension operation during
this phase are significantly reduced compared to the operation/restoration
phase, no adverse odour impact is therefore, anticipated.
The potential air quality impact due to
the emissions from the LFG treatment facility and LFG generator has been
evaluated. No exceedances
of AQO criteria, reference acute/chronic concentrations and health risk
guidelines are predicted at any of the identified ASRs. It is therefore concluded that the
aftercare of the Extension will not cause adverse air quality impacts to the
identified ASRs.
The monitoring
activities for ambient VOCs, ammonia and H2S,
and stack emissions from flares and LFG generator will be continued into the
aftercare period whereas the ambient TSP monitoring and odour patrol will be
conducted when major maintenance works will be required.
The 39 individual VOCs include dichlorodifluoromethane, vinyl chloride,
methanol, ethanol, dimethyl sulphide, carbon
disulphide, methylene chloride, chloroform, methyl
propionate, butan-2-ol, 1,1,1-trchloroethane, 1,2-dichlroethane, benzene,
carbon tetrachloride, di-n-propyl ethene,
heptane, trichloroethylene, ethyl propionate, methyl
butyrate, methanethiol, toluene, ethyl butyrate,
octane, propyl propionate, 1,2-dibromoethane, n-butyl
acetate, tetrachloroethylene, ethylbenzene,
xylene, nonane, ethanethiol, terpenes, propyl benzene, decane,
dichlorobenzene, limonene, butyl benzene, undecane
and butanethiol.
These compounds may be found in LFG generated from municipal solid waste
landfill.
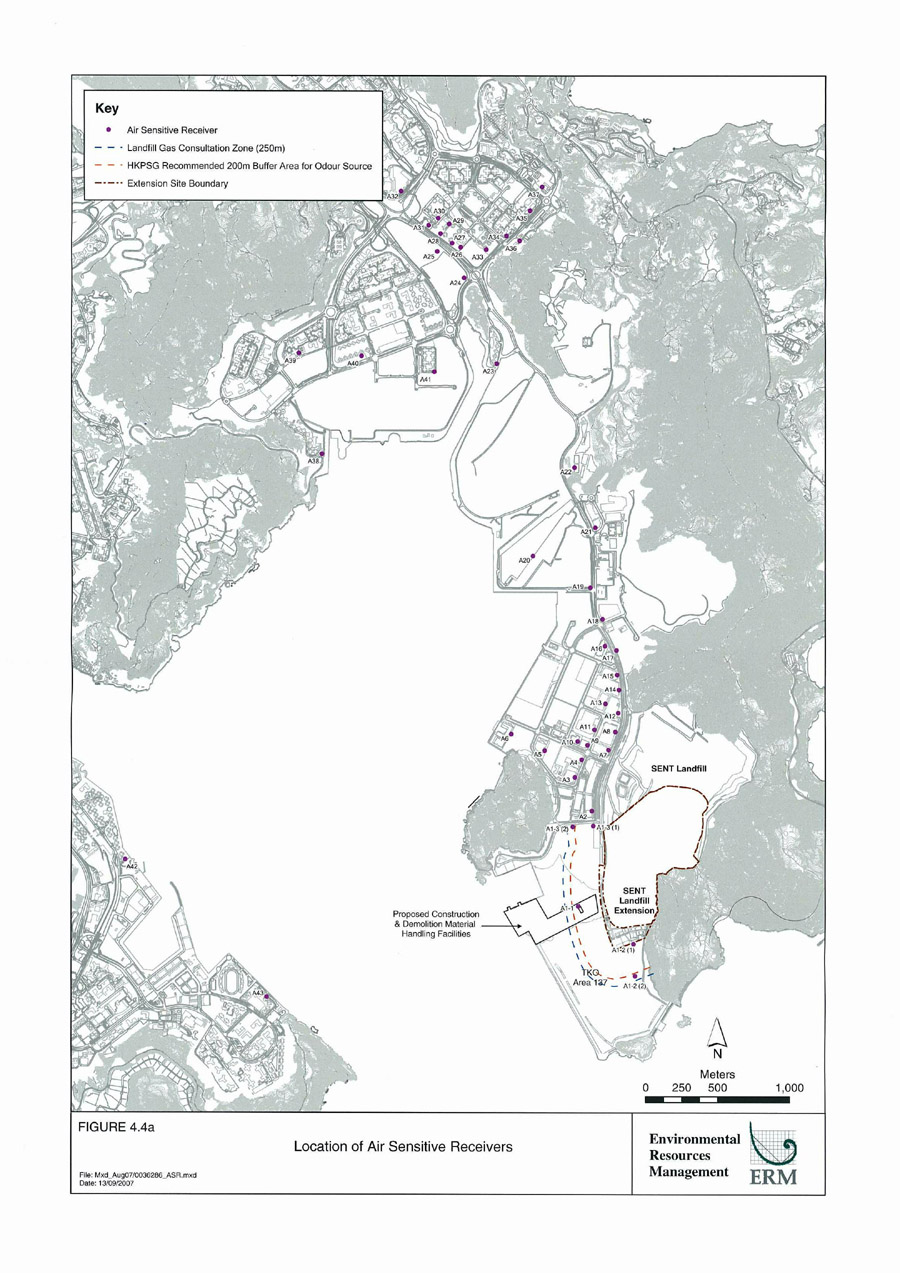
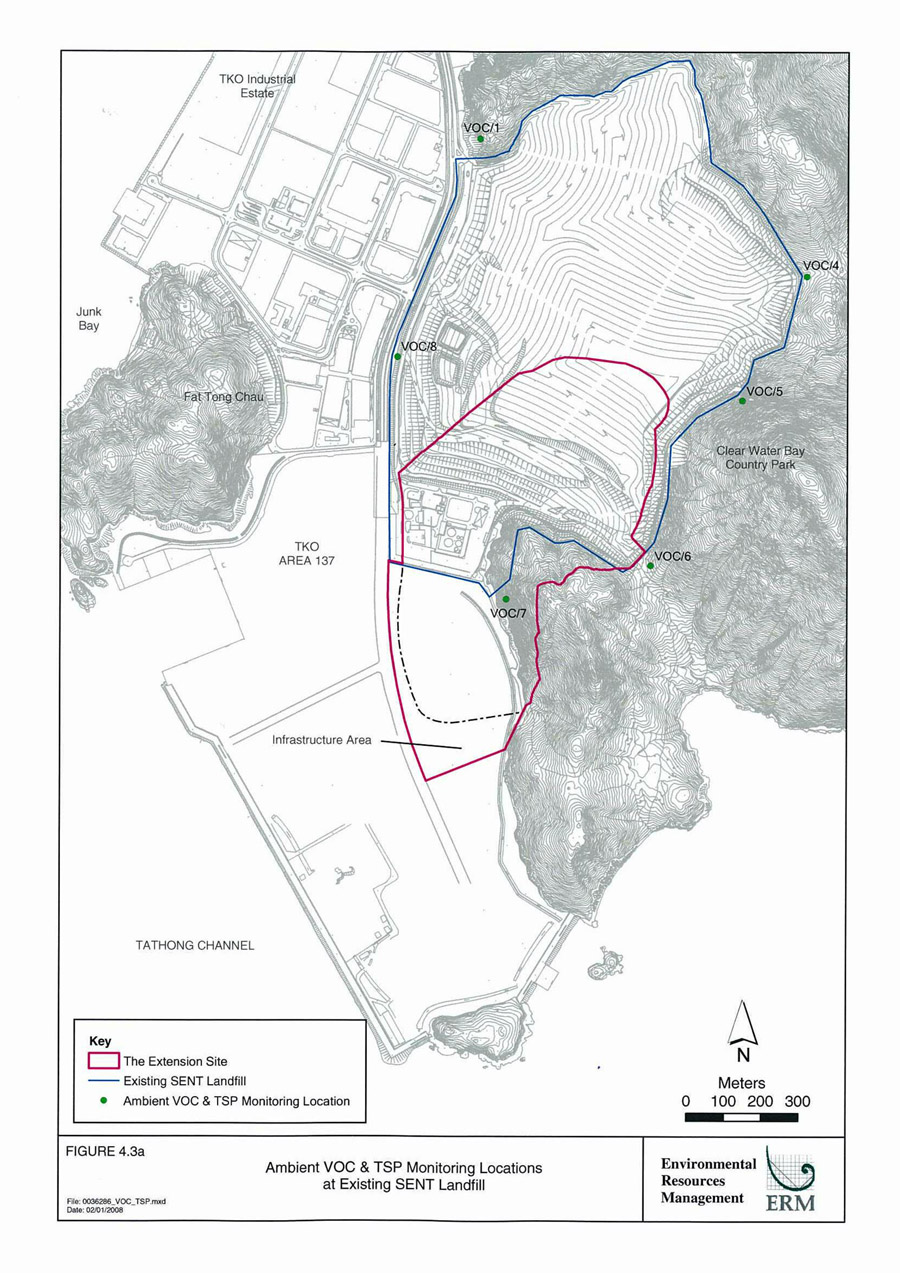
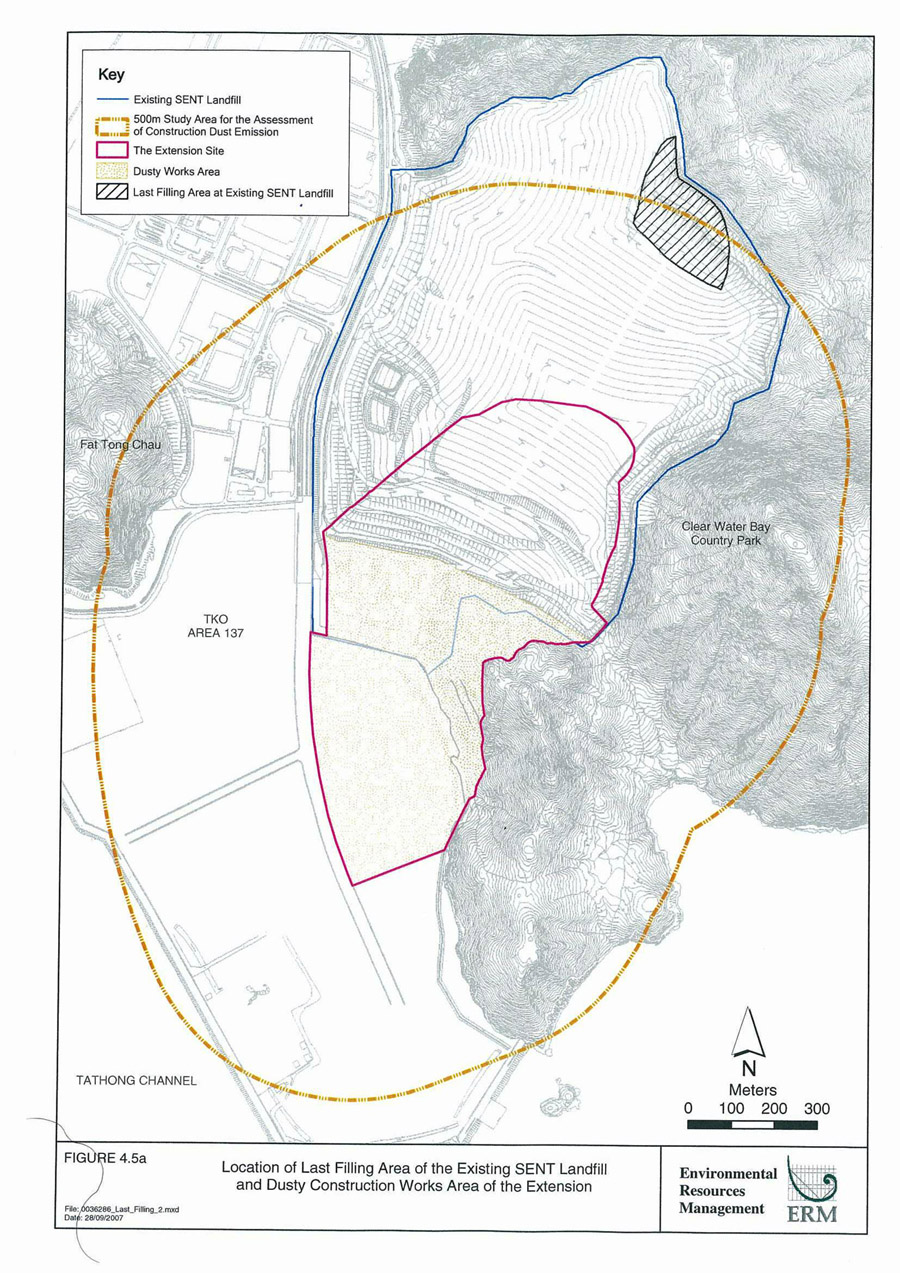
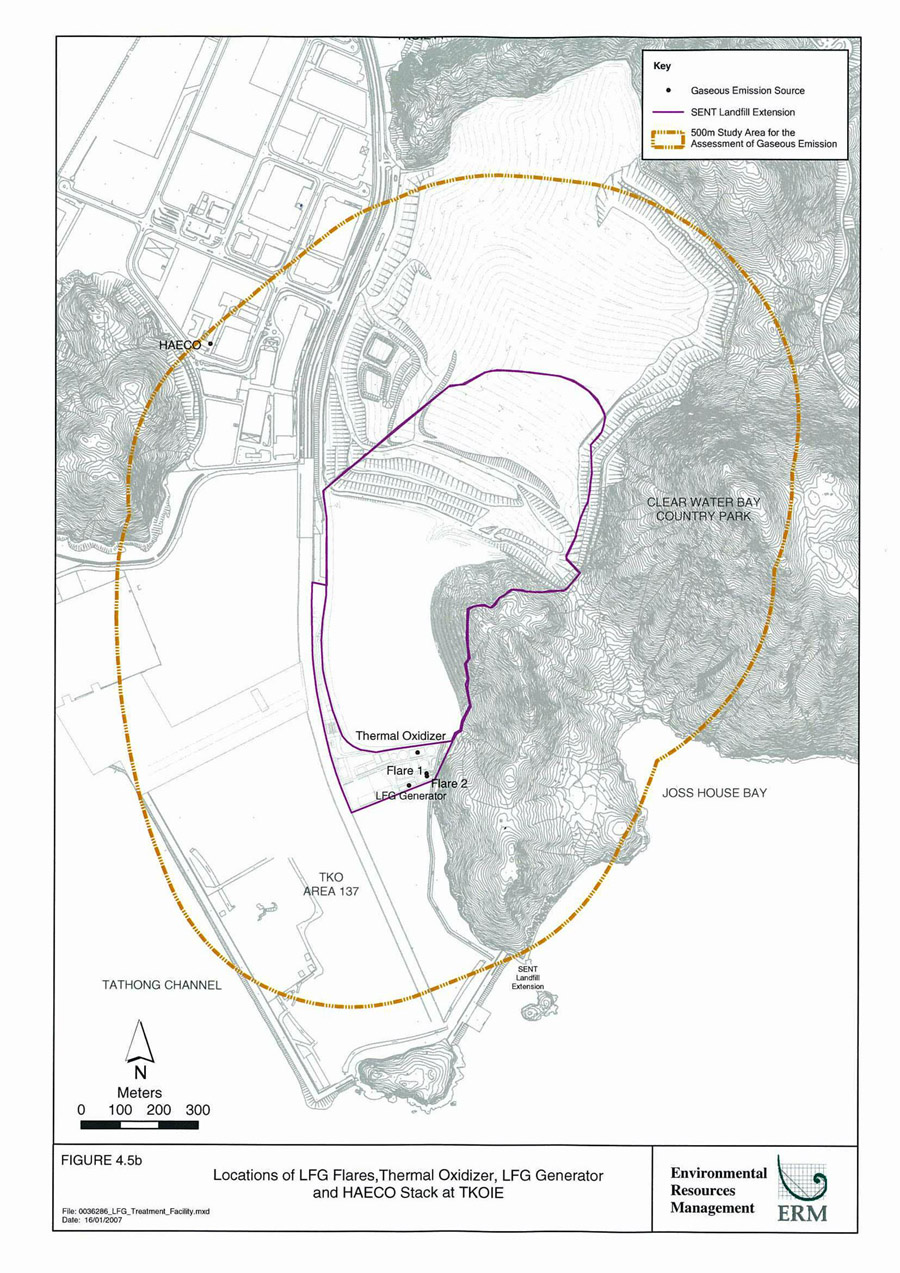
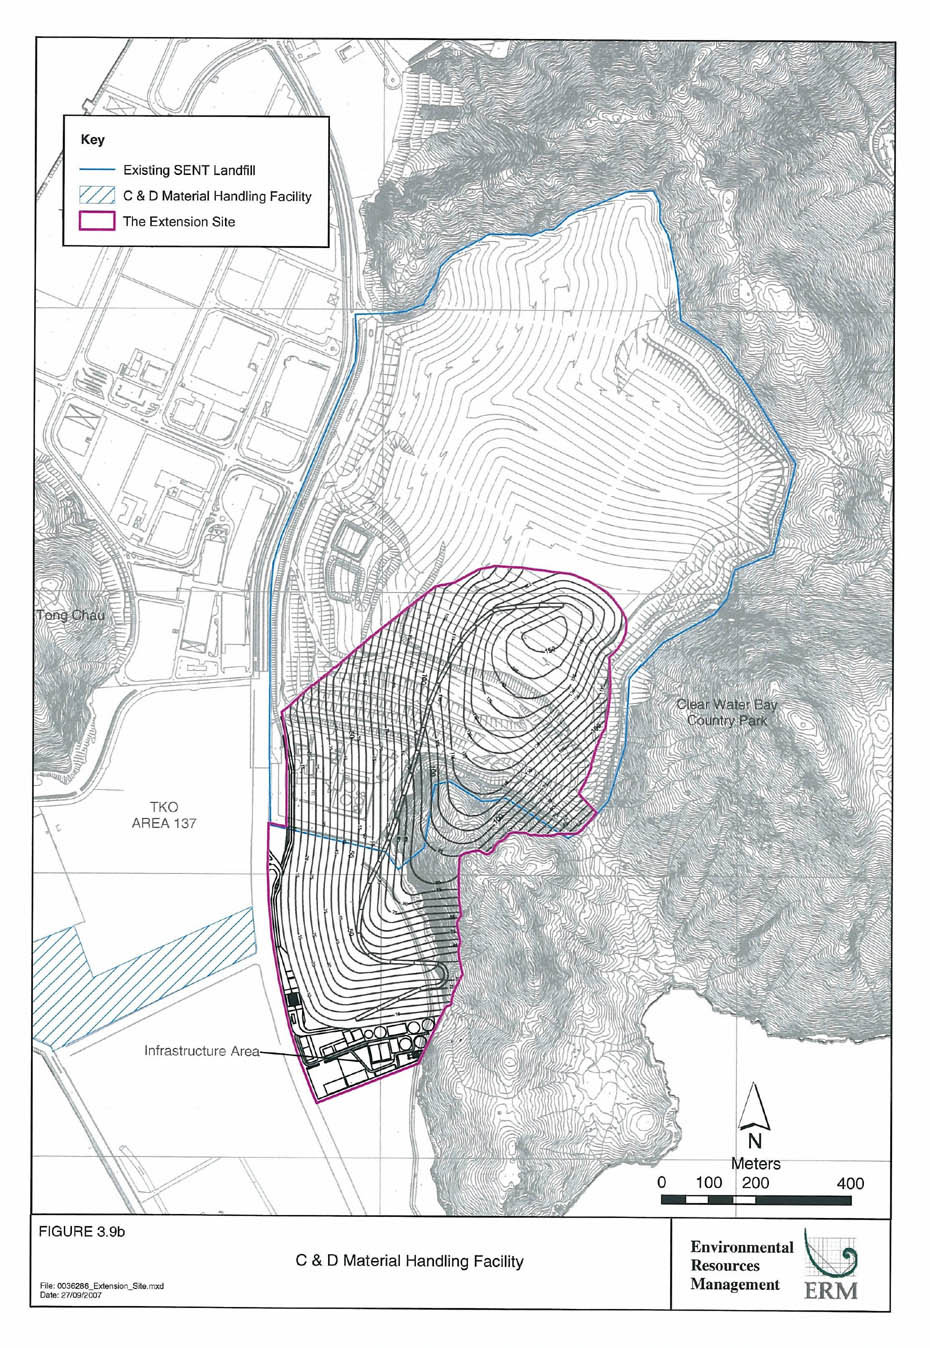
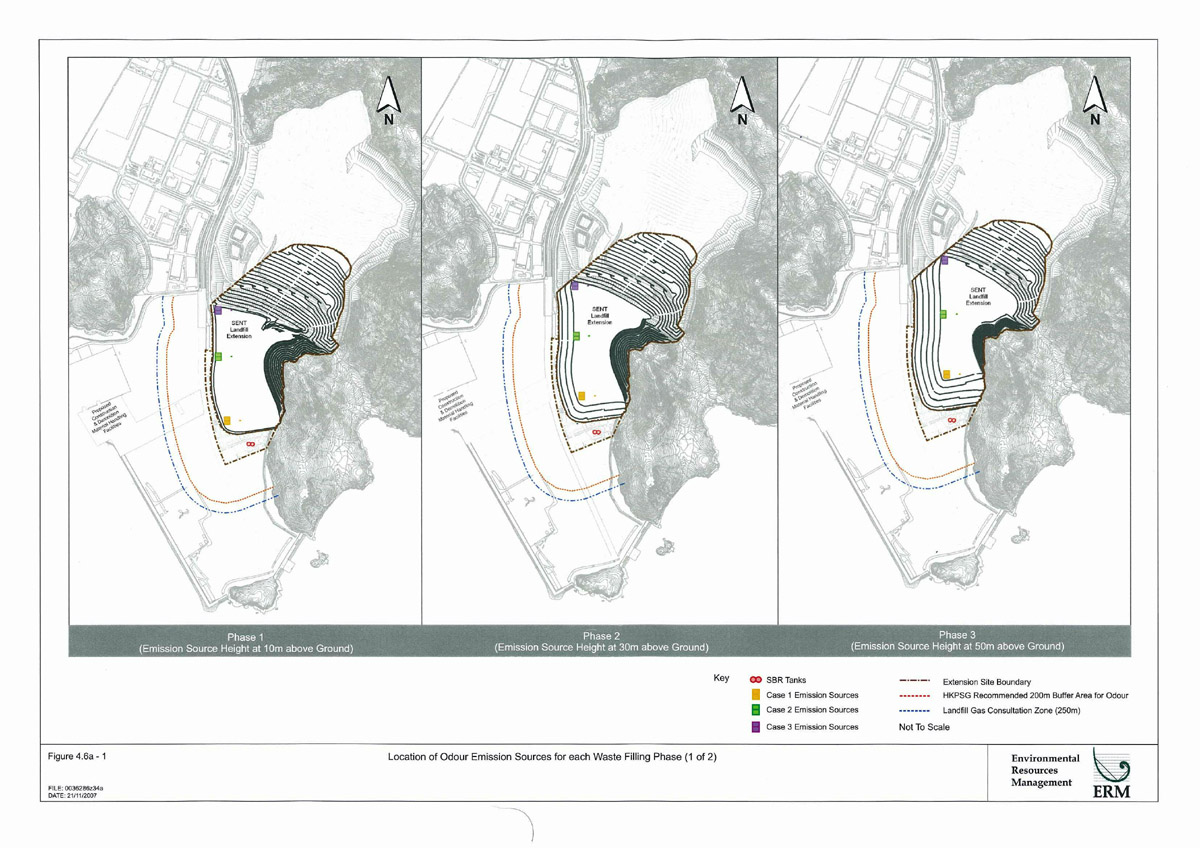
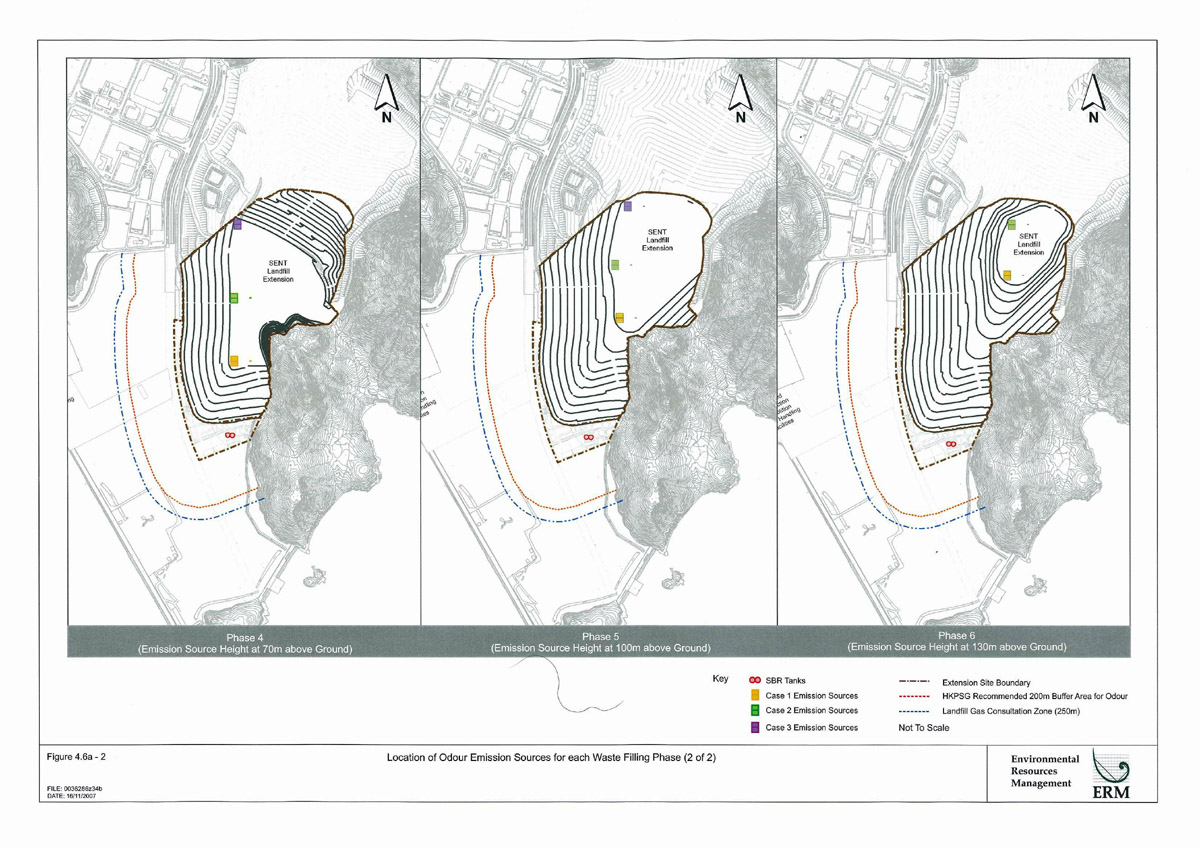
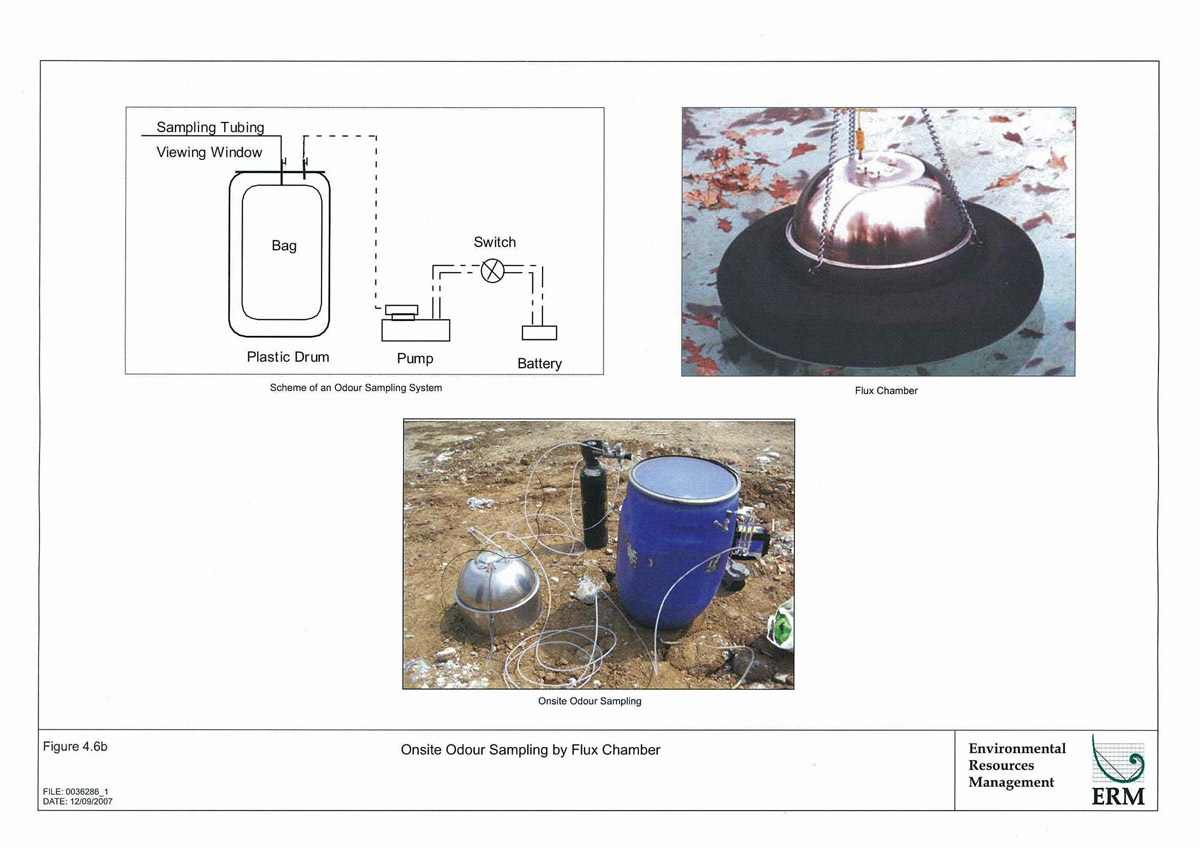
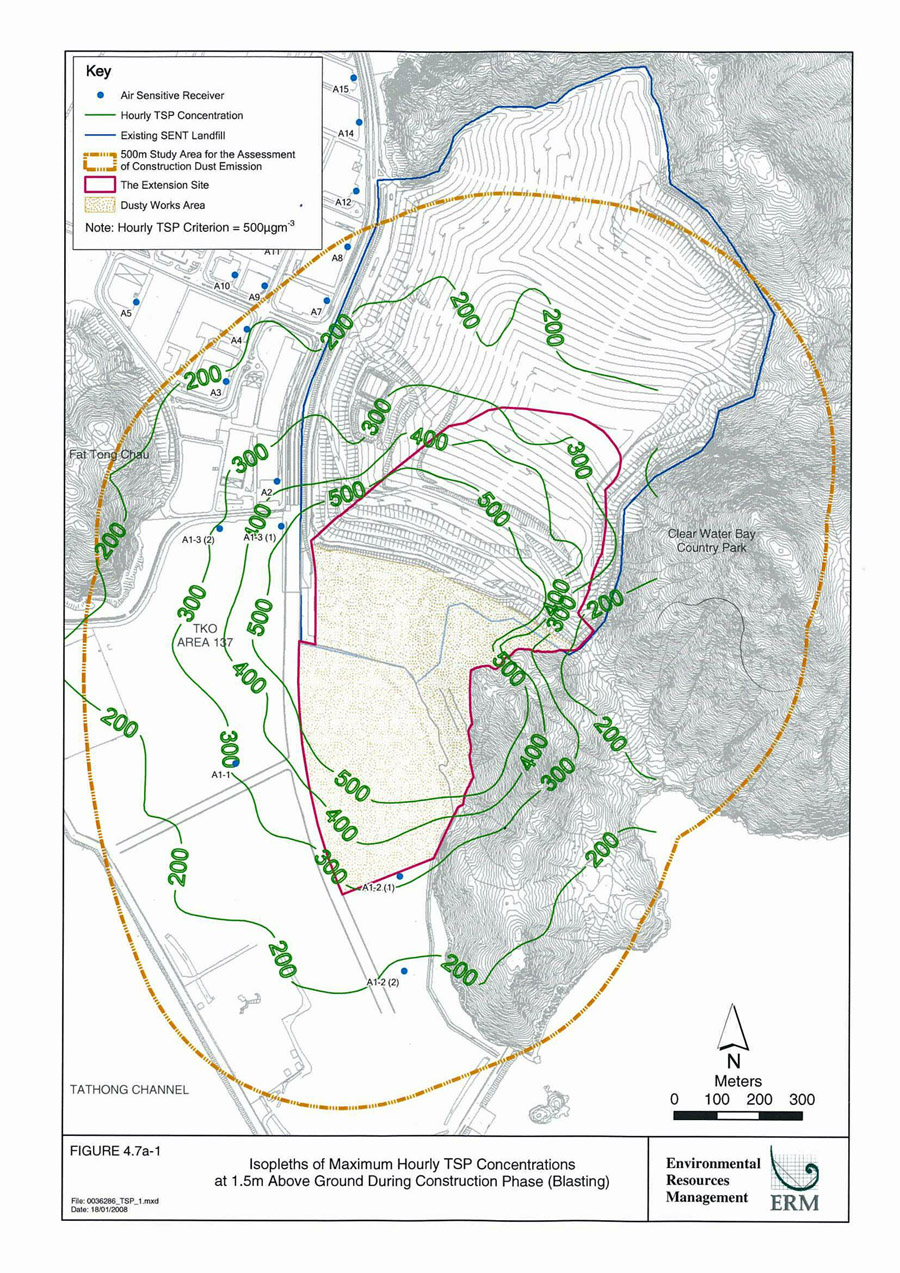
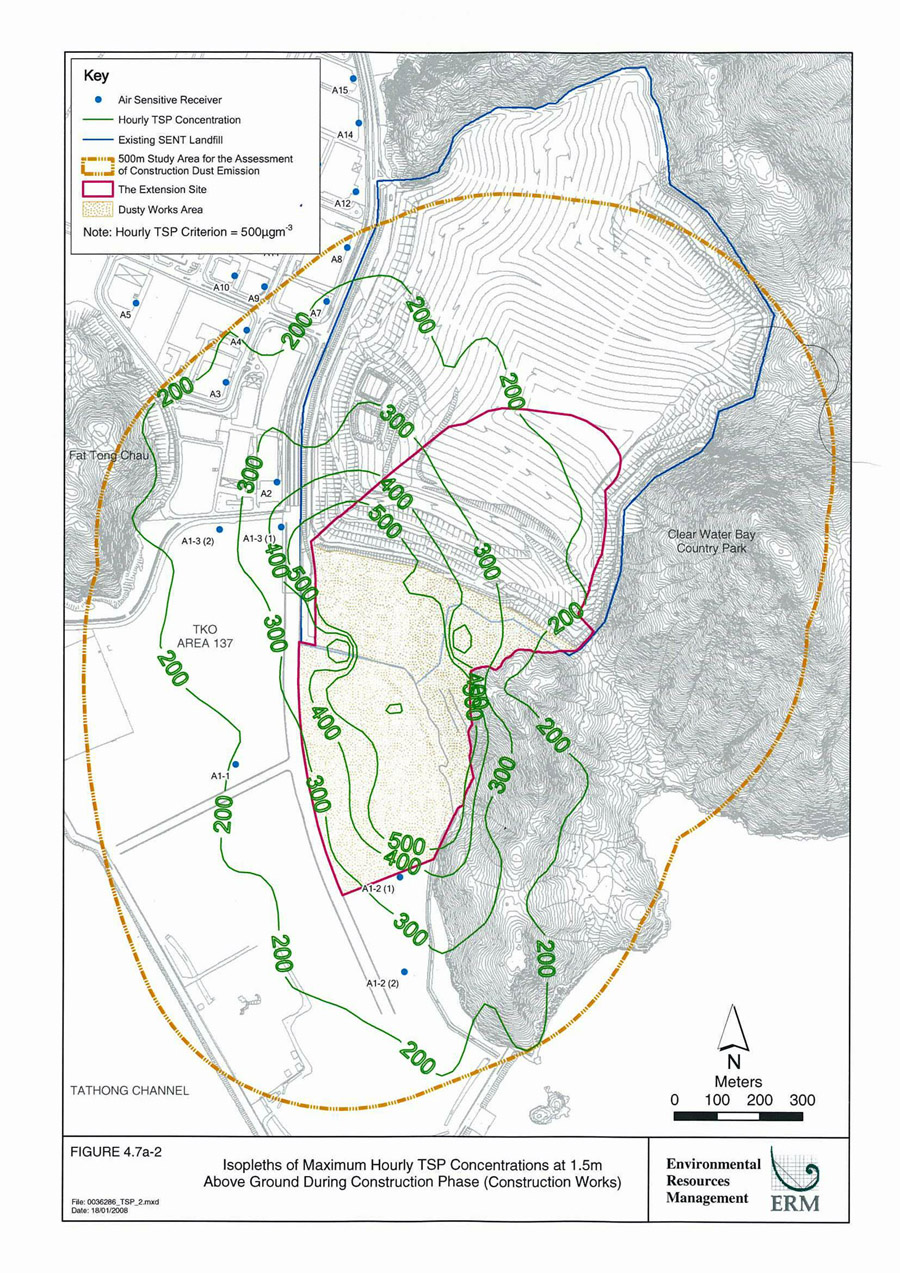
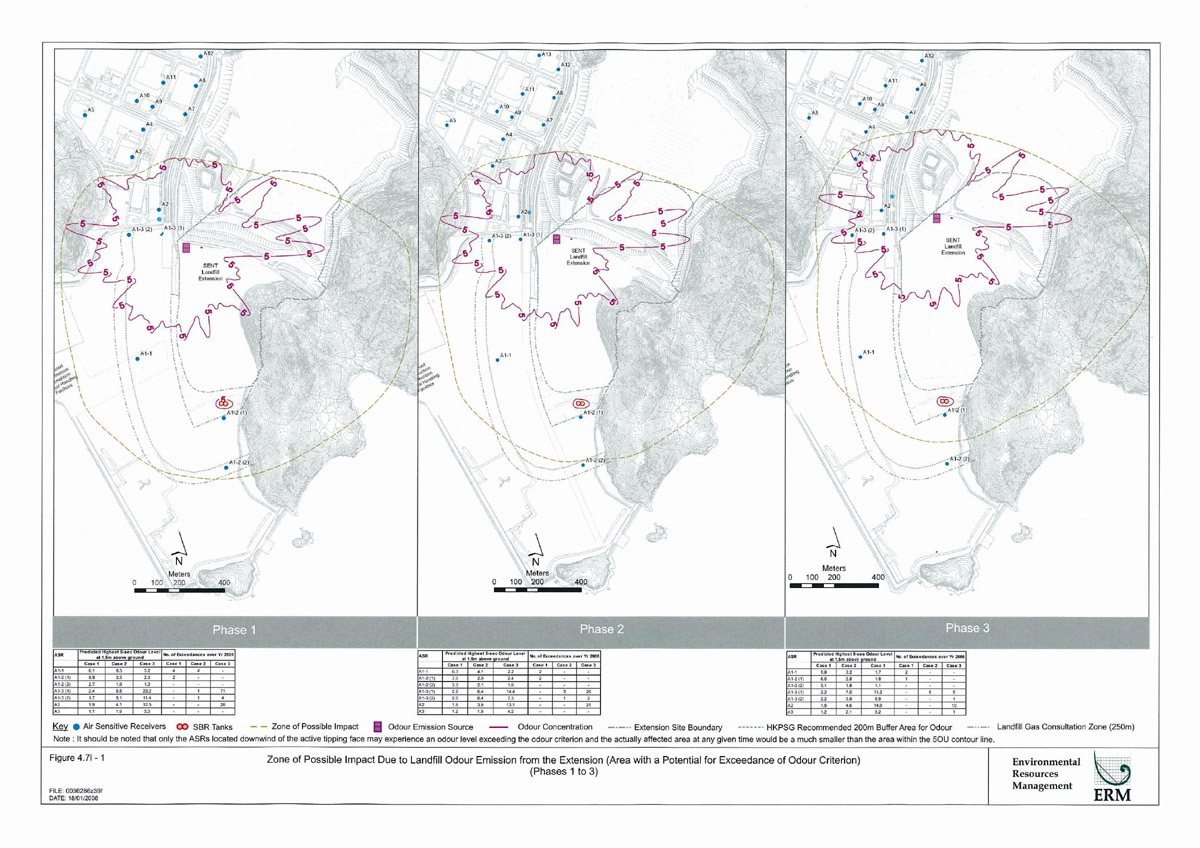
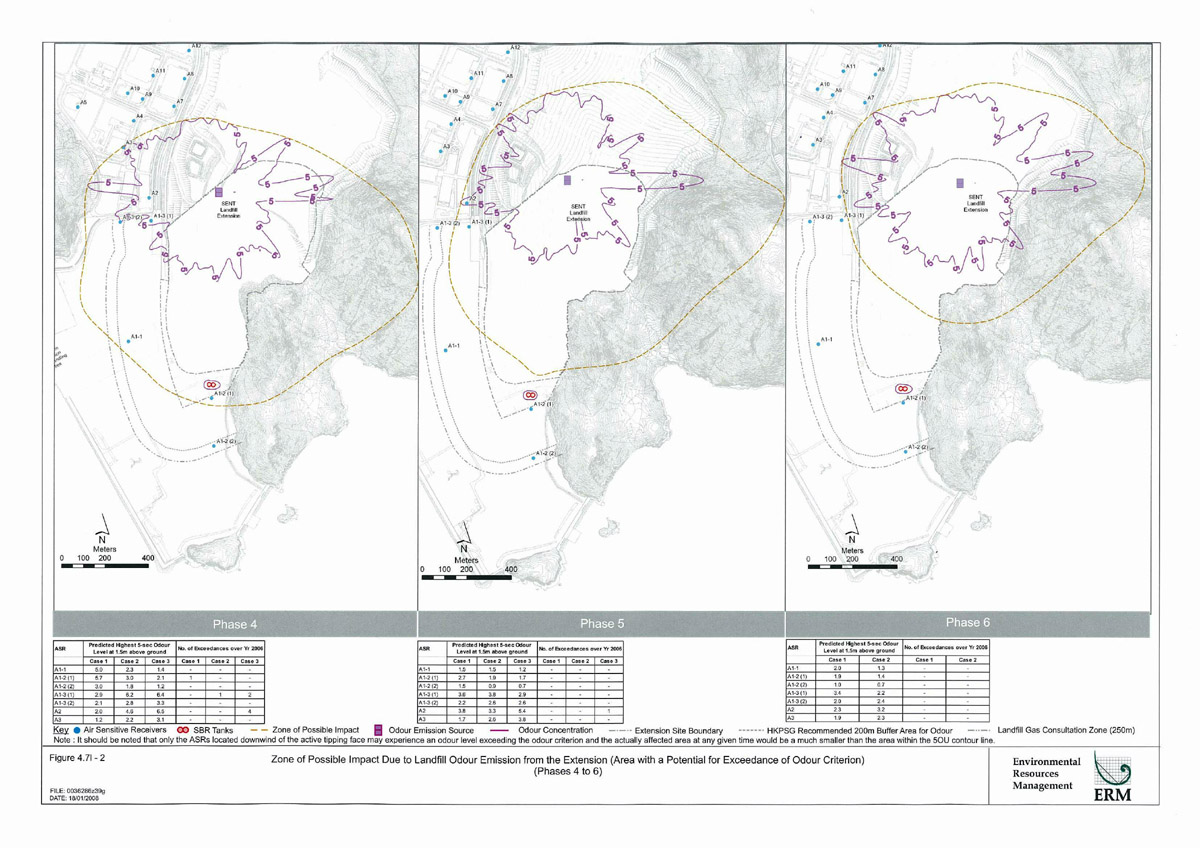
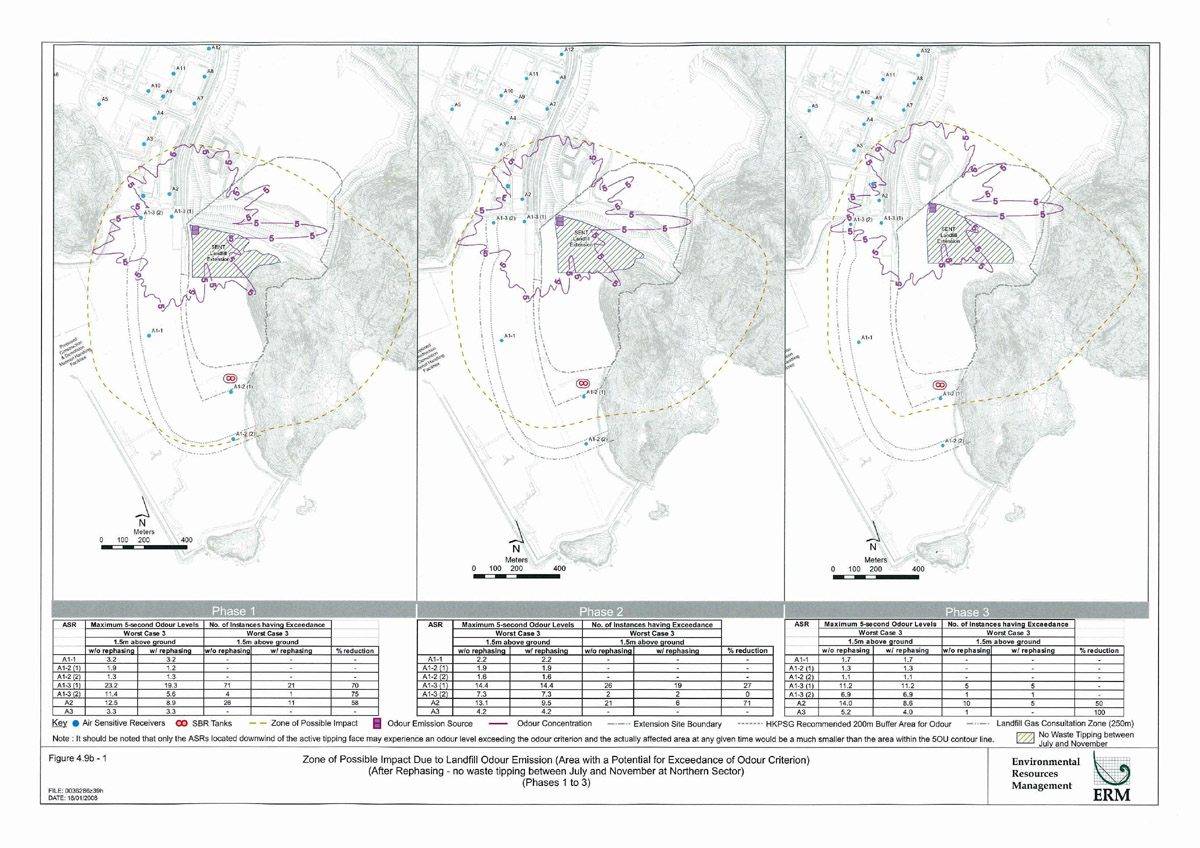
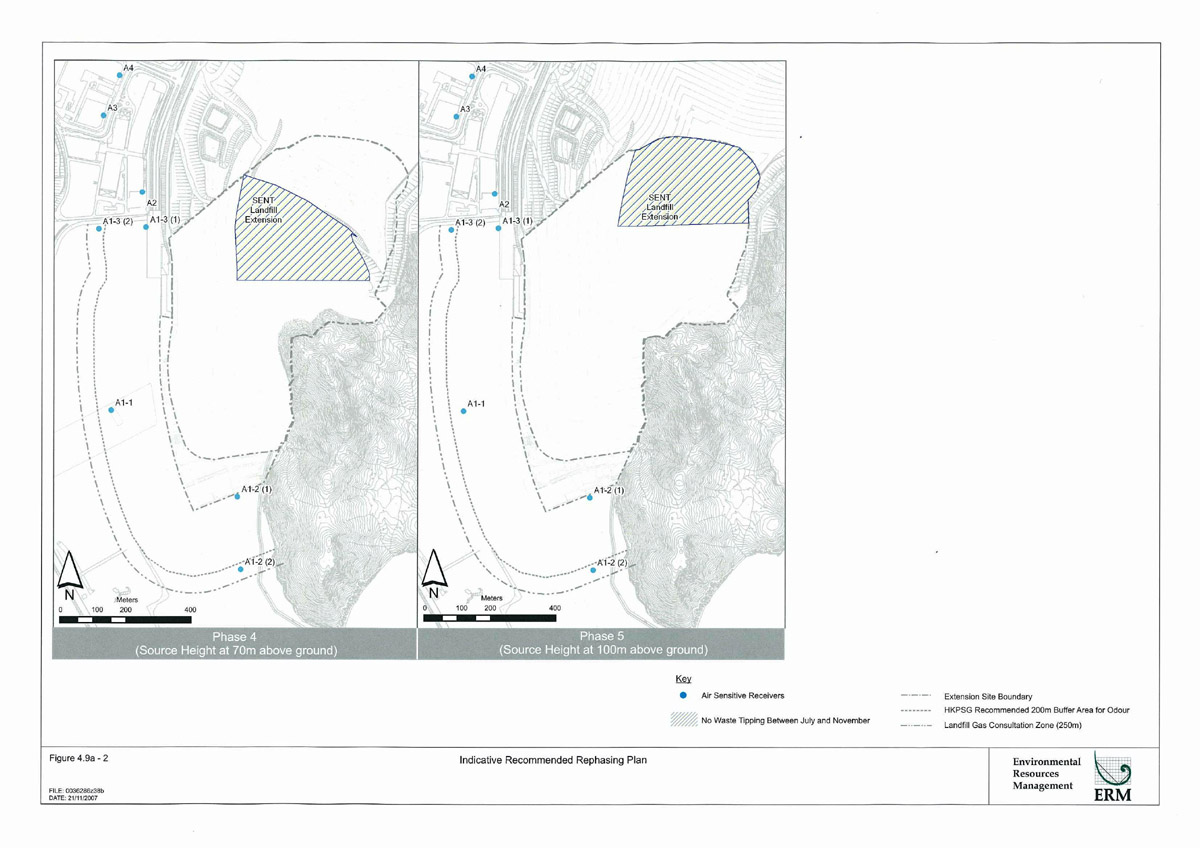
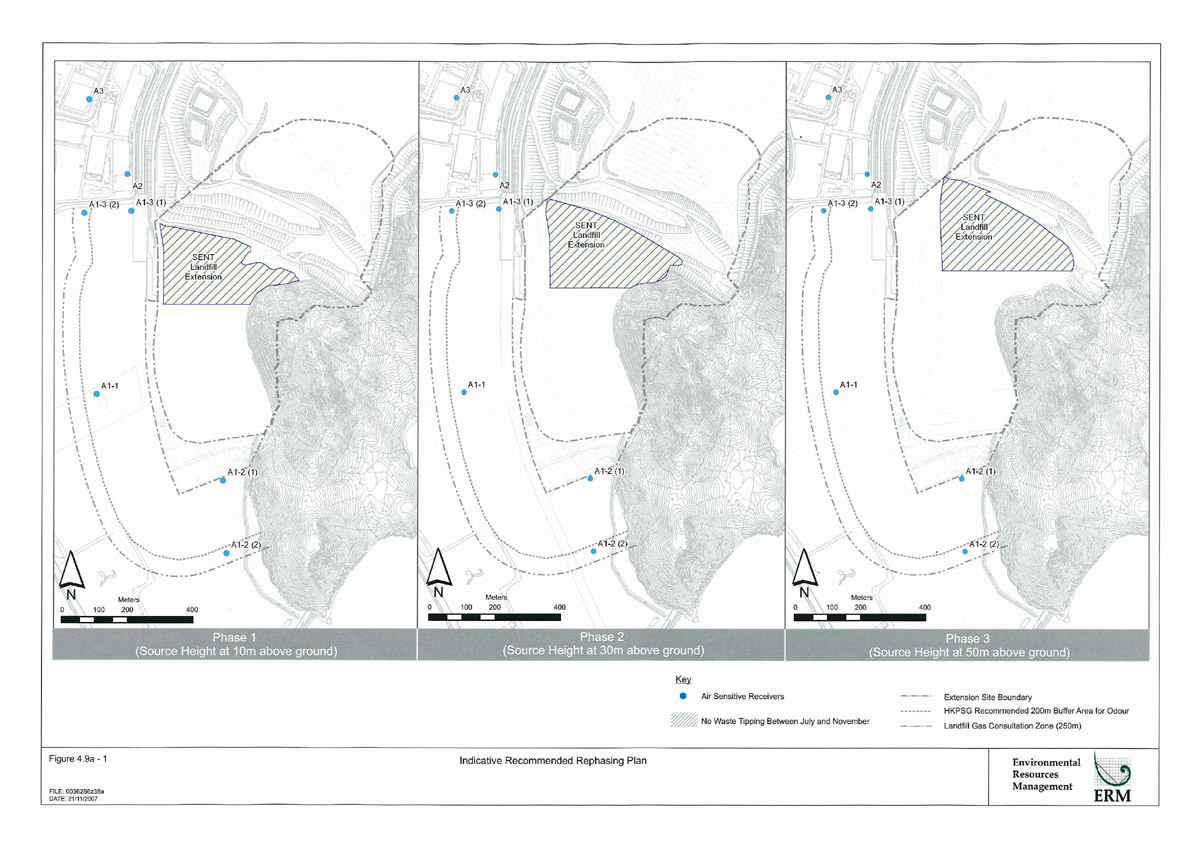
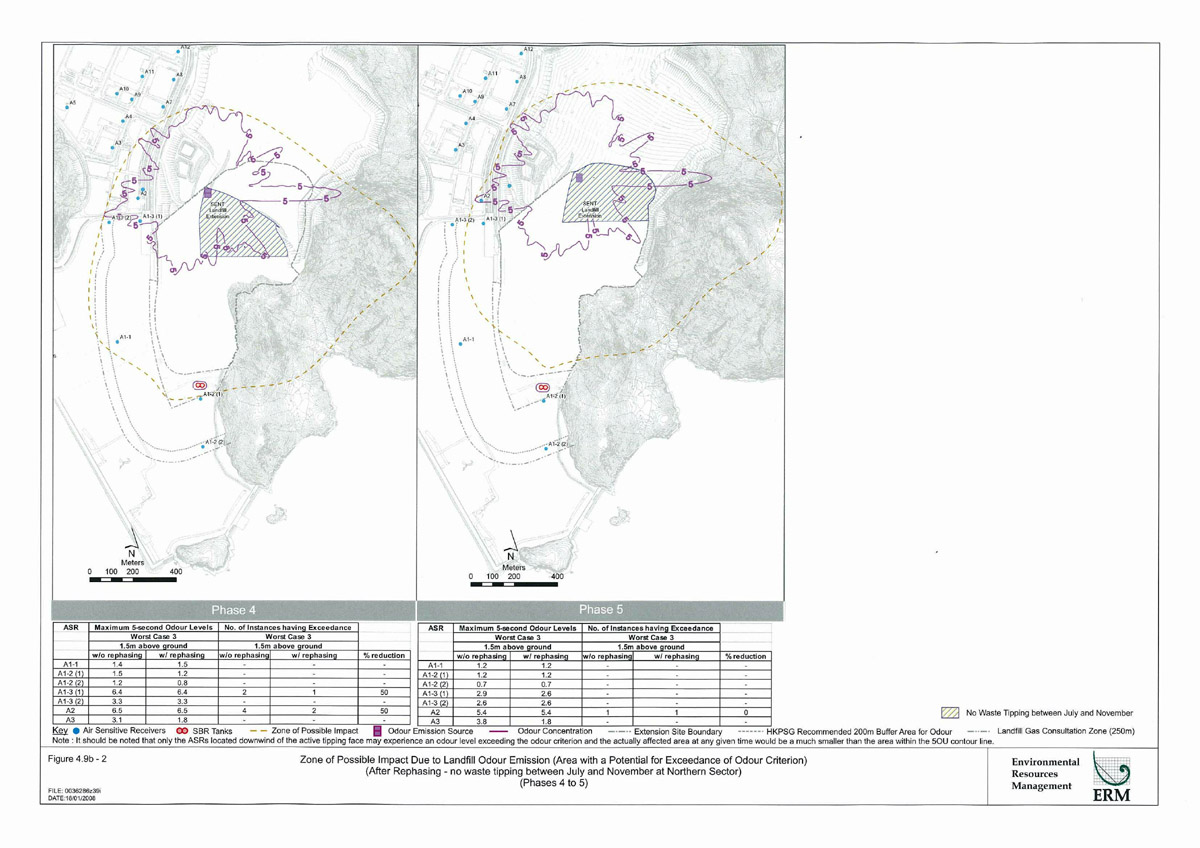
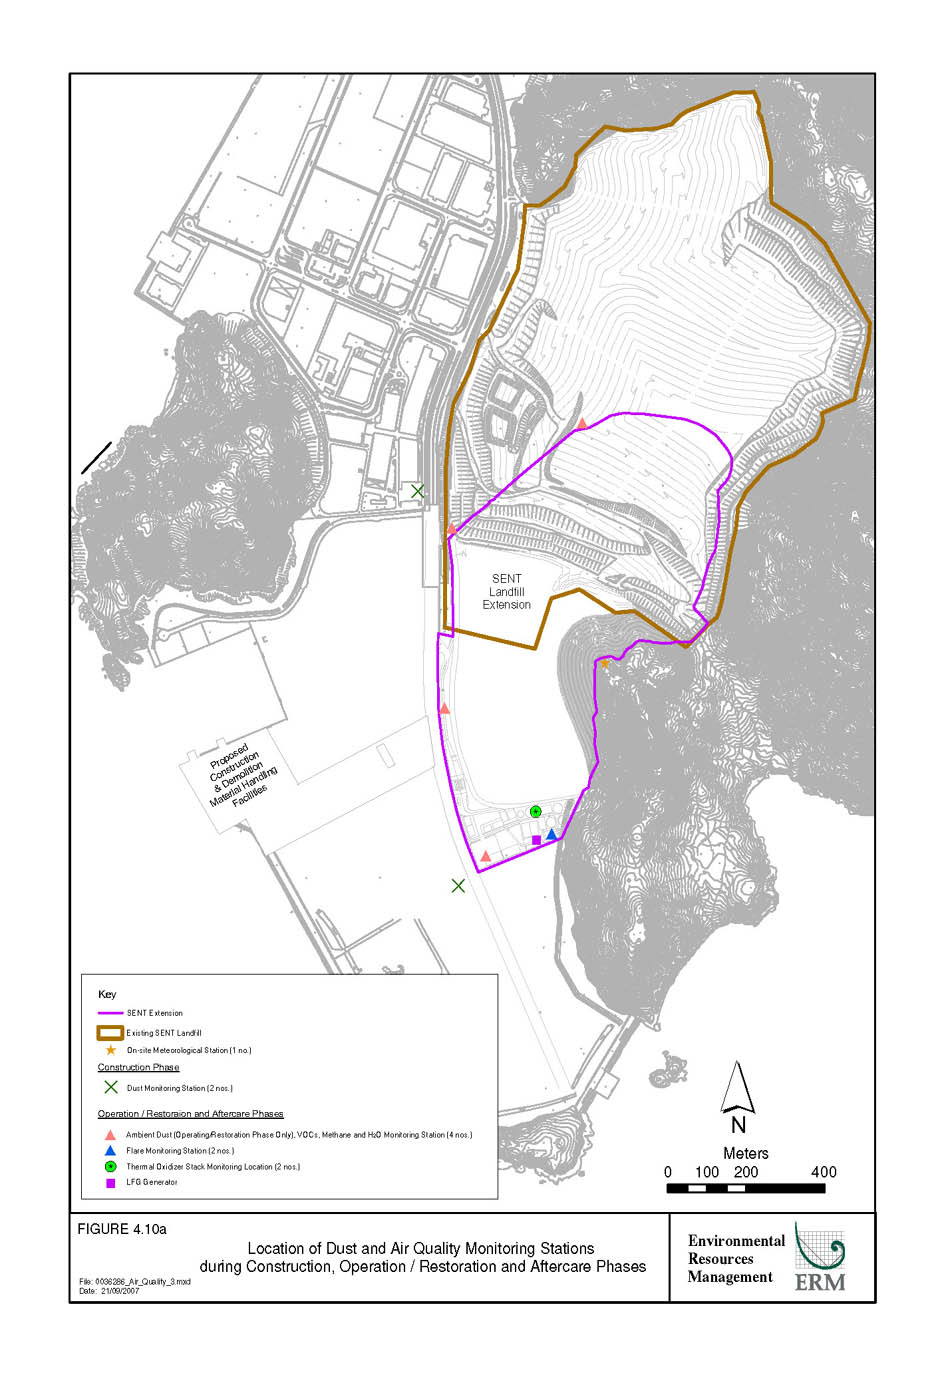