4
Air Quality
Assessment
4.1
Introduction
This Section presents an assessment of the
potential air quality impacts associated with the construction and operation of
the proposed biodiesel plant at Tseung Kwan O
Industrial Estate (TKOIE).
Dust nuisance and
stack emissions are the potential air quality impacts during the construction
and operation phases, respectively. Air
Sensitive Receivers (ASRs) have been identified and potential air quality
impacts were evaluated. Where necessary,
mitigation measures are recommended to minimize the impacts and ensure
compliance with the air quality criteria.
4.2
Legislation Requirements and Evaluation Criteria
4.2.1
Air Pollutants Covered by Hong Kong Air Quality Objectives (HKAQOs)
The principal legislation for the
management of air quality in
Table 4.2a Hong
Kong Air Quality Objectives (mg m-3) (a)
|
Air Pollutant |
Averaging Time |
|||
|
|
1 Hour (b) |
24 Hour (c) |
3 Months (d) |
1 Year (d) |
|
Total Suspended Particulates (TSP) |
- |
260 |
- |
80 |
|
Respirable Suspended Particulates (RSP) (e) |
- |
180 |
- |
55 |
|
|
800 |
350 |
- |
80 |
|
Nitrogen Dioxide (NO2) |
300 |
150 |
- |
80 |
|
Carbon Monoxide (CO) |
30,000 |
- |
- |
- |
|
Photochemical Oxidants (as ozone (O3))
(f) |
240 |
- |
- |
- |
|
Lead (Pb) |
- |
- |
1.5 |
- |
|
Notes: (a)
Measured
at 298K (25°C) and 101.325 kPa (one
atmosphere) (b)
Not
to be exceeded more than three times per year (c)
Not
to be exceeded more than once per year (d)
Arithmetic
means (e)
Suspended
airborne particulates with a nominal aerodynamic diameter of 10 micrometres
or smaller (f)
Photochemical
oxidants are determined by measurement of ozone only |
||||
In addition, the Technical Memorandum of Environmental Impact
Assessment Ordinance (EIAO-TM) stipulates an hourly TSP criterion of 500 mg m-3 for construction dust impact assessment and an odour criterion of 5 Odour Unit
(OU) in 5-second averaging time for the odour impact
assessment.
The measures stipulated in the Air Pollution Control (Construction Dust)
Regulations should be followed to reduce dust impacts.
Should the fuel consumption rate of a
premises/process with a chimney emission exceed the specified fuel consumption
rates stated in the Air Pollution Control
(Furnaces, Ovens and chimneys) (Installation and Alternation) Regulations,
an approval for chimney installation/alternation should be obtained from the
EPD prior to the operation.
Should the total quantity of organic
liquid to be stored in tanks exceed 100 tonnes per annum, a licence must be
obtained under the Air Pollution Control
(Specified Process) Regulation and the control measures set out in the Guidance Note on the Best Practicable Means
for Organic Chemical Works (Bulk Storage of Organic Liquids) (BPM 25/2)
should be followed.
4.2.2
Air Pollutants Not Covered by HKAQOs
For those pollutants not covered by the HKAQOs, health risk criteria recommended in the
international guidelines, such as those promulgated by the World Health
Organisation (WHO), the United States Environmental Protection Agency
(US EPA) and the California Air Resources Board (CARB) have been
considered. The criteria/guideline
values were selected in the following order of preference:
·
WHO;
·
·
CARB.
Cancer Health Risk Assessment
Of the non-criteria substances emitted
during the operation, acetaldehyde is considered carcinogenic. Table 4.2b shows the Unit Risk Factors
(URFs) for the carcinogenic substances considered in
this assessment.
Table 4.2b Guideline
Unit Risk Factor for Carcinogenic Substance
|
Substance |
Unit Risk Factor (mg m-3)-1 |
|
Acetaldehyde |
2.7x10⁻⁶ (a) |
|
Note: (a)
The unit risk factor (URF) of acetaldehyde [i.e. (1.5-9 x 10⁻⁷) (mgm-3)-1] is available in
Guidelines for Air Quality,
WHO, |
|
The risk assessment guidelines for
assessing the carcinogenic health risk from exposure to air toxic are
summarised in Table 4.2c.
Table 4.2c Risk
Assessment Guidelines for the Assessment of Carcinogenic Health Risks
|
Acceptability of Cancer Risk |
Estimated Individual Lifetime Cancer Risk Level |
|
Significant |
> 10-4 |
|
Risk should be reduced to
As Low As Reasonably Practicable (ALARP) |
> 10-6 – 10-4 |
|
Insignificant |
£ 10-6 |
Non-Cancer Health Risk Assessment
Acetaldehyde has the potential to cause
chronic impacts from long term exposure whereas methanol has the potential to
cause both acute and chronic impacts to humans from short term and long term
exposures. The chronic reference
concentration of acetaldehyde and the acute and chronic reference
concentrations of methanol are summarised in Table 4.2d.
Table 4.2d Guideline
Values for Chronic and Acute Reference Concentrations
|
Substance |
Chronic Reference Concentration (RCc) (Annual Average in mg m-3) |
Acute Reference Concentration (RCA) (Hourly in mg m-3) |
|
Acetaldehyde |
9 (a) |
- (b) |
|
Methanol |
4,000 (c) |
2.8x10⁴ (d) |
|
Notes: (a)
The RCcs for
acetaldehyde are both 9 mgm-3 with
reference to the USEPA-IRIS - online
data as in Sept 2008 (http://www.epa.gov/iriswebp/iris/subst/0290.htm)
and California Environmental Protection Agency, Air
Resources Board (ARB)/Office of Environmental Health Hazard Assessment
(OEHHA) – On-line data as in Sept 2008 (http://www.oehha.org/air/hot_spots/pdf/TSDlookup2002.pdf).
RCc for acetaldehyde (ie, 50
mg m-3)
is available in Guidelines
for Air Quality, WHO, (b)
No
acute reference concentrations of acetyldehyde are
available in WHO, CARB/OEHHA or USEPA-IRIS database. (c)
The
RCc for methanol is 4,000 mgm-3 with
reference to California Environmental Protection Agency, Air
Resources Board (ARB)/Office of Environmental Health Hazard Assessment
(OEHHA) – On-line data as in Sept 2008 (http://www.oehha.ca.gov/air/chronic_rels/AllChrels.html).
No RCc for methanol is available in USEPA-IRIS database
and WHO guidelines. (d)
The
RCA for methanol is 2.8x10⁴ mgm-3 with
reference to California Environmental Protection Agency, Air
Resources Board (ARB)/Office of Environmental Health Hazard Assessment
(OEHHA) – On-line data as in Sept 2008
(http://www.oehha.ca.gov/air/acute_rels/allAcRELs.html).
No RCA for methanol is available in USEPA-IRIS database and
WHO guidelines. |
||
The risk assessment guidelines also
recommend criteria to assess the acceptability of chronic and acute non-cancer
health risks and these are summarised in Tables 4.2e and 4.2f,
respectively.
Table 4.2e Acceptability
of Chronic Non-Cancer Health Risks
|
Acceptability |
Assessment Results (a) |
|
Chronic non-cancer risks are considered
“Insignificant” |
ACA £ RCc |
|
Chronic non-cancer health risks are
considered “Significant”. A
more detailed assessment of the control requirements and further mitigation
measures are needed. |
ACA > RCc |
|
Note: (a)
ACA
and RCc represent annual average
concentration and chronic reference concentration, respectively. |
|
Table 4.2f Acceptability
of Acute Non-cancer Health Risks
|
Acceptability |
Assessment Results (a) |
|
Acute non-cancer risks are considered “Insignificant” |
ACHM £ RCA |
|
Acute non-cancer health risks are considered “Significant”. A more detailed assessment of the control
requirements and further mitigation measures are needed. |
ACHM > RCA |
|
Note: (a)
ACHM
and RCA represent hourly average and acute reference
concentrations, respectively. |
|
4.3
Baseline Conditions and Identification of Air Sensitive Receivers
4.3.1
Baseline
Conditions
The Site is
located at the southwest of the TKOIE on
There is no EPD
Air Quality Monitoring Station (AQMS) operating the in Tseung
Kwan O area. The nearest EPD’s AQMS is located at Kwun
Tong. The means of the annual average
air pollutant concentrations recorded at the Kwun
Tong AQMS from 2003 to 2007 are adopted to establish the background air quality
of the Study Area (see Table 4.3a).
Table 4.3a Background
Air Pollution Concentrations
|
Air Pollutant |
Background Concentration |
|
TSP |
79 (a) |
|
RSP |
56 (a) |
|
NO2 |
63 (a) |
|
SO2 |
19 (a) |
|
CO |
1,181 (b) |
|
Notes: (a) Annual average data on air pollutant
concentrations measured at the EPD Kwun Tong AQMS
from 2003 – 2007 (http://www.epd-asg.gov.hk/english/report/aqr.php). (b) Since no CO data is recorded at EPD Kwun Tong AQMS, therefore, the annual average CO data
recorded at Mongkok AQMS from 2003-2007 is used. |
|
4.3.2
Identification of
Air Sensitive Receivers
Within the Study Area (ie 500m from the Site
boundary), the land uses are all industrial.
No residential
dwellings have been identified within 500m of the site boundary. The nearest residential use (
Table 4.3b Representative
Air Sensitive Receivers (ASRs)
|
ASR |
Location |
Type of Uses (a) |
Approx. Distance from the nearest Project Site Boundary (m) |
Approx. Max. Height of Building |
|
A1 |
Gammon Skanka |
I |
30 |
30 |
|
A2 |
Proposed
Industrial Sites (No committed uses at the time of preparation of EIA) |
I |
25 |
30 |
|
A3 |
Hong Kong
Trade Development Council Exhibition Services & Logistic Centre |
C |
140 |
30 |
|
A4 |
|
I |
310 |
30 |
|
A5 |
HAECO |
I |
440 |
30 |
|
A6-1 |
Asia Netcom
HK Limited |
I |
255 |
30 |
|
A6-2 |
Asia Netcom
HK Limited |
I |
345 |
30 |
|
A7 |
Mei Ah
Centre |
I |
420 |
30 |
|
A8 |
Wellcome Co. Ltd (Storage) |
I |
345 |
30 |
|
A9 |
|
I |
450 |
30 |
|
A10 |
Next Media
Apple Daily |
I |
450 |
30 |
|
A11 |
Hong Kong
Oxygen Acetylene Co. Ltd |
I |
355 |
30 |
|
A12-1 |
|
I |
510 |
30 |
|
A12-2 |
|
I |
550 |
30 |
|
A12-3 |
|
I |
560 |
30 |
|
A13 |
|
I |
515 |
30 |
|
A14 |
Next Media
Apple Daily |
I |
530 |
30 |
|
A15 |
Avery
Dennison |
I |
540 |
30 |
|
A16 |
Varitronix Limited |
I |
530 |
30 |
|
A17 |
Committed
HSBC Office |
C |
700 |
30 |
|
A18 |
Eastern
Pacific Electronics |
I |
780 |
30 |
|
A19 |
Committed
Tung Wah Group of Hospital Aided Primary &
Secondary School |
G/IC |
820 |
30 |
|
A20-1 |
|
CDA |
800 |
200 |
|
A20-2 |
|
CDA |
820 |
200 |
|
A20-3 |
|
CDA |
930 |
200 |
|
A21 |
Chiaphua-Shinko Centre |
I |
1,300 |
30 |
|
Note: (a)
I = Industrial premises, C = Commercial premises, G/IC =
Government/Institution/Community and CDA = Comprehensive Development Area |
||||
4.4
Potential Sources of Impacts
4.4.1
Construction Phase
The Project Site
is currently a vacant lot which has been formed by reclamation as part of the
TKOIE development. The construction
works will last for about 13 months from March 2009, tentatively. Foundation works will last for about 3
months. A detailed construction programme is presented in Figure 3.2f.
The total site area is about 18,000 m2. Since the site has been formed, no major
earthworks will be required for site formation.
Minor excavation works will be required for the construction of foundation
works and site utilities. Driven steel H piles with reinforced
concrete pile caps will be used for the foundations of the buildings. All excavated materials generated from
foundation works and site levelling works will be reused on site. The storage tanks and process equipment will be
pre-fabricated off-site and assembled on-site using hydraulic and tower cranes and hence minimal
dust will be generated from this activity.
About 4 to 5 trucks will be operating on site at the same time during the
foundation works, and building and civil works.
According to the construction programme, there
is no overlapping of the foundation works, and building and civil works.
Dust generated
from the excavation works and gaseous emissions from diesel-driven construction
equipment are the major concerns during the construction phase. As only minor excavation works will be
required, the potential dust emissions will be minimal with the implementation
of the dust control measures stipulated in the Air Pollution Control (Construction Dust) Regulation. The reinforced concrete buildings will be
constructed on site using ready-mix concrete and conventional construction
methods. Limited dust will be emitted
from the concreting works and assembling of the pre-fabricated units of the
storage tanks and processing system.
Due to the small
site area, the number of diesel-driven construction plant and equipment
operating simultaneously on-site will be limited. The potential gaseous emissions from these
plant and equipment are expected to be minimal and unlikely to cause adverse
air quality impacts.
The jetty for the reception of marine
vessels during the operation phase will be constructed by piled deck (see Figure 2.2b) and no dredging of marine
sediment will be required. Marine piles
will be drilled through the existing rubble mound seawall to competent bearing
strata by a piling rig mounted barge.
The bored piles will be filled with concrete prior to placement of
trellis beam and pre-cast concrete panels.
The dust and air emissions generated from the marine works will be
minimal.
With the
implementation of dust suppression measures stipulated under the Air Pollution Control (Construction Dust)
Regulation and the adoption of good site practices, the potential dust
impacts will be controlled to within the relevant standards as stipulated in
Section 1 of Annex 4 of the EIAO-TM. No adverse impacts are anticipated.
4.4.2
Operation Phase
Potential air
pollution sources from the biodiesel plant during the operation phase include
the following:
·
Emissions from fuel combustion in the boilers;
·
Emissions from the standby biogas flare (if in
operation);
·
Organic emissions from the
·
Odour from final air scrubber
which will scrub all the pre-treated exhaust gas from the unloading and
treatment of Grease Trap Waste (GTW) and the on-site wastewater treatment
plant; and
·
Vehicular emissions due to additional traffic
associated with the operation of the biodiesel plant.
To assess
potential cumulative air quality impacts, the emissions from the adjacent major
stacks within the TKOIE were also considered.
Emissions from
Fuel Combustion
The boilers are a
dual-fuel fired boiler (which could utilise gas (eg
biogas) or fuel oil (eg gas oil, or a mixture of gas
oil and bio-heating oil (hereafter called oil mixture) ([1])) for production of steam for the
biodiesel process and thermal oil system.
The Project Proponent is committed to use an appropriate fuel or a mixture
of fuels which will comply with the new emission limits stipulated in the Air Pollution Control (Fuel Restriction)
(Amendment) Regulation taking effect on 1 October 2008. About 21.5 tonnes of the oil mixture will be
required per day (which is equivalent to about 920 m3 of biogas per
hour). Under normal operation, biogas (a
high
energy value, 36.44 MJ Nm-3) generated from the IC Reactor of the wastewater
treatment plant (an average of
about 80 m3 hr-1
of biogas generated) will be used as the priority fuel which will be
supplemented by oil mixture or gas oil.
The
major air pollutants from the combustion of biogas and oil mixture (or gas oil)
are expected to be carbon monoxide (CO), nitrogen dioxide (NO2) and
a limited quantity of non-methane organic compounds (NMOCs)
(if biogas is combusted) and sulphur dioxide (SO2). The air pollutants will be emitted at a
minimum exit velocity of 7 m s-1 and temperature of 100°C through a 31m stack with a diameter of 0.75m.
With reference
to the emission factors for NO2, CO, SO2 and NMOCs established for biogas and oil mixture, a comparison
of the emission rates from the boiler is summarised in Table 4.4a.
Table 4.4a Comparison
of NO2, CO, SO2 and NMOCs
Emissions from Combustion of Biogas and Oil Mixture at Boiler
|
Parameter |
Boiler |
|||
|
|
Biogas |
Oil Mixture
(Mixture of Gas Oil (80%) and Bioheating Oil (20%)) |
||
|
Stack
Height (m above ground) |
31 |
|||
|
Stack
Diameter (m) |
0.75 |
|||
|
Exhaust
Velocity (m s-1) |
7 (minimum) |
|||
|
Exhaust
Temperature (°C) |
100 (minimum) |
|||
|
Exhaust
Flow Rate (m3hr-1) |
11,133 |
|||
|
Fuel
Consumption (tonnes day-1) |
- |
21.5 |
||
|
Maximum
Volume of Biogas (equivalent) & Oil Mixture Consumed (m3 hr-1) |
920.7 (a) |
0.995 (b) |
||
|
Emission
Factor for Biogas at Exhaust Temperature (mg m-3) (c) (d) |
NOx |
109.8 |
- |
|
|
|
CO |
36.6 |
- |
|
|
|
H2S |
10 (i) |
- |
|
|
|
NMOCs |
3.7 |
- |
|
|
Emission
Factor for Oil Mixture (kg m-3) (f) |
NOx |
- |
2.4 |
|
|
|
CO |
- |
0.6 (e) |
|
|
|
SO2 |
- |
0.864 |
|
|
Emission
Rate (g s-1) (g) (h) |
NOx |
0.34 |
0.66 |
|
|
|
NO2 |
0.07 |
0.13 |
|
|
|
CO |
0.11 |
0.17 |
|
|
|
SO2 |
0.01(j) |
0.24 |
|
|
|
NMOCs |
0.01 |
- |
|
|
Notes: (a)
Equivalent to oil mixture consumed. Under normal operation, the actual biogas
consumption is only about 80
m3 hr-1 produced from the IC Reactor based on the design
capacity. (b)
The density of oil mixture is about 900 kg m-3. (c)
Due to the nature of biogas, the emission factor of biogas
is assumed to be similar to that of landfill gas. (d)
The emission factors of biogas were converted to
that under exhaust gas condition. The
original emission factors of biogas used are reference to (e)
Reference to USEPA AP-42, Section
1.3, Table 1.3-1 (http://www.epa.gov/ttn/chief/ap42/ch01/final/c01s03.pdf). (f)
Reference to Amendment
of Air Pollution Control (Fuel Restriction) Regulation in June 2008. (g)
The emission rate of air pollutants from combustion
of oil mixture were calculated based on the volume of oil consumed. The emission rate of air pollutants from
combustion of biogas were calculated based on the exhaust flow rate. Emission rate of air pollutant from
combustion of oil mixture = emission factor (oil mixture) x volume of oil
mixture consumed. For example, NOx emission rate from combustion of oil
mixture = (2.4x10⁶ mg m-3) x (0.995 m3 hr-1)
/ (1,000 x 3,600) = 0.66 g s-1.
Emission rate of air pollutant from combustion of biogas = emission
factor (biogas) x exhaust flow rate.
For example, NOx emission rate
from combustion of biogas = (109.8 mg m-3) x (11,133 m3 hr-1)
/ (1,000 x 3,600) = 0.34 g s-1 (h)
Refer to Annex
A1 for detailed emission rate calculation. (i)
The emission factor of H2S (in ppm) in biogas is measured at
30°C and given by
the plant design engineer. (j)
The emission rate of SO2 from is
calculated based on the equivalent biogas consumption rate of about 920.7 m3
hr-1. |
||||
It should be noted that there have been a
number of research studies determine the NOx
emissions from biodiesel compared with petroleum based diesel oil. There is no commonly-agreed NOx emission factor for the combustion of
biodiesel.
Testing emissions from the combustion of
biodiesel in a similar boiler was conducted by BDI. A summary of the testing results is presented
in Annex A2. The testing results show that the NOx emissions range from 0.83 kg hr-1
to 1.01 kg hr-1 (ie, 0.23 g s-1
to 0.28 g s-1). Compared to
the emission factors given in Table 4.4a
(which are based on the emission rates of petroleum based diesel oil), the NOx emissions analysed from the emission test
are much lower. Therefore, the
assessment is considered conservative.
Comparing the pollutant emission rates of
biogas and oil mixture (see Table 4.4a),
it is evident that the emission rates for the combustion of oil mixture are
higher. As a conservation assumption, it
is assumed that the boilers will consume only oil mixture.
Emissions from
Standby Biogas Flare
Under normal
operation, all the biogas generated from the IC reactor will be used as fuel
for the boilers. However, when the
boilers are under maintenance, all the biogas generated will be flared. The stack of the flare will be installed at
about 12.5m above ground and located at to the on-site wastewater treatment
plant. The diameter of stack is about
0.96m and the flue gas flow rate is 1,407 m3 hr-1.
An air scrubber
will be installed to remove the majority of the hydrogen sulphide
(H2S) in the biogas (down to a maximum of 10 ppm)
prior to combustion in the flare or boilers.
NO2, CO, SO2 (from destruction of H2S
at high temperature) and NMOCs will be the key air
pollutants from the emissions from the biogas flare.
As a conservative assumption, it was assumed that the flare will be
operating at its maximum capacity (ie 150 m3 hr-1
of biogas), the emission rates of NO2, CO, SO2 and NMOCs are summarised in Table 4.4b.
Table 4.4b Emission
of NO2, CO, SO2 and NMOCs from
Standby Biogas Flare
|
Parameters |
Standby
Biogas Flare |
|
|
Stack
Height (m above ground) |
12.5 |
|
|
Stack
Diameter (m) |
0.96 |
|
|
Exhaust
Flow Rate (m3 hr-1) |
1,407 |
|
|
Exhaust
Temperature (°C) |
815 |
|
|
Volume
of Biogas to be flared off (Designed flare capacity) |
150 (a) |
|
|
Emission
Factor of Biogas at Exhaust Temperature |
NOx |
37.6 |
|
|
CO |
12.5 |
|
|
H2S |
10 ppm (c) |
|
|
NMOCs |
1.3 |
|
Emission
Rate (g s-1) (b) |
NOx |
0.015 |
|
|
NO2 |
0.003 |
|
|
CO |
0.005 |
|
|
SO2
|
1.07x10⁻³ (d) |
|
|
NMOCs |
4.9x10⁻⁴ |
|
Notes: (a)
The design capacity of the flare is 150 m3 hr-1
of biogas. (b)
Reference to Annex
A1 for detailed calculation. (c)
The emission factor of H2S in biogas is
measured at 30°C and given by
the plant design engineer. (d)
SO2 is estimated from the H2S concentration
in the biogas. Reference to Annex A1 for detailed calculation. |
||
Organic Emissions
from Process Building
The biodiesel
production is carried out inside the
Among of these organics, only acetyldehyde is classified as carcinogenic and has the
potential to lead to chronic heath effects.
Methanol has also the potential to cause both chronic and acute health
effects.
The emission inventory and exhaust vent
pipe design parameters are summarized in Table
4.4c.
Table 4.4c Emission
of Acetyldehyde and Methanol from
|
Parameters |
Exhaust
Pipe of |
|
|
|
Acetyldehyde |
Methanol |
|
Stack
Height (m above ground) |
22.8 |
|
|
Stack
Diameter (m) |
0.15 |
|
|
Exhaust
Flow Rate (m3 hr-1) |
50 |
|
|
Exhaust
Temperature (°C) |
35 |
|
|
Maximum
Concentration at Stack (mg m-3) |
2,000 (a) |
2,000 |
|
Emission
Rate (g s-1) (b) |
0.028 |
0.028 |
|
Notes: (a)
Since the percentage of acetyldehyde
in the impurities of methanol is not known, it is assumed that all the
impurities of methanol are acetyldehyde for the
worst case assessment. (b)
Refer to Annex
A1 for detailed emission rate calculation. |
||
Odour from Unloading and
Treatment of GTW and On-site Wastewater Treatment Plant
The unloading and
storage of GTW and operation of the wastewater treatment plant have the
potential to cause odour nuisance if not properly
managed.
Unloading and
Treatment of GTW
GTW will be delivered
to the biodiesel plant by sealed road tankers.
After weighing, the tankers will be directed to the unloading bays. GTW will be discharged from the tanker
directly to the underground storage tanks in a closed system (via a flexible
hose). The GTW received will be screened in the Belt Filter
Room adjacent to the unloading bays to remove food residues and other large
objects. The screenings will be stored
in containers inside the Technic Room. The Belt Filter Room and the Technic Room will be enclosed and provided with a
ventilation system which will maintain a slight negative pressure to prevent
odour emissions. The exhaust air from
these rooms will be treated by an air scrubbing system (with a removal efficiency
of >99.5% ([3])). The
scrubbed air will be diverted to the on-site wastewater treatment plant as the
ventilation air for the enclosed wastewater treatment tanks.
All biodiesel
process tanks ([4]), including the
GTW storage tanks will be enclosed and the exhaust air will be treated by an
air scrubbing system (with a
removal efficiency of >99.5%). The
scrubbed exhaust air will be diverted to the on-site wastewater treatment plant
as part of the air intake for the aeration process and ventilation air for the
enclosed wastewater treatment tanks. Any
residual odorous components in the exhaust air will be scrubbed by the
wastewater. The vent gas of the aeration
tank will be cleaned by the final air scrubber (with a removal efficiency of >99.5%) prior to discharge
to the atmosphere.
On-site Wastewater Treatment Plant
All wastewater
storage and treatment tanks will be enclosed.
After the anaerobic digestion process in the IC Reactor, the Biochemical
Oxygen Demand (BOD) of the wastewater will be significantly reduced (by about
80%) and hence the potential for odour nuisance is
significantly reduced. The vent air from
the wastewater storage and treatment tanks will be cleaned by the final air
scrubber prior to discharge to the atmosphere.
Summary
Figure 4.4a shows the flow rates of the
scrubbed exhaust air from the GTW unloading and pre-treatment facilities and
on-site wastewater treatment plant.
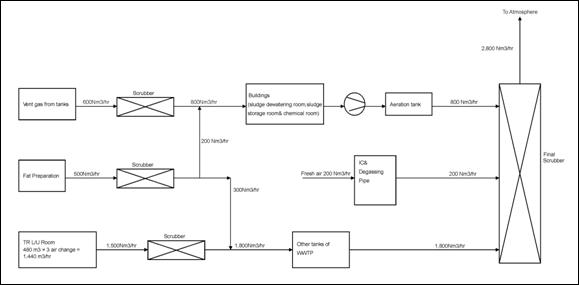
Figure 4.4a Exhaust Air Flow Chart
There is only one emission point for the air scrubbers (which is the
final air scrubber of the wastewater treatment plant). The odour
concentration after treatment at the final air scrubber will be controlled at a
limit of 257.6 OUm-3. The
exhaust air from the final air scrubber will be dispersed at ambient
temperature with a flow rate of 2,800 m3 hr-1. The details of the stack and odour emission rate are summarised in Table
4.4d.
Table 4.4d Odour
Emission from Final Scrubber
|
Parameters |
Final
Scrubber |
|
Stack
Height (m above ground) |
13.8 |
|
Stack
Diameter (m) |
1.2 |
|
Exit
Flow Rate (m3 hr-1) |
2,800 |
|
Exit
Temperature (°C) |
ambient |
|
Maximum
Odour Concentration at Exhaust Point (OU m-3) (a) |
257.6 |
|
Odour
Emission Rate (OU s-1) (b) |
200.3 |
|
Notes: (a)
Monitoring will be performed to ensure the odour concentration
emitted from the exhaust point will not exceed the maximum odour
concentration. This will be included
in the Contract Specification. (b)
Refer to Annex
A1 for detailed odour emission rate calculation. |
|
Emissions from
Delivery Trucks
Vehicular
emissions induced from the Project are expected to be negligible since
additional traffic associated with the operation of the biodiesel plant only
constitutes a very small percentage (0.47%) of the total background traffic on
Wan Po Road (ie 93 trucks per day compared to AADT of
19,860 in 2006, refer to Section 5.4.2). It is therefore considered that the potential
air quality impact due to additional traffic is negligible and will not cause
an adverse air quality impact.
Emissions from Marine
Vessels during Berthing
According to Section 3.2.2 and Table 3.2b, PFAD, biodiesel and methanol will be delivered by
barge. It is estimated that about 4
barges will be berthed per week and it takes less than 15 minutes for the
marine vessel to travel fro 500m from the approach channel to the jetty and
berth. Therefore, the potential air
quality impact during maneuvering of the marine vessel will be transient and
negligible. PFAD and methanol delivered to the Site by barge will
be pumped to the storage tanks using dedicated pipelines. Flexible hoses will be used to connect
storage the tanks of the barge to the pipelines at the jetty. During berthing, the main engine and the
auxiliary engine of the vessels will be switched off to minimize the emissions. The power supply to the marine vessels will
be provided by an on-site power supply.
Therefore, no emission is anticipated from the marine vessels during
berthing.
4.4.3
Cumulative Impacts
Construction Phase
The operation of
TKO Area 137 Fill Bank and existing SENT Landfill and the construction of the
TKO Further Development works are identified as concurrent projects during the
construction of the biodiesel plant (see Section
3.3).
TKO Area 137 Fill
Bank and existing SENT Landfill are located at south and east of the biodiesel
plant, respectively and the nearest distance from the existing SENT Landfill to
the Project Site is about 700m. The TKO
Area 137 Fill Bank is further away.
Given the large separation distances and different worst case wind
directions, it is not anticipated that these concurrent projects will cause
adverse cumulative dust impacts.
The TKO Further
Development – Infrastructure works site is located at more than 2 km from the
biodiesel plant. It is therefore, not
anticipated that it will cause cumulative dust impact to the identified ASRs.
Operation Phase
A chimney survey within the TKOIE was
conducted in January 2008 and the major emissions sources within 500m from the
Project Site boundary are HAESL and
Interviews with
According to the information provided by
With reference to
the EIA Report of HAECO/HAESL Aircraft
Engine Test Cell Facility at TKO, NO2, CO and SO2 are
the key air pollutants to be emitted during engine testing. These emission rates and stack
characteristics are summarized in Table
4.4e.
Table 4.4e Stack
and Emission Characteristics of HAESL (a)
|
Stack ID |
No.
of Stacks |
Efflux
Velocity |
Stack
Diameter (m) |
Stack
Height Above Ground (m) |
Exit
Temp. (°C) |
Emission
Rate (g s-1) |
||
|
|
NO2 |
CO |
SO2 |
|||||
|
HAECO
/ HAESL (b) |
1 |
16.4 for NO2 & SO2; |
14.7 |
40 |
52 |
21.2 |
23.9 |
1.92 |
|
Notes: (a)
Reference to the EIA Report of HAECO Aircraft Engine Test Cell Facility at TKO. (b)
It is the equivalent diameter. The stack is in square shape with an area
of 13m x 13m. |
||||||||
These data have been confirmed by
HAESL. The emissions of NO2,
CO and SO2 from HAESL are included to assess the cumulative air
quality impact during the operation phase.
To assess the
potential cumulative air quality impact due to other minor emission sources in
TKOIE, the Consultant has made reference to the emission sources and data
adopted in the approved EIA Report of Fill Bank at TKO Area 137. The estimation of the emissions from these
sources has taken account of the total fuel consumption of the whole TKOIE
which includes potential future emission sources. The assessment is therefore considered
conservative. The facilities were
assumed to operate for 10 hours a day on an annual basis, as detailed in the
reference report. Emission rates of NO2
from the potential sources were similar to those in the TKO 137 Fill Bank EIA,
while emission rates of CO and SO2 were calculated with reference to
the USEPA Compilation
of Air Pollutants Emission Factors, 5th Edition (AP42) (1995) and
the SO2 emission limit stipulated in the Air Pollution Control (Fuel Restriction) Regulation Amendment 2008,
respectively. Calculation details of
respective emission rates are presented in Annex
A1.
No similar odour source is identified
within 500m of the Project site boundary and hence, no cumulative odour impact
is expected.
4.5
Assessment Methodology (Operational Air Quality Impact)
Stack Emissions
from Boiler Stack, Biogas Flare, Process
Building
An emission
inventory for the boiler stack,
Table 4.5a Summary
of Stack Information and Emission Inventory
|
Parameter |
Boiler Stack |
Biogas Flare |
|
HAESL Stack |
TKOIE Stacks(f) |
|
|
Operating Hours |
24 |
24 |
24 |
24 |
10 |
|
|
No. of Stack |
1 |
1 |
1 |
1 |
21 |
|
|
Stack Height (m above ground) |
31 |
12.5 |
22.8 |
40 |
10 |
|
|
Stack Diameter (m) |
0.75 |
0.96 |
0.15 |
14.7 |
1.2 |
|
|
Flue Gas Exit Temperature (°K) |
373 |
1,088 |
308 |
325 |
463.15 |
|
|
Flue Gas Exit Velocity (m s-1) |
7 |
0.54 |
0.79 |
16.4 |
9.00 |
|
|
Emission Rates (g s-1) (a) |
NOx |
0.66 |
0.015 |
- |
106 |
|
|
NO2 (b) |
0.13 |
0.003 |
- |
21.2 |
0.043 (c) |
|
|
|
CO |
0.17 |
0.005 |
- |
23.9 |
0.042(d) |
|
|
SO2 |
0.24 |
1.07x10⁻³ |
- |
1.9 |
0.06(e) |
|
|
Acetyldehyde |
- |
|
0.028 |
- |
|
|
|
Methanol |
- |
|
0.028 |
- |
|
|
Notes: (a) As shown in Table 4.4a,
burning of mixture of gas oil/bioheating oil
generates higher emission rates of air pollutants than burning of biogas. (b) It is assumed that 20% of NOx emitted
from the stacks will be converted to NO2. (c) Reference has been made to NO2 emission rates in the Fill Bank at
TKO Area 137 EIA Report (EIA – 076/2002) (d) CO emission rate is calculated with reference to the USEPA Compilation of Air Pollutants Emission Factors,
5th Edition (AP42) (1995) (e) SO2
emission rate is calculated with reference to the SO2
limit stipulated in the Air Pollution Control (Fuel Restriction) Regulation Amendment 2008 (f) With reference to approach adopted in the approved TKO Area 137 Fill Bank
EIA Report |
||||||
Hourly, daily and annual average NO2, CO and SO2
concentrations, hourly methanol concentration and annual average acetyldehyde and methanol concentrations at different elevations
(1.5m to 120m) of the identified ASRs were predicted using an EPD approved air
dispersion model, Industrial Source Complex Short-Term (ISCST3). The meteorological data recorded at the TKO
Weather Station in 2003 ([5])
and
“rural” mode were used for the model runs as the Project Site is located along
the waterfront.
Two scenarios were
established for the model run:
Scenario 1 : Under
Scenario 2 : Under Emergency
Operation (Emission from Biogas Flare)
In each scenario,
emissions from HAESL and other emission sources in TKOIE are also included in
the model to assess the cumulative impact.
Background air pollutant concentrations (refer to Table 4.3a) were added to the modelled
cumulative results to assess the total air quality impacts at the ASRs.
Odour Emission from
Final Air Scrubber
Table 4.5b summarises the odour
emission inventory of the exhaust air after treatment by the final scrubber.
Table 4.5b Odour Emission Inventory
|
Parameter |
Final
Scrubber Exhaust Stack |
|
Operating Hours |
24 |
|
No. of Stacks |
1 |
|
Vent Duct Height (m above ground) |
13.8 |
|
Vent Duct Diameter (m) |
1.2 |
|
Exhaust Air Exit Temperature (°K) |
Ambient temperature |
|
Exhaust Air Exit Velocity (m s-1) |
0.7 |
|
Odour Concentration at Exhaust Duct (OU m-3) |
257.6 |
|
Odour Emission Rate (OU s-1) |
200.3 |
An EPD approved
air dispersion model, ISCST3, was used to predict the odour
concentration at different elevations of the identified ASRs. Other modeling parameters are similar to
those adopted in the stack emission assessment.
The model output
corresponds more closely to a maximum 15-minute average concentration. This matter relates to the Pasquill-Gifford vertical dispersion parameter used in the
ISCST model which is fully documented in the Workbook on Atmospheric Dispersion Estimates.
In order to
convert the model outputs to maximum 5-second average concentrations, a
two-step conversion process has been defined.
Step 1:
Conversion of the
model output to a maximum 3-minute average, using the power law formula
proposed by Duffee et al ([6]), which is
reproduced below:
![]()
Where:
Xl = concentration for the longer
averaging time;
Xs = concentration for the shorter
averaging time;
ts =
shorter averaging time;
tl =
longer averaging time; and
p = power law exponent, which depends on the Pasquill stability class, and is detailed in Table 4.5c.
Table 4.5c Power
Law Exponents
|
Pasquill Stability
Class |
p |
|
A |
0.5 |
|
B |
0.5 |
|
C |
0.333 |
|
D |
0.2 |
|
E |
0.167 |
|
F |
0.167 |
Step 2:
To convert
3-minute average to maximum 5-second average concentration, the approach
suggested by the Warren Spring Laboratory ([7])
was
adopted:
“Typical
maximum or peak 5-second average concentrations within any 3-minute period
appear to be of the order of 5 times the 3-minute average. During very unstable conditions larger
ratios, perhaps 10:1, are more appropriate…..”
The resulting factors for converting the
model outputs to 5-second averages are presented in Table 4.5d.
Table 4.5d Factors
for Converting Model Outputs to Maximum 5-second Mean Odour Concentration
|
Pasquill Stability Class |
Conversion 15-minute to 3-minute Average |
Conversion 3-minute to 5-second Average |
Overall Conversion Factor |
|
A |
2.23 |
10 |
22.3 |
|
B |
2.23 |
10 |
22.3 |
|
C |
1.70 |
5 |
8.50 |
|
D |
1.38 |
5 |
6.90 |
|
E |
1.31 |
5 |
6.55 |
|
F |
1.31 |
5 |
6.55 |
The overall
conversion factors under different stability classes are applied to the model
so that the predicted outputs are in 5-second averages.
Isopleths showing
5-second odour levels are plotted at the different
assessment heights.
4.6
Evaluation of Impacts
Stack Emissions
from Boiler Stack, Standby Flare, Process
Building
NO2, CO
and SO2
The maximum hourly, daily and annual average concentrations of NO2
and SO2 and maximum hourly and 8-hour average CO concentrations were
predicted at various heights at the identified ASRs. The highest cumulative maximum hourly, daily
and annual average concentrations of NO2 and SO2 and
maximum hourly and 8-hour average CO concentrations, taking account of the
background air quality, are summarised in Table
4.6a for both scenarios. The predicted concentrations of these air
pollutants at different ASR elevations are summarized in Annex A4.
Table 4.6a Predicted
Highest Cumulative Air Pollutant Concentrations at ASRs
|
ASR |
Highest Hourly
Concentration (µg m-3) |
Highest 8-hour
Concentration (µg m-3) |
Highest Daily Average
Concentration (µg m-3) |
Annual Average
Concentration |
||||
|
|
NO2 |
CO |
SO2 |
CO |
NO2 |
SO2 |
NO2 |
SO2 |
|
Scenario 1 : |
||||||||
|
A1 |
96.5 |
1,224 |
79.5 |
1,200 |
72.3 |
35.7 |
65.5 |
23.24 |
|
A2 |
99.0 |
1,227 |
84.5 |
1,205 |
74.0 |
39.1 |
65.2 |
22.75 |
|
A3 |
77.2 |
1,200 |
45.2 |
1,186 |
65.3 |
23.1 |
63.6 |
19.76 |
|
A4 |
84.1 |
1,202 |
48.4 |
1,191 |
66.6 |
24.0 |
64.1 |
20.45 |
|
A5 |
71.2 |
1,189 |
30.4 |
1,184 |
64.7 |
20.7 |
63.6 |
19.57 |
|
A6-1 |
80.3 |
1,198 |
43.1 |
1,186 |
65.0 |
21.7 |
63.5 |
19.62 |
|
A6-2 |
209.9 |
1,324 |
224.0 |
1,253 |
94.2 |
62.5 |
65.4 |
22.24 |
|
A7 |
97.8 |
1,216 |
68.4 |
1,191 |
66.9 |
23.7 |
63.4 |
19.52 |
|
A8 |
89.0 |
1,207 |
54.6 |
1,191 |
66.9 |
23.8 |
63.6 |
19.80 |
|
A9 |
69.3 |
1,189 |
30.5 |
1,184 |
64.4 |
21.1 |
63.4 |
19.42 |
|
A10 |
71.7 |
1,192 |
35.1 |
1,186 |
65.1 |
21.5 |
63.4 |
19.52 |
|
A11 |
77.0 |
1,195 |
39.3 |
1,190 |
66.2 |
24.4 |
63.9 |
20.24 |
|
A12-1 |
79.9 |
1,197 |
42.5 |
1,190 |
66.4 |
23.8 |
63.9 |
19.92 |
|
A12-2 |
84.7 |
1,202 |
49.3 |
1,191 |
67.2 |
24.9 |
64.0 |
20.39 |
|
A12-3 |
110.3 |
1,227 |
85.0 |
1,208 |
74.6 |
35.2 |
64.2 |
20.61 |
|
A13 |
74.7 |
1,192 |
35.4 |
1,185 |
64.9 |
21.3 |
63.4 |
19.47 |
|
A14 |
68.3 |
1,188 |
28.8 |
1,185 |
64.6 |
21.0 |
63.3 |
19.37 |
|
A15 |
72.0 |
1,193 |
35.6 |
1,184 |
64.6 |
21.3 |
63.3 |
19.39 |
|
A16 |
73.5 |
1,194 |
37.2 |
1,185 |
65.0 |
22.0 |
63.5 |
19.65 |
|
A17 |
103.9 |
1,221 |
76.0 |
1,195 |
68.7 |
27.0 |
64.4 |
20.89 |
|
A18 |
79.3 |
1,201 |
47.2 |
1,188 |
67.0 |
25.4 |
63.6 |
19.89 |
|
A19 |
91.1 |
1,209 |
58.3 |
1,201 |
72.3 |
32.2 |
64.0 |
20.39 |
|
A20-1 |
104.1 |
1,249 |
92.1 |
1,196 |
69.0 |
26.5 |
63.4 |
19.54 |
|
A20-2 |
90.8 |
1,225 |
51.0 |
1,196 |
68.7 |
24.1 |
63.5 |
19.61 |
|
A20-3 |
128.4 |
1,291 |
86.2 |
1,216 |
72.7 |
29.1 |
63.9 |
20.08 |
|
A21 |
75.4 |
1,198 |
39.4 |
1,189 |
66.1 |
23.8 |
63.4 |
19.56 |
|
Scenario 2
: Emergency Operation (Emission from Biogas Flare) |
||||||||
|
A1 |
80.8 |
1,198 |
43.8 |
1,189 |
66.5 |
23.9 |
63.8 |
19.97 |
|
A2 |
70.0 |
1,188 |
28.8 |
1,184 |
64.6 |
20.6 |
63.7 |
19.82 |
|
A3 |
74.0 |
1,192 |
34.3 |
1,185 |
65.0 |
21.7 |
63.5 |
19.62 |
|
A4 |
84.1 |
1,202 |
48.4 |
1,191 |
66.6 |
24.0 |
64.1 |
20.42 |
|
A5 |
71.2 |
1,189 |
30.4 |
1,184 |
64.7 |
20.4 |
63.6 |
19.52 |
|
A6-1 |
80.3 |
1,198 |
43.1 |
1,186 |
65.0 |
21.7 |
63.5 |
19.57 |
|
A6-2 |
209.9 |
1,324 |
224.0 |
1,253 |
94.2 |
62.5 |
65.4 |
22.18 |
|
A7 |
95.7 |
1,213 |
64.6 |
1,191 |
66.7 |
23.5 |
63.4 |
19.46 |
|
A8 |
89.0 |
1,207 |
54.6 |
1,191 |
66.9 |
23.8 |
63.6 |
19.77 |
|
A9 |
67.6 |
1,188 |
24.1 |
1,184 |
64.4 |
20.4 |
63.3 |
19.39 |
|
A10 |
69.0 |
1,190 |
25.6 |
1,185 |
64.5 |
20.3 |
63.4 |
19.47 |
|
A11 |
77.0 |
1,195 |
38.5 |
1,187 |
65.8 |
22.9 |
63.6 |
19.81 |
|
A12-1 |
79.9 |
1,197 |
42.5 |
1,190 |
66.4 |
23.8 |
63.9 |
19.84 |
|
A12-2 |
84.7 |
1,202 |
49.3 |
1,191 |
67.2 |
24.9 |
64.0 |
20.29 |
|
A12-3 |
110.3 |
1,227 |
85.0 |
1,208 |
74.6 |
35.2 |
64.2 |
20.58 |
|
A13 |
74.7 |
1,192 |
35.4 |
1,185 |
64.9 |
21.3 |
63.4 |
19.43 |
|
A14 |
67.5 |
1,185 |
25.2 |
1,185 |
64.6 |
21.0 |
63.3 |
19.35 |
|
A15 |
67.1 |
1,187 |
24.7 |
1,184 |
64.4 |
20.5 |
63.3 |
19.34 |
|
A16 |
70.3 |
1,192 |
27.1 |
1,185 |
64.5 |
20.3 |
63.4 |
19.52 |
|
A17 |
103.9 |
1,221 |
76.0 |
1,195 |
68.7 |
27.0 |
64.4 |
20.84 |
|
A18 |
76.1 |
1,196 |
36.6 |
1,188 |
65.6 |
21.0 |
63.4 |
19.40 |
|
A19 |
90.9 |
1,208 |
57.9 |
1,201 |
71.4 |
30.5 |
63.9 |
20.11 |
|
A20-1 |
104.1 |
1,249 |
45.4 |
1,196 |
68.8 |
21.7 |
63.3 |
19.31 |
|
A20-2 |
90.8 |
1,225 |
51.0 |
1,196 |
68.3 |
22.1 |
63.4 |
19.39 |
|
A20-3 |
128.4 |
1,291 |
86.2 |
1,216 |
72.6 |
28.4 |
63.9 |
19.93 |
|
A21 |
75.3 |
1,198 |
34.6 |
1,188 |
65.0 |
21.5 |
63.3 |
19.35 |
|
AQO |
300 |
30,000 |
800 |
10,000 |
150 |
350 |
80 |
80 |
|
Notes: (a) Background concentrations (NO2 of 63 µg m-3, CO
of 1,181 µg m-3 and SO2 of 19 µg m-3) have
been included. (b) The predicted concentrations of these
air pollutants at different ASR elevations are summarized in Annex A4. |
||||||||
The predicted cumulative maximum NO2, CO and SO2
concentrations under different averaging times at various heights at ASRs A1 –
A19 and A21 are well within the respective AQOs. The worst affected height is at 30m above
ground. The highest cumulative maximum
NO2, CO and SO2 concentrations, including the background
air quality, are predicted at 30m above ground; the ASR that is affected the
most varies depending on the averaging period.
The maximum
contribution of hourly NO2 concentration at the identified ASRs from
the operation of the biodiesel plant alone is at ASR A2, which is located immediately at the south
of the Project Site. It is about 34%of
the total predicted concentration at A2 (34 µgm-3 contributed from
the biodiesel plant operation during normal condition).
The predicted cumulative maximum NO2,
CO and SO2 concentrations under different averaging times at various
heights at LOHAS Park (A20) are also well within the respective AQOs.
Referring the predicted results presented in Table A4-1 of Annex A4,
the maximum hourly NO2 concentration at LOHAS Park due to the
operation of the biodiesel plant, (ie 39.6 µg m-3, which is about
13.2% of the hourly AQO criterion for NO2), is predicted at 60m above
ground. The predicted hourly NO2
concentrations at this ASR due to the operation of the biodiesel plant reduce
with increasing height and at 120m above ground the hourly NO2
concentration reduced to 2.8
µg m-3, which is about 0.9% of the hourly AQO criterion for NO2. This suggests that at level higher than 120m,
the Project contribution to the total hourly NO2 concentrations at
The highest predicted cumulative maximum hourly NO2
concentrations (including background) at
Figures 4.6a to 4.6e and 4.6h to
4.6j present the isopleths of the cumulative maximum average hourly NO2
concentrations at 1.5m to 30m above ground and 60m, 90m and 120m at
The assessment indicates that the
operation of the proposed biodiesel plant in the TKOIE will not cause adverse
air quality impacts to the identified ASRs at TKOIE, Areas 85 and 86.
Acetyldehyde and Methanol
Non-cancer
Health Risk Assessment: The predicted hourly methanol
concentration and annual average acetyldehyde and
methanol concentrations at different ASR elevations are presented in Annex A4 and the highest predicted
results are summarized in Table 4.6b.
Table 4.6b Predicted
Highest Hourly Concentration of Methanol and Annual Average Concentrations of Acetyldehyde and Methanol
|
ASR |
Predicted Highest Hourly
Concentrations (µg m-3) |
Predicted Highest Annual
Average Concentrations (µg m-3) |
|
|
|
Methanol |
Methanol |
Acetyldehyde |
|
A1 |
15.5 |
1.27 |
1.27 |
|
A2 |
58.9 |
2.90 |
2.90 |
|
A3 |
10.6 |
0.32 |
0.32 |
|
A4 |
5.2 |
0.10 |
0.10 |
|
A5 |
6.8 |
0.10 |
0.10 |
|
A6-1 |
7.1 |
0.08 |
0.08 |
|
A6-2 |
6.3 |
0.08 |
0.08 |
|
A7 |
5.4 |
0.06 |
0.06 |
|
A8 |
7.0 |
0.05 |
0.05 |
|
A9 |
6.2 |
0.04 |
0.04 |
|
A10 |
3.0 |
0.04 |
0.04 |
|
A11 |
7.7 |
0.16 |
0.16 |
|
A12-1 |
6.4 |
0.16 |
0.16 |
|
A12-2 |
4.0 |
0.07 |
0.07 |
|
A12-3 |
5.8 |
0.07 |
0.07 |
|
A13 |
5.8 |
0.05 |
0.05 |
|
A14 |
6.2 |
0.04 |
0.04 |
|
A15 |
3.3 |
0.03 |
0.03 |
|
A16 |
6.5 |
0.06 |
0.06 |
|
A17 |
2.2 |
0.05 |
0.05 |
|
A18 |
5.1 |
0.11 |
0.11 |
|
A19 |
5.7 |
0.10 |
0.10 |
|
A20-1 |
3.9 |
0.02 |
0.02 |
|
A20-2 |
4.6 |
0.05 |
0.05 |
|
A20-3 |
1.3 |
0.03 |
0.03 |
|
A21 |
4.7 |
0.06 |
0.06 |
|
Reference
Concentration : |
2.8x10⁴ |
4,000 |
9 |
The results indicate that the predicted
hourly concentration of methanol and annual average concentrations of acetyldehyde and methanol at the identified ASRs are well
below the respective reference chronic and acute concentrations. Hence, the chronic and acute health impacts
of acetyldehyde and methanol are considered to be
insignificant.
Cancer
Health Risk Assessment: The calculated individual cancer health risk
levels of acetyldehyde at different elevations of the
identified ASRs are presented in Annex A4
and the highest individual risk level of ASRs are summarized in Table 4.6c.
Table 4.6c Individual
Cancer Risk of Acetyldehyde
|
ASR |
Predicted Highest
Individual Cancer Risk of Acetyldehyde (a) |
|
A1 |
3.43E-06 |
|
A2 |
7.82E-06 |
|
A3 |
8.61E-07 |
|
A4 |
2.78E-07 |
|
A5 |
2.83E-07 |
|
A6-1 |
2.28E-07 |
|
A6-2 |
2.05E-07 |
|
A7 |
1.67E-07 |
|
A8 |
1.37E-07 |
|
A9 |
9.65E-08 |
|
A10 |
1.10E-07 |
|
A11 |
4.31E-07 |
|
A12-1 |
4.19E-07 |
|
A12-2 |
1.86E-07 |
|
A12-3 |
1.76E-07 |
|
A13 |
1.30E-07 |
|
A14 |
9.77E-08 |
|
A15 |
7.00E-08 |
|
A16 |
1.52E-07 |
|
A17 |
1.44E-07 |
|
A18 |
3.00E-07 |
|
A19 |
2.61E-07 |
|
A20-1 |
5.27E-08 |
|
A20-2 |
1.32E-07 |
|
A20-3 |
7.48E-08 |
|
A21 |
1.63E-07 |
|
Note: (a)
Unit risk factor of acetyldehyde (as presented
in Table 4.2b) was used for the
calculation. The individual risk level
is calculated by the predicted annual average concentration of acetyldehyde multiplying the unit risk factor. |
|
The calculated
individual cancer risk levels of acetyldehyde at different
elevations at the identified ASRs are lower than 10-6 except at A1
and A2. For A1 and A2, the risk should
be reduced to As Low As Reasonably Practicable (ALARP). It should be noted that the assessment
conservatively assumed that all the impurities of methanol are acetyldehyde (see Section
4.4.2) and it is expected that the actual risk will be lower than predicted
in this assessment.
Odour Emission from
Final Scrubber
The predicted
maximum 5-second odour levels at different elevations
of ASRs are presented in Annex A4 and
the highest predicted odour levels at ASRs are
summarized in Table 4.6d.
The predicted
5-second average odour levels at various heights at
the identified ASRs are well within the odour
criterion (ie 5 OU in 5-second averaging time).
Figures 4.6k to 4.6o present the isopleths of the predicted maximum
5-second odour levels at different heights of the identified ASRs. The isopleths show that the odour impacts are
localized and comply with the EIAO-TM
assessment criterion. Hence, no adverse
odour impact is anticipated.
Table 4.6d Highest
Predicted Maximum 5-second Odour Levels
|
ASR |
Predicted Maximum 5-second Odour Level (Odour Unit) |
|
A1 |
2.7 |
|
A2 |
2.2 |
|
A3 |
1.0 |
|
A4 |
1.2 |
|
A5 |
0.9 |
|
A6-1 |
0.6 |
|
A6-2 |
1.1 |
|
A7 |
0.9 |
|
A8 |
0.6 |
|
A9 |
0.5 |
|
A10 |
0.3 |
|
A11 |
0.5 |
|
A12-1 |
0.7 |
|
A12-2 |
0.5 |
|
A12-3 |
0.2 |
|
A13 |
0.3 |
|
A14 |
0.2 |
|
A15 |
0.3 |
|
A16 |
0.4 |
|
A17 |
0.4 |
|
A18 |
0.1 |
|
A19 |
0.1 |
|
A20-1 |
0.1 |
|
A20-2 |
0.3 |
|
A20-3 |
0.3 |
|
A21 |
0.1 |
|
5-second Odour Criterion : |
5 |
4.7
Mitigation Measures
4.7.1
Construction Phase
Although the construction dust impact is expected to be
minimal, the following dust control measures stipulated in the Air Pollution Control (Construction Dust)
Regulation will be implemented to further reduce the fugitive dust emission
as much as possible:
·
Dust
control measures such as water spaying on roads and dusty areas, covering of
lorries by impervious sheets and controlling of the falling height of fill
materials will be implemented;
·
Effective
dust screens, sheeting or netting will be provided to enclose the scaffolding
from the ground level of the facility during the building construction;
·
All
debris and materials will be covered or stored in a sheltered debris collection
area;
·
Hoarding
from ground level will be provided along the entire length of the site boundary
except for a site entrance or exit;
·
Every
stockpile of dusty materials will be covered entirely by impermeable sheeting
or placed in an area sheltered on the top and the 3 sides.
Good site practices such as regular
maintenance and checking of the diesel powered mechanical equipment will be
adopted to avoid any black smoke emissions and to minimize gaseous emissions.
4.7.2
Operation Phase
No mitigation
measures will be required.
4.8
Residual Impacts
4.8.1
Construction Phase
No adverse residual impact is anticipated after
the implementation of the recommended mitigation measures described in Section 4.7.1.
4.8.2
Operation Phase
No adverse residual impact is anticipated.
4.9
Environmental
Monitoring and Audit
4.9.1
Construction Phase
As the scale of construction works is small,
no dust monitoring (in terms of TSP) is required. However, regular site audit (ie monthly) will be performed to ensure the implementation
of suitable dust control measures and good site practices recommended in Section 4.7.1.
4.9.2
Operation Phase
Odour concentration at the stack of the
final air scrubber will be monitored on monthly basis for the first two years
of the operation. Exhaust gas
temperature and exhaust gas velocity of the final scrubber will also be
monitored at the same frequency.
Odour patrol will be carried out along the
Project Site boundary on
monthly basis during the first year of the operation of the biodiesel
plant. If there is no exceedance of action limit or there is no substantiated
odour compliant during the first year of operation, the monitoring frequency
will be reduced to quarterly intervals in the second year of the operation.
During the second year of operation, if the action level is triggered,
the frequency will be resumed to monthly until compliance with the action level
for three consecutive months is obtained and the frequency will be reduced to
quarterly interval thereafter. If the
action level is not triggered for four consecutive quarterly monitoring, the
monitoring can be terminated
Detailed monitoring programme and
requirements are presented in Section 9.2.
4.10
Conclusions
4.10.1
Construction Phase
The Site has been
formed and is currently vacant. No major
earthworks will be required for the site formation works and only minor
excavation works will be required for the construction of the foundation works
and site utilities. The storage tanks
and process equipment will be pre-fabricated off-site and assembled on site using hydraulic and tower cranes and hence minimal
dust will be generated from this activity.
Dust generated from the minor excavation works and concreting works for
the construction of site buildings will be minimal. The dust and air emissions generated from the marine works will be
minimal.
The jetty will be constructed by piled
deck and no dredging of marine sediment will be required. Marine piles will be drilled through the
existing rubble mound seawall to competent bearing strata by a piling rig
mounted barge. The bored piles will be
filled with concrete prior to placement of trellis beam and pre-cast concrete
panels. The dust and air emissions
generated from the marine works will be minimal.
With the
implementation of dust suppression measures stipulated under the Air Pollution Control (Construction Dust)
Regulation and the adoption of good site practices, no adverse construction
dust impact is anticipated. Dust
monitoring during the construction phase is therefore considered not necessary.
Monthly site
audits will be conducted to ensure the implementation of suitable dust control
measures and good site practices during the construction phase.
4.10.2
Operational Phase
The stacks of the boiler and biogas flare (if in operation), and the
exhaust of the
The potential odour impact due to the discharge of exhaust air from the
final air scrubber of the on-site wastewater treatment plant has been
evaluated. After scrubbing, the odour concentration will be significantly reduced and will
not cause adverse odour impacts to the identified
ASRs.
The concentrations
of
Odour concentration at the stack of the
final air scrubber will be monitored for the first two years of operation of
the biodiesel plant and odour patrols along the Project Site boundary will also
be carried out to confirm that the operation of biodiesel plant will not cause
adverse odour impacts.
With the implementation
of proper design, the recommended mitigation measures and monitoring programme, it is concluded that the construction and
operation of the biodiesel plant will not cause adverse air quality impacts and
will comply with the EIAO-TM
requirements.