1.6 Objectives of the EIA Report
2.1 General Description of the Project
2.3 Recommended Outline Development Plan and Revised Preliminary Layout Plan
2.5 Nature, Benefit and Scope of the Project
2.7 Tentative Implementation Programme
2.8 Concurrent Projects and Evaluation of Potential Cumulative Impacts
3.2 Environmental Legislation, Standards and Guidelines
3.3 Description of the Environment
3.6 Identification and Evaluation of Environmental Impacts
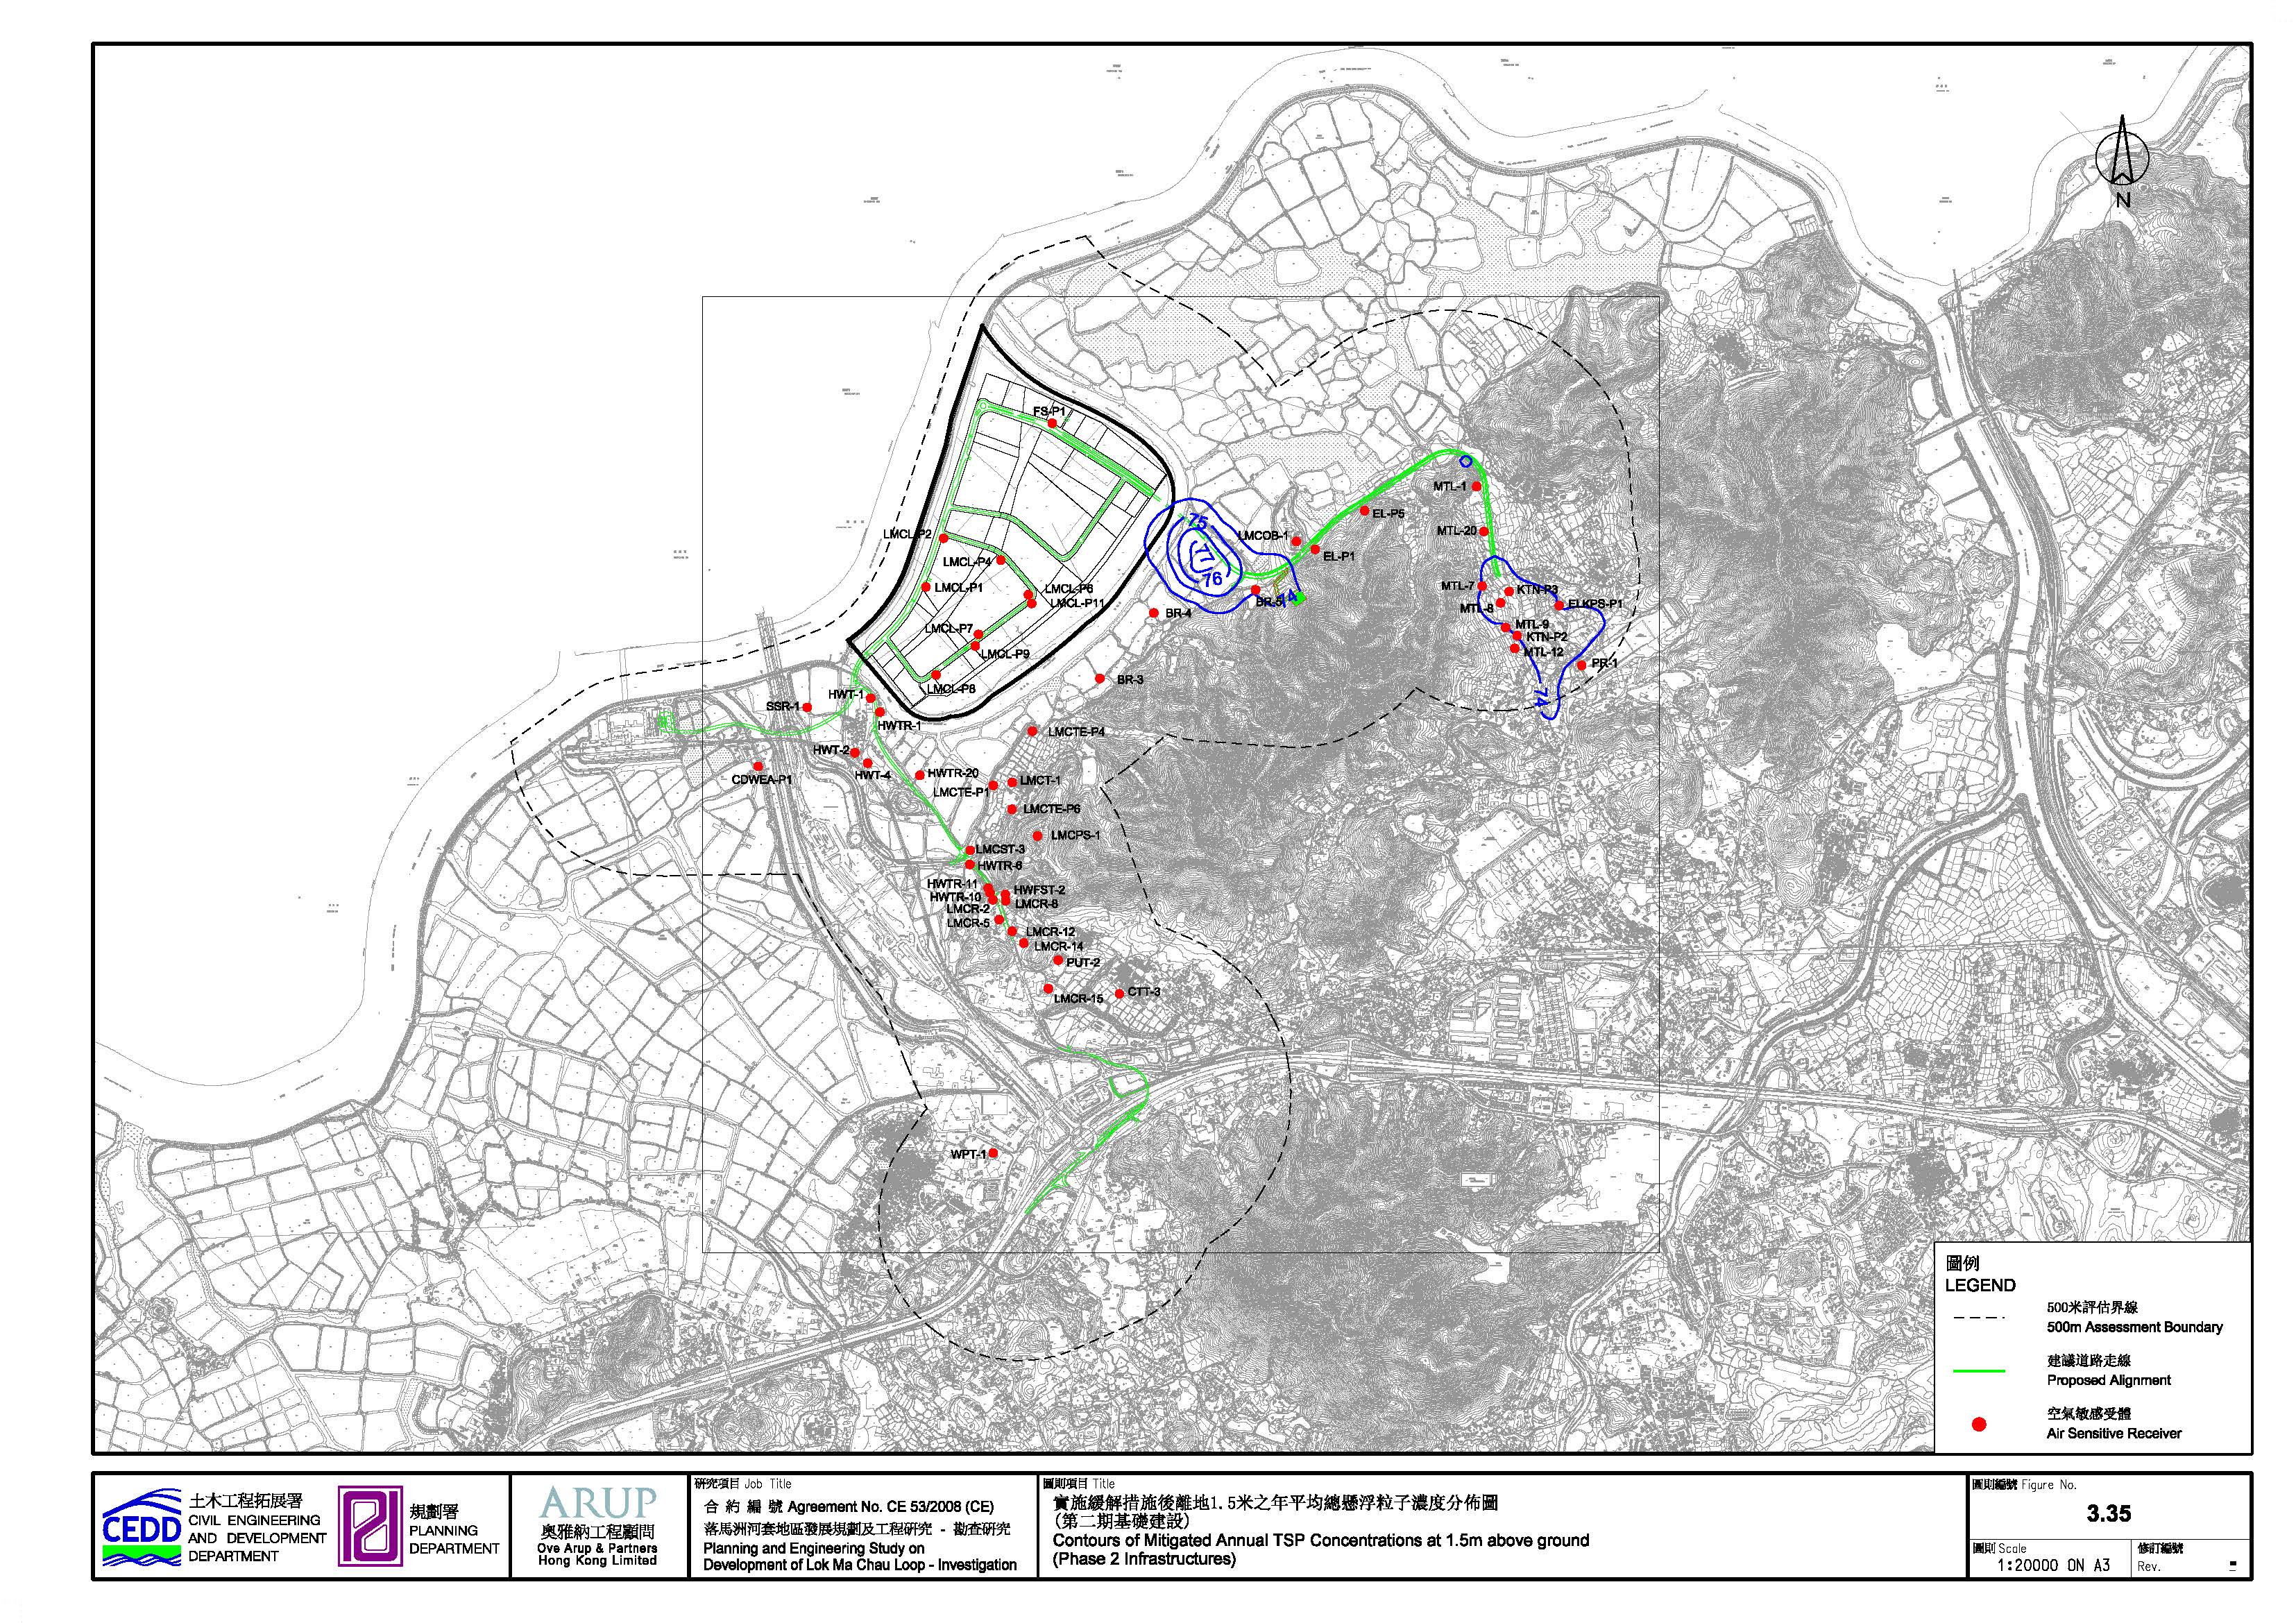
3.7 Prediction and Evaluation of Environmental Impacts
3.9 Residual Environmental Impacts
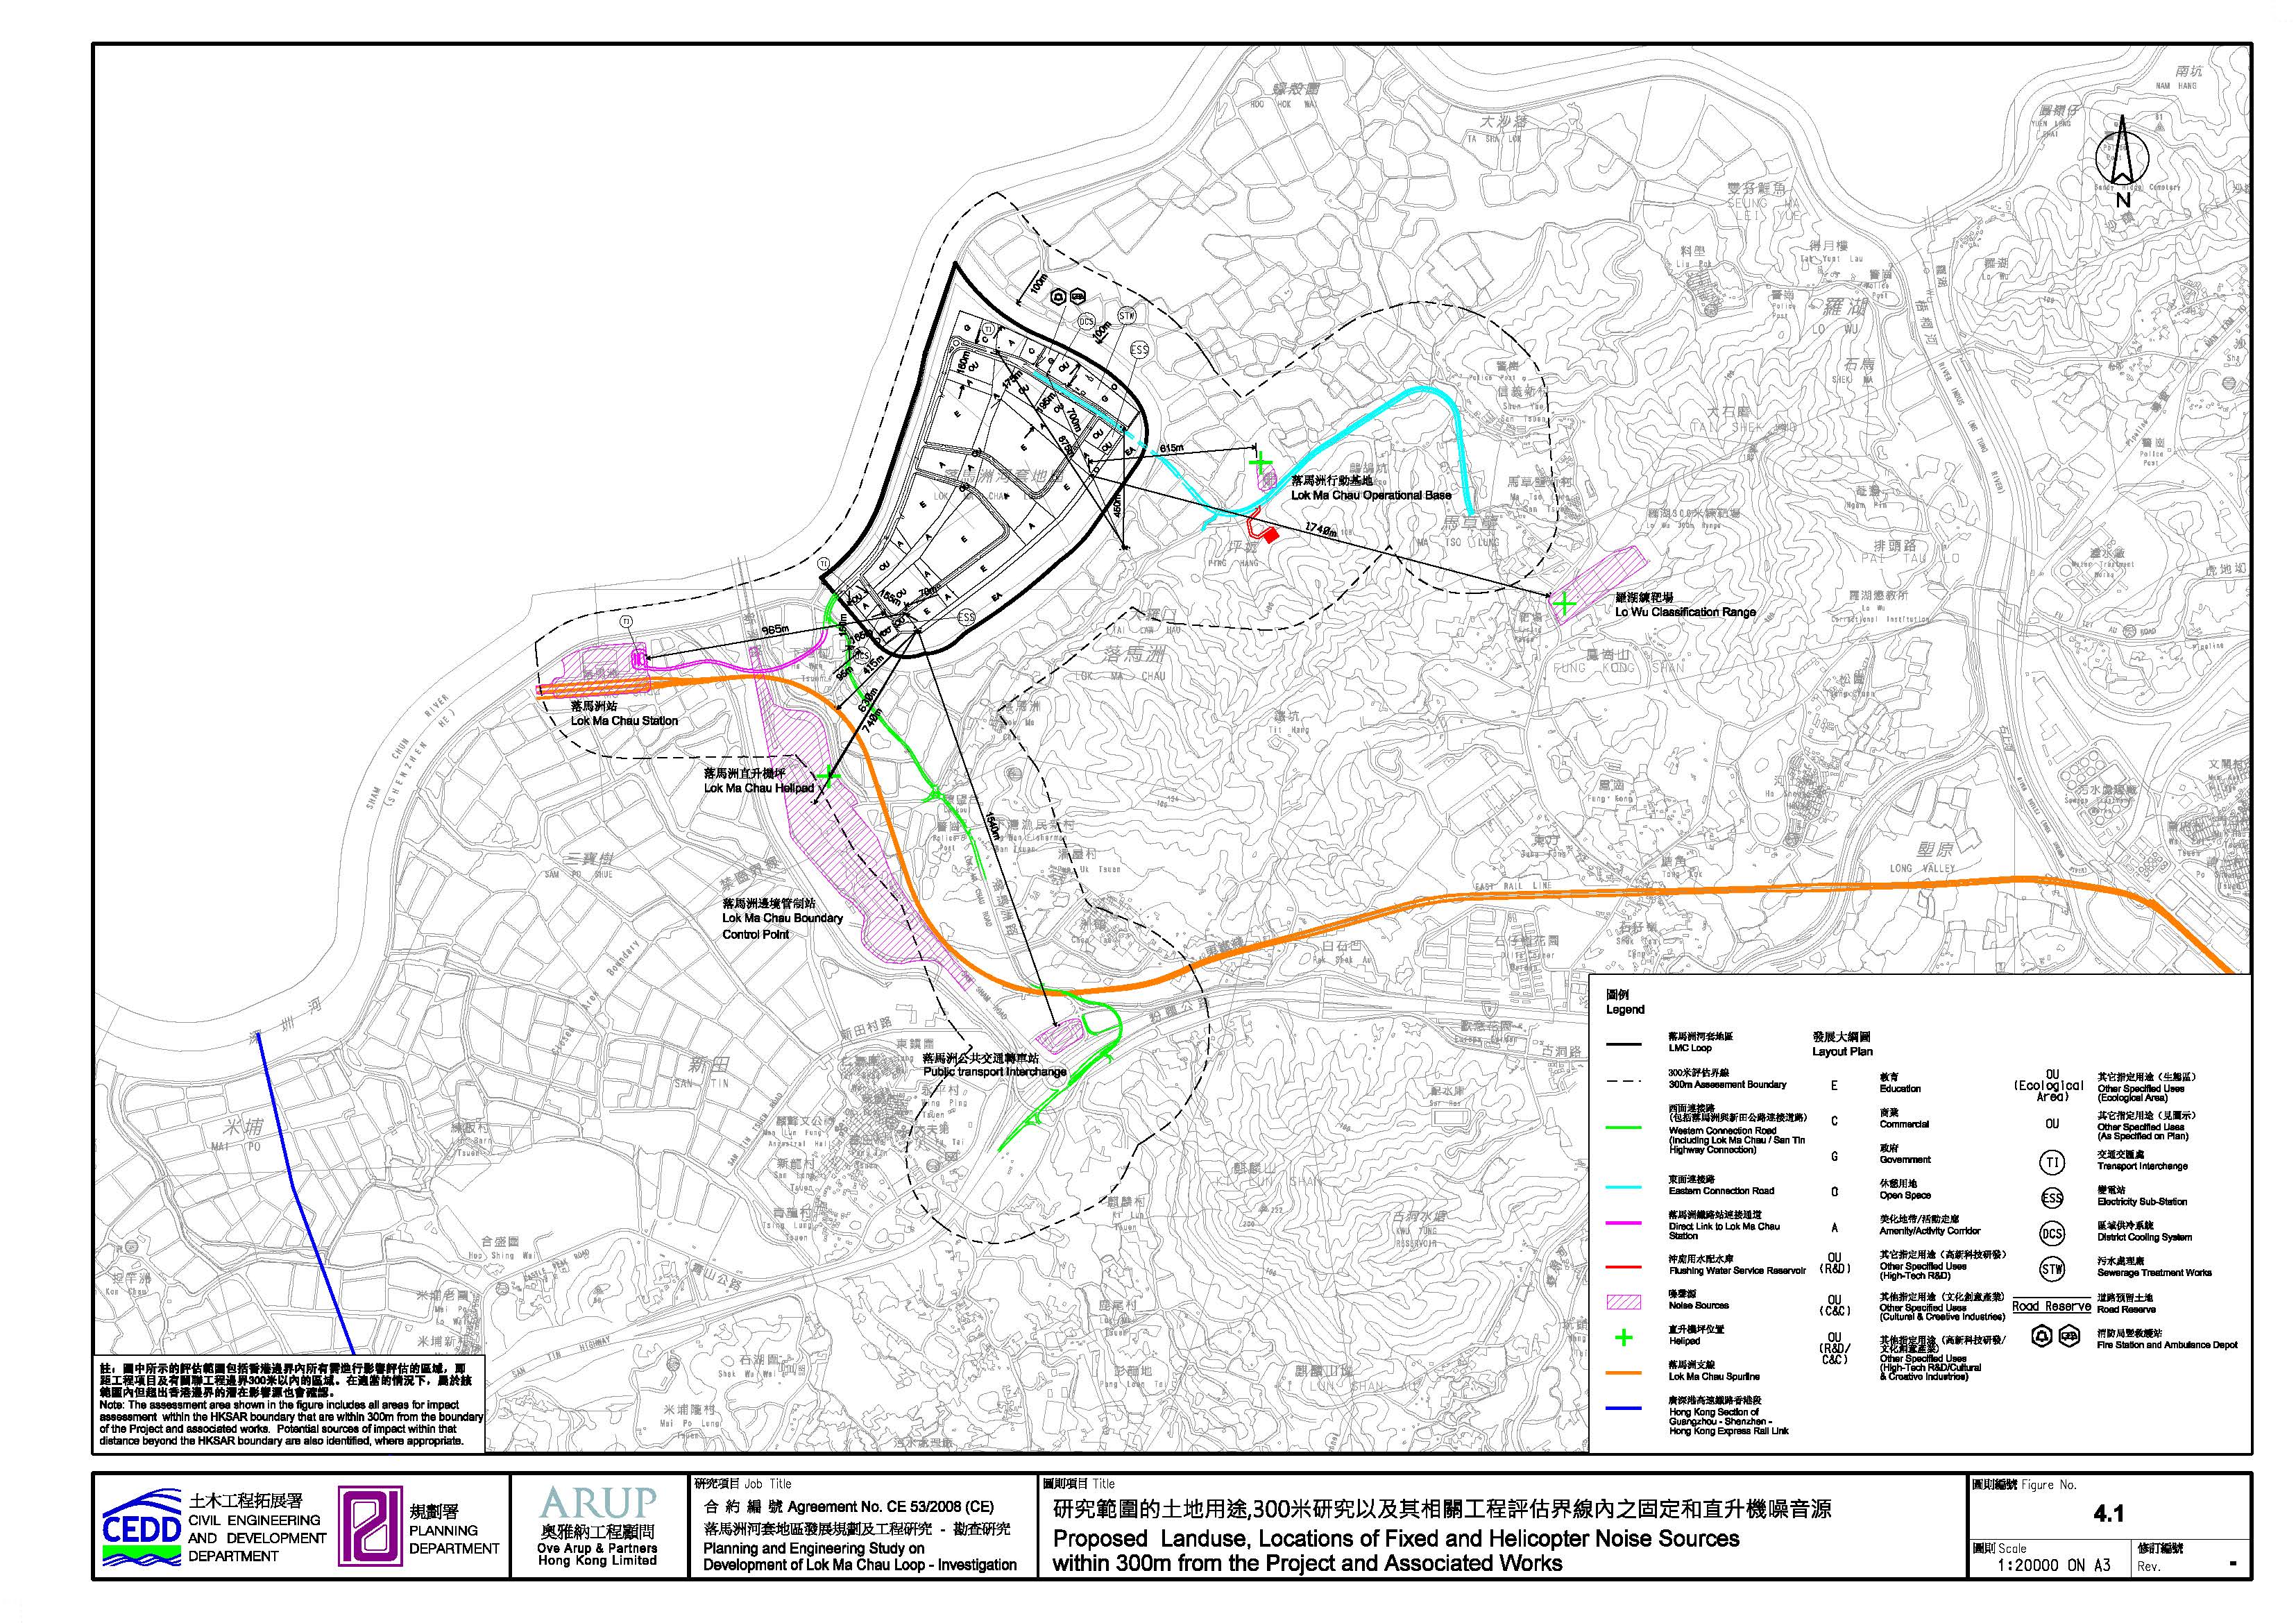
4.2 Environmental Legislation, Standards and Guidelines
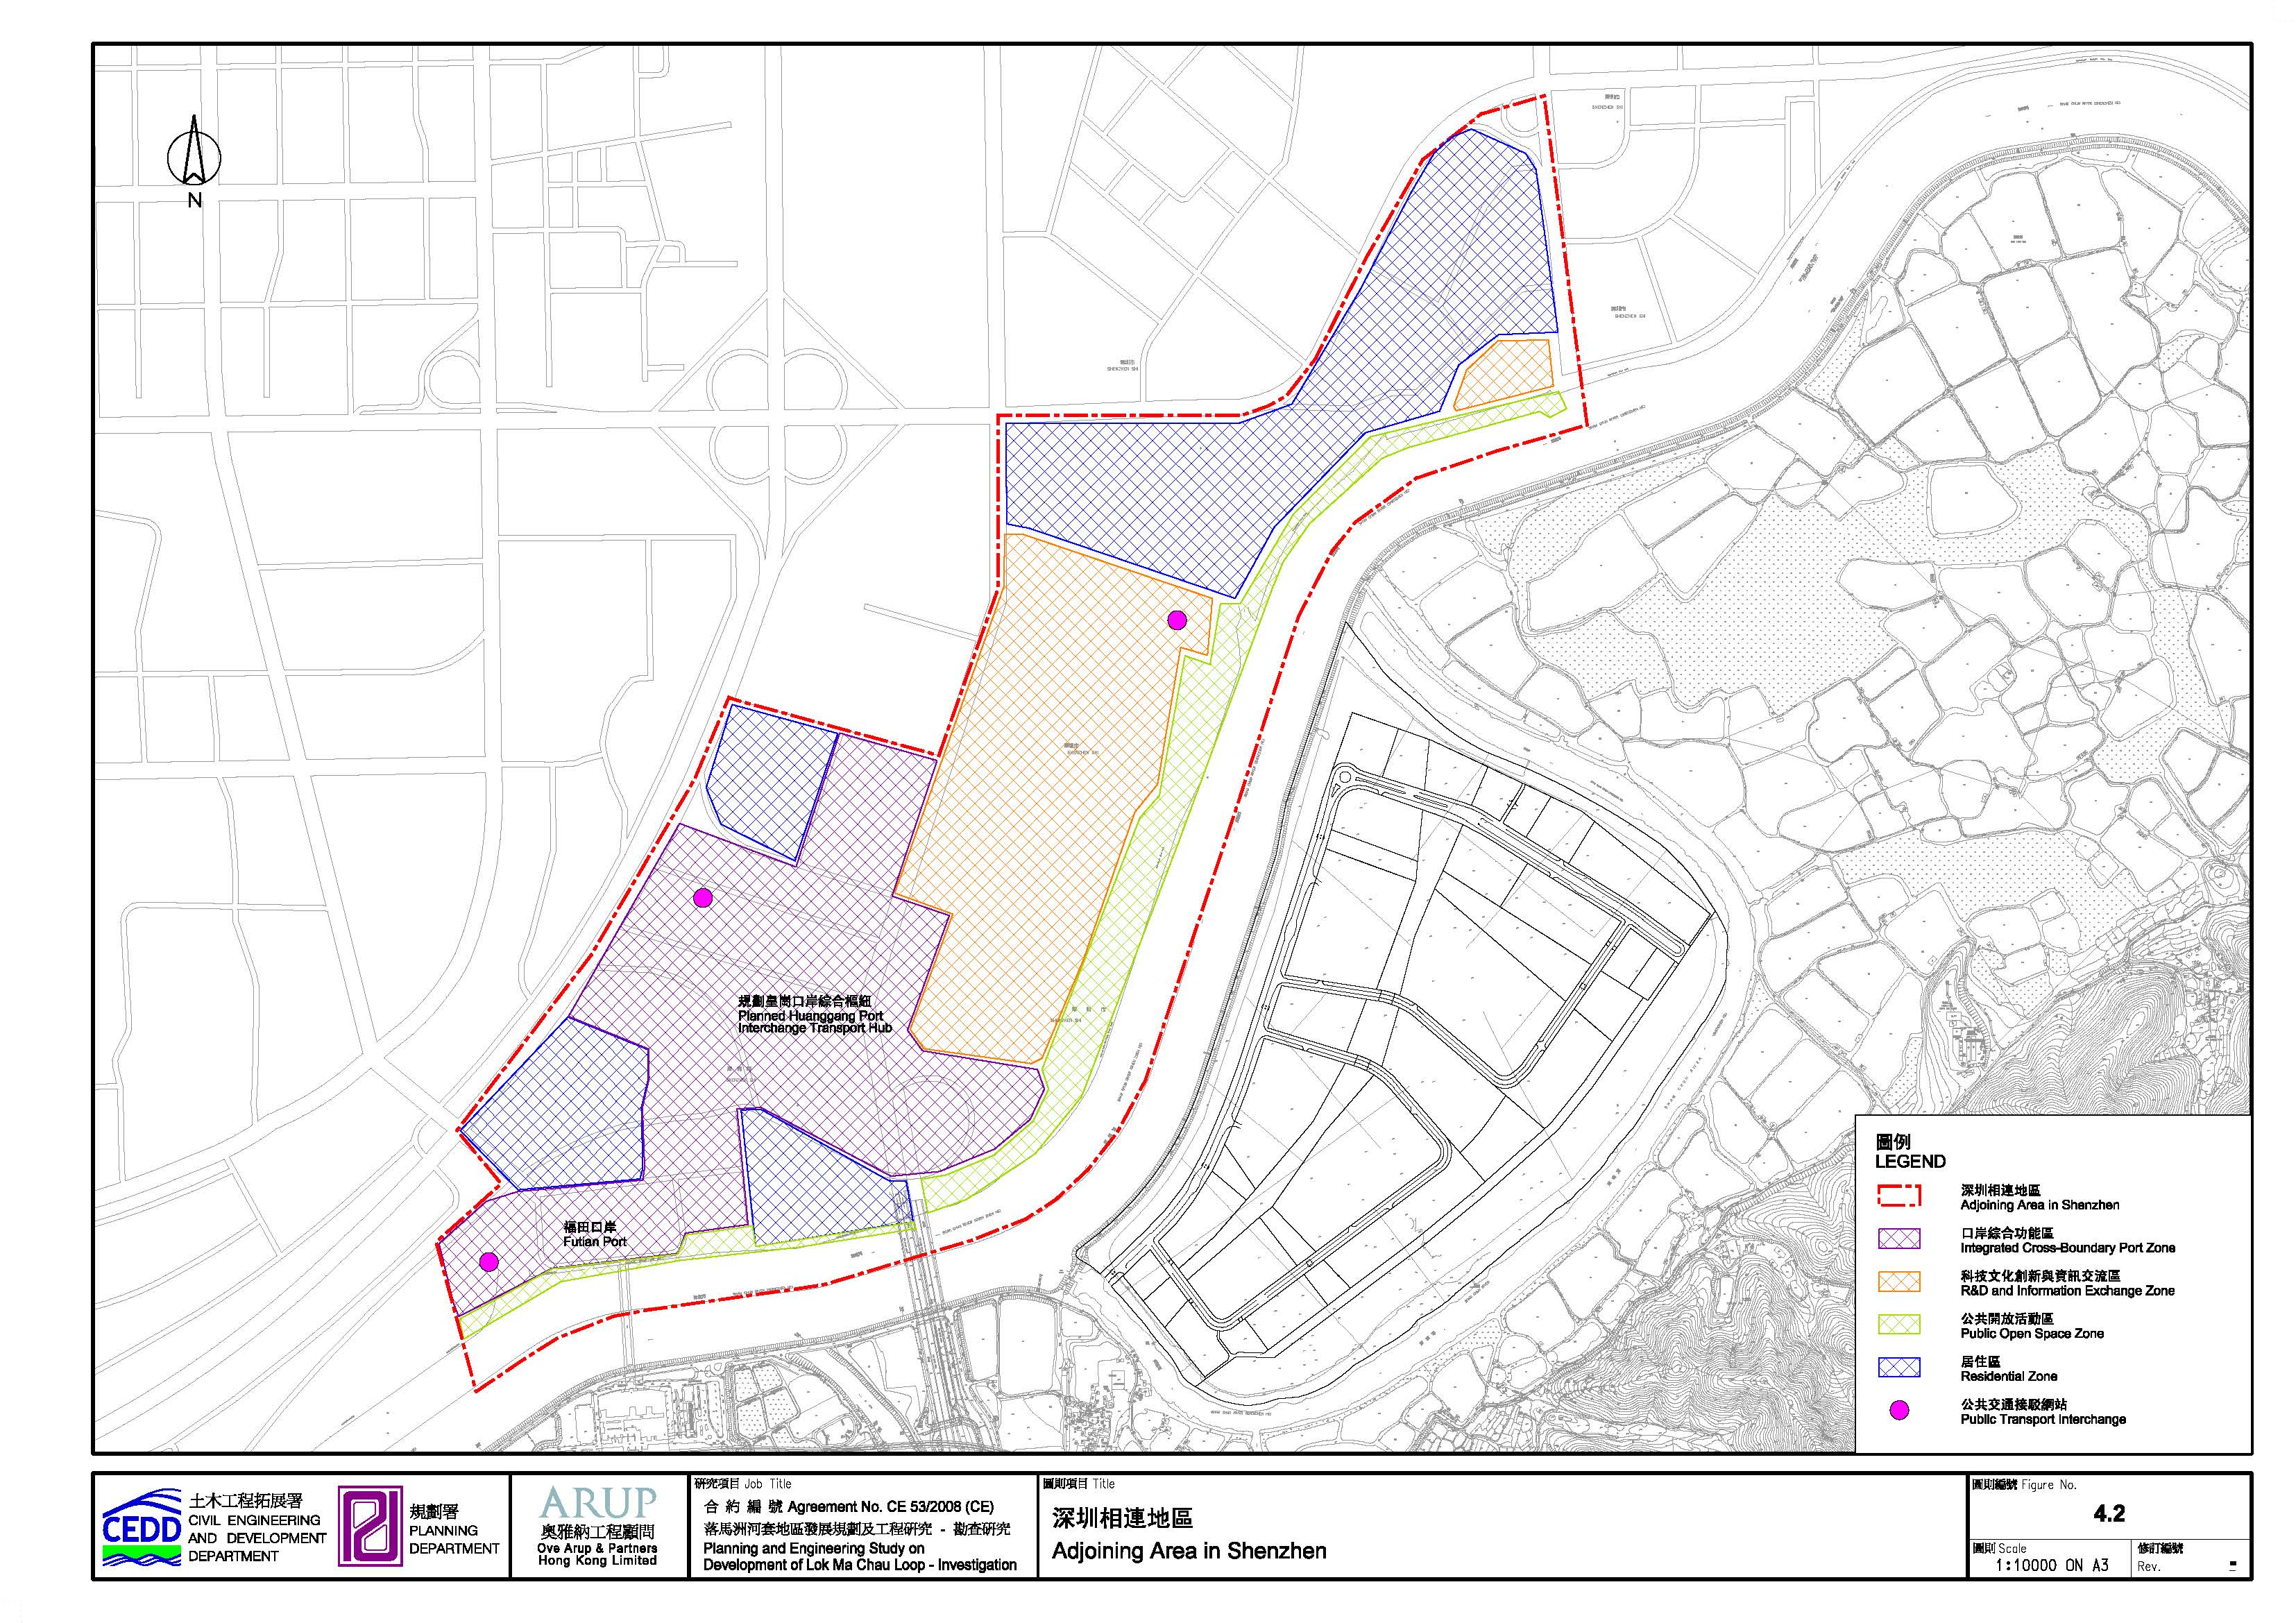
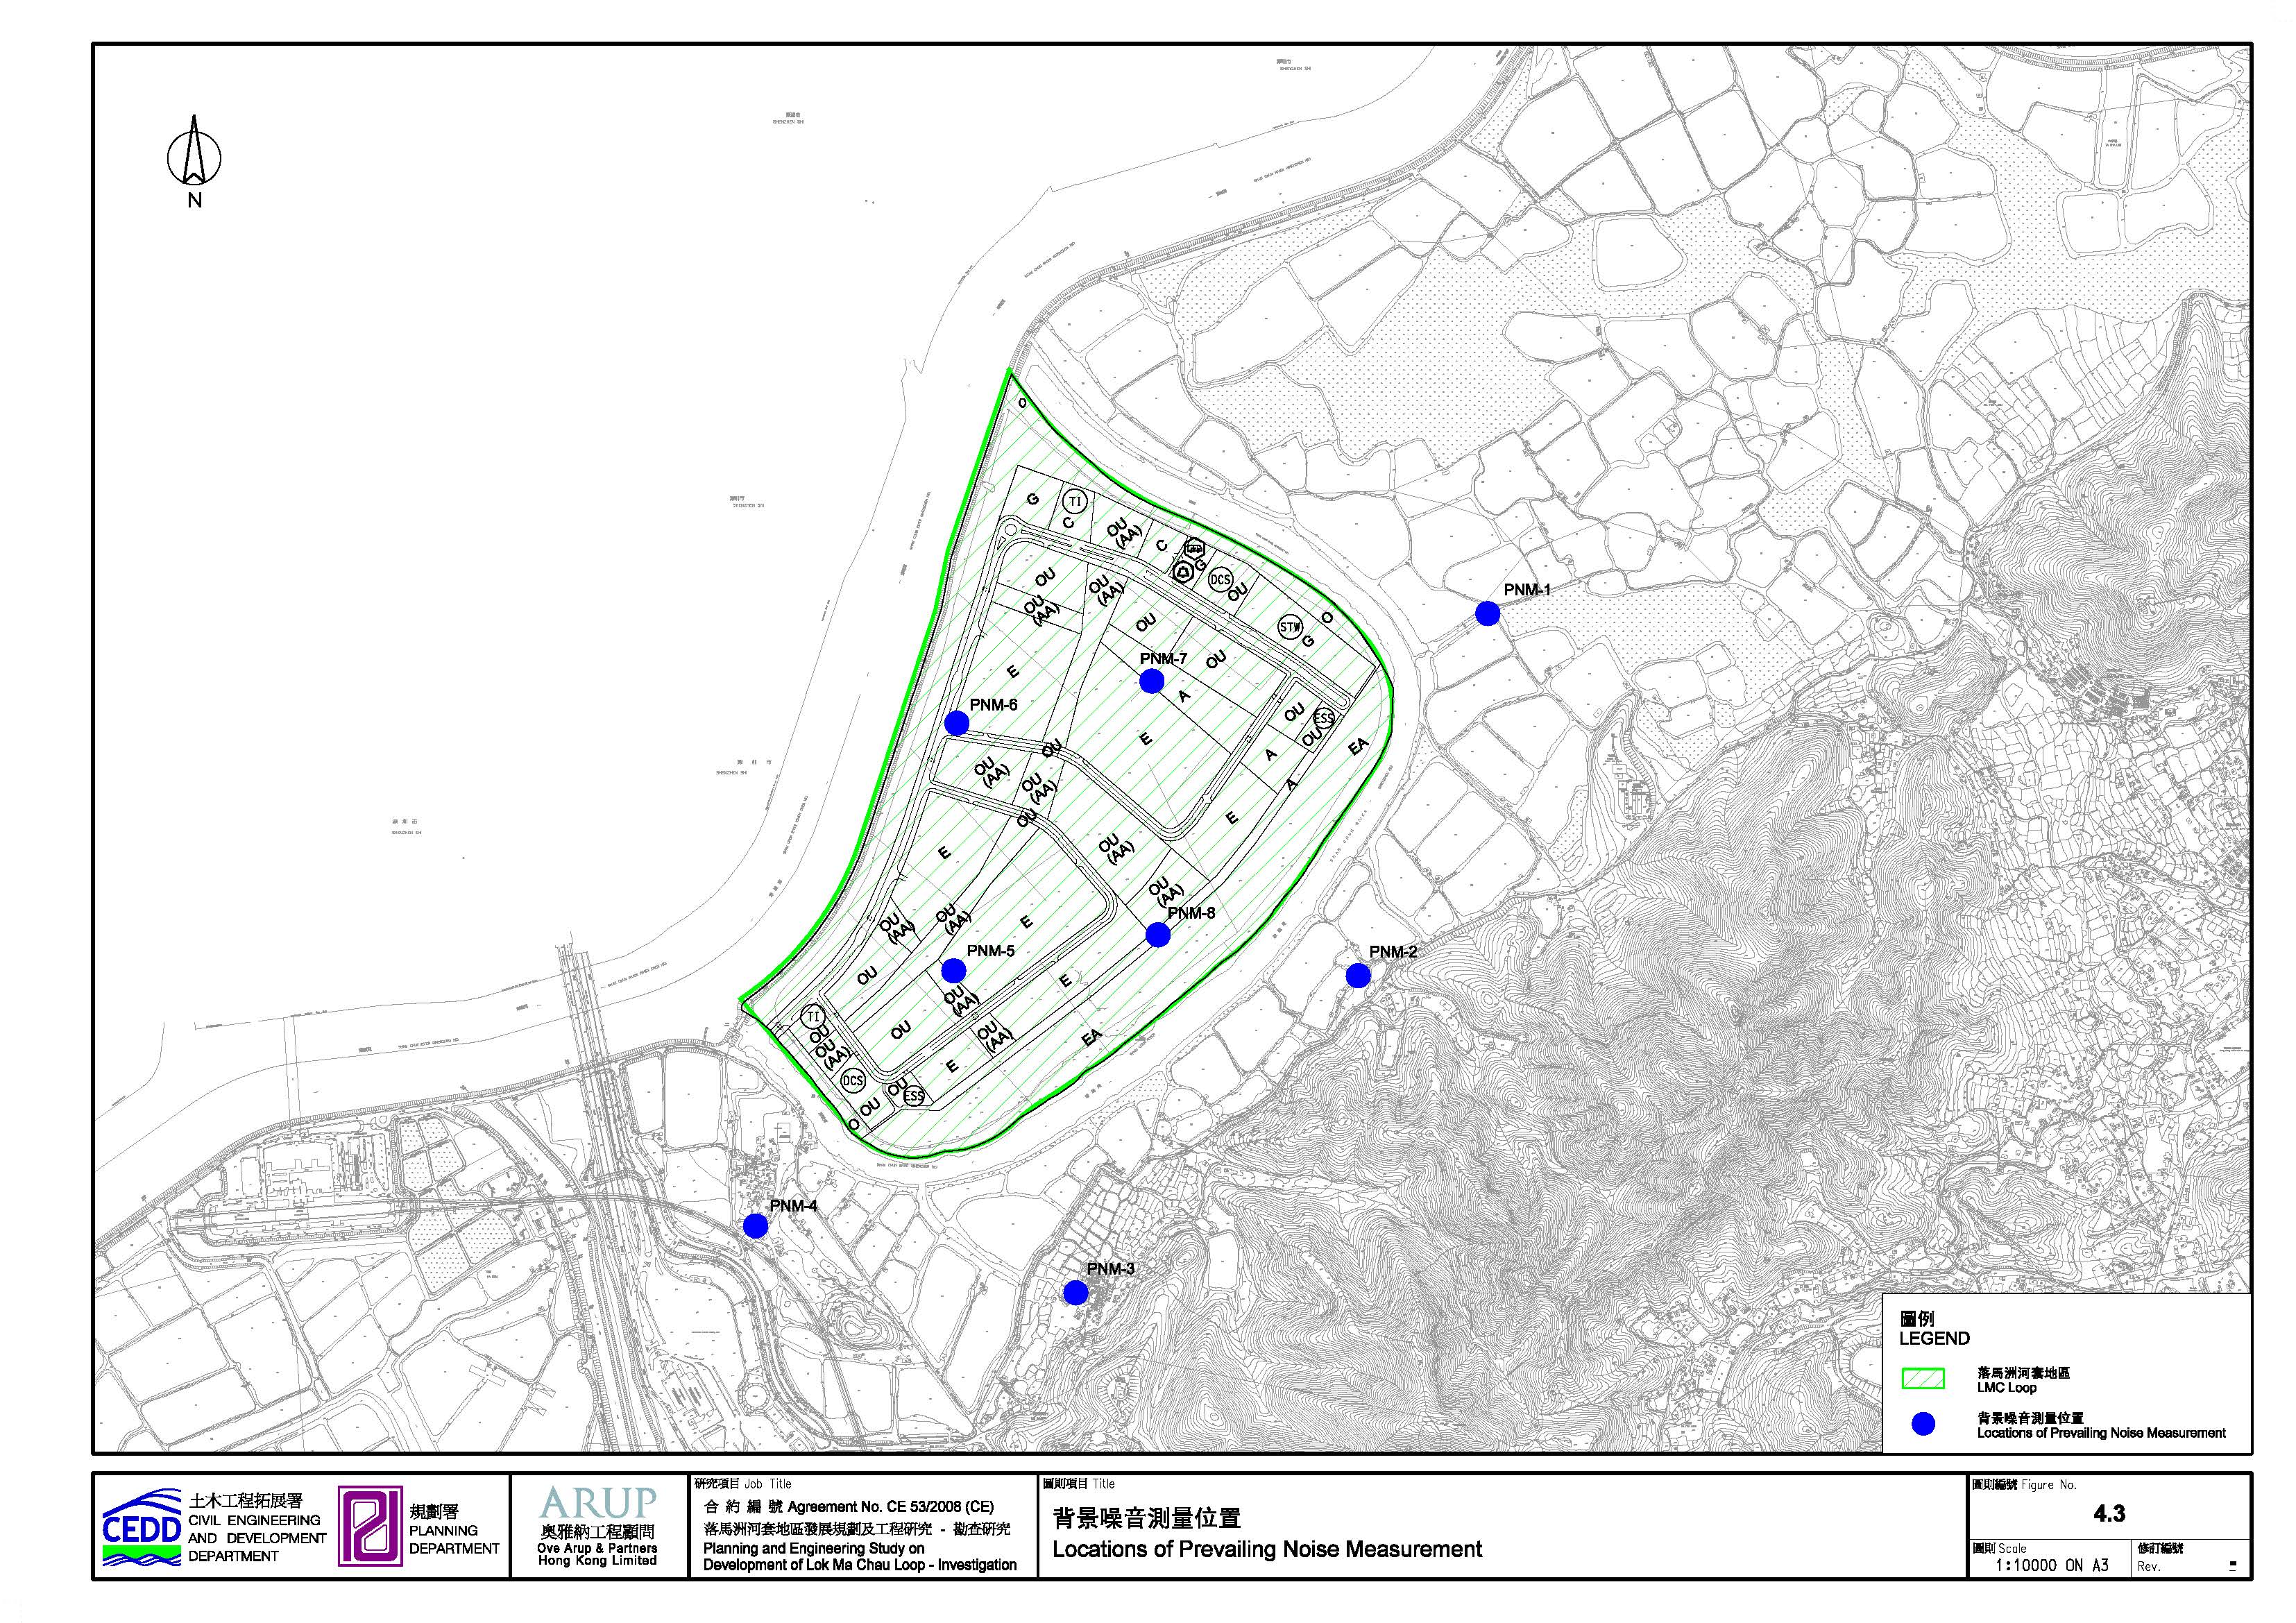
4.3 Description of the Environment
4.9 Residual Environmental Impacts
5.2 Environmental Legislations, Standards and Guidelines
5.3 Description of the Environment
5.6 Identification and Evaluation of Environmental Impacts
5.9 Residual Environmental Impacts
6 Sewerage and Sewage Treatment Implications
6.2 Environmental Legislations, Standards and Guidelines
6.3 Description of the Environment
6.5 Identification and Evaluation of Sewage and Sewerage Treatment Implications
7 Waste Management Implications
7.2 Environmental Legislation, Standards and Guidelines
7.3 Description of the Environment
7.5 Identification and Evaluation of Waste Management Implications
7.7 Residual Waste Management Implications
8.2 Environmental Legislation, Standards and Guidelines
8.4 Description of the Environment
8.6 Identification and Evaluation of Land Contamination
8.7 Remediation Action Plan for LMC Loop
9.2 Environmental Legislation, Standards and Guidelines
9.3 Need for Hazard Assessment
10.2 Environmental Legislation, Standards and Guidelines
10.3 Description of the Environment
10.5 Identification and Evaluation of Impact
11 Landscape and Visual Impact
11.2 Environmental Legislation, Standards and Guidelines
11.3 Review of Planning and Development Control Framework
11.5 Landscape Baseline, Impact Assessment and Mitigation
11.6 Visual Baseline, Impact Assessment and Mitigation
11.8 Residual Landscape Impacts
12.2 Environmental Legislation, Standards and Guidelines
12.5 Evaluation of Habitats and Species
12.6 Prediction and Evaluation of Ecological Impacts
12.8 Implementation of Mitigation
12.9 Residual Ecological Impacts
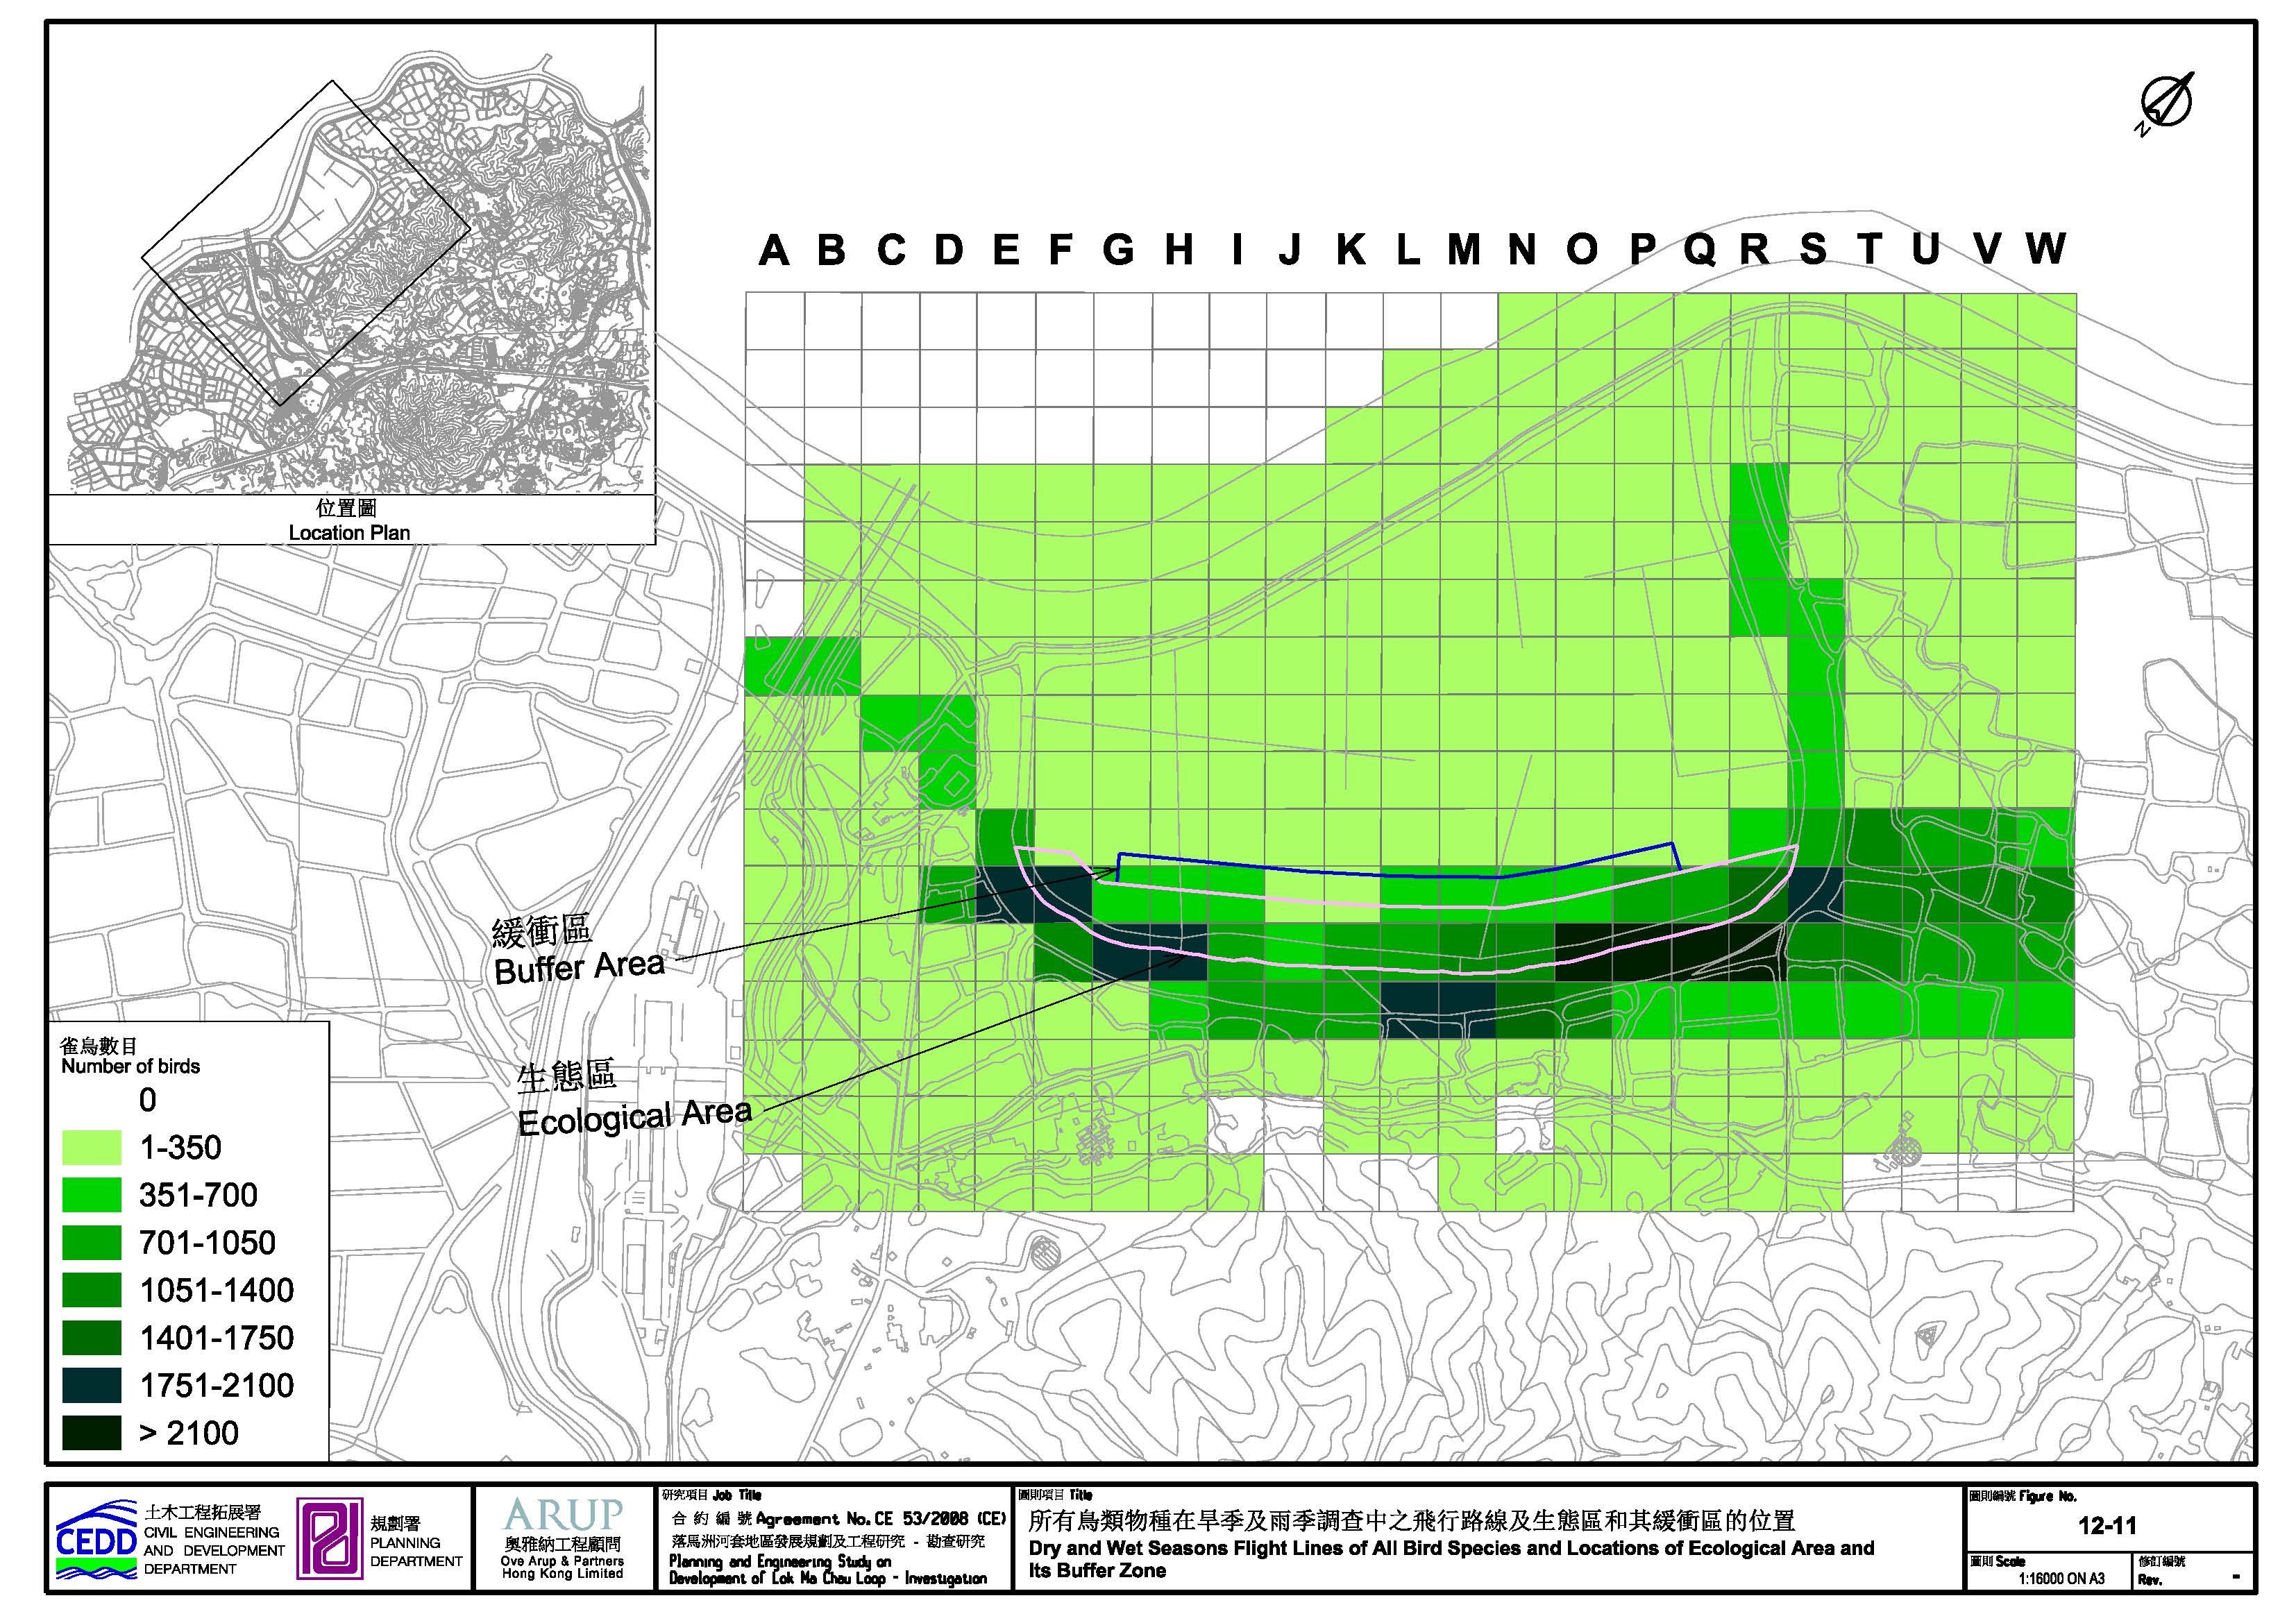
12.10 Ecological Monitoring Programme
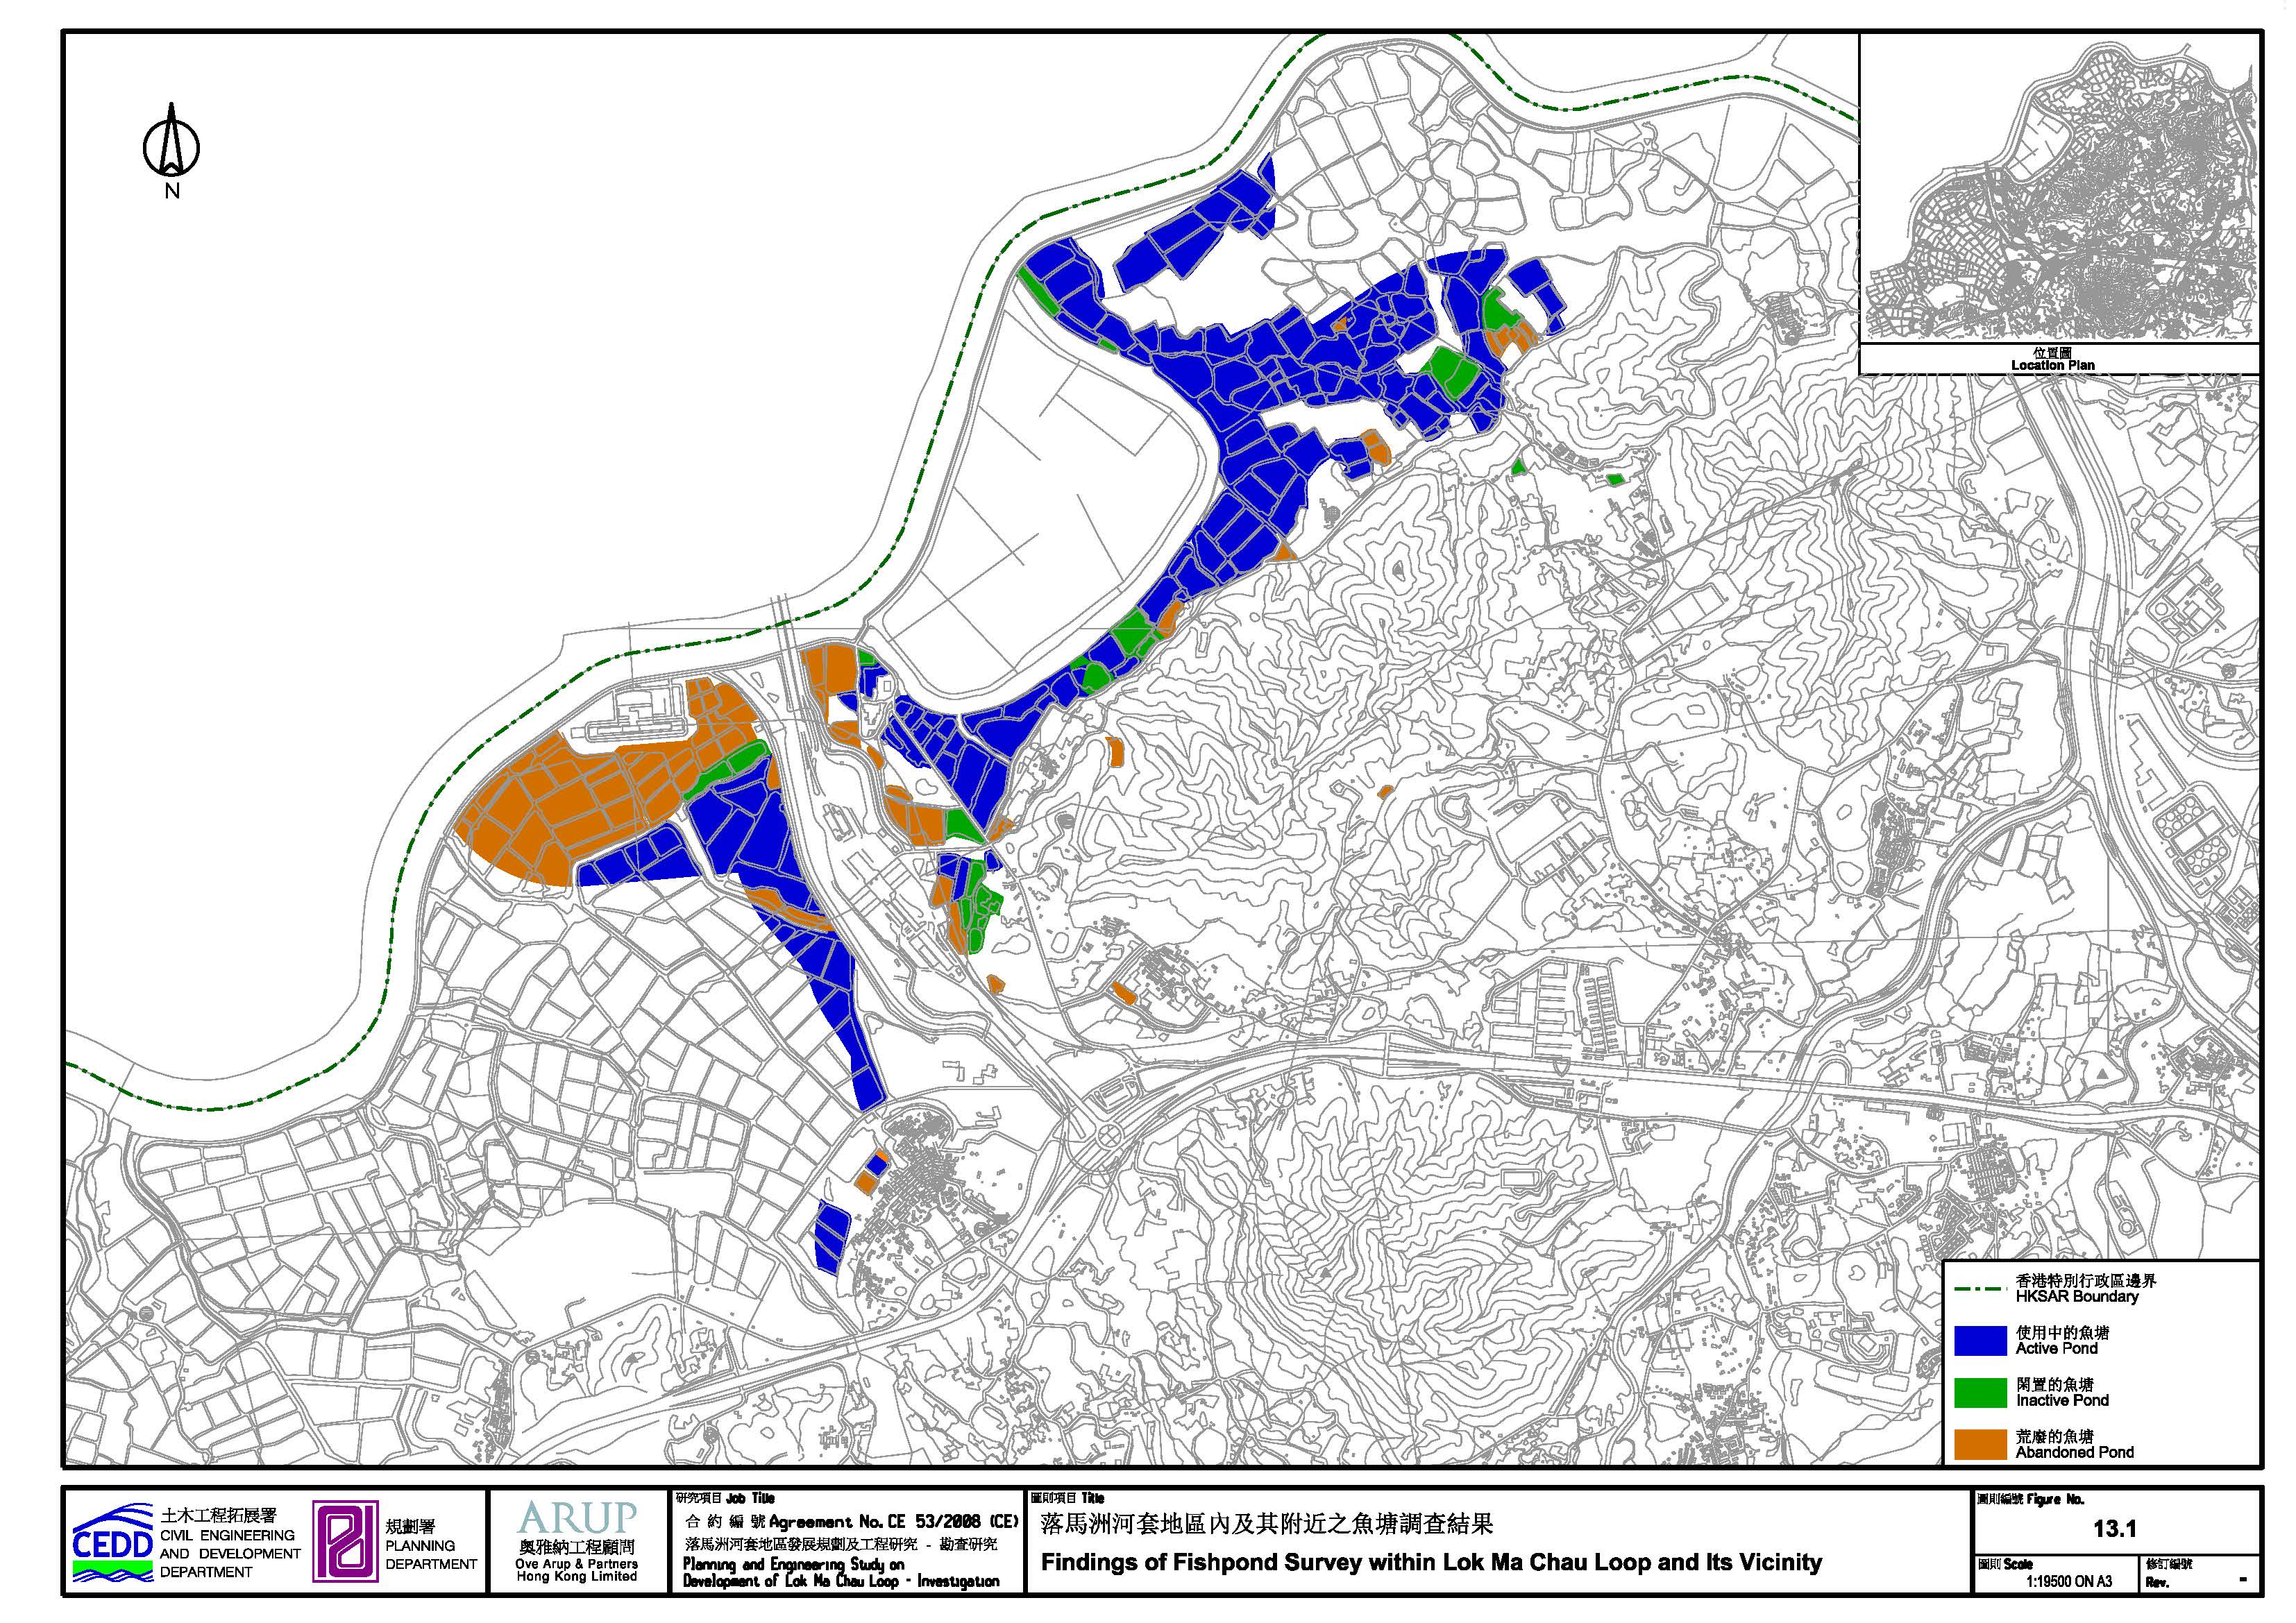
13 Fisheries Impact Assessment
13.2 Environmental Legislation, Standards and Guidelines
13.6 Identification and Evaluation of Fisheries Impacts
13.8 Residual Environmental Impacts and Monitoring and Audit
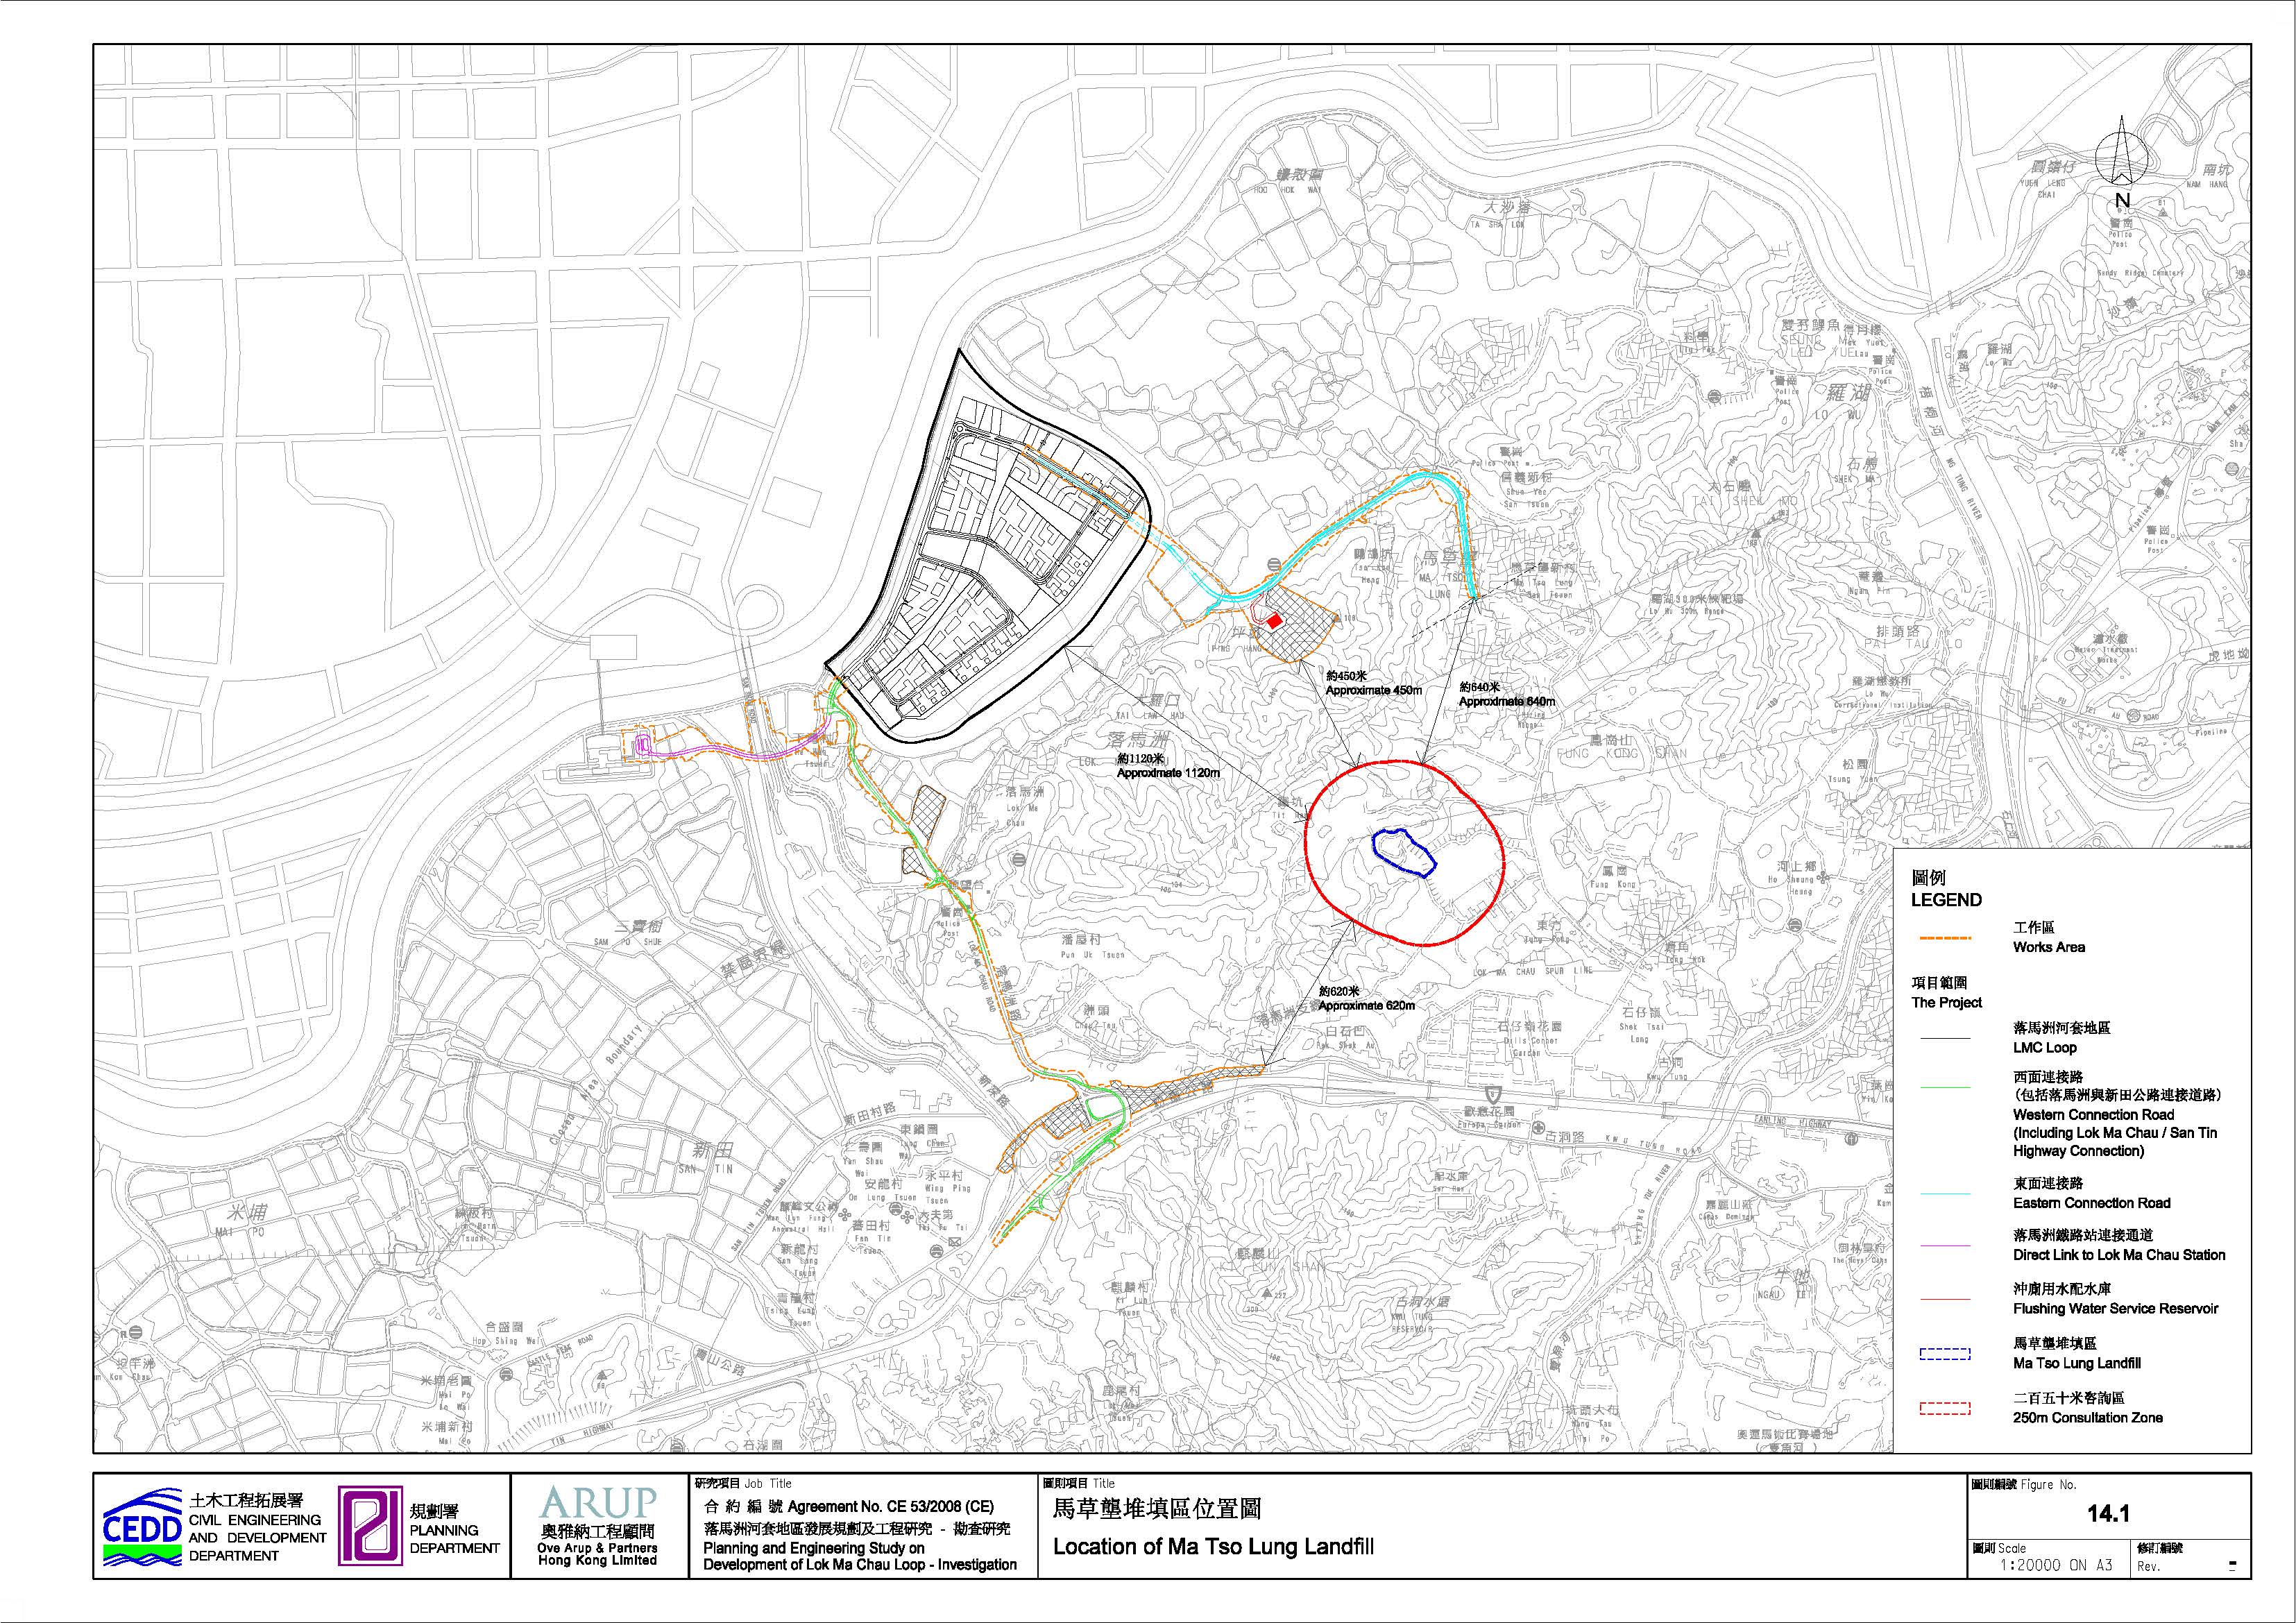
14.2 Environmental Legislation, Standards and Guidelines
14.3 The Need for LFG Hazard Assessment
14.4 Impact on the Restored Ma Tso Lung Landfill
15.2 Legislation, Standards and Guidelines
15.5 Identification and Evaluation of Food Safety Implications
15.7 Residual Environmental Impacts and Monitoring and Audit
16 Summary of Environmental Outcomes
16.2 Population and Environmental Sensitive Areas Protected
16.3 Key Assessment Assumptions and Limitation of Assessment Methodologies
16.5 Environmentally Friendly Design and Benefit
16.6 Summary of Measures Adopted to Avoid and Minimize Environmental Impacts
17 Environmental Monitoring & Audit
17.4 Project Implementation Schedule
18.6 Sewerage and Sewage Treatment Implications
18.7 Waste Management Implications
18.8 Land Contamination Impact
18.10 Impacts on Sites of Cultural Heritage
18.11 Landscape and Visual Impacts
18.16 Environmental Monitoring and Audit
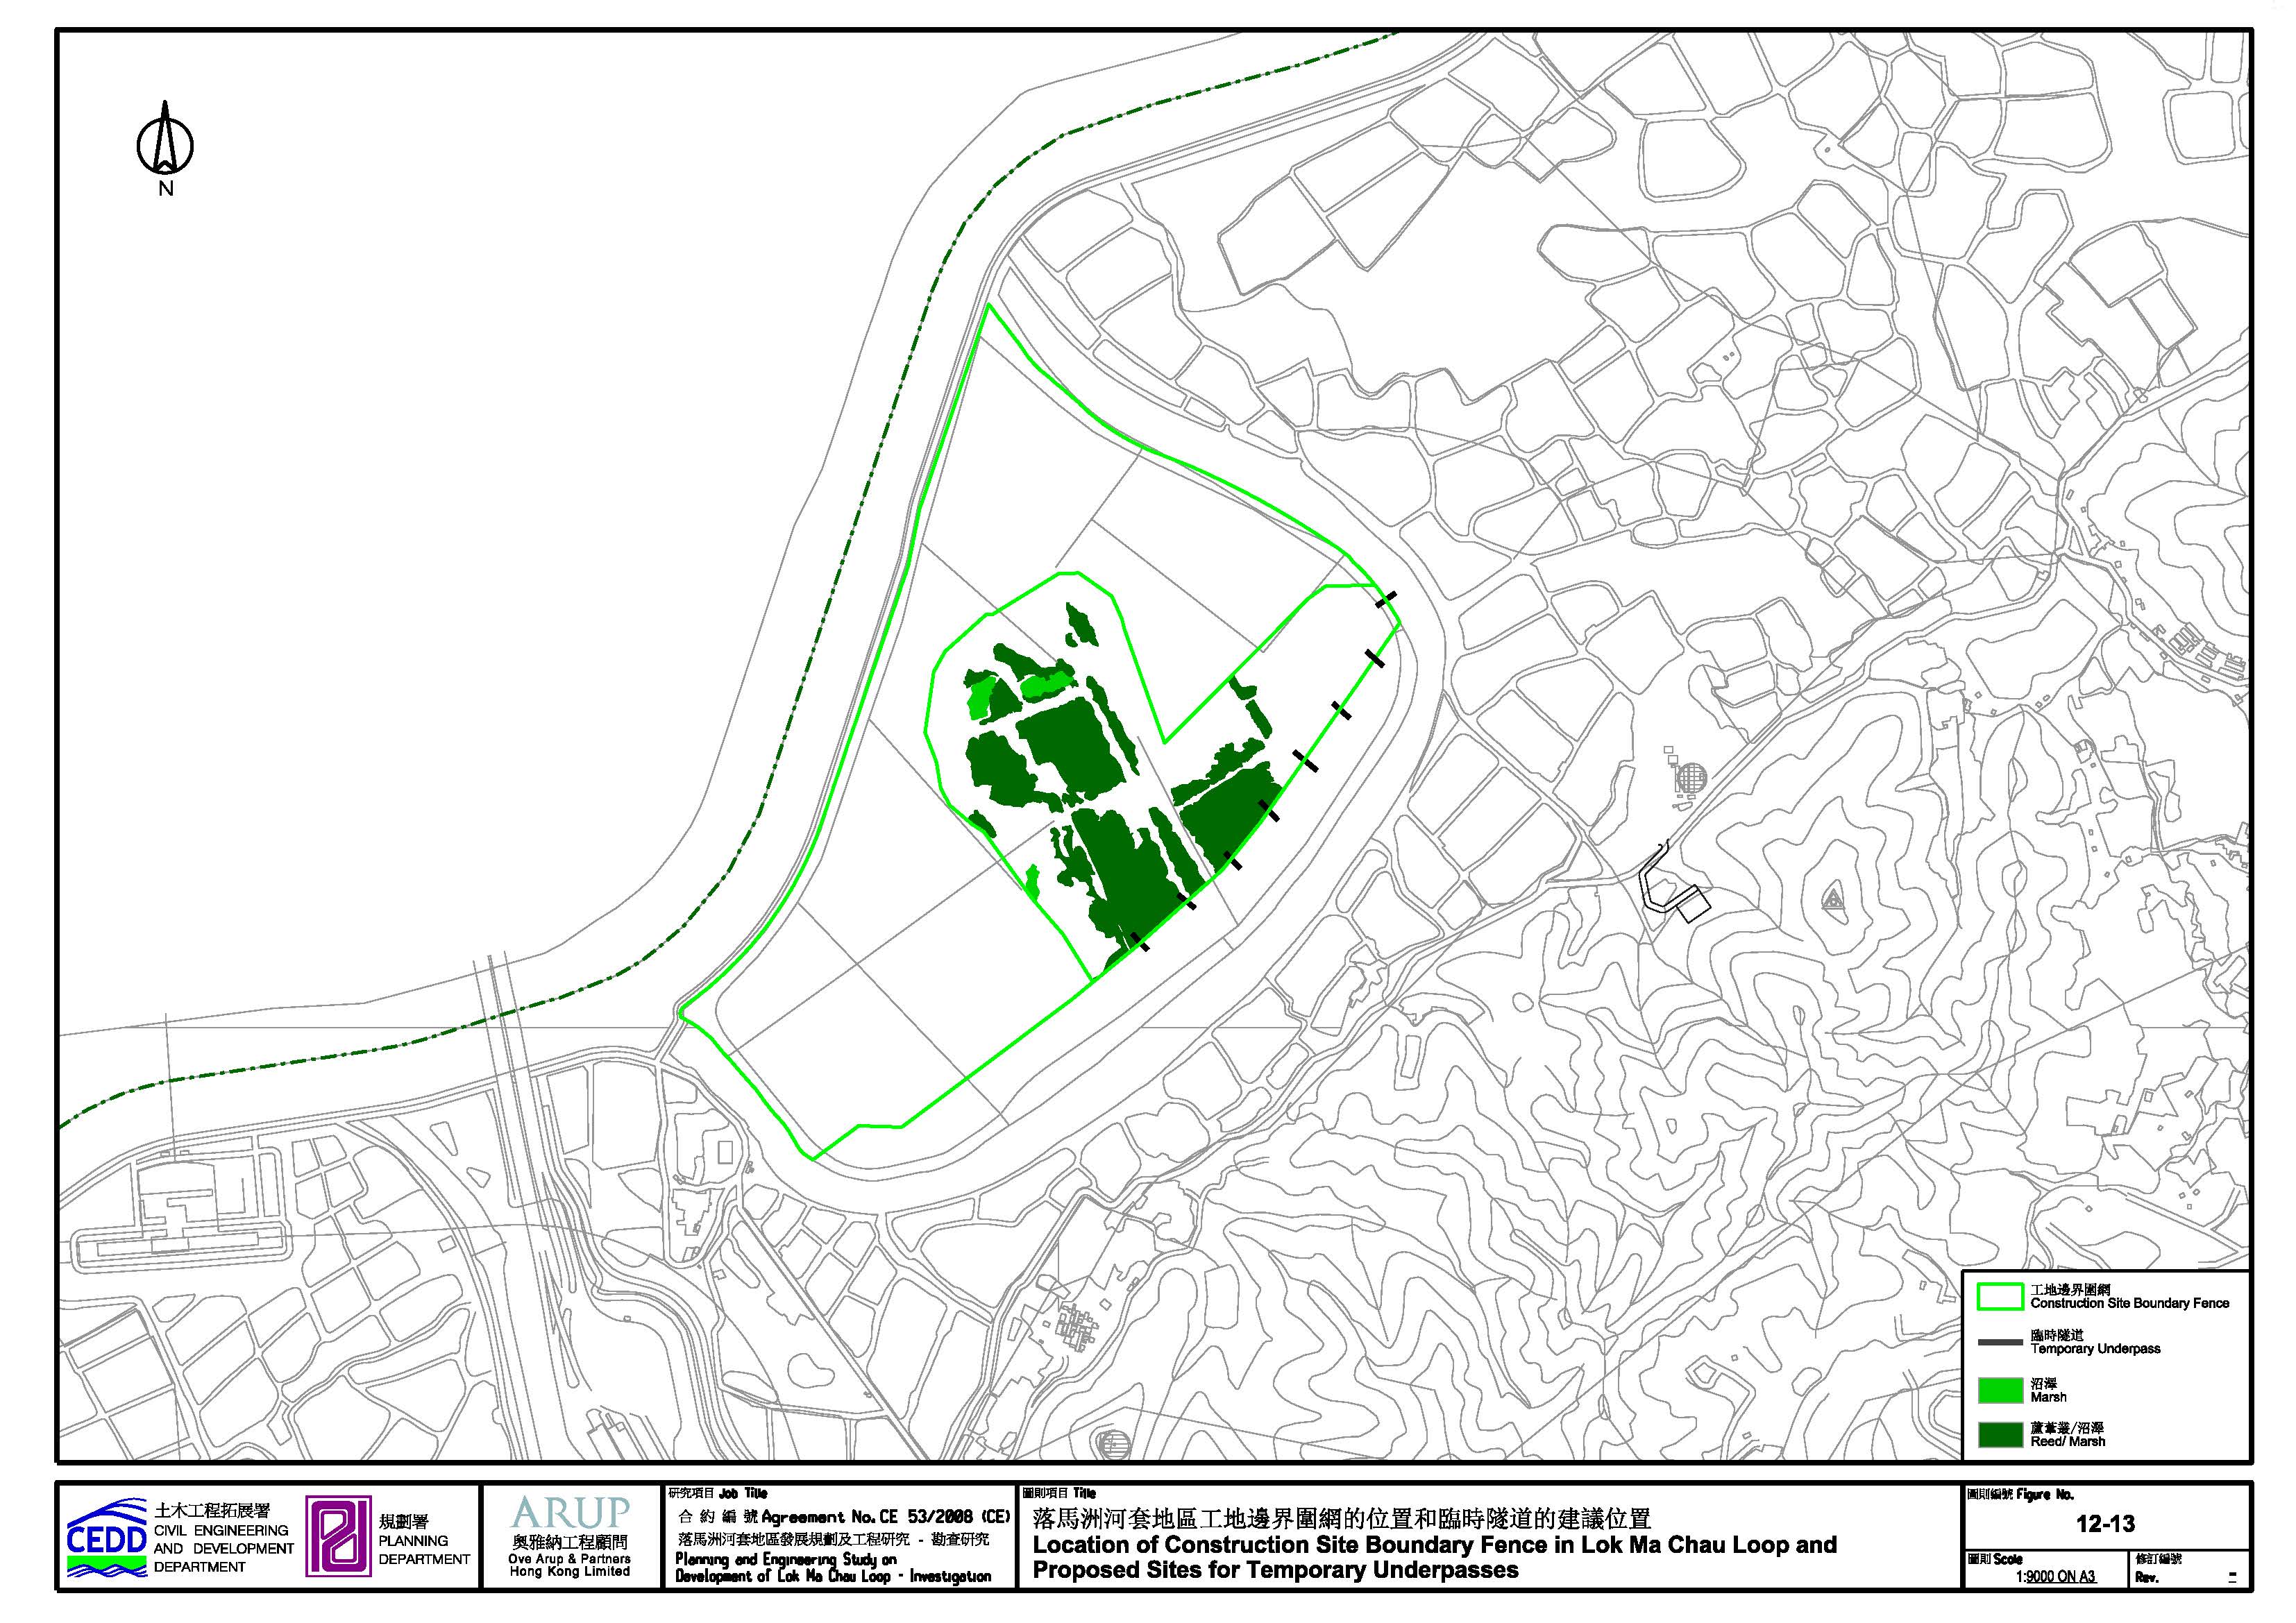
Figures
Figure 2.1a Layout Plan (Overall) and Designated Projects
_Page_01.jpg)
Figure 2.1b Revised Preliminary Layout Plan
_Page_02.jpg)
Figure 2.1c Off-site Works Area – Wetland
Compensation(Fishpond/Reedbed)
_Page_03.jpg)
Figure 2.1d The Project and Temporary Works
Area
_Page_04.jpg)
_Page_05.jpg)
Figure 2.3 Ecological Area (with associated drainage network)
_Page_06.jpg)
Figure 2.4a Western Connection Road – Slip Road
to San Tin Interchange
_Page_07.jpg)
Figure 2.4b Western Connection Road – Slip Road
to San Tin Interchange
_Page_08.jpg)
(Schematic
longitudinal section)(1/2)
Figure 2.4c Western Connection Road – Slip Road
to San Tin Interchange
_Page_09.jpg)
(Schematic
longitudinal section)(2/2)
Figure 2.5 Western Connection Road
_Page_10.jpg)
Figure 2.6 Western Connection Road (1/5)
_Page_11.jpg)
Figure 2.7 Western Connection Road (2/5)
_Page_12.jpg)
Figure 2.8 Western Connection Road (3/5)
_Page_13.jpg)
Figure 2.9 Western Connection Road (4/5)
_Page_14.jpg)
Figure 2.10 Western Connection Road (5/5)
_Page_15.jpg)
Figure 2.11a Direct Link to Lok Ma Chau Station – General
Layout – Key Plan
_Page_16.jpg)
Figure 2.11b Direct Link to Lok Ma Chau Station(Schematic
longitudinal section)(1/3)
_Page_17.jpg)
Figure 2.11c Direct Link to Lok Ma Chau Station(Schematic
longitudinal section)(2/3)
_Page_18.jpg)
Figure 2.11d Direct Link to Lok Ma Chau Station(Schematic
longitudinal section)(3/3)
_Page_19.jpg)
Figure 2.11e Horizontal and Vertical Alignments of
Direct Link to Lok Ma Chau Station
_Page_20.jpg)
Figure 2.12 Eastern Connection Road
_Page_21.jpg)
Figure 2.13 Eastern Connection Road (1/7)
_Page_22.jpg)
Figure 2.14 Eastern Connection Road (2/7)
_Page_23.jpg)
Figure 2.15 Eastern Connection Road (3/7)
_Page_24.jpg)
Figure 2.16 Eastern Connection Road (4/7)
_Page_25.jpg)
Figure 2.17 Eastern Connection Road (5/7)
_Page_26.jpg)
Figure 2.18 Eastern Connection Road (6/7)
_Page_27.jpg)
Figure 2.19 Eastern Connection Road (7/7)
_Page_28.jpg)
Figure 2.20 Eastern Connection Road (Schematic longitudinal section) (1/2)
_Page_29.jpg)
Figure 2.21 Eastern Connection Road (Schematic longitudinal section) (2/2)
_Page_30.jpg)
Figure 2.22 Eastern Connection Road (Schematic Cross Section) (1/7)
_Page_31.jpg)
Figure 2.23 Eastern Connection Road (Schematic Cross Section) (2/7)
_Page_32.jpg)
Figure 2.23a Eastern Connection Road (Schematic Cross Section) (3/7)
_Page_33.jpg)
Figure 2.23b Eastern Connection Road (Schematic Cross Section) (4/7)
_Page_34.jpg)
Figure 2.23c Eastern Connection Road (Schematic Cross Section) (5/7)
_Page_35.jpg)
Figure 2.23d Eastern Connection Road (Schematic Cross Section) (6/7)
_Page_36.jpg)
Figure 2.23e Eastern Connection Road (Schematic Cross Section) (7/7)
_Page_37.jpg)
Figure 2.23f Flushing Water Service Reservoir
_Page_38.jpg)
Figure 2.24 Haul Road for Phase 1 Infrastructure
_Page_39.jpg)
Figure 2.25a Sequence of Site Formation(1/4)
_Page_40.jpg)
Figure 2.25b Sequence of Site Formation(2/4)
_Page_41.jpg)
Figure 2.25c Sequence of Site Formation(3/4)
_Page_42.jpg)
Figure 2.25d Sequence of Site Formation(4/4)
_Page_43.jpg)
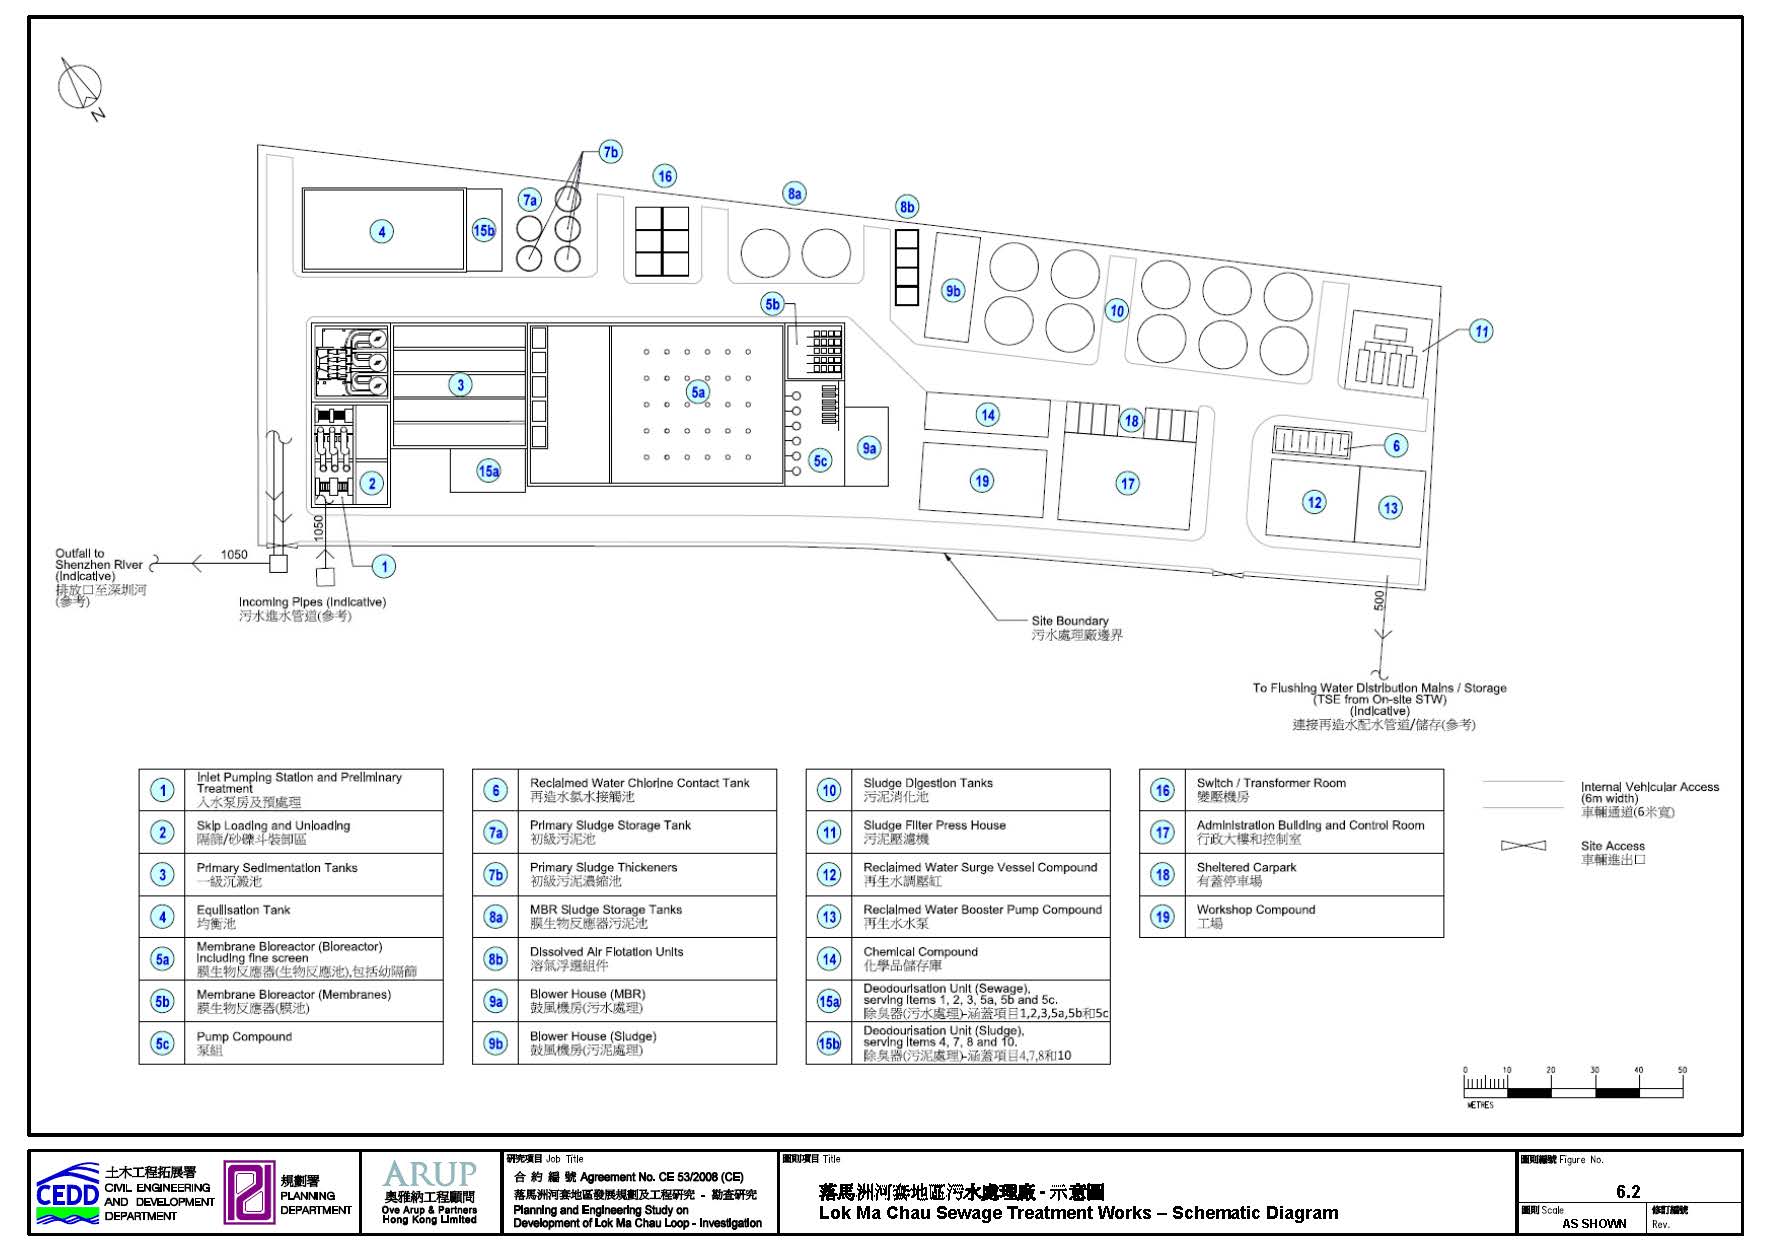
Figure 2.26a Lok Ma Chau Sewage Treatment Works –
Schematic Diagram
_Page_44.jpg)
Figure 2.26b Sewerage Collection Networks/Disposal
Pipes
_Page_45.jpg)
Figure 2.26c TSE Reuse Supply Network (Flushing
Water Network)
_Page_46.jpg)
Figure
3.1 Proposed Landuse, Associated Works, and
the 500m Assessment Boundary
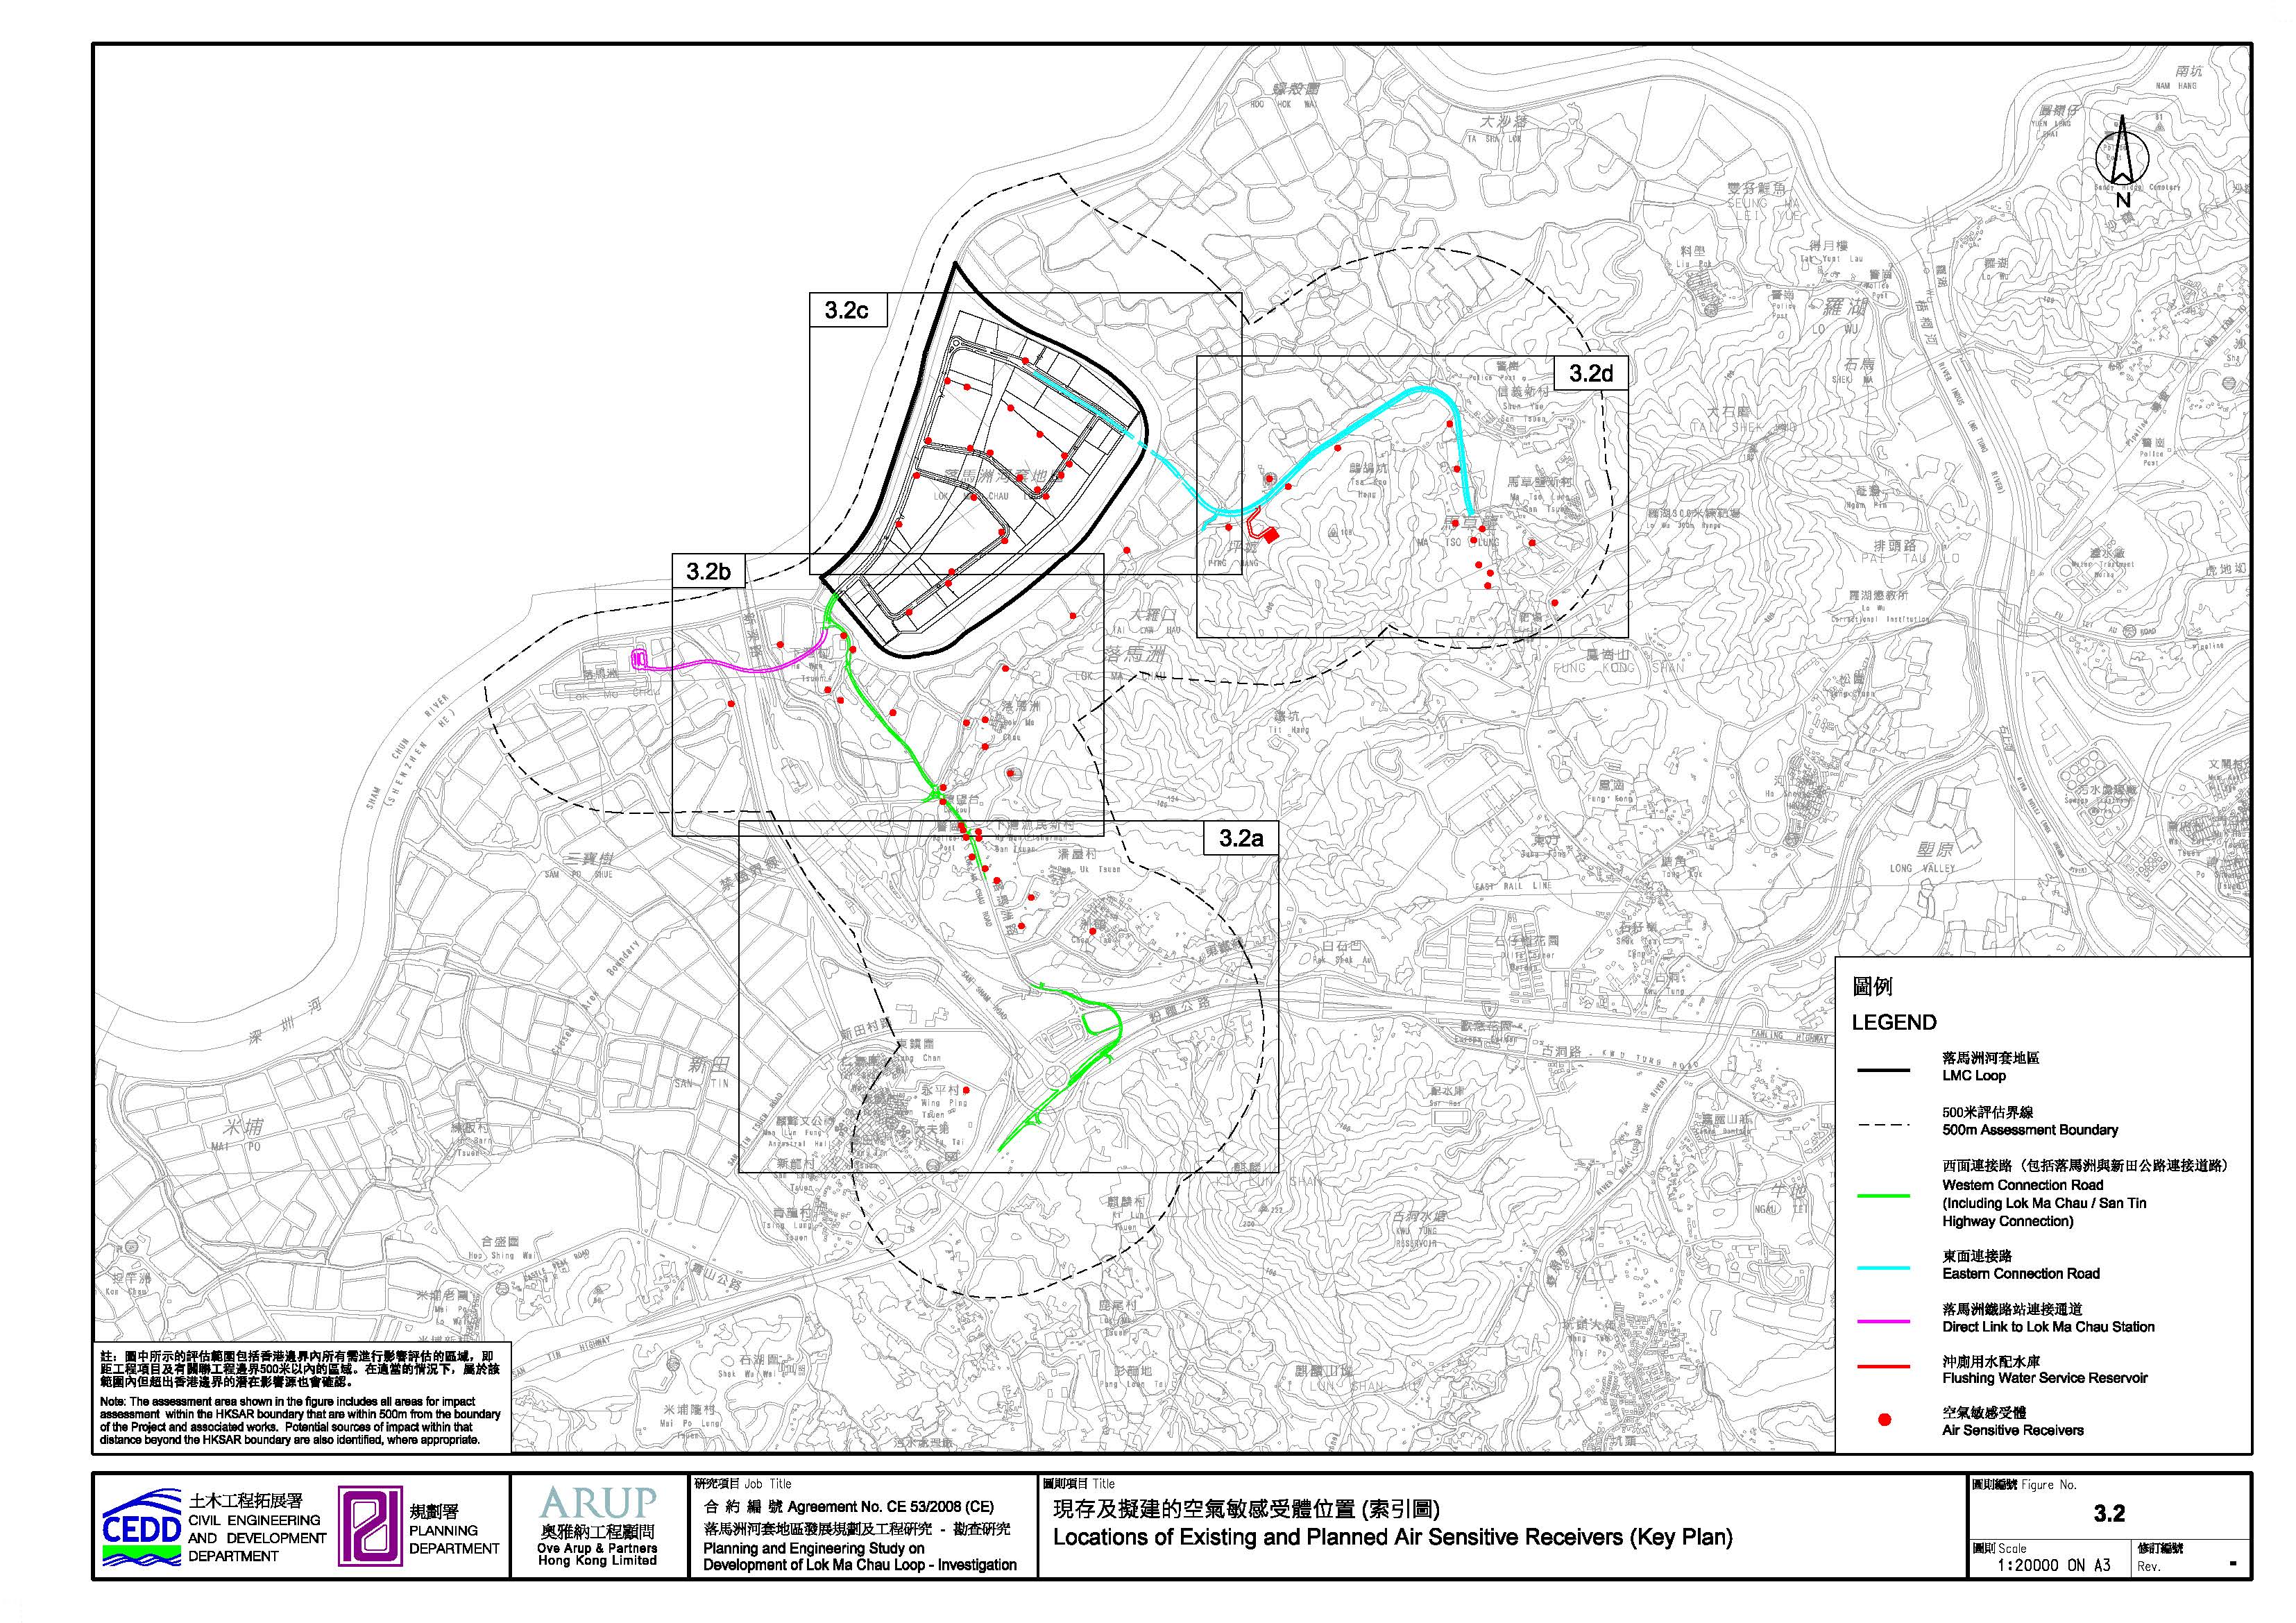
Figure 3.2 Locations
of Existing and Planned Air Sensitive Receivers (Key Plan)
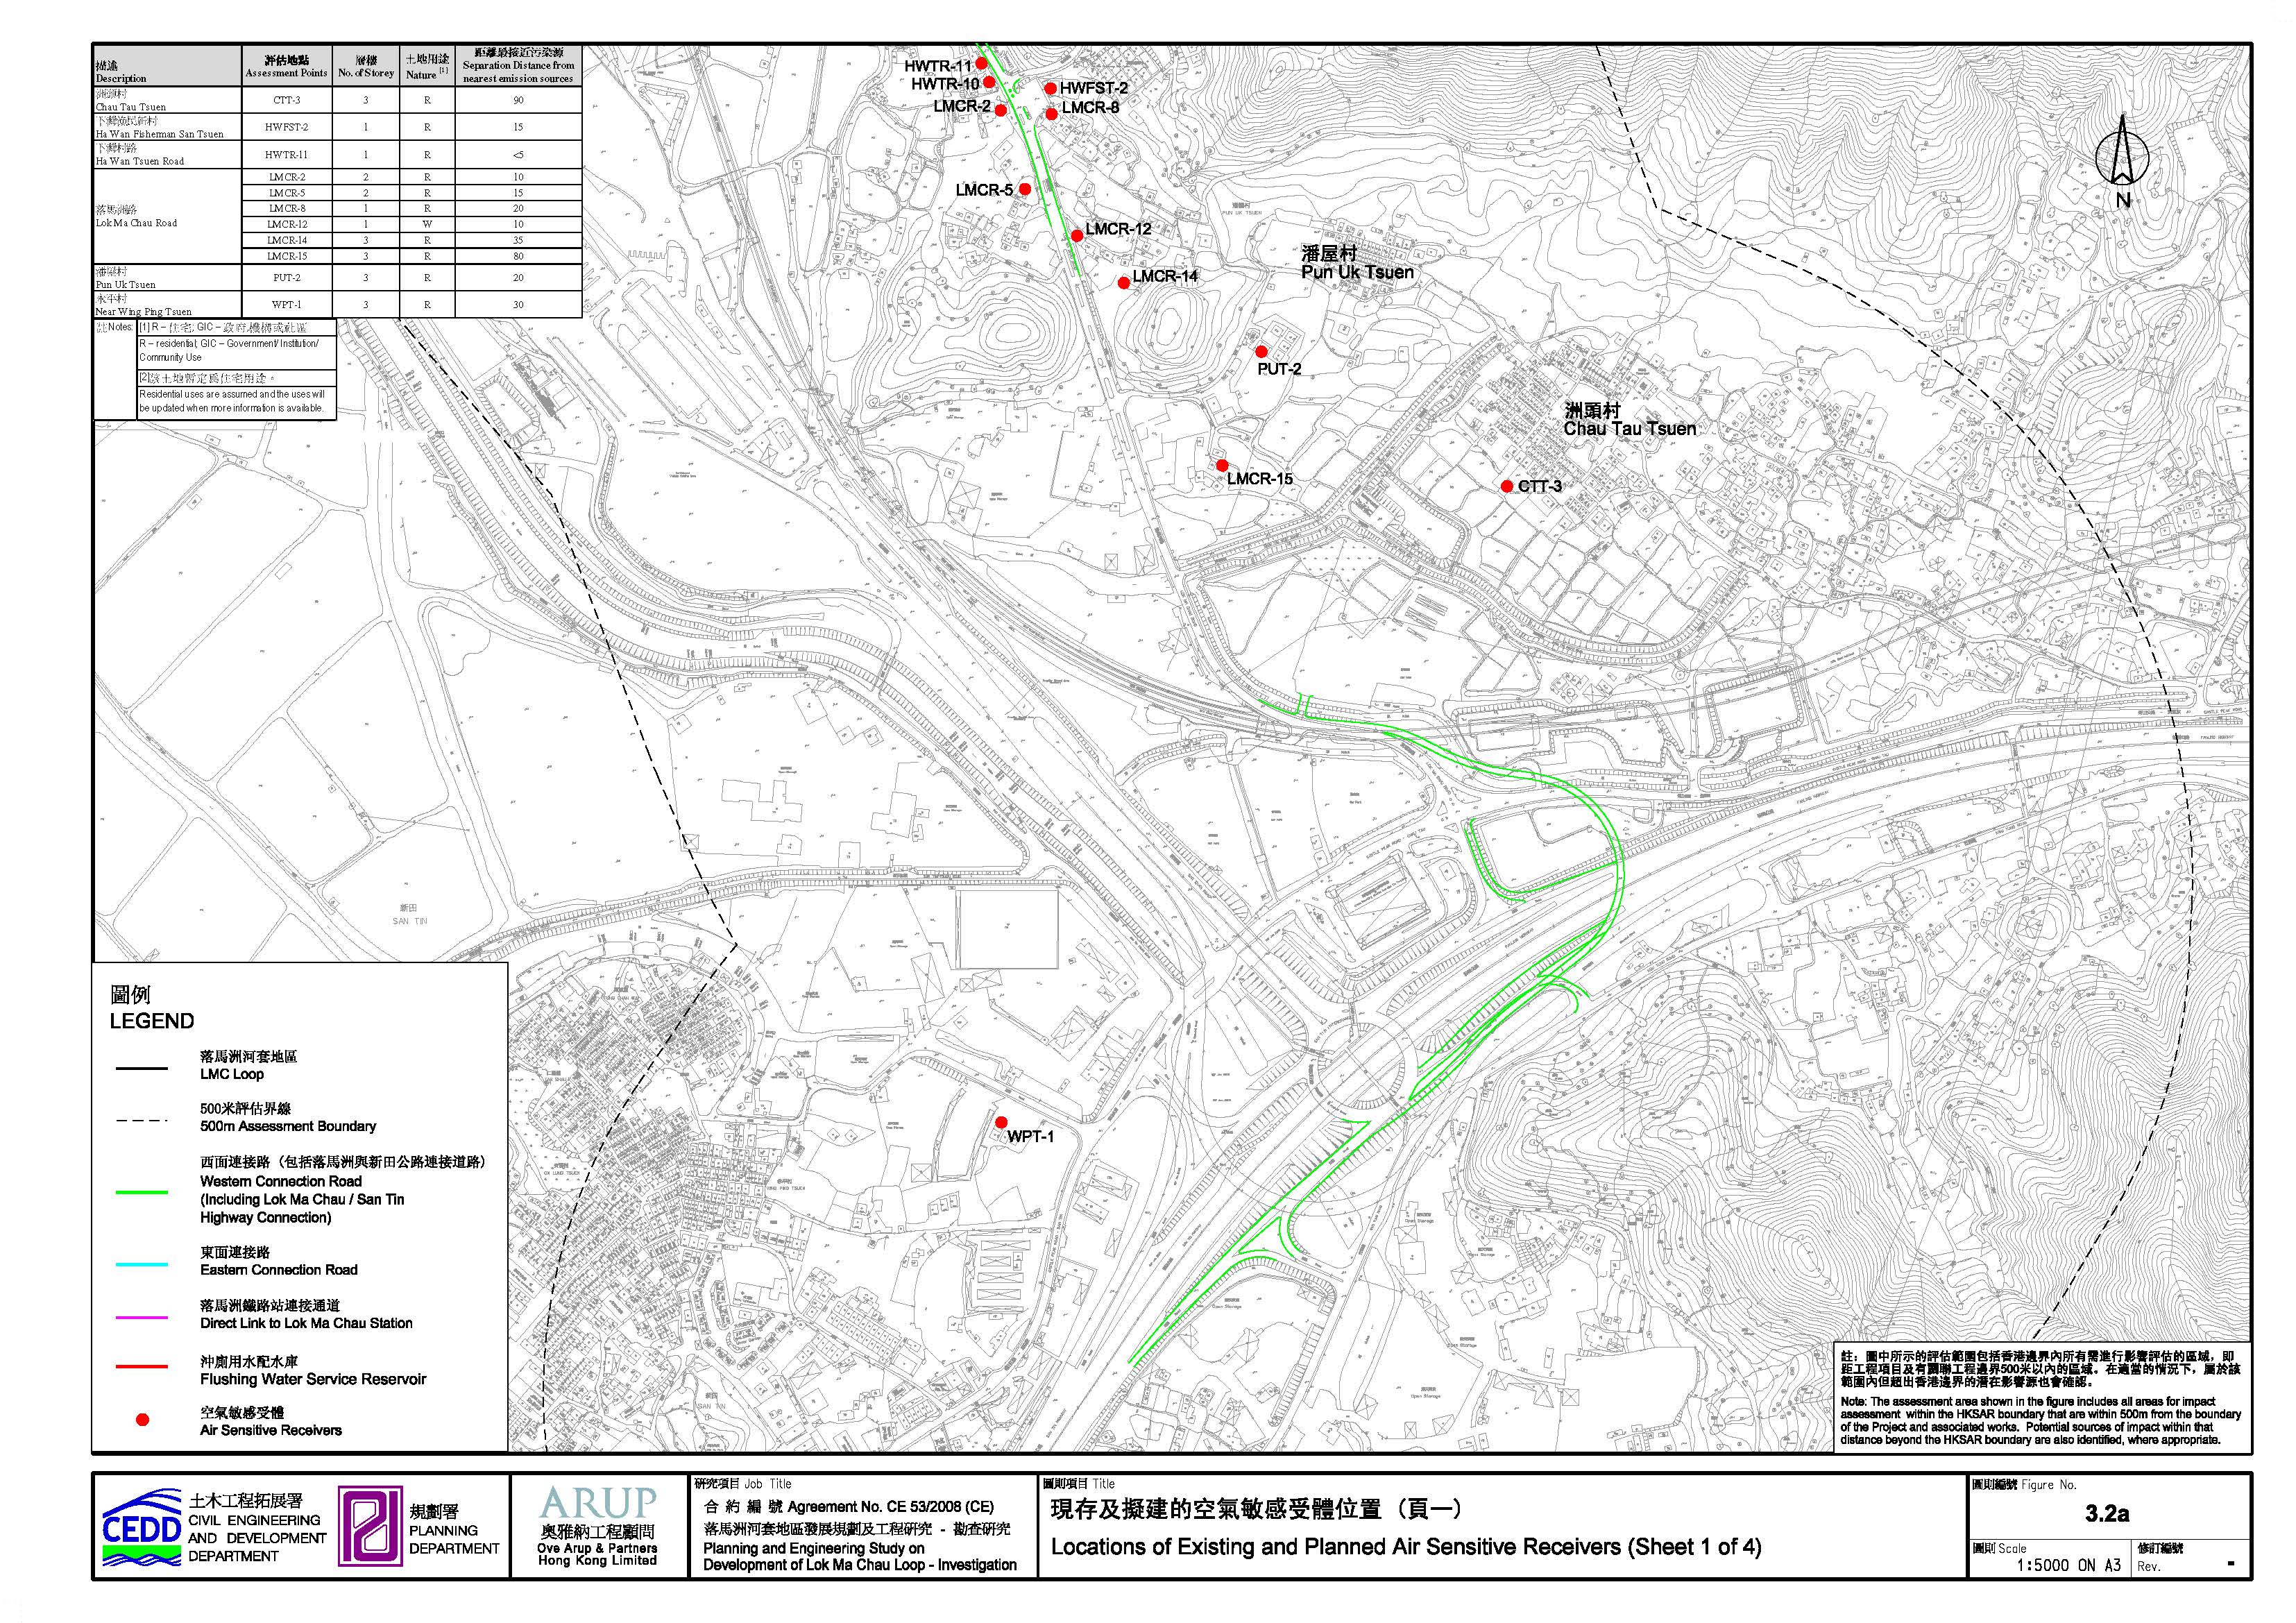
Figure 3.2a Locations of Existing and Planned Air Sensitive Receivers (Sheet 1 of 4)
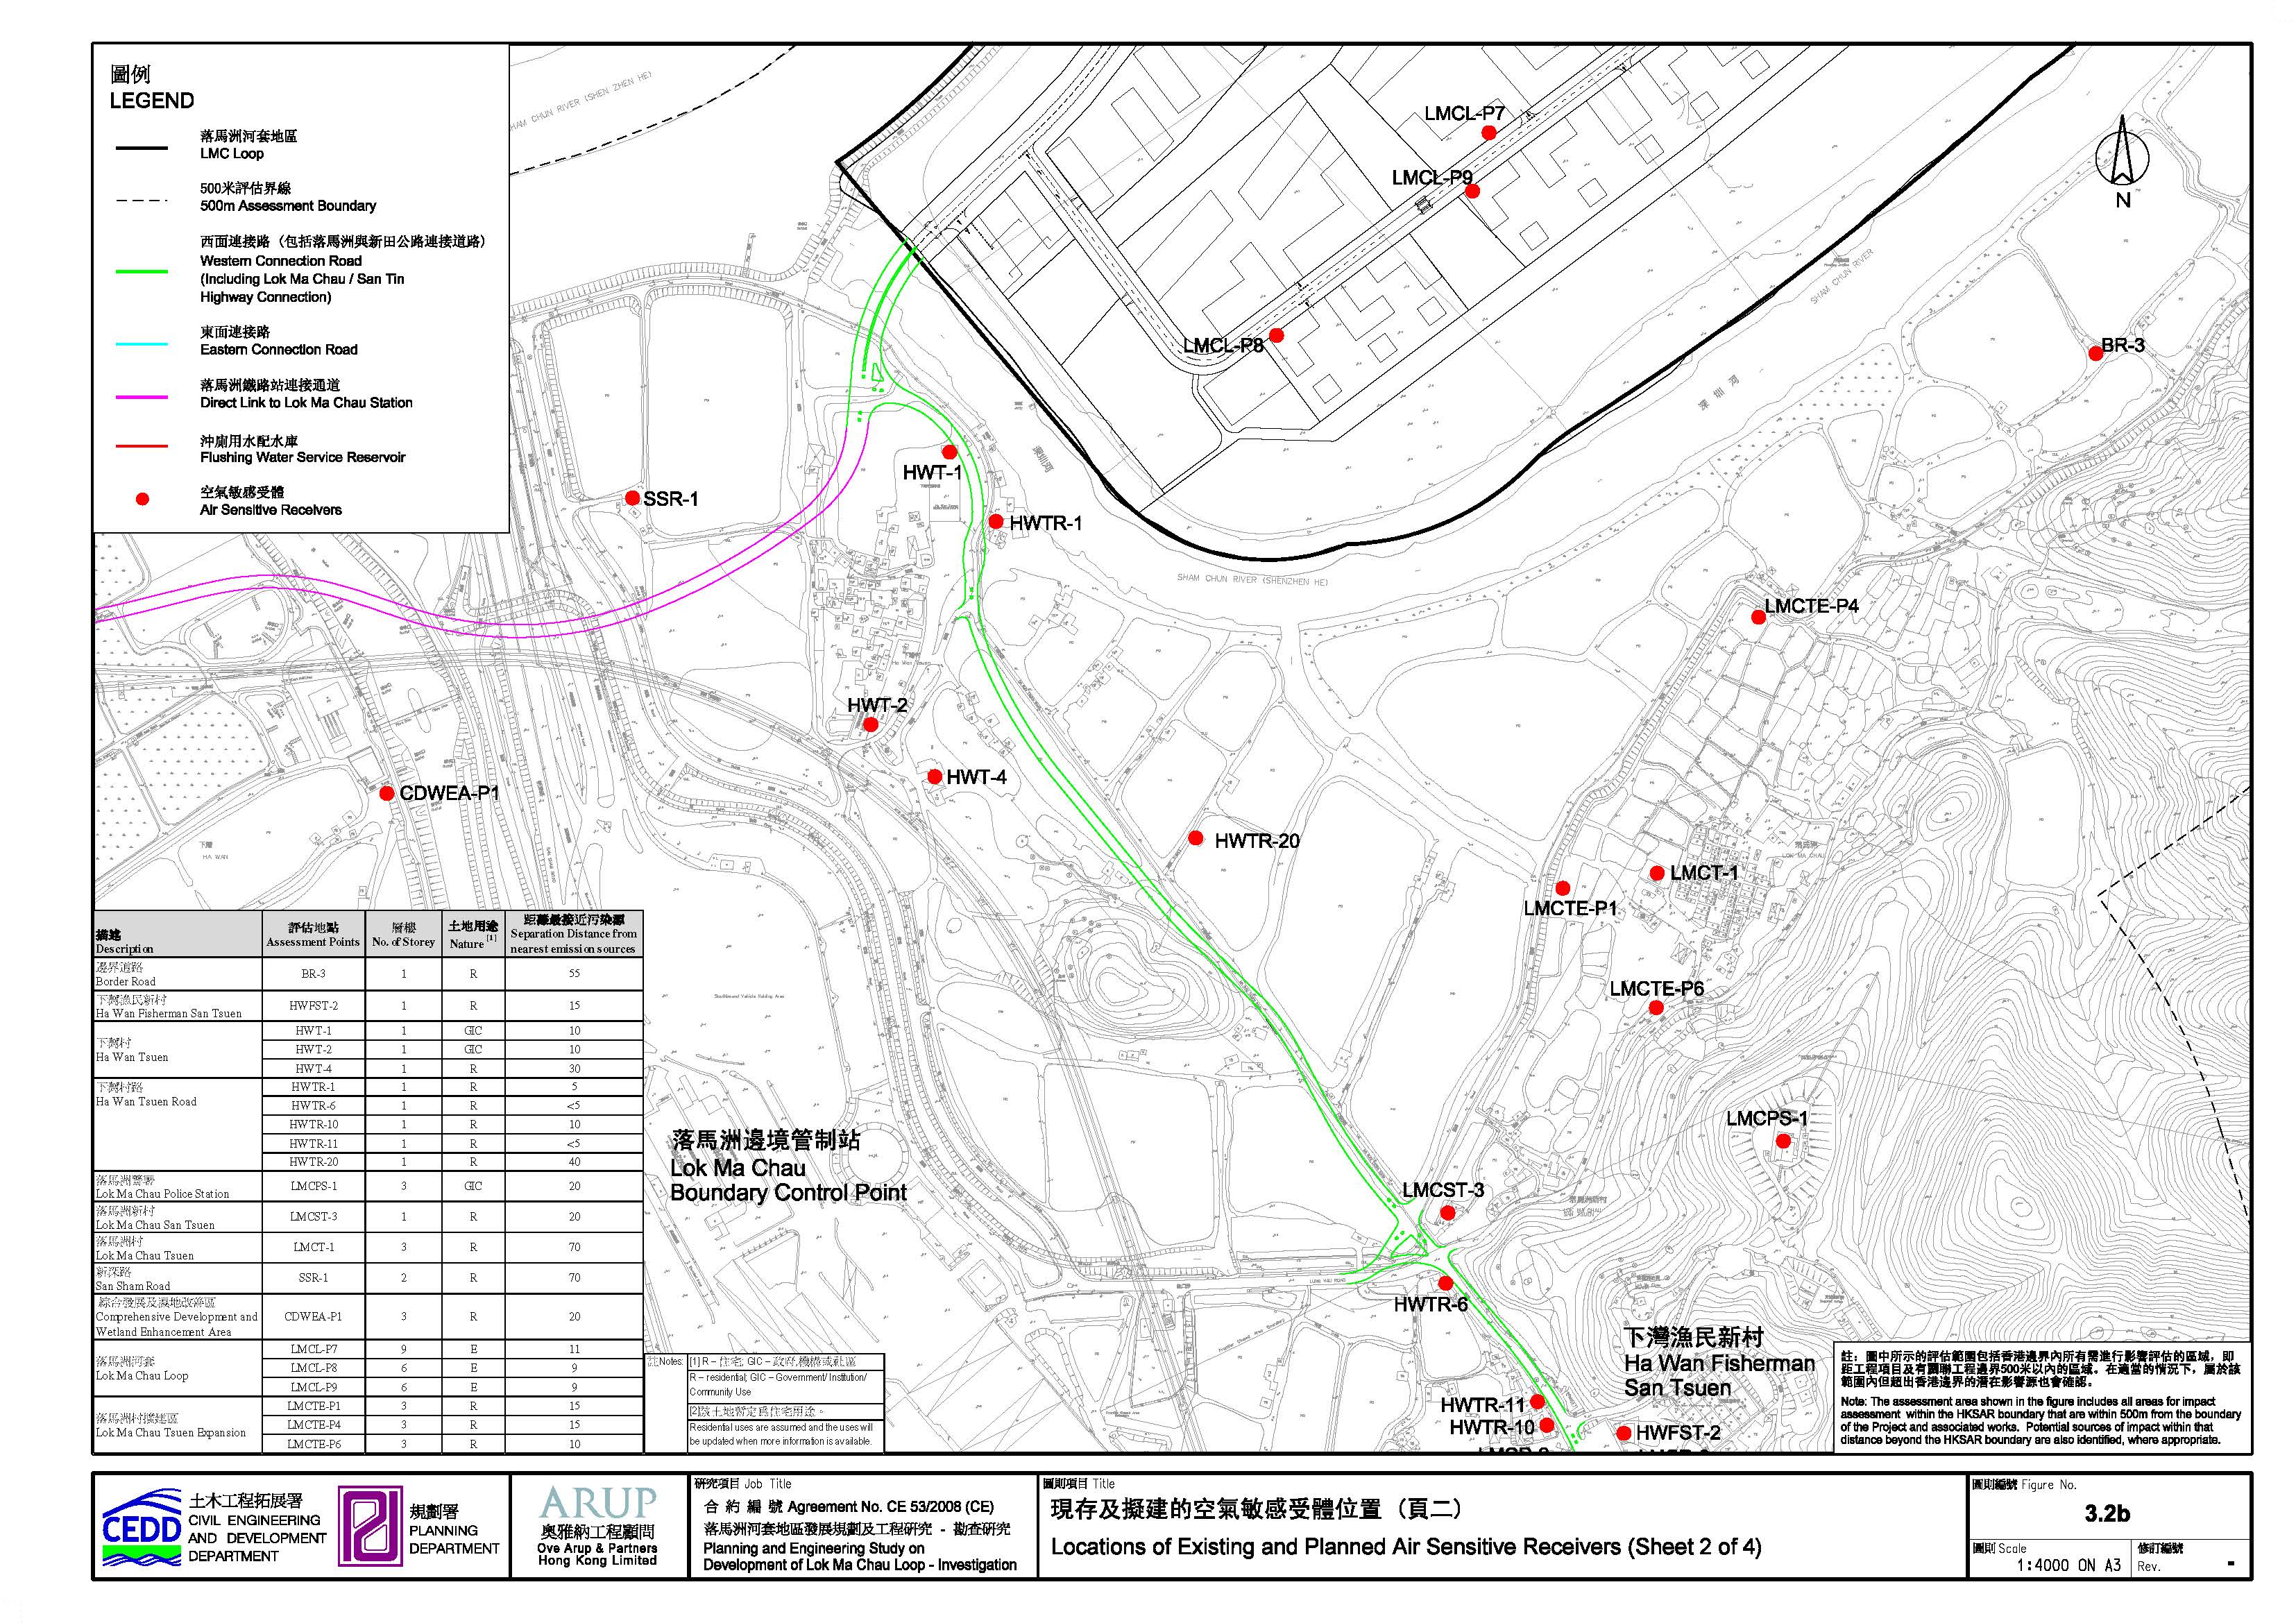
Figure 3.2b Locations of Existing and Planned Air Sensitive Receivers (Sheet 2 of 4)
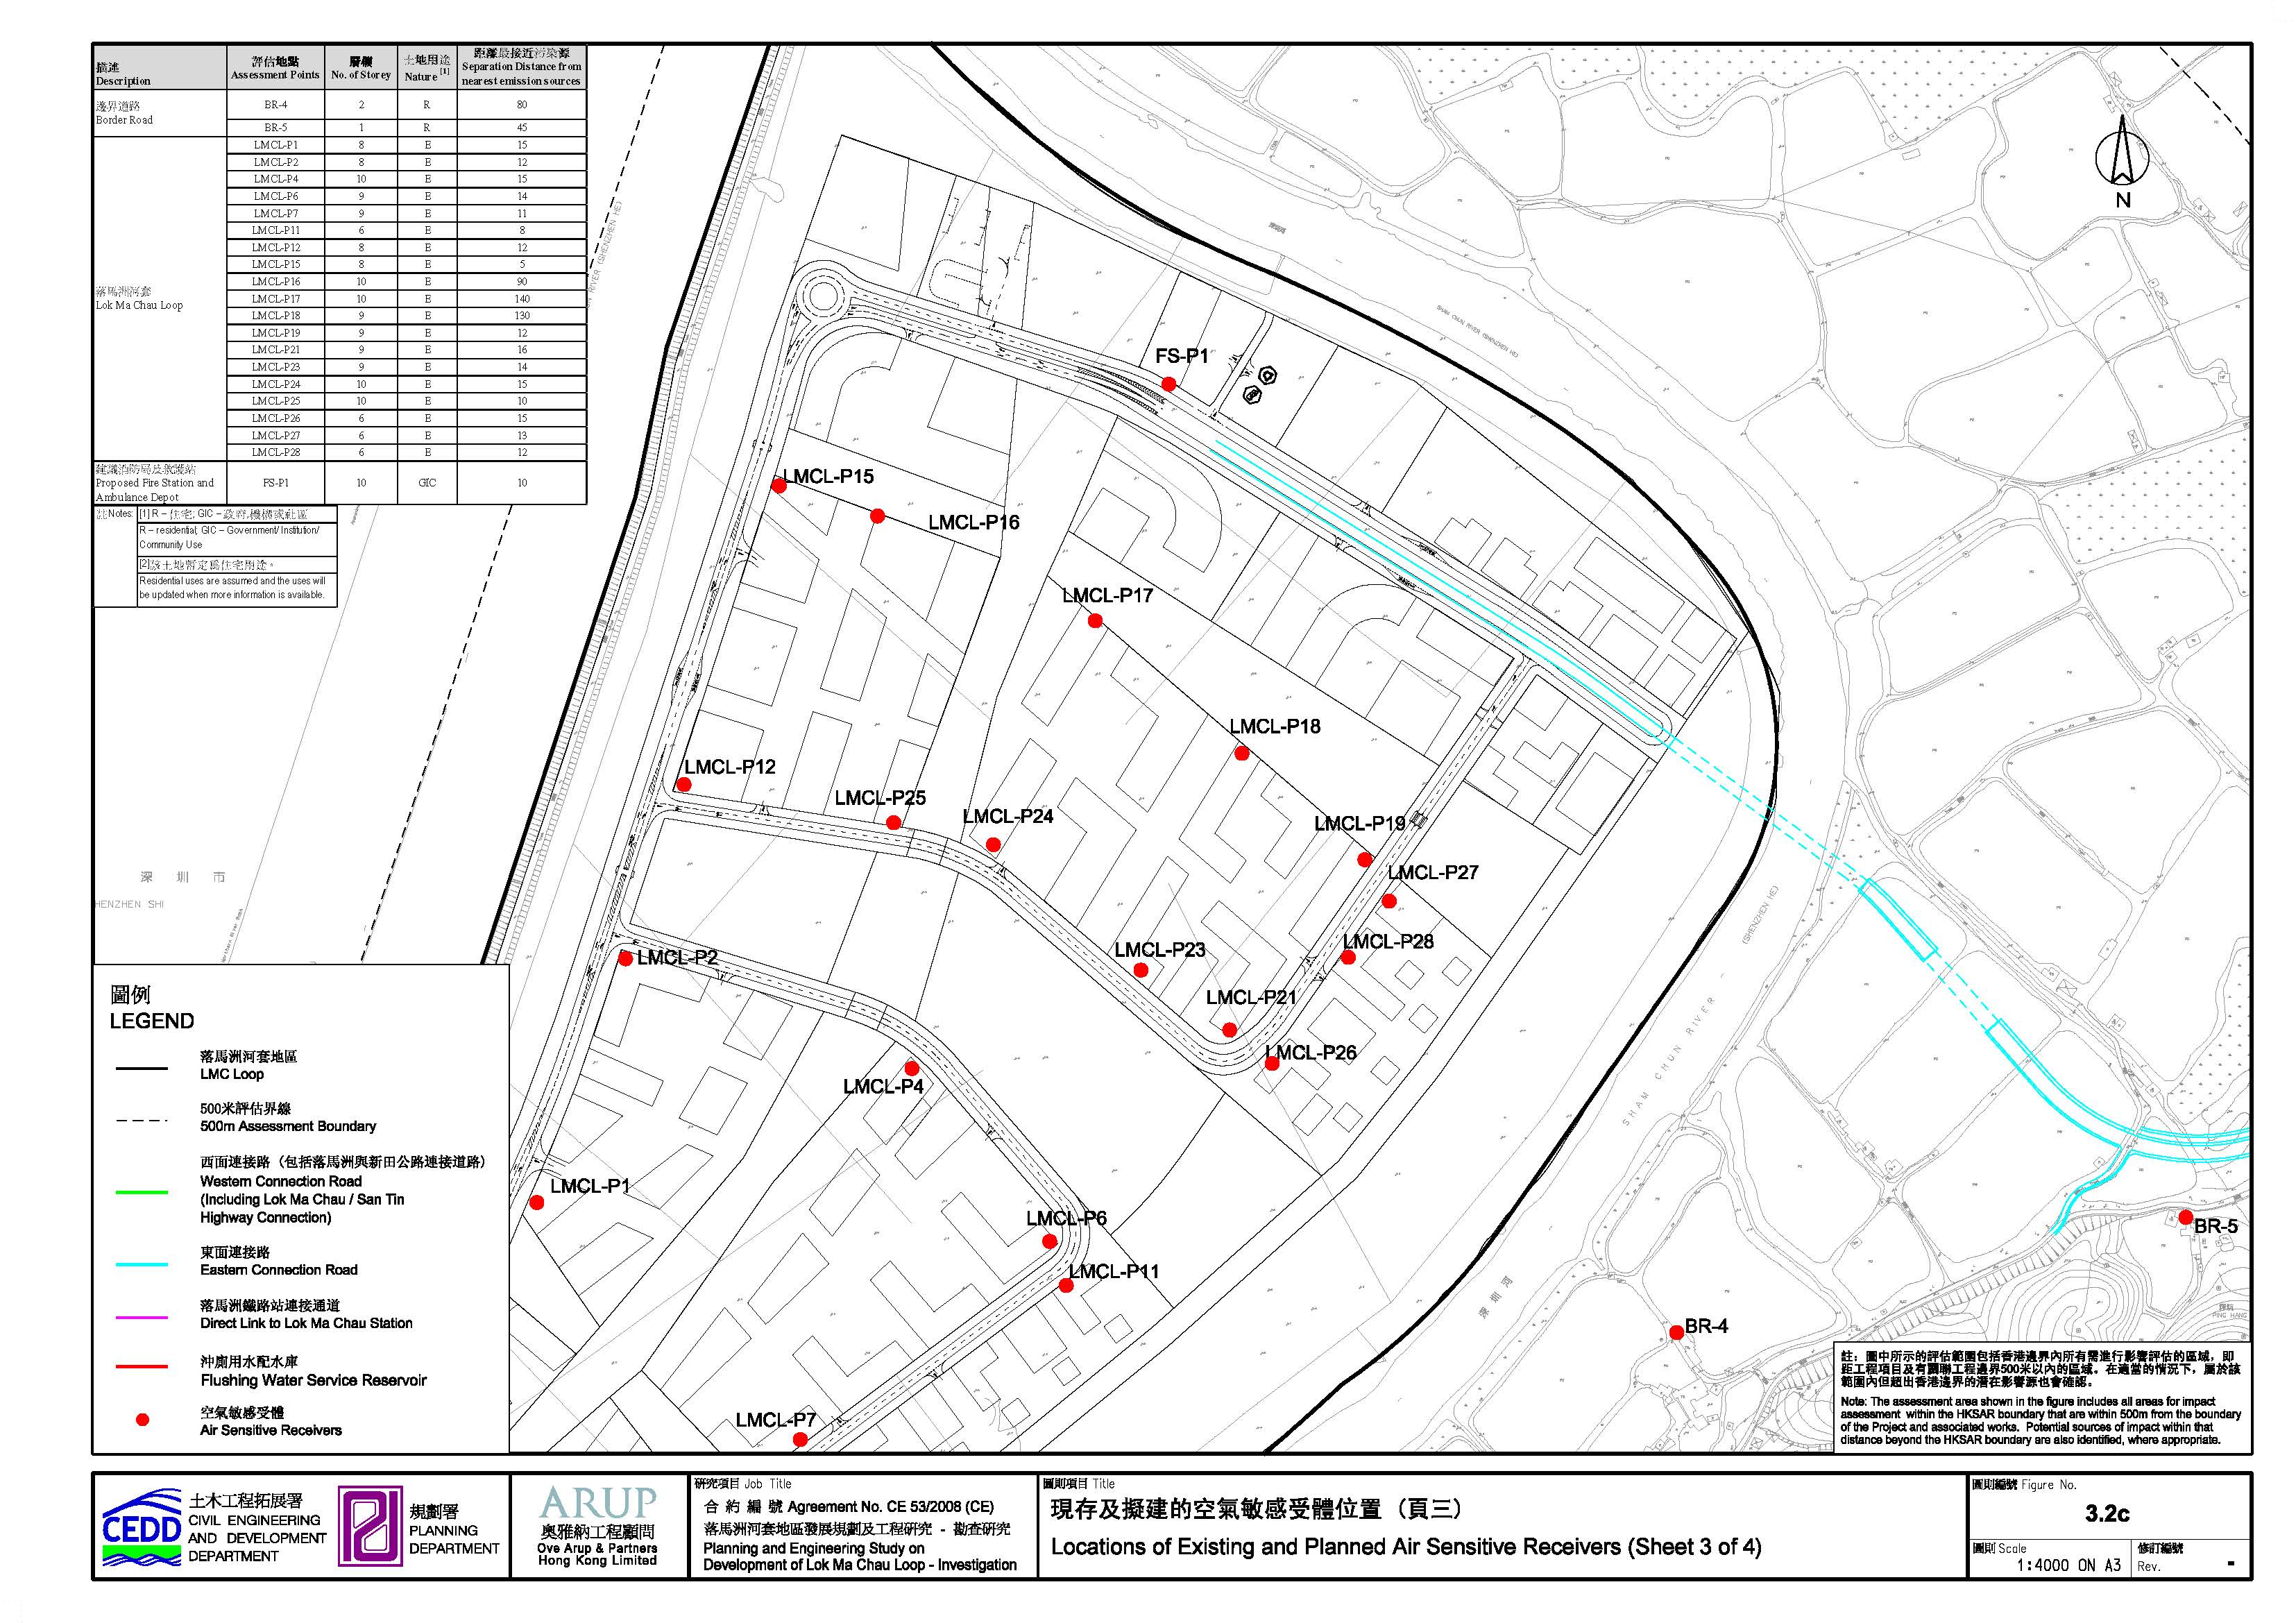
Figure 3.2c Locations of Existing and Planned Air Sensitive Receivers (Sheet 3 of 4)
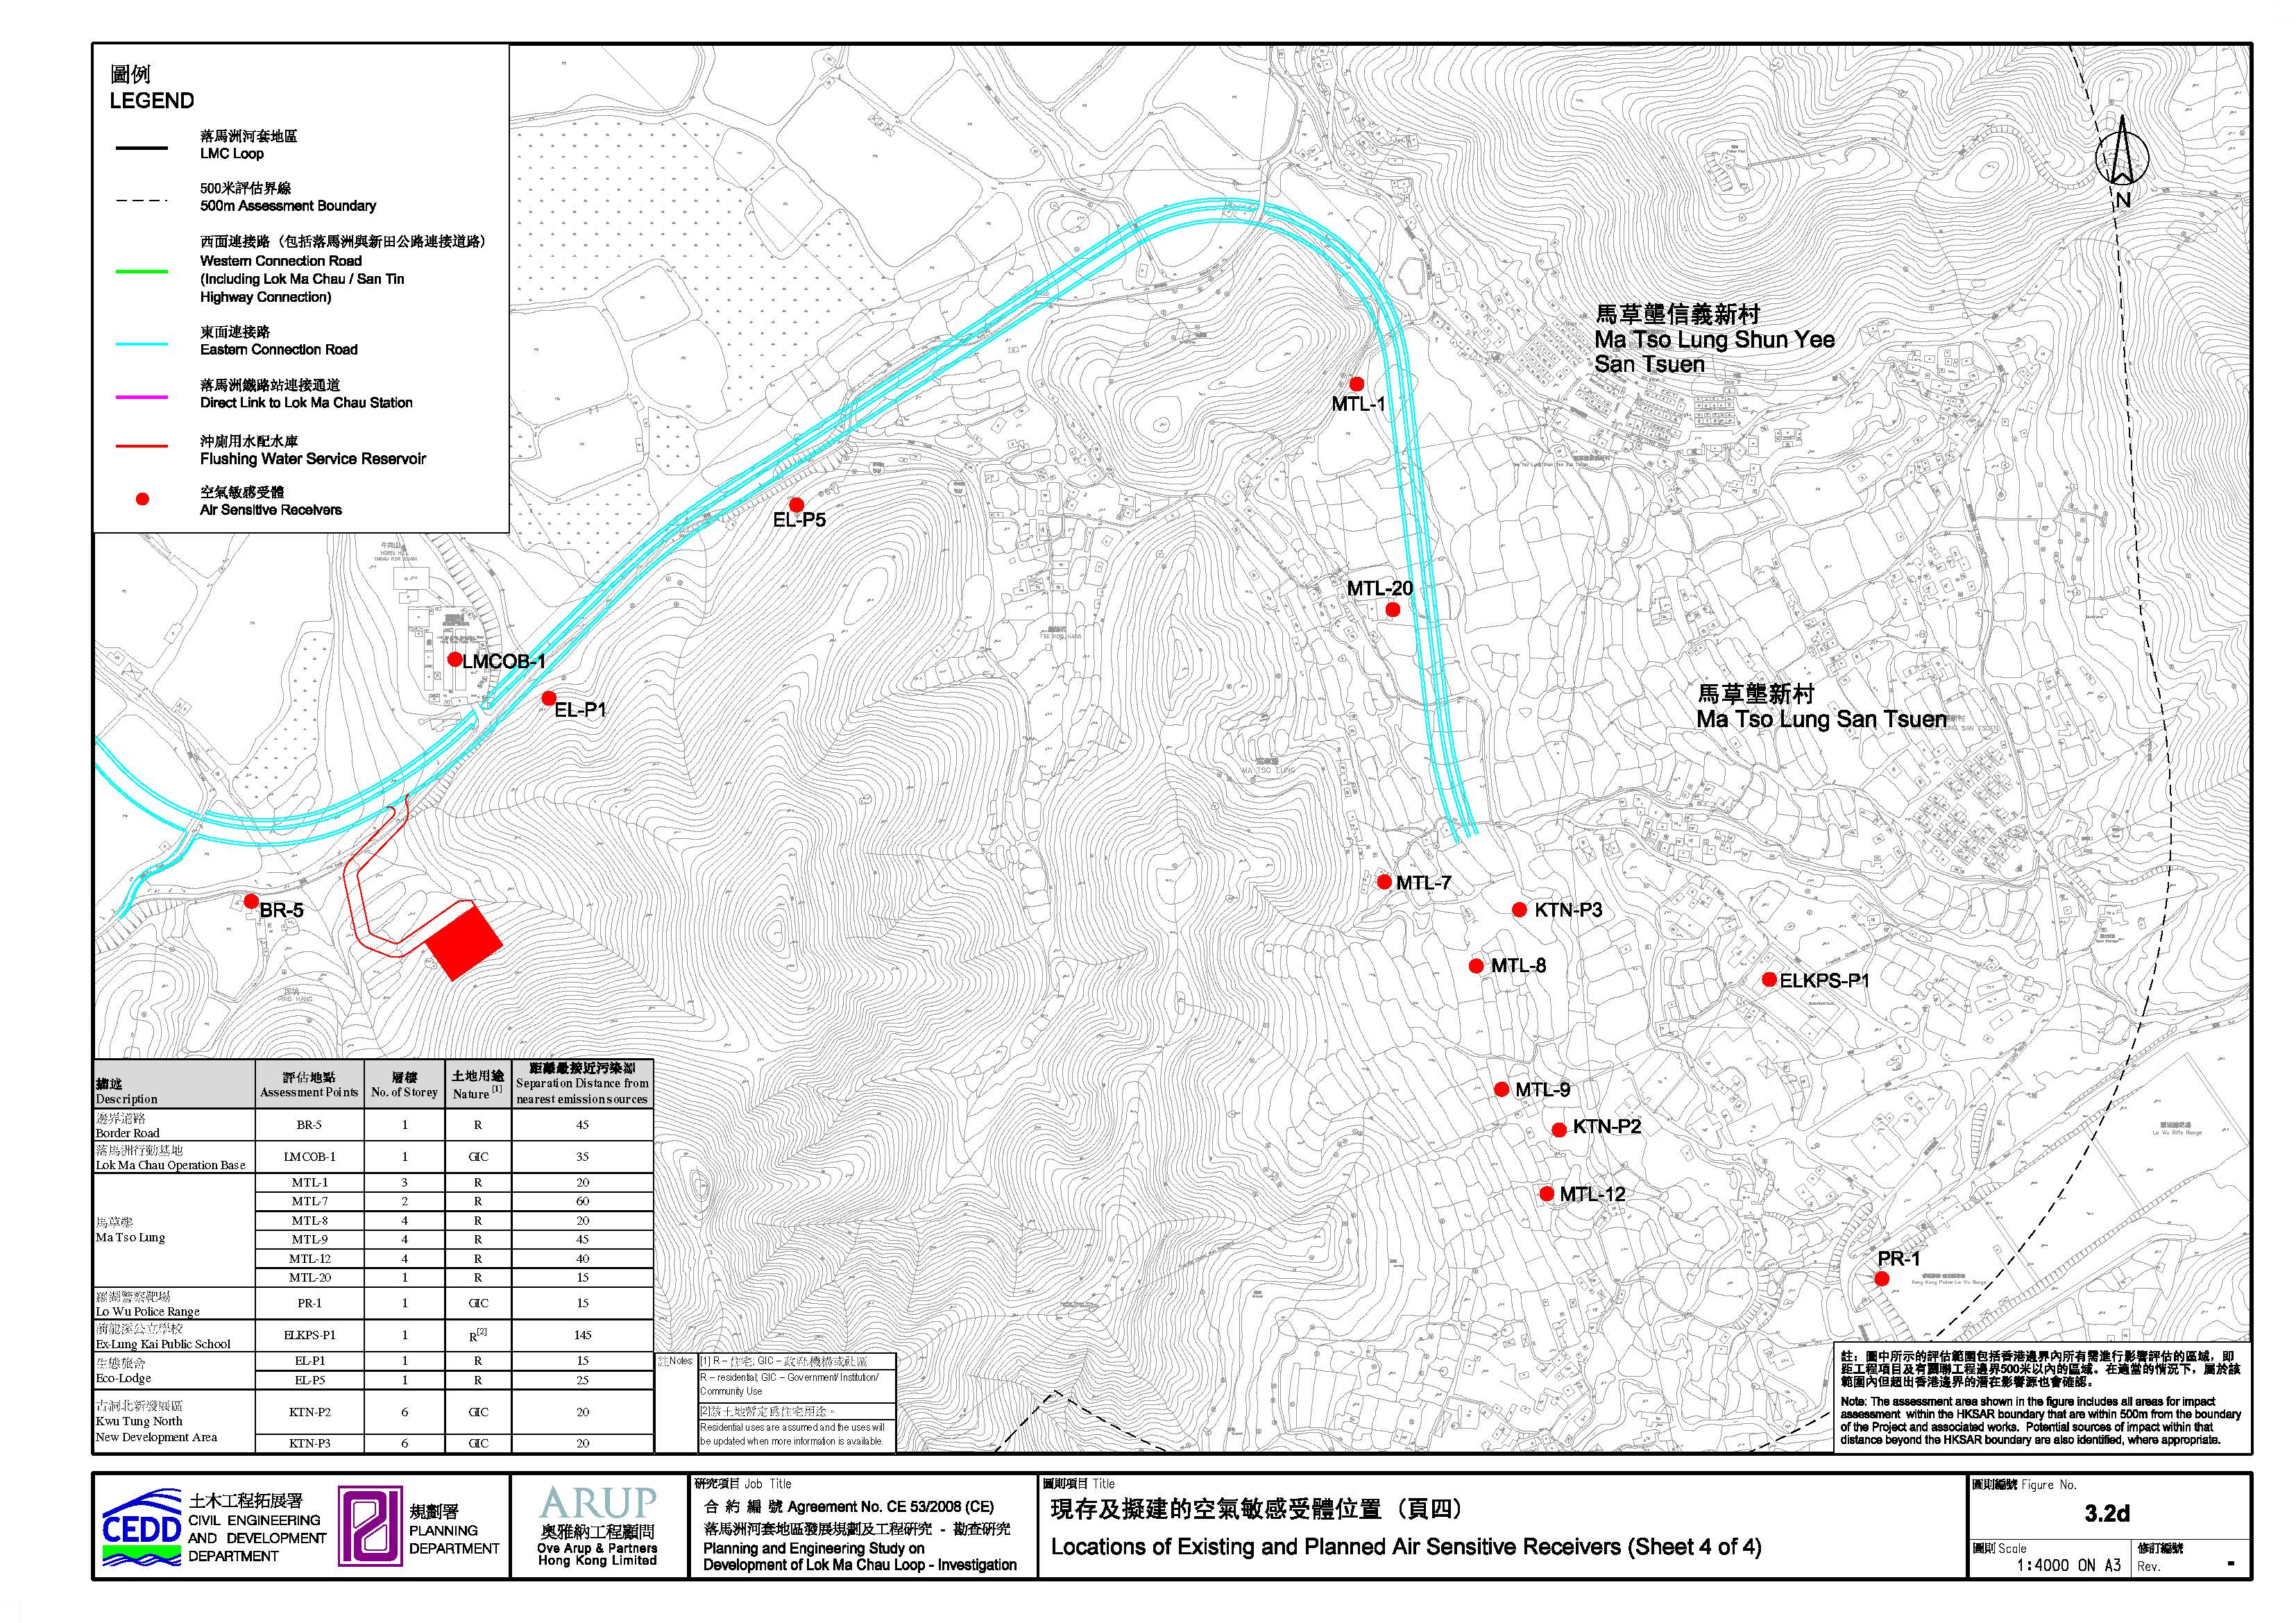
Figure 3.2d Locations of Existing and Planned Air Sensitive Receivers (Sheet 4 of 4)
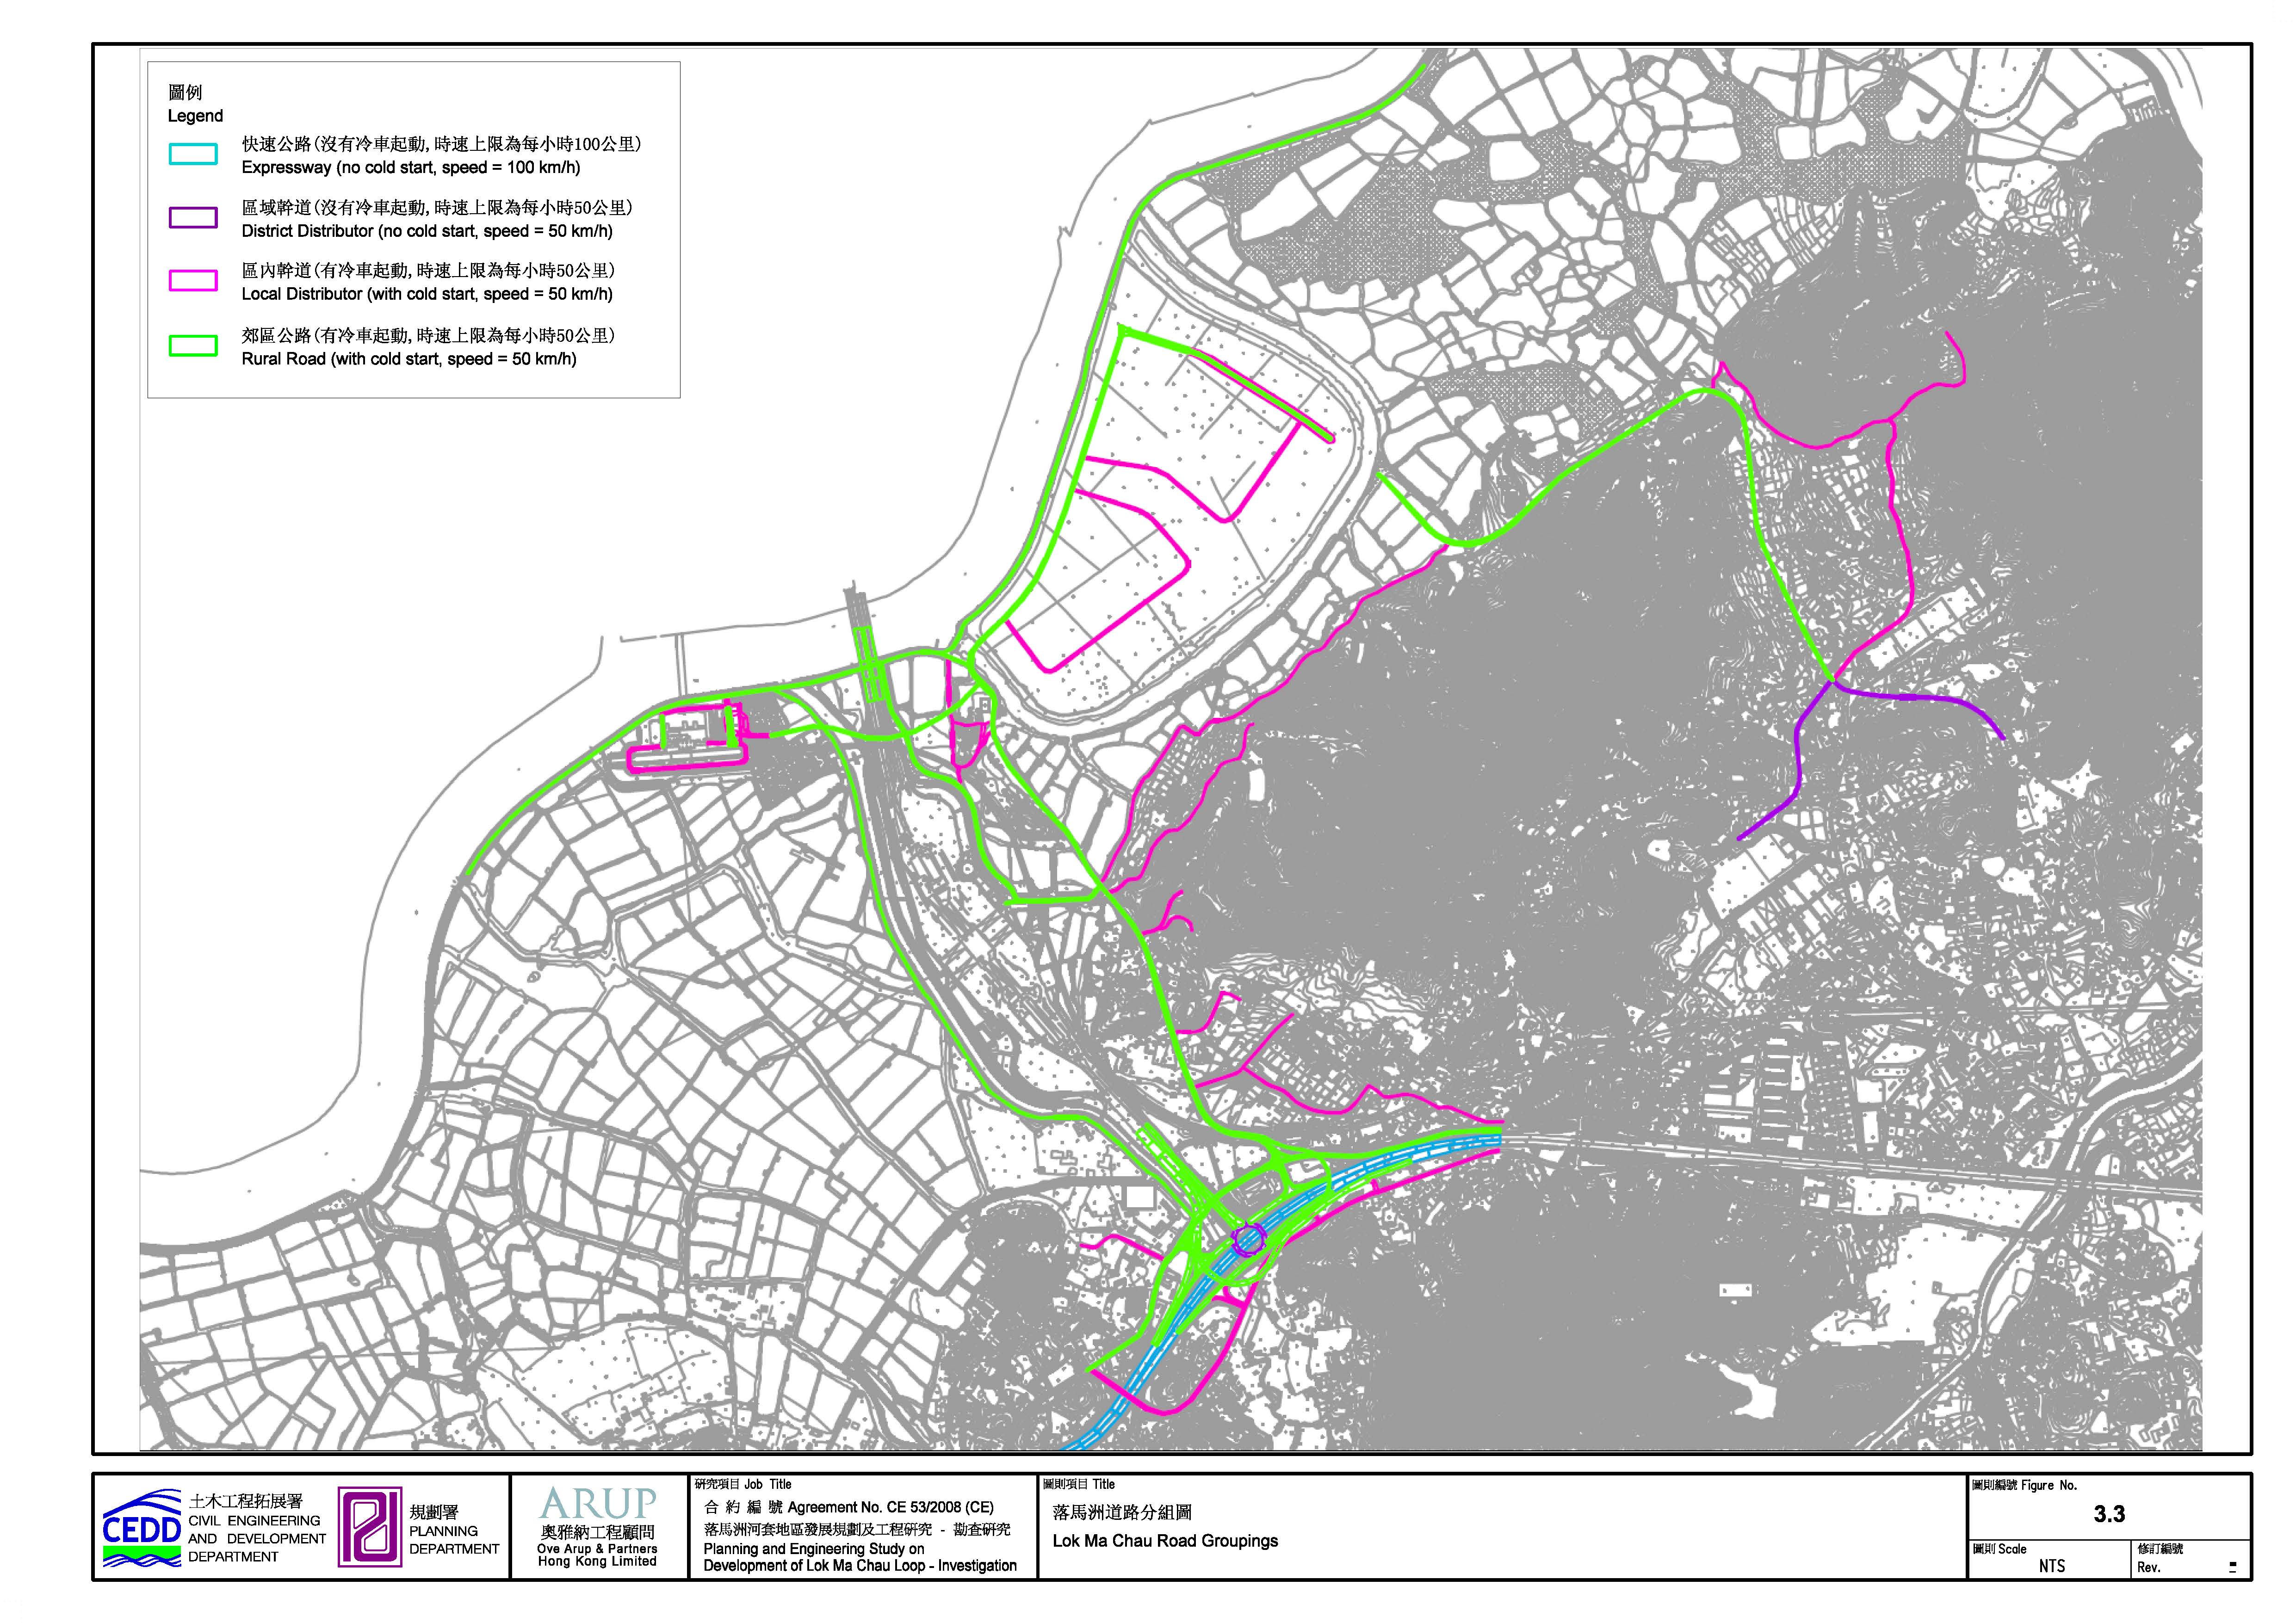
Figure 3.3 Lok Ma Chau Road Groupings
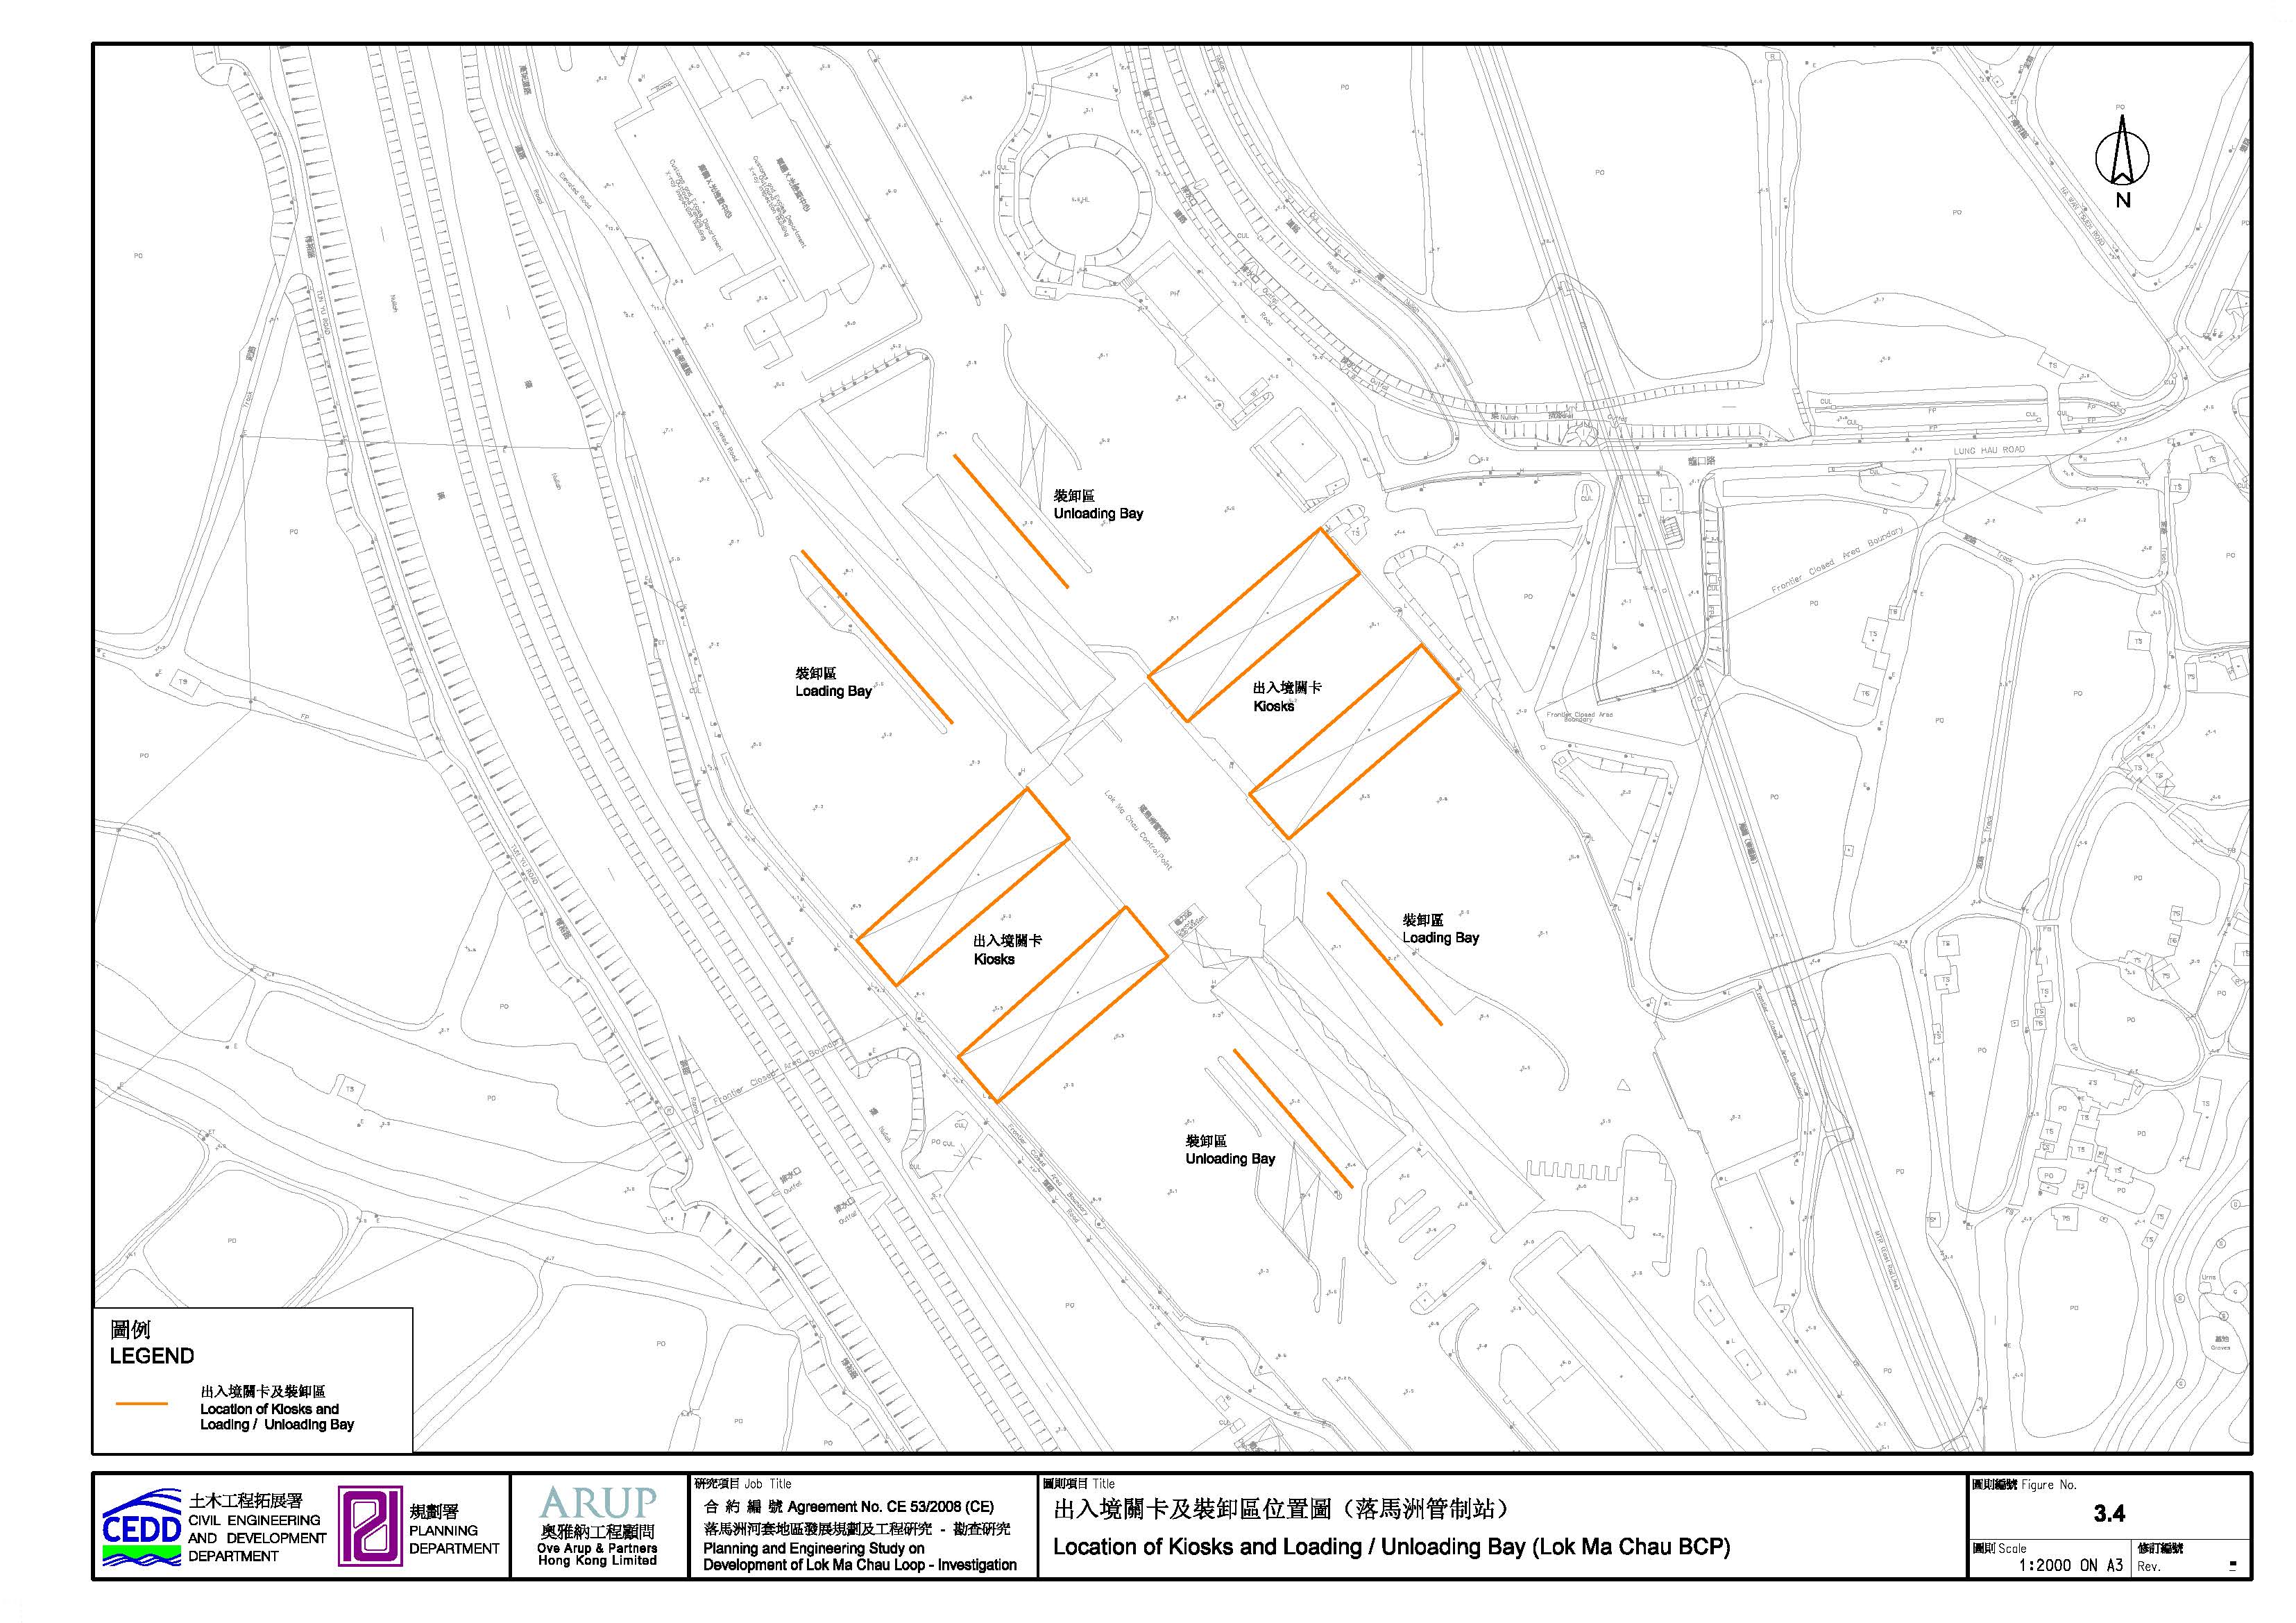
Figure 3.4 Location of Kiosks and Loading / Unloading Bay (Lok Ma Chau BCP)
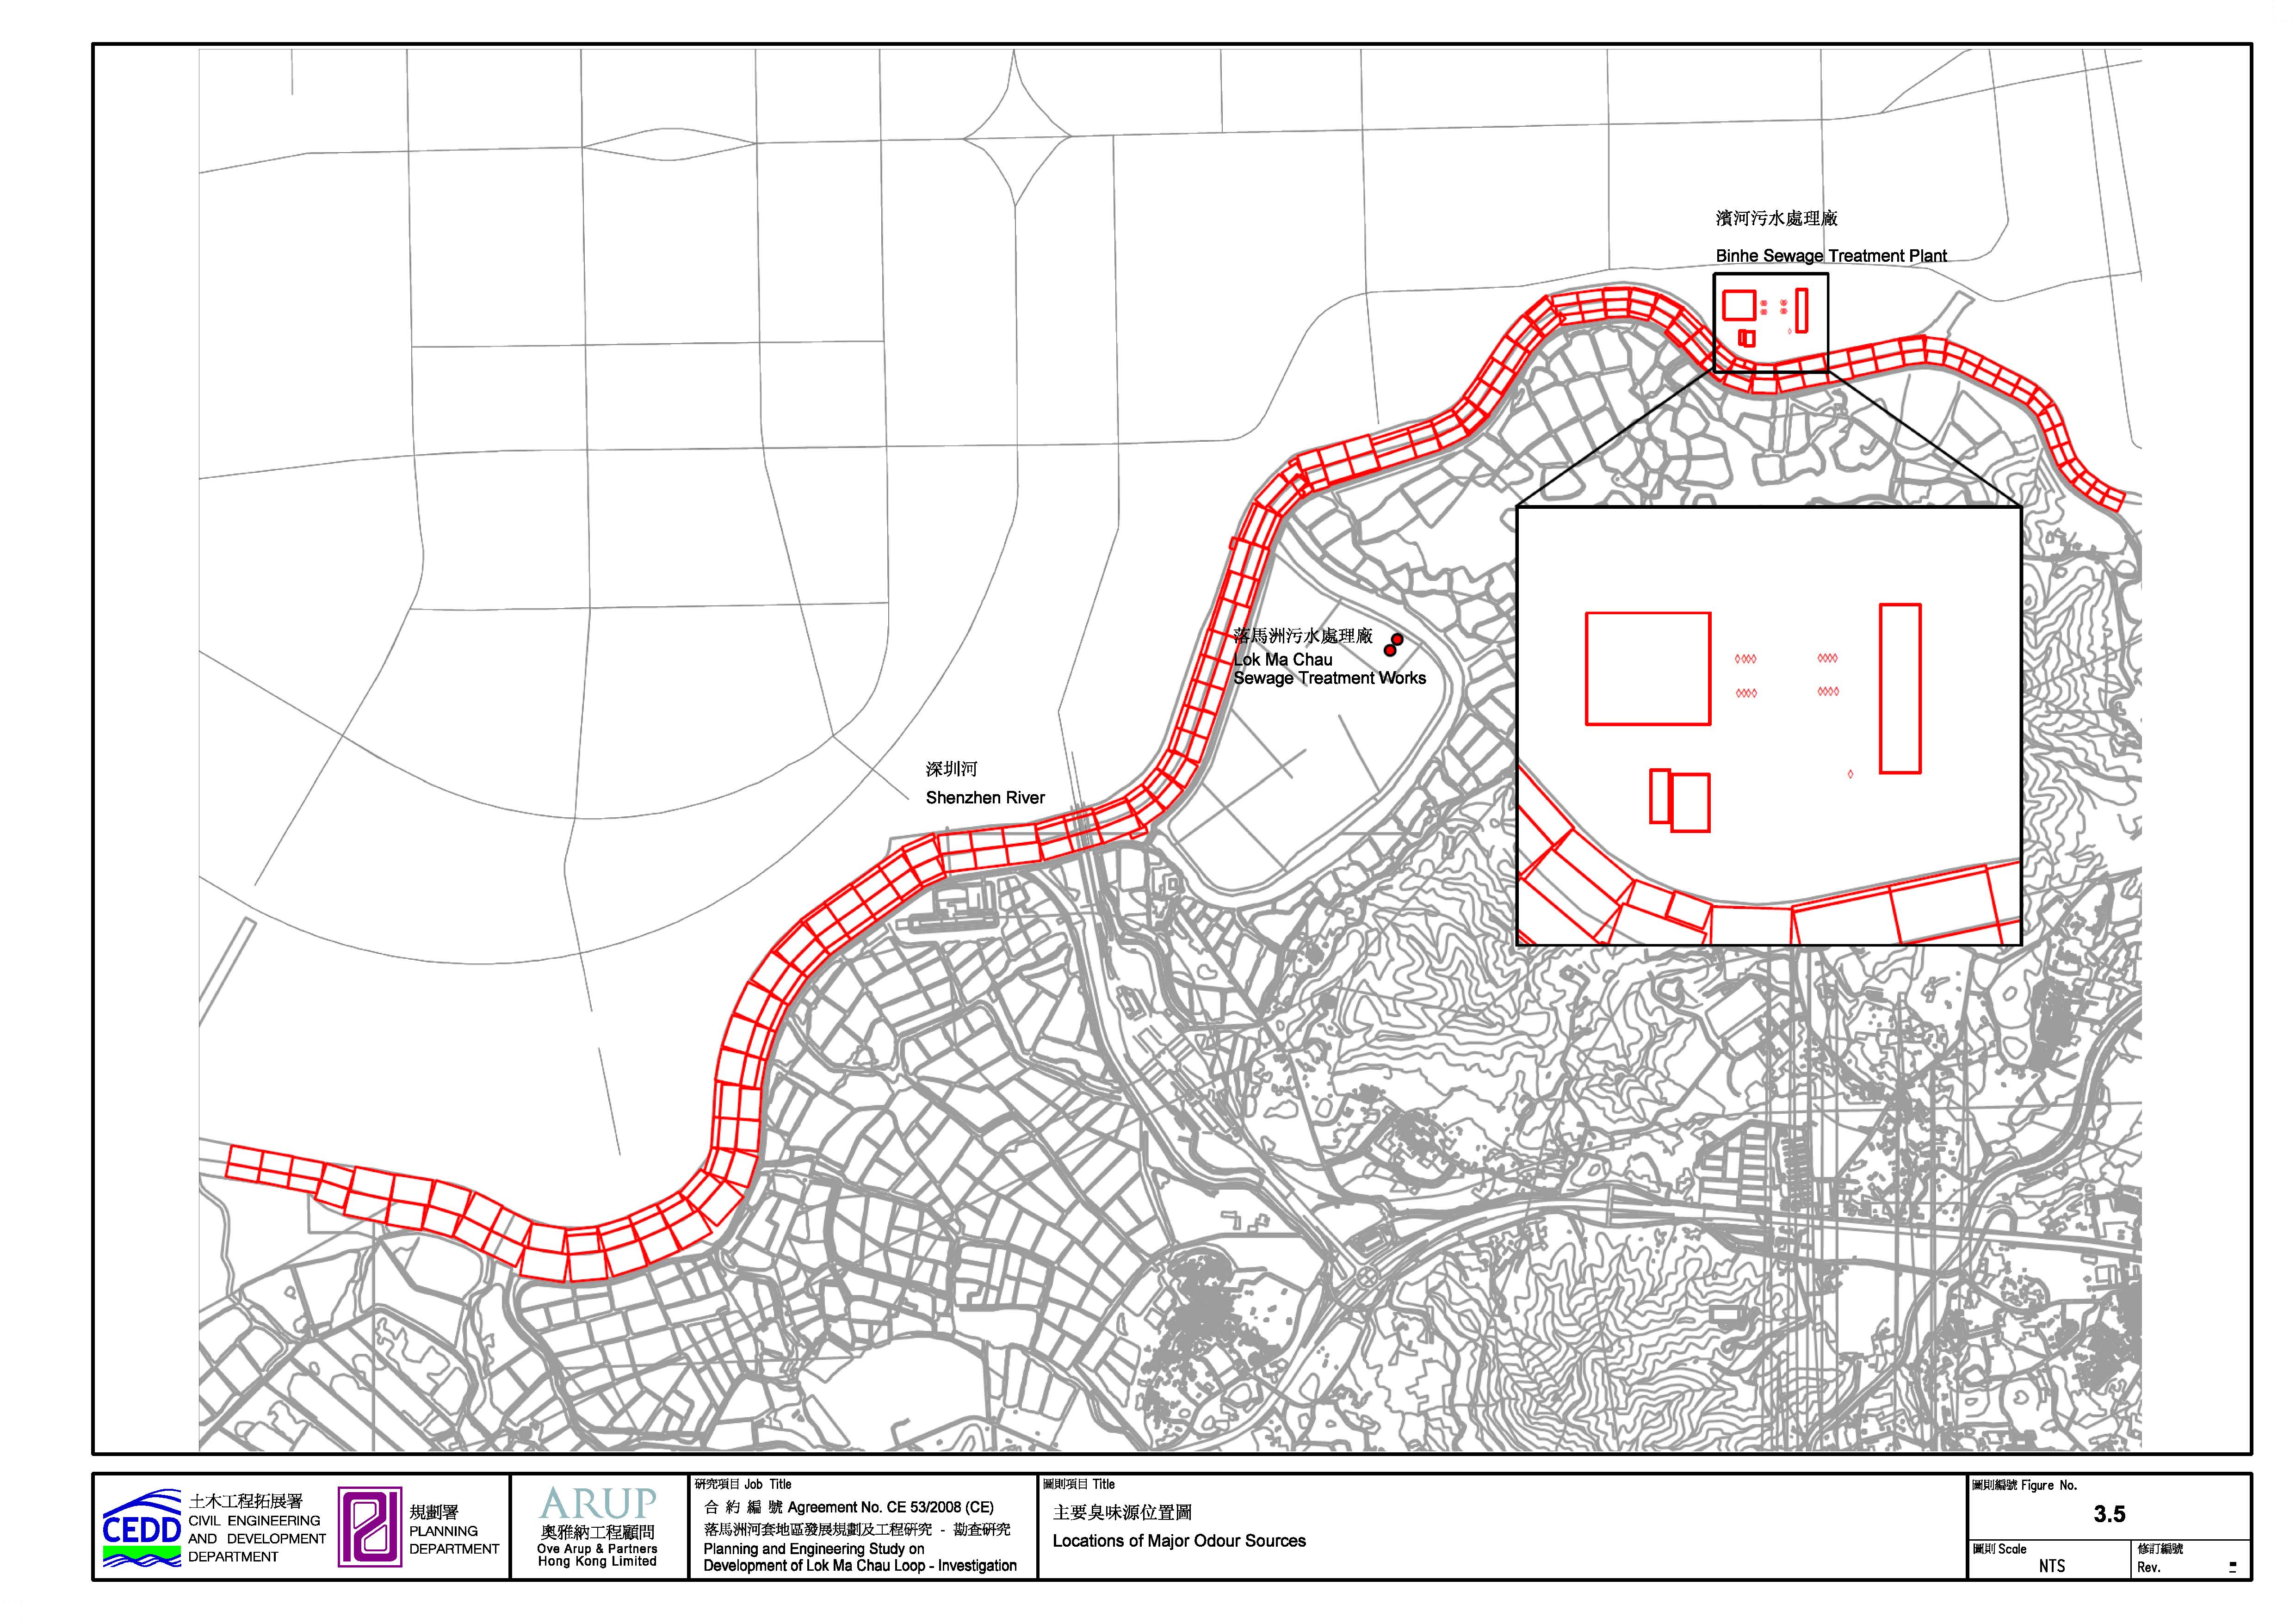
Figure 3.5 Locations of Major Odour Sources
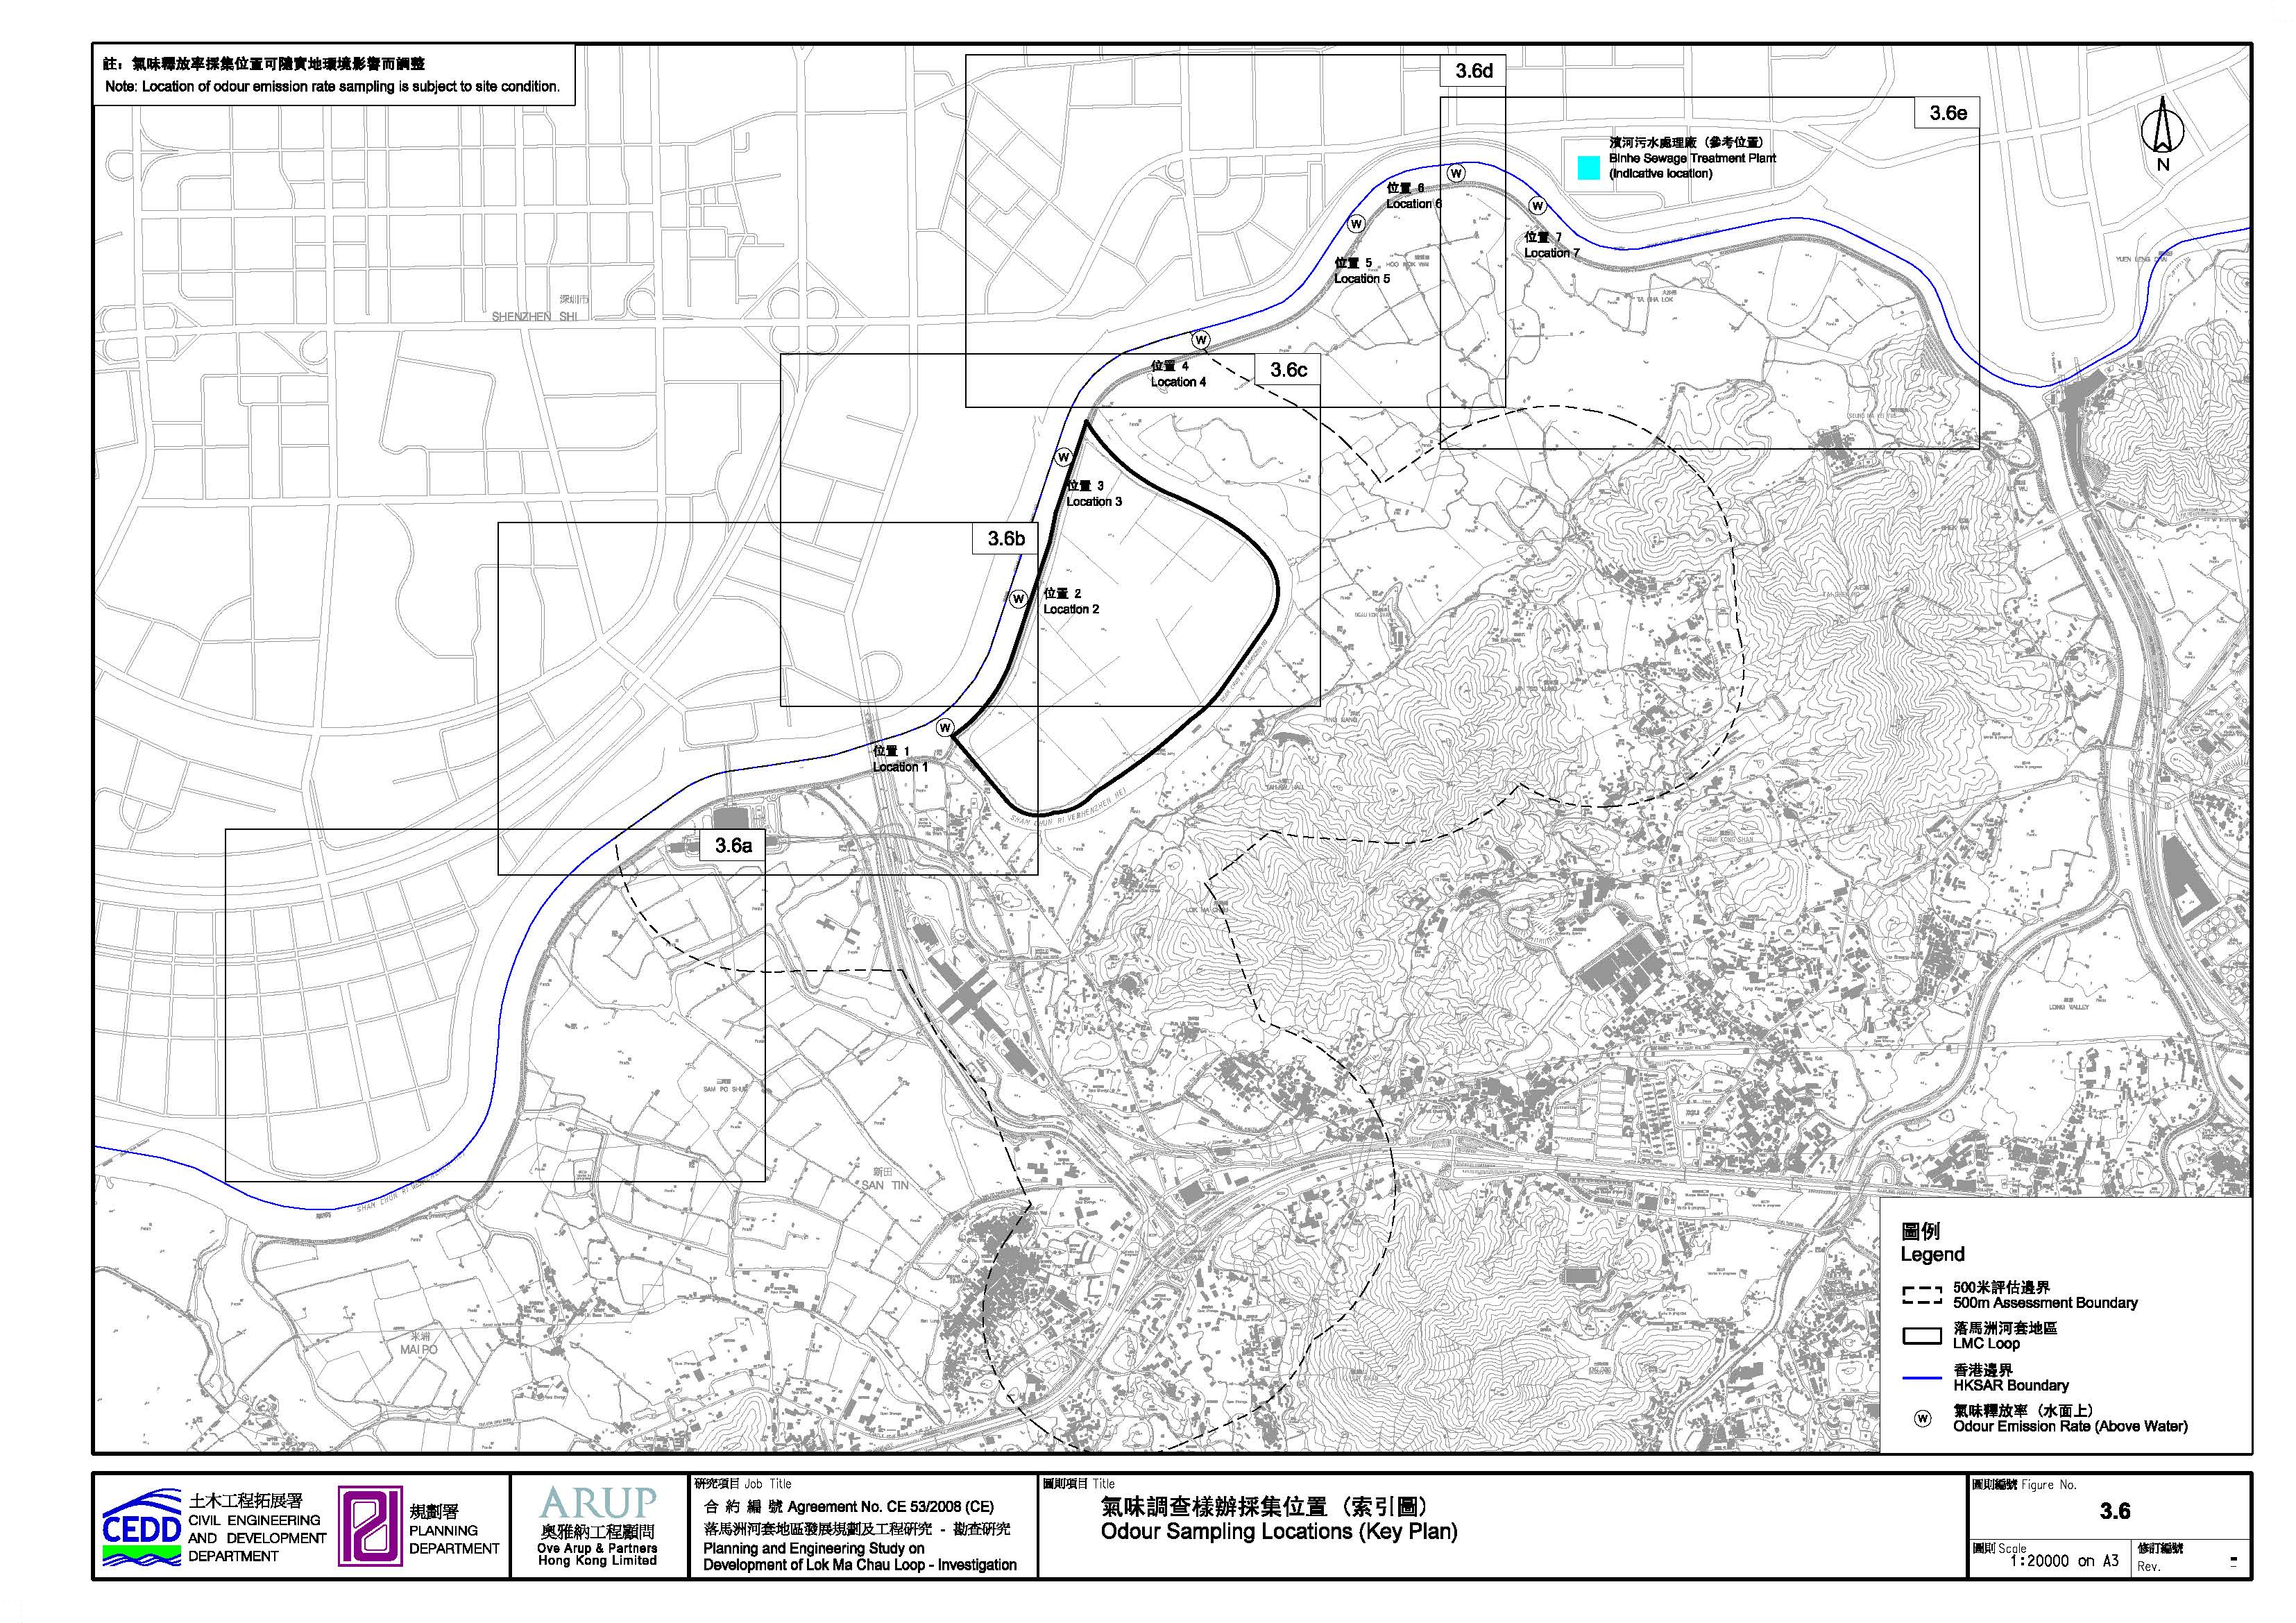
Figure 3.6 Odour Sampling Locations (Key Plan)
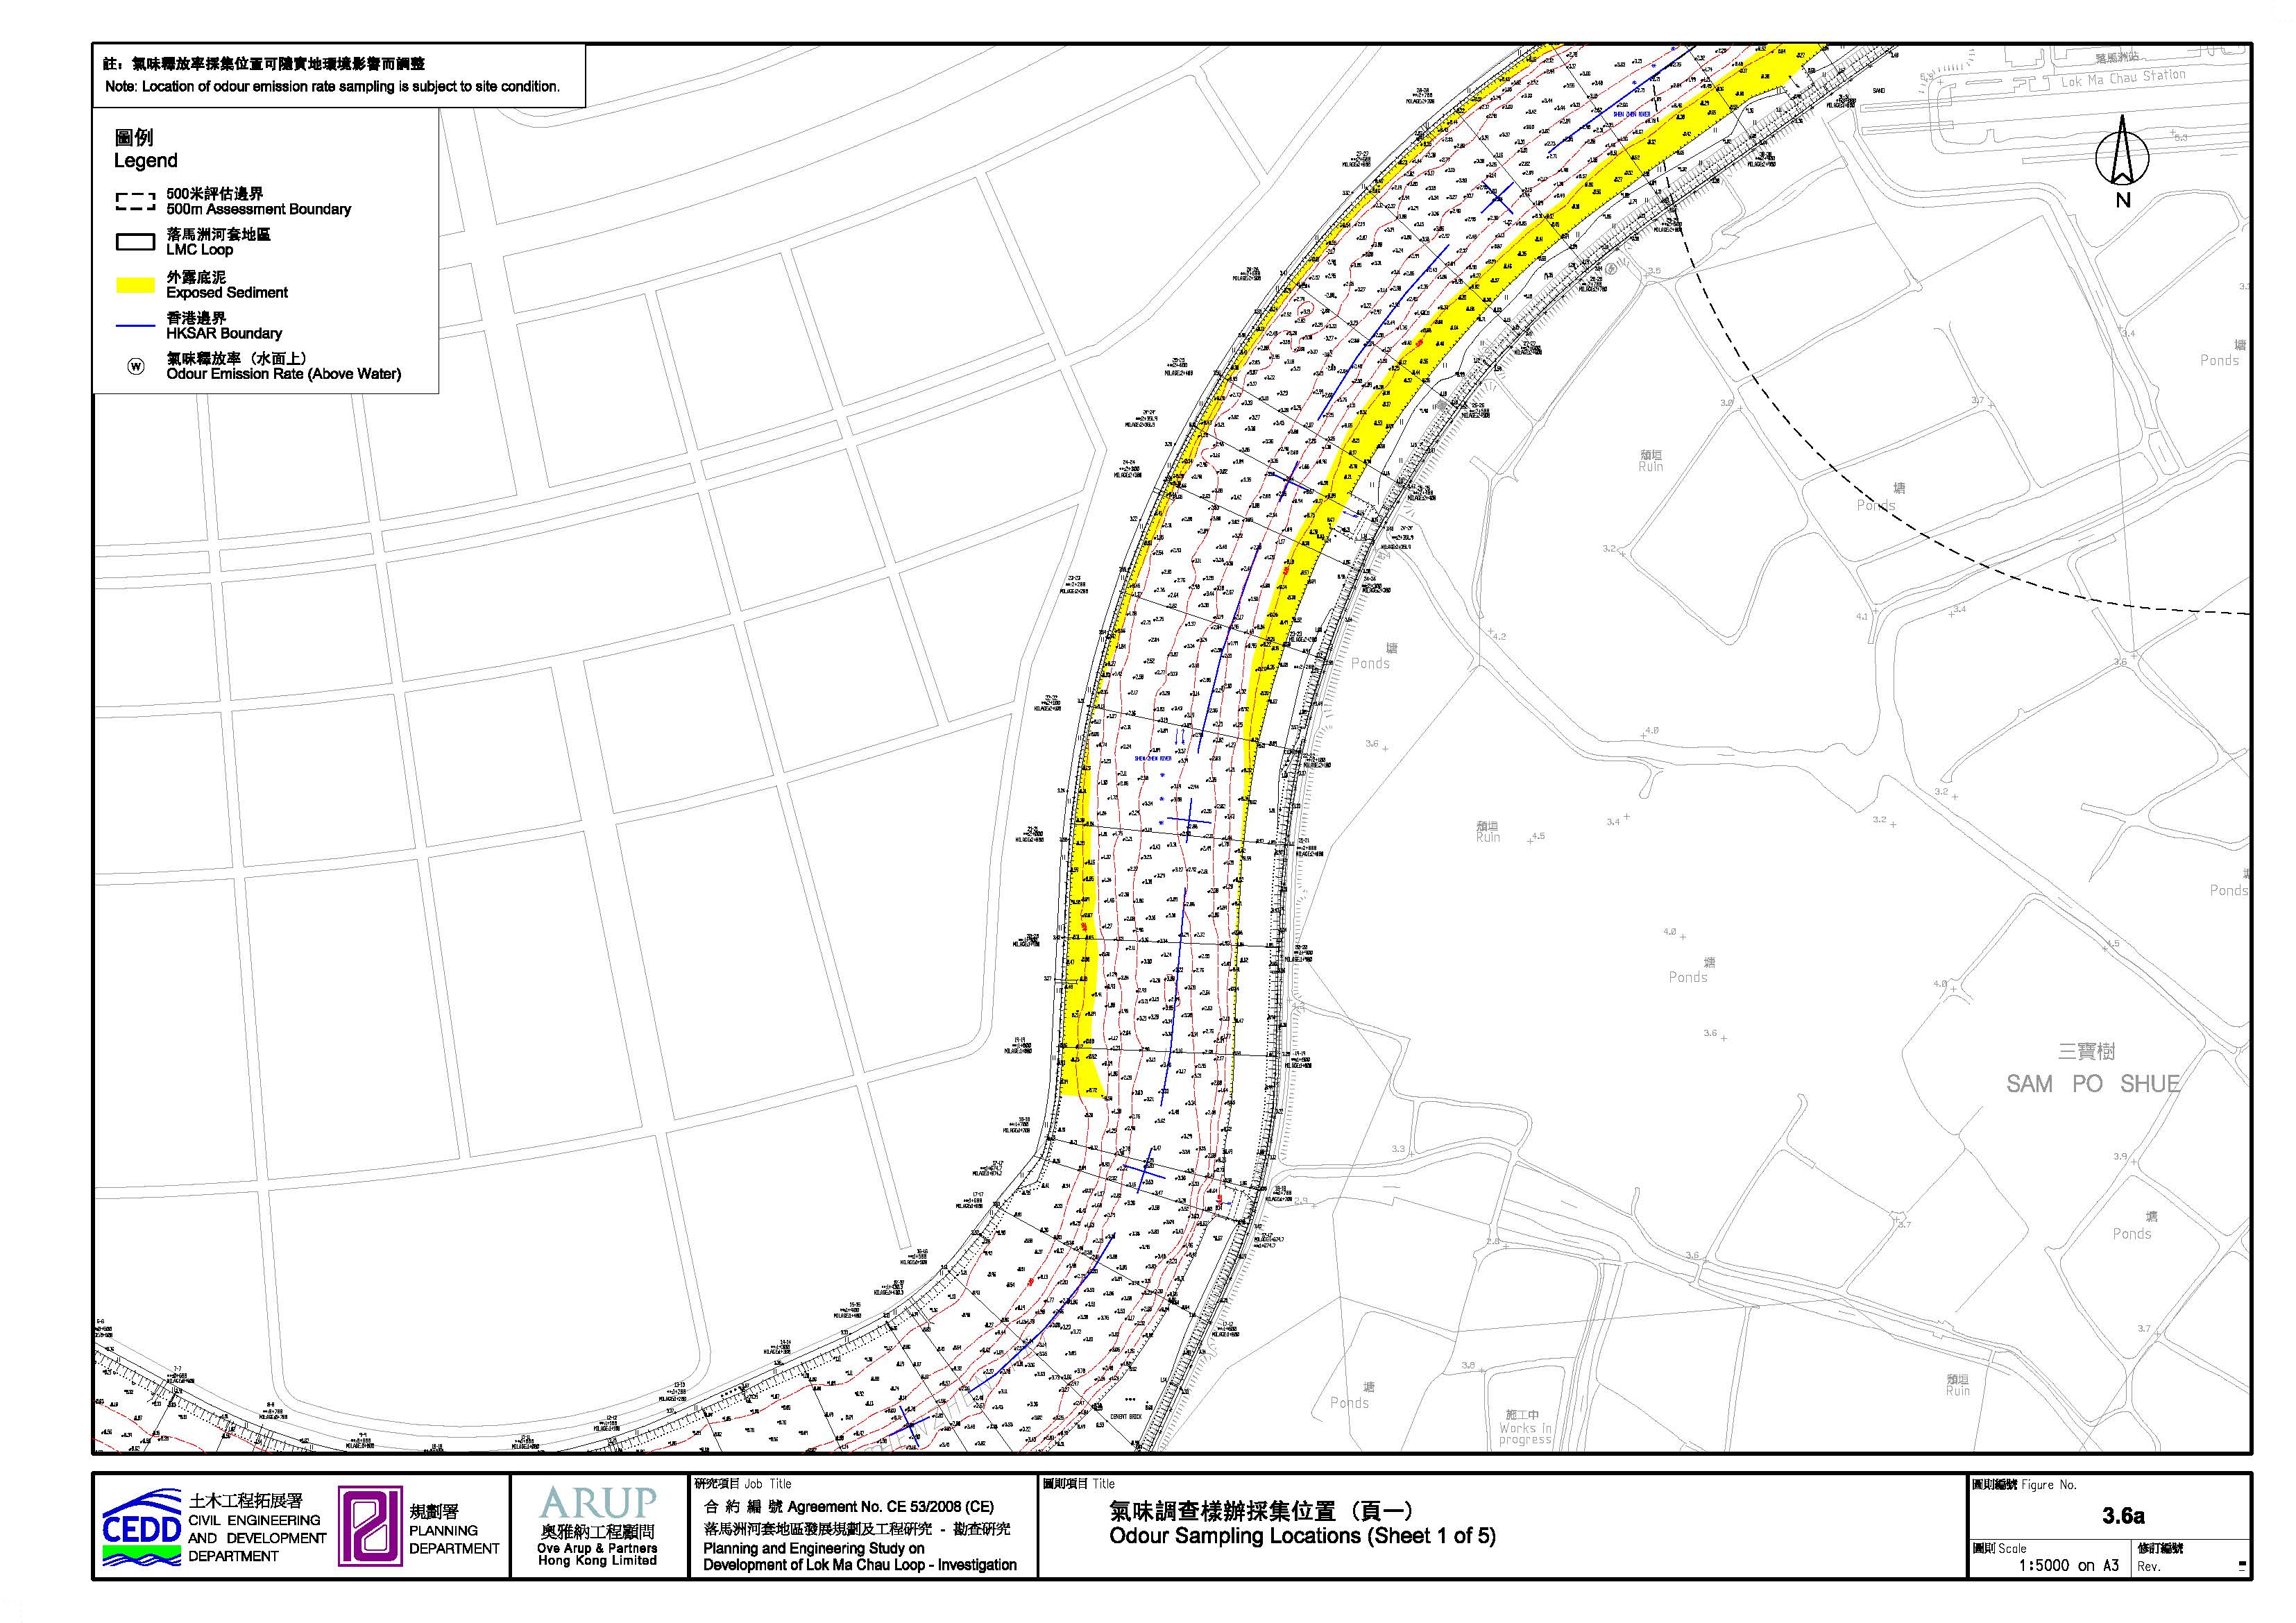
Figure 3.6a Odour Sampling Locations (Sheet 1 of 5)
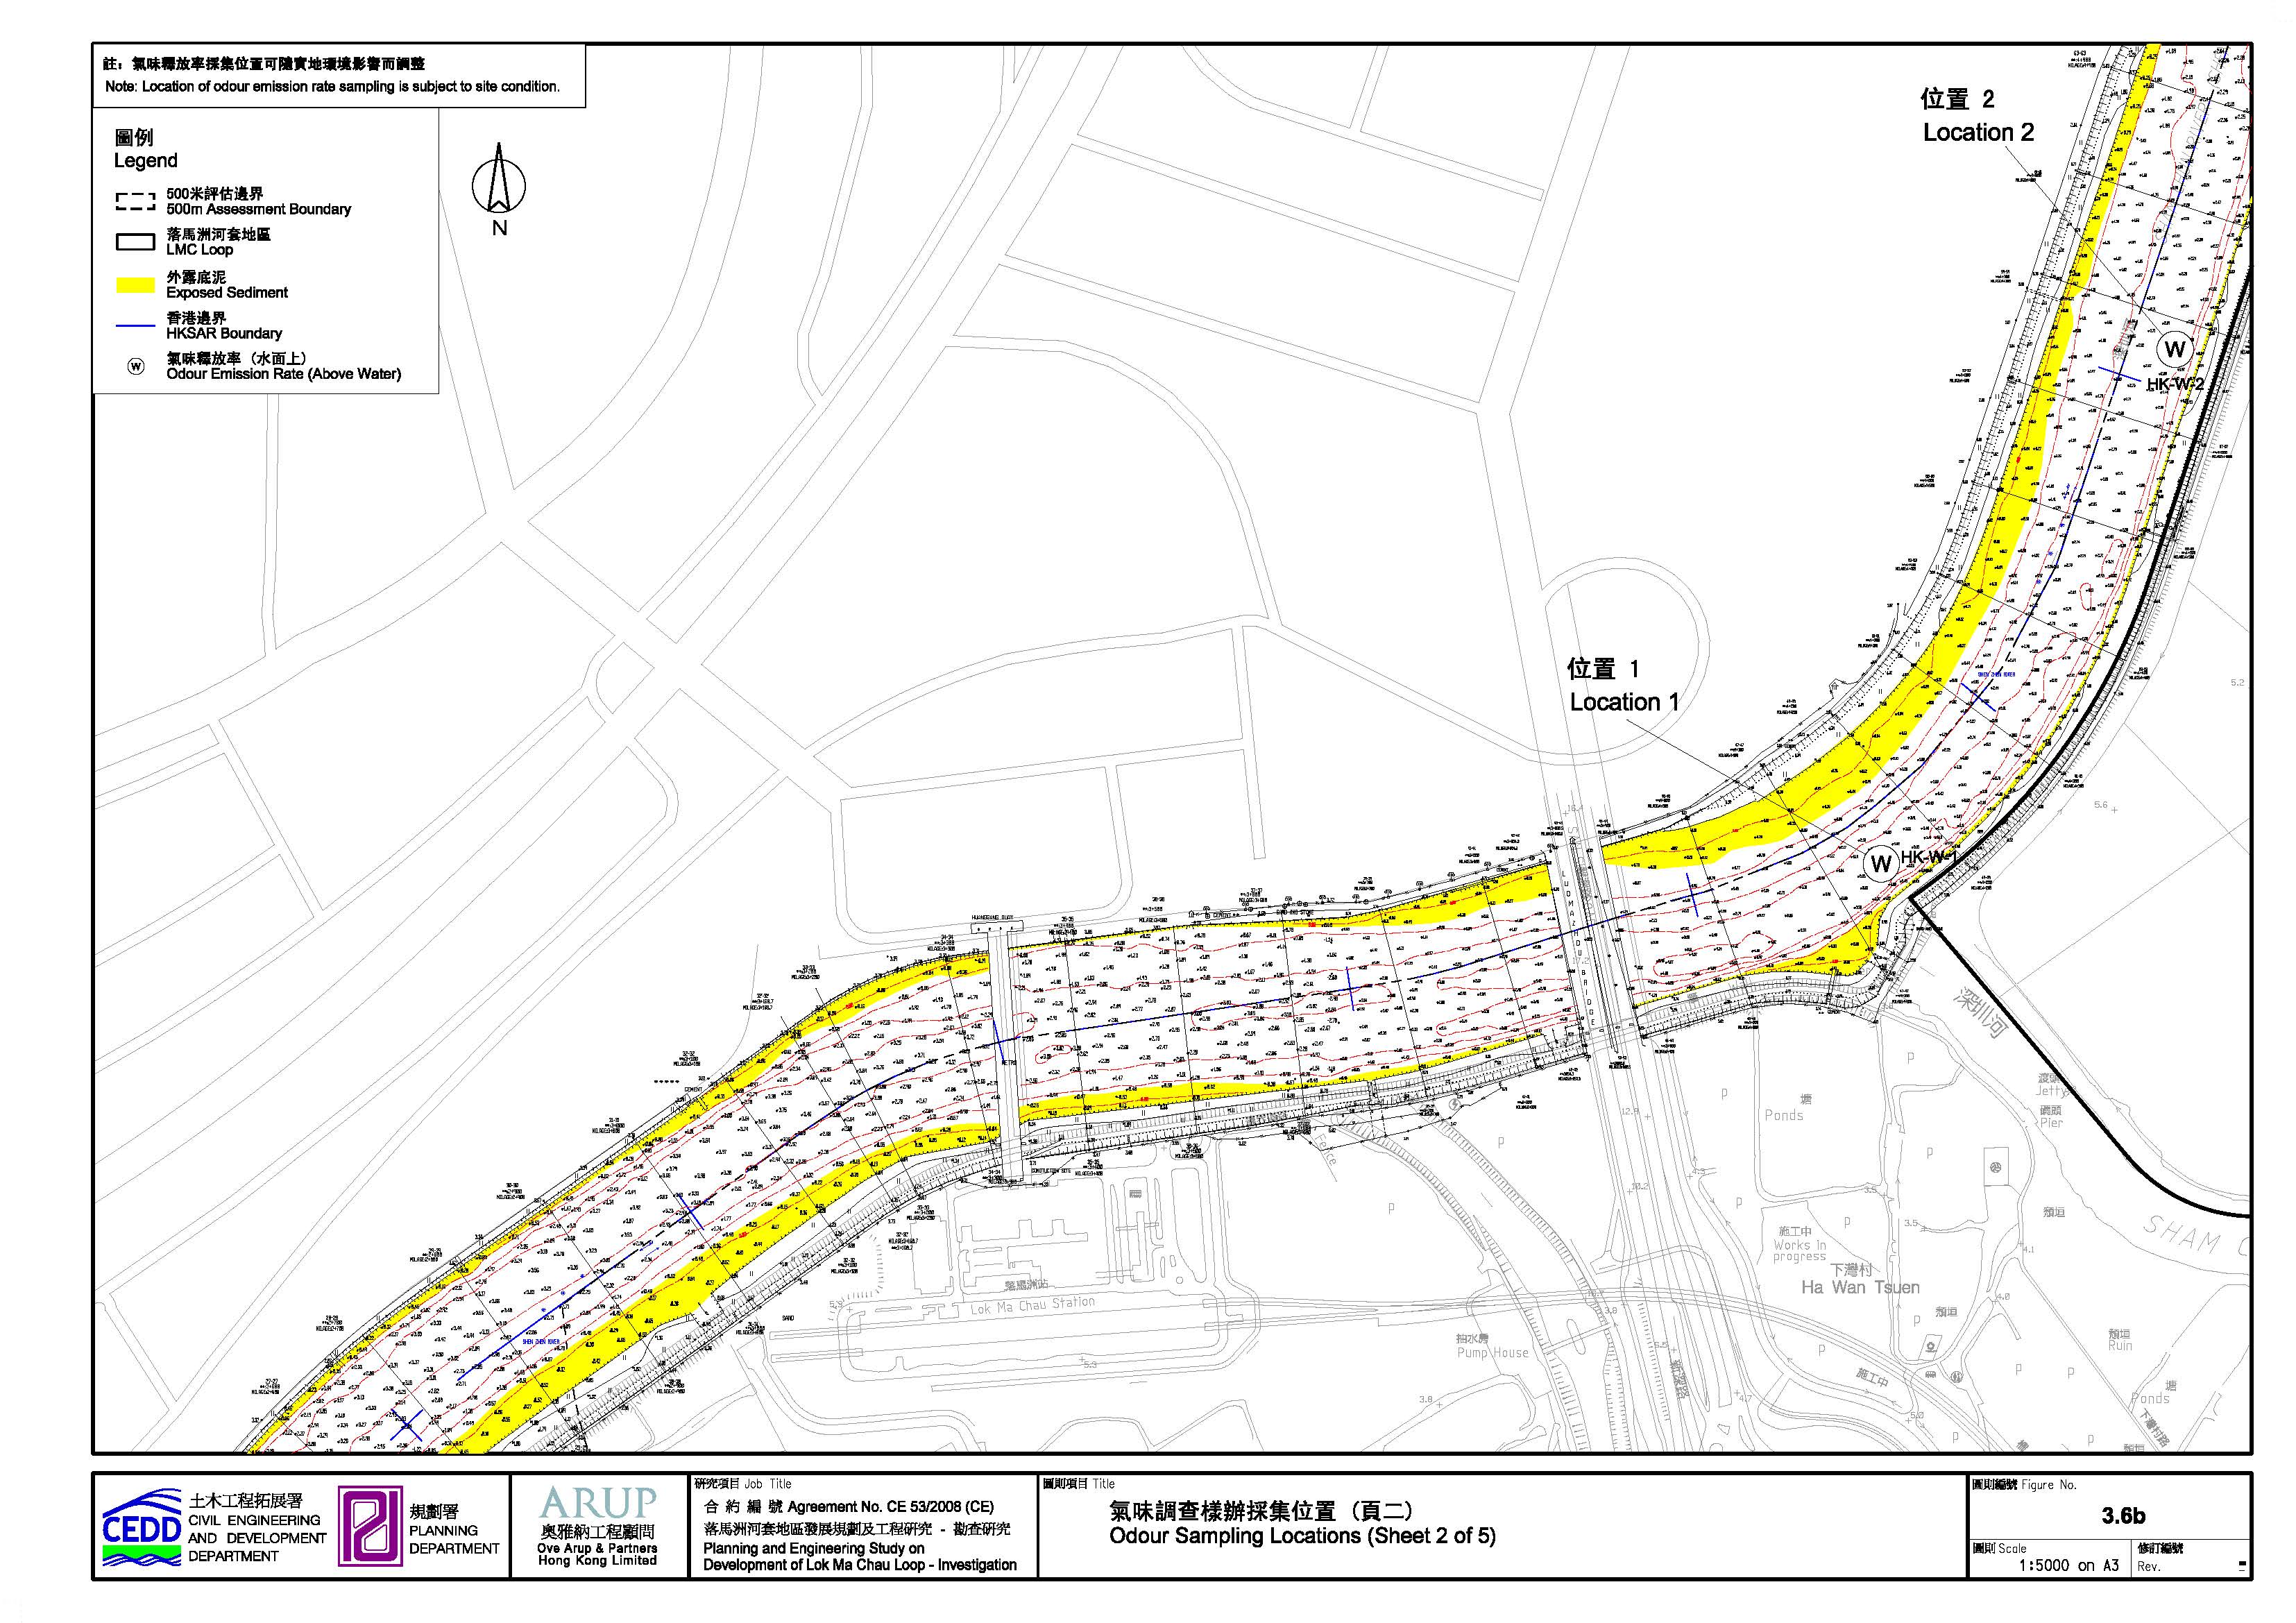
Figure 3.6b Odour Sampling Locations (Sheet 2 of 5)
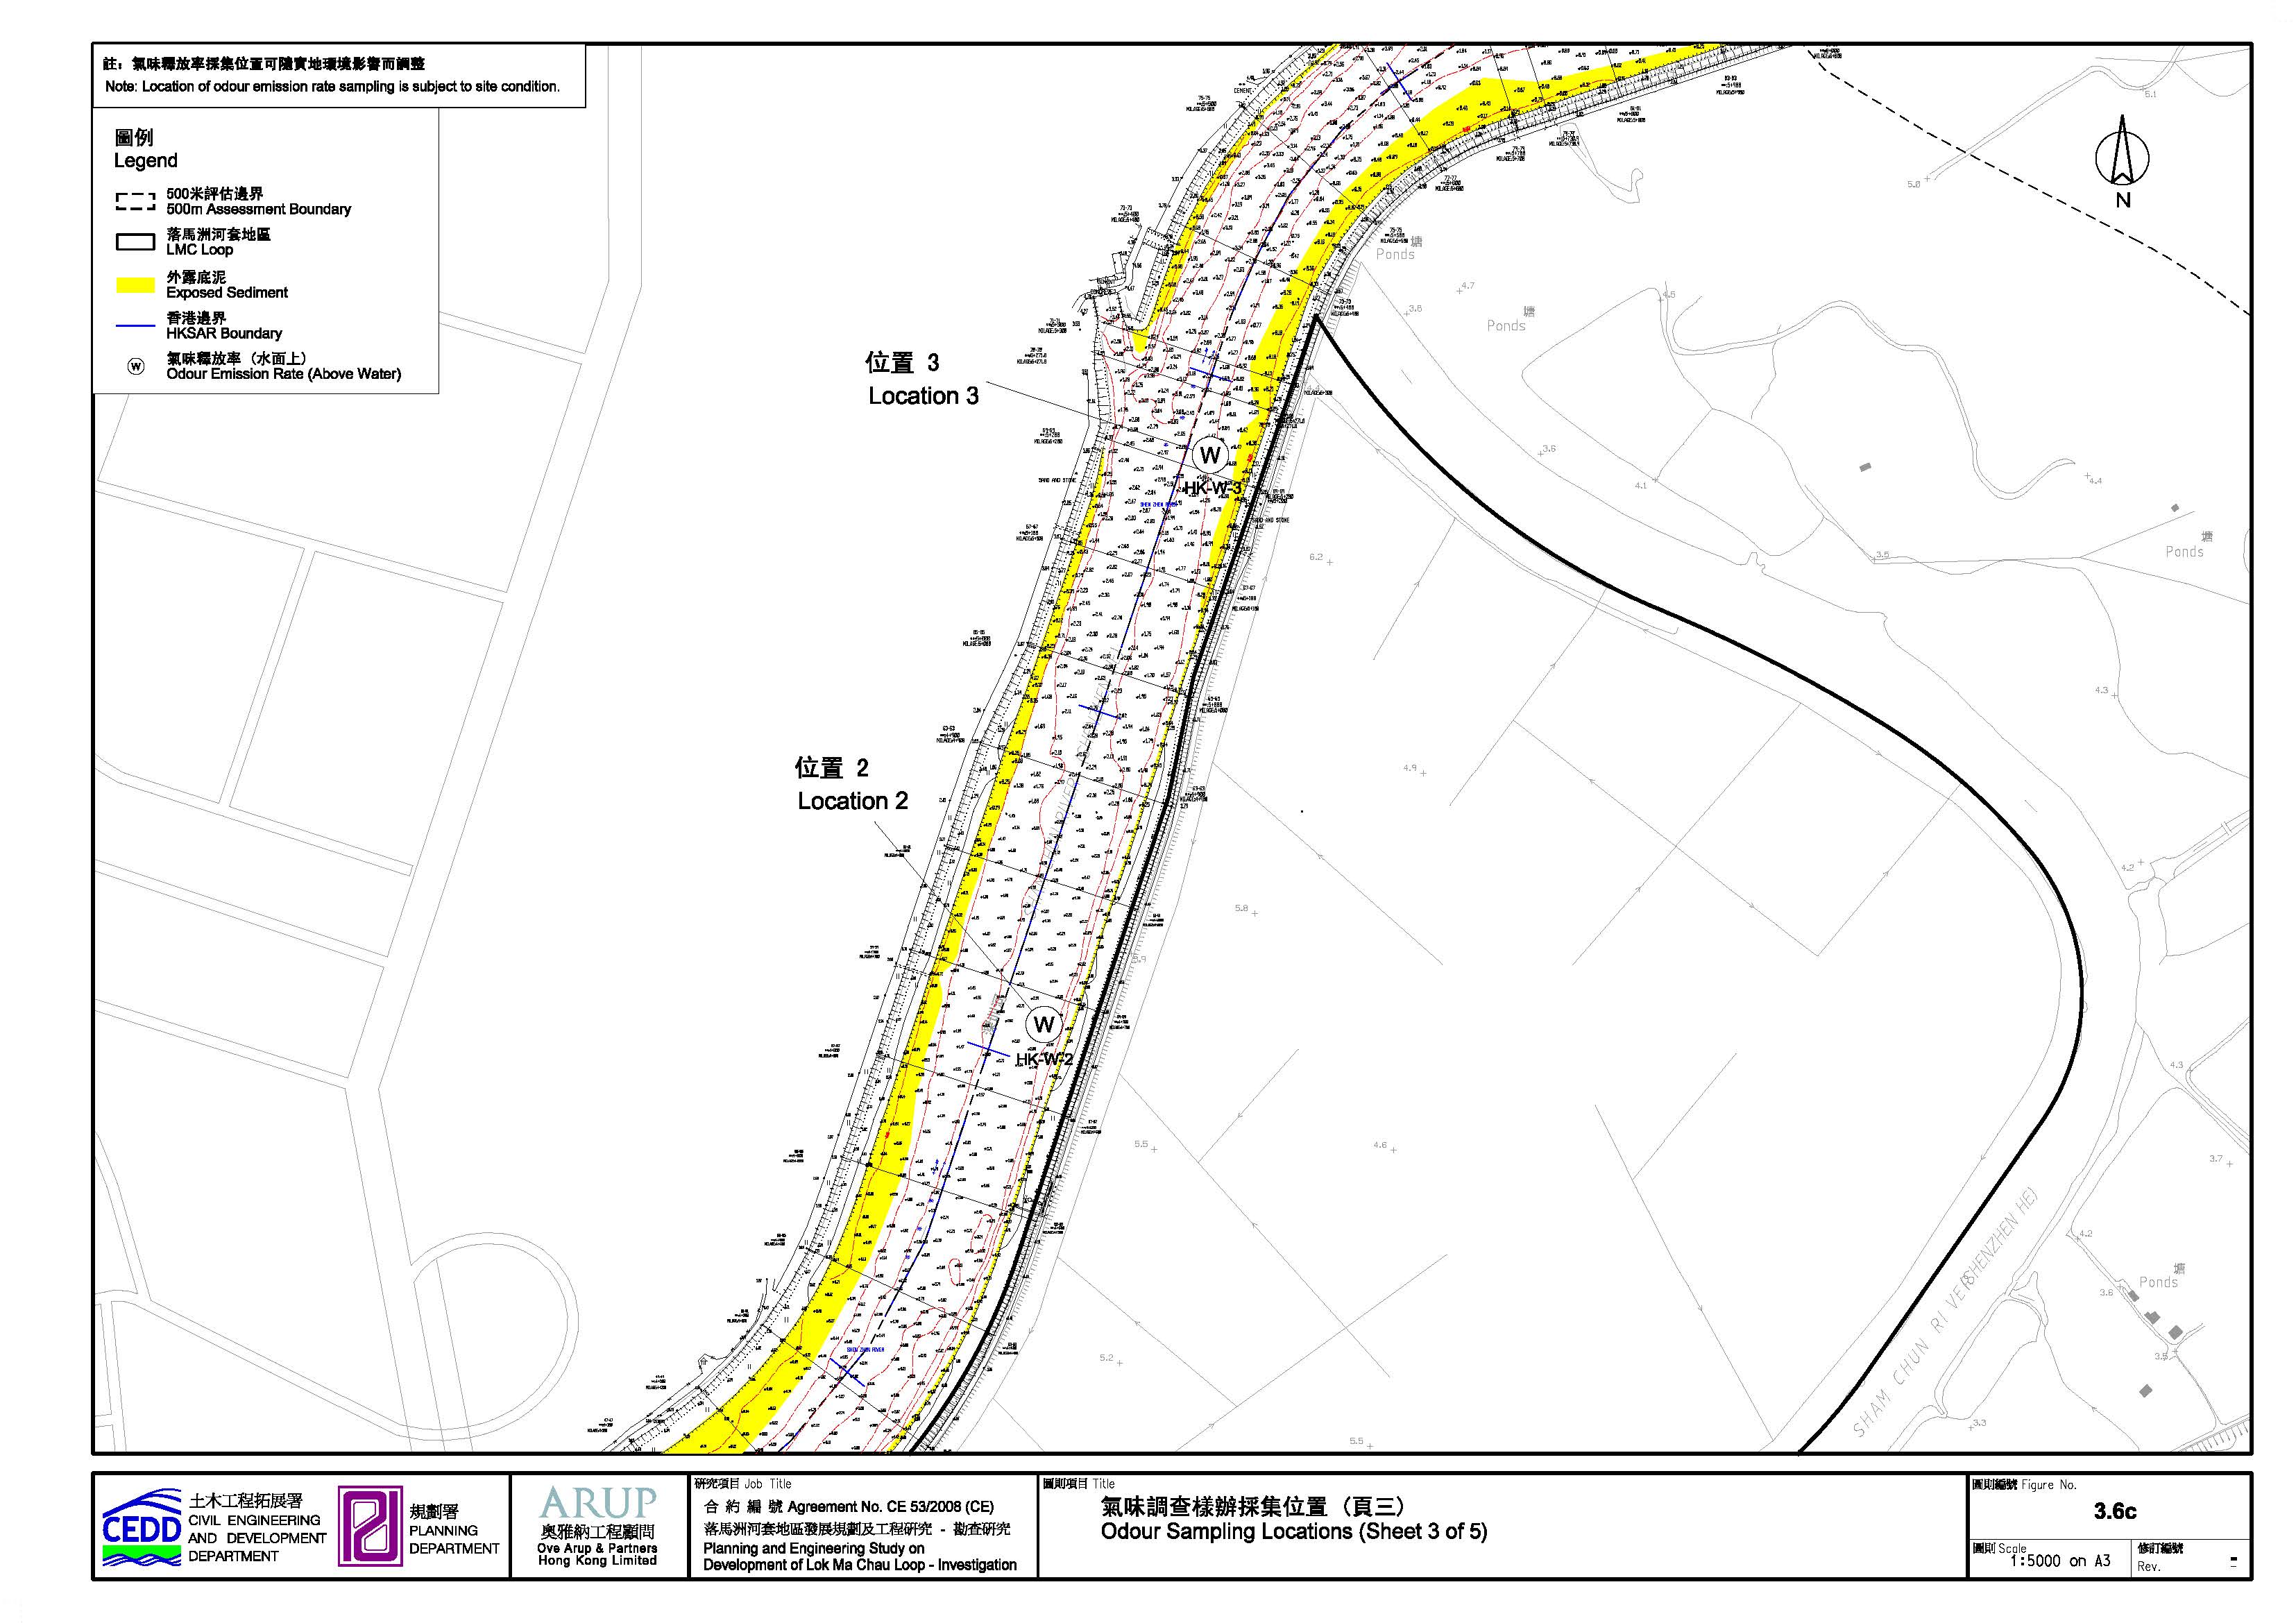
Figure 3.6c Odour Sampling Locations (Sheet 3 of 5)
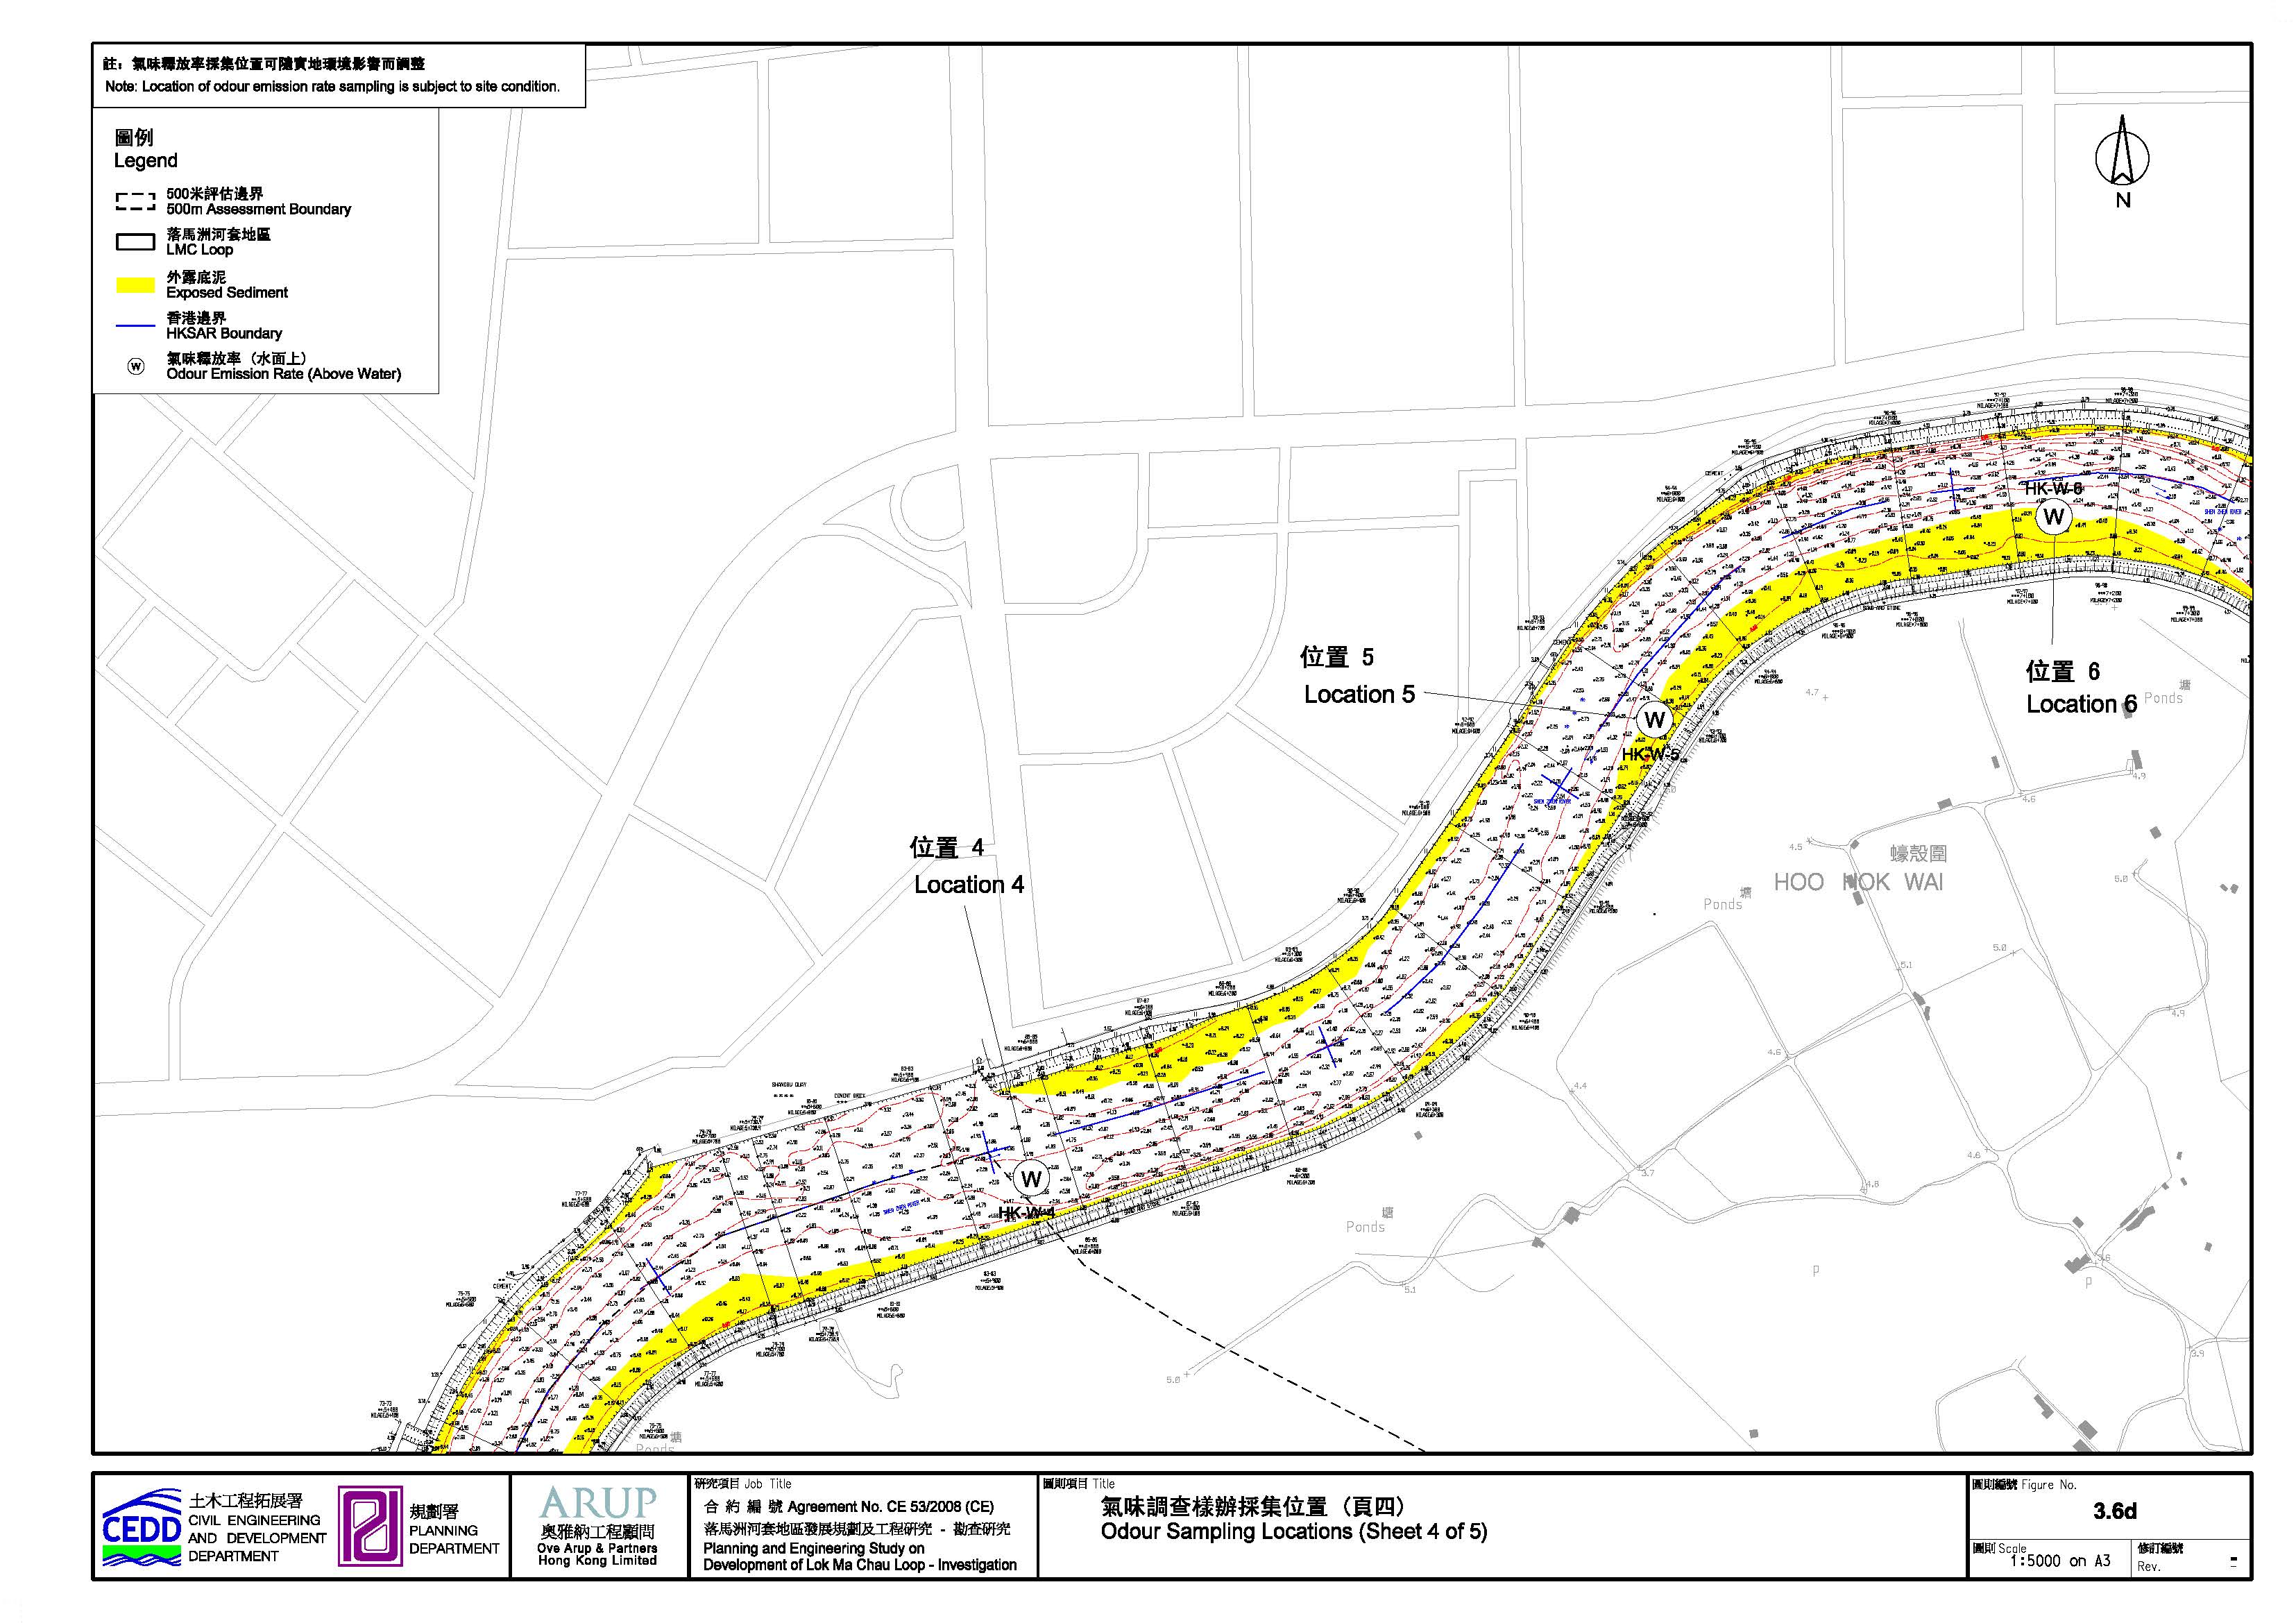
Figure 3.6d Odour Sampling Locations (Sheet 4 of 5)
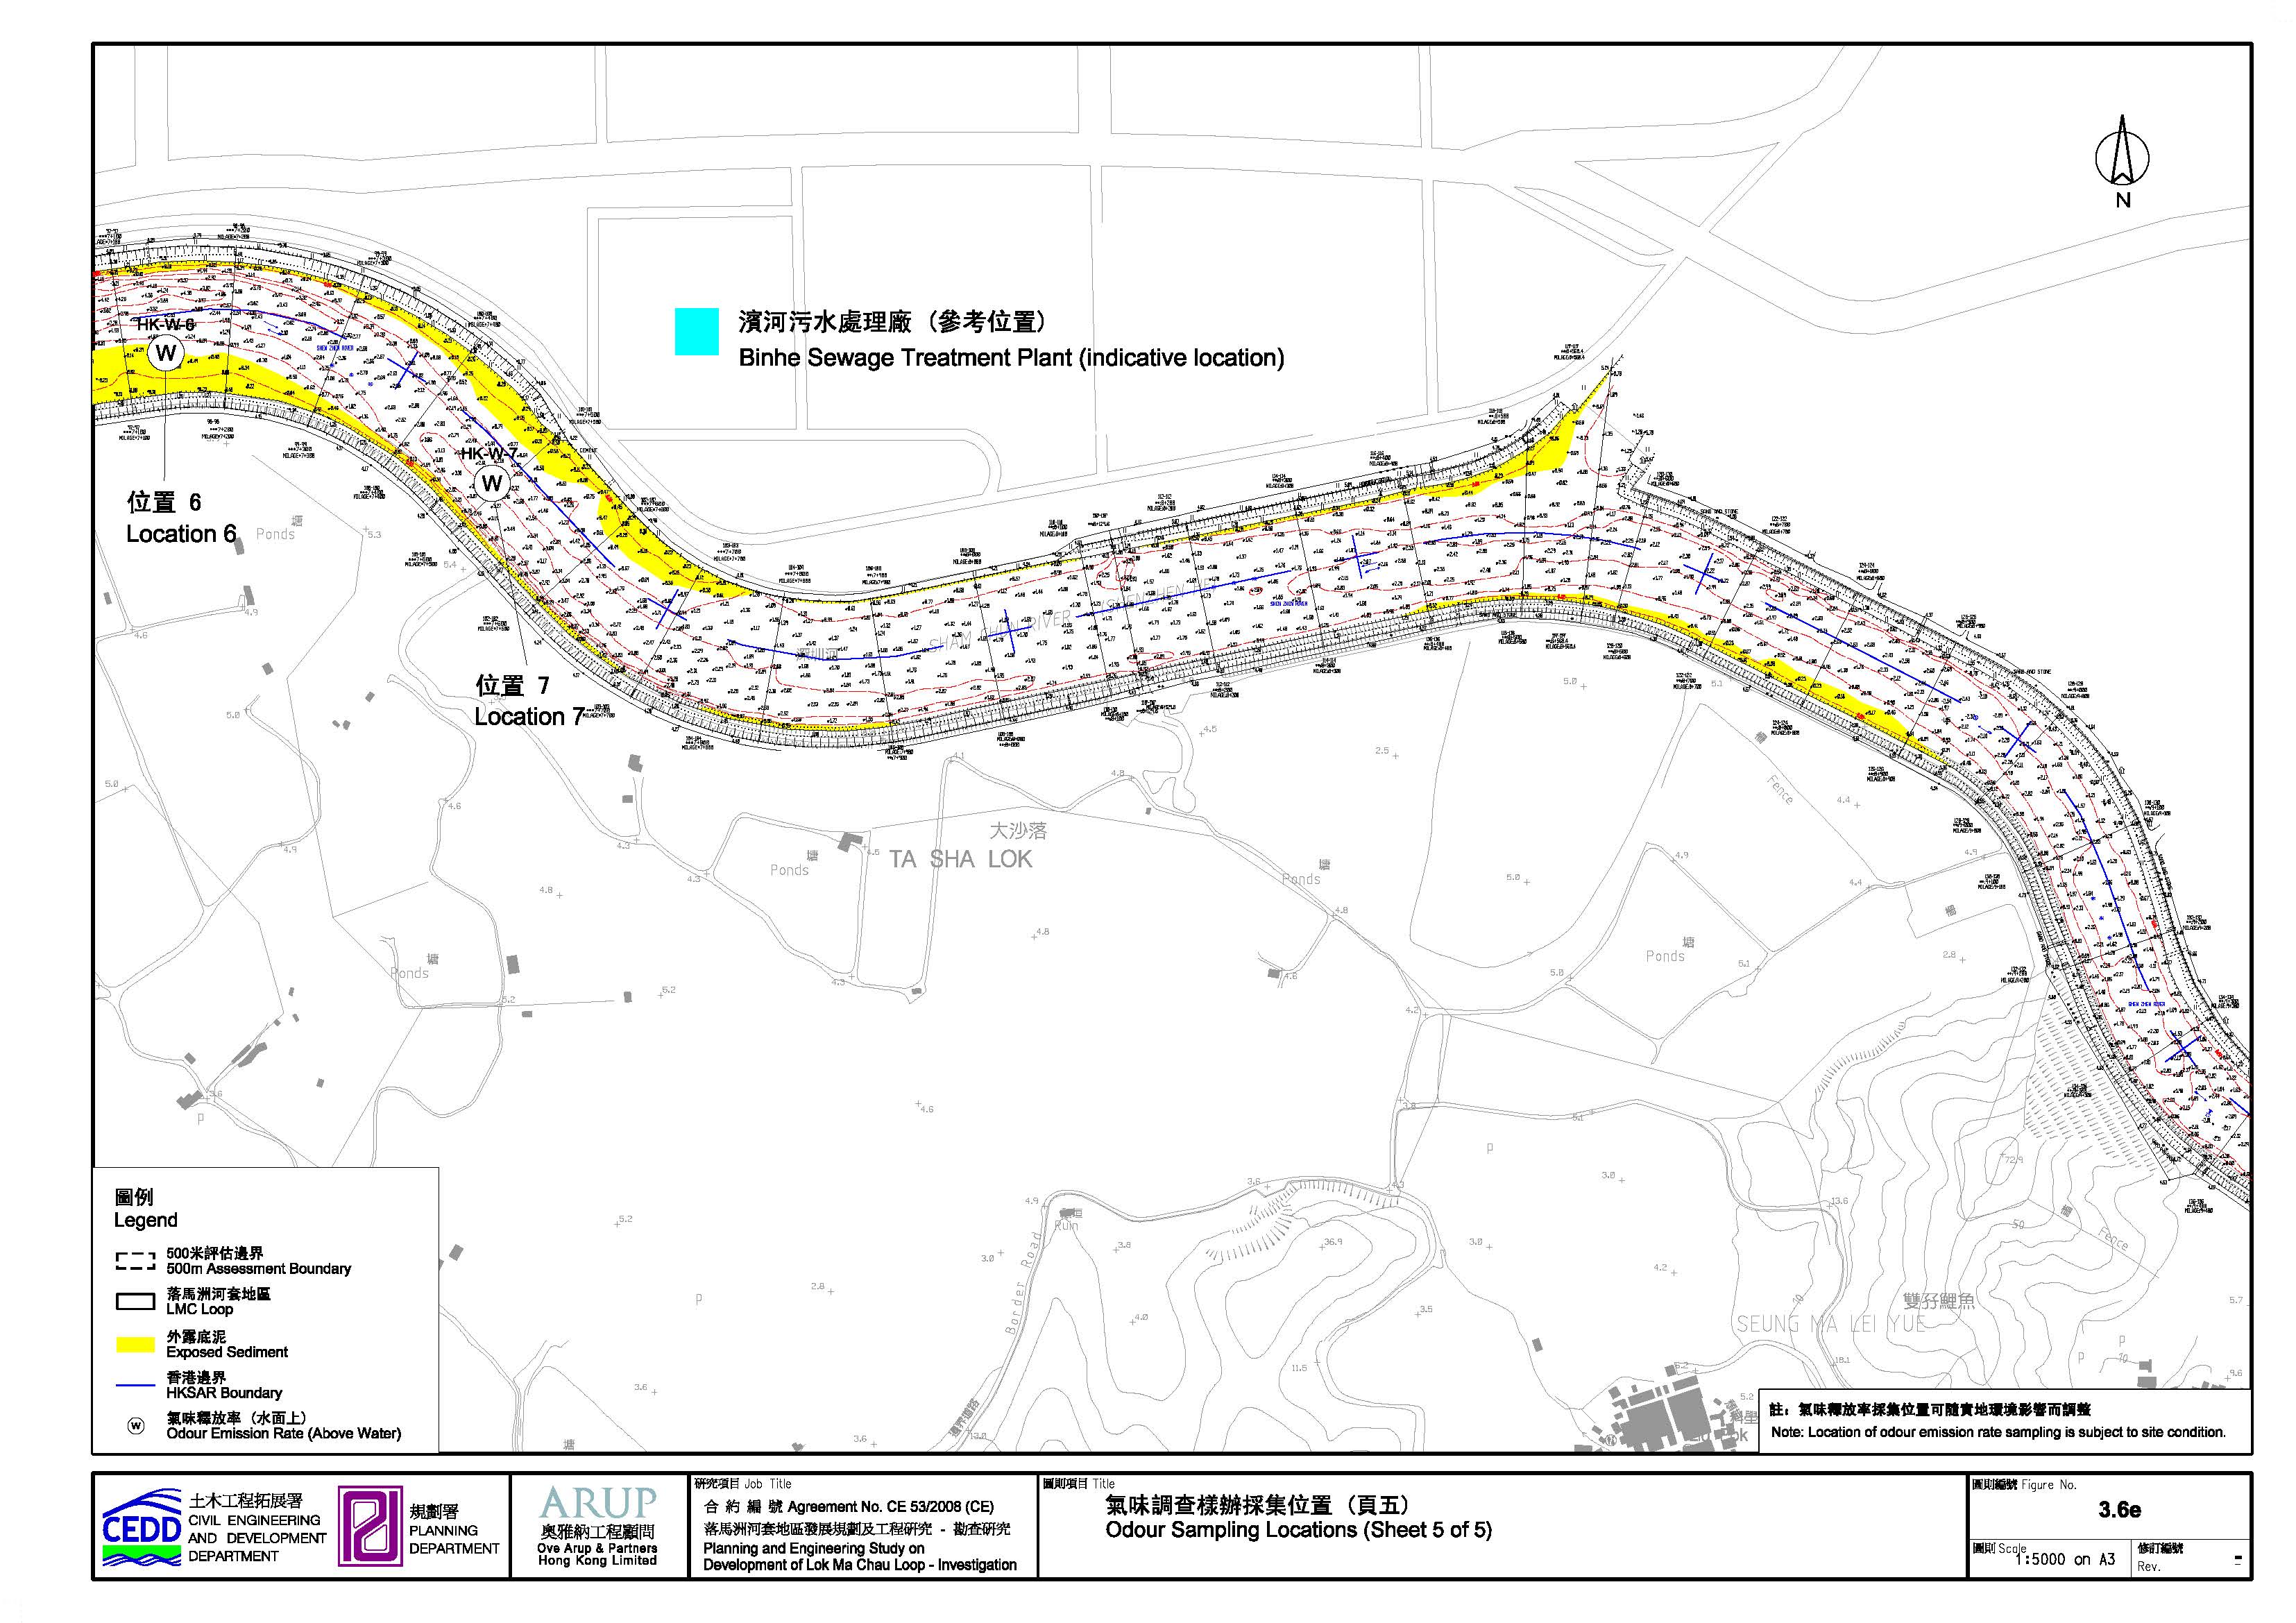
Figure 3.6e Odour Sampling Locations (Sheet 5 of 5)
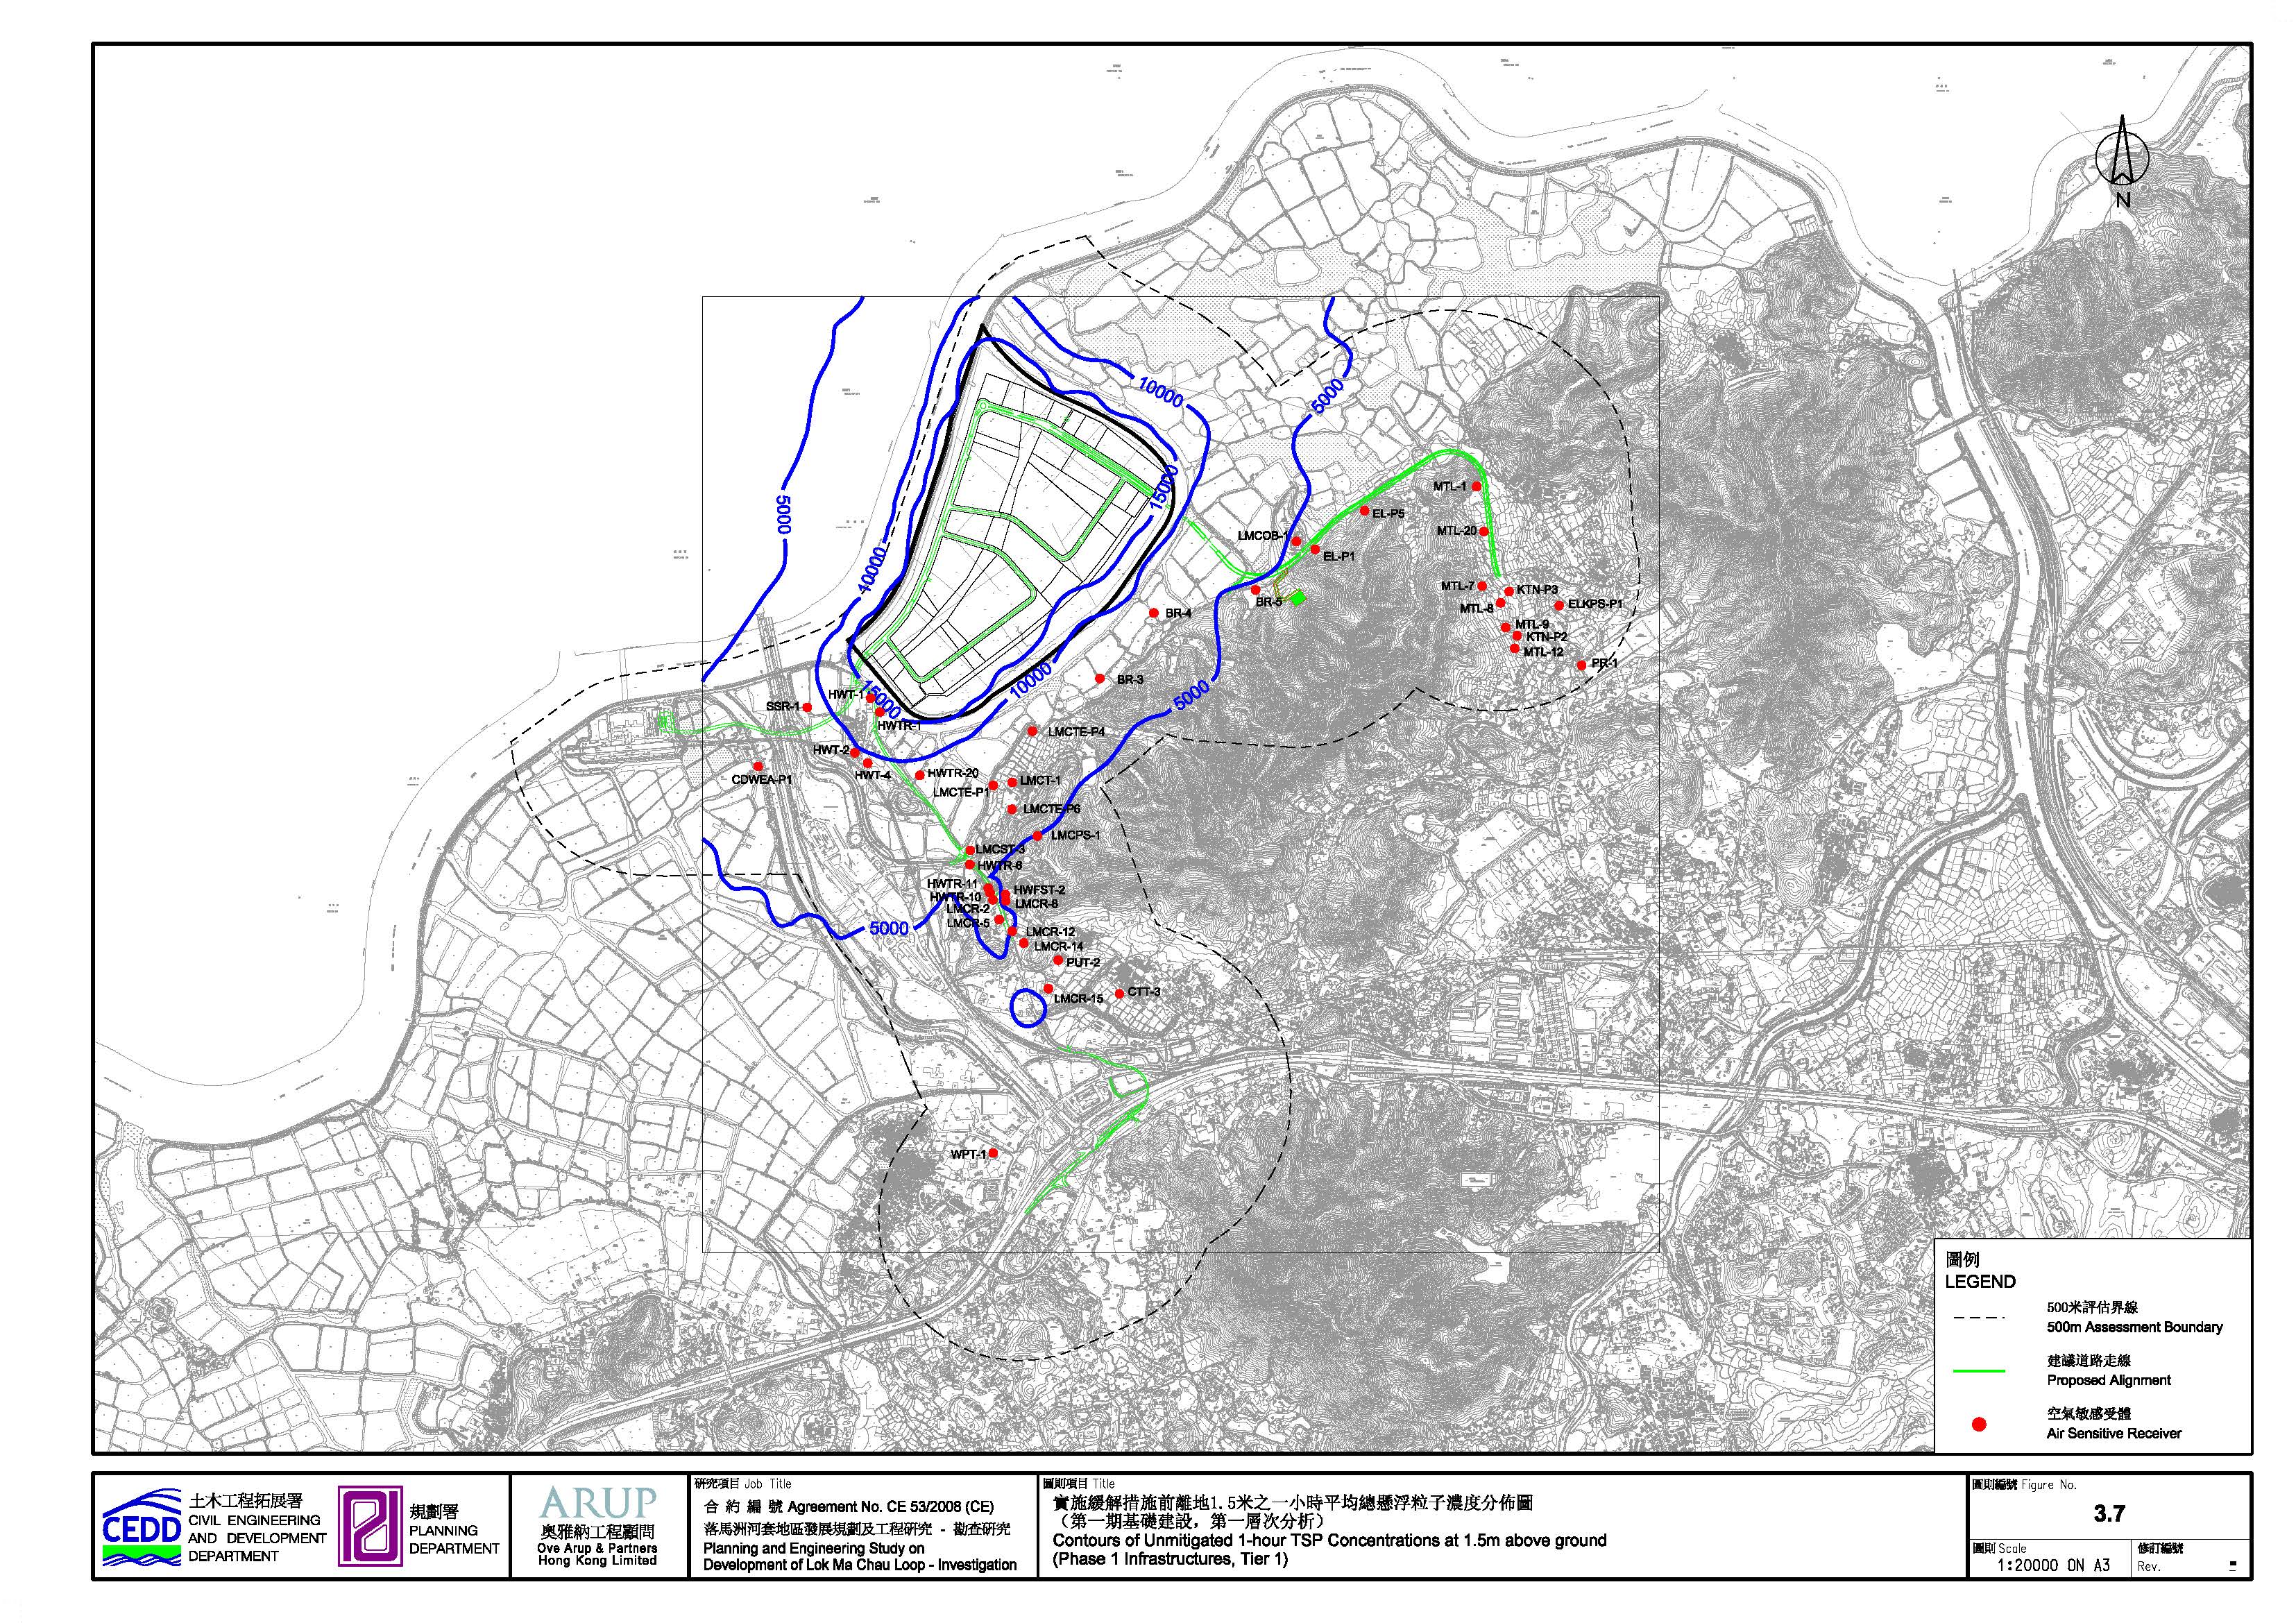
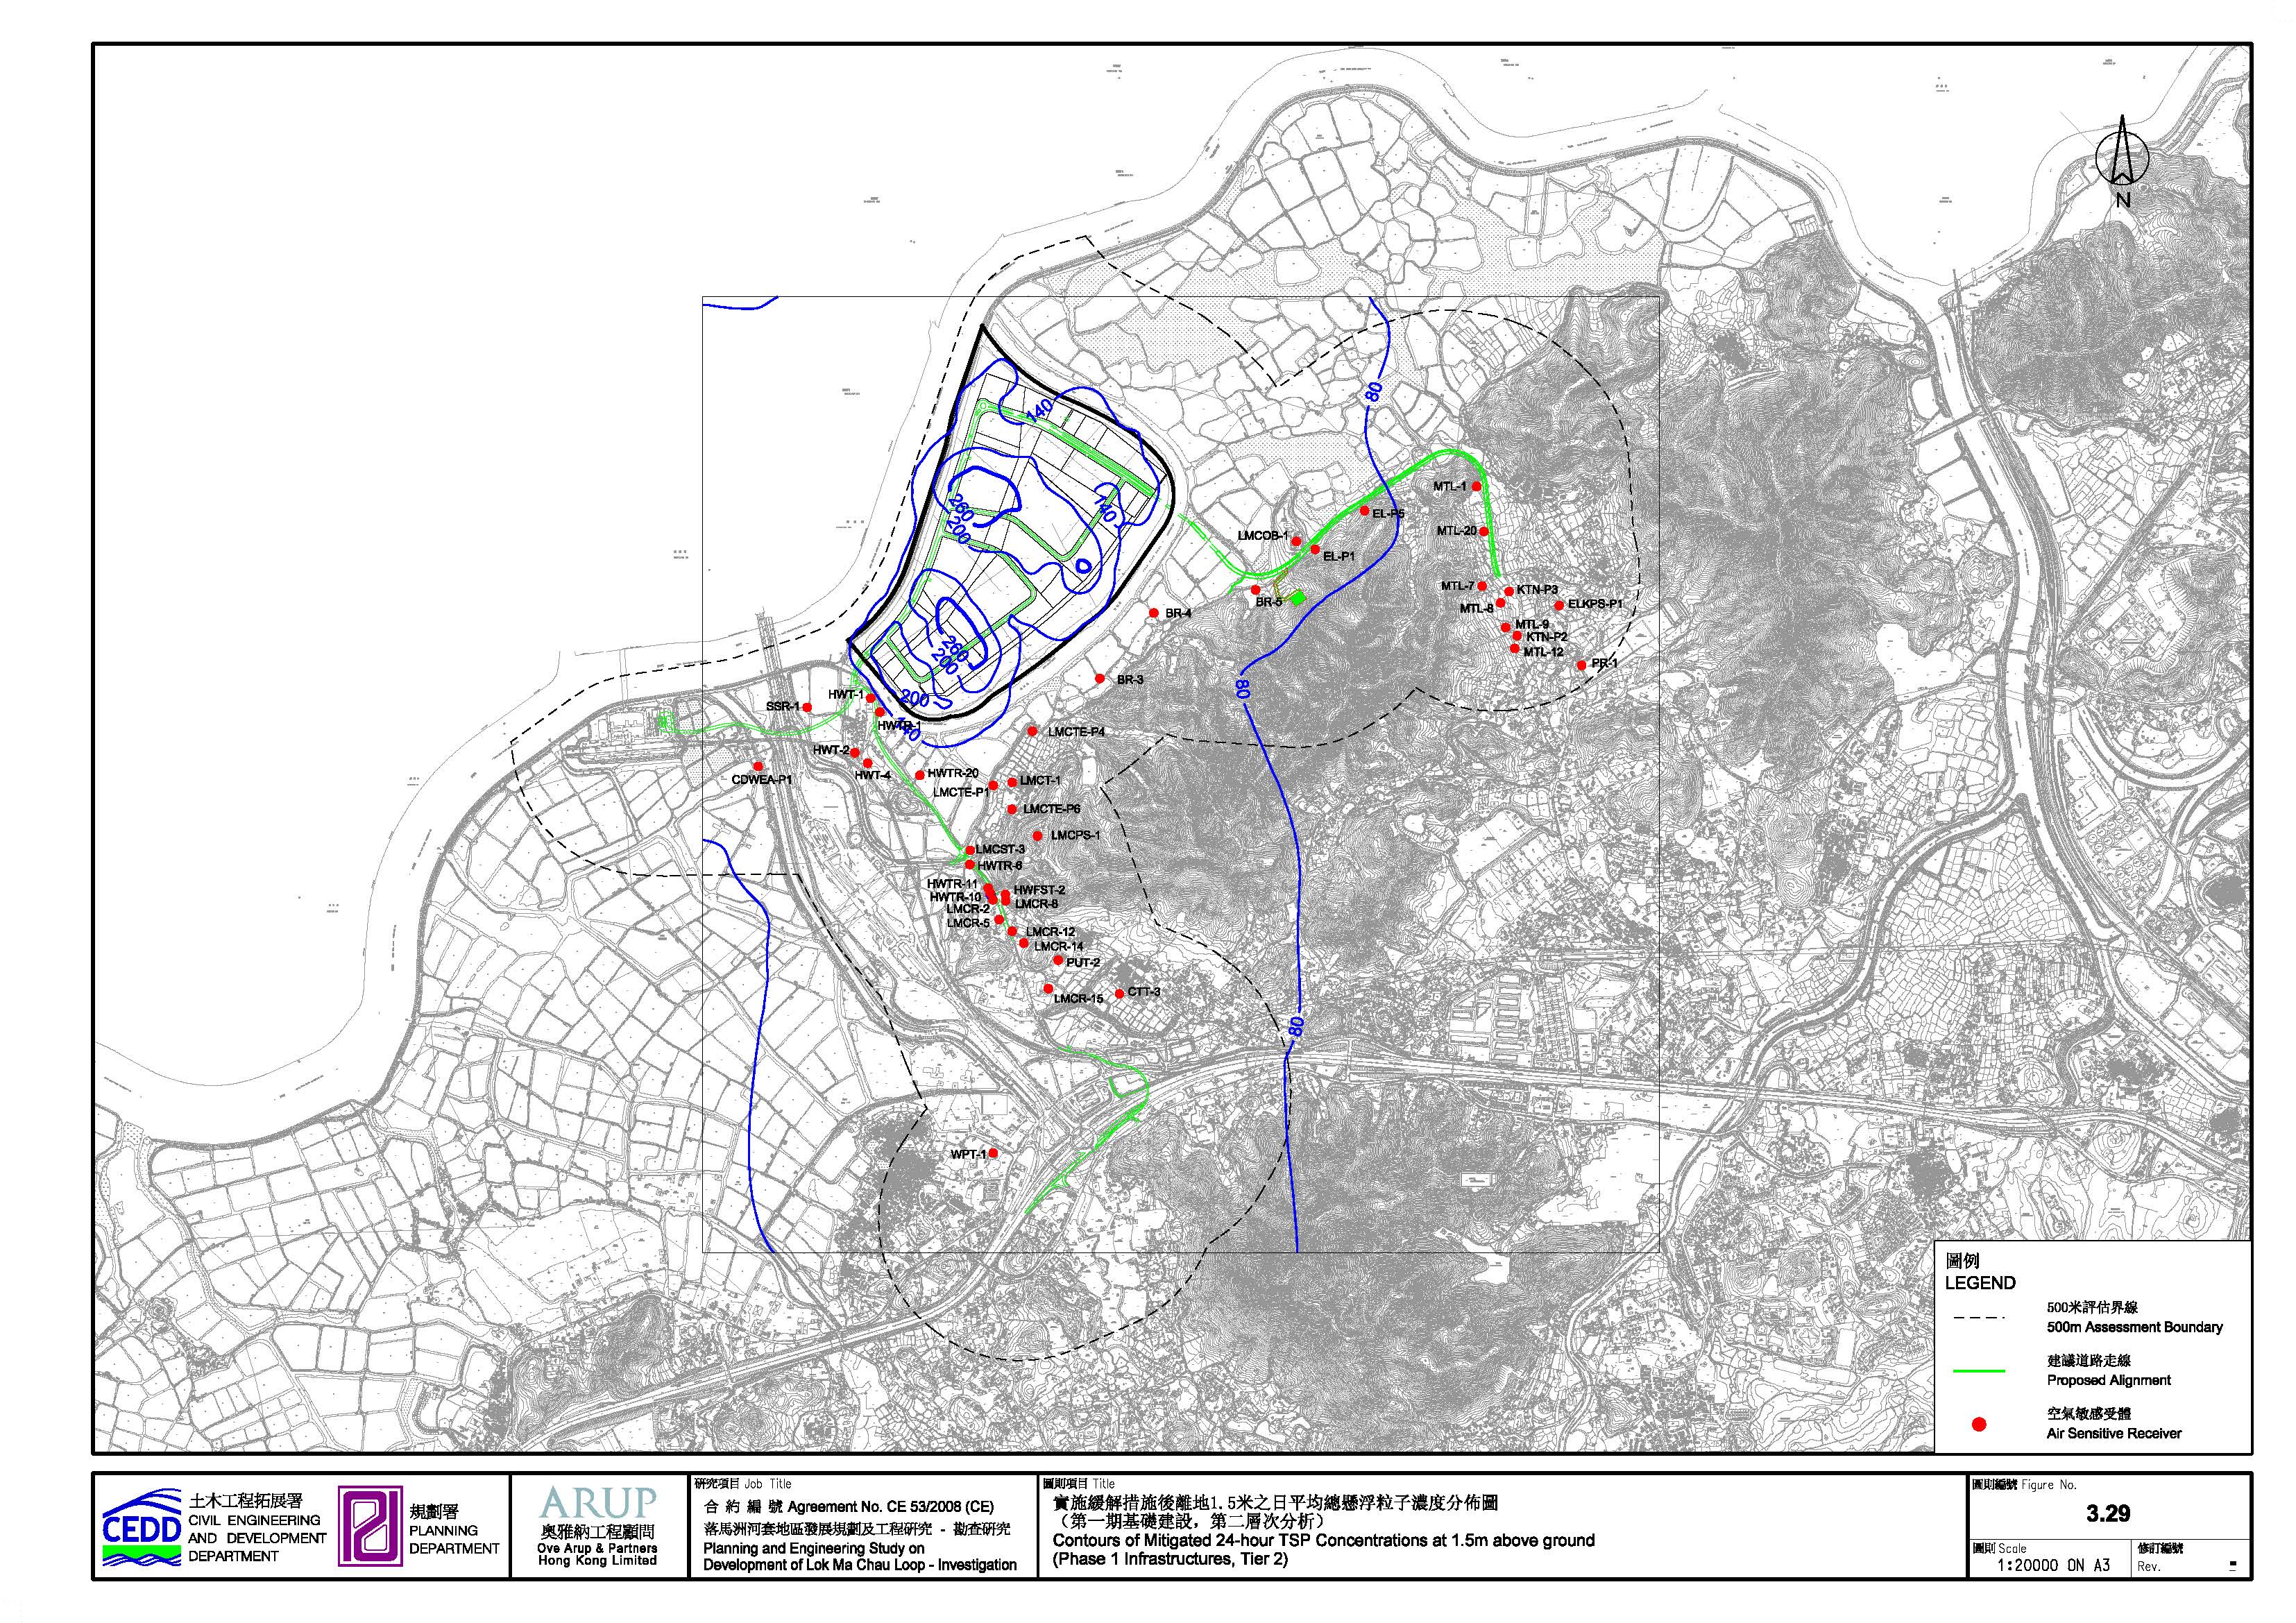
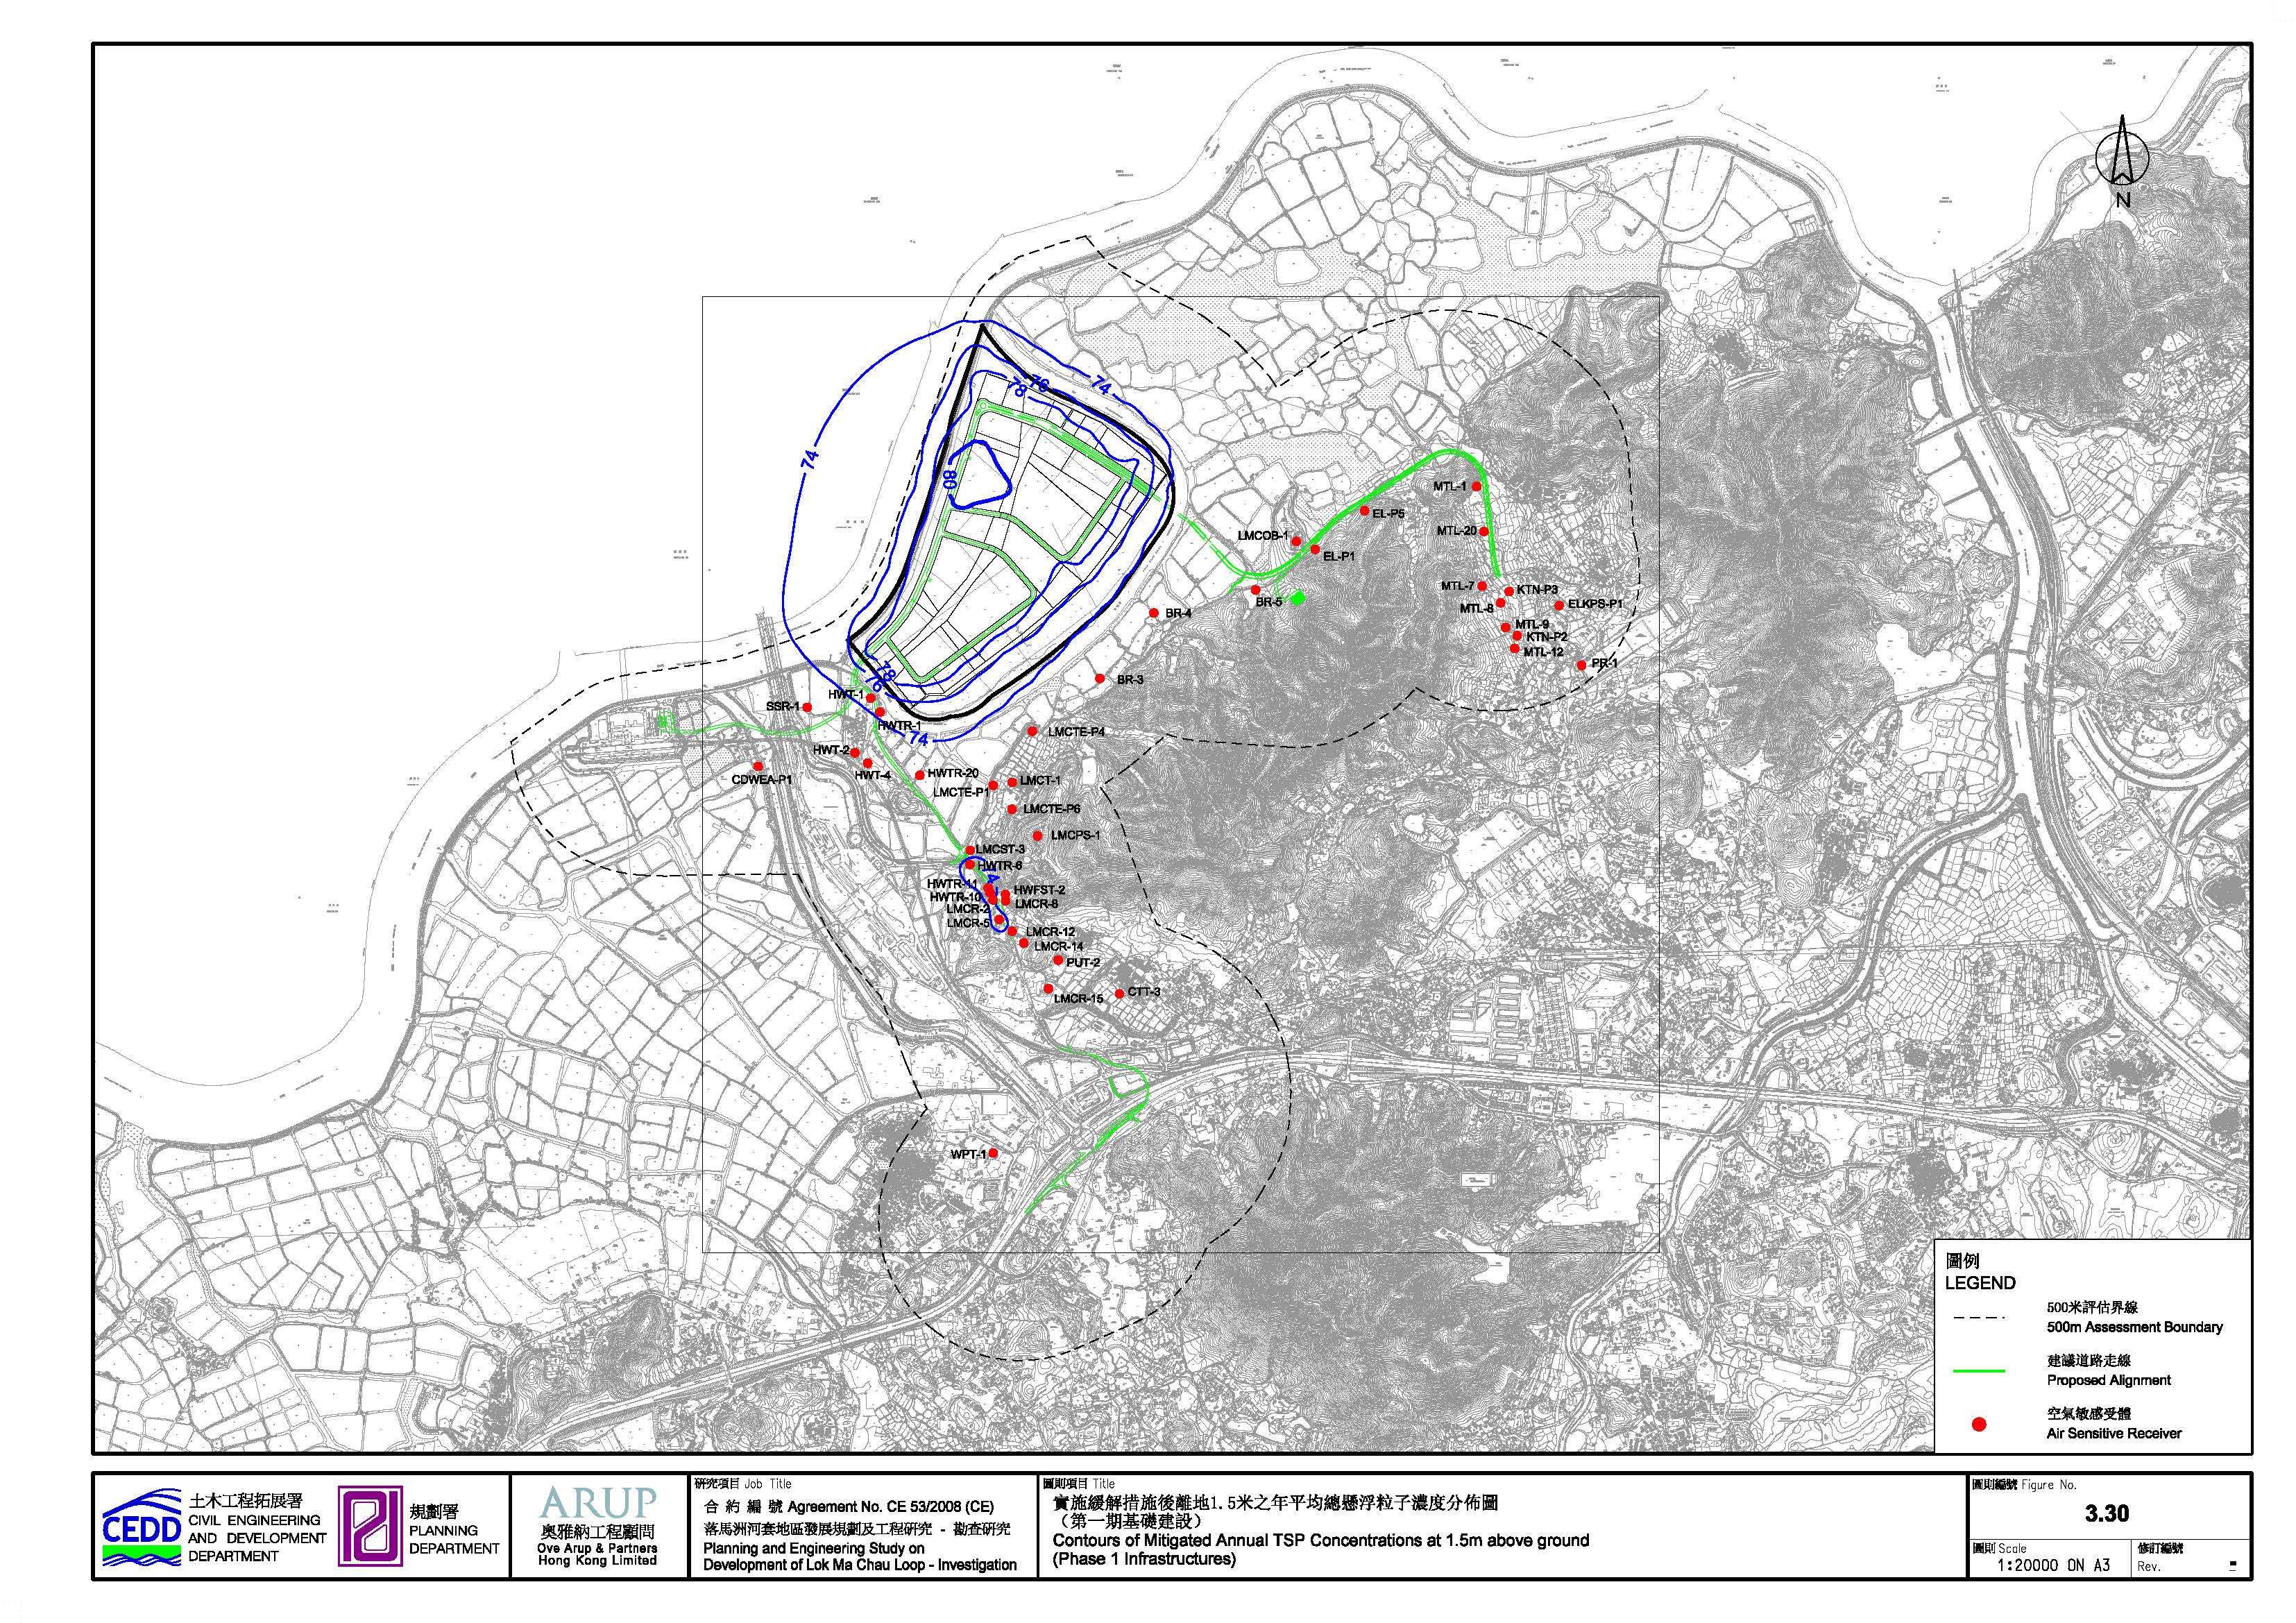
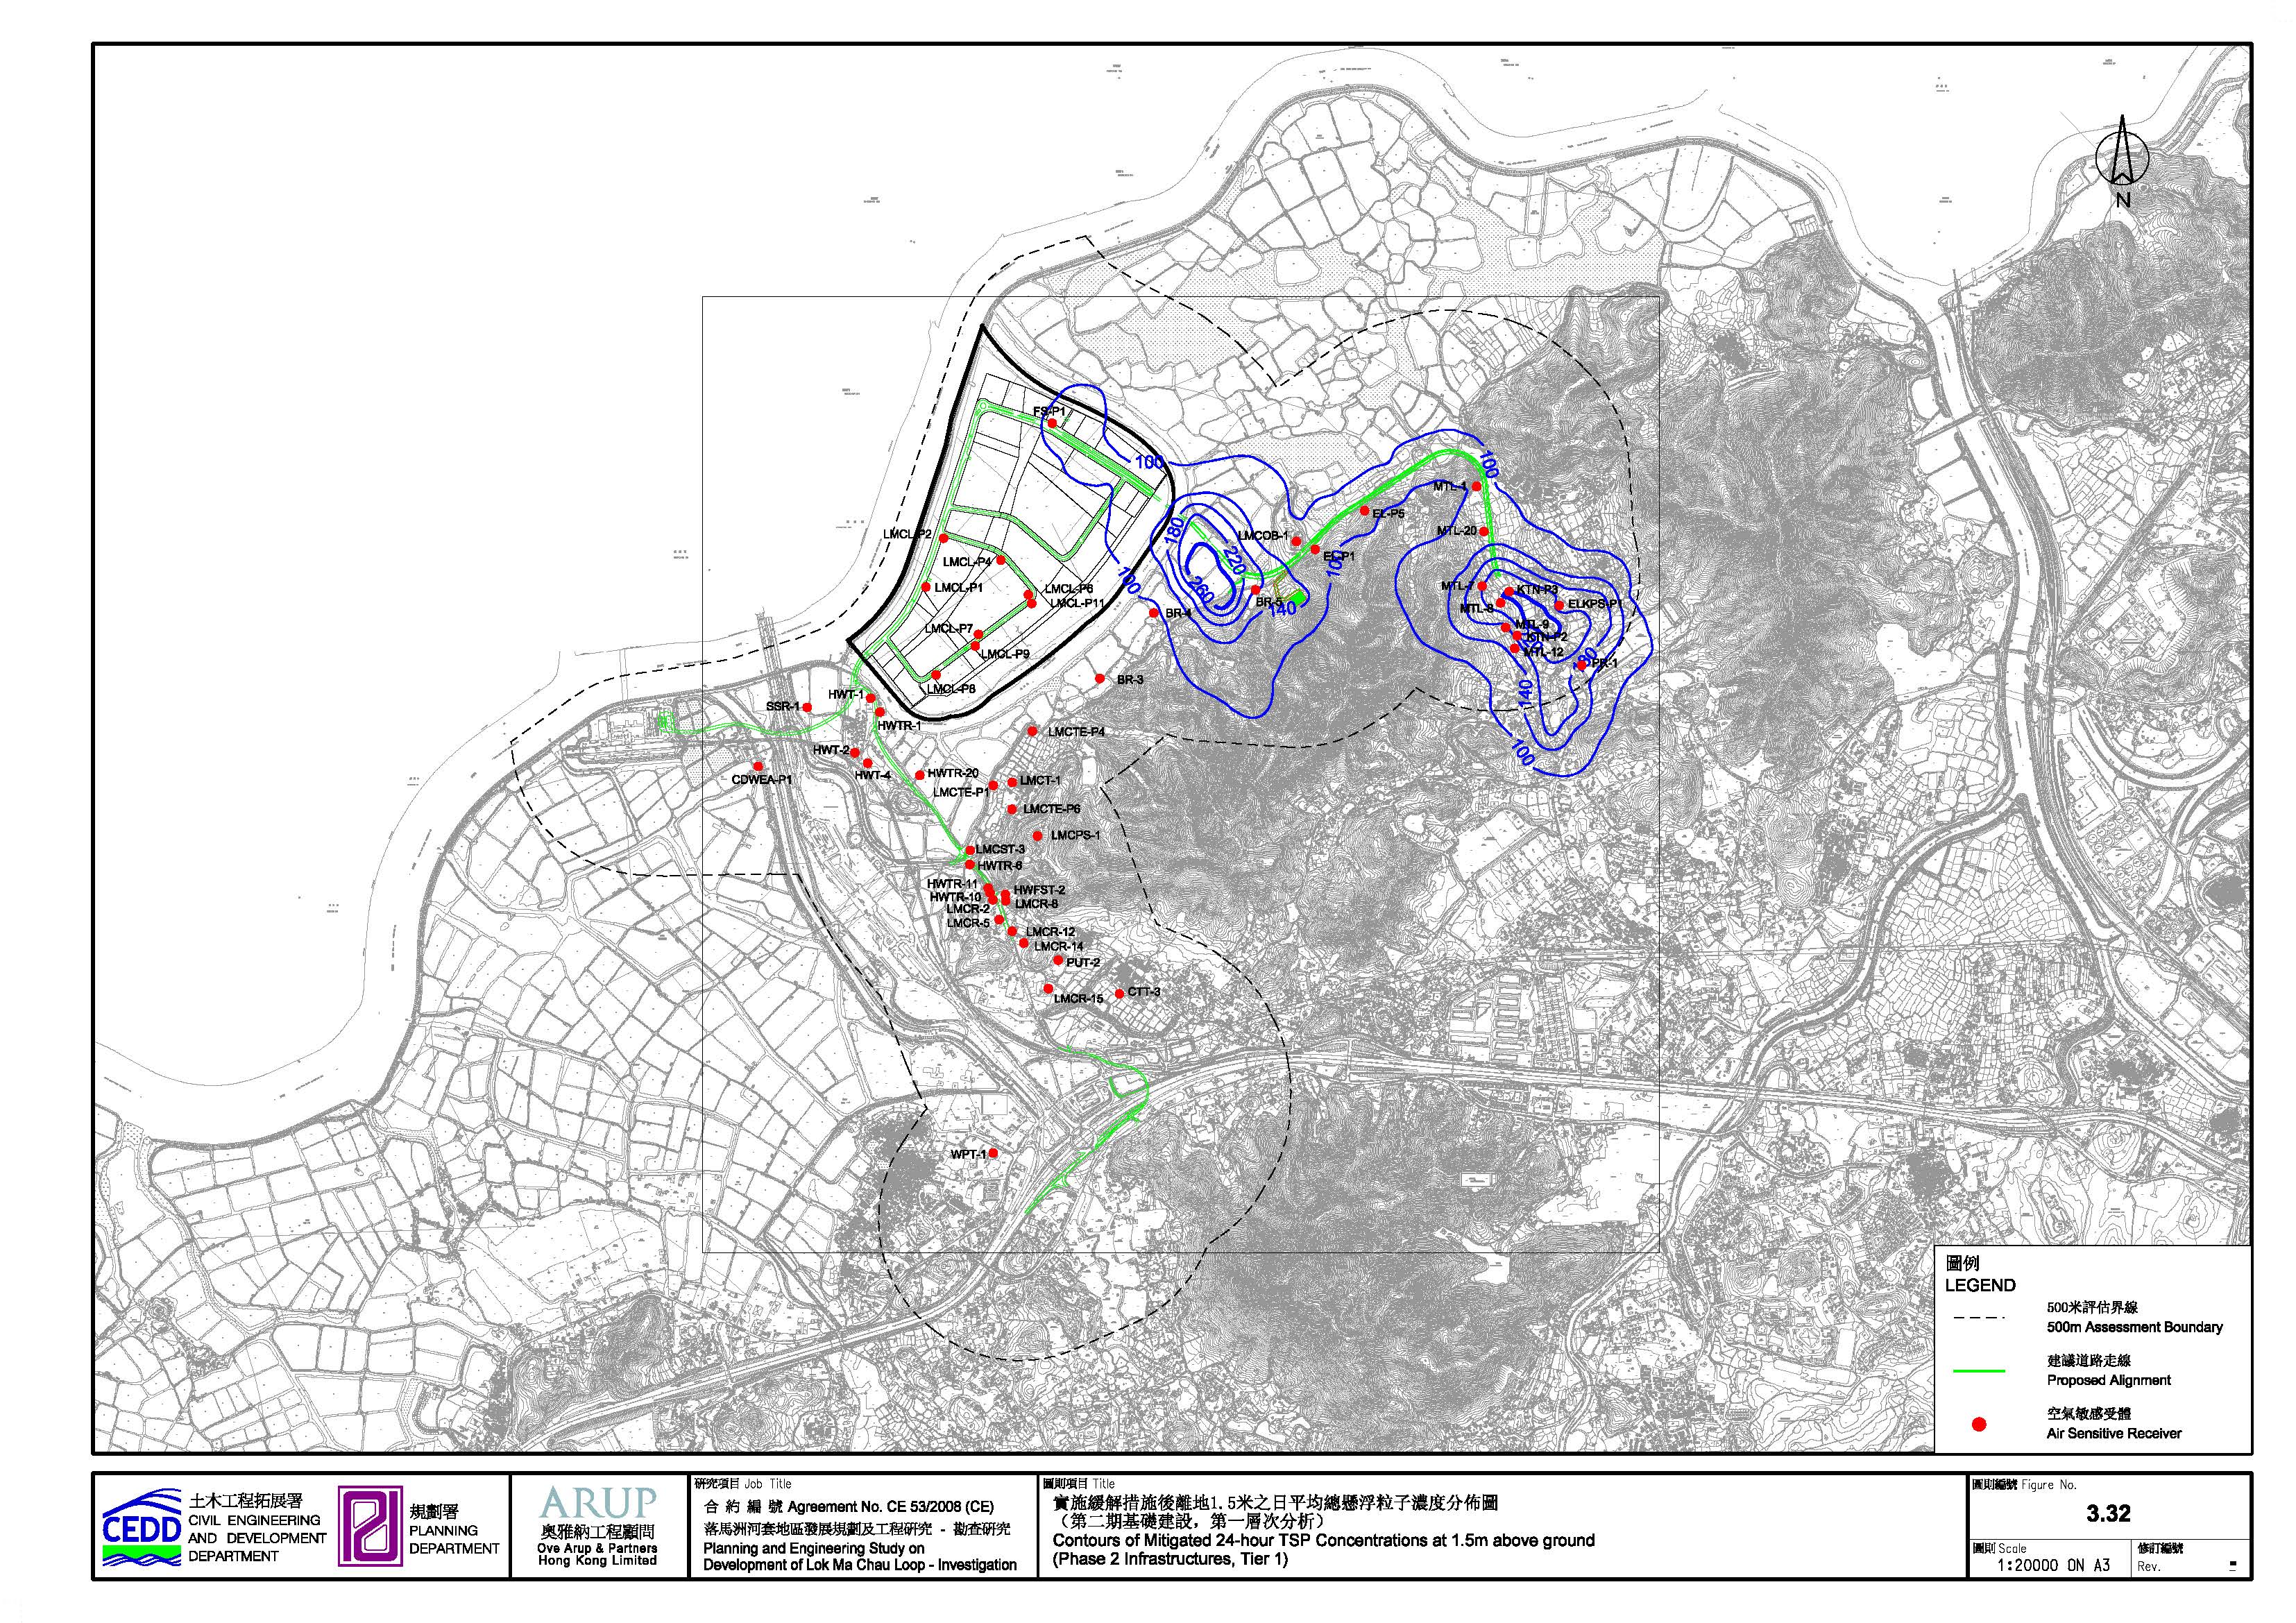
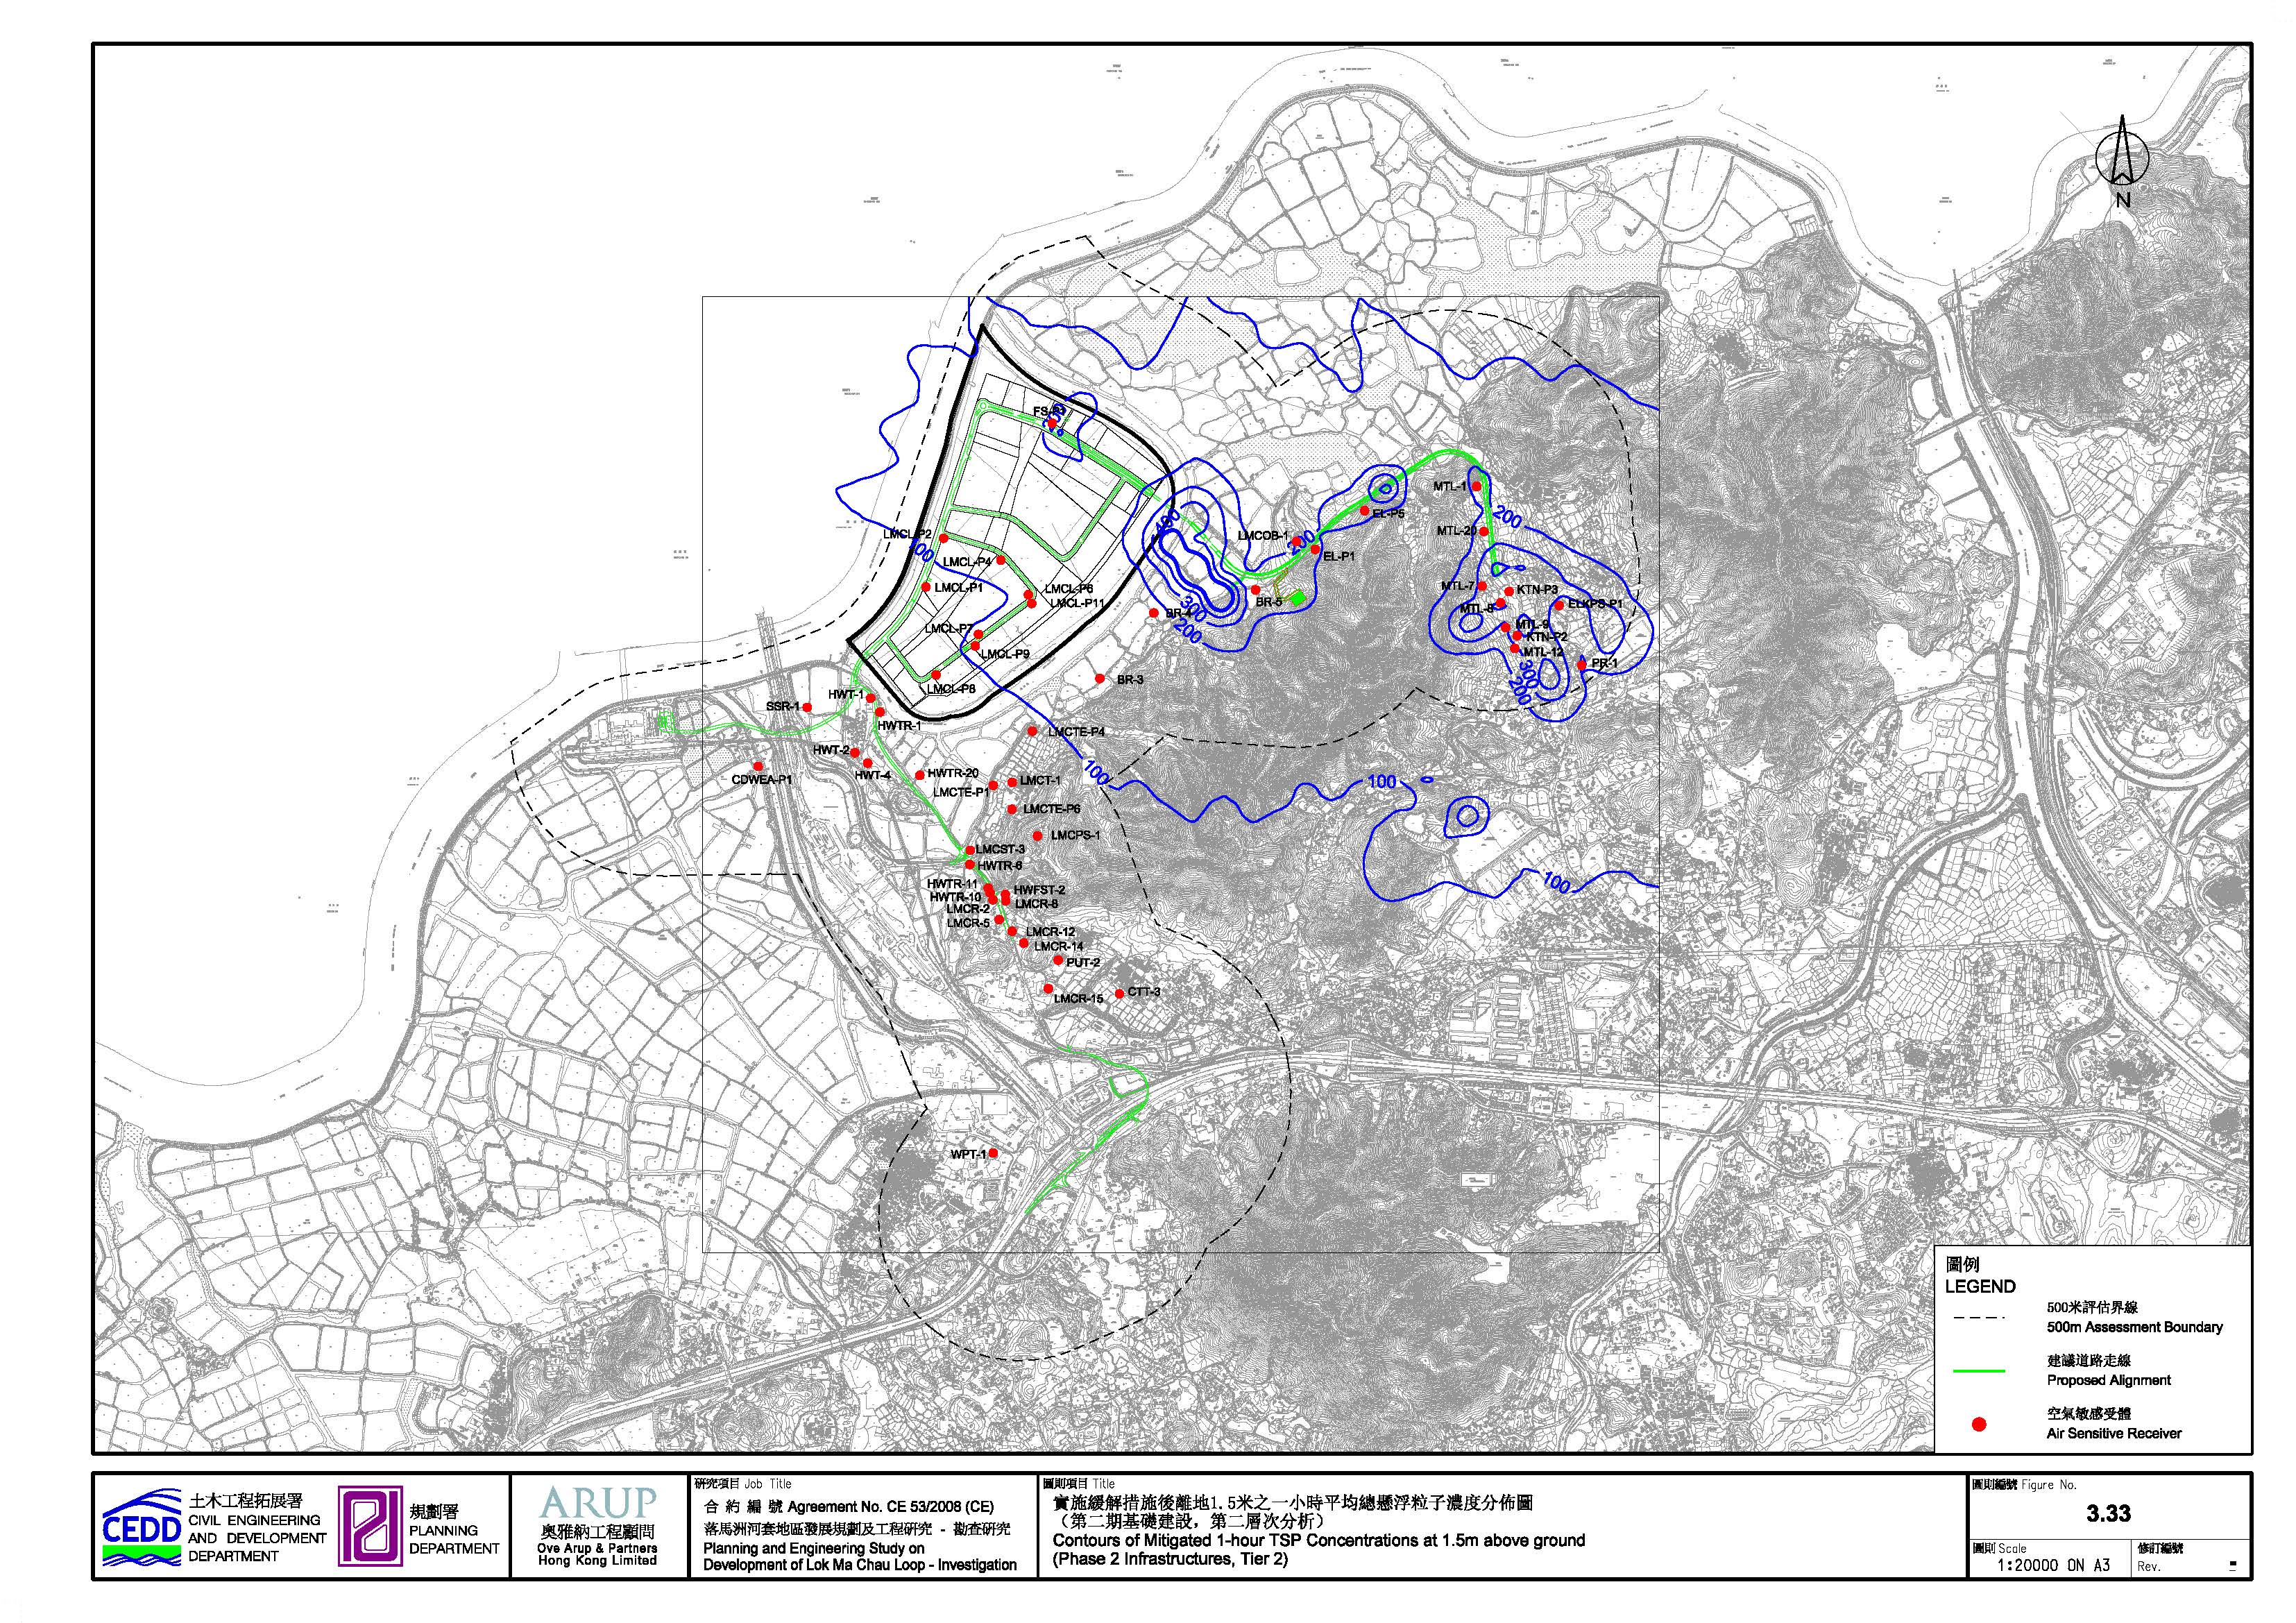
Figure 3.13 Contours of 1-hour NO2 Concentrations at 1.5m above ground in Year 2020
Figure 3.14 Contours of 24-hour NO2 Concentrations at 1.5m above ground in Year 2020
Figure 3.15 Contours of Annual NO2 Concentrations at 1.5m above ground in Year 2020
Figure 3.16 Contours of 1-hour NO2 Concentrations at 1.5m above ground in Year 2027
Figure 3.17 Contours of 24-hour NO2 Concentrations at 1.5m above ground in Year 2027
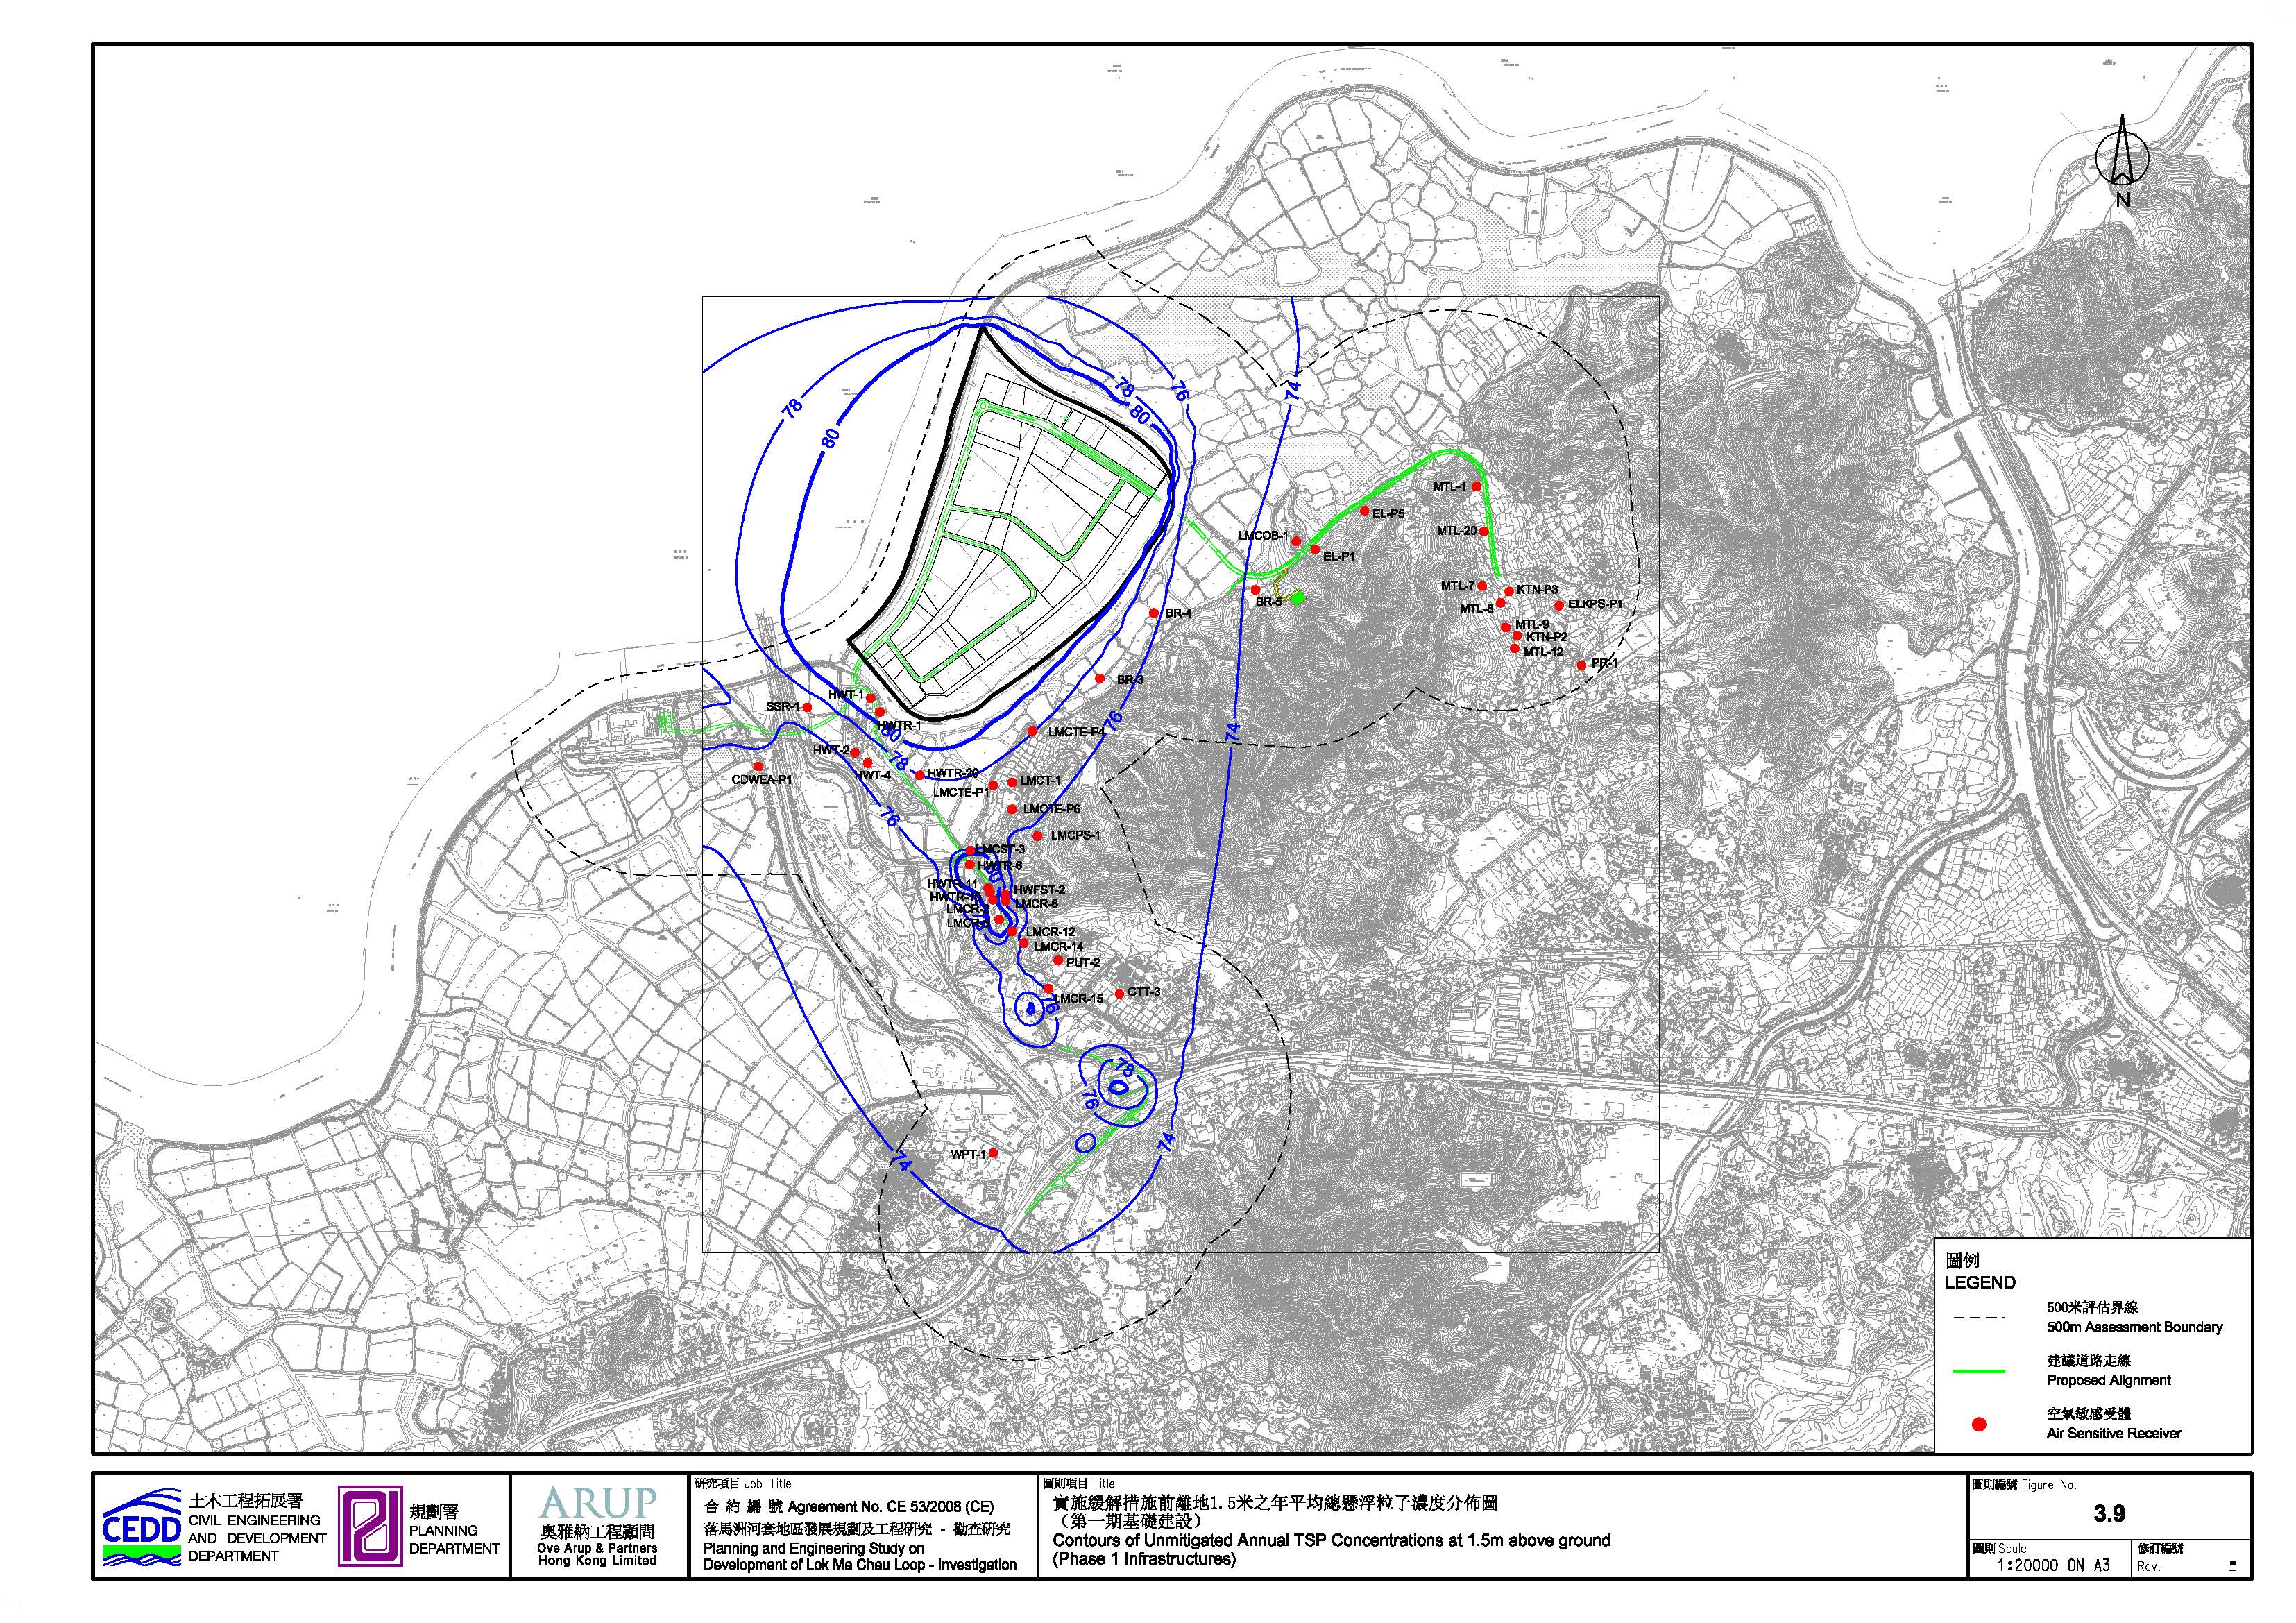
Figure 3.18 Contours of Annual NO2 Concentrations at 1.5m above ground in Year 2027
Figure 3.19 Contours of 24-hour RSP Concentrations at 1.5m above ground in Year 2020
Figure 3.20 Contours of Annual RSP Concentrations at 1.5m above ground in Year 2020
Figure 3.21 Contours of 24-hour RSP Concentrations at 1.5m above ground in Year 2027
Figure 3.22 Contours of Annual RSP Concentrations at 1.5m above ground in Year 2027
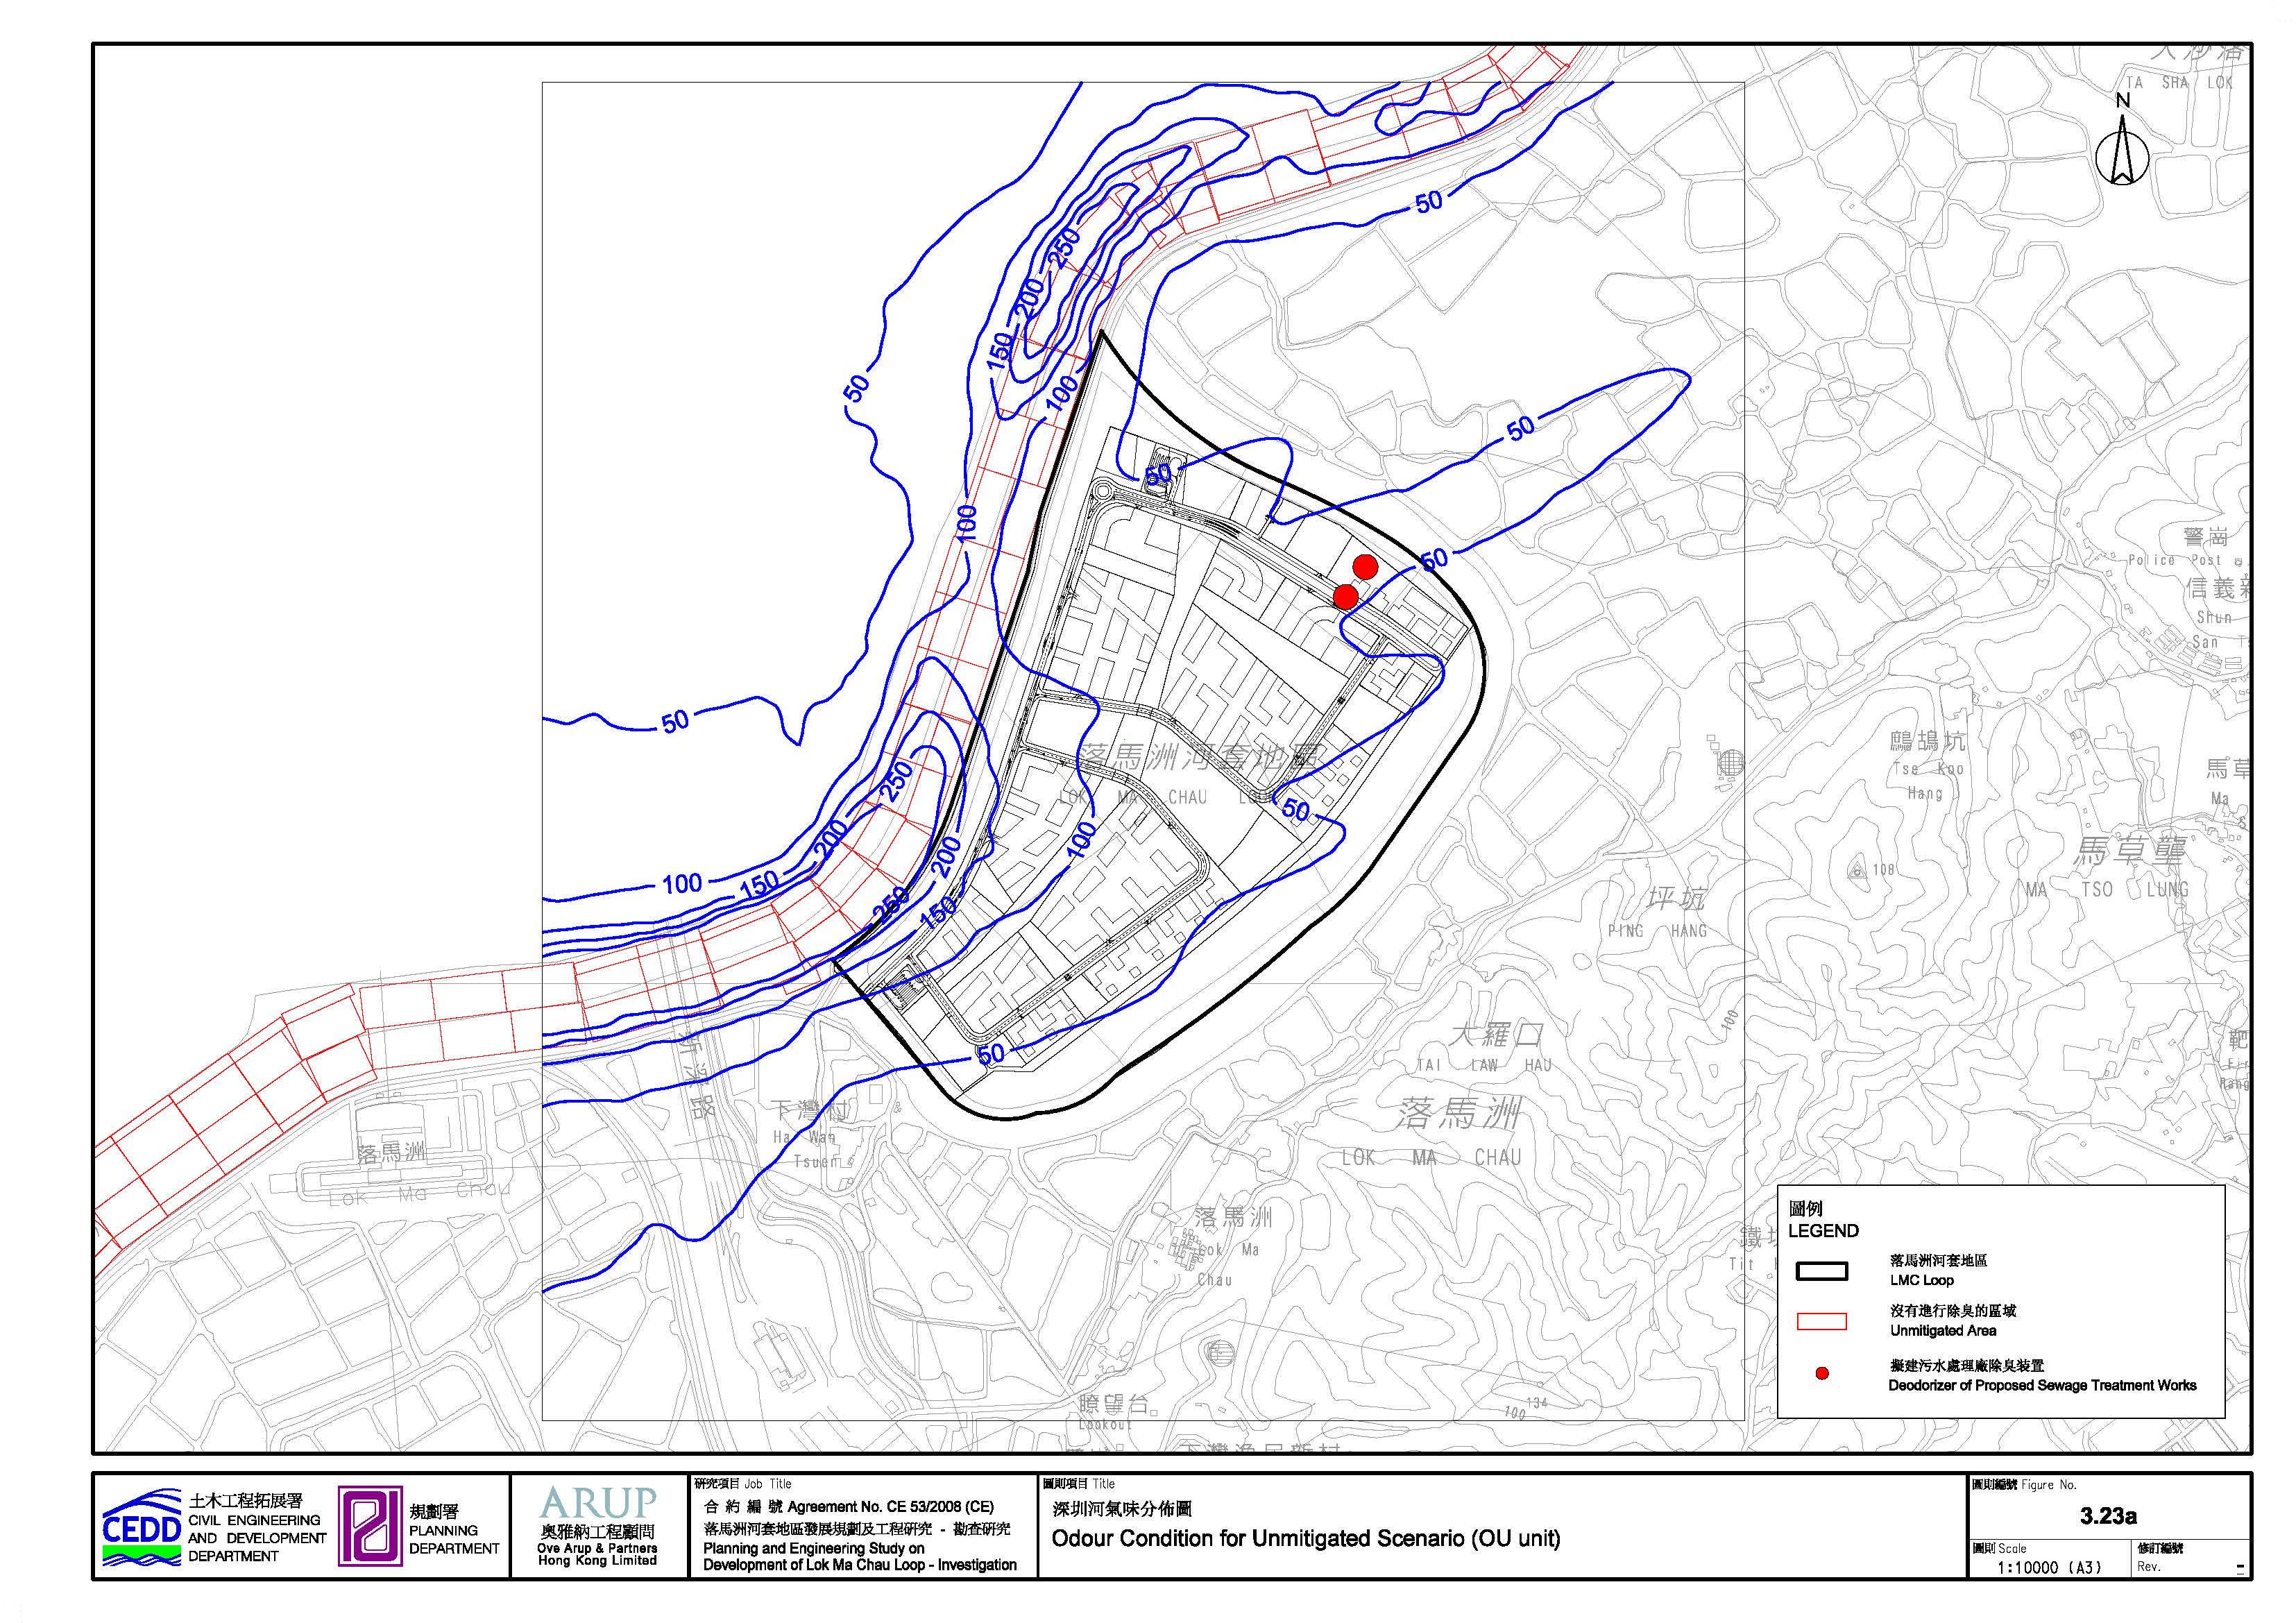
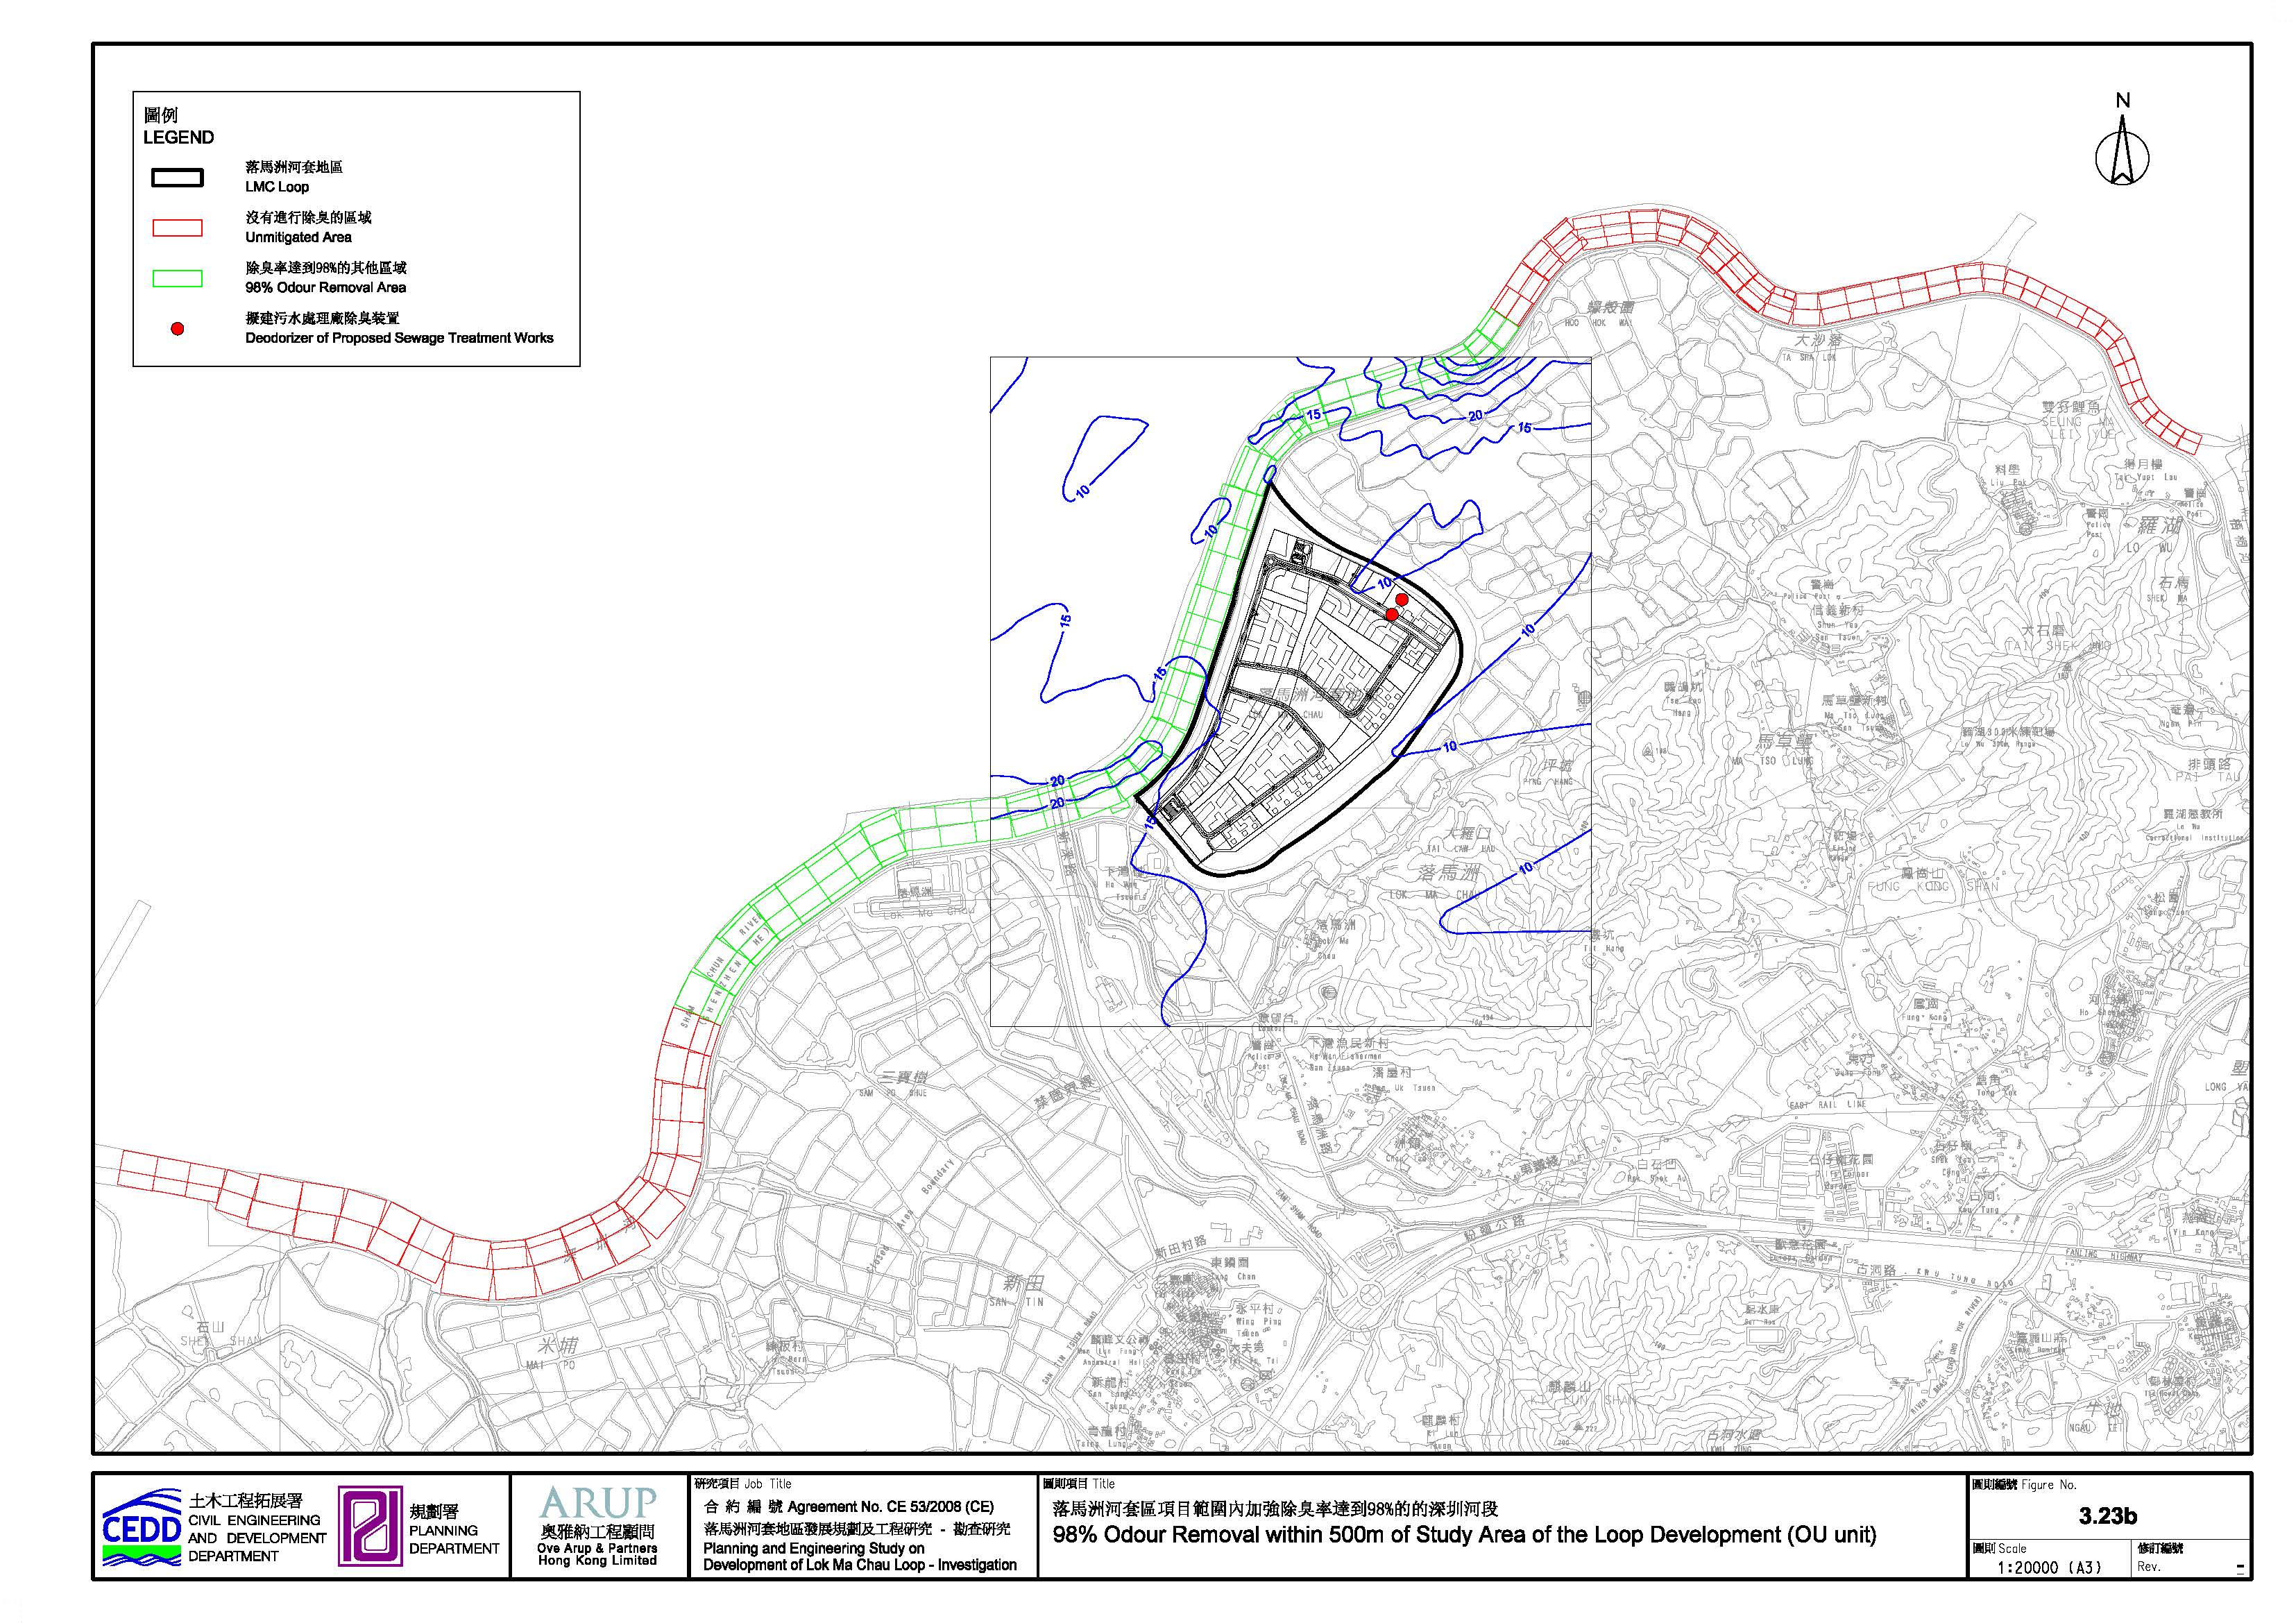
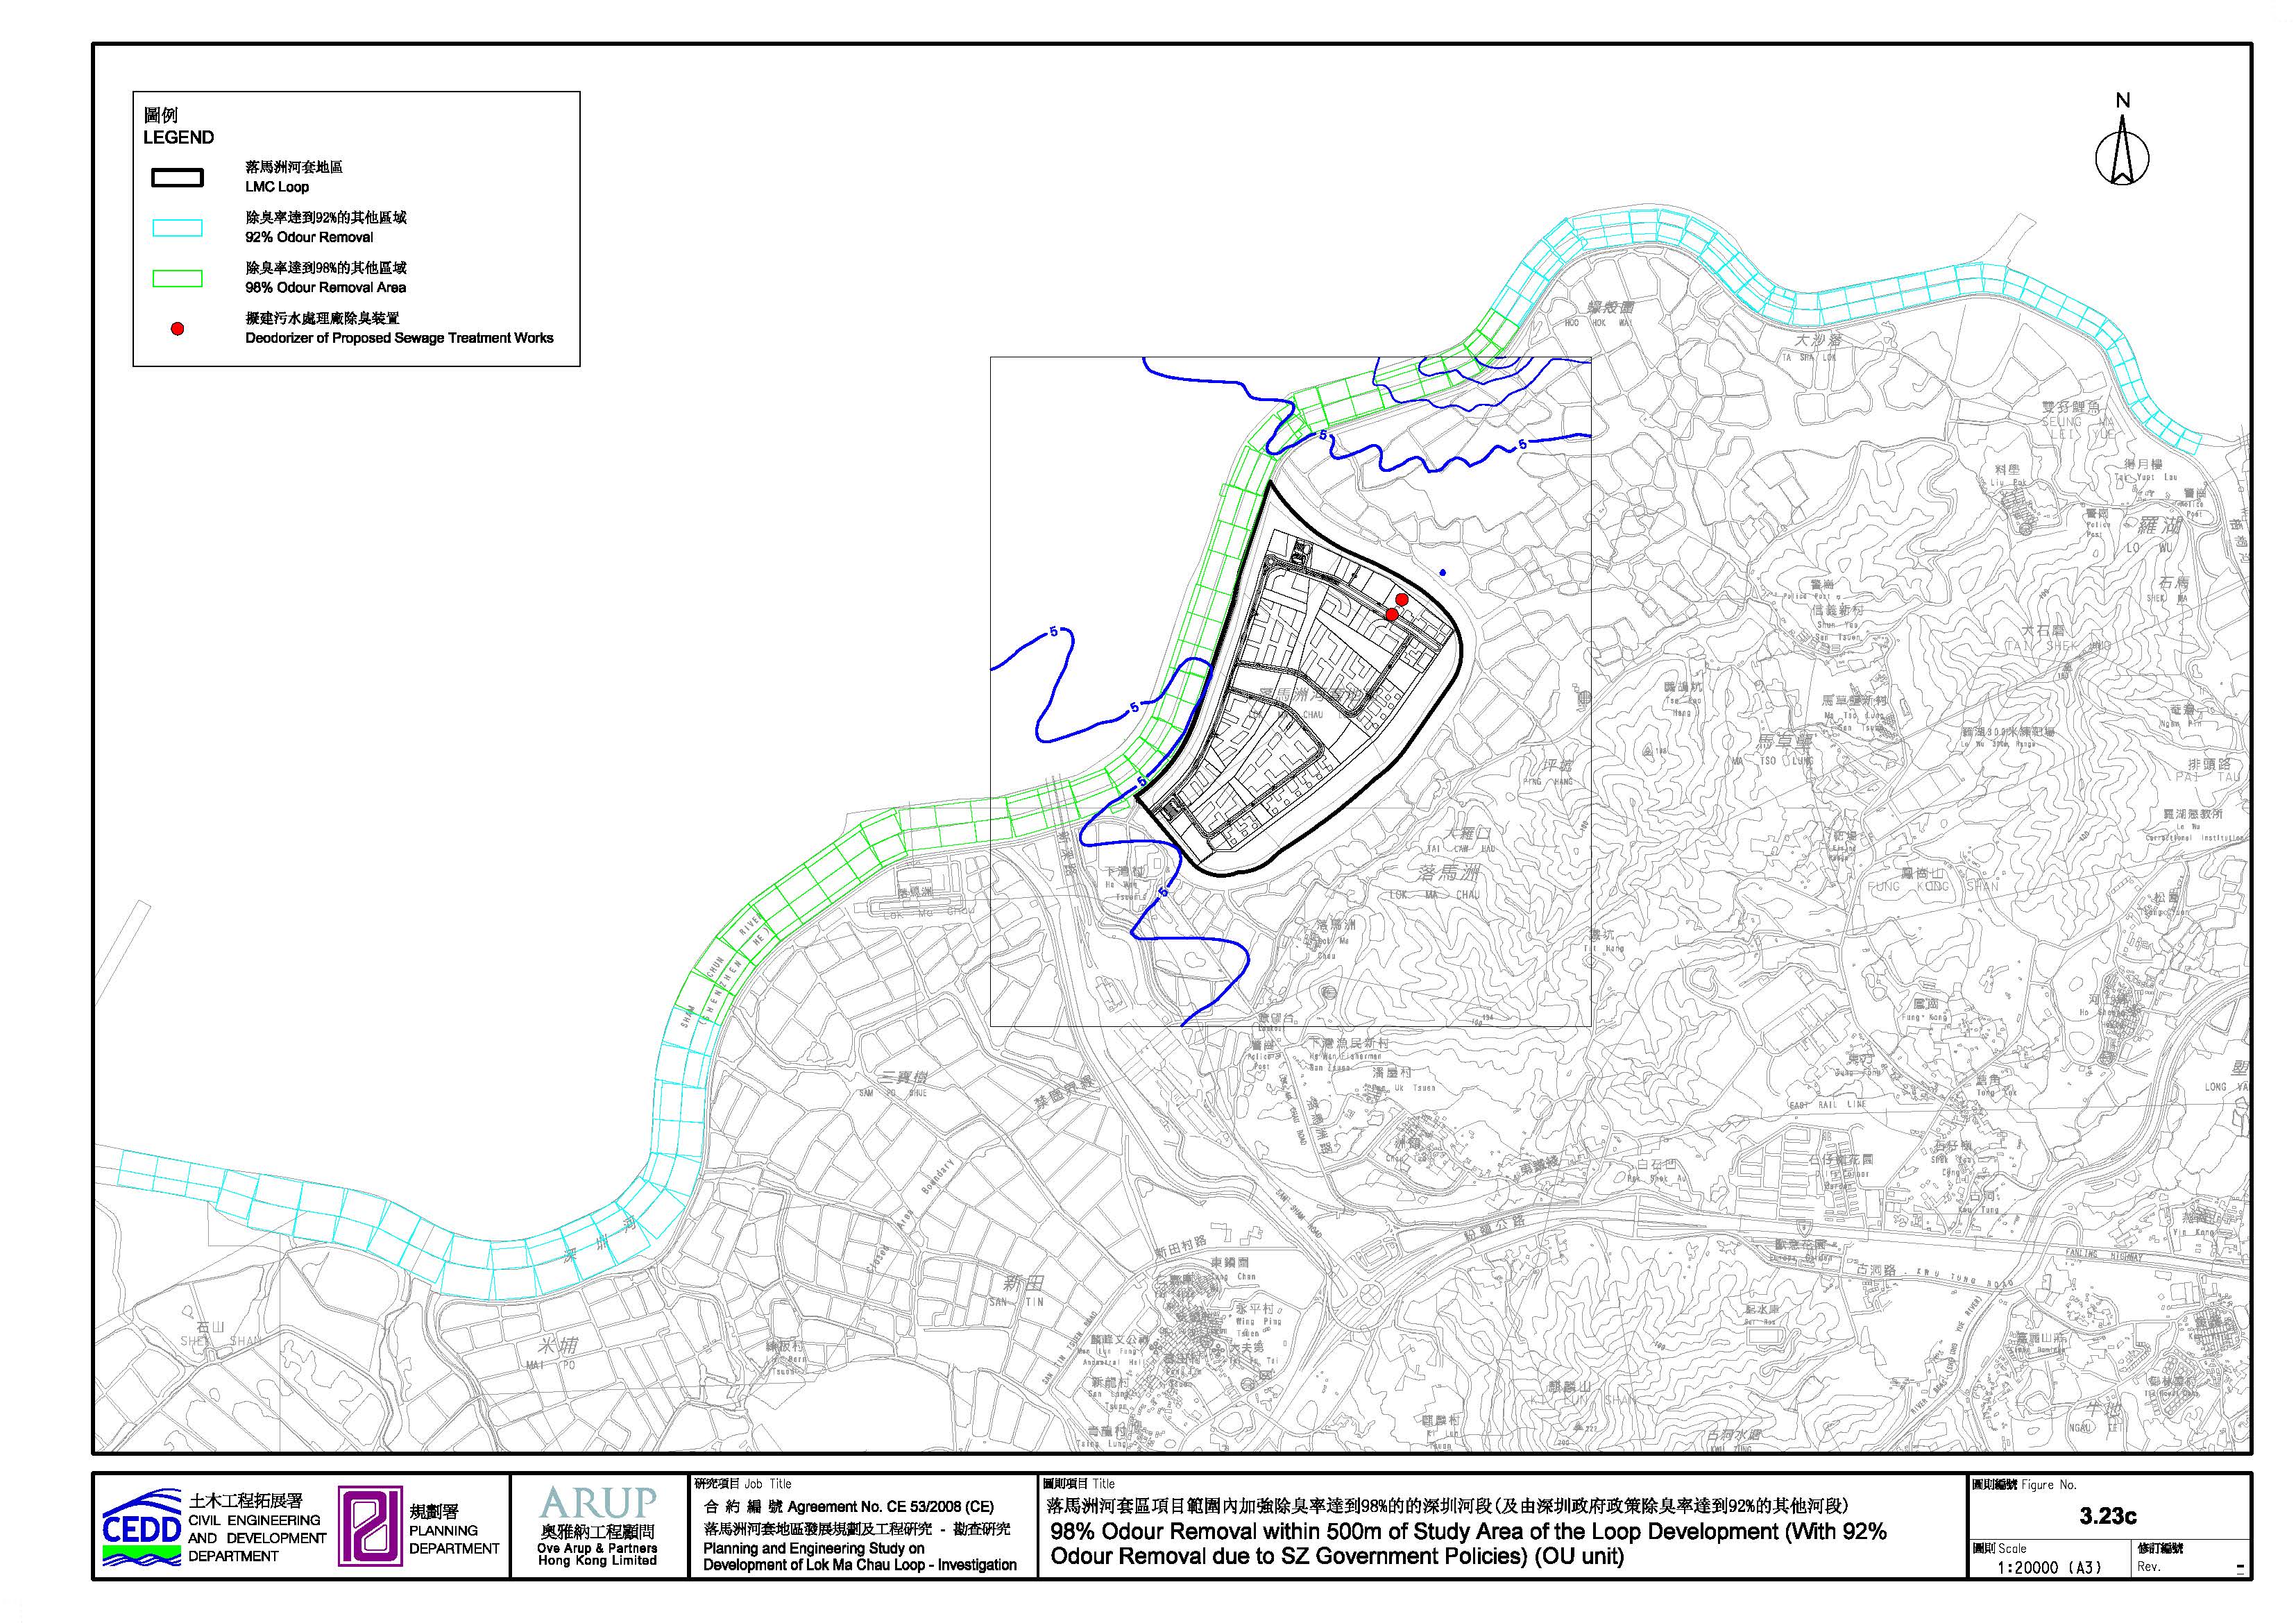
Figure 3.23a Odour Condition for Unmitigated Scenario
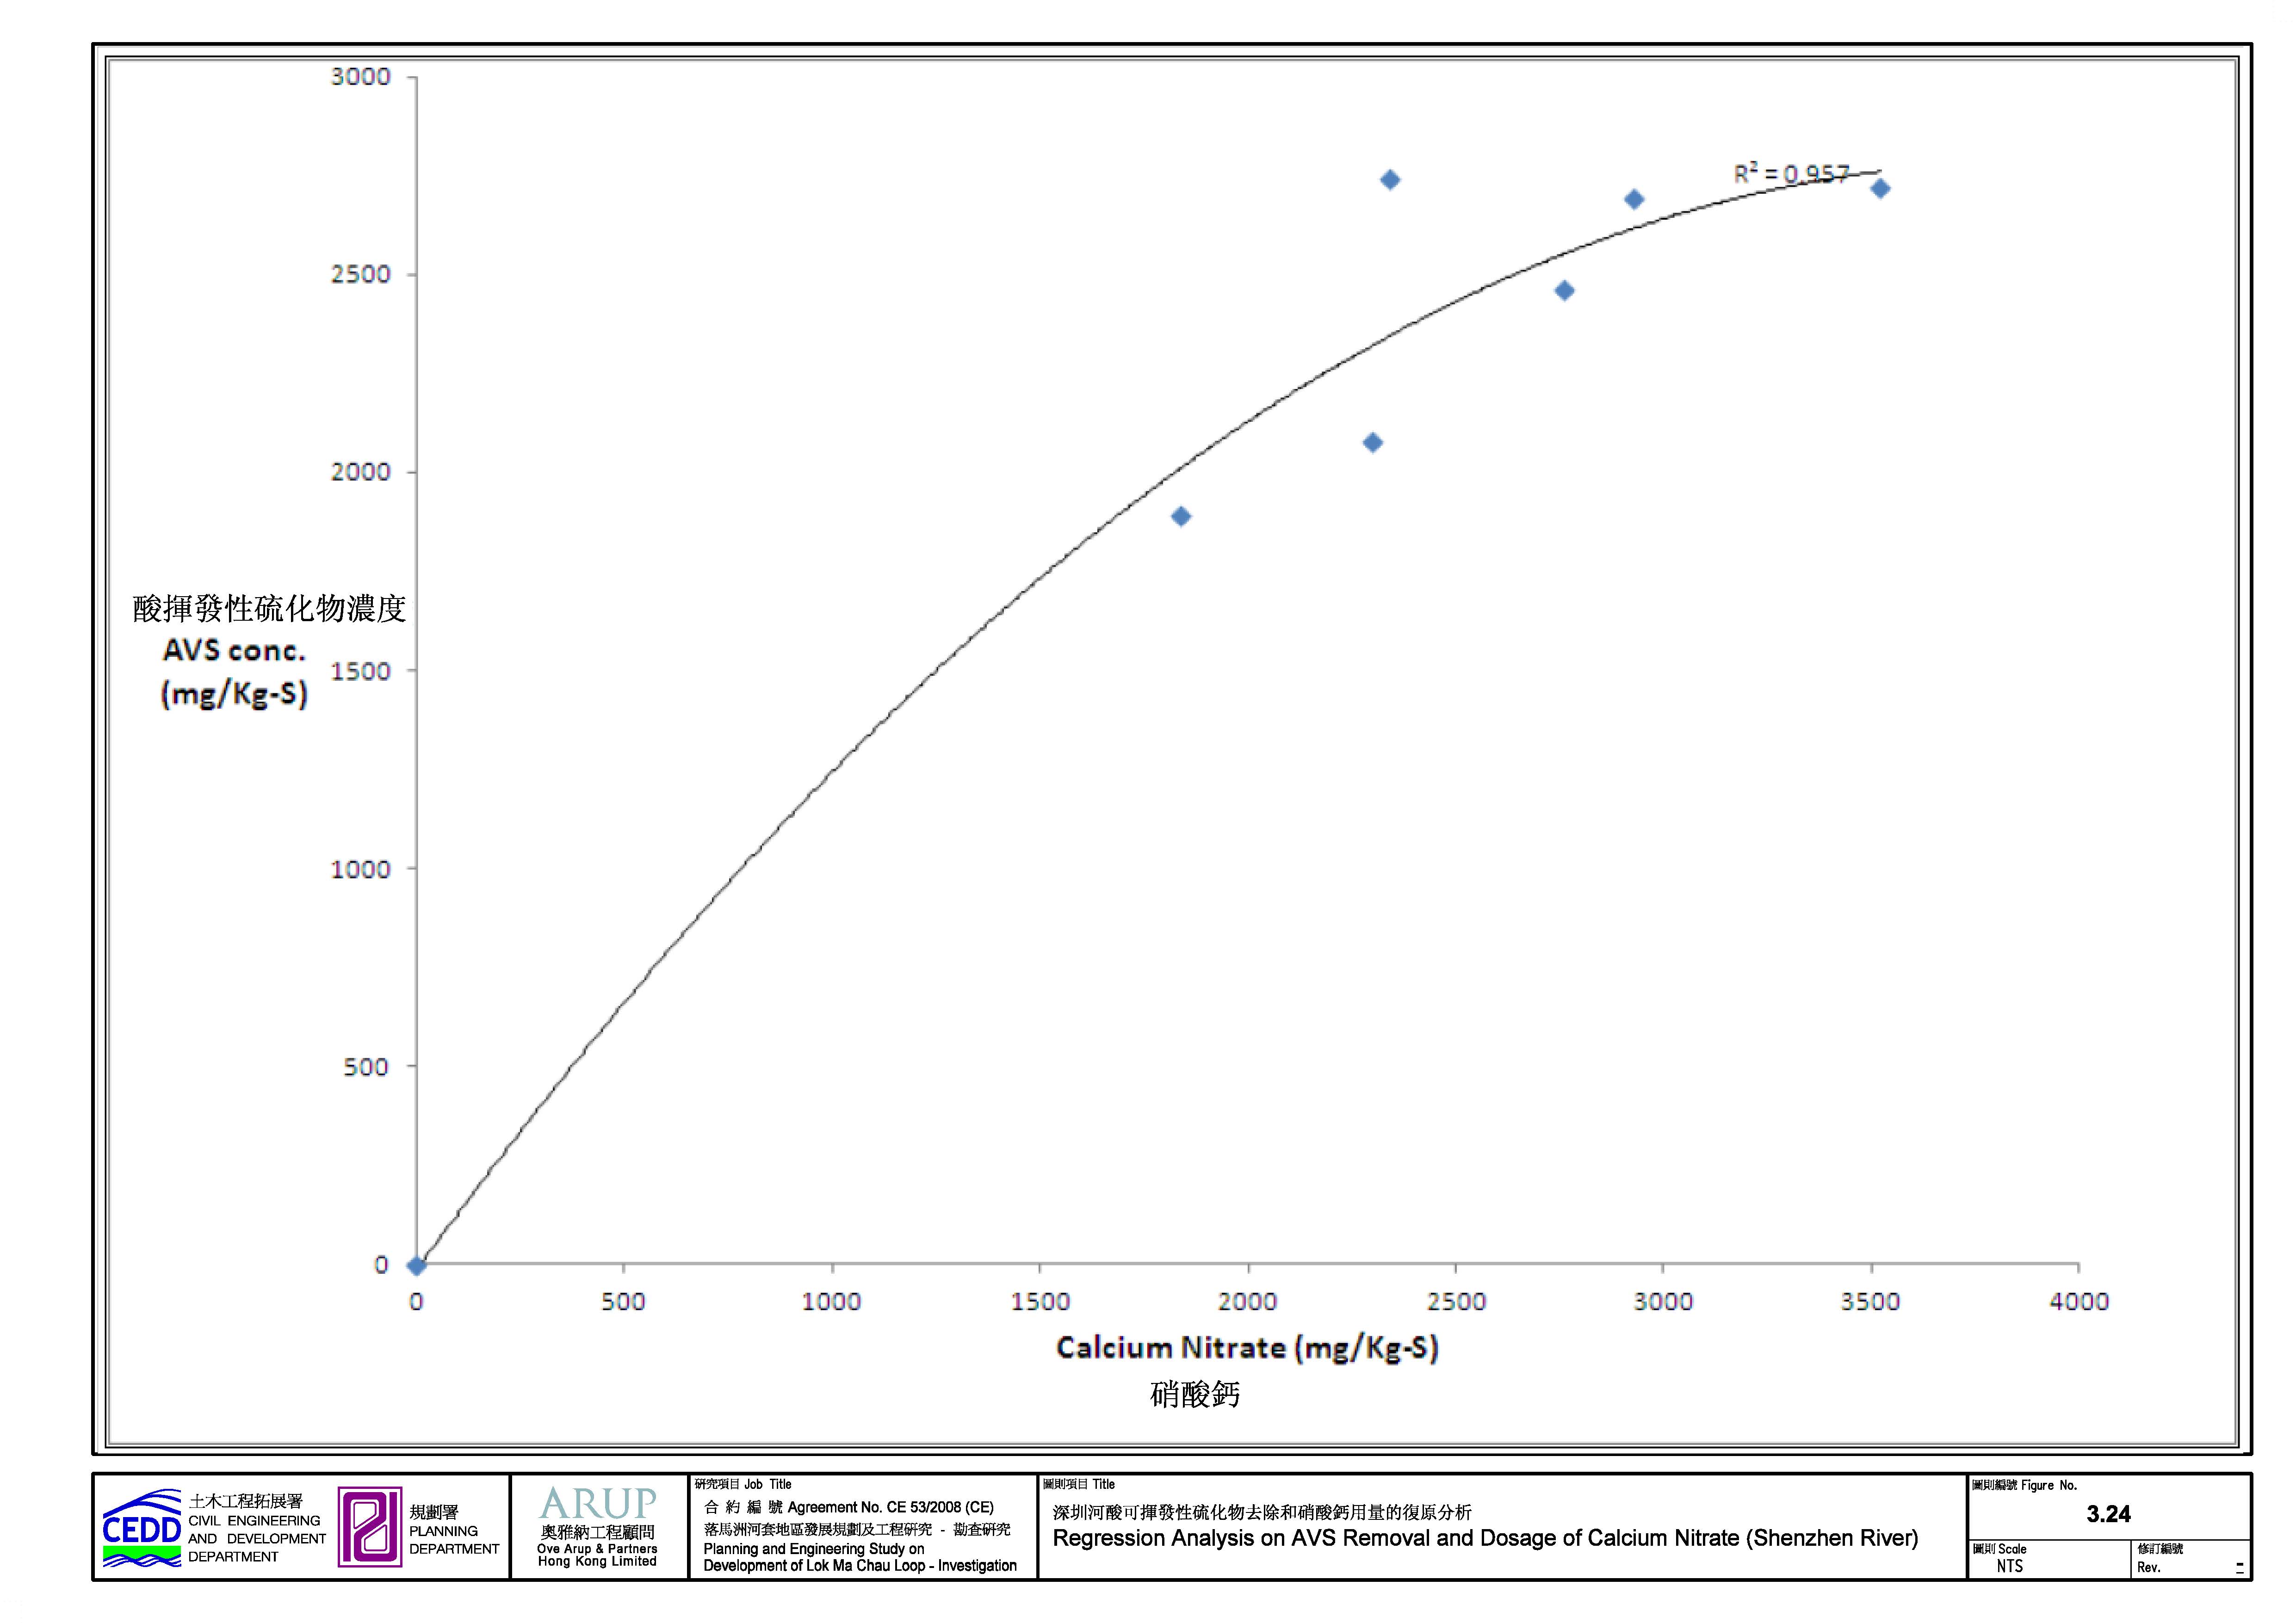
Figure 3.24 Regression
Analysis on AVS Removal and Dosage of Calcium Nitrate (Shenzhen River)
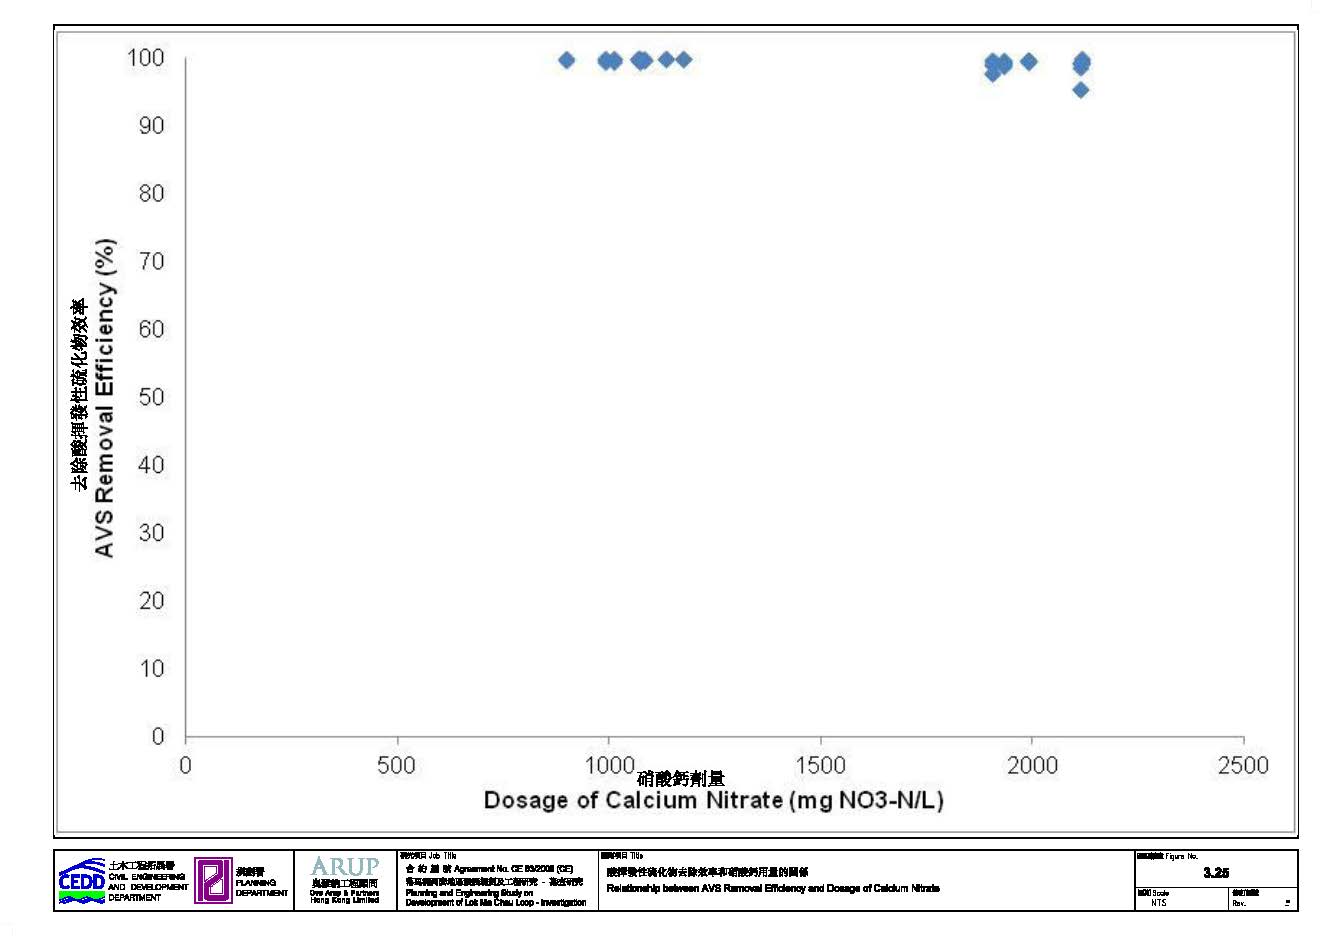
Figure 3.25 Relationship
between AVS Removal Efficiency and Dosage of Calcium Nitrate
Figure 4.2 Adjoining Area in Shenzhen
Figure 4.3 Locations of Prevailing Noise
Measurement
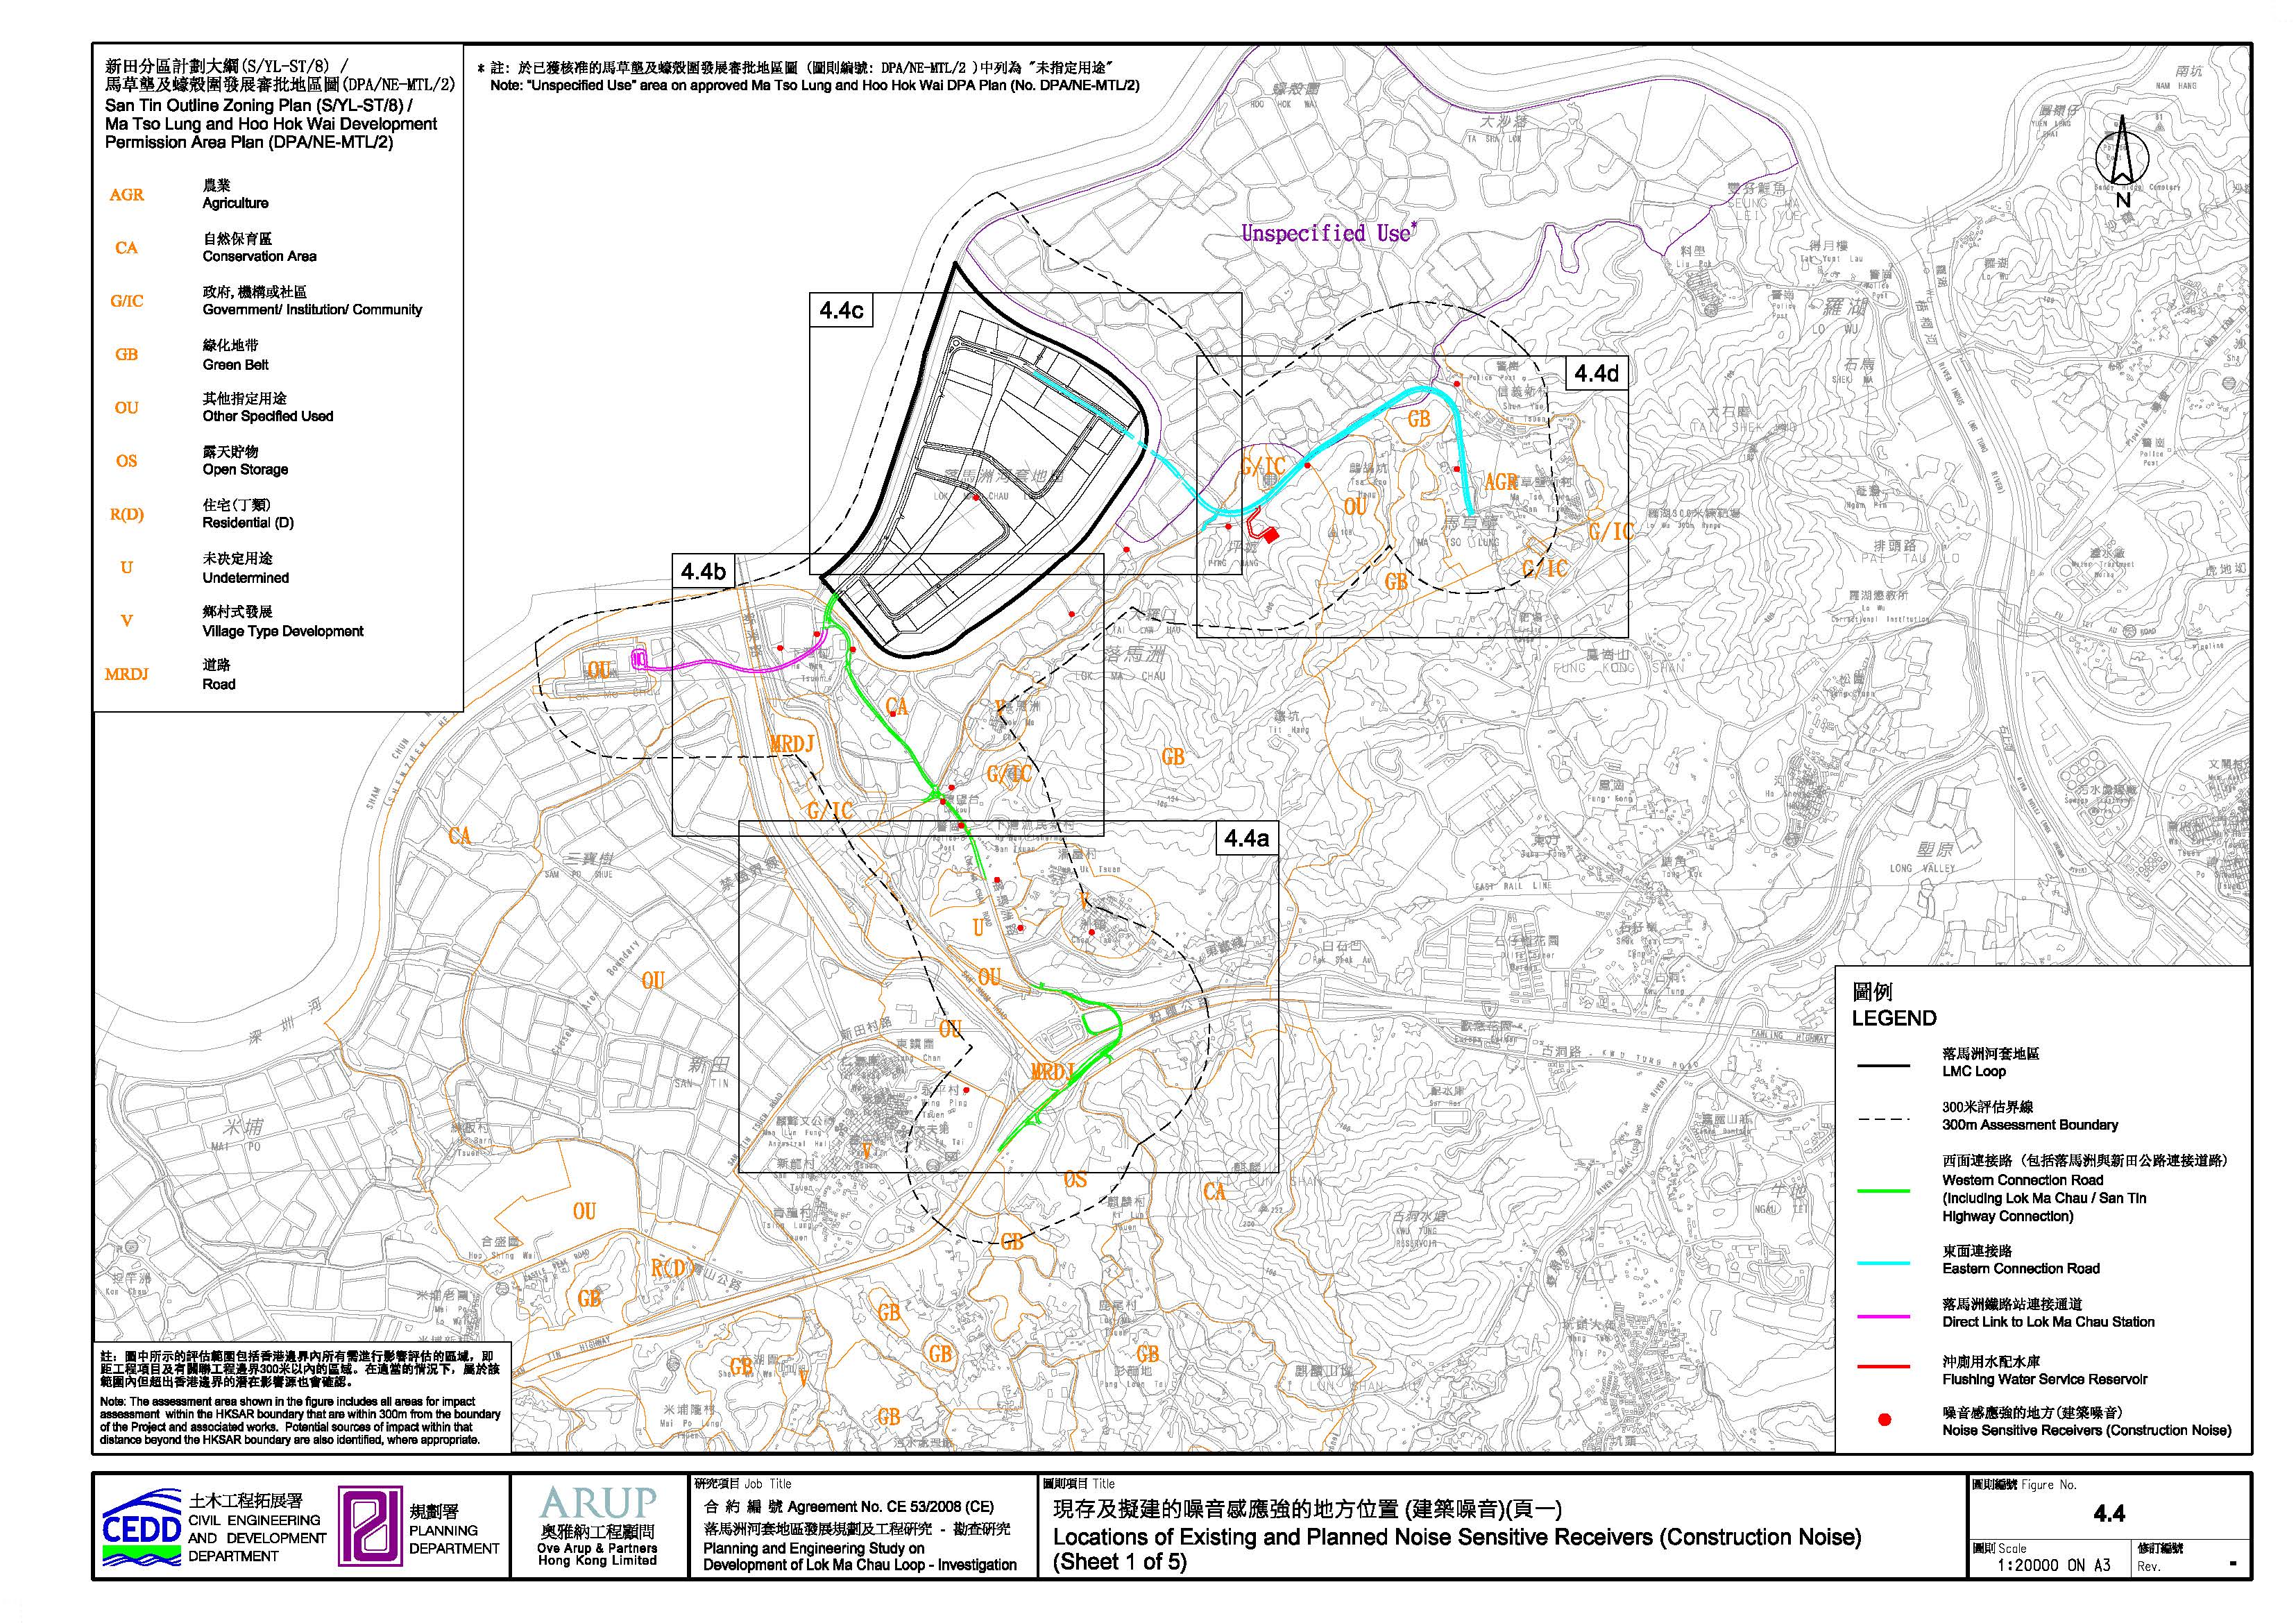
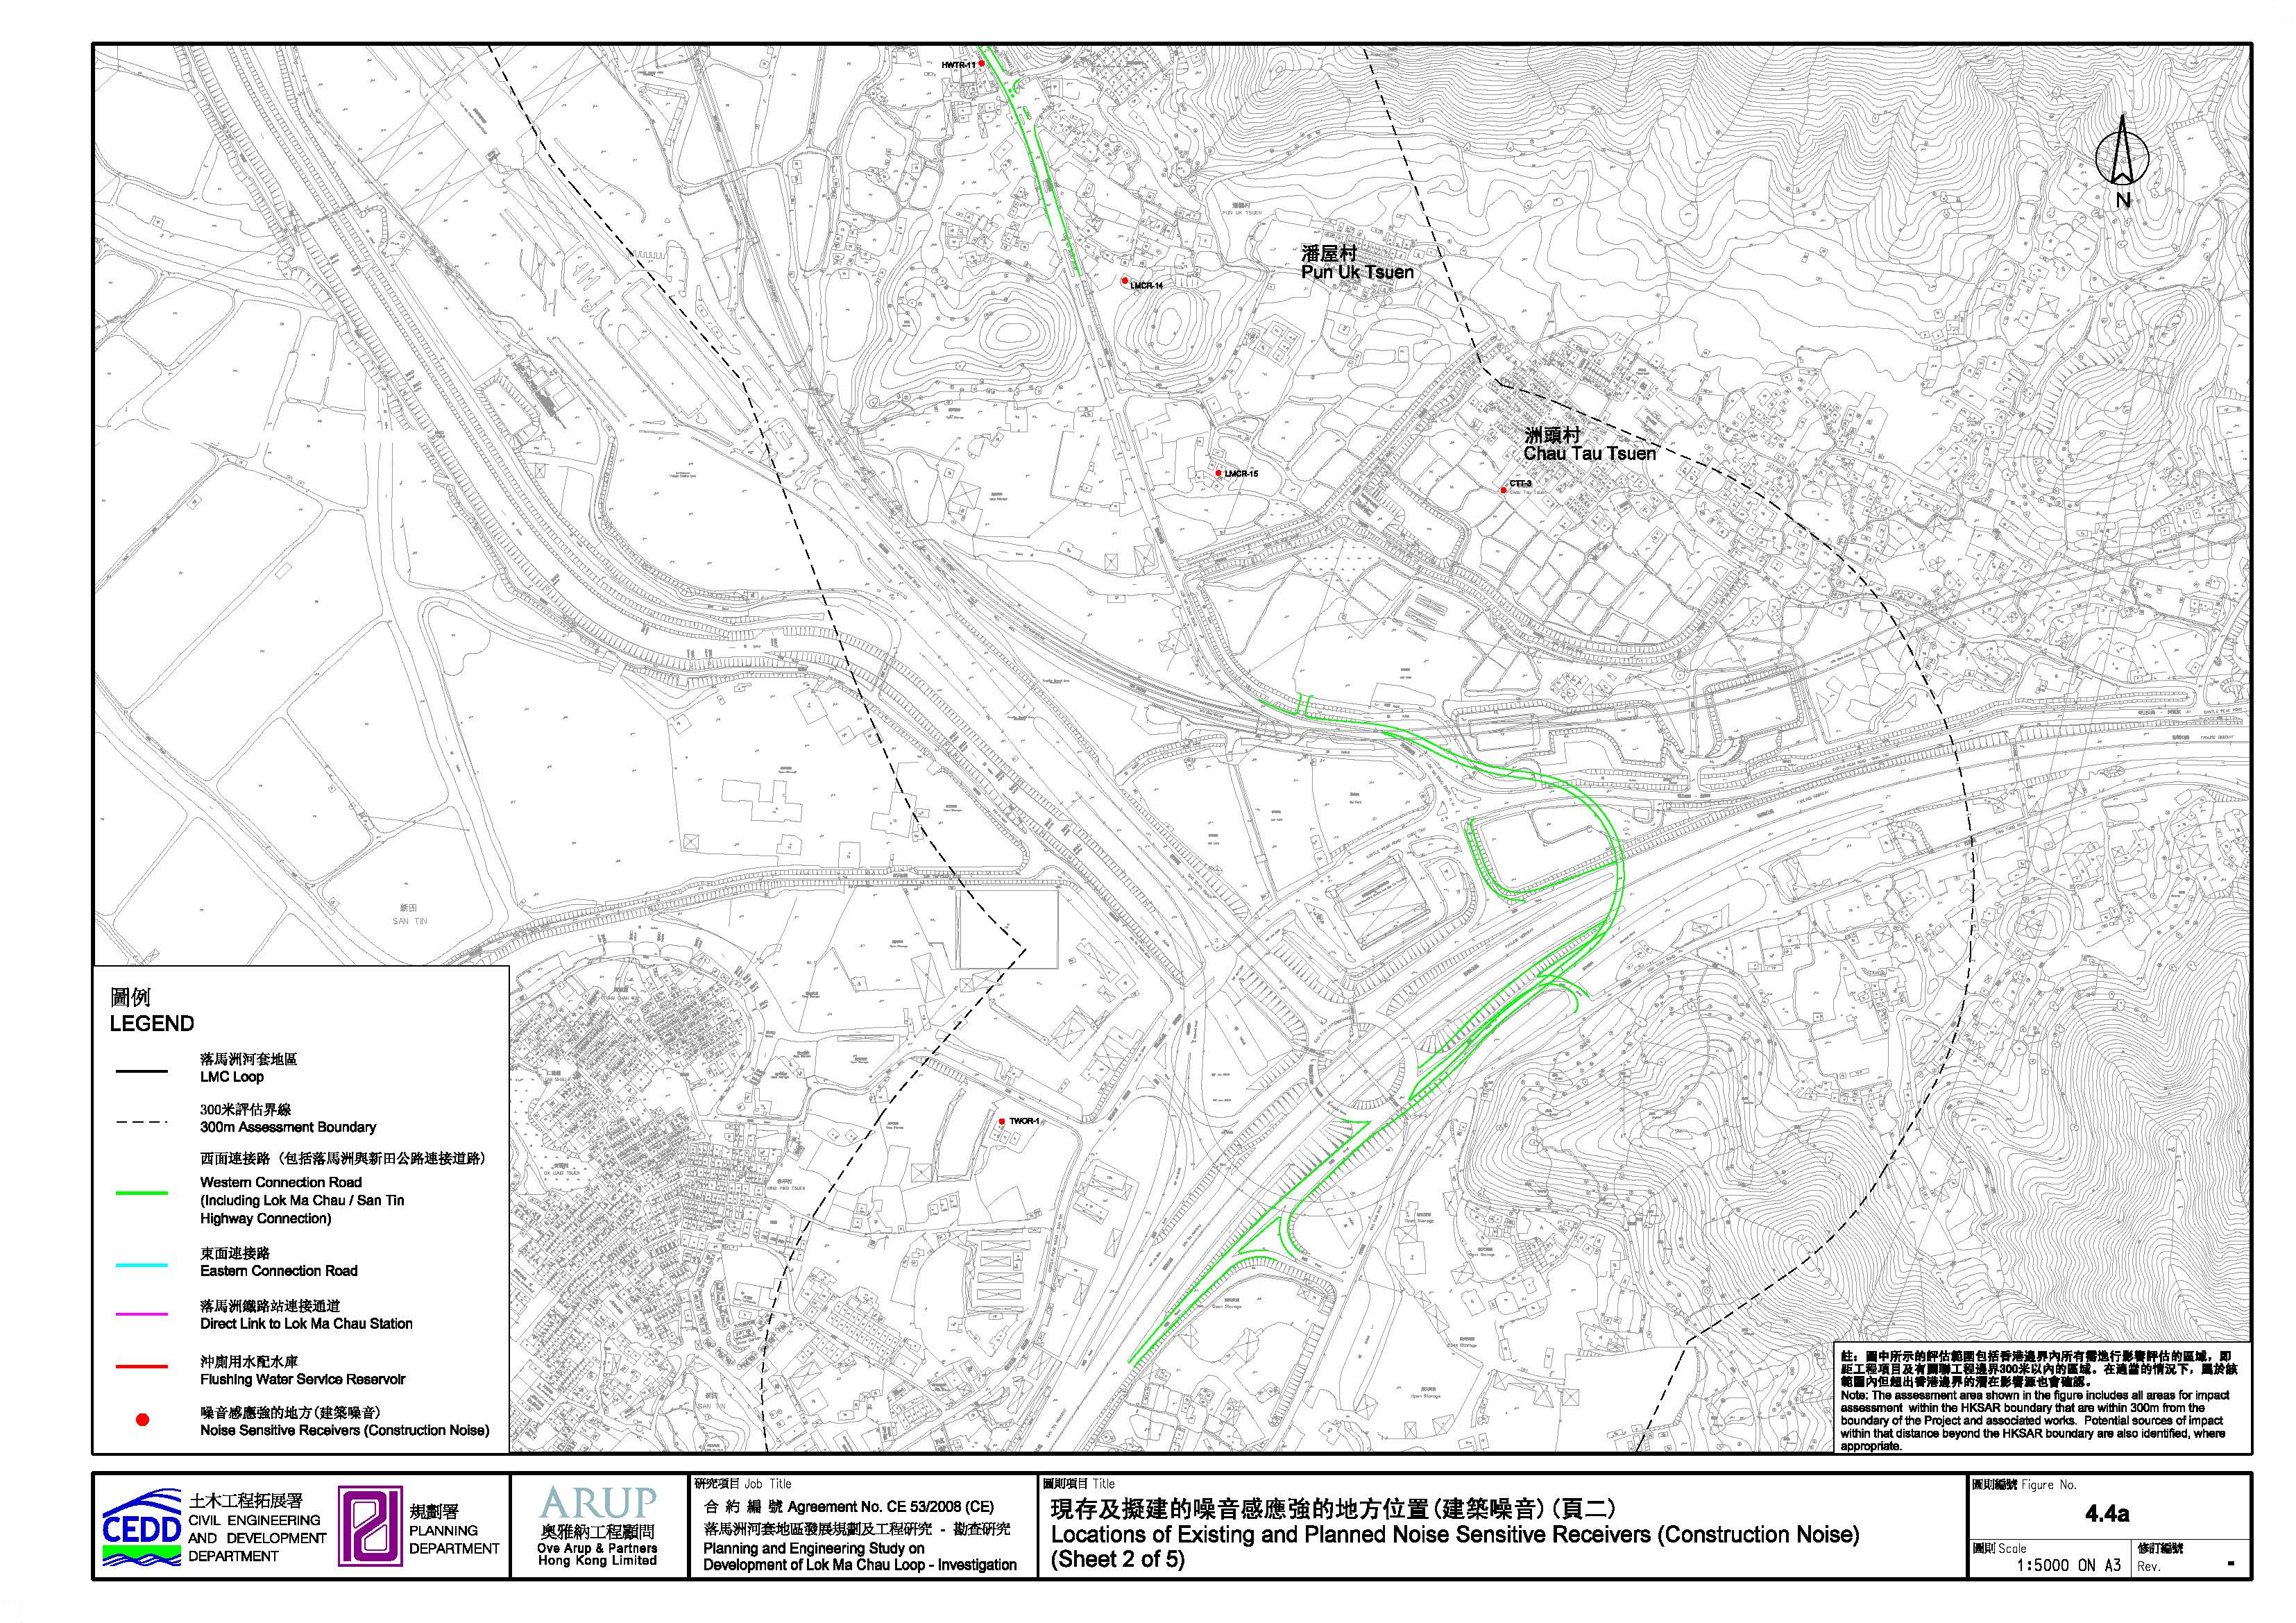
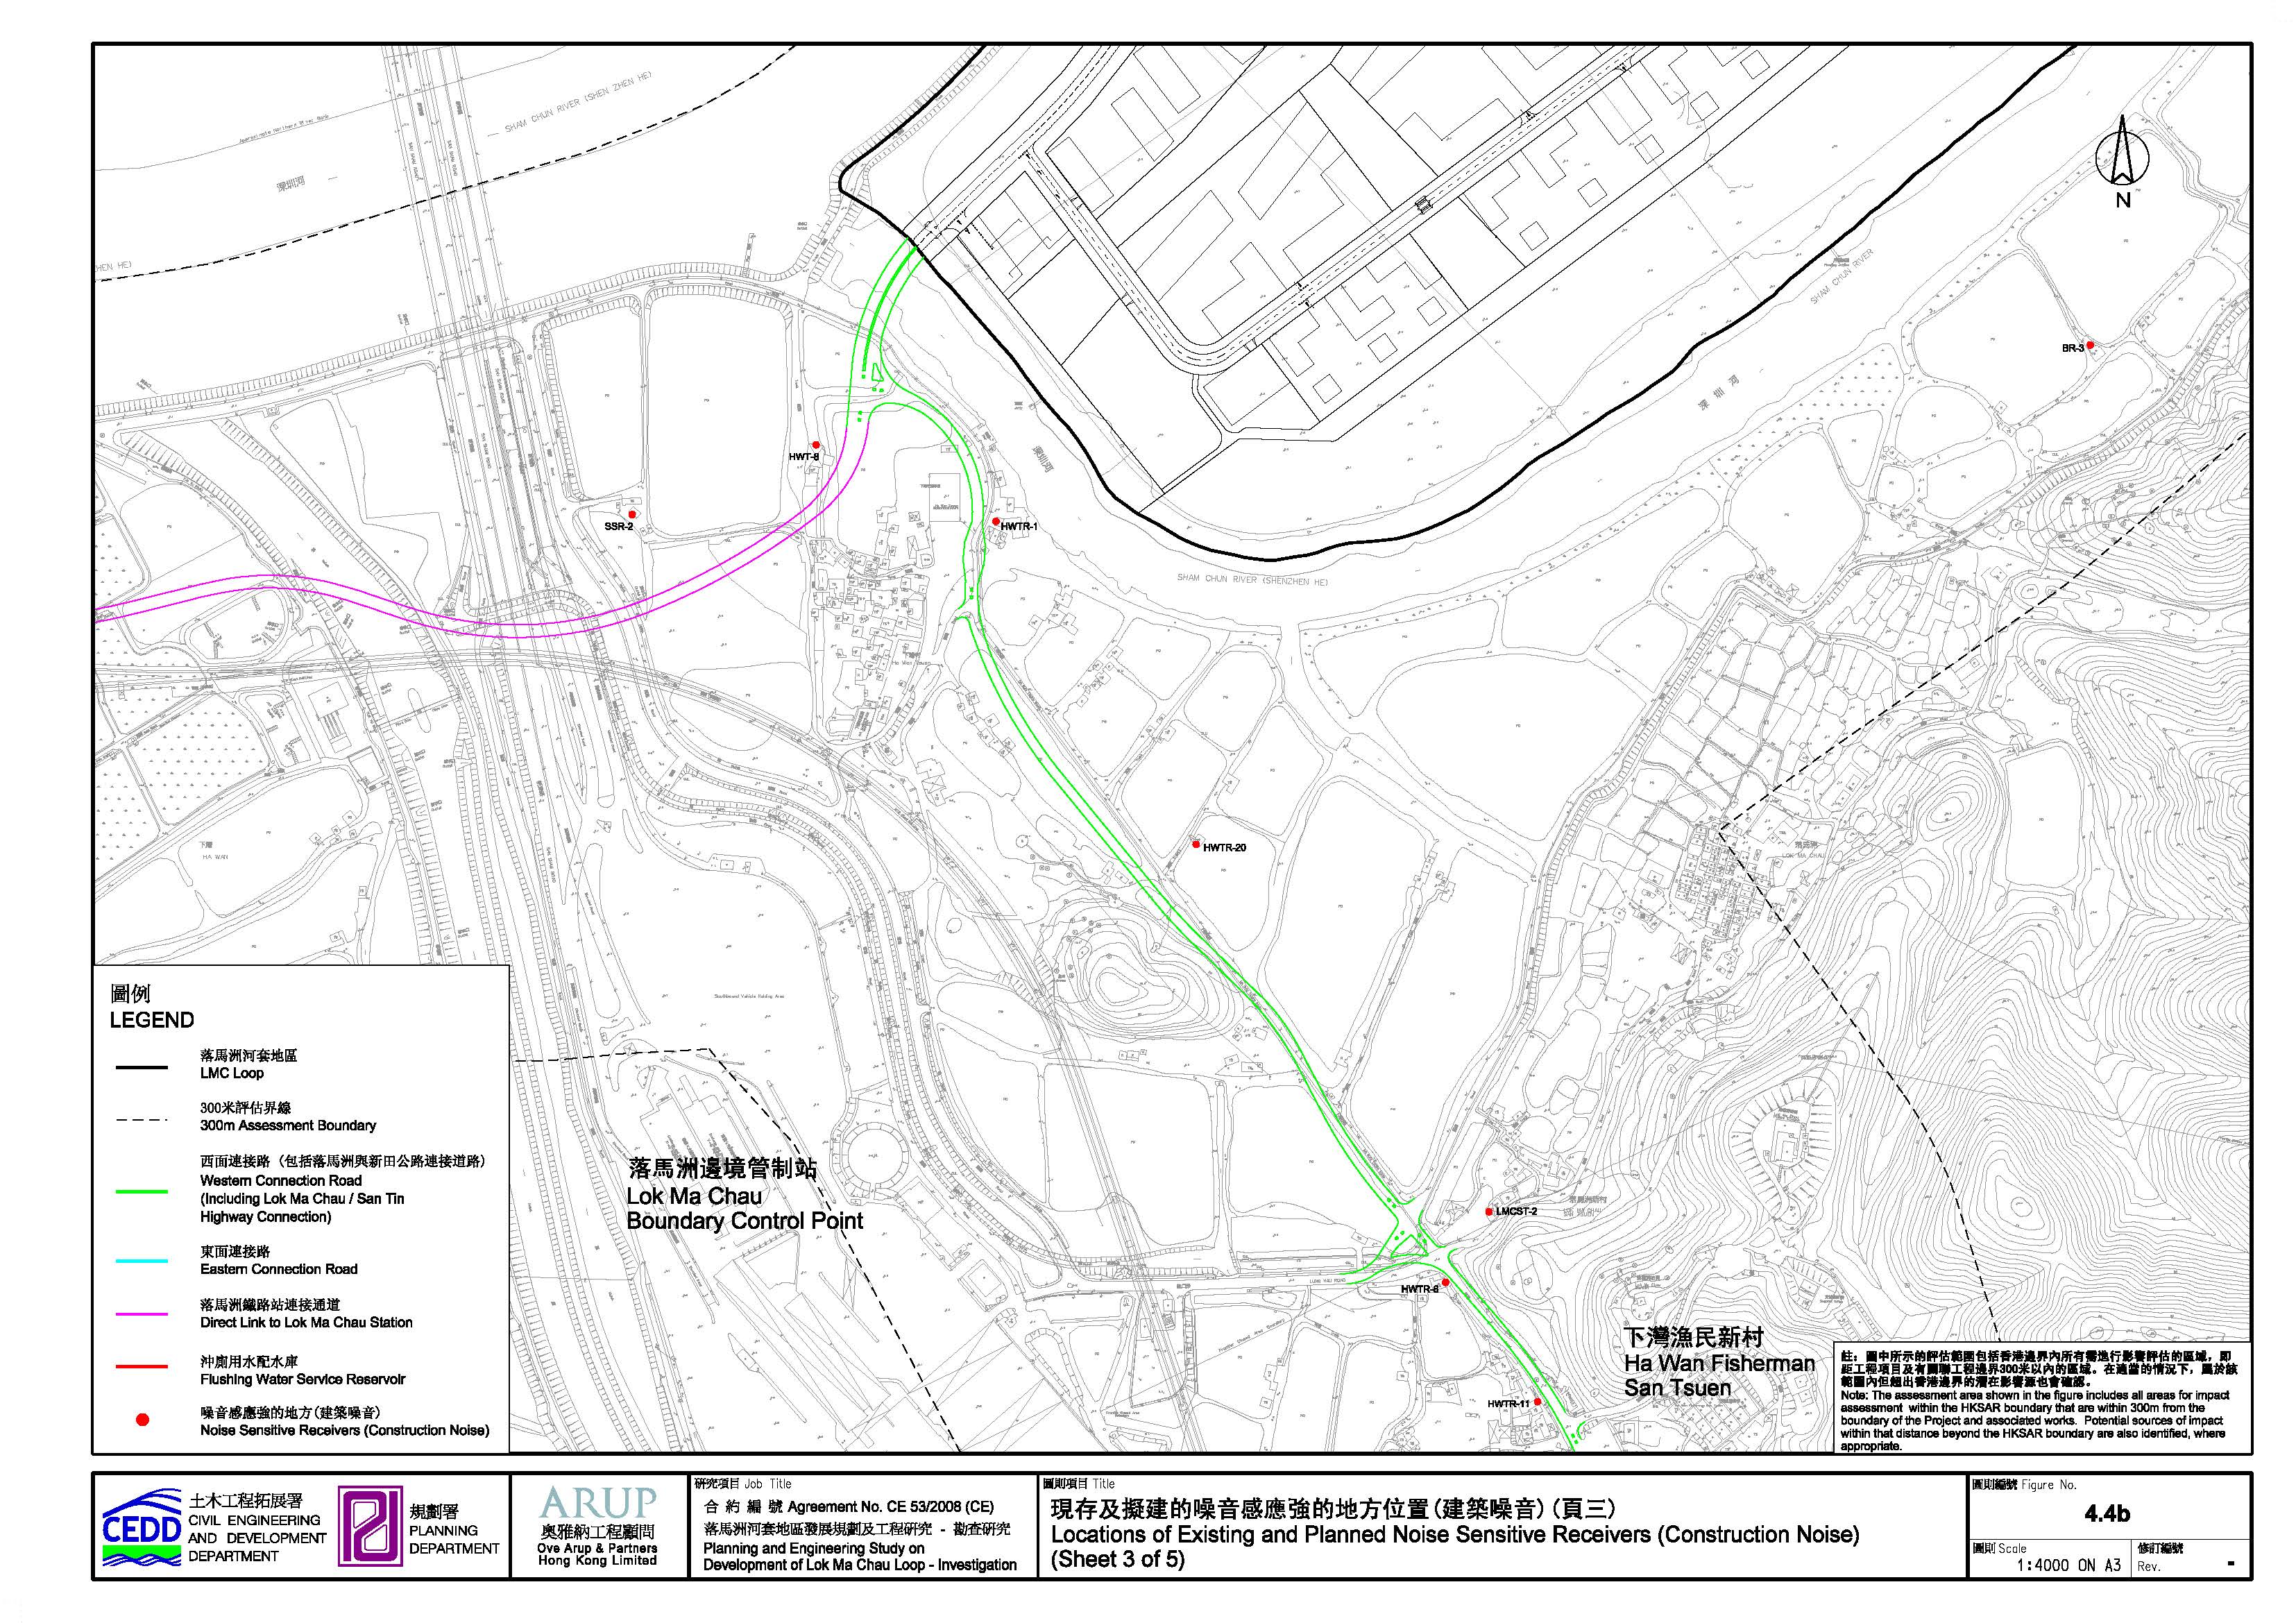
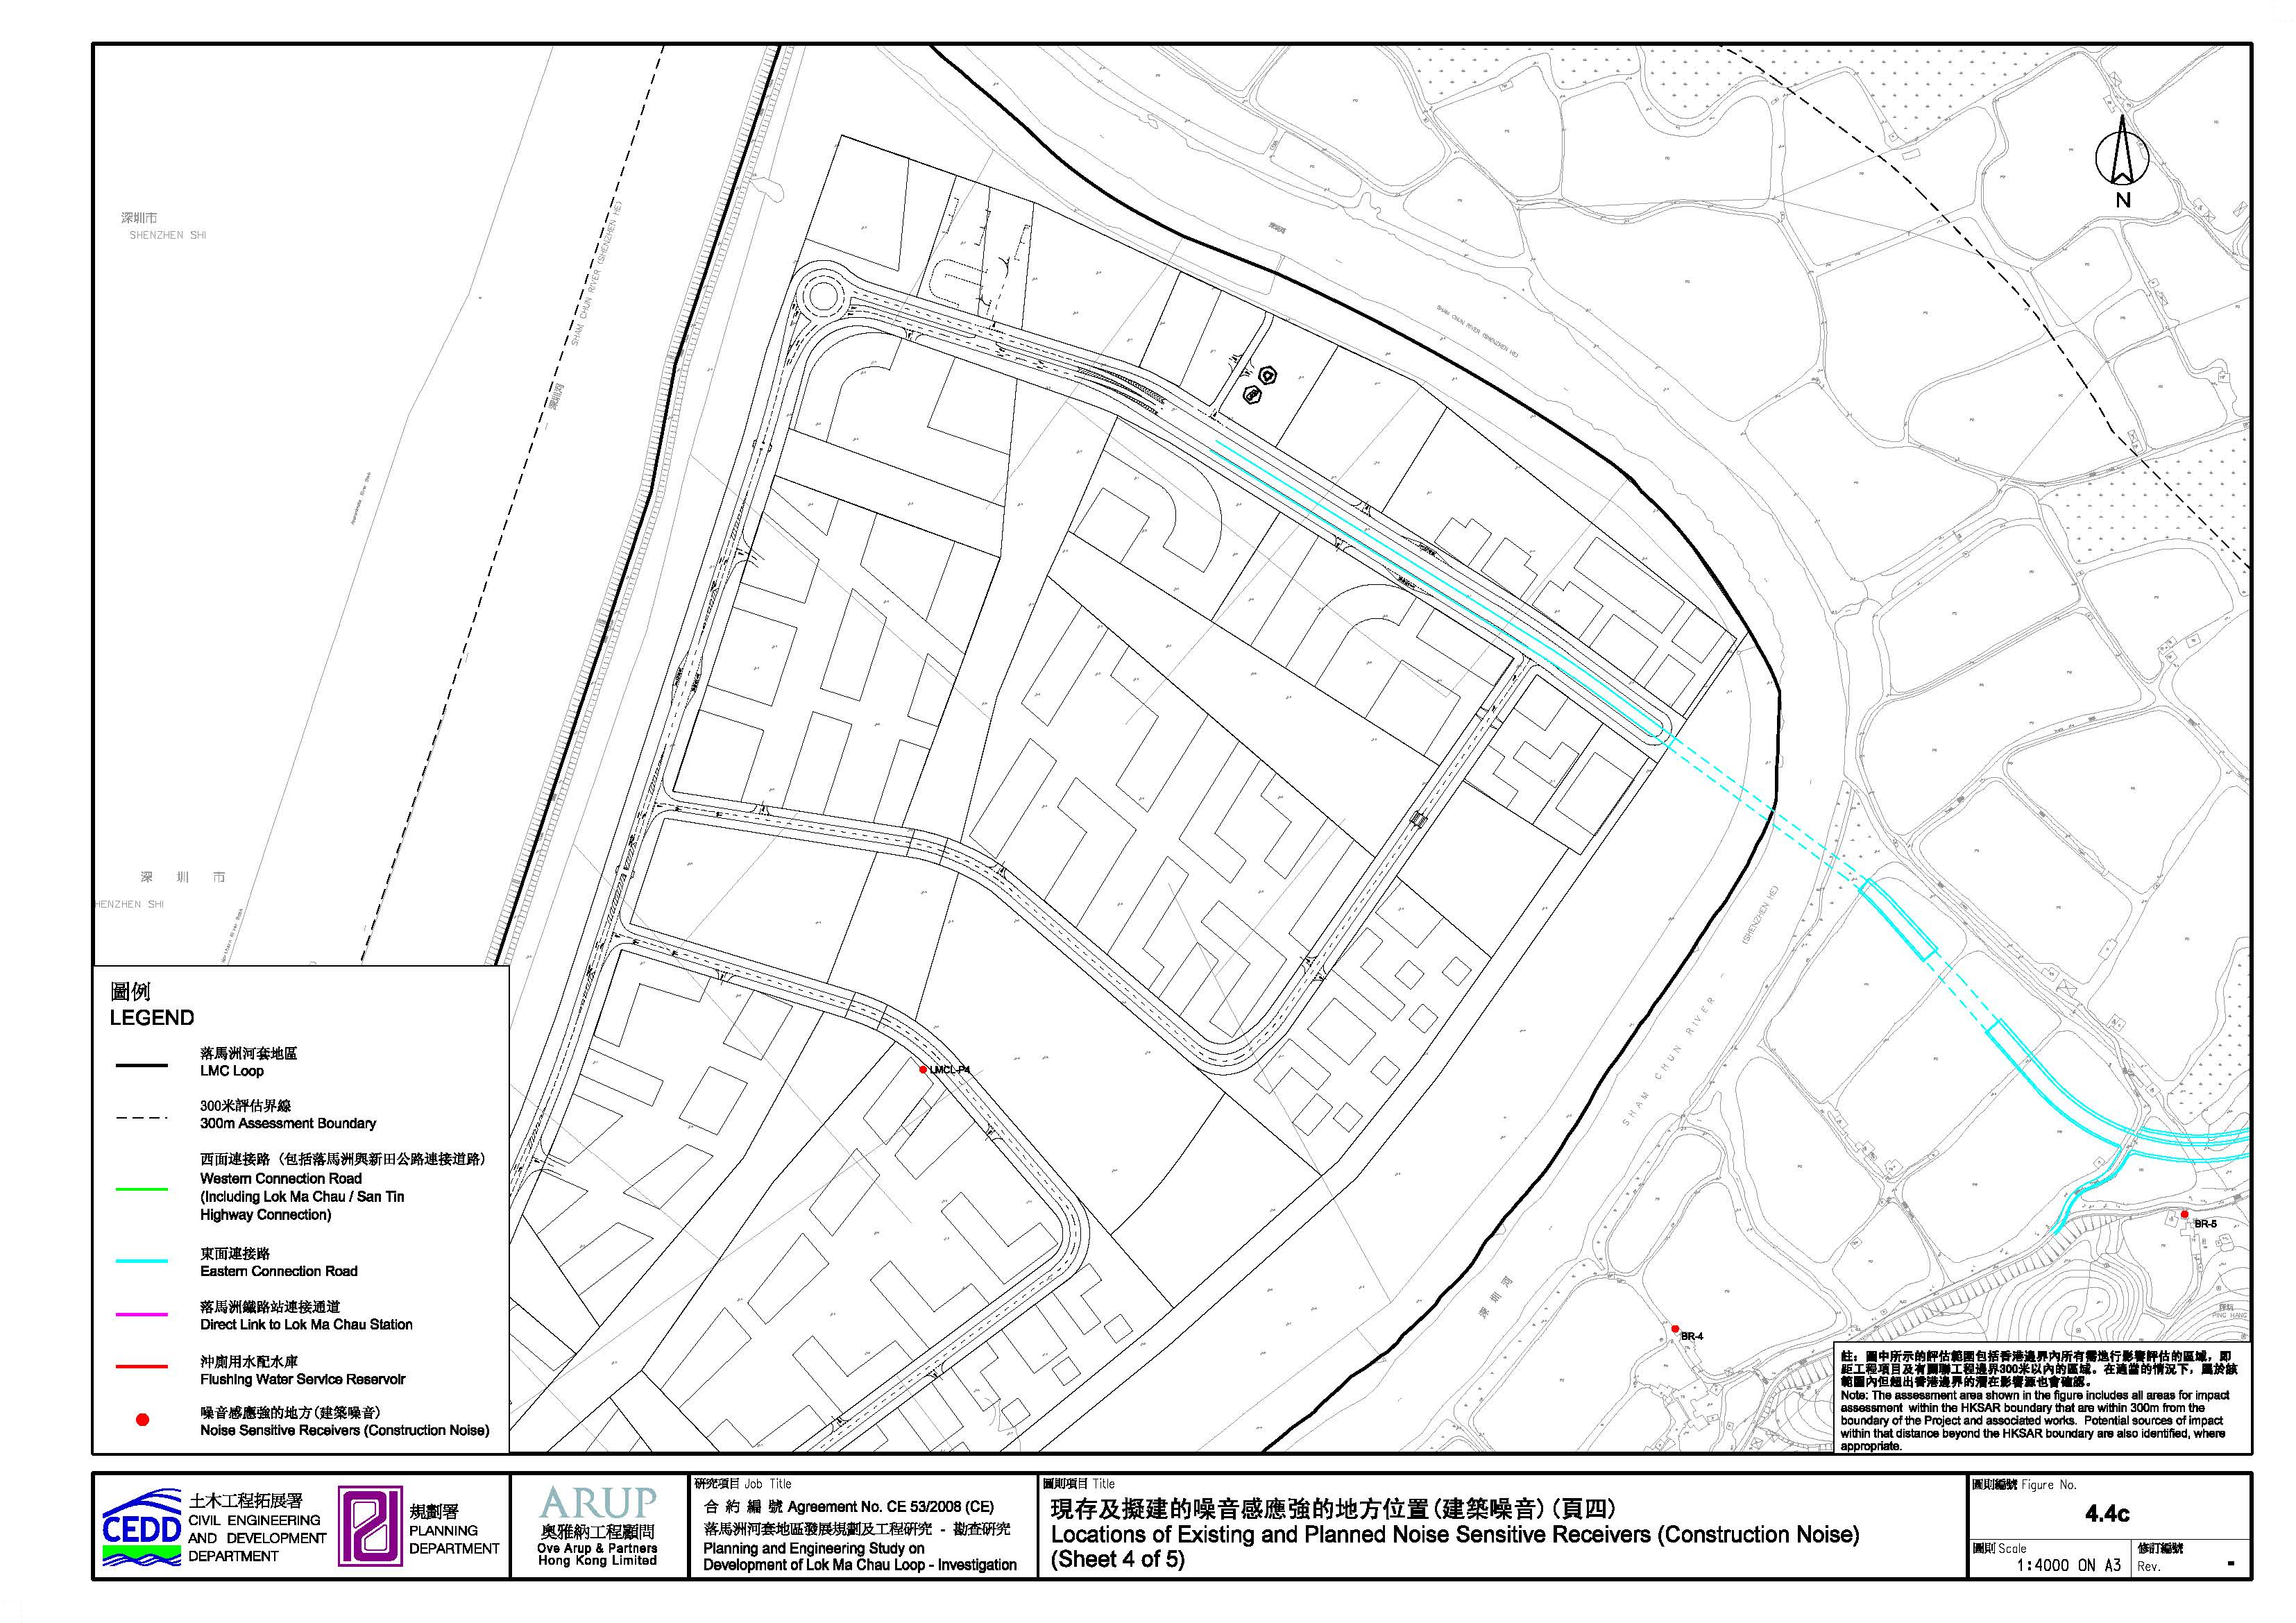
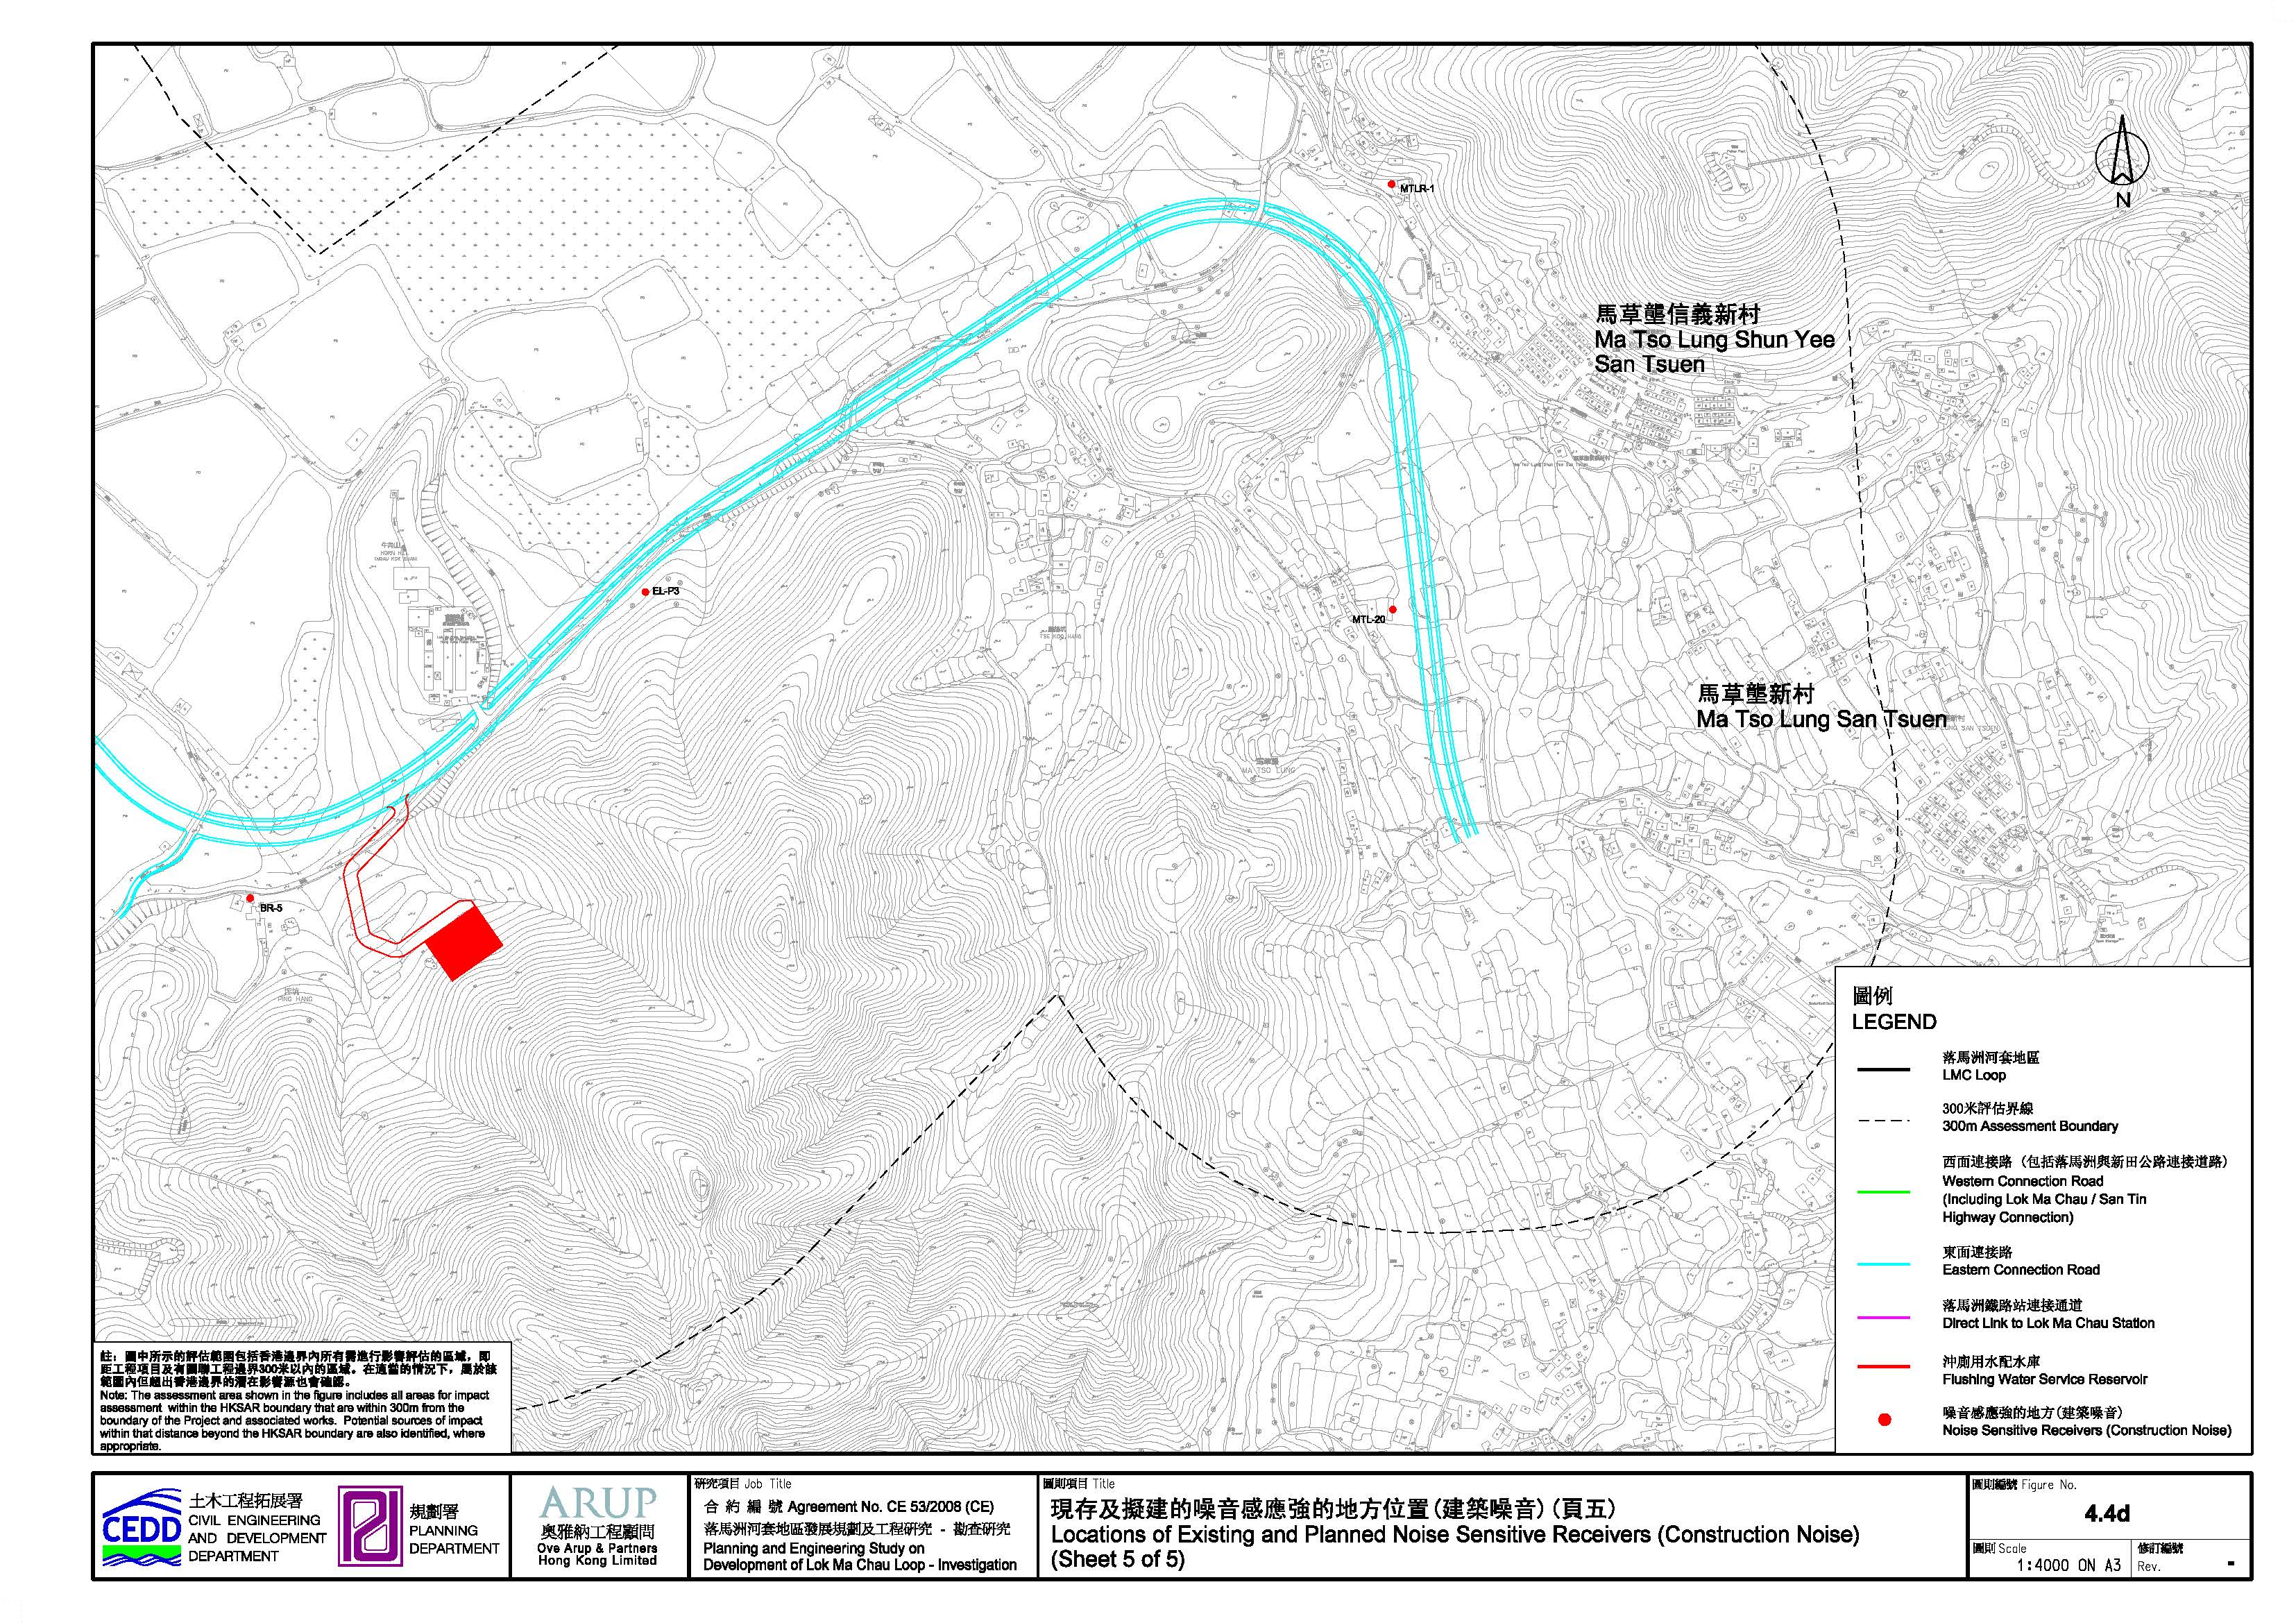
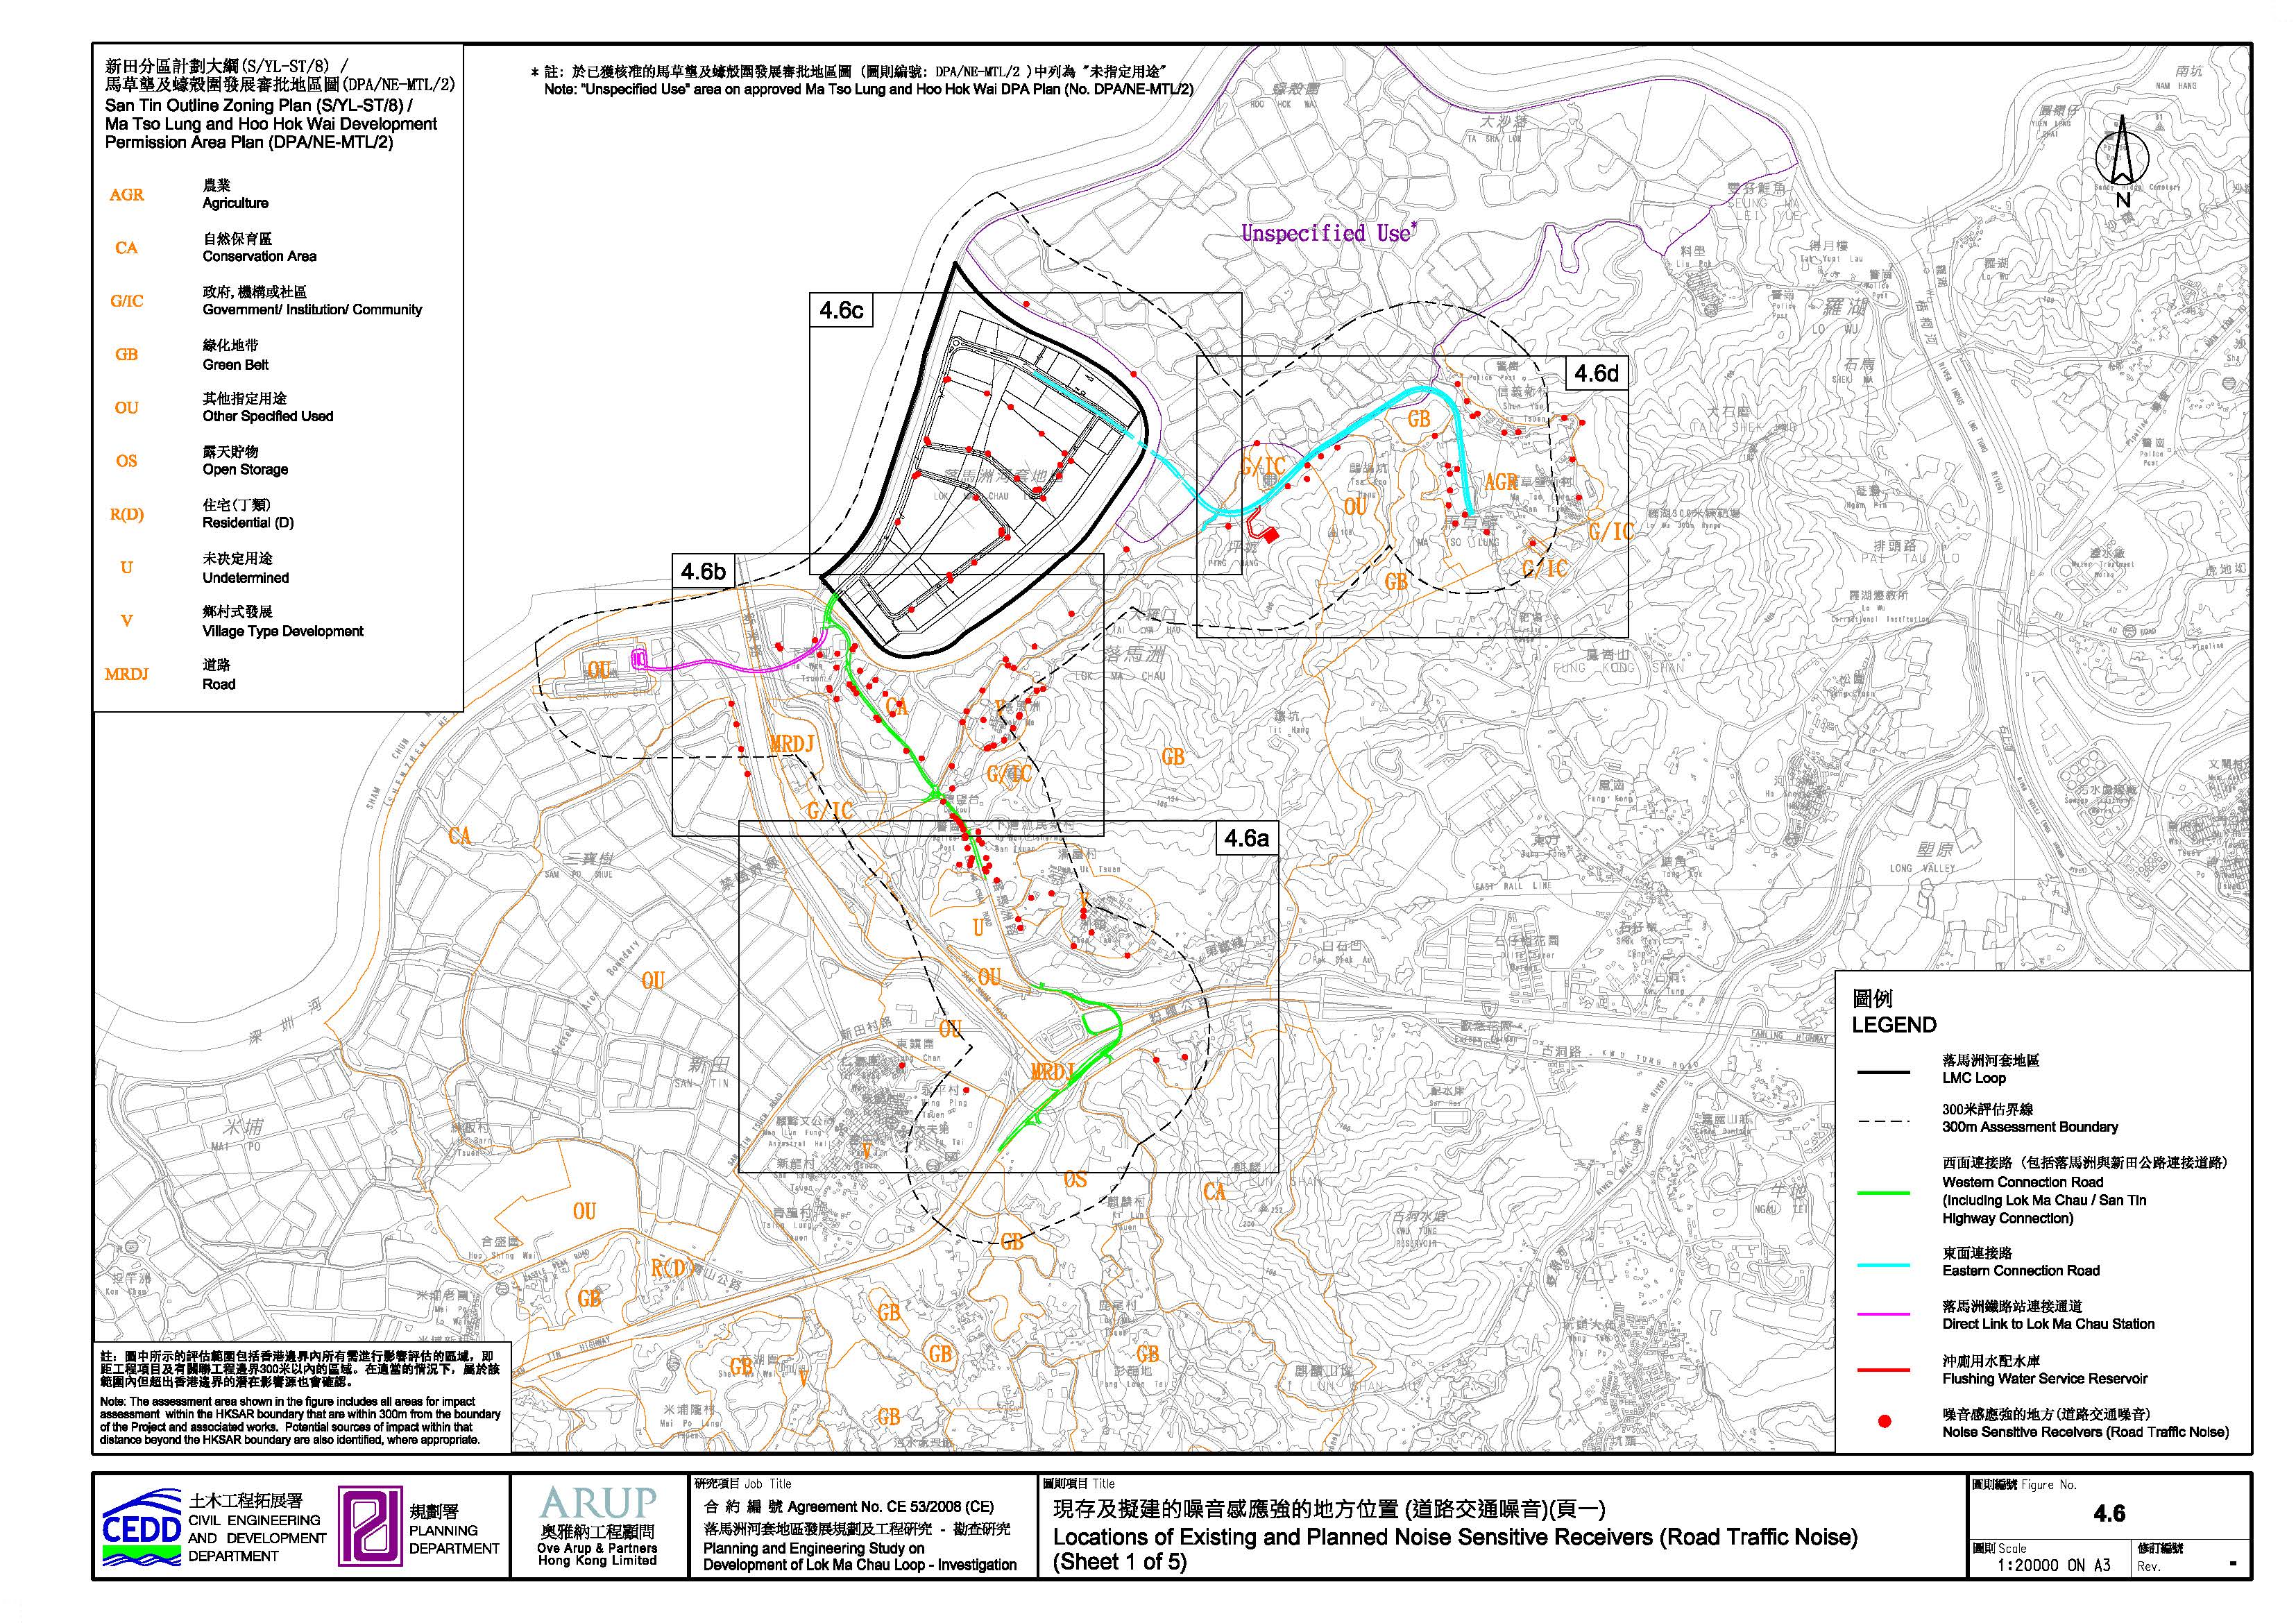
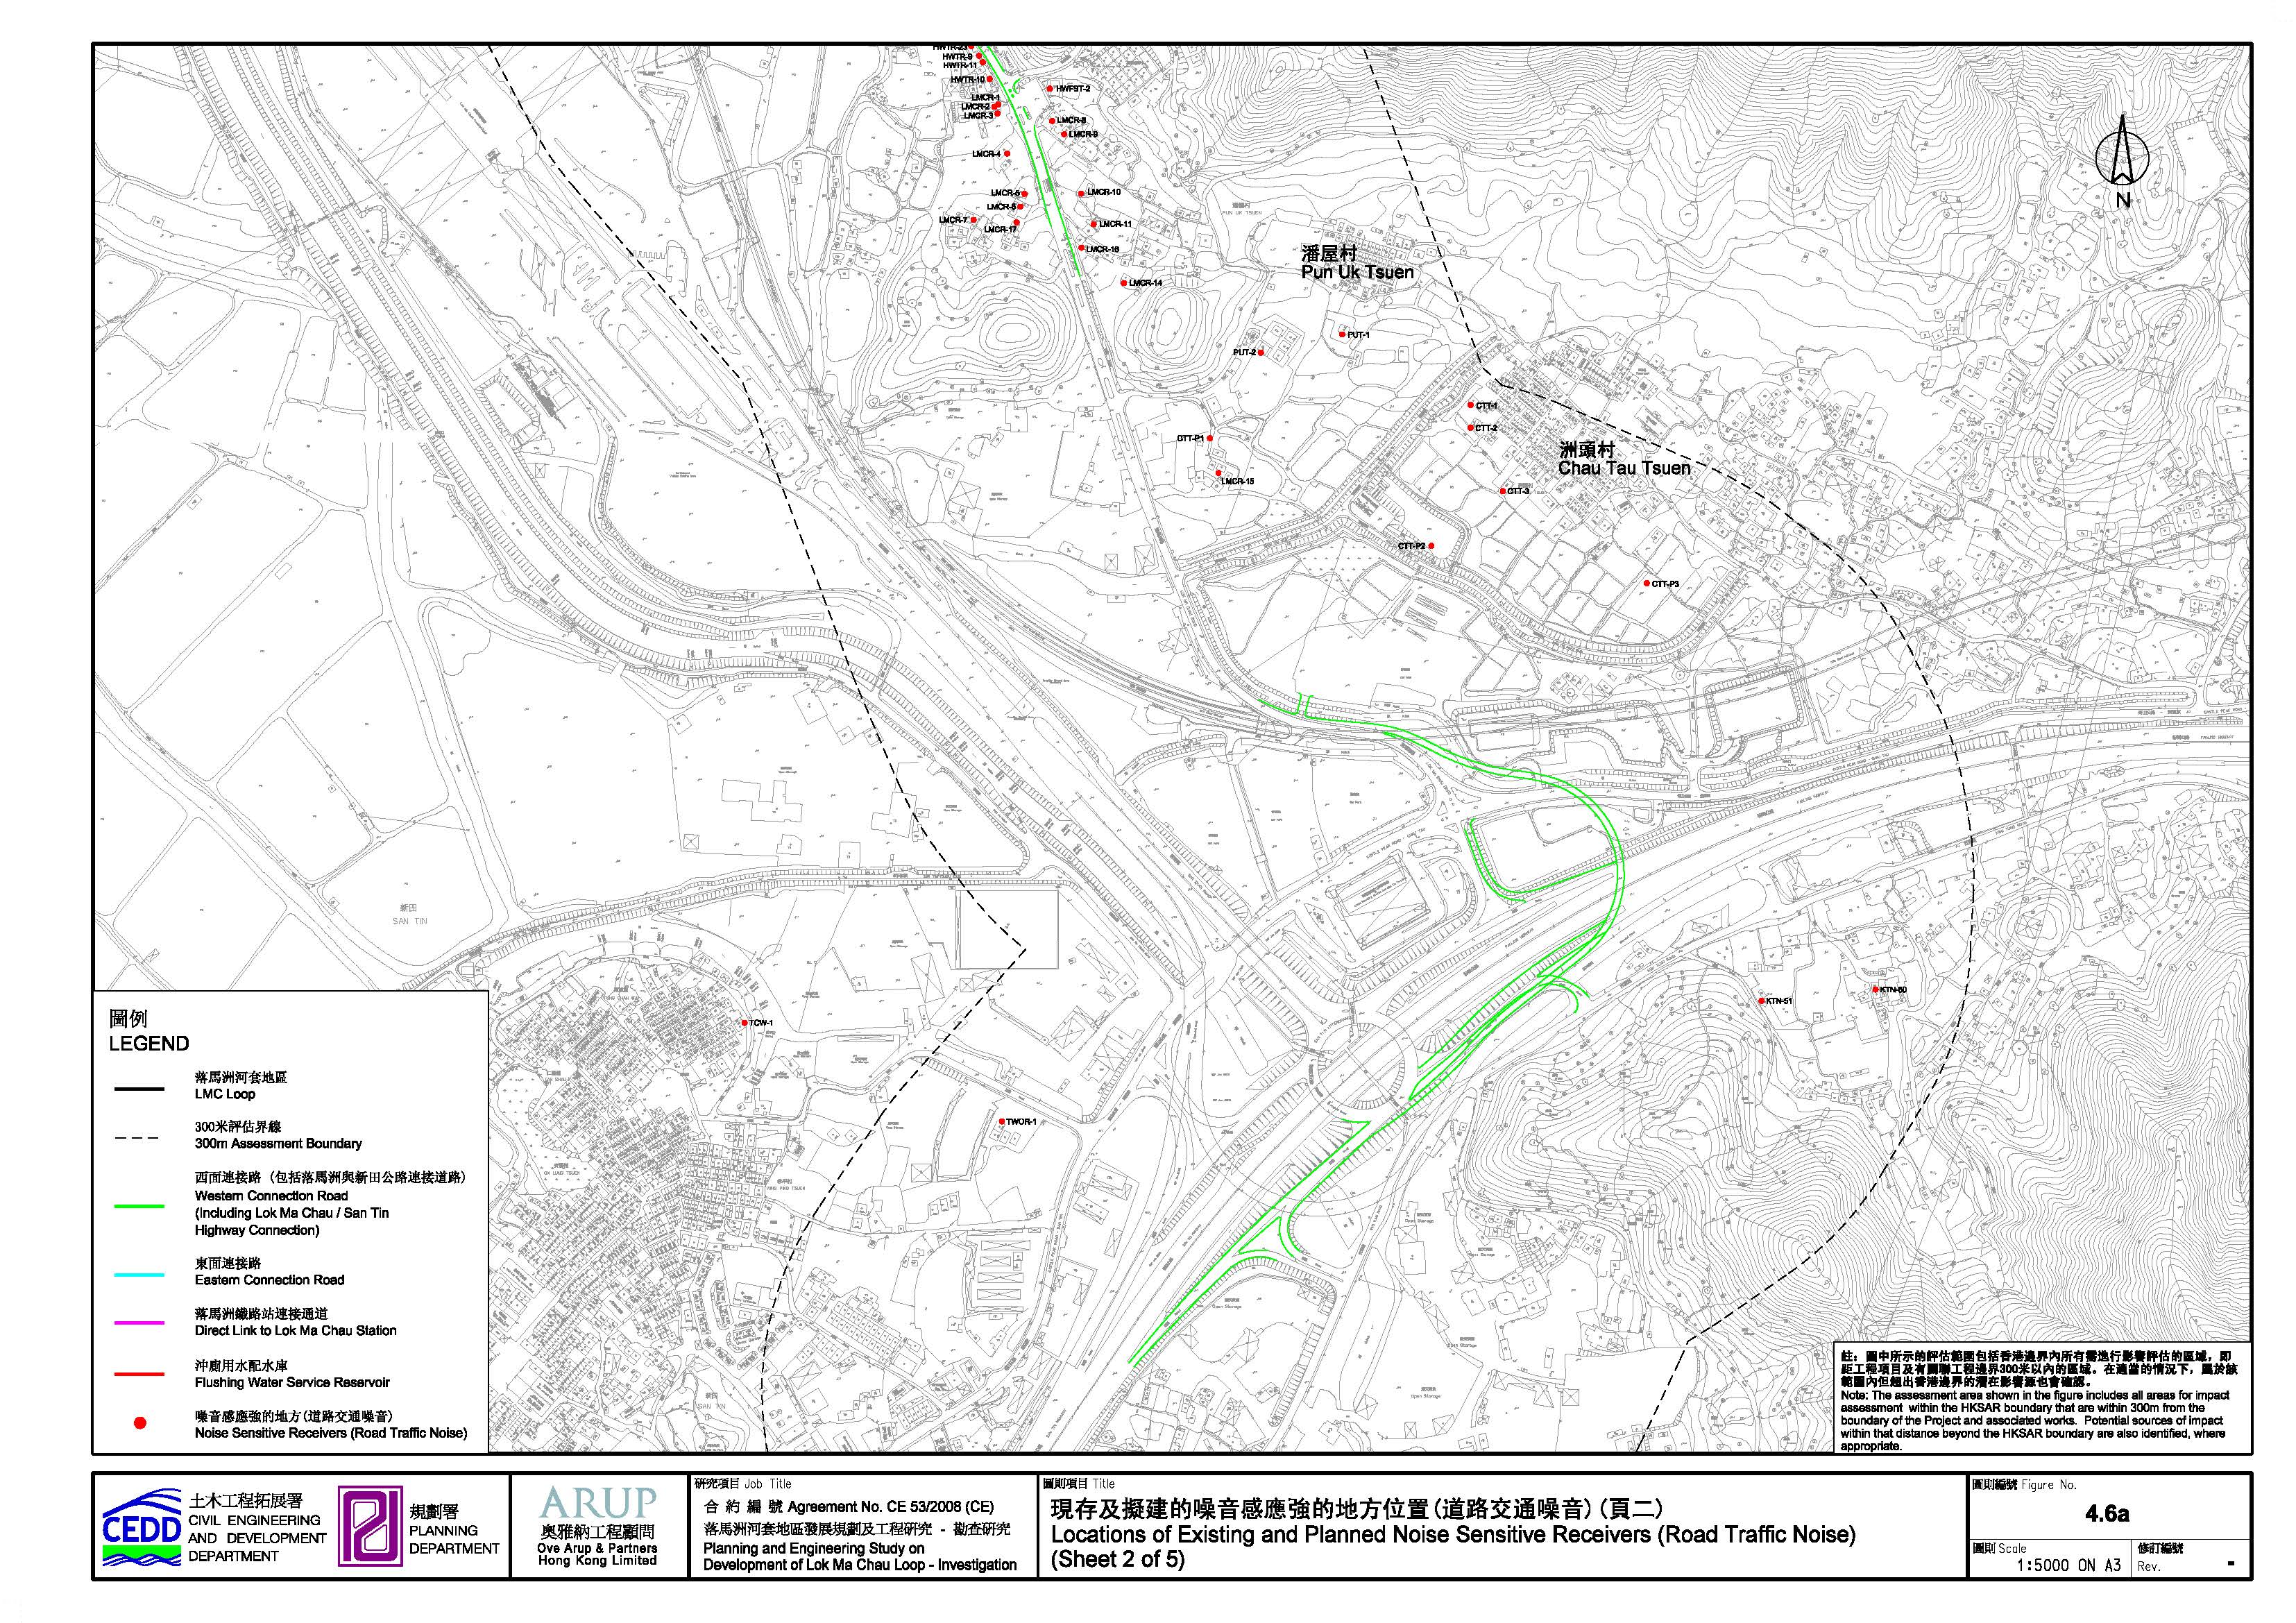
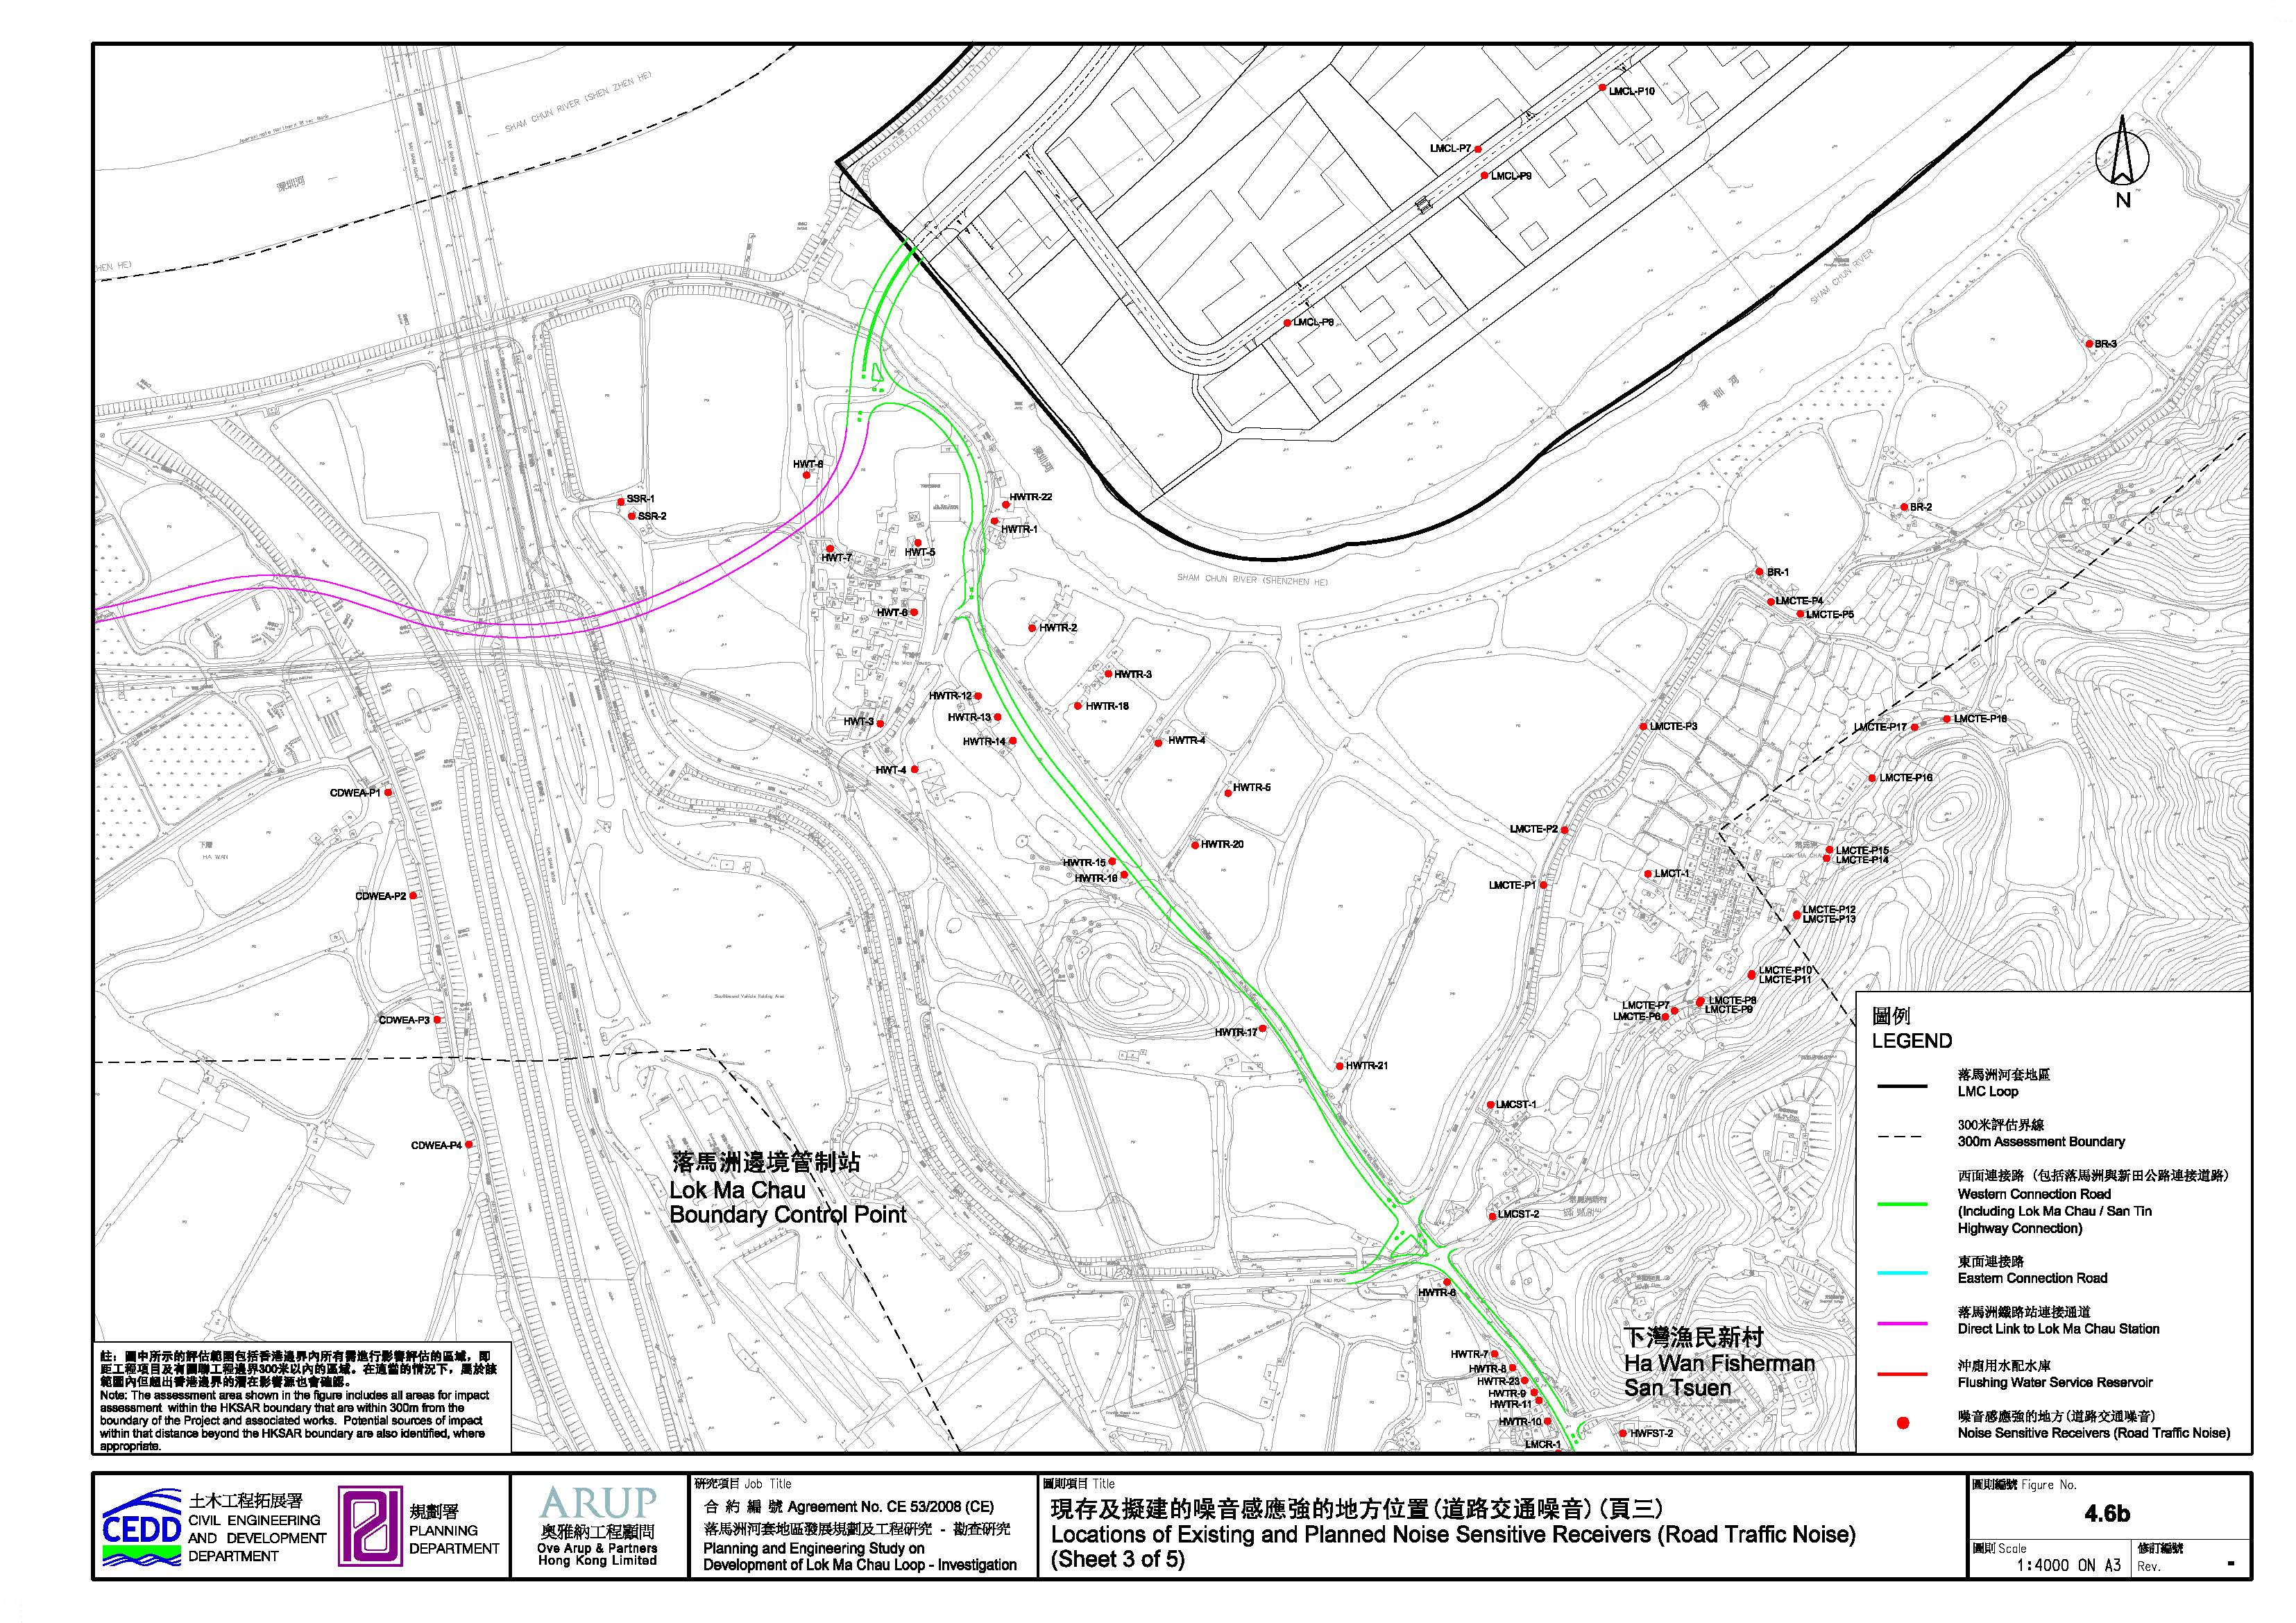
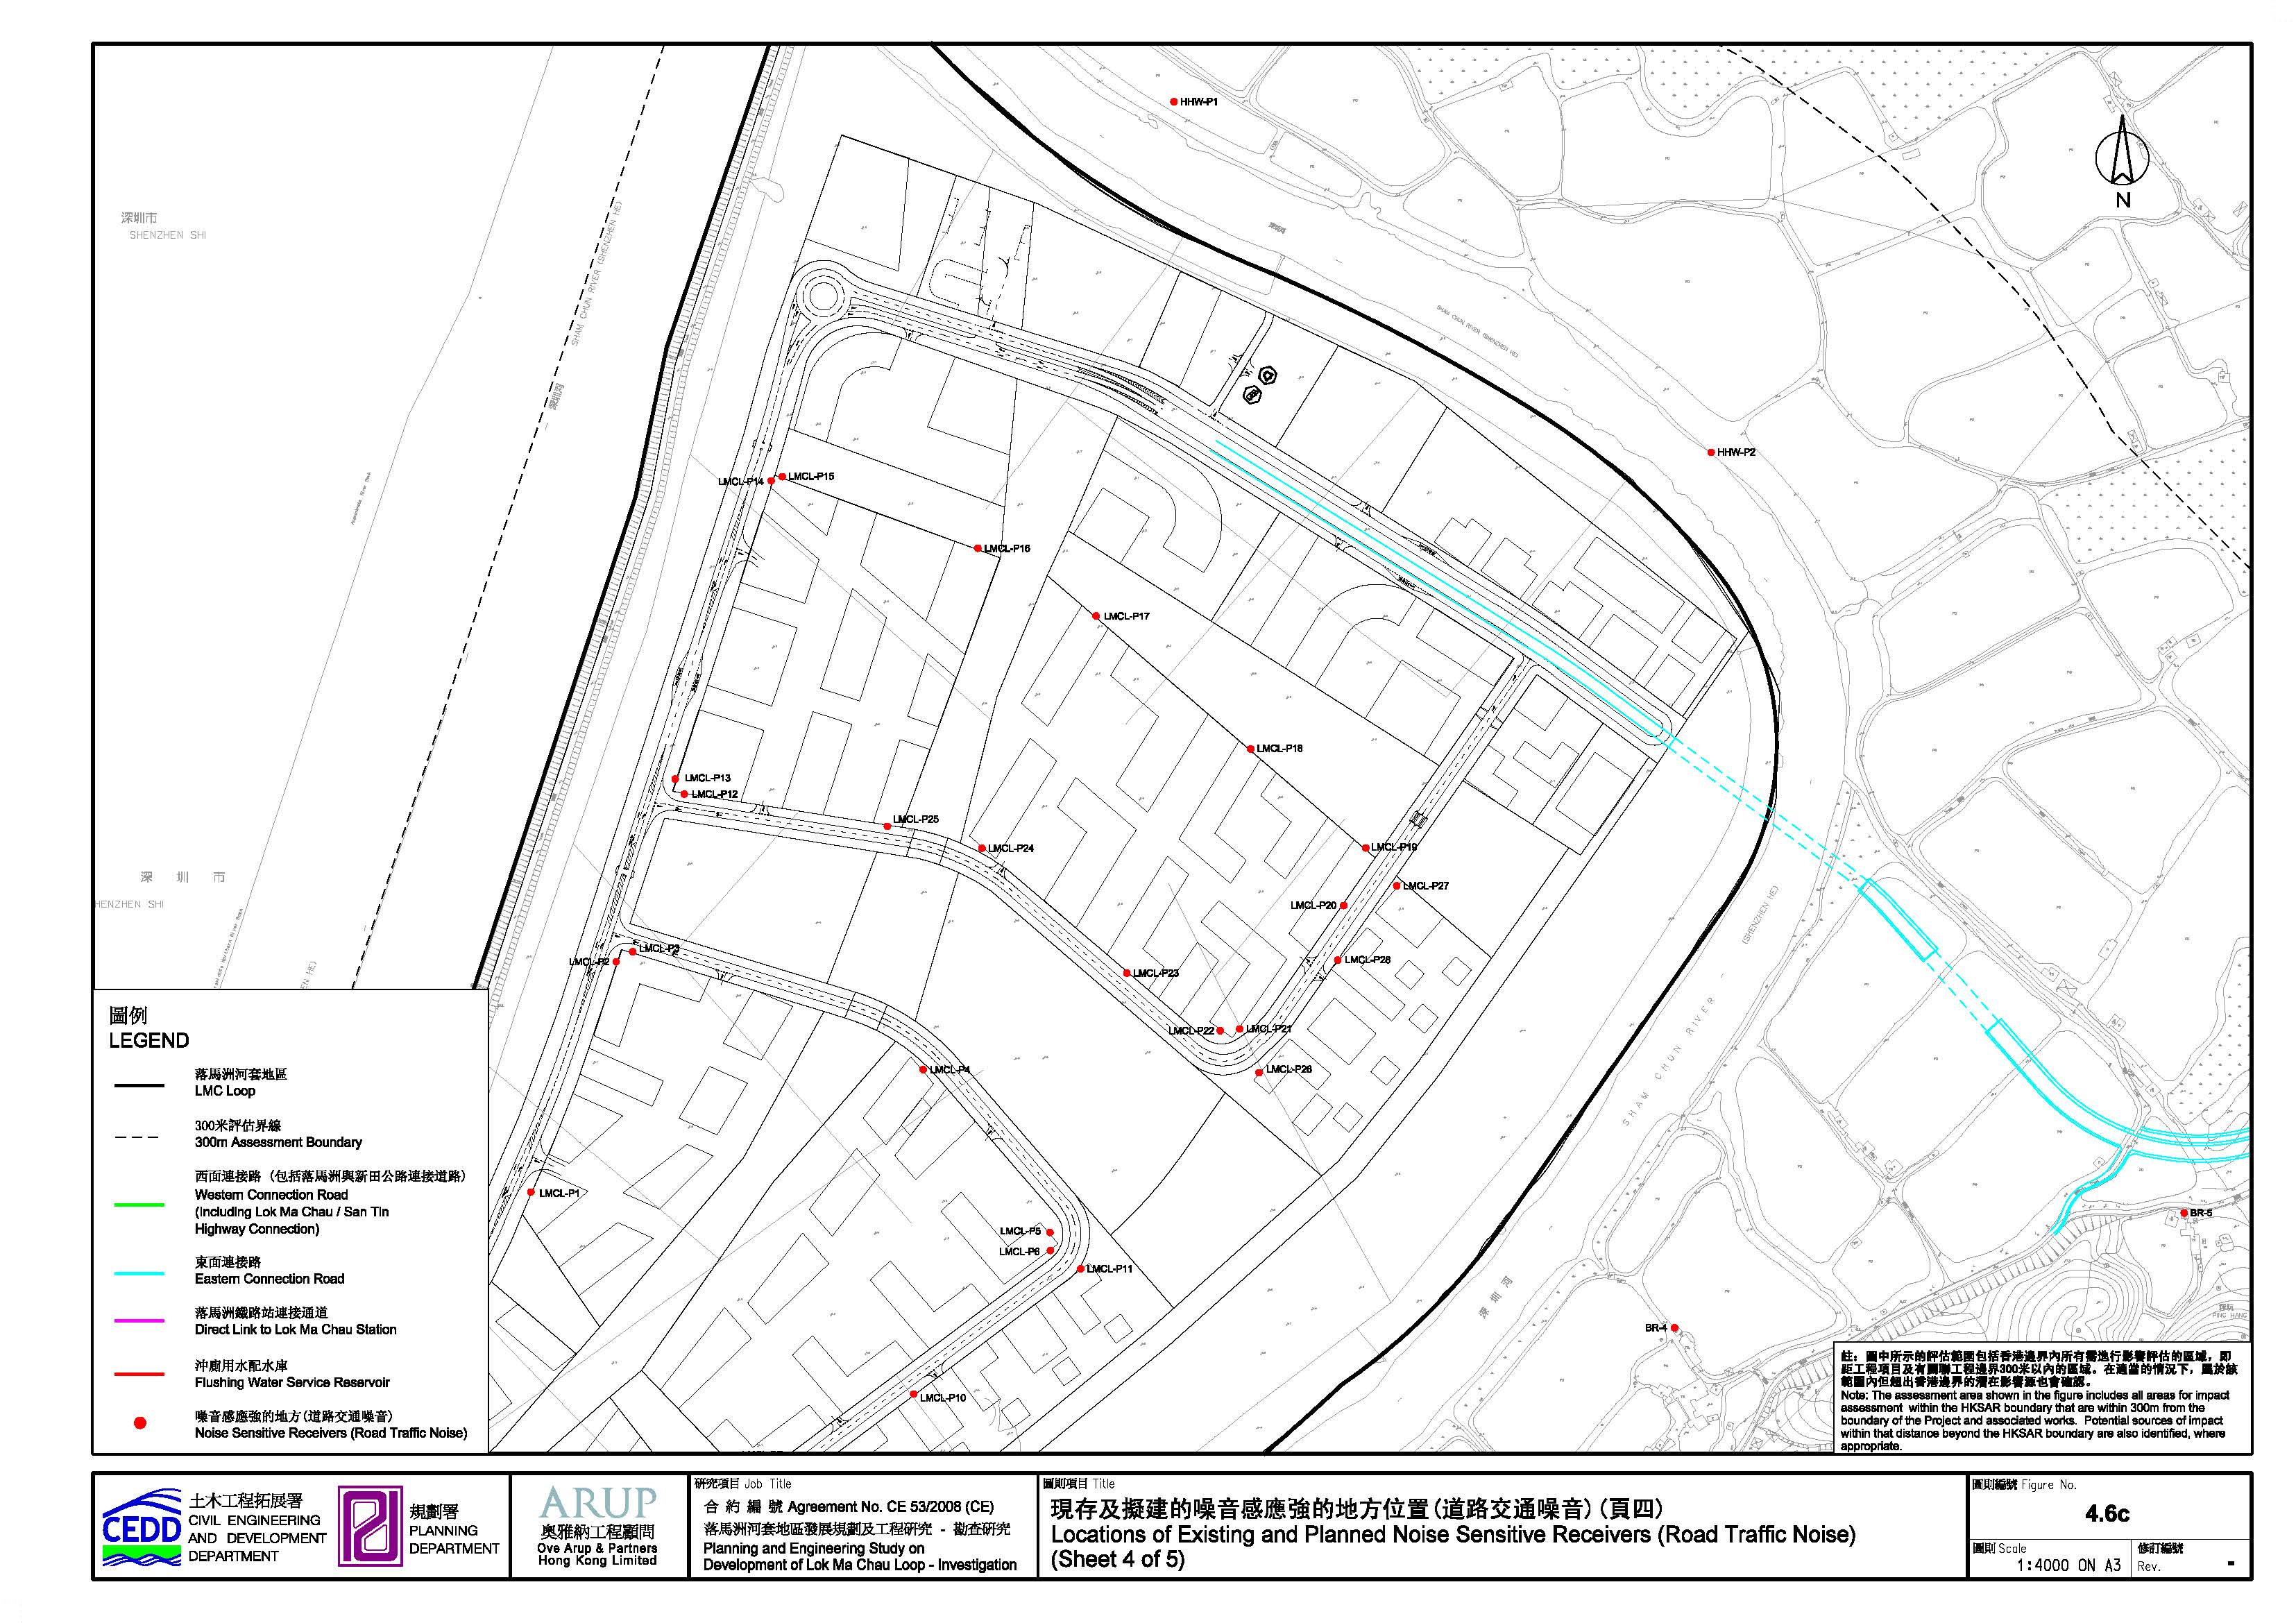
Figure 4.7 Location of Planned Noise Sensitive
Receiver (Fixed Noise)
Figure 4.8a Locations of Temporary Noise Barriers in 2016(Sheet 1 of 3)
Figure 4.8b Locations of Temporary Noise Barriers in 2016(Sheet 2 of 3)
Figure 4.8c Locations of Temporary Noise Barriers in 2016(Sheet 3 of 3)
Figure 4.8d Locations of Temporary Noise Barriers in 2020(Sheet 1 of 3)
Figure 4.8e Locations of Temporary Noise Barriers in 2020(Sheet 2 of 3)
Figure 4.8f Locations of Temporary Noise Barriers in 2020(Sheet 3 of 3)
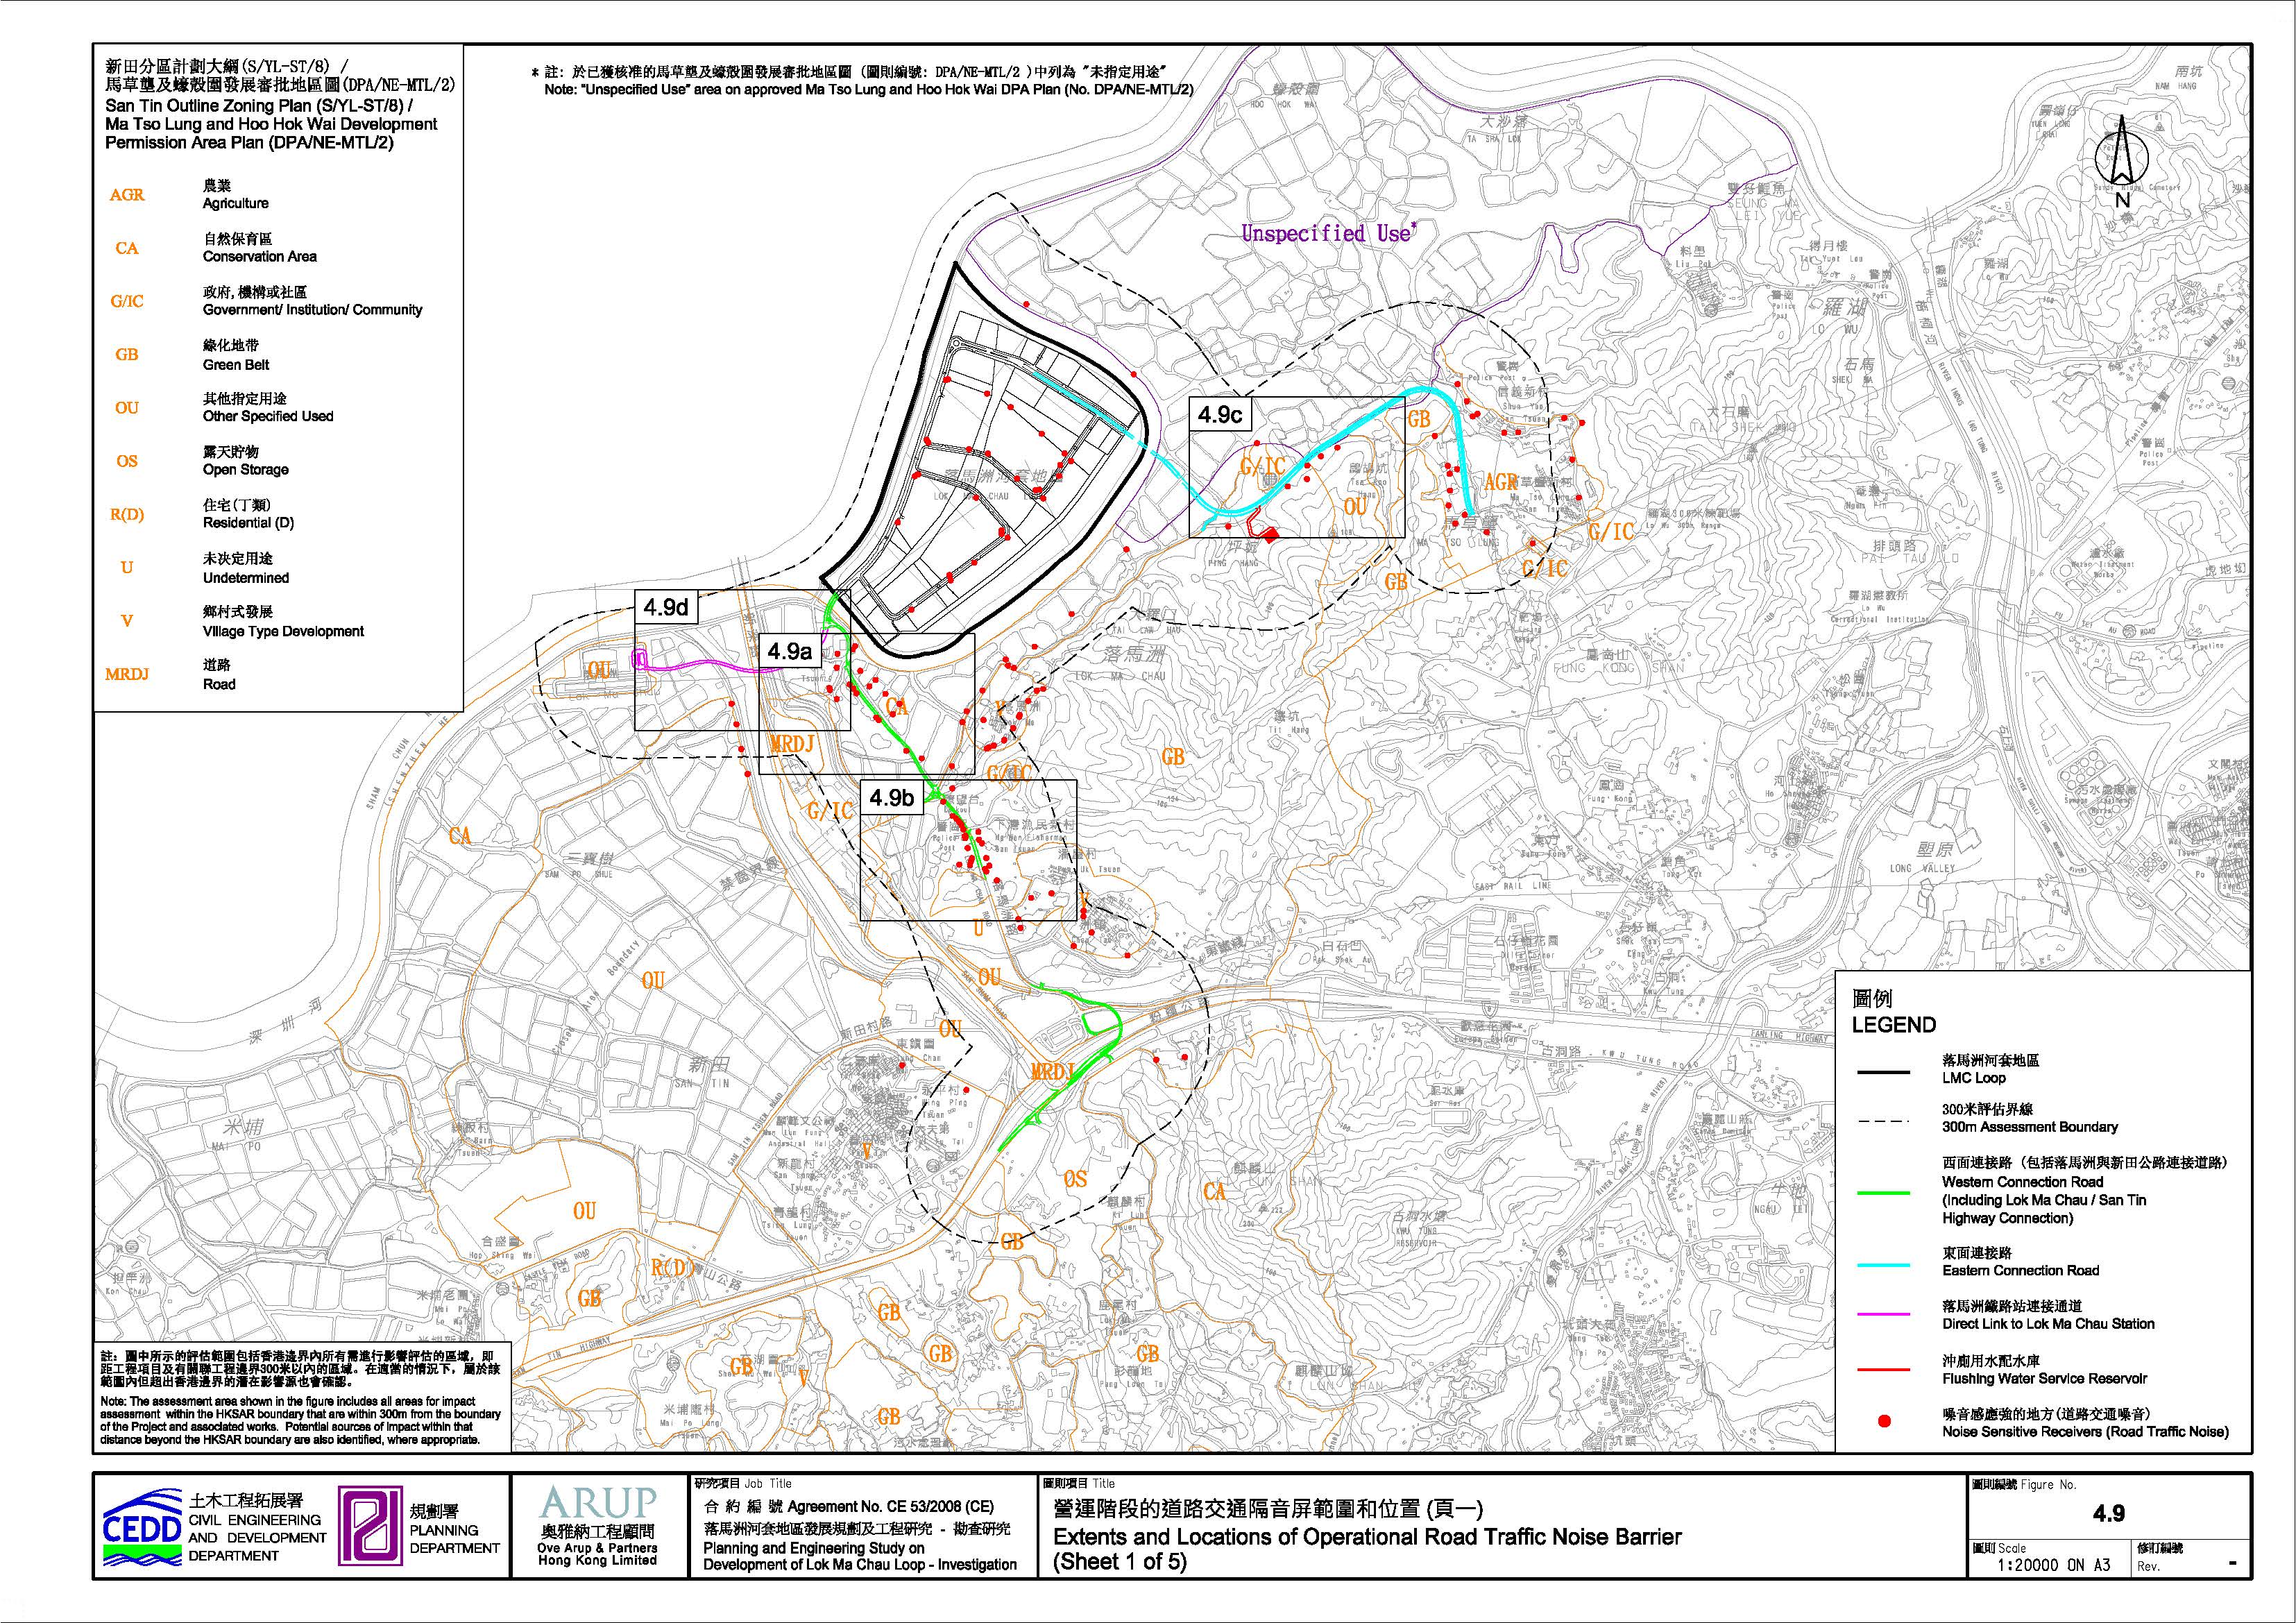
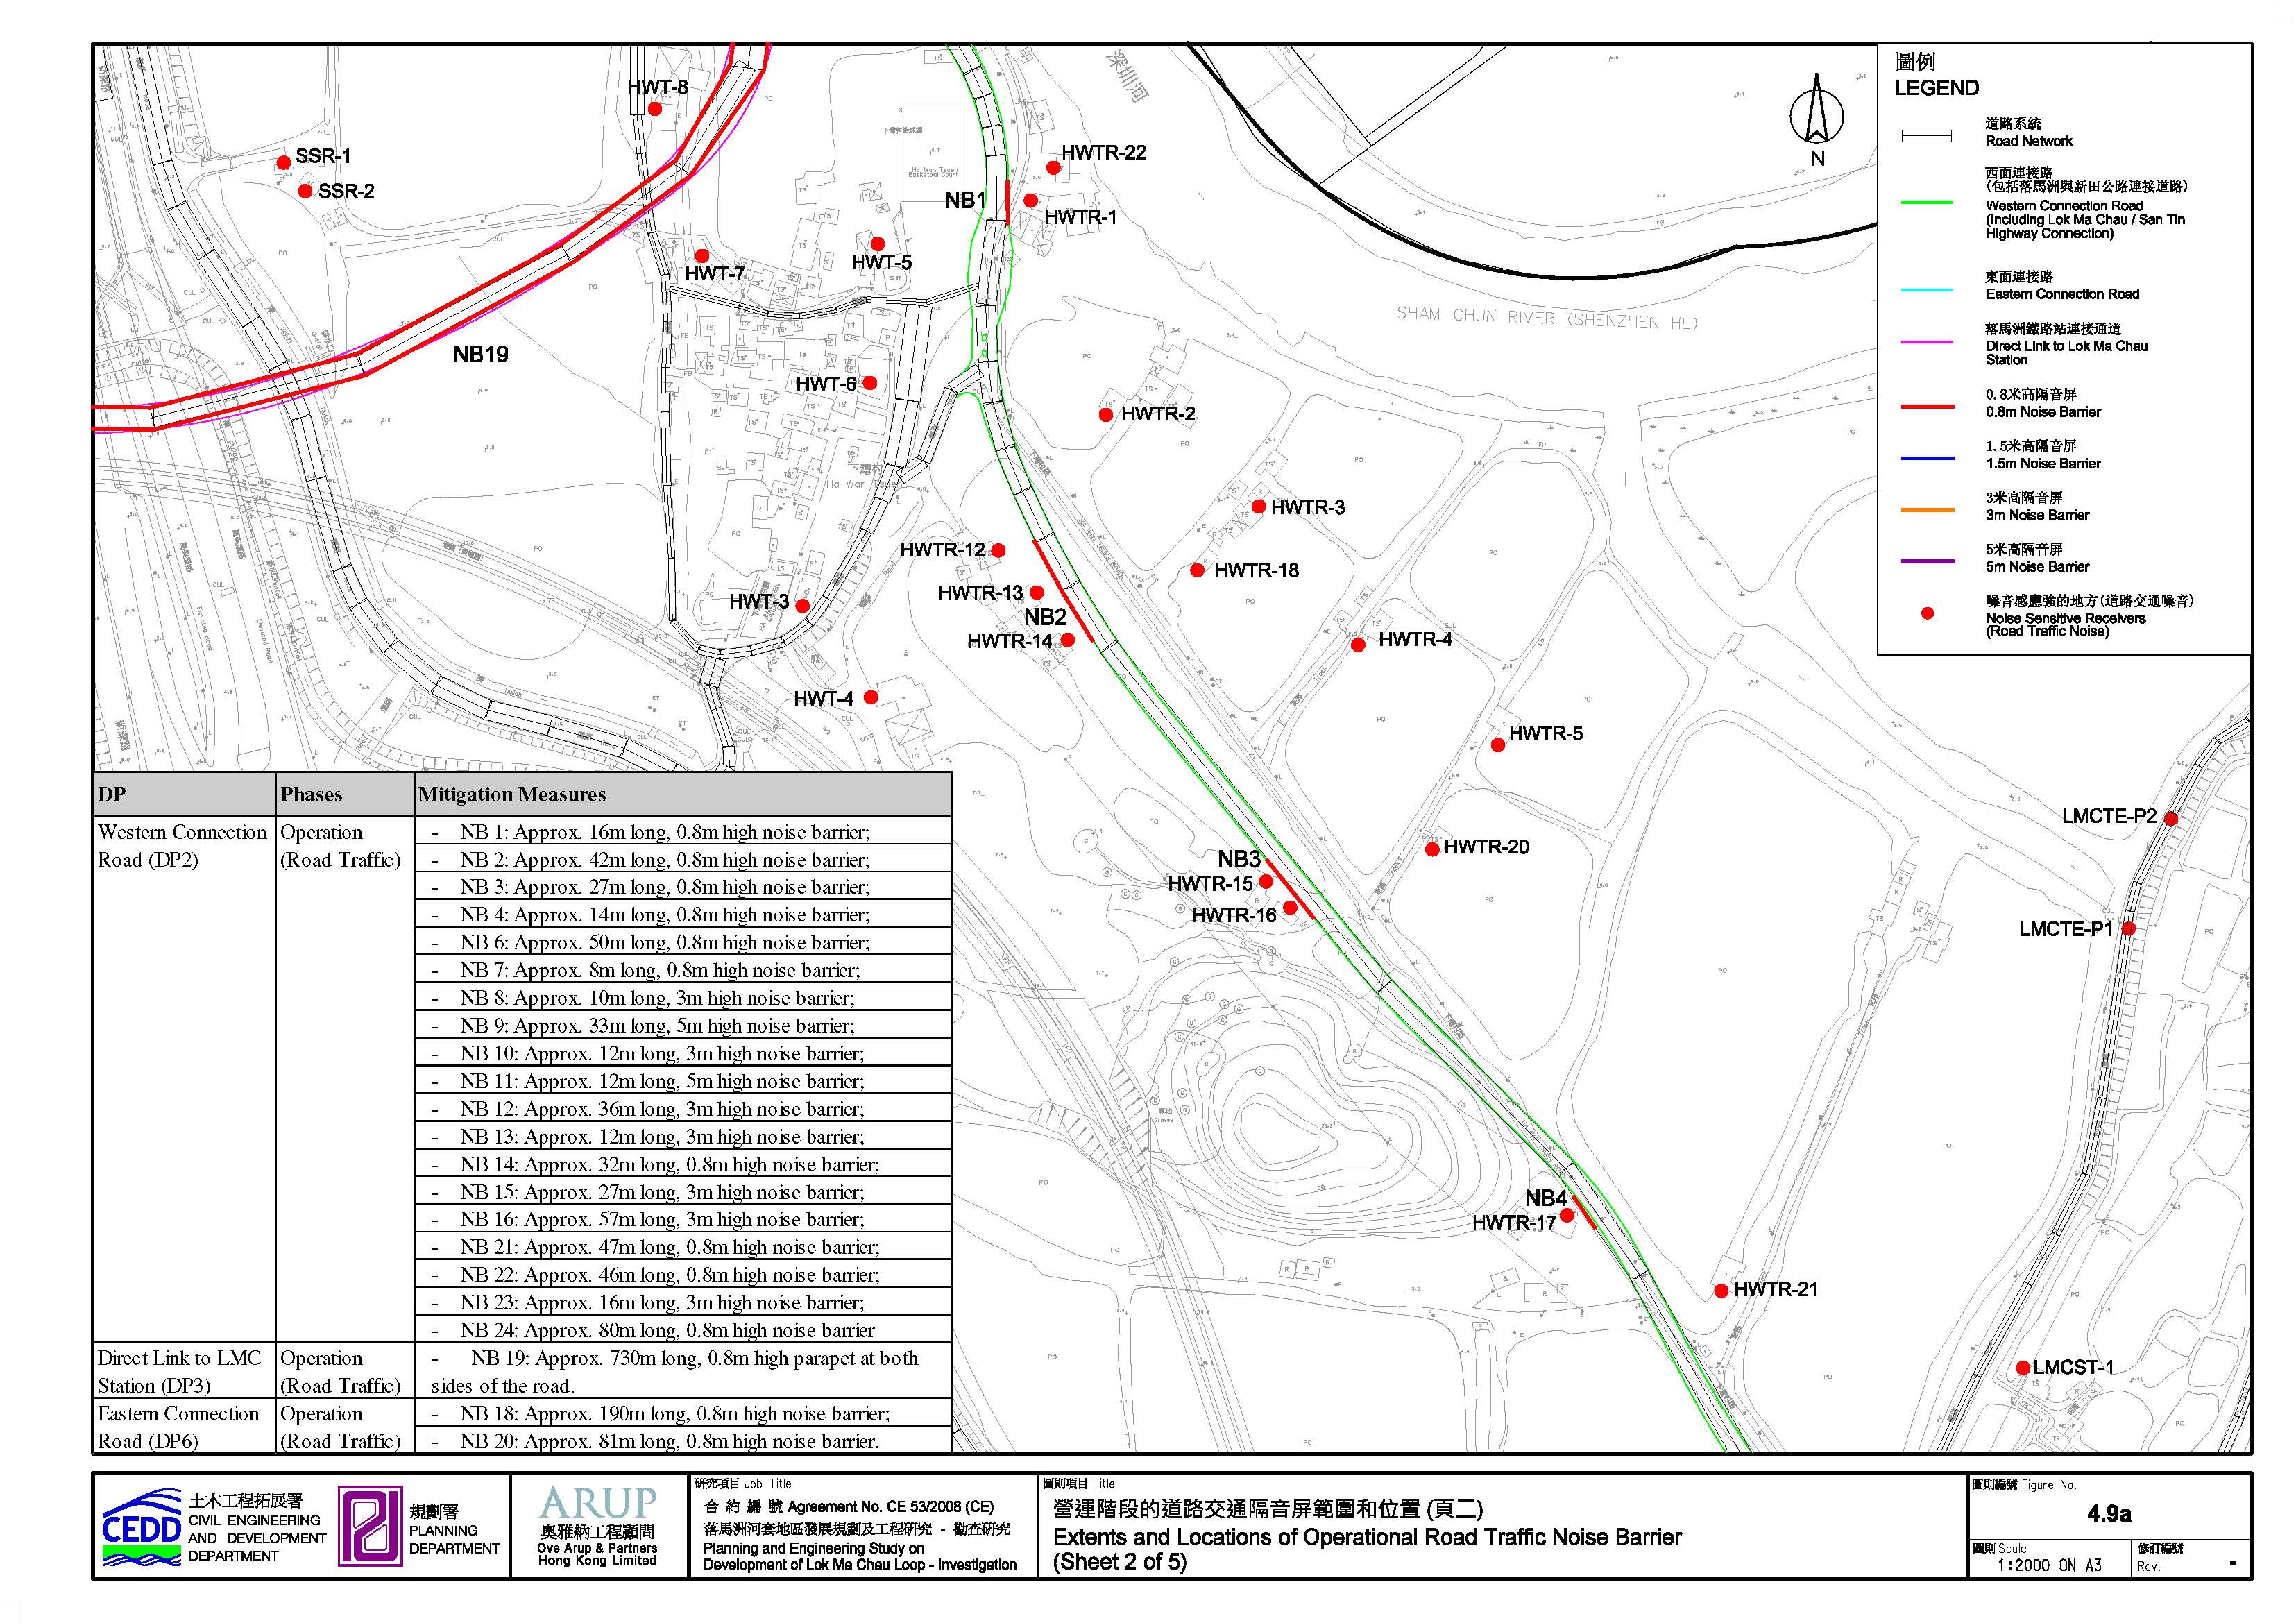
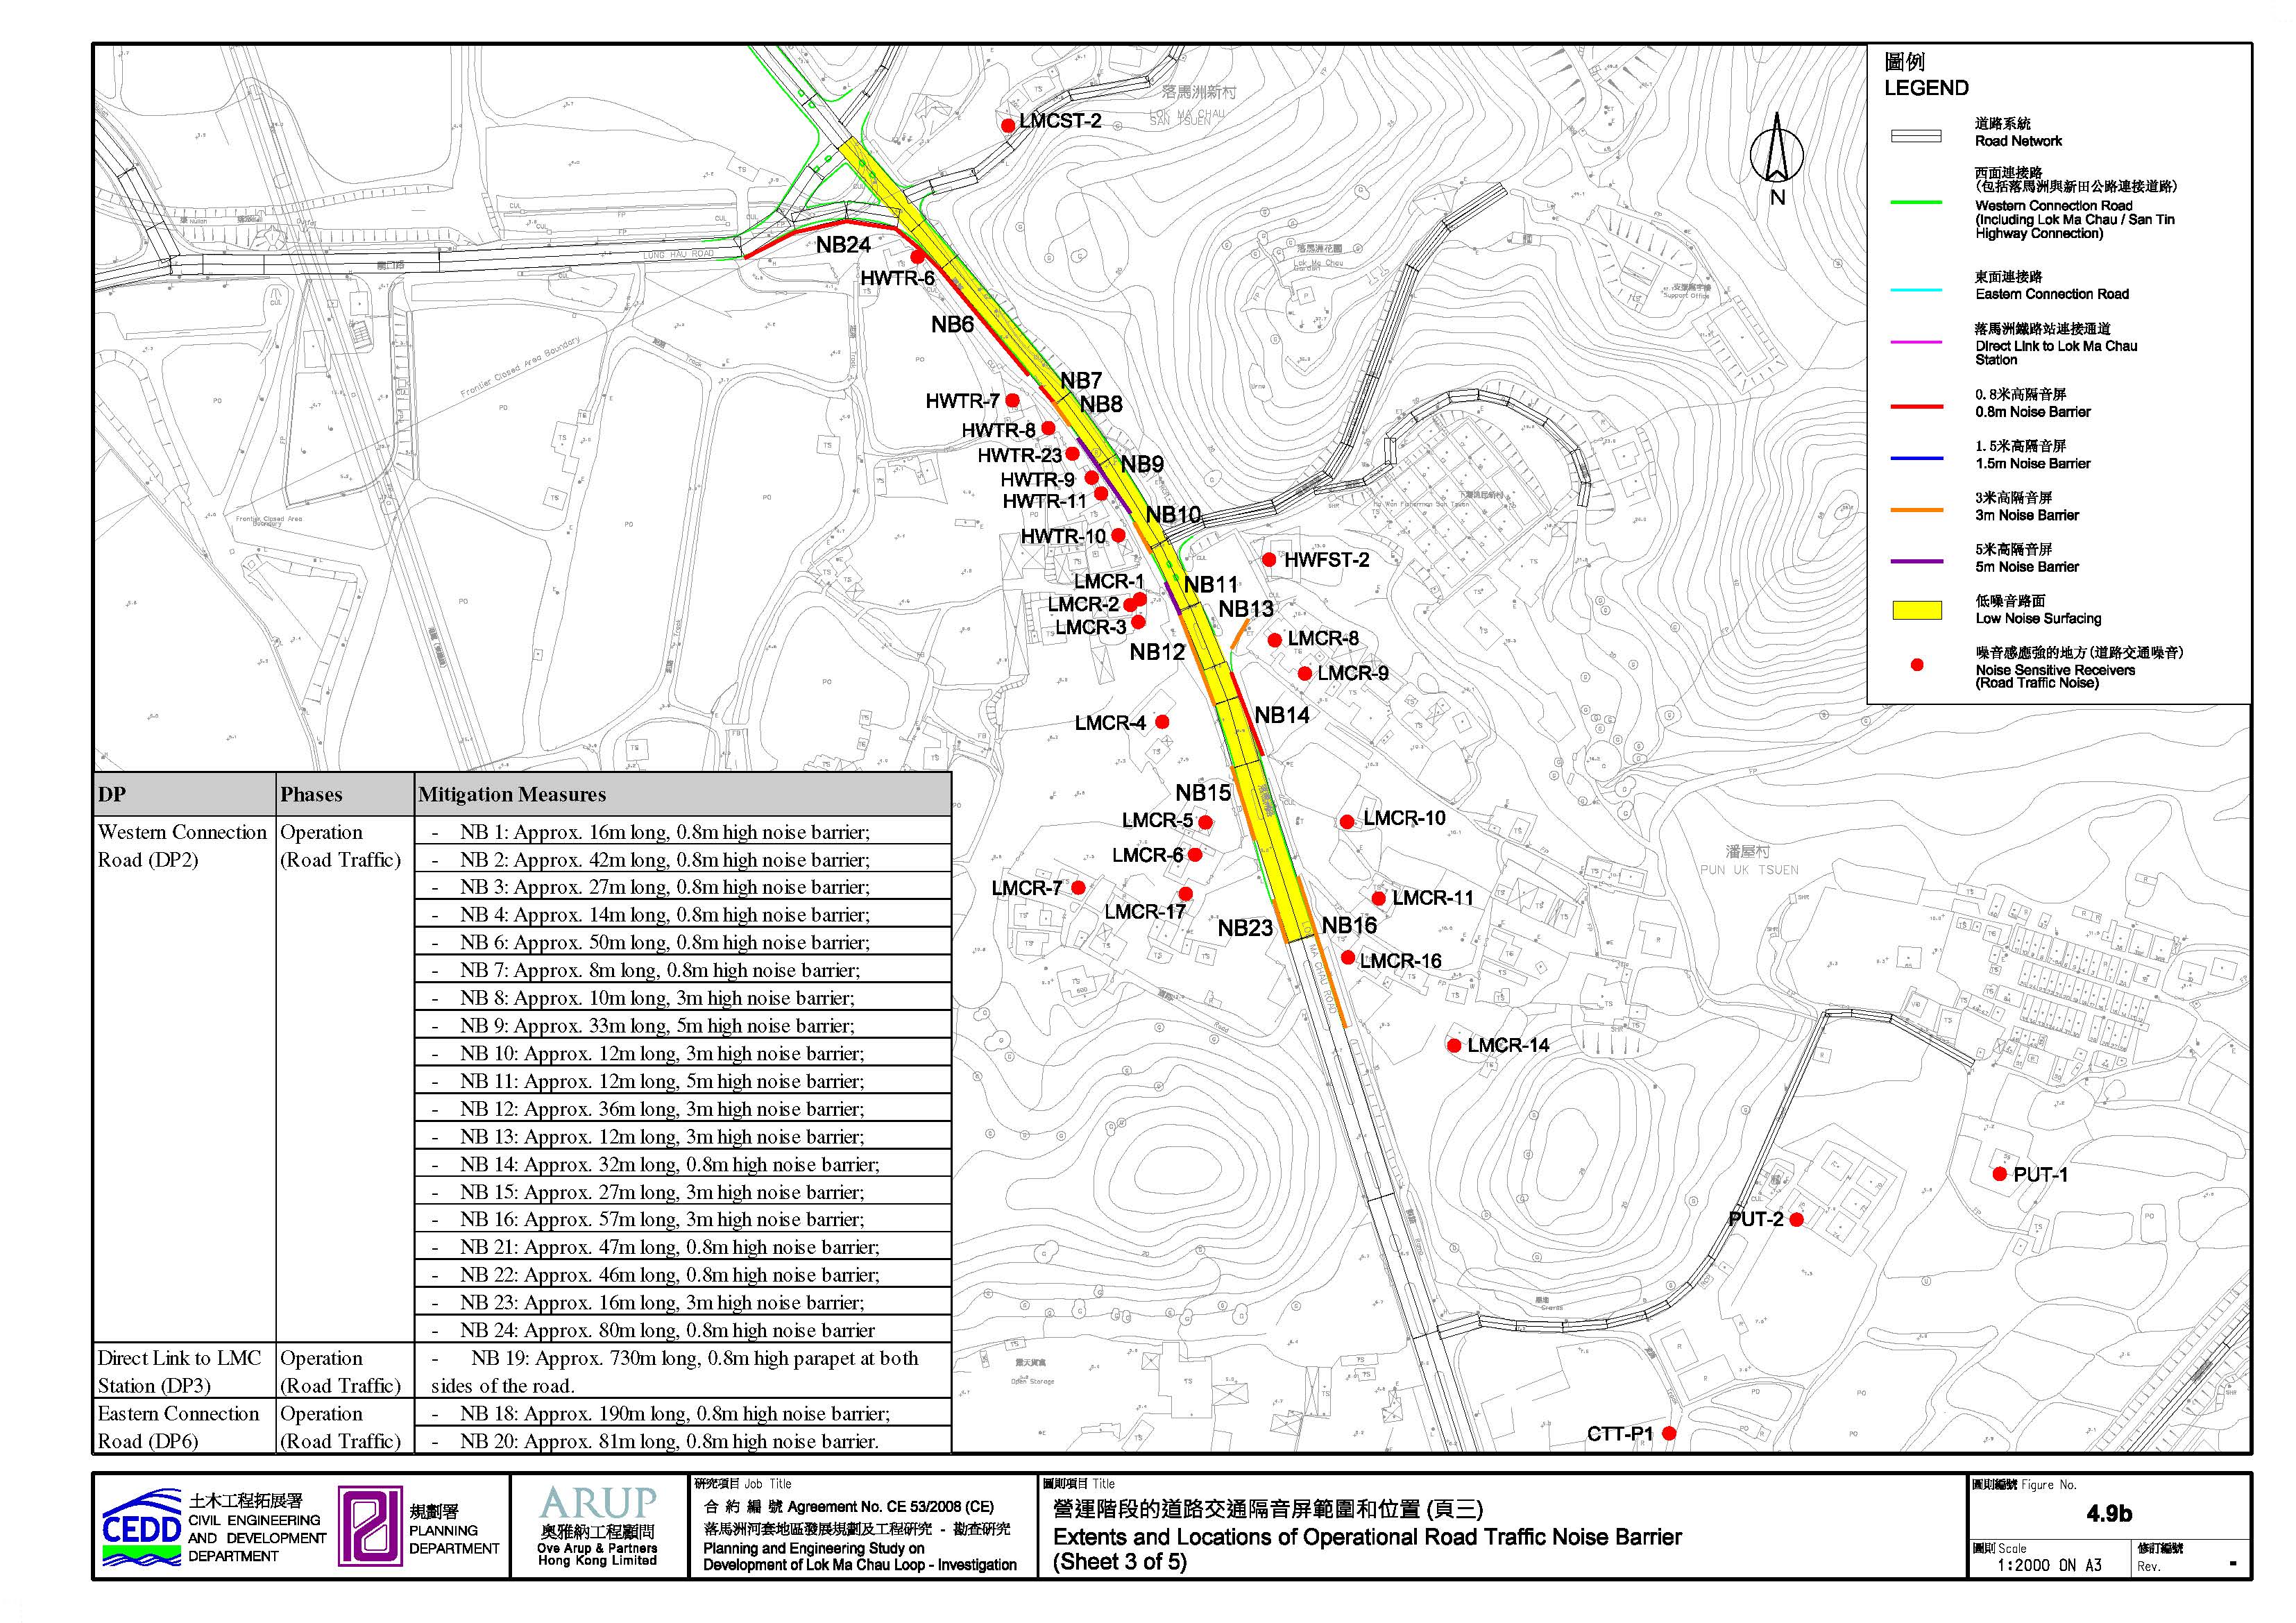
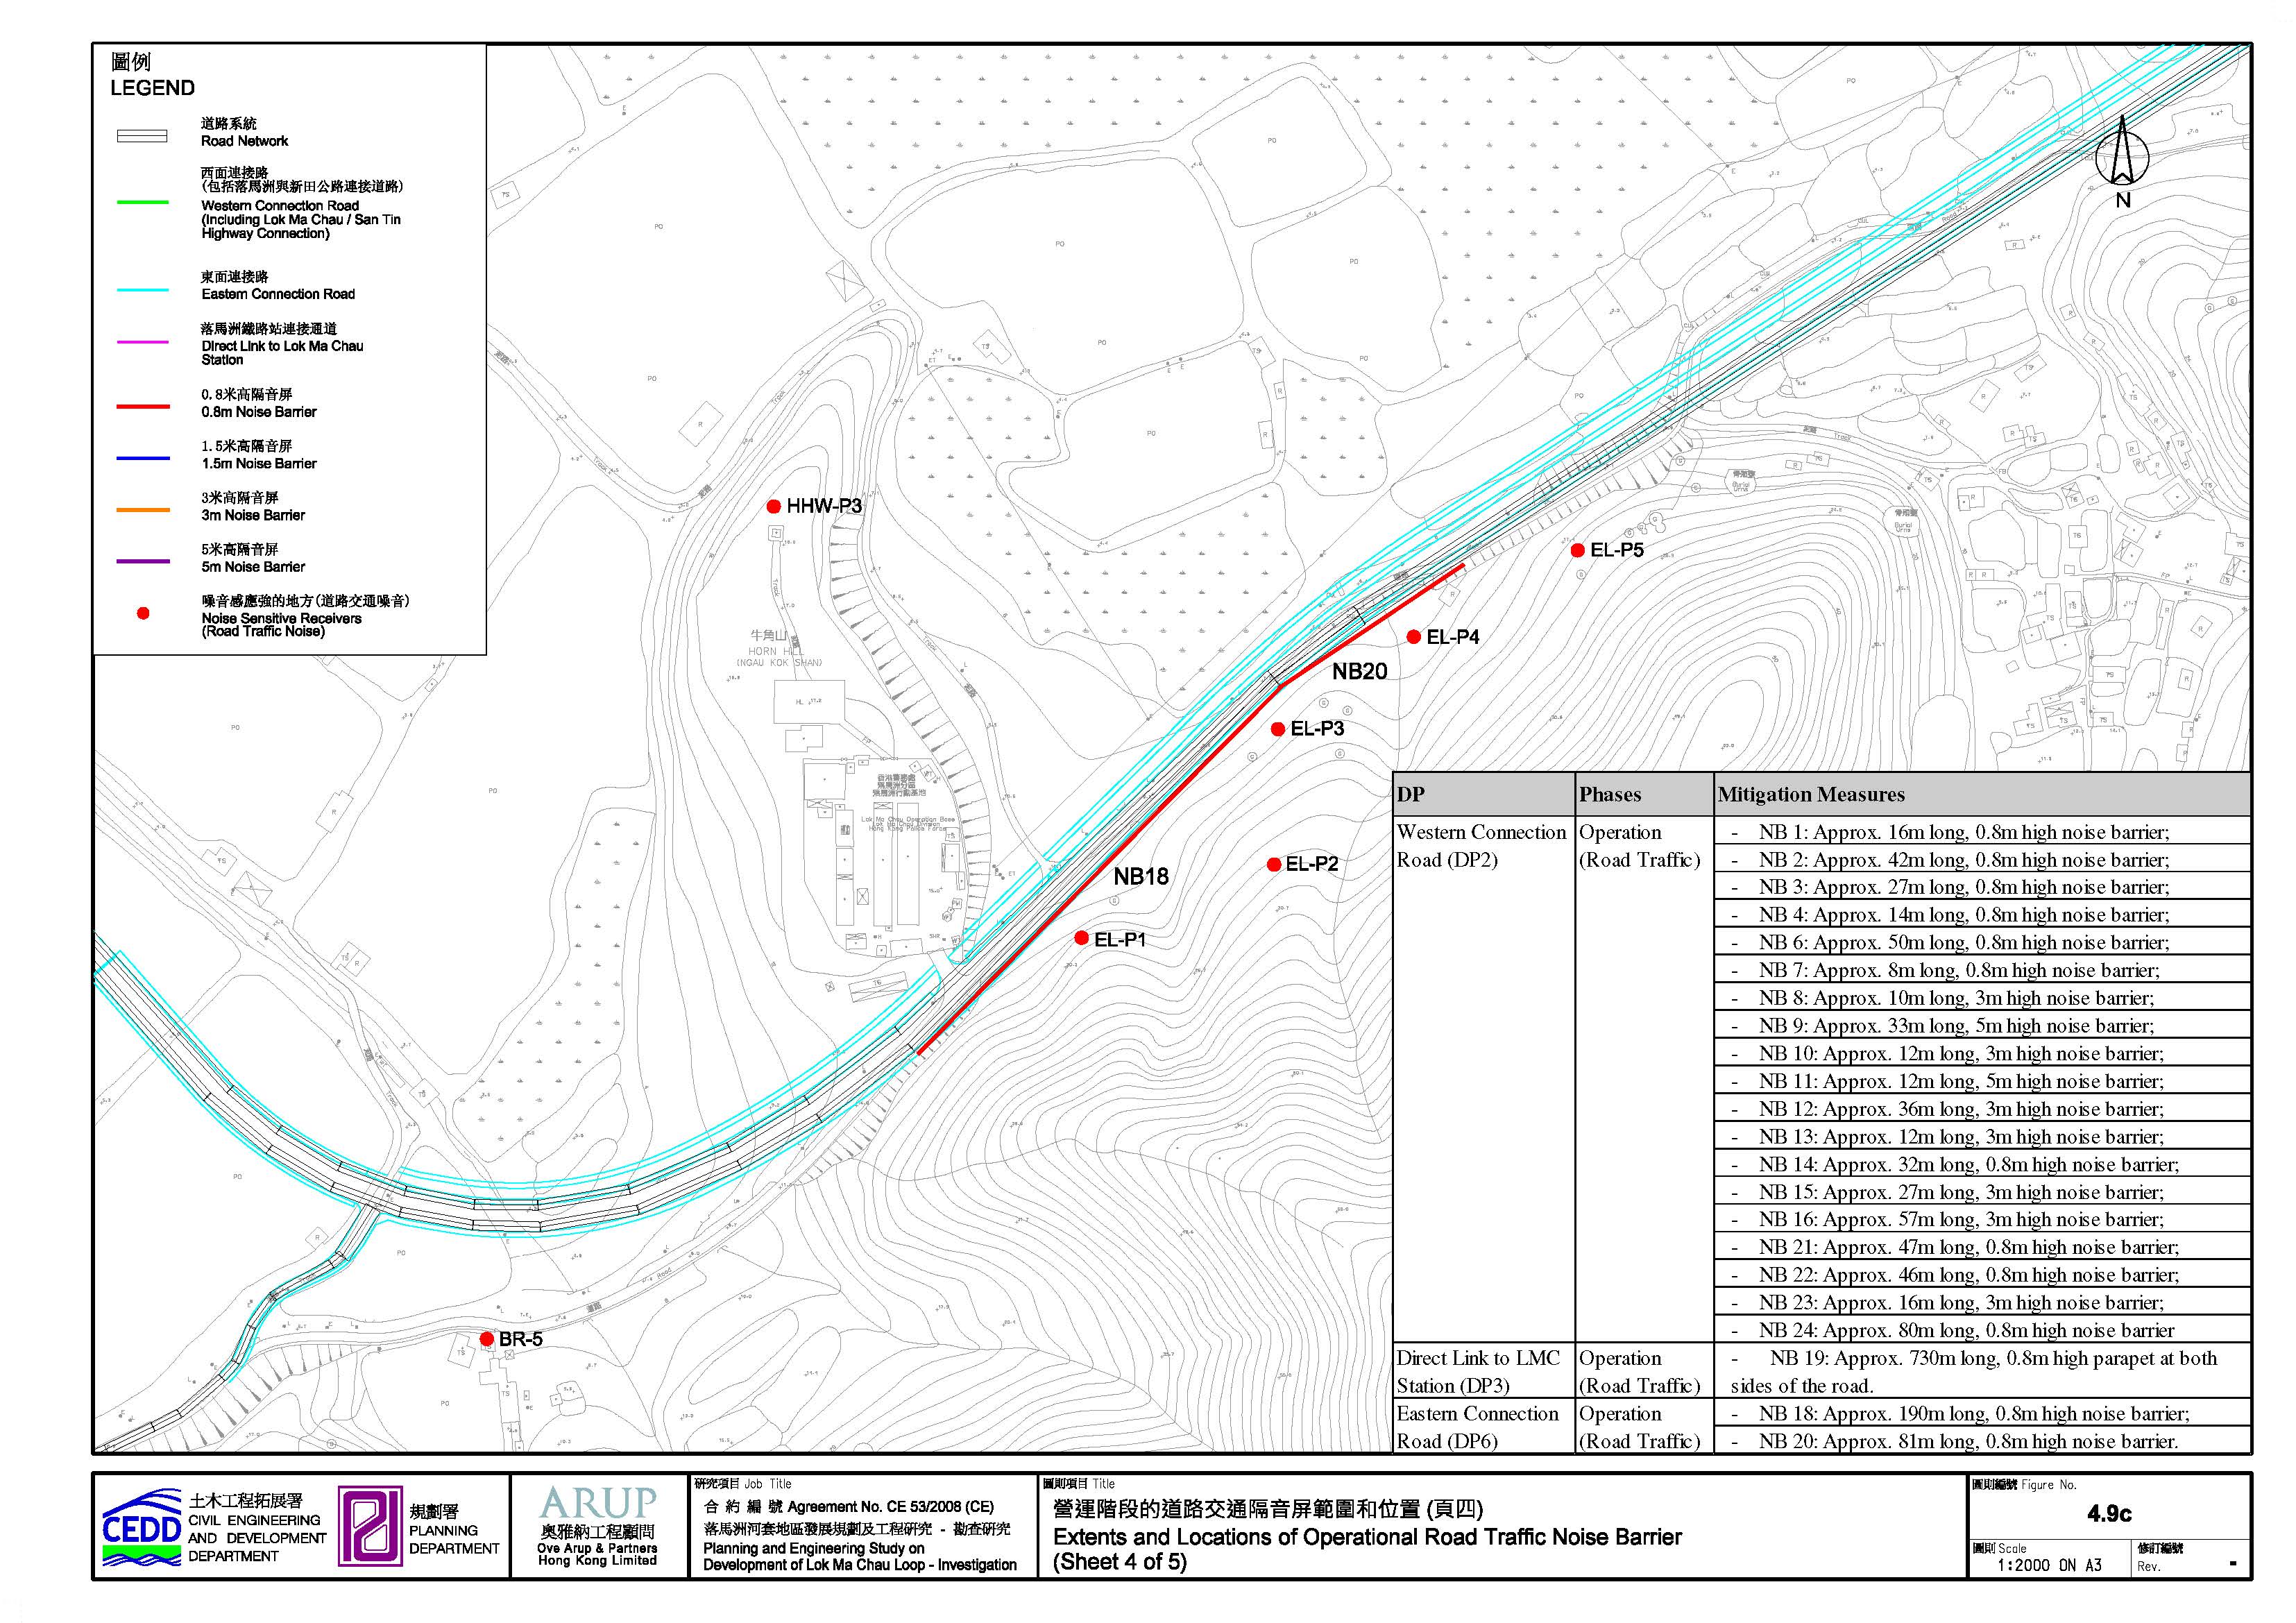
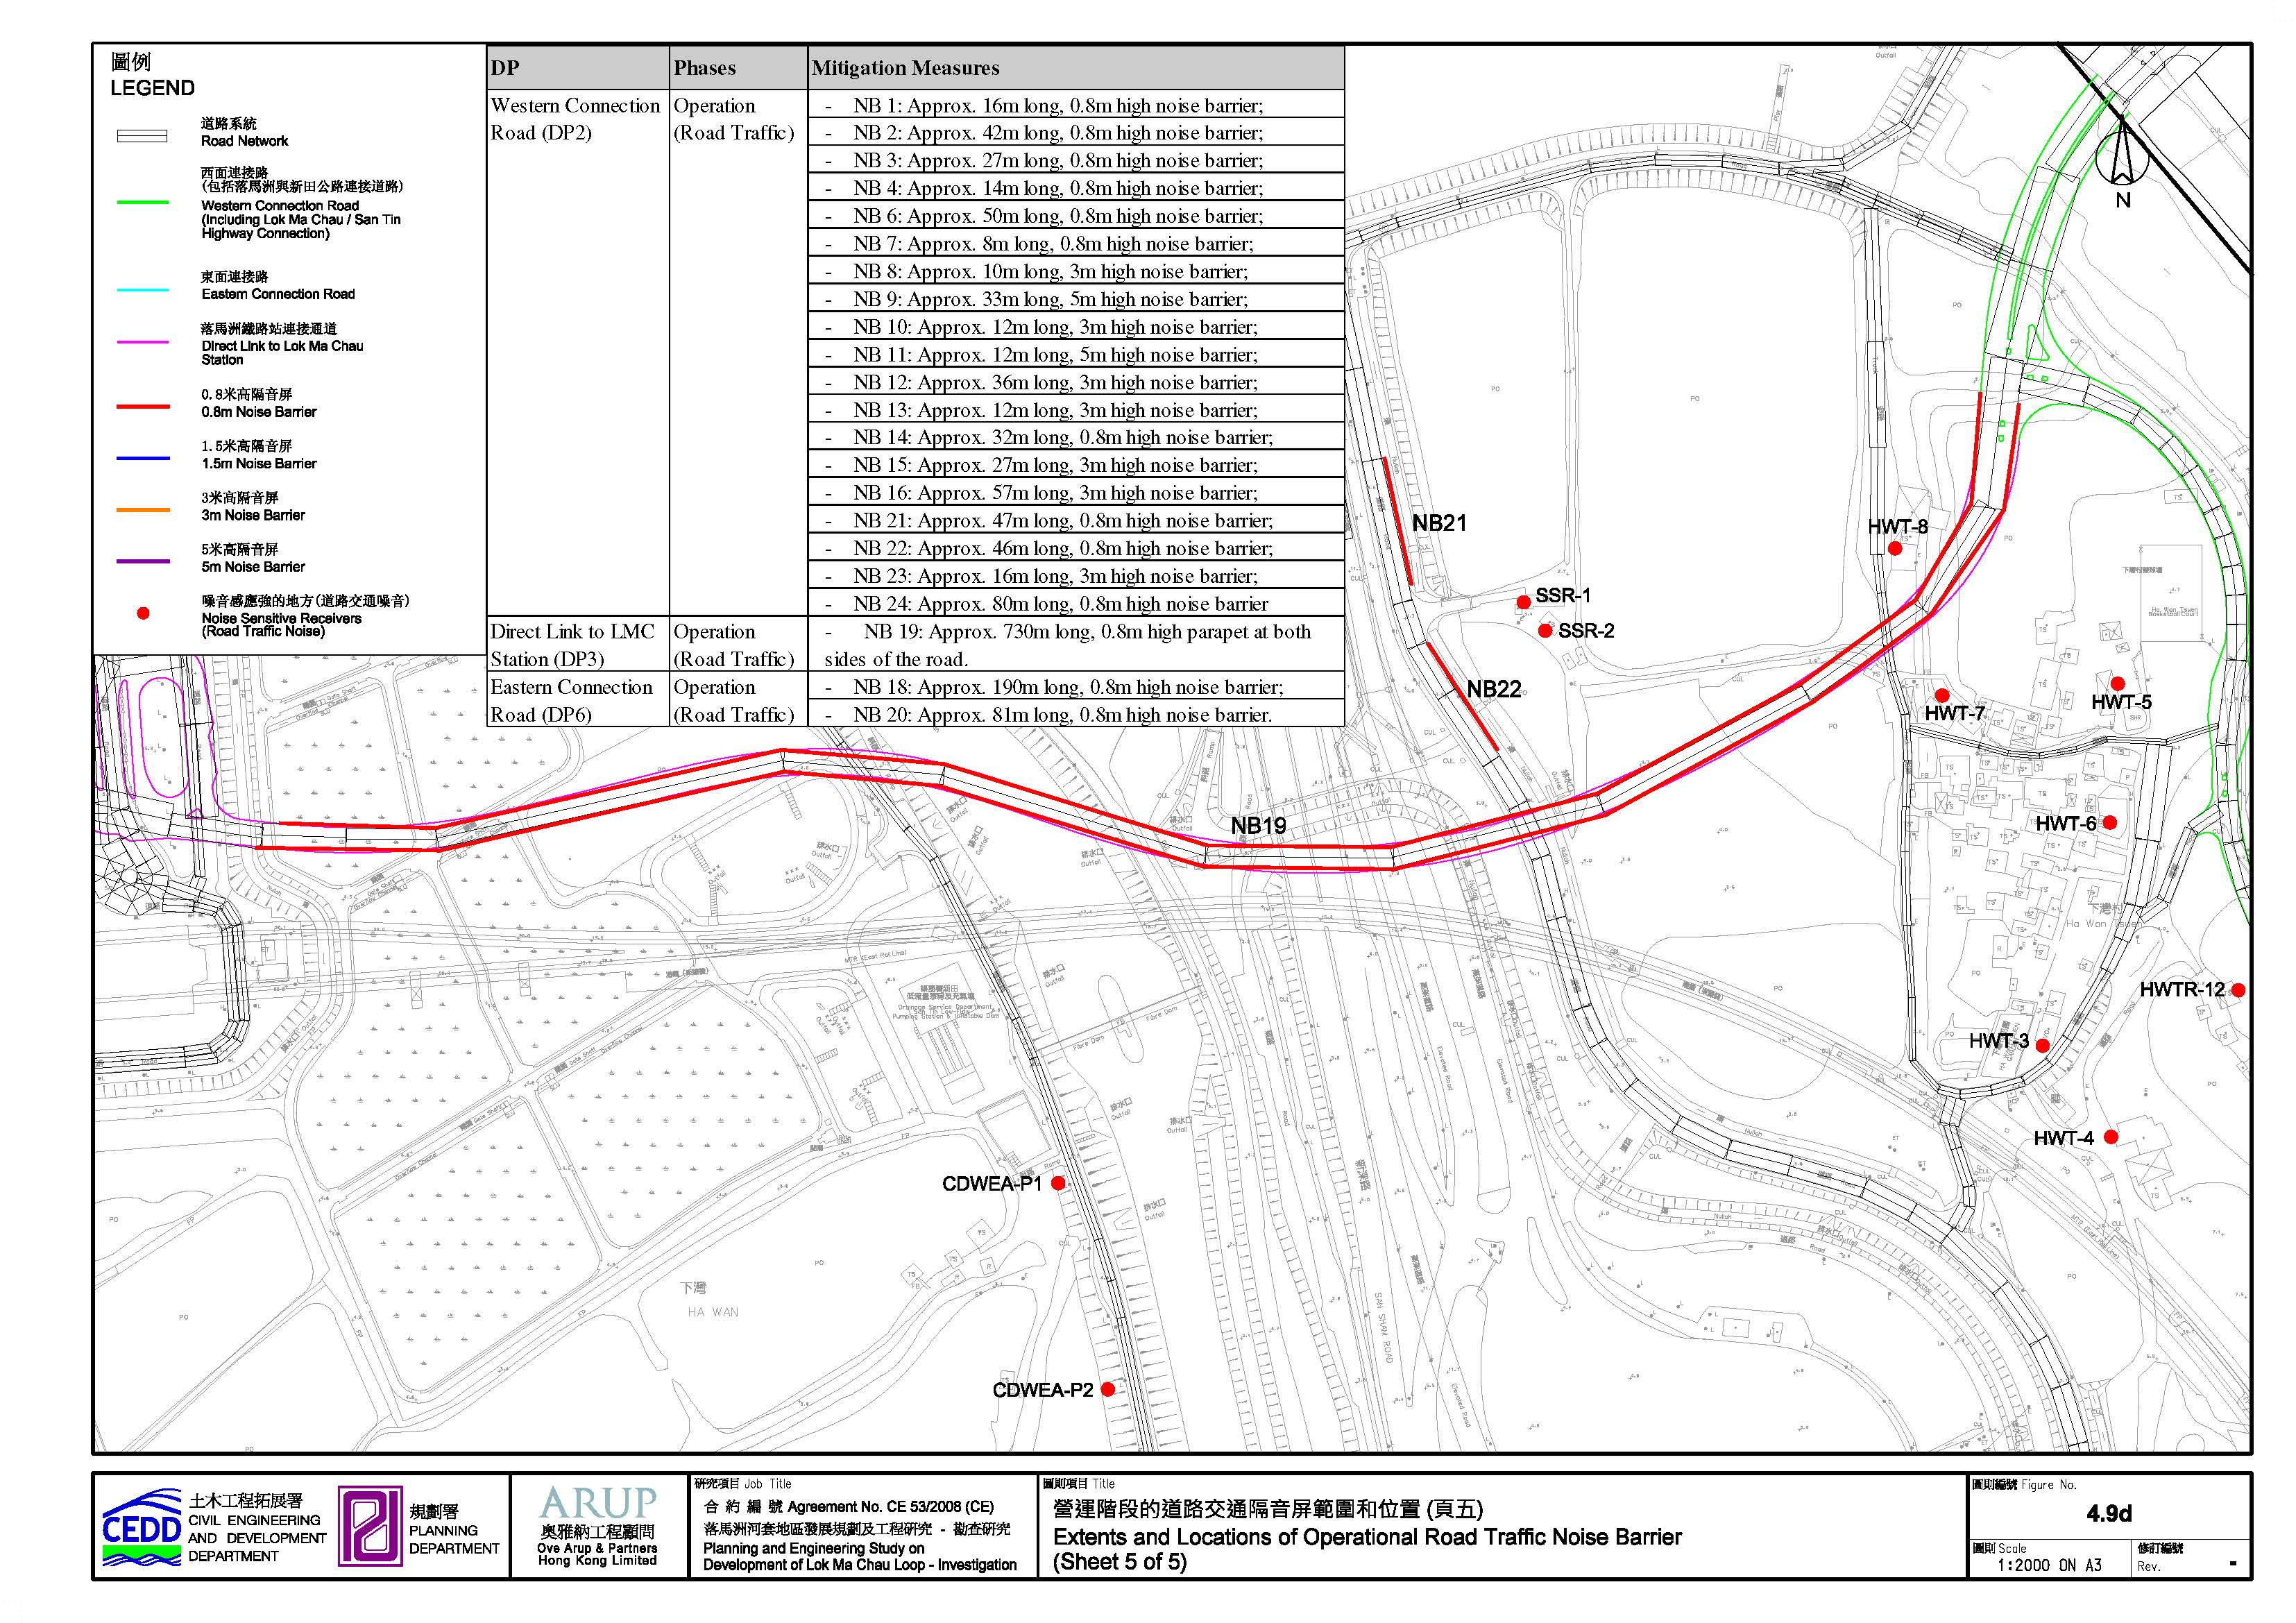
Figure 4.9 Extent and Locations of Noise Barrier in 2042(Sheet 1 of 5)
Figure 4.9a Extent and Locations of Noise Barrier in 2042(Sheet 2 of 5)
Figure 4.9b Extent and Locations of Noise Barrier in 2042(Sheet 3 of 5)
Figure 4.9c Extent and Locations of Noise Barrier in 2042(Sheet 4 of 5)
Figure 4.9d Extent and Locations of Noise Barrier in 2042(Sheet 5 of 5)
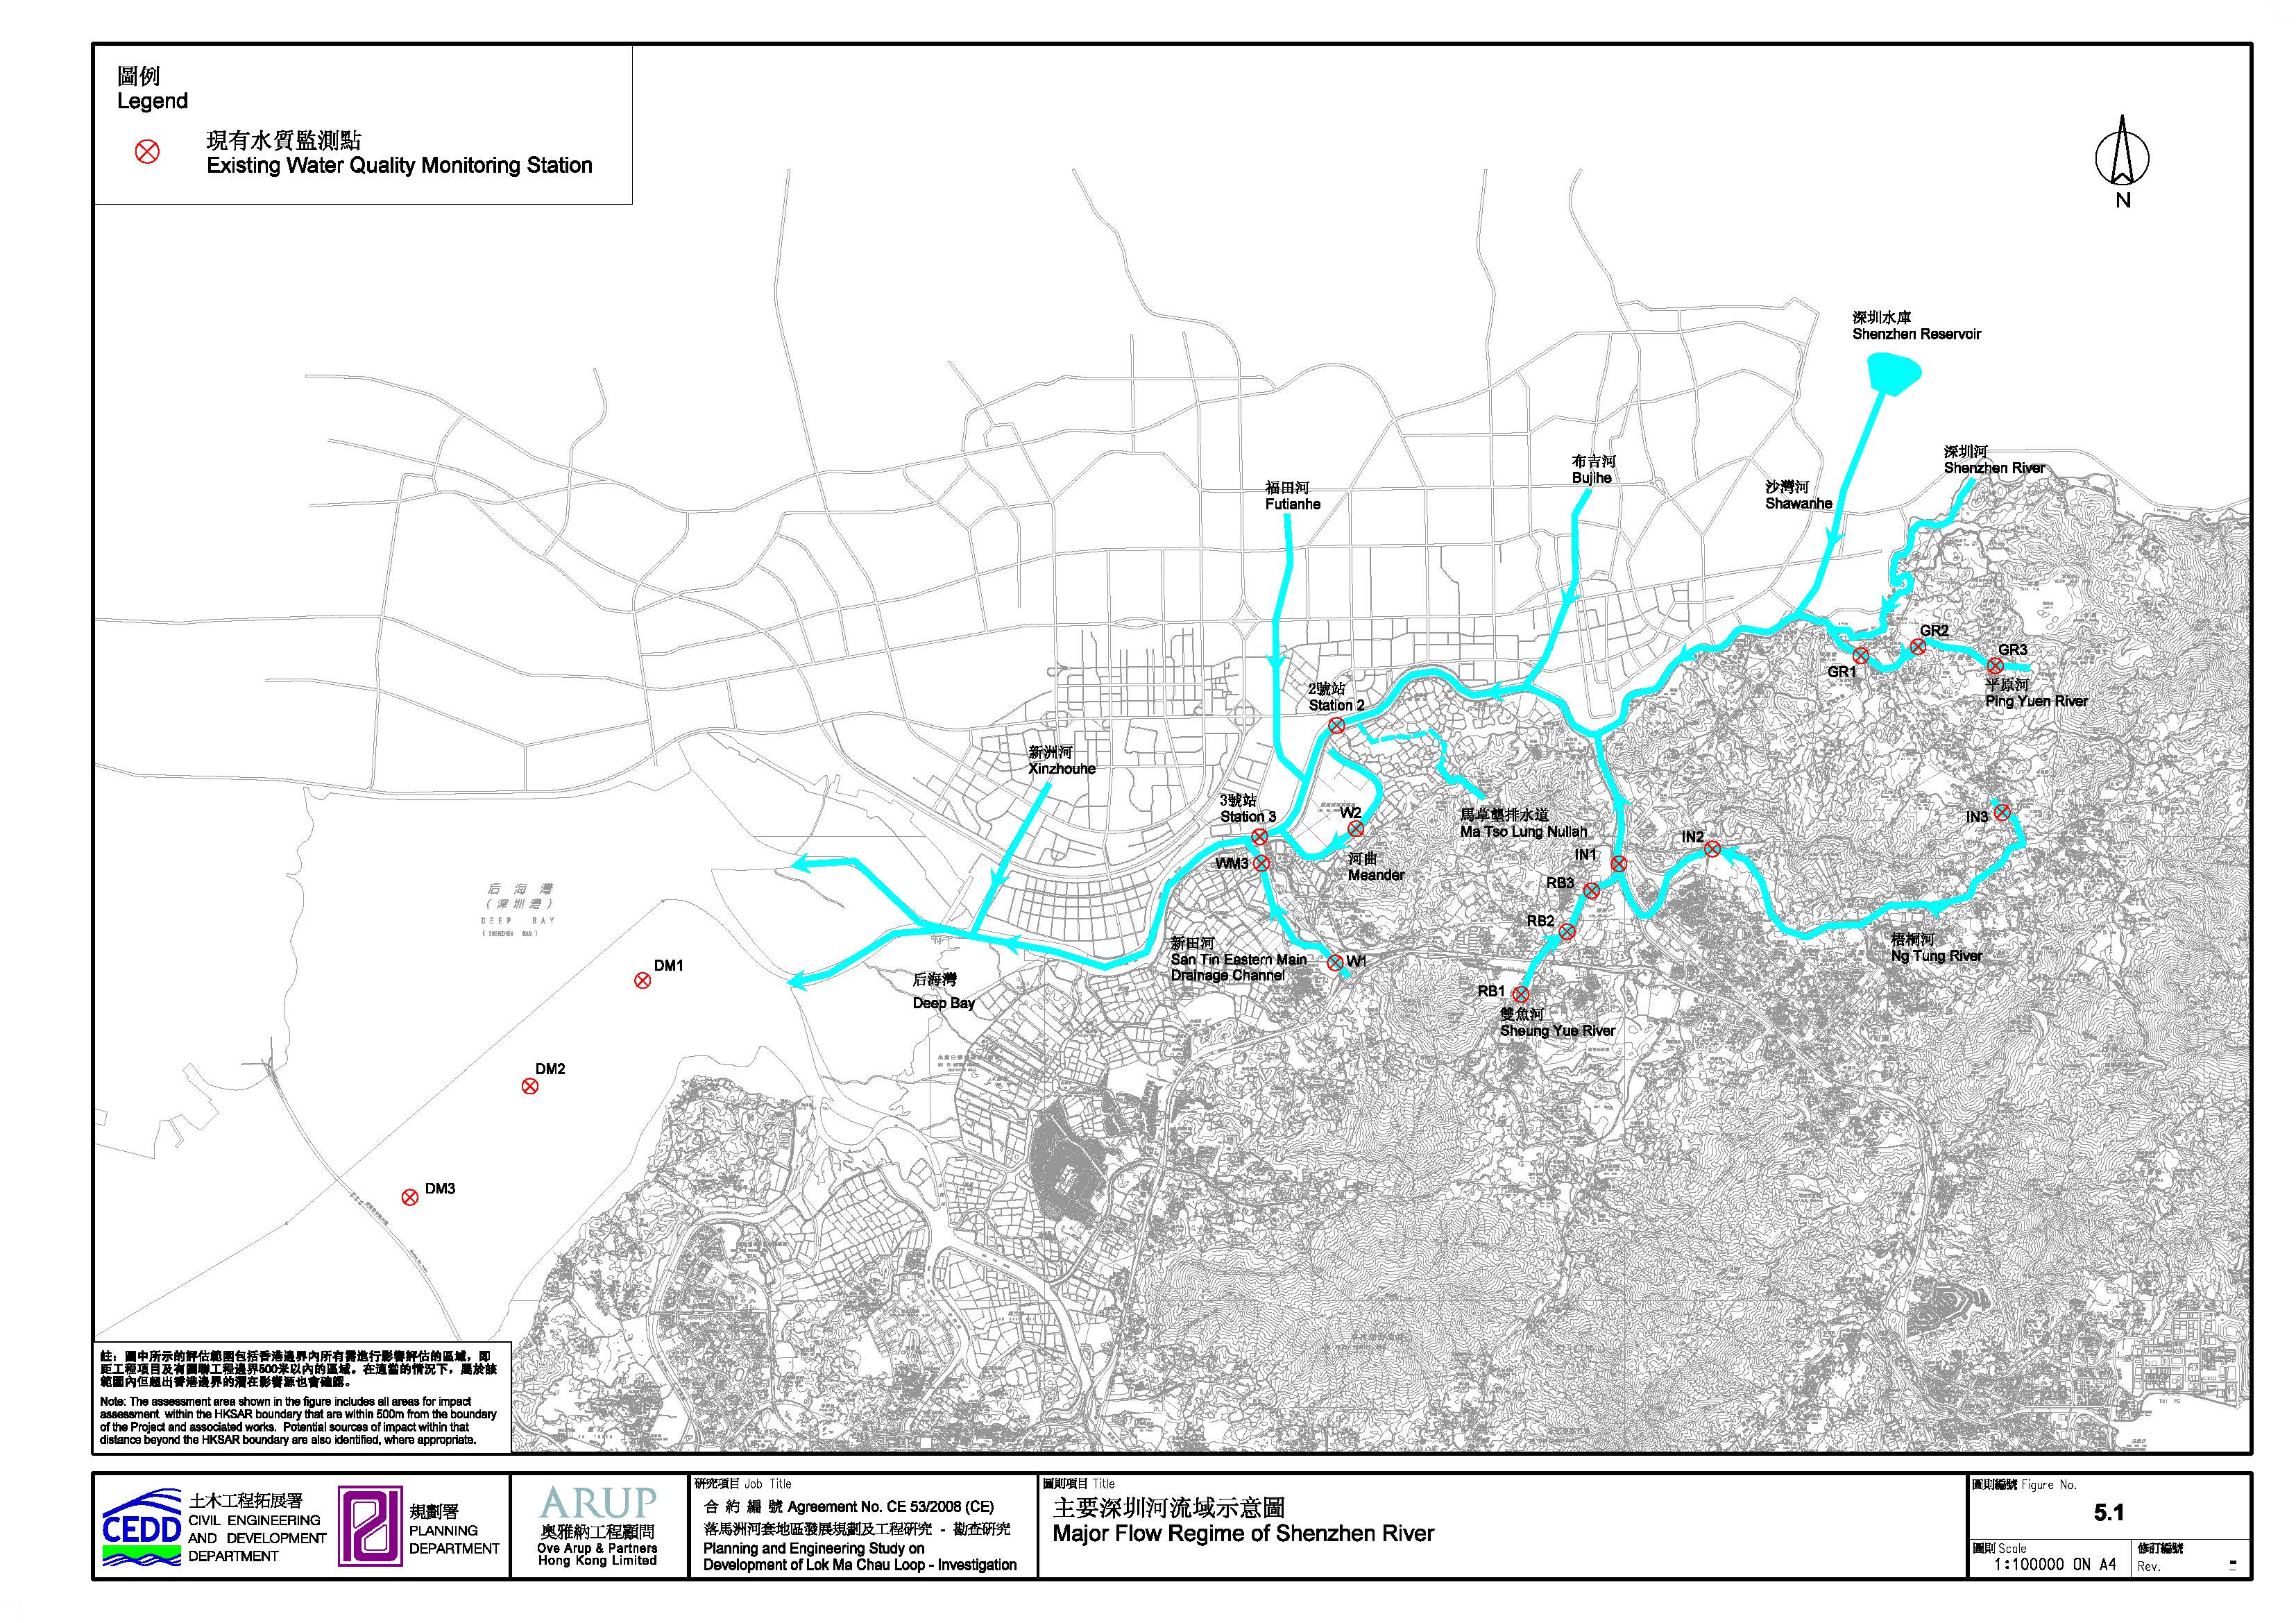
Figure 5.1 Flow Regime for Shenzhen River
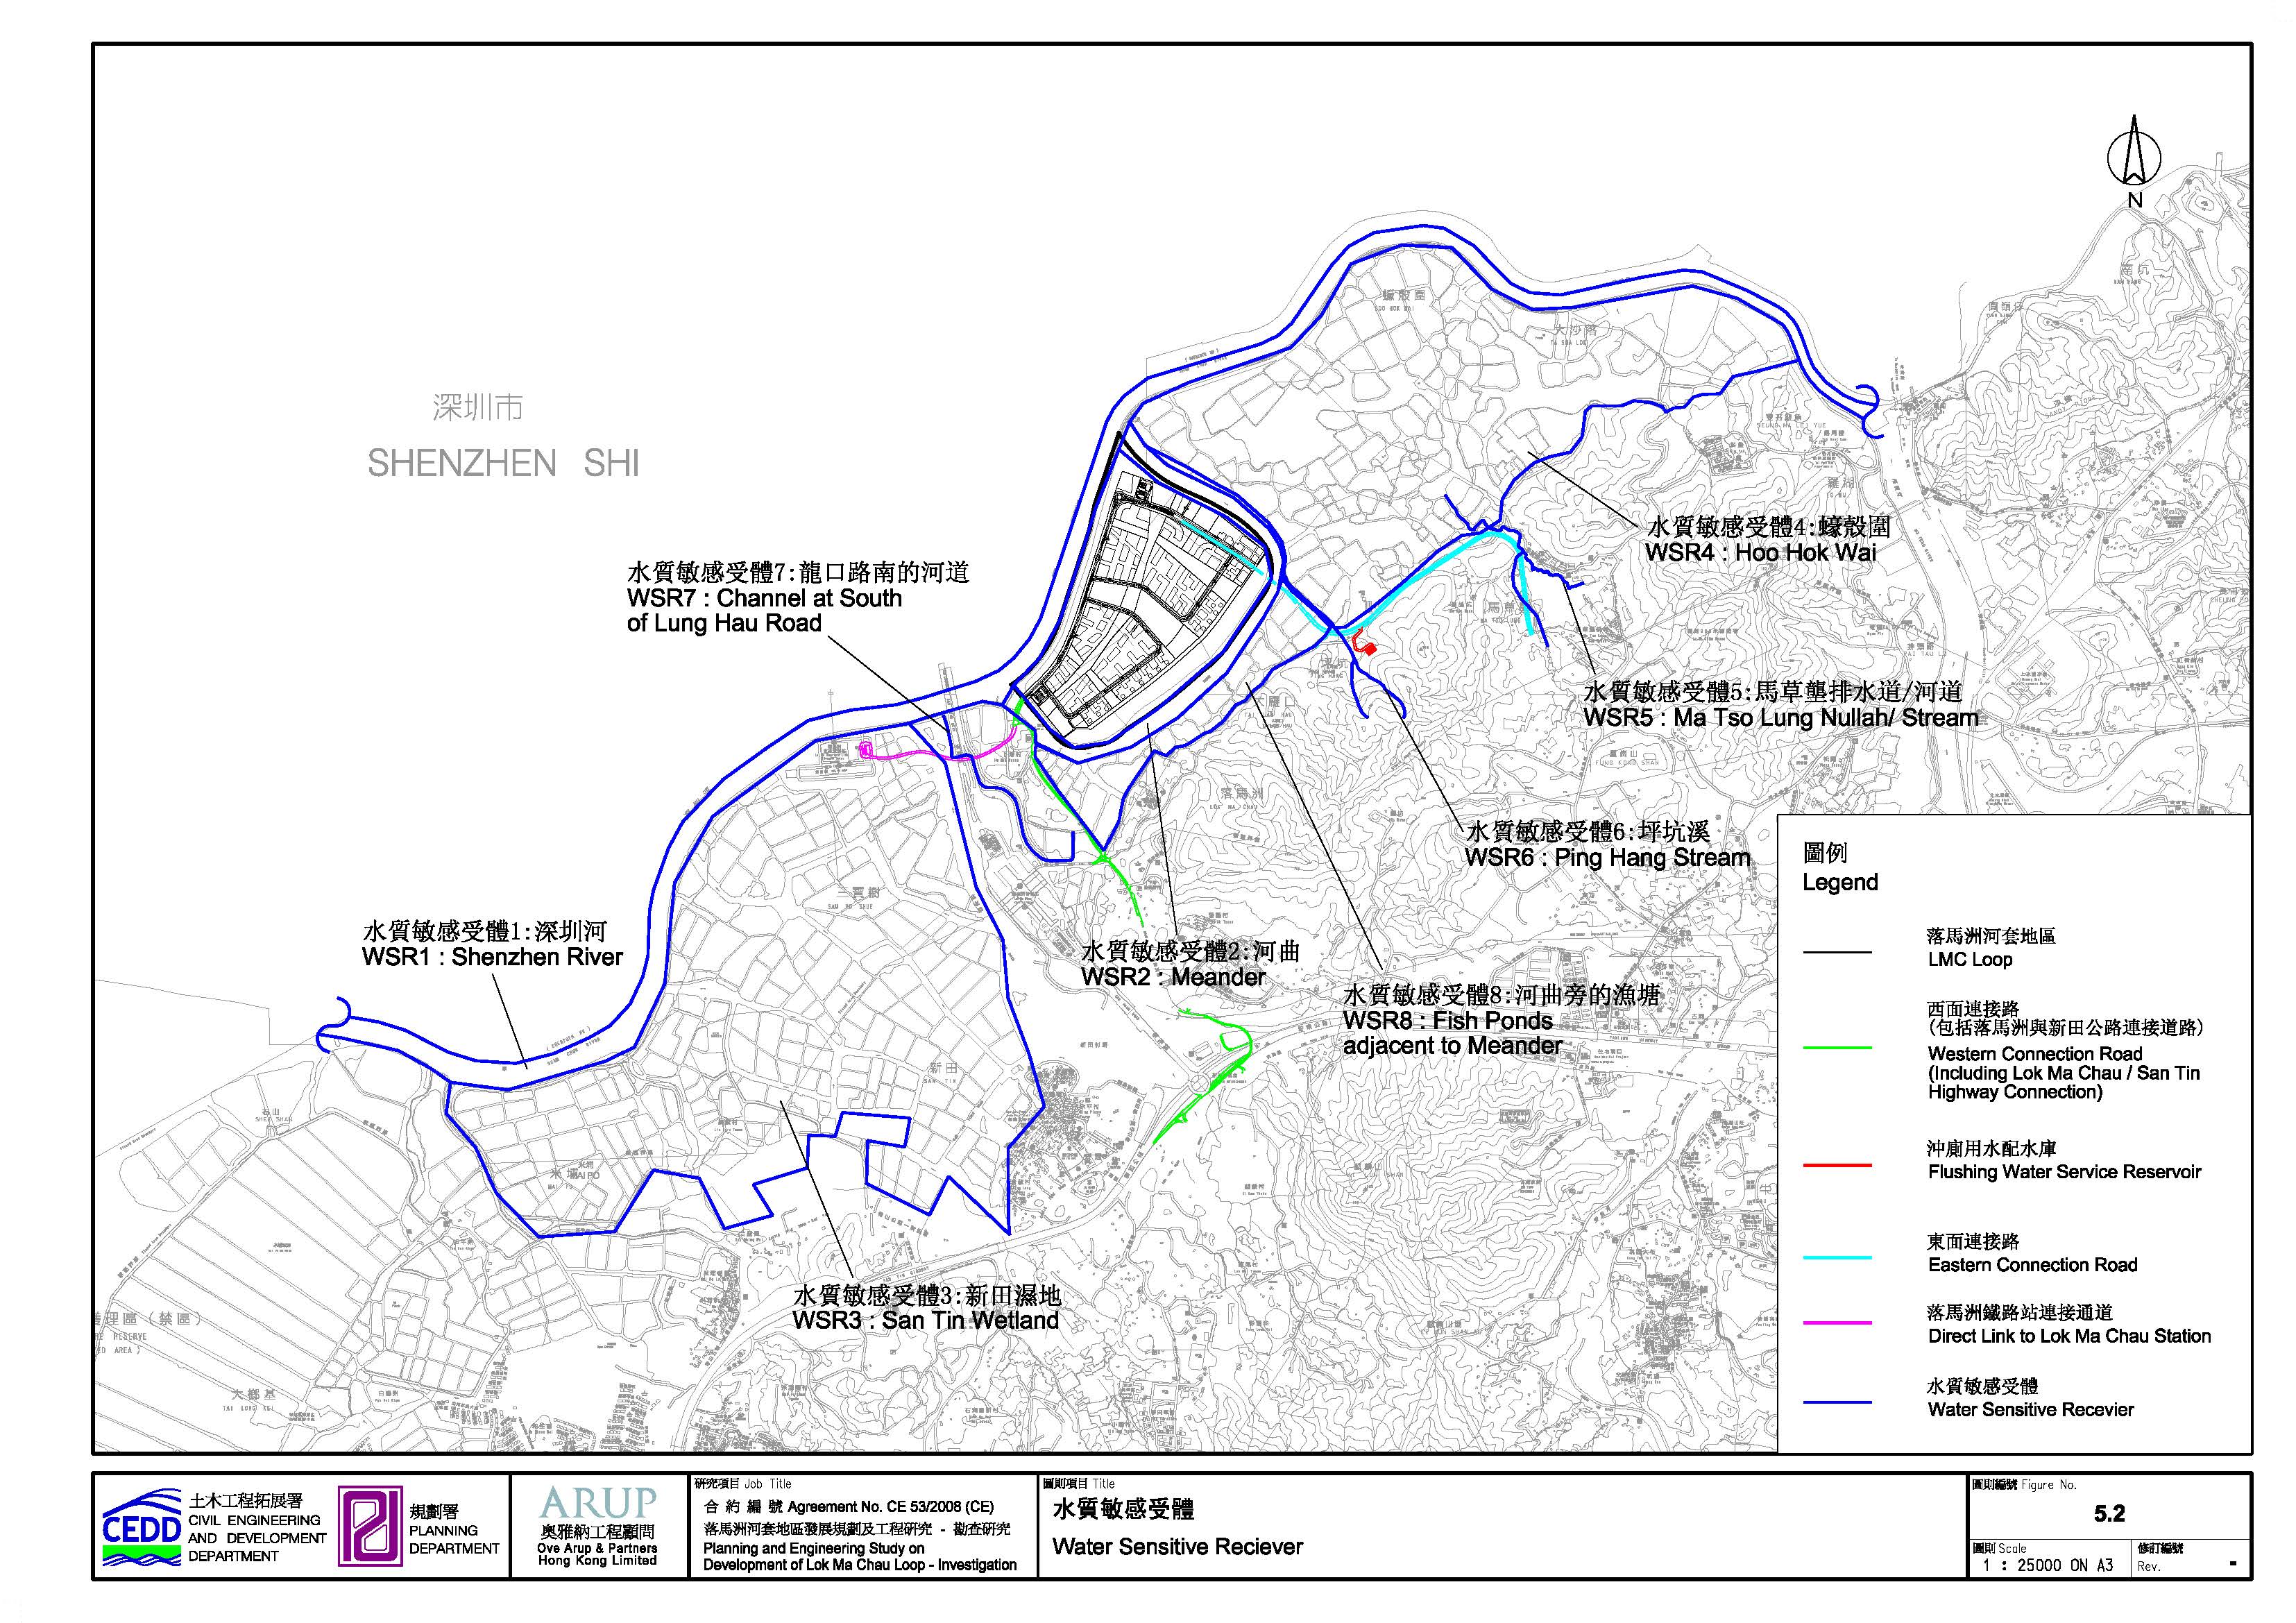
Figure 5.2 Water Sensitive Receivers
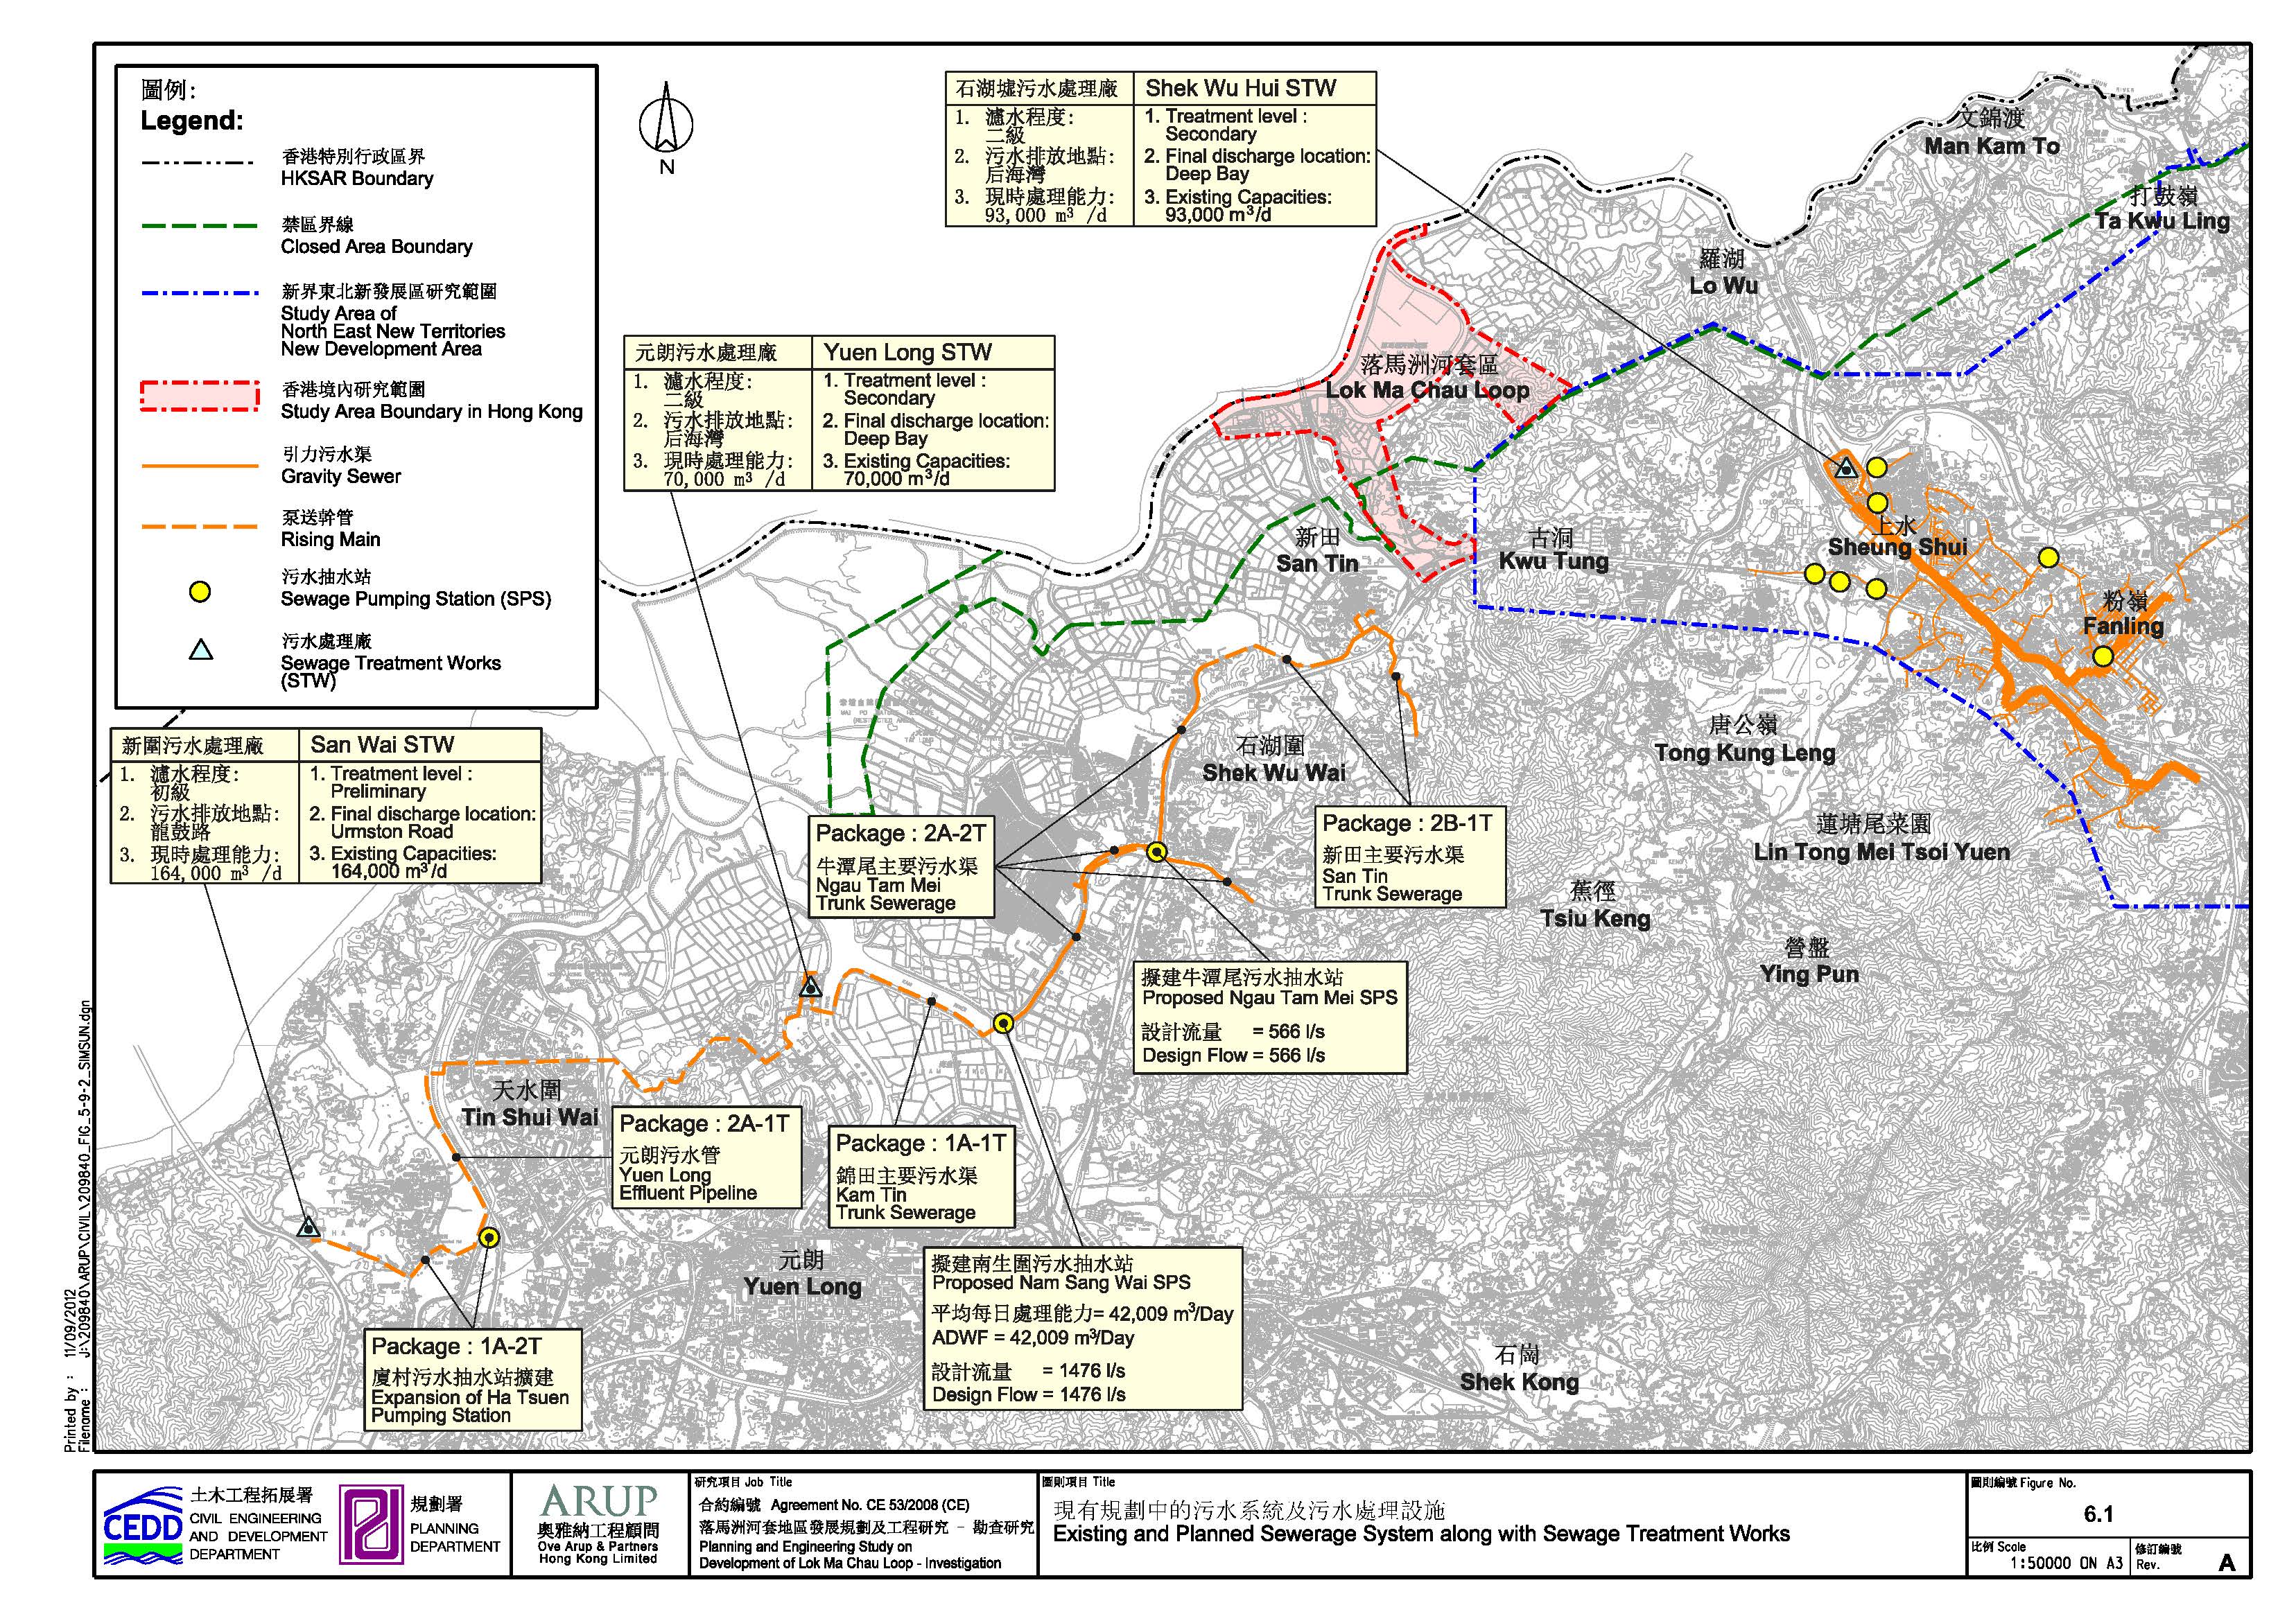
Figure 6.1 Existing
and Planned Sewerage System along with Sewage Treatment Works
Figure 6.2 Lok Ma Chau
Sewage Treatment Works – Schematic Diagram
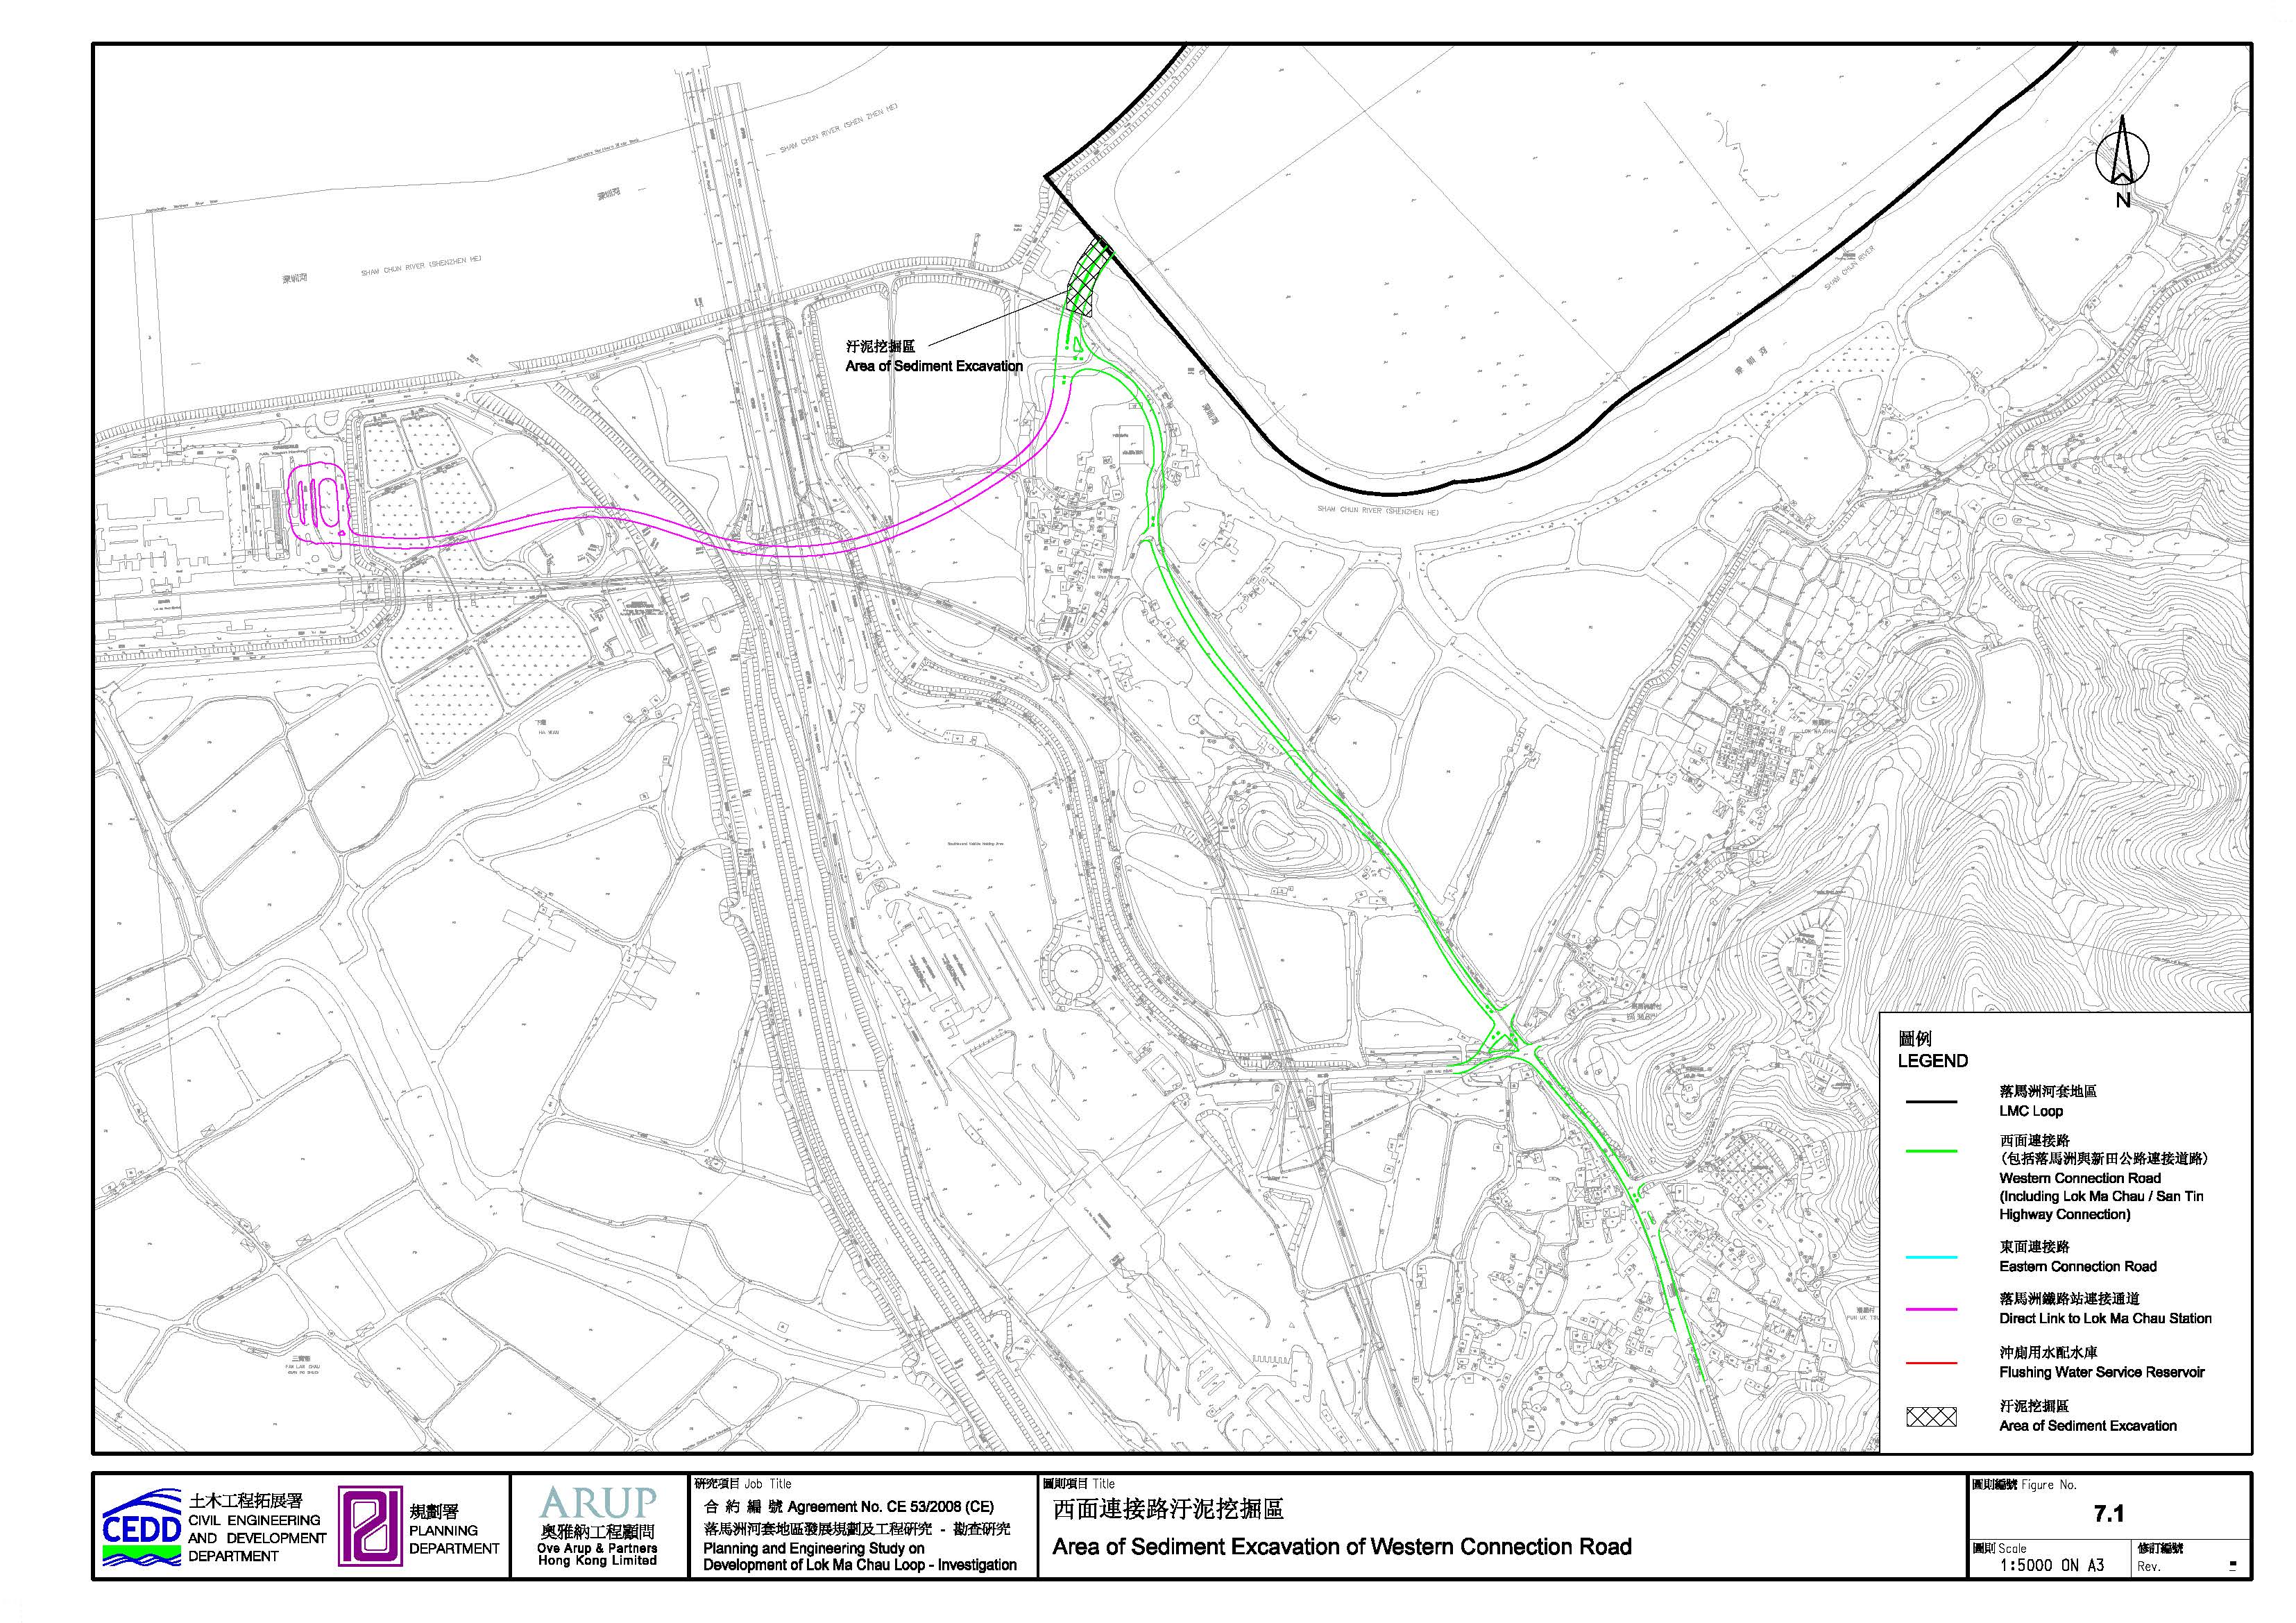
Figure 7.1 Area
of Sediment Excavating of Western Connection Road
Figure 7.2 Area
of Sediment Excavating of Eastern Connection Road
Figure 8.1 Location of Potentially Contaminated Site A
Figure 8.2 Locations of Proposed Sampling Boreholes in Area LMC Loop
Figure 8.3 Locations of 5 Concerned Boreholes with Arsenic Contamination
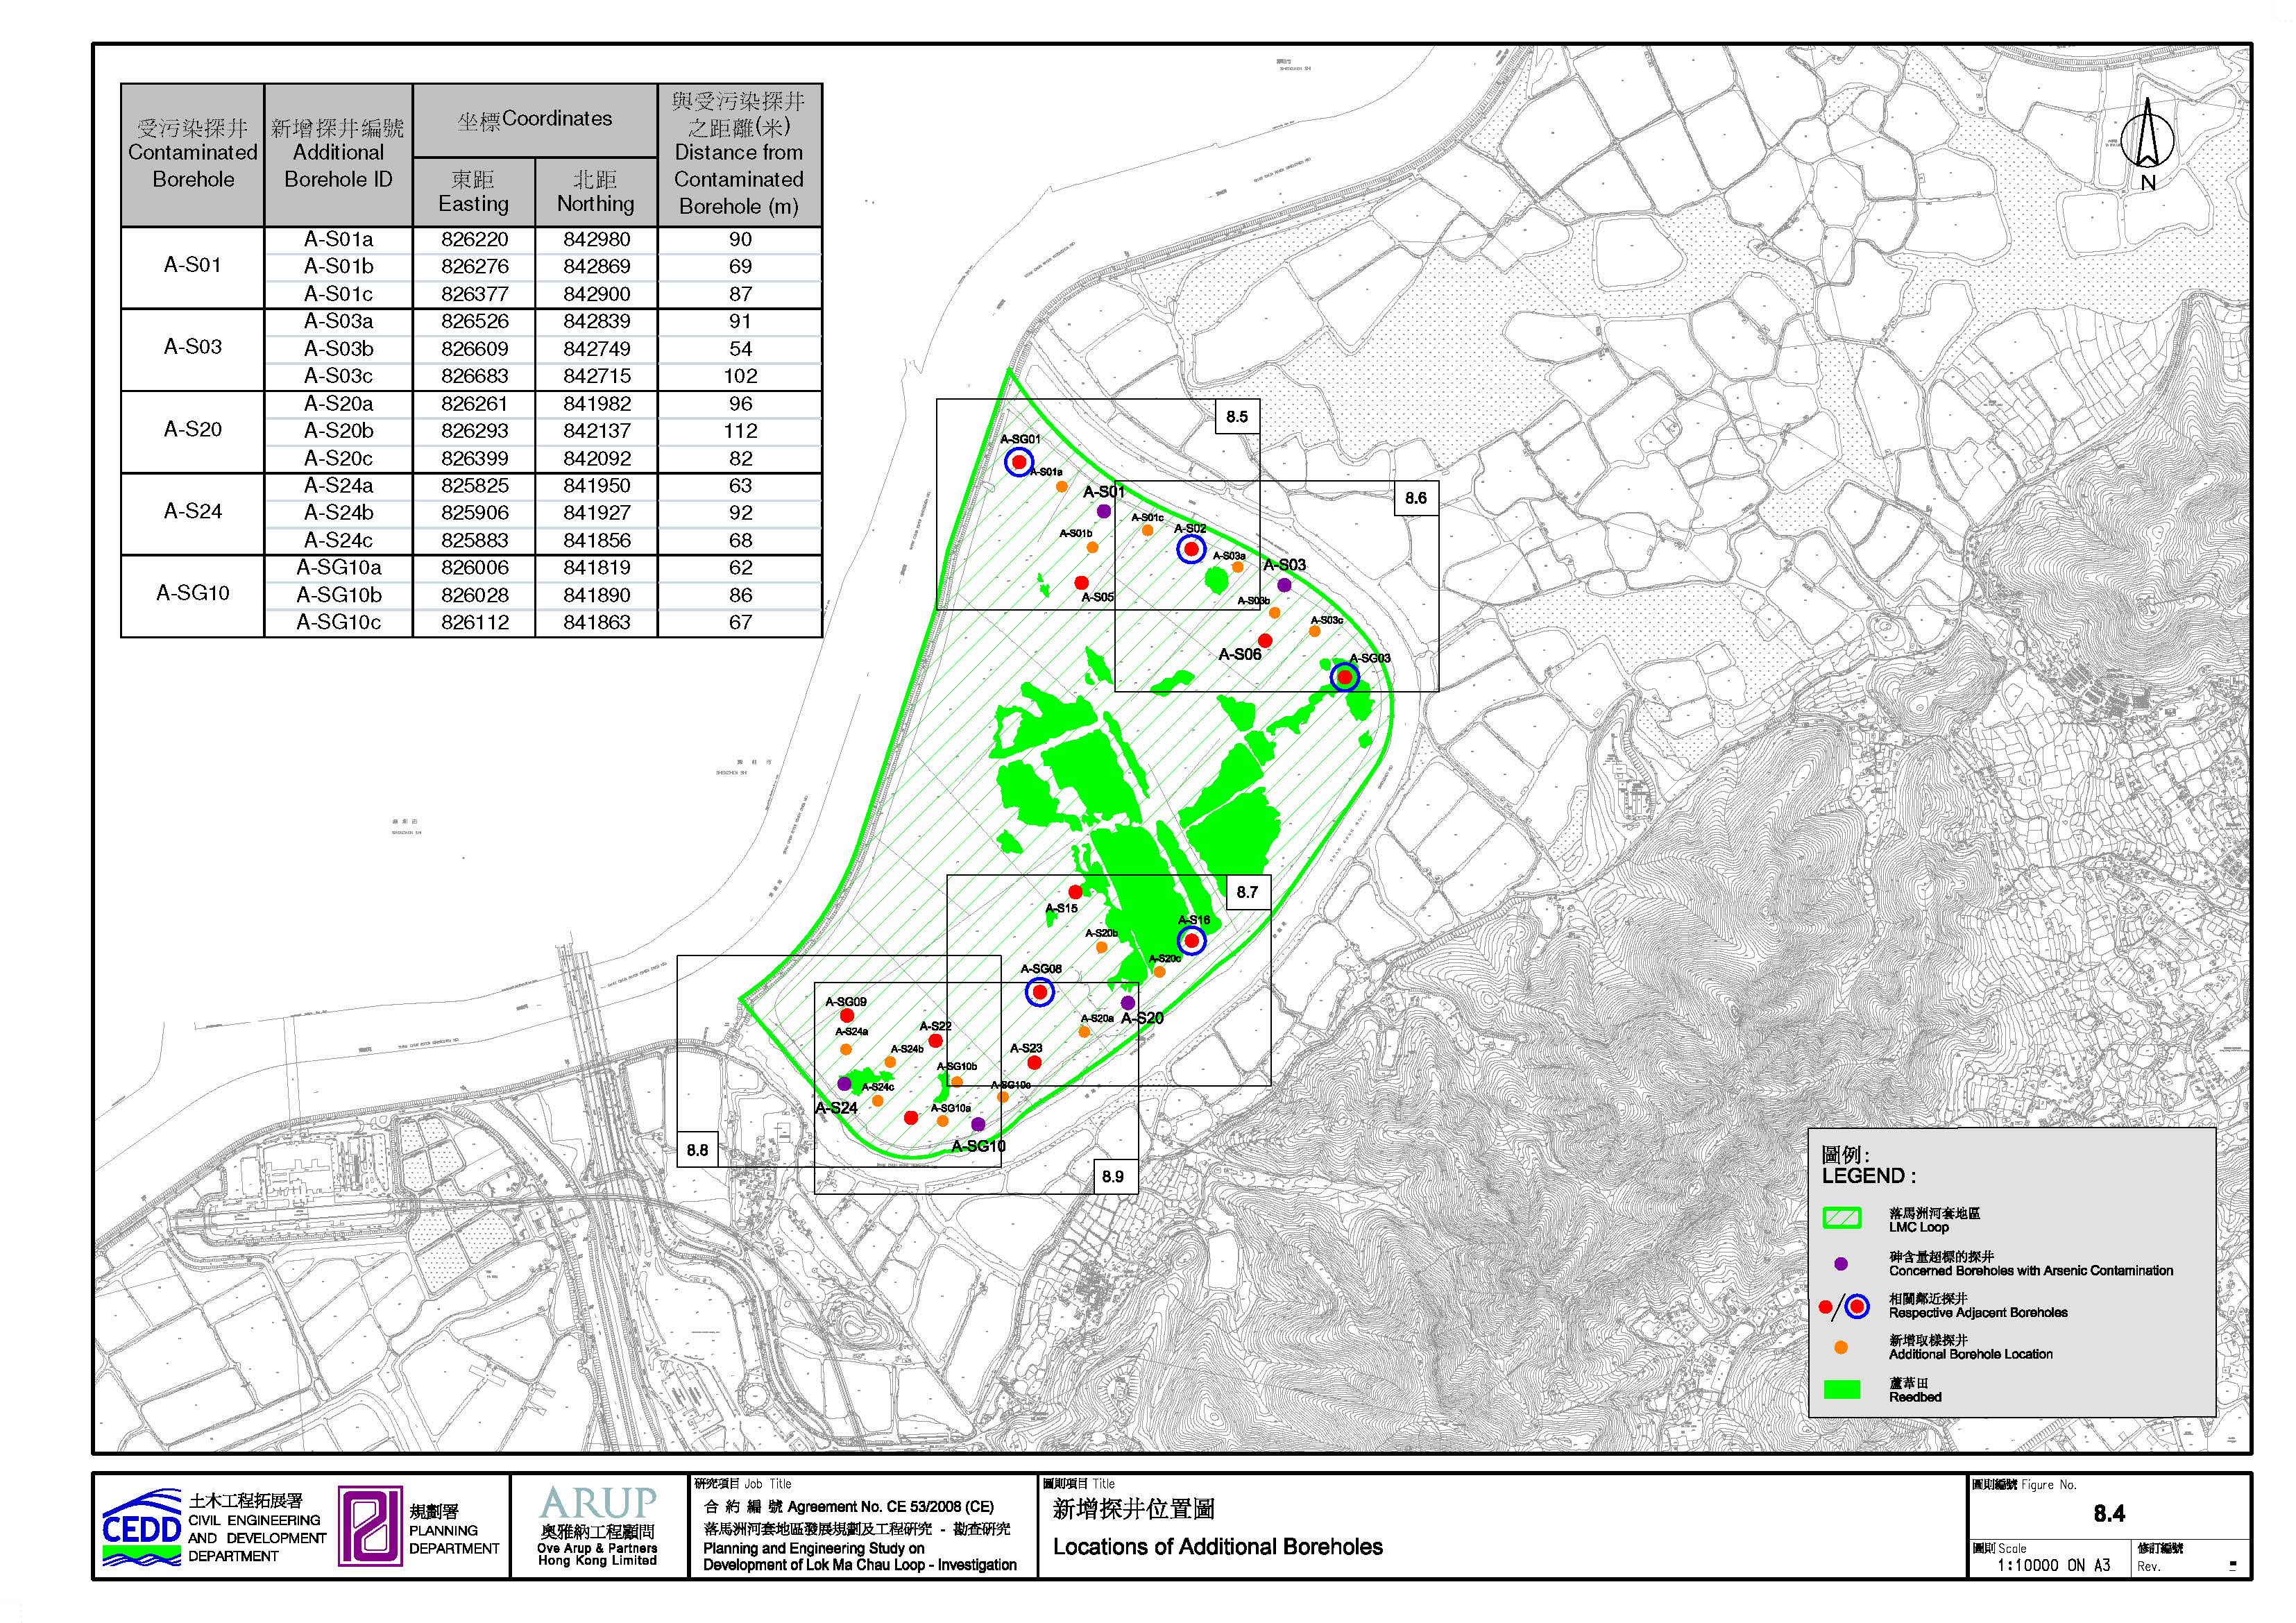
Figure 8.4 Locations of Additional Boreholes
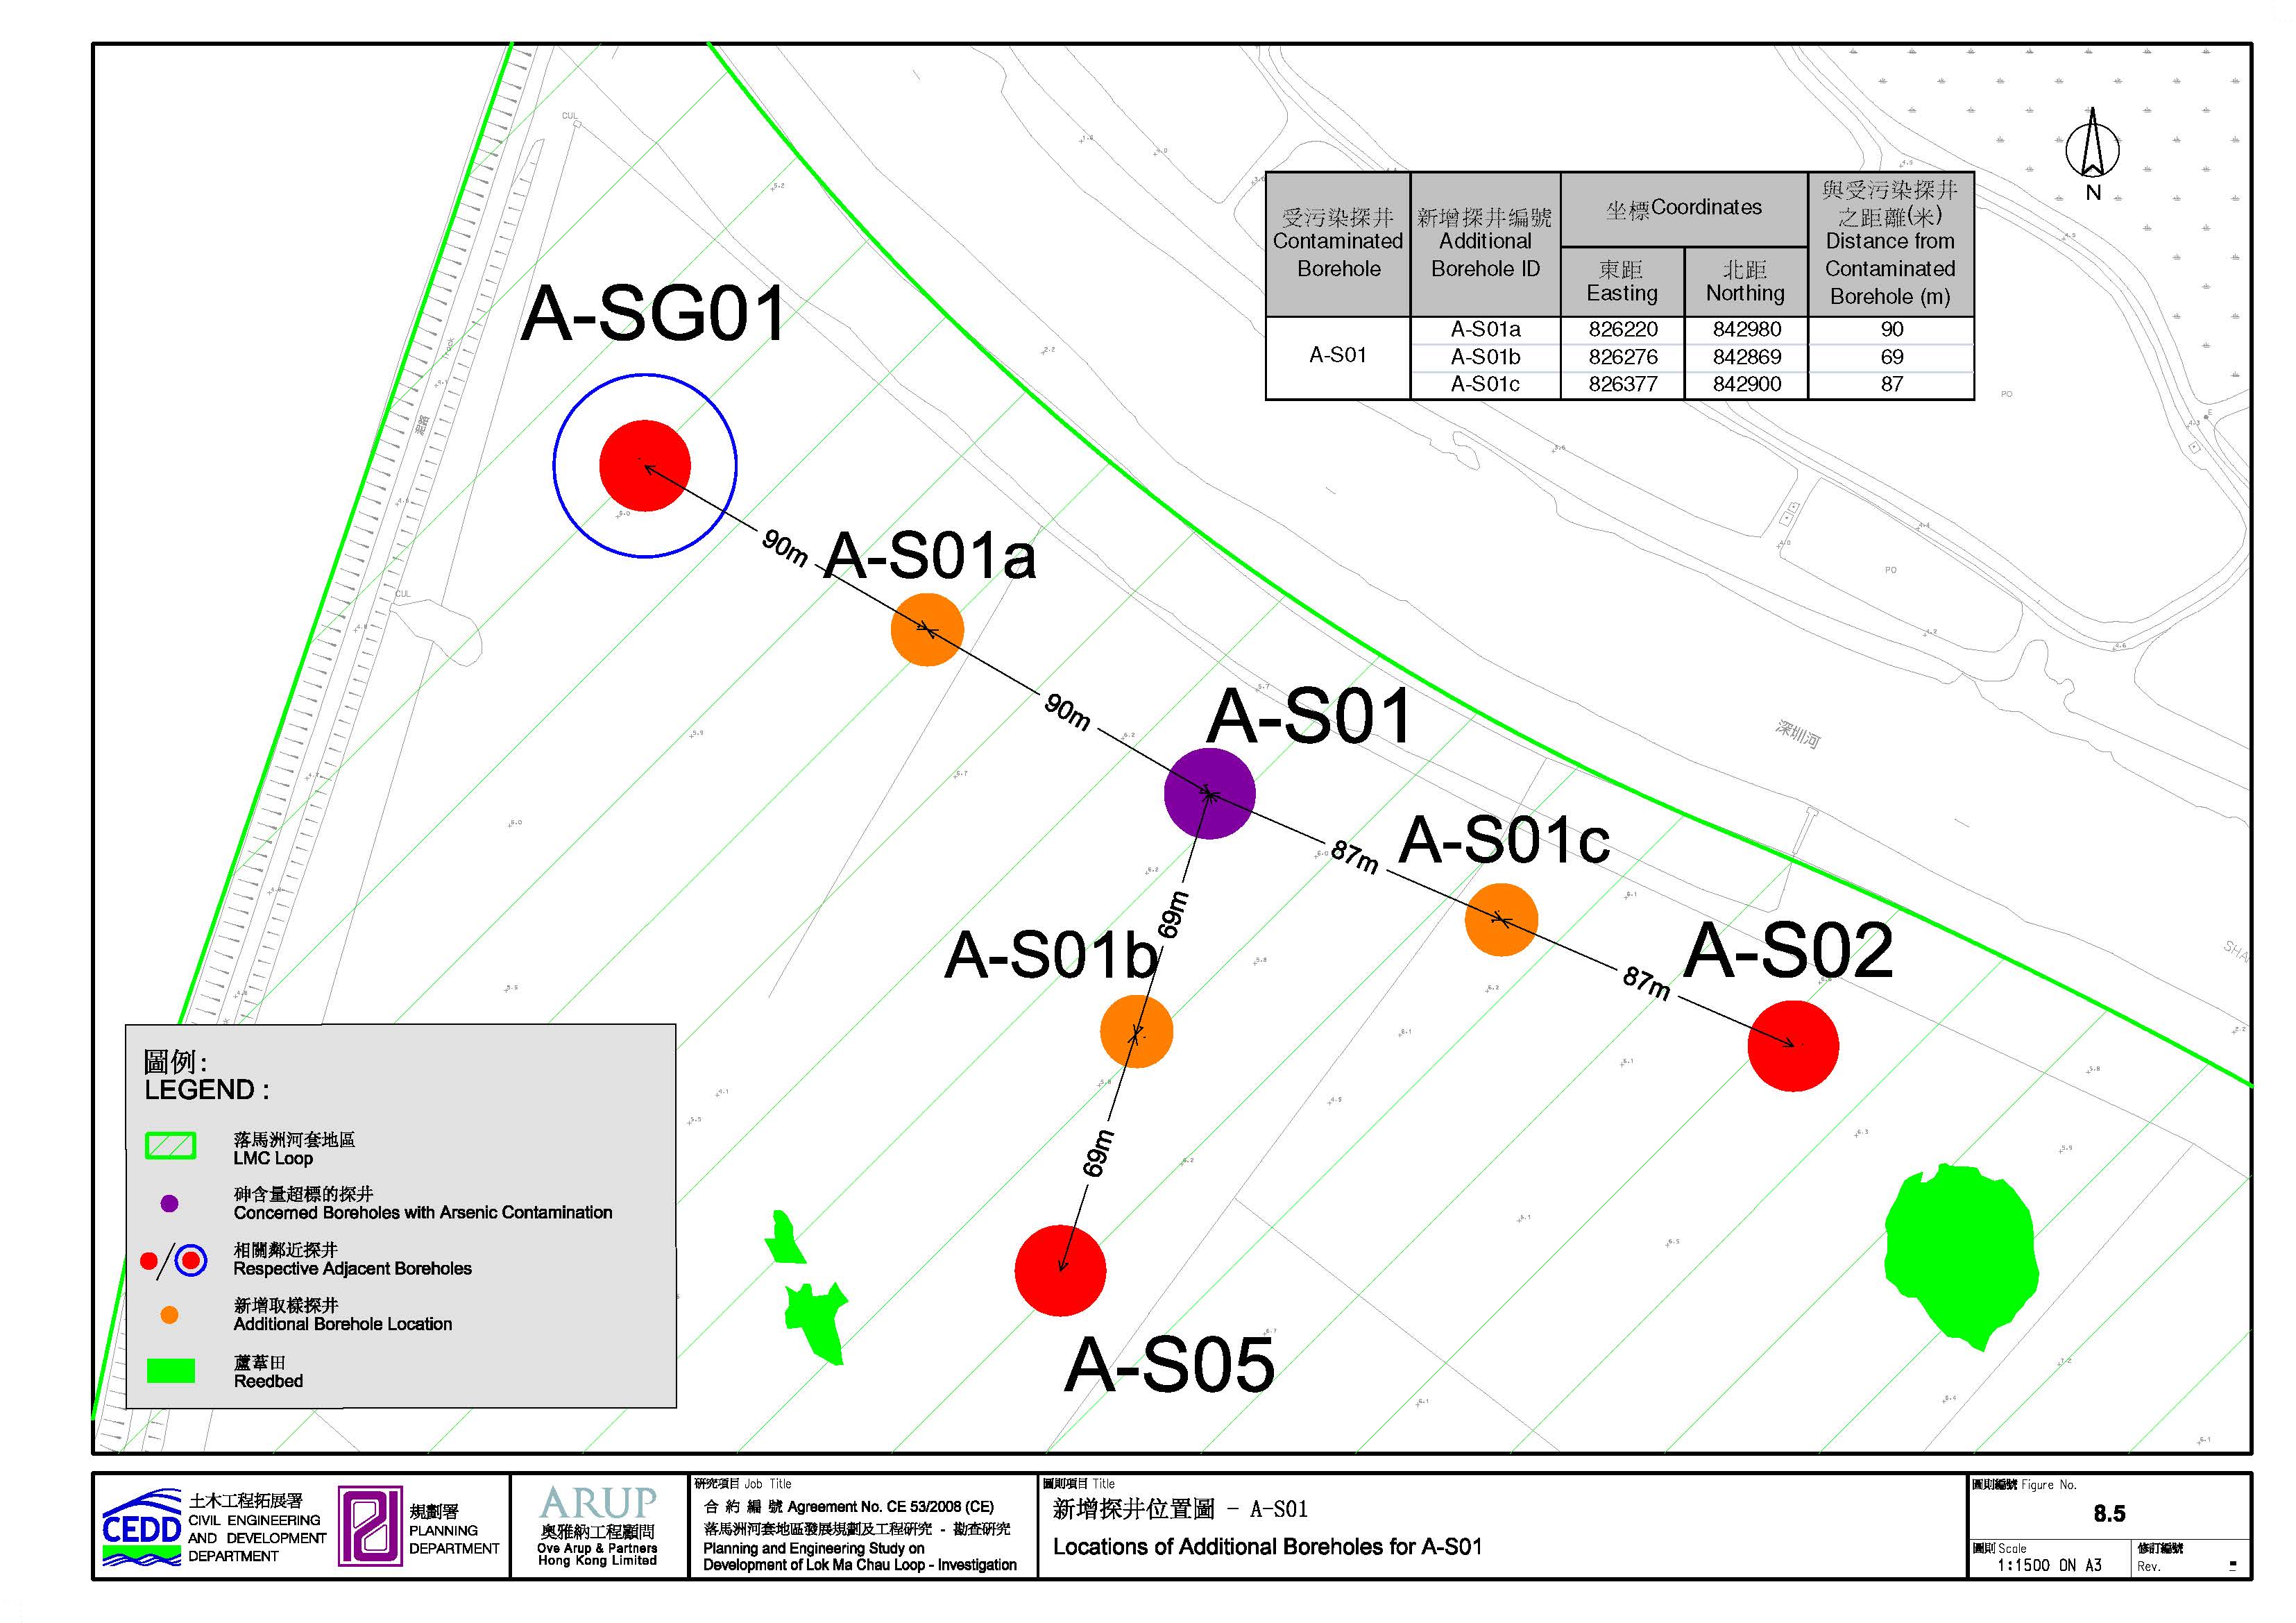
Figure 8.5 Locations of Additional Boreholes for A-S01
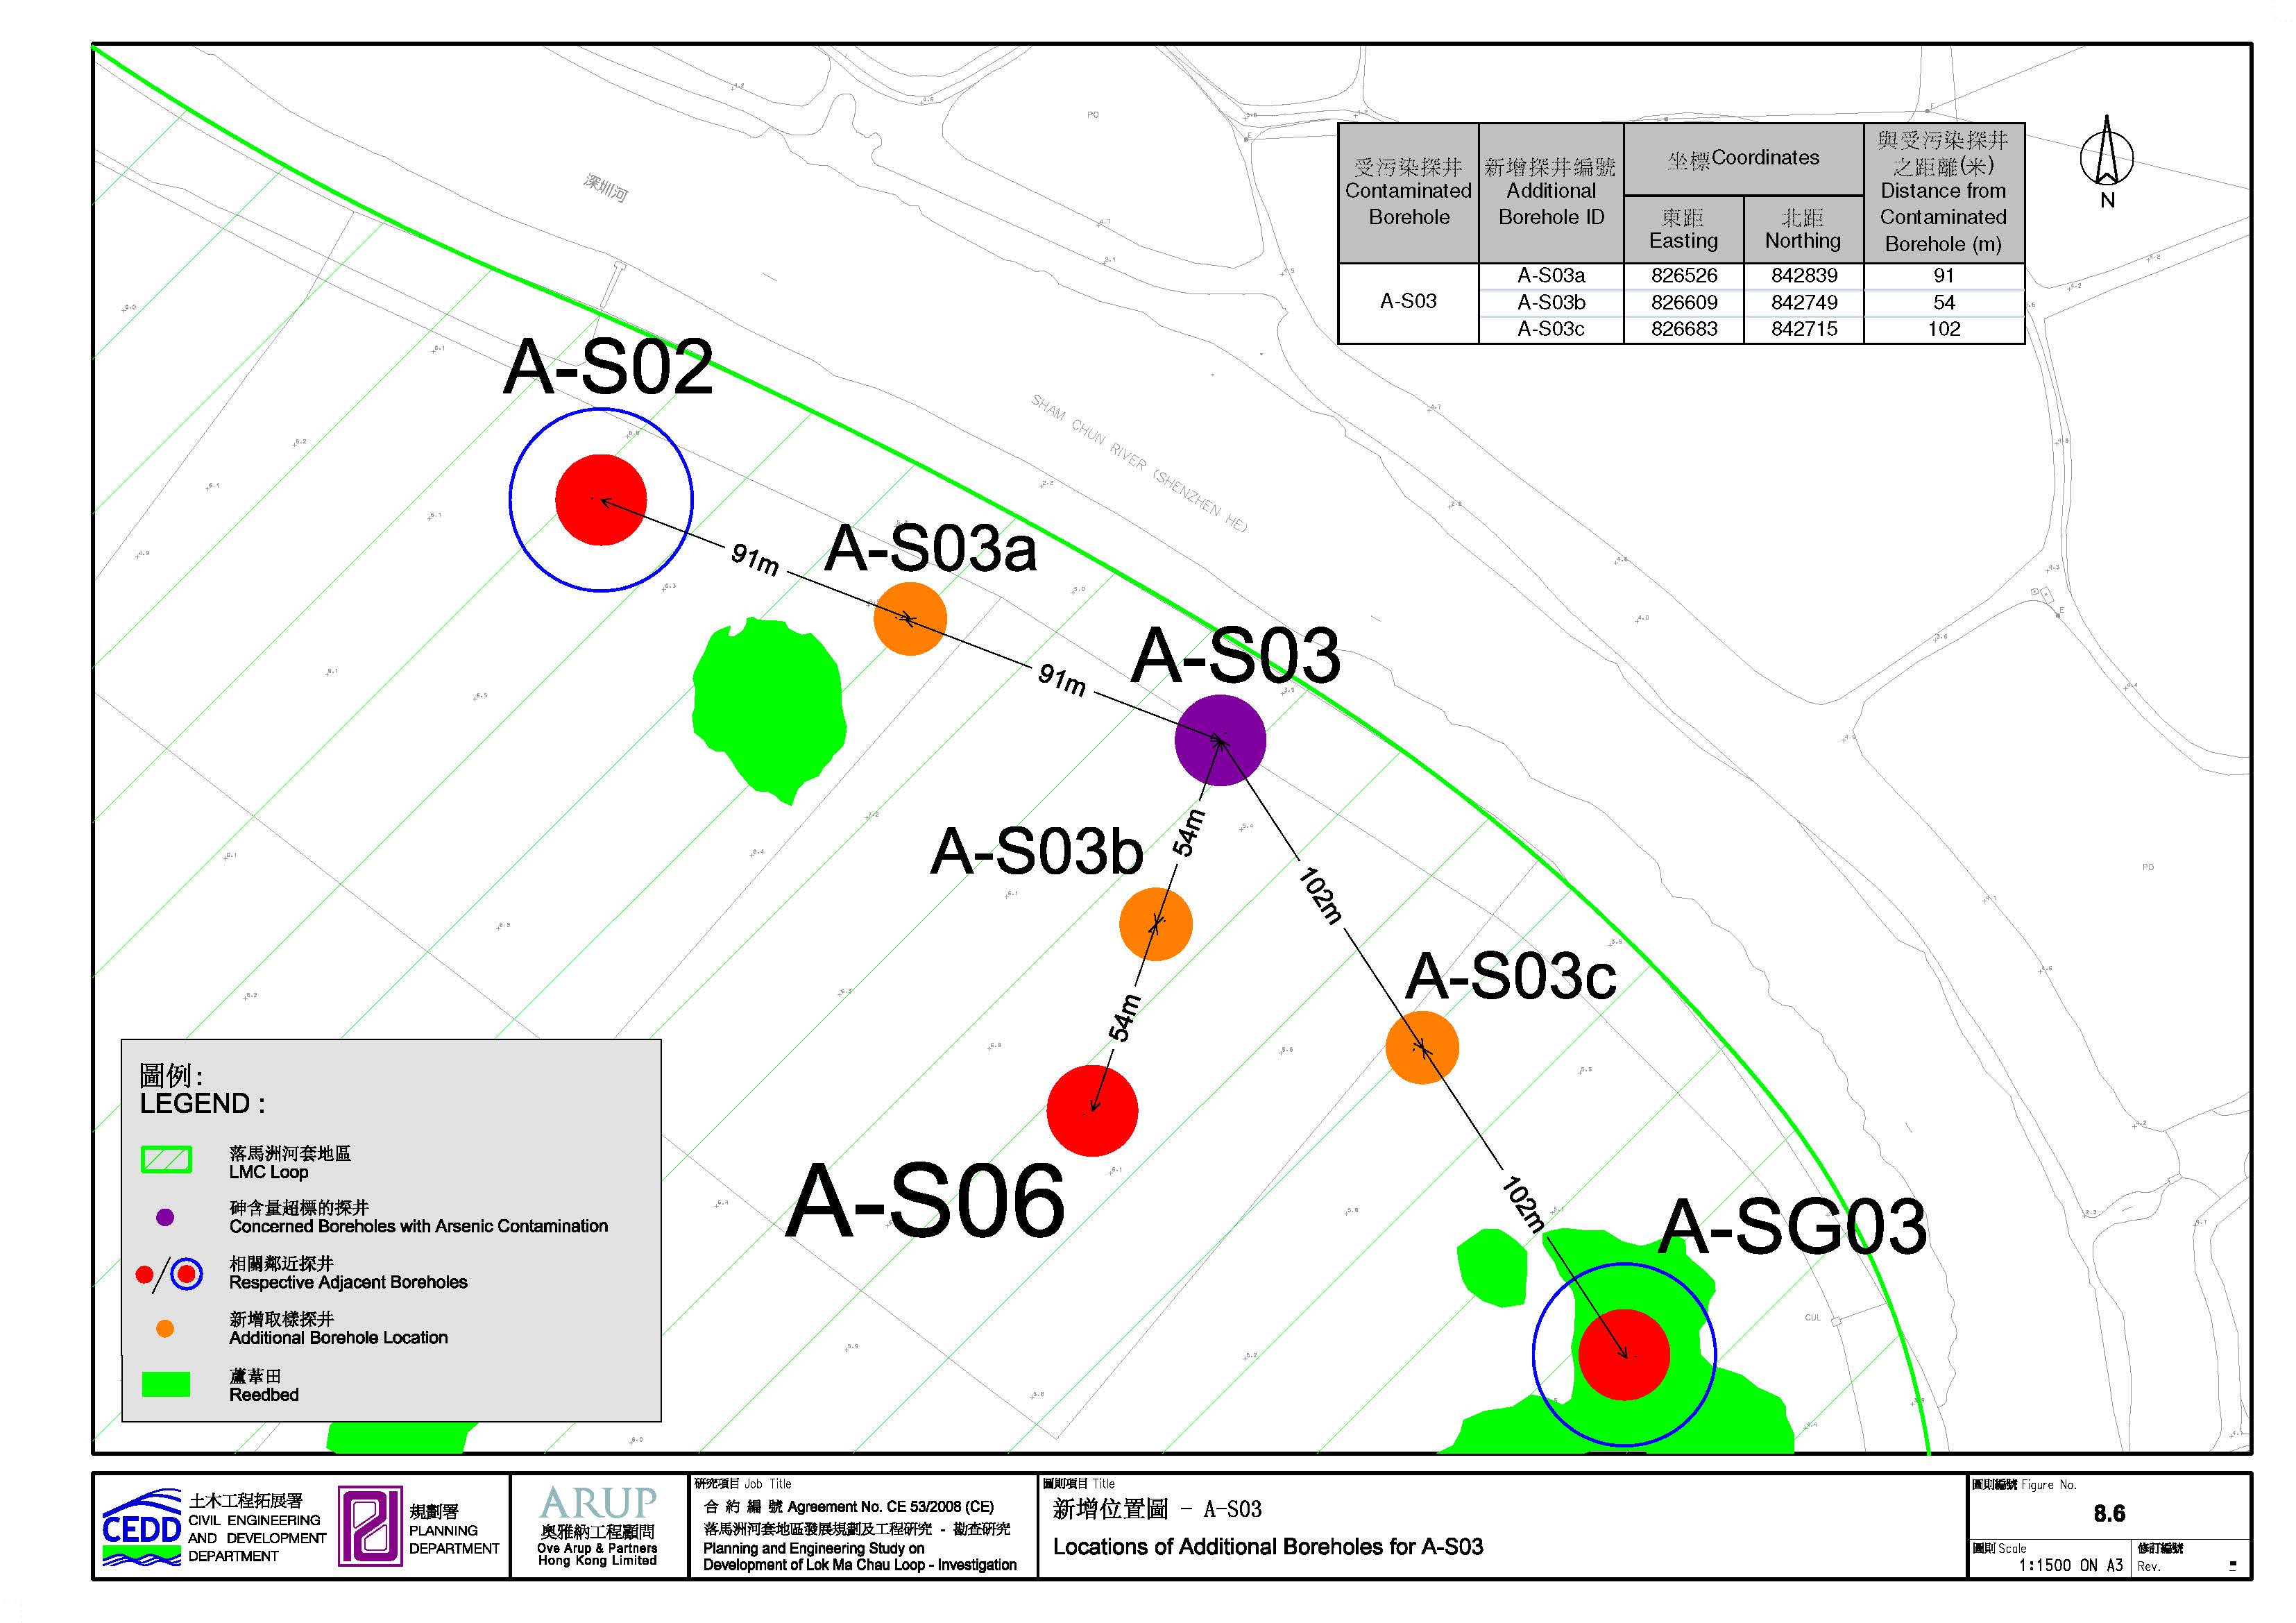
Figure 8.6 Locations of Additional Boreholes for A-S03
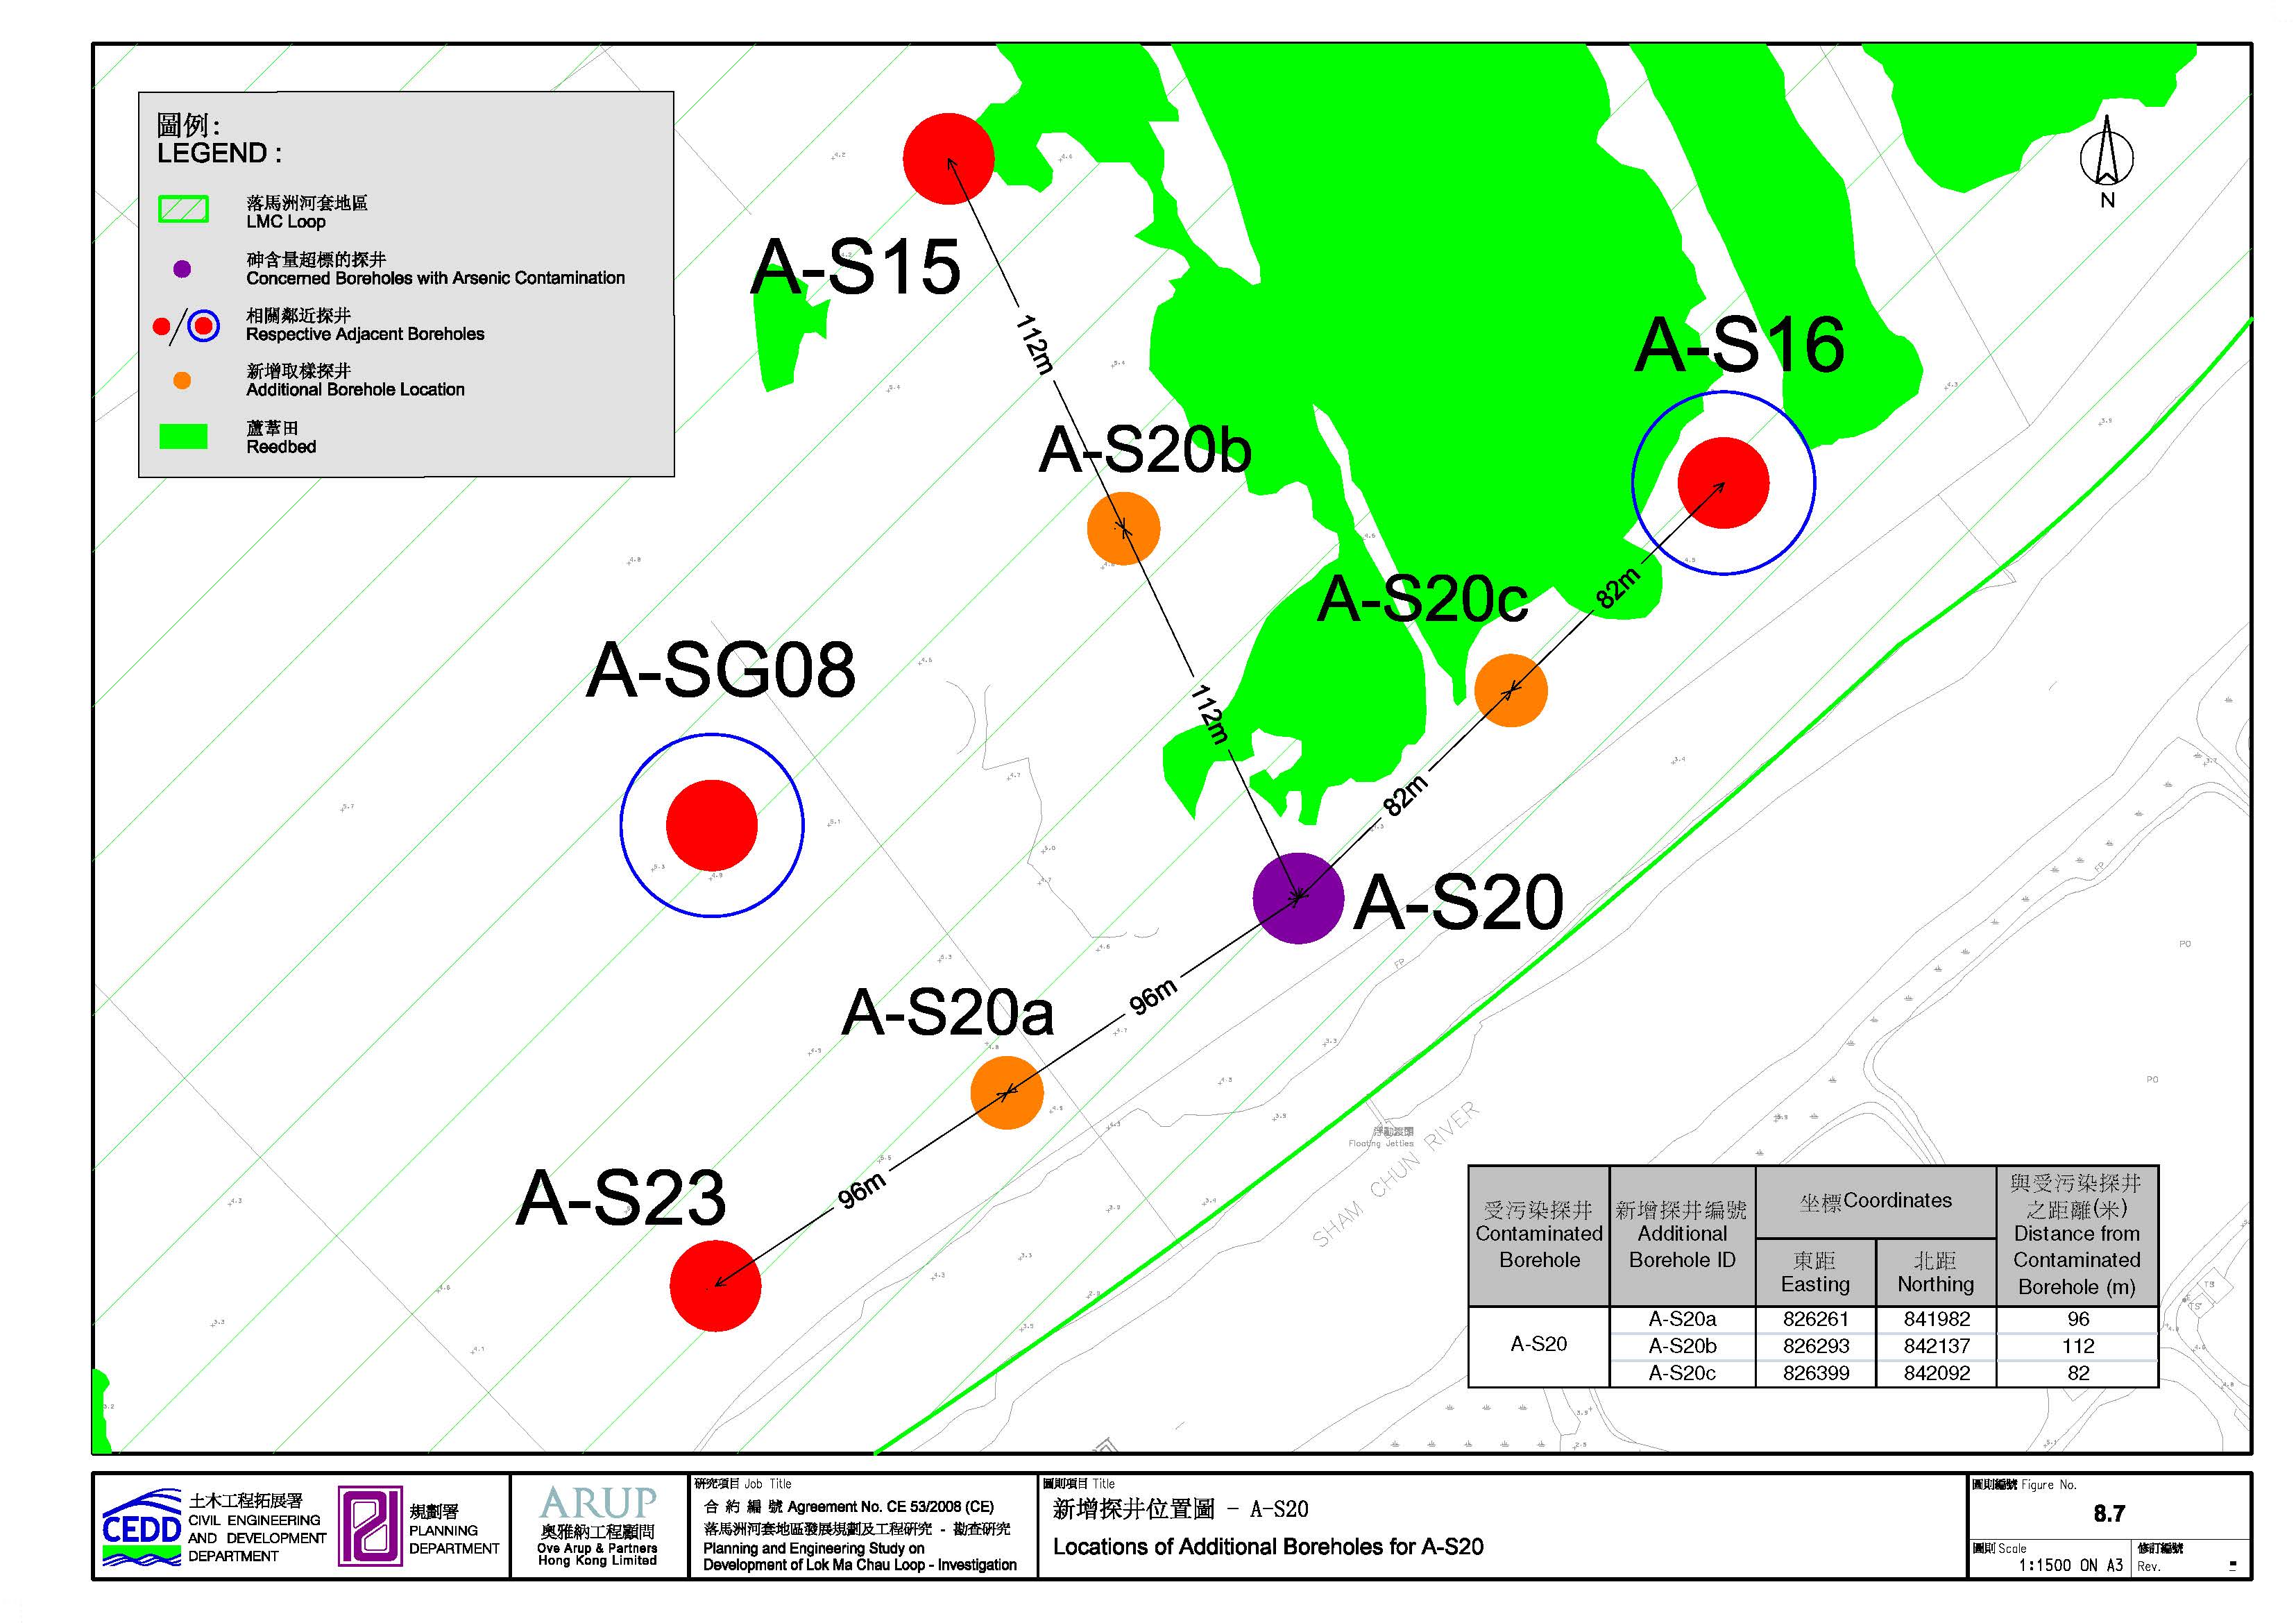
Figure 8.7 Locations of Additional Boreholes for A-S20
Figure 8.8 Locations of Additional Boreholes for A-S24
Figure 8.9 Locations of Additional Boreholes for A-SG10
Figure 8.10 Locations of Further Additional Boreholes
Figure 8.11 Locations of Further Additional Boreholes for A-S01
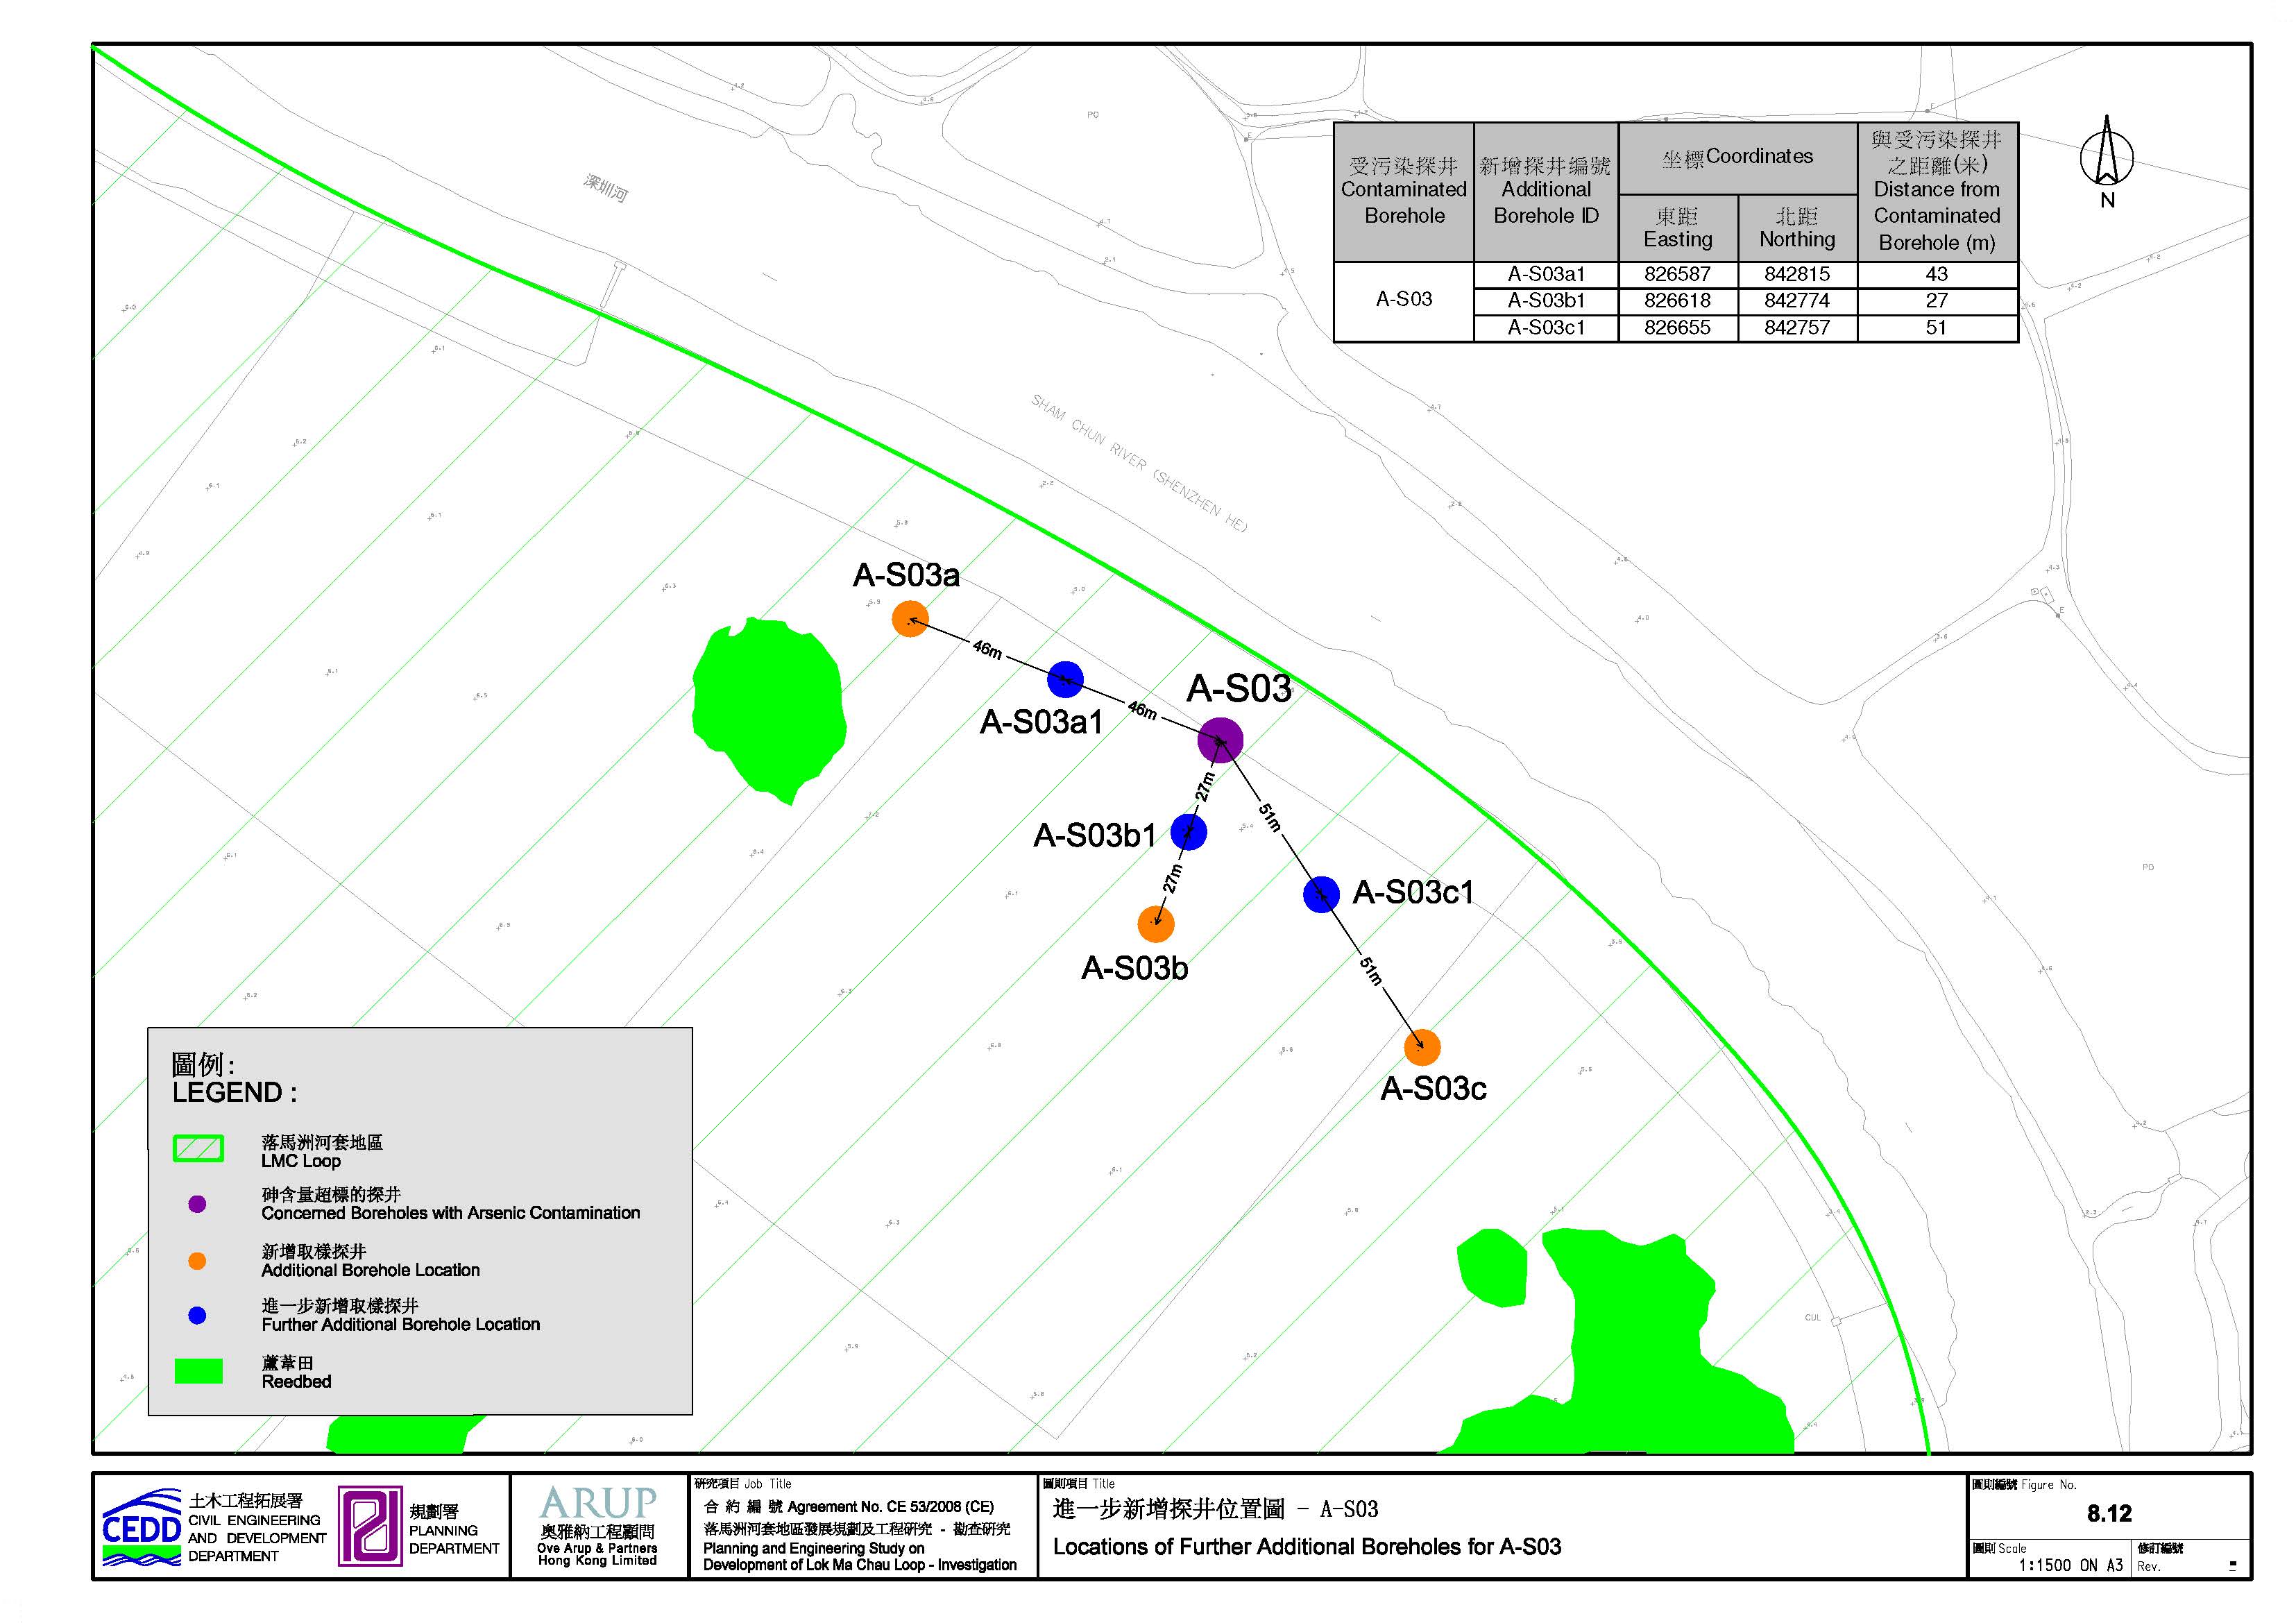
Figure 8.12 Locations of Further Additional Boreholes for A-S03
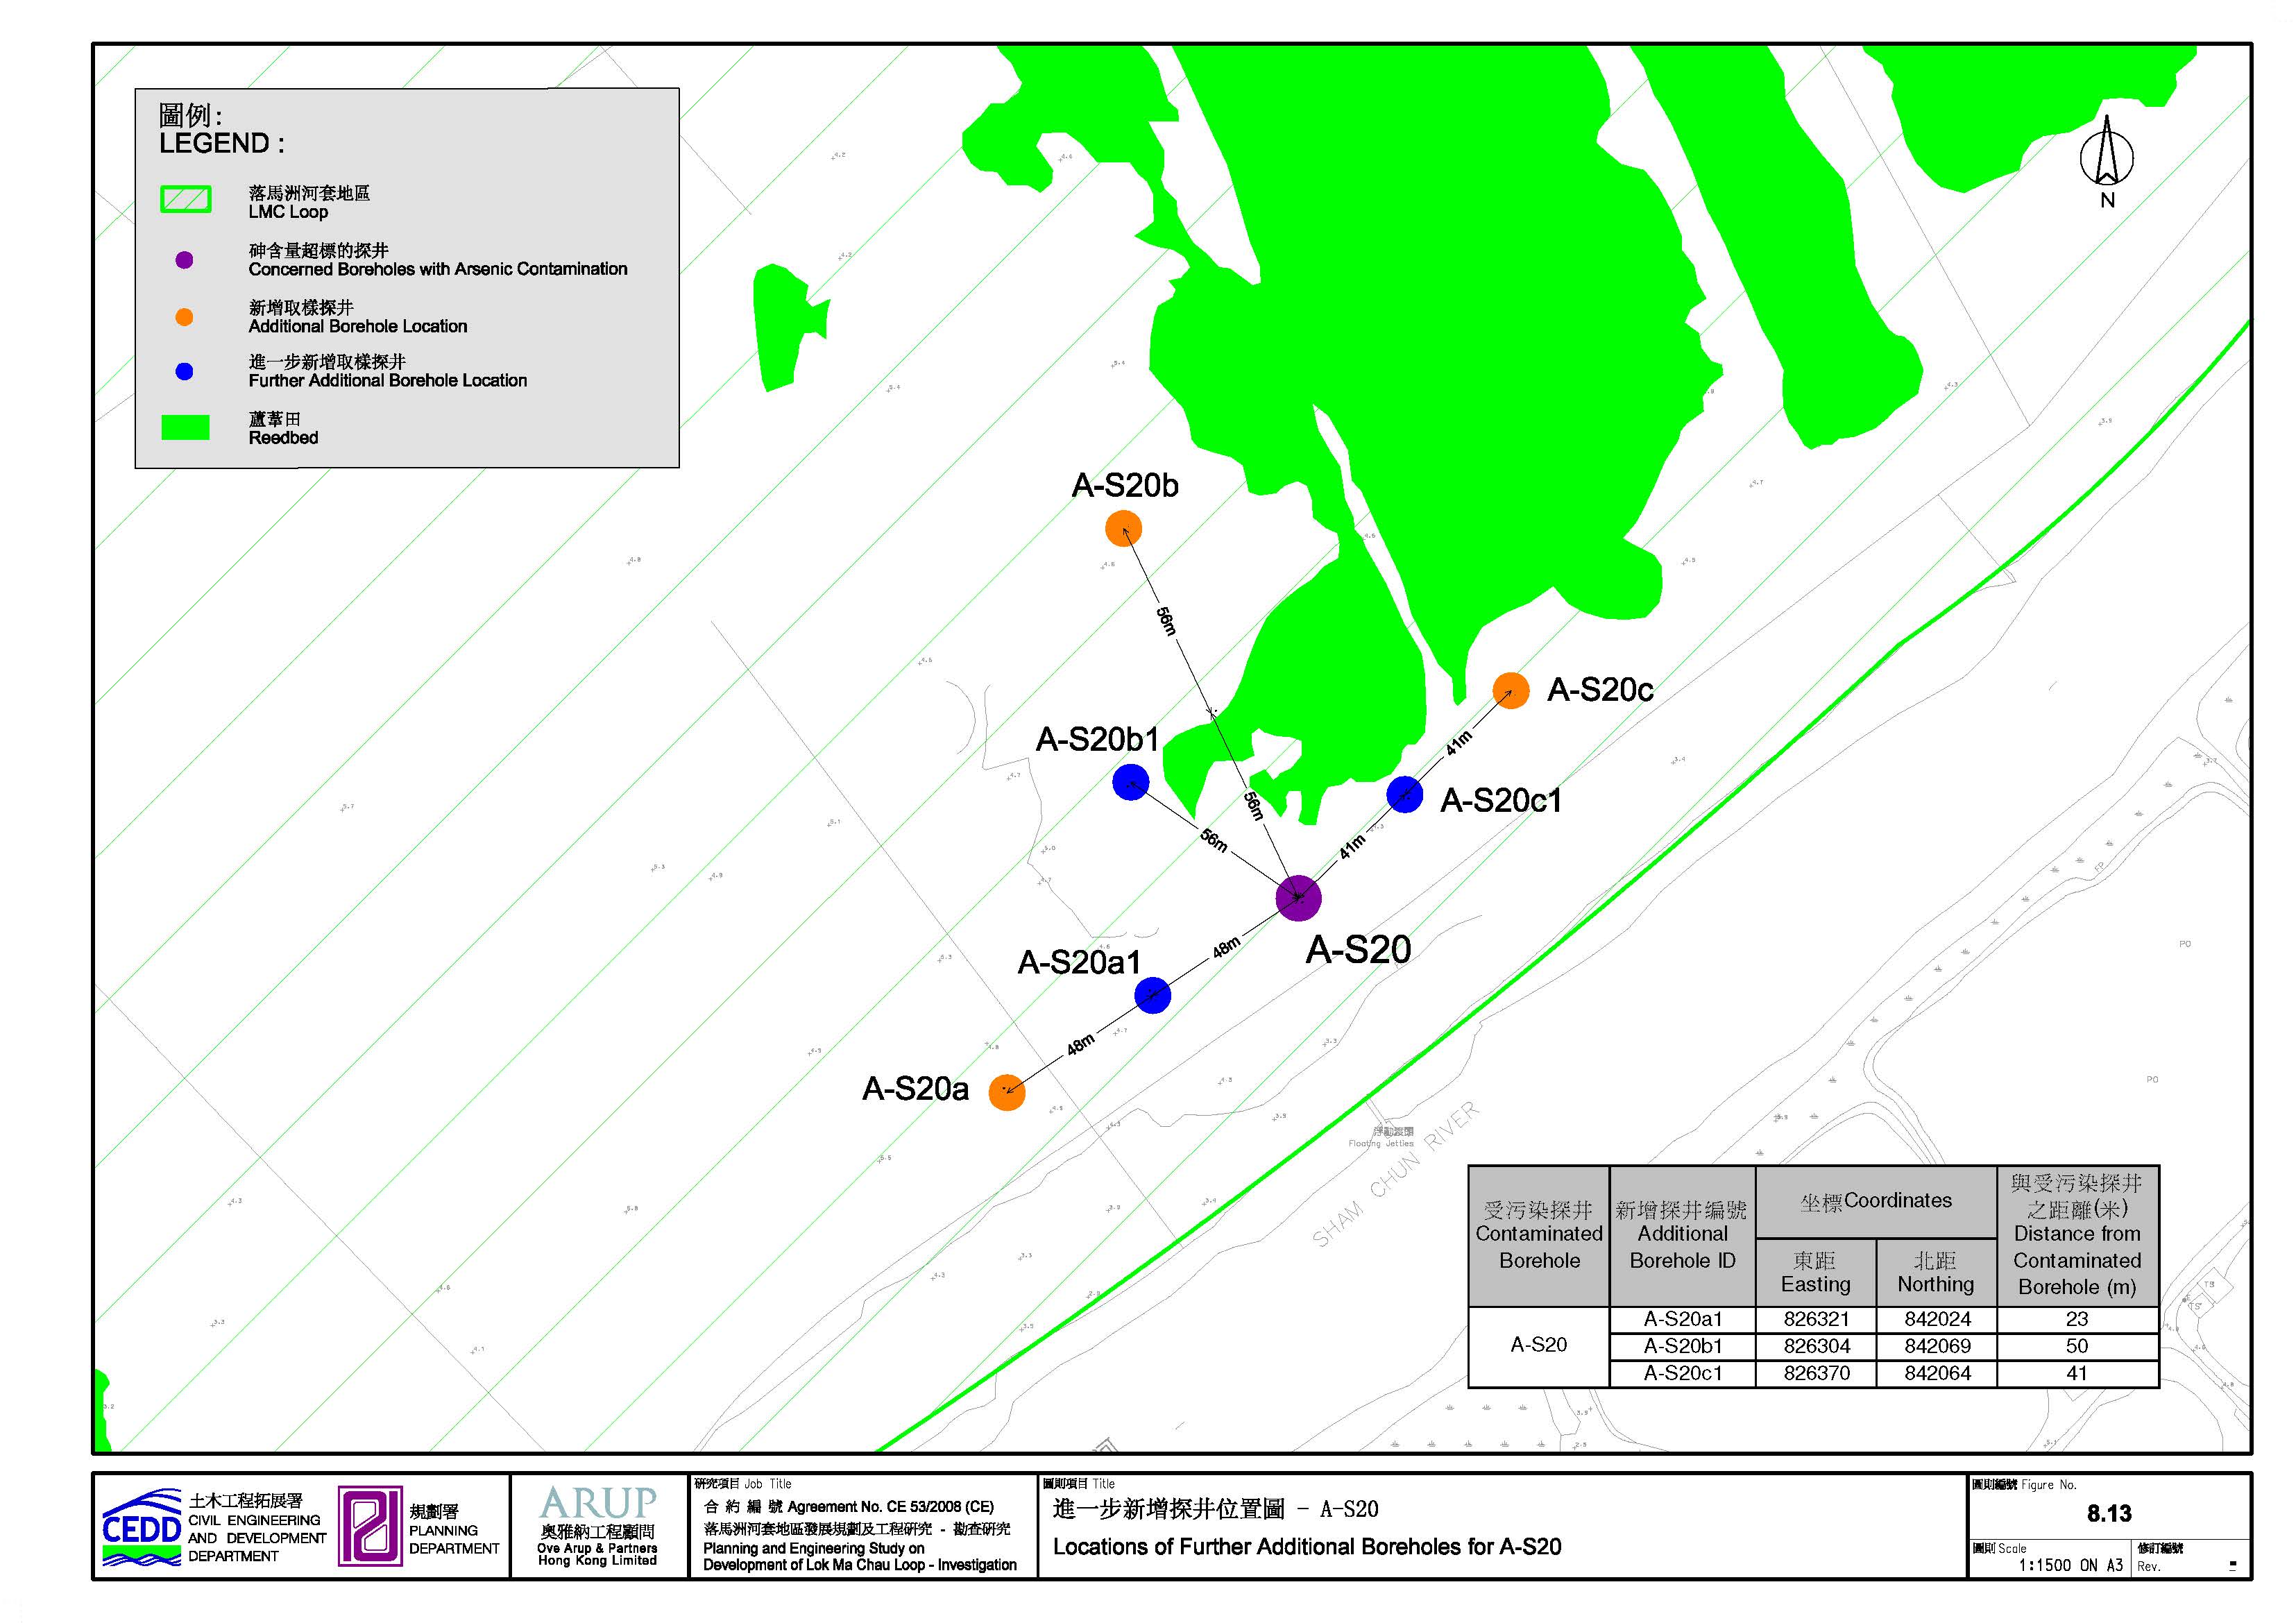
Figure 8.13 Locations of Further Additional Boreholes for A-S20
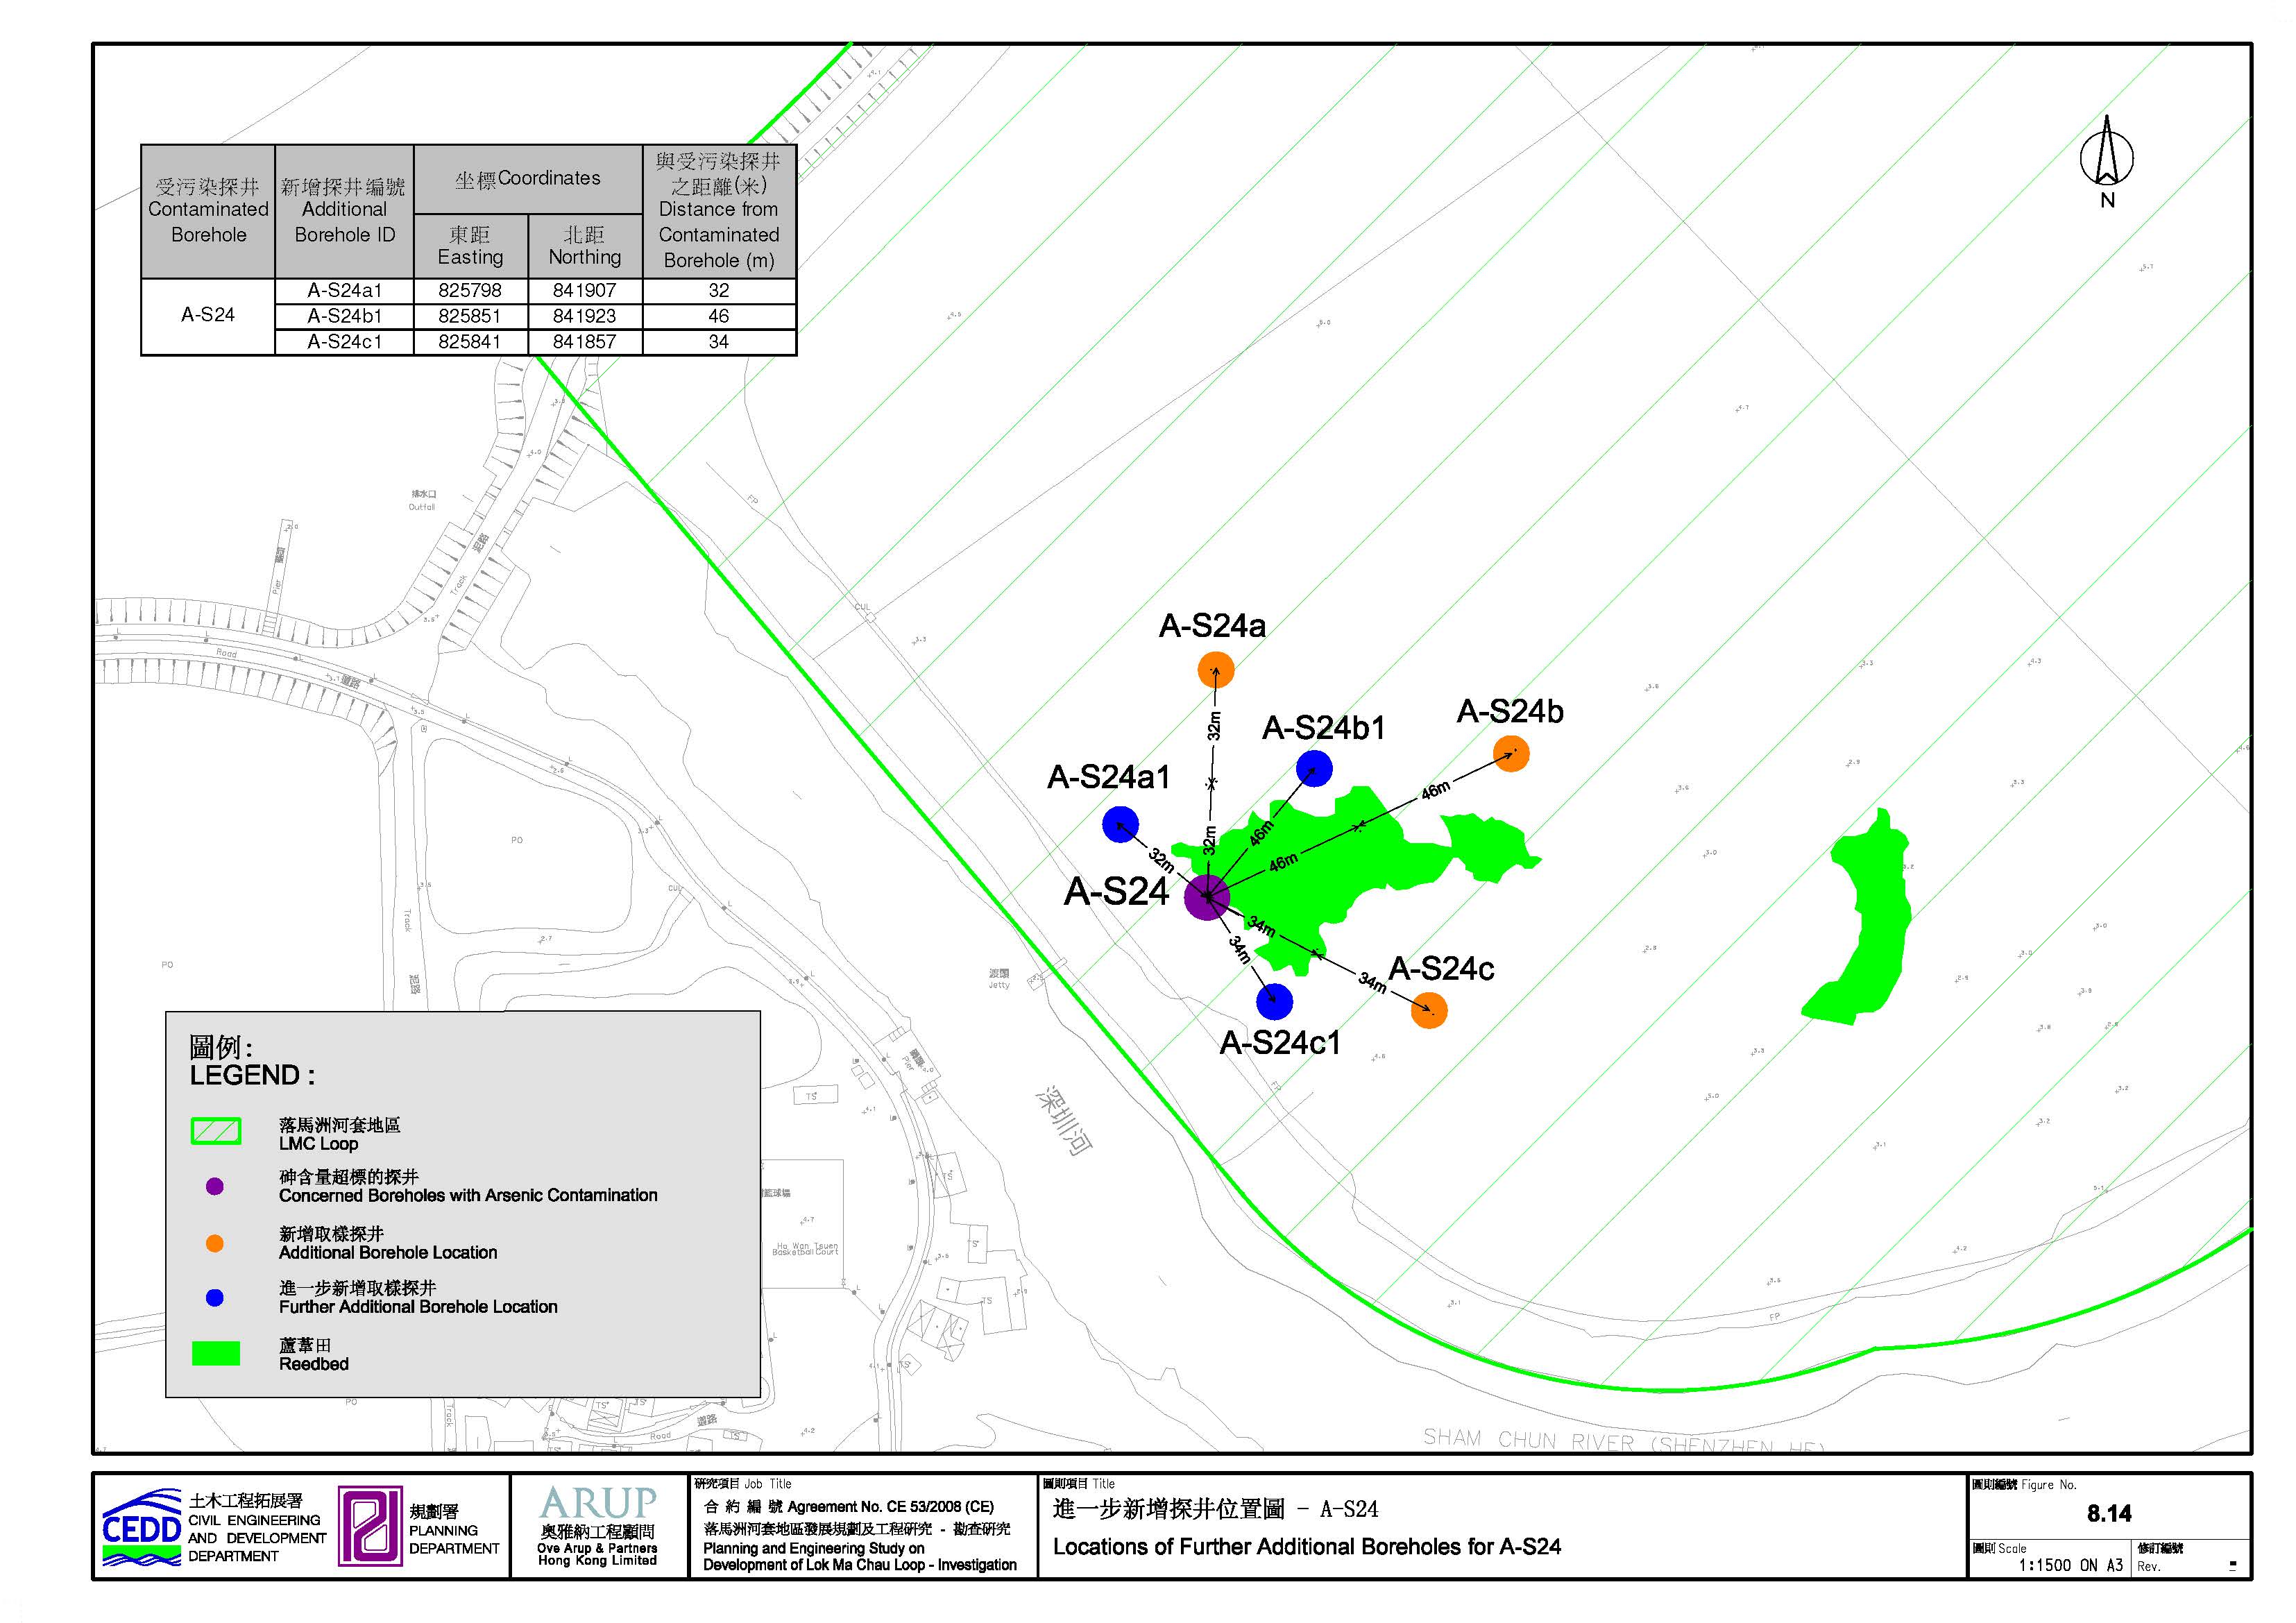
Figure 8.14 Locations of Further Additional Boreholes for A-S24
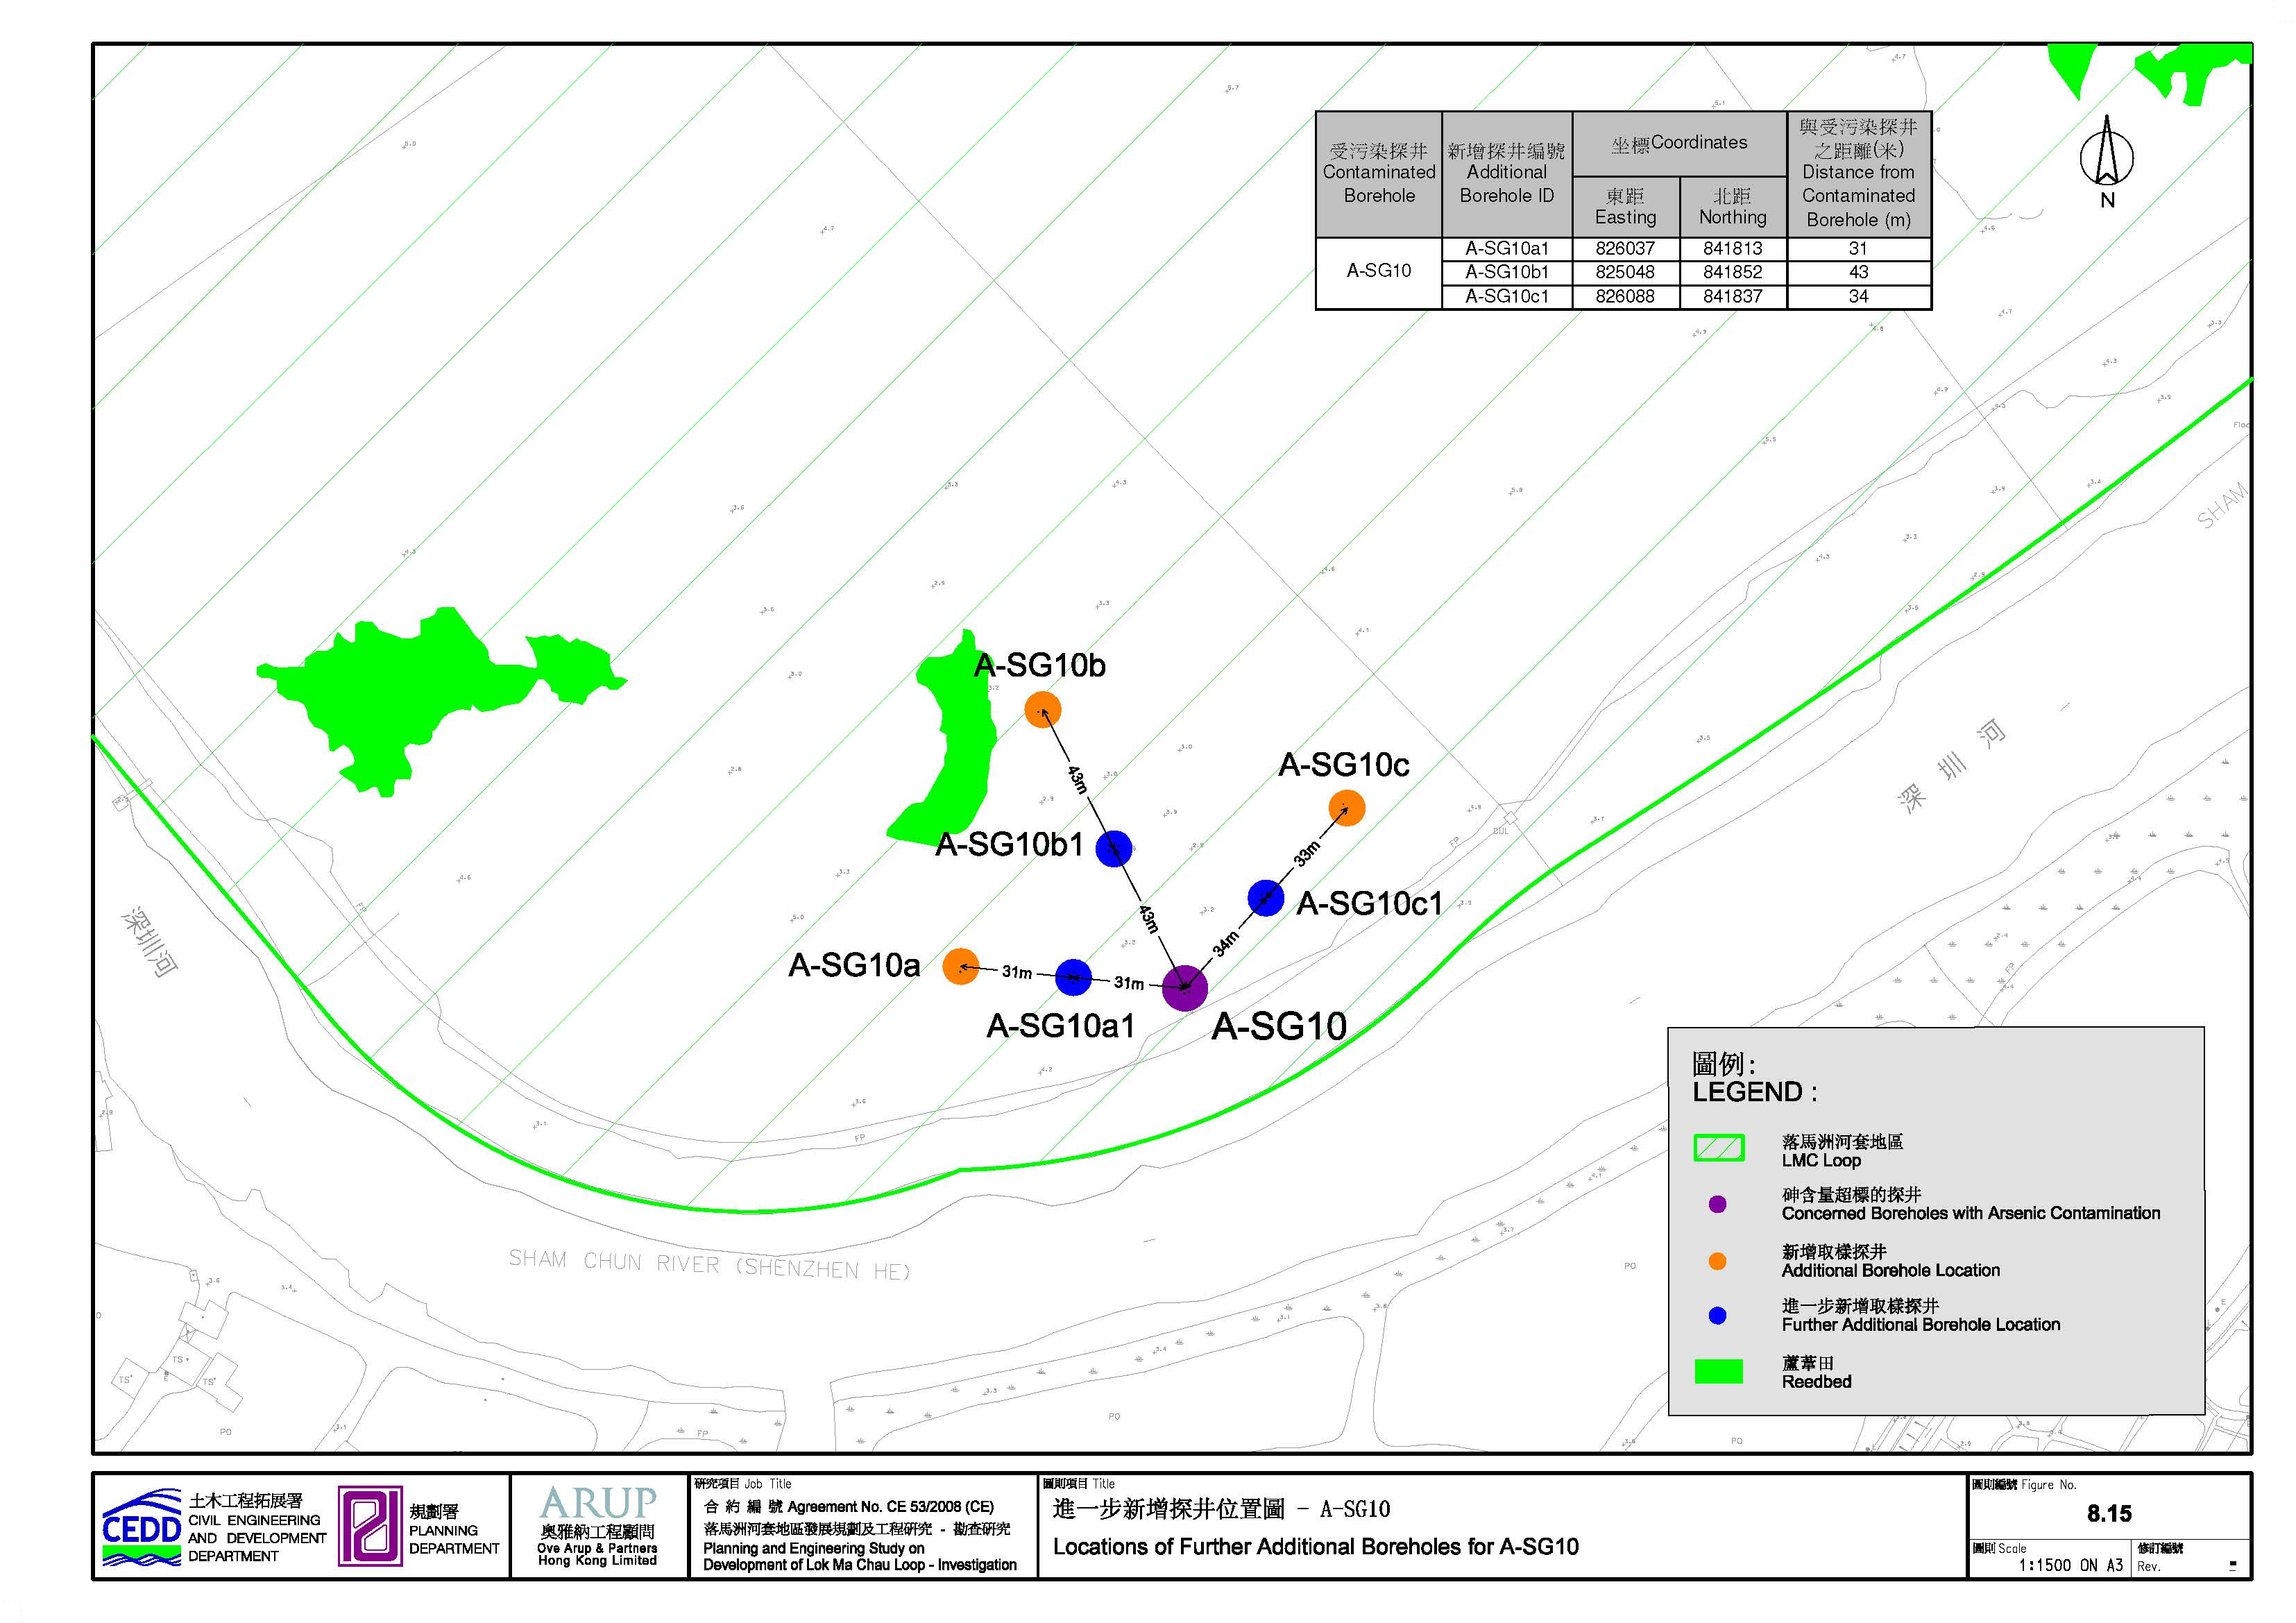
Figure 8.15 Locations of Further Additional Boreholes for A-SG10
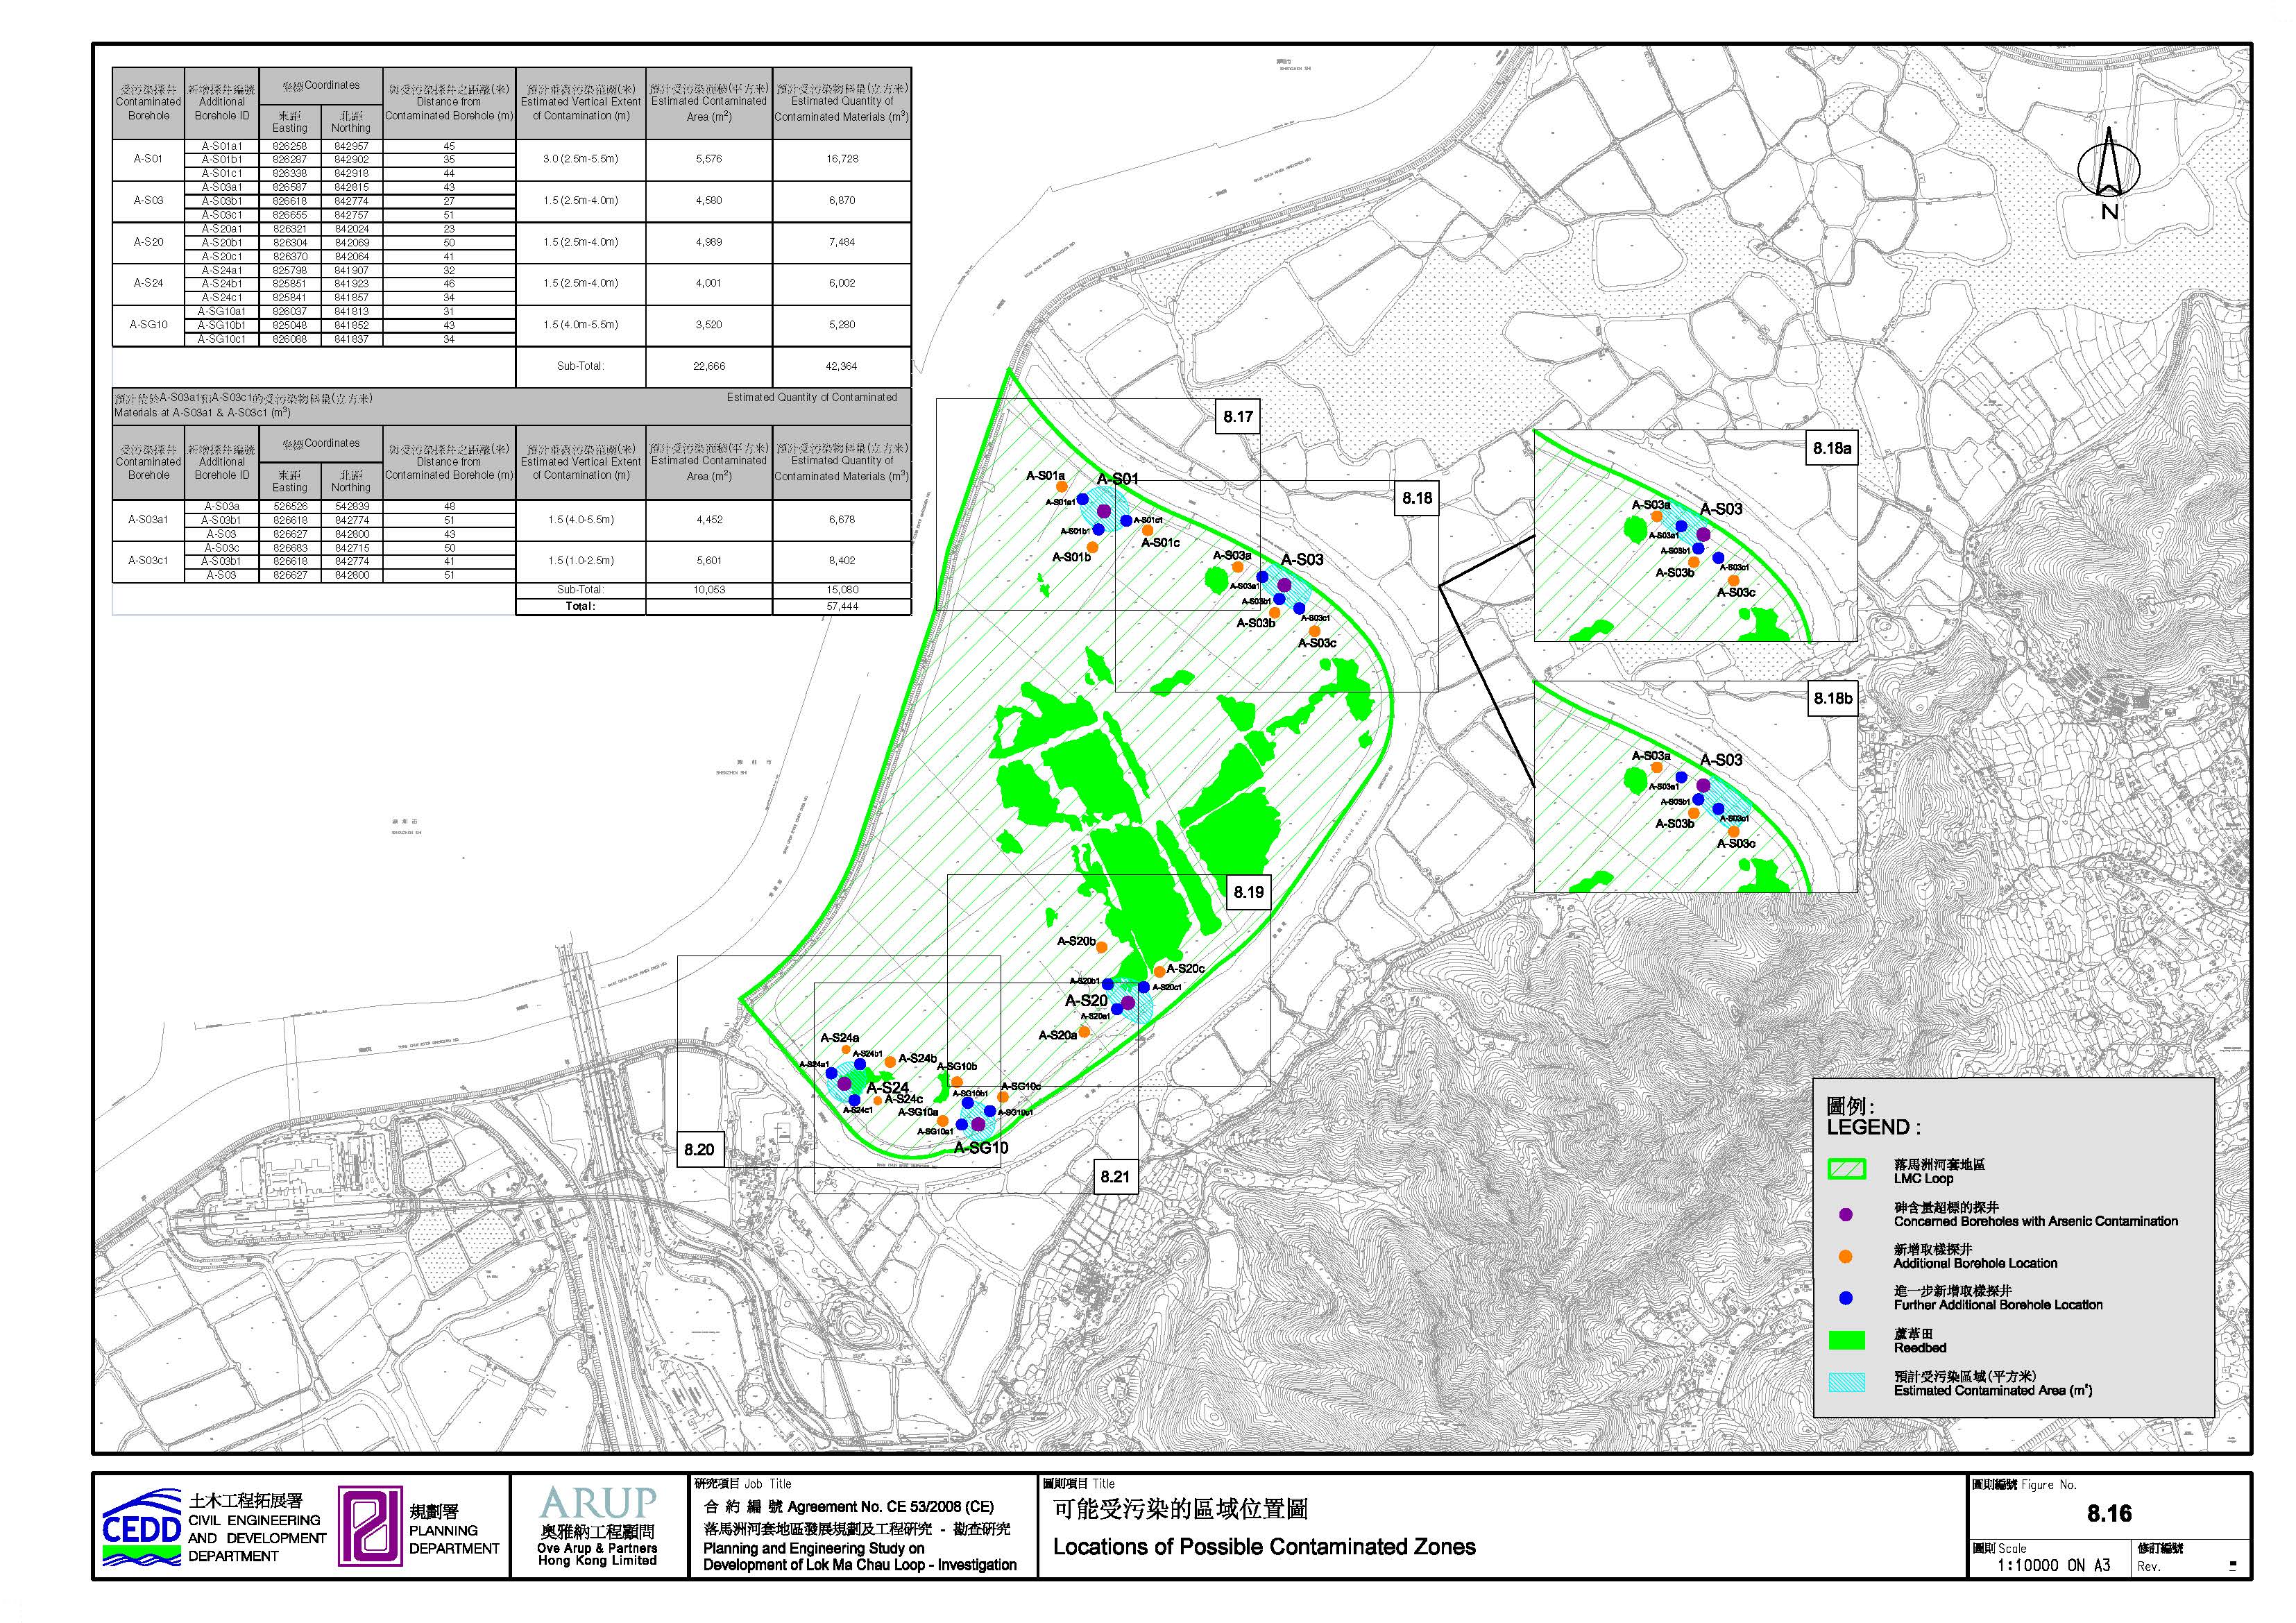
Figure 8.16 Locations of Possible Contaminated Zones
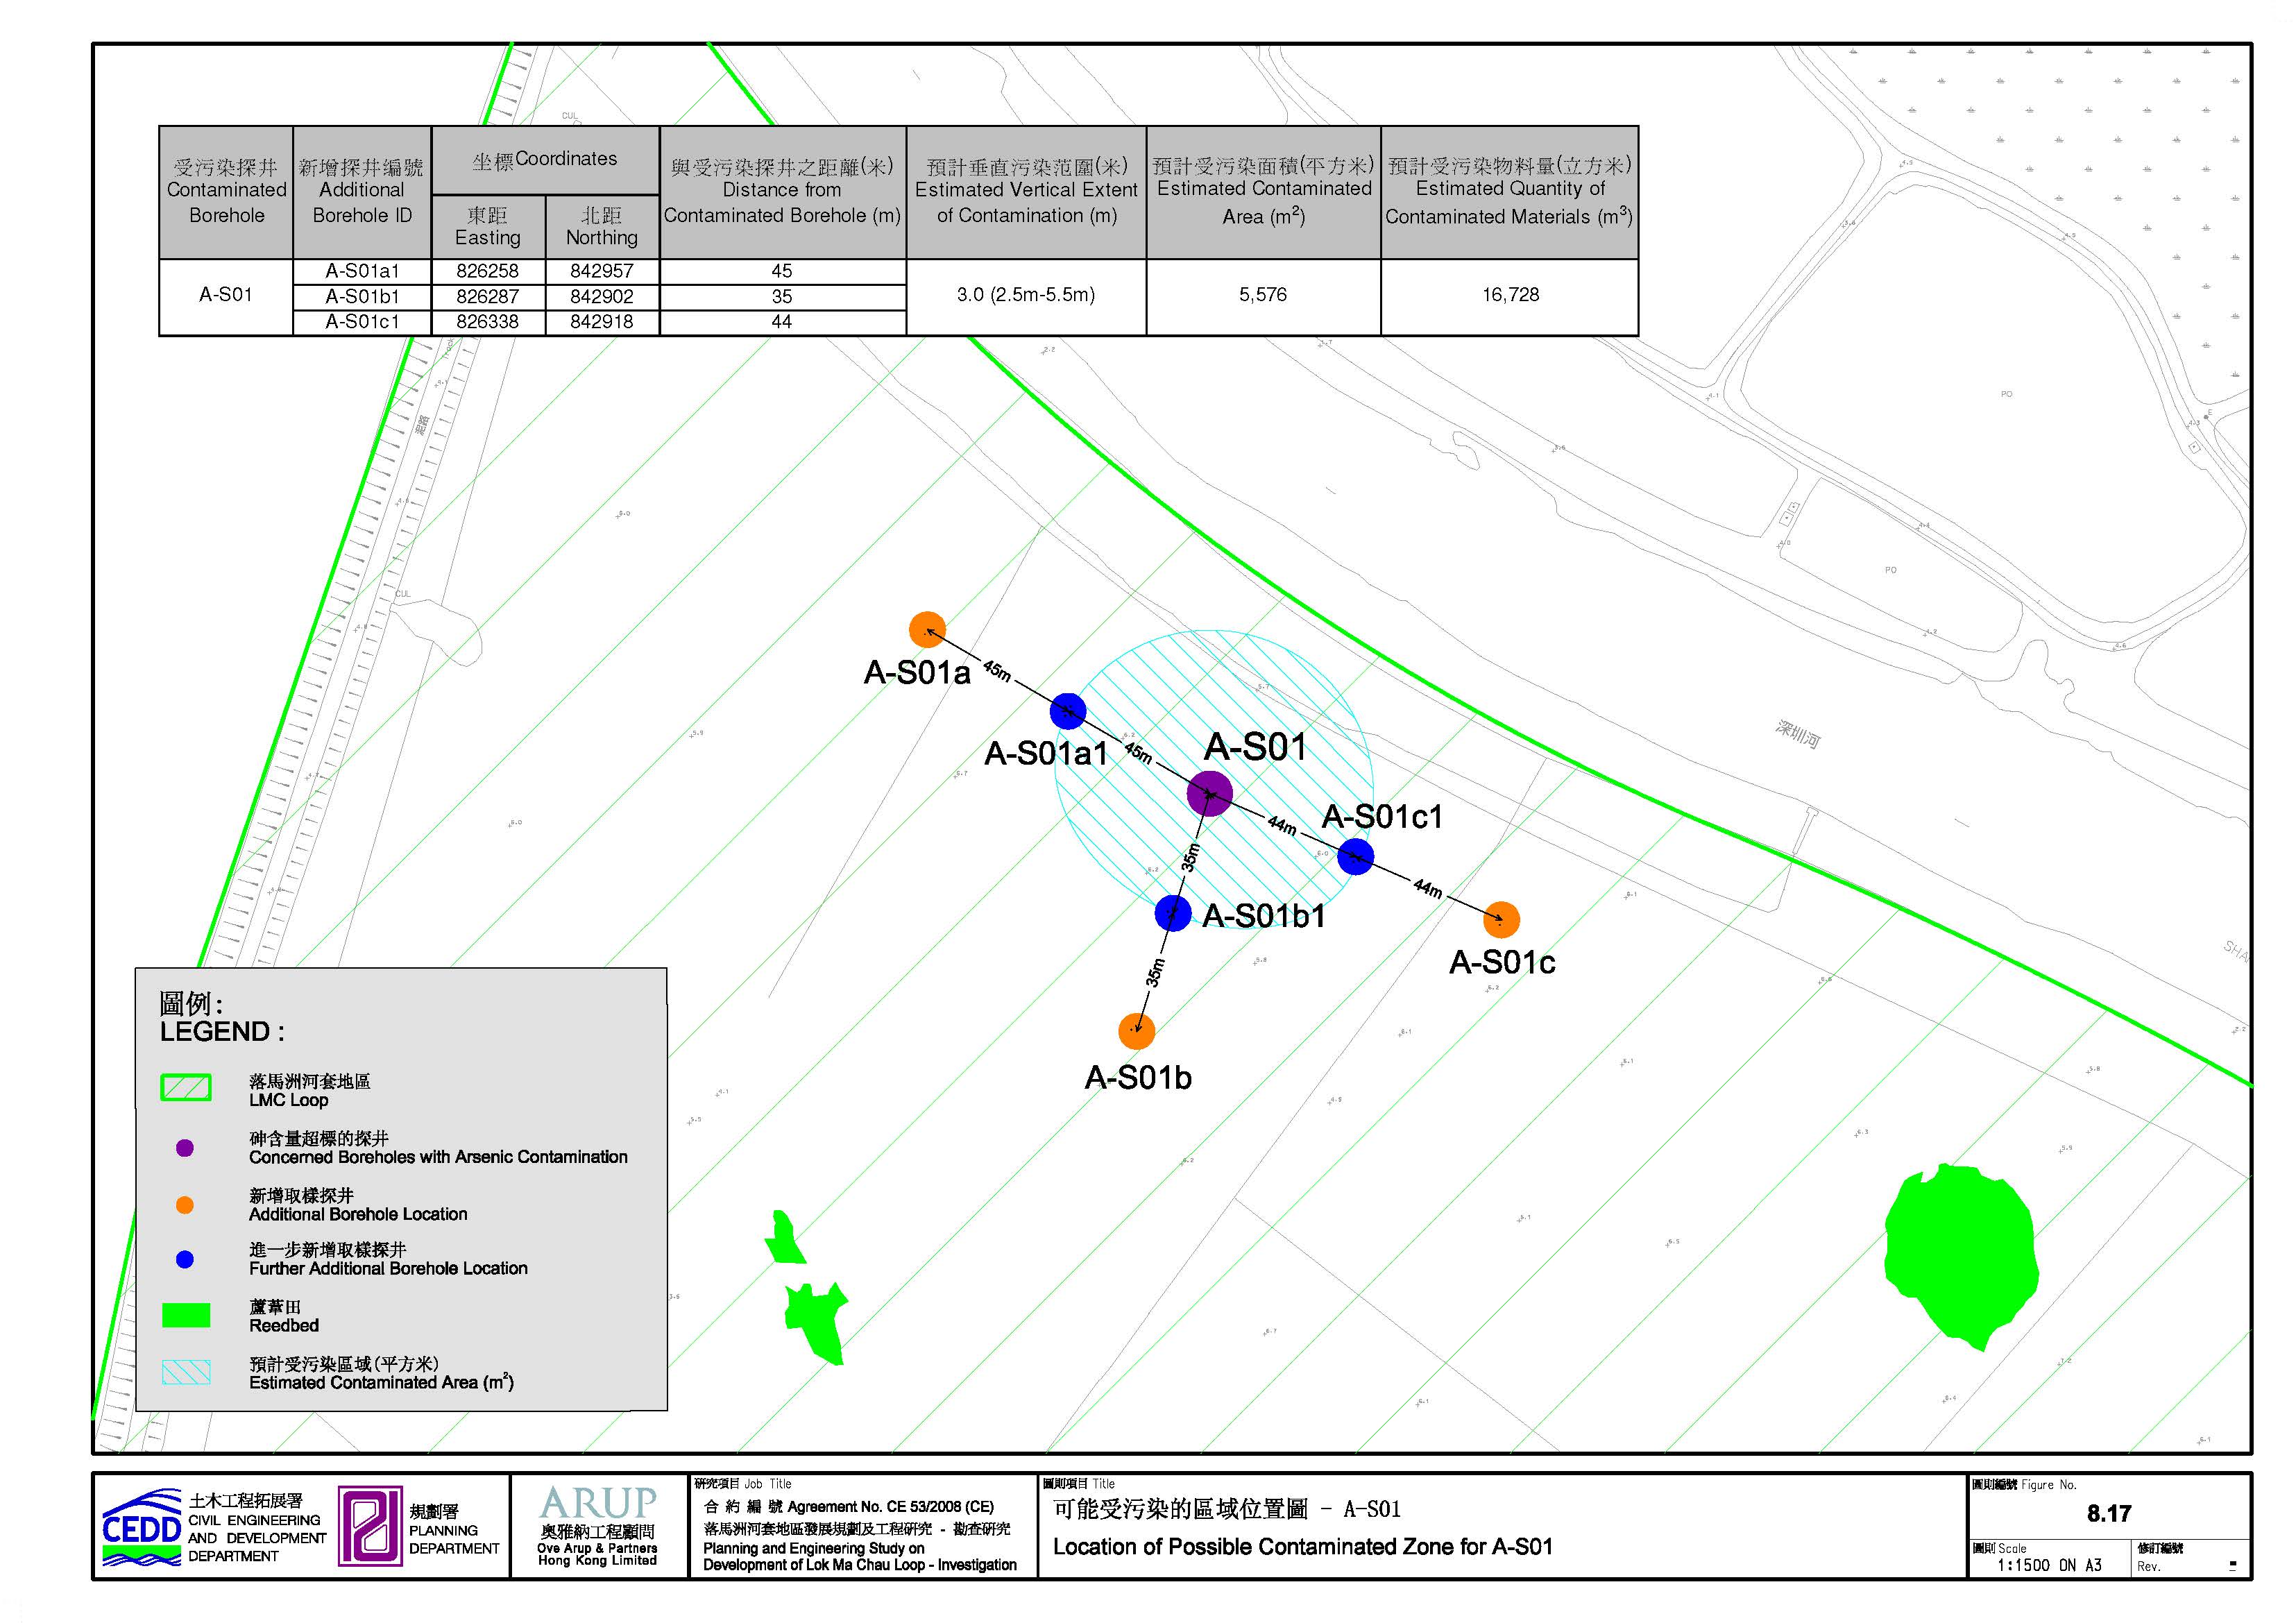
Figure 8.17 Locations of Possible Contaminated Zones for A-S01
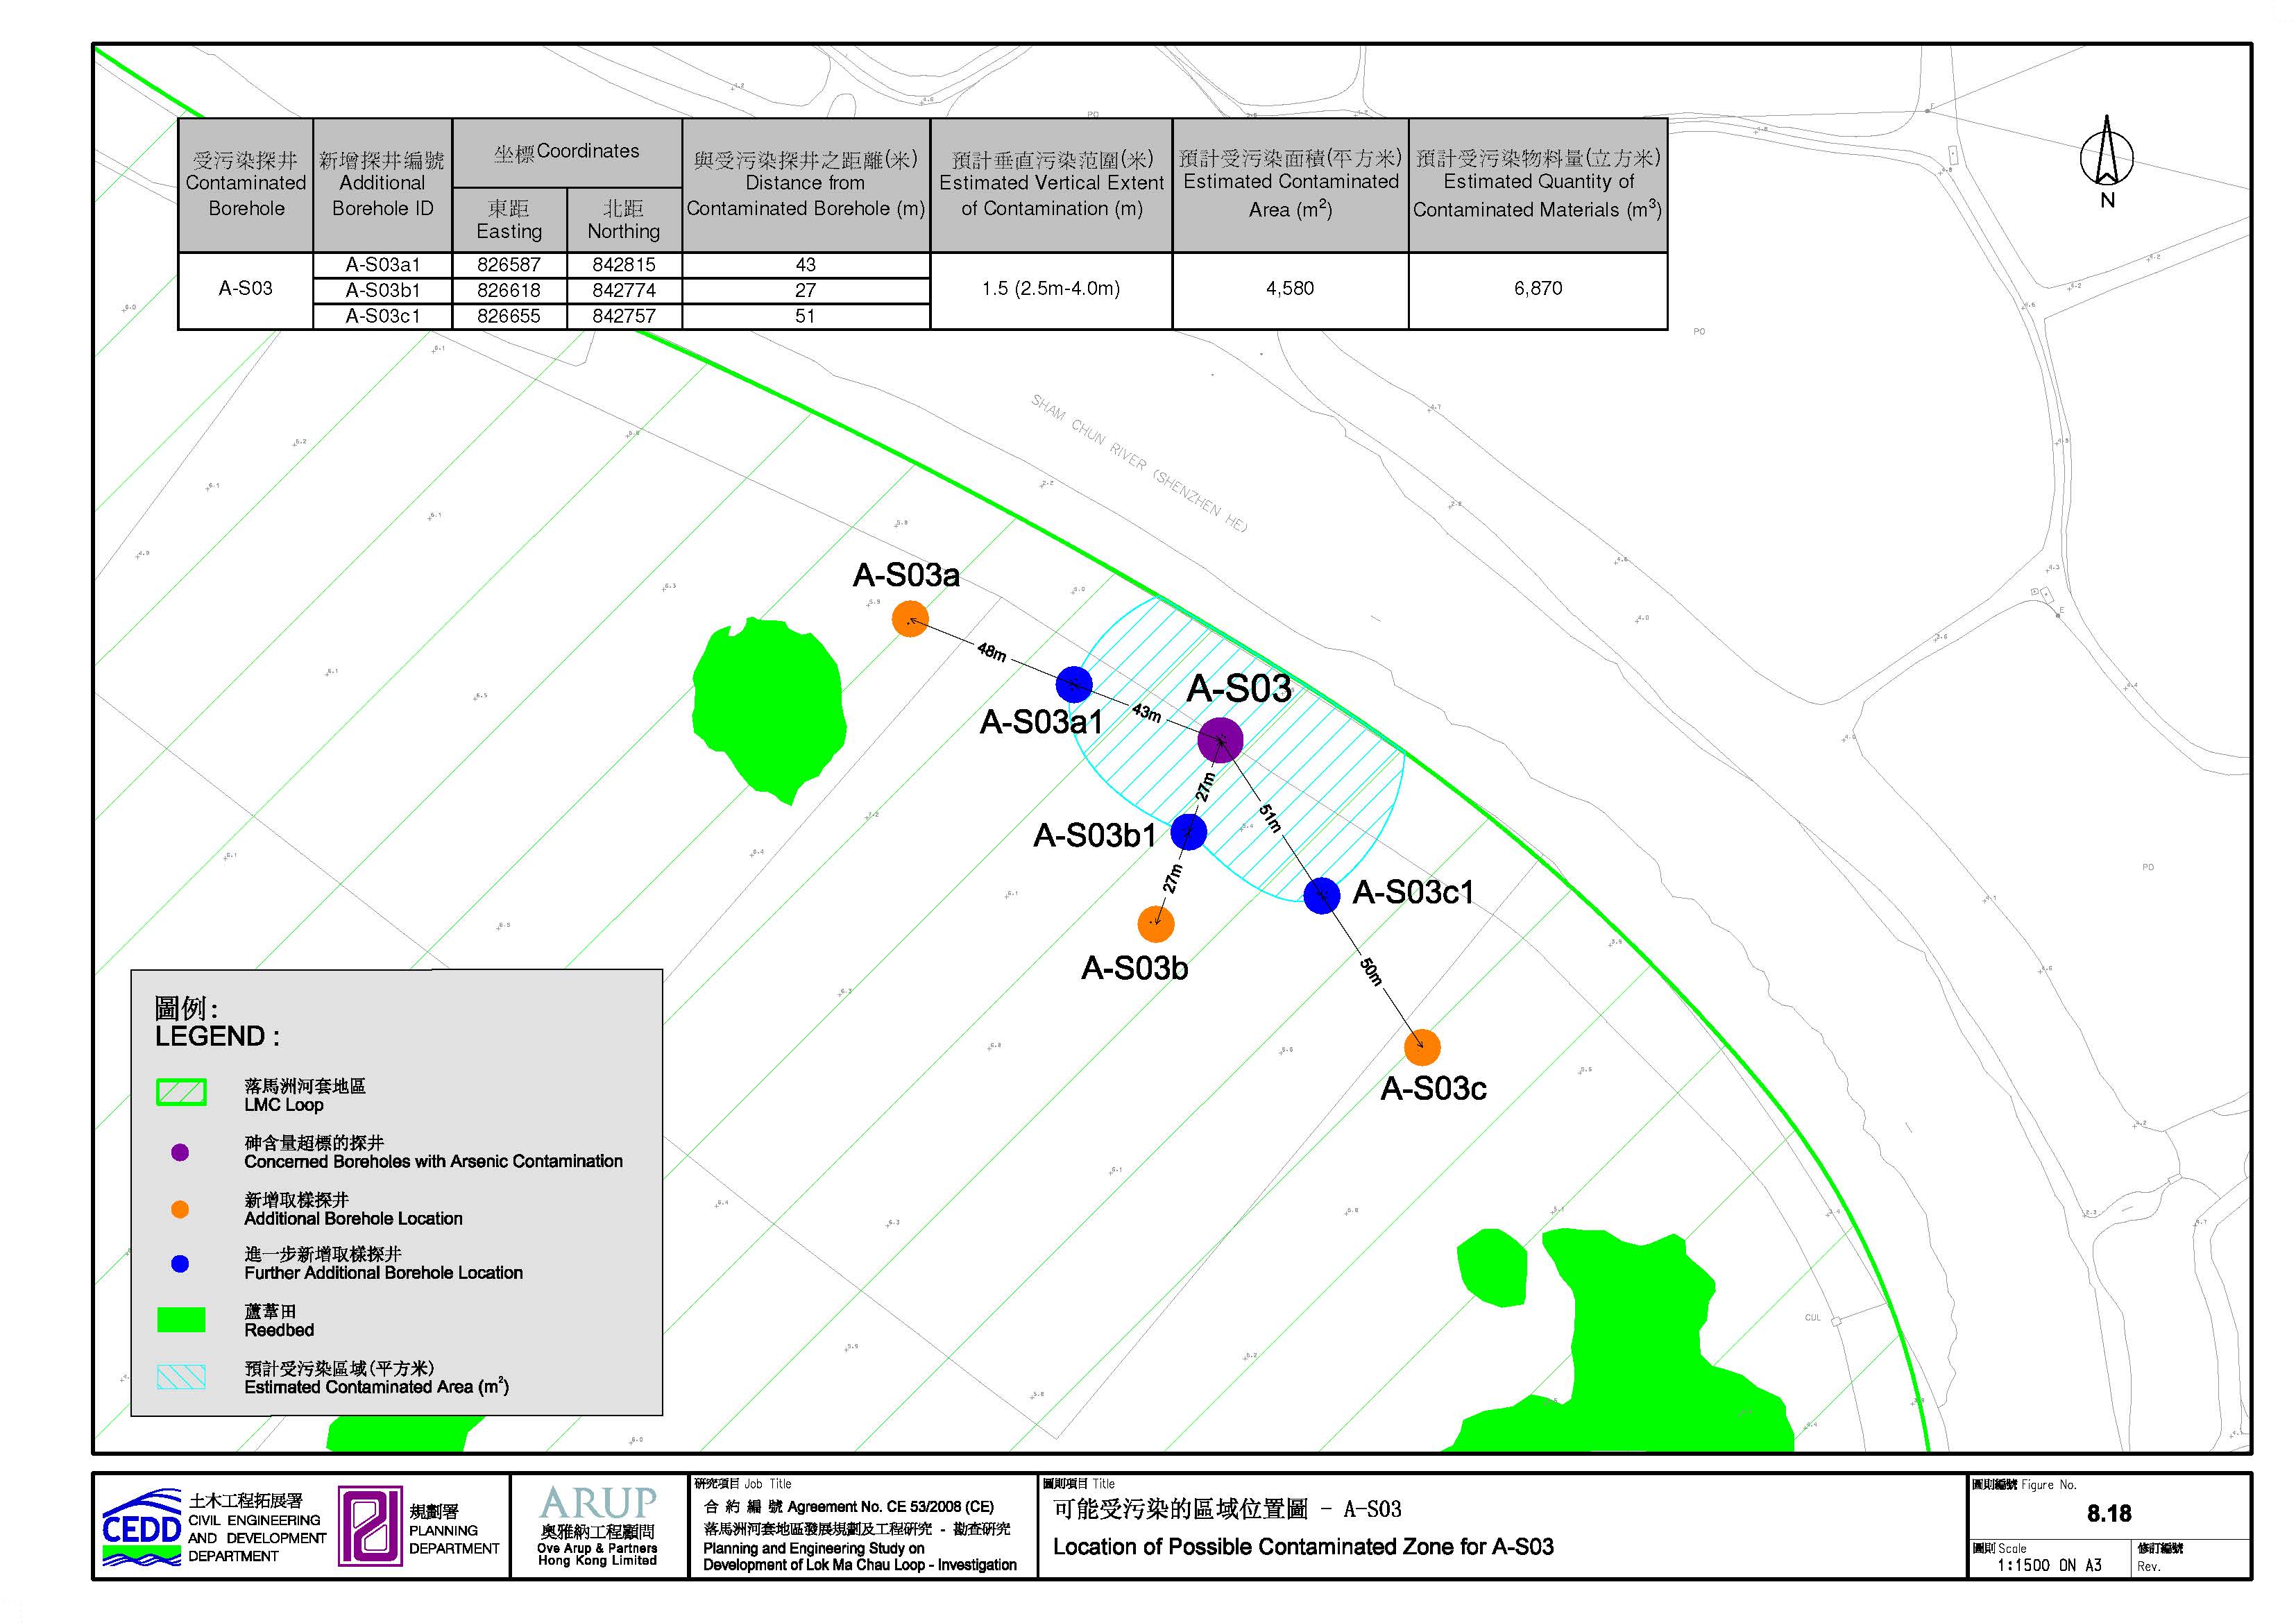
Figure 8.18 Locations of Possible Contaminated Zones for A-S03
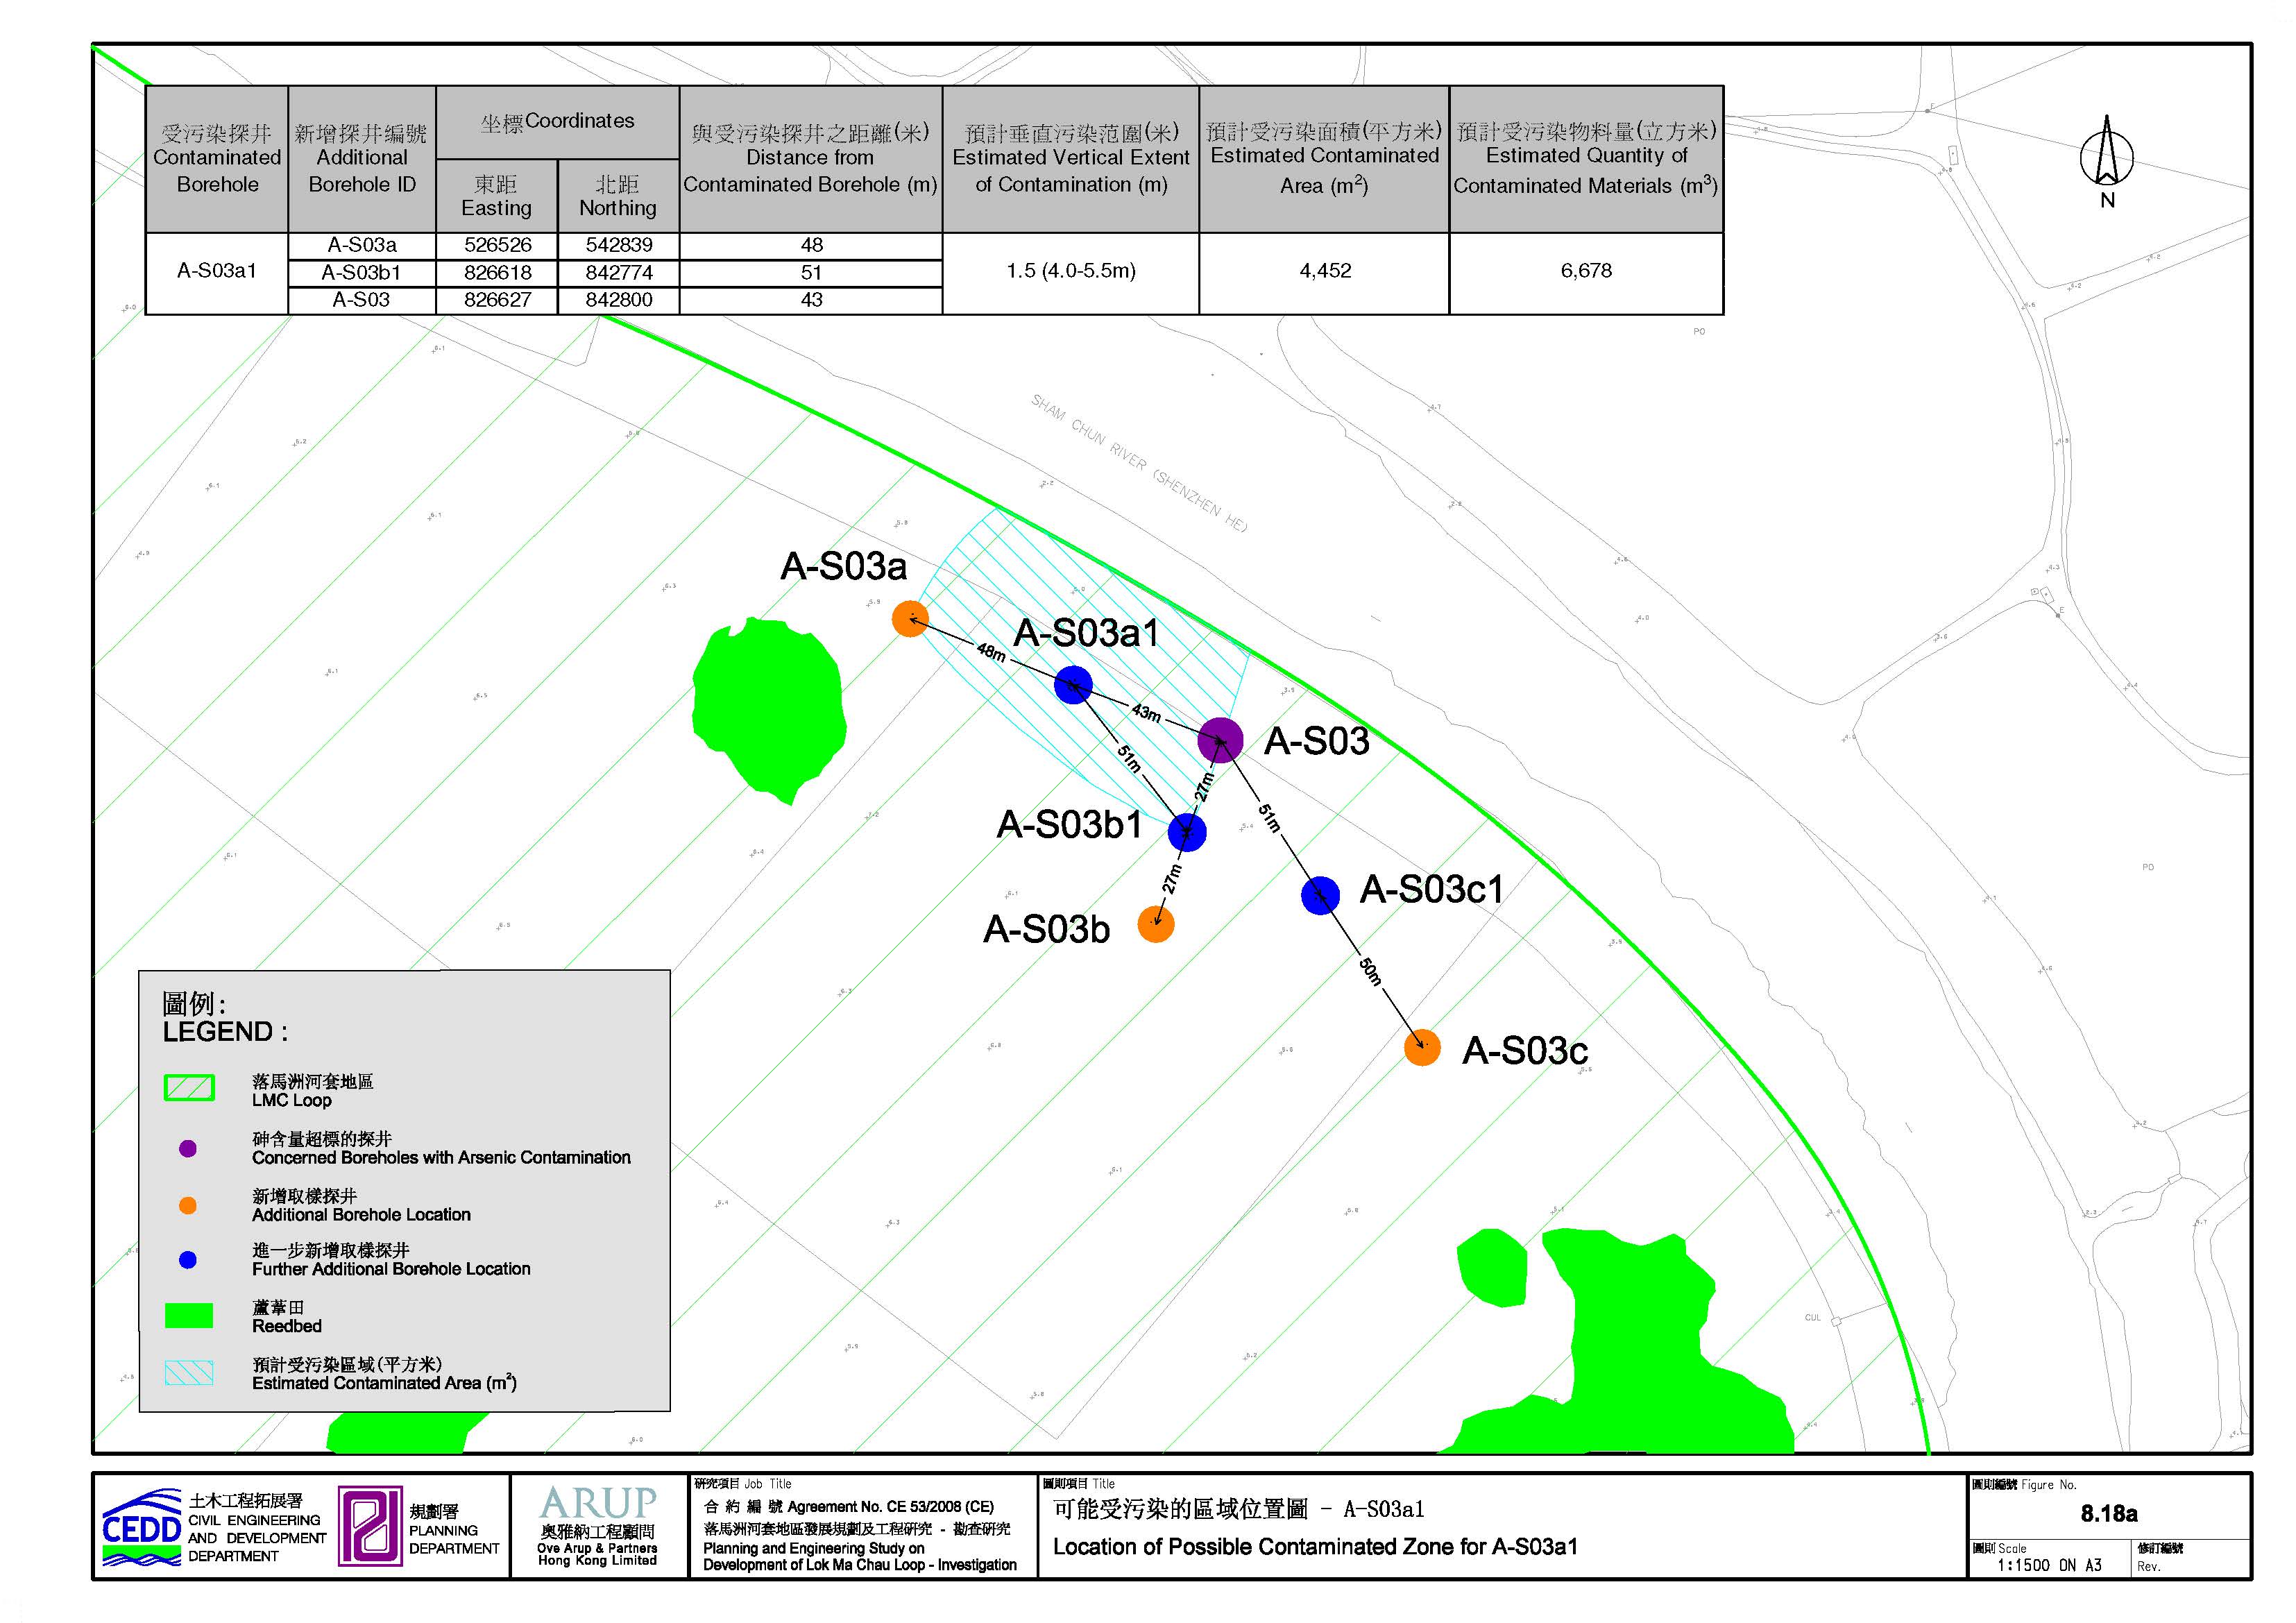
Figure 8.18a Locations of Possible Contaminated Zones for A-S03a1
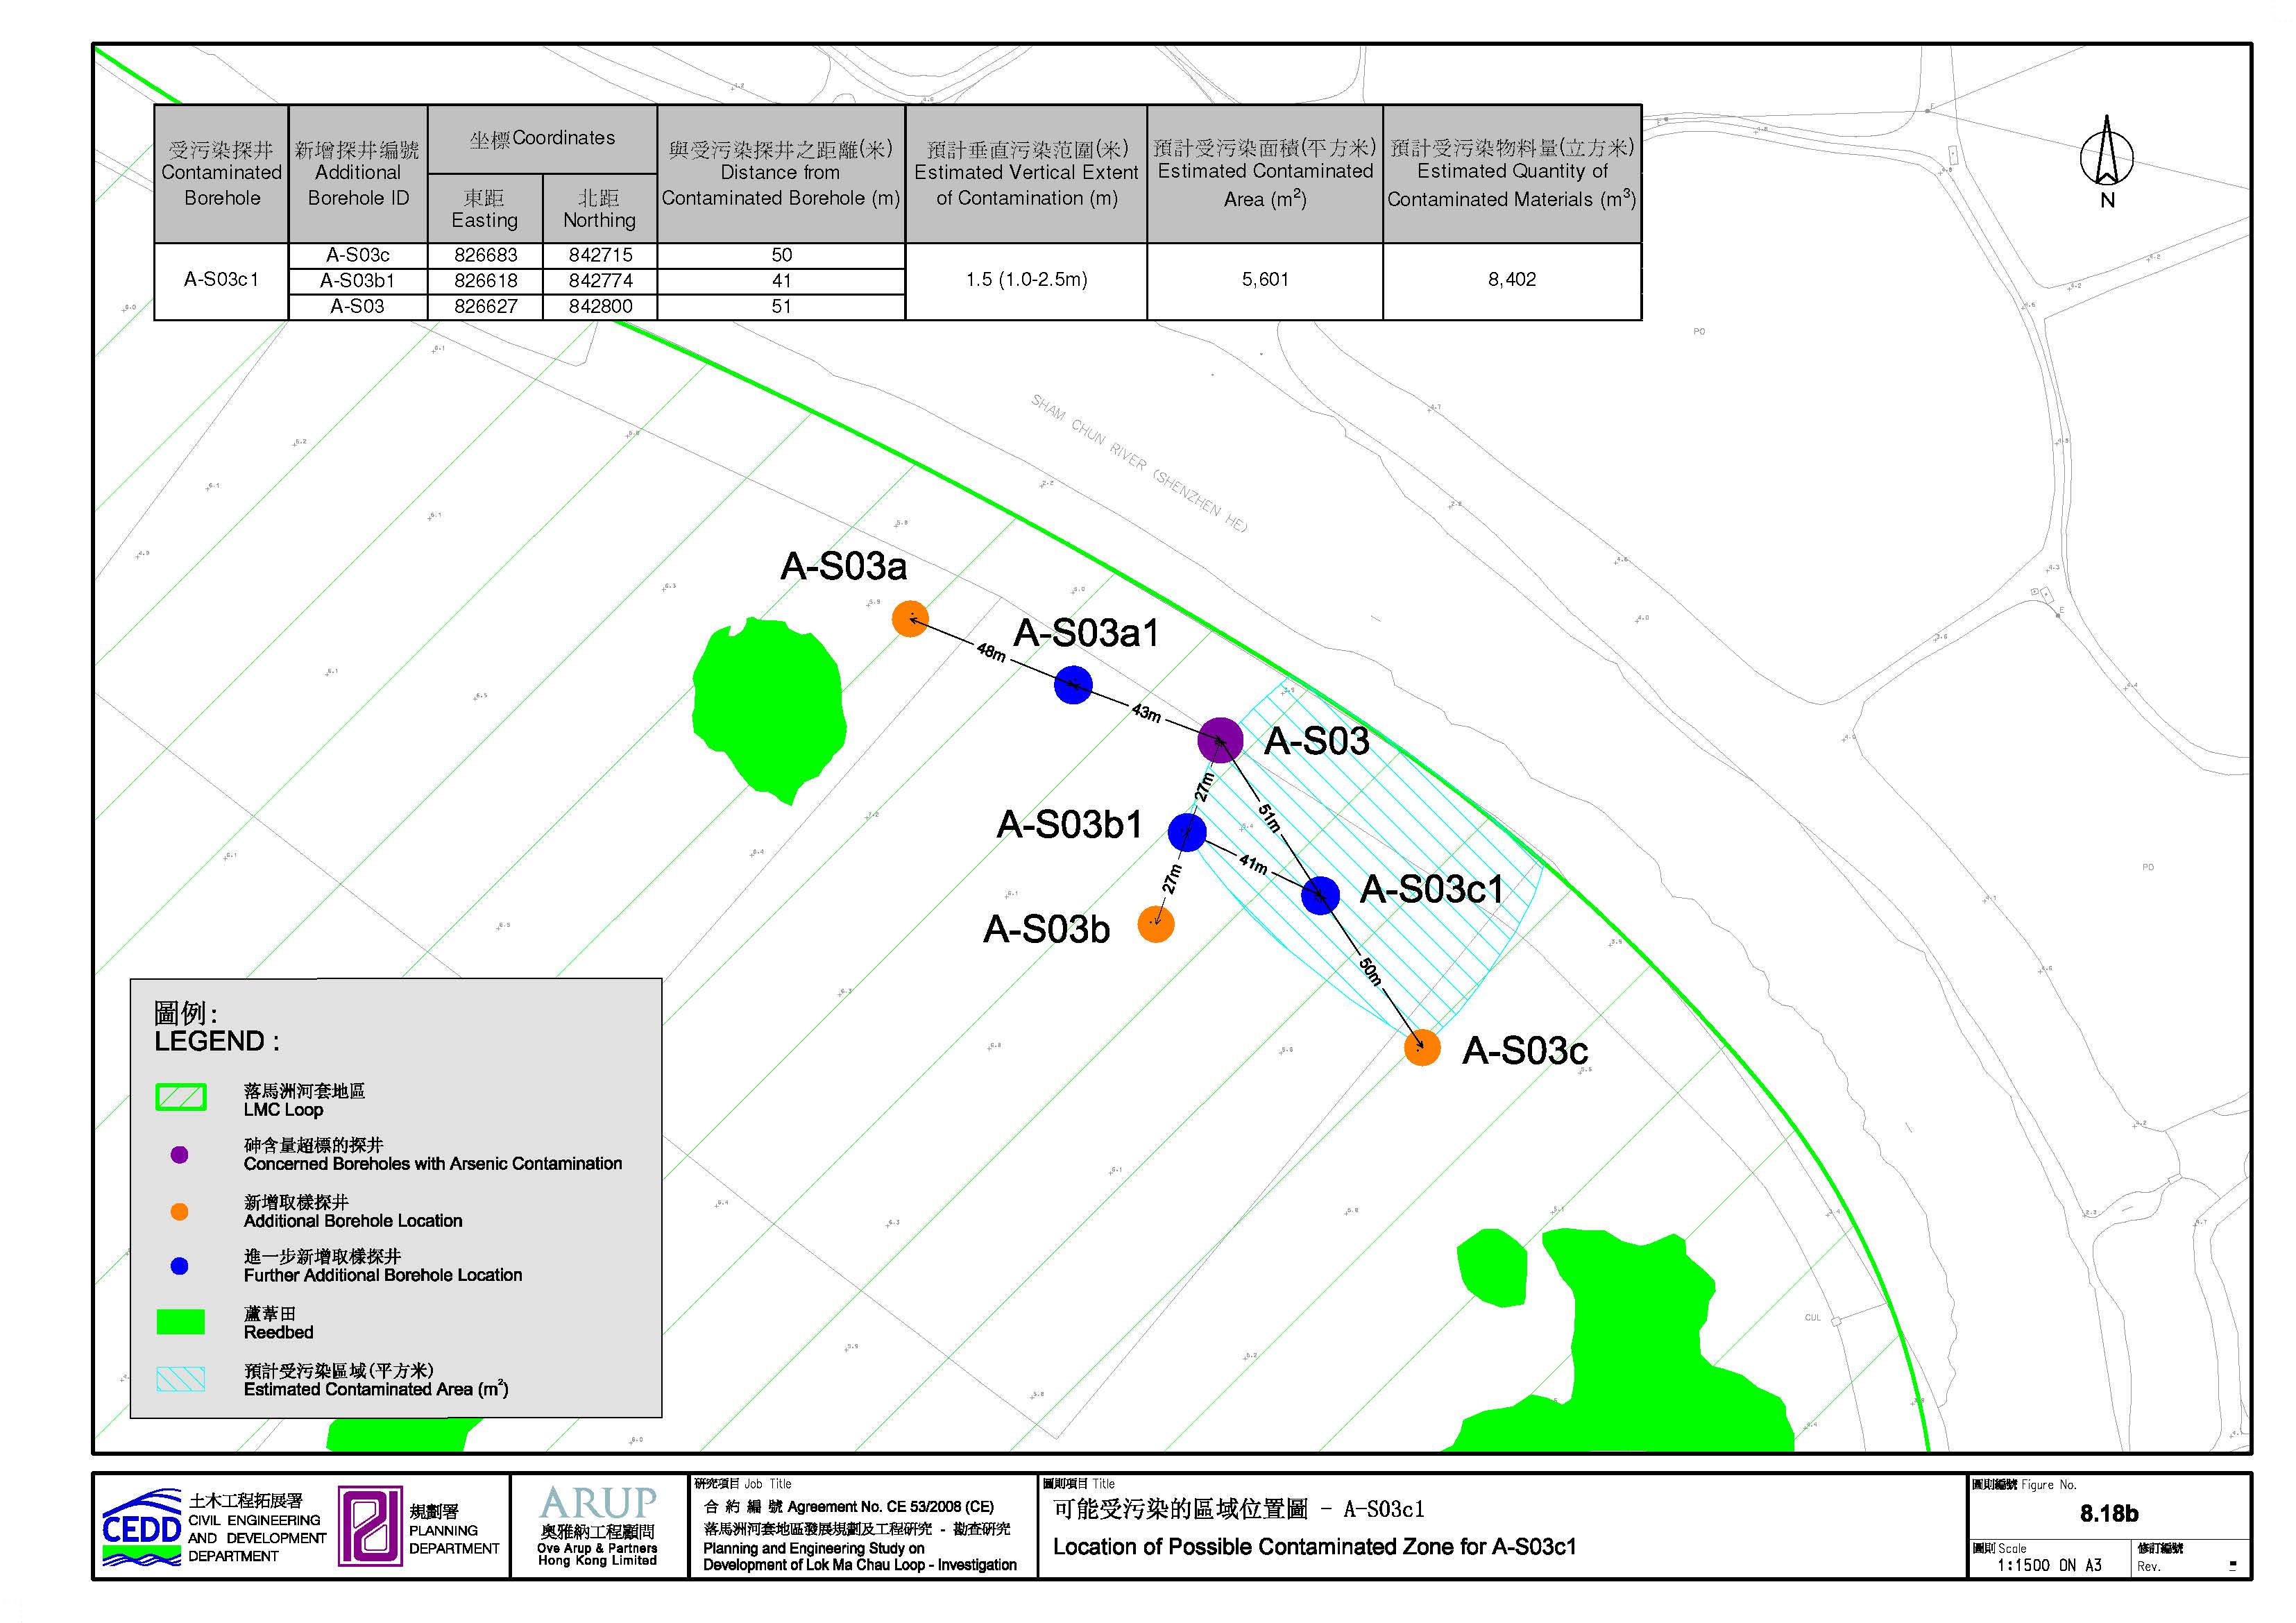
Figure 8.18b Locations of Possible Contaminated Zones for A-S03c1
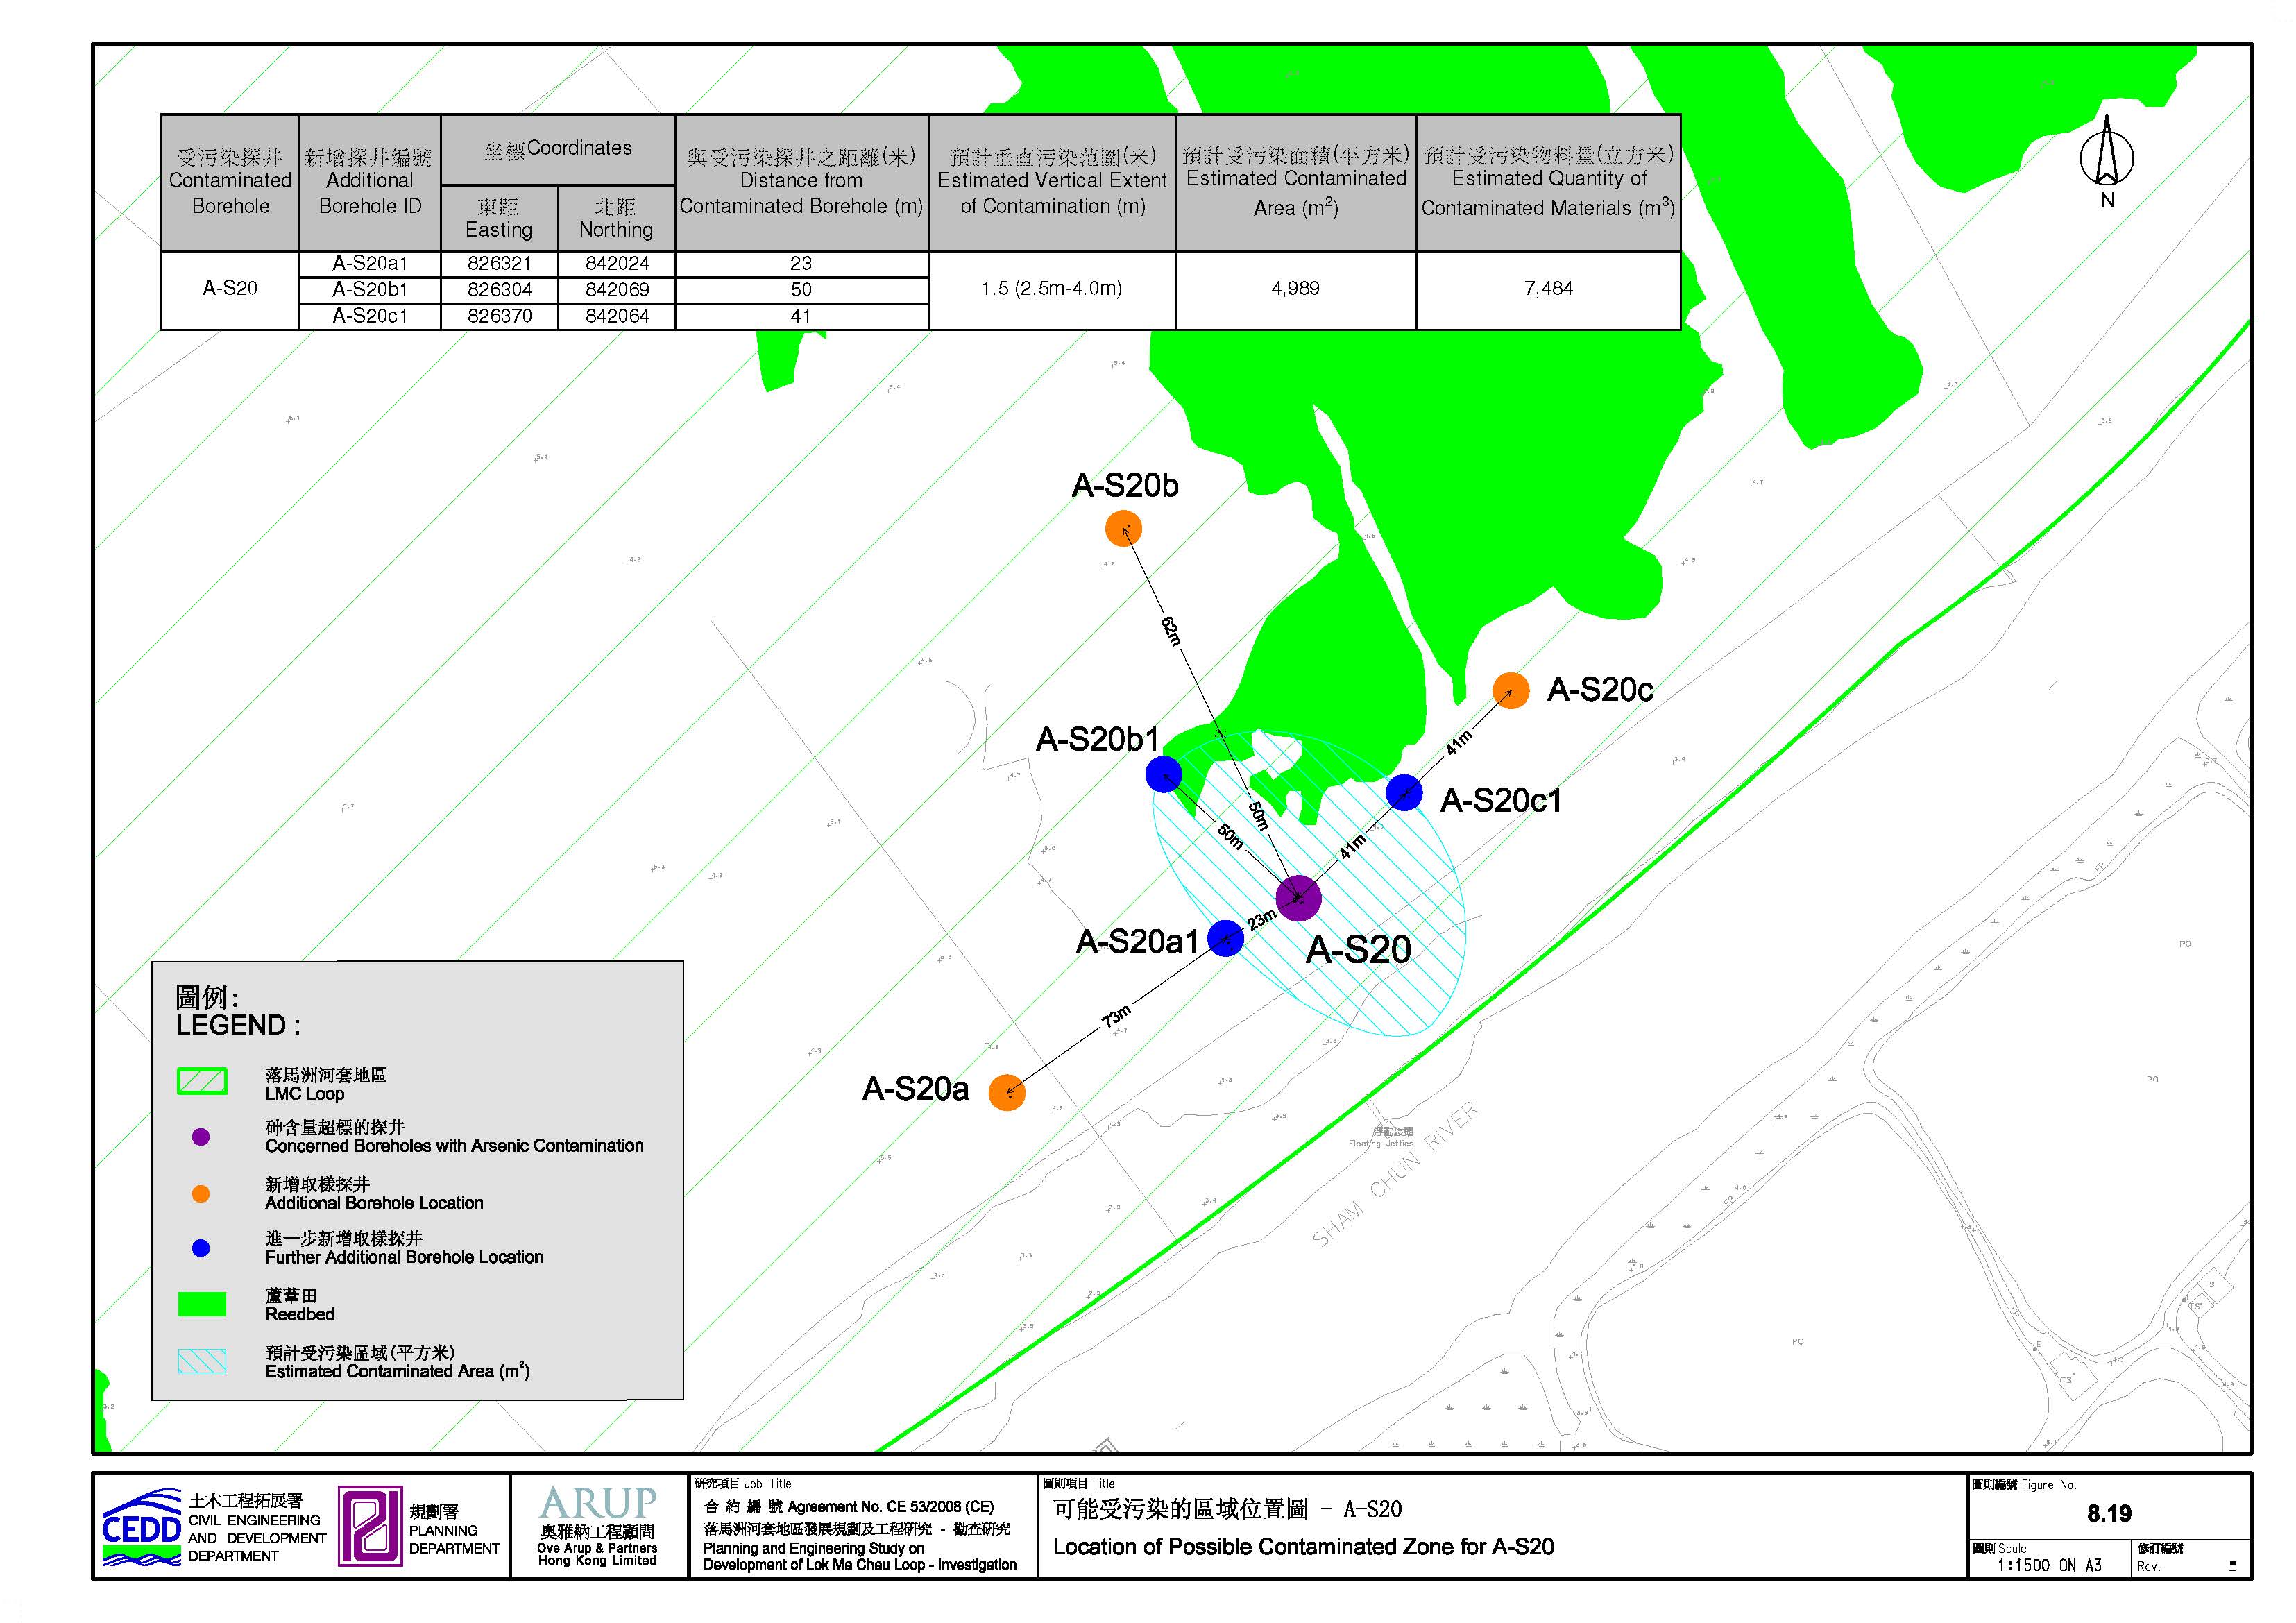
Figure 8.19 Locations of Possible Contaminated Zones for A-S20
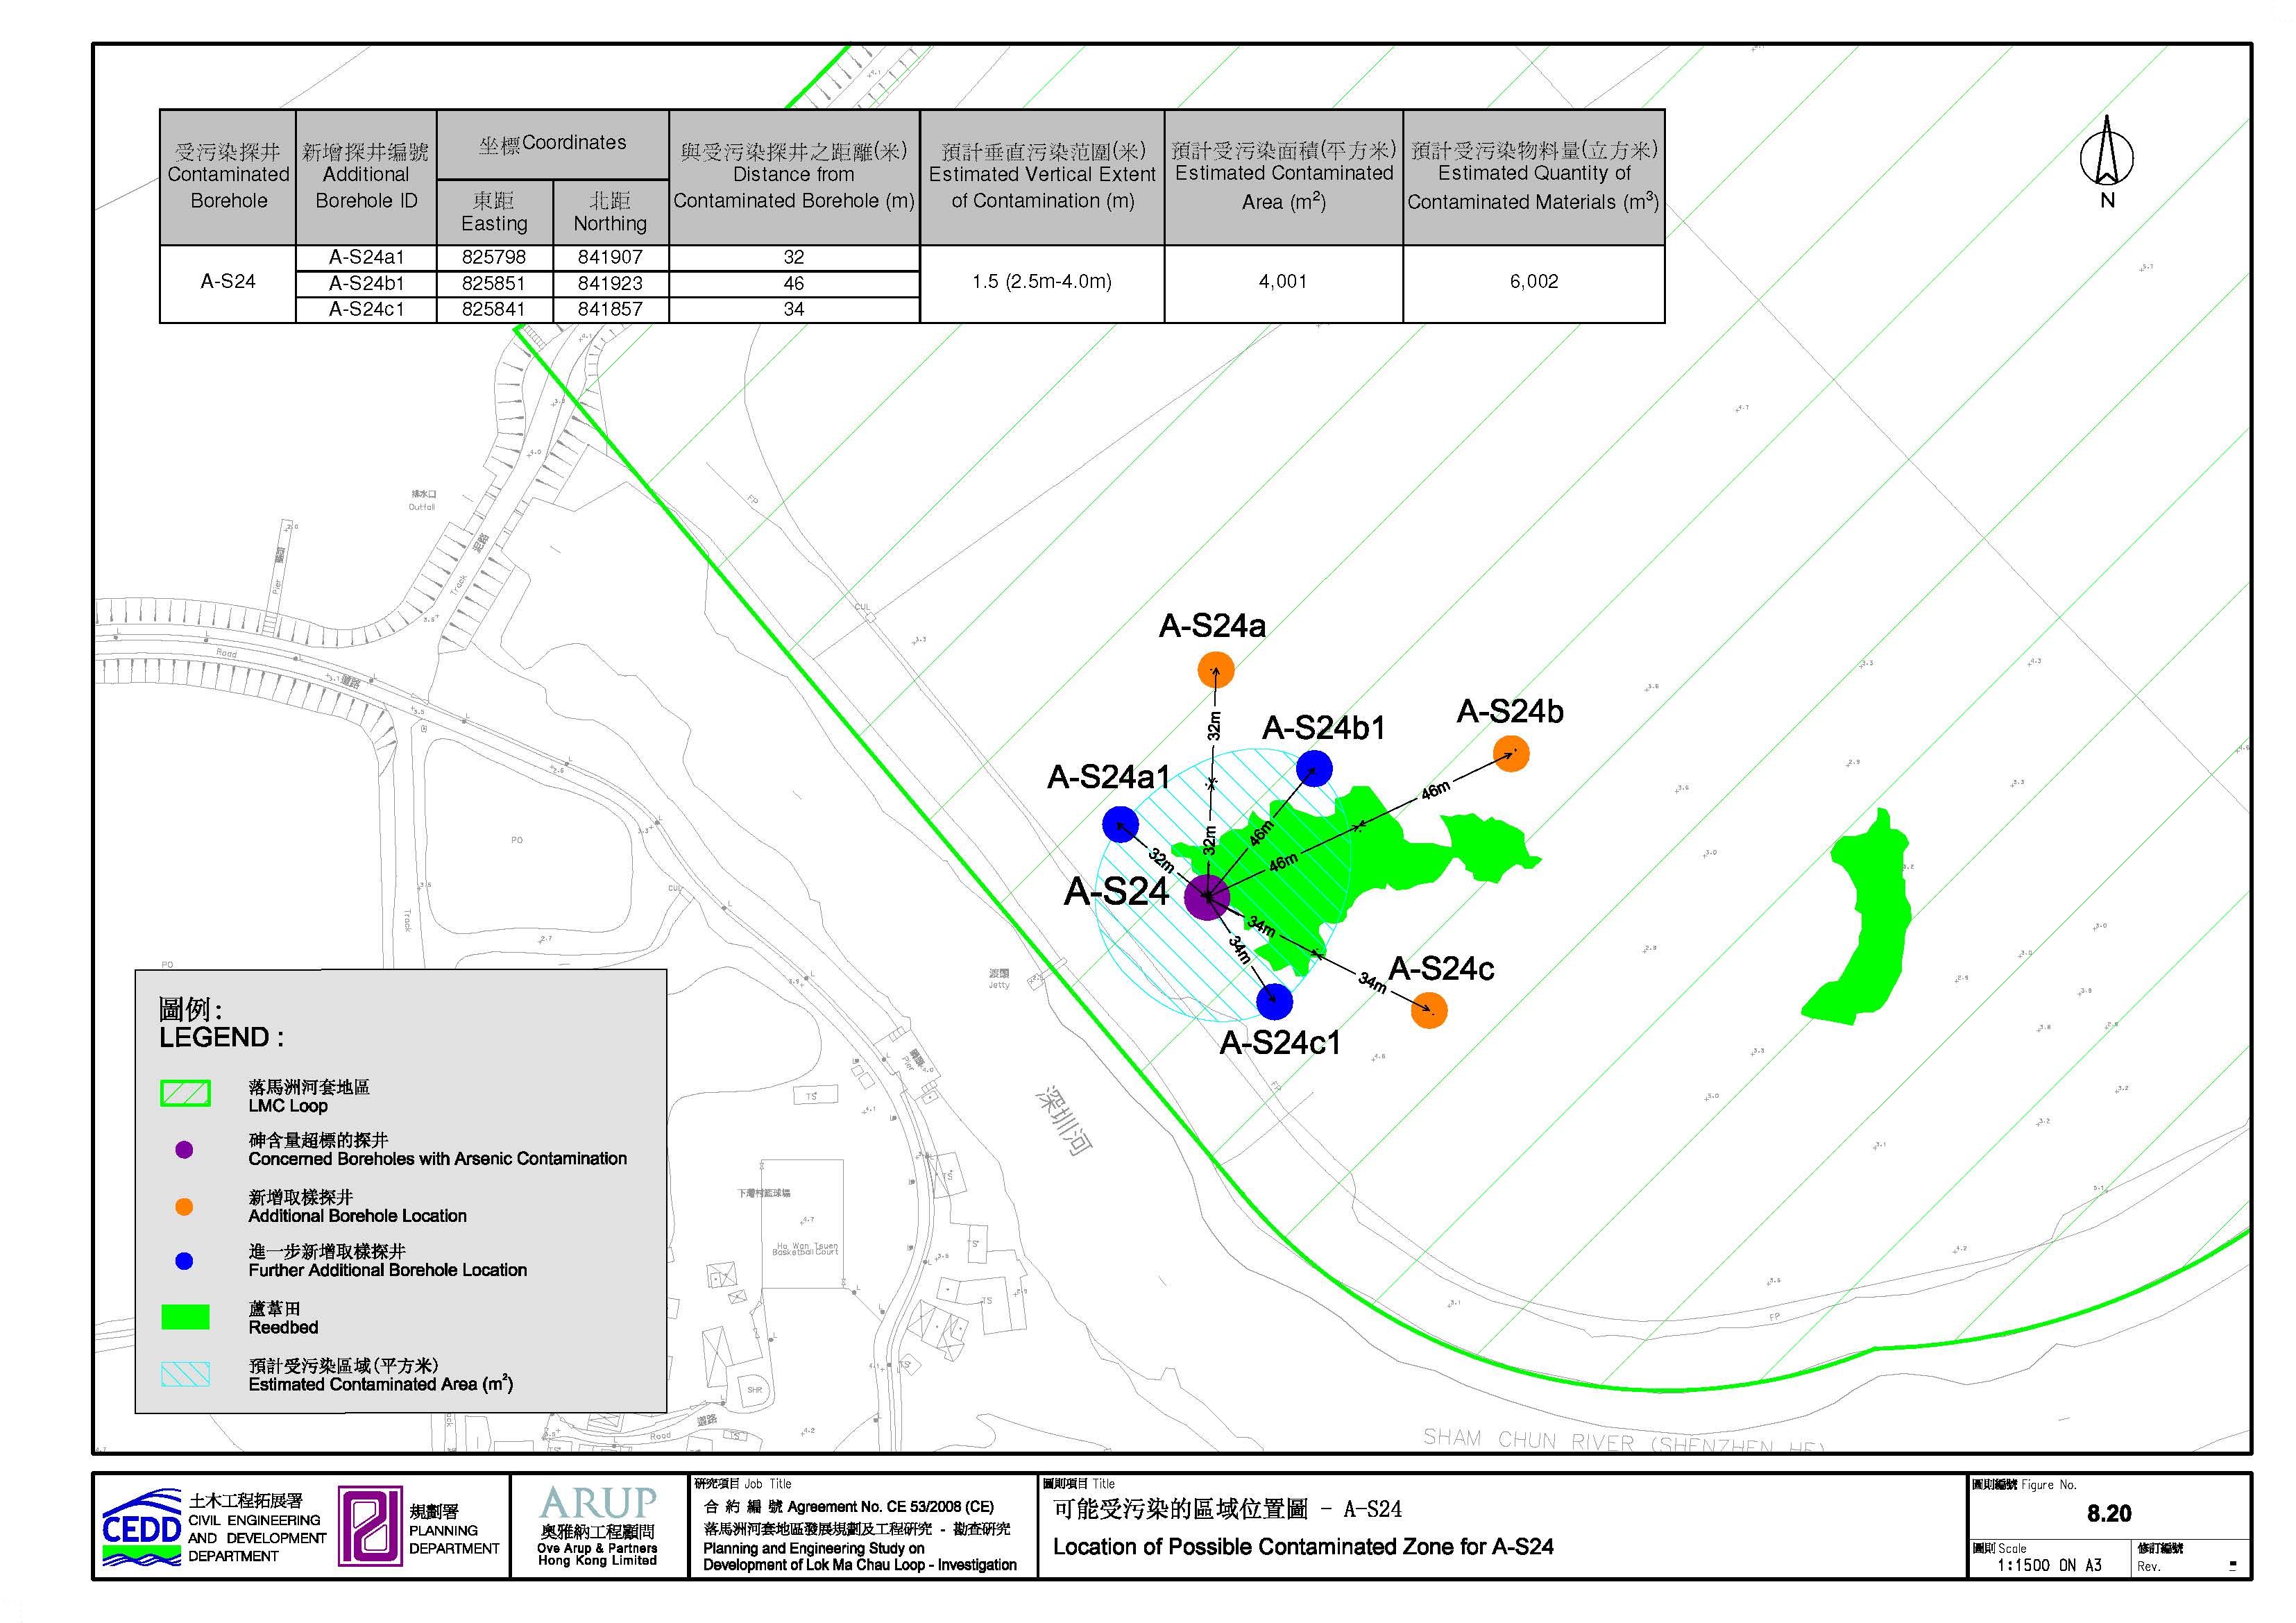
Figure 8.20 Locations of Possible Contaminated Zones for A-S24
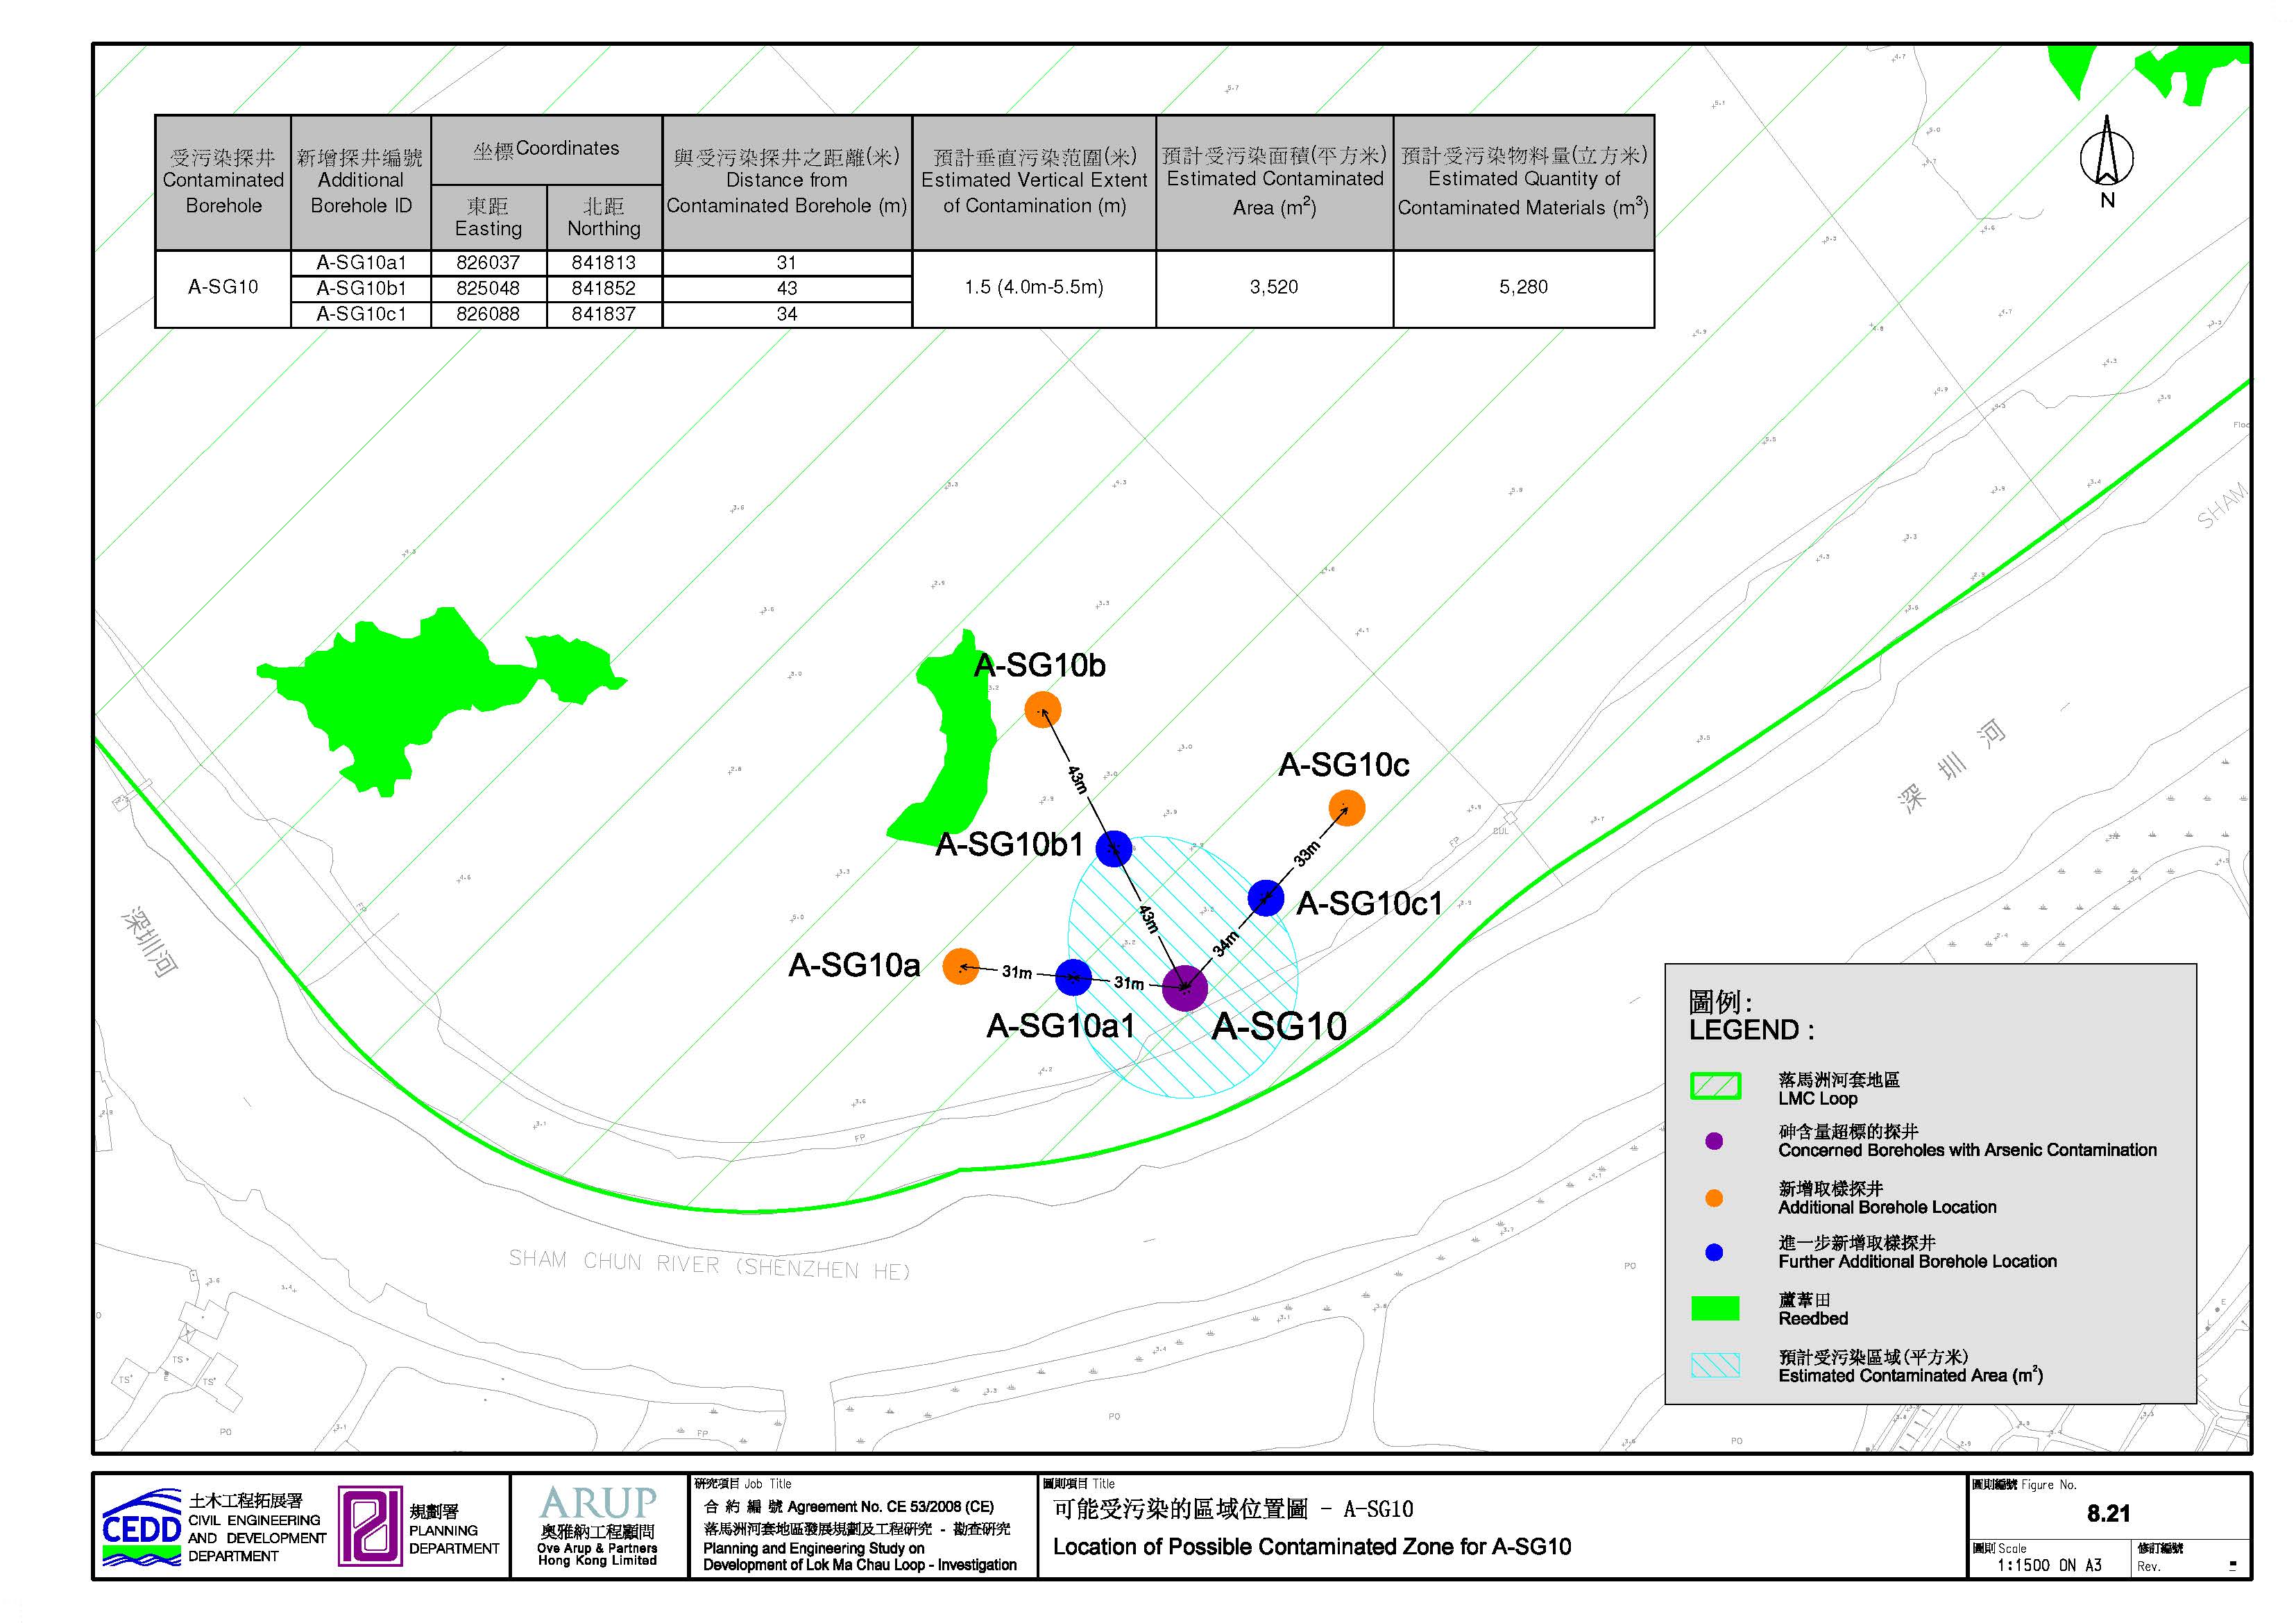
Figure 8.21 Locations of Possible Contaminated Zones for A-SG10
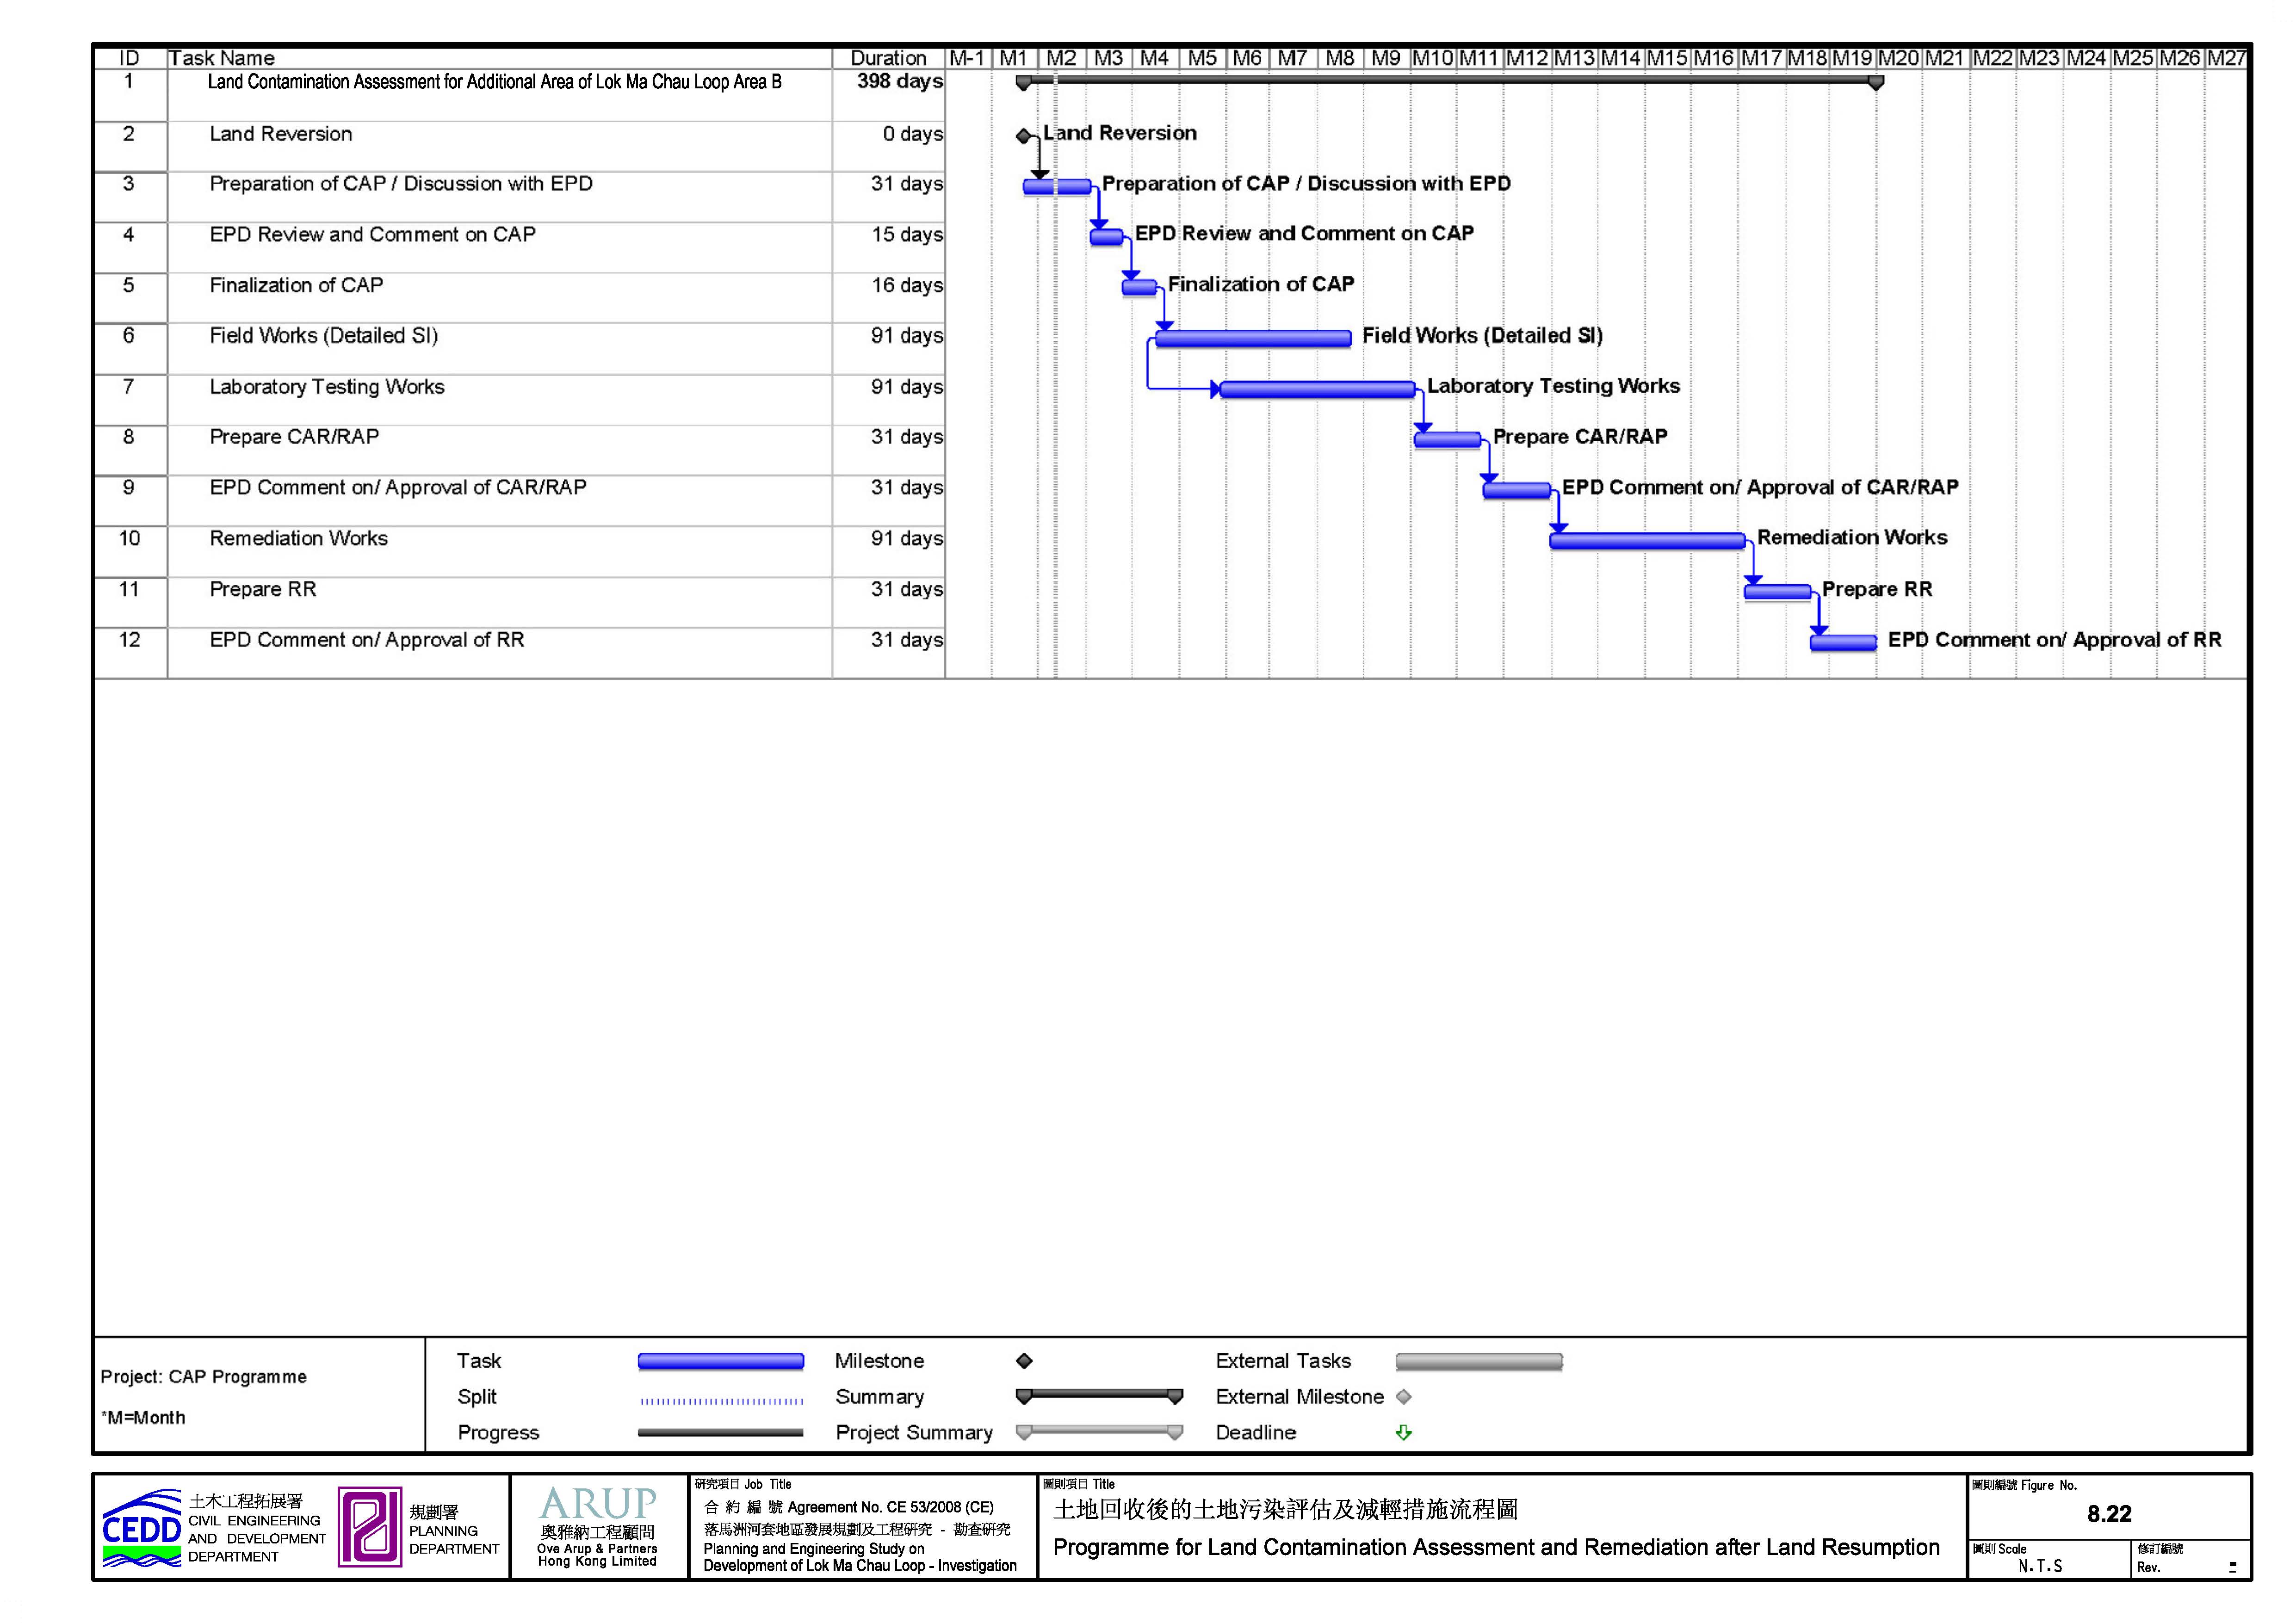
Figure 8.22 Programme for Land Contamination Assessment and Remediation after Land Resumption
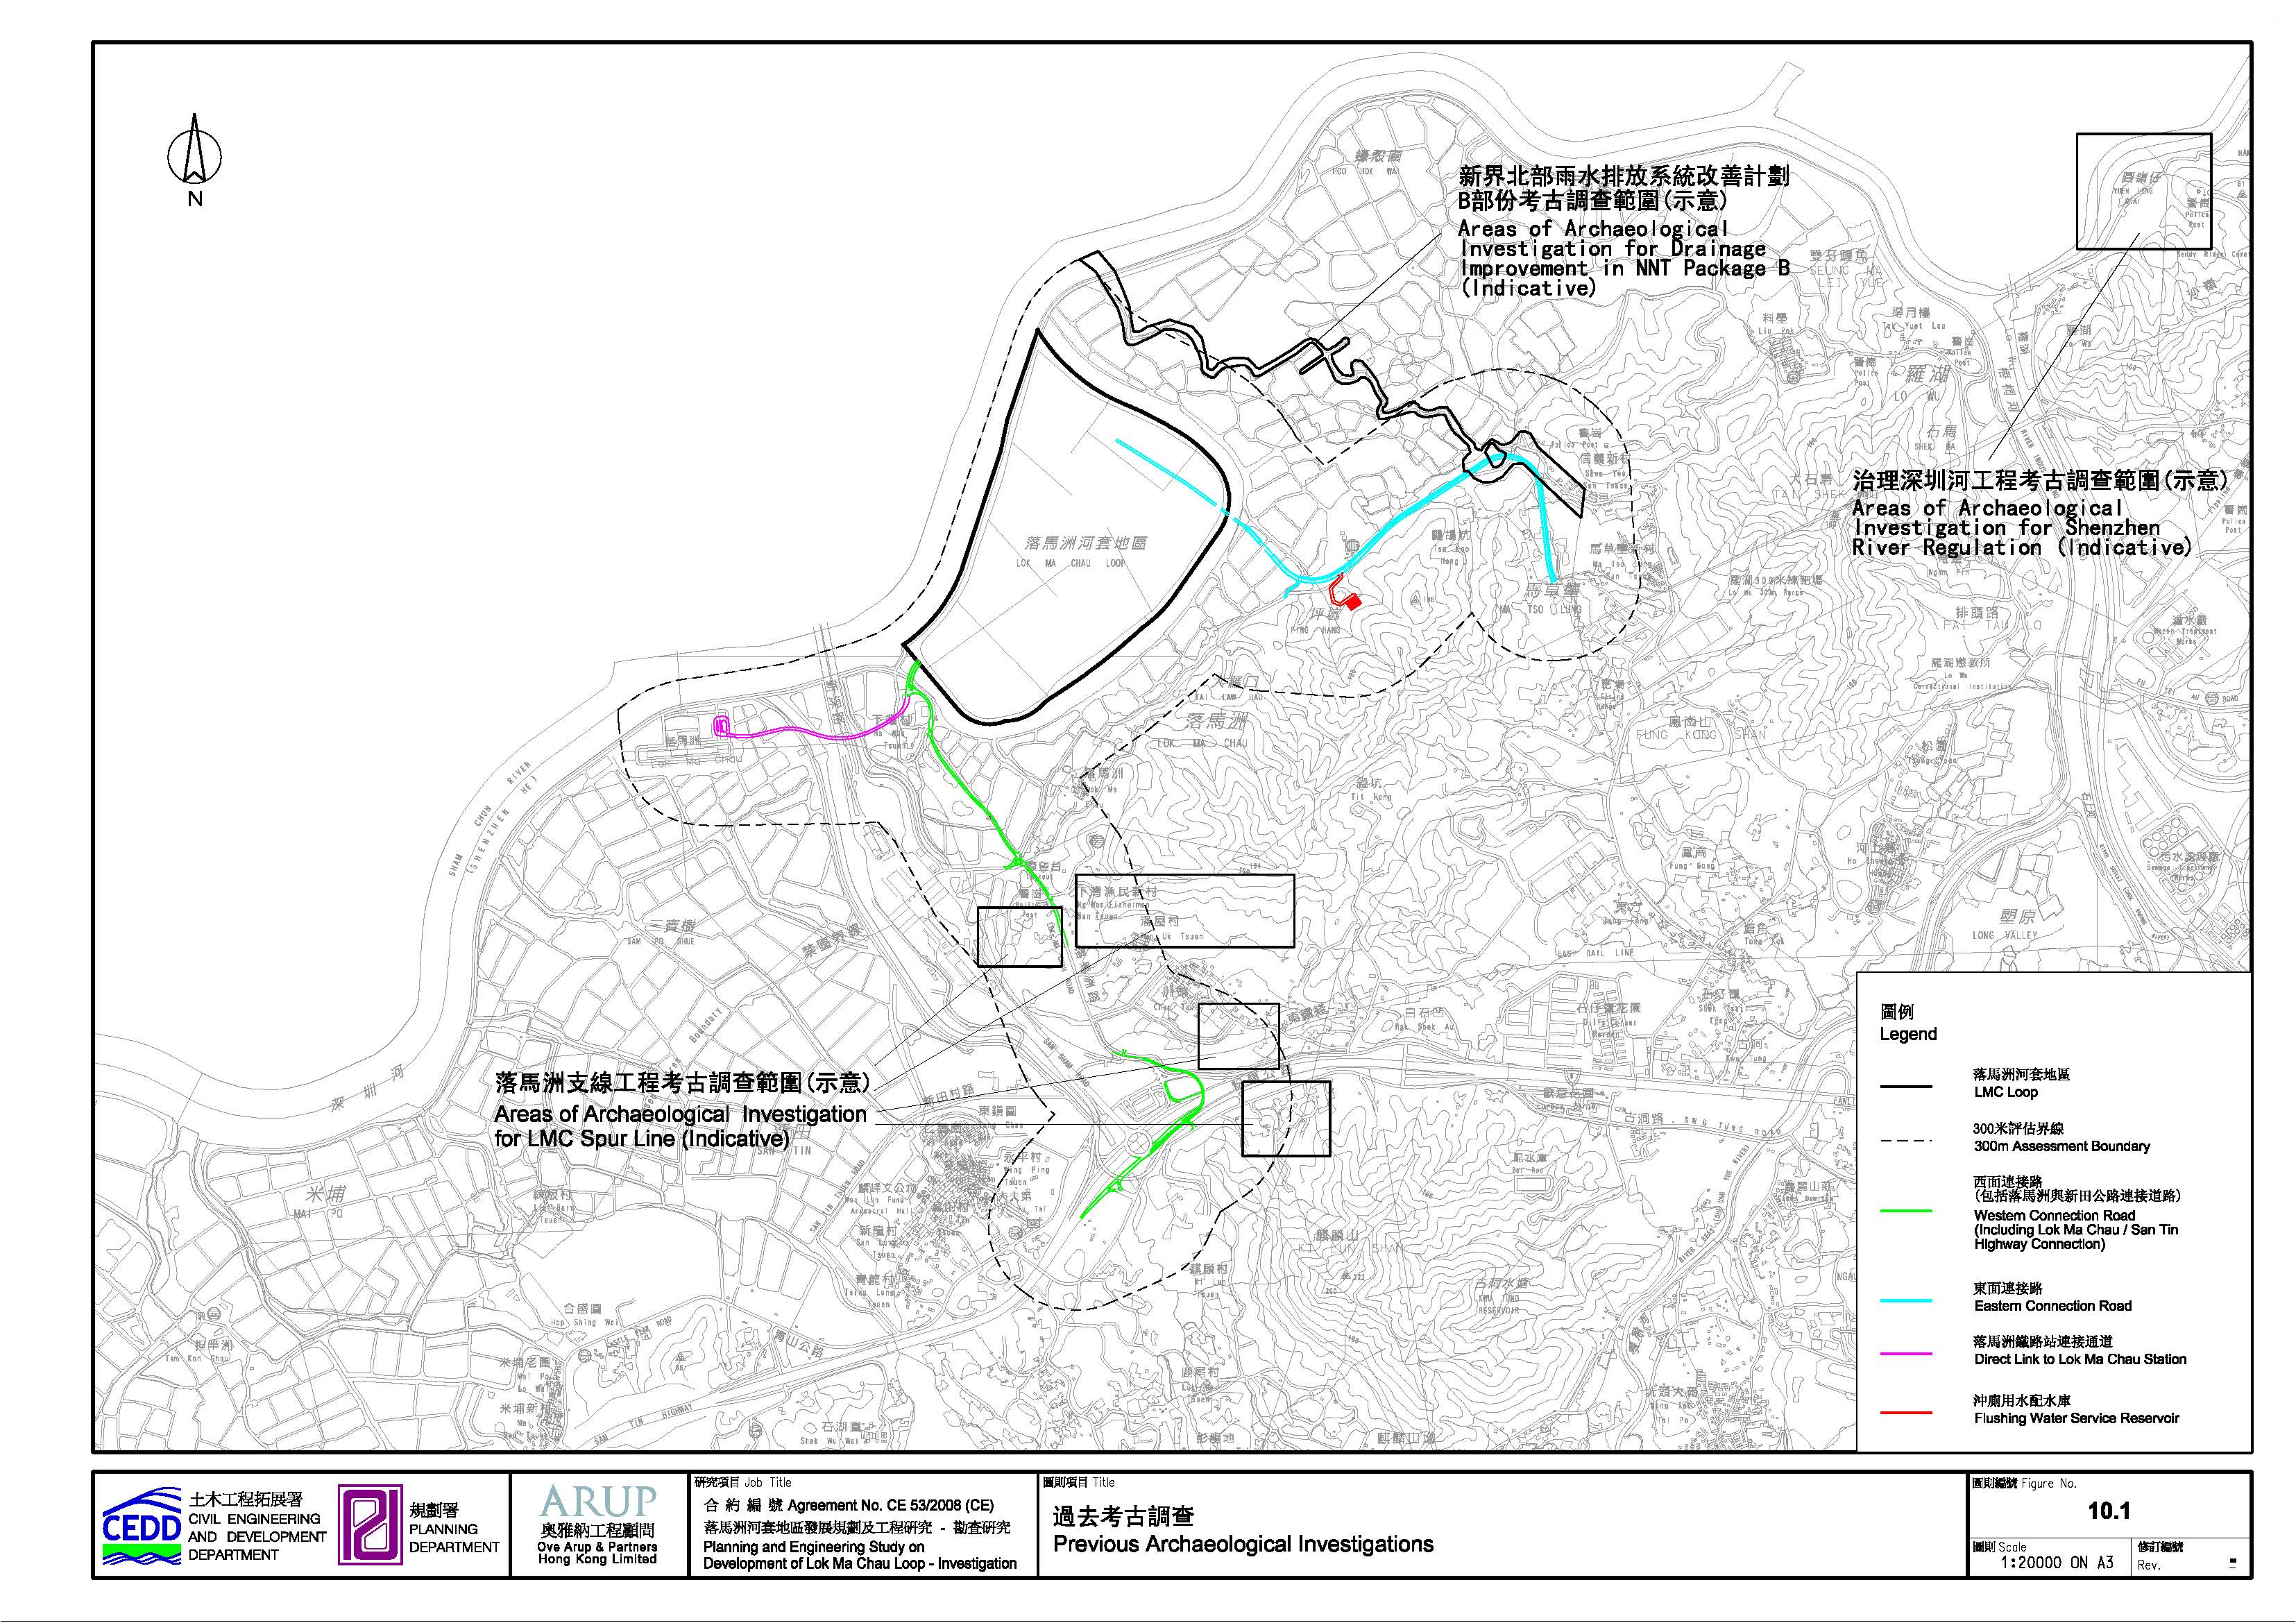
Figure 10.1 Previous Archaeological Investigations
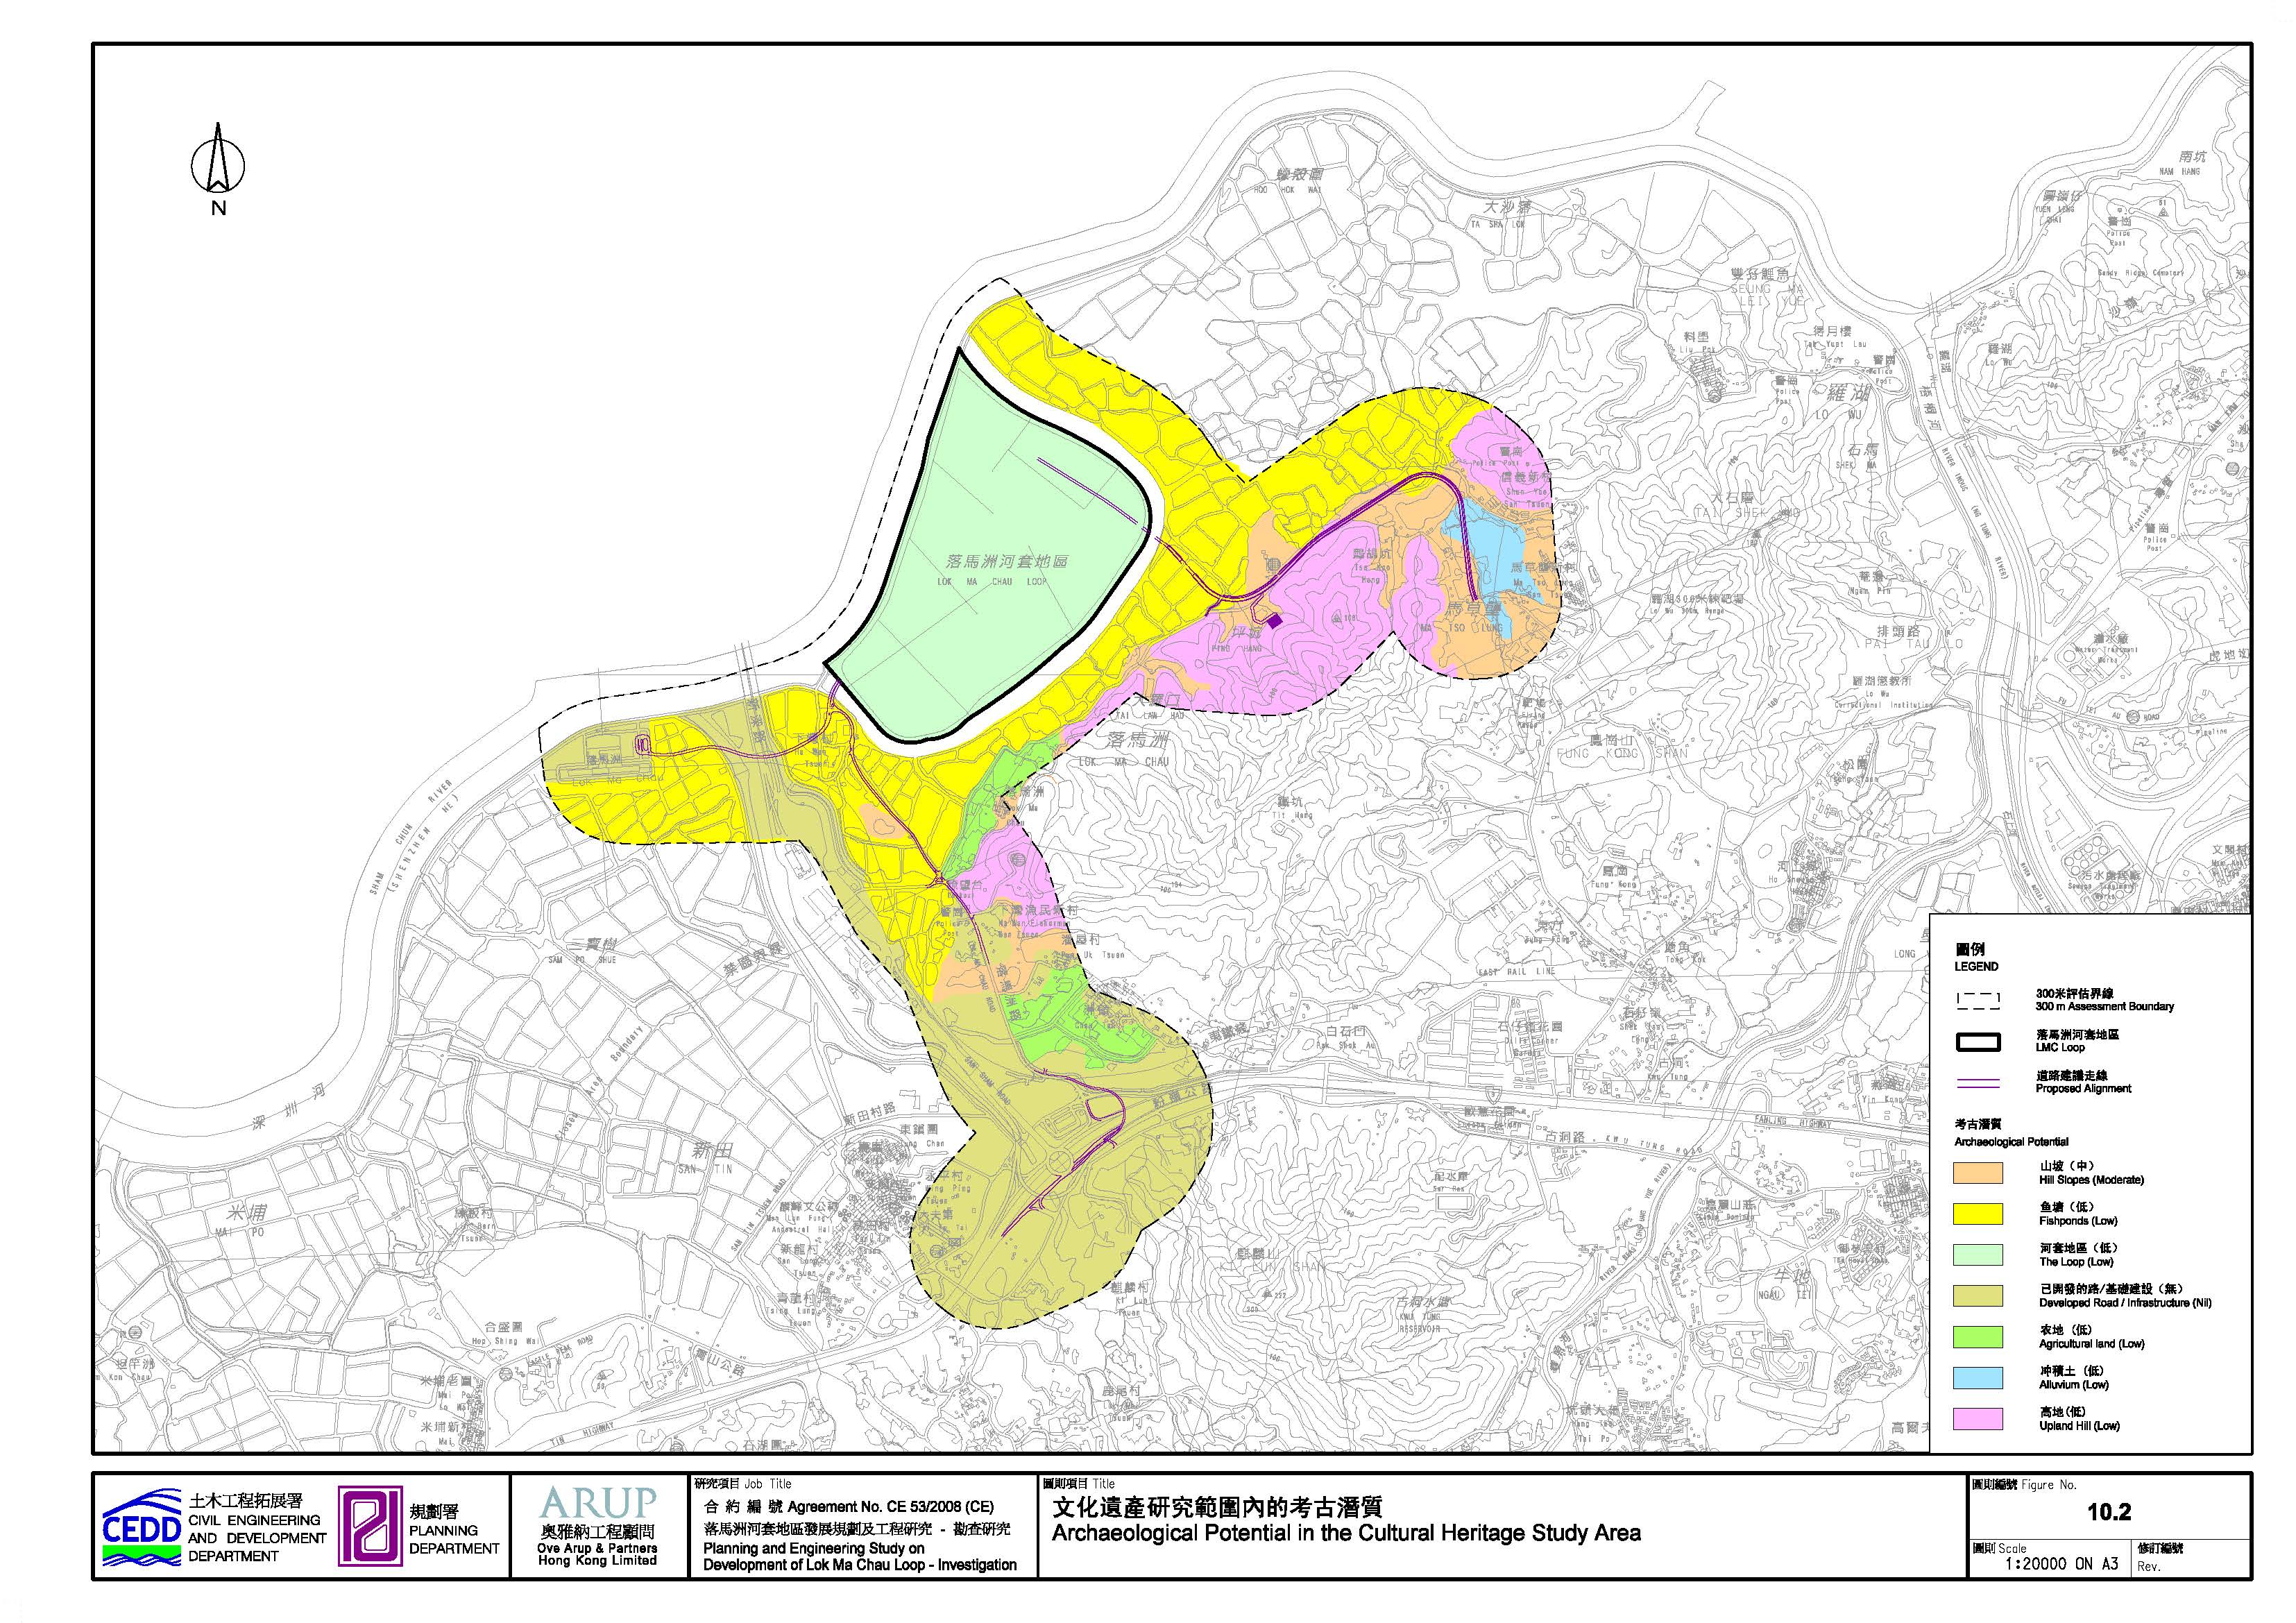
Figure 10.2 Archaeological Potential in the Heritage Study Area
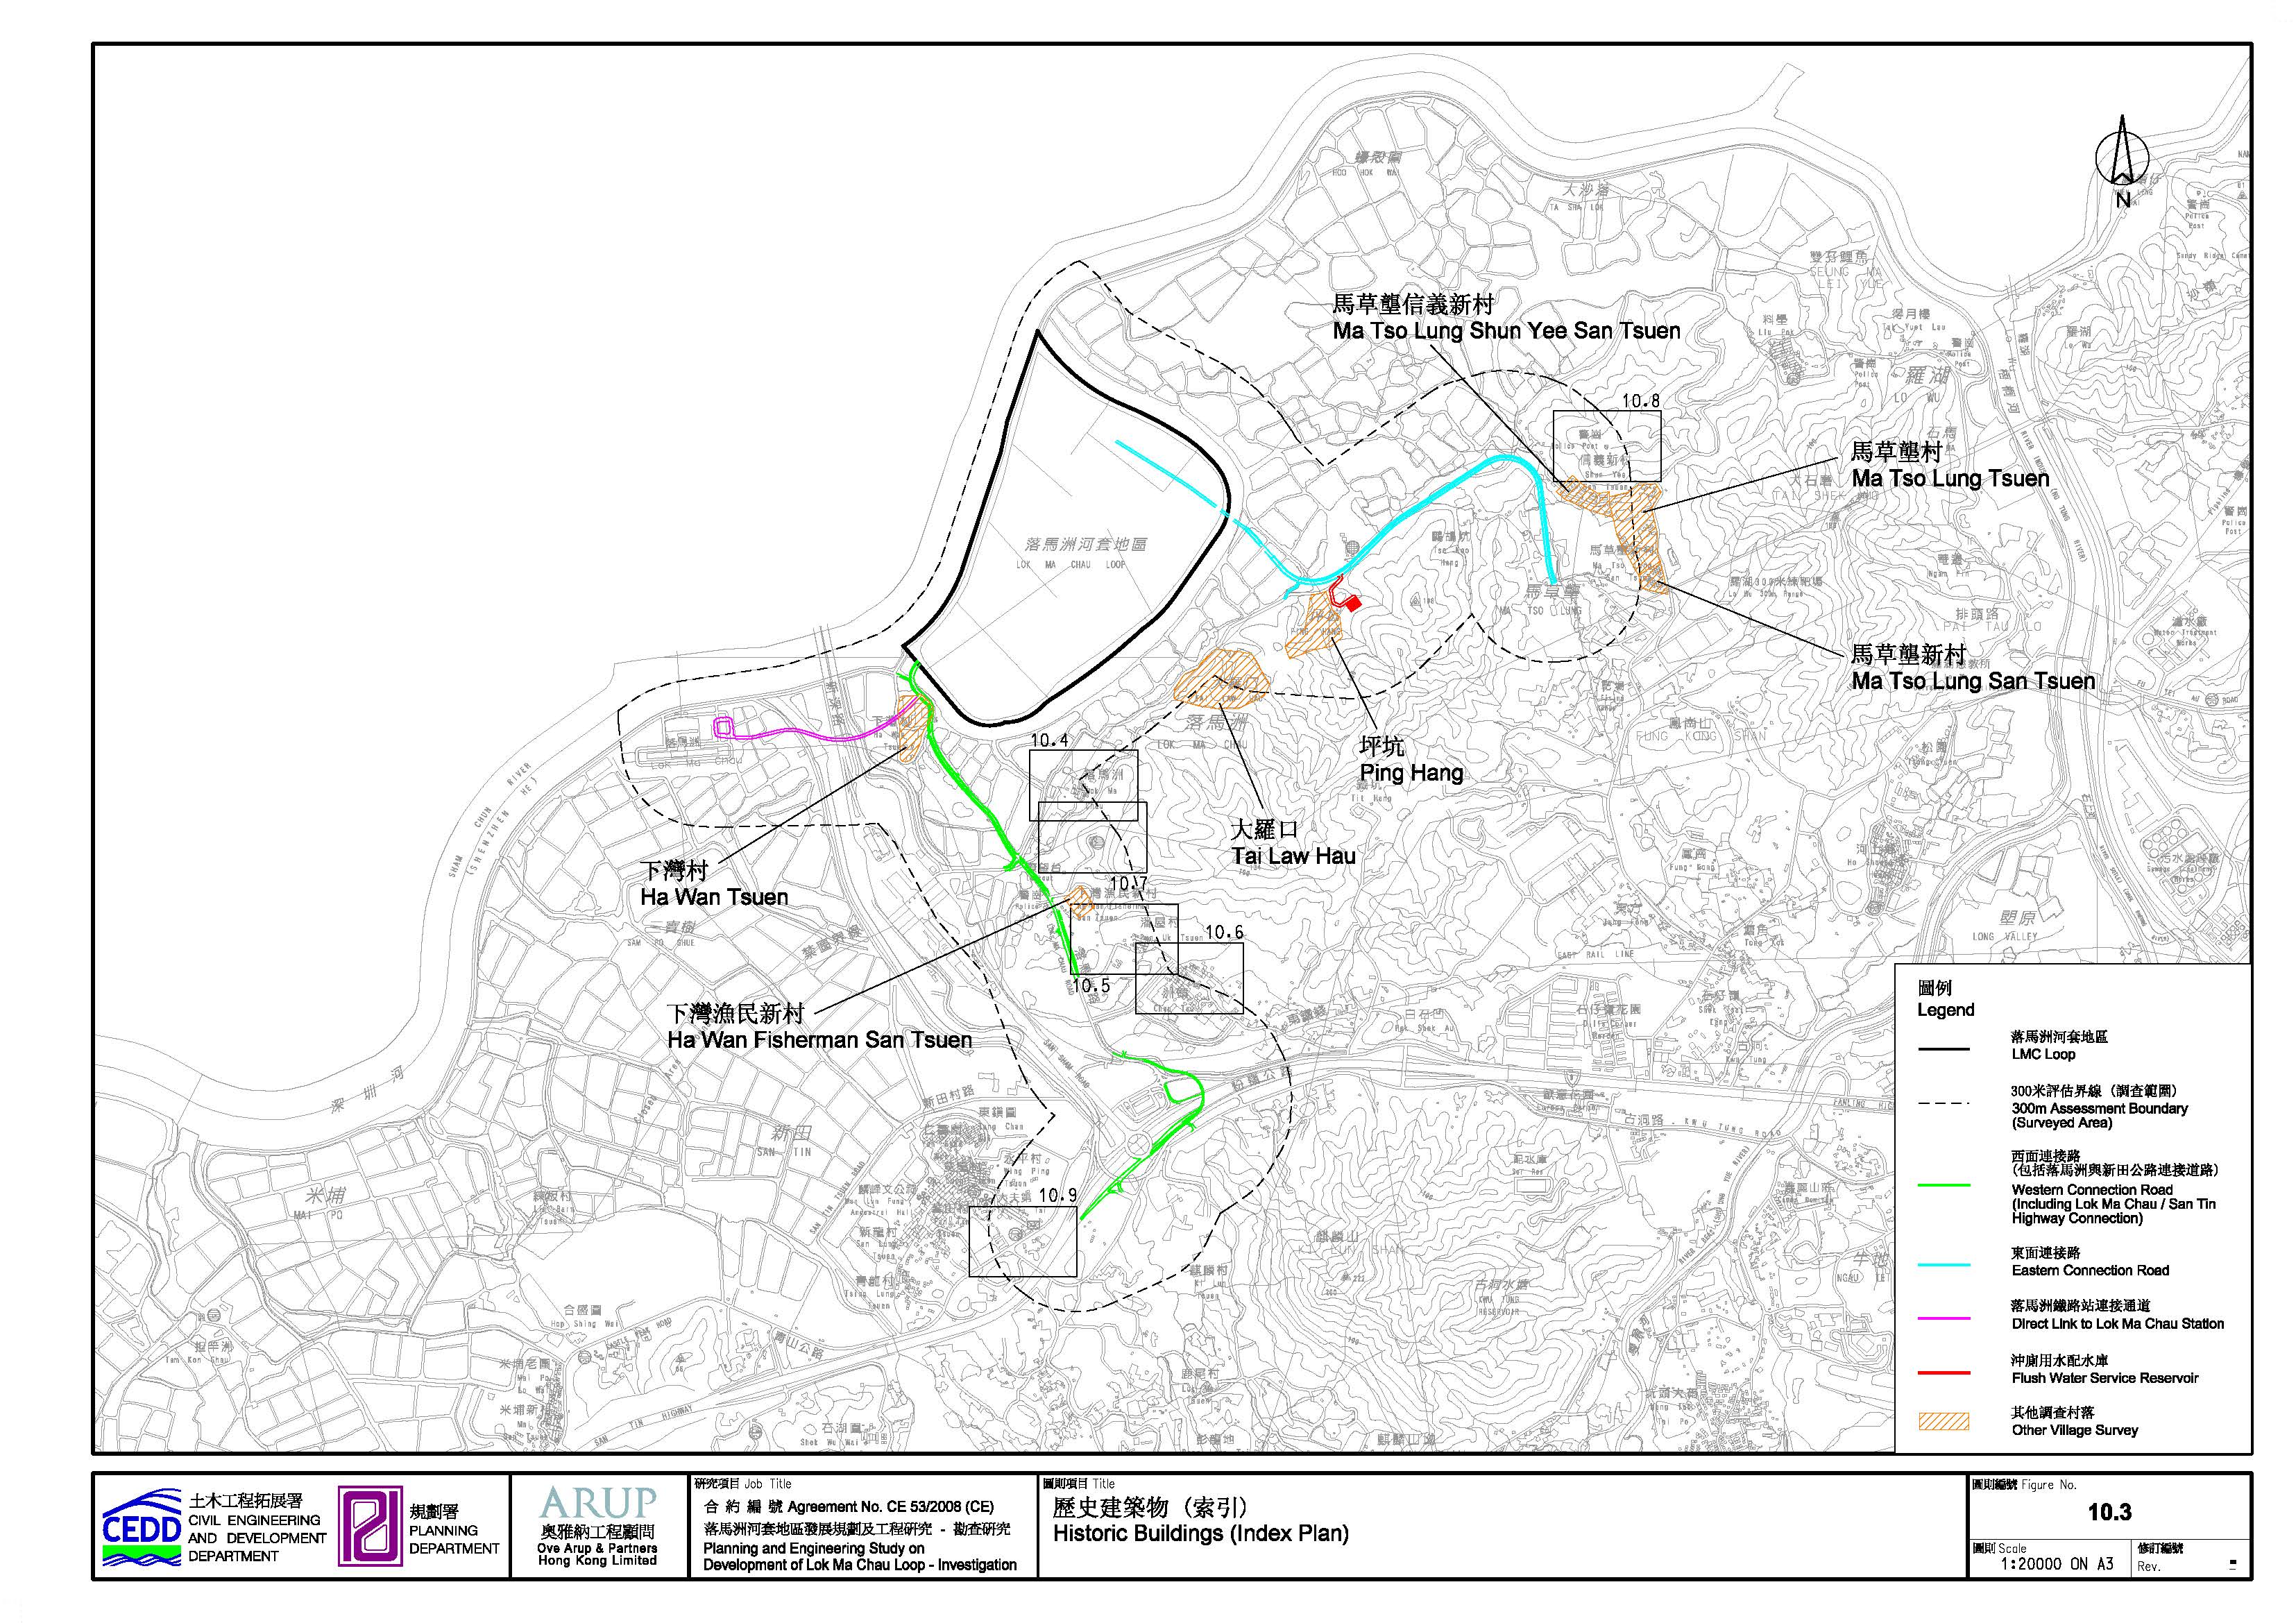
Figure 10.3 Historic Buildings (Index Plan)
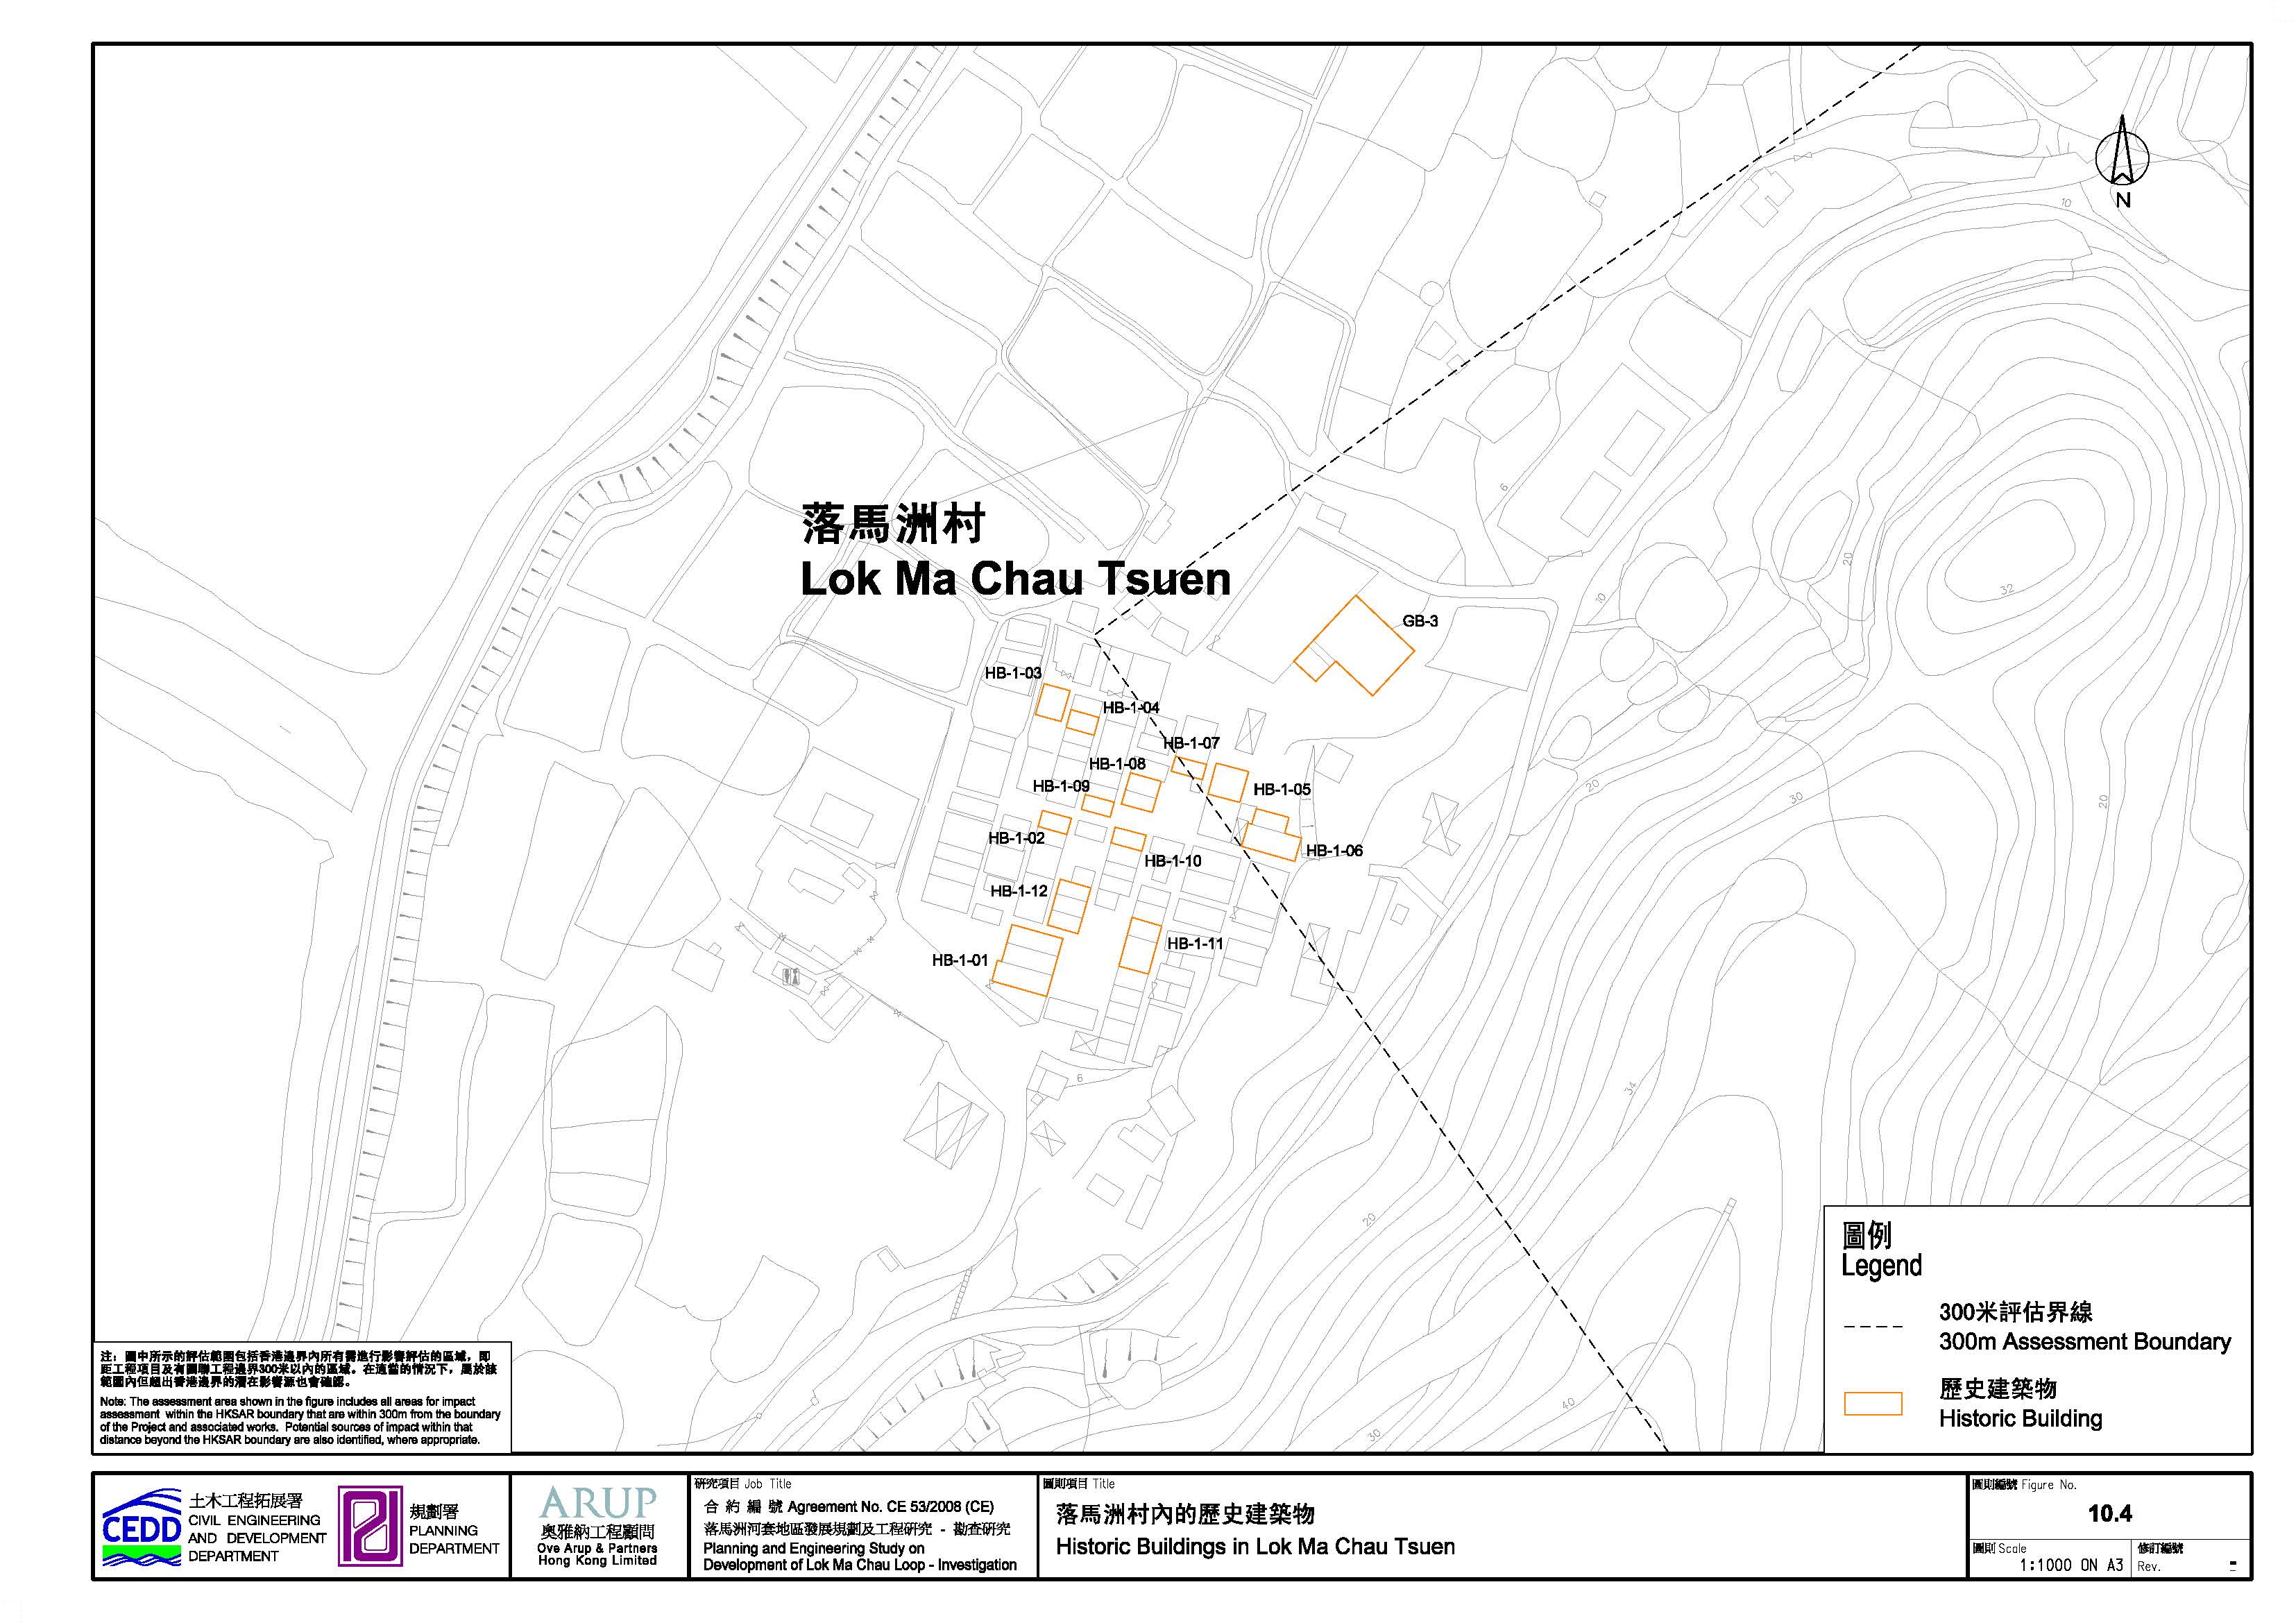
Figure 10.4 Historic Buildings in Lok Ma Chau Tsuen
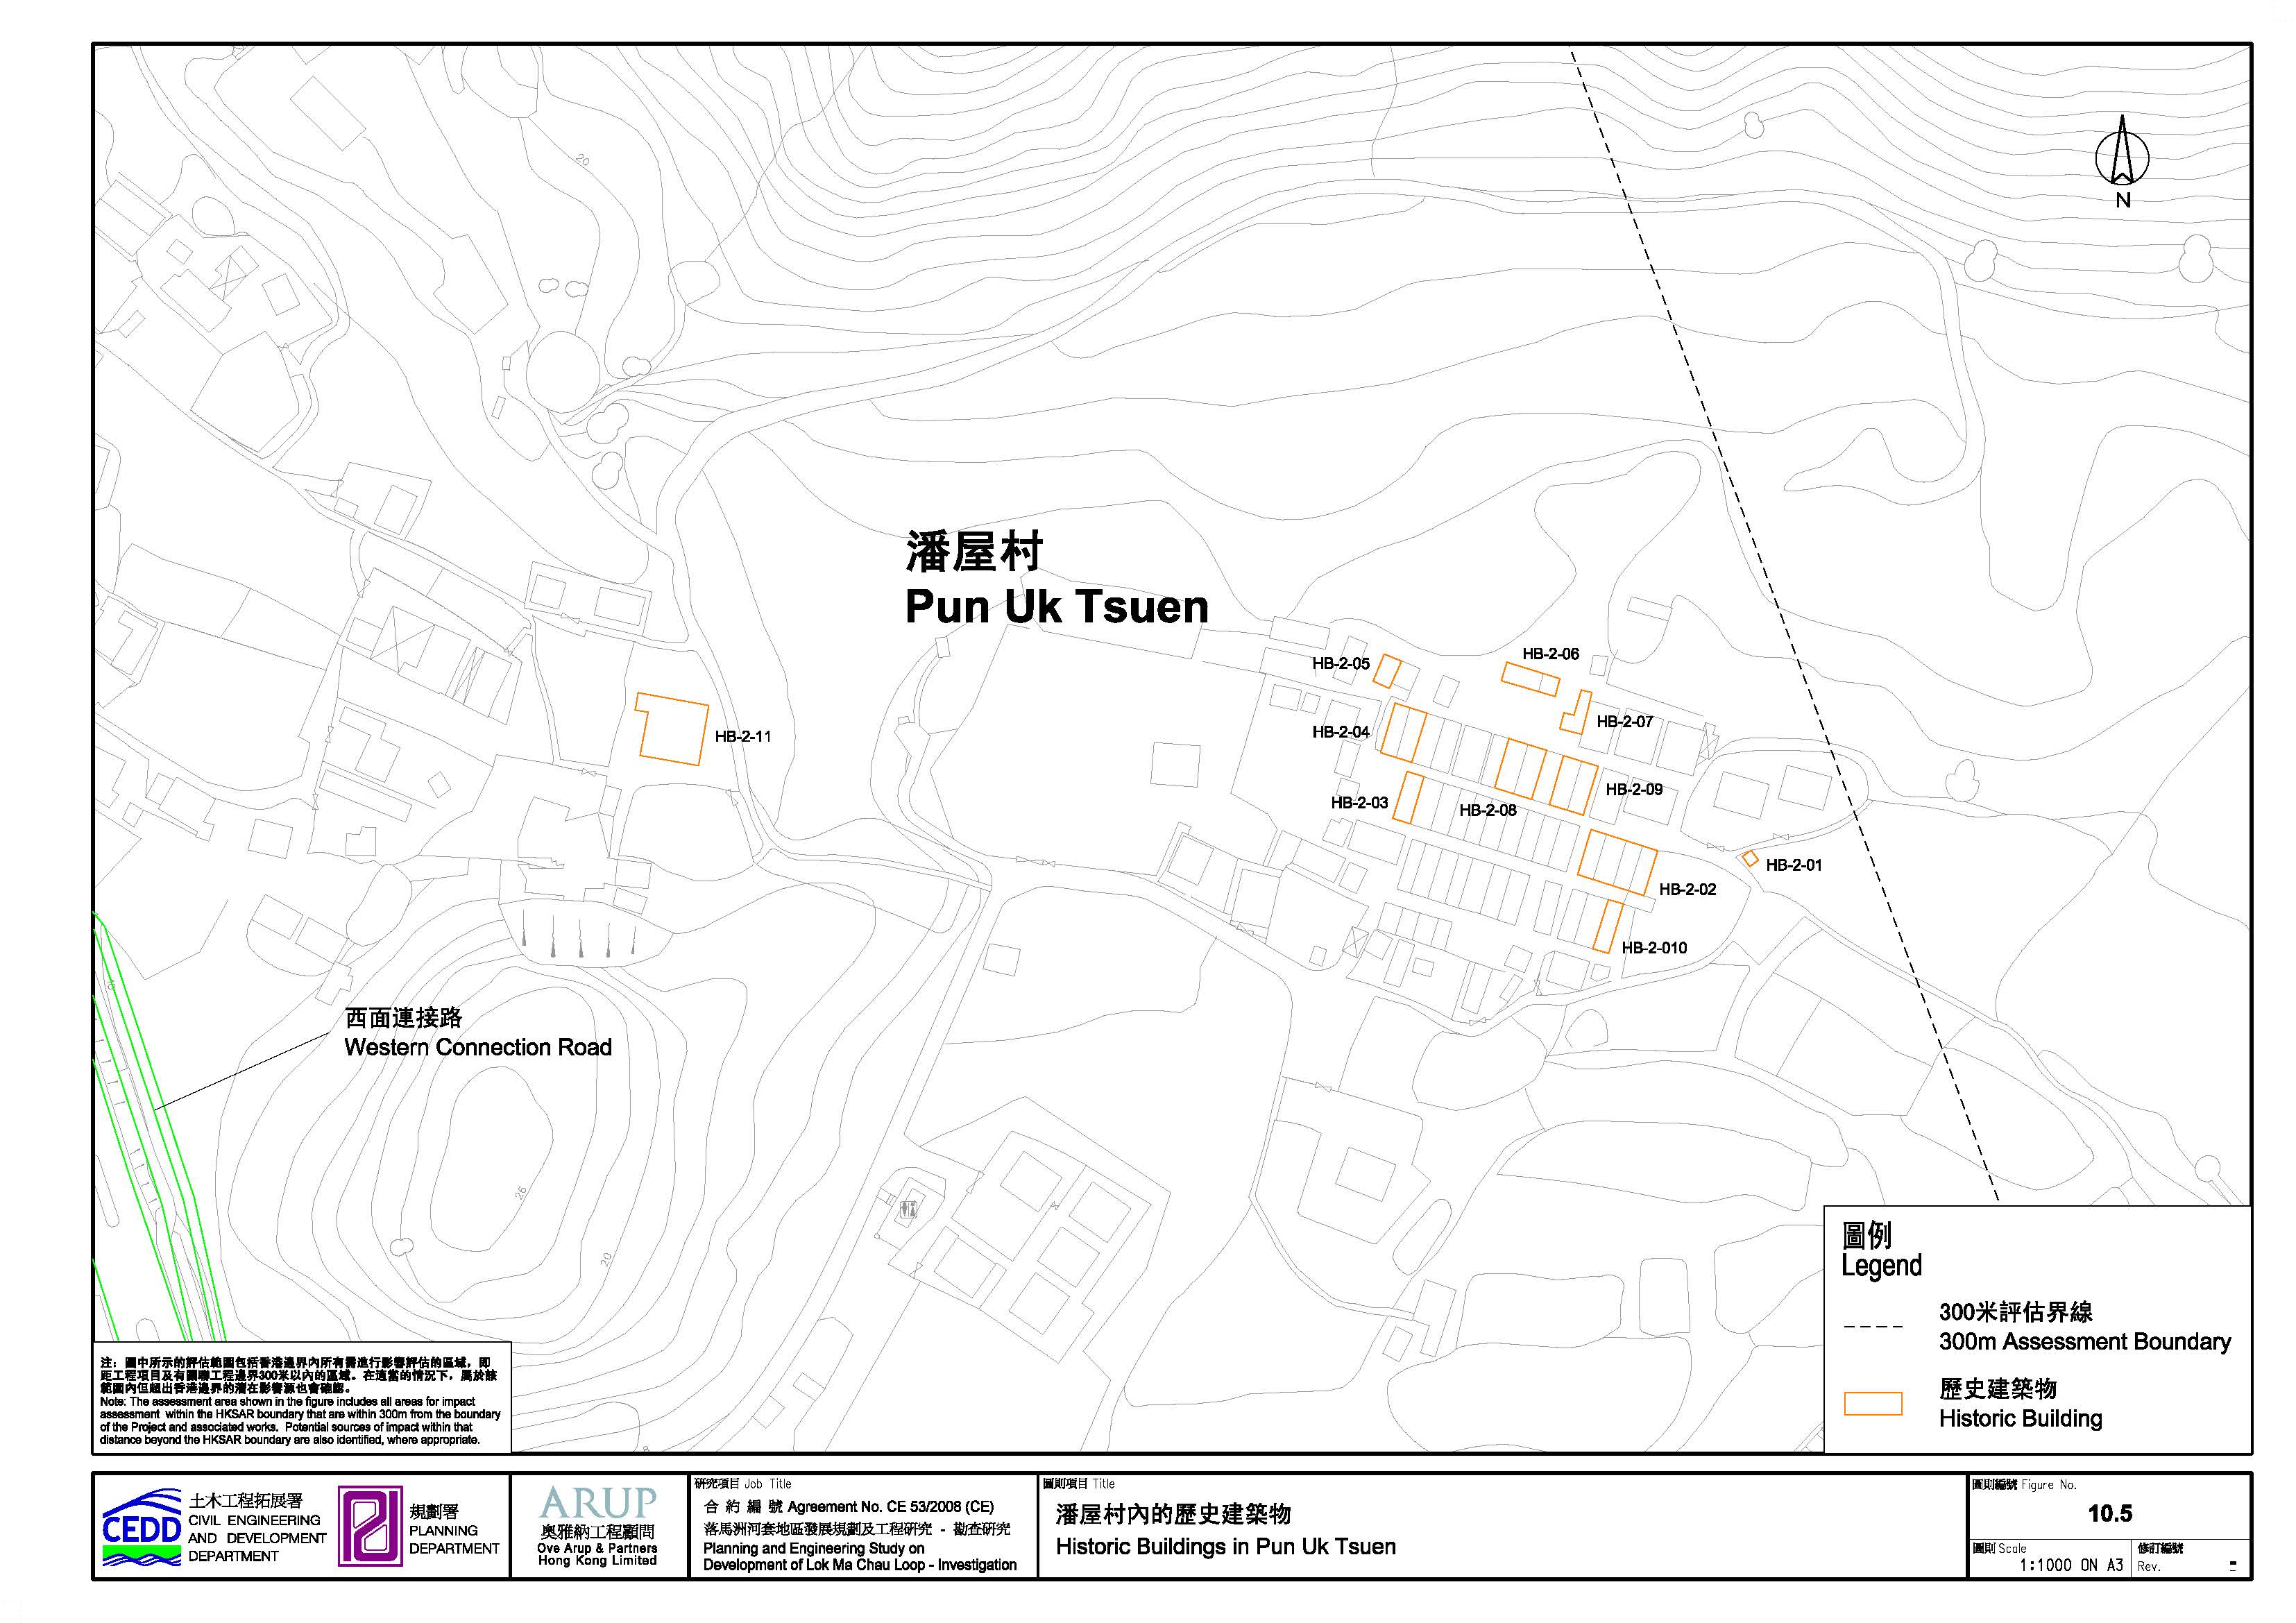
Figure 10.5 Historic Buildings in Pun Uk Tsuen
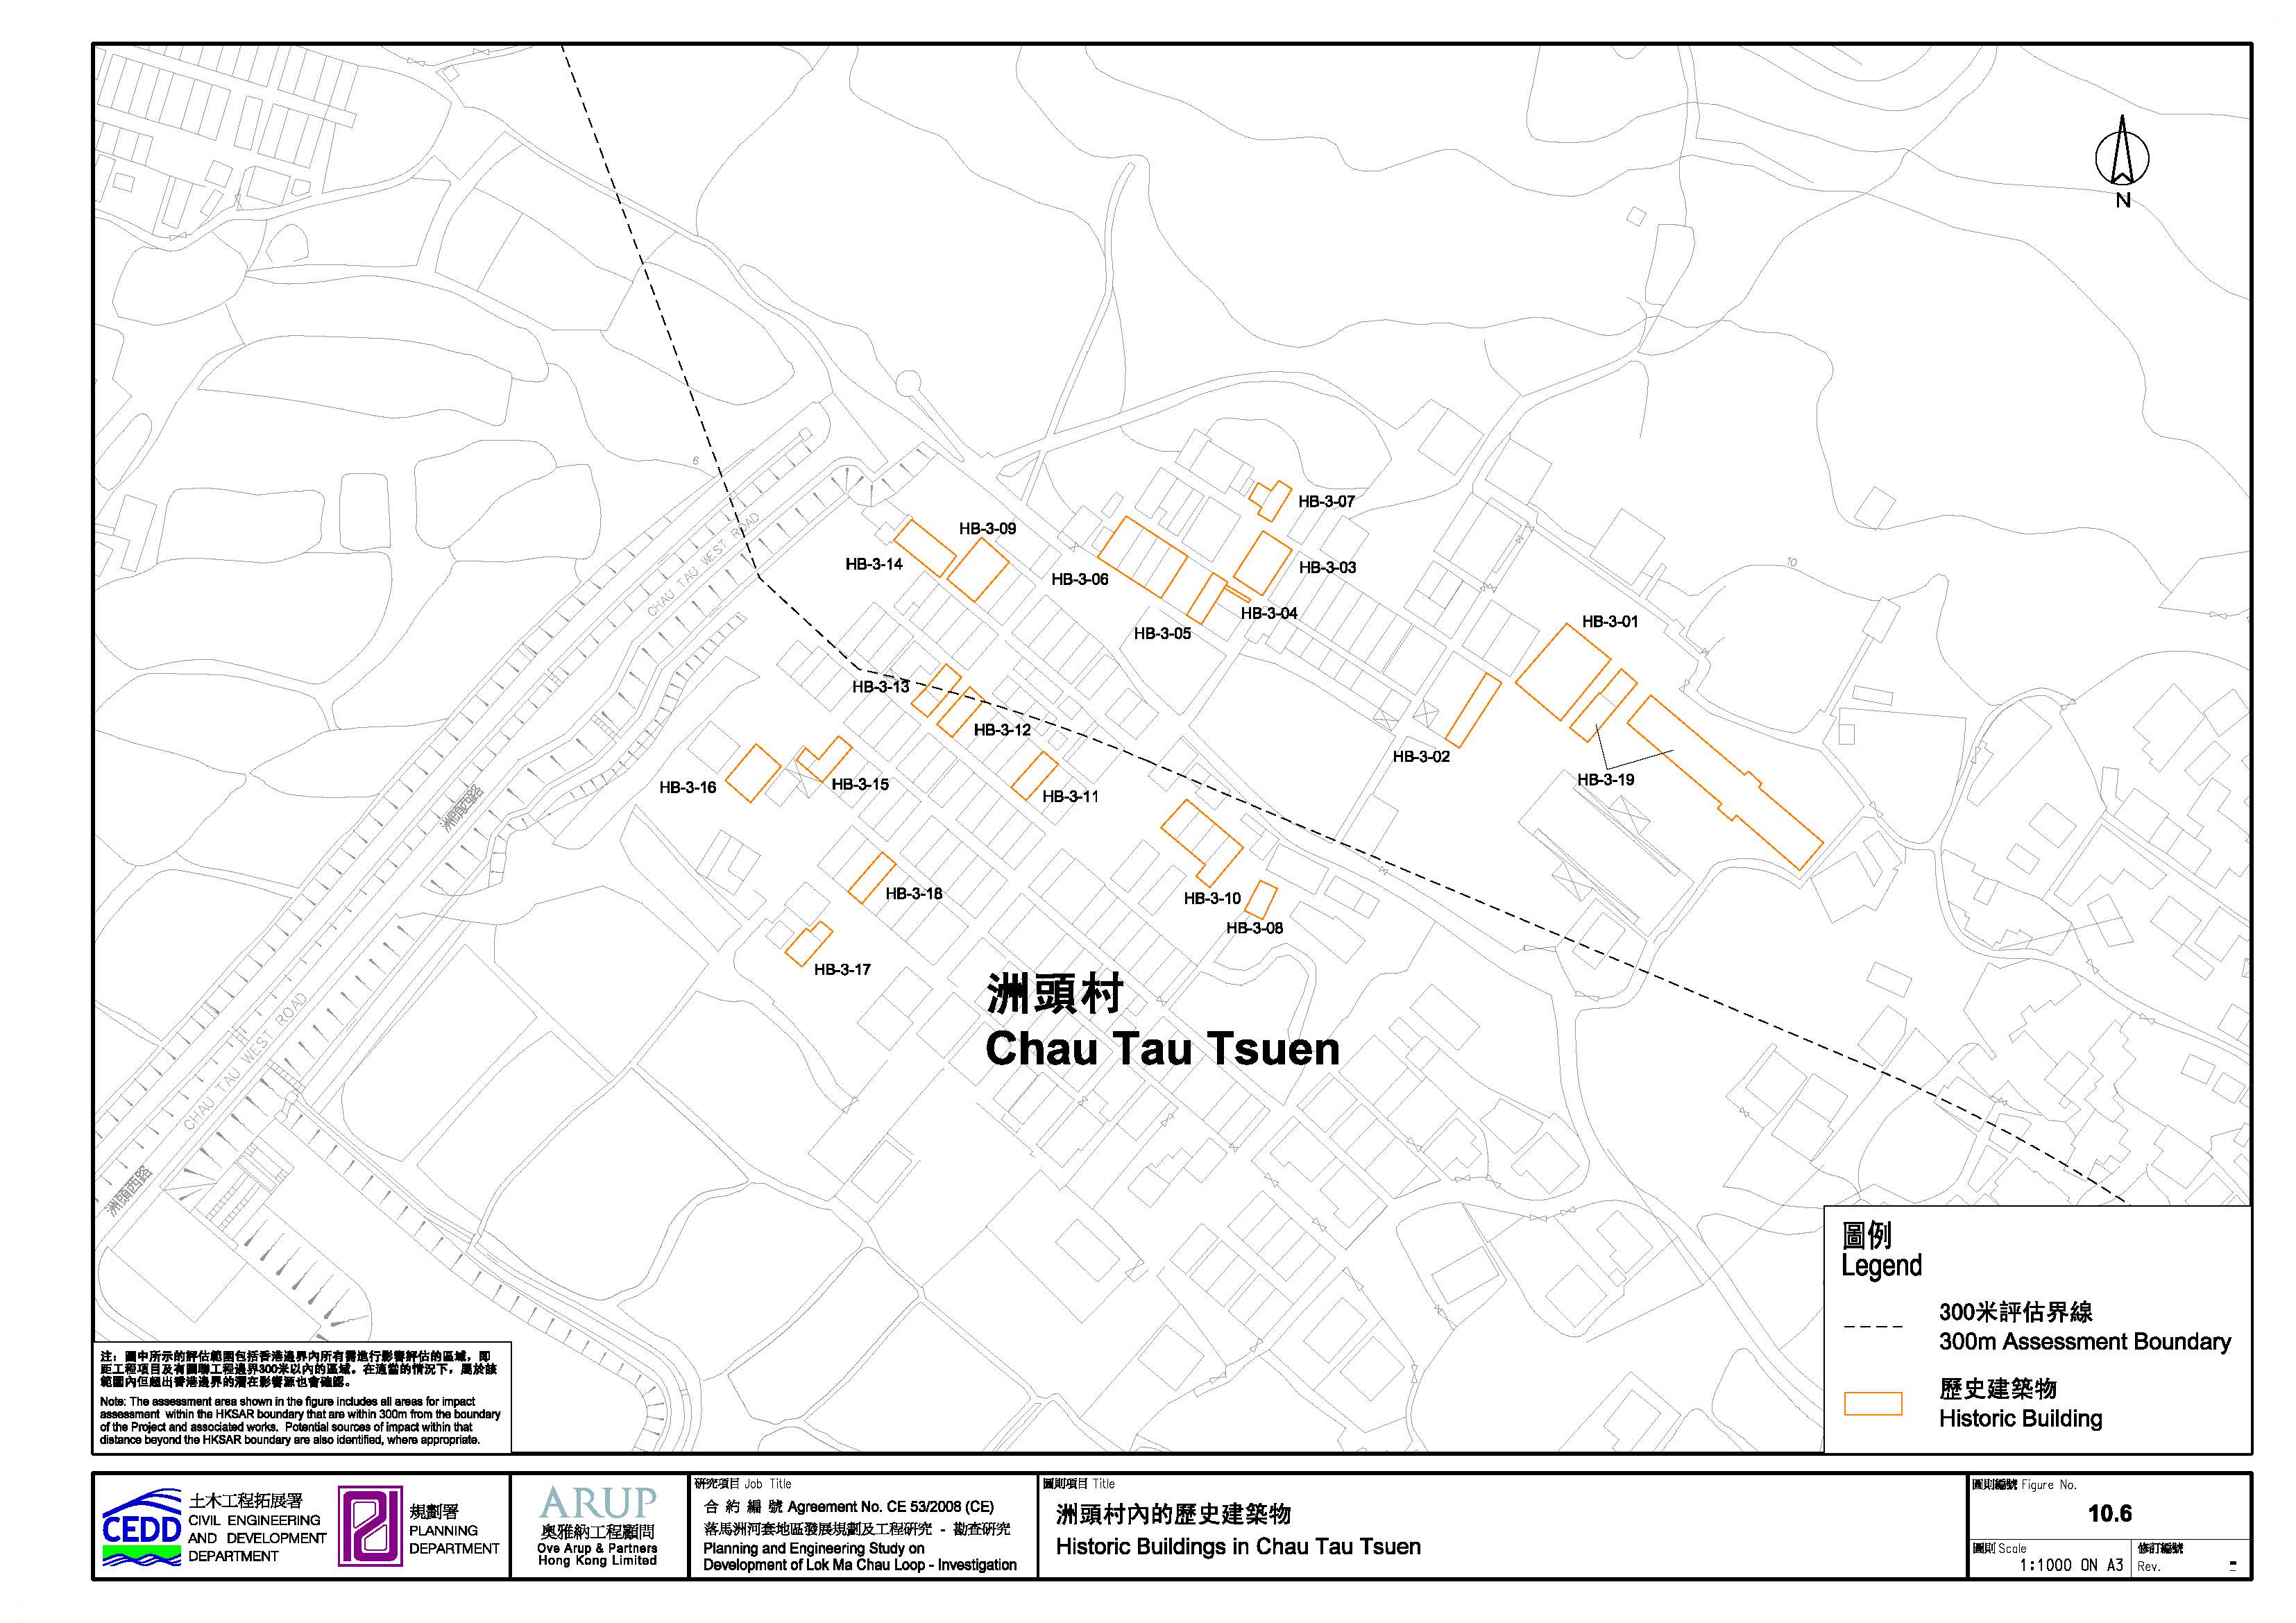
Figure 10.6 Historic Buildings in Chau Tau Tsuen
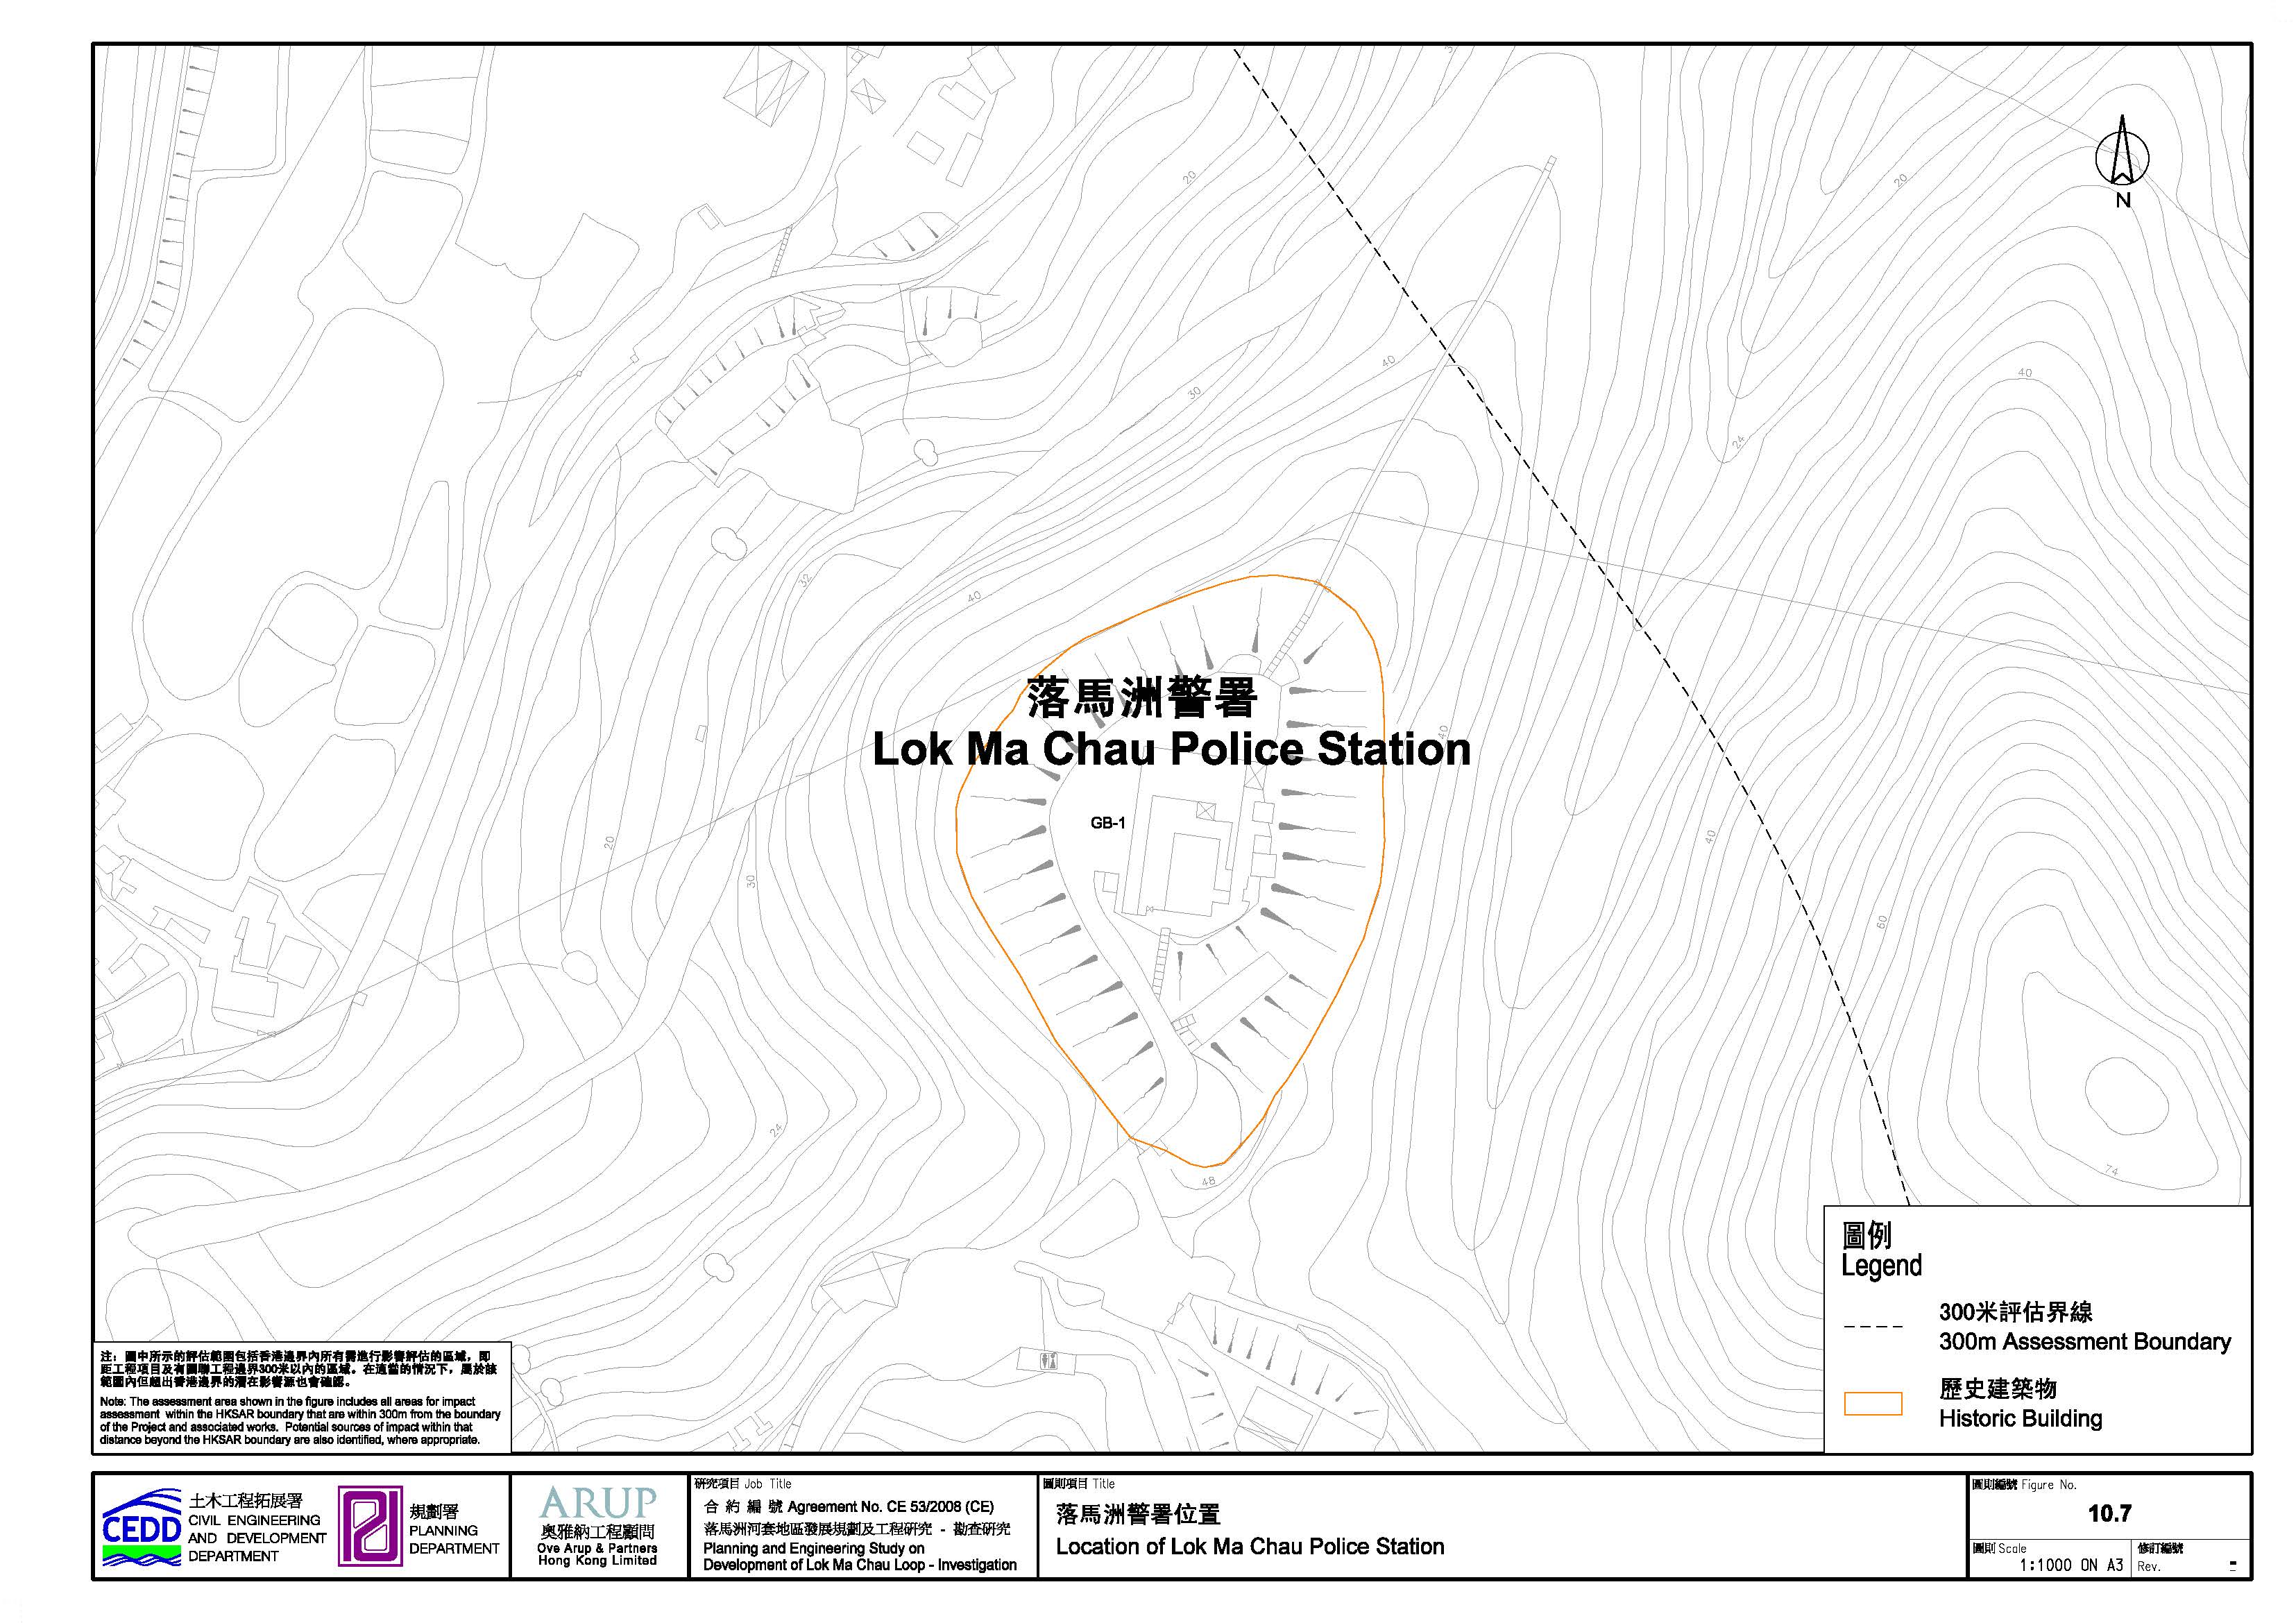
Figure 10.7 Location
of Lok Ma Chau Police Station
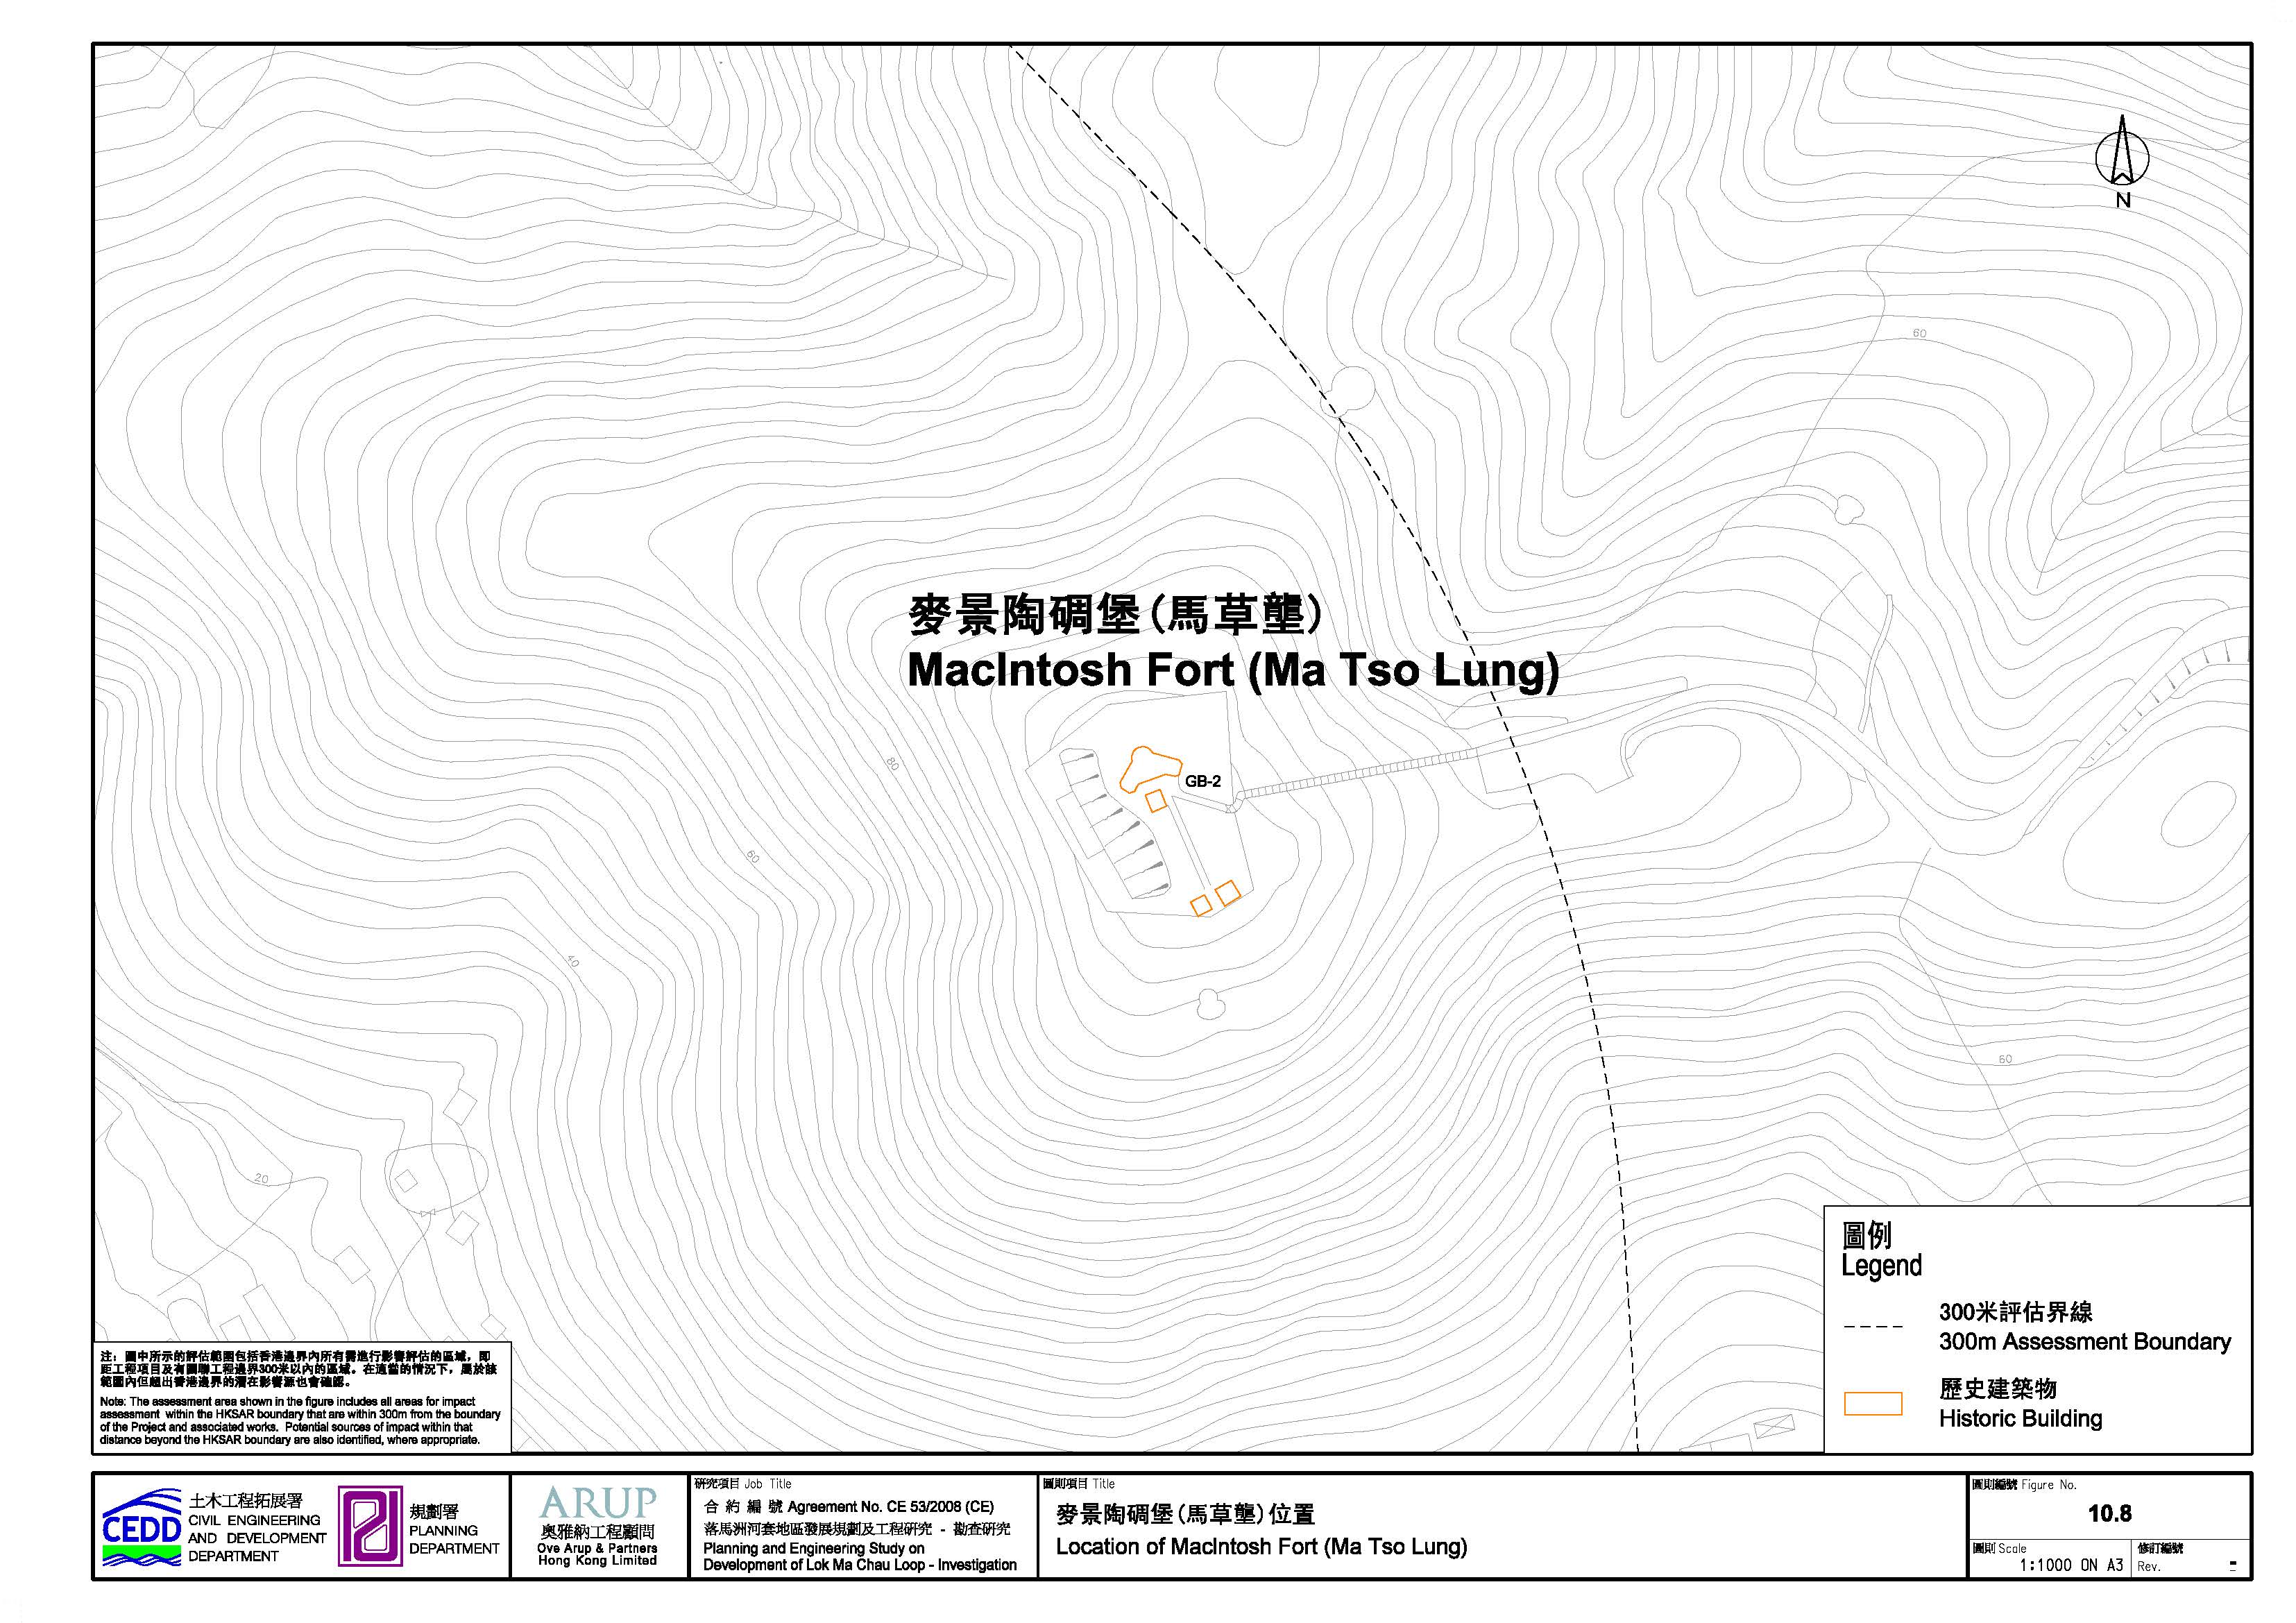
Figure 10.8 Location
of Macintosh Fort(Ma Tso Lung)\
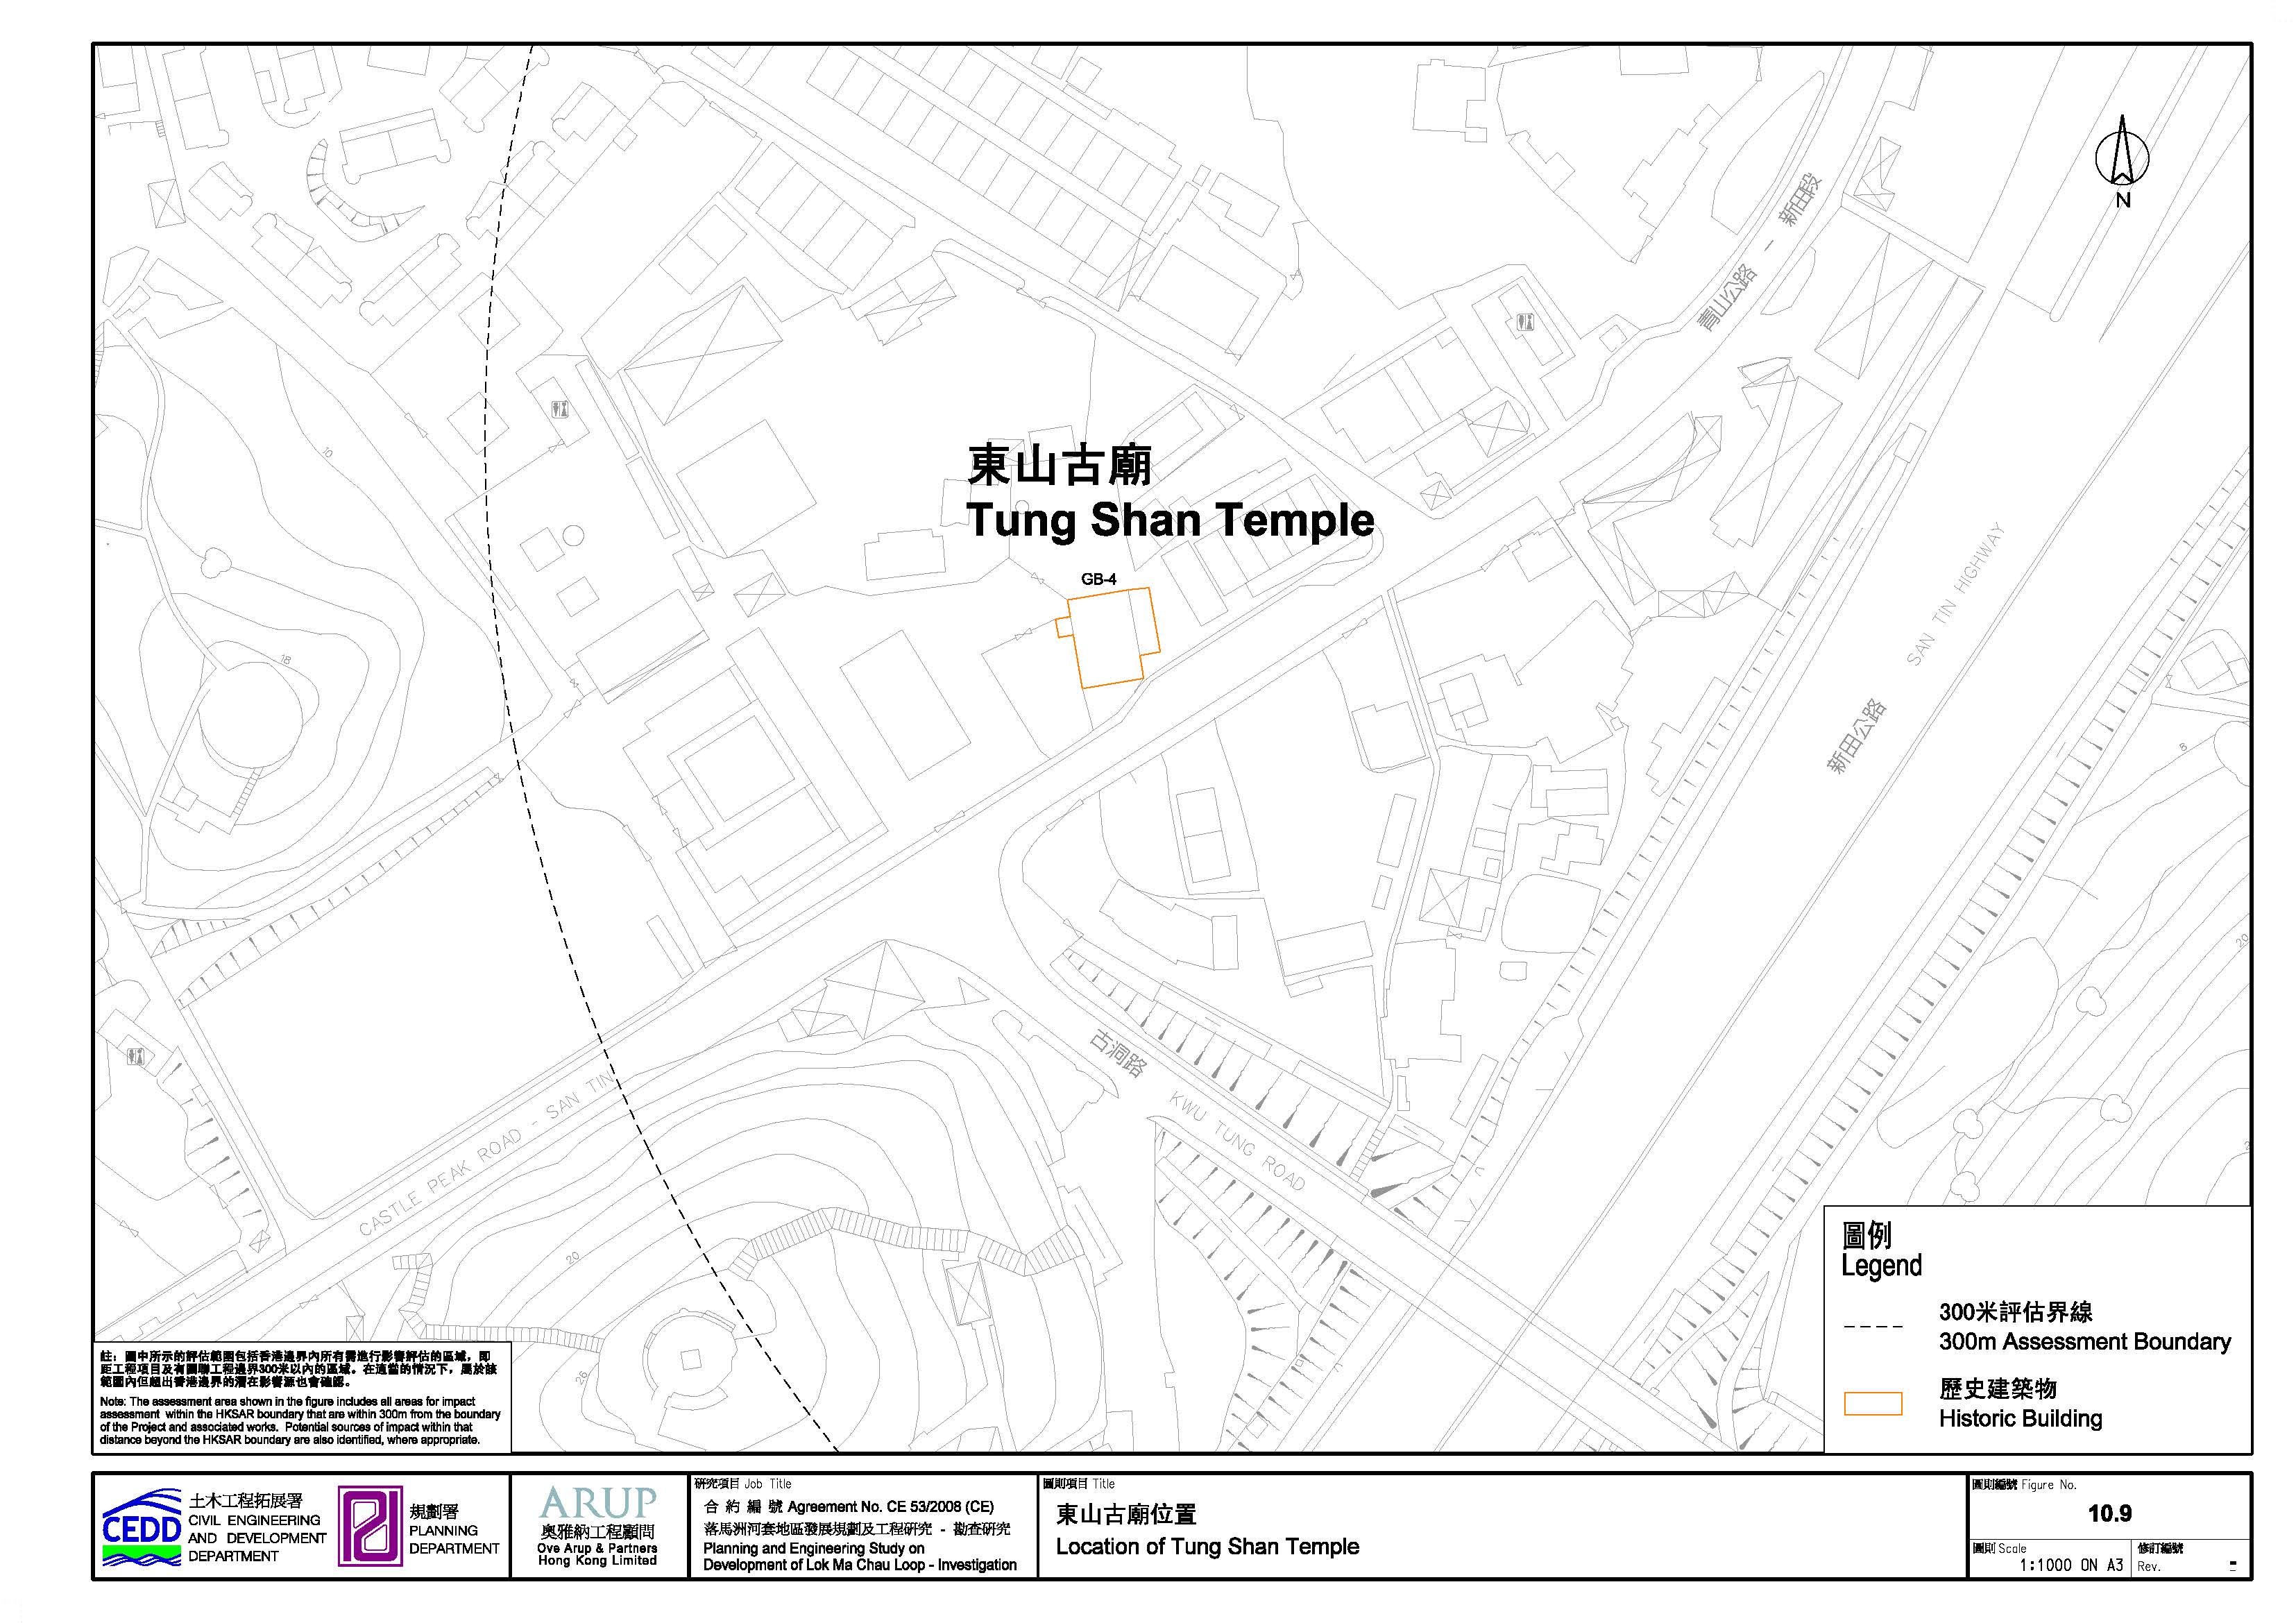
Figure 10.9 Location
of Tung Shan Temple
Figure 11.1a Review of Planning and Development Control Framework 1 of 5
_Page_001.jpg)
Figure 11.1b Review of Planning and Development Control Framework 2 of 5
_Page_002.jpg)
Figure 11.1c Review of Planning and Development Control Framework 3 of 5
_Page_003.jpg)
Figure 11.1d Review of Planning and Development Control Framework 4 of 5
_Page_004.jpg)
Figure 11.1e Review of Planning and Development Control Framework 5 of 5
_Page_005.jpg)
Figure 11.2a Landscape Resources 1 of 5
_Page_006.jpg)
Figure 11.2b Landscape Resources 2 of 5
_Page_007.jpg)
Figure 11.2c Landscape Resources 3 of 5
_Page_008.jpg)
Figure 11.2d Landscape Resources 4 of 5
_Page_009.jpg)
Figure 11.2e Landscape Resources 5 of 5
_Page_010.jpg)
Figure 11.2f Landscape Resources Photographs 1 of 18
_Page_011.jpg)
Figure 11.2g Landscape Resources Photographs 2 of 18
_Page_012.jpg)
Figure 11.2h Landscape Resources Photographs 3 of 18
_Page_013.jpg)
Figure 11.2i Landscape Resources Photographs 4 of 18
_Page_014.jpg)
Figure 11.2j Landscape Resources Photographs 5 of 18
_Page_015.jpg)
Figure 11.2k Landscape Resources Photographs 6 of 18
_Page_016.jpg)
Figure 11.2l Landscape Resources Photographs 7 of 18
_Page_017.jpg)
Figure 11.2m Landscape Resources Photographs 8 of 18
_Page_018.jpg)
Figure 11.2n Landscape Resources Photographs 9 of 18
_Page_019.jpg)
Figure 11.2o Landscape Resources Photographs 10 of 18
_Page_020.jpg)
Figure 11.2p Landscape Resources Photographs 11 of 18
_Page_021.jpg)
Figure 11.2q Landscape Resources Photographs 12 of 18
_Page_022.jpg)
Figure 11.2r Landscape Resources Photographs 13 of 18
_Page_023.jpg)
Figure 11.2s Landscape Resources Photographs 14 of 18
_Page_024.jpg)
Figure 11.2t Landscape Resources Photographs 15 of 18
_Page_025.jpg)
Figure 11.2u Landscape Resources Photographs 16 of 18
_Page_026.jpg)
Figure 11.2v Landscape Resources Photographs 17 of 18
_Page_027.jpg)
Figure 11.2w Landscape Resources Photographs 18 of 18
_Page_028.jpg)
Figure 11.3a Landscape Character Areas 1 of 5
_Page_029.jpg)
Figure 11.3b Landscape Character Areas 2 of 5
_Page_030.jpg)
Figure 11.3c Landscape Character Areas 3 of 5
_Page_031.jpg)
Figure 11.3d Landscape Character Areas 4 of 5
_Page_032.jpg)
Figure 11.3e Landscape Character Areas 5 of 5
_Page_033.jpg)
Figure 11.3f Landscape Character Areas Photographs 1 of 1
_Page_034.jpg)
Figure 11.4a Impacts on Landscape Resources 1 of 19
_Page_035.jpg)
Figure 11.4b Impacts on Landscape Resources 2 of 19
_Page_036.jpg)
Figure 11.4c Impacts on Landscape Resources 3 of 19
_Page_037.jpg)
Figure 11.4d Impacts on Landscape Resources 4 of 19
_Page_038.jpg)
Figure 11.4e Impacts on Landscape Resources 5 of 19
_Page_039.jpg)
Figure 11.4f Impacts on Landscape Resources 6 of 19
_Page_040.jpg)
Figure 11.4g Impacts on Landscape Resources 7 of 19
_Page_041.jpg)
Figure 11.4h Impacts on Landscape Resources 8 of 19
_Page_042.jpg)
Figure 11.4i Impacts on Landscape Resources 9 of 19
_Page_043.jpg)
Figure 11.4j Impacts on Landscape Resources 10 of 19
_Page_044.jpg)
Figure 11.4k Impacts on Landscape Resources 11 of 19
_Page_045.jpg)
Figure 11.4l Impacts on Landscape Resources 12 of 19
_Page_046.jpg)
Figure 11.4m Impacts on Landscape Resources 13 of 19
_Page_047.jpg)
Figure 11.4n Impacts on Landscape Resources 14 of 19
_Page_048.jpg)
Figure 11.4o Impacts on Landscape Resources 15 of 19
_Page_049.jpg)
Figure 11.4p Impacts on Landscape Resources 16 of 19
_Page_050.jpg)
Figure 11.4q Impacts on Landscape Resources 17 of
19
_Page_051.jpg)
Figure 11.4r Impacts on Landscape Resources 18 of
19
_Page_052.jpg)
Figure 11.4s Impacts on Landscape Resources 19 of
19
_Page_053.jpg)
Figure 11.5a Impacts on Landscape Character Area 1 of 5
_Page_054.jpg)
Figure 11.5b Impacts on Landscape Character Area 2 of 5
_Page_055.jpg)
Figure 11.5c Impacts on Landscape Character Area 3 of 5
_Page_056.jpg)
Figure 11.5d Impacts on Landscape Character Area 4 of 5
_Page_057.jpg)
Figure 11.5e Impacts on Landscape Character Area 5 of 5
_Page_058.jpg)
Figure 11.6a Zone of Visual Influence and Visually Sensitive Receivers 1 of 7
_Page_059.jpg)
Figure 11.6b Zone of Visual Influence and Visually Sensitive Receivers 2 of 7
_Page_060.jpg)
Figure 11.6c Zone of Visual Influence and Visually Sensitive Receivers 3 of 7
_Page_061.jpg)
Figure 11.6d Zone of Visual Influence
and Visually Sensitive Receivers 4 of 7
_Page_062.jpg)
Figure 11.6e Zone of Visual Influence
and Visually Sensitive Receivers 5 of 7
_Page_063.jpg)
Figure 11.6f Zone of Visual Influence and Visually Sensitive Receivers 6 of 7
_Page_064.jpg)
Figure 11.6g Zone of Visual Influence and Visually Sensitive Receivers 7 of 7
_Page_065.jpg)
Figure 11.6h Visual Sensitive Receiver Photographs 1 of 12
_Page_066.jpg)
Figure 11.6i Visual Sensitive Receiver Photographs 2 of 12
_Page_067.jpg)
Figure 11.6j Visual Sensitive Receiver Photographs 3 of 12
_Page_068.jpg)
Figure 11.6k Visual Sensitive Receiver Photographs 4 of 12
_Page_069.jpg)
Figure 11.6l Visual Sensitive Receiver Photographs 5 of 12
_Page_070.jpg)
Figure 11.6m Visual Sensitive Receiver Photographs 6 of 12
_Page_071.jpg)
Figure 11.6n Visual Sensitive Receiver Photographs 7 of 12
_Page_072.jpg)
Figure 11.6o Visual Sensitive Receiver Photographs 8 of 12
_Page_073.jpg)
Figure 11.6p Visual Sensitive Receiver Photographs 9 of 12
_Page_074.jpg)
Figure 11.6q Visual Sensitive Receiver Photographs 10 of 12
_Page_075.jpg)
Figure 11.6r Visual Sensitive Receiver Photographs 11 of 12
_Page_076.jpg)
Figure 11.6s Visual Sensitive Receiver Photographs 12 of 12
_Page_077.jpg)
Figure 11.7a Visual Impacts 1 of 7
_Page_078.jpg)
Figure 11.7b Visual Impacts 2 of 7
_Page_079.jpg)
Figure 11.7c Visual Impacts 3 of 7
_Page_080.jpg)
Figure 11.7d Visual Impacts 4 of 7
_Page_081.jpg)
Figure 11.7e Visual Impacts 5 of 7
_Page_082.jpg)
Figure 11.7f Visual Impacts 6 of 7
_Page_083.jpg)
Figure 11.7g Visual Impacts 7 of 7
_Page_084.jpg)
Figure 11.8 Preliminary Landscape Master Plan
_Page_085.jpg)
Figure 11.9a Recommended Landscape and Visual Mitigation Measures sheet 1 of 35
_Page_086.jpg)
Figure 11.9b Recommended Landscape and Visual Mitigation Measures sheet 2 of 35
_Page_087.jpg)
Figure 11.9c Recommended Landscape and Visual Mitigation Measures sheet 3 of 35
_Page_088.jpg)
Figure 11.9d Recommended Landscape and Visual Mitigation Measures sheet 4 of 35
_Page_089.jpg)
Figure 11.9e Recommended Landscape and Visual Mitigation Measures sheet 5 of 35
_Page_090.jpg)
Figure 11.9f Recommended Landscape and Visual Mitigation Measures sheet 6 of 35
_Page_091.jpg)
Figure 11.9g Recommended Landscape and Visual Mitigation Measures sheet 7 of 35
_Page_092.jpg)
Figure 11.9h Recommended Landscape and Visual Mitigation Measures sheet 8 of 35
_Page_093.jpg)
Figure 11.9i Recommended Landscape and Visual Mitigation Measures sheet 9 of 35
_Page_094.jpg)
Figure 11.9j Recommended Landscape and Visual Mitigation Measures sheet 10 of 35
_Page_095.jpg)
Figure 11.9k Recommended Landscape and Visual Mitigation Measures sheet 11 of 35
_Page_096.jpg)
Figure 11.9l Recommended Landscape and Visual Mitigation Measures sheet 12 of 35
_Page_097.jpg)
Figure 11.9m Recommended Landscape and Visual Mitigation Measures sheet 13 of 35
_Page_098.jpg)
Figure 11.9n Recommended Landscape and Visual Mitigation Measures sheet 14 of 35
_Page_099.jpg)
Figure 11.9o Recommended Landscape and Visual Mitigation Measures sheet 15 of 35
_Page_100.jpg)
Figure 11.9p Recommended Landscape and Visual Mitigation Measures sheet 16 of 35
_Page_101.jpg)
Figure 11.9q Recommended Landscape and Visual Mitigation Measures sheet 19 of 35
_Page_102.jpg)
Figure 11.9r Recommended Landscape and Visual Mitigation Measures sheet 18 of 35
_Page_103.jpg)
Figure 11.9s Recommended Landscape and Visual Mitigation Measures sheet 19 of 35
_Page_104.jpg)
Figure 11.9t Recommended Landscape and Visual Mitigation Measures sheet 20 of 35
_Page_105.jpg)
Figure 11.9u Recommended Landscape and Visual Mitigation Measures sheet 21 of 35
_Page_106.jpg)
Figure 11.9v Recommended Landscape and Visual Mitigation Measures sheet 22 of 35
_Page_107.jpg)
Figure 11.9w Recommended Landscape and Visual Mitigation Measures sheet 23 of 35
_Page_108.jpg)
Figure 11.9x Recommended Landscape and Visual Mitigation Measures sheet 24 of 35
_Page_109.jpg)
Figure 11.9y Recommended Landscape and Visual Mitigation Measures sheet 25 of 35
_Page_110.jpg)
Figure 11.9z Recommended Landscape and Visual Mitigation Measures sheet 26 of 35
_Page_111.jpg)
Figure 11.9za Recommended Landscape and Visual Mitigation Measures sheet 27 of 35
_Page_112.jpg)
Figure 11.9zb Recommended Landscape and Visual Mitigation Measures sheet 28 of 35
_Page_113.jpg)
Figure 11.9zc Recommended Landscape and Visual Mitigation Measures sheet 29 of 35
_Page_114.jpg)
Figure 11.9zd Recommended Landscape and Visual Mitigation Measures sheet 30 of 35
_Page_115.jpg)
Figure 11.9ze Recommended Landscape and Visual Mitigation Measures sheet 31 of 35
_Page_116.jpg)
Figure 11.9zf Recommended Landscape and Visual Mitigation Measures sheet 32 of 35
_Page_117.jpg)
Figure 11.9zg Recommended Landscape and Visual Mitigation Measures sheet 33 of 35
_Page_118.jpg)
Figure 11.9zh Recommended Landscape and Visual Mitigation Measures sheet 34 of 35
_Page_119.jpg)
Figure 11.9zi Recommended Landscape and Visual Mitigation Measures sheet 35 of 35
_Page_120.jpg)
Figure 11.10a Photomontages – Vantage Point A
_Page_121.jpg)
Figure 11.10b Photomontages – Vantage Point A
_Page_122.jpg)
Figure 11.10c Photomontages – Vantage Point B
_Page_123.jpg)
Figure 11.10d Photomontages – Vantage Point B
_Page_124.jpg)
Figure 11.10e Photomontages – Vantage Point C
_Page_125.jpg)
Figure 11.10f Photomontages – Vantage Point C
_Page_126.jpg)
Figure 11.10g Photomontages – Vantage Point D
_Page_127.jpg)
Figure 11.10h Photomontages – Vantage Point D
_Page_128.jpg)
Figure 11.10i Photomontages – Vantage Point E
_Page_129.jpg)
Figure 11.10j Photomontages – Vantage Point E
_Page_130.jpg)
Figure 11.10k Photomontages – Vantage Point H
_Page_131.jpg)
Figure 11.10l Photomontages – Vantage Point H
_Page_132.jpg)
Figure 11.10m Photomontages – Vantage Point I
_Page_133.jpg)
Figure 11.10n Photomontages – Vantage Point I
_Page_134.jpg)
Figure 11.10o Photomontages – Vantage Point K
_Page_135.jpg)
Figure 11.10p Photomontages – Vantage Point K
_Page_136.jpg)
Figure 11.10q Photomontages – Vantage Point L
_Page_137.jpg)
Figure 11.10r Photomontages – Vantage Point L
_Page_138.jpg)
Figure 11.10s Photomontages – Vantage Point O
_Page_139.jpg)
Figure 11.10t Photomontages – Vantage Point O
_Page_140.jpg)
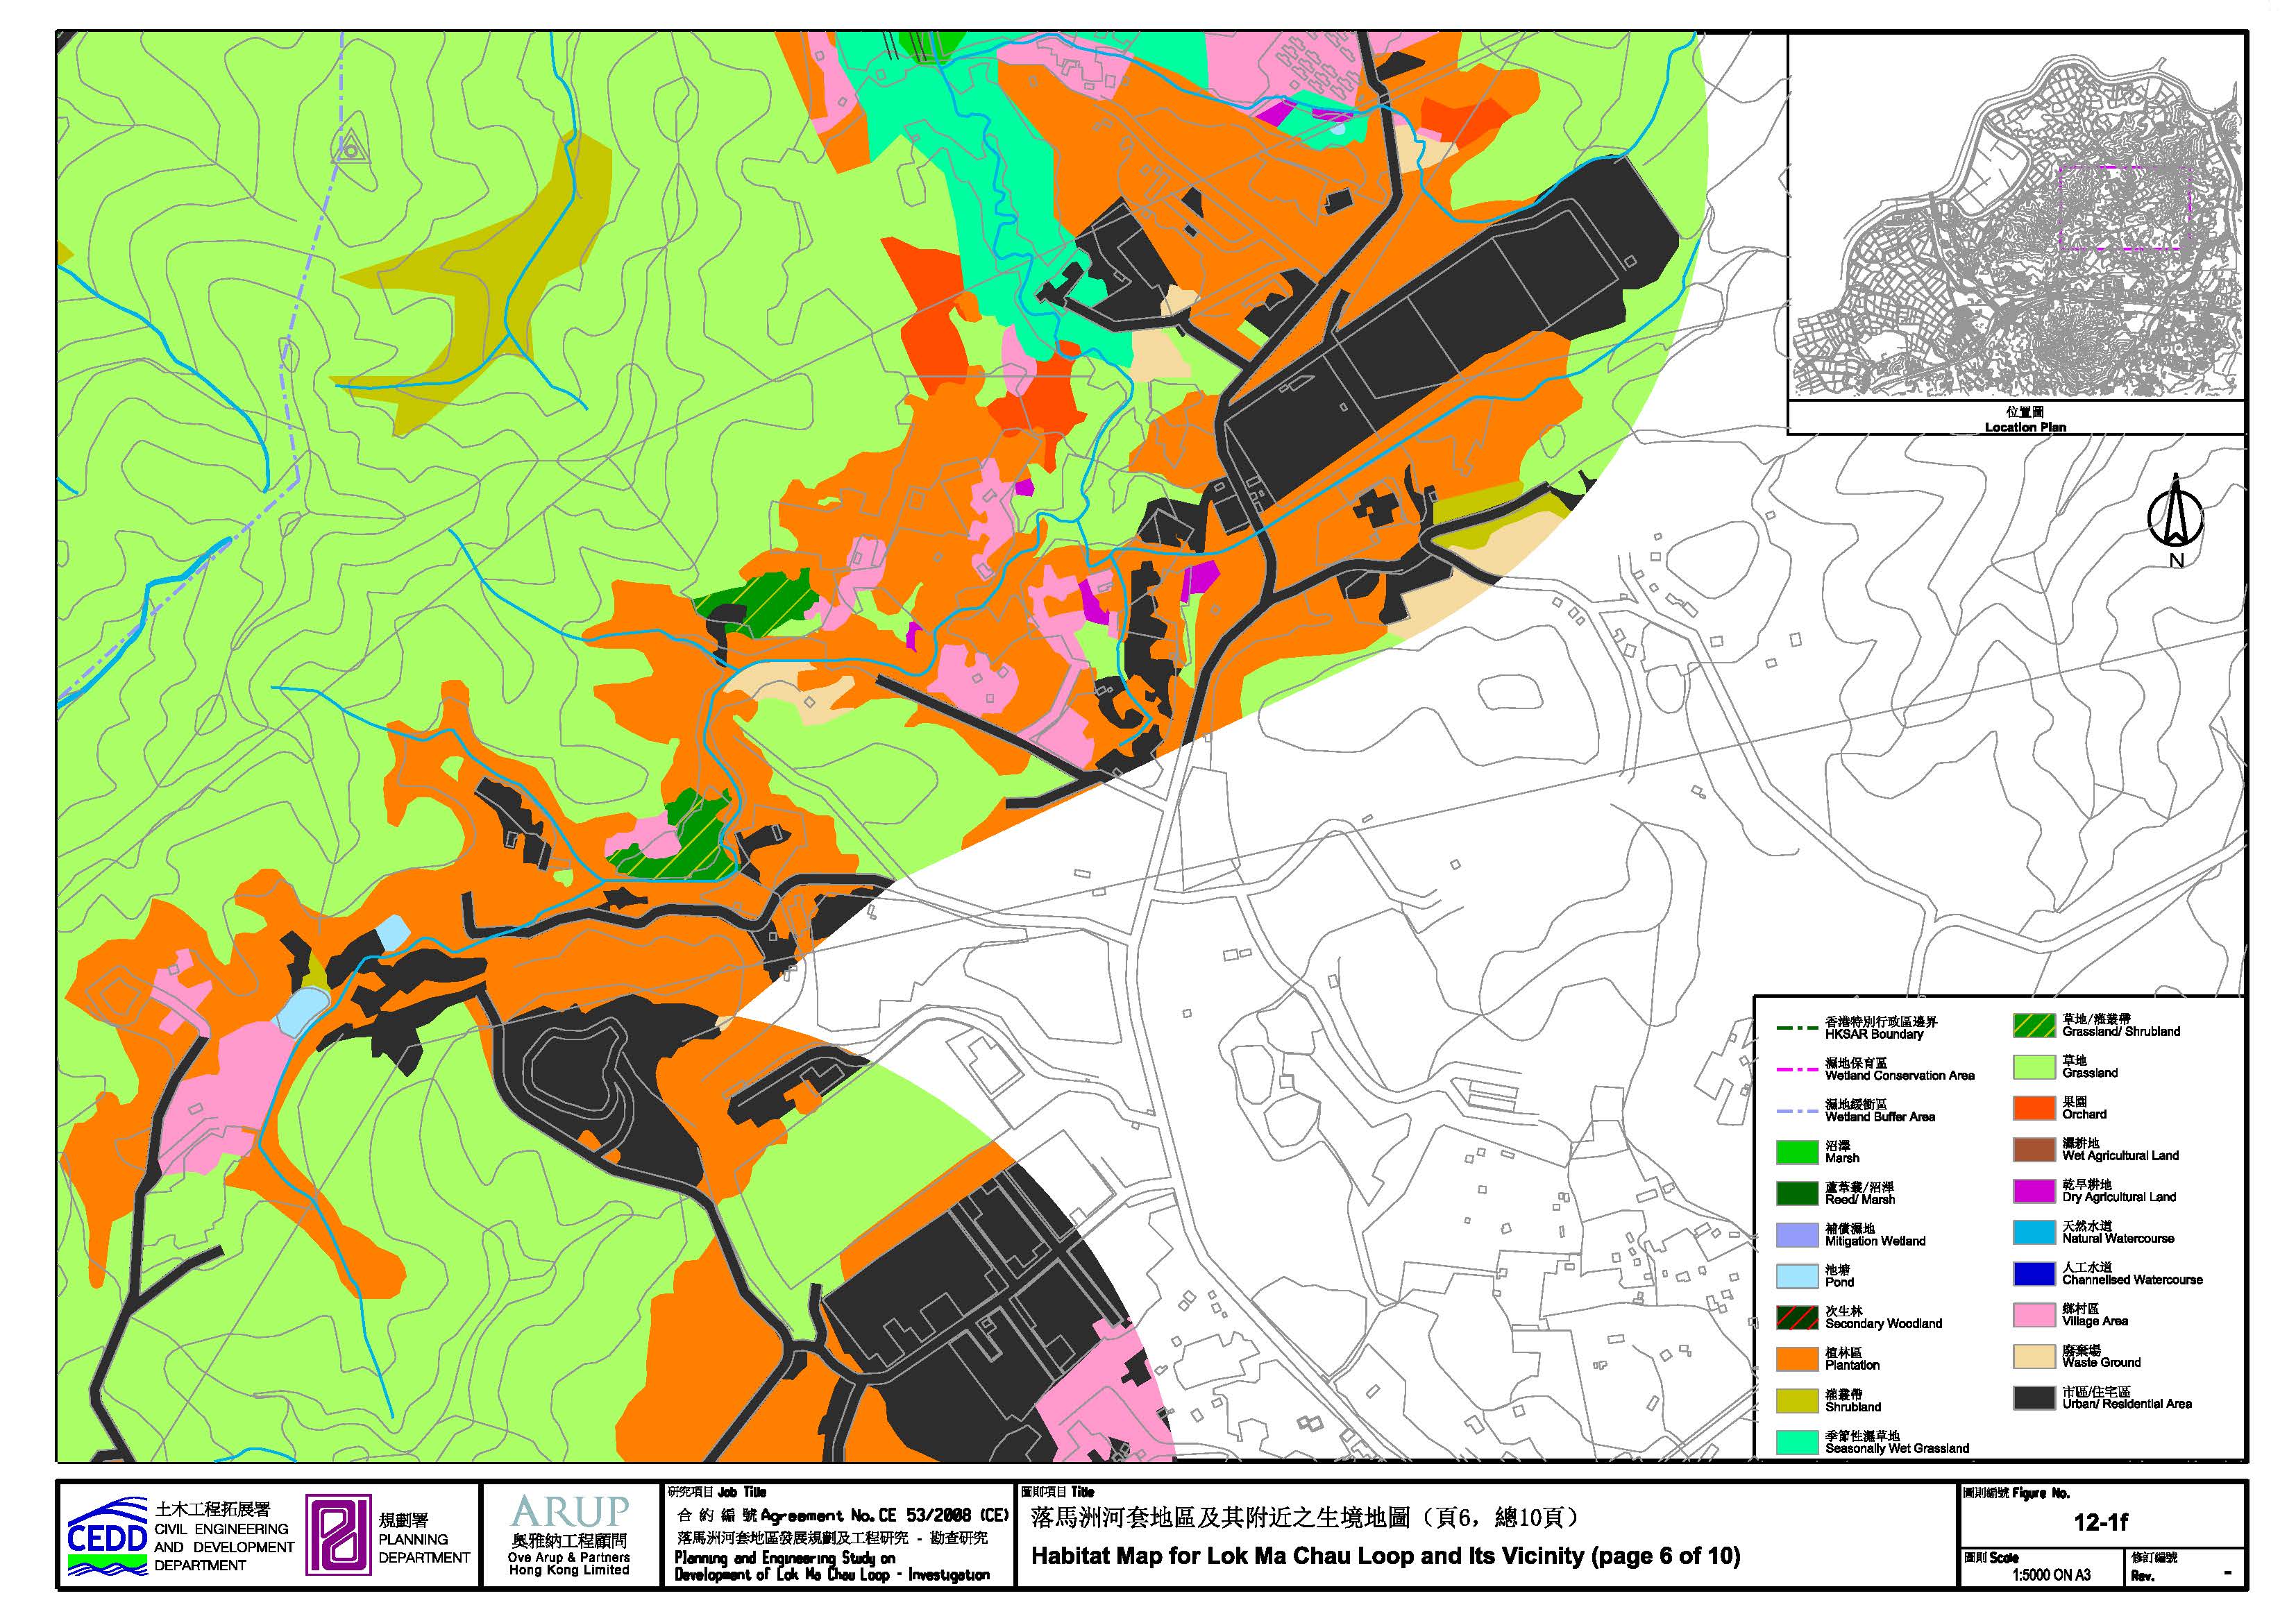
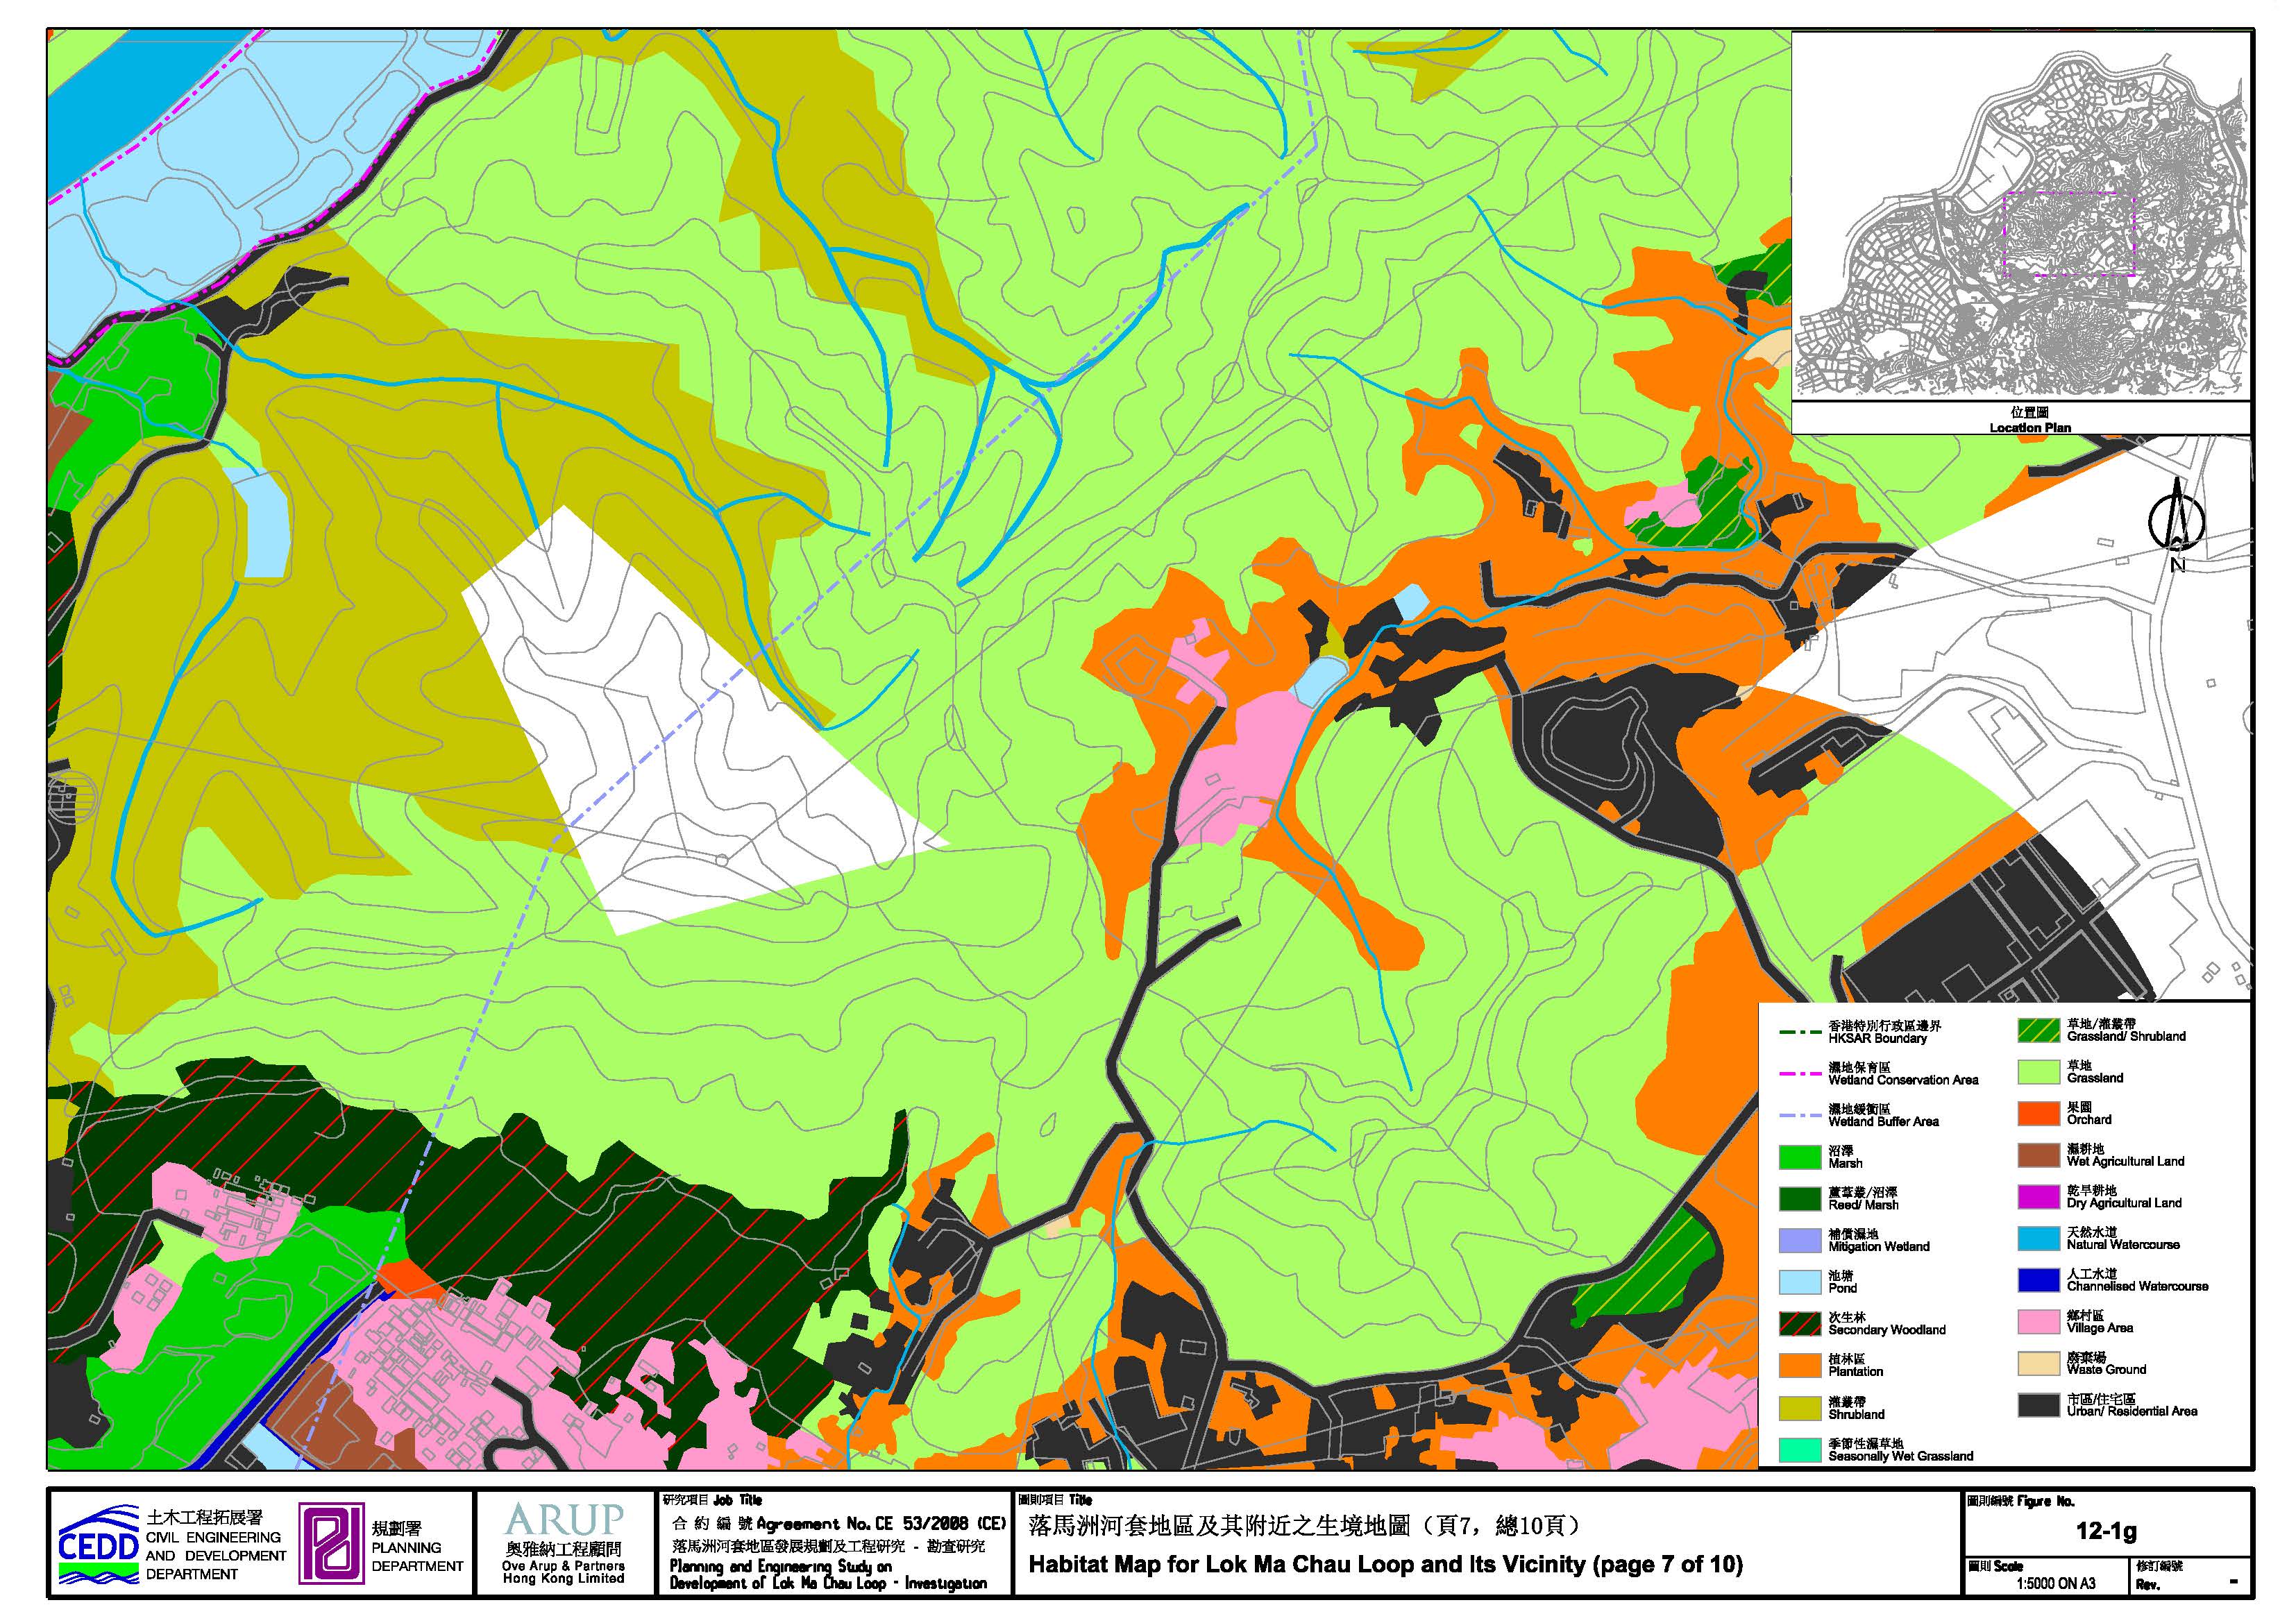
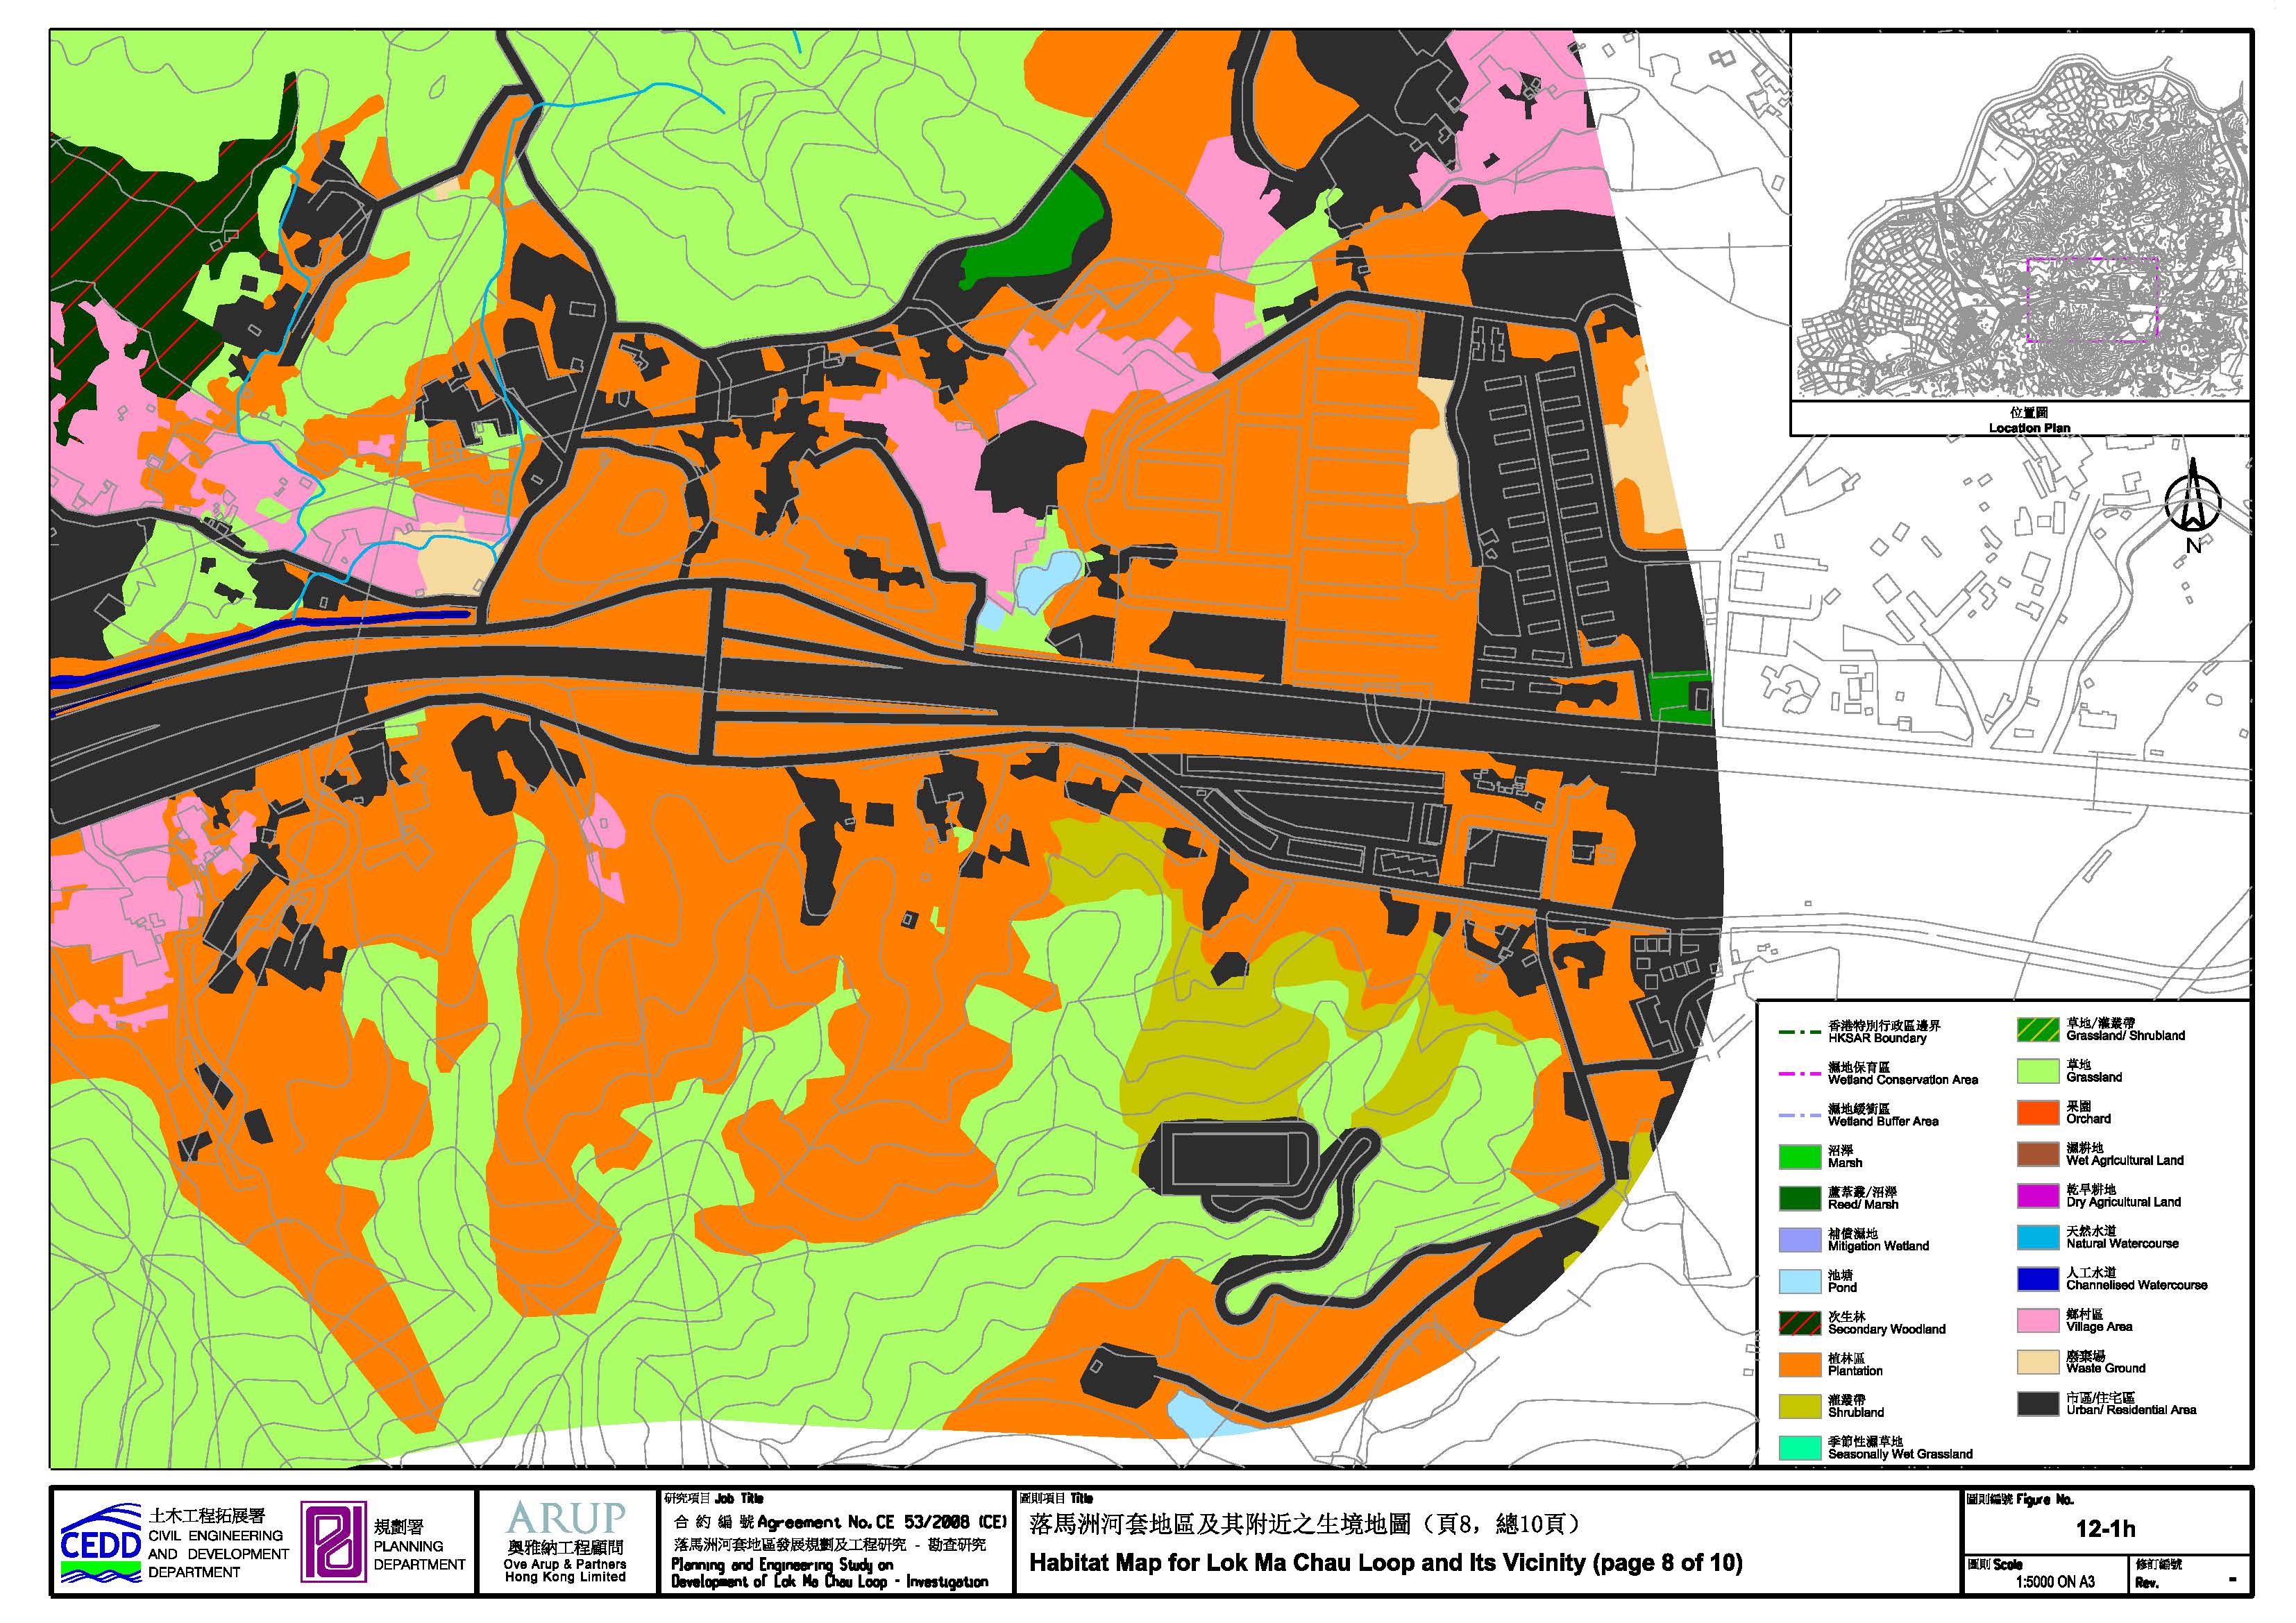
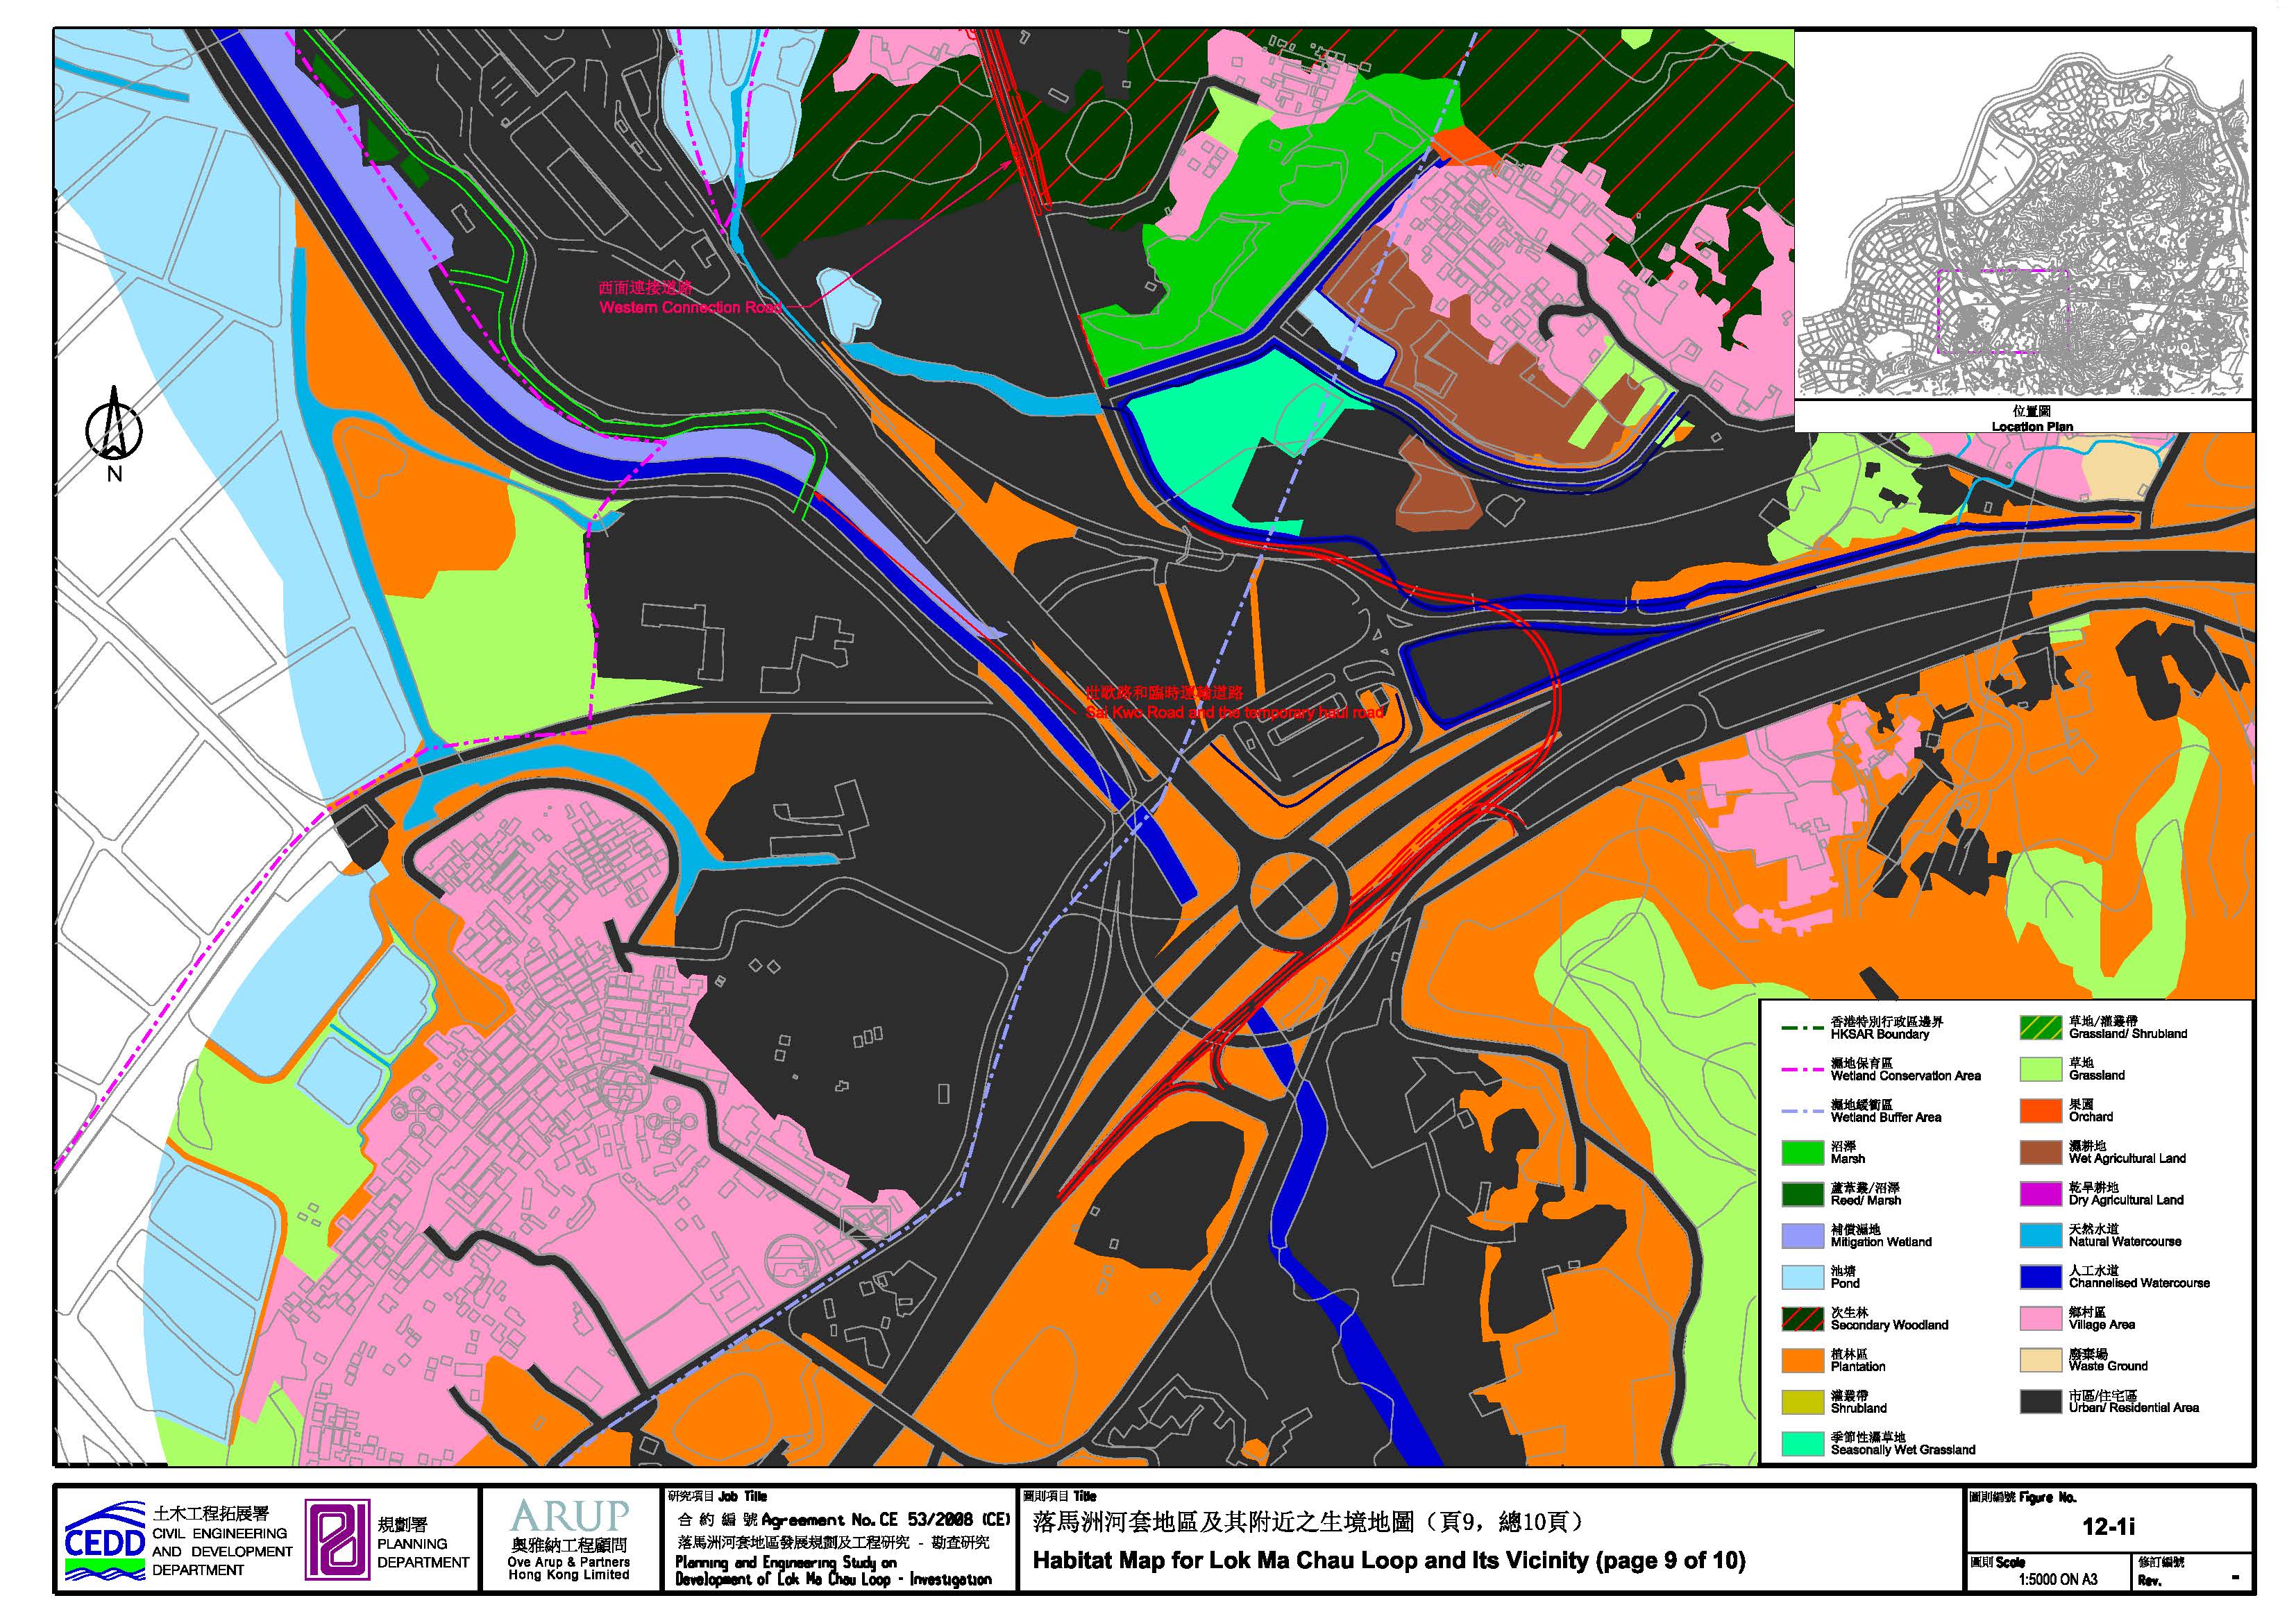
Figure 12.1 Habitat Map for Lok Ma Chau Loop and Its Vicinity
Figure 12.1a Habitat
Map for Lok Ma Chau Loop and Its Vicinity (page 1 of 10)
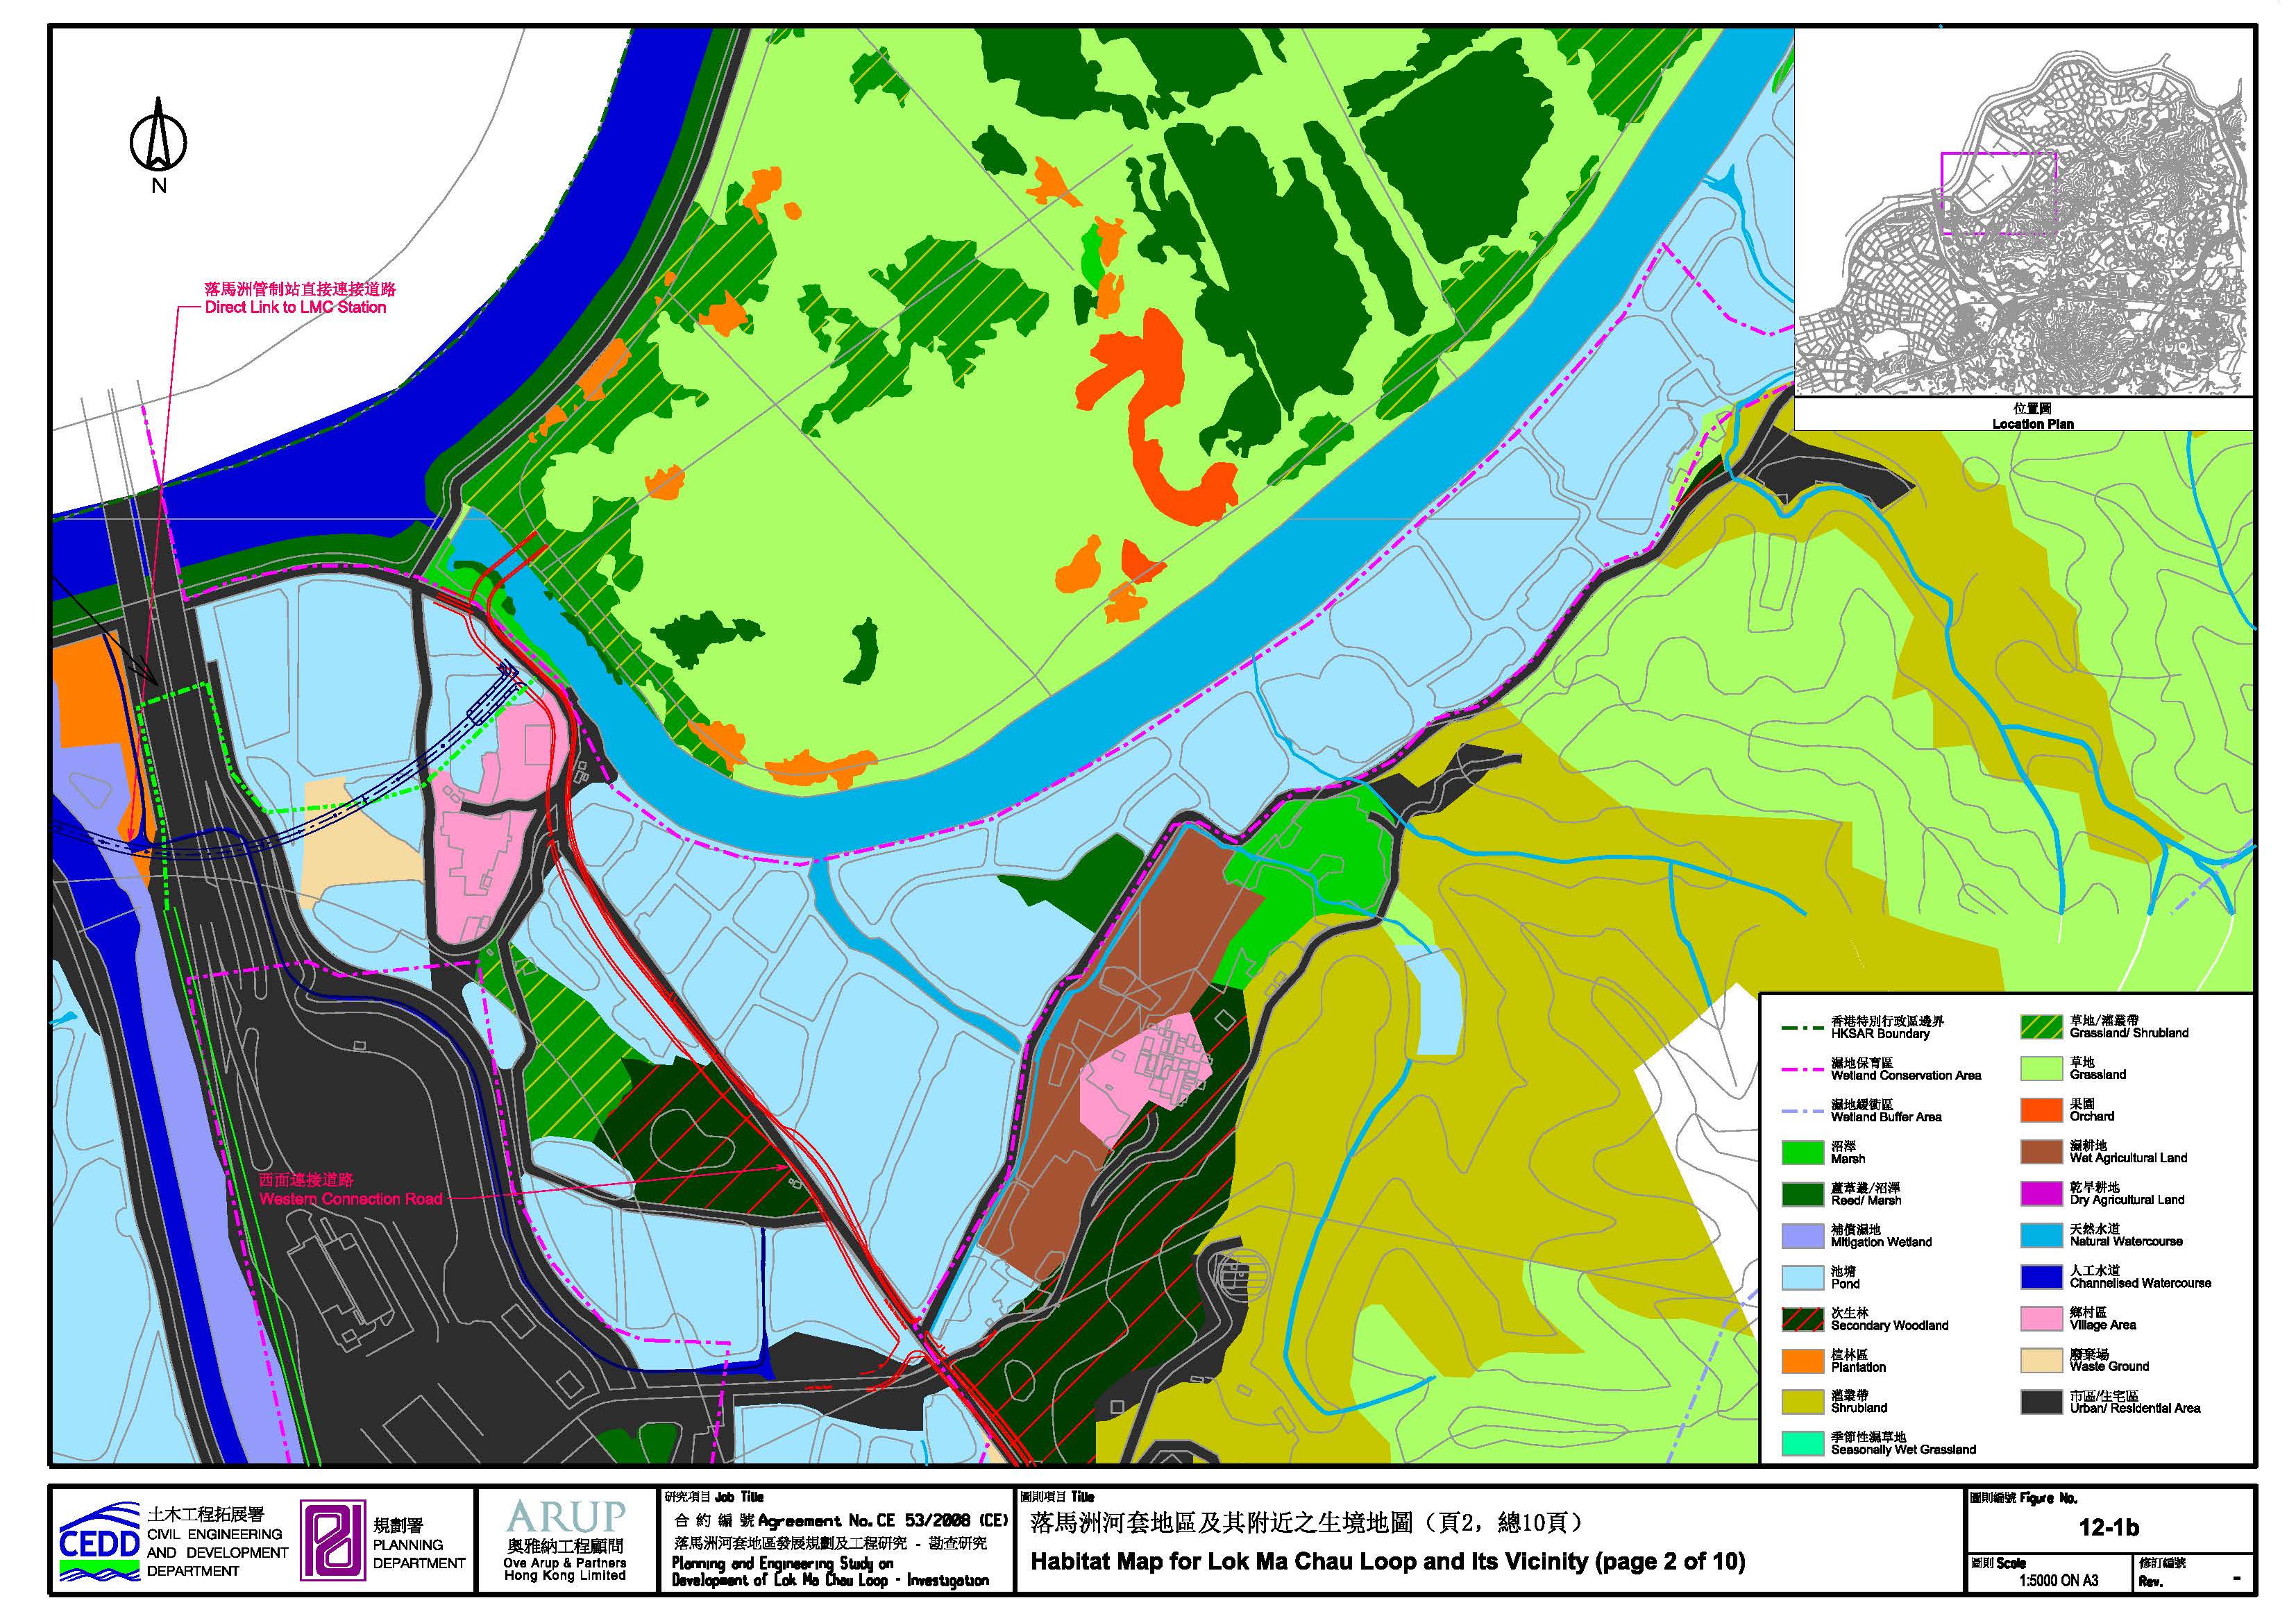
Figure 12.1b Habitat
Map for Lok Ma Chau Loop and Its Vicinity (page 2 of 10)
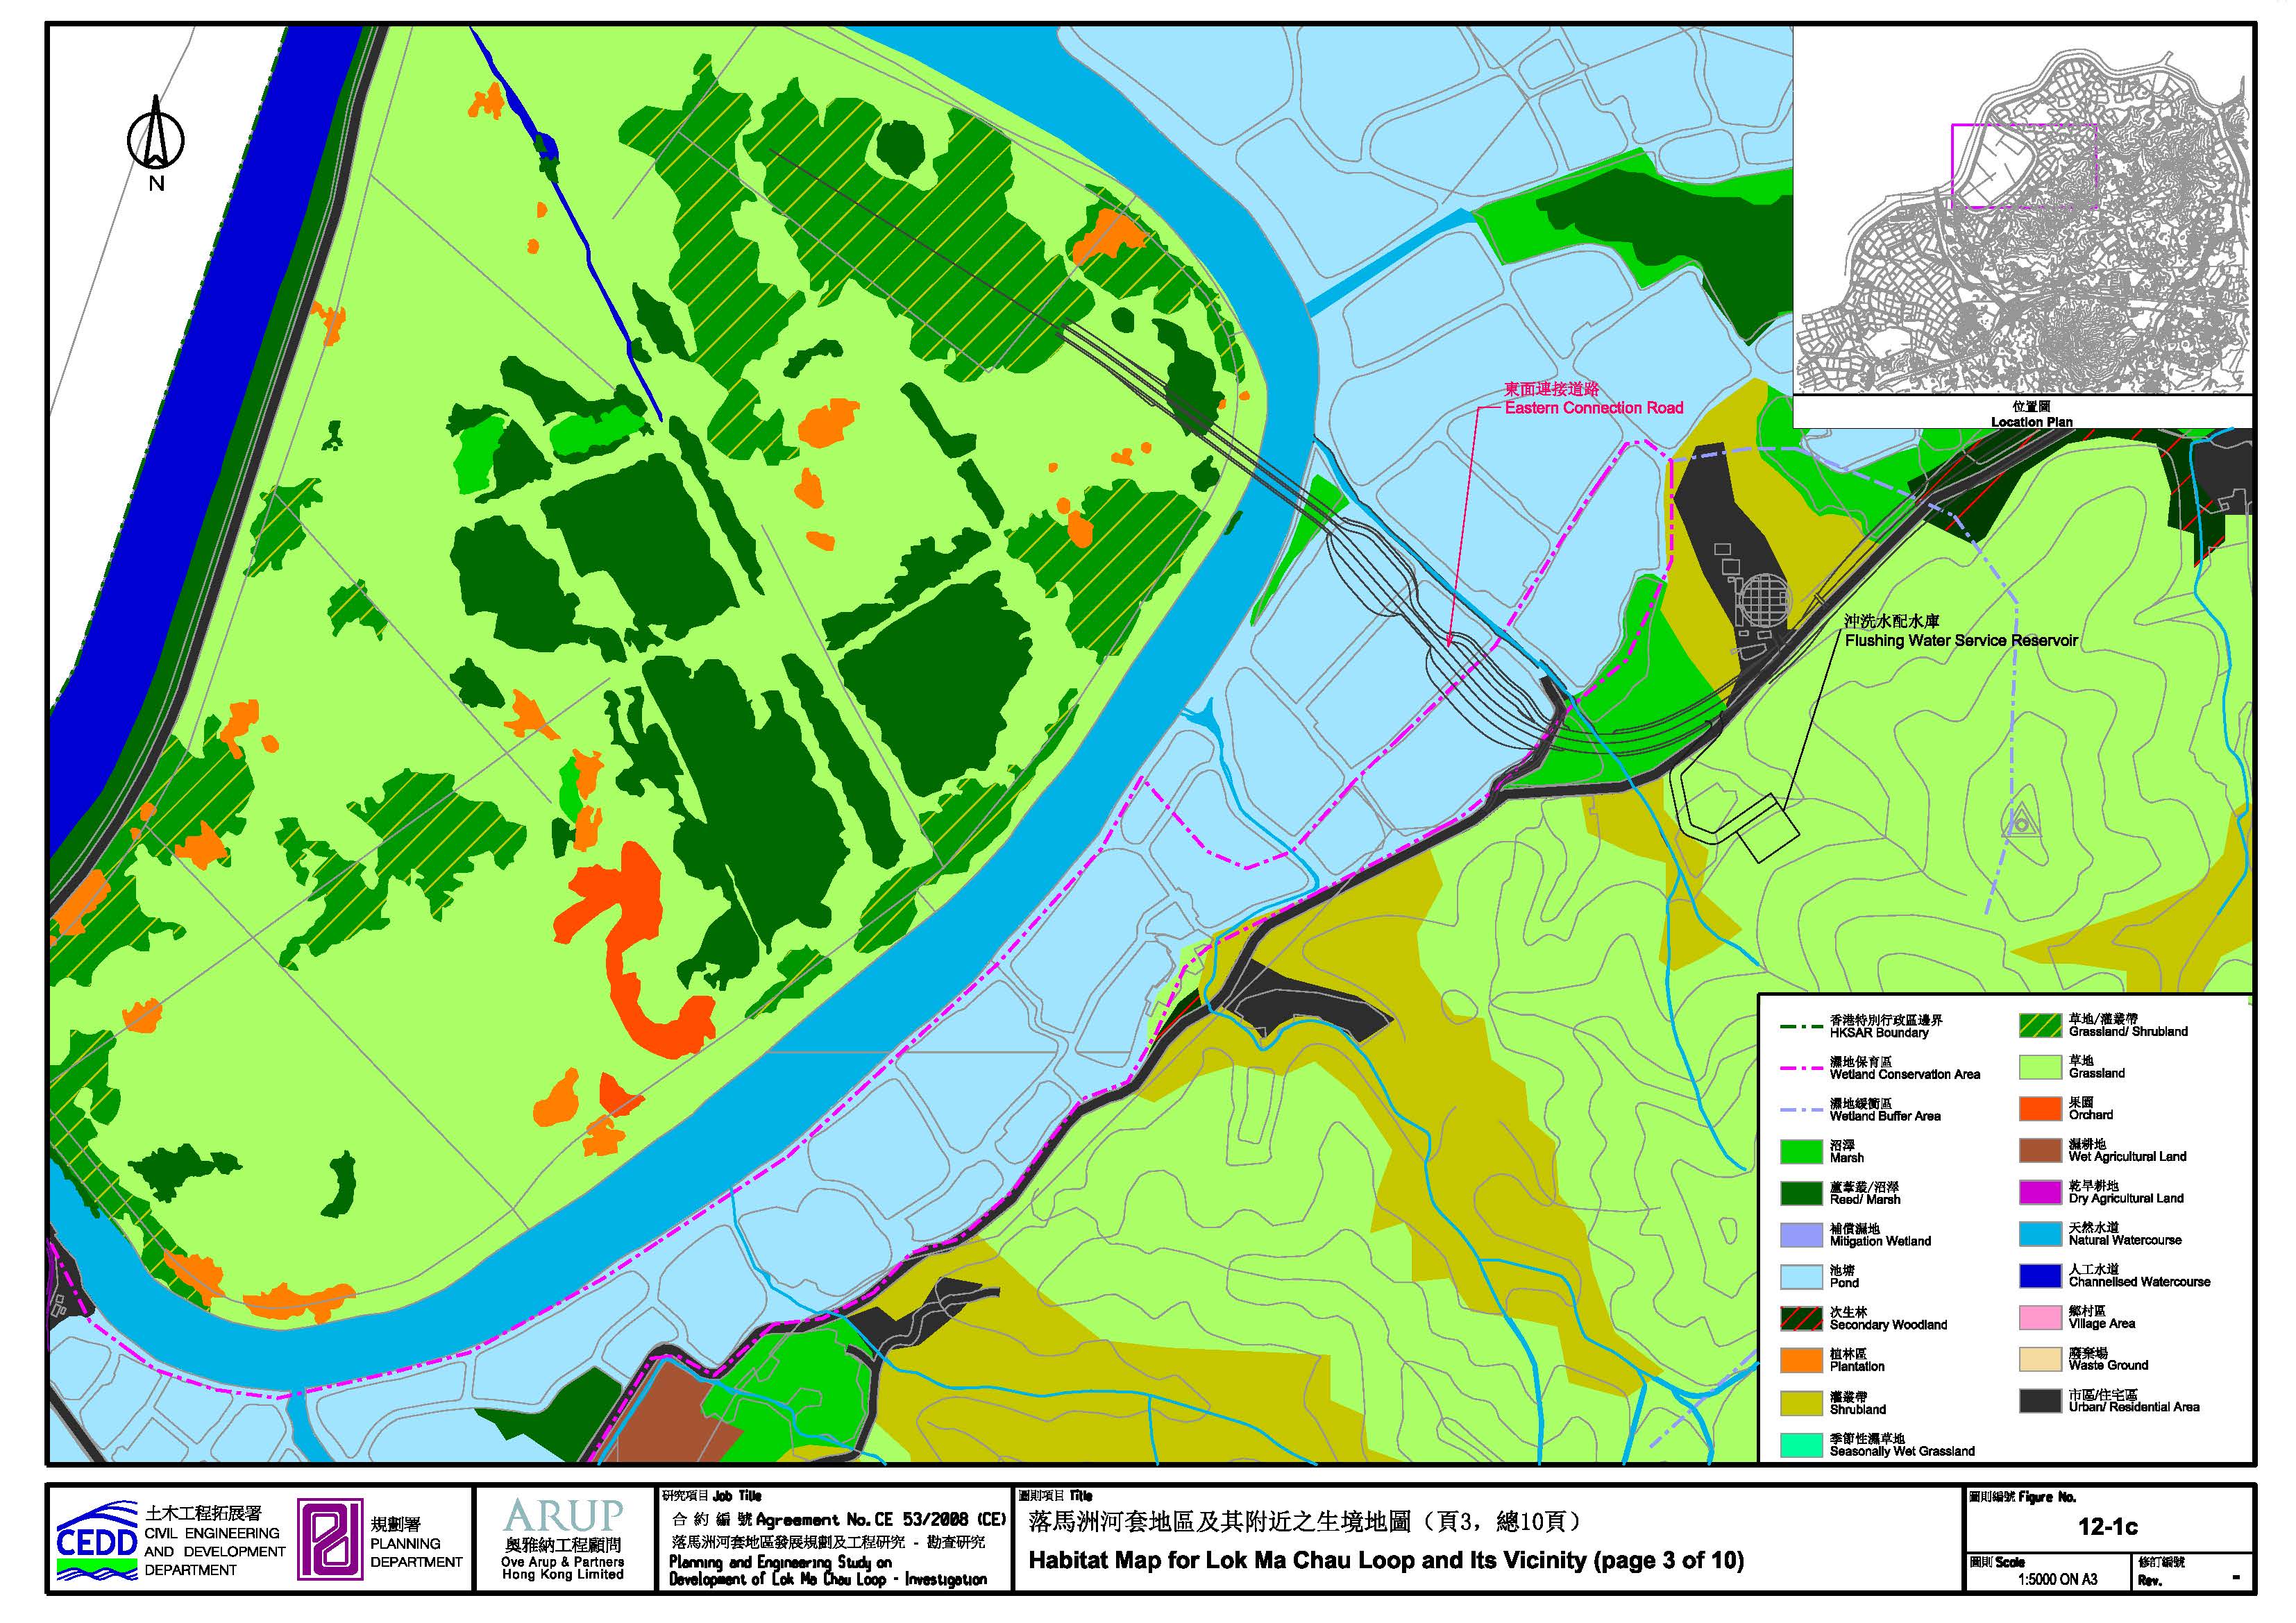
Figure 12.1c Habitat
Map for Lok Ma Chau Loop and Its Vicinity (page 3 of 10)
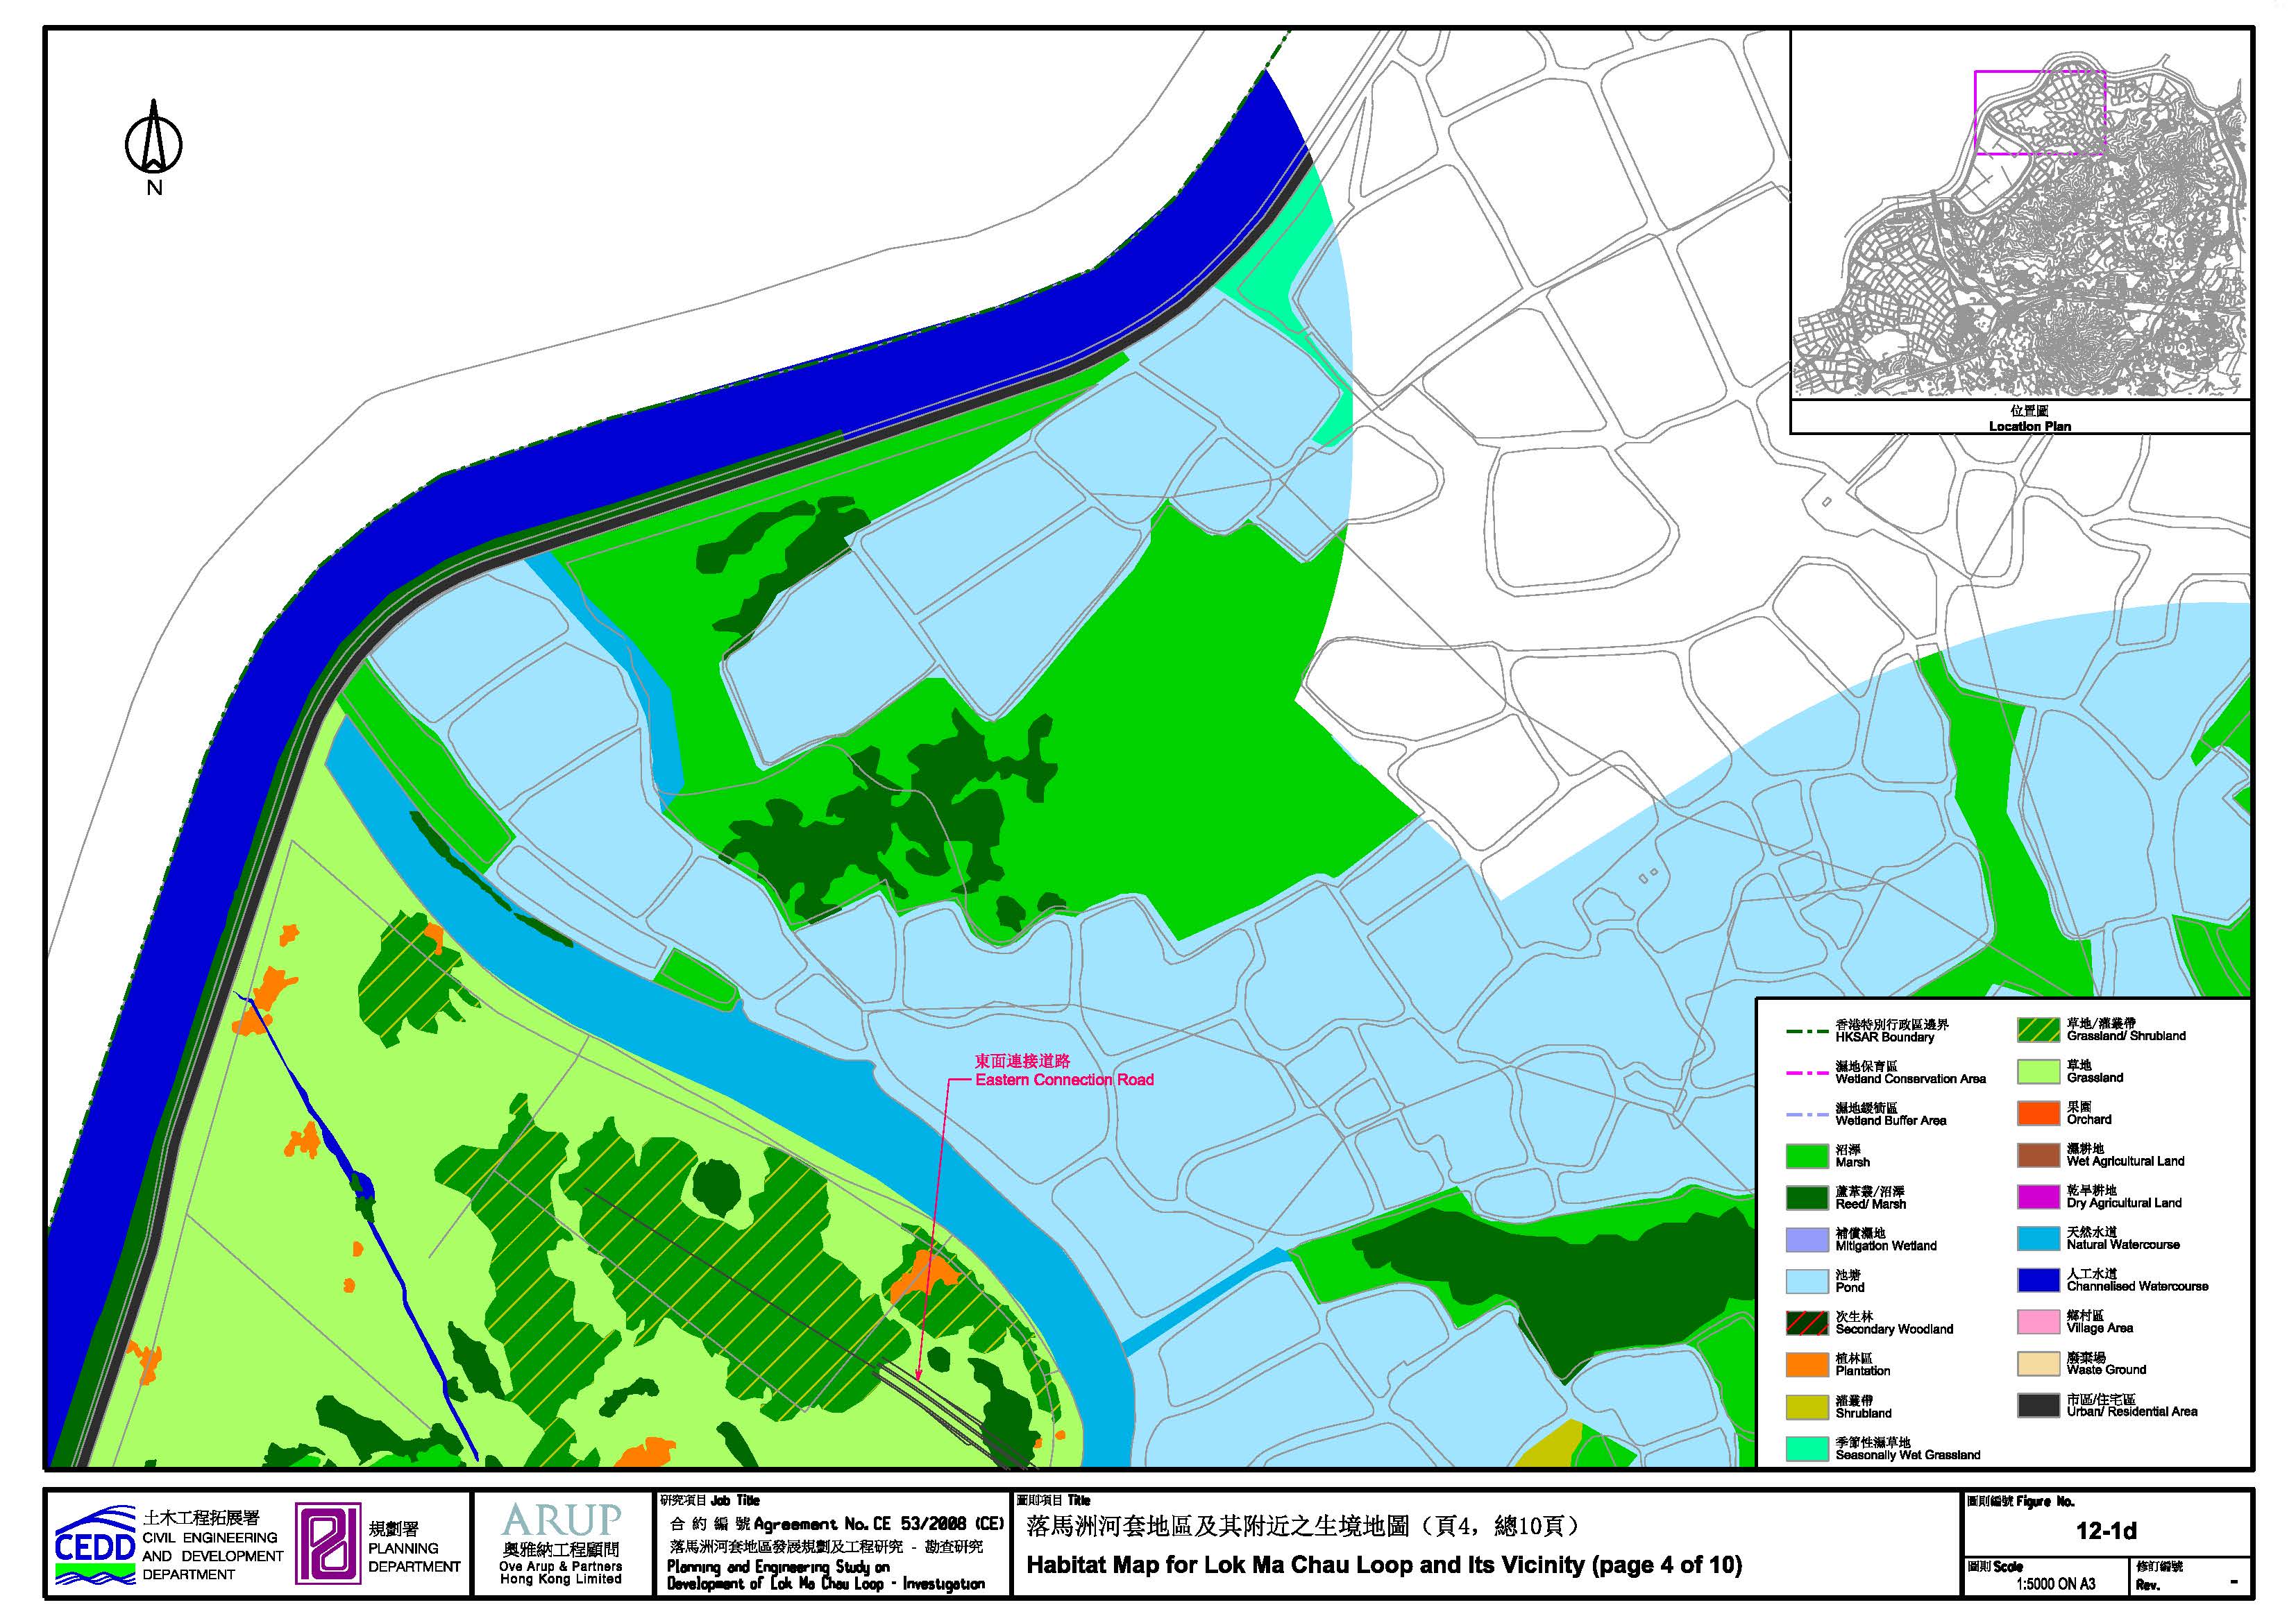
Figure 12.1d Habitat
Map for Lok Ma Chau Loop and Its Vicinity (page 4 of 10)
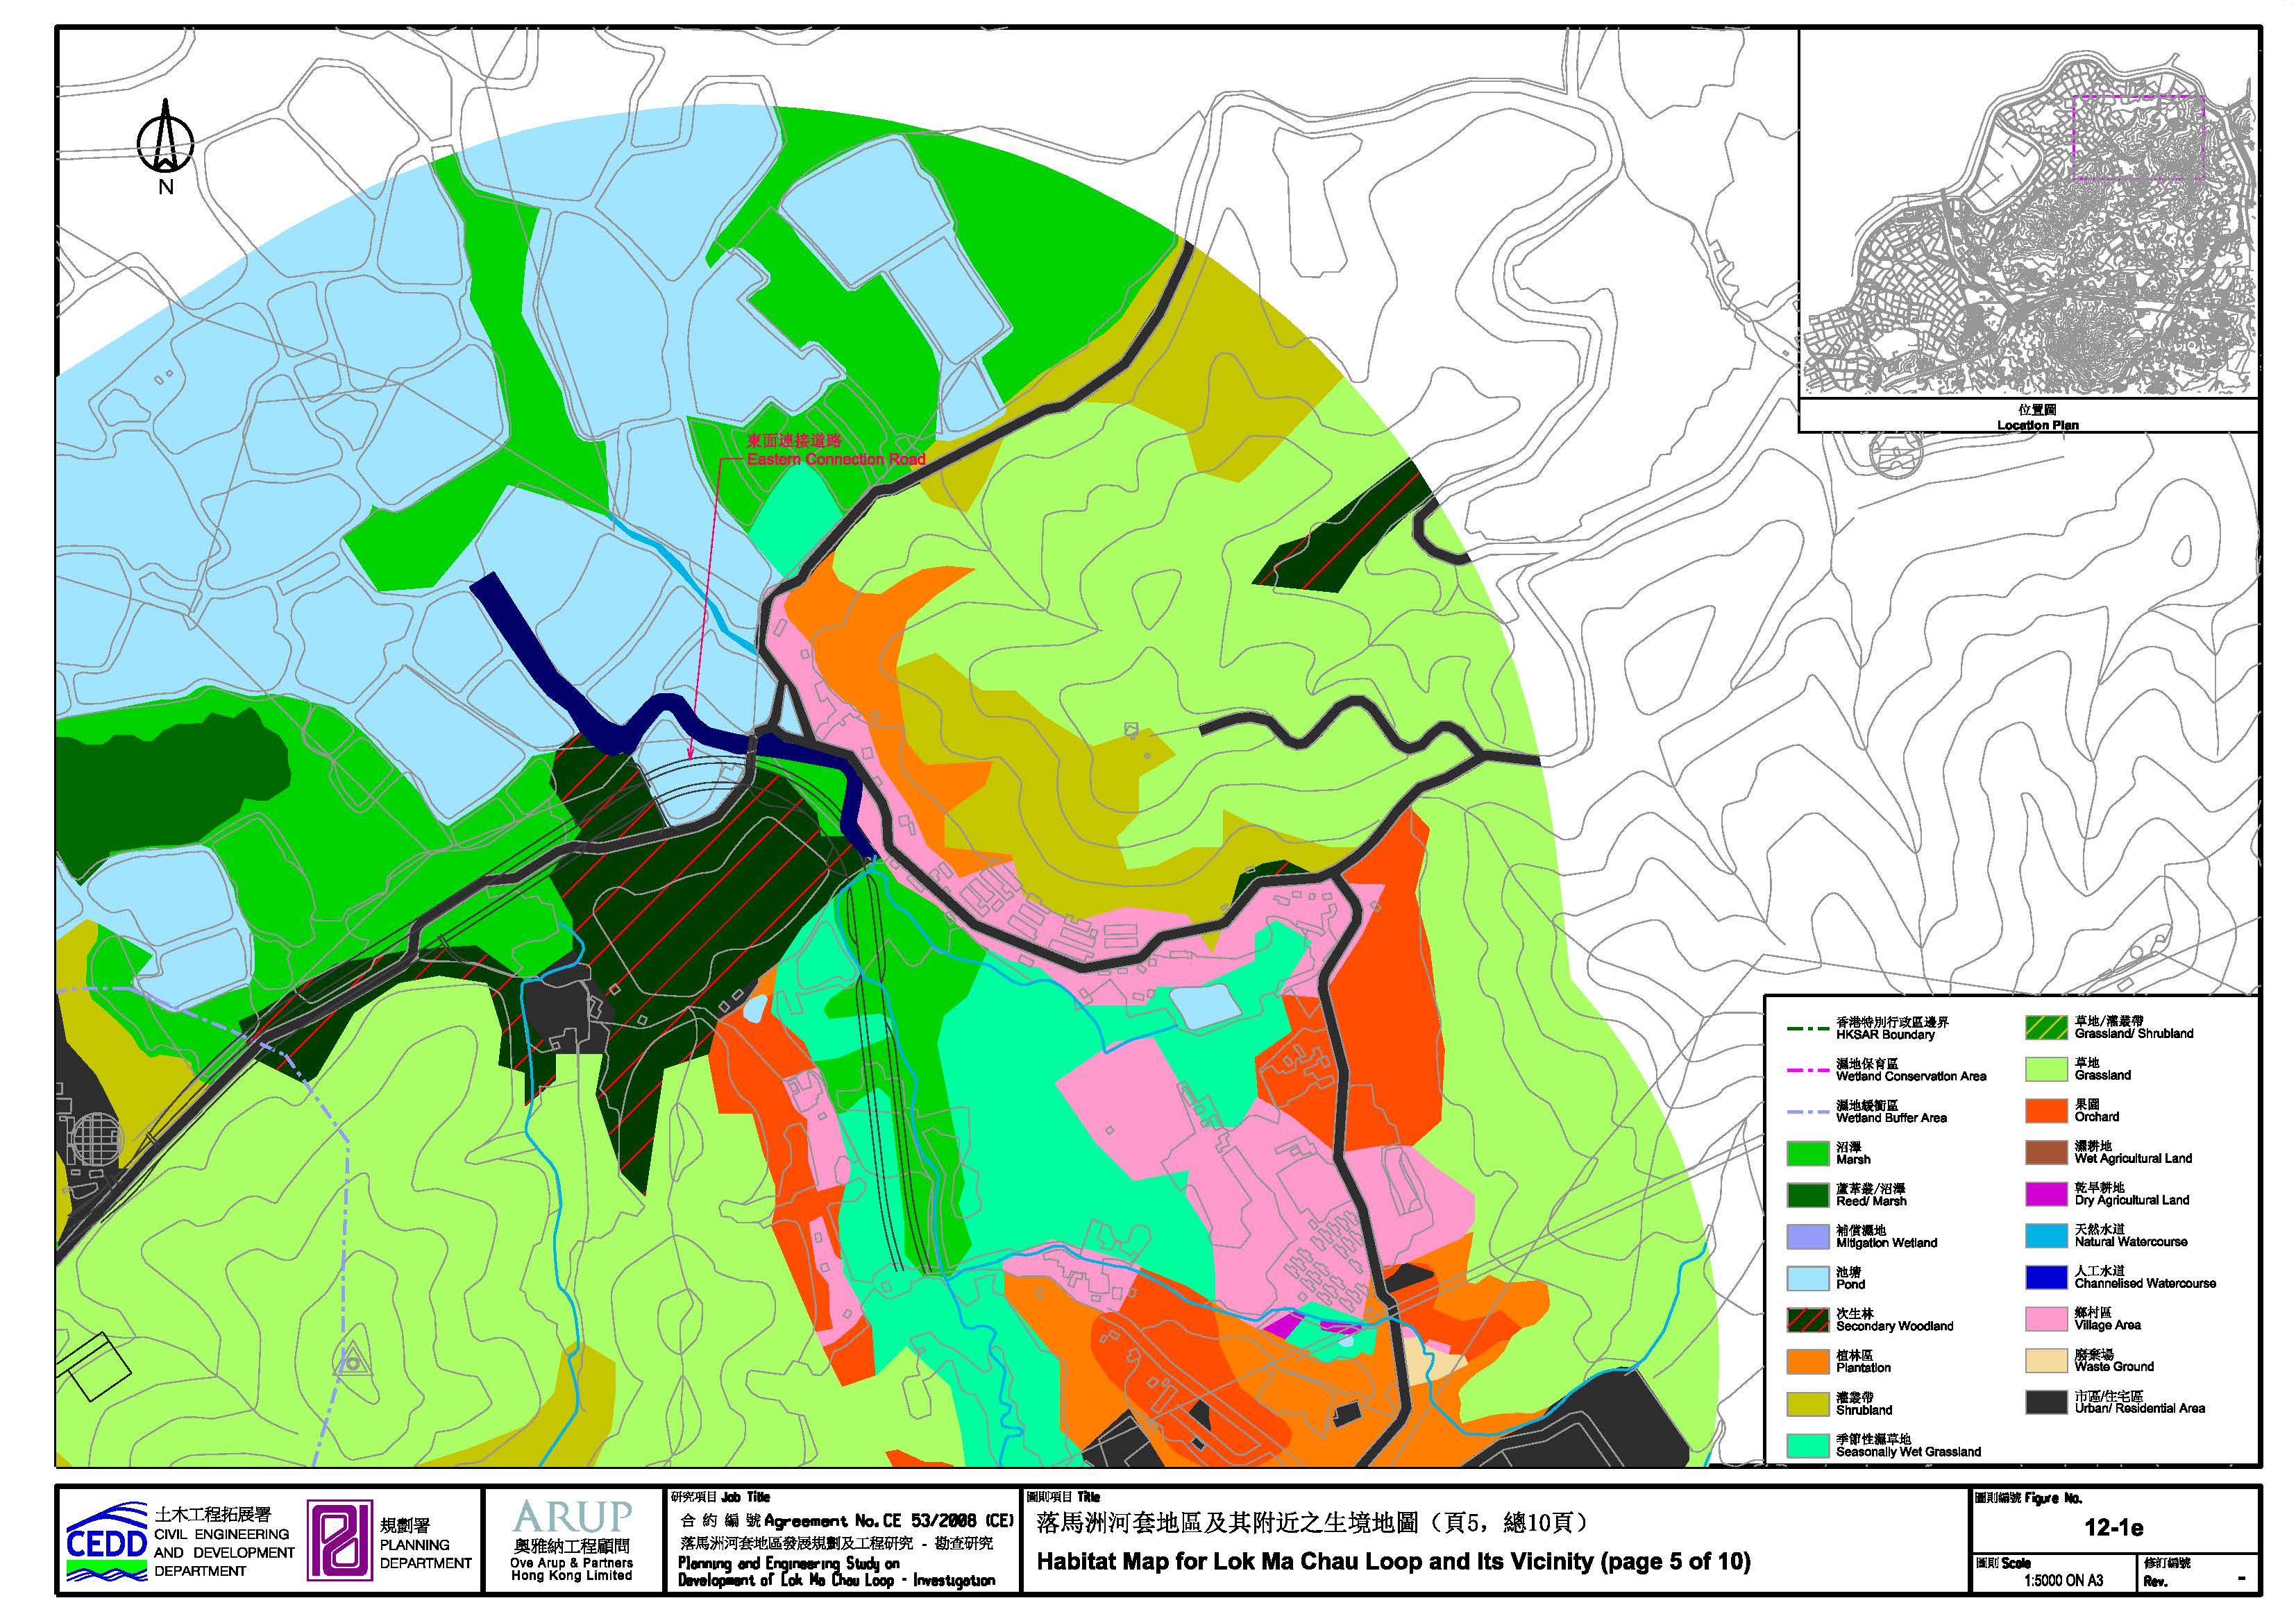
Figure 12.1e Habitat
Map for Lok Ma Chau Loop and Its Vicinity (page 5 of 10)
Figure 12.1f Habitat
Map for Lok Ma Chau Loop and Its Vicinity (page 6 of 10)
Figure 12.1g Habitat
Map for Lok Ma Chau Loop and Its Vicinity (page 7 of 10)
Figure 12.1h Habitat
Map for Lok Ma Chau Loop and Its Vicinity (page 8 of 10)
Figure 12.1i Habitat
Map for Lok Ma Chau Loop and Its Vicinity (page 9 of 10)
Figure 12.1j Habitat
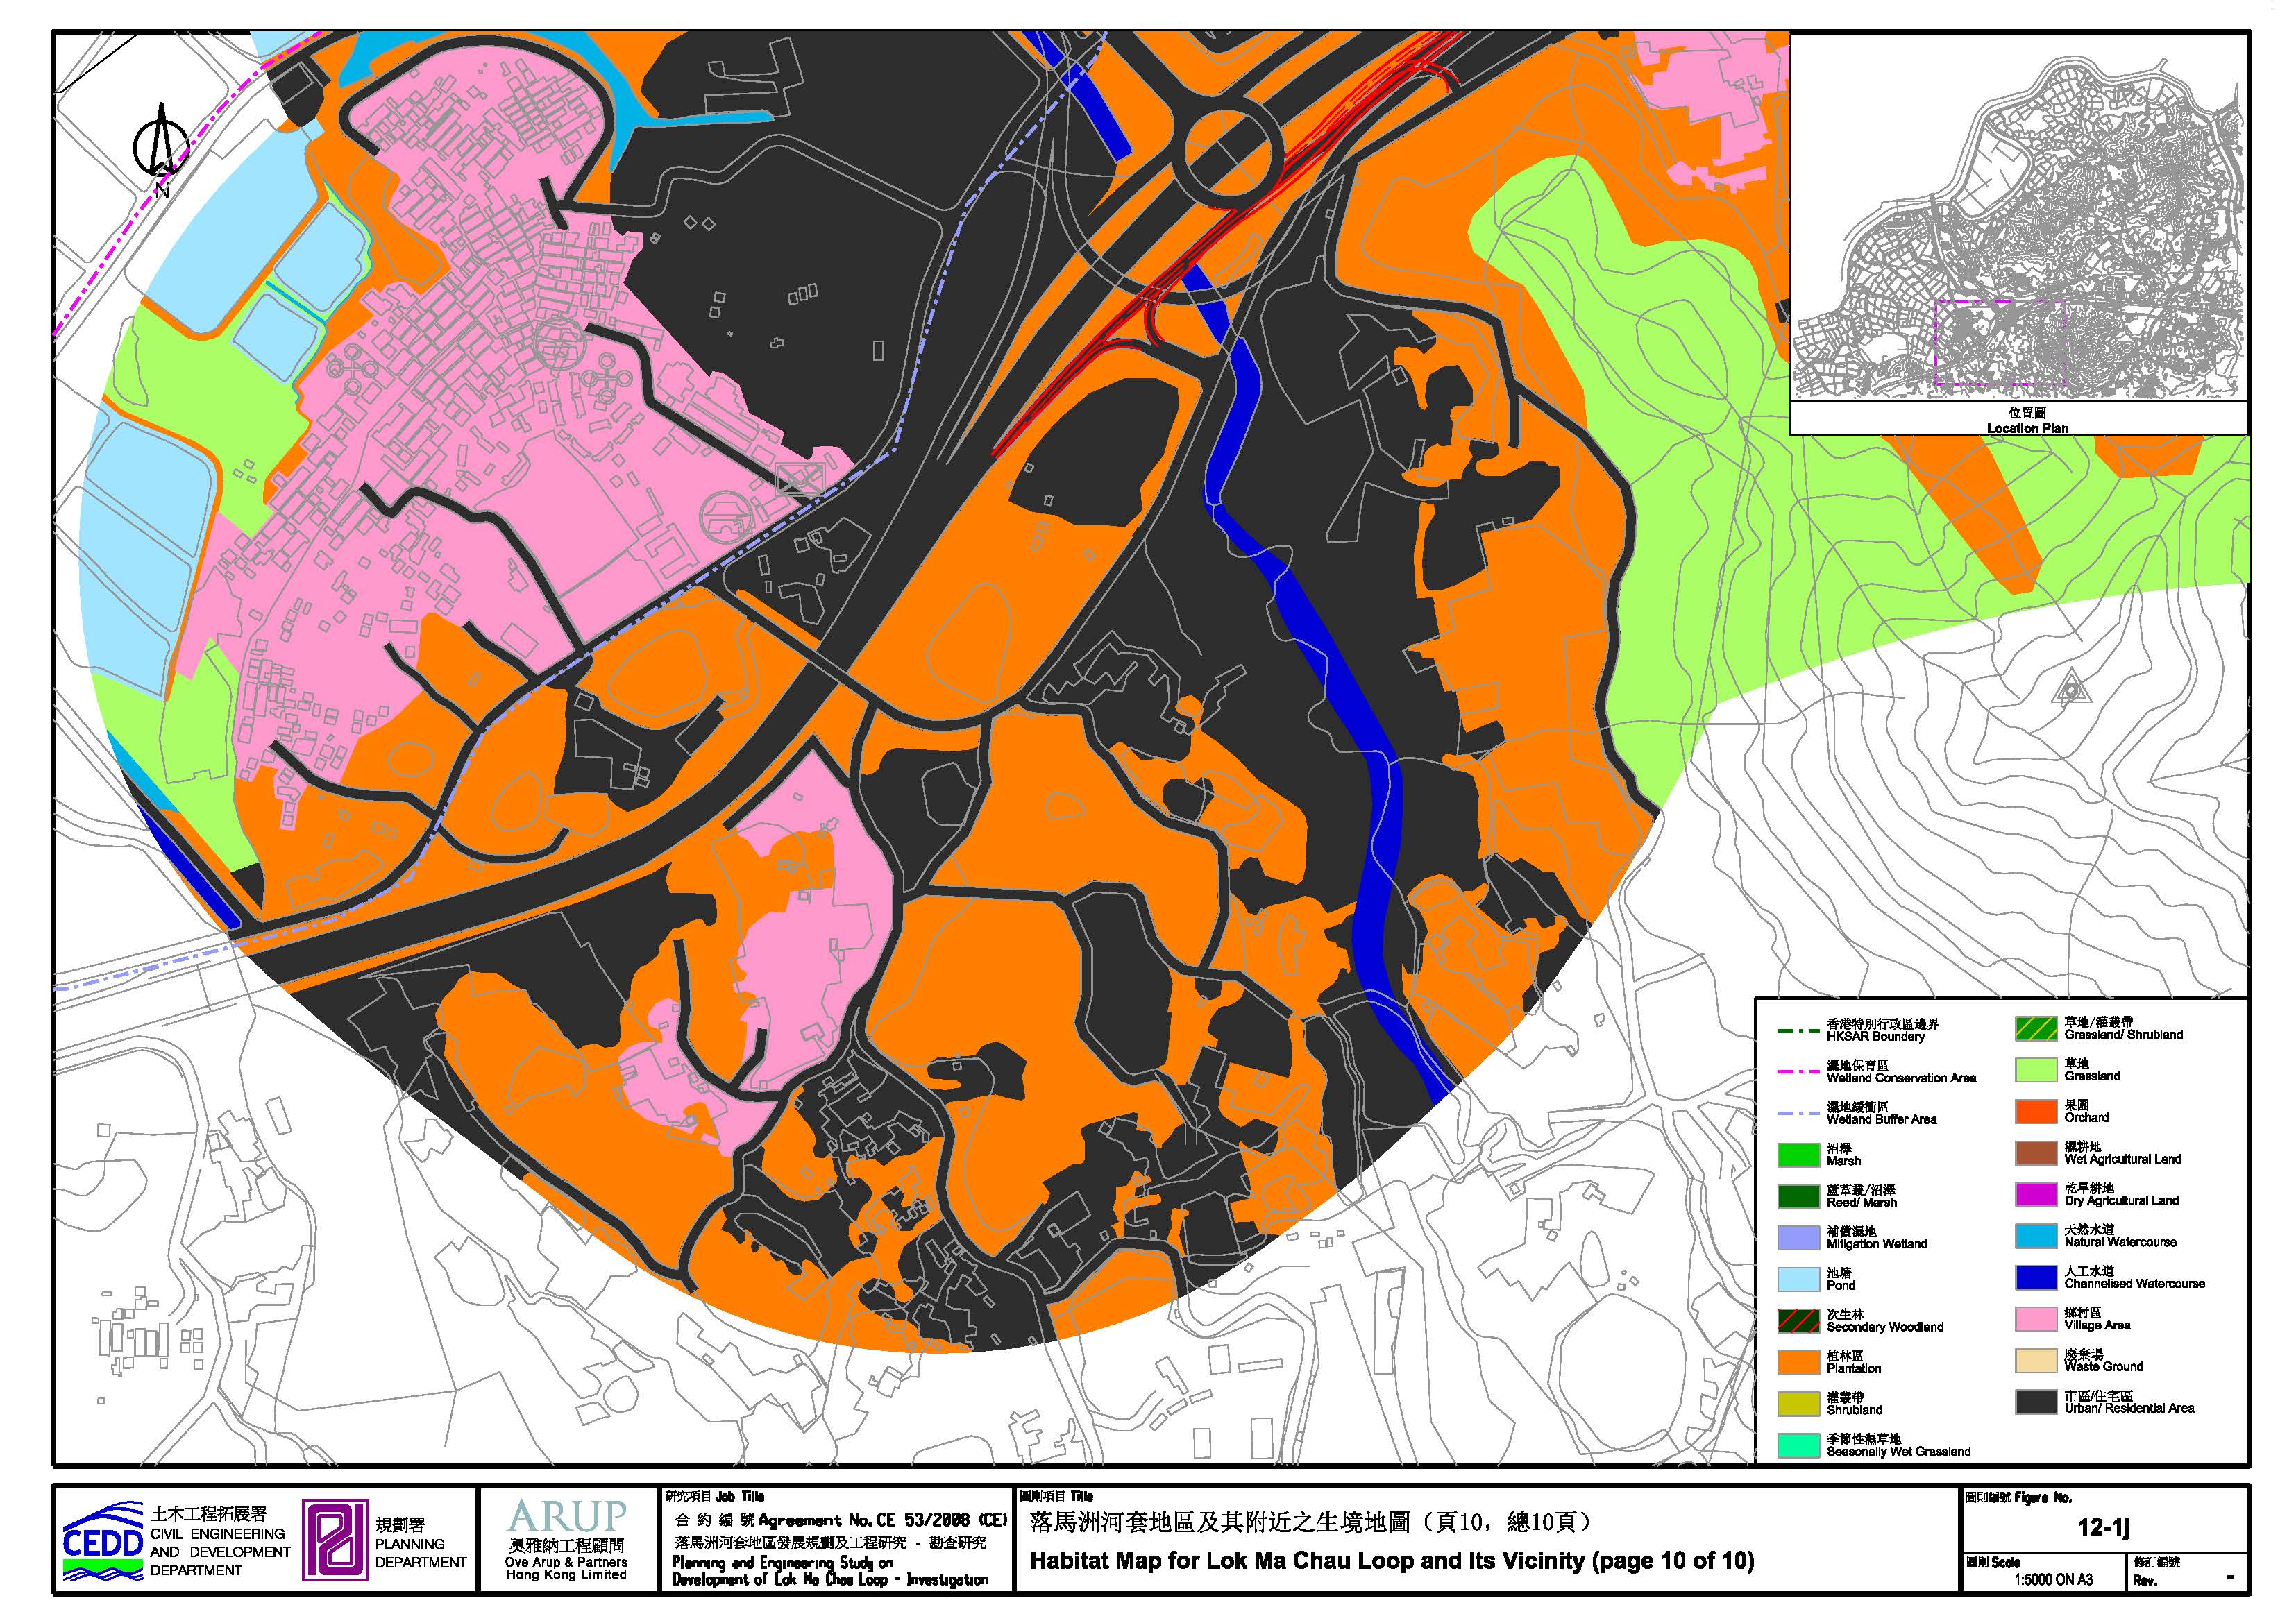
Map for Lok Ma Chau Loop and Its Vicinity (page 10 of 10)
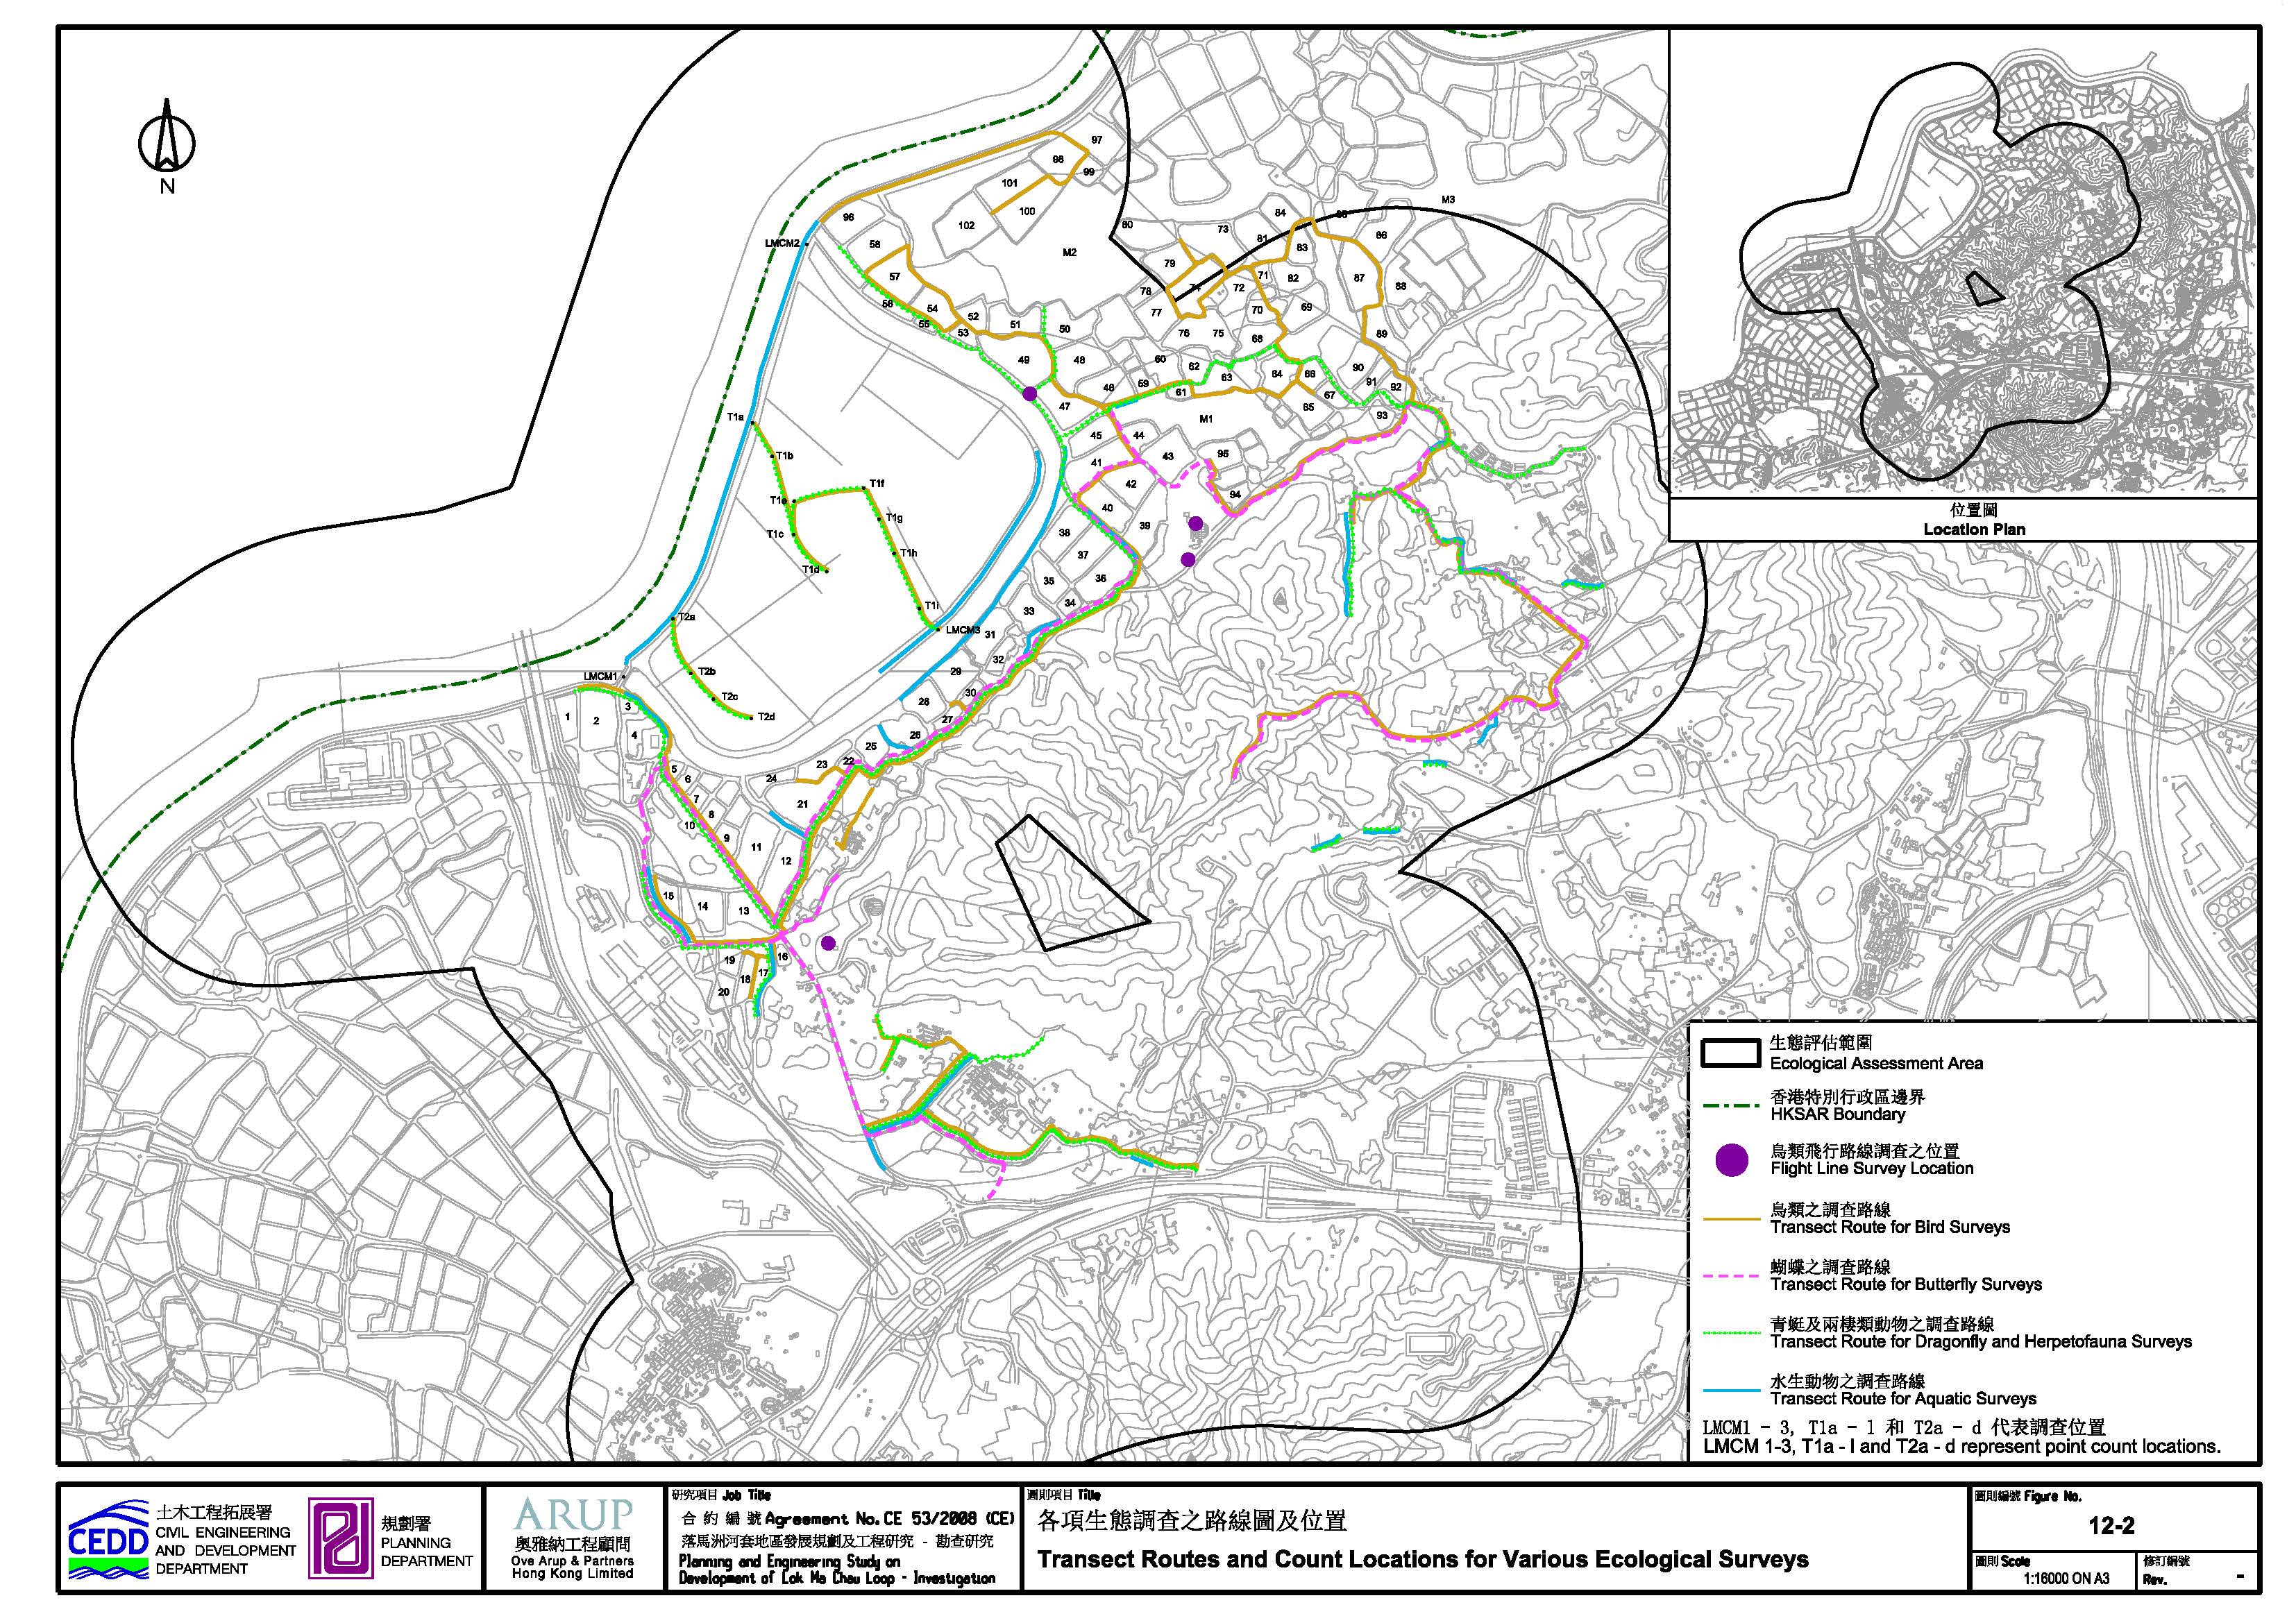
Figure 12.2 Transect Routes and Count Locations for Various Ecological Surveys
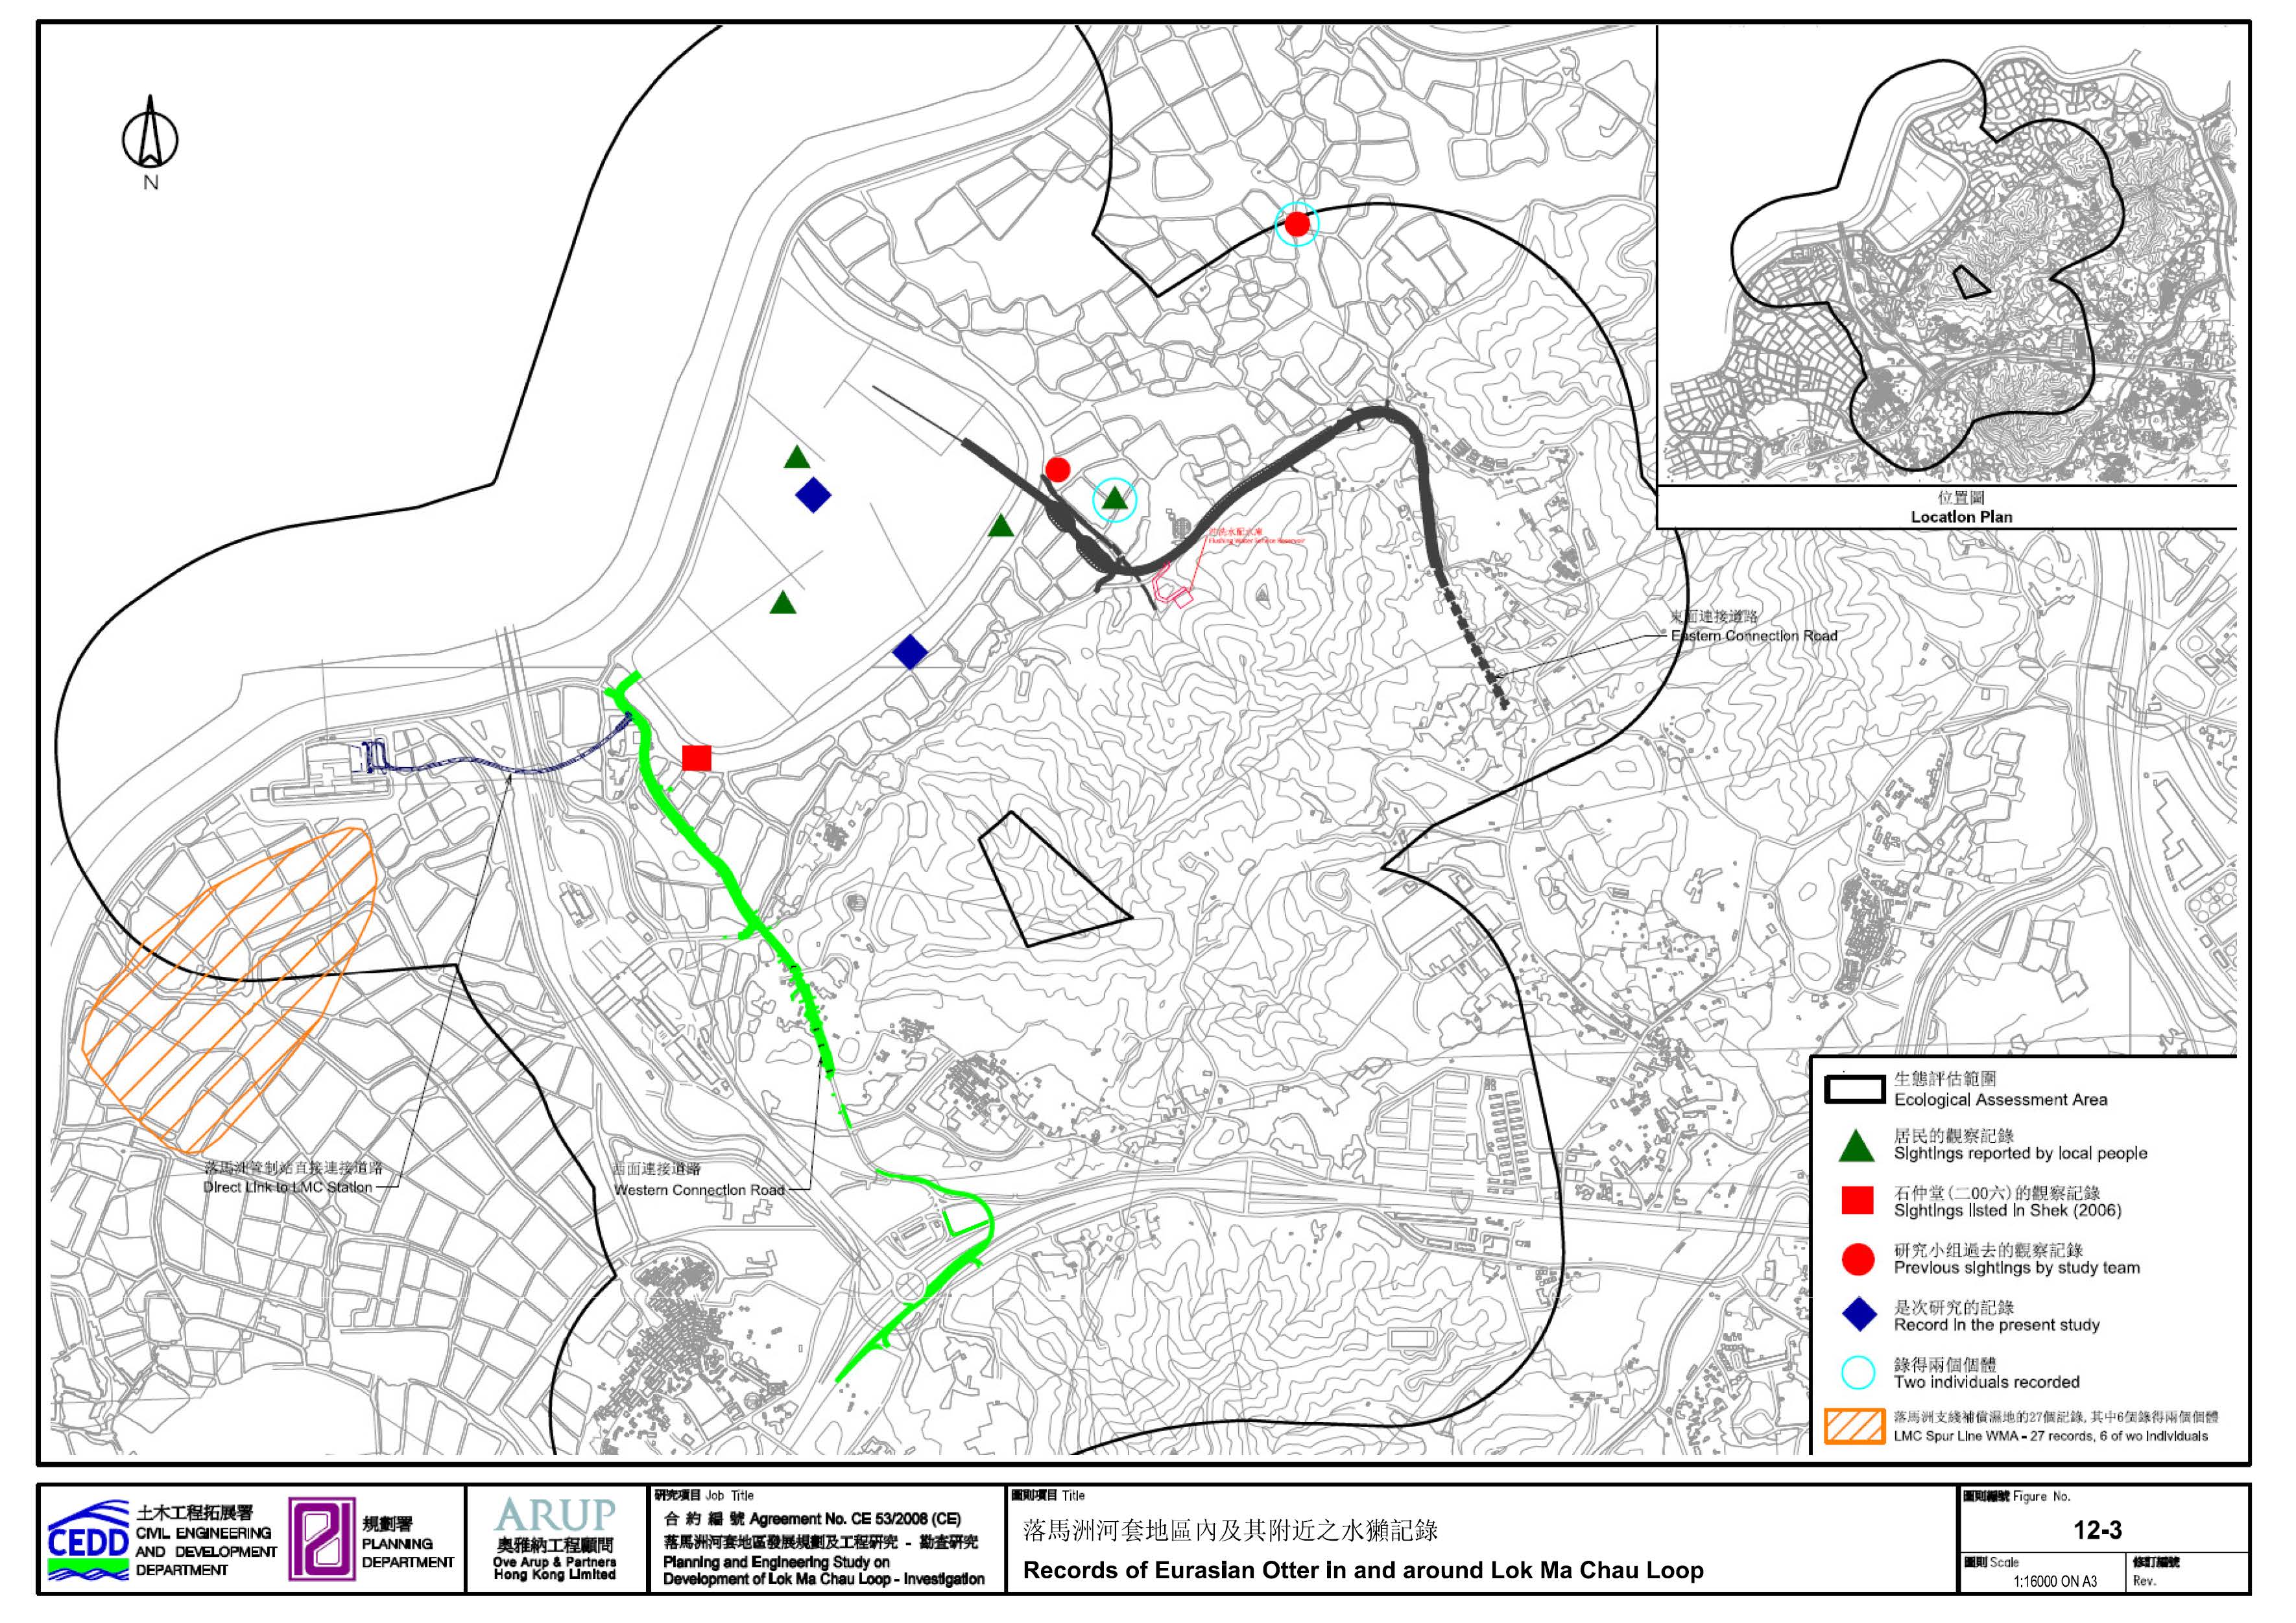
Figure 12.3 Records of Eurasian Otter in and around Lok Ma Chau Loop
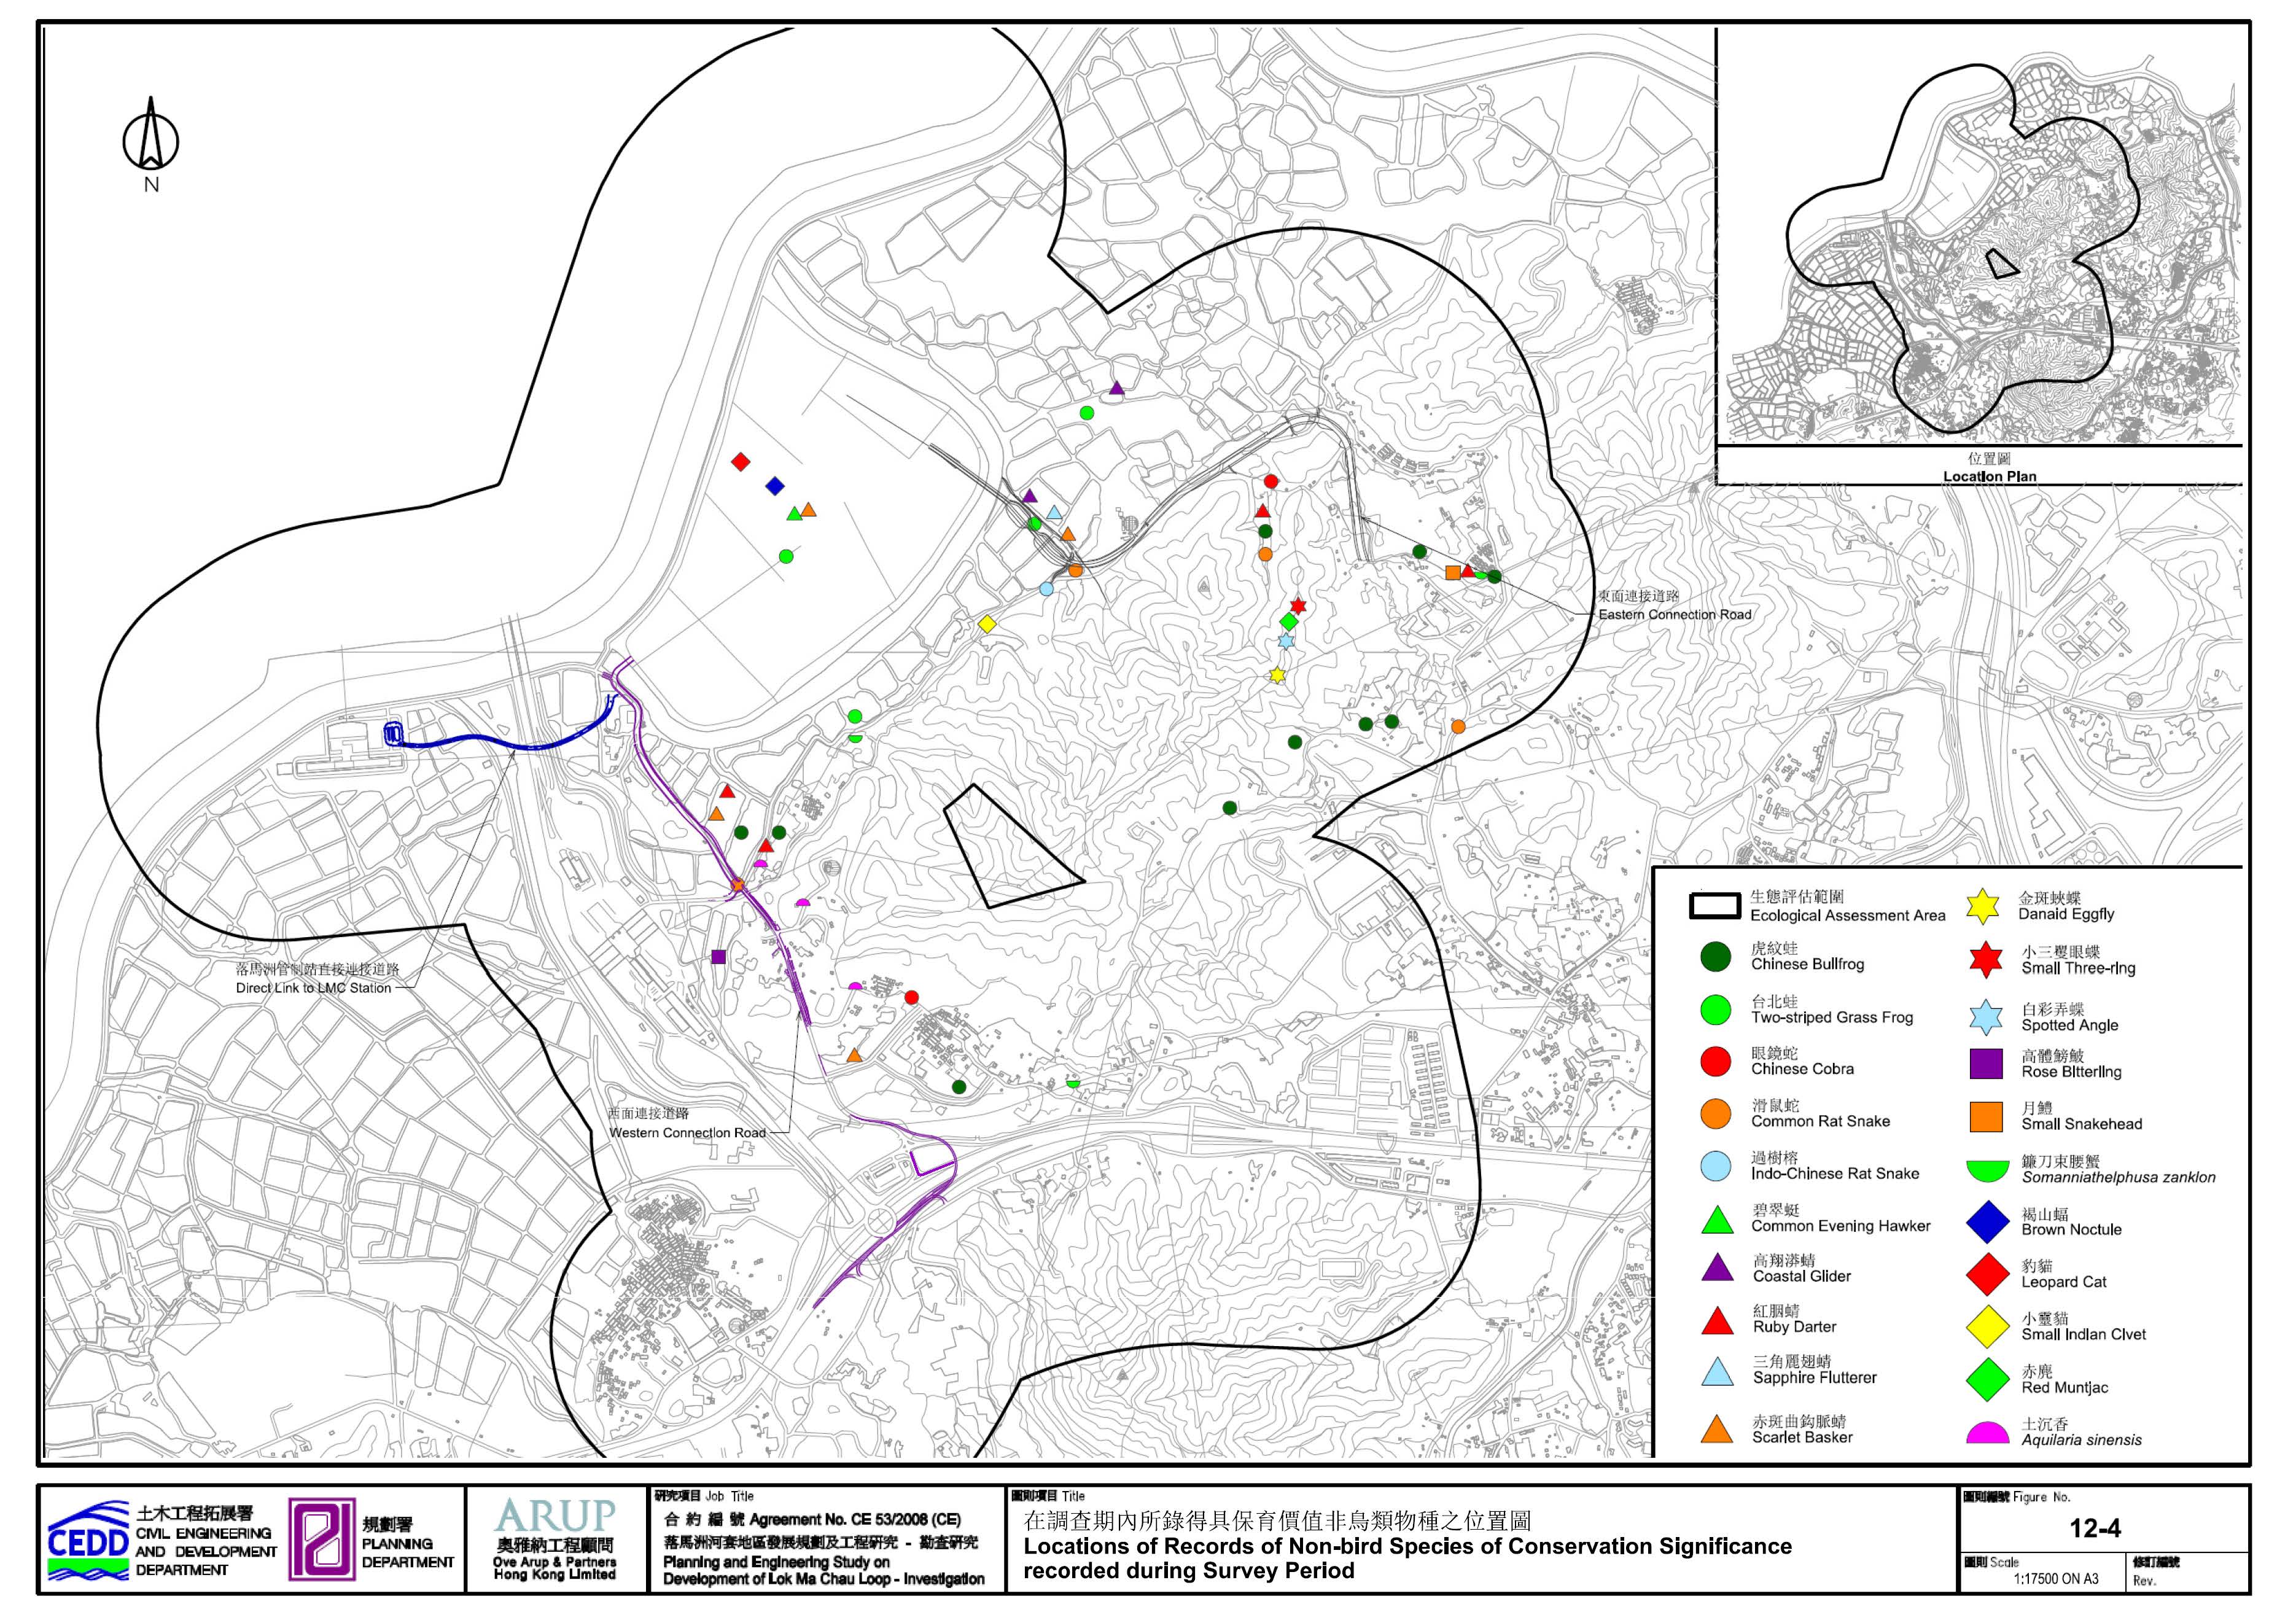
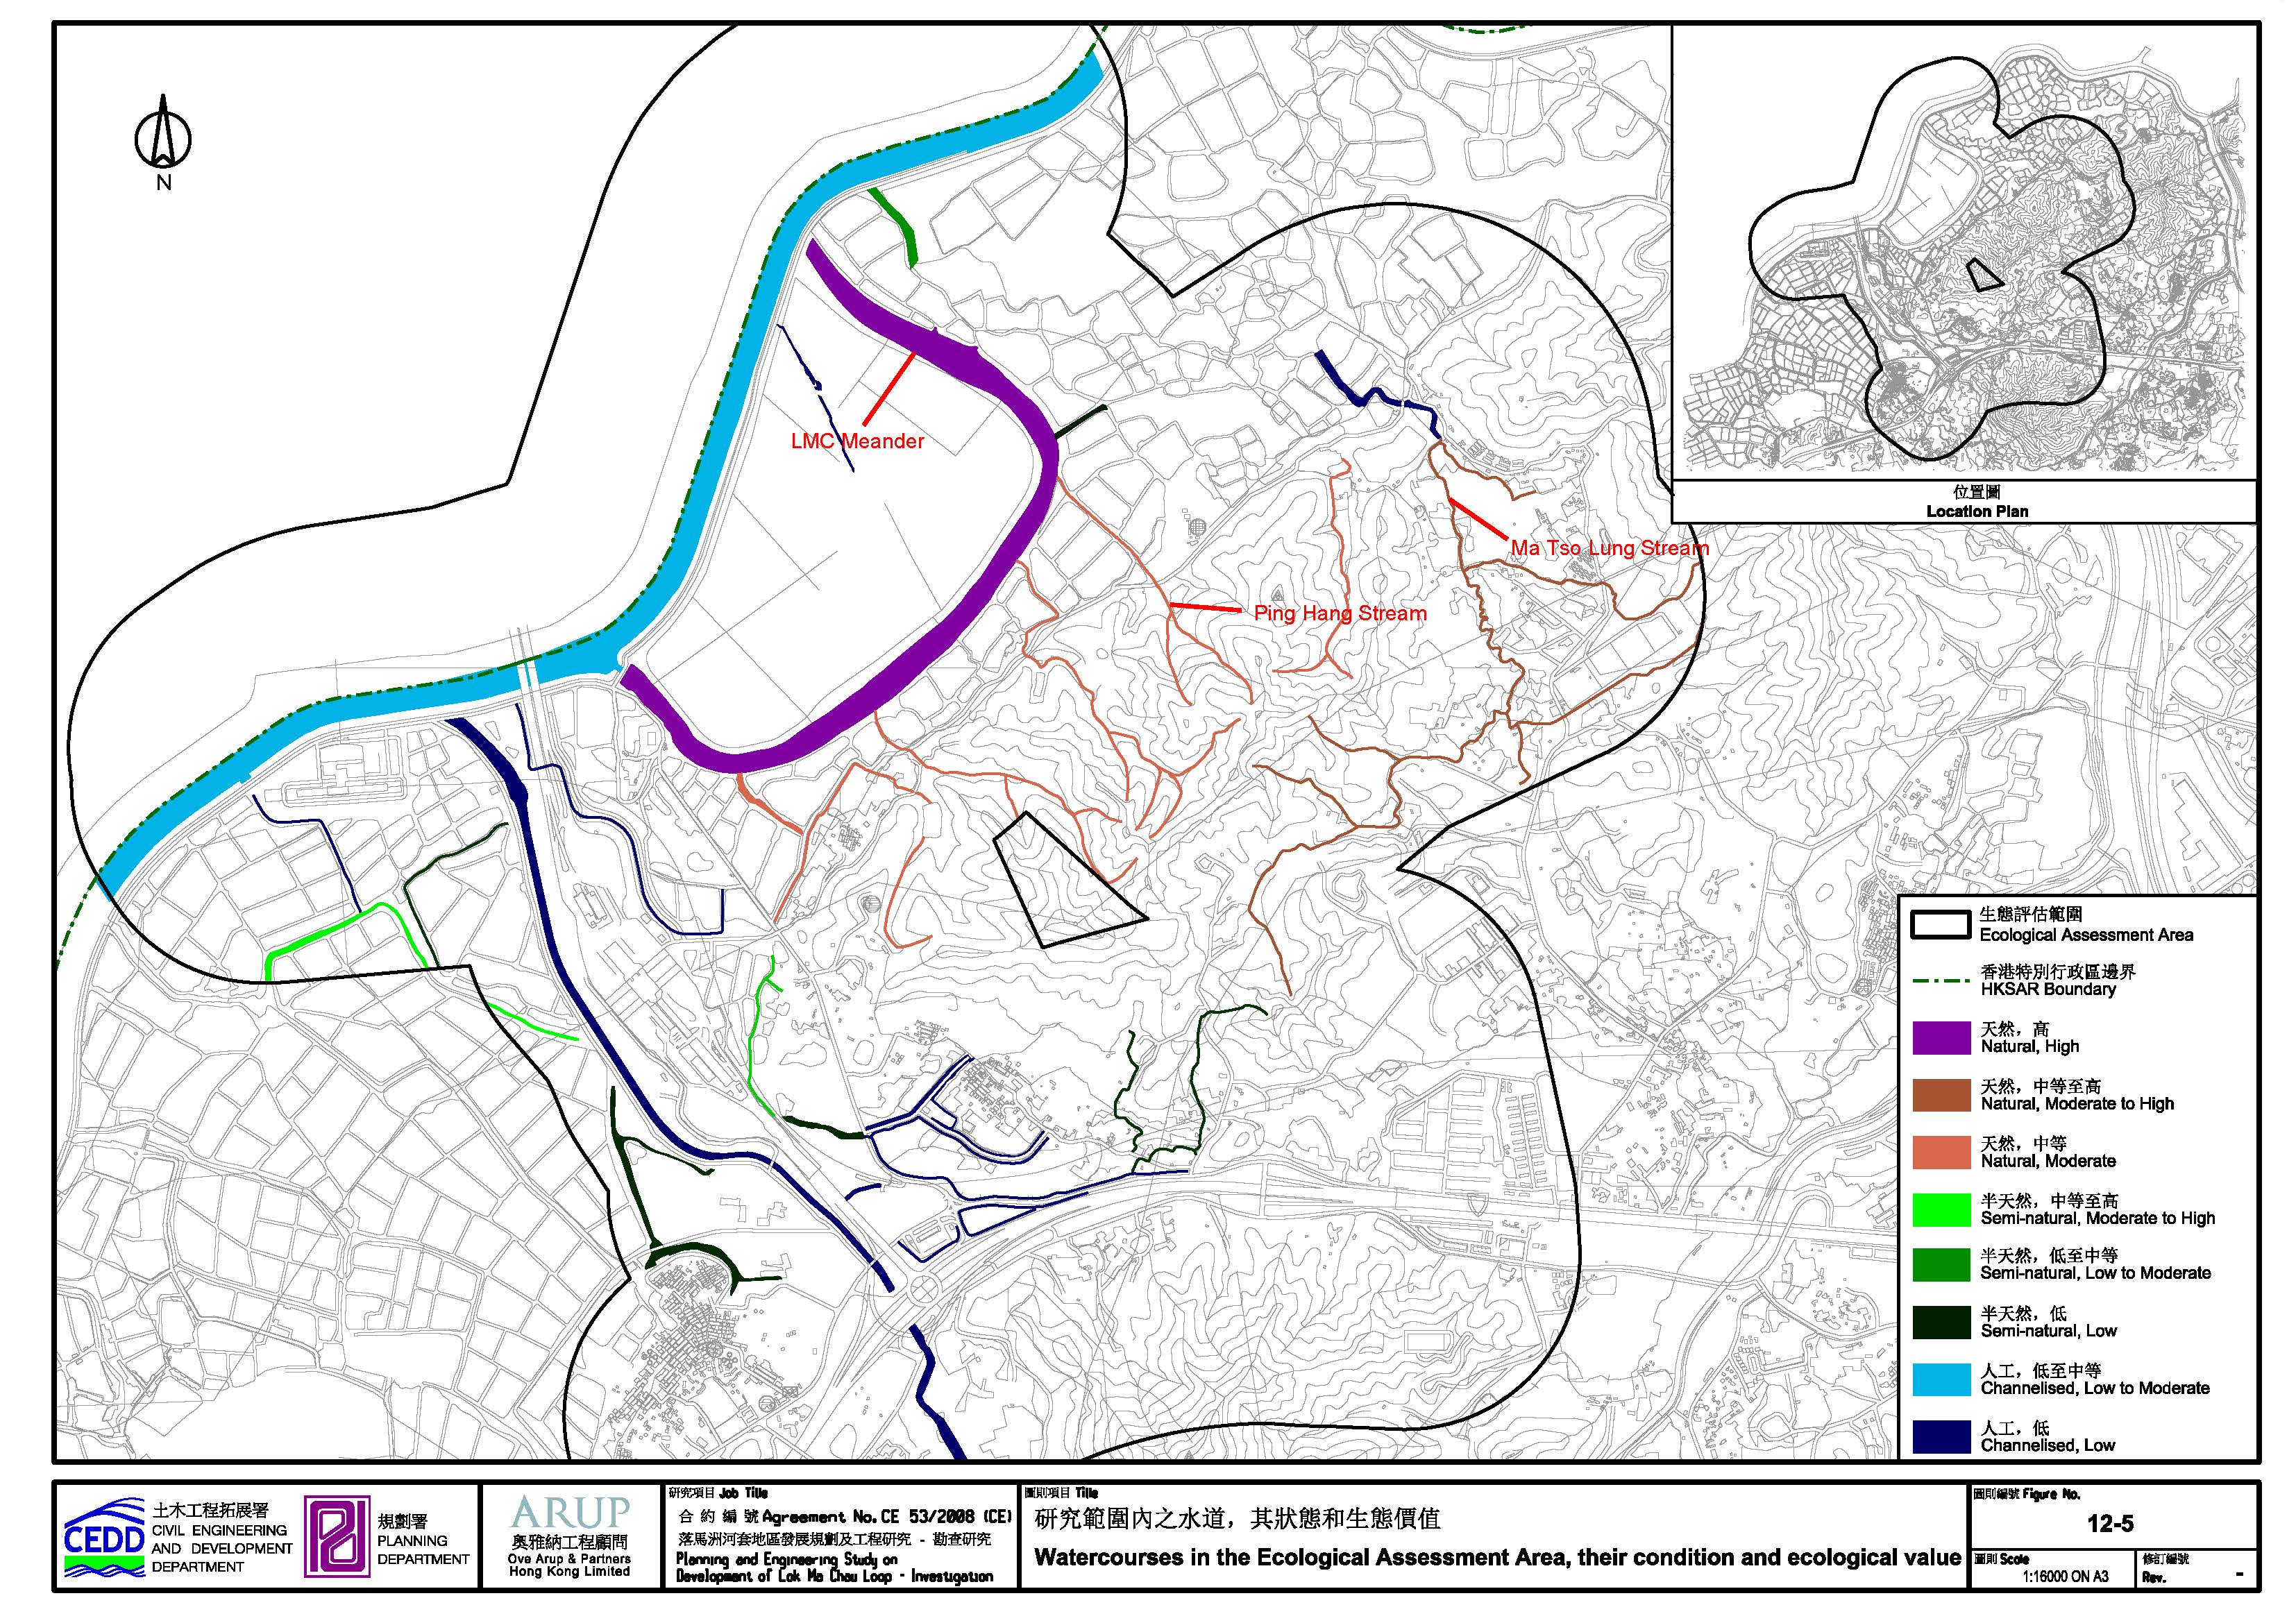
Figure 12.5 Watercourses in the Ecological Assessment Area, their condition and ecological value
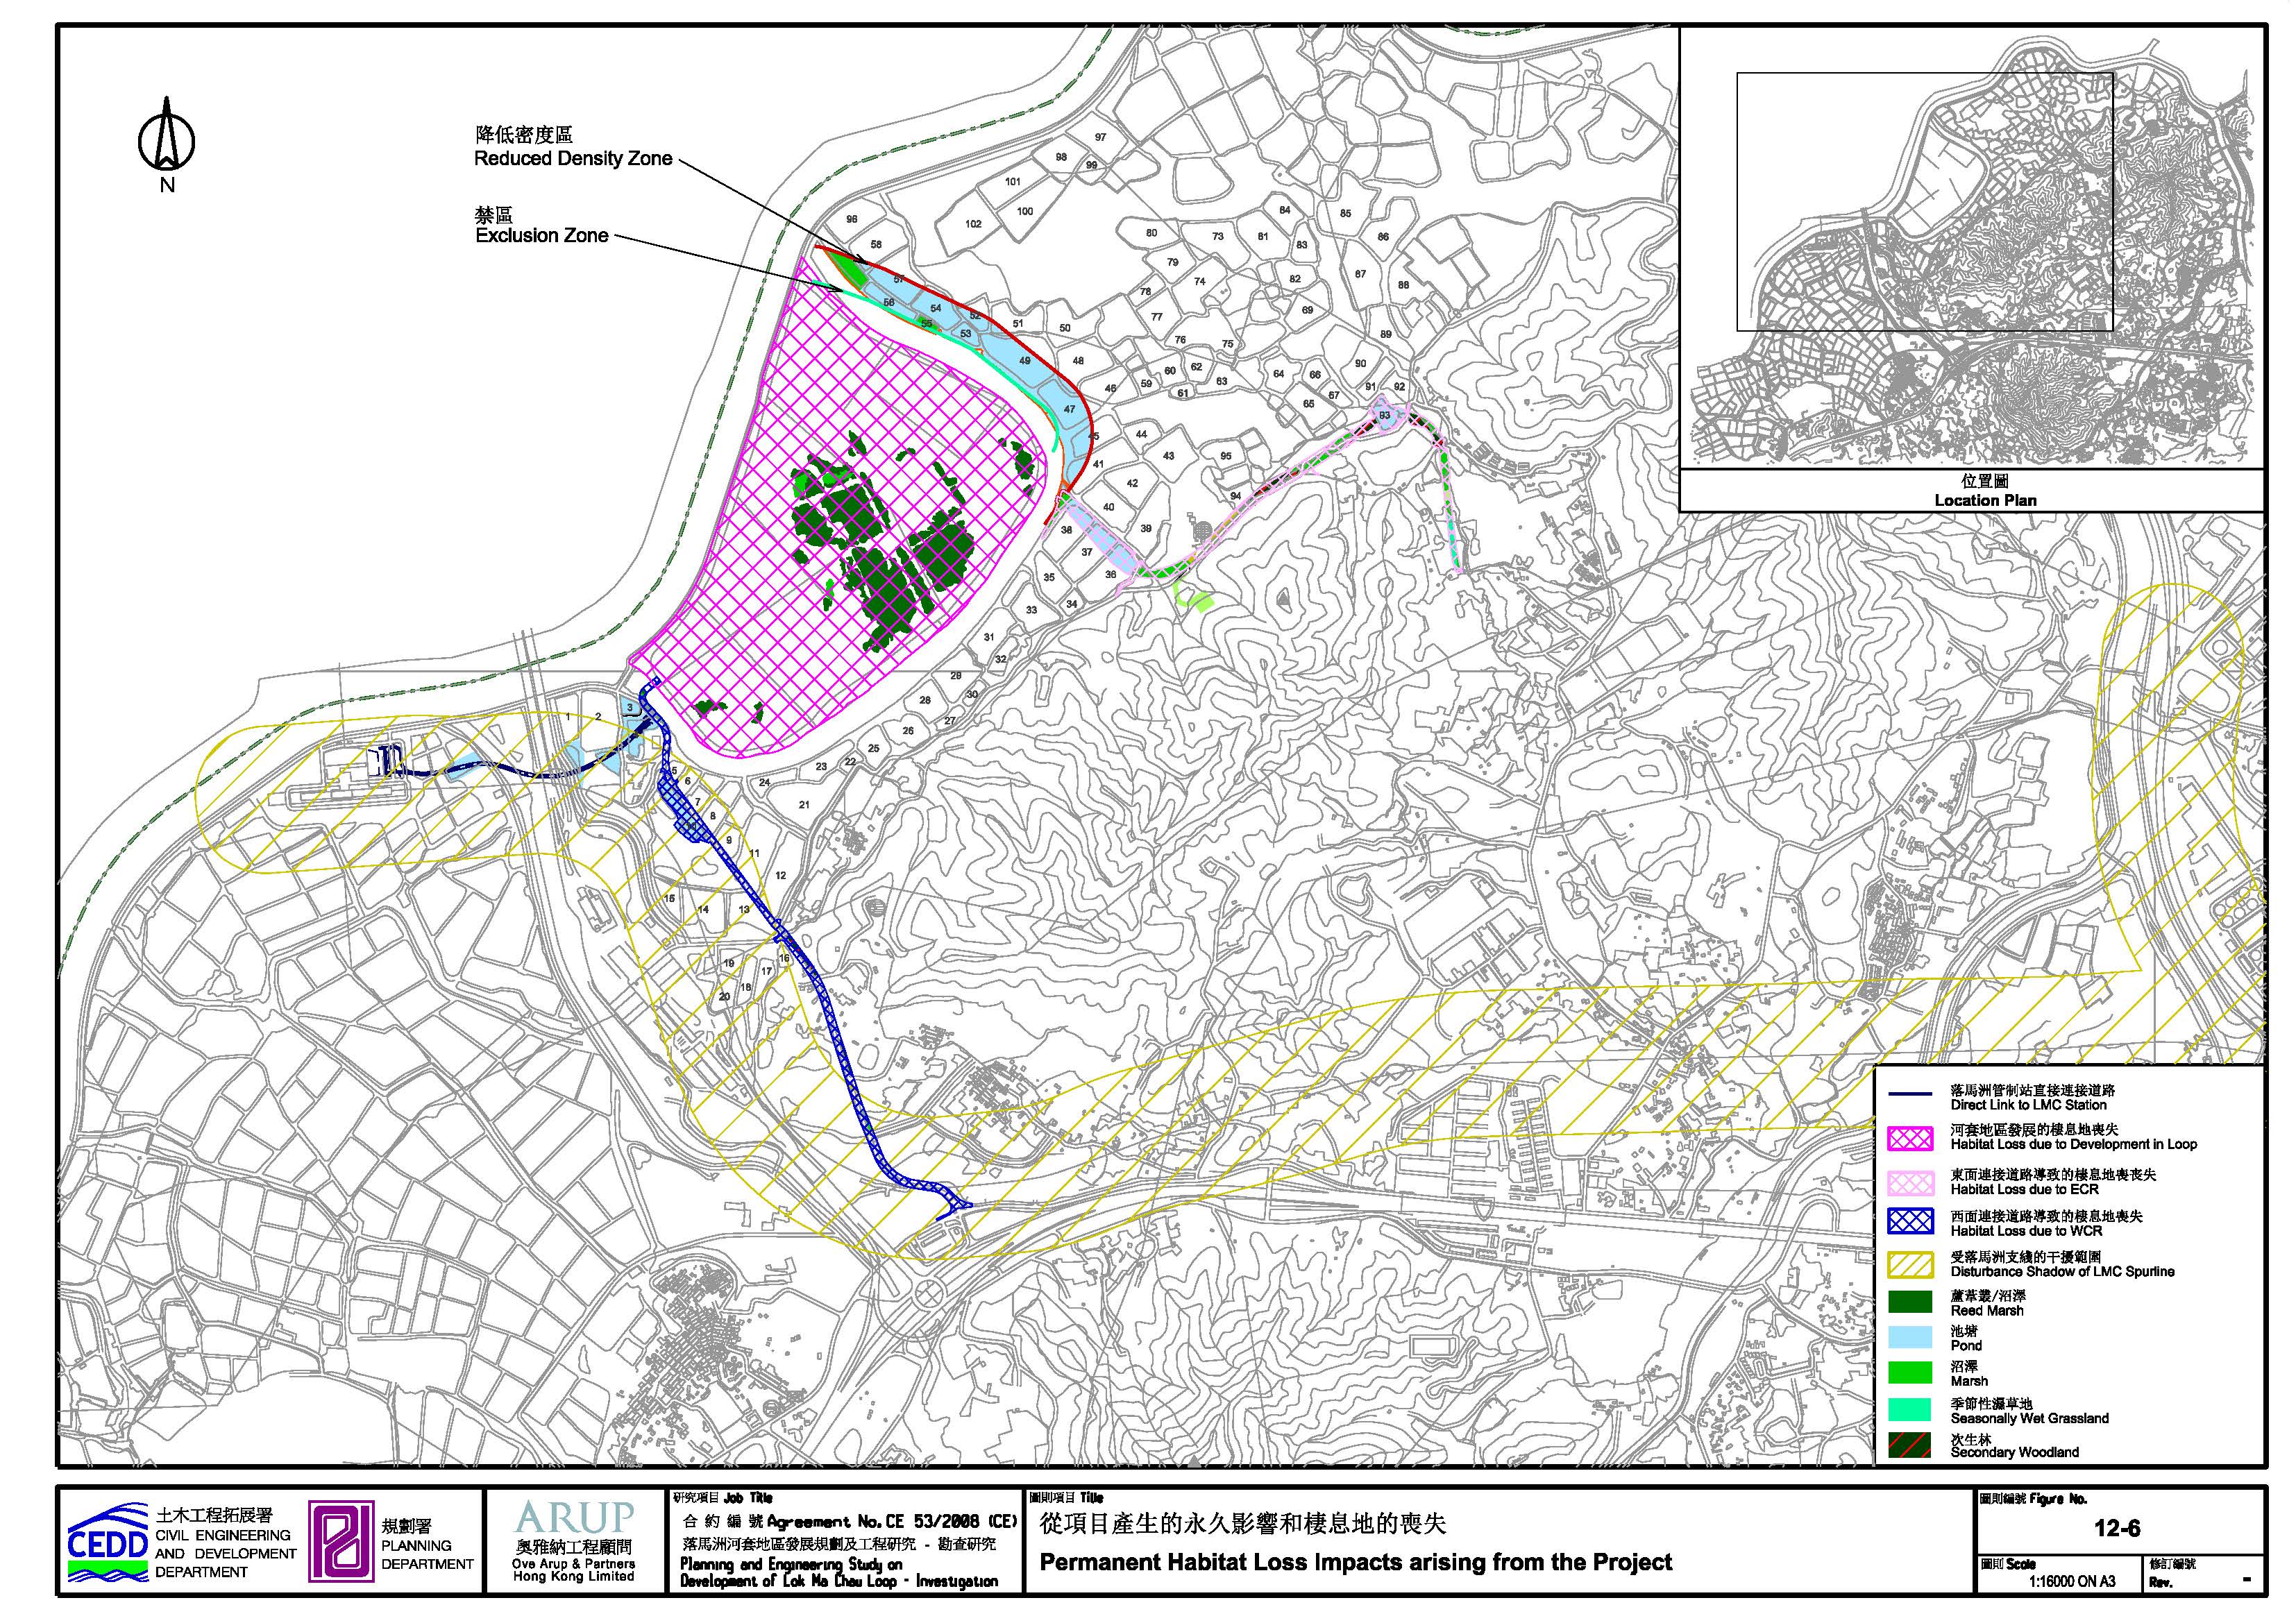
Figure 12.6 Permanent Habitat Loss Impacts arising from the Project
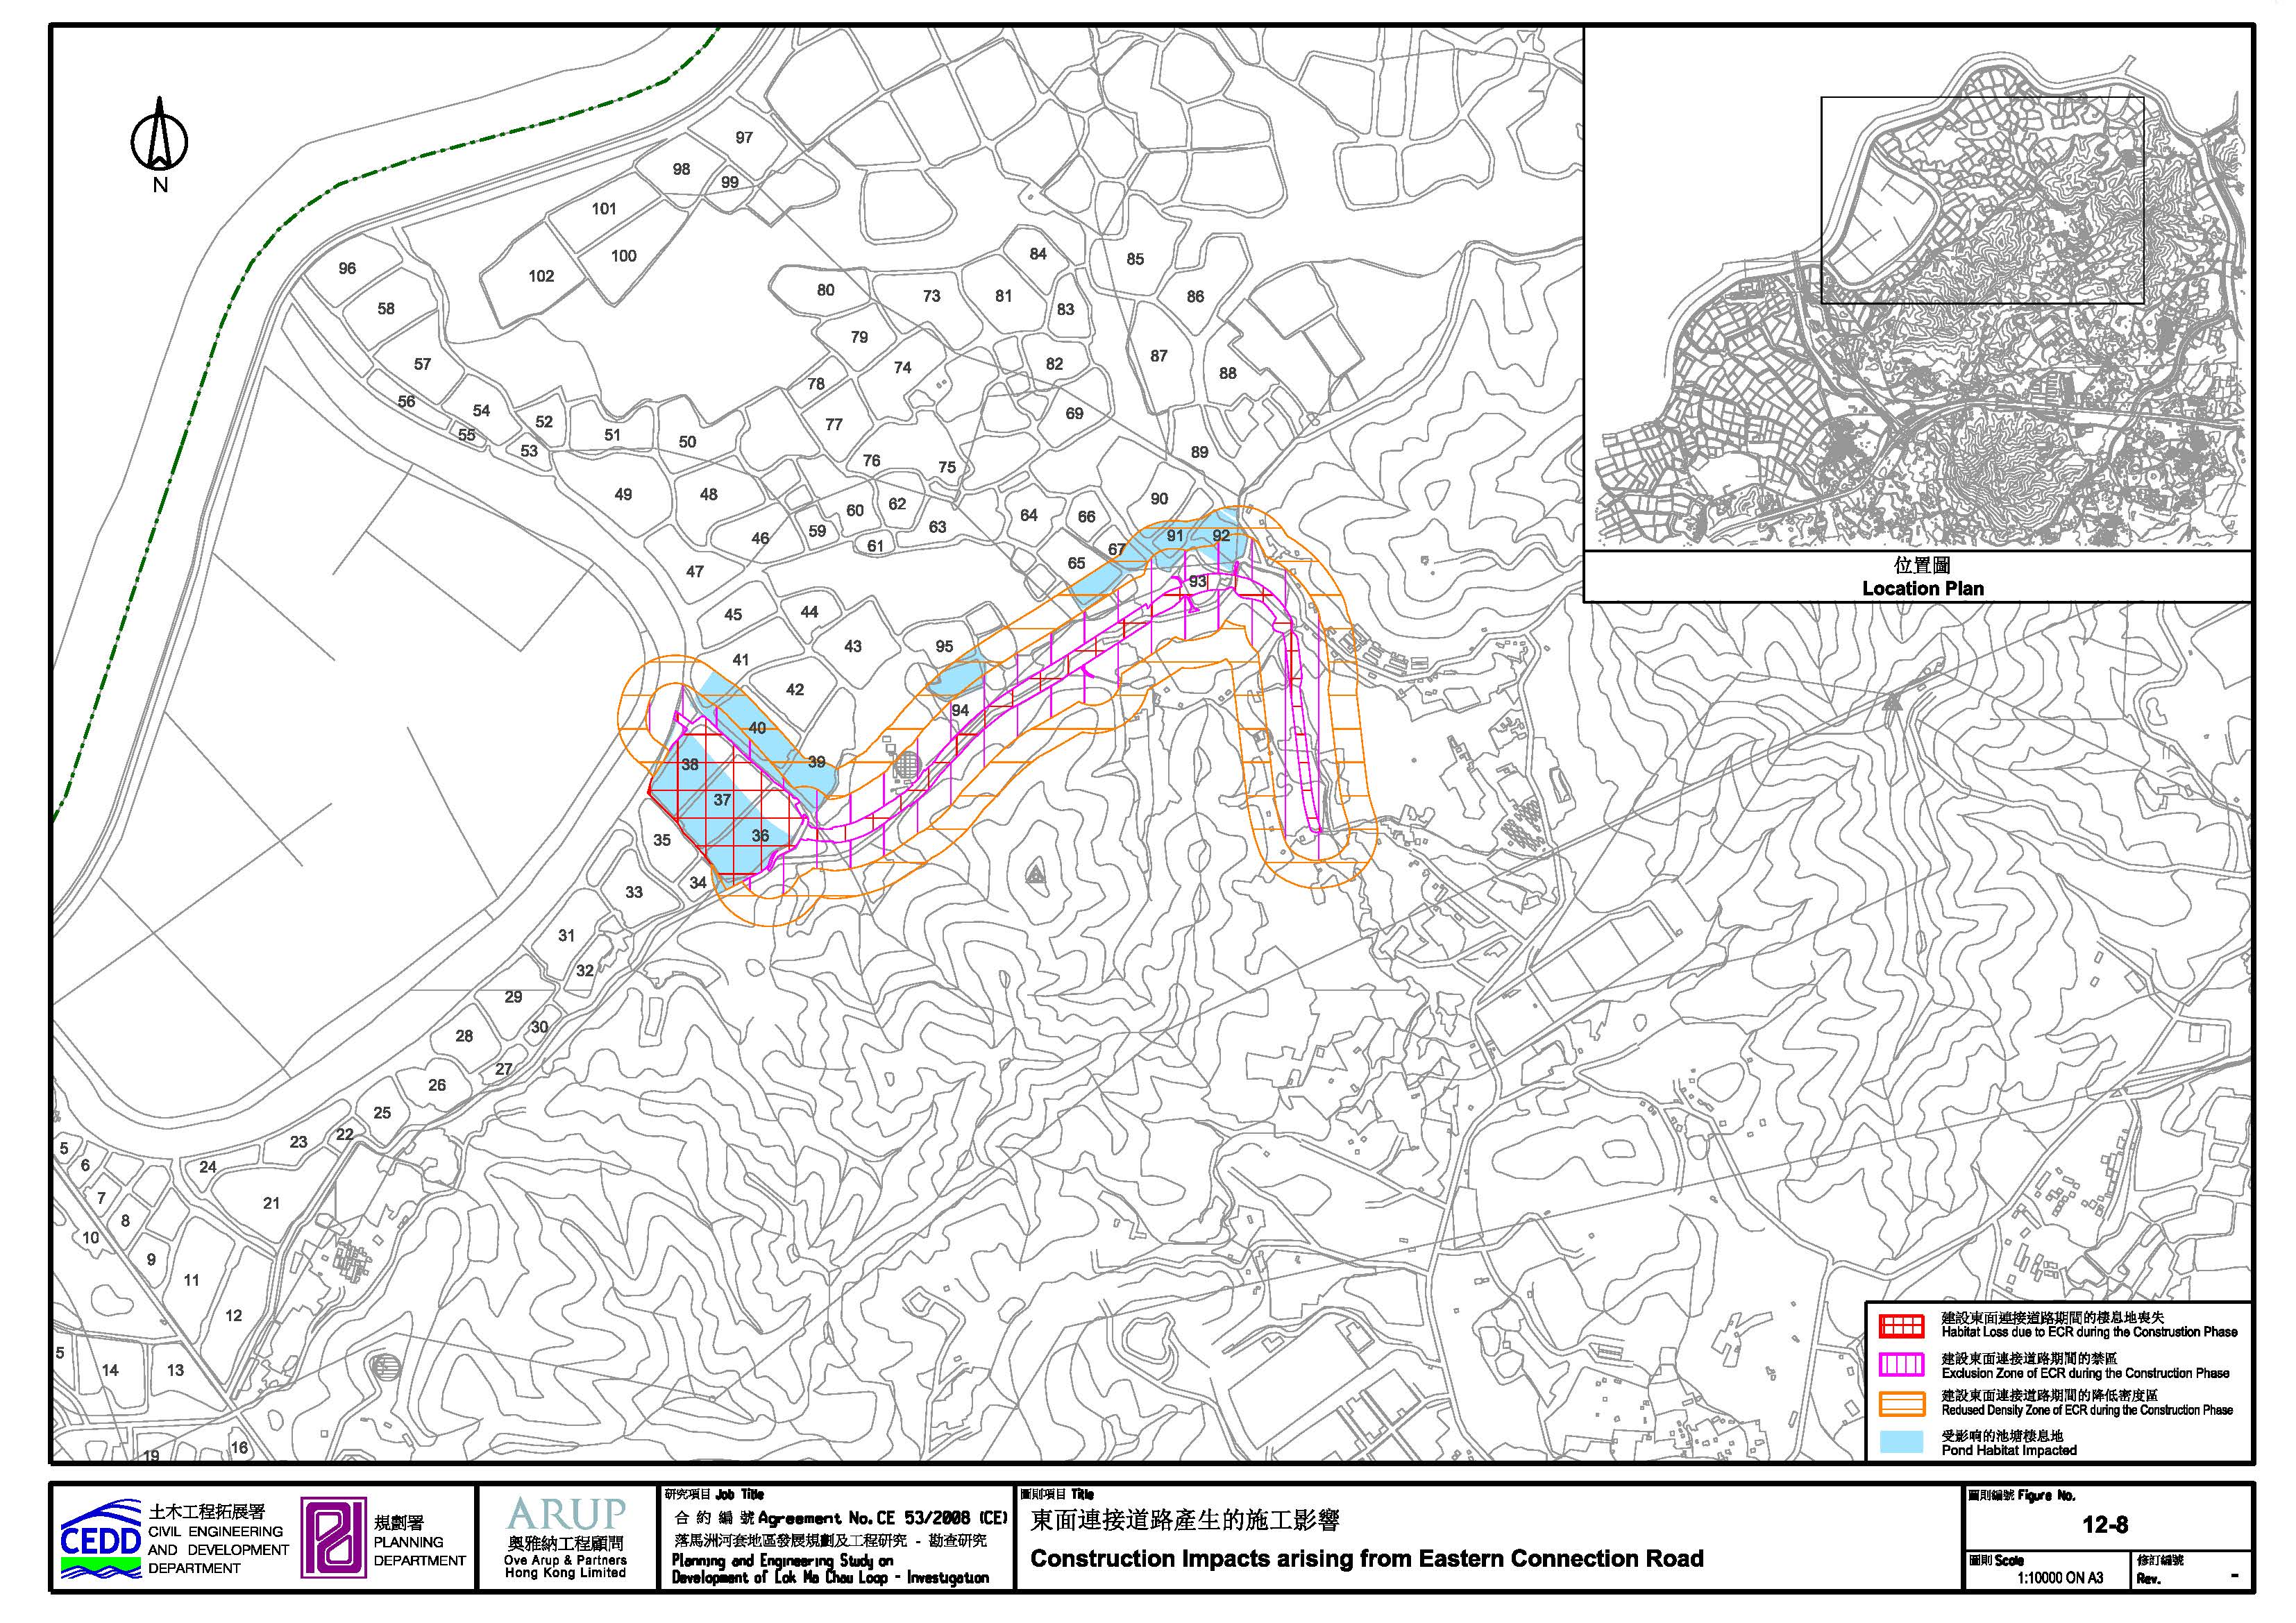
Figure 12.8 Construction Impacts arising from Eastern Connection Road
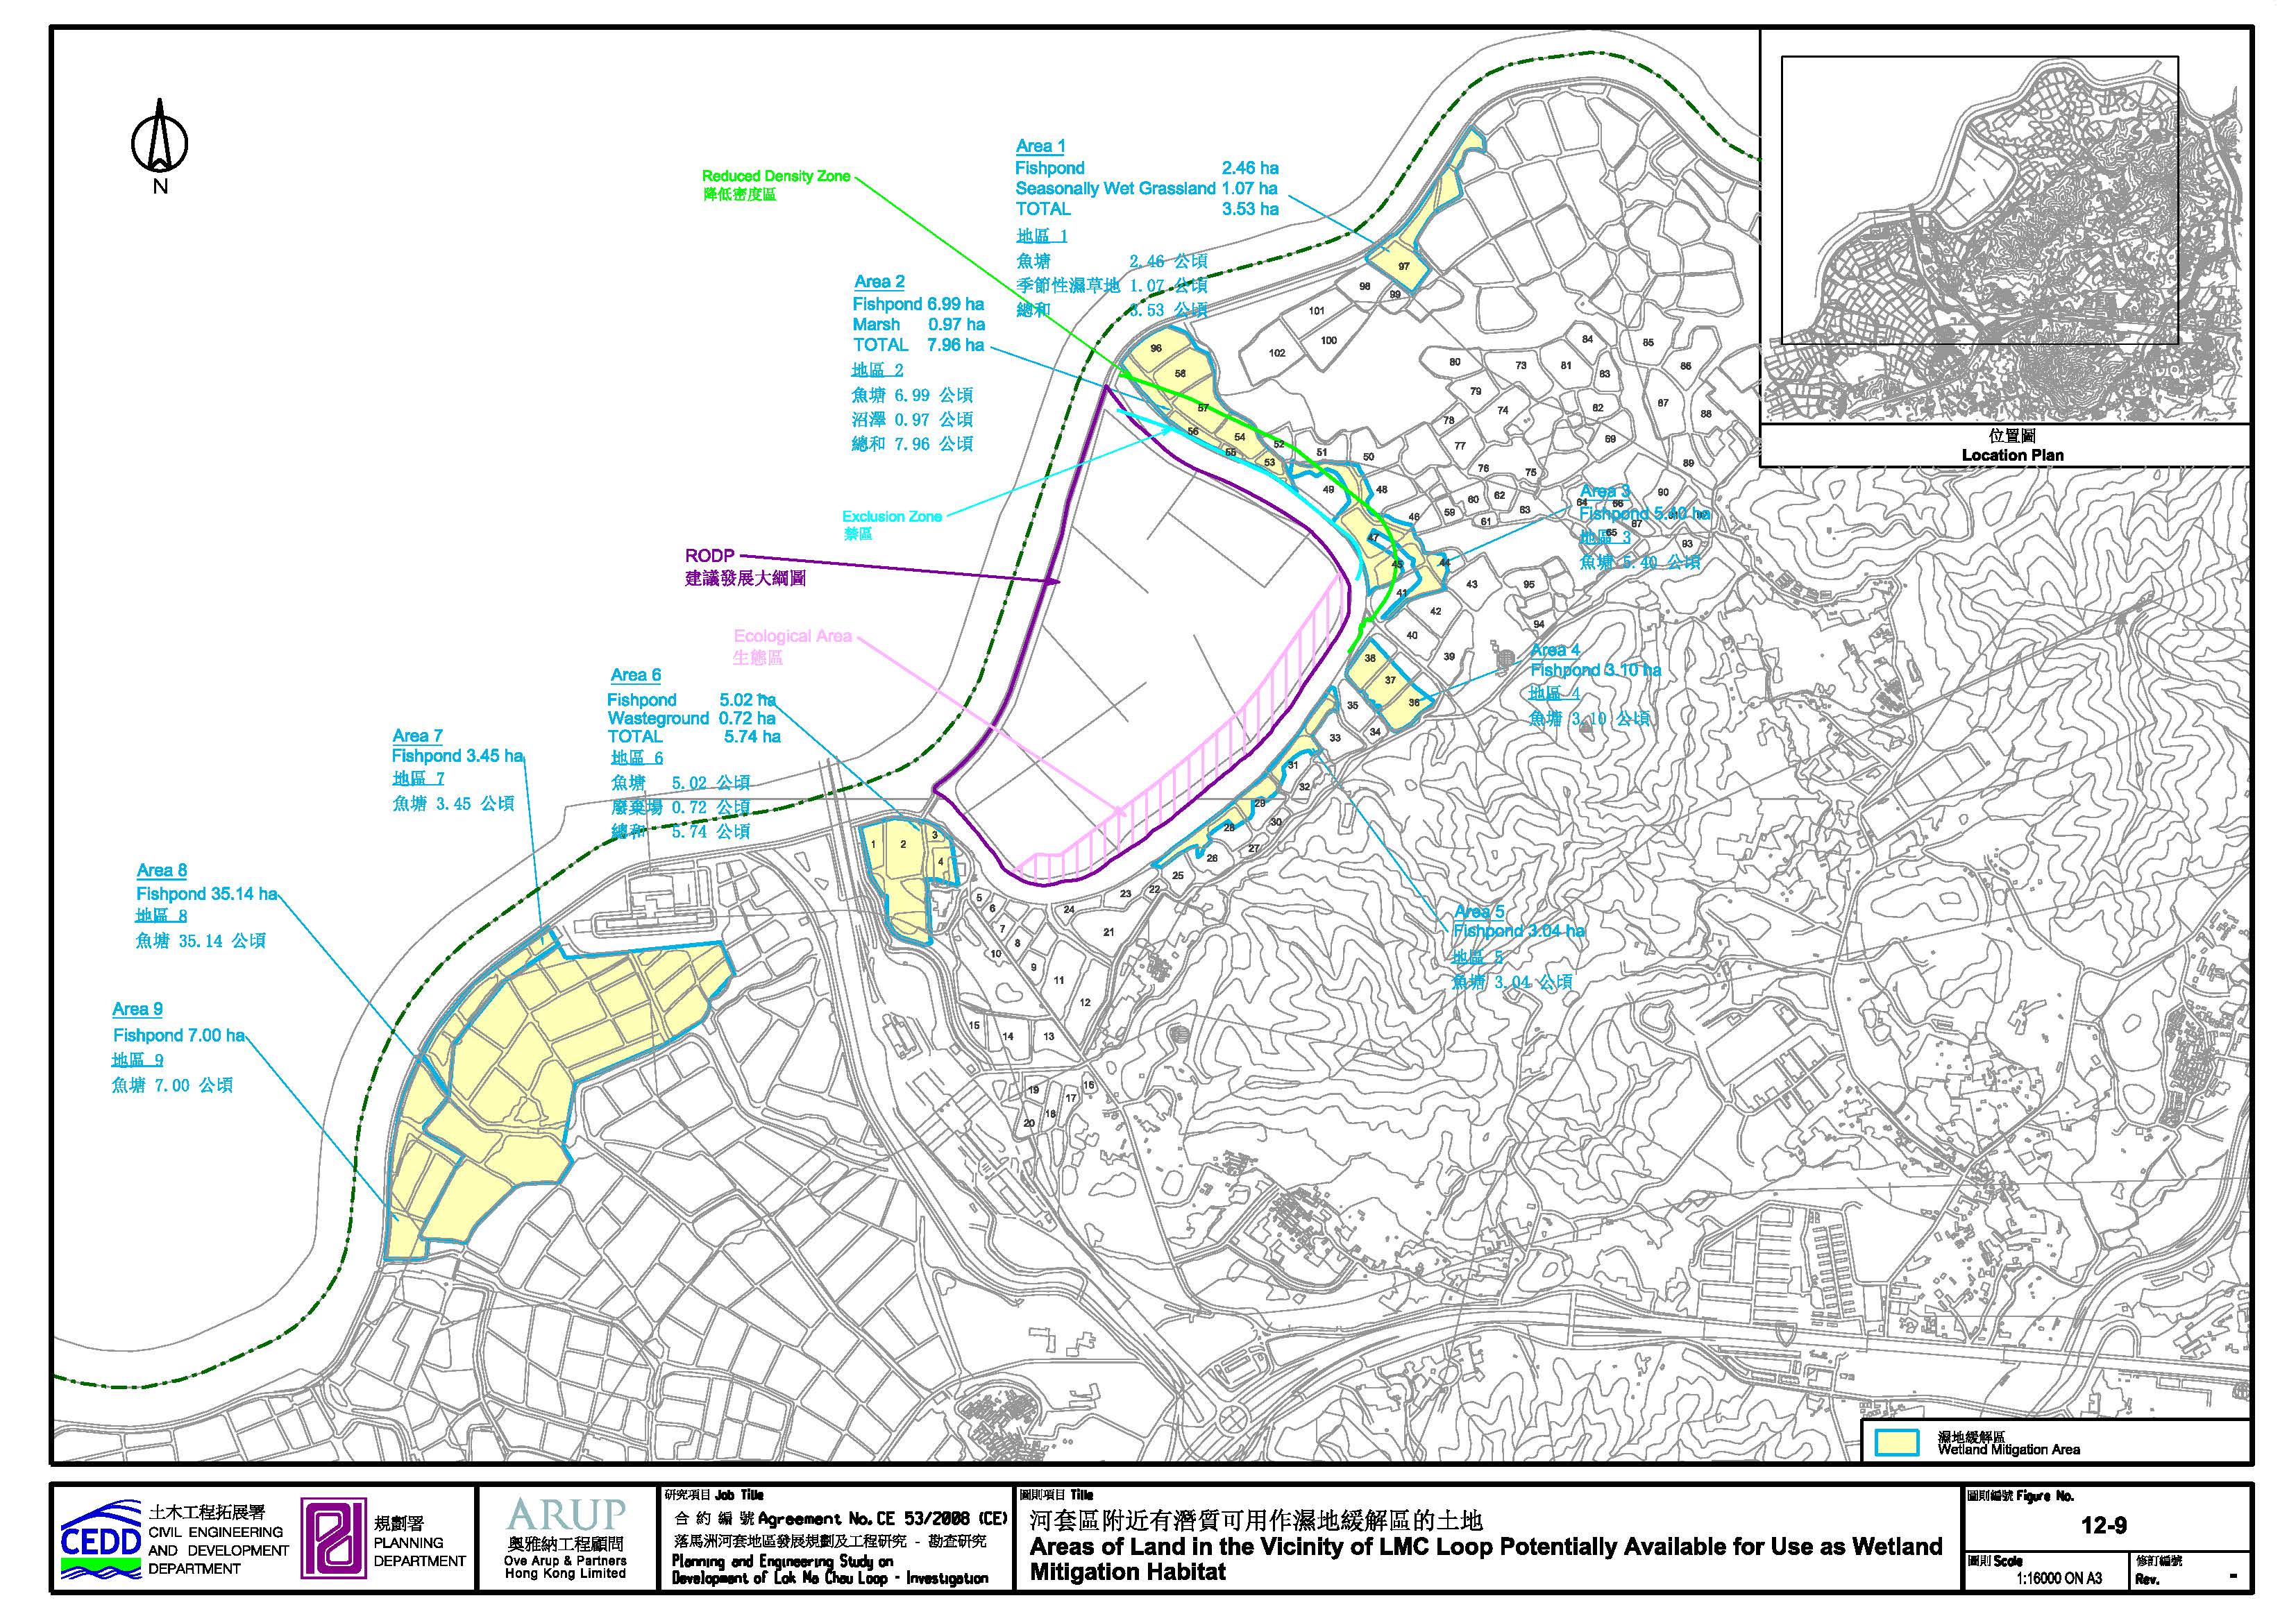
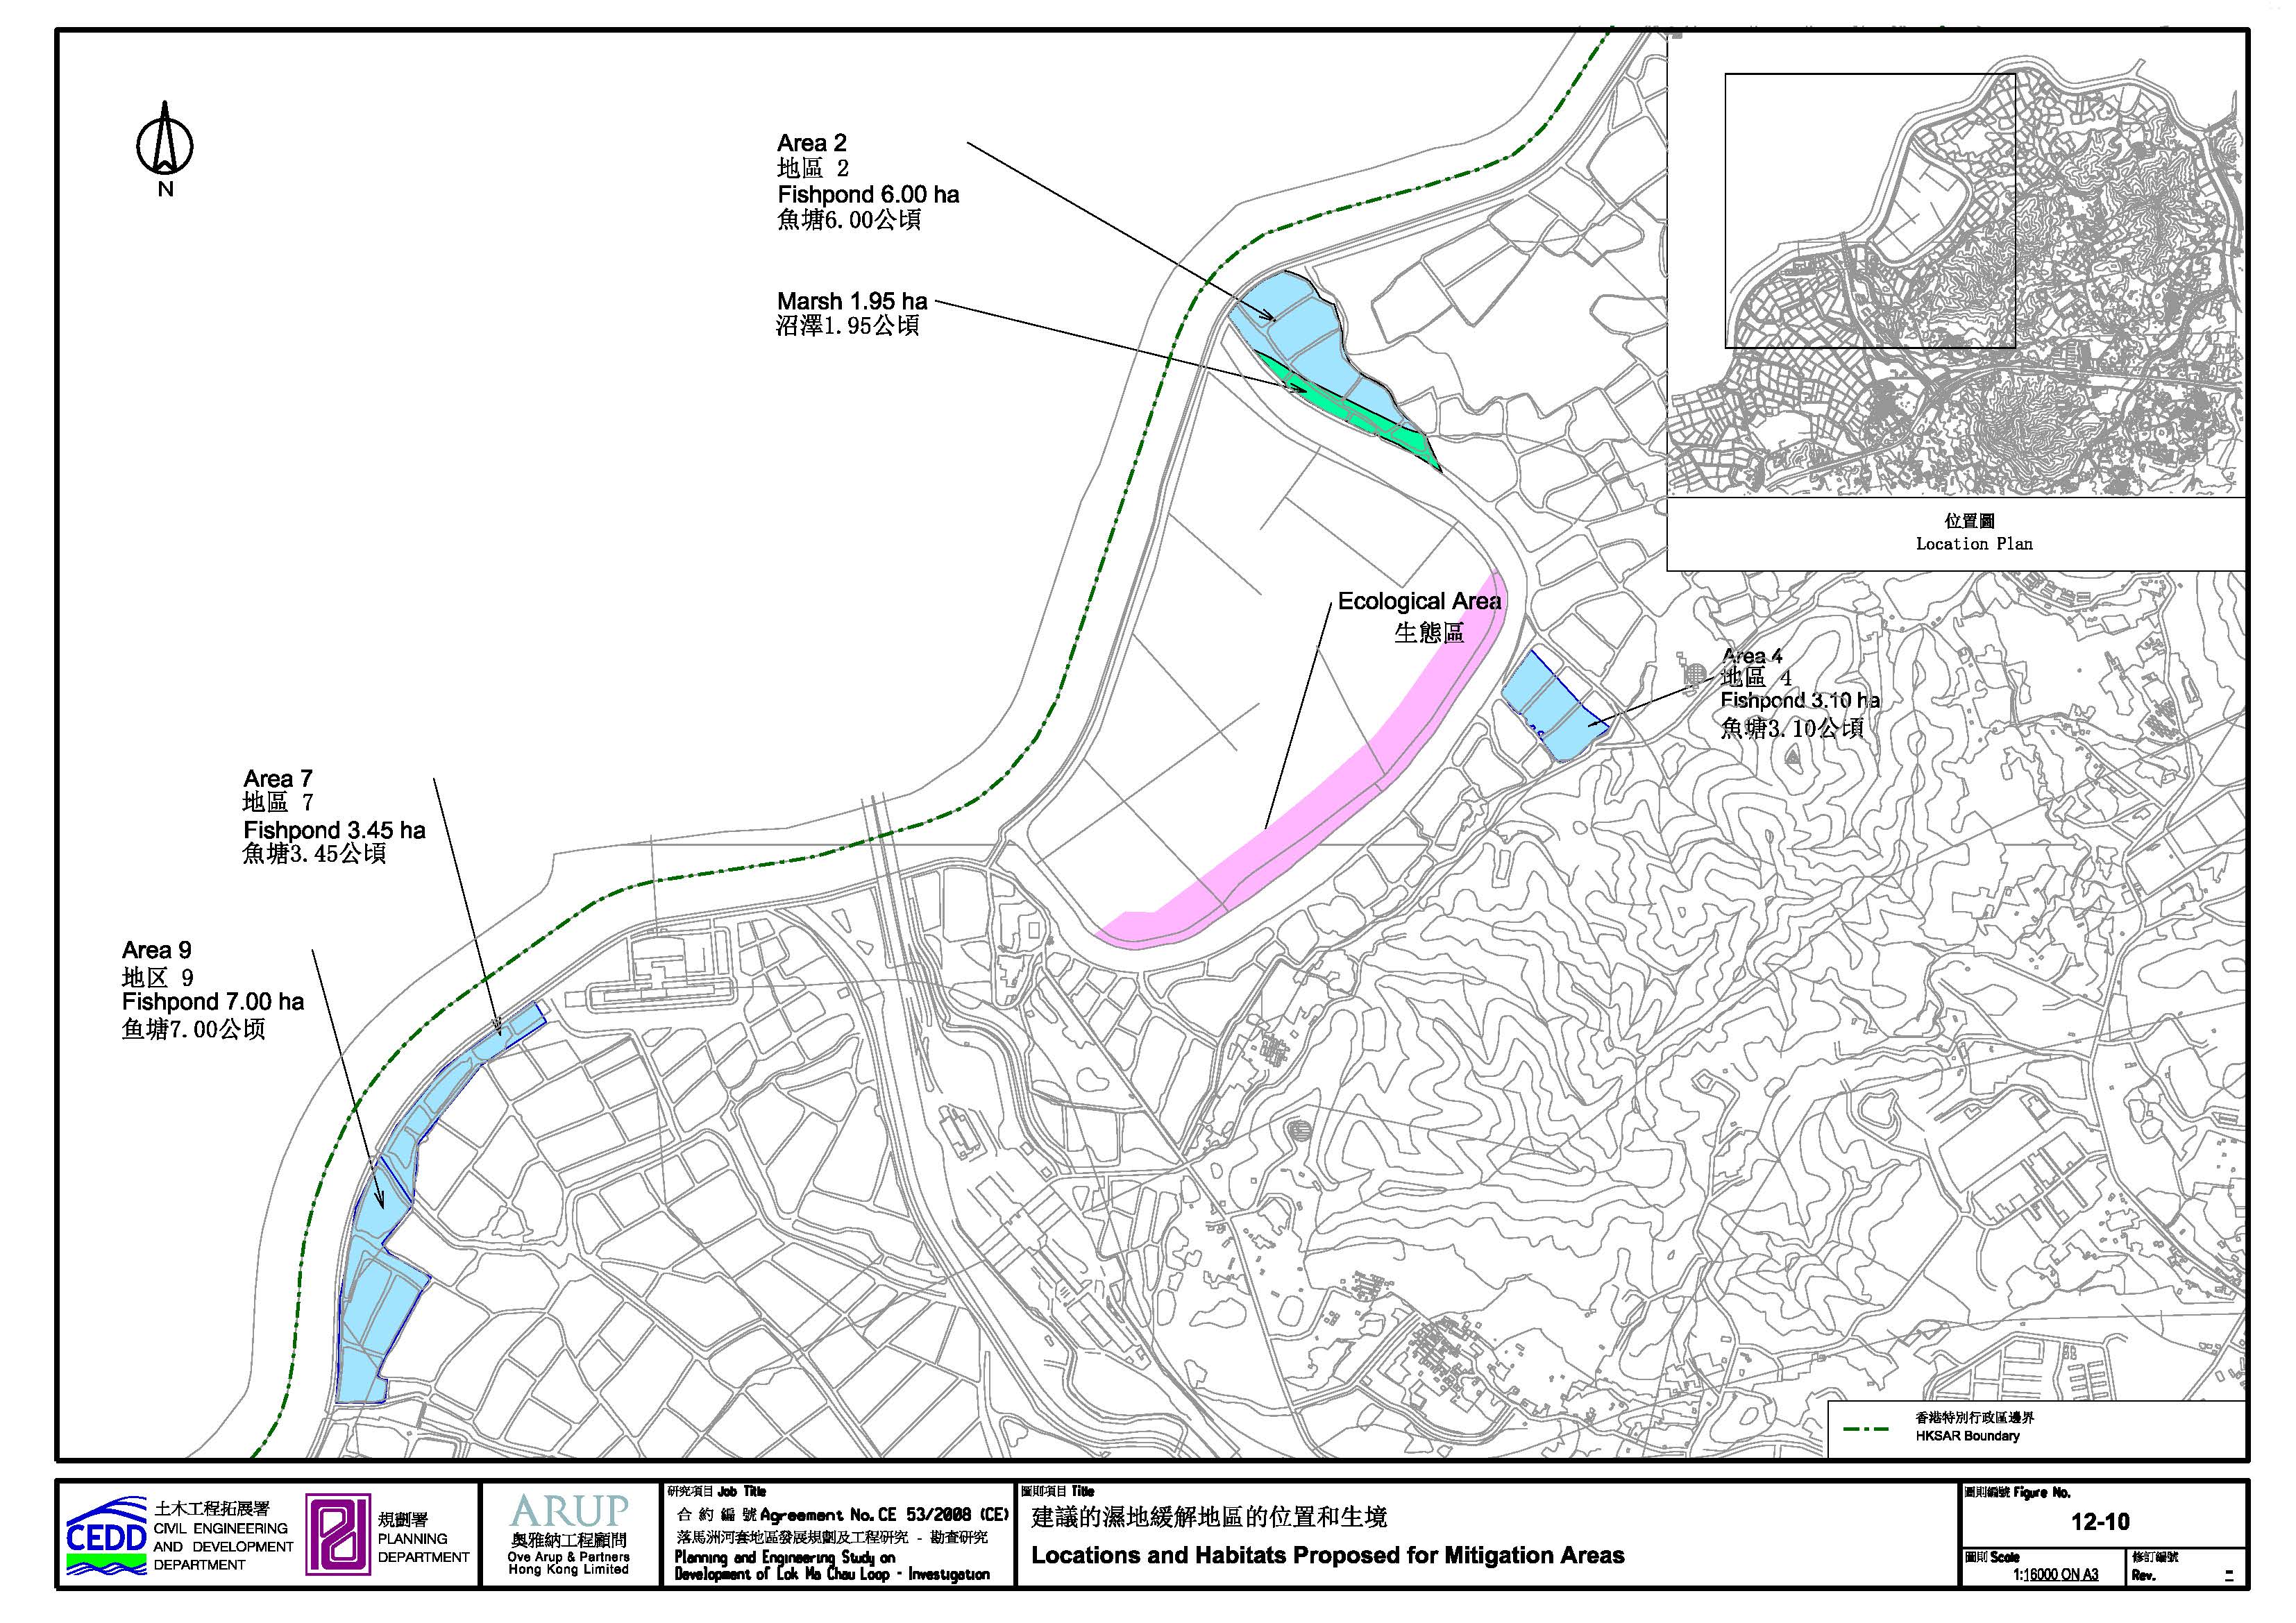
Figure 12.10 Locations and Habitats Proposed for Mitigation Areas
Figure 12.12 Proposed
Location of Secondary Woodland Compensation
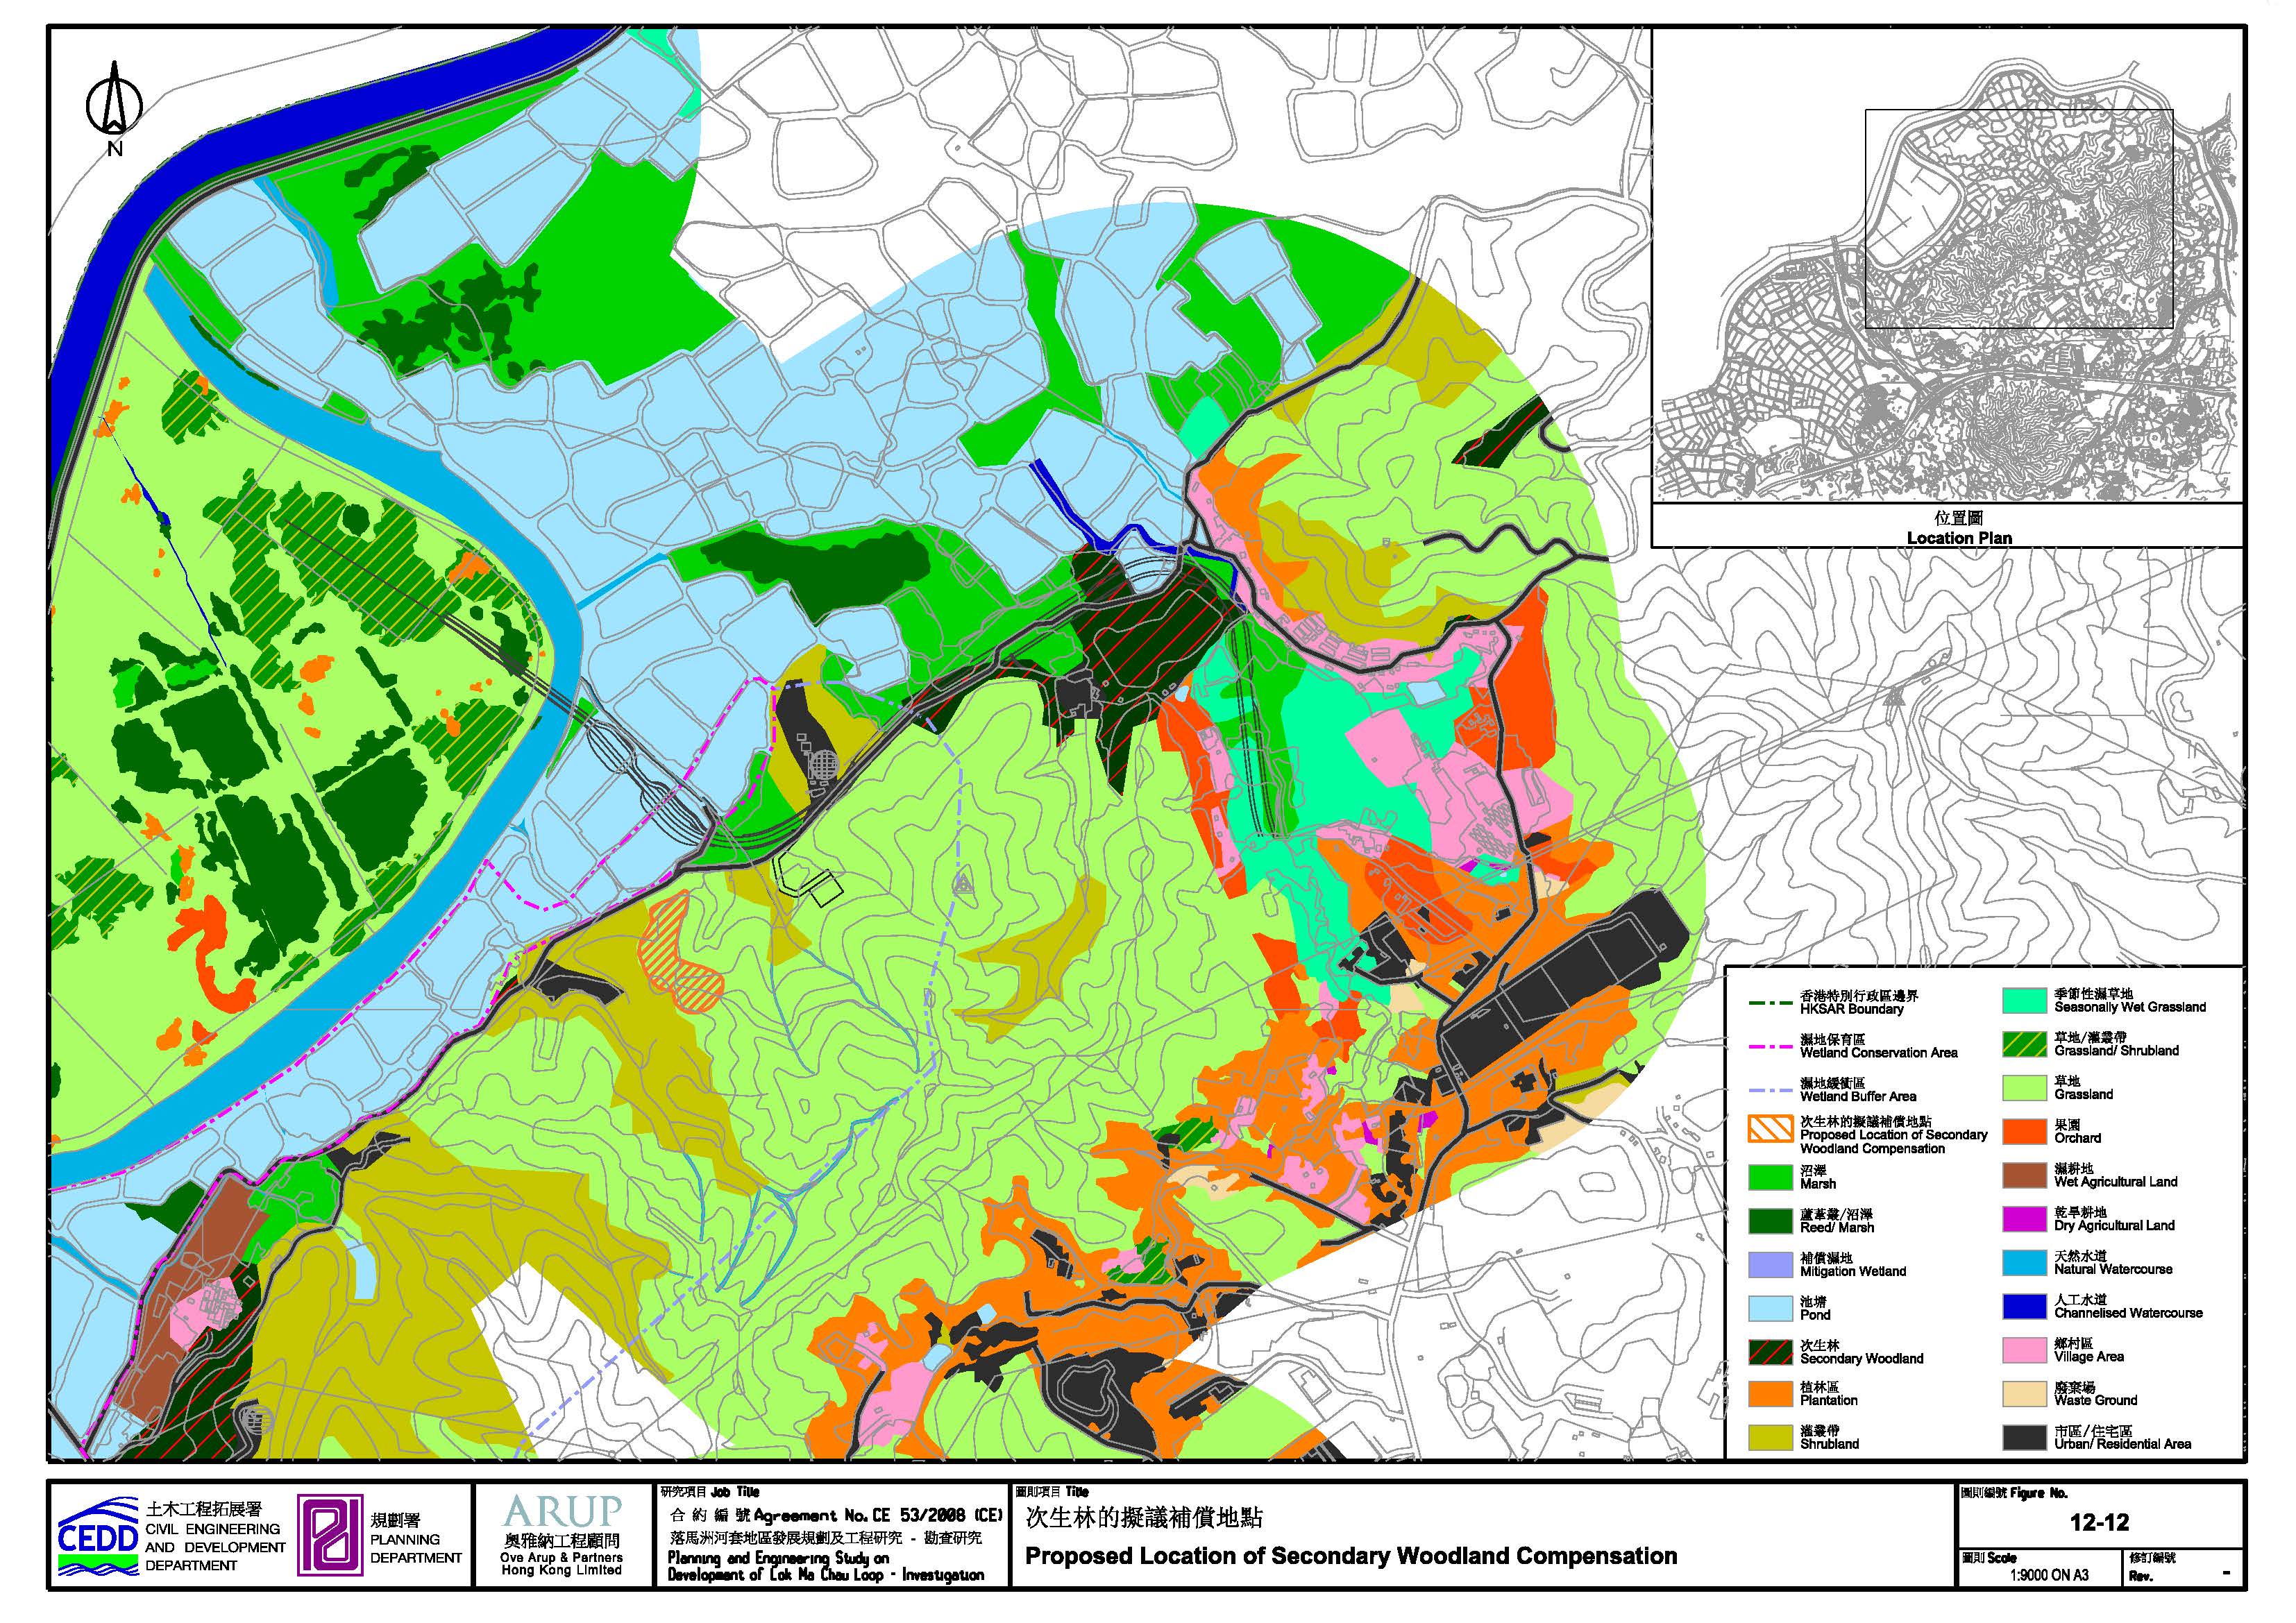
Figure 13.1 Findings of Fishpond Survey within Lok Ma Chau Loop and Its Vicinity
Figure 14.1 Location of Ma Tso Lung Landfill
Tables
Table
1.1 Schedule 2 designated projects in
LMC Loop development
Table
2.1 Summary of considerations of the 3
layout options
Table
2.1a Comparison of GFA for various
existing universities and R&D/C&C developments
Table
2.2 Major public views from the public
engagement in 2011 and responses
Table
2.3 Overall GFA by land uses (including
internal roads and local open space)
Table
2.5 Green initiatives in district and
building levels
Table
2.7 Other projects related to LMC Loop
Development but under separate studies
Table
2.8 Summary of tentative implementation
programme
Table
2.9 Evaluation of cumulative impacts due
to concurrent projects in HKSAR
Table 3.1 Hong
Kong Air Quality Objectives
Table 3.2
District-average air quality monitoring data
Table 3.3
Existing ASRs identified within 500m from the boundary of the Project
Table 3.4
Planned ASRs identified within 500m from the boundary of the Project
Table 3.5
Summary of heavy construction works
Table 3.6
Modelling parameters
Table 3.7
References of dust emission factors for different construction activities
Table 3.8: The
emission percentage and the amount of NOx in Hong Kong (2011)
Table 3.9: The
emission percentage and the amount of RSP in Hong Kong (2011)
Table 3.9a NOx
and RSP emission factors for various types of vehicles
Table 3.10
Conversion factors for hourly average to 5-sec average of odour concentration
Table 3.11
Summary of base emission rates for proposed LMC STW
Table 3.12:
Comparison of Binhe WWTP and Shatin STW
Table 3.13
Summary of base emission rates for Binhe WWTP
Table 3.14
Summary of total daily air pollutant emissions for LMCL
Table 3.21:
Status of remediation for tributaries to Shenzhen River
Table 3.23
Comparison between different bioremediation projects/ study
Table 4.1
Noise standards for construction activities
Table 4.2
ANLs for construction during restricted hours
Table 4.3 ANLs for percussive piling
Table 4.4
Noise standards for operational phase
Table 4.5 ANLs for fixed noise sources
Table 4.5a
Major existing noise sources and its potential impacts
Table 4.5b
Planned noise sources and its potential impacts
Table 4.6
Prevailing noise measurements
Table 4.7
Existing NSRs identified within 300 metres from the boundary of the Project and
associated works
Table 4.9
Representative NSRs for construction noise assessment
Table 4.10
Representative NSRs for construction access road traffic noise
Table 4.11
Representative NSRs for operational noise assessment
Table 4.12
Utilisation rates of PME
Table 4.13
Predicted construction noise impact at NSRs under unmitigated scenario
Table
4.14a Summary of peak hour traffic flow data in 2016
Table
4.14b Summary of peak hour traffic flow data in 2020
Table 4.16
Summary of peak hour traffic flow data in 2042
Table 4.20
Summary of noise criteria at NSRs for fixed noise sources
Table 4.21
Summary of SWLs criteria for major fixed noise sources
Table 4.22
Summary of barrier and standard enclosure adopted for PMEs
Table 4.23
Construction noise impact at NSRs under mitigated scenario
Table
4.25a Traffic noise contribution under mitigated scenario at 2016
Table
4.25b Traffic noise contribution under mitigated scenario at 2020
Table
4.25c Traffic noise contribution due to project road only under mitigated
scenario at 2016
Table
4.25d Traffic noise contribution due to project road only under mitigated
scenario at 2020
Table 4.26
Predicted road traffic noise impact at existing NSRs (Year 2042) under
mitigated scenario
Table 4.27
Predicted road traffic noise impact at planned NSRs (Year 2042) under mitigated
scenario
Table 4.30
Traffic noise contribution under mitigated scenario
Table 4.31
Summary of noise mitigation measures for DPs
Table 5.1 Water quality objectives for Deep Bay Water
Control Zones
Table 5.2a Standards for effluents discharged into Group
B Inland Waters
Table 5.2b Standards for effluents discharged into Group
C Inland Waters
Table 5.3 Water quality of Ng Tung River and Sheung Yue
River between 2006 and 2010
Table 5.4a Water quality monitoring results at Station
No. 2 near the LMC Loop in 2008
Table 5.4b Water quality monitoring results at Station
No. 3 near the LMC Loop in 2008
Table 5.4c Water quality monitoring results at the
Meander (2002)
Table 5.4d Water quality monitoring results at the
Meander (2009 to 2010)
Table 5.5 Marine water quality of Inner Deep Bay
between 2006 and 2010
Table 5.6 Water quality sensitive receivers
Table 5.7a Pore Water Test Results for Bio-remediation
by Injecting Calcium Nitrate.
Table 5.7b Elutriate Test Results for Bio-remediation by
Injecting Calcium Nitrate.
Table 6.1 Current effluent discharge standards for
SWHSTW and YLSTW
Table 6.2
Population and employment data for the LMC Loop
Table 6.3 Peaking factors for various population ranges
Table 6.4
Summary of adopted unit load factors
Table 6.5
Projected pollutant loads
Table 6.6 Projected pollutant concentrations
Table 6.7 Discharge standards for on-site STW
Table 6.8
Pollutant loads discharge subject to ”no net
increase in pollution loads”
Table 6.10
Estimated quantities of TSE reuse
Table 6.11 Proposed water quality standards of TSE reuse
Table 7.1 Other relevant documents and information
Table 7.2 Summary of existing waste facilities serving the Project
Table 7.4 Major construction works from the Project
Table 7.5b Summary of annual disposal quantities of surplus C&D materials (Phase II)
Table 7.6a Summary of annual quantities of imported fill materials (Advance Works and Phase I)
Table 7.6b Summary of annual quantities of imported fill materials (Phase II)
Table 7.8 Sediment quality analysis results
Table 7.9 Summary of chemical screening results
Table 7.11 Acceptance criteria of TCLP and UCS tests
Table 7.14 Estimated quantities of municipal waste from LMC Loop
Table 7.16 Estimated quantities of major chemical waste generated from laboratory
Table 7.17 Summary of waste arising from the operational phase
Table 8.1 Risk-Based Remediation Goals (RBRGs) for Soil & Soil Saturation Limit
Table 8.2 Risk-Based Remediation Goals (RBRGs) for Groundwater and Solubility Limit
Table 8.3 Potentially contaminated landuse within the LMC Loop
Table 8.4 Summary of soil samples exceeding RBRGs
Table 8.5 Initial estimate of contaminated soil quantity
Table 8.6 Possible future land uses of the contaminated zones
Table 8.7 Universal Treatment Standards (UTS) for metal arsenic
Table 10.1 Graded buildings (as of 23 November 2011) within the assessment boundary
Table 10.2 Summary of impact assessment for cultural heritage from the Project
Table 11.3.1 Review of existing planning and development control framework
Table 11.4.1 Significance threshold for landscape impact assessment
Table 11.4.2 Significance threshold for visual impact assessment
Table 11.4.4 Residual impact significance threshold matrix
Table 11.5.1 Broad Brush Tree Group Survey Summary
Table 11.5.2 Assessment of the sensitivity of landscape resources (LRs)
Table 11.5.3 Assessment of the sensitivity of landscape character areas (LCAs)
Table 11.5.4 Number of trees to be felled / transplanted
Table 11.5.5 Magnitude of change for landscape resources
Table 11.5.6 Predicted impacts on landscape resources
Table 11.5.7 Magnitude of change for landscape character areas
Table 11.5.8 Predicted impacts on landscape character areas
Table 11.5.9 Proposed construction phase mitigation measures
Table 11.5.10 Proposed operational phase mitigation measures
Table 11.6.1 Assessment of the sensitivity of visually sensitive receivers (VSRs)
Table 11.6.2 Visually sensitive receivers and proposed predicted impacts
Table 11.6.3 Proposed construction phase mitigation measures
Table 11.6.4 Proposed operational phase mitigation measures
Table 12.1 Not used.
Table 12.2 Schedule of field
survey activities (2009-2010).
Table 12.3 Avifauna of
conservation concern recorded in LMC Loop and habitat utilisation.
Table 12.5 Species of
conservation significance recorded at HHW and their status at HHW and in HK.
Table 12.6 Herpetofauna species
of conservation concern recorded in the ecological Assessment Area.
Table 12.7 Odonate species of
conservation concern present in the Ecological Assessment Area.
Table 12.10 Ecological
evaluation of reed marsh
Table 12.11 Ecological
evaluation of marsh
Table 12.12 Ecological
evaluation of mitigation wetland
Table 12.13 Ecological
evaluation of pond
Table 12.14 Ecological
evaluation of secondary woodland
Table 12.15 Ecological
evaluation of plantation
Table 12.16 Ecological
evaluation of shrubland
Table 12.17 Ecological
evaluation of seasonally wet grassland
Table 12.18. Ecological
evaluation of grassland/shrubland
Table 12.19 Ecological
evaluation of grassland
Table 12.20 Ecological
evaluation of grassland
Table 12.21 Ecological
evaluation of orchard
Table 12.22 Ecological
evaluation of wet agricultural land
Table 12.23 Ecological
evaluation of dry agricultural land in all areas
Table 12.24 Ecological
evaluation of natural watercourses
Table 12.25 Ecological
evaluation of natural watercourses
Table 12.26 Ecological
evaluation of LMC Meander
Table 12.27 Ecological
evaluation of channelised watercourse
Table 12.28 Ecological
evaluation of village area
Table 12.29 Ecological
evaluation of waste ground
Table 12.30 Ecological
evaluation of Urban/Residential Area
Table 12.31 Summary of habitat
evaluations
Table 12.32 Mammals of
conservation significance occurring in the Ecological Assessment Area.
Table 12.33 Herpetofauna of
conservation significance occurring in the Ecological Assessment Area
Table 12.34 Odonata of conservation
significance occurring in the Ecological Assessment Area
Table 12.35 Butterflies of
conservation significance occurring in the Ecological Assessment Area
Table 12.36 Aquatic fauna of
conservation significance occurring in the Ecological Assessment Area
Table 12.37. Flora of
conservation significance occurring in the Ecological Assessment Area.
Table 12.38 Area of Habitats in
LMC Loop
Table 12-57a Potential
Ecological Impacts on grassland of Flushing Water Service Reservoir
Table 12.58 Potential collision
mortality impacts on bird species in the absence of mitigation
Table 12.59 Potential ecological
impacts on Eurasian Otter in the absence of mitigation
Table 12.60 Potential ecological
impacts on other mammals in the absence of mitigation
Table 12.61a Potential
ecological impacts on Three-banded Box Terrapin in the absence of mitigation
Table 12.62 Potential ecological
impacts on odonata in the absence of mitigation
Table 12.63 Potential ecological
impacts on butterflies in the absence of mitigation
Table 12.64 Potential ecological
impacts on aquatic fauna in the absence of mitigation
Table 12.65 Potential ecological
impacts on aquatic fauna in the absence of mitigation
Table 12.67c Species proposed
for planting as woodland and shrubland compensation.
Table 12.69 Project components
requiring wetland compensation
Table 12.70 Summary of permanent
impacts (ha) on wetland habitats arising from the Project.
Table 12.71 Summary of
construction impacts (ha) on wetland habitats arising from the Project.
Table 12.72 Breakdown of
temporary wetland mitigation requirements (ha) arising from the Project.
Table 12.74 Key species for mitigation
areas
Table 12.76 Implementation
schedule for wetland mitigation areas
Table 12.77 Regular management
actions of the Ecological Area
Table 12.79 Regular management
actions of the fish pond mitigation area
Table 12.80 Regular management
actions of the freshwater marsh wetland mitigation area
Table 12.81 Key species
utilization of habitats to be provided as mitigation.
Table 13.1 Annual pond fish production and fish pond area
Table 13.2 Status and area (ha) of ponds within the assessment area
Table 13.3 Direct loss of fish ponds arising from the Project.
Table 13.4 Summary of fisheries impact in absence of mitigation
Table 15.1 Maximum
permitted concentration of certain metals present
Table 15.2 Baseline
toxicity in pond fish in Mai Po
Table 15.3 Emission rate
of contaminant from soil (mg/yr)
Table 15.4 Estimation of contaminant in fish from
indirect impact
Table
16.1 Green initiatives at district and
building levels
Table
16.2 Summary of implementation programme
Appendix
Appendix 1-1.............. PODP and RODP
Appendix 2-2.............. Development Options
Appendix 2-3a............. Road Alignment Options for
Western Connection Road
Appendix
2-3b............ Road Alignment
Options for Eastern Connection Road
Appendix 2-3c............. Road Alignment Options for
Direct Link to Lok Ma Chau Station
Appendix
2-4.............. Evaluation of
Road Options Selections
Appendix
2-6.............. Implementation Programme
Appendix
3-1.............. Justification for
the Percentage of Active Area
Appendix 3-2.............. Calculation of Dust Suppression
Efficiency from Watering
Appendix 3-3.............. Details of Dust Emission Sources and
Calculations
Appendix 3-4.............. Key Assumptions for EmFAC
Modelling
Appendix
3-5.............. Vehicle Emission
Factors for 2020 and 2027
Appendix 3-6.............. In-tunnel Emission
Appendix
3-7.............. Detailed
Calculations of Idling Emissions
Appendix
3-8.............. Odour Emission
Literature Review and Reconnaissance Site Surveys
Appendix
3-9.............. Measurement
Reports for Odour Sampling at Shenzhen River (PolyU)
Appendix 3-10 Briefing Note on Binhe WWTP Site
Inspection
Appendix
3-11 Measured Emission Rates
Adopted for Shatin STW
Appendix 3-12 Emission Rates for Proposed LMC STW and Binhe WWTP
Appendix
4-1.............. NSR Photos
Appendix 4-1A........... Ground Levels
Appendix 4-2.............. SWL of PME
Appendix
4-3.............. Location of
Workfront and Separation Distance to NSRs
Appendix
4-4.............. Plant Inventory
Appendix
4-5.............. Distance between
Notional Sources and Workfront
Appendix
4-6.............. Unmitigated
Construction Work Programme
Appendix
4-7.............. Construction
Noise Impact (Unmitigated)
Appendix
4-8.............. Computer Plot of
Road Traffic at 2016, 2020 and 2042 (Without Project)
Appendix
4-8A........... Location of
Existing Low Noise Surfacing
Appendix
4-9.............. Key Map to
Traffic Flow in 2020 and 2042 (Without Project)
Appendix
4-10............ Traffic Data at2016, 2020
and 2042 (Without Project)
Appendix 4-10A......... Approval from TD on Traffic Data
Appendix
4-11............ Computer Plot of
Road Traffic at 2042 (With Project)
Appendix
4-12............ Key Map to Traffic
Flow in 2042 (With Project)
Appendix
4-13............ Traffic Data at
2042 (With Project)
Appendix
4-14............ Predicted
Unmitigated Operational Road Traffic Noise in 2042
Appendix 4-14A......... Sample Calculations for
Operational Road Traffic Noise
Appendix
4-15............ Fixed Noise
Calculations
Appendix
4-15A......... Fixed Noise Levels
at NSRs
Appendix
4-16............ Drawings Showing
Barrier and Enclosure for Construction Noise
Appendix
4-17............ Mitigated
Construction Work Programme
Appendix
4-18............ Mitigated
Construction Noise Impacts
Appendix
4-19............ Drawings Showing
Noise Barriers for Road Traffic Noise
Appendix
4-20............ Mitigated
Construction Access Road Traffic Noise Impacts at 2016
Appendix
4-20A......... Mitigated Construction Access
Road Traffic Noise Impacts at 2020
Appendix
4-21............ Mitigated
Operational Noise Impacts
Appendix
5-1.............. Stormwater
Pollution Control Plan
Appendix 5-3.............. Runoff Loading
Appendix 5-4.............. Construction of Underpass
at ECR
Appendix 6-1.............. Flow and Load Estimates
Appendix
6-2.............. Compliance with
No Net Increase in Pollution Load Policy
Appendix 6-3.............. Sewerage Master Plan
Appendix
7-1.............. Edorsement Letters from PFC and CEDD Vetting
Committee of C&DMMP
Appendix
7-2.............. Agreement Email
from the Project Proponent of NENT NDA
Appendix 7-3.............. Sediment Sampling and Testing Plan
Appendix 7-4.............. Objection Letter for the Sediment Sampling at Old Shenzhen Meander
Appendix
7-5.............. Laboratory
Chemical Testing Report (Final Report)
Appendix 8-1.............. Contamination Assessment
Plan for LMC Loop
Appendix
10-1............ Historical Map and
Aerial Photos
Appendix 10-2............ Building Heritage Survey
Appendix
10-3............ Archaeological
Survey Report
Appendix 11-1............ Broadbrush Tree Group Survey
Appendix 12-1............ Methodology and Results of
Botanical Surveys
Appendix 12-3............ Methodology and Results of
Flight Line Surveys
Appendix 12-4............ Methodology and Results of
Bird Trapping Surveys
Appendix 12-5............ Methodology and
Results of Bird Transect and Point Count Surveys
Appendix 12-6............ Methodology and Results of
Mammal Surveys
Appendix 12-8............ Methodology and Results of
Herpetofauna Surveys
Appendix 12-9............ Methodology and Results of
Odonata Surveys
Appendix 12-10.......... Methodology and Results of
Butterfly Surveys
Appendix 12-11.......... Methodology and Results of
Aquatic Fauna Surveys
Appendix 12-12.......... Photographs of Habitats and
Impacted Areas
Appendix
12-13.......... Habitat
Requirements of Key Species
Appendix
12-15.......... Reed Marsh
Establishment Methods
Appendix
16-1............ Key Assessment
Assumptions & Limitation of Assessment
Appendix
16-2............ Impact Summary
Appendix 17-1............ Project Implementation
Schedule