All assumptions described in the following sub-sections have been confirmed with relevant parties.
3.5.1 Construction Phase
The prediction of dust emissions is based on the typical values and emission factors obtained from United States Environmental Protection Agency (USEPA) Compilation of Air Pollution Emission Factors, AP-42, 5th Edition.
As mentioned in Section 2.5, the construction of LMC Loop will be divided into phases including the Advance Works, Phase 1 Infrastructure, Phase 1 Buildings, Phase 2 Infrastructure and Phase 2 Buildings. Each of these phases would be implemented according to the development programme and their associated dusty construction activities will be assessed.
Since the air quality impact due to different construction phases will vary, the assessment identifies the worst case scenario over the entire construction phase to address the specific impacts arisen from the different work areas.
Construction dust assessment for short-term impact (i.e. 1-hour and 24-hour average) will be undertaken by a 2-Tier approach. Tier 1 screening assessment is a theoretical worst case scenario evaluation to identify hot spot areas of construction air quality impact by assuming 100% active construction area for all worksites. The identified hot spot areas will be further assessed by a more focused Tier 2 assessment to predict a more realistic worst case impact by altering the active construction areas to 30% and locating them nearest to the ASRs. Long-term impact (i.e. annual average) will be assessed with 6% active construction area for all work sites. Details discussions are given in the following subsections.
Conservative approach was adopted in the model run.
3.5.1.1 Assessment Years
The construction programme given in Appendix 2-6 and Appendix 3-3 have been reviewed to identify the construction phases for inclusion in the assessment.
Dust emission from heavy construction usually arises from dusty construction activities such as site clearance, ground excavation, etc. As shown in Table 3.5, most of the site formation and construction of major infrastructure within LMC Loop area will be carried out in Phase 1 Infrastructure.
According to the construction programme given in Appendix 2-6, major construction activities including the site formation of LMC Loop and essential infrastructure works (e.g. Western Connection Road and Lok Ma Chau Station Connection) at adjacent area in Hong Kong outside LMC Loop will occur in Year 2016. In addition, during the construction of Western Connection Road, some major site activities will occur in proximity to the existing ASRs (e.g. village house near Ha Wan Tsuen Road) and significant air quality impact is therefore anticipated. In light of the programme schedule of major construction activities and proximity of the activities to the ASRs, Year 2016 is considered as the worst case scenario for the assessment.
Since sensitive receivers along the Eastern Connection Road are less likely affected by the construction dust impact due to Phase 1 Infrastructure, the dusty construction activities associated with the Phase 2 Infrastructure have also been assessed to check compliance of this phase of the construction programme.
Table 3.5 Summary
of heavy construction works
|
Phases |
Construction
Period |
Major Construction Activities |
|
Phase 1
Infrastructure |
End 2014 to early
2019 |
·
Site formation,
clearance and ground excavation in all zones within LMC Loop area (Figure
2.24). ·
Construction of the associated facilities
for Internal Transport Network, Drainage Discharge Points, Fire Station cum
Ambulance Depot, District Cooling System (Western) and Sewage Treatment
Works. ·
Construction works for West Connection Road
(including Lok Ma Chau / San Tin Highway). ·
Junction improvement works (Lok Ma Chau Road – Castle Peak Road) ·
Construction of Direct
Link to Lok Ma Chau station. |
|
Phase 2
Infrastructure |
End 2024 to early
2027 |
·
Construction works for Eastern Connection
Road. ·
Construction works for the District Cooling
System (Eastern). ·
Construction works for the Proposed Flushing
Water Service Reservoir and the corresponding connection roads. |
3.5.1.2 Construction Vehicle Access
Dust emission from construction vehicle movement within the site and the temporary construction access have been taken into account.
The LMC Loop is a net fill intake project. It is assessed that the peak construction traffic occurs during the site formation stage for fill import and surplus surcharge export. Based on the estimated fill import volume divided by the truck capacity, the working hour per month and the scheduled construction programme for site formation, it was established that 50 trucks per hour (one-way only) for fill transportation would be required for supporting the construction rate to meet the first population intake in Year 2020. On top of the fill transportation traffic, an additional 10 trucks per hour (one-way only) was allowed for miscellaneous minor construction traffic like machinery and staff transportation. The assessment therefore adopted 60 trucks/hour travelling into and out of the project site through the construction access during working hours.
Effective from September 2009, all loaded dump trucks, including grab-mounted dump trucks travelling into and out of construction sites should be equipped with suitable covers before the trucks leaving the site. It is expected that dust emission from dump trucks travelling on the temporary construction access road outside the site would be minimal. Construction dust emission from vehicle movement inside the site are included in the assessment.
3.5.1.3 Operating Hours
Heavy construction working during weekdays and 8 hours per day (9a.m. to 5p.m.) have been assumed according to the mitigation requirement for ecology in Section 12.7.6.2 for most parts within the project, except for the area near San Tin Interchange which will be allowed for 12 operating hours per day (7a.m. to 7p.m.). Construction works during restricted hours might be required for the construction crossing over San Tin Highway and San Sham Road. The two construction works are:
· The elevated structure of Western Connection Road (i.e. the portion of Lok Ma Chau Road/ San Tin Highway Connection) across San Tin Highway (expressway); and
· The elevated structure of Direct Link to LMC Spur line Station across San Sham Road.
In general, the construction works that need to be conducted during restricted hours include falsework and formwork erection, formwork launching and concrete casting. Given these activities would not generate significant dust emission, they were not considered in the assessment.
3.5.1.4 Tier 1 Screening
Assessment
In terms of the construction programme, it should be noted that the sequencing of works activities from individual work sites or areas will be determined by the Contractor and is not known at this stage. However, due to the size of the works site and the need for orderly sequencing of construction activities, active construction activities will occur at different locations of the work site at different time periods. Therefore, it is not possible to pinpoint the exact locations of individual dust emission sources in the entire work site.
Tier 1 screening assessment is to establish a theoretical worst case scenario for identifying hot spot areas with potential short term 1-hour and 24-hour impacts on ASRs. The basis of the Tier 1 screening assessment for short term impact evaluation has assumed a 100% active work area for all worksites. Areas within the criteria contour are considered hot spot locations for which a focused Tier 2 assessment will be conducted.
3.5.1.5 Tier 2 Assessment
Based on the experience of the Engineer, there would be no more than 30% of active work area in each work site during any short period of time. Any short-term 1-hour and 24-hour periods, construction works activities would also occur at different locations of the entire work site. Hence, the chance of all 30% active works area in an individual work site occurring next to an ASR at any short time period is unlikely.
In Tier 2 assessment, each hot spot area is assumed with 30% active works areas occurring nearest to the potentially worst affected ASRs, while emissions from all other work sites outside the hot spot area will remain at 100% active as in Tier 1. Results of Tier 2 assessment are still conservative as noted by the experience of the Engineer though it serves a representation of the worst case construction dust impact prediction for the study.
3.5.1.6 Long-term Annual Predictions
Dust modelling assessment for long term annual predictions assumes that the work activities would evenly distribute across the whole area of each site over the year with an effective 6% active work area. In the modelling analysis, the dust emission rates are proportionally reduced to produce this effect in the assessment. Appendices 3-1 and 3-3 present the justifications for the percentage of active areas and tentative construction programme respectively.
3.5.1.7 Dust Dispersion Modelling
Dust impact assessment was undertaken using the Fugitive Dust Model developed by USEPA and approved by EPD. It is a Gaussian plume model for computing air dispersion due to fugitive dust emission. Modelling parameters including dust emission factors, particle size distributions, surface roughness, etc can be referred to EPD guideline entitled “Guideline on Choice of Models and Model parameters in Air Quality Assessment” and the USEPA AP-42. The density of dust was assumed to be 2.5g/m3. The 5-year mean of the annual averaged TSP concentration of relevant EPD’s air quality monitoring stations will be taken as the background concentration. As mentioned in Section 3.3.2, the TSP background concentration of 73.1 ug/m3 is adopted for the fugitive dust modelling. A surface roughness of 100 cm is assumed in the model to represent the terrain.
During daytime working hours (9am to 5pm), it is assumed that dust emissions would be generated from all dust generating activities and site erosion. During night-time non-working hours (5pm to 9am of the next day), Sunday and public holidays, dust emission would be from site erosion only as there would be no construction activities during these hours.
The
worst-case 1-hour, 24-hour and annual average TSP concentrations were predicted
with Year 2010 meteorological data from Ta Kwu Ling
Weather Station and mixing height from King’s Park Station.
Fugitive
dust modelling was conducted at 1.5m above ground level
as all the dusty activities would be located at ground level only.
Table 3.6 Modelling parameters
|
3.5.2
Parameters |
3.5.3
Input |
3.5.4
Remark |
|
Particle
size distribution |
1.25um = 7% 3.75um = 20% 7.5um = 20% 12.5um = 18% 22.5um = 35% |
Reference from S13.2.4.3
of USEPA AP-42 |
|
Background Concentration |
Recent 5-year average value
of monitoring stations of rural and new development category |
Sha Tin, Tai Po and Yuen Long air quality data have
been adopted for background concentration |
|
Modelling
mode |
Flatted
terrain |
- |
|
Meteorological
data |
Data recorded
in 2010 at Ta Kwu Ling (TKL) meteorological station |
- |
|
Anemometer
Height |
13m at
TKL |
- |
|
Surface
Roughness |
100cm |
- |
|
Emission
period |
General
construction activities during daytime working hours (9 am to 5 pm Monday to Saturday
except Sundays and general public holidays) Wind
erosion at all times during construction period. |
- |
|
ASR
calculating levels |
1.5m
only |
- |
3.5.1.8 Dust Emission Factors and Assumptions
Dust emission factors and assumptions used in the assessment for different dust generating activities are listed in Table 3.7. Detailed calculations of the emission factors are given in Appendix 3-3.
Table 3.7 References of dust emission factors
for different construction activities
|
Construction
Activities |
Reference |
Operating Sites |
Emission Factors
and Assumptions |
|
Heavy construction
activities including land clearance, site formation, ground excavation,
construction of associated facilities etc. |
USEPA AP-42,
Section 13.2.3.3 |
All construction
and excavation sites |
E = 2.69
Mg/hectare/month of activities |
|
Wind erosion |
USEPA AP-42, Table 11.9.4 |
All open construction sites, any stockpile areas,
barging points etc. |
E = 0.85 Mg/hectare/year |
The prediction of operational air quality impact covers road traffic emission, chimney emission and odour emission due to the operation of LMC BCP, Phase 1 Infrastructure, Phase 2 Infrastructure and the cumulative odorous sources from Shenzhen River and Binhe Wastewater Treatment Plant.
3.5.2.1 Determination of Assessment Year
According to Section 3.4.4.3 (v) (a) of the EIA Study Brief, vehicular emissions impact shall assess the worst scenario of the future road traffic within 15 years upon commissioning of the Project. The completion year for Phase 1 Infrastructure will be Year 2020 while for Phase 2 Infrastructure will be Year 2027. Therefore, Year 2035 and Year 2042 (i.e. 15 years upon commissioning of each phase) are considered respectively as interim and ending year for between the worst year determination period of Year 2020 and Year 2042. Results indicate that Year 2020 is the worst assessment year as it generates the highest vehicular emission within the Study Area when compared with the other three years. Given Year 2020 is within the assessment period of Phase 2 buildings, Year 2027 which has the 2nd highest vehicular emission, is also assessed to predict the air quality impact of the entire development for both Phases. Appendix 3-4 presents the detailed methodology and Section 3.6.2.1 presents the details for selecting the worst assessment year of 2020.
3.5.2.2 Determination of Key Parameters
Nitrogen Dioxide (NO2)
Nitrogen oxides (NOx) is known to be one of the pollutants emitted by
vehicles. According to the 2011 Hong
Kong Emission Inventory Report published by EPD (http://www.epd.gov.hk/epd/english/environmentinhk/air/data/files/2011HKEIReport.pdf) which is the latest
available information by the time of preparing this report, the dominant source
of NOx generated in HK is the navigation
which constitutes about 33% of the total in 2011. Road transport is the
second largest NOx emission group, accounting for
about 29% of the total (see Table 3.8
below).
Table 3.8: The emission percentage
and the amount of NOx in Hong Kong (2011)
|
Pollutant Source Categories |
NOx Emission %[1] |
NOx Emission (tonnes)[1] |
|
Public Electricity Generation |
26% |
30,000 |
|
Road Transport |
29% |
32,700 |
|
Navigation |
33% |
37,700 |
|
Civil Aviation |
4% |
4,770 |
|
Other Fuel Combustion |
8% |
9,290 |
|
Total |
100% |
114,000 |
Notes:
[1] Figures extracted from 2011 Hong Kong Emission
Inventory Report (http://www.epd.gov.hk/epd/english/environmentinhk/air/data/files/2011HKEIReport.pdf)
Together with VOC and in the presence of O3 under sunlight, NOx would be transformed to NO2. As discussed in Section 3.3.2, the latest
5-year average of annual NO2 concentrations in Shatin,
Tai Po and Yuen Long is 60.6% of the AQO.
The operation of LMC Loop would increase the traffic flow and hence the NOx emission and subsequently the NO2
concentrations near to the roadside.
Hence, NO2 is one of the key / representative pollutants for
the operational air quality assessment of the Project. 1-hour, 24-hour and
annual average concentrations at each identified ASR would be
assessed and compared with the relevant AQO to determine their compliance.
Respirable Suspended Particulates (RSP or PM10)
Respirable Suspended Particulates
(RSP or PM10) refers to suspended particulates with a nominal aerodynamic
diameter of 10µm or less. According to the EPD’s data, (http://www.epd.gov.hk/epd/english/environmentinhk/air/data/files/2011HKEIReport.pdf), and other research
studies (Tian et al., 2011 & Wie-Zhen
et al., 2008), road vehicles, particularly diesel vehicles, are one of the
sources of RSP in Hong Kong.
According to the latest statistics of 2011 Hong Kong Emission Inventory
Report (http://www.epd.gov.hk/epd/english/environmentinhk/air/data/files/2011HKEIReport.pdf), road transport is the
second largest source of RSP accounting for 19% of the total emissions. As discussed in Section 3.3.2, the latest
5-year average of the annual RSP concentration in Shatin,
Tai Po and Yuen Long is about 91.8% of the AQO.
Table 3.9: The emission percentage and the amount of RSP in Hong Kong (2011)
|
Pollutant Source Categories |
RSP Emission % [1] |
RSP Emission (tonnes)[1] |
|
Public Electricity Generation |
16% |
998 |
|
Road Transport |
19% |
1,180 |
|
Navigation |
37% |
2,310 |
|
Civil Aviation |
<1% |
58 |
|
Other Fuel Combustion |
12% |
745 |
|
Non-combustion |
15% |
934 |
|
Total |
[2] |
6,220 |
Note:
[1] Figures extracted from 2011 Hong Kong Emission
Inventory Report (http://www.epd.gov.hk/epd/english/environmentinhk/air/data/files/2011HKEIReport.pdf)
[2] Figures
are directly extracted from the report and may not be
added to 100% or the total sum of the emission from all source categories.
The operation of LMC Loop would increase the traffic flow and hence the
RSP concentrations near to the roadside.
Hence, RSP is also one of the key representative pollutants for the
operational air quality assessment of the Project. The 24-hour and annual
average concentrations at each identified ASR would be
assessed and compared with the relevant AQOs to determine their compliance.
Carbon
Monoxide (CO)
CO is
one of the primary pollutants emitted by road transport which
contributed about 67% of total CO emission in 2011. Despite road transportation
being the dominant source of CO emission, however, the air quality impact from
CO is relatively minor considering its monitoring stations data records. In
year 2011, the highest 1-hr concentration was 4030 µg/m3 as for
Causeway Bay and the highest 8-hr concentration is 3309 µg/m3 as for
Causeway Bay as well, both of which were well below the AQO standard of 30,000
(1-hour) and 10,000 (8-hour) respectively. It is therefore not a key parameter
for assessment.
Sulphur Dioxide (SO2)
According to the latest statistics of 2011 Hong Kong Emission Inventory
Report [3-2], the dominant source of SO2 in Hong Kong is
from navigation, which constitutes about 54% of the total emissions. Only <1%
of the total emissions comes from road transport. The introduction of ultra low
sulphur diesel for vehicle fleet has further reduced the SO2
emission from road transport in Hong Kong. Given the low contribution of SO2
from transportation sector, it is also not considered
a key parameter in this assessment.
Ozone (O3)
Unlike other pollutants
such as NOx, O3 is not a primary pollutant
emitted from man-made sources but is formed by a set
of complex chain reactions between various chemical species, including NOx and VOC, in the presence of sunlight. According to Sun et al.[3-2]
the rate of formation of O3, also known as Ozone Production
Efficiency, depends not only on NOx and VOC levels,
but atmospheric oxidation, temperature, radiation, and other meteorological
factors in the atmosphere of different regions. The formation of O3
generally takes several hours to proceed (EPD, 2011)[3-3]
and therefore O3 recorded locally could be attributed to emissions
generated from places afar.
According to “A Study to Review
Hong Kong’s Air Quality Objectives” (http://www.epd.gov.hk/epd/english/environmentinhk/air/studyrpts/aqor_report.html), due to the abundance of
its precursors (VOC and NOx) from a great variety of
sources such as motor vehicles, industries, power plants and consumer products,
etc., ozone can be widely formed in the region and can be transported over long
distance. The general rising trend of
ozone levels in Hong Kong over the past years reflects an aggravation in the
photochemical smog problem on a regional scale.
All these indicate that local traffic emission is not a dominant
controlling factor in O3 formation.
In addition, the EPD’s “Air
Quality in Hong Kong 2011” report stated that NOx
emissions from motor vehicles have the potential to react with and remove O3
in the air, and regions with heavy traffic normally have lower ozone levels
than areas with light traffic. It is therefore possible that the Project may contribute to
a decrease in O3 in the immediate area along main roads. O3
is therefore not considered as a key parameter in this
assessment.
Lead (Pb)
As leaded petrol had been banned in Hong Kong in 1999, it is no longer
considered as a primary source in Hong Kong.
According to the “Annual Air Quality Monitoring Results - Air Quality in
Hong Kong 2011” from EPD (http://www.epd-asg.gov.hk/english/report/files/AQR2011e_final.pdf), the measured 3-month
averaged lead level ranged from 0.020 μg/m3
(Kwun Tong and Central/ Western) to 0.104 μg/m3 (Yuen Long). The measured concentration is much lower than
the 3-month AQO of 1.5 μg/m3.
Therefore, lead is not considered as a key air
pollutant for assessment.
In summary, NO2
and RSP are concluded to be the representative air
pollutants for the assessment.
3.5.2.3 Vehicular Emission from Open Road
In the Hong Kong
context, NO2 and RSP are considered key vehicular
emissions pollutants for the purpose of air quality assessment under the EIAO,
as the others emitted pollutants are rather insignificant based on their
current monitoring station data trend records.
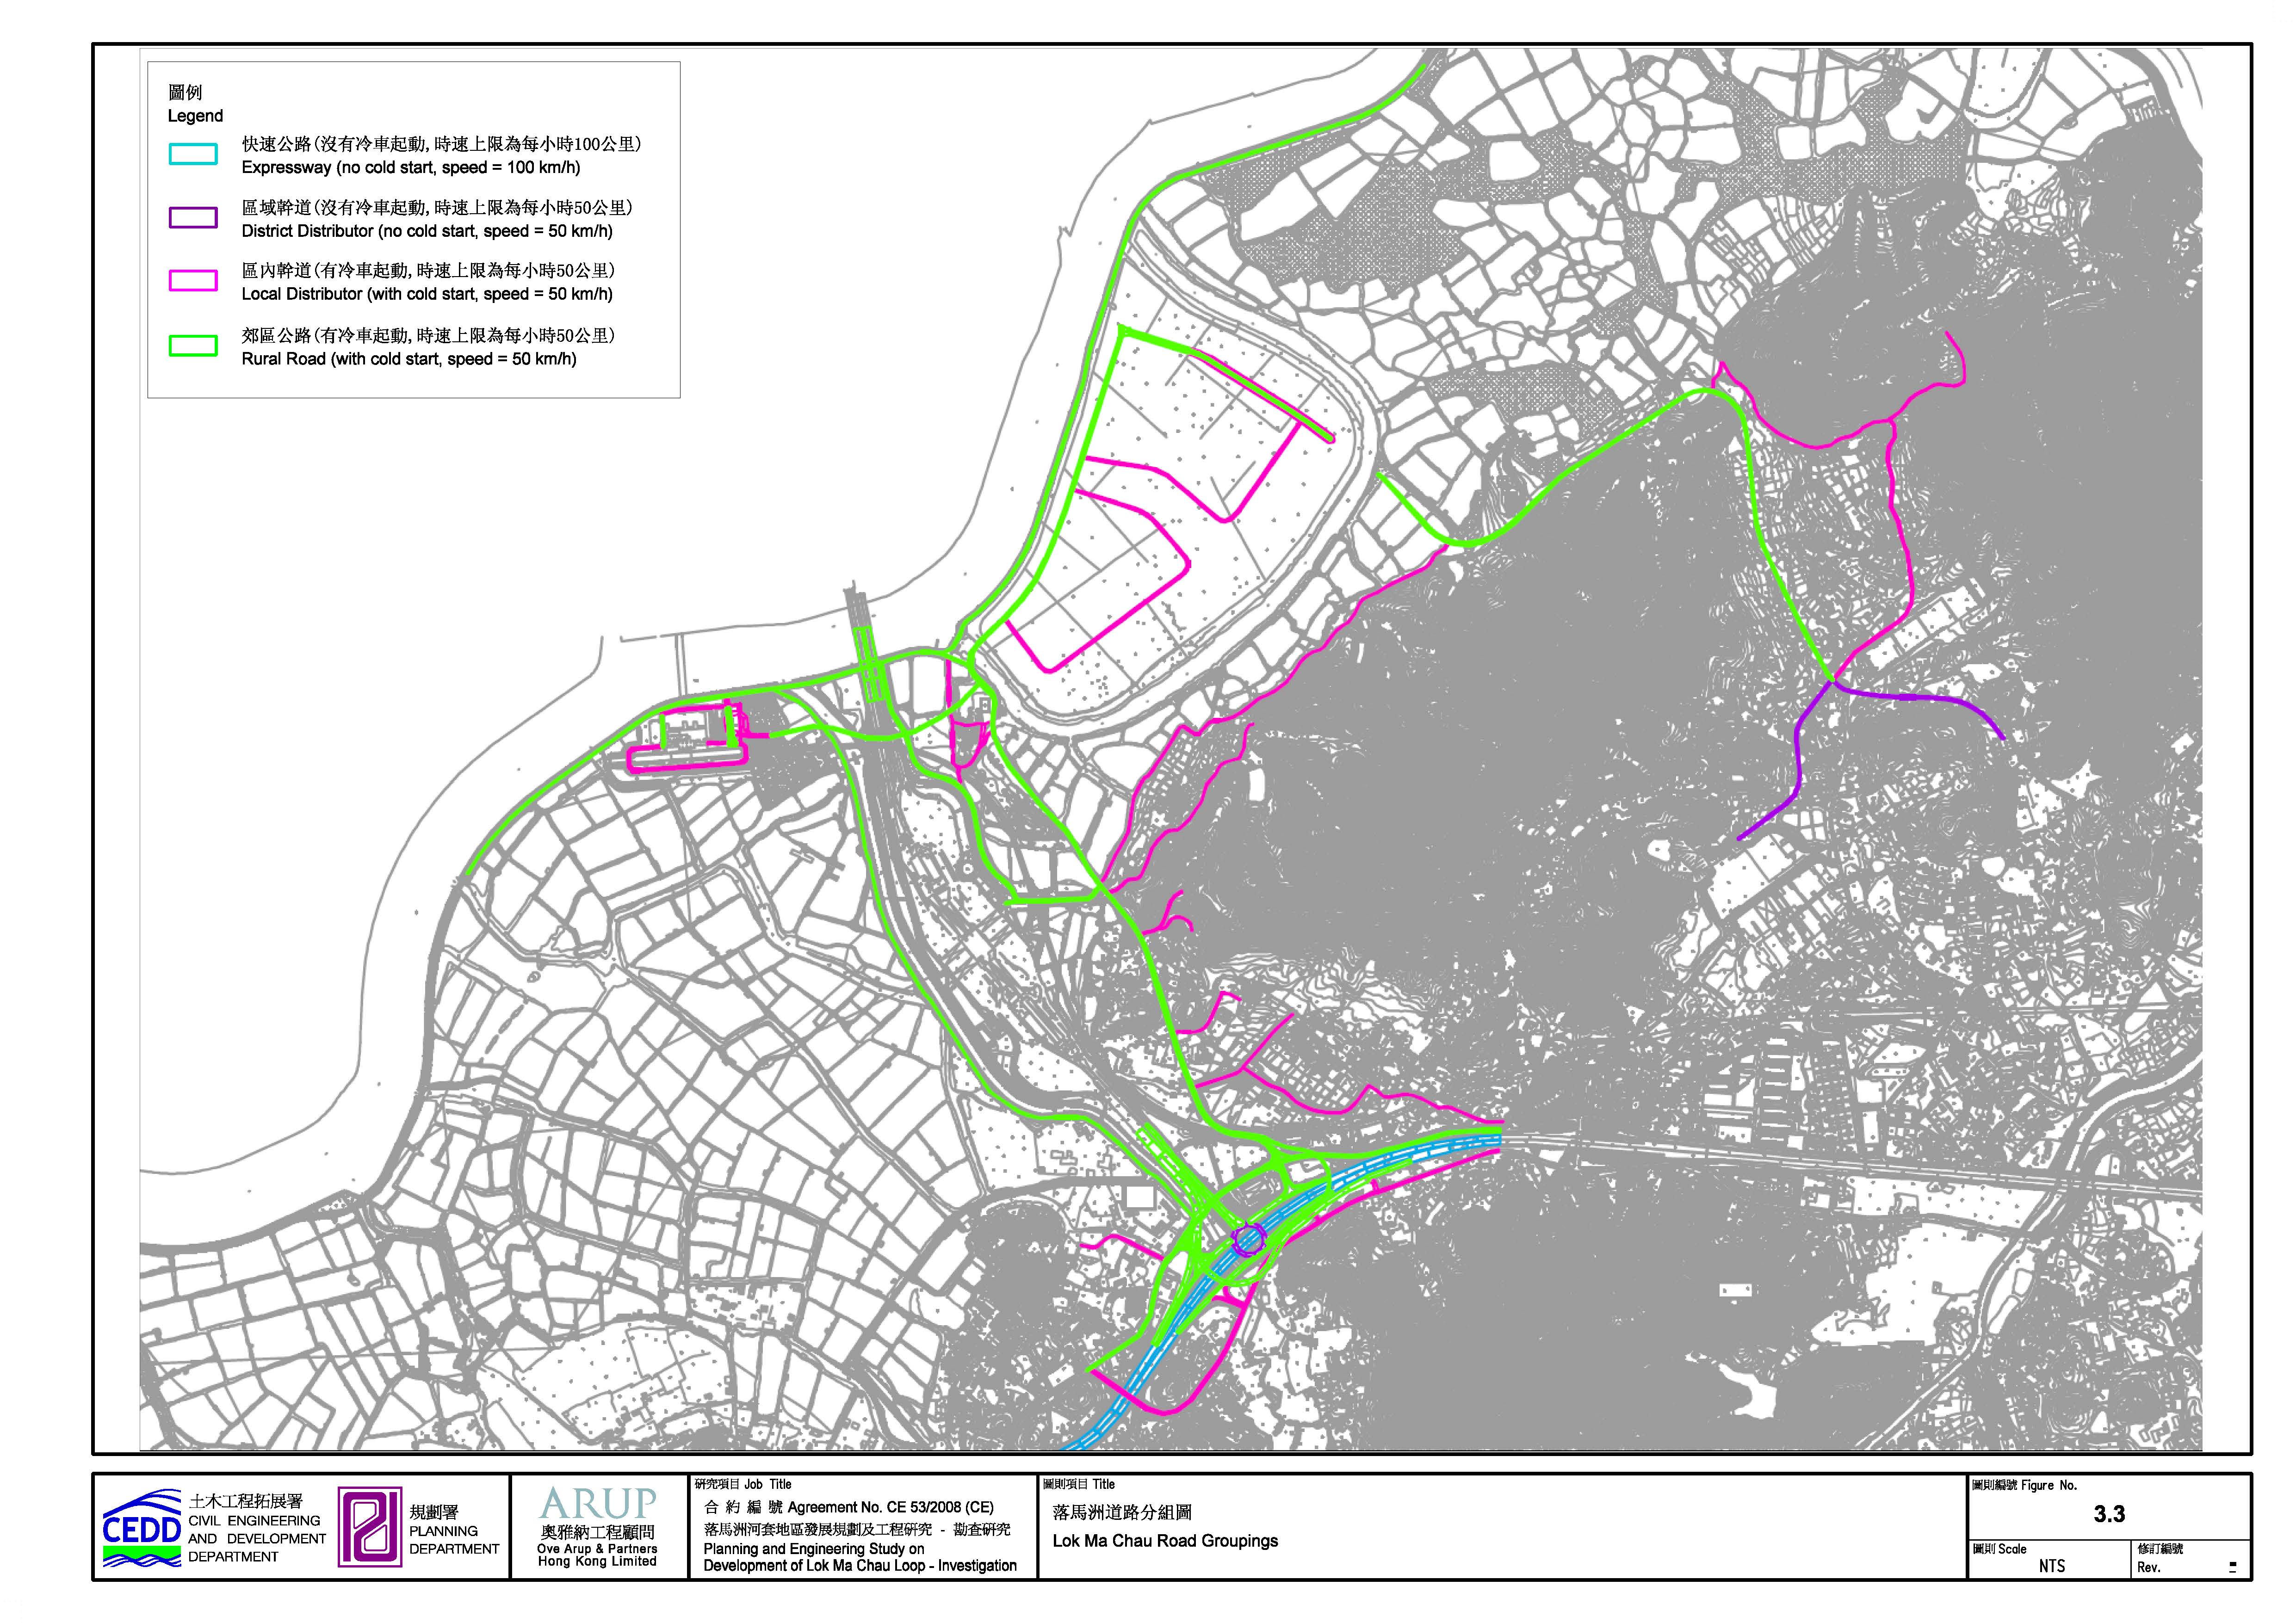
EMFAC-HK was used to calculate the vehicular tailpipe emission in lieu of the traditional fleet average emission factors. The road grouping for this assessment is shown in Figure 3.3. Emission factors for Year 2020, Year 2027, Year 2035 and Year 2042 were determined.
Vehicular tailpipe emissions from open roads are derived from the EPD EMFAC-HK model v2.1 at the time of assessment (end 2012). Later model versions EMFAC-HK v2.5 and v.2.5.1 have since been released by EPD in January and March 2013 respectively. According to EPD website, changes to v2.5 involved the output file formats, output file name and input file unit for vehicle milage travel, the overall effect on emission estimates are insignificant. Similarly, it has also stated that v2.5.1 will not result in any changes in predicted emission rates. Therefore, the vehicular tailpipe emission rates generated from v2.1 remain applicable for adoption in this assessment.
Vehicular emissions for cross-boundary vehicles have followed the same methodology adopted in the approved EIA report “Hong Kong - Zhuhai - Macao Bridge Hong Kong Link Road” (Register No. AEIAR-144/2009). The HZMB EIA report stated that cross-boundary vehicles had to go through the vehicle-registration process in Hong Kong. As such, all motor vehicles seeking first registration in Hong Kong must comply with the requirements of the Air Pollution Control (Vehicle Design Standards) (Emission) Regulations. Without a programme on policy review, it implies that cross-boundary vehicles on LMC BCP would meet the same emission standards as local vehicles of similar types. It is therefore not unreasonable to assume that cross-boundary vehicles would have the same emission characteristics as local vehicles.
Estimated traffic flow in Year 2020 is presented in Appendix 3-4. It shows that the traffic flow is relatively higher for “PM peak hour” than “AM peak hour”. Hence, traffic flow during PM peak is adopted as the worst case. Appendix 3-4 presents the key assumptions for the EMFAC-HK modelling. A 24-hour daily profile in terms of total traffic flow will be assumed for all vehicle classes. Appendix 3-5 presents the detailed estimation of the vehicular emission factors for NO2 and RSP within the 500m from the boundary of the Project. Assessment points are shown in Table 3.3 and 3.4 and Figures 3.2 to 3.2d respectively.
The air dispersion model, CALINE4 developed by the California Department of Transport and approved by USEPA was used to assess vehicular emission impacts from the existing and planned road network. In view of the limitation of the model, elevated roads higher than 10m were set to the maximum height of 10m to represent the condition, albeit in a more conservative manner.
Based on EPD’s Guidelines for Local-Scale Air Quality Assessment Using Models (http://www.epd.gov.hk/epd/english/environmentinhk/air/guide_ref/ guide_aqa_model_g1 .html), surface roughness was estimated to be 10% of the average height of physical structures within 1km of the study area. On the Shenzhen side, the area is mainly dominated by high-rise residential and commercial buildings. On the other hand, the Loop development will be occupied by taller developments located at the southwestern corner with lower building heights along the SZ River, it is intended that building heights should step up gradually from the SZ River to the centre of the site and gradually stepping down towards the eastern part of the site, so a surface roughness of 100cm was appropriately assumed.
Meteorological data recorded at the Ta Kwu Ling Weather Station and mixing heights at King’s Park Station in 2010 was adopted. The standard deviation of wind direction was determined according to the Guideline on Air Quality Models (Revised), EPA-450/2/78/027R USEPA, July1986. 20% of NOx was assumed to be NO2 in accordance with the Ambient Ratio Method.
3.5.2.4 Portal Emission from Underpass connecting LMC Loop and Eastern Connection Road
Upon
completion of the Phase 2 Infrastructure, there will be a short underpass
section connecting the Loop internal road to Eastern Connection Road across the
meander and Ecological Area. As advised by the Tunnel
Engineer, only jet fan will be installed in this underpass and no ventilation
building is required.ISCST3 Model was adopted to estimate the portal emission
from the underpass in accordance with the Permanent International Association
of Road Congress Report (PIARC, 1991), where
it is assumed that the pollutant will be ejected from the portal as a portal
jet such that 2/3 of the total emission will be dispersed within first 50m, and
the rest 1/3 of the total emission within the next 50m.
3.5.2.5 Air Quality Inside Underpass
In accordance with the “Practice Note on Control of Air Pollution in Vehicle Tunnels”, the air quality inside the tunnel should achieve the EPD recommended limit of 1ppm NO2 concentration. This criterion is adopted in this assessment. As advised by tunnel engineer, only jet fan will be installed in the underpass and no ventilation building is required. The in-tunnel air quality assessment is given in Appendix 3-6. Results indicate the EPD recommended limit will be achieved. The emission rate of CO is approximately 10-20 times of the NO2 emission rate with reference to vehicular emission derived from EMFAC Mode using EMFAC-HK v2.1 (I&M), however, the ratio of guideline standard of CO (5-minute) concentration to NO2 (5-minute) concentration in µg/m3 is 64 to 1. Therefore, CO would also comply with the standard. Under the Air Pollution Control (Motor Vehicle Fuel) Regulation, the sulphur content of diesel fuel is required to be less than 0.005%. in view of the low emission rates relative to the statutory limit, SO2 would also comply with the tunnel air quality limit.
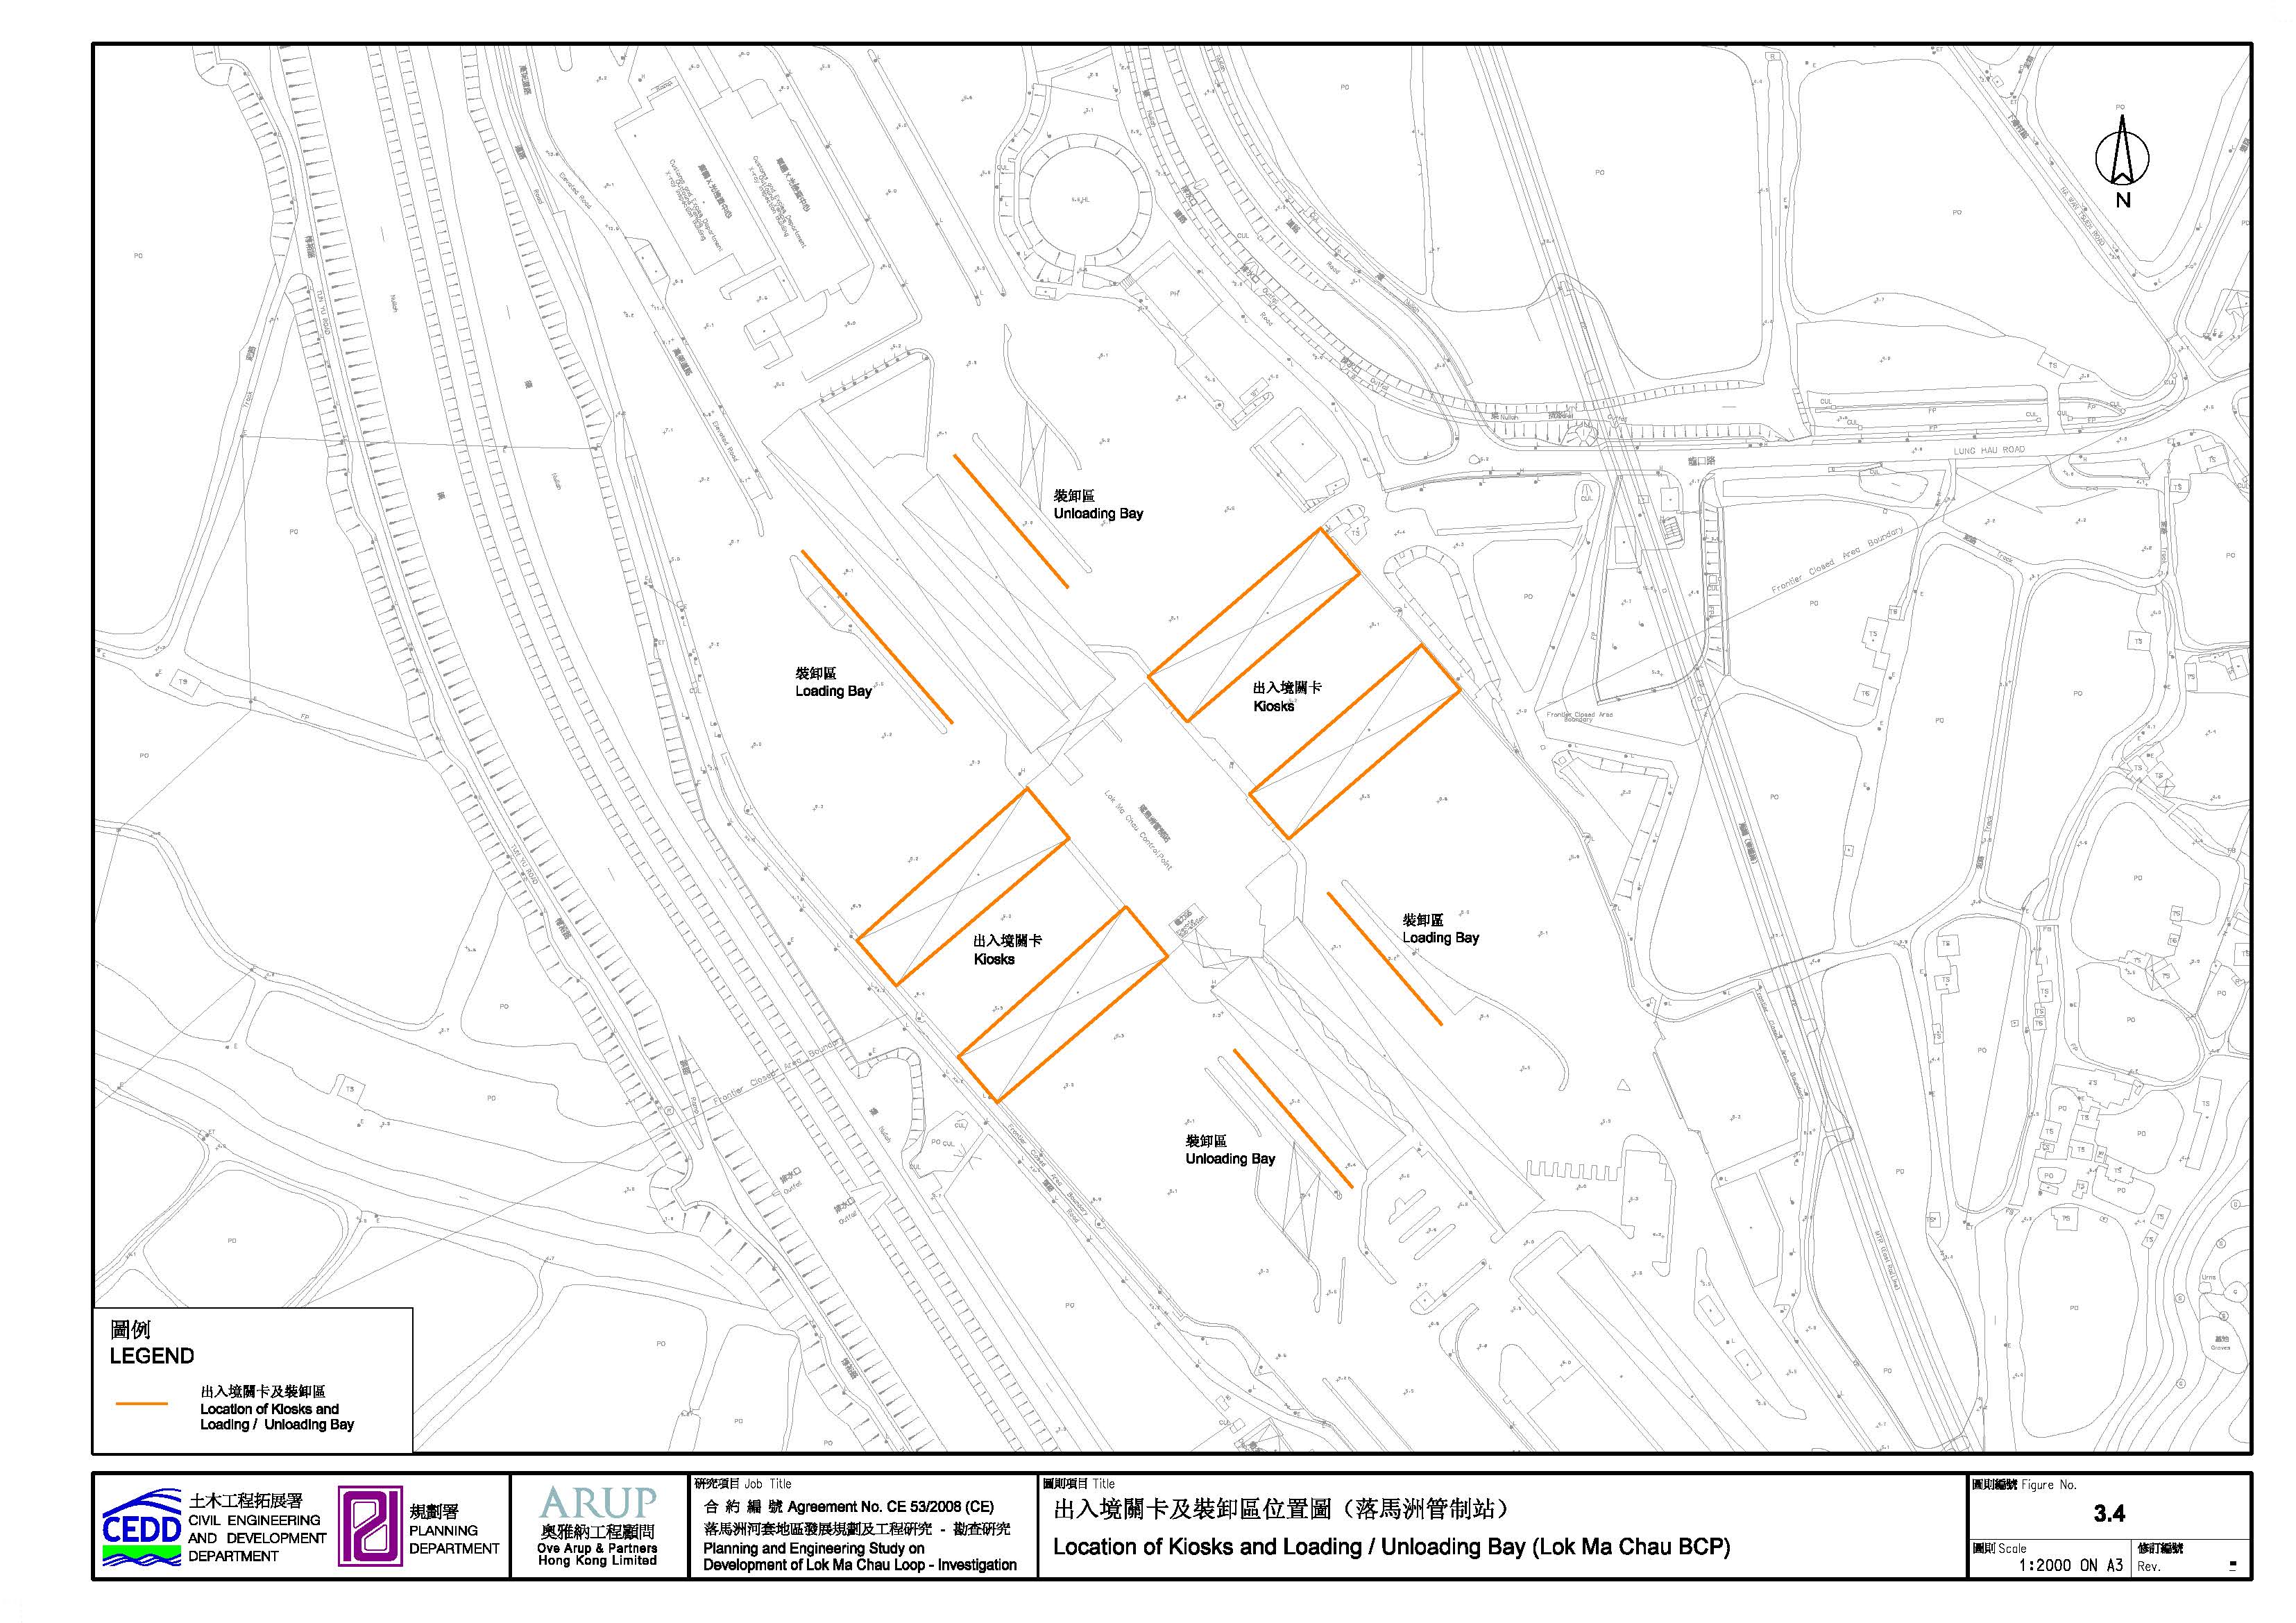
3.5.2.6 Vehicular Emission from Idling Vehicles at LMC BCP
LMC BCP is located within 500m from the boundary of the Project. The calculation of emission factors from idling
engines in the kiosks and loading/unloading bay at LMC BCP
has followed the methodology of PIARC 2004 paper on
road tunnels. The locations of Kiosks and Loading/Unloading Bay at
LMC BCP are shown in Figure 3.4.
Detailed calculations of idling emissions and locations of emission sources are presented in Appendix
3-7. The latest implementation programme of vehicle emission standard,
vehicle age distribution and technology fraction of different engine types have been taken into account in the calculations of
vehicular emissions.
For conservative analysis, buses and coaches were assumed to have the same idling emission factor as heavy goods vehicles. A more conservative idling emission factor of 0.2g/min for NOx as given in the Consultation Paper - A Proposal to Ban Idling Vehicles with Running Engines was assumed for private cars. Table 3.9a summarizes the idling emission factors adopted for different vehicle types in the assessment years of 2020 and 2027.
Table 3.9a NOx and RSP emission factors for various types of
vehicles
|
Vehicle Type |
Year 2020 Idling Emission Factor |
Year 2027 Idling Emission Factor |
||
|
NOx |
RSP |
NOx |
RSP |
|
|
(g/min-veh) |
(g/min-veh) |
(g/min-veh) |
(g/min-veh) |
|
|
Passenger
Car |
0.2 |
Negligible |
0.2 |
Negligible |
|
Goods
vehicle & Container Truck |
1.229 |
0.032 |
1.036 |
0.024 |
|
Bus /
Coach |
1.229 |
0.032 |
1.036 |
0.024 |
|
Taxi |
0.2 |
Negligible |
0.2 |
Negligible |
Similar to the methodology of vehicular emission from open road, the potential air quality impact due to idling emissions at LMC BCP was assessed by the approved model, CALINE4. Emissions from the kiosks as well as at the loading/unloading bays were modelled as “parking lot” mode.
3.5.2.7 Vehicular Emission from Public Transport Interchanges (PTI)
With reference to the “Motor Vehicle Idling (Fixed Penalty) Ordinance (Cap. 611)”, the driver of a motor vehicle is prohibited from causing or permitting any internal combustion engine ("ICE") which forms part of a motor vehicle to operate for more than three minutes in aggregate within any continuous sixty-minute period while the vehicle is stationary (“idling prohibition”), unless an exemption applies. Therefore, idling emission is not identified within the PTI.
A TI is proposed above the existing LMC Station Public Transport Interchange. It would be an open TI with passengers taking and dropping operations. Provision for mechanical ventilation is not required for this TI and the existing LMC Station Public Transport Interchange. For the two proposed TI within the LMC Loop development, the design of the two proposed TI should comply with “Practice Note for Professional Persons – Control of Air Pollution in Semi-Confined Public Transport Interchange”. With reference to S.2.4.2.4, in consideration of the worst case scenario for traffic impact assessment, free vehicle movements were assumed within the internal transport networks.
3.5.2.8 Chimney Emission
An initial desktop study and site surveys
had been carried out on 9 and 12 December 2009. Based
on verification findings from subsequent reconnaissance survey on 2 March 2012,
it is confirmed that no industrial chimney was
identified within the 500m from the boundary of the Project on Hong Kong side.
On Shenzhen side, the nearest potential industrial land use is located within
the Futian Bonded Zone in Futian
District at more than 500m away from the Project boundary.
In
addition, as the LMC Loop site is being planned for the development of a
mixture of educational institutions and high-technology industry
park, chimney emission from the area is not anticipated. To the east of
the site at Sandy Ridge, three cremators were proposed, however, their
locations are outside 500m of the Project boundary, and so potential chimney
emission impact is not anticipated.
3.5.2.9 Odour Emission
From the desktop review and reconnaissance site surveys undertaken on 11 January, 16 January, and 16 March of 2010, odour emission along the Shenzhen River
was identified in the vicinity of the LMC Loop. On 23
April 2010, another site survey was conducted to
identify other odour generating industries within 500m from Loop development on
Hong Kong side, in which the planned ASRs will be located. There were no active
odour generating industries identified. Details of the literature review and
reconnaissance site surveys are given in Appendix 3.8.
In
addition, the future STW within the LMC Loop and the Binhe
WWTP at about 1.8 km upstream from the boundary of LMC Loop on Shenzhen side
are potential odour sources and have been included in the assessment. All the
major pollution sources are shown in Figure
3.5.
_Page_09.jpg)
The Lagrangian model,
ISCST was adopted to assess compliance of the odour
criterion.
Hourly meteorological data including wind speed, wind direction, air temperature and stability classes at the Ta Kwu Ling Weather Station and the mixing height from the King’s Park Weather Station in Year 2010 was adopted for the assessment. The future land use for industrial, commercial and residential uses will account for over 50% of area within 3 km radius from the odour emission source within the LMC Loop. Hence, urban dispersion coefficients are adopted in the ISC3 model.
The predicted hourly odour concentrations were
converted into the 5-second odour concentrations and compared to the stipulated
odour criterion, i.e. 5 odour unit. The conversion
factors used were made reference to the study of
“Agreement No. CE43/2005 (EP) Harbour Area Treatment Scheme Stage 2A EIA Study
– Investigation”, which adopted the New South Wales Approved Method stipulated
in “Approved Methods for Modelling and
Assessment of Air Pollutants in New South Wales”, these conversion factors
are shown in Table 3.10.
Table 3.10 Conversion factors
for hourly average to 5-sec average of odour concentration
|
Emission Sources |
Pasquill Stability Class |
Conversion Factor (From 1 hour to 5 seconds) |
|
Binhe WWTP |
A – D |
2.3 |
|
E – F |
1.9 |
|
|
Future STW within the Loop |
A – F |
2.3 |
|
Shenzhen River |
A – D |
2.5 |
|
E – F |
2.3 |
Upon the operation of LMC Loop, the surrounding of future STW would be surrounded by low to medium-rise buildings and
building wake effect on the dispersion of odour emission is anticipated. Hence,
the conversion factor for wake-affected point source is
adopted.
In respect of the odour emission from Shenzhen
River, the emission rates were established through
in-situ odour sampling and subsequent laboratory olfactometry
analysis. The steps taken for determination of emission rates from Shenzhen
River and assumptions for Binhe WWTP and on-site STW are discussed as follows:
Shenzhen River Odour
Emission
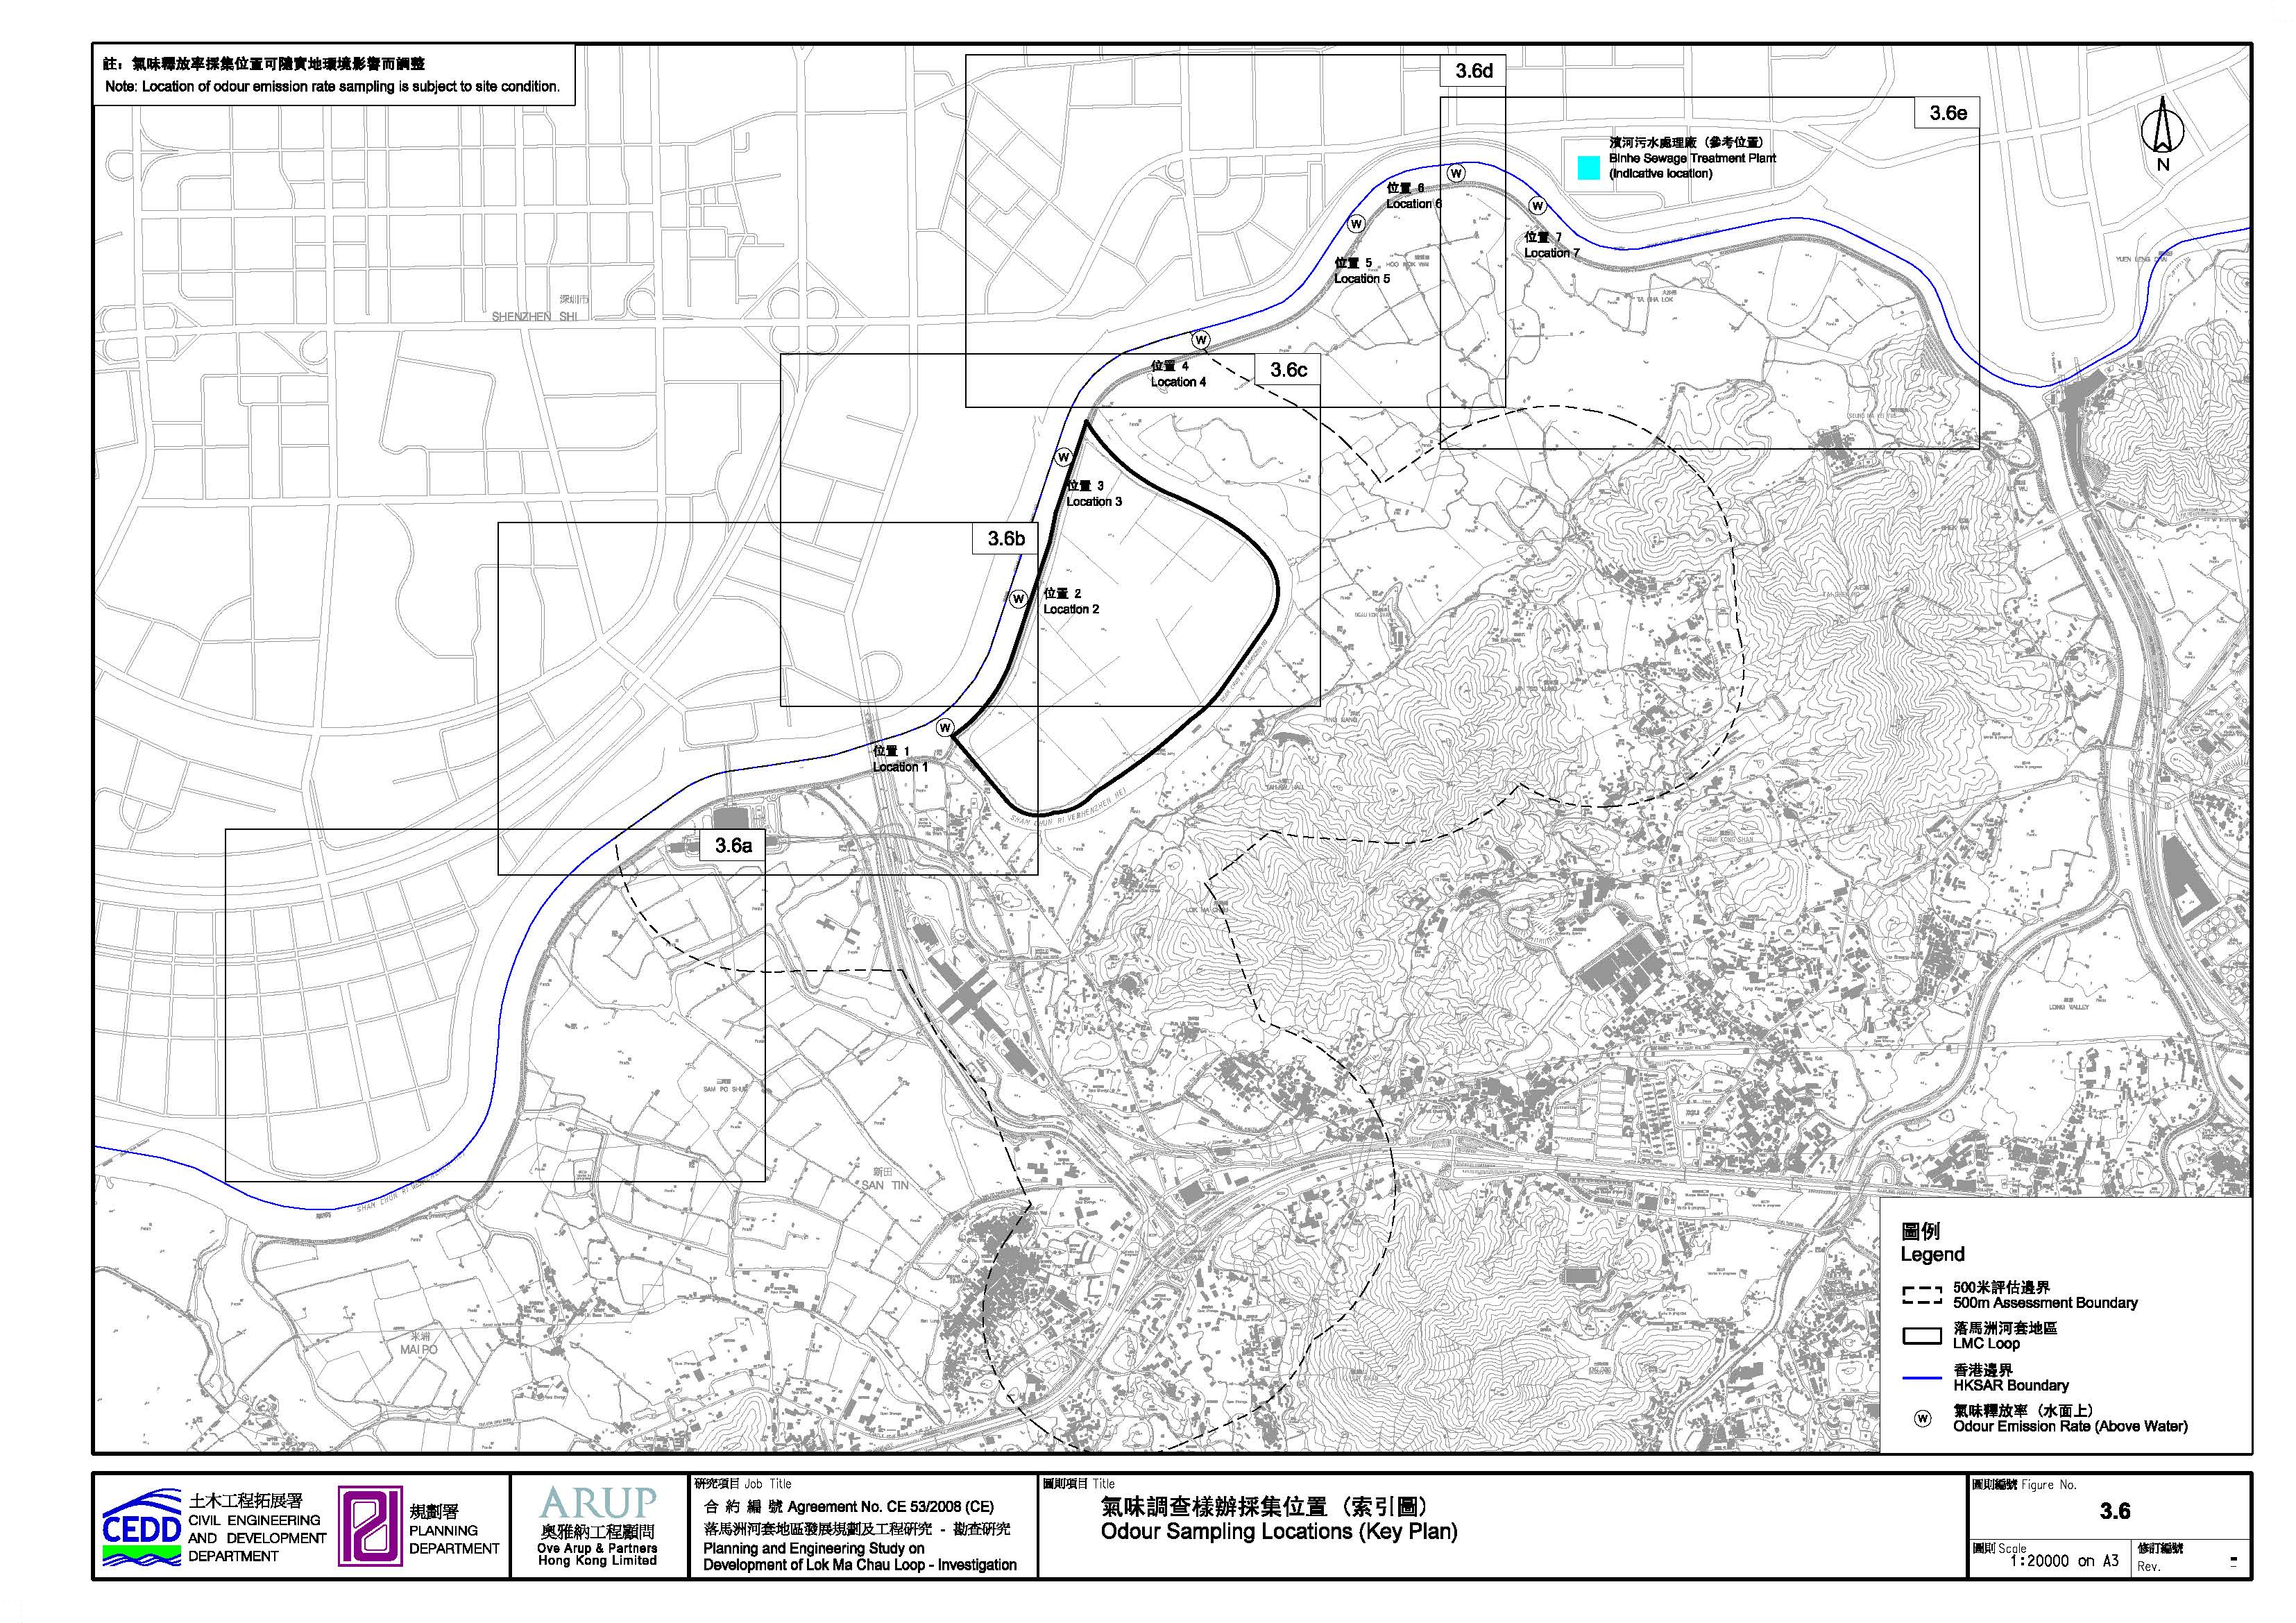
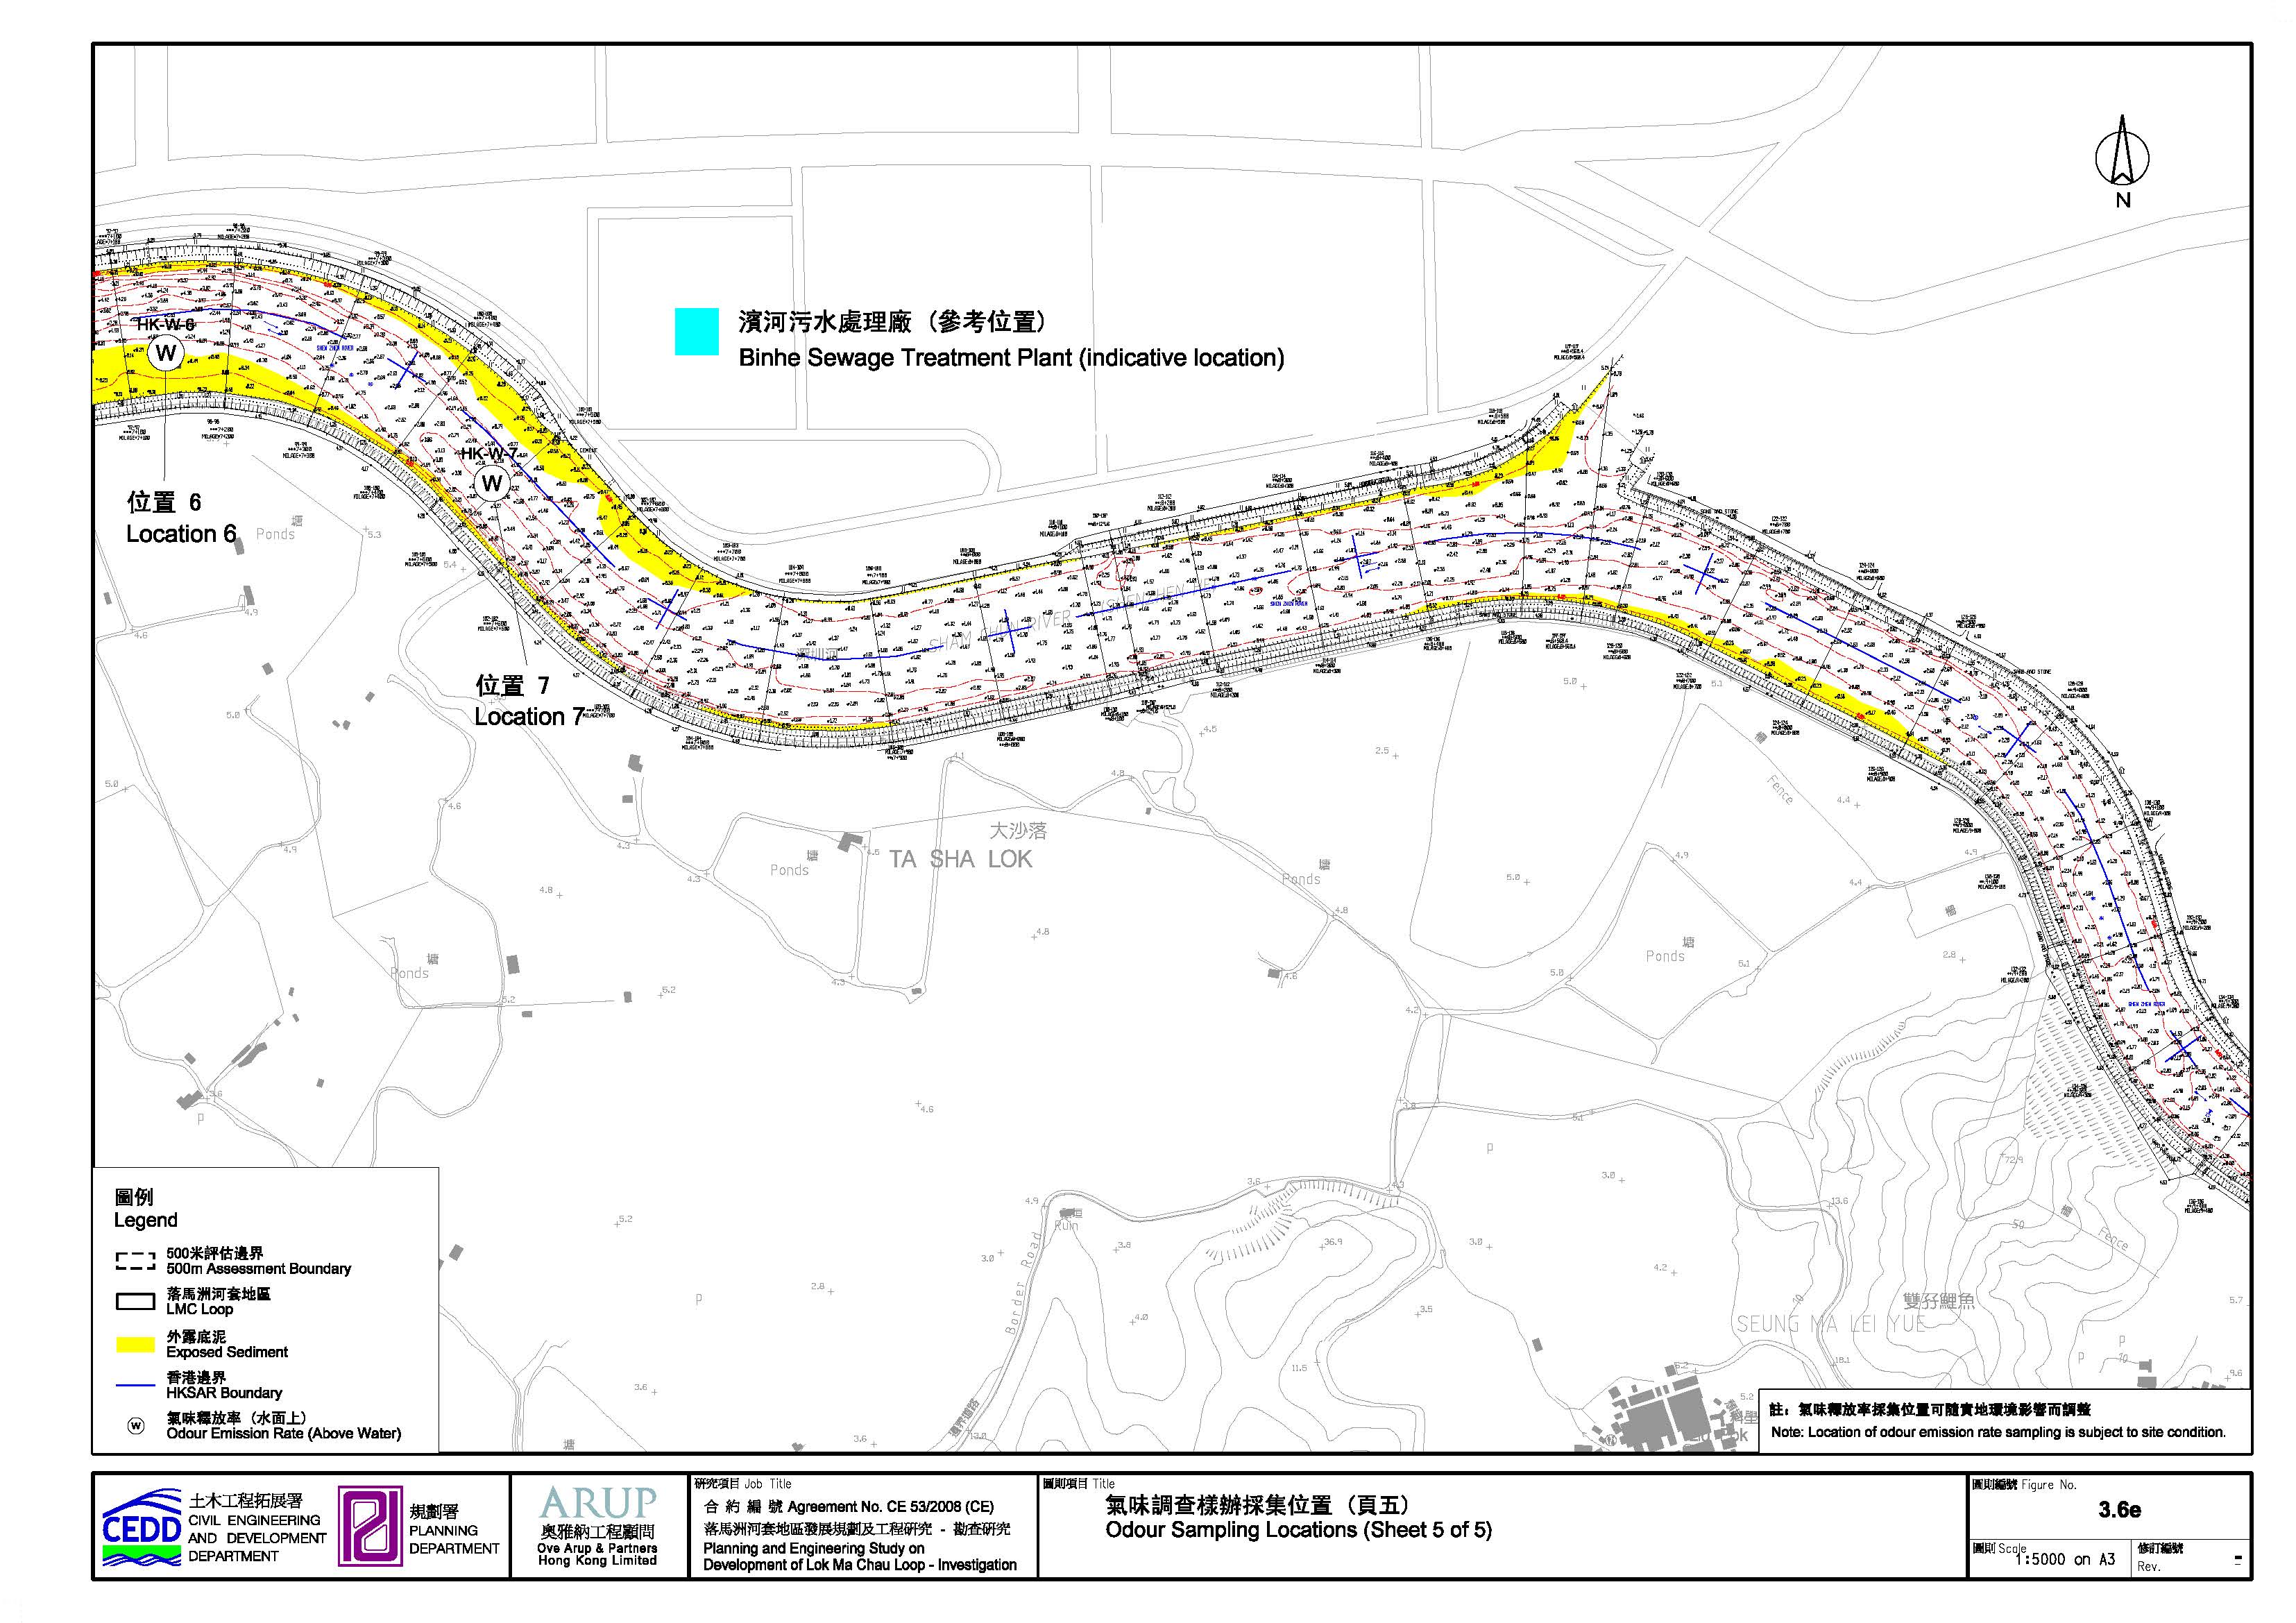
Step 1 - Sampling Locations
In
view of the identified odour emission sources along the Shenzhen River, odour
emission sampling has been proposed to evaluate the odour emission strength. Sampling
locations along the Shenzhen River are shown in Figures 3.6 to 3.6e. Seven
locations were selected and verified by an odour specialist
prior to the actual sampling works. At each sampling location, the
following samples have been collected.
Shenzhen Side
·
1 odour sample for exposed sediment.
·
1 odour sample on water surface.
Hong Kong Side
·
1 odour sample on water surface.
The selected sampling locations were
summarised below:
·
downstream of the
LMC Loop at the boundary of the study area (Location 1 in Figure 3.6);
_Page_10.jpg)
·
off the
North-Western boundary of the LMC Loop (Location 2 in Figure 3.6);
·
upstream of
Location 2 within the LMC Loop (Location 3 in Figure 3.6);
·
upstream of
Location 3 near the boundary of the associated infrastructure in the adjacent
area in Hong Kong outside LMC Loop (Location 4 in Figure 3.6);
·
upstream of
Location 4 and located at within 500m from the boundary of Loop development
(Location 5 in Figure 3.6);
·
upstream of
Location 5 to the west of the Binhe WWTP (Location 6
in Figure 3.6); and
·
upstream of
Location 6 and near the Binhe WWTP (Location 7 in Figure 3.6);
Odour
samplings have been carried out at these seven
locations during the low tide periods on 6th,
19th and 22nd of August 2010 when the ambient temperatures were above
32oC such that a reasonable worst scenario could be established. Sediment
profile of the Shenzhen River in 2009, obtained from the Drainage Services
Department, is also shown in Figures 3.6 to 3.6e.
Step 2 - Odour Sampling
To determine the specified odour emission rate
(SOER) from the Shenzhen River, the odour concentration (ou/m3)
was measured at the identified sampling locations.
Odour sampling along the Shenzhen River
were carried out by an odour specialist, who had also verified the selected
sampling locations shown in Figure 3.6 prior to the actual sampling works.
Meteorological data such as
ambient temperature, relative humidity, wind speed, wind direction and tidal
data were taken from Hong Kong Observatory or recorded on site.
Air samples were collected by positioning a wind
tunnel device on the selected odour emitting surface
(i.e. on water or sediment surface).
Nitrogen gas from a certified gas cylinder was then directed into the
hood to simulate parallel air flow at a fixed velocity
through the wind tunnel device.
Collected samples had undergone olfactometry
analysis in the laboratory to determine odour concentrations. The odour
measurement report for Hong Kong side of the Shenzhen River by Hong Kong
Polytechnics University is given in Appendix 3-9 whereas the report for
Shenzhen side of the Shenzhen River by Zhongshan University
(中山大學) has been
provided to EPD but omitted in the appendix due to data confidentiality reason.
Step 3 - Emission Rate Determination
The emission rate was determined by the air flow rate through the hood and the odour concentration
of the exit air. Specific odour emission rates (SOER) of each area source were estimated by the equation below:
![]()
On-site Sewage Treatment Works within the
LMC Loop
The on-site STW within the LMC Loop was identified to be a potential odour emission source to
the sensitive receivers.
As in-situ sampling from a planned STW is not
possible, odour emission rates were made reference to
the measured data of existing STWs with similar mode of operation. In this
project, the operation of the proposed STW is considered
similar to the decentralized design of the Sha Tin
Sewage Treatment Works (STSTW). Hence, the measured emission rates in the STSTW
were adopted for the assessment. The emission rates
for different facilities of the proposed STW are summarised in Table 3.11.
Table 3.11 Summary of base emission
rates for proposed LMC STW
|
LMC on-site STW Facilities |
Basis of odour emission factors
in STSTW |
SOER Adopted (ou/m2/s or ou/s)[1] |
|
Deodorization Unit 1 |
442.02 |
|
|
Inlet Pumping Station (Pump) |
Influent Channel PST |
7.80 |
|
Screens and Grit Traps |
Grit Surface, Inlet Work |
5.72 |
|
Primary Sedimentation Tanks |
Sedimentation Tank Surface PST |
5.68 |
|
Membrane Bioreactor (Bioreactor) including fine screen |
Aerobic Zone, Aeration Tanks |
0.6 |
|
Membrane Bioreactor (Membranes) |
||
|
Pump Compound |
||
|
Deodorization Unit 2 |
1989.02 |
|
|
Equalization Tank |
Sedimentation Tank Surface PST |
5.68 |
|
Primary Sludge Storage Tank |
Tank Surface, Sludge Holding Tank |
15.15 |
|
Primary Sludge Thickeners |
||
|
MBR Sludge Storage Tanks |
Sludge Transfer Pumping Station, Sludge Storage Tank |
3.90 |
|
Dissolved Air Flotation Units |
Tank Surface FST |
0.42 |
|
Aerobic Sludge Digestion Tanks |
Overflow Box Sludge Digester |
33.97 |
|
Sludge Filter Press House |
Dewatered Sludge Tank Surface, Sludge Dewatering building No. 2 |
5.58 |
Note:
[1] Emission rate
from the deodorization units is given in ou/s, which is estimated based on the emission rates of
individual facilities and their respective emission areas. Two deodorization
units 1 and 2 would serve the plant. Refer to Appendix 3-12 for SOER
calculation. Emission rates adopted in the model are in bold.
According to the engineering design of the
on-site STW, it will be equipped with two deodorization units,
each serves different facilities within the STW. Emission rates from the
deodorization units were derived from the sum of
unmitigated emission sources rates listed above for the facilities with a 95%
odour removal efficiency applied. 95% of odour removal efficiency was assumed
by making reference to “Code of Practice on Assessment and Control of Odour
Nuisance from Waste Water Treatment Works, April 2005”, which was also adopted
in the approved EIA for Harbour Area Treatment Scheme (HATS)[3-9].
The mitigated emission rates for deodorization units 1 and 2 are determined as 442.02 ou/s and 1989.02 ou/s respectively.
Binhe Wastewater Treatment Plant (WWTP)
An on-site inspection, together with PlanD and CEDD, to Binhe WWTP was conducted on 21 June 2010. Binhe
WWTP was built in 1983 and is operated by Shenzhen
Water (Group) Co. Ltd. (深圳市水務集團有限公司). To further improve the effluent discharge quality and
environmental conditions, Shenzhen Water (Group) Co. Ltd has been upgrading Binhe WWTP since October 2007. The ultimate goal of the
upgrading works is to increase the wastewater treatment capacity to 300,000m3/day
and meet the GB 18918-2002 Class IA Standard (城鎮污水處理廠污染物排放標準), i.e. odour
concentration of 10 OU at the
boundary of the WWTP.
The upgrading works consists of two portions. The
first portion is the decommissioning of the existing Phases I
and II wastewater treatment facilities and construction of a similar facility
with a handling capacity of 180,000m3/day. Biological deodorization
systems have been installed to various wastewater
treatment facilities including inlet pumping stations, fine grit removal,
aerated sedimentation tanks, primary and secondary sedimentation tanks and
biological reaction tanks.
The second portion is the upgrading works of the
existing Phase III wastewater treatment facilities so as to increase the
handling capacity to 120,000m3/day. Chemical deodorization systems will be installed to wastewater treatment facilities
including, inlet grit removal, upgrading pumps, aeration tanks etc.
Apart from the newly installed odour removal units,
most wastewater facilities, including the primary and secondary sedimentation
tanks, biological treatment tanks, and activated sludge tanks, have been
enclosed, and some facilities have landscaping feature or open garden above, to
mitigate odour nuisance. There are 16 deodorization units installed for a
combination of several processes including inlet pumping station, influent
channel, primary sedimentation tank, bioreactor and sludge pumping station, and
an additional one for dewatering tank and sludge digester. These emissions are
simulated as 17 point sources. Other facilities are
either uncovered or covered with hollow plastic covers. They are
simulated as area sources. Details of the Binhe
WWTP and photos of some of these facilities taken from the on-site inspection can be found in Appendix
3-10.
Since there is no available odour data for Binhe WWTP, the odour emission rates of the Shatin STW measured in 2006[3-5]
were adopted for modelling the odour emission from Binhe
WWTP. The Shatin STW adopts secondary treatment using
activated sludge process which is similar to the Binhe WWTP. Odour emission rates were
made reference to the measured data of existing STWs, including
facilities of inlet works, primary sedimentation tanks, aeration tanks, sludge holding tanks, sludge storage tanks, sludge digestion tanks,
sludge dewatering house and final sedimentation, as appropriate. A comparison
of Binhe WWTP and Sha Tin
STW is presented in Table 3.12 below. Measured emission rates for different facilities
of the Shatin STW are given
in Appendix 3-11.
Table 3.12: Comparison of
Binhe WWTP and Shatin STW
|
|
Binhe WWTP |
Sha Tin STW |
|
Daily capacity (m3/day) |
300,000 |
340,000 |
|
Sewage characteristic |
Domestic |
Domestic |
|
Treatment method |
Secondary |
Secondary |
In view of the similar treatment process as well as the flow capacity between Shatin STW and Binhe WWTP, measured emission rates from Shatin STW were adopted for representation of Binhe WWTP in the odour impact assessment.
For those covered sewage treatment facilities in Binhe WWTP, 95% of odour removal efficiency was assumed by making reference to “Code of Practice on Assessment and Control of Odour Nuisance from Waste Water Treatment Works, April 2005”, which was also adopted in the approved EIA for Harbour Area Treatment Scheme (HATS)[3-9]. For those uncovered sewage treatment facilities in Phase III of Binhe WWTP, unmitigated odour emission rates from Shatin STW were directly adopted. A summary of the adopted emission rates for Binhe WWTP is presented in Table 3.13.
Table 3.13 Summary of base
emission rates for Binhe WWTP
|
Facilities[1] |
Base Emission Rate (ou/m2/s) Shatin STW |
Mitigated SOER (ou/m2/s or ou/s)[2] Adopted for Binhe WWTP |
|
Area Sources |
||
|
Aeration Tank [Aerobic Zone Aeration Tank] |
0.6 |
0.6 |
|
Final Sedimentation Tank (Western) [Tank Surface FST] |
0.39 |
0.39 |
|
Aerobic Zone Aeration Tank [Aerobic Zone Aeration Tank] |
0.6 |
0.6 |
|
Final Sedimentation Tank (Eastern) [Tank Surface FST] |
0.39 |
0.39 |
|
Point Sources |
||
|
Deodorization Unit 1-16[3] |
148.2 |
|
|
Inlet Pumping Station [Influent Channel PST] |
7.80 |
0.39 |
|
Influent Channel [Influent Channel PST] |
7.80 |
0.39 |
|
Primary Sedimentation Tank [Sedimentation Tank Surface PST] |
5.68 |
0.284 |
|
Bioreactor and Sludge Pumping Station [Anoxic Zone Aeration Tank] |
0.59 |
0.0295 |
|
Deodorization Unit 17[4] |
84.54 |
|
|
Dewatering Tank and Sludge Digester [Tank Surface Sludge Holding Tank] |
15.15 |
0.7575 |
[1] Description in “[
]” indicates the facilities where emission rates were adopted from STSTW.
[2] Emission rates
from the deodorization units is given in ou/s, which
is estimated based on the emission rates of individual facilities listed
underneath and their respective emission areas. Emission rates adopted in the
model are in bold.
[3] Deodorization
unit 1-16 represent the 16 Deodorization units that serve the covered processes
of inlet pumping station & influent channel, primary sedimentation tank,
bioreactor and sludge pumping station at Binhe WWTP.
Refer to Appendix 3-12 for SOER calculation.
[4] Deodorization
unit 17 covers the dewatering tank and sludge digester at Binhe
WWTP. Refer to Appendix 3-12 for SOER calculation.
3.6 Identification and Evaluation of Environmental Impacts
3.6.1 Construction Phase
Besides the development of LMC Loop, the following Designated Projects (DPs) have been included in the dust impact assessment for construction phase:
·
Ecological
Area (DP1)
·
Western
Connection Road (DP2)
·
Direct
Linkage to LMC Station (DP3)
·
Drainage
System (under Internal Transport Networks) (DP4)
·
Sewage
Treatment Works (DP5)
·
Eastern
Connection Road (DP6)
·
Flushing
Water Service Reservoir (DP7)
3.6.1.1 Project Emission
Dust impact assessments have been carried out based on conservative assumptions of general construction activities which include the following:
Phase 1 Infrastructures
·
Site formation and clearance and ground excavation
in all zones within LMC Loop area (Figures
2.25a to d)
_Page_40.jpg)
_Page_43.jpg)
·
Construction
of the associated facilities for Internal Transport Network, Drainage
Discharge Points, Fire Station cum Ambulance Depot, District
Cooling System (Western) and Sewage Treatment Works
·
Construction
access along LMC Road, Direct Linkage to Lok Ma Chau
Station and Western Connection Road
(including Lok Ma Chau / San Tin Highway Connection);
and
·
Wind
erosion of all open sites.
Phase 2 Infrastructures
·
Construction
of Eastern Connection Road, District Cooling System (Eastern), Flush Water
Service Reservoir and the corresponding connection roads; and
·
Wind
erosion of all open sites.
Potential dust impact from other construction activities such as the utilities works, building and landscape works within the LMC Loop is considered to be minor. Locations of the dust emission sources mentioned above for Phase 1 Infrastructure and Phase 2 Infrastructure are shown in Appendix 3-3.
3.6.1.2 Concurrent Construction Activities
According to the best available information at the time of this study, the only concurrent projects activities for cumulative air quality assessment are the site formation from the construction work on the NENT NDA during Year 2024. Hence, the concurrent construction activities are included in the construction impact assessment.
3.6.2 Operational Phase
Operational air quality impact assessments have been carried out based on conservative assumptions of the following projects and the development of LMC Loop and their cumulative impacts:
·
Western
Connection Road (DP2)
·
Direct
Linkage to LMC Station (DP3)
·
Drainage
System under Internal Transport Networks (DP4)
·
Sewage
Treatment Works (DP5)
·
Eastern
Connection Road (DP6)
3.6.2.1 Vehicular Emission
During operational phase of the Project, major
sources of vehicular emission in different phases of development include:
Phase 1 Buildings
·
Vehicular
emission from road networks within 500m of LMC Loop Area, including Internal
Transport Network and road connections to the Drainage Discharge Points, Fire
Station cum Ambulance Depot, District Cooling System (Western) and Sewage
Treatment Works;
·
Vehicular
emission from road network within 500m of Direct Link to Lok
Ma Chau Station; and
·
Vehicular
emission from road network within 500m of Western Connection Road (including Lok Ma Chau/San Tin Highway Connection);
Phase 2 Buildings
·
Vehicular
emission from road networks within 500m of LMC Loop Area, including the road
connections to the District Cooling System (Eastern) and Flush Water Service
Reservoir; and
·
Vehicular emission from road network within
500m of Eastern Connection Road.
Vehicular emissions from open roads are determined by the EMFAC-HK model. As mentioned in Section 3.5.2.3,
EMFAC-HK v2.1 was employed at the time of assessment
(end 2012). Traffic data prepared by traffic engineer have
been endorsed by the Transport Department. Appendix 3-4 presents the methodology and assumptions adopted in
estimating the emission factors. The results have concluded that Year 2020 is
the worst assessment year for Phase 1 Infrastructure Development while Year
2027 is the worst assessment year when all roads are completed. Table 3.14 below summarizes the total
daily emissions in the Study Area for each assessment year.
Table 3.14 Summary of total daily air pollutant emissions for
LMCL
|
Year of Assessment |
Total Daily NOx
Emission (kg/day) |
Total Daily RSP Emission (kg/day) |
Remark |
|
2020 |
252 |
12 |
Commencement of Phase 1 Buildings |
|
2027 |
146 |
8 |
Commencement of Phase 2 Buildings |
|
2035 |
96 |
7 |
15 years after commencement of Phase 1
Buildings |
|
2042 |
92 |
6 |
15 years after commencement of Phase 2 Buildings |
3.6.2.2 Chimney Emission
Based on the verification findings from subsequent reconnaissance survey on 2 March, 2012, no industrial chimney was identified within the 500m from the boundary of the Project on Hong Kong side. According to the Draft Comprehensive Planning of Shenzhen City (2007-2020), the existing land use of Shenzhen within 500m from the Project boundary comprises mainly residential, commercial, government and community uses. The nearest potential industrial land use is located in Futian Bonded Zone in Futian District at more than 500m away from the Project boundary. In addition, Futian Bonded Zone is a free trade zone with hi-technology and modern logistics industries. According to the information from the Administration of Shenzhen Free Trade Zone, a plan to develop Futian Bonded Zone into the National Ecological Industrial Park was proposed to the Guangdong Environmental Protection Bureau in 2007 (http://www.szftz.gov.cn). Potential industrial emission impact is therefore not expected.
3.6.2.3 Odour Emission
During operational phase of the Project, major
odour emission sources include:
·
Odour
emission from the proposed STW within the LMC Loop Area;
·
Odour
emission from the existing Binhe WWTP in Shenzhen to
the east of the LMC Loop; and
·
Odour emission from the Shenzhen River.
3.6.2.4 Concurrent Operational Activities
Other concurrent projects, which may have cumulative air quality impacts during operation, have been identified. They include:
·
Increased
traffic flow induced from the opening of FCA; and
·
Increased
traffic flow induced from the proposed new road networks from the KTN NDA.
3.7 Prediction and Evaluation of Environmental Impacts
3.7.1 Construction Phase
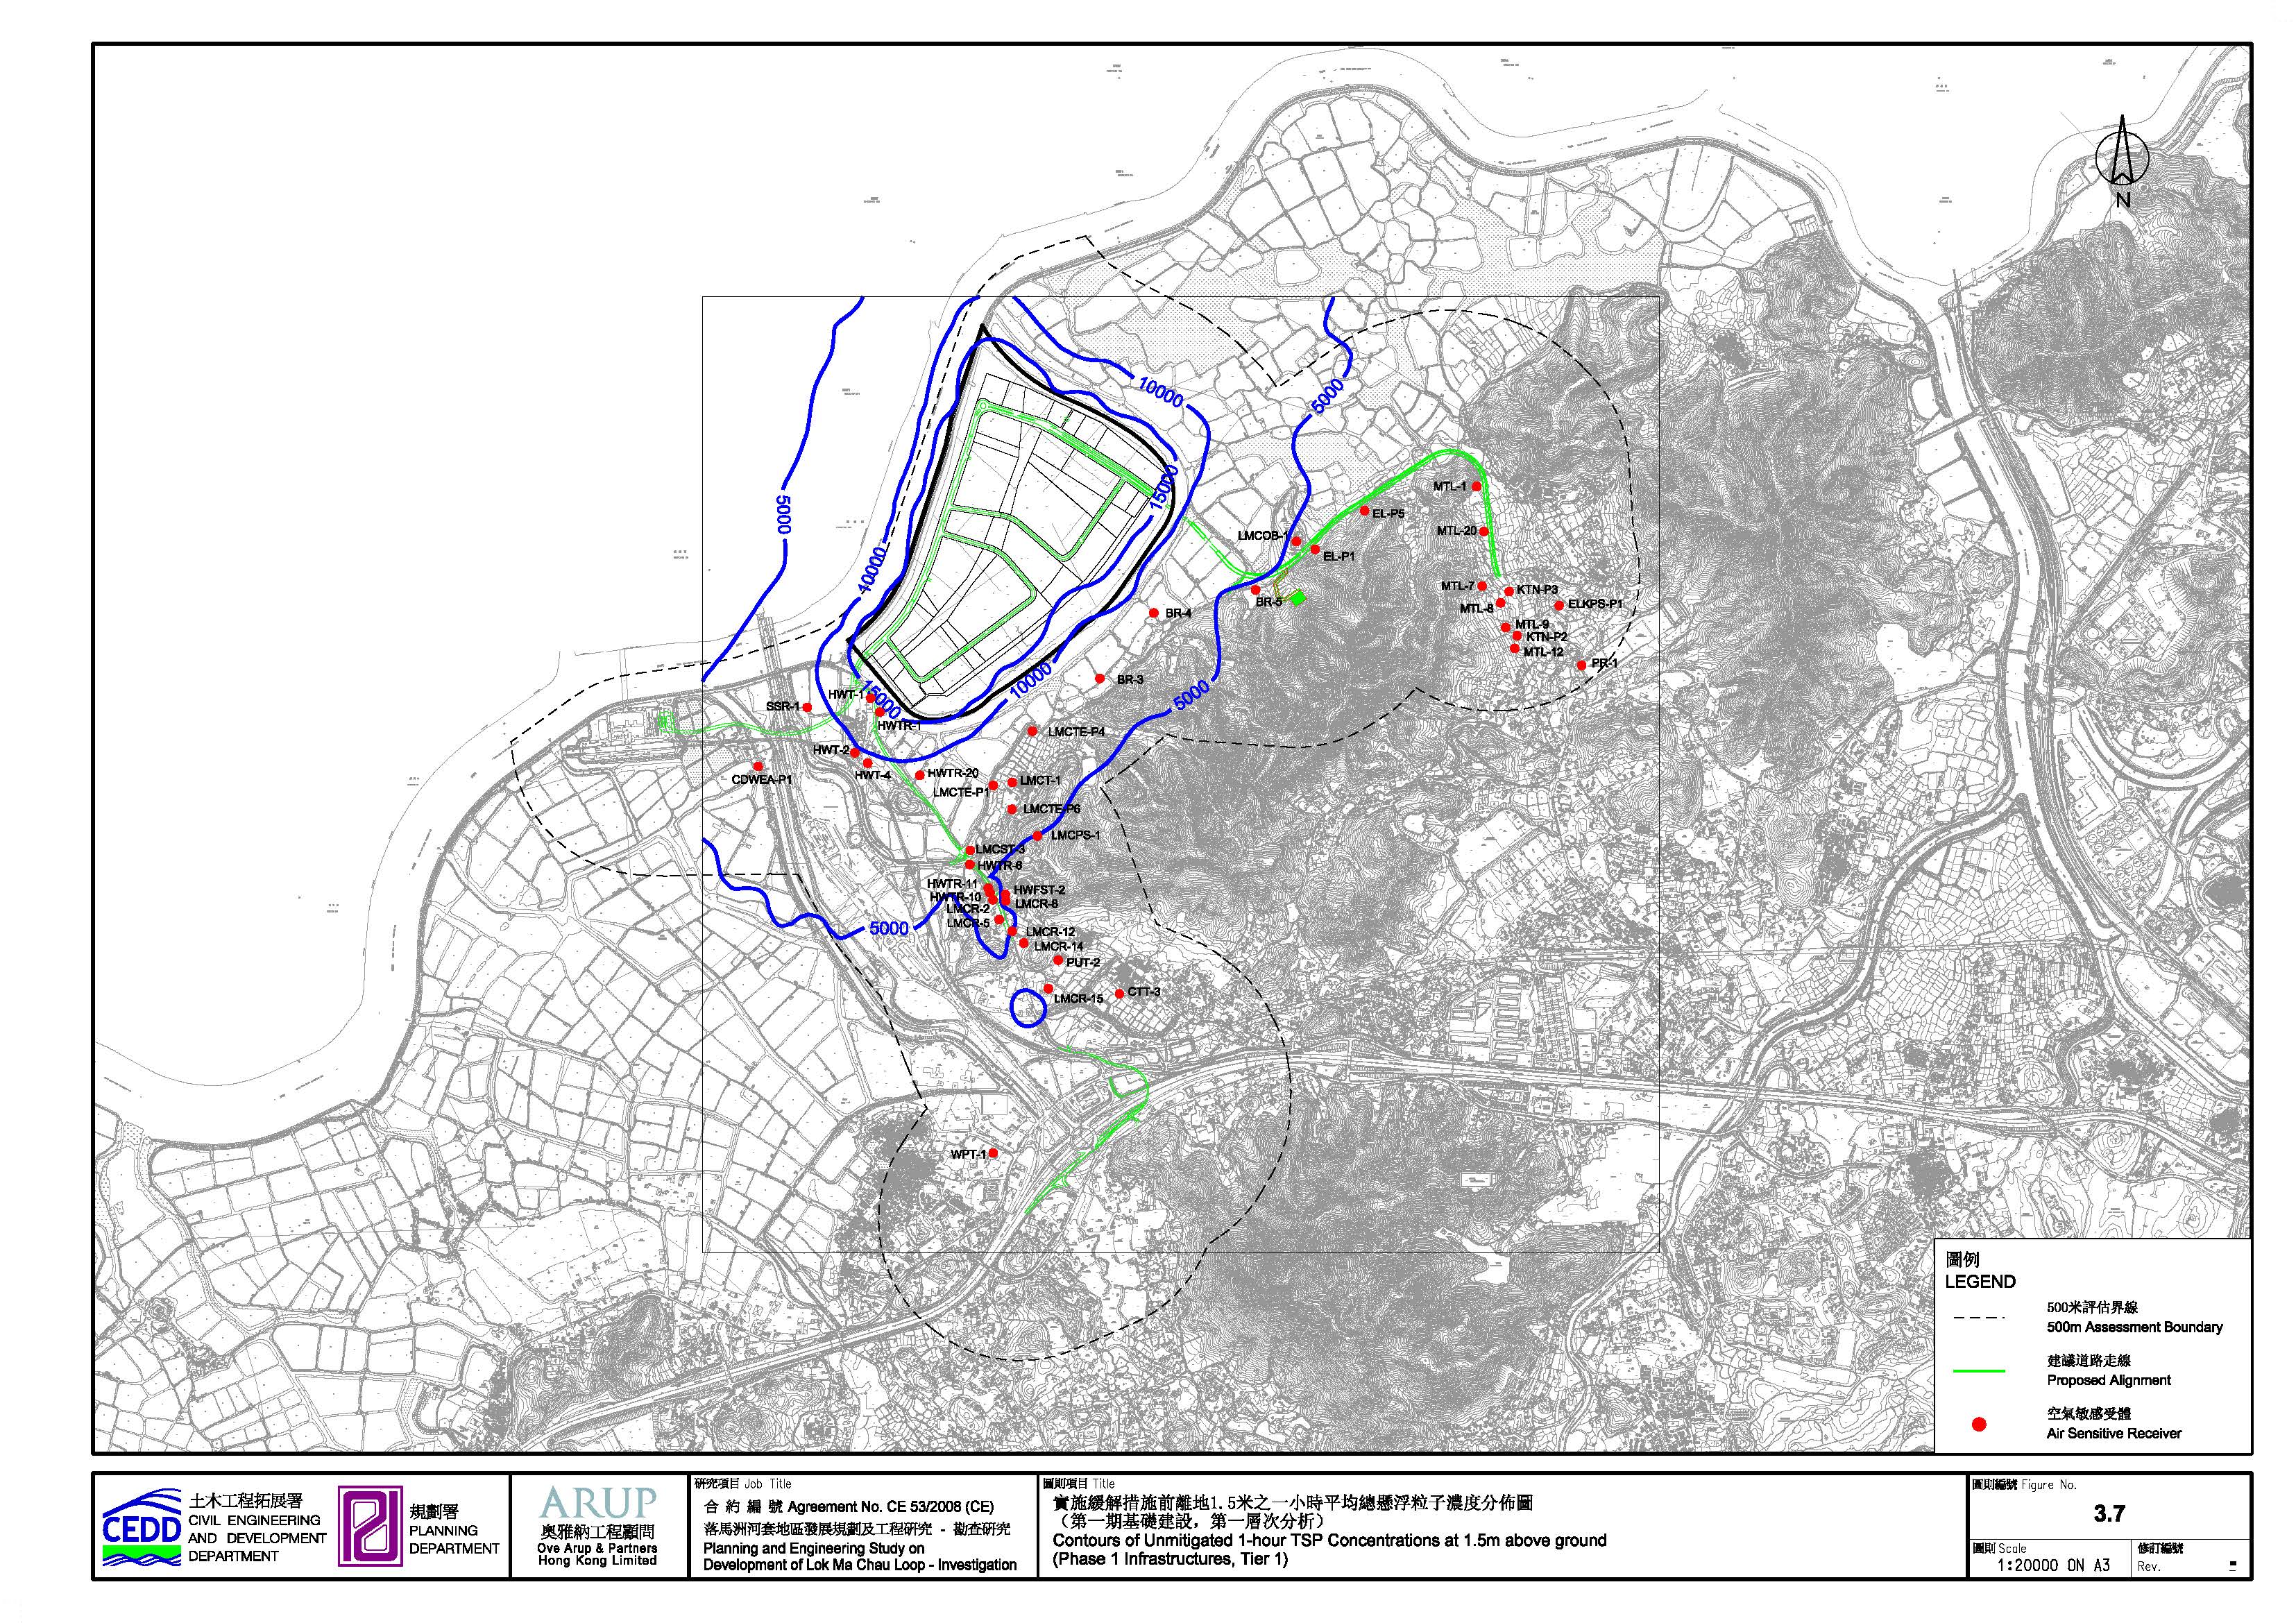
3.7.1.1 Assessment Results – Unmitigated Scenario for Phase 1 Infrastructures
Under the unmitigated Phase 1 Infrastructures, the maximum predicted 1-hour, 24-hour and annual average TSP levels due to the construction of the Project are summarised in Table 3.15. Results show exceedances of the relevant AQOs at the majority of the ASRs locations. Mitigation measures are therefore necessary to reduce the predicted dust impacts. Figures 3.7 to 3.9 show the contours of cumulative unmitigated 1-hour, 24-hour, and annual TSP concentrations in the LMC Loop development area.
_Page_18.jpg)
Table 3.15 Predicted unmitigated cumulative
1-hour, 24-hour, and Annual TSP concentrations at 1.5m above ground (including
background concentration of 73.1μg/m3)
|
Location
of ASRs |
Assessment
Points |
TSP Concentrations (μg/m3) |
||
|
1-hour |
24-hour |
Annual |
||
|
AQO
Standard |
500 |
260 |
80 |
|
|
Existing ASRs |
||||
|
Border Road |
BR-3 |
6555.8 |
1338.3 |
77.3 |
|
BR-4 |
7917.0 |
1047.3 |
76.4 |
|
|
BR-5 |
4742.8 |
370.6 |
73.9 |
|
|
Chau Tau Tsuen |
CTT-3 |
3060.8 |
600.9 |
74.5 |
|
Ha Wan Fisherman San Tsuen |
HWFST-2 |
4578.4 |
848.9 |
76.5 |
|
Ha Wan Tsuen |
HWT-1 |
13982.1 |
1325.2 |
84.8 |
|
HWT-2 |
9718.7 |
791.8 |
76.5 |
|
|
HWT-4 |
9294.9 |
989.7 |
76.7 |
|
|
Ha Wan Tsuen Road |
HWTR-1 |
13364.7 |
1490.9 |
82.6 |
|
HWTR-6 |
5696.0 |
1187.9 |
86.9 |
|
|
HWTR-10 |
7351.3 |
1593.8 |
84.0 |
|
|
HWTR-11 |
4926.8 |
1039.3 |
85.4 |
|
|
HWTR-20 |
9014.0 |
1408.6 |
78.0 |
|
|
Lok Ma Chau Operation
Base |
LMCOB-1 |
4821.8 |
396.0 |
73.7 |
|
Lok Ma Chau Police
Station |
LMCPS-1 |
4994.5 |
980.7 |
75.8 |
|
Lok Ma Chau Road |
LMCR-2 |
5371.9 |
1171.2 |
83.7 |
|
LMCR-5 |
6309.7 |
1052.4 |
82.3 |
|
|
LMCR-8 |
4505.5 |
858.4 |
76.2 |
|
|
LMCR-12 |
4772.9 |
969.3 |
76.6 |
|
|
LMCR-14 |
3805.6 |
763.4 |
75.7 |
|
|
LMCR-15 |
3452.9 |
623.4 |
75.2 |
|
|
Lok Ma
Chau San Tsuen |
LMCST-3 |
5651.0 |
1032.0 |
77.0 |
|
Lok Ma
Chau Tsuen |
LMCT-1 |
6109.9 |
1348.9 |
77.1 |
|
Ma Tso Lung |
MTL-1 |
3227.5 |
270.6 |
73.3 |
|
MTL-7 |
2989.3 |
231.8 |
73.3 |
|
|
MTL-8 |
2807.6 |
216.9 |
73.3 |
|
|
MTL-9 |
2723.2 |
200.2 |
73.3 |
|
|
MTL-12 |
2713.7 |
195.3 |
73.3 |
|
|
MTL-20 |
2983.9 |
257.1 |
73.3 |
|
|
Lo Wu
Police Range |
PR-1 |
2390.2 |
180.0 |
73.2 |
|
Pun Uk Tsuen |
PUT-2 |
3679.7 |
670.9 |
74.9 |
|
San Sham
Road |
SSR-1 |
8707.5 |
638.1 |
77.0 |
|
Near Wing
Ping Tsuen |
WPT-1 |
3062.8 |
470.8 |
74.5 |
|
Planned ASRs |
||||
|
Comprehensive Development and Wetland Enhancement
Area |
CDWEA-P1 |
6666.4 |
468.1 |
74.9 |
|
Ex-Lung Kai Public School |
ELKPS-P1 |
2612.1 |
200.3 |
73.3 |
|
Eco-Lodge |
EL-P1 |
4494.2 |
358.6 |
73.6 |
|
EL-P5 |
4046.7 |
348.4 |
73.5 |
|
|
KTN NDA |
KTN-P2 |
2676.7 |
193.8 |
73.3 |
|
KTN-P3 |
2850.4 |
220.5 |
73.3 |
|
|
LMC Loop |
LMCL-P1 |
N/A[2] |
N/A[2] |
N/A[2] |
|
LMCL-P2 |
N/A[2] |
N/A[2] |
N/A[2] |
|
|
LMCL-P4 |
N/A[2] |
N/A[2] |
N/A[2] |
|
|
LMCL-P6 |
N/A[2] |
N/A[2] |
N/A[2] |
|
|
LMCL-P7 |
N/A[2] |
N/A[2] |
N/A[2] |
|
|
LMCL-P8 |
N/A[2] |
N/A[2] |
N/A[2] |
|
|
LMCL-P9 |
N/A[2] |
N/A[2] |
N/A[2] |
|
|
LMCL-P11 |
N/A[2] |
N/A[2] |
N/A[2] |
|
|
Proposed Fire Station and Ambulance Depot |
FS-P1 |
N/A[2] |
N/A[2] |
N/A[2] |
|
Lok Ma Chau Tsuen Expansion |
LMCTE-P1 |
6730.5 |
1396.3 |
77.3 |
|
LMCTE-P4 |
7435.5 |
1559.4 |
78.1 |
|
|
LMCTE-P6 |
5580.0 |
1179.1 |
76.5 |
|
Notes:
[1] Values which exceeded
AQO are shown as bolded characters.
[2] The premises are located within the works
site boundary hence the population intake would be after the construction of
the Phase 1 Infrastructures of the Project, i.e. no impact from the Project under Phase 1 Infrastructure.
[3] For ASR LMCL-P12 to
LMCL-P28, the premises
are located within the works site boundary and the population intake would be
after the construction of both Phase 1 and Phase 2 Infrastructures of the Project, i.e. no impact from the construction
phase of the Project and
therefore not included in the construction dust assessment.
3.7.1.2 Assessment Results – Unmitigated Scenario for Phase 2 Infrastructures
Under the unmitigated Phase 2 Infrastructures, the maximum predicted 1-hour, 24-hour and annual average TSP levels due to the construction of the Project are summarised in Table 3.16. Results show exceedances of the relevant AQOs at the majority of the ASR locations. Mitigation measures are therefore necessary to reduce the predicted dust impacts. Figures 3.10 to 3.12 show the contours of cumulative unmitigated 1-hour, 24-hour, and annual TSP concentrations in the LMC Loop development area.
Table 3.16 Predicted unmitigated cumulative
1-hour, 24-hour, and Annual TSP concentrations at 1.5m above ground (including
background concentration of 73.1μg/m3)
|
Location
of ASRs |
Assessment
Points |
TSP Concentrations (μg/m3) |
||
|
1-hour |
24-hour |
Annual |
||
|
AQO
Standard |
500 |
260 |
80 |
|
|
Existing ASRs |
||||
|
Border Road |
BR-3 |
1614.7 |
156.5 |
73.7 |
|
BR-4 |
3565.2 |
328.8 |
75.3 |
|
|
BR-5 |
9254.8 |
1499.5 |
82.6 |
|
|
Chau Tau Tsuen |
CTT-3 |
542.1 |
124.7 |
73.2 |
|
Ha Wan Fisherman San Tsuen |
HWFST-2 |
620.0 |
102.4 |
73.2 |
|
Ha Wan Tsuen |
HWT-1 |
809.8 |
138.1 |
73.3 |
|
HWT-2 |
688.7 |
104.2 |
73.3 |
|
|
HWT-4 |
738.5 |
105.2 |
73.2 |
|
|
Ha Wan Tsuen Road |
HWTR-1 |
716.9 |
130.0 |
73.3 |
|
HWTR-6 |
668.0 |
101.1 |
73.2 |
|
|
HWTR-10 |
544.8 |
98.6 |
73.2 |
|
|
HWTR-11 |
551.7 |
97.8 |
73.2 |
|
|
HWTR-20 |
652.4 |
105.8 |
73.3 |
|
|
Lok Ma Chau Operation
Base |
LMCOB-1 |
2532.4 |
469.8 |
77.2 |
|
Lok Ma Chau Police
Station |
LMCPS-1 |
748.5 |
111.1 |
73.3 |
|
Lok Ma Chau Road |
LMCR-2 |
570.1 |
99.7 |
73.2 |
|
LMCR-5 |
596.6 |
100.8 |
73.2 |
|
|
LMCR-8 |
620.8 |
102.3 |
73.2 |
|
|
LMCR-12 |
590.3 |
101.1 |
73.2 |
|
|
LMCR-14 |
540.6 |
101.3 |
73.2 |
|
|
LMCR-15 |
533.9 |
113.8 |
73.2 |
|
|
Lok Ma
Chau San Tsuen |
LMCST-3 |
691.0 |
102.1 |
73.2 |
|
Lok Ma
Chau Tsuen |
LMCT-1 |
850.3 |
110.1 |
73.3 |
|
Ma Tso Lung |
MTL-1 |
4500.1 |
461.9 |
77.1 |
|
MTL-7 |
7666.2 |
1670.9 |
81.0 |
|
|
MTL-8 |
8153.6 |
1875.6 |
87.3 |
|
|
MTL-9 |
5862.6 |
1124.3 |
80.7 |
|
|
MTL-12 |
5877.0 |
974.7 |
79.1 |
|
|
MTL-20 |
6464.9 |
644.5 |
78.9 |
|
|
Lo Wu
Police Range |
PR-1 |
7845.8 |
1106.9 |
77.9 |
|
Pun Uk Tsuen |
PUT-2 |
574.0 |
117.3 |
73.2 |
|
San Sham
Road |
SSR-1 |
695.5 |
128.1 |
73.3 |
|
Near Wing
Ping Tsuen |
WPT-1 |
386.9 |
101.0 |
73.2 |
|
Planned ASRs |
||||
|
Comprehensive Development and Wetland Enhancement
Area |
CDWEA-P1 |
491.5 |
110.1 |
73.2 |
|
Ex-Lung Kai Public School |
ELKPS-P1 |
7021.9 |
1290.5 |
80.3 |
|
Eco-Lodge |
EL-P1 |
4645.3 |
651.8 |
77.5 |
|
EL-P5 |
2740.2 |
617.0 |
77.4 |
|
|
KTN NDA |
KTN-P2 |
7271.4 |
1310.6 |
81.7 |
|
KTN-P3 |
8256.2 |
2211.1 |
86.3 |
|
|
LMC Loop |
LMCL-P1 |
853.8 |
119.0 |
73.6 |
|
LMCL-P2 |
1284.3 |
133.9 |
73.8 |
|
|
LMCL-P4 |
1596.6 |
163.7 |
74.0 |
|
|
LMCL-P6 |
1147.8 |
169.4 |
74.0 |
|
|
LMCL-P7 |
1243.8 |
176.8 |
73.5 |
|
|
LMCL-P8 |
1007.8 |
155.7 |
73.4 |
|
|
LMCL-P9 |
1257.6 |
177.9 |
73.5 |
|
|
LMCL-P11 |
1443.6 |
195.4 |
73.9 |
|
|
Proposed Fire Station and Ambulance Depot |
FS-P1 |
3834.5 |
492.1 |
78.1 |
|
Lok Ma Chau Tsuen Expansion |
LMCTE-P1 |
766.2 |
112.5 |
73.3 |
|
LMCTE-P4 |
1089.6 |
129.1 |
73.4 |
|
|
LMCTE-P6 |
822.5 |
108.3 |
73.3 |
|
Note:
[1] Values which exceeded
AQO are shown as bolded characters.
[2] For ASR LMCL-P12 to
LMCL-P28, the premises
are located within the works site boundary and the population intake would be
after the construction of both Phase 1 and Phase 2 Infrastructures of the Project, i.e. no impact from the construction
phase of the Project and
therefore not included in the construction dust assessment.
3.7.1.3 Cumulative Dust Impacts
Without any mitigation measures in place, cumulative dust impact would be anticipated. Hence, mitigation measures are recommended.
3.7.2 Operational Phase – Vehicular Emission
The air
quality impact from maximum 1-hour, maximum 24-hour & annual concentration
of NO2 and maximum 24-hour & annual concentration of RSP at the
identified existing/planned ASRs for the worst assessment year (i.e. Year 2020)
are summarised in Tables 3.17 to 3.18.
Table 3.17 Summary of 1-hour, 24-hour and
Annual cumulative concentration of NO2 at the identified ASRs in
Year 2020 (including background concentration of 48.5 μg/m3)
|
Location of ASRs |
Assessment Points |
NO2
Concentrations (μg/m3) |
||
|
1-hour |
24-hour |
Annual |
||
|
AQO
Standard |
300 |
150 |
80 |
|
|
Existing ASRs |
||||
|
Border Road |
BR-3 |
76 |
53 |
49 |
|
BR-4 |
70 |
52 |
49 |
|
|
BR-5 |
68 |
51 |
49 |
|
|
Chau Tau Tsuen |
CTT-3 |
101 |
55 |
51 |
|
Ha Wan Fisherman San Tsuen |
HWFST-2 |
124 |
58 |
51 |
|
Ha Wan Tsuen |
HWT-1 |
122 |
59 |
52 |
|
HWT-2 |
154 |
64 |
52 |
|
|
HWT-4 |
155 |
63 |
52 |
|
|
Ha Wan Tsuen Road |
HWTR-1 |
120 |
60 |
51 |
|
HWTR-6 |
123 |
64 |
57 |
|
|
HWTR-10 |
122 |
60 |
55 |
|
|
HWTR-11 |
126 |
63 |
57 |
|
|
HWTR-20 |
114 |
63 |
51 |
|
|
Lok Ma Chau Operation
Base |
LMCOB-1 |
67 |
51 |
49 |
|
Lok Ma Chau Police
Station |
LMCPS-1 |
104 |
55 |
50 |
|
Lok Ma Chau Road |
LMCR-2 |
148 |
61 |
55 |
|
LMCR-5 |
151 |
61 |
54 |
|
|
LMCR-8 |
145 |
59 |
51 |
|
|
LMCR-12 |
158 |
66 |
52 |
|
|
LMCR-14 |
142 |
60 |
51 |
|
|
LMCR-15 |
141 |
58 |
51 |
|
|
Lok Ma
Chau San Tsuen |
LMCST-3 |
134 |
63 |
52 |
|
Lok Ma
Chau Tsuen |
LMCT-1 |
99 |
58 |
50 |
|
Ma Tso Lung |
MTL-1 |
62 |
50 |
49 |
|
MTL-7 |
61 |
51 |
49 |
|
|
MTL-8 |
62 |
50 |
49 |
|
|
MTL-9 |
65 |
51 |
49 |
|
|
MTL-12 |
66 |
51 |
49 |
|
|
MTL-20 |
63 |
50 |
49 |
|
|
Lo Wu
Police Range |
PR-1 |
62 |
50 |
49 |
|
Pun Uk Tsuen |
PUT-2 |
137 |
56 |
51 |
|
San Sham
Road |
SSR-1 |
137 |
61 |
51 |
|
Near Wing
Ping Tsuen |
WPT-1 |
115 |
61 |
54 |
|
Planned ASRs |
||||
|
Comprehensive Development and Wetland Enhancement
Area |
CDWEA-P1 |
183 |
68 |
52 |
|
Ex-Lung Kai Public School |
ELKPS-P1 |
65 |
50 |
49 |
|
Eco-Lodge |
EL-P1 |
66 |
51 |
49 |
|
EL-P5 |
64 |
50 |
49 |
|
|
KTN NDA |
KTN-P2 |
65 |
51 |
49 |
|
KTN-P3 |
62 |
50 |
49 |
|
|
LMC Loop |
LMCL-P1 |
83 |
56 |
50 |
|
LMCL-P2 |
80 |
56 |
50 |
|
|
LMCL-P4 |
78 |
53 |
49 |
|
|
LMCL-P6 |
76 |
53 |
49 |
|
|
LMCL-P7 |
87 |
55 |
50 |
|
|
LMCL-P8 |
92 |
57 |
50 |
|
|
LMCL-P9 |
89 |
55 |
50 |
|
|
LMCL-P11 |
74 |
53 |
49 |
|
|
LMCL-P12 |
77 |
56 |
50 |
|
|
LMCL-P15 |
78 |
55 |
50 |
|
|
LMCL-P16 |
76 |
52 |
50 |
|
|
LMCL-P17 |
74 |
52 |
50 |
|
|
LMCL-P18 |
72 |
52 |
49 |
|
|
LMCL-P19 |
71 |
52 |
49 |
|
|
LMCL-P21 |
73 |
52 |
49 |
|
|
LMCL-P23 |
75 |
52 |
49 |
|
|
LMCL-P24 |
76 |
53 |
49 |
|
|
LMCL-P25 |
80 |
53 |
49 |
|
|
LMCL-P26 |
72 |
52 |
49 |
|
|
LMCL-P27 |
71 |
52 |
49 |
|
|
LMCL-P28 |
71 |
52 |
49 |
|
|
Proposed Fire Station and Ambulance Depot |
FS-P1 |
81 |
56 |
51 |
|
Lok Ma Chau Tsuen Expansion |
LMCTE-P1 |
102 |
59 |
50 |
|
LMCTE-P4 |
85 |
54 |
50 |
|
|
LMCTE-P6 |
103 |
56 |
50 |
|
Table 3.18 Summary of 24-hour and Annual
cumulative concentration of RSP at identified ASRs in Year 2020 (including background
concentration of 50.5 μg/m3)
|
Location
of ASRs |
Assessment
Points |
RSP Concentrations (μg/m3) |
|
|
24-hour |
Annual |
||
|
AQO
Standard |
180 |
55 |
|
|
Existing ASRs |
|||
|
Border Road |
BR-3 |
51 |
51 |
|
BR-4 |
51 |
51 |
|
|
BR-5 |
51 |
51 |
|
|
Chau Tau Tsuen |
CTT-3 |
52 |
51 |
|
Ha Wan Fisherman San Tsuen |
HWFST-2 |
52 |
51 |
|
Ha Wan Tsuen |
HWT-1 |
52 |
51 |
|
HWT-2 |
53 |
51 |
|
|
HWT-4 |
52 |
51 |
|
|
Ha Wan Tsuen Road |
HWTR-1 |
52 |
51 |
|
HWTR-6 |
53 |
52 |
|
|
HWTR-10 |
52 |
51 |
|
|
HWTR-11 |
52 |
52 |
|
|
HWTR-20 |
53 |
51 |
|
|
Lok Ma Chau Operation
Base |
LMCOB-1 |
51 |
51 |
|
Lok Ma Chau Police
Station |
LMCPS-1 |
51 |
51 |
|
Lok Ma Chau Road |
LMCR-2 |
52 |
51 |
|
LMCR-5 |
52 |
51 |
|
|
LMCR-8 |
52 |
51 |
|
|
LMCR-12 |
53 |
51 |
|
|
LMCR-14 |
52 |
51 |
|
|
LMCR-15 |
52 |
51 |
|
|
Lok Ma
Chau San Tsuen |
LMCST-3 |
52 |
51 |
|
Lok Ma
Chau Tsuen |
LMCT-1 |
52 |
51 |
|
Ma Tso Lung |
MTL-1 |
51 |
51 |
|
MTL-7 |
51 |
51 |
|
|
MTL-8 |
51 |
51 |
|
|
MTL-9 |
51 |
51 |
|
|
MTL-12 |
51 |
51 |
|
|
MTL-20 |
51 |
51 |
|
|
Lo Wu Police
Range |
PR-1 |
51 |
51 |
|
Pun Uk Tsuen |
PUT-2 |
52 |
51 |
|
San Sham
Road |
SSR-1 |
52 |
51 |
|
Near Wing
Ping Tsuen |
WPT-1 |
54 |
52 |
|
Planned ASRs |
|||
|
Comprehensive Development and Wetland Enhancement
Area |
CDWEA-P1 |
53 |
51 |
|
Ex-Lung Kai Public School |
ELKPS-P1 |
51 |
51 |
|
Eco-Lodge |
EL-P1 |
51 |
51 |
|
EL-P5 |
51 |
51 |
|
|
KTN NDA |
KTN-P2 |
51 |
51 |
|
KTN-P3 |
51 |
51 |
|
|
LMC Loop |
LMCL-P1 |
51 |
51 |
|
LMCL-P2 |
51 |
51 |
|
|
LMCL-P4 |
51 |
51 |
|
|
LMCL-P6 |
51 |
51 |
|
|
LMCL-P7 |
51 |
51 |
|
|
LMCL-P8 |
52 |
51 |
|
|
LMCL-P9 |
51 |
51 |
|
|
LMCL-P11 |
51 |
51 |
|
|
LMCL-P12 |
51 |
51 |
|
|
LMCL-P15 |
51 |
51 |
|
|
LMCL-P16 |
51 |
51 |
|
|
LMCL-P17 |
51 |
51 |
|
|
LMCL-P18 |
51 |
51 |
|
|
LMCL-P19 |
51 |
51 |
|
|
LMCL-P21 |
51 |
51 |
|
|
LMCL-P23 |
51 |
51 |
|
|
LMCL-P24 |
51 |
51 |
|
|
LMCL-P25 |
51 |
51 |
|
|
LMCL-P26 |
51 |
51 |
|
|
LMCL-P27 |
51 |
51 |
|
|
LMCL-P28 |
51 |
51 |
|
|
Proposed Fire Station and Ambulance Depot |
FS-P1 |
51 |
51 |
|
Lok Ma Chau Tsuen Expansion |
LMCTE-P1 |
52 |
51 |
|
LMCTE-P4 |
51 |
51 |
|
|
LMCTE-P6 |
52 |
51 |
|
Since Eastern
Connection Road would commence operation in Year 2027, the assessment results
in Table 3.16 and Table 3.17 have not included the emission from Eastern Connection Road. Based
on assessment year determination findings, Year 2027
generates the second highest vehicular emission within the study area. Hence,
air quality impact at Year 2027 was also assessed to
predict the air quality impact due to Phase 2 infrastructure. The assessment
results are summarised in Tables 3.19 to 3.20.
Table 3.19 Summary of 1-hour, 24-hour and
Annual cumulative concentration of NO2 at identified ASRs in Year
2027 (including background concentration of 48.5 μg/m3)
|
Location
of ASRs |
Assessment
Points |
NO2 Concentrations (μg/m3) |
||
|
1-hour |
24-hour |
Annual |
||
|
AQO
Standard |
300 |
150 |
80 |
|
|
Existing ASRs |
||||
|
Border Road |
BR-3 |
73 |
52 |
49 |
|
BR-4 |
67 |
51 |
49 |
|
|
BR-5 |
65 |
50 |
49 |
|
|
Chau Tau Tsuen |
CTT-3 |
93 |
52 |
50 |
|
Ha Wan Fisherman San Tsuen |
HWFST-2 |
112 |
55 |
50 |
|
Ha Wan Tsuen |
HWT-1 |
113 |
57 |
51 |
|
HWT-2 |
136 |
61 |
51 |
|
|
HWT-4 |
140 |
60 |
51 |
|
|
Ha Wan Tsuen Road |
HWTR-1 |
111 |
57 |
50 |
|
HWTR-6 |
113 |
61 |
53 |
|
|
HWTR-10 |
114 |
56 |
52 |
|
|
HWTR-11 |
117 |
58 |
53 |
|
|
HWTR-20 |
106 |
61 |
51 |
|
|
Lok Ma Chau Operation
Base |
LMCOB-1 |
65 |
50 |
49 |
|
Lok Ma Chau Police
Station |
LMCPS-1 |
97 |
54 |
49 |
|
Lok Ma Chau Road |
LMCR-2 |
136 |
56 |
52 |
|
LMCR-5 |
139 |
58 |
52 |
|
|
LMCR-8 |
130 |
56 |
50 |
|
|
LMCR-12 |
140 |
61 |
51 |
|
|
LMCR-14 |
128 |
57 |
50 |
|
|
LMCR-15 |
128 |
55 |
50 |
|
|
Lok Ma
Chau San Tsuen |
LMCST-3 |
120 |
60 |
51 |
|
Lok Ma
Chau Tsuen |
LMCT-1 |
93 |
57 |
49 |
|
Ma Tso Lung |
MTL-1 |
57 |
50 |
49 |
|
MTL-7 |
59 |
50 |
49 |
|
|
MTL-8 |
56 |
50 |
49 |
|
|
MTL-9 |
58 |
50 |
49 |
|
|
MTL-12 |
61 |
50 |
49 |
|
|
MTL-20 |
61 |
50 |
49 |
|
|
Lo Wu
Police Range |
PR-1 |
60 |
50 |
49 |
|
Pun Uk Tsuen |
PUT-2 |
125 |
54 |
50 |
|
San Sham
Road |
SSR-1 |
125 |
59 |
51 |
|
Near Wing
Ping Tsuen |
WPT-1 |
106 |
57 |
51 |
|
Planned ASRs |
||||
|
Comprehensive Development and Wetland Enhancement
Area |
CDWEA-P1 |
162 |
64 |
51 |
|
Ex-Lung Kai Public School |
ELKPS-P1 |
58 |
50 |
49 |
|
Eco-Lodge |
EL-P1 |
63 |
51 |
49 |
|
EL-P5 |
62 |
50 |
49 |
|
|
KTN NDA |
KTN-P2 |
60 |
50 |
49 |
|
KTN-P3 |
58 |
50 |
49 |
|
|
LMC Loop |
LMCL-P1 |
78 |
55 |
50 |
|
LMCL-P2 |
75 |
55 |
50 |
|
|
LMCL-P4 |
74 |
52 |
49 |
|
|
LMCL-P6 |
72 |
52 |
49 |
|
|
LMCL-P7 |
82 |
54 |
49 |
|
|
LMCL-P8 |
86 |
55 |
50 |
|
|
LMCL-P9 |
84 |
54 |
49 |
|
|
LMCL-P11 |
70 |
52 |
49 |
|
|
LMCL-P12 |
74 |
55 |
50 |
|
|
LMCL-P15 |
75 |
54 |
50 |
|
|
LMCL-P16 |
72 |
52 |
50 |
|
|
LMCL-P17 |
70 |
52 |
49 |
|
|
LMCL-P18 |
69 |
51 |
49 |
|
|
LMCL-P19 |
68 |
51 |
49 |
|
|
LMCL-P21 |
69 |
51 |
49 |
|
|
LMCL-P23 |
72 |
52 |
49 |
|
|
LMCL-P24 |
73 |
52 |
49 |
|
|
LMCL-P25 |
76 |
52 |
49 |
|
|
LMCL-P26 |
69 |
51 |
49 |
|
|
LMCL-P27 |
68 |
51 |
49 |
|
|
LMCL-P28 |
68 |
51 |
49 |
|
|
Proposed Fire Station and Ambulance Depot |
FS-P1 |
80 |
56 |
51 |
|
Lok Ma Chau Tsuen Expansion |
LMCTE-P1 |
95 |
57 |
50 |
|
LMCTE-P4 |
80 |
53 |
49 |
|
|
LMCTE-P6 |
96 |
55 |
50 |
|
Table 3.20 Summary of 24-hour and Annual
cumulative concentration of RSP at identified ASRs in Year 2027 (including
background concentration of 50.5 μg/m3)
|
Location
of ASRs |
Assessment
Points |
RSP Concentrations (μg/m3) |
|
|
24-hour |
Annual |
||
|
AQO
Standard |
180 |
55 |
|
|
Existing ASRs |
|||
|
Border Road |
BR-3 |
51 |
51 |
|
BR-4 |
51 |
51 |
|
|
BR-5 |
51 |
51 |
|
|
Chau Tau Tsuen |
CTT-3 |
52 |
51 |
|
Ha Wan Fisherman San Tsuen |
HWFST-2 |
51 |
51 |
|
Ha Wan Tsuen |
HWT-1 |
52 |
51 |
|
HWT-2 |
52 |
51 |
|
|
HWT-4 |
52 |
51 |
|
|
Ha Wan Tsuen Road |
HWTR-1 |
52 |
51 |
|
HWTR-6 |
52 |
51 |
|
|
HWTR-10 |
52 |
51 |
|
|
HWTR-11 |
52 |
51 |
|
|
HWTR-20 |
52 |
51 |
|
|
Lok Ma Chau Operation
Base |
LMCOB-1 |
51 |
51 |
|
Lok Ma Chau Police
Station |
LMCPS-1 |
51 |
51 |
|
Lok Ma Chau Road |
LMCR-2 |
52 |
51 |
|
LMCR-5 |
52 |
51 |
|
|
LMCR-8 |
51 |
51 |
|
|
LMCR-12 |
52 |
51 |
|
|
LMCR-14 |
52 |
51 |
|
|
LMCR-15 |
52 |
51 |
|
|
Lok Ma
Chau San Tsuen |
LMCST-3 |
52 |
51 |
|
Lok Ma Chau
Tsuen |
LMCT-1 |
51 |
51 |
|
Ma Tso Lung |
MTL-1 |
51 |
51 |
|
MTL-7 |
51 |
51 |
|
|
MTL-8 |
51 |
51 |
|
|
MTL-9 |
51 |
51 |
|
|
MTL-12 |
51 |
51 |
|
|
MTL-20 |
51 |
51 |
|
|
Lo Wu
Police Range |
PR-1 |
51 |
51 |
|
Pun Uk Tsuen |
PUT-2 |
51 |
51 |
|
San Sham
Road |
SSR-1 |
52 |
51 |
|
Near Wing
Ping Tsuen |
WPT-1 |
53 |
52 |
|
Planned ASRs |
|||
|
Comprehensive Development and Wetland Enhancement
Area |
CDWEA-P1 |
53 |
51 |
|
Ex-Lung Kai Public School |
ELKPS-P1 |
51 |
51 |
|
Eco-Lodge |
EL-P1 |
51 |
51 |
|
EL-P5 |
51 |
51 |
|
|
KTN NDA |
KTN-P2 |
51 |
51 |
|
KTN-P3 |
51 |
51 |
|
|
LMC Loop |
LMCL-P1 |
51 |
51 |
|
LMCL-P2 |
51 |
51 |
|
|
LMCL-P4 |
51 |
51 |
|
|
LMCL-P6 |
51 |
51 |
|
|
LMCL-P7 |
51 |
51 |
|
|
LMCL-P8 |
51 |
51 |
|
|
LMCL-P9 |
51 |
51 |
|
|
LMCL-P11 |
51 |
51 |
|
|
LMCL-P12 |
51 |
51 |
|
|
LMCL-P15 |
51 |
51 |
|
|
LMCL-P16 |
51 |
51 |
|
|
LMCL-P17 |
51 |
51 |
|
|
LMCL-P18 |
51 |
51 |
|
|
LMCL-P19 |
51 |
51 |
|
|
LMCL-P21 |
51 |
51 |
|
|
LMCL-P23 |
51 |
51 |
|
|
LMCL-P24 |
51 |
51 |
|
|
LMCL-P25 |
51 |
51 |
|
|
LMCL-P26 |
51 |
51 |
|
|
LMCL-P27 |
51 |
51 |
|
|
LMCL-P28 |
51 |
51 |
|
|
Proposed Fire Station and Ambulance Depot |
FS-P1 |
51 |
51 |
|
Lok Ma Chau Tsuen Expansion |
LMCTE-P1 |
52 |
51 |
|
LMCTE-P4 |
51 |
51 |
|
|
LMCTE-P6 |
51 |
51 |
|
The cumulative 1-hour, 24-hour and annual NO2 concentrations and 24-hour and annual RSP concentrations caused by vehicular emission have been assessed at the height of 1.5m above ground (which is the average height of the human breathing zone) for the Study Area. Figures 3.13 to 3.15 and Figures 3.16 to 3.18 show the 1-hour, 24-hour and annual NO2 concentrations at 1.5m above ground in Year 2020 and Year 2027 respectively. Figures 3.19 to 3.20 and Figures 3.21 to 3.22 show the 24-hour and annual RSP concentrations at 1.5m above ground in Year 2020 and Year 2027 respectively.
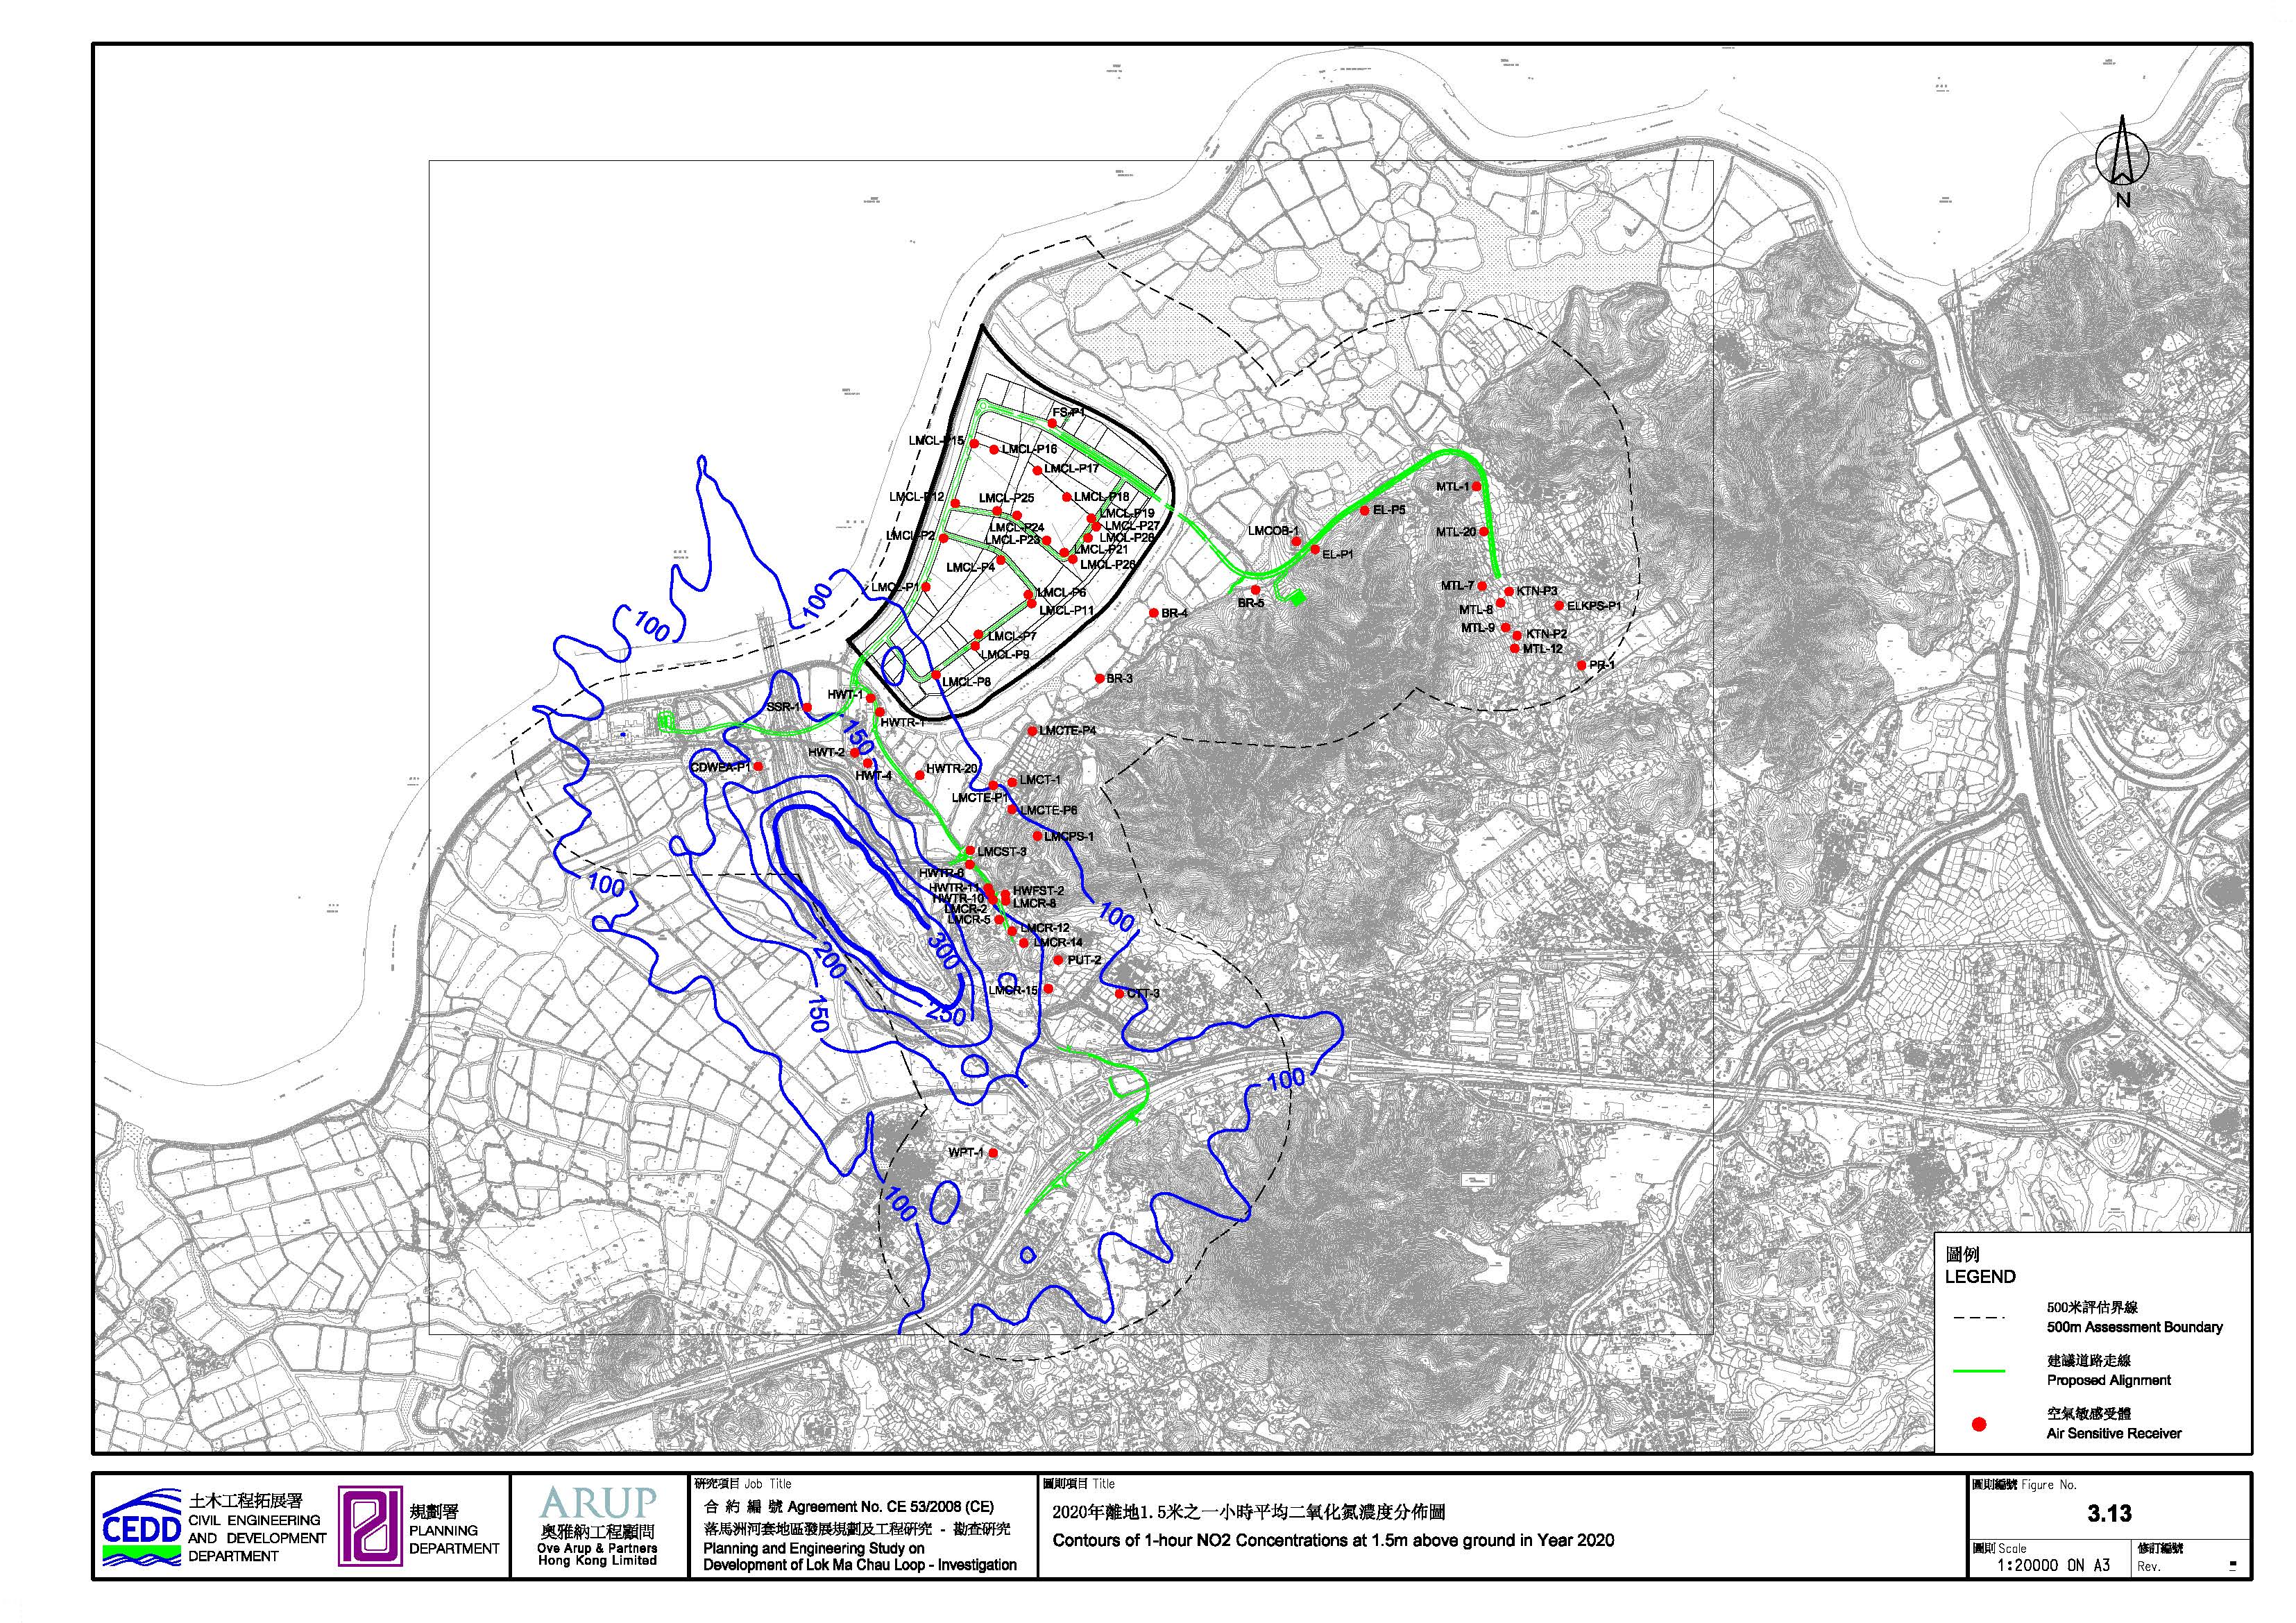
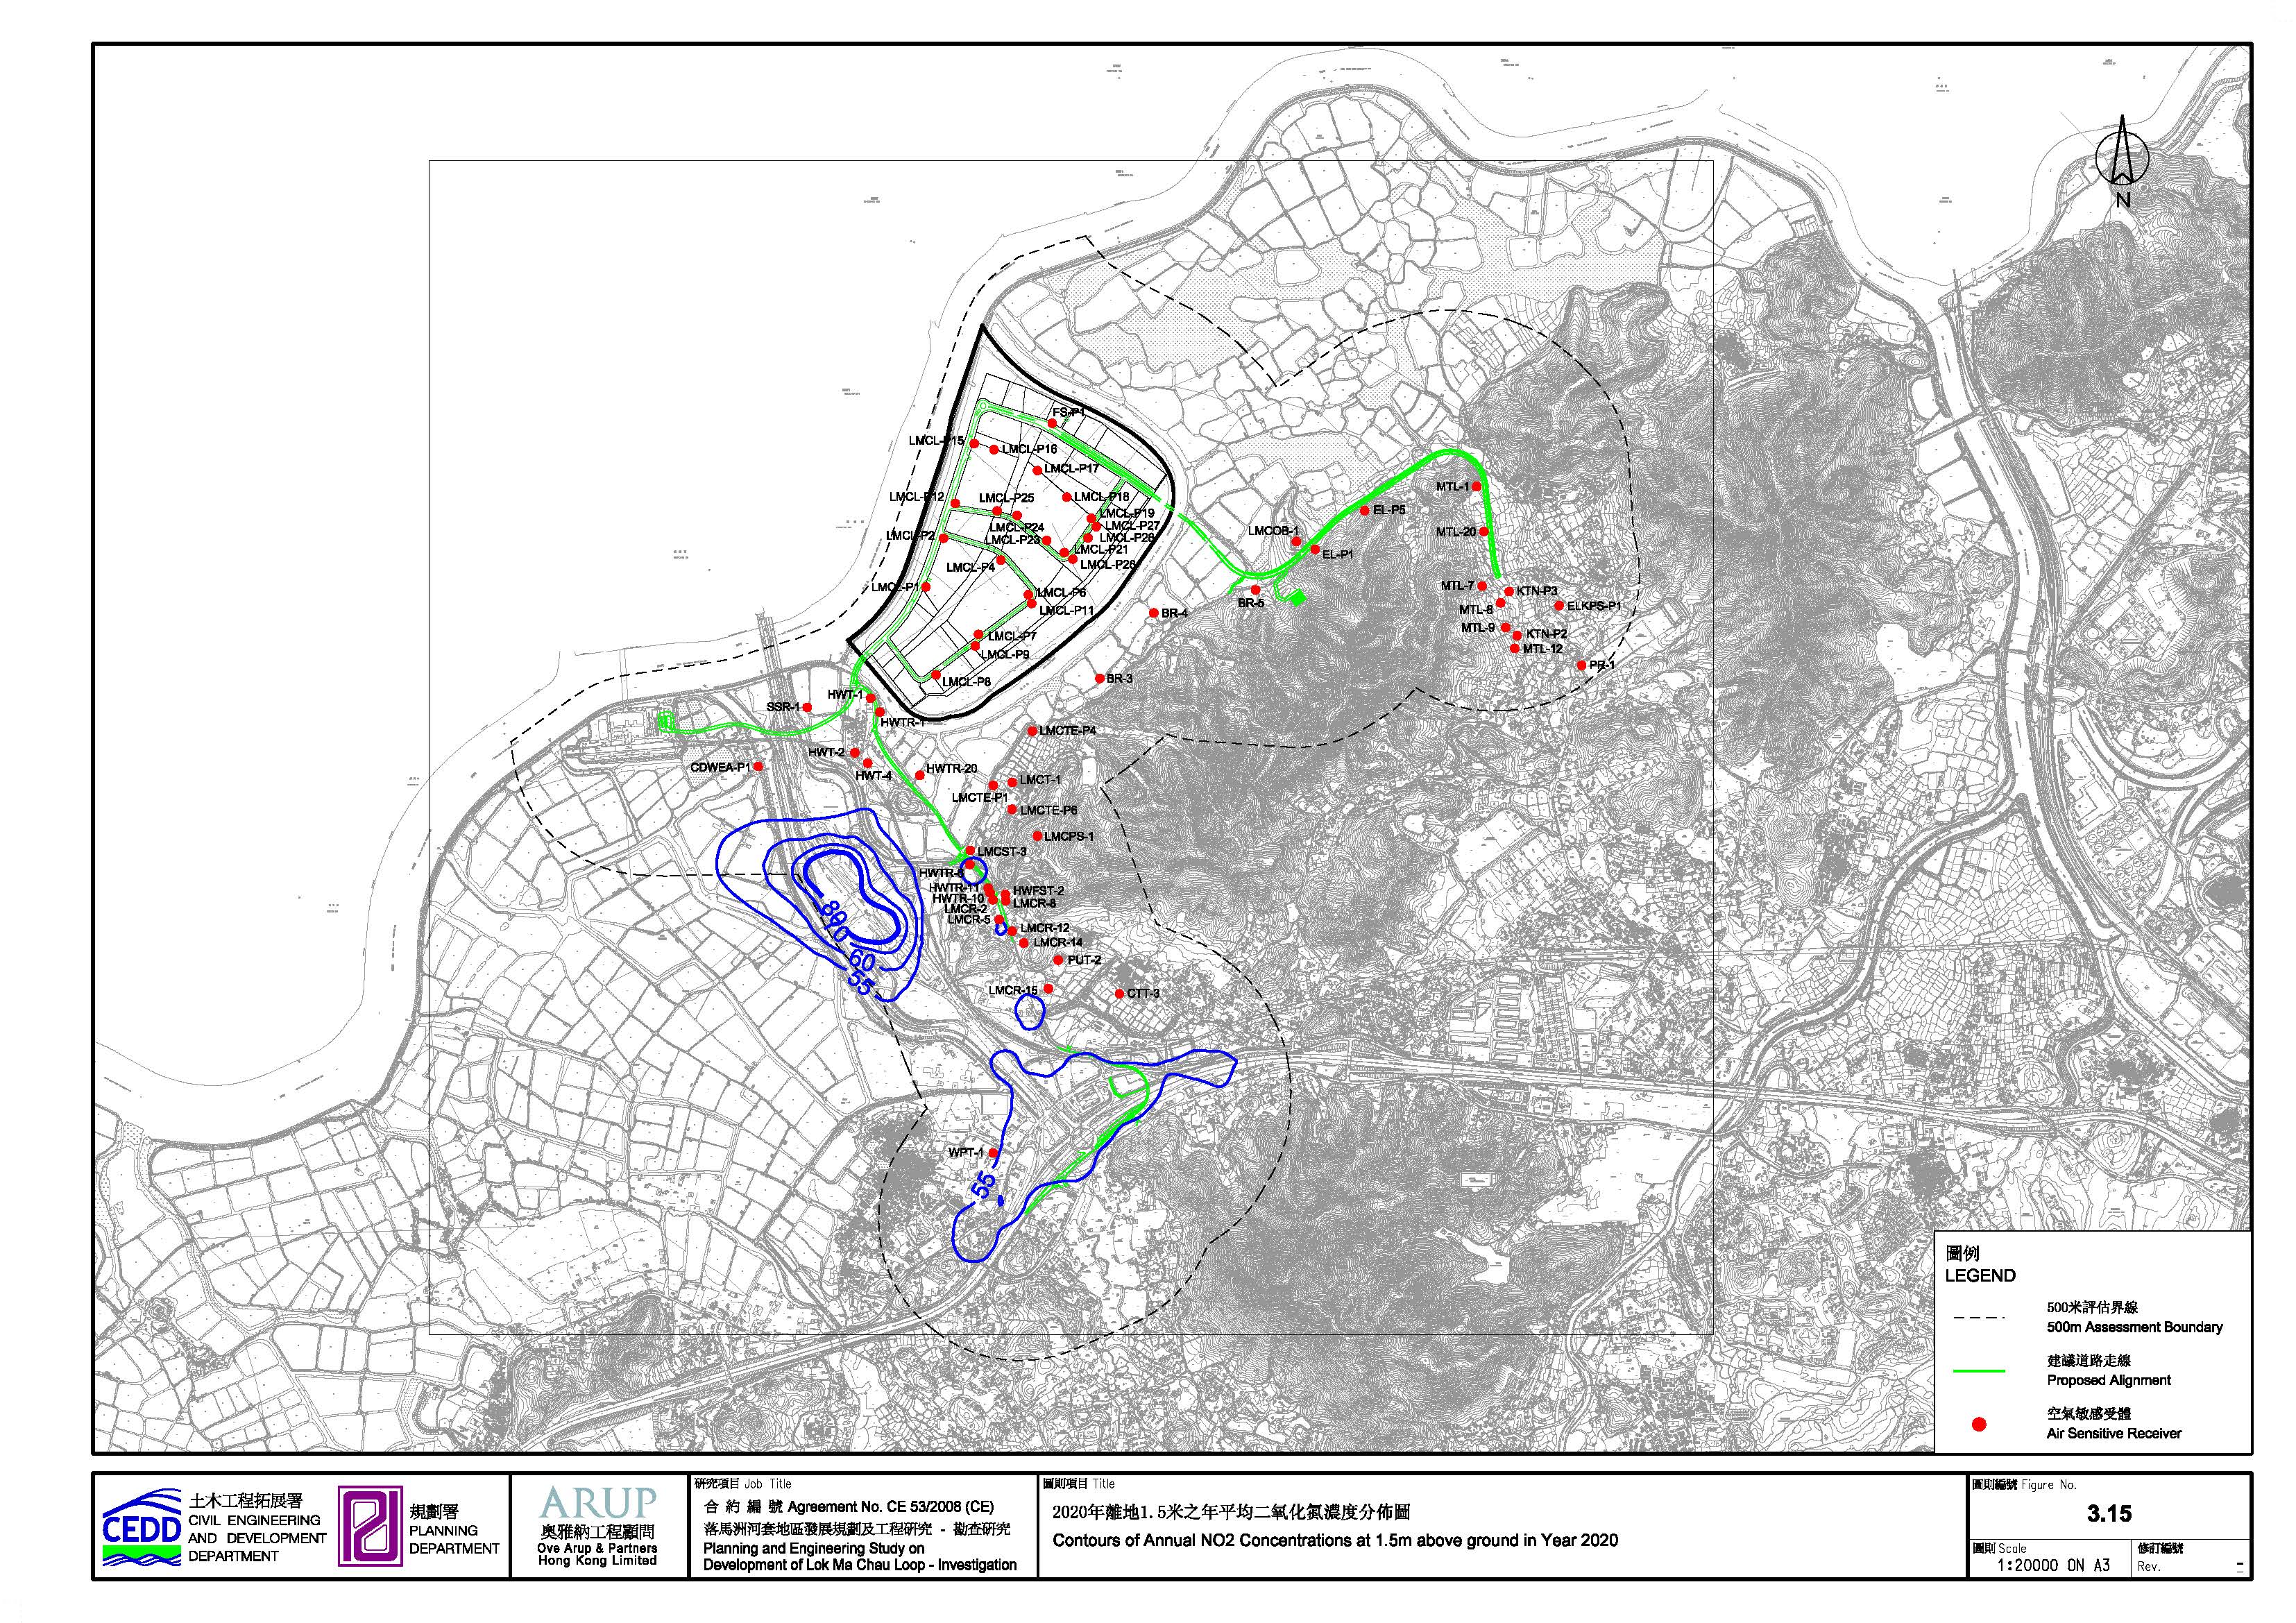
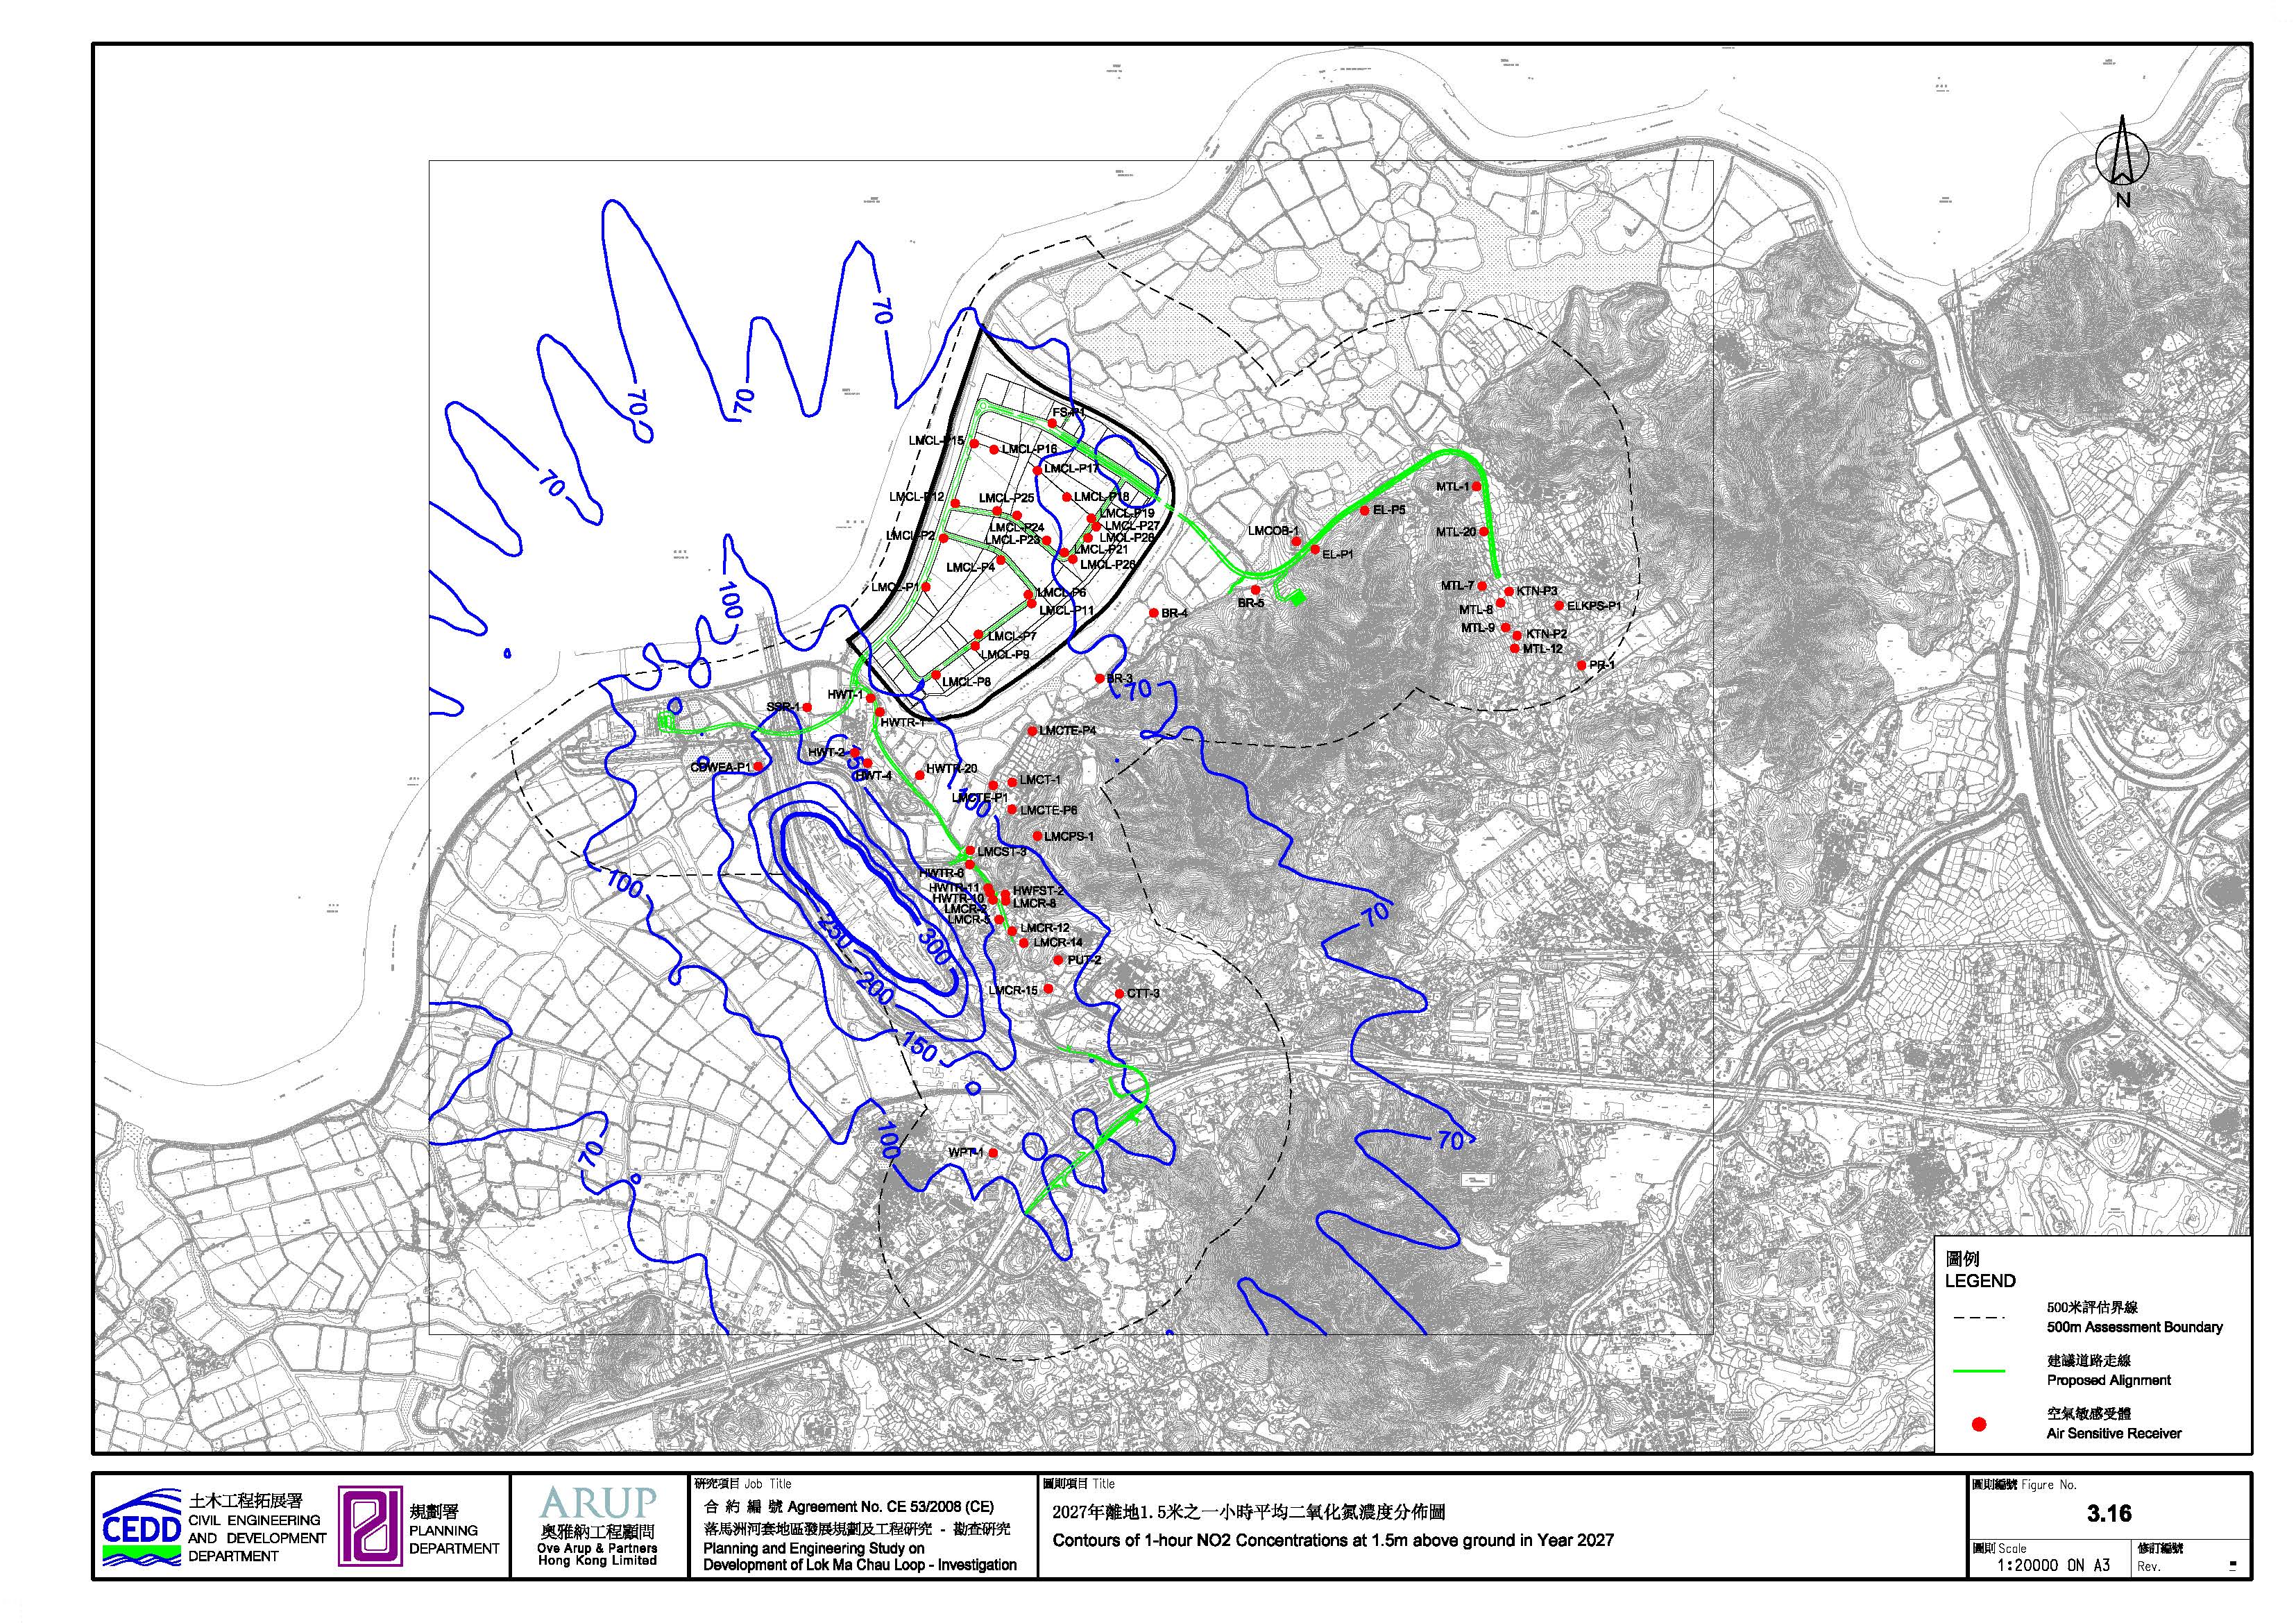
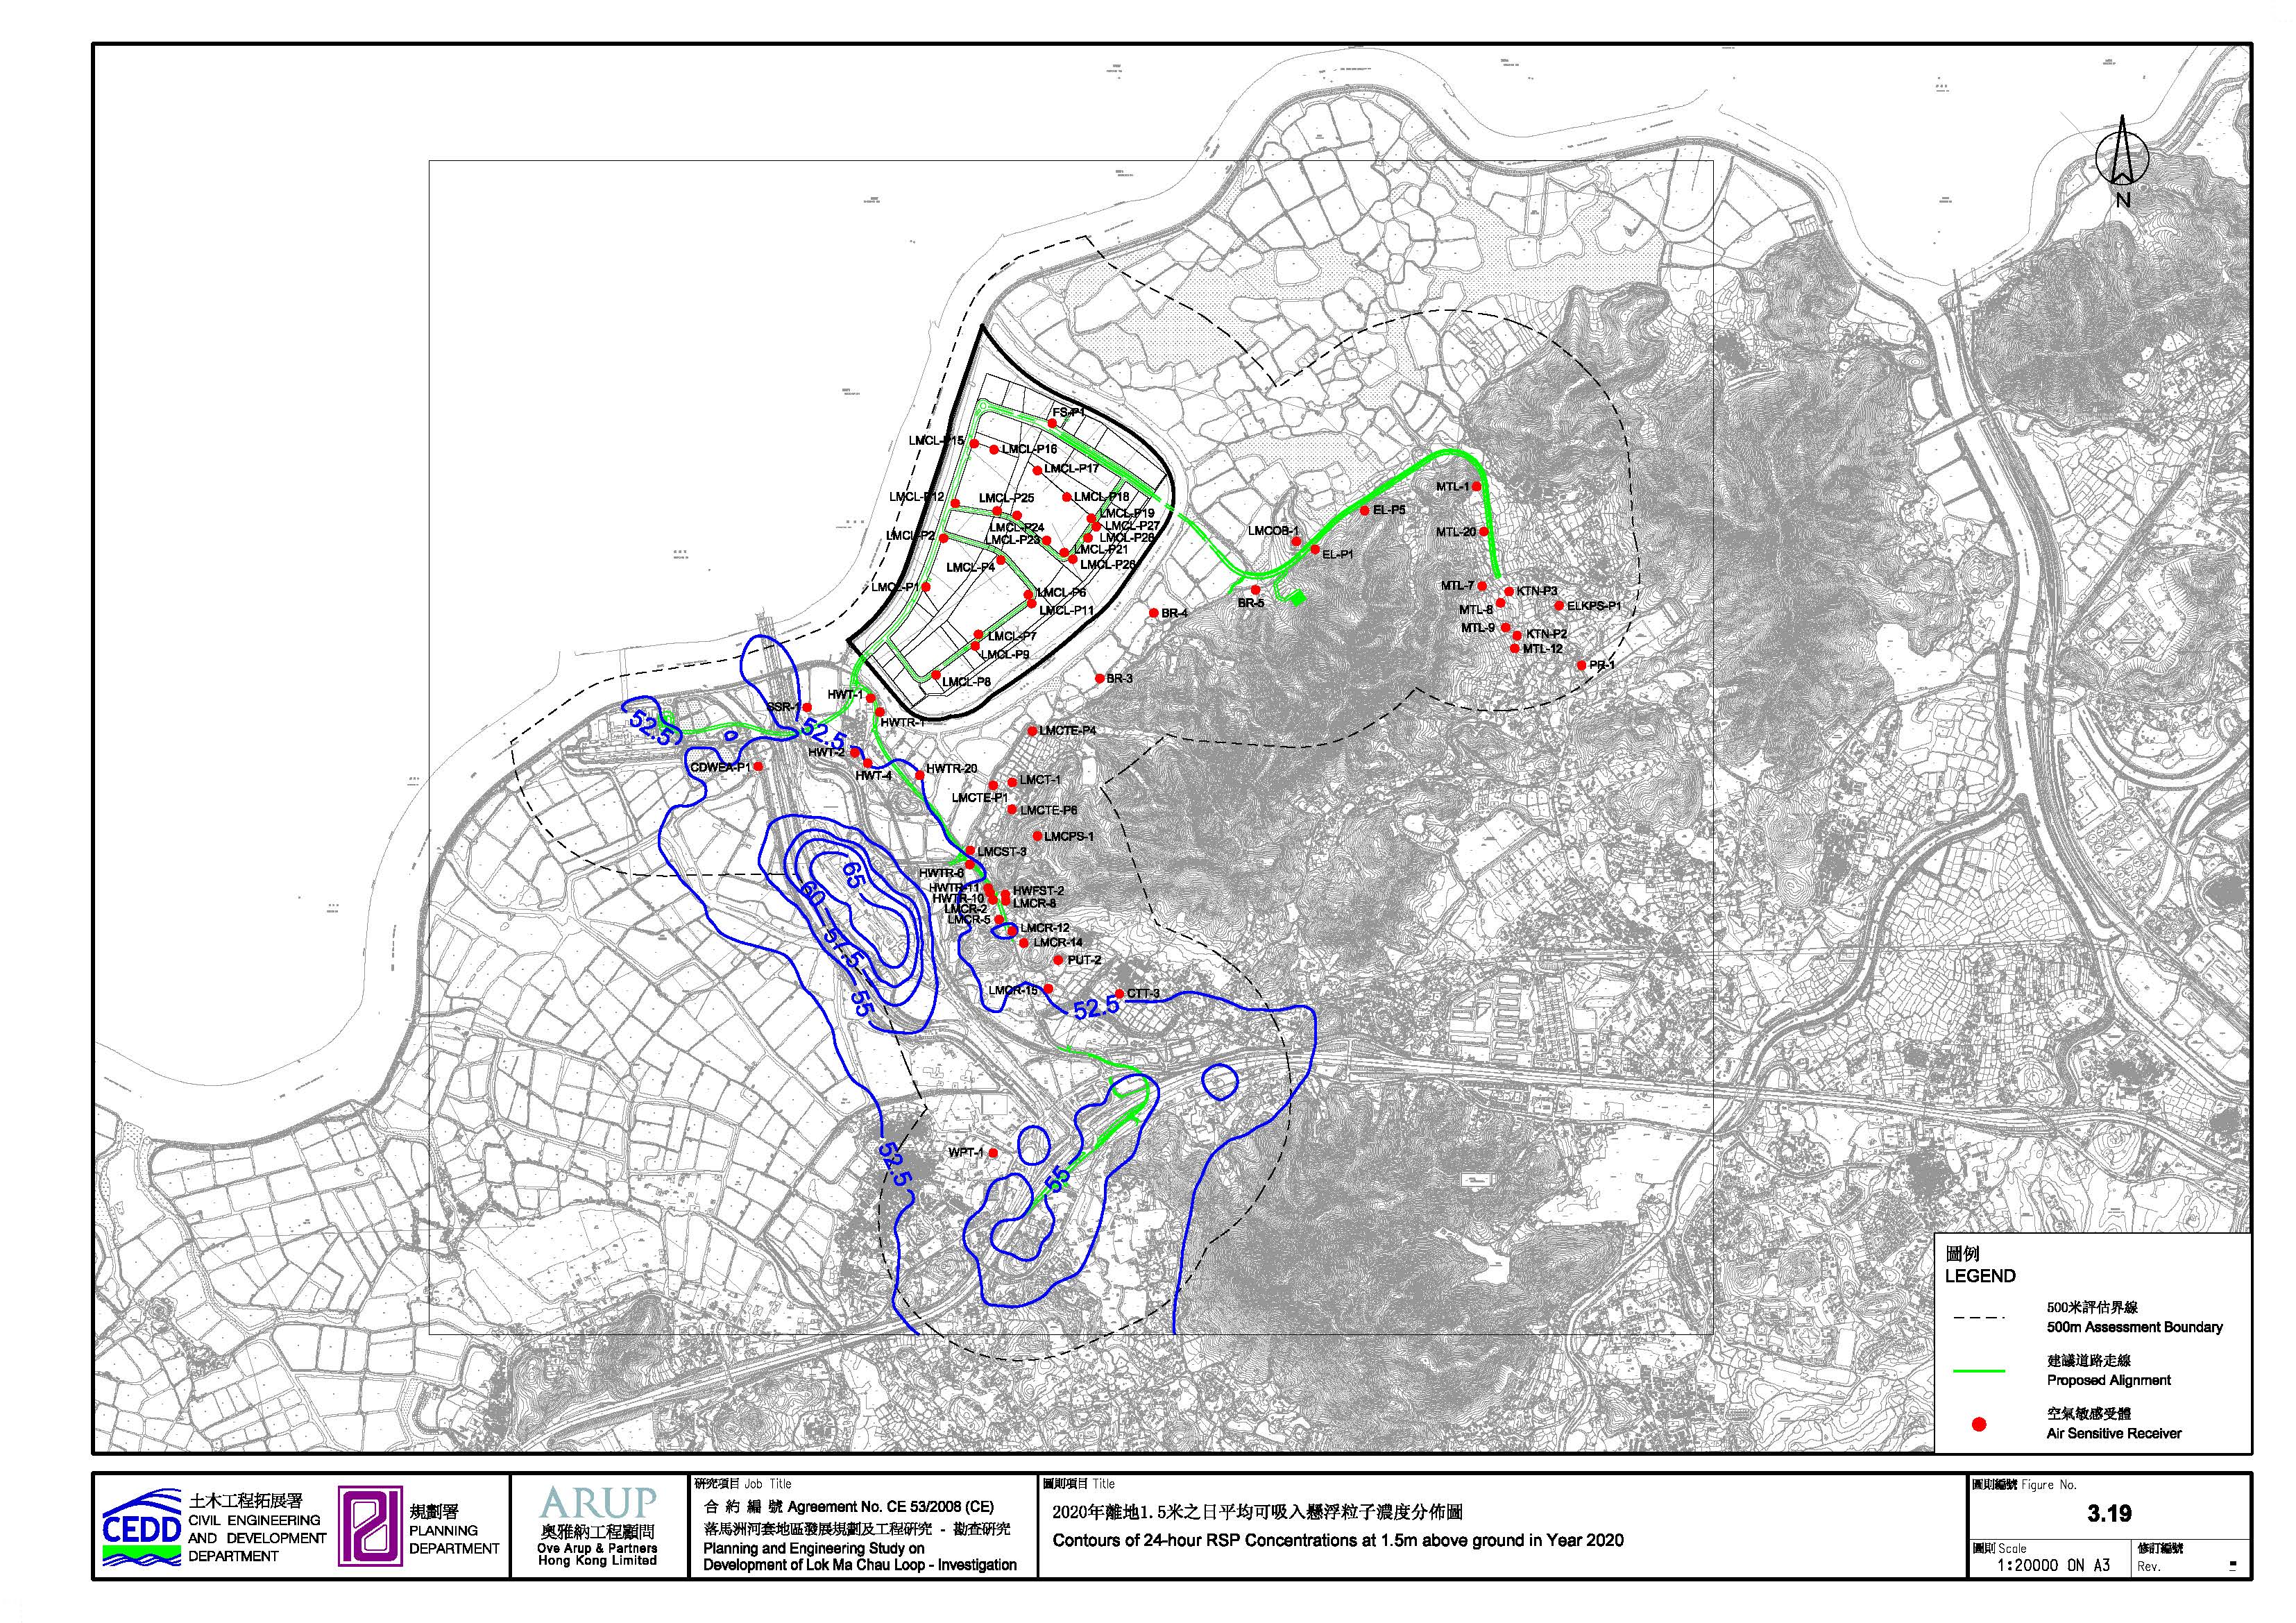
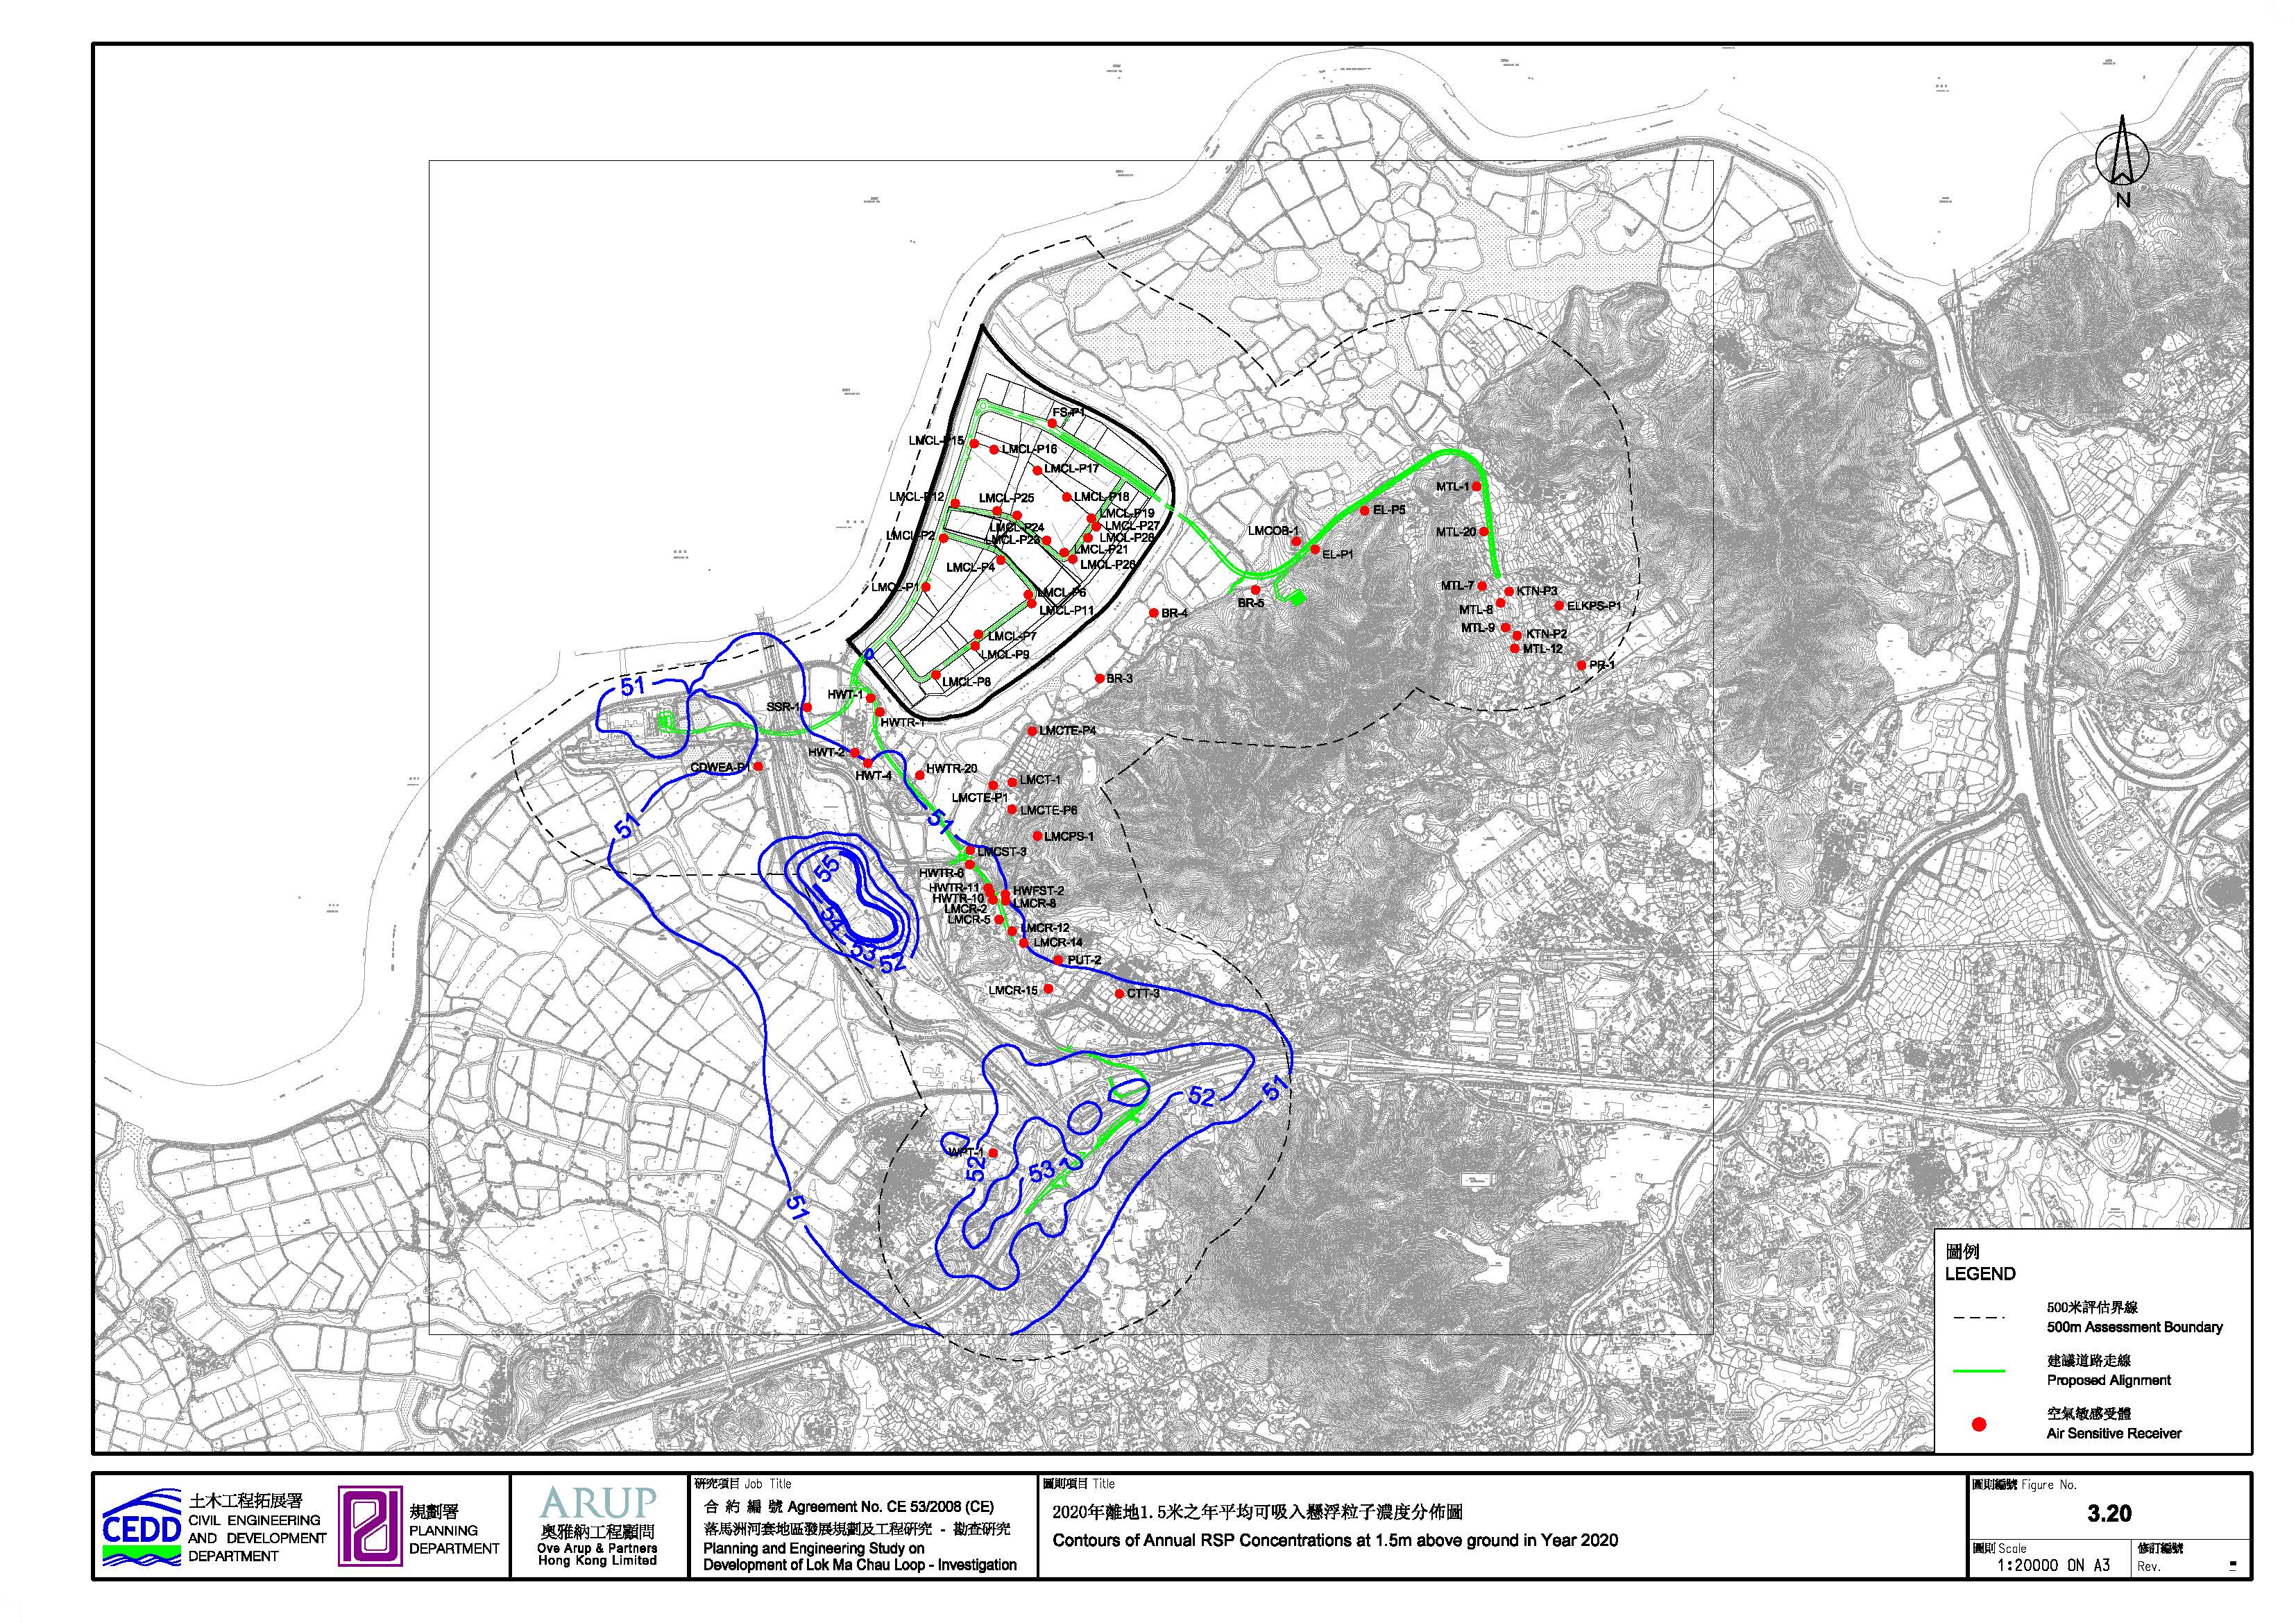
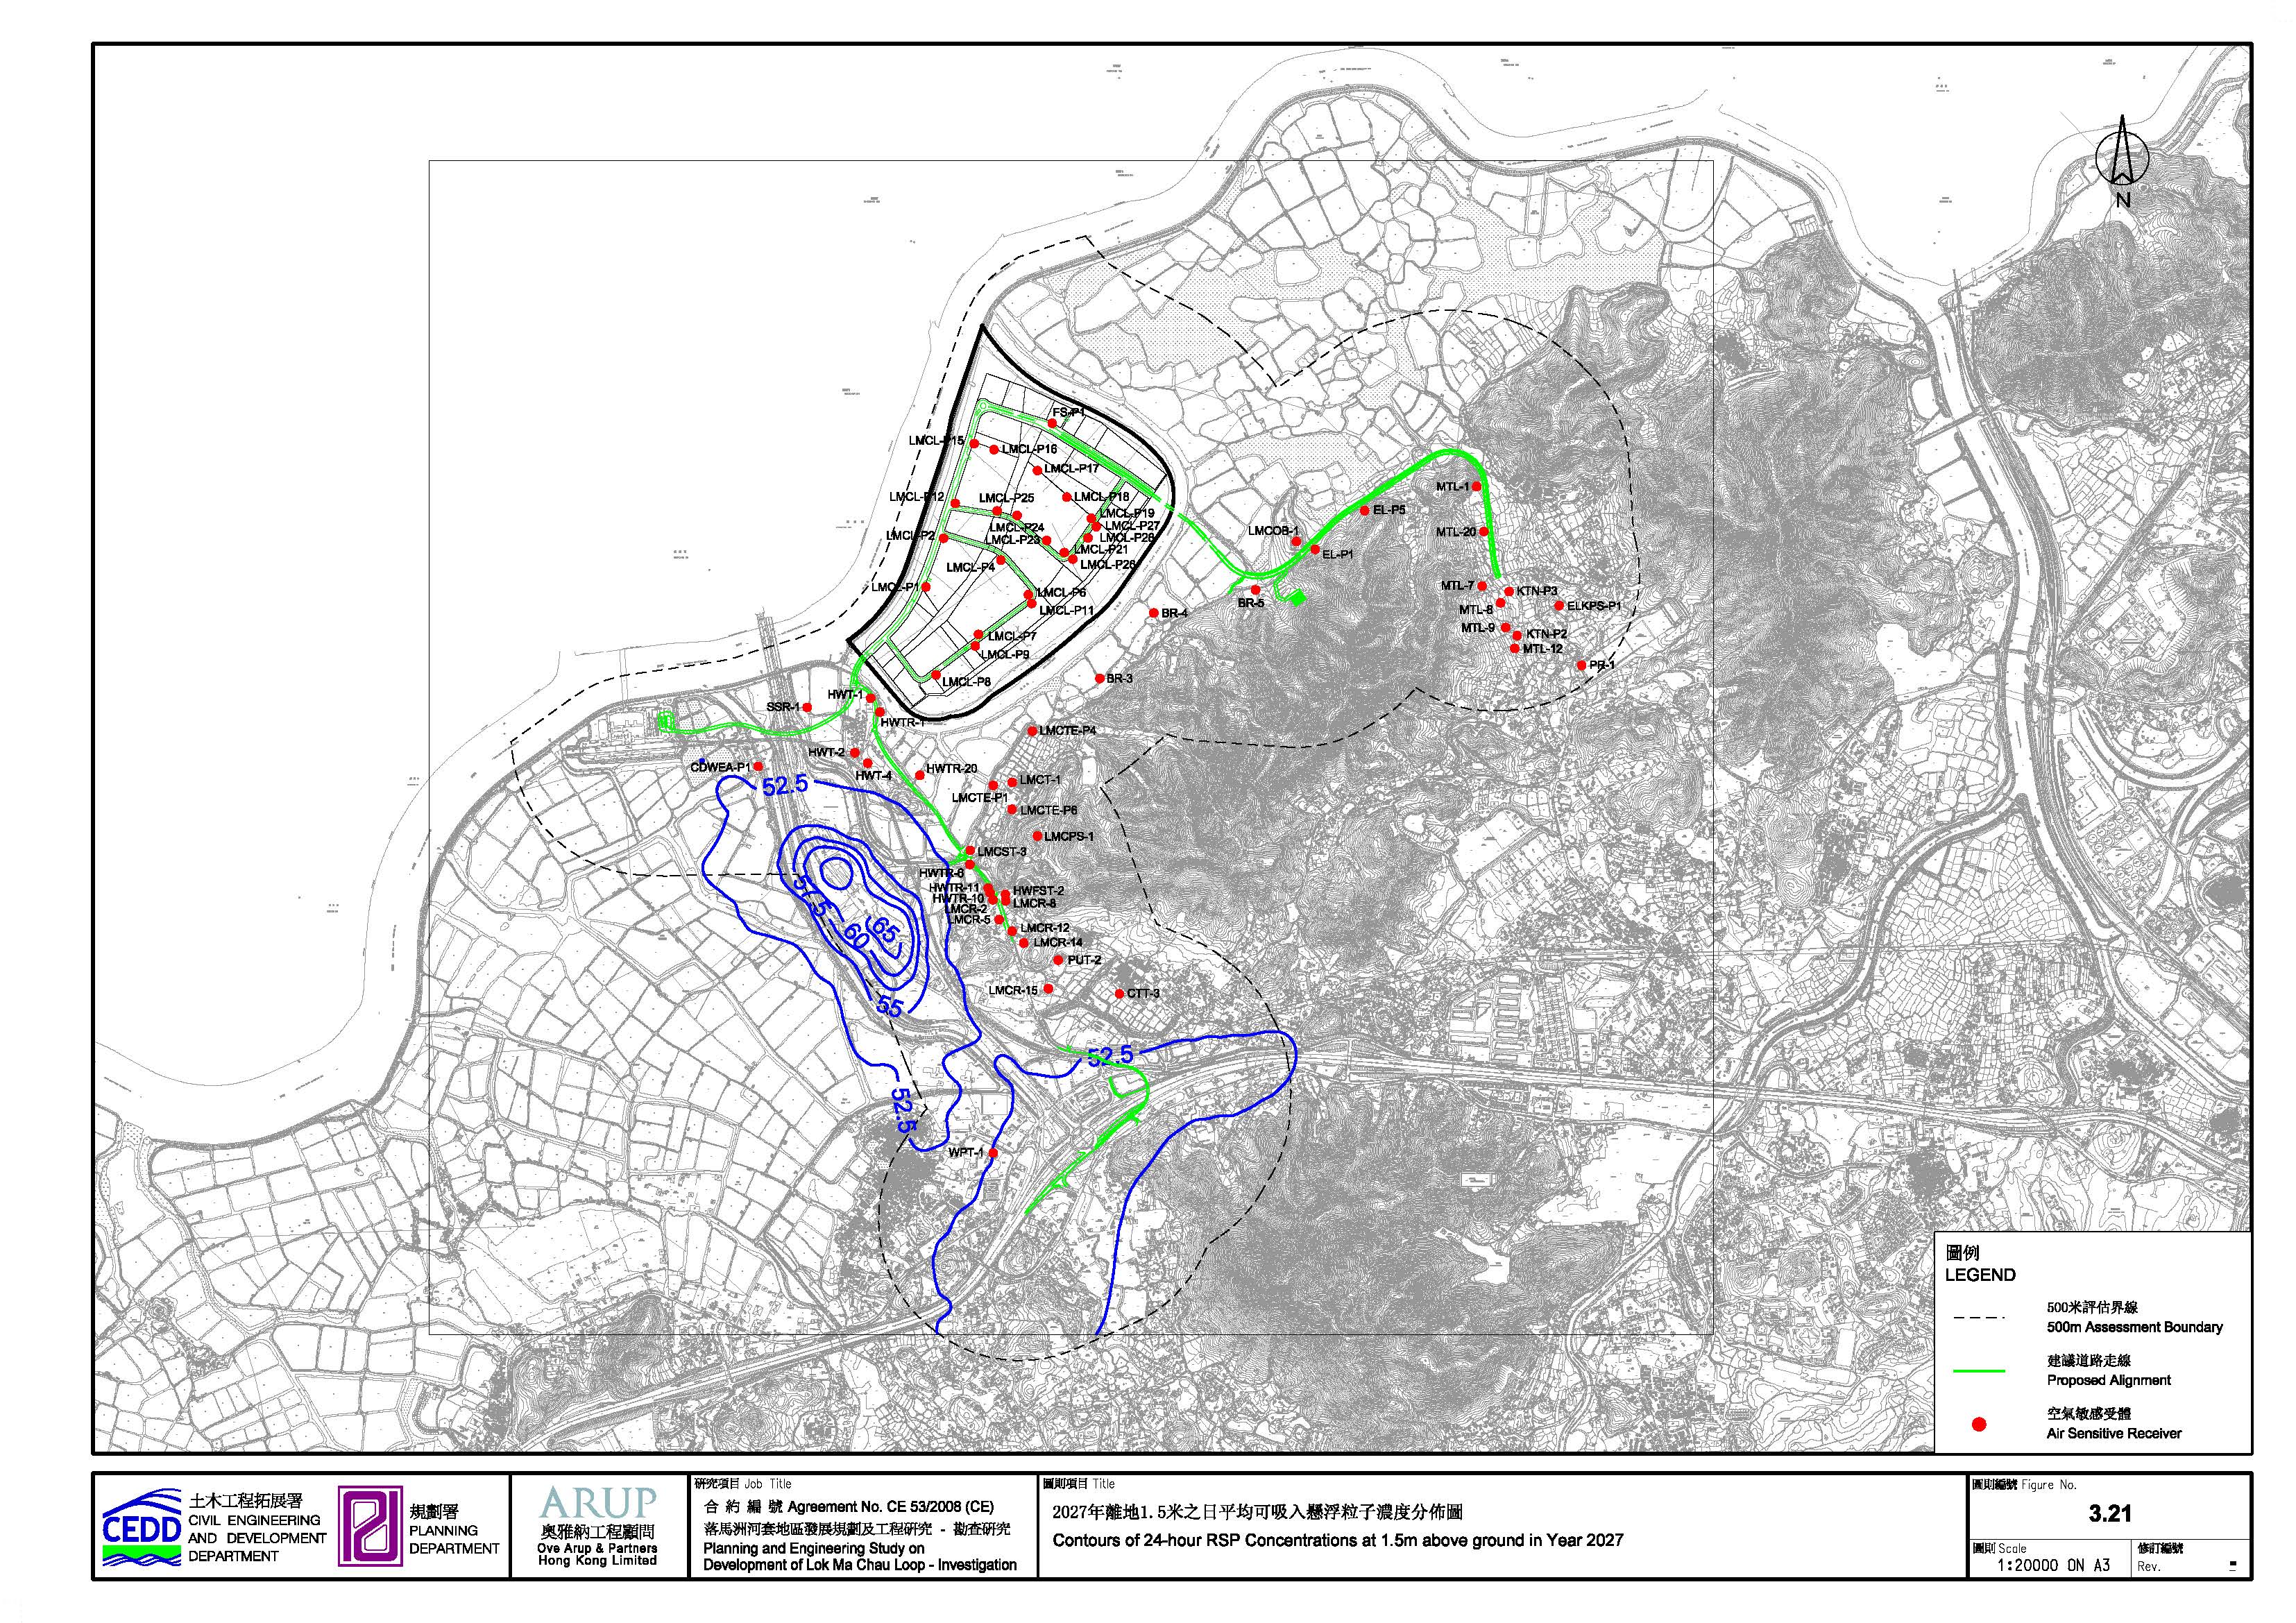
The assessment results for NO2
concentration are summarised in Table
3.17 and Table 3.19. In Year 2020, the 1-hour cumulative concentration ranges from 61 μg/m3 to 183 μg/m3,
24-hour cumulative ranges from 50 μg/m3
to 68 μg/m3 and annual average ranges
from 49 μg/m3 to 57 μg/m3; In Year 2027, the 1-hour cumulative
concentration ranges from 56 μg/m3 to
162 μg/m3, 24-hour cumulative ranges
from 50 μg/m3 to 64 μg/m3 and annual average ranges from 49 μg/m3 to 53 μg/m3
which were below the stipulated criteria of 300, 150 and 80 μg/m3
respectively for Year 2020 and Year 2027. The assessment results
for RSP concentration are summarized in Table 3.18 and Table 3.20. In Year 2020, the 24-hour cumulative
ranges from 51 μg/m3 to 54 μg/m3, annual average ranges from 51 μg/m3 to 52 μg/m3;
In Year 2027, the 24-hour cumulative ranges from 51 μg/m3
to 53 μg/m3, annual average ranges
from 51 μg/m3 to 52 μg/m3 which were below the stipulated
criteria of 180 and 55 μg/m3 for Year
2020 and Year 2027.
The air
quality implications of the proposed noise barriers have also
been considered. Since the ASRs within the assessment area are low-rise
structures, the inclusion of noise barriers into the assessment will not
materially affect the worst scenario air quality impact
at the ASRs. Therefore, the effect of noise barriers are
excluded in the assessment. The predicted air quality impacts due to
vehicular emission are well within acceptable levels when comparing to the AQO.
For the in-tunnel emission at the underpass connecting LMC Loop and Eastern Connection Road, the concentration of NO2 is 328.38 μg/m3, which is much lower than the 1,800 μg/m3 stated in the “Practice Note on Control of Air Pollution in Vehicle Tunnels”.
3.7.3 Operational Phase - Chimney Emission
No industrial chimney was identified within 500m from the boundary of the Project on Hong Kong side and the nearest potential industrial land use on Shenzhen side is located at more than 500m away from the Project. Chimney emission impact is not anticipated.
3.7.4 Operational Phase - Odour Emission
Cumulative odour impact assessment has been conducted for the on-site STW, Binhe WWTP and Shenzhen River. Odour emission rates for on-site STW and Binhe WWTP have followed their respective assumptions shown in Tables 3.11 and 3.13. The scenario assessments have evaluated the unmitigated, short to medium term and long term situation of cumulative odour contribution from Shenzhen River.
Under the unmitigated Shenzhen River scenario, modelling results for cumulative odour impact are in the range of 47.2 OU to 153.5 OU at the LMC Loop development area, which have exceeded the 5 OU criterion. (Figure 3.23a)
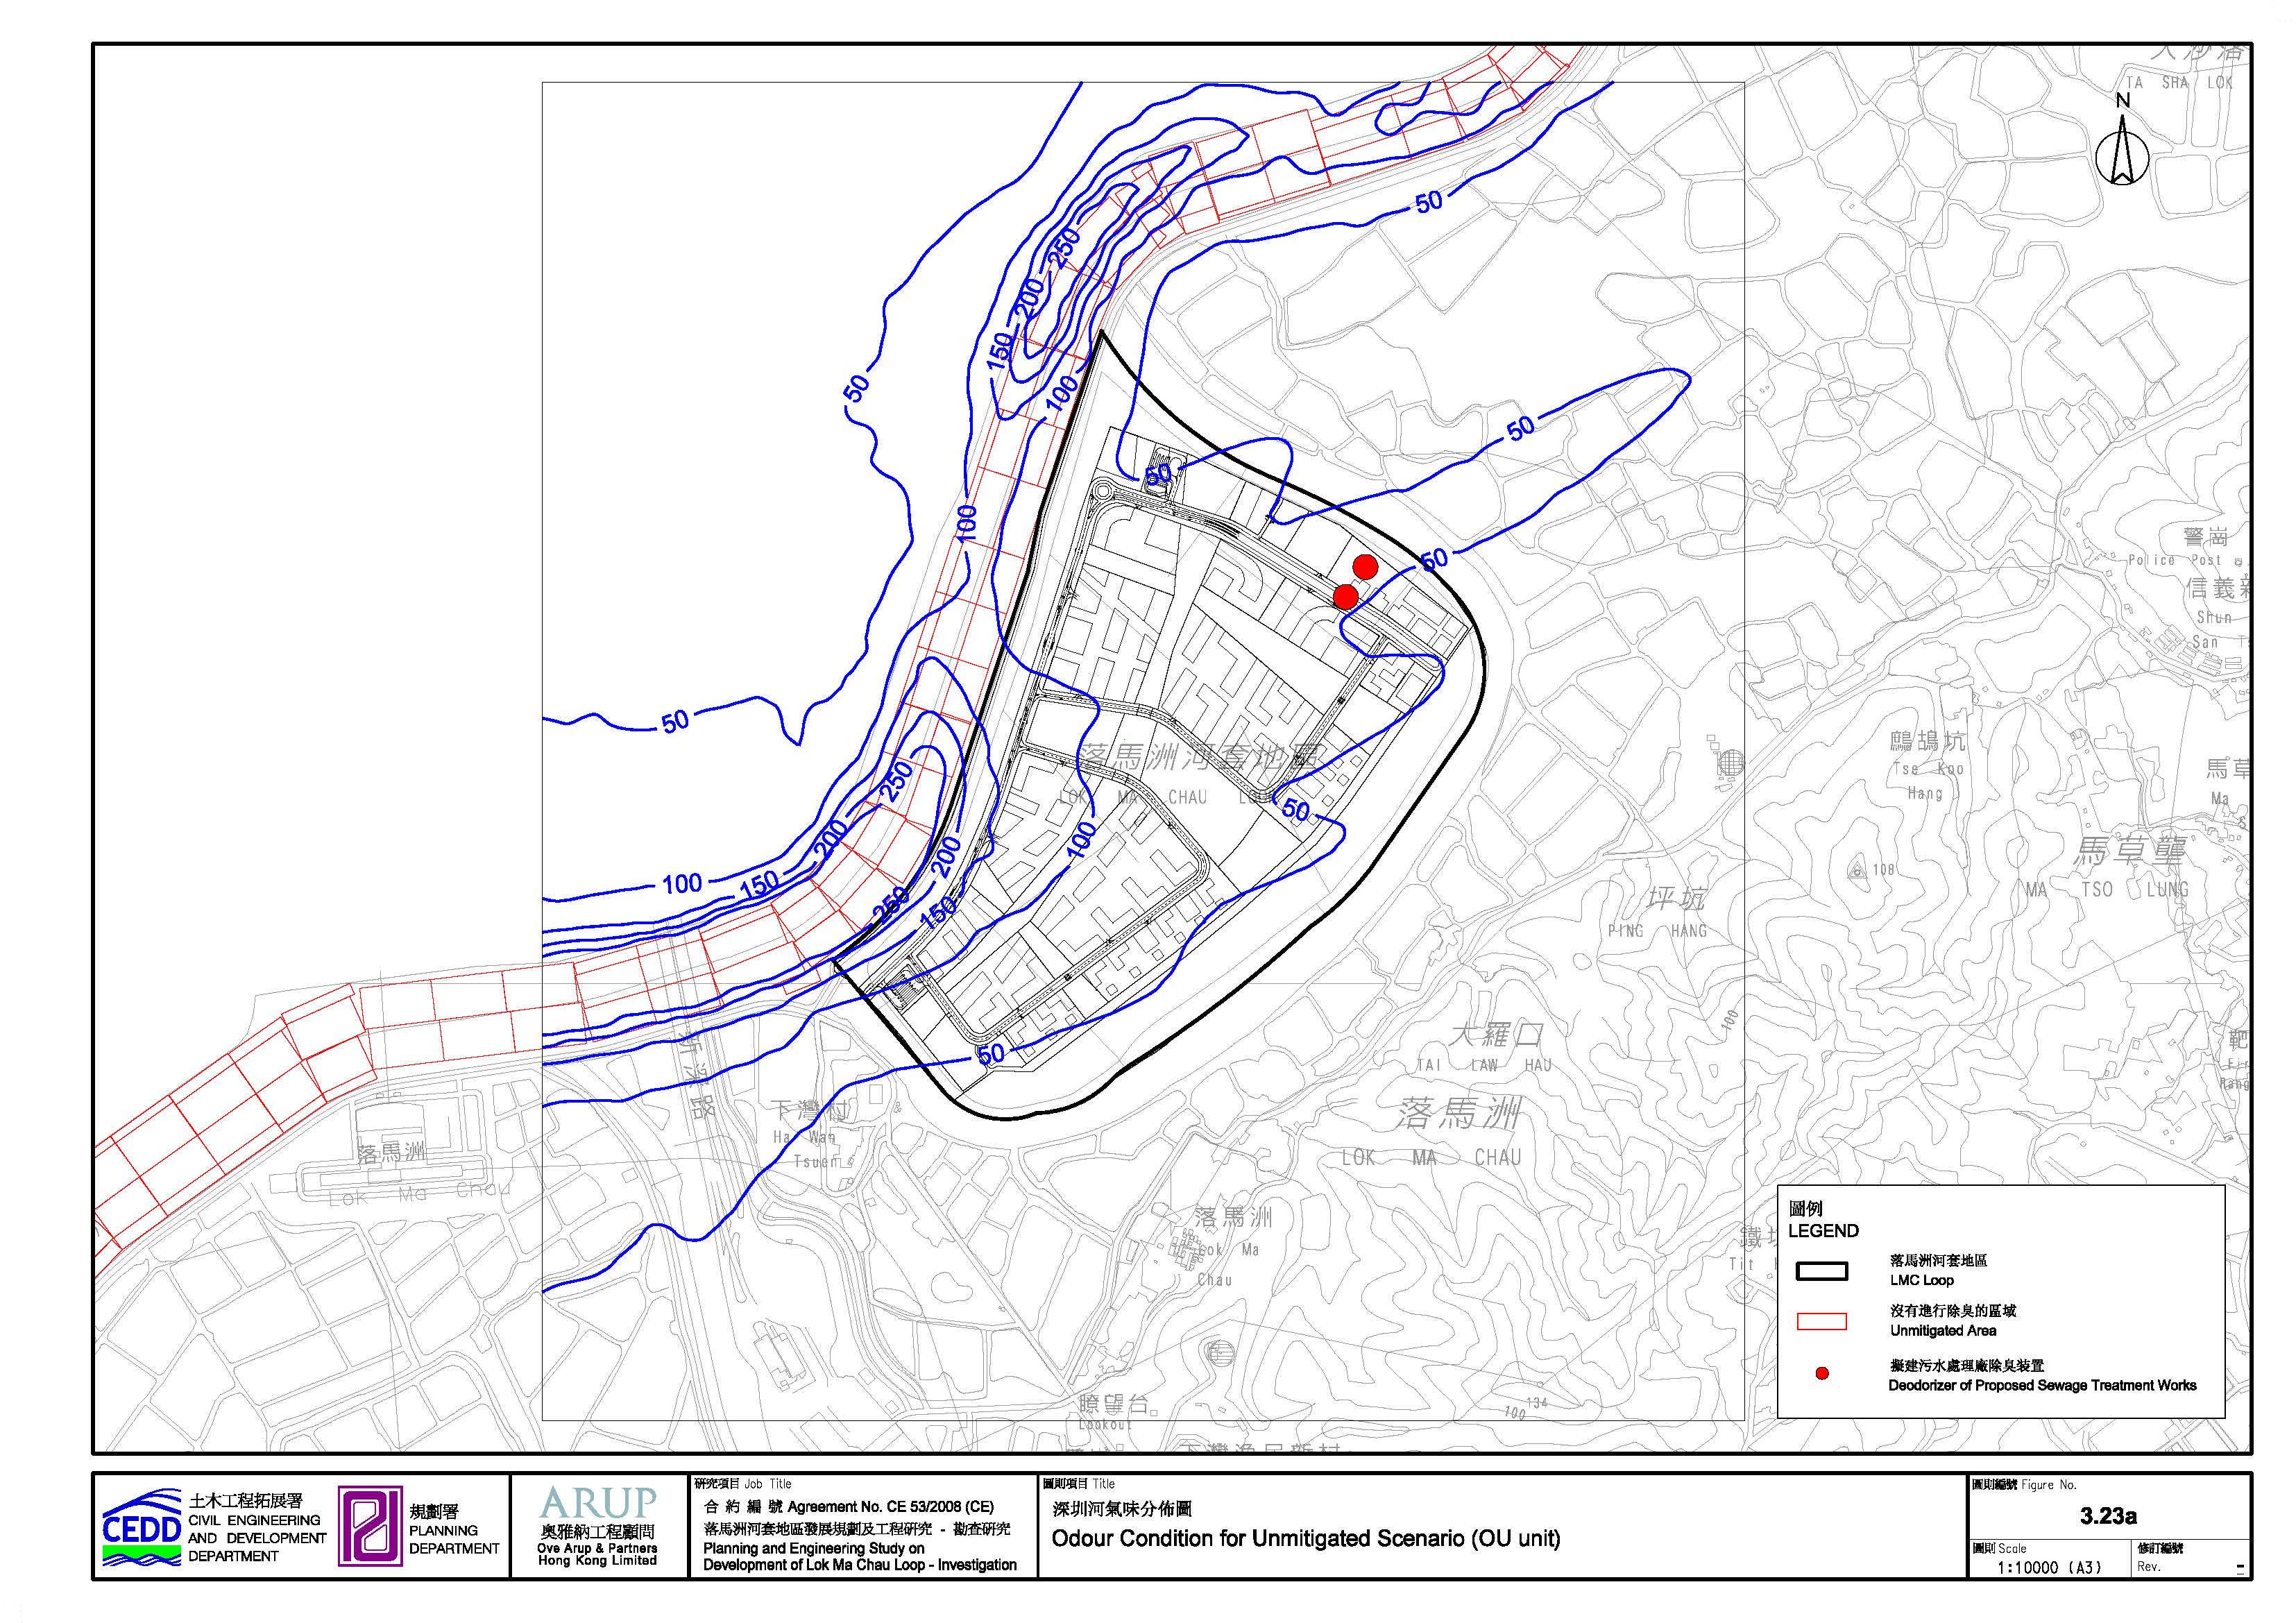
In the short to medium term, the project proponent has undertaken to implement bio-remediation along the section of Shenzhen River approximately 1.9km downstream of, 1km upstream of and 1.3km along the Loop development (i.e. approximately 4.2 km in total) (Figure 3.23b) before populations intake of the development. Cumulative odour impacts with bioremediation for the extent will be reduced to 10.8 OU to 14.5 OU, but still exceeds the 5 OU criterion. (Figure 3.23b)
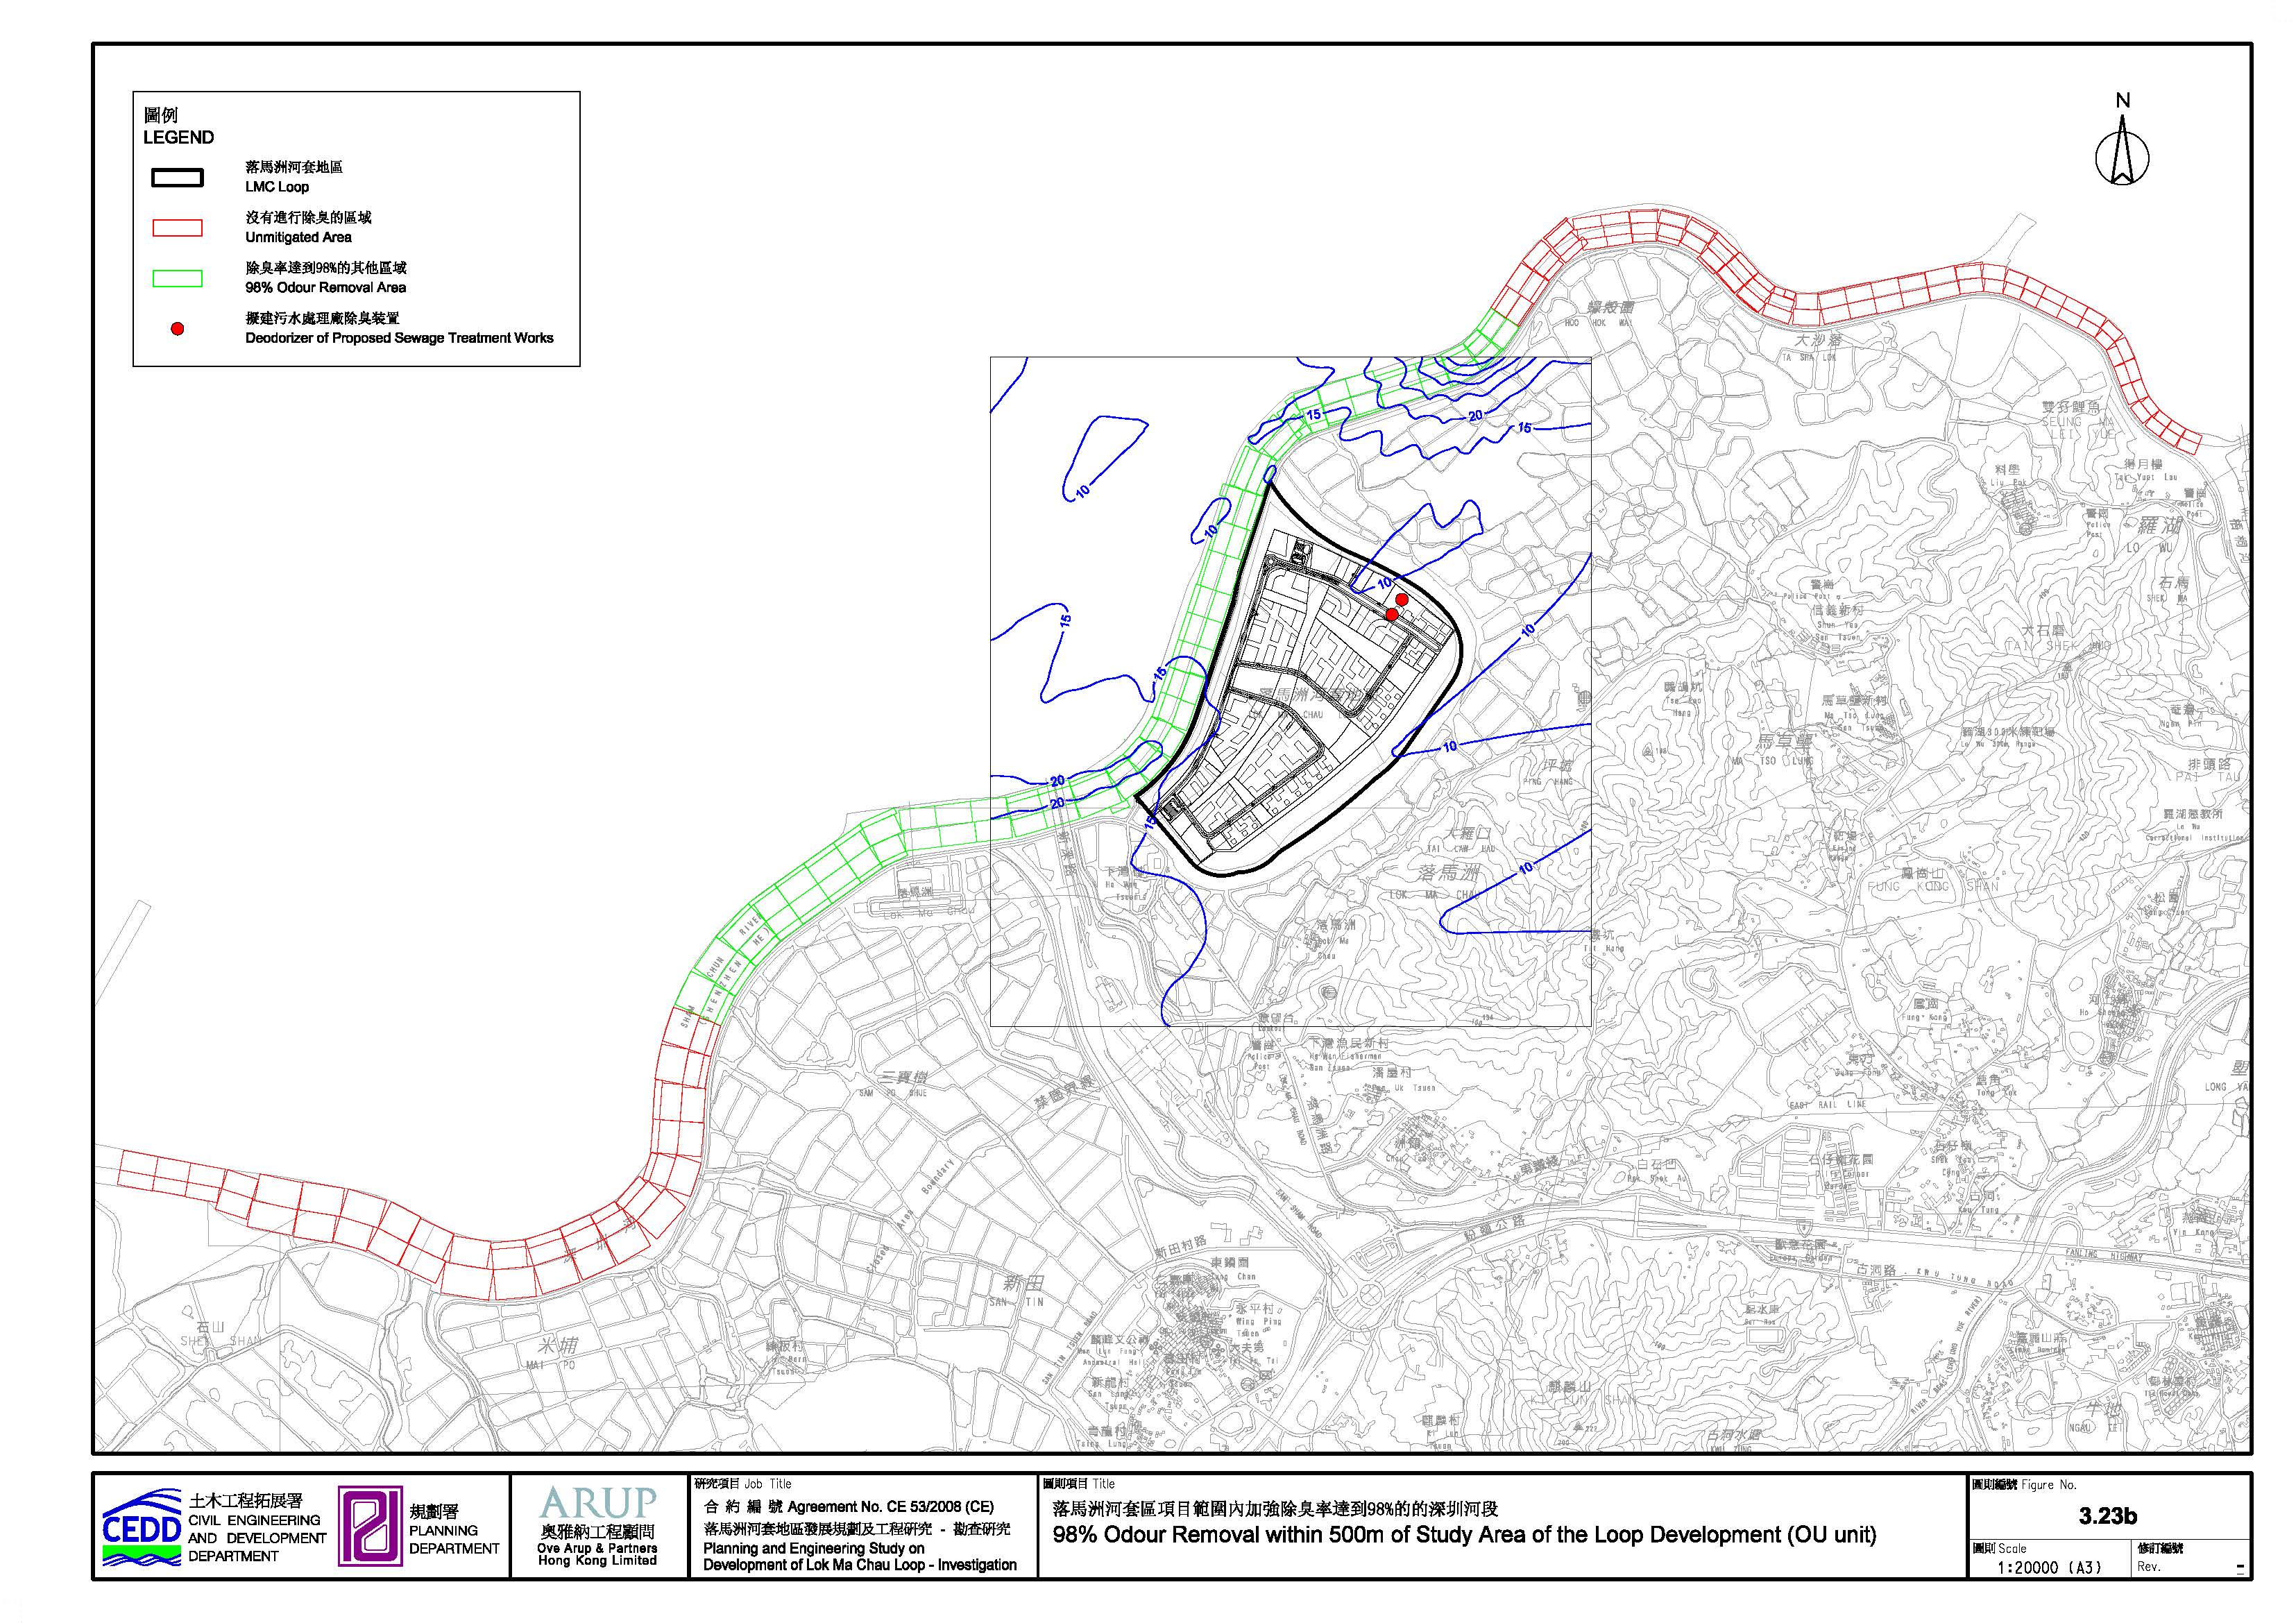
In the longer term,
residual impact would be reduced by the continual
improvement of the Shenzhen River odour issues in view of the improvement works
already undertaken or to be implemented in the major tributaries of the
Shenzhen River. Table 3.21 shows the implementation schedule provided by
Shenzhen Municipal Water Affairs Bureau as well as the commitment in the 12th
5-year plan on centralised treatment of intercepted sewage for the City of
Shenzhen.
Table 3.21: Status of remediation for tributaries to Shenzhen River
|
Tributaries |
Proposed/ Completion Year |
Status of
Remediation |
|
Buji River (布吉河) |
2009 |
布吉河特區內流域污水截排二期工程 (English
Translation: Phase 2 Buji River District Sewage
Interception Works) reduces 80% to 85% sewage loading into Buji River. |
|
2013 |
Phase 1 of the 布吉河水環境綜合工程
(English translation: Buji River Water Environment
Enhancement Works) was 95% completed in 2012. |
|
|
2014 |
Phase 2 of the 布吉河水環境綜合工程 (English
translation: Buji River Water Environmental
Enhancement Works) |
|
|
Futian River (福田河) |
2012 |
福田河綜合治理工程
(English translation: Futian River Remediation
Works) |
|
Xinzhou River (新洲河) |
2010 |
新洲河綜合整治工程 (English
translation: Xinzhou River Remediation Works) was
completed in 2010 and reached Category V of the Surface Water Quality
Standard |
|
Shenzhen River (深圳河) |
2015 |
Sewage collection and sewage treatment in central
urban districts are committed to reach 95% |
|
2017 |
治理深圳河第四期工程
(English translation: Phase 4 of Shenzhen River Improvement Works) |
With the implementation of above improvement works, it is
anticipated that significant reduction of residual impact due to odour
generation from Shenzhen River will be effected. A test scenario has been
conducted to assess the long term conditions of the
residual impact if the proposed improvement measures and centralised sewage
treatment by Shenzhen Municipal Government were materialised. To predict the odour
level at the Loop development in the long term
scenario will require certain assumptions on the changes affected by these
improvement works. While it is not unreasonable to assume a low odour emitting situation for Shenzhen River, a more
conservative approach has been adopted for the assessment. It assumes the odour
emission rates measured along the Shenzhen side of the Shenzhen River will
resemble those taken at the opposite locations along the Hong Kong side.
With
the bioremediation works to be implemented by the project proponent along the
defined section of Shenzhen River, assessment shows that if the odour emission
rates at the sewage discharge points along Shenzhen side of the Shenzhen River
are assumed to be reduced by 92% as a conservative estimate of the committed
95% centralised sewage treatment target in the 12th 5-year plan[3-1]
for the City of Shenzhen (Figure 3.23c), the residual
odour impacts on the Loop development will be reduced to 3.5 to 4.7 OU, within
the criterion of 5 OU in the long run.
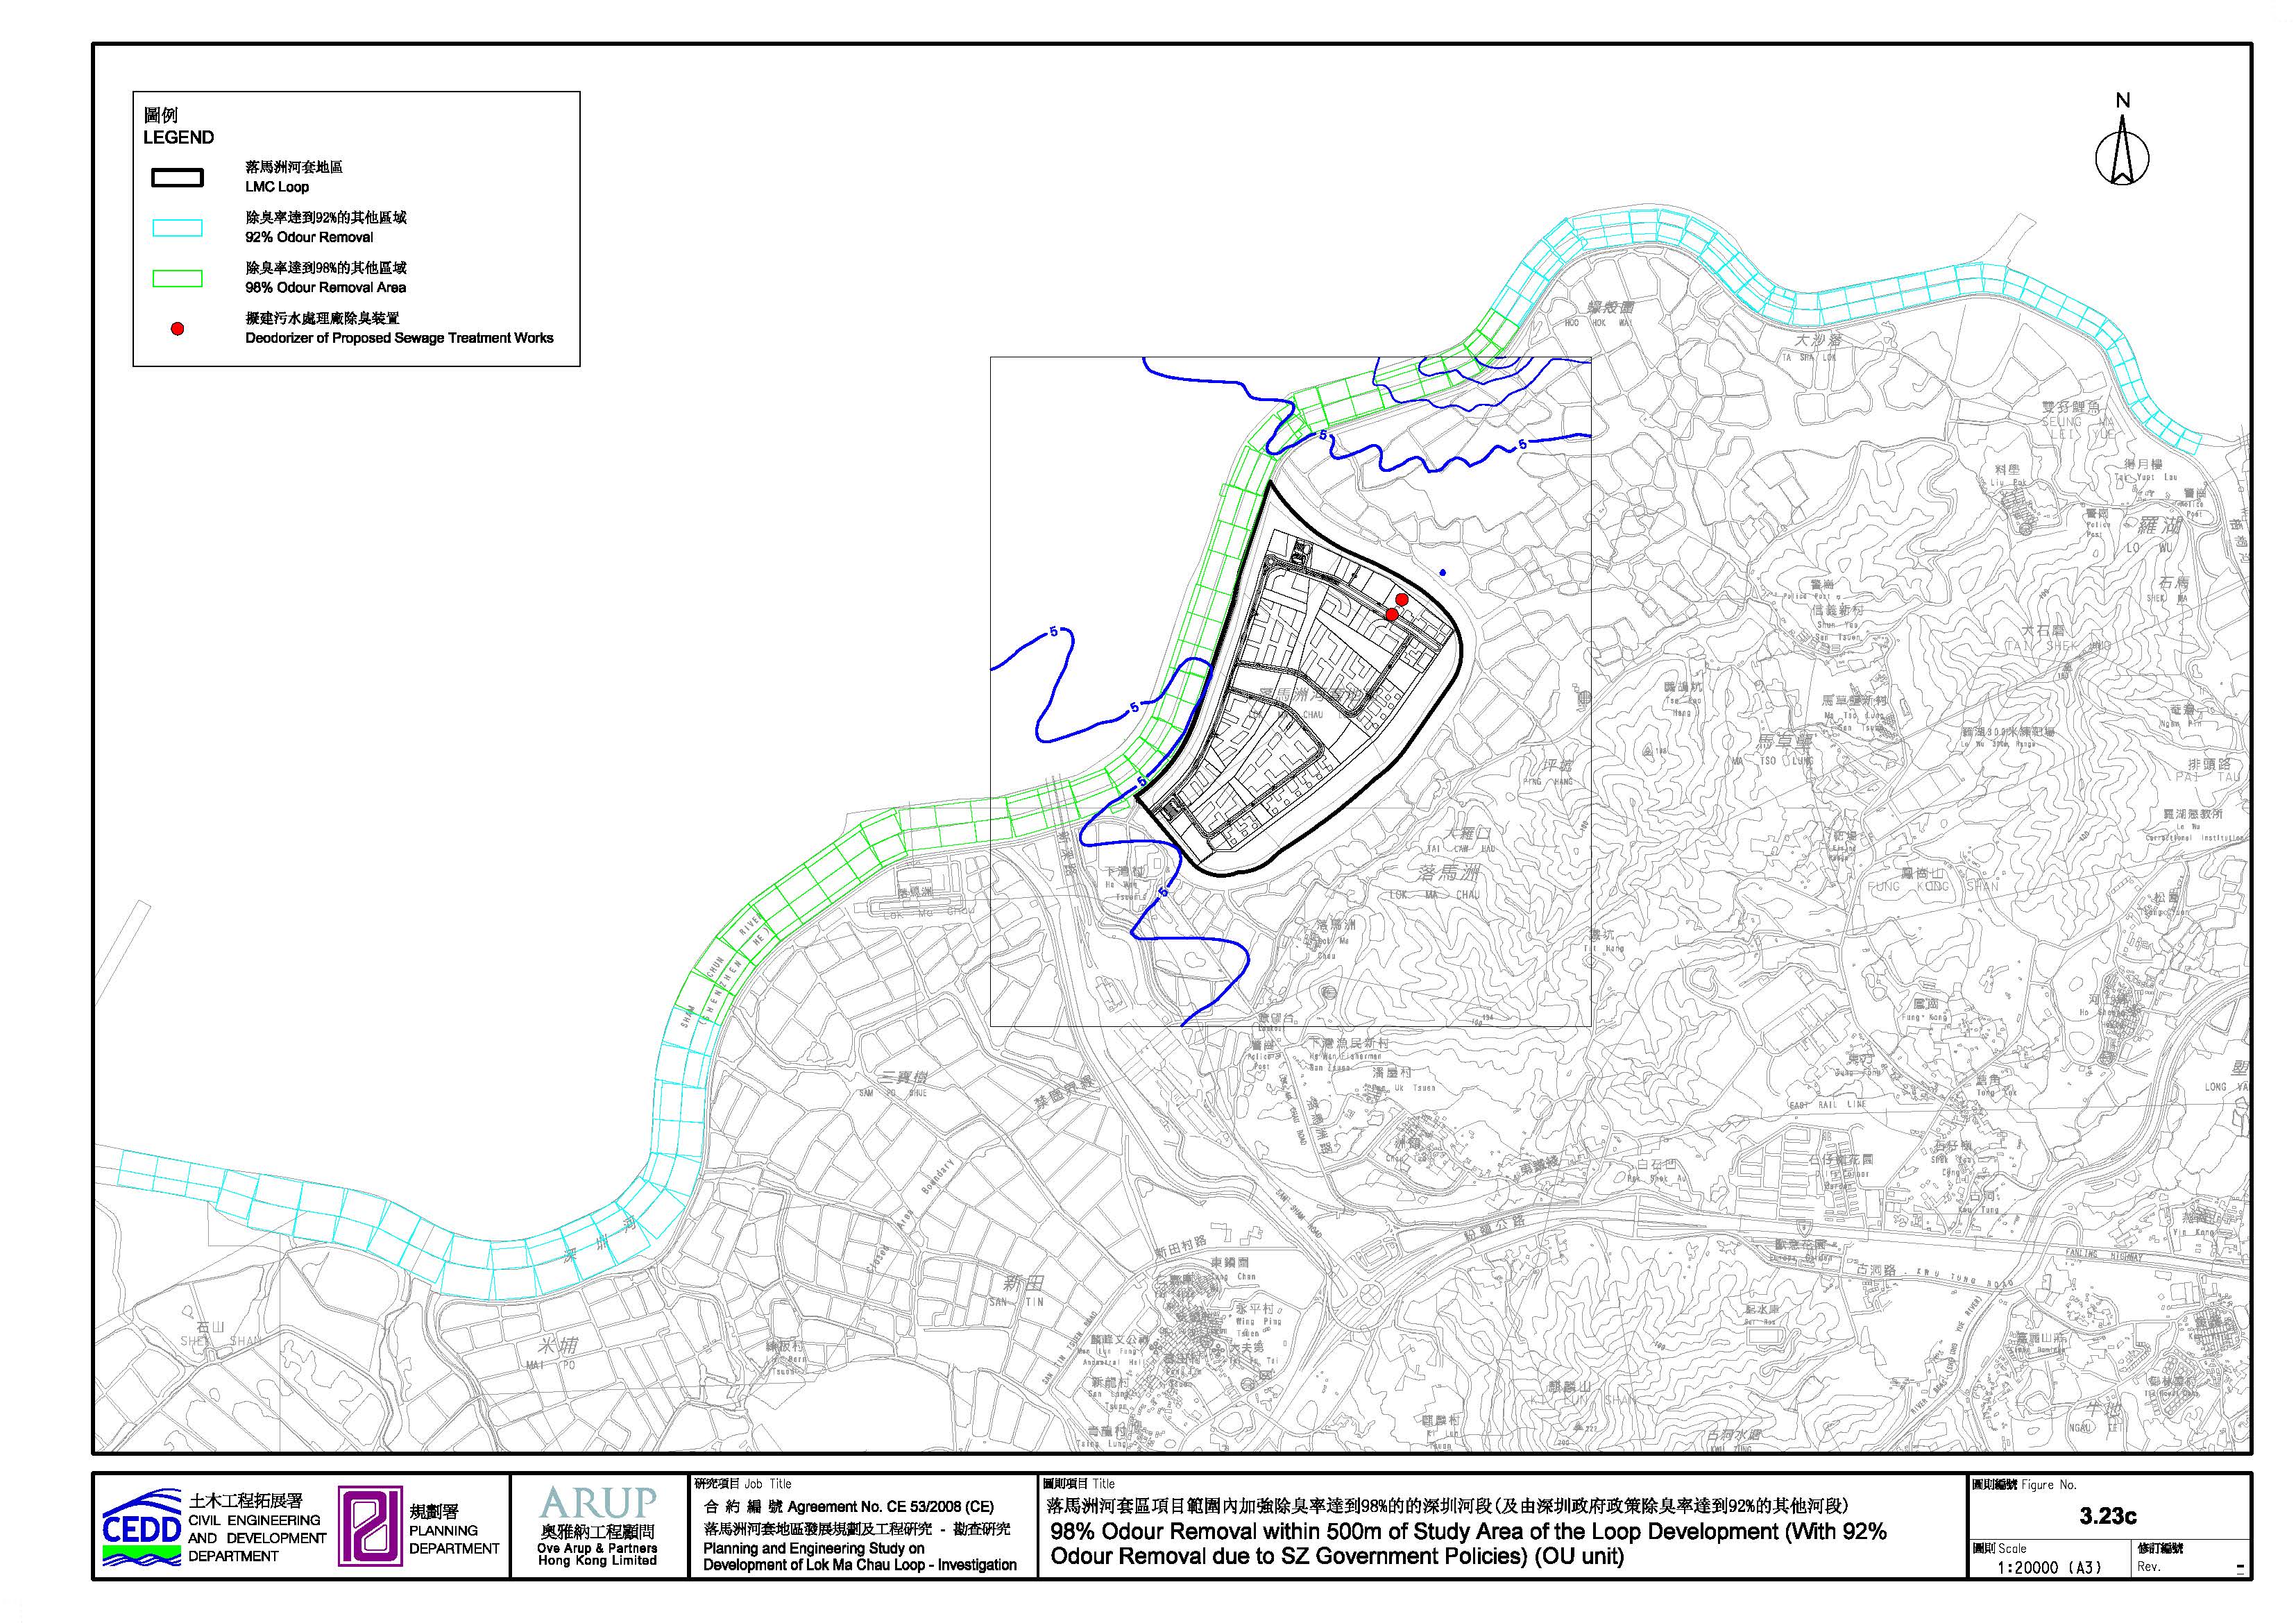
Individual and cumulative impacts
of odour concentration level at ASRs located 1.5m above ground are summarised
in Table 3.22. Contributions from
Shenzhen River remain the highest under both unmitigated and mitigated
scenarios. Further contingency enhancement measure which
the developer could be considered enhancing the odour reduction inside the
buildings is discussed in Section 3.8.
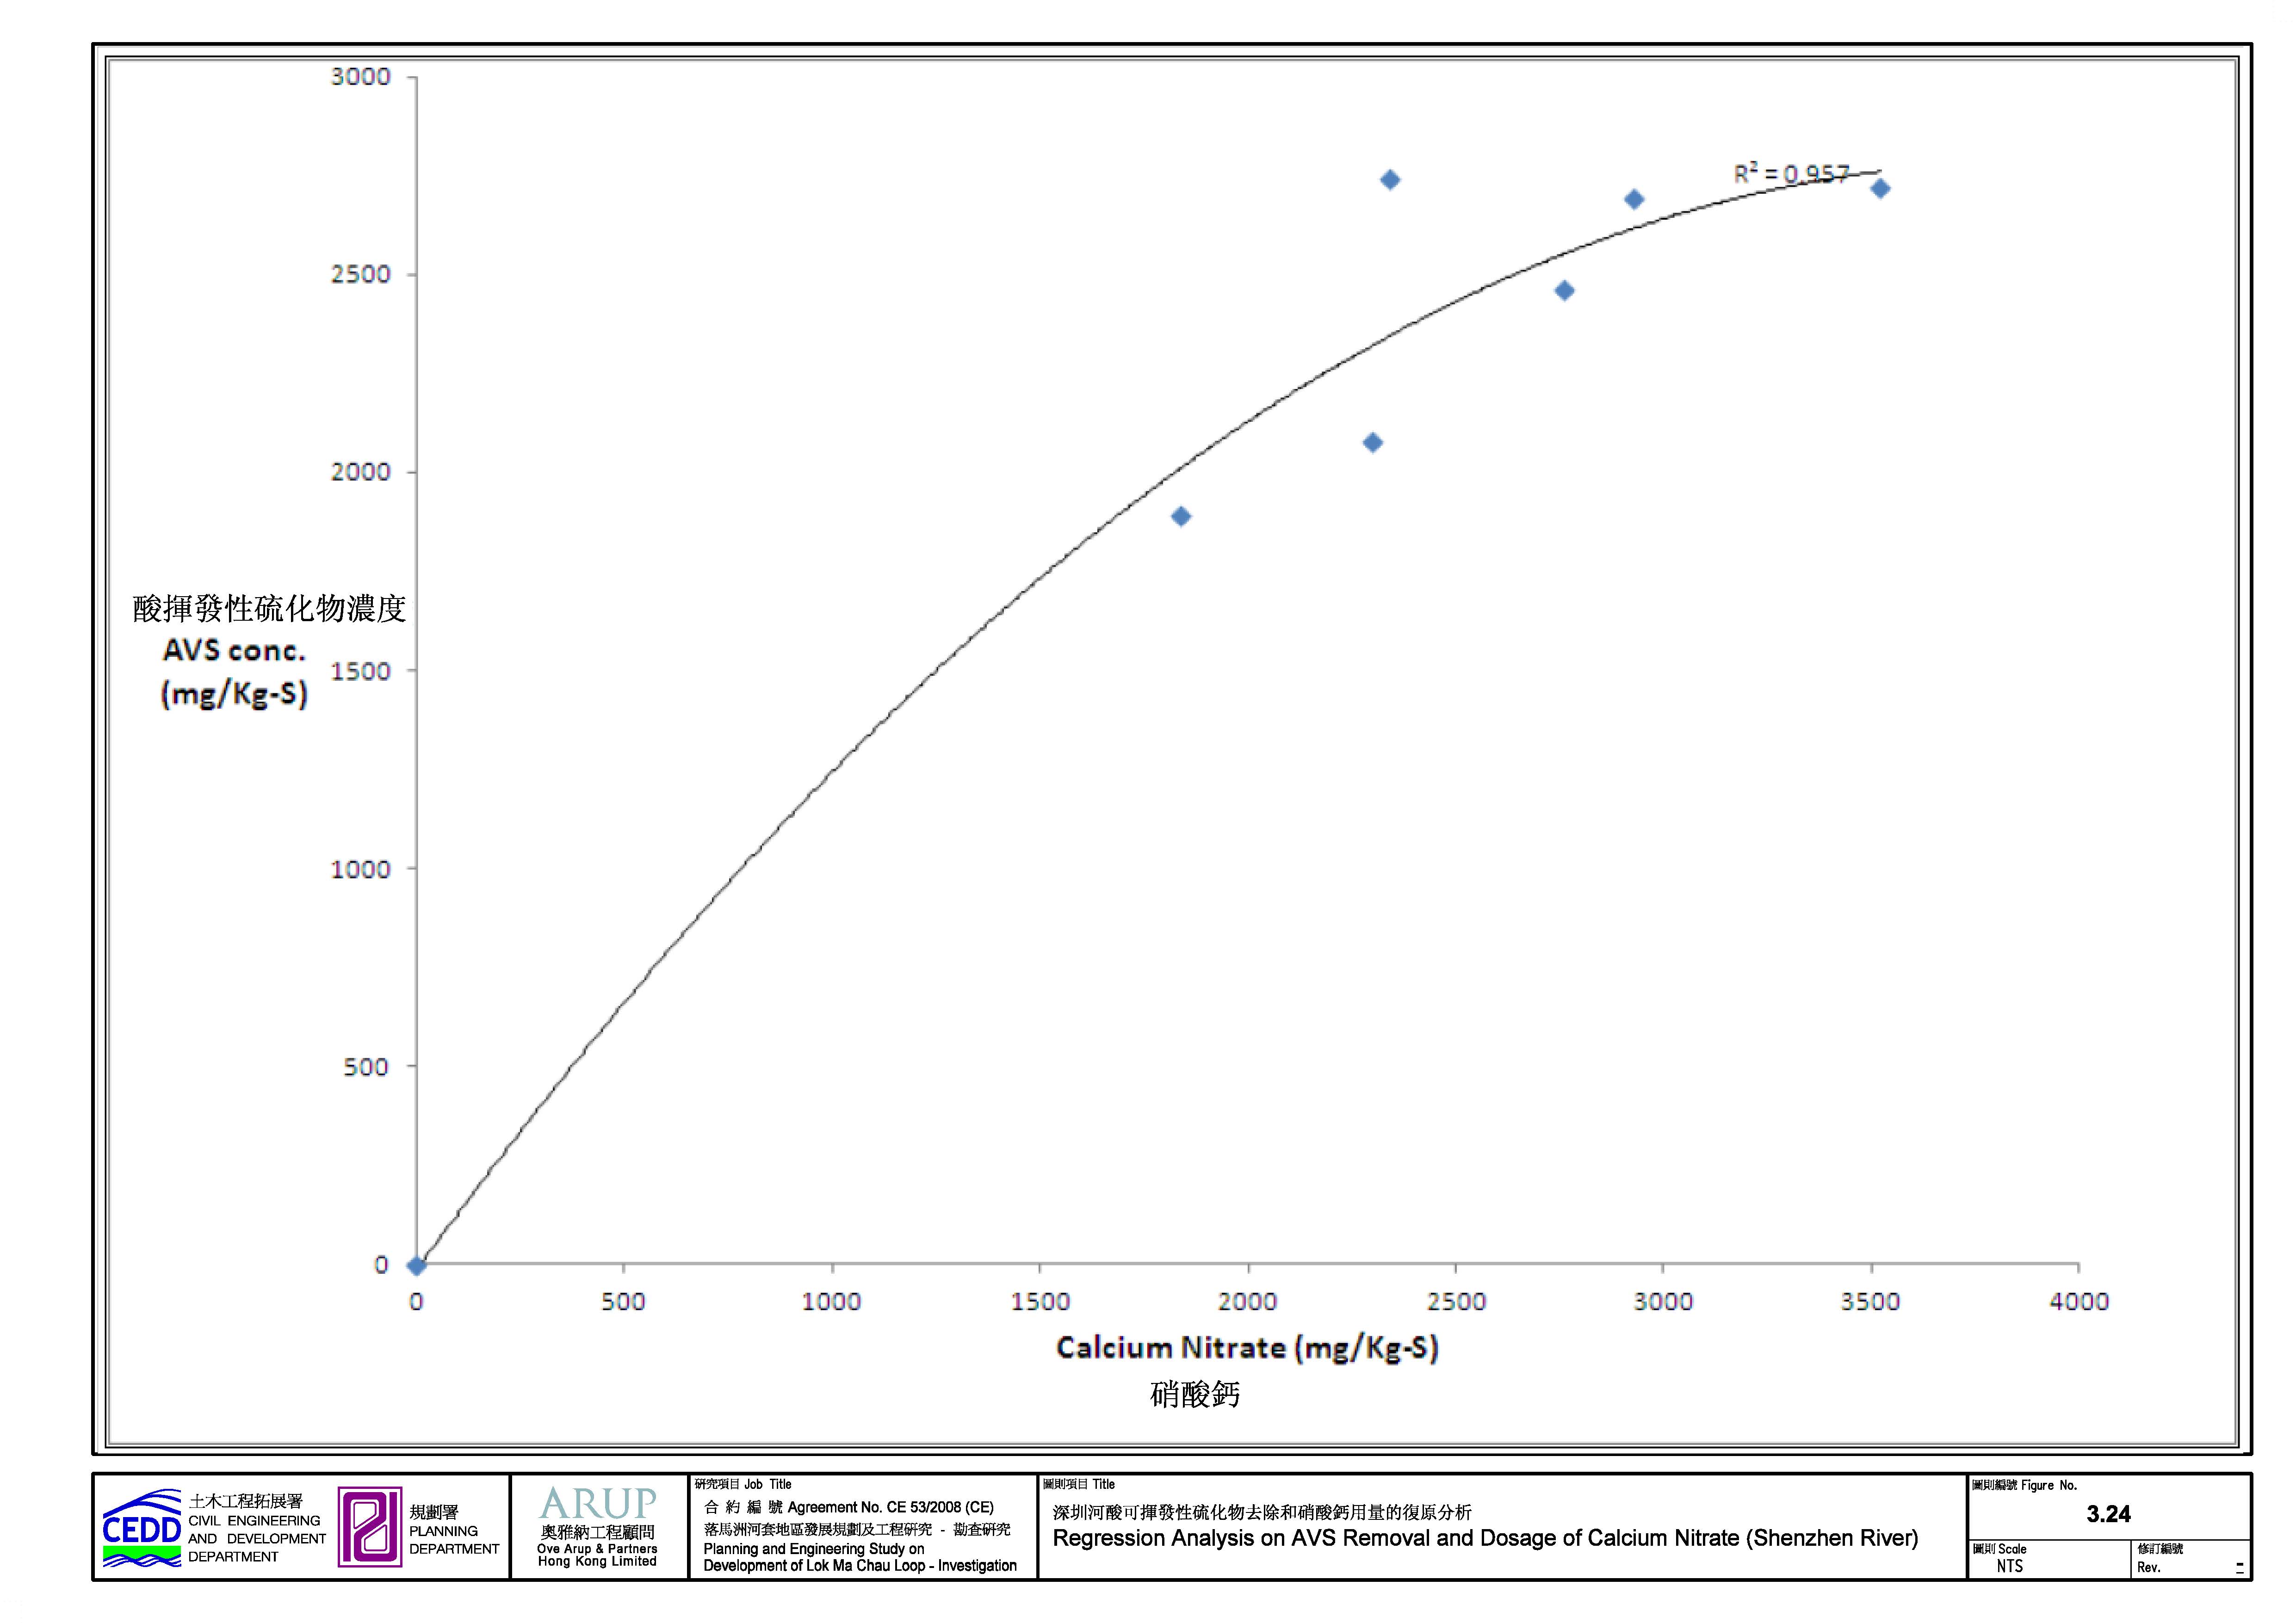
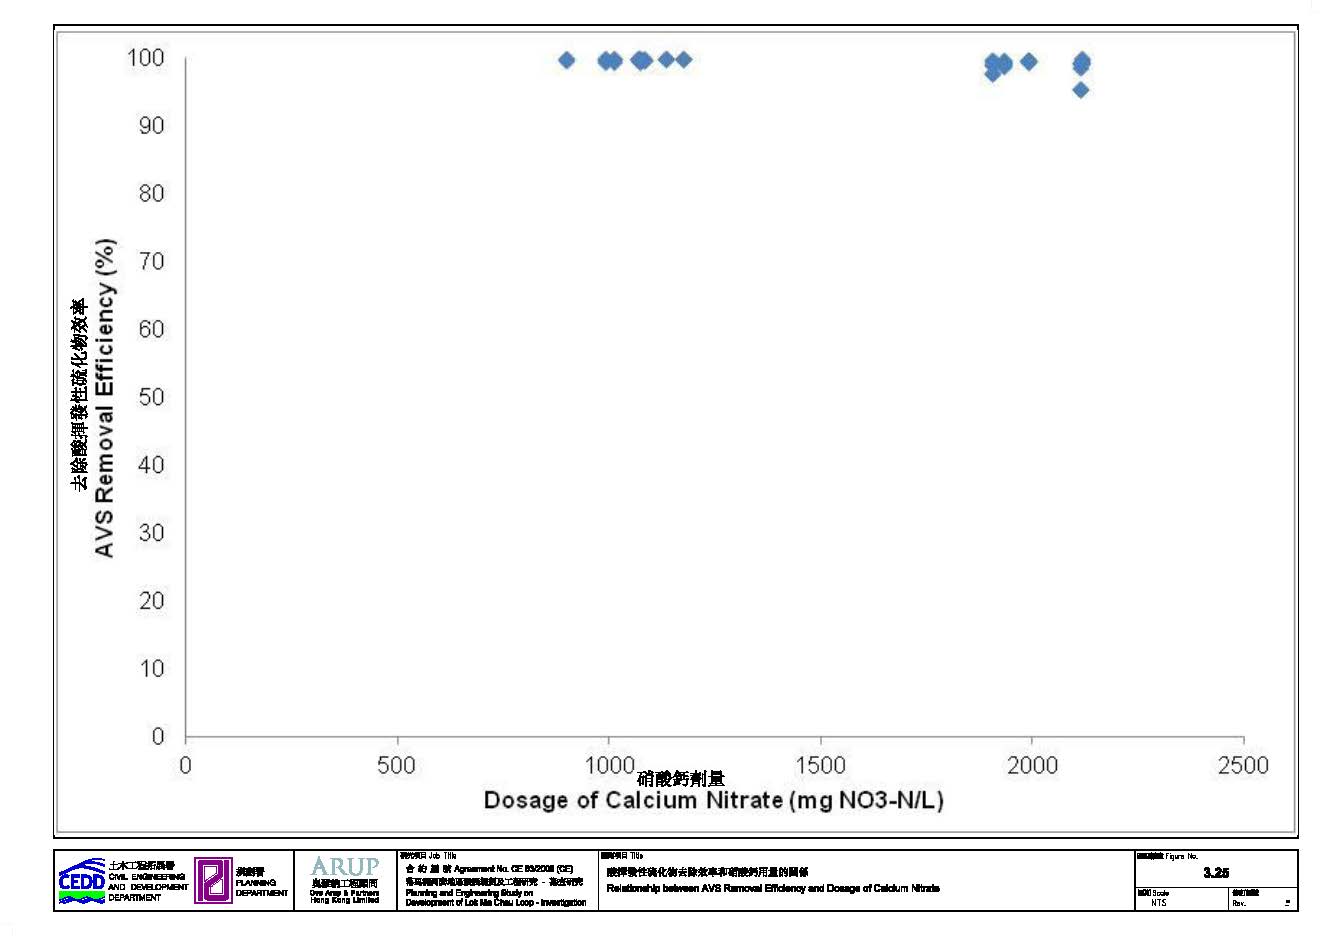
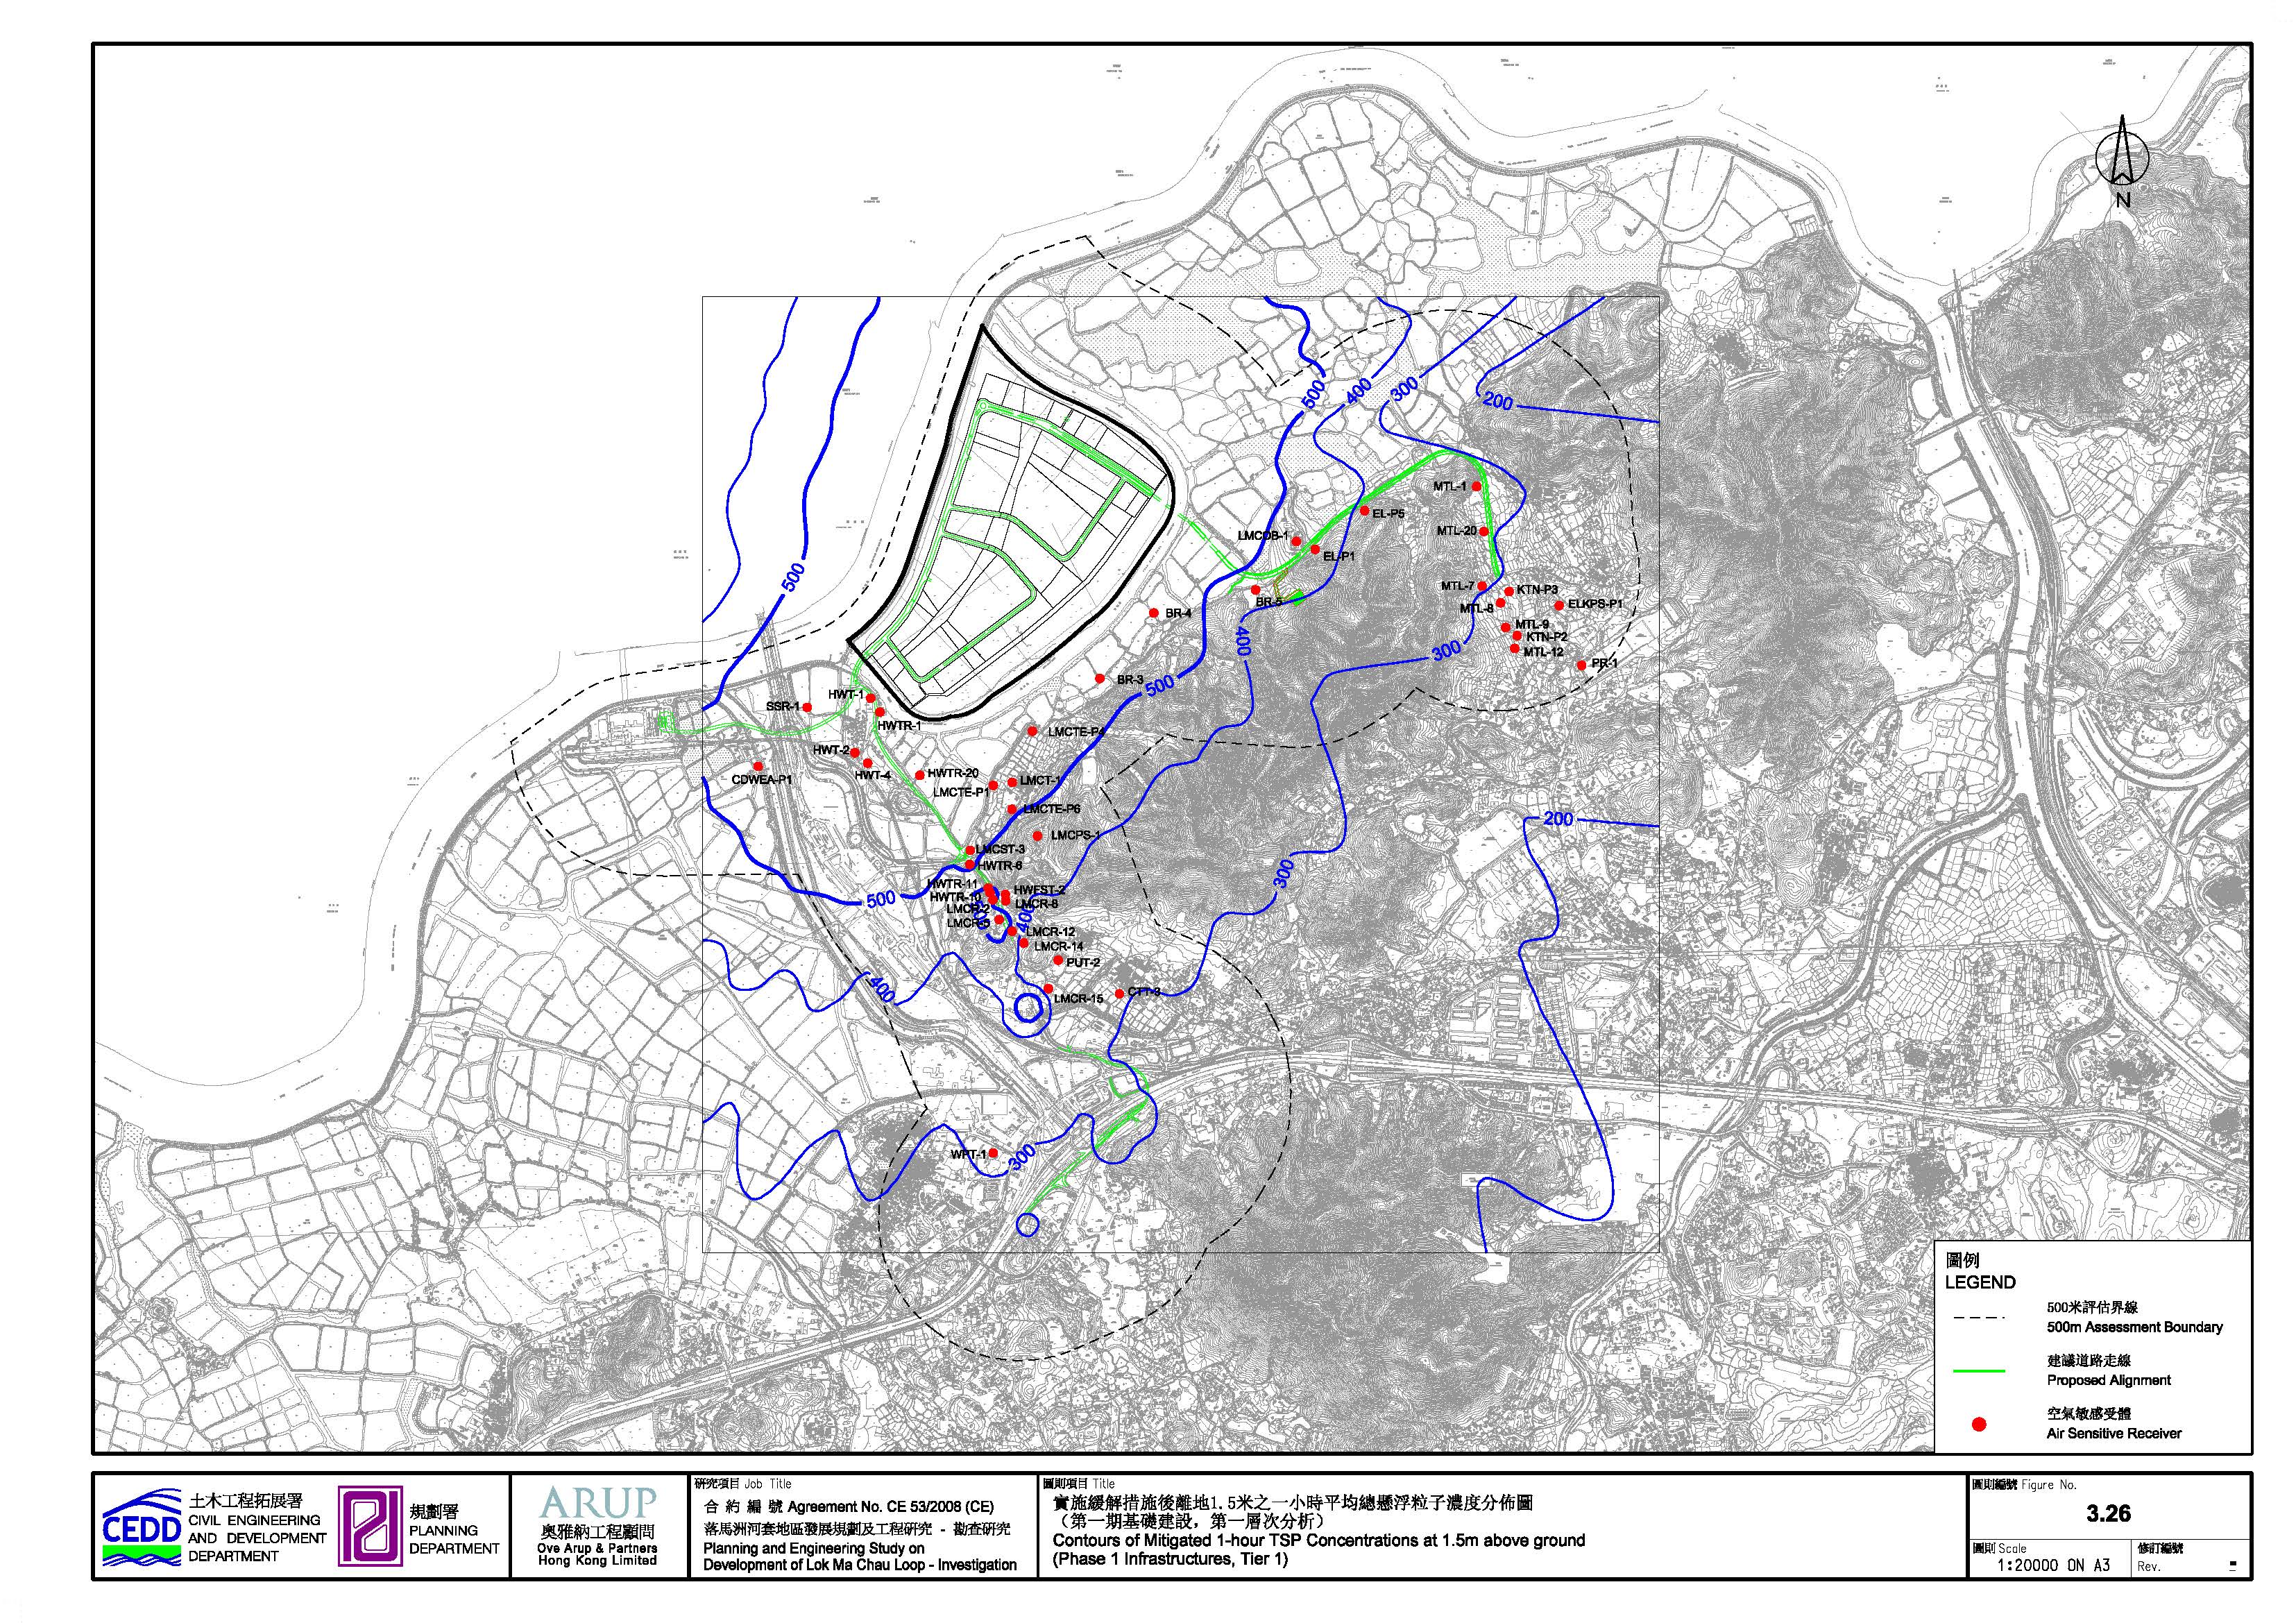
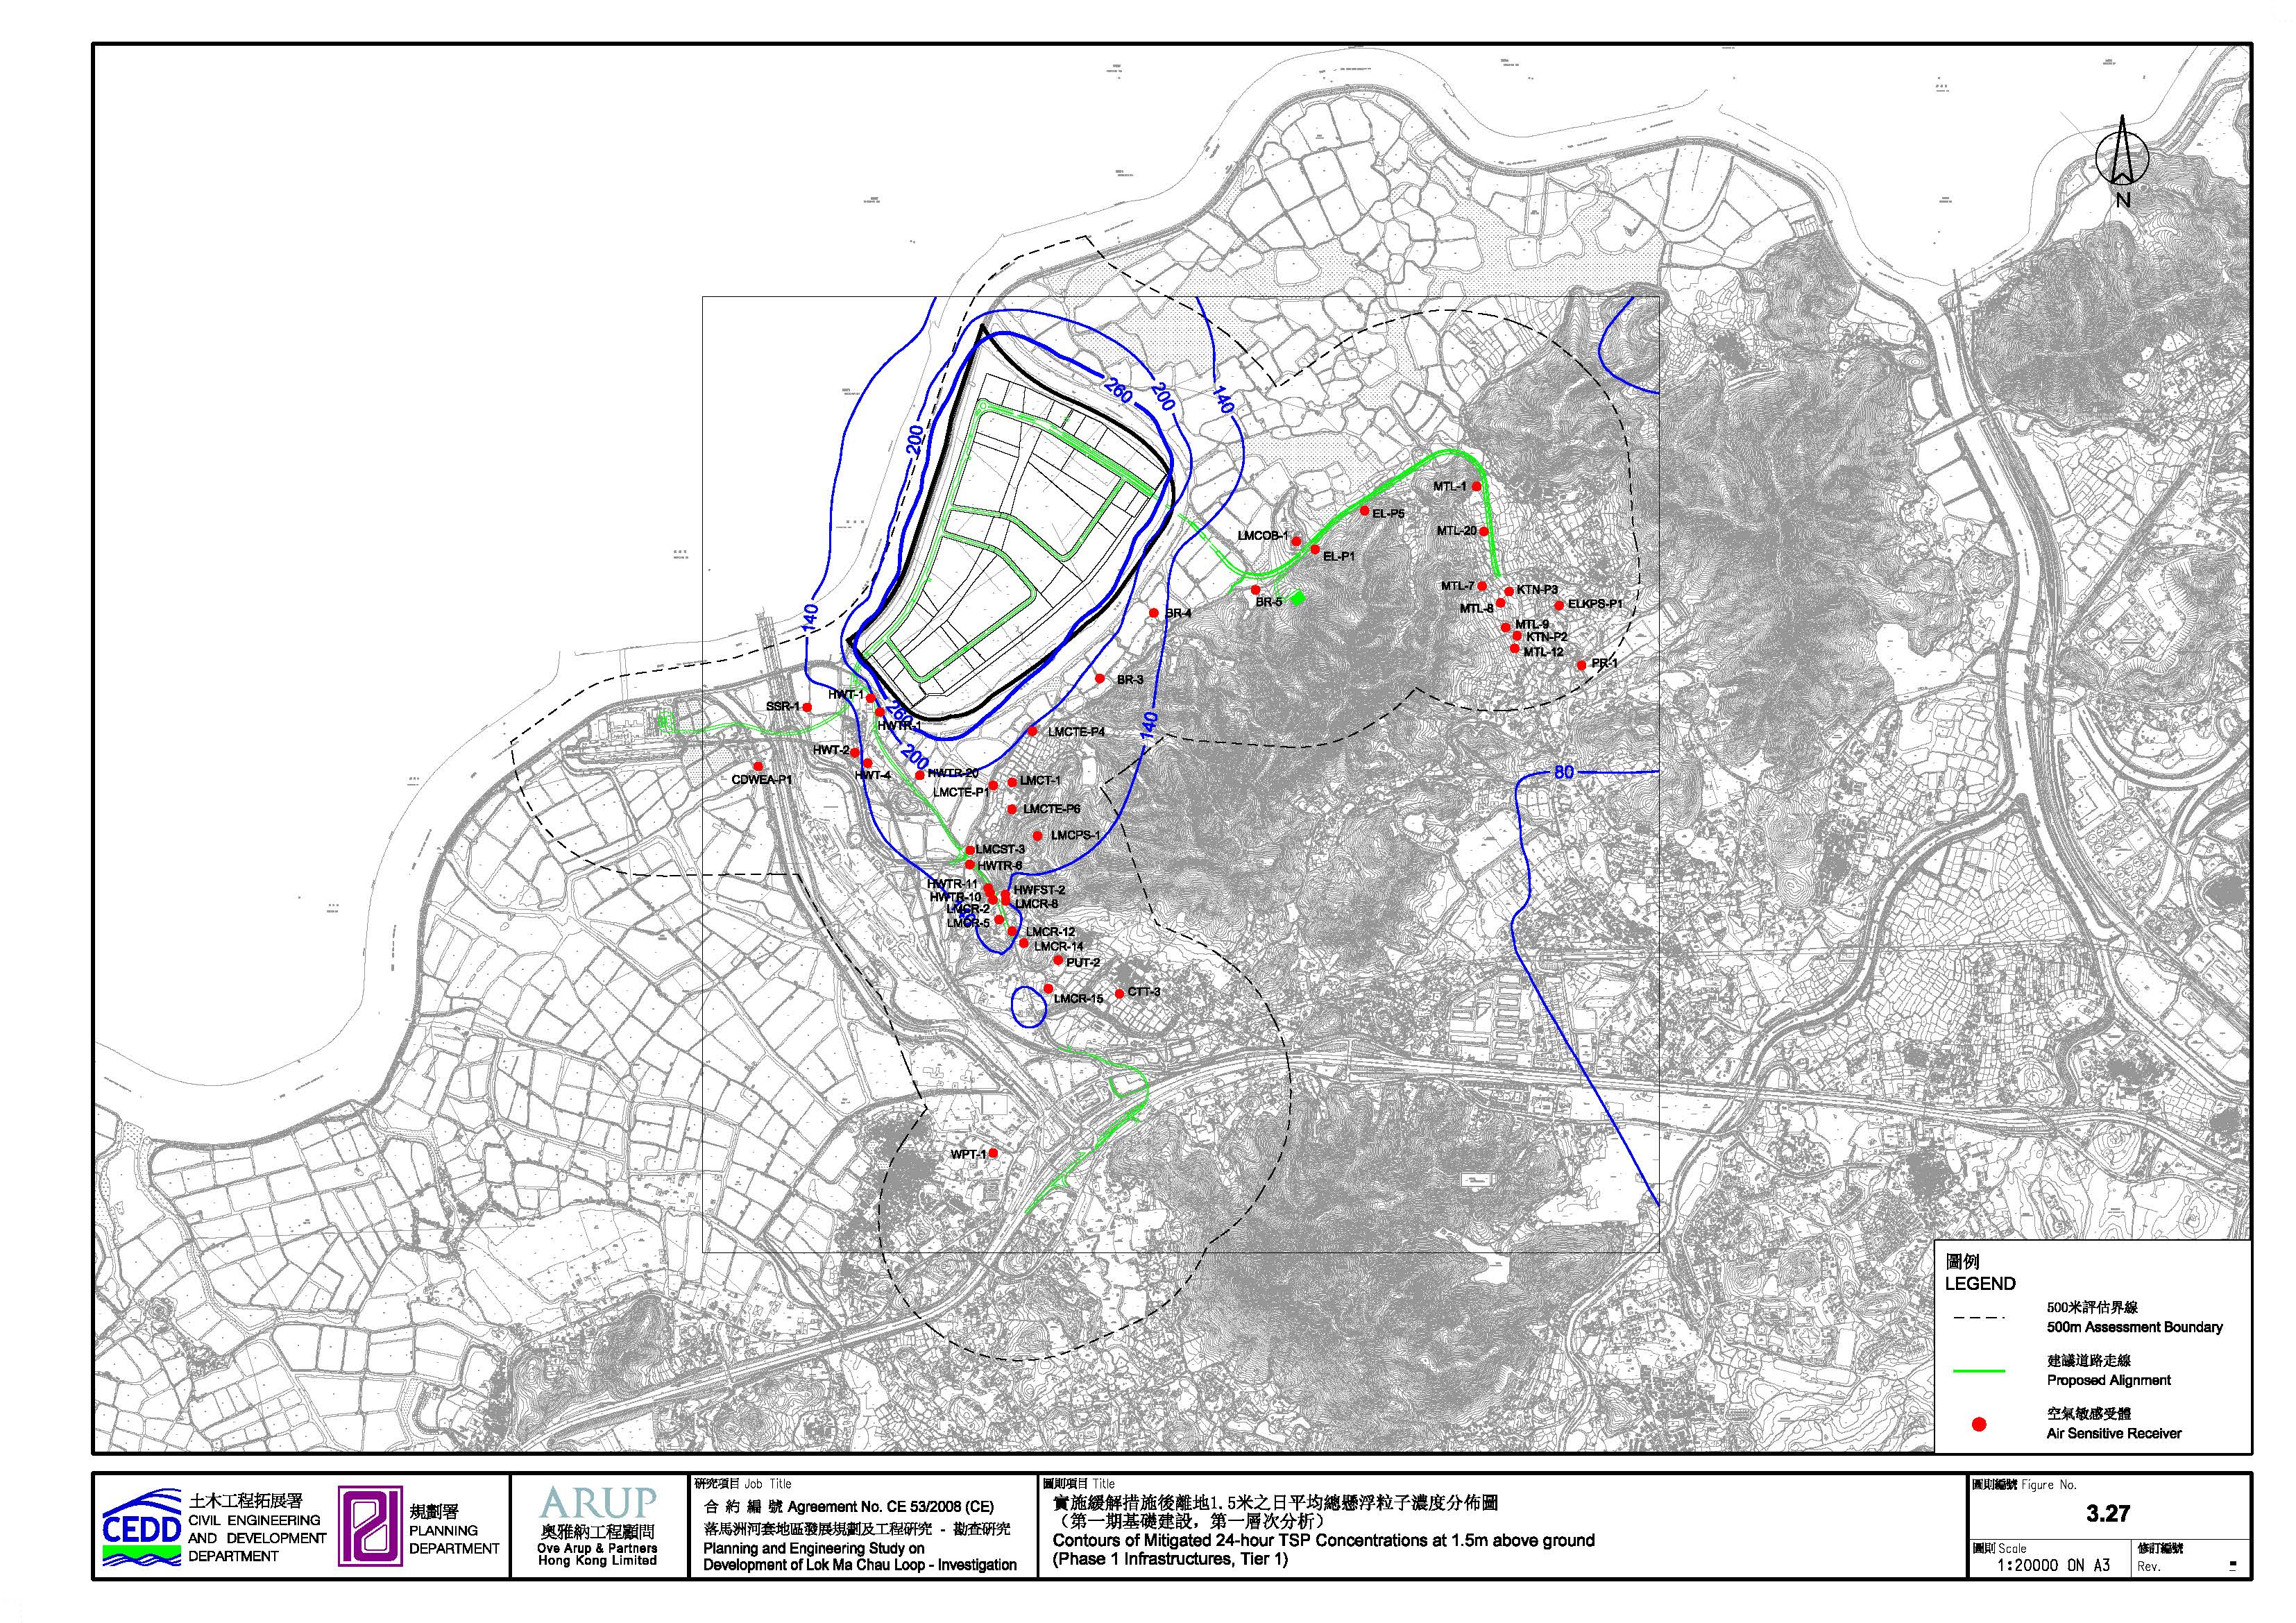
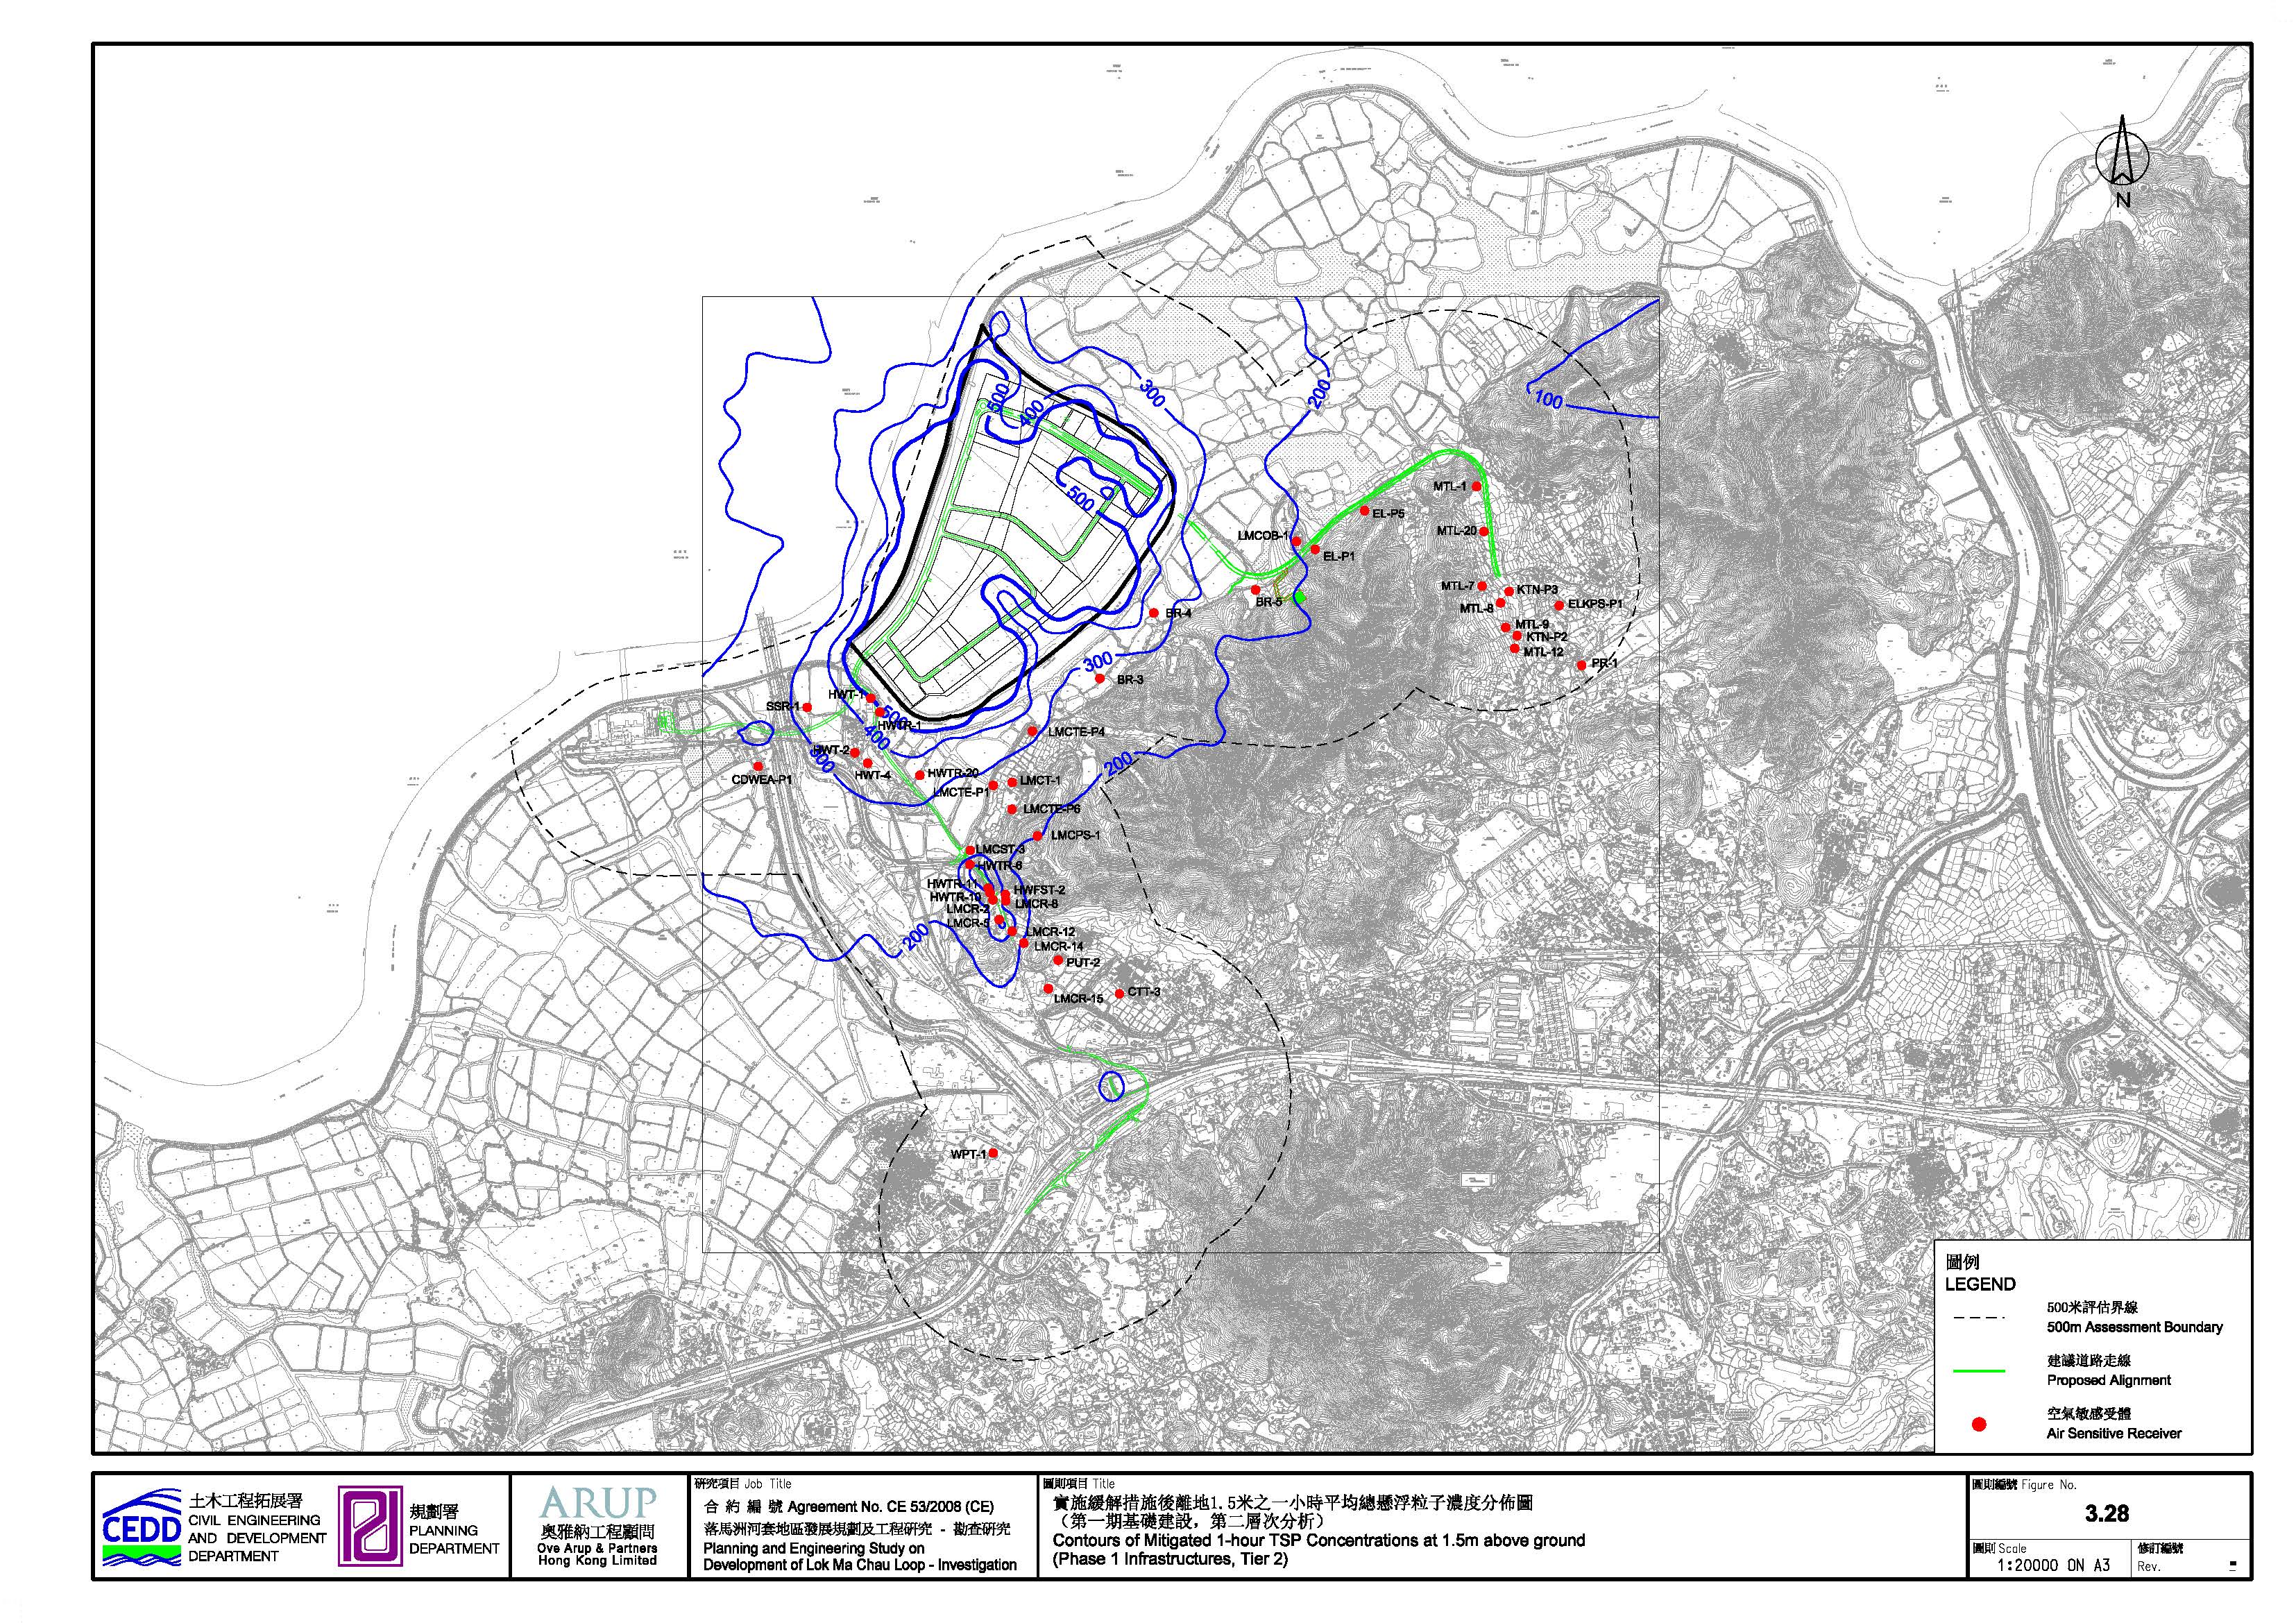
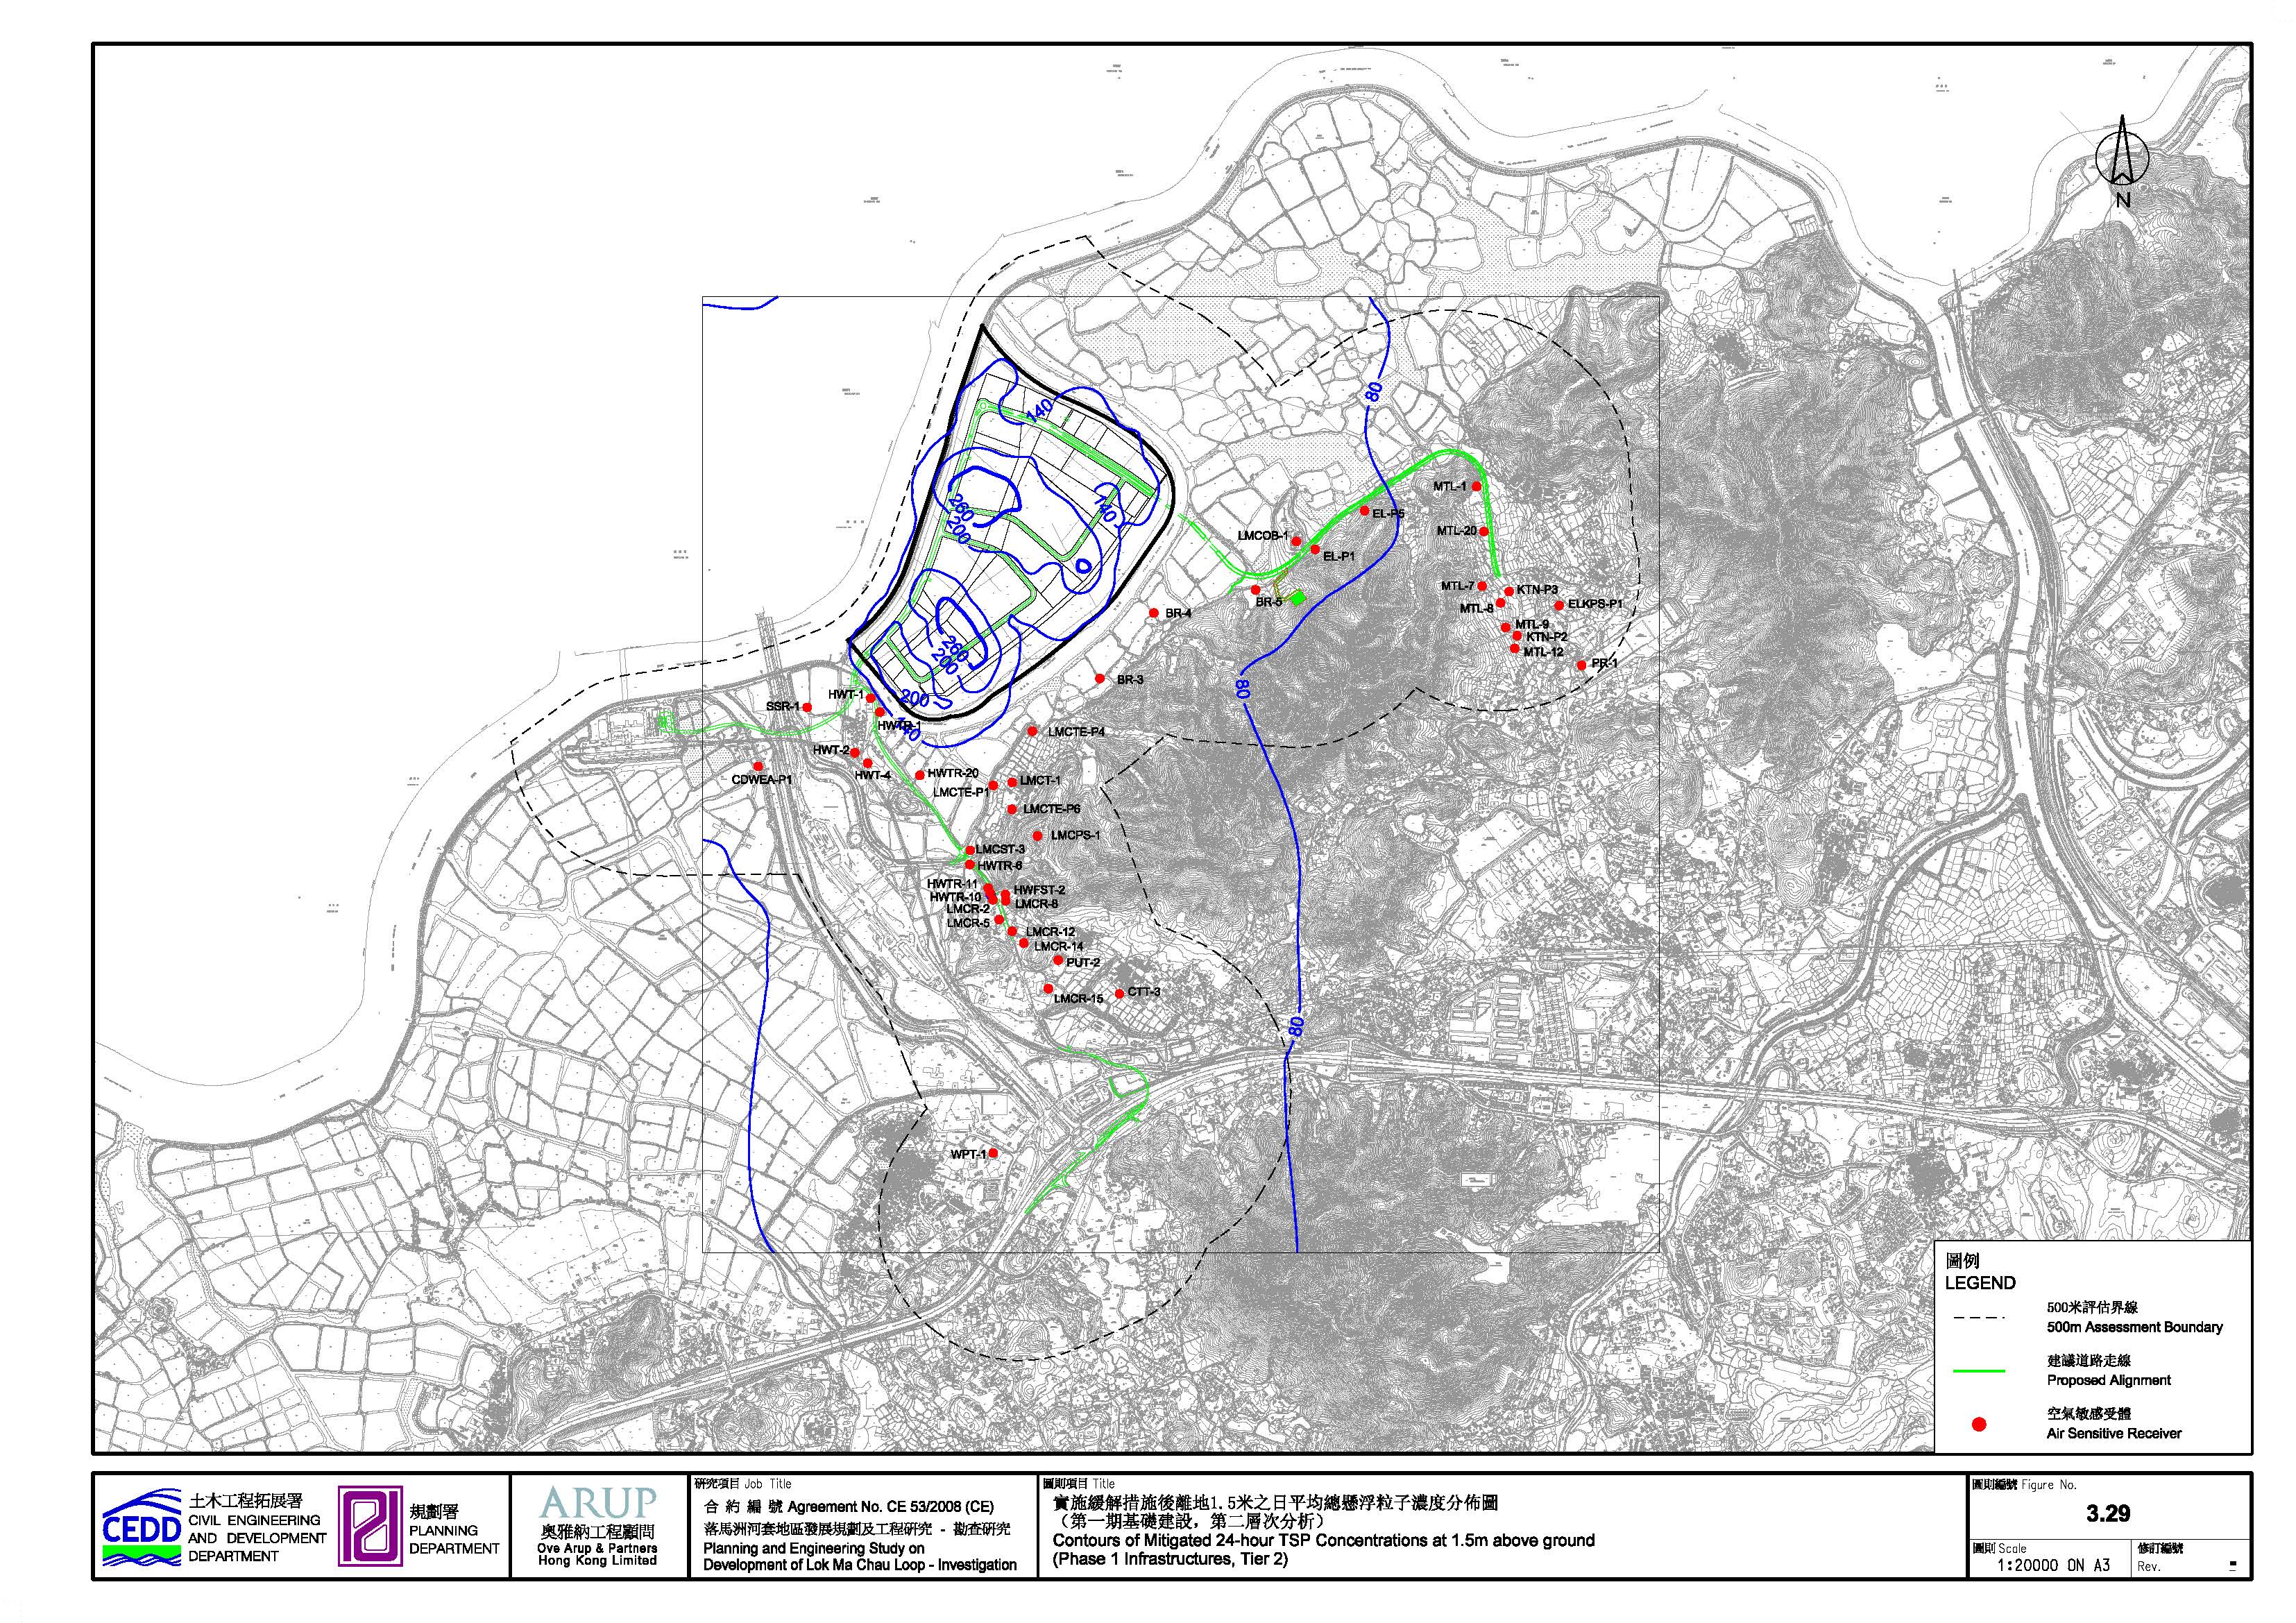
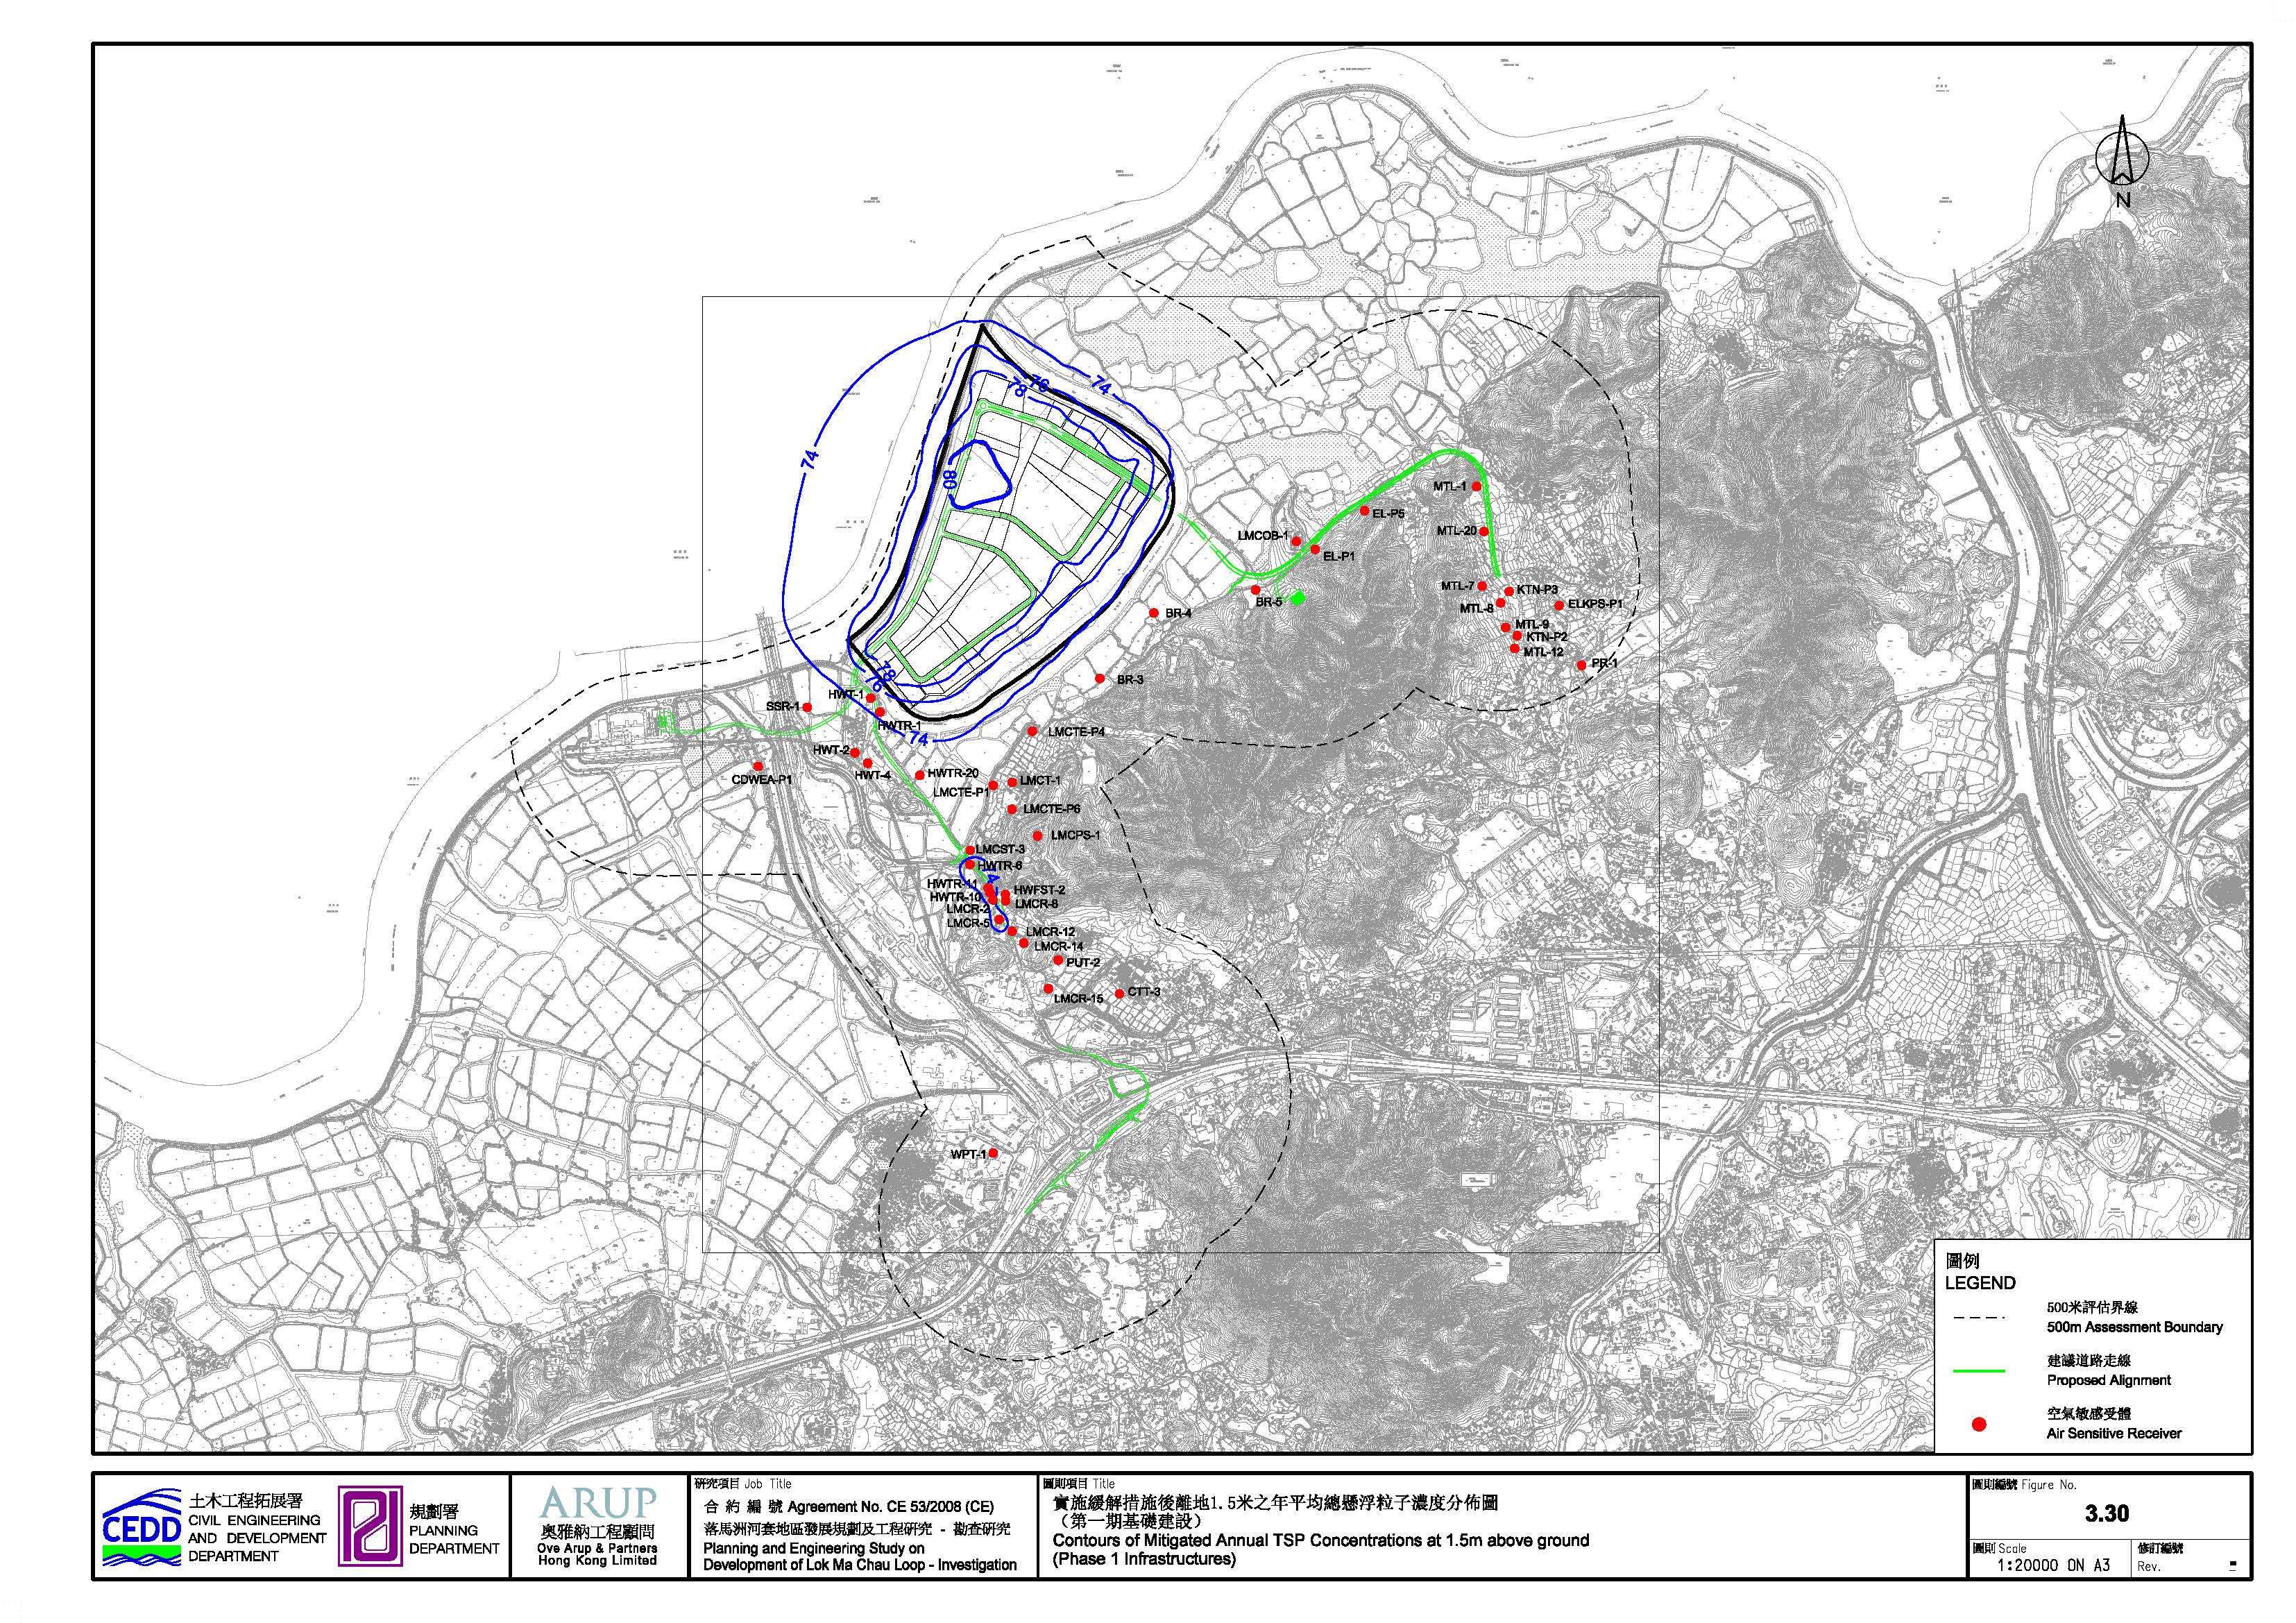
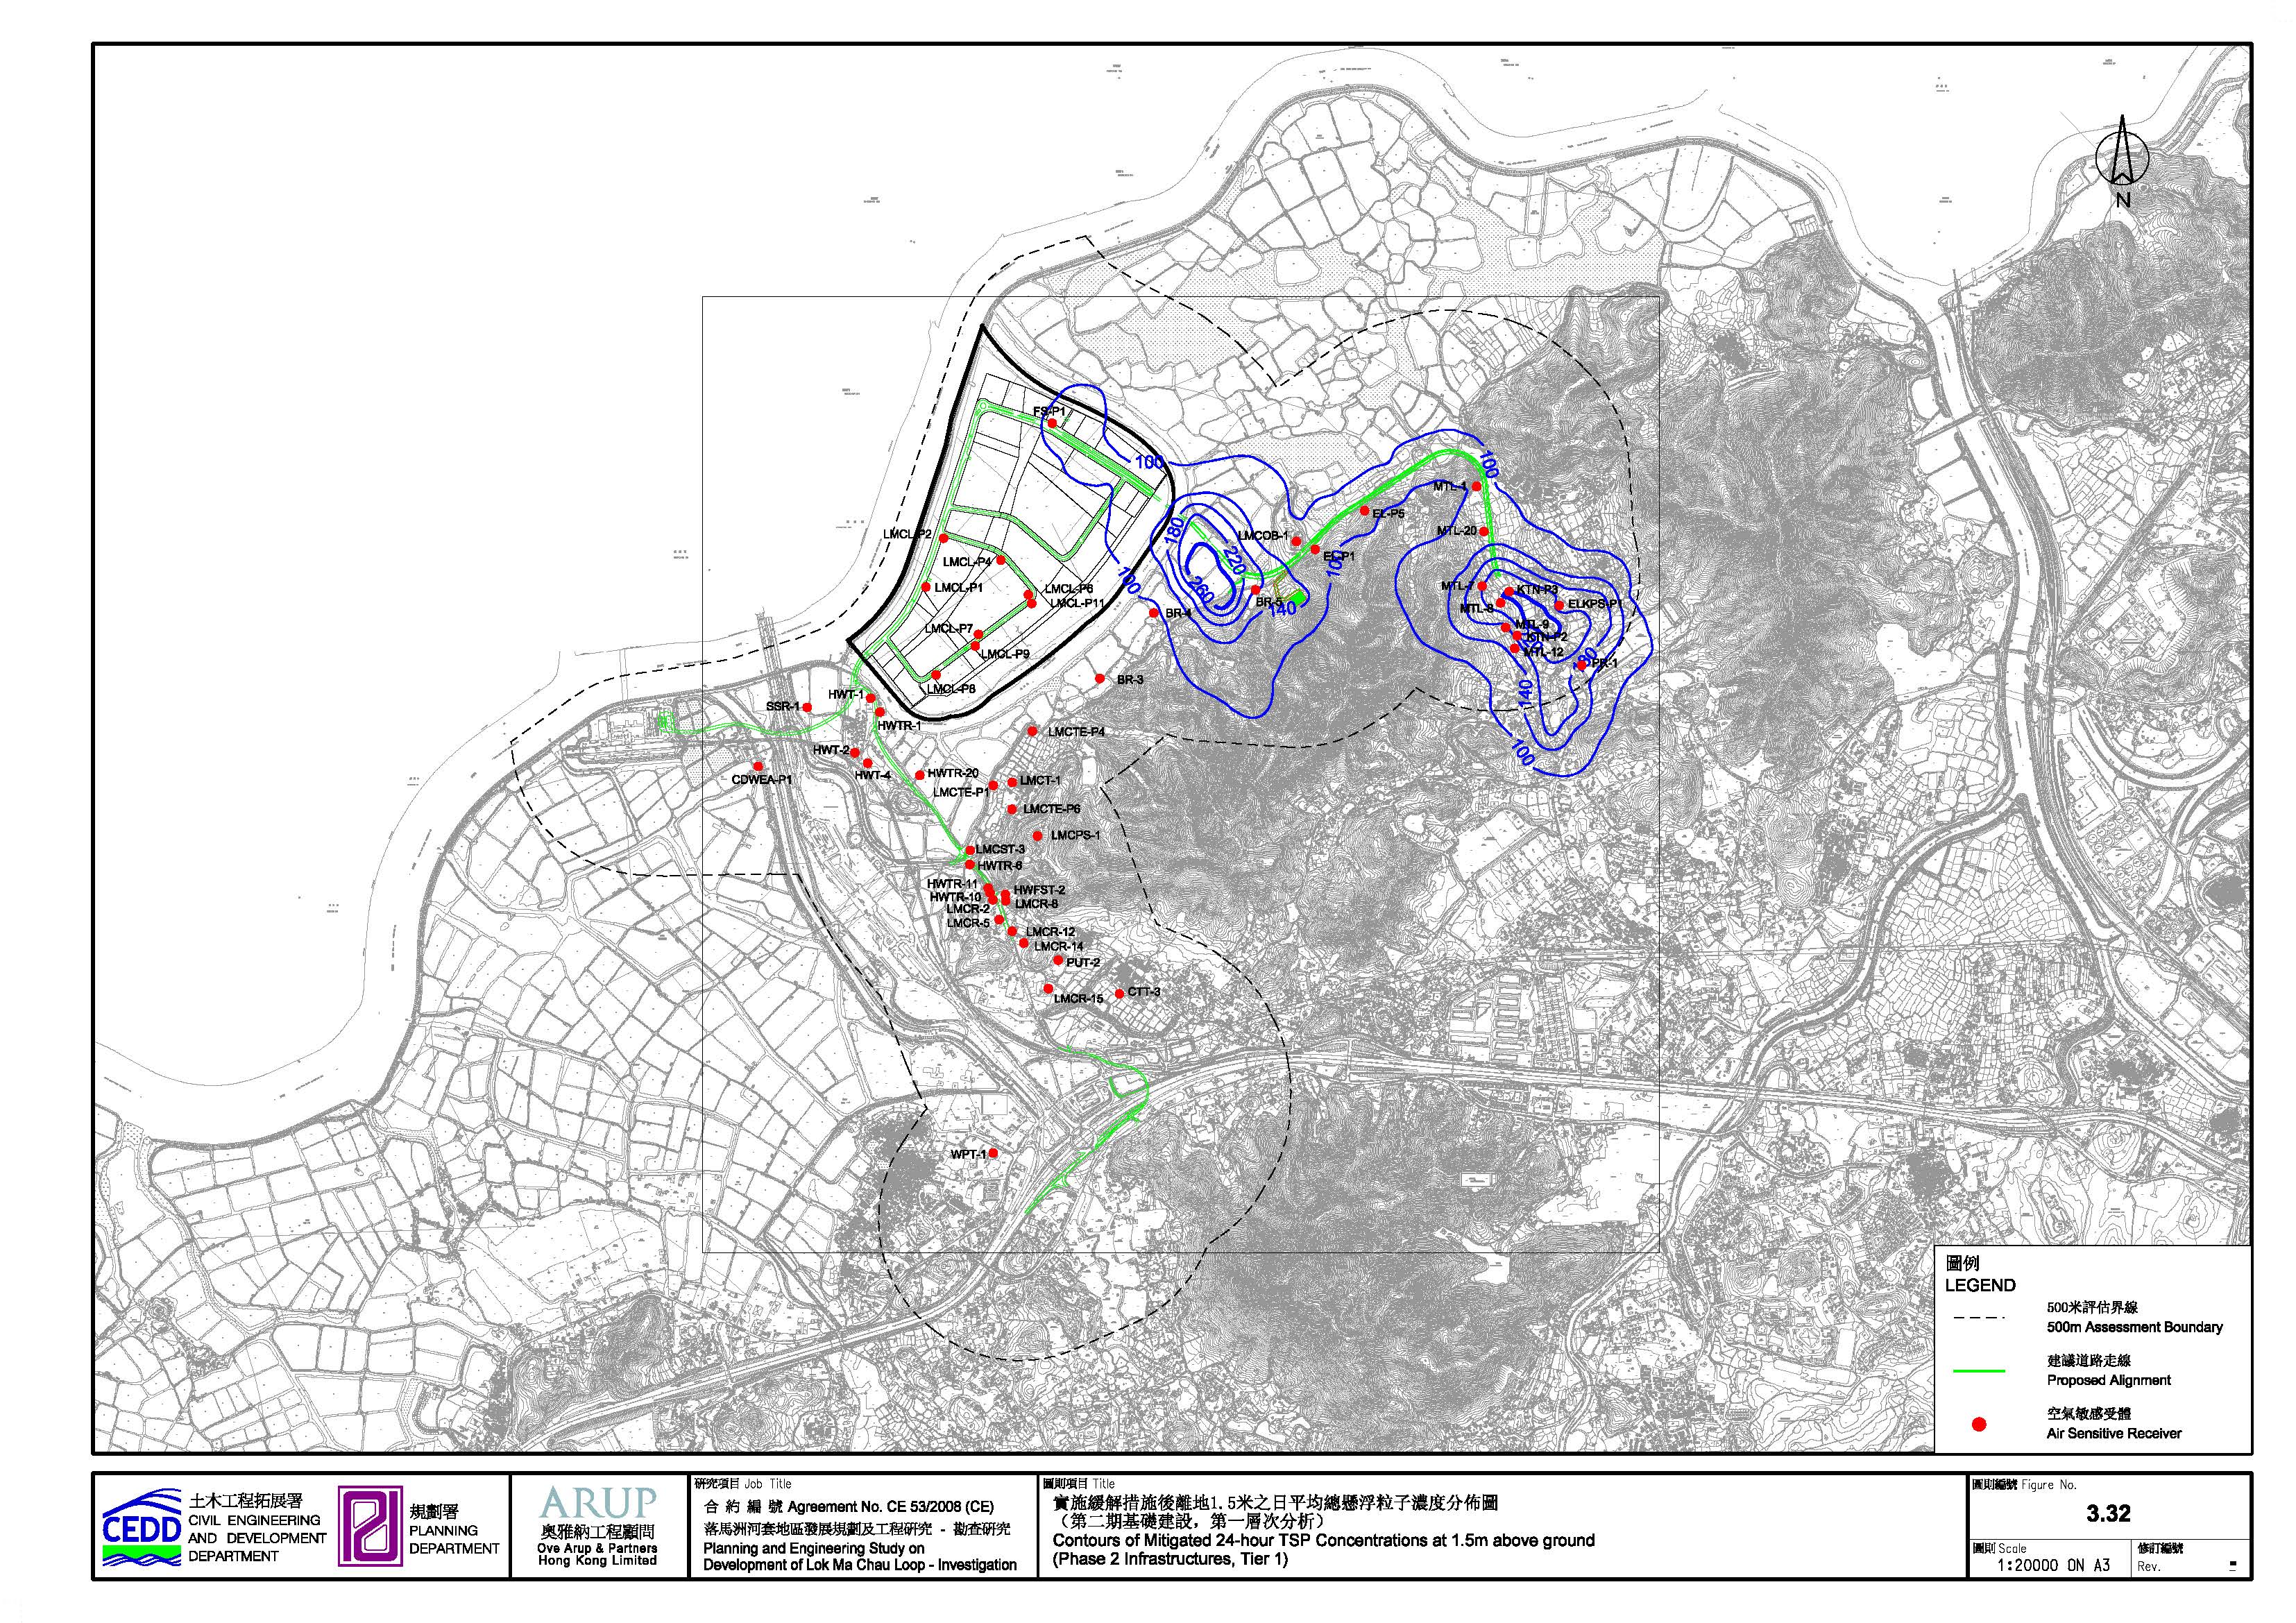
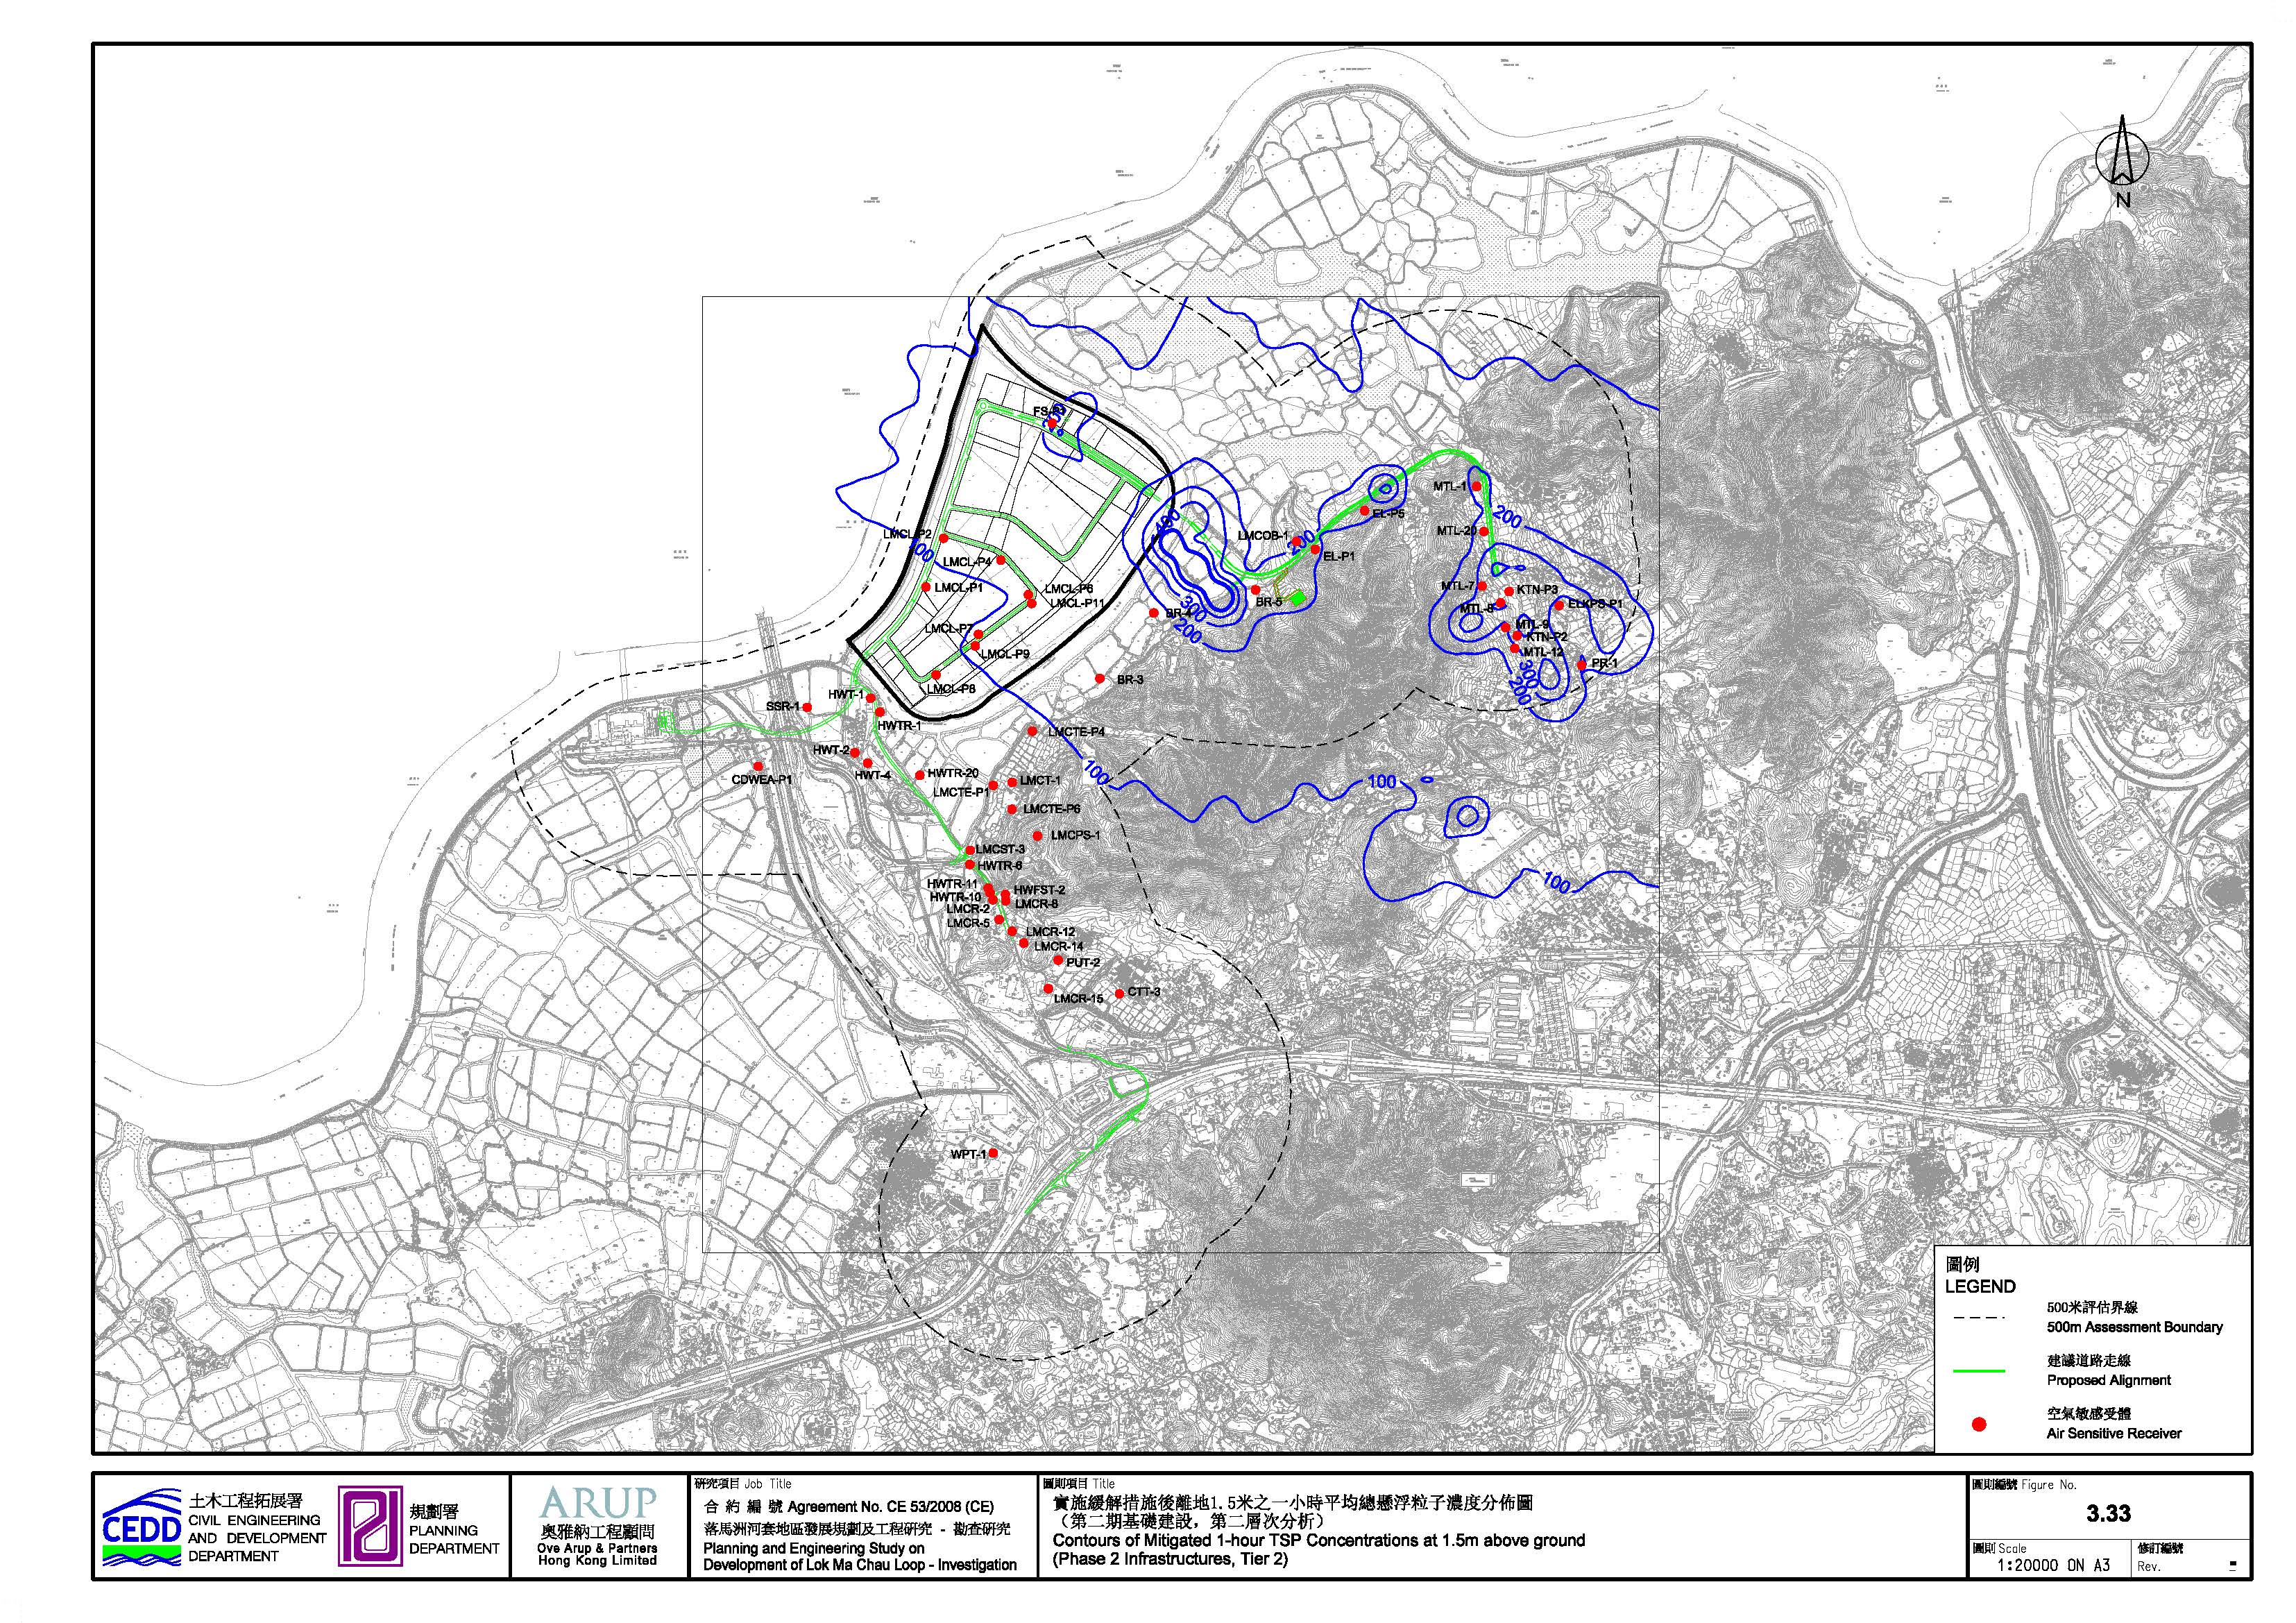
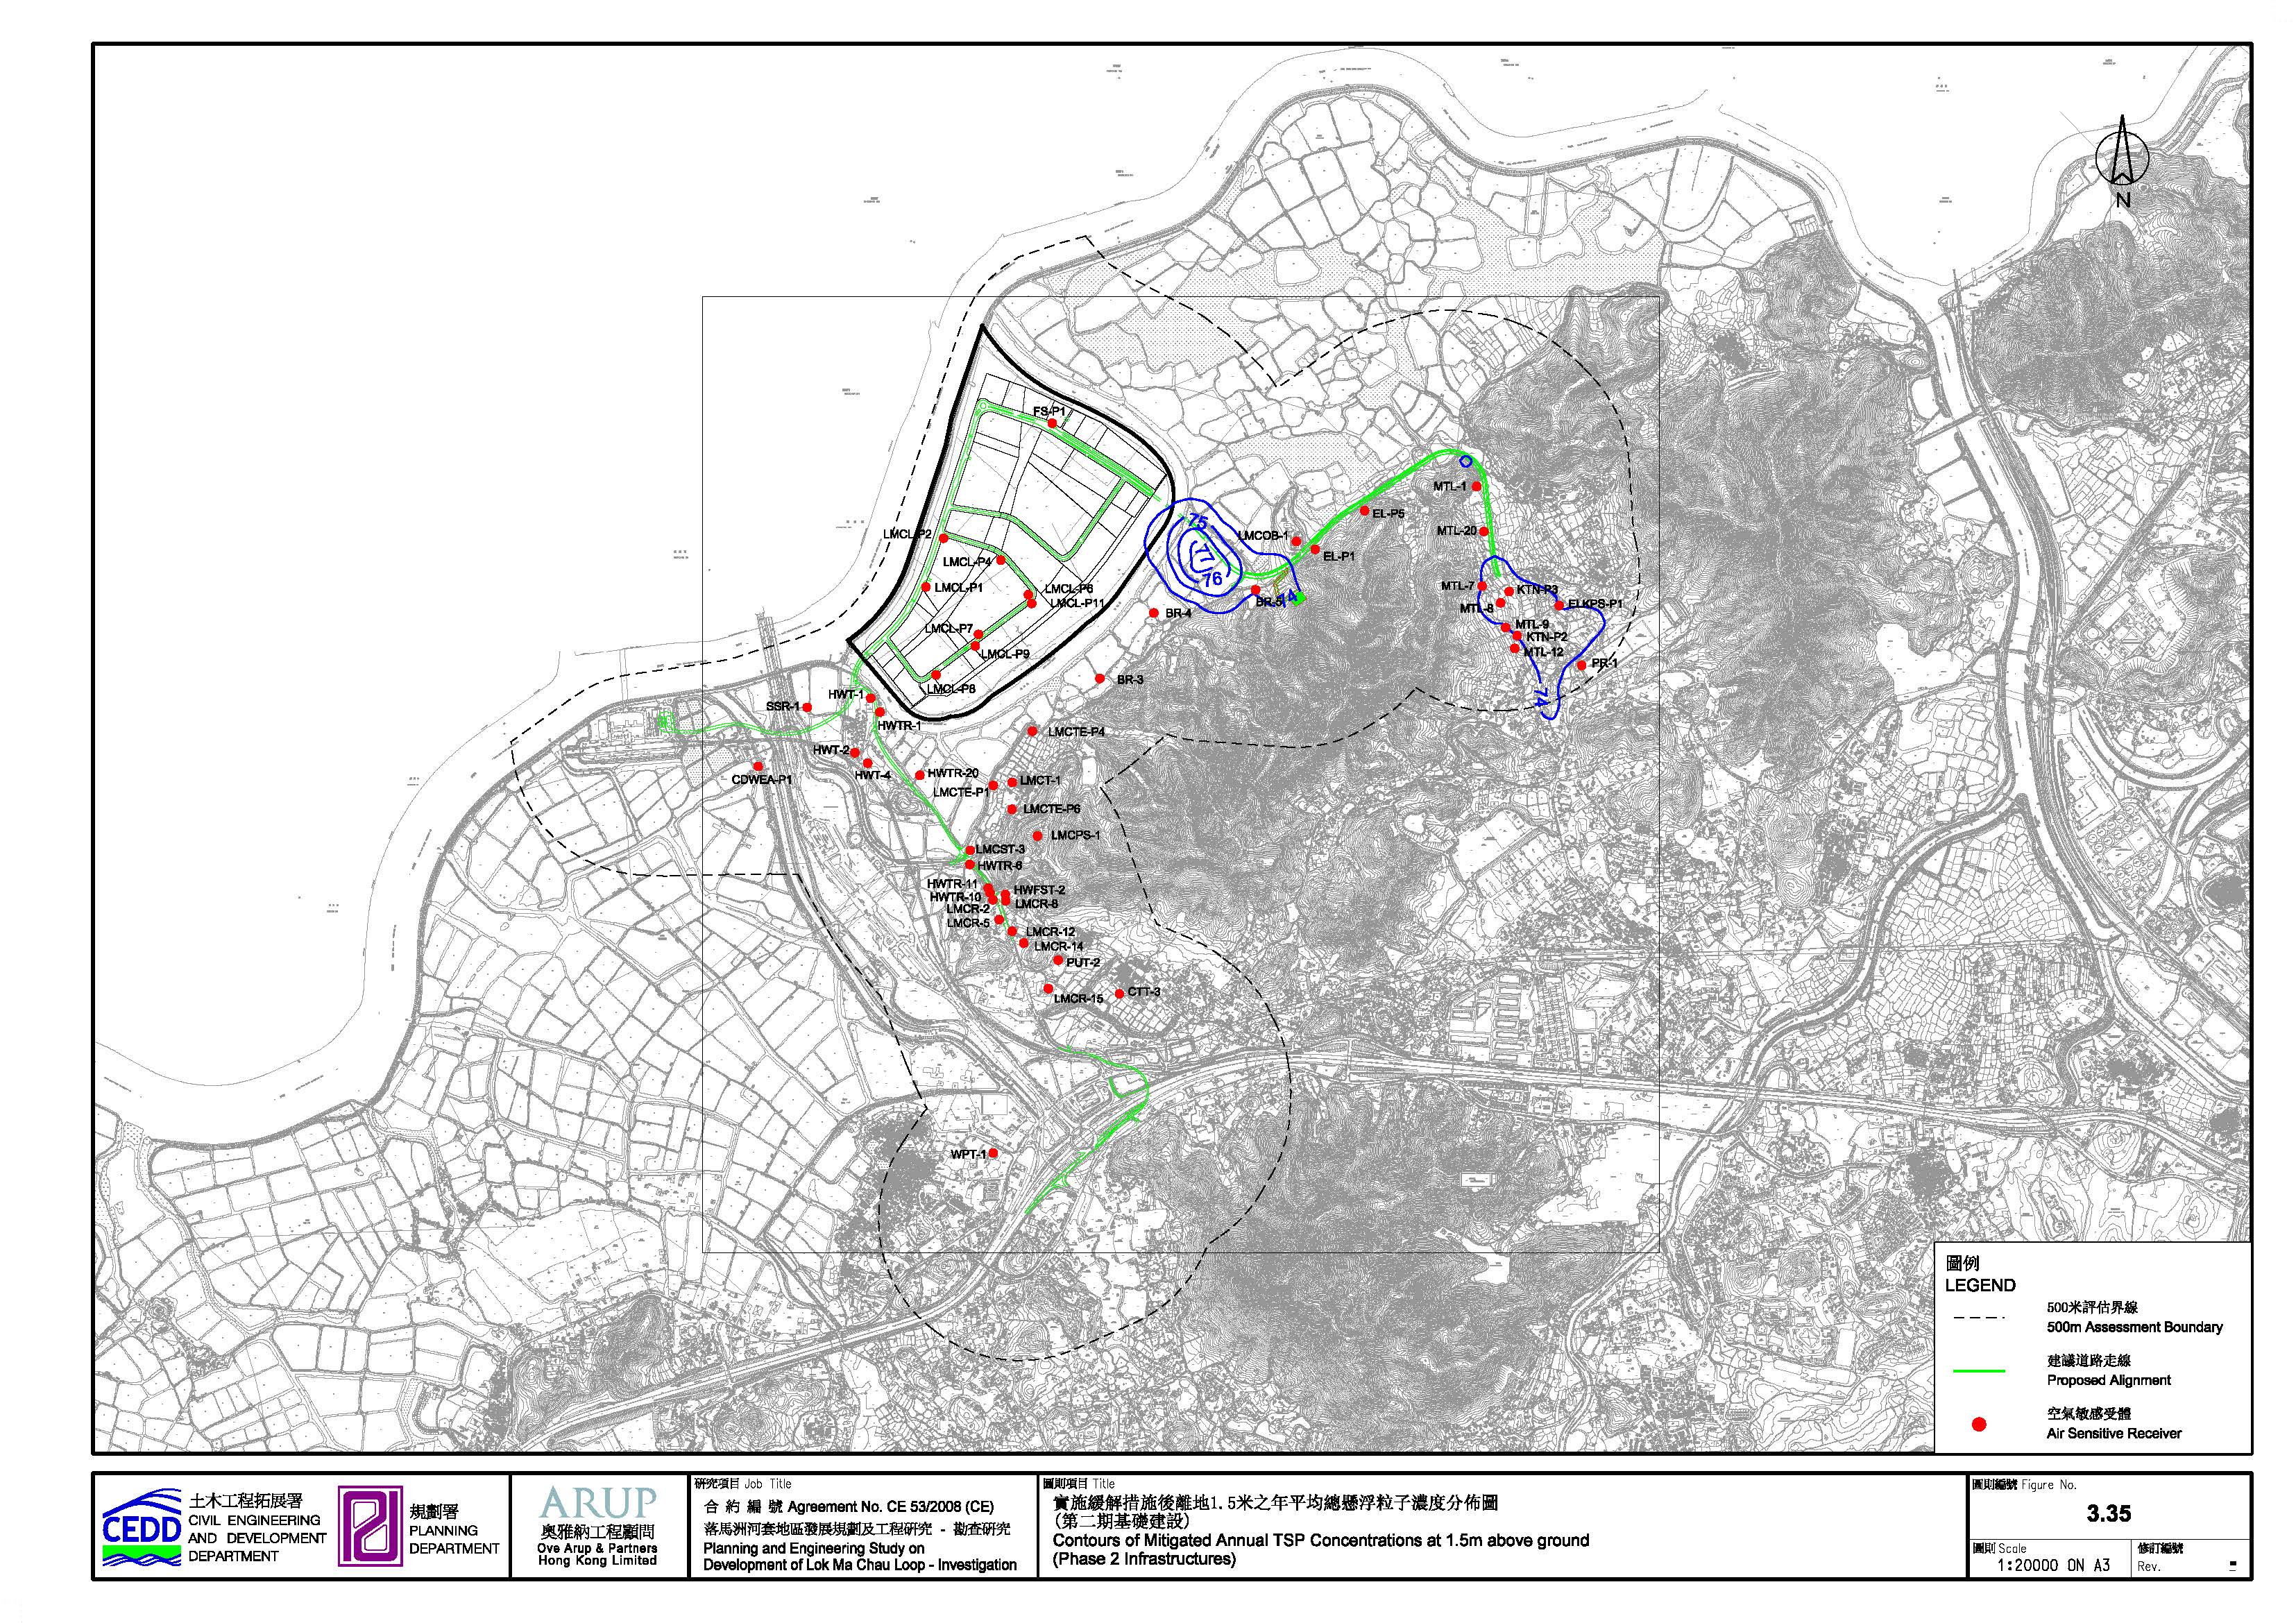