5.2 Environmental
Legislations, Standards and Guidelines
5.3 Description
of the Environment
5.6 Identification
and Evaluation of Environmental Impacts
5.9 Residual
Environmental Impacts
This
section presents the assessment of potential water quality impacts, which may
arise during the construction and operation of the LMC Loop. Control measures such as silt
traps and oil interceptors will be implemented on site to control the potential
surface runoff during construction / operational phase. Cofferdam/diaphragm
wall will be employed to prevent disturbance to waterbodies
during bridge pier and cut-and-cover underpass constructions.
During operational phase, the major water pollution
source would be the sewerage and sewage implication from the proposed sewage
treatment works for LMC Loop. A “no net increase in pollution loads
requirement” in Deep Bay will be fulfilled by loading compensation in Deep Bay
catchment by upgrading of Shek Wu Hui STW to advanced
treatment level.
The
water quality impact assessment has been conducted in accordance with the
requirements of Annexes 6 and 14 of the TM-EIAO as well as the requirements set
out under Clause 3.4.6 of the EIA Study Brief.
5.2 Environmental Legislations, Standards and Guidelines
The
relevant legislations, standards and guidelines applicable to the present study
for the assessment of water quality impacts include:
· Water Pollution Control Ordinance (WPCO) CAP 358;
· Technical Memorandum for Effluents Discharged into Drainage and Sewerage Systems Inland and Coastal Waters (TM-DSS)
· Environmental Impact Assessment Ordinance (EIAO) (CAP. 499), Technical Memorandum on Environmental Impact Assessment Process (TM-EIAO);
· No Net Increase in Pollution Loads Requirement in Deep Bay;
· Hong Kong Planning Standards and Guidelines; and
· ProPECC PN 1/94 “Construction Site Drainage”
5.2.1 Water Pollution Control Ordinance, CAP 358
The entire
Hong Kong waters are divided into ten Water Control Zones (WCZs) and four
supplementary WCZs under the Water Pollution Control Ordinance (WPCO) (CAP
358). Each WCZ has a designated set of statutory Water Quality Objectives
(WQOs) designed to protect the inland and/or marine environment and its users.
The LMC Loop is located in the Deep Bay WCZ and the corresponding WQOs are
summarised in Table 5.1.
Table 5.1 Water quality objectives for Deep Bay Water Control
Zones
|
Objectives |
Sub-Zone |
|
|
Offensive Odour, Tints |
Not to be present |
Whole zone |
|
Visible
foam, oil scum, litter |
Not
to be present |
Whole
zone |
|
Dissolved
Oxygen (DO) within 2 m of the seabed |
Not
less than 2.0mg/L for 90% of samples |
Outer
Marine Subzone excepting Mariculture Subzone |
|
DO
within 1 m below surface |
Not
less than 4.0mg/L for 90% of samples |
Inner
Marine Subzone excepting Mariculture Subzone |
|
Not
less than 5.0mg/L for 90% of samples |
Mariculture
Subzone |
|
|
Depth-averaged
DO |
Not less
than 4.0mg/L for 90% of samples |
Outer
Marine Subzone excepting Mariculture Subzone |
|
Not
less than 4.0mg/L |
Yuen
Long & Kam Tin (Upper and Lower) Subzones, Beas Subzone, Indus Subzone,
Ganges Subzone, Water Gathering Ground Subzones and other inland waters of
the Zone |
|
|
5-Day
Biochemical Oxygen Demand (BOD5) |
Not
to exceed 3mg/L |
Yuen
Long & Kam Tin (Upper) Subzone, Beas Subzone, Indus Subzone, Ganges
Subzone and Water Gathering Ground Subzones |
|
Not
to exceed 5mg/L |
Yuen
Long & Kam Tin (Lower) Subzone and other inland waters |
|
|
Chemical
Oxygen Demand (COD) |
Not
to exceed 15mg/L |
Yuen
Long & Kam Tin (Upper) Subzone, Beas Subzone, Indus Subzone, Ganges
Subzone and Water Gathering Ground |
|
Not
to exceed 30mg/L |
Yuen Long & Kam Tin (Lower) Subzone and
other inland waters |
|
|
pH |
To
be in the range of 6.5 – 8.5, change due to waste discharges not to exceed
0.2 |
Marine
waters excepting Yung Long Bathing Beach Subzone |
|
To
be in the range of 6.5 – 8.5 |
Yuen
Long & Kam Tin (Upper and Lower) Subzones, Beas Subzone, Indus Subzone,
Ganges Subzone and Water Gathering Ground Subzones |
|
|
To
be in the range of 6.0 –9.0 |
Other
inland waters |
|
|
To
be in the range of 6.0 – 9.0 for 95%
samples, change due to waste discharges not to exceed 0.5 |
Yung
Long Bathing Beach Subzone |
|
|
Salinity |
Change
due to waste discharges not to exceed 10% of ambient |
Whole
zone |
|
Temperature |
Change
due to waste discharges not to exceed 2°C |
Whole
zone |
|
Suspended
solids (SS) |
Not to
raise the ambient level by 30% caused by waste discharges and shall not
affect aquatic communities |
Marine
waters |
|
Not
to cause the annual median to exceed 20mg/L |
Yuen
Long & Kam Tin (Upper and Lower) Subzones, Beas Subzone, Ganges Subzone,
Indus Subzone, Water Gathering Ground Subzones and other inland waters |
|
|
Unionized
Ammonia (UIA) |
Annual
mean not to exceed 0.021mg/L as unionized form |
Whole
zone |
|
Nutrients |
Shall
not cause excessive algal growth |
Marine
waters |
|
Total
Inorganic Nitrogen (TIN) |
Annual
mean depth-averaged inorganic nitrogen not to exceed 0.7mg/L |
Inner
Marine Subzone |
|
Annual
mean depth-averaged inorganic nitrogen not to exceed 0.5mg/L |
Outer
Marine Subzone |
|
|
Bacteria |
Not exceed
610per 100ml, calculated as the geometric mean of all samples collected in
one calendar year |
Secondary
Contact Recreation Subzones and Mariculture
Subzones |
|
Should
be zero per 100 ml, calculated as the running median of the most recent 5
consecutive samples taken between 7 and 21 days. |
Yuen
Long & Kam Tin (Upper) Subzone, Beas Subzone, Indus Subzone, Ganges
Subzone and Water Gathering Ground Subzones |
|
|
Not
exceed 180per 100ml, calculated as the geometric mean of the collected from March
to October inclusive in one calendar year. Samples should be taken at least 3
times in a calendar month at intervals of between 3 and 14days. |
Yung
Long Bathing Beach Subzone |
|
|
Not
exceed 1000 per 100ml, calculated as the running median of the most recent 5
consecutive samples taken at intervals of between 7 and 21days |
Yuen
Long & Kam Tin (Lower) Subzone and other inland waters |
|
|
Colour |
Not
to exceed 30 Hazen units |
Yuen
Long & Kam Tin (Upper) Subzone, Beas Subzone, Indus Subzone, Ganges Subzone
and Water Gathering Ground Subzones |
|
Not
to exceed 50 Hazen units |
Yuen
Long & KamTin (Lower) Subzone and other inland
waters |
|
|
Turbidity |
Shall
not reduce light transmission substantially from the normal level |
Yuen
Long Bathing Beach Subzone |
|
Phenol |
Quantities
shall not sufficient to produce a specific odour or more than 0.05mg/L as C6H5OH |
Yuen
Long Bathing Beach Subzone |
|
Toxins |
Should
not cause a risk to any beneficial uses of the aquatic environment |
Whole
Zone |
|
Should
not attain such levels as to produce toxic carcinogenic, mutagenic or teratogenic effects in humans, fish or any other aquatic
organisms. |
Whole
Zone |
5.2.2 Technical Memorandum for Effluents Discharge into Drainage and Sewerage Systems, Inland & Coastal Waters (TM-DSS)
Apart
from the WQOs, Section 21 of the WPCO also specifies the limits to control the
physical, chemical and microbial parameters for effluent discharges into
drainage and sewage system at both inland and coastal waters under the
Technical Memorandum for Effluents Discharged into Drainage and Sewerage
Systems, Inland and Coastal Waters (TM-DSS). The discharge limits vary with the
effluent flowrates. Sewerage from the LMC Loop should
comply with the standards for effluent discharged into inland water. Group B
and C inland water standards in TM-DSS are adopted and the effluent discharge
standards are presented in Tables 5.2a and 5.2b.
Table 5.2a Standards for effluents discharged into Group B Inland
Waters
|
Parameter |
Flowrate (m3/day) |
|||||||
|
£
200 |
> 200 and £400 |
> 400 and £
600 |
> 600 and £
800 |
> 800 and £
1000 |
> 1000 and £
1500 |
> 1500 and £
2000 |
> 2000 and £
3000 |
|
|
pH (pH units) |
6.5-8.5 |
6.5-8.5 |
6.5-8.5 |
6.5-8.5 |
6.5-8.5 |
6.5-8.5 |
6.5-8.5 |
6.5-8.5 |
|
Temperature (°C) |
30 |
30 |
30 |
30 |
30 |
30 |
30 |
30 |
|
Colour (lovibond units) |
1 |
1 |
1 |
1 |
1 |
1 |
1 |
1 |
|
Suspended solids |
30 |
30 |
30 |
30 |
30 |
30 |
30 |
30 |
|
BOD |
20 |
20 |
20 |
20 |
20 |
20 |
20 |
20 |
|
COD |
80 |
80 |
80 |
80 |
80 |
80 |
80 |
80 |
|
Oil & Grease |
10 |
10 |
10 |
10 |
10 |
10 |
10 |
10 |
|
Iron |
10 |
8 |
7 |
5 |
4 |
3 |
2 |
1 |
|
Boron |
5 |
4 |
3 |
2.5 |
2 |
1.5 |
1 |
0.5 |
|
Barium |
5 |
4 |
3 |
2.5 |
2 |
1.5 |
1 |
0.5 |
|
Mercury |
0.001 |
0.001 |
0.001 |
0.001 |
0.001 |
0.001 |
0.001 |
0.001 |
|
Cadmium |
0.001 |
0.001 |
0.001 |
0.001 |
0.001 |
0.001 |
0.001 |
0.001 |
|
Selenium |
0.2 |
0.2 |
0.2 |
0.2 |
0.2 |
0.1 |
0.1 |
0.1 |
|
Other toxic metals individually |
0.5 |
0.5 |
0.2 |
0.2 |
0.2 |
0.1 |
0.1 |
0.1 |
|
Total Toxic metals |
2 |
1.5 |
1 |
0.5 |
0.5 |
0.2 |
0.2 |
0.2 |
|
Cyanide |
0.1 |
0.1 |
0.1 |
0.08 |
0.08 |
0.05 |
0.05 |
0.03 |
|
Phenols |
0.1 |
0.1 |
0.1 |
0.1 |
0.1 |
0.1 |
0.1 |
0.1 |
|
Sulphide |
0.2 |
0.2 |
0.2 |
0.2 |
0.2 |
0.2 |
0.2 |
0.2 |
|
Fluoride |
10 |
10 |
8 |
8 |
8 |
5 |
5 |
3 |
|
Sulphate |
800 |
800 |
600 |
600 |
600 |
400 |
400 |
400 |
|
Chloride |
1000 |
1000 |
800 |
800 |
800 |
600 |
600 |
400 |
|
Total phosphorus |
10 |
10 |
10 |
8 |
8 |
8 |
5 |
5 |
|
Ammonia nitrogen |
5 |
5 |
5 |
5 |
5 |
5 |
5 |
5 |
|
Nitrate + nitrite nitrogen |
30 |
30 |
30 |
20 |
20 |
20 |
10 |
10 |
|
Surfactants (total) |
5 |
5 |
5 |
5 |
5 |
5 |
5 |
5 |
|
E.
coli (cfu/100ml) |
100 |
100 |
100 |
100 |
100 |
100 |
100 |
100 |
Notes:
[1] All units in mg/L unless otherwise stated
Table 5.2b Standards for effluents discharged into Group C Inland
Waters
|
Parameter |
Flowrate (m3/day) |
|||
|
£
100 |
> 100 and £500 |
> 500 and £
1000 |
> 1000 and £
2000 |
|
|
pH (pH units) |
6-9 |
6-9 |
6-9 |
6-9 |
|
Temperature (°C) |
30 |
30 |
30 |
30 |
|
Colour (lovibond units) |
1 |
1 |
1 |
1 |
|
Suspended solids |
20 |
10 |
10 |
5 |
|
BOD |
20 |
15 |
10 |
5 |
|
COD |
80 |
60 |
40 |
20 |
|
Oil & Grease |
1 |
1 |
1 |
1 |
|
Iron |
0.5 |
0.4 |
0.3 |
0.2 |
|
Mercury |
0.001 |
0.001 |
0.001 |
0.001 |
|
Cadmium |
0.001 |
0.001 |
0.001 |
0.001 |
|
Silver |
0.1 |
0.1 |
0.1 |
0.1 |
|
Copper |
0.1 |
0.1 |
0.05 |
0.05 |
|
Selenium |
0.1 |
0.1 |
0.05 |
0.05 |
|
Lead |
0.2 |
0.2 |
0.2 |
0.1 |
|
Nickel |
0.2 |
0.2 |
0.2 |
0.1 |
|
Other toxic metals individually |
0.5 |
0.4 |
0.3 |
0.2 |
|
Total Toxic metals |
0.5 |
0.4 |
0.3 |
0.2 |
|
Cyanide |
0.05 |
0.05 |
0.05 |
0.01 |
|
Phenols |
0.1 |
0.1 |
0.1 |
0.1 |
|
Sulphide |
0.2 |
0.2 |
0.2 |
0.2 |
|
Fluoride |
10 |
7 |
5 |
4 |
|
Sulphate |
800 |
600 |
400 |
200 |
|
Chloride |
1000 |
1000 |
800 |
800 |
|
Total phosphorus |
10 |
10 |
8 |
8 |
|
Ammonia nitrogen |
2 |
2 |
2 |
1 |
|
Nitrate + nitrite nitrogen |
30 |
30 |
20 |
20 |
|
Surfactants (total) |
2 |
2 |
2 |
1 |
|
E.
coli (cfu/100ml) |
1000 |
1000 |
1000 |
1000 |
Notes:
[1] All units in mg/L unless otherwise stated
5.2.3 Environmental Impact Assessment Ordinance (EIAO) (Cap. 499), Technical Memorandum on Environmental Impact Assessment Process (TM-EIAO)
The general
criteria and guidelines for evaluating and assessing water quality impacts are
listed in Annexes 6 and 14 of the TM-EIAO.
5.2.4 No Net Increase in Pollution Loads Requirement in Deep Bay
In
addition to the provisions of the TM, the ‘No Net Increase in Pollution Loads
Requirement’ aims to provide protection to the inland and marine water quality
of the Deep Bay WCZ. The pollutions
entering into Deep Bay have exceeded the assimilative capacity of the water
body. To increase pollution loads to the water body is environmentally
undesirable. In accordance with Clause 3.4.6.5(xv) of the EIA Study Brief and
Town Planning Board Guideline No.12B, the pollution loads of concern should be
offset by equivalent reduction of current loads for new discharge into Deep Bay. The policy ensures that developments within
the Deep Bay catchment areas do not result in an increase in pollution loads to
the inland and marine waters.
5.2.5 Hong Kong Planning Standards and Guidelines
Chapter
9 of the Hong Kong Planning Standards and Guidelines (HKPSG) outlines
environmental requirements that need to be considered in land use planning. The
recommended guidelines, standards and guidance cover the selection of suitable
locations for the developments and sensitive uses, provision of environmental
facilities, and design, layout, phasing and operational controls to minimise
adverse environmental impacts. It also
lists out environmental factors influencing land use planning and recommend
buffer distances for land uses.
5.2.6 ProPECC PN 1/94 “Construction Site Drainage”
The
Practice Note for Professional Persons (ProPECC Note
PN1/94) on Construction Site Drainage provides guidelines for the handling and
disposal of construction discharges. It
is applicable to this study for control of site runoff and wastewater generated
during the construction phase. The types
of discharges from construction sites outlined in the ProPECC
Note PN1/94 include:
· Surface runoff;
· Groundwater;
· Boring and drilling water;
· Wastewater from concrete batching;
· Wheel washing water;
· Bentonite slurries;
· Water for testing and sterilization of water retaining structures and water pipes;
· Wastewater from building construction and site facilities; and
· Acid cleaning, etching and pickling wastewater.
5.3 Description of the Environment
5.3.1 Existing Environment
The
project boundary falls within the Deep Bay WCZ according to the WPCO. It is
located on the south bank of mid-stream of Shenzhen
River.
In
terms of hydrological regime, LMC Loop is surrounded by a moat formed by the
main line of Shenzhen River and the meander, which is a part of the Old
Shenzhen River. The flowrate of the meander is nearly
stagnant with minor baseflow to the Shenzhen River
Main Line. Upstream of LMC Loop, tributaries draining into the Shenzhen River
include Ng Tung River, Sheung Yue River, Ping Yuen
River, Shawanhe, Bujihe and
Futianhe. Downstream tributaries include San Tin
Eastern Main Drainage Channel, Huangguanghe and Xinzhouhe. A diagram of the river regime near the LMC Loop
is shown in Figure 5.1.
The
mainline of Shenzhen River also act as a major drainage channel to the stormwater catchments of Northern New Territories Drainage
Master Plan. The catchment area covers North District, North Yuen Long, San Tin,
Mai Po and South of Shenzhen City. A flood plain was formed by wetlands on Hong
Kong side such as Mai Po, San Tin and Hoo Hok Wai.
There
is no public sewage system in the vicinity of proposed development site except
at the Sewage Treatment Works (STW) within MTR LMC Station, which is designed
for LMC Station use only. Existing domestic wastewater generated by villages
nearby is likely discharged directly to nearby streams or collected by
individual soak away and septic tanks systems.
5.3.2 Existing Baseline Condition
5.3.2.1 River Water Quality
1) Ng Tung River and Sheung Yue River
The
EPD has carried out routine water quality monitoring in Ng Tung River and Sheung Yue River, which is about 4.0 to 5.8km at upstream
of the LMC Loop. According to the EPD’s River Water Quality in Hong Kong in
2010, the compliance levels of WQO for Sheung Yue
River were ranged from 78% to 90%. The river water quality was subjected to
pollution from livestock farms, small industrial establishments and unsewered villages. For Ng Tung River, the compliance level
on WQO could achieve up to 92% to 95% at midstream to upstream sections.
However, it would drop to only 60% on WQO at downstream sections, as a result
of the backflow from Shenzhen River. The environmental monitoring data are
presented in Table 5.3 and the
locations of monitoring stations are presented in Figure 5.1.
Table 5.3 Water quality of Ng Tung River and Sheung
Yue River between 2006 and 2010
|
Parameter |
Monitoring Point |
Concentration [1] [5-1] |
|||||
|
2006 |
2007 |
2008 |
2009 |
2010 |
|||
|
Ng Tung River |
|||||||
|
Dissolved Oxygen (DO) (mg/L) |
IN1 |
3.8 |
5.8 |
2.9 |
4.7 |
5.1 |
|
|
IN2 |
7.7 |
6.9 |
8.1 |
6.8 |
6.6 |
||
|
IN3 |
8.2 |
8.2 |
8.5 |
8.3 |
8.5 |
||
|
pH |
IN1 |
7.2 |
7.2 |
7.1 |
7.3 |
7.4 |
|
|
IN2 |
7.1 |
7.4 |
7.3 |
7.3 |
7.7 |
||
|
IN3 |
7.4 |
7.4 |
7.1 |
7.5 |
7.6 |
||
|
Suspended Solid (SS) (mg/L) |
IN1 |
25 |
16 |
35 |
24 |
20 |
|
|
IN2 |
9 |
12 |
6 |
6 |
10 |
||
|
IN3 |
4 |
3 |
3 |
4 |
8 |
||
|
BOD5 (mg/L) |
IN1 |
7 |
6 |
10 |
6 |
8 |
|
|
IN2 |
2 |
3 |
3 |
3 |
3 |
||
|
IN3 |
2 |
1 |
< 1 |
1 |
2 |
||
|
COD (mg/L) |
IN1 |
26 |
20 |
25 |
15 |
18 |
|
|
IN2 |
10 |
11 |
9 |
8 |
8 |
||
|
IN3 |
10 |
12 |
9 |
8 |
8 |
||
|
Sheung Yue River |
|||||||
|
DO (mg/L) |
RB1 |
8.4 |
8.1 |
8.3 |
9.0 |
9.7 |
|
|
RB2 |
7.5 |
7.7 |
7.9 |
7.8 |
7.7 |
||
|
RB3 |
8.2 |
6.5 |
6.7 |
7.8 |
8.1 |
||
|
pH |
RB1 |
7.6 |
7.7 |
7.7 |
8.0 |
8.0 |
|
|
RB2 |
7.3 |
7.5 |
7.4 |
7.5 |
7.5 |
||
|
RB3 |
7.3 |
7.3 |
7.3 |
7.4 |
7.6 |
||
|
SS (mg/L) |
RB1 |
7 |
10 |
13 |
7 |
8 |
|
|
RB2 |
7 |
12 |
24 |
11 |
20 |
||
|
RB3 |
16 |
17 |
17 |
16 |
9 |
||
|
BOD5 (mg/L) |
RB1 |
3 |
3 |
4 |
2 |
3 |
|
|
RB2 |
4 |
5 |
4 |
3 |
4 |
||
|
RB3 |
6 |
4 |
5 |
4 |
8 |
||
|
COD (mg/L) |
RB1 |
11 |
12 |
11 |
10 |
8 |
|
|
RB2 |
13 |
14 |
12 |
9 |
10 |
||
|
RB3 |
27 |
19 |
17 |
12 |
14 |
||
Notes:
[1] Data presented are in annual medians of monthly samples
2) Shenzhen River
There
is no existing EPD water quality monitoring station located in Shenzhen River.
The baseline water quality near the LMC Loop can be referred to Shenzhen-Hong
Kong Lok Ma Chau Loop Joint Development Project
Environmental Impact Assessment Outline (Draft) 《深港落馬洲河套地區聯合開發項目環境影響評價大綱(送審稿)》[5-2], Shenzhen River Contaminated Sediment Remediation Strategy Joint Study《深圳河污染底泥治理策略合作研究》[5-3] and Shenzhen River and Deep Bay Water Quality and
Ecological Baseline Survey Report《深圳河及深圳灣水環境與生態現狀調查與評介報告》studies conducted by SZMEPB [5-4].
According
to Shenzhen-Hong Kong Lok Ma Chau Loop Joint
Development Project Environmental Impact Assessment Outline (Draft) 《深港落馬洲河套地區聯會開發項目環境影響評價大綱(送審稿)》[5-2] prepared under the appointment of the SZMEPB, the
water quality target for Shenzhen River is Category III surface water quality
standard《地表水環境質量標準》 (GB3838-2002).
In reality, the monitored water quality of Shenzhen River in 2006
exceeded the Category III standard and even worse than Category V (劣五類), which refers to the poorest water quality in the
range.
Findings
of the Proposed Working Plan for Implementing Contamination Survey in River
Sediments《底泥污染調查建議工作計劃》[5-5]
under the on-going study Shenzhen River Contaminated
Sediment Remediation Strategy Joint Study《深圳河污染底泥治理策略合作研究》[5-3] suggested the pollution of Shenzhen River was
resulted from untreated effluent discharge from urban areas such as Buji and Futian. The lack of
proper sewage system has also exacerbated the poor water quality conditions.
In the
SZ Baseline Survey Report, measurements were conducted at 4 monitoring stations
along Shenzhen River during the periods of 2 – 4 August 2008, 11 – 13 October
2008 and 12 – 14 December 2008. Among all monitoring stations, Stations No. 2
(114°4’18”E, 22°31’4”N) and 3 (114°4’18”E, 22°31’4”N) were located in the main
line of Shenzhen River alongside the LMC Loop (Figure 5.1). It is therefore considered representative of the water
quality near the LMC Loop. Monitoring results at Stations No. 2 and 3 are
summarized in Tables 5.4a and 5.4b respectively.
Table 5.4a Water quality monitoring results at Station No. 2
near the LMC Loop in 2008
|
Parameter |
Surface
water quality standard (GB3838-2002) |
Concentration |
|||
|
Cat
III – 2nd class protection zone |
Cat
V - Amenity use |
2 –
4 Aug 2008 |
11
– 13 Oct 2008 |
12
– 14 Dec 2008 |
|
|
Temperature (°C) |
Man-made increase ≤1 and man-made reduction
≤ 2 |
30.3 (29.9 - 30.5) |
28.2 (27.5 – 28.6) |
20.6 (20.3 – 20.9) |
|
|
Salinity (ppt) |
- |
- |
< 2 |
< 2 |
< 2 |
|
pH |
6 - 9 |
6 – 9 |
7.44 (7.21 – 7.56) |
7.39 (7.21 – 7.58) |
7.38 (7.21 – 7.53) |
|
COD (mg/L) |
20 |
40 |
16.8 (13.2 – 20.8) |
9.23 (2.85 – 13) |
1.76 (1.34 – 2.30) |
|
BOD5 (mg/L) |
4 |
10 |
14.8 (12.1 – 18.4) |
22.3 (12.6 – 30) |
23.3 (20.2 – 27.4) |
|
Ammonium Nitrogen (NH4-N) (mg/L) |
1.0 |
2.0 |
28.2 (15.0 – 41.3) |
5.1 (4.0 – 6.4) |
5.8 (3.3 – 7.1) |
|
Total Phosphorus (mg/L) |
0.2 |
0.4 |
0.923 (0.583 – 1.41) |
1.29 (1.19 – 1.46) |
2.39 (2.08 – 2.7) |
|
Total Nitrogen (mg/L) |
1.0 |
2.0 |
12.8 (11.4 – 13.8) |
4.10 (1.21 – 9.52) |
17.8 (16 – 20.4) |
|
Mercury (Hg) (mg/L) |
0.1 |
1 |
0.023 (0.018 – 0.037) |
0.028 (0.024 – 0.031) |
0.045 (0.040 – 0.053) |
|
Arsenic (As) (mg/L) |
50 |
100 |
3.2 (3.0 – 3.4) |
2.7 (2.5 – 3.0) |
2.3 (2.0 – 2.9) |
|
Zinc (Zn) (mg/L) |
1000 |
2000 |
11.1 (5.9 – 17.3) |
9.5 (7.7 – 11.1) |
15.8 (13.3 – 17.5) |
|
Cadmium (Cd) (mg/L) |
5 |
10 |
0.17 (Undetectable – 0.27) |
Undetectable |
0.26 (0.23 – 0.29) |
|
Lead (Pb) (mg/L) |
50 |
100 |
1.2 (0.7 – 1.6) |
0.9 (0.7 – 1.0) |
1.1 (0.9 – 1.2) |
|
Copper (Cu) (mg/L) |
1000 |
1000 |
1.7 (1.3 – 1.9) |
2.3 (1.9 – 2.7) |
2.5 (2.2 – 2.7) |
|
Chromium ions (Cr6+) (mg/L) |
50 |
100 |
3.7 (0.7 – 6.0) |
9.5 (4.0 – 17) |
8 (2.6 – 16.9) |
|
Cyanide (mg/L) |
200 |
200 |
≤ 0.003 |
≤ 0.005 |
< 0.002 |
|
Fluoride (mg/L) |
- |
- |
0.57 (0.53 – 0.62) |
0.84 (0.82 – 0.89) |
0.81 (0.71 – 0.86) |
|
Sulfide (mg/L) |
200 |
1000 |
25.6 (1.2 – 71.8) |
46.8 (17.6 – 89.9) |
257 (138 – 520) |
|
Volatile Phenol (mg/L) |
5 |
100 |
≤ 0.002 |
≤ 0.002 |
< 0.002 |
|
Anionic surfactant (mg/L) |
200 |
300 |
1.67 (1.02 – 2.13) |
1.56 (1.07 – 2.16) |
2.46 (2.27 – 2.82) |
|
TPH (mg/L) |
50 |
100 |
0.337 (0.268 – 0.563) |
0.420 (0.275 – 0.541) |
0.37 (0.341 – 0.404) |
|
SS (mg/L) |
- |
- |
36.8 (24.7 – 49.0) |
34.3 (2.0 – 117) |
47.8 (27.0 – 76.0) |
Table 5.4b Water quality monitoring results at Station No. 3
near the LMC Loop in 2008
|
Parameter |
Surface
water quality standard (GB3838-2002) |
Concentration |
|||
|
Cat
III – 2nd class protection zone |
Cat
V - Amenity use |
2 –
4 Aug 2008 |
11
– 13 Oct 2008 |
12
– 14 Dec 2008 |
|
|
Temperature (°C) |
Man-made increase ≤1 and man-made reduction
≤ 2 |
30.3 (30.0 - 30.5) |
28.2 (27.6 – 28.6) |
20.2 (20.0 – 20.3) |
|
|
Salinity (ppt) |
- |
- |
< 2 |
< 2 |
< 2 |
|
pH |
6 - 9 |
6 – 9 |
7.65 (7.40 – 7.79) |
7.37 (7.13 – 7.63) |
7.39 (7.35 – 7.46) |
|
COD (mg/L) |
20 |
40 |
15.3 (11.2 – 19.3) |
10.8 (8.00 – 12.4) |
1.35 (0.22 – 2.14) |
|
BOD5 (mg/L) |
4 |
10 |
11.7 (8.7 – 18.0) |
18.5 (8.71 – 25.1) |
20.2 (9.68 – 28.0) |
|
Ammonium Nitrogen (NH4-N) (mg/L) |
1.0 |
2.0 |
86.8 (47.6 – 137) |
7.0 (3.8 – 16.7) |
7.4 (6.1 – 8.9) |
|
Total Phosphorus (mg/L) |
0.2 |
0.4 |
0.646 (0.416 – 0.934) |
1.18 (1.09 – 1.25) |
2.23 (1.99 – 2.74) |
|
Total Nitrogen (mg/L) |
1.0 |
2.0 |
10.3 (8.32 – 12.5) |
2.14 (0.898 – 5.07) |
16.7 (11.6 – 20.5) |
|
Mercury (Hg) (mg/L) |
0.1 |
1 |
0.024 (0.013 – 0.045) |
0.027 (0.023 – 0.031) |
0.043 (0.032 – 0.052) |
|
Arsenic (As) (mg/L) |
50 |
100 |
3.7 (3.3 – 4.2) |
2.6 (2.3 – 2.7) |
1.9 (1.8 – 2.1) |
|
Zinc (Zn) (mg/L) |
1000 |
2000 |
7.9 (3.9 – 16.1) |
9.7 (7.7 – 11.1) |
15.1 (11.4 – 19.4) |
|
Cadmium (Cd) (mg/L) |
5 |
10 |
0.15 (Undetectable – 0.25) |
Undetectable |
0.30 (0.2 – 0.62) |
|
Lead (Pb) (mg/L) |
50 |
100 |
1.9 (1.0 – 4.4) |
0.9 (0.7 – 1.3) |
1.1 (0.9 – 1.2) |
|
Copper (Cu) (mg/L) |
1000 |
1000 |
1.5 (1.3 – 1.9) |
2.2 (1.7 – 2.5) |
2.5 (2.3 – 2.7) |
|
Chromium ions (Cr6+) (mg/L) |
50 |
100 |
2.4 (1.4 – 4.1) |
8.3 (4.4 – 13.7) |
6.1 (3 – 10.3) |
|
Cyanide (mg/L) |
200 |
200 |
≤ 0.002 |
≤ 0.003 |
≤ 0.002 |
|
Fluoride (mg/L) |
- |
- |
0.55 (0.5 – 0.64) |
0.82 (0.78 – 0.85) |
0.80 (0.72 – 0.83) |
|
Sulfide (mg/L) |
200 |
1000 |
8.5 (0.6 – 42.6) |
110.4 (32.4 – 247.7) |
132 (1.9 – 395) |
|
Volatile Phenol (mg/L) |
5 |
100 |
≤ 0.002 |
≤ 0.003 |
≤ 0.002 |
|
Anionic surfactant (mg/L) |
200 |
300 |
0.596 (0.118 – 1.16) |
1.54 (1.05 – 2.28) |
2.16 (1.81 – 2.54) |
|
TPH (mg/L) |
50 |
100 |
0.249 (0.194 – 0.306) |
0.395 (0.297 – 0.479) |
0.352 (0.25 – 0.531) |
|
SS (mg/L) |
- |
- |
28.9 (20 – 52.7) |
17.7 (5.0 – 29.0) |
65.1 (35.0 – 92.0) |
The
flow direction of Shenzhen River at the section alongside the LMC Loop is
influenced by tidal effect. Thus, there is no major significant differentiation
in water quality between Station 2 and 3. In Year 2008, the average SS and BOD5
concentrations calculated from Tables
5.4a and 5.4b at Station No. 2
and 3 were 38.4 mg/L and 18.5 mg/L respectively. The BOD5, total
phosphorus, total petroleum hydrocarbons (TPH), anionic surfactant and faecal coliform exceeded the GB3838-2002 Category III criteria and
zero compliance rate was recorded.
The SZ Baseline Survey Report has
concluded that current baseline water quality of Shenzhen River was worse than
Category V (劣五類), which refers to the poorest water quality in the range. Exceedances were mainly
due to BOD5, ammonia nitrogen (NH4-N), total phosphorus,
anionic surfactant and faecal coliforms.
Comparing
the pollutant concentrations between Tables
5.3, 5.4a and 5.4b, the SS concentrations in
Shenzhen River near the LMC Loop were generally higher than that of the upstream
sections such as Ng Tung River and Sheung Yue River.
Monitoring data in 2008 have shown that the average SS concentration was 37mg/L
near the LMC Loop, whilst the upstream sections was about 14mg/L (3 to 35mg/L).
The same for BOD5 was 17mg/L and 4.5 mg/L (<1 to 10mg/L)
respectively.
3) Ma Tso Lung Nullah/Stream
The Ma
Tso Lung Nullah is close to
the ECR. It was a natural stream before 2008 and was trained as a drainage nullah under the project 4156CD - Drainage improvement in Ki Lun Tsuen, Ma Tso Lung, Ying Pun, Shek Tsai Leng and Sha Ling in New
Territories. Upstream
of Ma Tso Lung Nullah is a
natural stream near the proposed Kwu Tung North NDA.
Site
visits were conducted in November 2012 and April 2013, which represents at both
dry and wet season respectively. The base flowrates
of Ma Tso Lung Nullah in
wet season is generally higher than that of dry season. The majority of
drainage catchment of Ma Tso Lung Nullah
consists of local villages and natural hillsides. From site observations, the
water condition is clear and there was no direct sewage discharge to the nullah and the existing water quality is anticipated to be
good.
4) Meander
The
Meander was a part of the Old Shenzhen River. After the Shenzhen River works in
1997, the Meander is formed as a moat of LMC Loop. Flap valves were installed
in the connection to Shenzhen River in order to prevent tidal backflow upstream
of Meander.
The
EM&A programme for Shenzhen River Regulation
Stage 2 Phase 2 had monitored the water quality along the Meander after ecological
restoration in a period of 2 years. The latest monitoring results (Year 2002)
are summarized in Table 5.4c.
Table 5.4c Water quality monitoring results at the Meander
(2002)
|
Parameter |
Concentration |
|
|
Dry
Season (Jan to Mar, Oct to Nov) |
Wet
Season (Apr to Sep) |
|
|
Temperature (℃) |
22.3 (15.1 to 32) |
32.4 (27.5 to 36) |
|
pH |
7.9 (6.8 to 9.3) |
7.2 (6.6 to 8.2) |
|
DO (mg/L) |
7.7 (5.3 to 12.9) |
5.9 (2.9 to 8.2) |
|
Ammonia Nitrogen (mg/L) |
1.4 (0.1 to 3.2) |
1.5 (0.3 to 4.9) |
|
Conductivity (micro-S/cm) |
2838 (994 to 5180) |
3065 (481 to 5920) |
|
Salinity (g/L) |
1.5 (0.5 to 2.8) |
1.6 (0.2 to 3.2) |
Additional
in-situ water quality monitoring was also conducted on 31 July 2009 and 3
February 2010. The monitoring results were summerized
in Table 5.4d.
Table 5.4d Water quality monitoring results at the Meander (2009
to 2010)
|
Parameter |
Concentration |
|
|
31
July 2009 |
3
February 2010 |
|
|
Temperature (℃) |
31.6 (26.9 to 33.5) |
22.3 (22.1 to 22.6) |
|
pH |
7.3 (6.6 to 8.1) |
7.6 (6.9 to 8.1) |
|
DO (mg/L) |
2.7 (2.1 to 3.8) |
7.8 (1.6 to 10.2) |
|
Turbidity (NTU) |
19.3 (8 to 35) |
23.3 (16 to 36) |
After
Shenzhen River Regulation, the Meander is formed as a moat with flap valves, which likes a “long-shaped
pond”. The ammonia nitrogen levels (Table
5.4d) are rather low without the influence from Shenzhen River. However,
while there is less water circulation, the reaeration
rate is low. In addition, non-point source pollutant from surface runoff during
wet season would contribute a low DO levels.
5) Ping Hang Stream / Channel at South of Lung Hau Road
The Ping Hang Stream and Channel at South of Lung Hau
Road are closed to ECR and Direct Link to MTR LMC Station respectively. Site visits were conducted in November 2012 and
April 2013. From site observations, there was no direct sewage discharge to the
nullah and river water is observed as clear. The
existing water quality is anticipated to be good.
6)
San Tin
Eastern Drainage Channel
The San Tin Eastern Drainage Channel is an engineered nullah with low ecological value. According to the Approved
EIA for LMC Spur Line (EIA-071/2001), water
quality monitoring was conducted in San Tin Eastern Drainage Channel. The monitoring location (Station W1 and WM3) is presented
in Figure 5.1 and the monitoring
results are presented in Table 5.4e.
Table 5.4e Water quality monitoring results at Station W1 and
WM3 at San Tin Eastern Drainage Channel in 2000
|
Parameter |
Concentration |
|
|
Station
W1 (Upstream) |
Station
WM3 (Downstream) |
|
|
pH |
7.5 |
6.8 |
|
Temperature (℃) |
25 |
22.3 |
|
DO (mg/L) |
1.5 |
5.1 |
|
Turbidity (NTU) |
103 |
85 |
|
COD (mg/L) |
380 |
28 |
|
BOD (mg/L) |
200 |
10 |
|
SS (mg/L) |
190 |
118 |
|
NH3-N (mg/L) |
83 |
8 |
|
NO2-N and NO3-N (mg/L) |
0.1 |
0.2 |
|
TIN (mg/L) |
83 |
8 |
|
Total phosphorus (mg/L) |
15 |
0.4 |
|
Orthophosphate (mg/L) |
12 |
<0.1 |
|
E.
coli (cfu/100mL) |
1,036,667 |
16,333 |
|
Salinity (ppt) |
0.7 |
0.5 |
Site visits
were conducted in November 2012 and April 2013. From site observations, there
is no major discharge along San Tin Eastern Drainage Channel and the water
condition is slightly turbid. However, wastewater might be discharged from
upstream villiages. According to the water quality
monitoring results above, higher levels of BOD was recorded in upstream
locations and the water quality improves in downstream, although SS and E. coli. levels
are still high.
5.3.2.2 Marine Water Quality
The
existing water quality downstream of the LMC Loop can be referred to EPD’s
routine marine monitoring data at Inner Deep Bay area (Stations DM1 to DM3
according to EPD’s data), which is about 7.1 to 13.8km away from the LMC Loop.
According to the Marine Water Quality in Hong Kong 2008, Deep Bay has the
poorest water quality in the territory with high concentrations of organic and
inorganic pollutants and low levels of DO.
According
to the Marine Water Quality in Hong Kong 2010, the compliance level of WQOs at
Deep Bay was 40%, same as Year 2009. The total inorganic nitrogen exceeded the
WQOs (i.e. 0.7mg/L) at three Stations DM1, DM2 and DM3 by 0.76, 2.27 and 3.11
mg/L, respectively. Details of EPD’s marine water quality monitoring at Inner
Deep Bay are presented in Table 5.5
and the locations of monitoring stations are presented in Figure 5.1.
Table 5.5 Marine water quality of Inner Deep Bay between 2006 and
2010
|
Parameter |
Monitoring Point |
Concentration [5-6] |
||||
|
2006 |
2007 |
2008 |
2009 |
2010 |
||
|
Dissolved Oxygen (mg/L) |
DM1 [1] |
3.8 |
3.8 |
5.2 |
4.1 |
4.2 |
|
DM2 [2] |
5 |
5.3 |
6.7 |
5.0 |
4.9 |
|
|
DM3 [3] |
5.8 |
6.4 |
7.2 |
6.2 |
6.2 |
|
|
Ammonia Nitrogen (mg/L) |
DM1 [1] |
3.07 |
5.62 |
2.88 |
4.04 |
2.830 |
|
DM2 [2] |
2.52 |
3.74 |
2.47 |
2.63 |
1.930 |
|
|
DM3 [3] |
0.69 |
0.84 |
0.55 |
0.57 |
0.436 |
|
|
Unionised Ammonia, mg/L (Annual mean) |
DM1 [1] |
0.041 |
0.057 |
0.045 |
0.050 |
0.025 |
|
DM2 [2] |
0.055 |
0.058 |
0.082 |
0.046 |
0.025 |
|
|
DM3 [3] |
0.013 |
0.017 |
0.014 |
0.015 |
0.009 |
|
|
Nitrite Nitrogen, mg/L |
DM1 [1] |
0.269 |
0.256 |
0.284 |
0.254 |
0.348 |
|
DM2 [2] |
0.27 |
0.305 |
0.291 |
0.280 |
0.348 |
|
|
DM3 [3] |
0.188 |
0.21 |
0.178 |
0.202 |
0.218 |
|
|
Nitrate Nitrogen (mg/L) |
DM1 [1] |
0.52 |
0.259 |
0.528 |
0.470 |
0.628 |
|
DM2 [2] |
0.48 |
0.308 |
0.52 |
0.505 |
0.687 |
|
|
DM3 [3] |
0.63 |
0.539 |
0.673 |
0.678 |
0.803 |
|
|
Total Inorganic Nitrogen, mg/L (Annual mean) |
DM1 [1] |
3.86 |
6.13 |
3.7 |
4.77 |
3.81 |
|
DM2 [2] |
3.27 |
4.36 |
3.28 |
3.42 |
2.97 |
|
|
DM3 [3] |
1.51 |
1.59 |
1.4 |
1.45 |
1.46 |
|
|
Total Kjeldahl Nitrogen
(mg/L) |
DM1 [1] |
3.73 |
7.1 |
3.76 |
4.86 |
3.24 |
|
DM2 [2] |
3.1 |
4.89 |
3.34 |
3.09 |
2.33 |
|
|
DM3 [3] |
0.95 |
1.28 |
0.92 |
0.81 |
0.65 |
|
|
Total Nitrogen, mg/L |
DM1 [1] |
4.51 |
7.61 |
4.57 |
5.58 |
4.22 |
|
DM2 [2] |
3.85 |
5.51 |
4.15 |
3.87 |
3.36 |
|
|
DM3 [3] |
1.77 |
2.03 |
1.77 |
1.69 |
1.68 |
|
|
Orthophosphate Phosphorus (mg/L) |
DM1 [1] |
0.35 |
0.549 |
0.278 |
0.372 |
0.301 |
|
DM2 [2] |
0.29 |
0.405 |
0.24 |
0.283 |
0.236 |
|
|
DM3 [3] |
0.11 |
0.14 |
0.081 |
0.109 |
0.079 |
|
|
Total Phosphorous (mg/L) |
DM1 [1] |
0.51 |
0.73 |
0.41 |
0.55 |
0.38 |
|
DM2 [2] |
0.41 |
0.55 |
0.36 |
0.38 |
0.30 |
|
|
DM3 [3] |
0.16 |
0.2 |
0.13 |
0.16 |
0.11 |
|
|
E.coli (cfu/100L) (Annual geometric mean) |
DM1 [1] |
2000 |
5000 |
1400 |
1500 |
1300 |
|
DM2 [2] |
1300 |
1200 |
680 |
470 |
480 |
|
|
DM3 [3] |
120 |
38 |
85 |
32 |
26 |
|
|
pH |
DM1 [1] |
7.3 |
7.1 |
7.4 |
7.4 |
7.3 |
|
DM2 [2] |
7.4 |
7.3 |
7.6 |
7.5 |
7.5 |
|
|
DM3 [3] |
7.6 |
7.5 |
7.8 |
7.7 |
7.7 |
|
|
Suspended Solids (mg/L) |
DM1 [1] |
58.8 |
20.7 |
41.5 |
58.8 |
34.3 |
|
DM2 [2] |
29 |
19.7 |
22.9 |
38.4 |
23.8 |
|
|
DM3 [3] |
16.9 |
13.4 |
11.2 |
23.2 |
10.0 |
|
|
Salinity (psu) |
DM1 [1] |
16.1 |
17.1 |
17 |
17.5 |
17.2 |
|
DM2 [2] |
18.9 |
19.1 |
18.1 |
19.5 |
19.0 |
|
|
DM3 [3] |
22.2 |
22.9 |
21.2 |
22.9 |
21.4 |
|
Notes:
[1] Station DM1 is located at about 2.4 km downstream of Shenzhen River Estuary (about 7.1 km downstream of the LMC Loop)
[2] Station DM2 is located at about 3.1 km downstream of Shenzhen River Estuary (about 7.8 km downstream of the LMC Loop)
[3] Station DM3 is located at about 9.1 km downstream of Shenzhen River Estuary (about 13.8 km downstream of the LMC Loop)
At
downstream sections near Deep Bay, the average SS concentration was 25 mg/L
(11.2 to 41.5 mg/L). It was slightly reduced from mid-stream near LMC Loop (37
mg/L). The reason of such concentration reduction may likely due to natural
dilution and sedimentation near the estuary area.
A
desktop study on relevant RODP and Revised PLP of the
Project, Approved San Tin Outline
Zoning Plan (No.
S/YL-ST/8) and Approved Ma Tso Lung and Hoo Hok Wai Development Permission
Area Plan (No. DPA/NE-MTL/2) and site visits were conducted to identify the
water quality sensitive receivers (WSRs) for the LMC Loop. These include
Shenzhen River, LMC meander, San Tin wetlands, Hoo Hok Wai and Ma Tso Lung Nullah. These WSRs (Figure 5.2) and their
respective approximate distance are given in Table 5.6. Other potential WSR such as inner Deep Bay and Ma Po Ramsar Site (Mangrove) are located at further downstream of
Shenzhen River. However, these areas are considered far away from site (>2km
compared to the 500m assessment area) and water quality impact is not
anticipated.
Table 5.6 Water quality sensitive receivers
|
ID |
WSRs |
Status |
Location
with respect to the LMC Loop |
Approximate
Distance from Site |
|
WSR1 |
Shenzhen River |
Channelized with low ecological value |
Surrounding the LMC Loop |
- |
|
WSR2 |
LMC Meander |
Natural river with high ecological value |
Surrounding the LMC Loop |
- |
|
WSR3 |
San Tin Wetlands (Fish Ponds) |
Abundant or active fishponds with high ecological
value |
Downstream of the LMC Loop |
>360m |
|
WSR4 |
Hoo Hok Wai |
Abundant or active fishponds with high ecological
value |
Upstream of the LMC Loop |
>200m |
|
WSR5 |
Ma Tso Lung Nullah/Stream |
Downstream is drainage channel with low
ecological value; Upstream is a natural stream and act as an
ecological linkage to Hoo Hok
Wai |
Close to ECR |
- |
|
WSR6 |
Ping Hang Stream |
Natural stream with high ecological value |
Close to ECR |
- |
|
WSR7 |
Channel at south of Lung Hau
Road |
Drainage channel |
Close to Direct Link to MTR LMC Station |
- |
|
WSR8 |
Fishponds adjacent to the Meander |
Abundant or active fishponds |
Between ECR and WCR |
- |
In accordance
with Clause 3.4.6.2 of the EIA Study Brief, the area for water quality impact
assessment included all areas within a distance of 500m from the Project site
boundary, including Shenzhen River (WSR1) and Meander (WSR2), Lok Ma Chau (WSR1 and WSR2), wetland at Hoo
Hok Wai (WSR4) and San Tin (WSR3), other small
watercourses (WSR5 to WSR7) and the Fishponds adjacent to the Meander (WSR8).
The assessment would be extended to include other areas such as stream courses
and associated water systems, fish ponds in the vicinity being impacted by the
Project if found justifiable. Apart from the identified major WSR in Table 5.6, other ponds or streams (e.g.
those small natural watercourses in Ping Hang, Tai Law Hau
and Ma Tso Lung) were considered as minor. Nevertheless,
the assessment was still applicable to these minor ponds or streams.
The
major area of concern during construction and operation of the LMC Loop
development are the works associated with sewage treatment and sewerage
infrastructures; ingress of water pollutants to Shenzhen River, Inner Deep Bay,
Hoo Hok Wai and San Tin
wetlands, and important habitats such as mangroves from storm water drainage
system and surface runoff; and the potential for increasing risks of flooding
as a result of hydrological changes. The provision and adequacy of the
existing, committed and planned future facilities to reduce pollution arising
from the storm water drainage system and surface water runoff during
construction and operation of the Project was analyzed and proposed.
There
will be no requirement for reclamation. Minor excavation works will be
conducted during bridge pier construction and cut-and-cover underpass, the
excavation works would be within cofferdam or diaphragm walls with no contact
with waterbodies. No dredging work is required and
thus quantification of impacts arsing from dredging
works under Clause 3.4.6.5(xiii) is not required. The assessment approach is
referred to Annex 6 – Criteria for Evaluating Water Pollution and Annex 14 –
Guidelines for Assessment of Water Pollution under the TM-EIAO.
5.6 Identification and Evaluation of Environmental Impacts
The water quality impact assessment has covered the Project including the following DPs:-
· LMC Loop:
- Ecological Area (DP1)
- Drainage System under Internal Transport Networks (DP4)
- Sewage Treatment Works (DP5)
- Other non-DP components (refer to Section 2)
· Associated Infrastructures outside LMC Loop:
- Western Connection Road (DP2);
- Direct Linkage to LMC Station (DP3);
-
Eastern Connection Road (DP6); and
-
Flushing Water Service Reservoir (DP7).
5.6.1 Construction Phase
5.6.1.1 Construction Site Runoff
Construction
site runoff would come from all over the works site (~0.329 km2
including 30% active area) during de-contamination and site formation period of
4.5 years. According to DSD Stormwater Drainage
Manual, the total peak runoff is about 2094 m3/hr under
10-year-return-period rainstorm. The surface runoff might be polluted by:
· Runoff and erosion from site surfaces, drainage channels such as Ma Tso Lung Nullah, earth working areas and stockpiles;
· Wash water from dust suppression sprays and wheel washing facilities; and
· Fuel, oil, solvents and lubricants from maintenance of construction machinery and equipment.
Construction
runoff may cause physical, biological and chemical effects. The physical
effects include potential blockage of drainage channels and increase of SS
levels in the Deep Bay WCZ. Runoff containing significant amounts of concrete
and cement-derived material may cause primary chemical effects such as
increasing turbidity and discoloration, elevation in pH, and accretion of
solids. A number of secondary effects may also result in toxic effects to water
biota due to elevated pH values, and reduced decay rates of faecal
micro-organisms and photosynthetic rate due to the decreased light
penetration. Mitigation measures will be
in place to control runoff.
5.6.1.2 Groundwater from Contaminated Area
Environmental site investigation works were carried
out between 25 November 2009 and 1 February 2010 in LMC Loop (around 87 ha). Soil
and groundwater samples were collected. Elevated level of metal “arsenic” was
detected from soil samples at 5 borehole locations, whereas no contamination
was detected in ground water samples. Details are given in Section 8 - Land Contamination.
For the purpose of excavations works, groundwater
would be pumped out and discharged. Given that no contaminated groundwater
sample was detected, no adverse water quality impact due to groundwater
discharge is anticipated.
However, due to site access constraints in existing
occupied lots outside LMC Loop, no environmental site investigations works were
carried out during the course of this study (see Section 8 - Land Contamination),
groundwater contamination assessment would be recommended when the areas are
accessible for site investigation.
5.6.1.3 Sewage from Workforce
Sewage
effluents will arise from the sanitary facilities provided for the on-site
construction workforce. According to Table T-2 of Guidelines for Estimating
Sewage Flows for Sewage Infrastructure Planning, the unit flow is 0.15 m3/day/employed
populations and the entire construction period is from 2014 to 2027. The
characteristics of sewage would include high levels of BOD5, Ammonia
and E. coli counts. Since portable
chemical toilets and sewage holding tank will be provided, no adverse water
quality impact is anticipated.
5.6.1.4 Riverbanks Formation for Ecological Area
During
site and riverbanks formation for southern edge of Ecological Area, the
temporary channeling works will be required in the meander
with the extent of about 30m in length for construction of ECR underpass and
depressed road only. There will be no underwater works in the other sections of
natural riverbank at southern edge for EA. The ecological impact due to slopework above-water is assessed in Section 12.
Sand/silt
may enter the meander through erosion or surface runoff during the temporary channeling. In addition, bottom sediment of the meander
would be re-suspended after disturbance. There will also be increase in
flooding risk due to flow contraction from scaffolding or cofferdam works.
5.6.1.5 Construction of Bridge Crossing under WCR / Direct Link to LMC Station / ECR
Bridges
would be constructed crossing the meander and San Tin Eastern Drainage Channel
for WCR and Direct Link to LMC Station. The river widths and depths are 30 to
60m and 1 to 4m respectively. Subject to detailed structural design, the pier areas crossing these rivers is about 2m x 3m, which consist
of less than 10% in cross sections. The pile caps will be located below river
beds and the piers arrays will mainly align with the existing bridges such as
Border Road and MTR Spur Line Viaduct to minimize the hydrodynamic impact and
the associated scouring effect during operation. In addition, there are
existing hydraulic structures such as weirs and flap valves in the meander and
San Tin Eastern Drainage. Additional bridge piers to these channels will not
impose significant hydrological impact and thus, the water quality regime will
not be disturbed. Thus, the adverse water quality impact is not anticipated.
For
ECR crossing minor watercourses/streams at Ping Hang or Ma Tso
Lung, low level viaducts will be provided. Given the limited sizes of these
streams, the cross sections of low level viaduct will be larger than or same as
that of the original streams such that the hydrodynamic and water quality
regime will not be disturbed. Precast structures will be used for viaducts
sections at those small streams in Ma Tso Lung, Ping
Hang and channel near Lung Hau Road such that there
will be no construction works in the water streams.
If
unmitigated, bottom sediment may be disturbed and resuspended
during bridge piers constructions in the water environment. Some fish ponds
might be filled or partially filled for road widening purpose. Dewatering
process during fish pond filling may potentially release turbid water into the
environment. The SS levels in the fish ponds may be increased and secondary
water quality impacts such as DO depletion and nutrient pollution level
increase will occur in the fish ponds. Mitigation measures will be required and
details are discussed in Section 5.7.1.5.
5.6.1.6 Construction of Underpass / Depressed Road under ECR
Due to
the ecological concerns, underpass/depressed road will be constructed across
the Meander and fishponds for ECR. Bottom sediment may be disturbed during
cut-and-cover activities in the water environment during construction of
underpass.
Excavations
will be required within the cofferdams or diaphragm walls, such that the works
are will be separated from river waters. Temporary river contraction by
cofferdams or diaphragm walls will be required in the Meander. The sequence of
flow contraction will be divided into two batches (half year per each batch)
and all the works will be conducted in dry season (October to March) in order
to avoid and minimize the impact to flow regimes. 50% (around 30m) of the width
of the Meander (total width around 60m) will be occupied by the erected
cofferdams or diaphragm walls. Given all the works will be conducted during in dry season and the
hydrological changes will be minimal, the
water quality regime will not be affected.
The
potential water quality impact associated with the drainage diversion will be
from the run-off and erosion from site surfaces and earth working areas. Small
amount of wastewater may be released during the disconnection of various
drainage systems. Regular inspection and maintenance
should be provided in order to prevent the occurrence of disconnection.
The underpass/depressed
road will be constructed by cut-&-cover method and fully enclosed by
cofferdams or diaphragm walls. Construction methodology using cofferdams or
diaphragm walls can minimise the intrusion of groundwater during excavation.
Diaphragm walls involve excavation of a narrow trench that is kept full of
slurry, which exerts hydraulic pressure against the trench walls and acts as a
shoring to prevent collapse. Slurry trench excavations can be performed in all
types of soil, even below the groundwater table. In order to provide an
effective cut-off to groundwater flow, the walls will need to be toe grouted.
Once the excavation of a panel is completed, a steel reinforcement cage will be
placed in the centre of the panel. Concrete is then poured in one continuous
operation. Once the primary panels are set, secondary panels will be
constructed between the primary panels and the process then repeats to create a
continuous wall. It should be noted that this slurry trench method will reduce
the gap between the panels to the practicable minimum. After this, soil
excavation will be commenced. The intrusion of groundwater through cofferdams
or diaphragm walls during soil excavation is therefore considered
insignificant. Appendix 5-4
indicates the tentative working sequences on ECR underpass construction.
5.6.1.7 Bio-remediation of Shenzhen River
In-situ
bio-remediation of Shenzhen River may be required. The time period taken will
be subject to odour monitoring results and further investigation. The extension
of bio-remediation section will be about 500m from LMC Loop. Sediment treatment
by nitrate injection will cover Shenzhen River alongside LMC Loop. Compared to
offsite treatment, which will require dredging activities, in-situ
bioremediation is likely to cause much less water quality impact due to minimal
seabed disturbance. In addition, in-situ bioremediation will improve sediment
quality, thus induce a beneficial improvement to Shenzhen River water quality
and promote recolonization of aquatic life/waterbirds.
The
major water quality impact concerns associated with in-situ bioremediation are
the potential release of nitrate-nitrogen, ammonia and heavy metals from the
sediments into the surrounding water bodies during the bioremediation
activities.
An
in-situ bioremediation field test using calcium nitrate was conducted by
Shenzhen River Contaminated Sediment Remediation Strategy Joint Study《深圳河污染底泥治理策略合作研究》[5-3]
in 2011. According to Bioremediation Field Test Draft Final Report《生化處理技術實地試驗總報告書(送審終稿)》[5-7], pore water and
elutriate test results for heavy metals is monitored and the results are
extracted in Table 5.7a and b below.
Table 5.7a Pore Water Test Results for Bio-remediation by
Injecting Calcium Nitrate.
|
Scenario |
Heavy
Metal (μg/L) |
||||||||
|
|
As |
Cu |
Pb |
Cd |
Ni |
Zn |
Hg |
Cr |
Ag |
|
Baseline |
N.D. |
N.D. |
N.D. |
N.D. |
61-123 |
167-423 |
N.D. |
702-729 |
N.D. |
|
After Injection |
N.D. |
N.D. – 47 |
N.D. |
N.D. |
N.D.-90 |
179-264 |
N.D. |
233-639 |
N.D. |
|
Water Quality Target GB 3838-2002 (Cat III) |
50 |
1000 |
50 |
5 |
N/A |
1000 |
0.1 |
50 |
N/A |
Note: N.D. = Not detectable
Table 5.7b Elutriate Test Results for Bio-remediation by Injecting
Calcium Nitrate.
|
Scenario |
Heavy
Metal (μg/L) |
||||||||
|
|
As |
Cu |
Pb |
Cd |
Ni |
Zn |
Hg |
Cr |
Ag |
|
Baseline |
N.D. |
N.D. |
N.D. |
N.D. |
N.D.-0.064 |
N.D.-671 |
N.D. |
N.D.-829 |
N.D. |
|
After Injection |
N.D. |
N.D. |
N.D. |
N.D. |
N.D.-0.068 |
N.D.-311 |
N.D. |
145-428 |
N.D. |
|
Water Quality Target GB 3838-2002 (Cat III) |
50 |
1000 |
50 |
5 |
N/A |
1000 |
0.1 |
50 |
N/A |
Note: N.D. = Not detectable
According
to the report, pore water and elutriate test results
after bioremediation were generally below Category III of GB3838-2002.
There is
no nutrient monitoring for elutriate or pore water under the test. Instead,
nitrate nitrogen monitoring on surface water at Shenzhen River were conducted
before and after the in-situ bioremediation field test. The test results were
summarised in Table 5.7c below.
Table 5.7c Nitrate Nitrogen levels at Shenzhen River before and
after the in-situ bioremediation field test
|
|
Nitrate
Nitrogen (mg/L) |
|
|
Control
Stations (500m surrounding the works area) |
Impact
Stations (50 to 100m surrounding the works area) |
|
|
Before injection |
2.28 (not detectable to 5.02) |
2.8 (not detectable to 4.91) |
|
Just after 1st injection |
5.36 (4.27 to 7.33) |
3.79 (1.60 to 4.90) |
|
Just after 2nd injection |
6.80 (6.08 to 8.74) |
5.82 (5.27 to 6.10) |
|
7 days after 2nd injection |
5.50 (4.44 to 7.58) |
5.12 (4.63 to 5.58) |
|
14 days after 2nd injection |
4.65 (3.70 to 5.11) |
4.34 (3.15 to 6.26) |
|
30 days after 2nd injection |
3.98 (3.18 to 6.02) |
3.60 (3.32 to 3.90) |
Note: To eliminate the tidal influence, the impact stations were
located 50 to 100m surrounding the works area and the control stations were
located far away from (>500m) and surrounding the works area.
According
to the analysis in the Bioremediation Field Test Draft Final Report《生化處理技術實地試驗總報告書(送審終稿)》[5-7], the concentration of nitrate nitrogen were
gradually reduced in time and the highest level of nitrate nitrogen will still
within the environmental requirement for the study. In addition, the report
mentioned that the increase of nitrate nitrogen were mainly due to natural
variations of Shenzhen River since the results in control stations were rather
high.
Alongside
the Shenzhen River, there were several discharge points such as Futian River, Buji River and
other sewerage outfalls. Thus the river water quality is dominated by these
pollution sources. Therefore, with the poor baseline water quality in Shenzhen
River, the field test results in both control stations and impact stations were
highly varied by the baseline conditions when the impact is insignificant.
There
is no criterion for nitrate nitrogen according to GB3838-2002. According to
Australian Water Quality Guidelines for Fresh and Marine Waters[5-10],
a 95% level of species protection could be achieved when nitrate nitrogen is
less than 7 mg/L. The highest nitrate nitrogen levels will be occurred after 2nd
injection and the concentration is 5.27 to 6.10 mg/L at the impact stations,
which is below the Australian guideline. Compared to the baseline levels of up
to 4.91 mg/L and control stations of up to 8.74 mg/L, the increase is not
significant and highly disturbed by background variations. Thus, adverse
transient impact is not anticipated.
According
to the Biochemical Processing Technology Field Test and Final Test Report,
increase of nitrate nitrogen is not significant compare with the control
stations in either immediate injection or 30 days after injections. Thus, long
term residue impact due to bio-remediation are not
anticipated.
The
bio-remediation works will only involve chemical injections and no dredging
work is required. Thus, it is anticipated that the bio-remediation works will
involve minor disturbance only and could be mitigated by good site practices.
According
to the Environmental Review Report (Draft Final, Jan 2013) 《環境複查報告書(預終稿2013年1月)》, water quality monitoring
during bio-remediation is recommended. The report also recommended the
following site practices (extracted) in order to minimize the environmental
impact:
·
Chemical
injections: suitable injector should be used in order to minimize the
disturbance to bottom sediment and water bodies. Chemicals should be injected
gradually in the required sediment layer.
·
Injection area: Less than 10,000m2 per
day
·
Specific environment: Increase the frequency of
water quality monitoring during low flow and summer time, immediate actions
when exceedance observed.
·
Injection vessels: Strictly control the injection
vessels and number of concurrent vessels during injection, especially to avoid
multi-marine works concurrently. It is recommended to inject the chemicals in
batches. Not more than one working vessel should be allowed in a certain area
and fully allow the assimilative
capacity of Shenzhen River and Deep Bay.
Monitoring
of heavy metals and nutrient will be conducted during bio-remediation and the
details are included in the EM&A Manual.
5.6.1.8 Construction of Direct Link to LMC Station
During
construction of viaduct for Direct Link to LMC Station, the existing reedbeds for effluent polishing in LMC Station under Clause
2.14 of FEP-080/2007 may be disturbed. While bridge or tunnel options are not
advised, viaduct option is recommended (See Section 2.4.1). The piers of viaduct were optimized to avoid
permanent encroachment to the reedbeds. However,
temporary reedbed loss of around 320m2
will be unavoidable due to land requirement during construction phase.
According
to the EIA for MTR LMC Spurline (EIA-071/2001), the
BOD loading to the reedbeds (effluent polishing
efficiency is 50% thus 12.3 kg/day BOD removal by reedbeds)
is 24.6 kg/day. An additional flow from San Tin Eastern Drainage Channel was
then added to the reedbeds such that the total BOD
removal was 24.6 kg/day so as to meet the requirement of "no net increase
in pollution loads requirement in Deep Bay". During construction phase, a
temporary loss of 320 m2 of reedbed which
is equivalent to slight reduction of 0.7% of total reedbed
size of 4.65 ha is considered acceptable, and indeed the loss of 320 m2
will be reinstated upon completion of the construction. In addition, the LMC
Spur Line terminal is not under ultimate use during the construction period of
Direct Link. Therefore, adverse water quality impact is not anticipated.
However, in precautionary consideration, compensation on the loss of reedbed area is required as shown in Section 5.7.1.8.
5.6.2 Operational Phase
5.6.2.1 Sewage and Sewerage System
During
operational phase, sewage discharge from approximate 53,000 population of the proposed
development at the LMC Loop will be the major water pollution source. A conformal design standard to satisfy the
WQO and the “No net increase in pollution loads requirement in Deep Bay” will
apply.
Subject to engineering findings during detailed design
stage, reuse of treated sewage
effluent (TSE) from the on-site STW may supply the water for flushing, District
Cooling System (DCS) operation and landscape area irrigation. Its potential
health impact to the end users is assessed in Chapter 6.
Emergency
discharge might be required if the on-site STW had failed. This will have
adverse water quality impact to surrounding waterbodies
if not properly controlled. The impact due to emergency discharge would be
subject to the quantity and quality of sewage discharge and the assimilation
capacity of receiving bodies, i.e. Shenzhen River. The flow is about 14,689 m3/day. Precautionary measures are
required to prevent and minimise the impact.
Effluent will be discharged to the
Shenzhen River. If TSE reuse required, part of the effluent, will go via a
further treatment such as chlorination. The chlorination process and all
related pump sets will be located within the on-site STW. Treated effluent from
on-site STW will then be pumped and diverted to the Flushing Water Service Reservoir. The pump sets will be man-controlled. While malfunction occurred
in flushwater distribution system, effluent treatment
such as chlorination and the related pumps will be shut down and effluent will
be discharge to Shenzhen River via the STW. Thus Emergency overflow and bypass
to Flushing Water
Service Reservoir is not required. During regular
cleaning of Flushing
Water Service Reservoir, wastewater will be generated
and mitigation measures such as good site practices are required.
5.6.2.2 Discharge from District Cooling System (subject to engineering findings during detailed design stage)
Water
circulation for the operation of district cooling system (DCS) will be in
closed circuit and will be completed after two phases of construction (western
and eastern). Water demand in DCS refers to the replenishment/blown down of
water from cooling tower in the heat rejection system due to evaporation, drift
and bleed-off and the estimated amount is about 5000m3/day. During
emergency or maintenance condition, wastewater will be discharged to the
proposed STW. Adverse water quality impact is not anticipated.
Potential
water quality impacts may arise from the LMC Loop and road runoff discharge,
which is known as non-point source pollutions, during operational phase.
Substances such as dust and lubricant oil deposited and accumulated on the road
surfaces will be washed into the drainage system, fish ponds or streams during
rainfall. The total
length of external connections is about 4.8 km. According to DSD Stormwater
Drainage Manual, the total peak runoff is about 3238 m3/hour and
4119 m3/hour under 10-year and 50 year-return-period rainstorm. The
hydrological impact within LMC Loop is presented in Section 5.6.2.4 and the required mitigation measures
is presented in Section 5.7.2.4 respectively. Mitigation
measures to road runoff will be required in the design of drainage systems.
Under
existing scenario, the area was mainly rural area. Additional loading would be
due to addition runoff from reducing of infiltration rate from the development.
Worst scenario will be due to first flush under heavy rainstorm events. Typical
runoff concentrations were measured under the study of Update on Cumulative
Water Quality and Hydrological Effect of Coastal Developments and Upgrading of
Assessment Tool – Pollution Loading Inventory Report[5-9].
Under normal condition, runoff will not be generated in low rainfall intensity [5-9].
In addition, the additional loading could minimize by
proper design and site management. Given the stochastic nature of non-point
source pollution, a semi empirical but conservative estimate is presented in Appendix 5-3. The estimate takes into
account the proposed land use, previous local and oversea
studies and prevailing road and open space management practice with enhancement
where beneficial.
5.6.2.4 Drainage System
Bridge
crossing with no encroachment to river waters will be provided when the
external road connections crossing ecological important streams. There will be
no permanent alternation of water courses and natural streams with high
ecological value. Box culverts will be installed in other small streams. In
addition, the proposed development will be within in LMC Loop only, compared
with the whole stormwater catchment for Shenzhen
River.
The
only change in hydrology regime due to the project involves the additional
paved area, which will affect the infiltration rate in the catchment.
Increasing flood risk as a result of extra stormwater
runoff may occur. According to the hydraulic modelling results in Drainage
Impact Assessment report under this study, the performance of the permanent
drainage system will comply with the relevant regulations and the potential
change in water levels at Shenzhen River (near LMC Loop at Ch 11155 to 13155)
is less than 0.02m under 1 in 50 year return period rainfall. In the permanent
drainage system design, the Ecological Area will have a side function for flood
retention in order to minimize the impacts. Thus, potential flood risk is
considered as minimal. Provided the minimal hydrological
changes due to the project, the water quality regime will not be affected.
5.7.1 Construction Phase
5.7.1.1 Construction Site Runoff
In
accordance with the Practice Note for Professional Persons on Construction Site
Drainage, Environmental Protection Department, 1994 (ProPECC
PN 1/94), construction phase mitigation measures should be provided as far as
practicable and the Storm Water Pollution Control Plan is given below.
Storm Water Pollution Control Plan
· At the start of site establishment, perimeter cut-off drains to direct off-site water around the site should be constructed with internal drainage works and erosion and sedimentation control facilities implemented. Channels (both temporary and permanent drainage pipes and culverts), earth bunds or sand bag barriers should be provided on site to direct stormwater to silt removal facilities. According to DSD’s Stormwater Drainage Manual, to handle a 10 year-return-period storm, the sizes of drains for LMC Loop, WCR, Direct Link and ECR should be no less than 986mm, 409mm, 321mm and 444mm in diameter, respectively. Details of the reference calculation and a storm water pollution control plan are presented in Appendix 5-1. The design of the temporary on-site drainage system will be undertaken by the contractor prior to the commencement of construction. The size of the drains shall be determined to suit the actual site arrangement according to the DSD’s Stormawater Drainage Manual
·
Diversion of natural stormwater
should be provided as far as possible. The design of temporary on-site drainage
should prevent runoff going through site surface, construction machinery and
equipment in order to avoid or minimize polluted runoff. Sedimentation tanks
with sufficient capacity, constructed from pre-formed individual cells of
approximately 6 to 8 m3 capacities, are recommended as a general
mitigation measure which can be used for settling surface runoff prior to
disposal. The system capacity shall be
flexible and able to handle multiple inputs from a variety of sources and
suited to applications where the influent is pumped.
· The dikes or embankments for flood protection should be implemented around the boundaries of earthwork areas. Temporary ditches should be provided to facilitate the runoff discharge into an appropriate watercourse, through a silt/sediment trap. The silt/sediment traps should be incorporated in the permanent drainage channels to enhance deposition rates.
· The design of efficient silt removal facilities should be based on the guidelines in Appendix A1 of ProPECC PN 1/94. The detailed design of the sand/silt traps should be undertaken by the contractor prior to the commencement of construction.
· Construction works should be programmed to minimize surface excavation works during the rainy seasons (April to September). All exposed earth areas should be completed and vegetated as soon as possible after earthworks have been completed. If excavation of soil cannot be avoided during the rainy season, or at any time of year when rainstorms are likely, exposed slope surfaces should be covered by tarpaulin or other means.
· All drainage facilities and erosion and sediment control structures should be regularly inspected and maintained to ensure proper and efficient operation at all times and particularly following rainstorms. Deposited silt and grit should be removed regularly and disposed of by spreading evenly over stable, vegetated areas.
· Measures should be taken to minimise the ingress of site drainage into excavations. If the excavation of trenches in wet periods is necessary, it should be dug and backfilled in short sections wherever practicable. Water pumped out from trenches or foundation excavations should be discharged into storm drains via silt removal facilities.
· All open stockpiles of construction materials (for example, aggregates, sand and fill material) of should be covered with tarpaulin or similar fabric during rainstorms. Measures should be taken to prevent the washing away of construction materials, soil, silt or debris into any drainage system.
· Manholes (including newly constructed ones) should always be adequately covered and temporarily sealed so as to prevent silt, construction materials or debris being washed into the drainage system and storm runoff being directed into foul sewers.
· Precautions to be taken at any time of year when rainstorms are likely, actions to be taken when a rainstorm is imminent or forecasted, and actions to be taken during or after rainstorms are summarized in Appendix A2 of ProPECC PN 1/94. Particular attention should be paid to the control of silty surface runoff during storm events.
· All vehicles and plant should be cleaned before leaving a construction site to ensure no earth, mud, debris and the like is deposited by them on roads. An adequately designed and sited wheel washing facilities should be provided at every construction site exit where practicable. Wash-water should have sand and silt settled out and removed at least on a weekly basis to ensure the continued efficiency of the process. The section of access road leading to, and exiting from, the wheel-wash bay to the public road should be paved with sufficient backfall toward the wheel-wash bay to prevent vehicle tracking of soil and silty water to public roads and drains.
· Oil interceptors should be provided in the drainage system downstream of any oil/fuel pollution sources. The oil interceptors should be emptied and cleaned regularly to prevent the release of oil and grease into the storm water drainage system after accidental spillage. A bypass should be provided for the oil interceptors to prevent flushing during heavy rain.
· Construction solid waste, debris and rubbish on site should be collected, handled and disposed of properly to avoid water quality impacts.
· All fuel tanks and storage areas should be provided with locks and sited on sealed areas, within bunds of a capacity equal to 110% of the storage capacity of the largest tank to prevent spilled fuel oils from reaching water sensitive receivers nearby.
· Regular environmental audit on the construction site should be carried out in order to prevent any malpractices. Notices should be posted at conspicuous locations to remind the workers not to discharge any sewage or wastewater into the meander, wetlands and fish ponds.
· During the construction of ECR, proper site drainage system with adequate silt removal facilities should be deployed in order to prevent polluted runoff discharged to the Ma Tso Lung Nullah and the meander. A discharge license should be obtained from EPD prior to any site runoff discharge.
· The construction works of underpass should be conducted during dry season (October to March) to prevent excess stormwater runoff to the meander. Cofferdams or diaphragm walls should be deployed to fully separate the works area and the river waters.
By
adopting the above plan with best management practices, it is anticipated that
the impacts of construction site runoff from the construction site will be
reduced to satisfactory levels before discharges. Subject to detailed design and contractor’s
site arrangement, the Storm
Water Pollution Control Plan should be reviewed and updated. The requirement of
Storm Water Pollution Plan will be incorporated in the project contract
documents.
5.7.1.2 Groundwater from Contaminated Area
Given
that no contamination was detected in groundwater sample in LMC Loop, no
adverse water quality impact due to groundwater discharge is anticipated. No
mitigation measure is therefore required for groundwater treatment.
Outside
the LMC Loop, as no site investigation has been carried out due to site access
denial, additional investigation may be required to identify if contaminated
groundwater is found (refer to Section 8).
If the
investigation results indicated that the groundwater to be generated from
construction works would be contaminated, the contaminated groundwater should
be either discharged into recharged wells, or properly treated in compliance
with the requirements of Technical Memorandum on Standards for Effluents
Discharged into Drainage on Sewerage Systems, Inland and Coastal Waters.
If
recharged well method were used, the groundwater quality in the recharged well
should not be affected by recharging operation, i.e. the pollution levels of
the recharged groundwater should not be higher than that in the recharging
wells.
If
treatment and discharge method were used, the design of wastewater treatment
facilities, such as active carbon and petrol interceptor, should be submitted
to the EPD and a discharge license should be obtained under the WPCO through
the Regional Offices of EPD.
Portable
chemical toilets and sewage holding tanks should be provided for handling the
construction sewage generated by the workforce. A licensed contractor should be
employed to provide appropriate and adequate portable toilets to cater 0.15m3/day/employed
populations and be responsible for appropriate disposal and maintenance.
Notices
should be posted at conspicuous locations to remind the workers not to
discharge any sewage or wastewater into the nearby environment during the
construction phase of the Project. Regular environmental audit on the
construction site should be conducted in order to provide an effective control
of any malpractices and achieve continual improvement of environmental
performance on site. It is anticipated that sewage generation during the
construction phase of the Project would not cause water quality impact after
undertaking all required measures.
5.7.1.4 Riverbanks Formation for Ecological Area
In
order to prevent sediment transport during riverbank works, deployment of silt
curtain should be implemented, especially when construction works encroach or
occur in close distance to water body. It is recommended to carry out all the
riverbank works within a cofferdam or diaphragm wall.
Water
quality of the Shenzhen River and the meander would be monitored to ensure
effectiveness of the implemented mitigation measures.
5.7.1.5 Construction of Bridge Crossing under WCR / Direct Link to LMC Station / ECR
Good
site management as stipulated in ProPECC PN1/94
should be fully implemented to avoid polluted liquid or solid wastes from
falling into the WSRs.
If
bridge/structures erected on pond, the pond water will be drained and refilled
after completion of works at all affected ponds. Thus, the water quality of the pond will not be
affected by the construction works.
Cofferdam
or diaphragm walls should be deployed for protecting fish ponds or nearby
watercourses/streams during bridge pier/box culvert construction and/or road
widening work at fishponds.
For
the low level viaducts crossing the small streams at Ma Tso
Lung, Ping Hang and channel near Lung Hau Road,
precast structures will be used such that there will be no construction work in
the water streams, and thus, to avoid direct water quality impacts.
5.7.1.6 Construction of Underpass / Depressed Road under ECR
Good
site management as stipulated in ProPECC PN1/94
should be fully implemented to avoid polluted liquid or solid wastes from
falling into the WSRs.
Cofferdam
or diaphragm walls should be deployed for protecting fish ponds or the meander
during excavation activities such that the construction works will be separated
from the meander and nearby fishpond waters. As a precaution measures, silt
curtain/screen could be deployed to cover the cofferdam/diaphragm walls.
For ECR
underpass, subject to further engineering review, the sequence of flow contraction will be divided into
two batches (half year per each batch) and all the works will be conducted in
dry season (October to March) in order to avoid and minimize the impact to flow
regimes. 50% (around 30m) of the width of the Meander (total width around 60m)
will be occupied by the erected cofferdams or diaphragm walls. Appendix 5-4 indicates the tentative
working sequences on ECR underpass construction.
5.7.1.7 Bio-remediation in Shenzhen River
Major
water quality impact due to bio-remediation is not anticipated. According to
Biochemical Processing Technology Field Test and Final Test Report《生化處理技術實地試驗總報告書》[5-7],
the pore water and elutriate test results after bioremediation were well below
Category V of GB3838-2002, which refers to the poorest water quality in the
range.
Not
more than one working vessel is allowed to work concurrently and the maximum
injection area should be less than 10,000m2 per day.
Water
quality monitoring and audit is recommended to ensure that the proposed
bio-remediation operation would not result in adverse water quality impact.
Details of the water quality monitoring programme are presented in the EM&A
Manual. If unacceptable water quality impact in the receiving water is
recorded, additional measures such as slowing down, or rescheduling of works should
be implemented as necessary.
5.7.1.8 Construction of Direct Link to LMC Station
The
effluent polishing efficiency of the reedbed at LMC
Station will not be deteriorated in theory. However, as a precautionary
consideration, the following options are proposed to compensate for the small
loss of reedbed area:
1. Reprovision of similar or larger size reedbed near the affected reedbed
to compensate for the loss. The area reprovisioned reedbed should not be less than 320m2 in total
area.
2. Reprovision of a package sewage treatment
plant (e.g. MBR) to provide the same sewage treatment efficiency of the
affected reedbed. The package sewage treatment plant
should at least have a BOD removal of 0.395 kg/day (49.2 kg/day/2ha x 0.032 ha
x 50%); or
3. Increasing the Hydraulic Retention Time (HRT) of
the entire system by 1.6%. There will be negligible increase in water depth
(about 10mm) in the reedbed, which will not
deteriorate the function of existing system. Appendix 5-2 gives the justifications for the required HRT.
It
should be noted that the above calculation assumes an ultimate loading from MTR
Lok Ma Chau Station. However, it is currently not
under a full capacity and unlikely to achieve full capacity during the
construction of Direct Link, which is tentative from 2015 to 2020. In order to
prevent over-design of mitigation measures, the Project Proponent shall further
liaise with MTRC on the actual loading during construction of Direct Link and
review the required mitigation measures, if required.
The
affected reedbed will be reinstated after
construction of Direct Link. There will only be temporary minor reedbed loss due to viaduct piers during construction and
the function reedbed will not be affected
permanently. Since the reedbed within MTR LMC Station
is under the conditions of FEP-06/129/2002/F. A process of Variations of
Environmental Permit might be required. During detail design stage, these
options will be further evaluated in terms of land resumptions,
responsibilities, etc. The selection of abovementioned options are subject to
future discussion with MTRC.
5.7.2 Operational Phase
5.7.2.1 Sewage and Sewerage System
All
the sewage generated from the LMC Loop will be collected and treated in the
proposed new STW to achieve compliance with the “No Net Increase in Pollution
Loads Requirement in Deep Bay”.
Membrane
bio-reactor wastewater treatment technology will be adopted for the STW. The effluent discharge from
the proposed STW will comply with the
no net increase in pollution loads requirement by compensating the river
quality in Deep Bay catchment. Onsite treatment and offsite
compensation is
proposed to achieve the no net increase in pollution load requirement. A STW with ultimate capacity of 18,000 m3/day
is proposed in LMC Loop and the effluent will be discharged to the Shenzhen
River. Compensation of pollution loading will be achieved by upgrading the
existing Shek Wu Hui such that a higher effluent
quality level and capacity would be reached.
The
ultimate load from the proposed STW is summarised in Table 5.8 below. Detail of these options for compensation is given
in Section 6.6.1.
Table
5.8 Pollutant emission inventory subject to ”no net
increase in pollution loads requirement in Deep Bay”
|
|
Parameter |
Unit |
Average Flow = 18,000 m3/day
|
Base Case |
|
On-site STW in LMC Loop |
BOD5 |
kg/day |
90 |
- |
|
TN |
kg/day |
144 |
- |
|
|
TP |
kg/day |
18 |
- |
|
|
Cumulative with NENT NDA |
BOD5 |
kg/day |
1990 |
2260 |
|
TN |
kg/day |
1664 |
1695 |
|
|
TP |
kg/day |
208 |
565 |
Emergency
discharge, with maximum flowrate of about 14,689 m3/day,
will be diverted to Shenzhen River when the on-site STW had failed, the
following precautions measures shall be included in the STW design in order minimize
the occurrences:
· Standby unit should be provided to facilitate repair and maintenance of equipment;
· Dual power supply, or back-up power, should be provided, perfectly in the format of ring main or automatic-operated emergency generator with sufficient capacity to cope with the demand loading of the essential plant equipment;
· Telemetry system should be provided to the closest manned plant for unmanned facilities, such that swift actions could be taken in case of malfunction of unmanned facilities; and
· Manual cleaning should be provided at all screens and overflow bypass to prevent the discharge of floating solids.
The occurrence of
emergency discharge is remote accorrding to local
experience. According to the EIA report of Tai Po STW (EIA-097/2004), emergency
discharge of untreated effluent was occurred once due to power failure at Year
1995. The duration of
the emergency discharge was less than 3 hours with a total discharge volume of
less than 9,000 m3,
compared to their design flow of 88,000 m3/day
at that time. With the implementation of dual power and the abovementioned
precaution measures, the occurrence of emergency discharge for LMC Loop on-site
STW is unlikely.
As discussed in Section 5.6.2.1, emergency discharge for Flushing Water Service Reservoir is not required. However, during regular cleaning, waste water will be generated. These wastewater should be delivered to STWs or diverted back to influent pipes of on-site STW.
5.7.2.2 Discharge from District Cooling System (subject to engineering findings during detailed design stage)
As
discussed in Section 5.6.2.2,
effluent discharge from district cooling system would only occur during
emergency or maintenance condition. All the effluent will be discharged to the proposed
STW for treatment and adverse water quality impact is not anticipated. No
mitigation measure is therefore required.
5.7.2.3 Surface Runoff
During
operational phase, vehicle dust, tyre scraps and oils might be washed away from
the paved surface to the nearby water courses by surface runoff or road surface
cleaning. Usually only silt traps will be provided for rural roads. However, in
considering the ecological importance in the vicinity, oil interceptors will be
installed in proposed road in advance. The design of road gullies with silt traps
and oil interceptors should be incorporated in later detailed design. Frequent
manually cleaning should be provided.
In the
ecological sensitive areas, runoff will be controlled by management practices.
Runoff will be intercepted by silt traps with management practices before
diverting to Ping Hang Stream, Ma Tso Lung Stream and
the Meander remove the pollutants at source. At the outfalls to these rivers,
the Project Proponent or the delegated operation parties should manage the
road/open area cleaning prior to the occurrence of a storm. The operator should undertake the cleaning at an interval of twice a
week and the frequency should be increased to suit actual site conditions.
Moreover, it is recommended each of the cleaning events should not be separated
by more than four days and should be carried out during low traffic flow
period, preferably using either manually or vacuum air sweeper/truck equipped with side
broom, which is to sweep road sludge and debris into the suction nozzle to
increase the removal efficiency of pollutants. The collected pollutants would
be tankered away for off-site disposal at landfill
sites. After removal of the pollutants, the pollution levels from stormwater would be much reduced.
Given the stochastic nature of non-point
source pollution and adopting flexible management to suit site conditions, the
impact to the receiving water body is insignificant. Appendix
5-3 shows the calculation of non-point source loading rates.
Storm Water Pollution Control
Plan
Subject
to detailed design and requirement of relevant government departments, the
capacities of road drainage system shall cater the runoff from 50
year-return-period rainstorm. Proper drainage systems with silt traps and oil
interceptors should be installed. According to DSD’s Stormwater Drainage
Manual, the drainage pipe size of WCR, Direct Link and ECR should be no less
than 1050mm, 778mm and 1130mm, respectively. Details of calculation and a storm water pollution control plan are presented in Appendix 5-1. However, the actual size of the storm drains
will be subject to detailed design. The Storm Water Pollution Control Plan should be
updated and submitted to EPD for approval prior to construction.
During
the EM&A programme, the project proponent should verify the efficiency of
silt traps and cleaning frequencies by water quality monitoring during typical
rainstorm events.
5.7.2.4 Drainage System
Compared
to the whole stormwater catchment for Shenzhen River,
the overall hydrology regime will not be significantly changed with the
implementation of proper drainage system.
According
to the model results of Drainage Impact Assessment (DIA), the largest variation
of water level at Shenzhen River with and without LMC Loop Development is less
than 0.02 m under 50-year-return-period rainstorm. The storm
water pollution control plan is presented in Appendix 5-1.
5.8.1 Construction Phase
Although
the construction of SZ River Regulation Phase IV is concurrent with that of LMC
Loop, the separation distance from site is about 7km, which is outside the 500m
of assessment area. In addition, according to the approved EIA report (AEIAR-160/2011) for Regulation of Shenzhen River Stage
IV, the water quality impacts of the river training project would be mitigated
within acceptable levels and thus no significant cumulative water quality
impact is anticipated with the Loop project.
5.8.2 Operational Phase
In
addition to the sewage generated from the LMC Loop operation, implication of
sewage flows would occur from other catchments such as from nearby villages. In
order to tackle the cumulative sewage flows, designed capacity of the proposed
STW will be marked up. The details of sewerage impact assessment will be
discussed in Section 6 of this report.
5.9 Residual Environmental Impacts
No
adverse residual impact is anticipated during the construction and operation of
the Project with the implementation of mitigation measures.
The estimated total sewage flow from the
development is 14,689 m3/day which is based on the
estimation from proposed population and
future land use. The calculations of no net increase in pollution
loading did not consider the TSE reuse which is in a conservative side to cater
the uncertainties. In spite the daily sewage flow is 14,689 m3/day,
the treatment capacity of on-site STW has been designed to 18,000 m3/day
in order to cater any uncertainties.
With
full implementation of the mitigation measures, no adverse impact is
anticipated. No adverse residual impact and cumulative impact is anticipated
during both the construction and operational phase of the Project. In order to
ensure effectiveness of the implemented mitigation, regular water quality
monitoring in the meander are recommended during the construction phase.
[5-1] EPD, 2006-2010, River Water Quality Report
[5-2] Shenzhen-Hong
Kong Lok Ma Chau Loop Joint Development Project
Environmental Impact Assessment Outline (Draft) 《深港落馬洲河套地區聯合開發項目環境影響評價大綱(送審稿)》
[5-3] Shenzhen
River Contaminated Sediment Remediation Strategy Joint Study深圳河污染底泥治理策略合作研究
[5-4] Shenzhen
River and Deep Bay Water Quality and Ecological Baseline Survey Report,
February 2009《深圳河及深圳灣水環境與生態現狀調查與評介報告》
[5-5] Shenzhen
River Regulation Office (深圳市治理深圳河辦公室) & EPD, Proposal of Sediment Contamination Survey Work
Plan《底泥污染調查建議工作計劃》4th
Edition
[5-6] EPD,
2006-2010, Marine Water Quality
[5-7] Shenzhen
River Regulation Office (深圳市治理深圳河辦公室) & EPD, 4 Jan 2013, Bioremediation Field Test
Draft Final Report《生化處理技術實地試驗總報告書送審終稿(2013年1月4日) 》S6.2.10,
Pages 64 to 80 and S7.3 Page 93
[5-8] Shenzhen
River Regulation Office (深圳市治理深圳河辦公室) & EPD, Jan 2013, Environmental Review Report (Draft Final)《環境覆查報告書預終稿(2013年1月)》Page 58
[5-9] EPD (1999) Update on Cumulative Water Quality and Hydrological
Effect of Coastal Developments and Upgrading of Assessment Tool – Pollution
Loading Inventory Report
[5-10] Australian Water Quality Guidelines for Fresh and
Marine Waters, October 2000
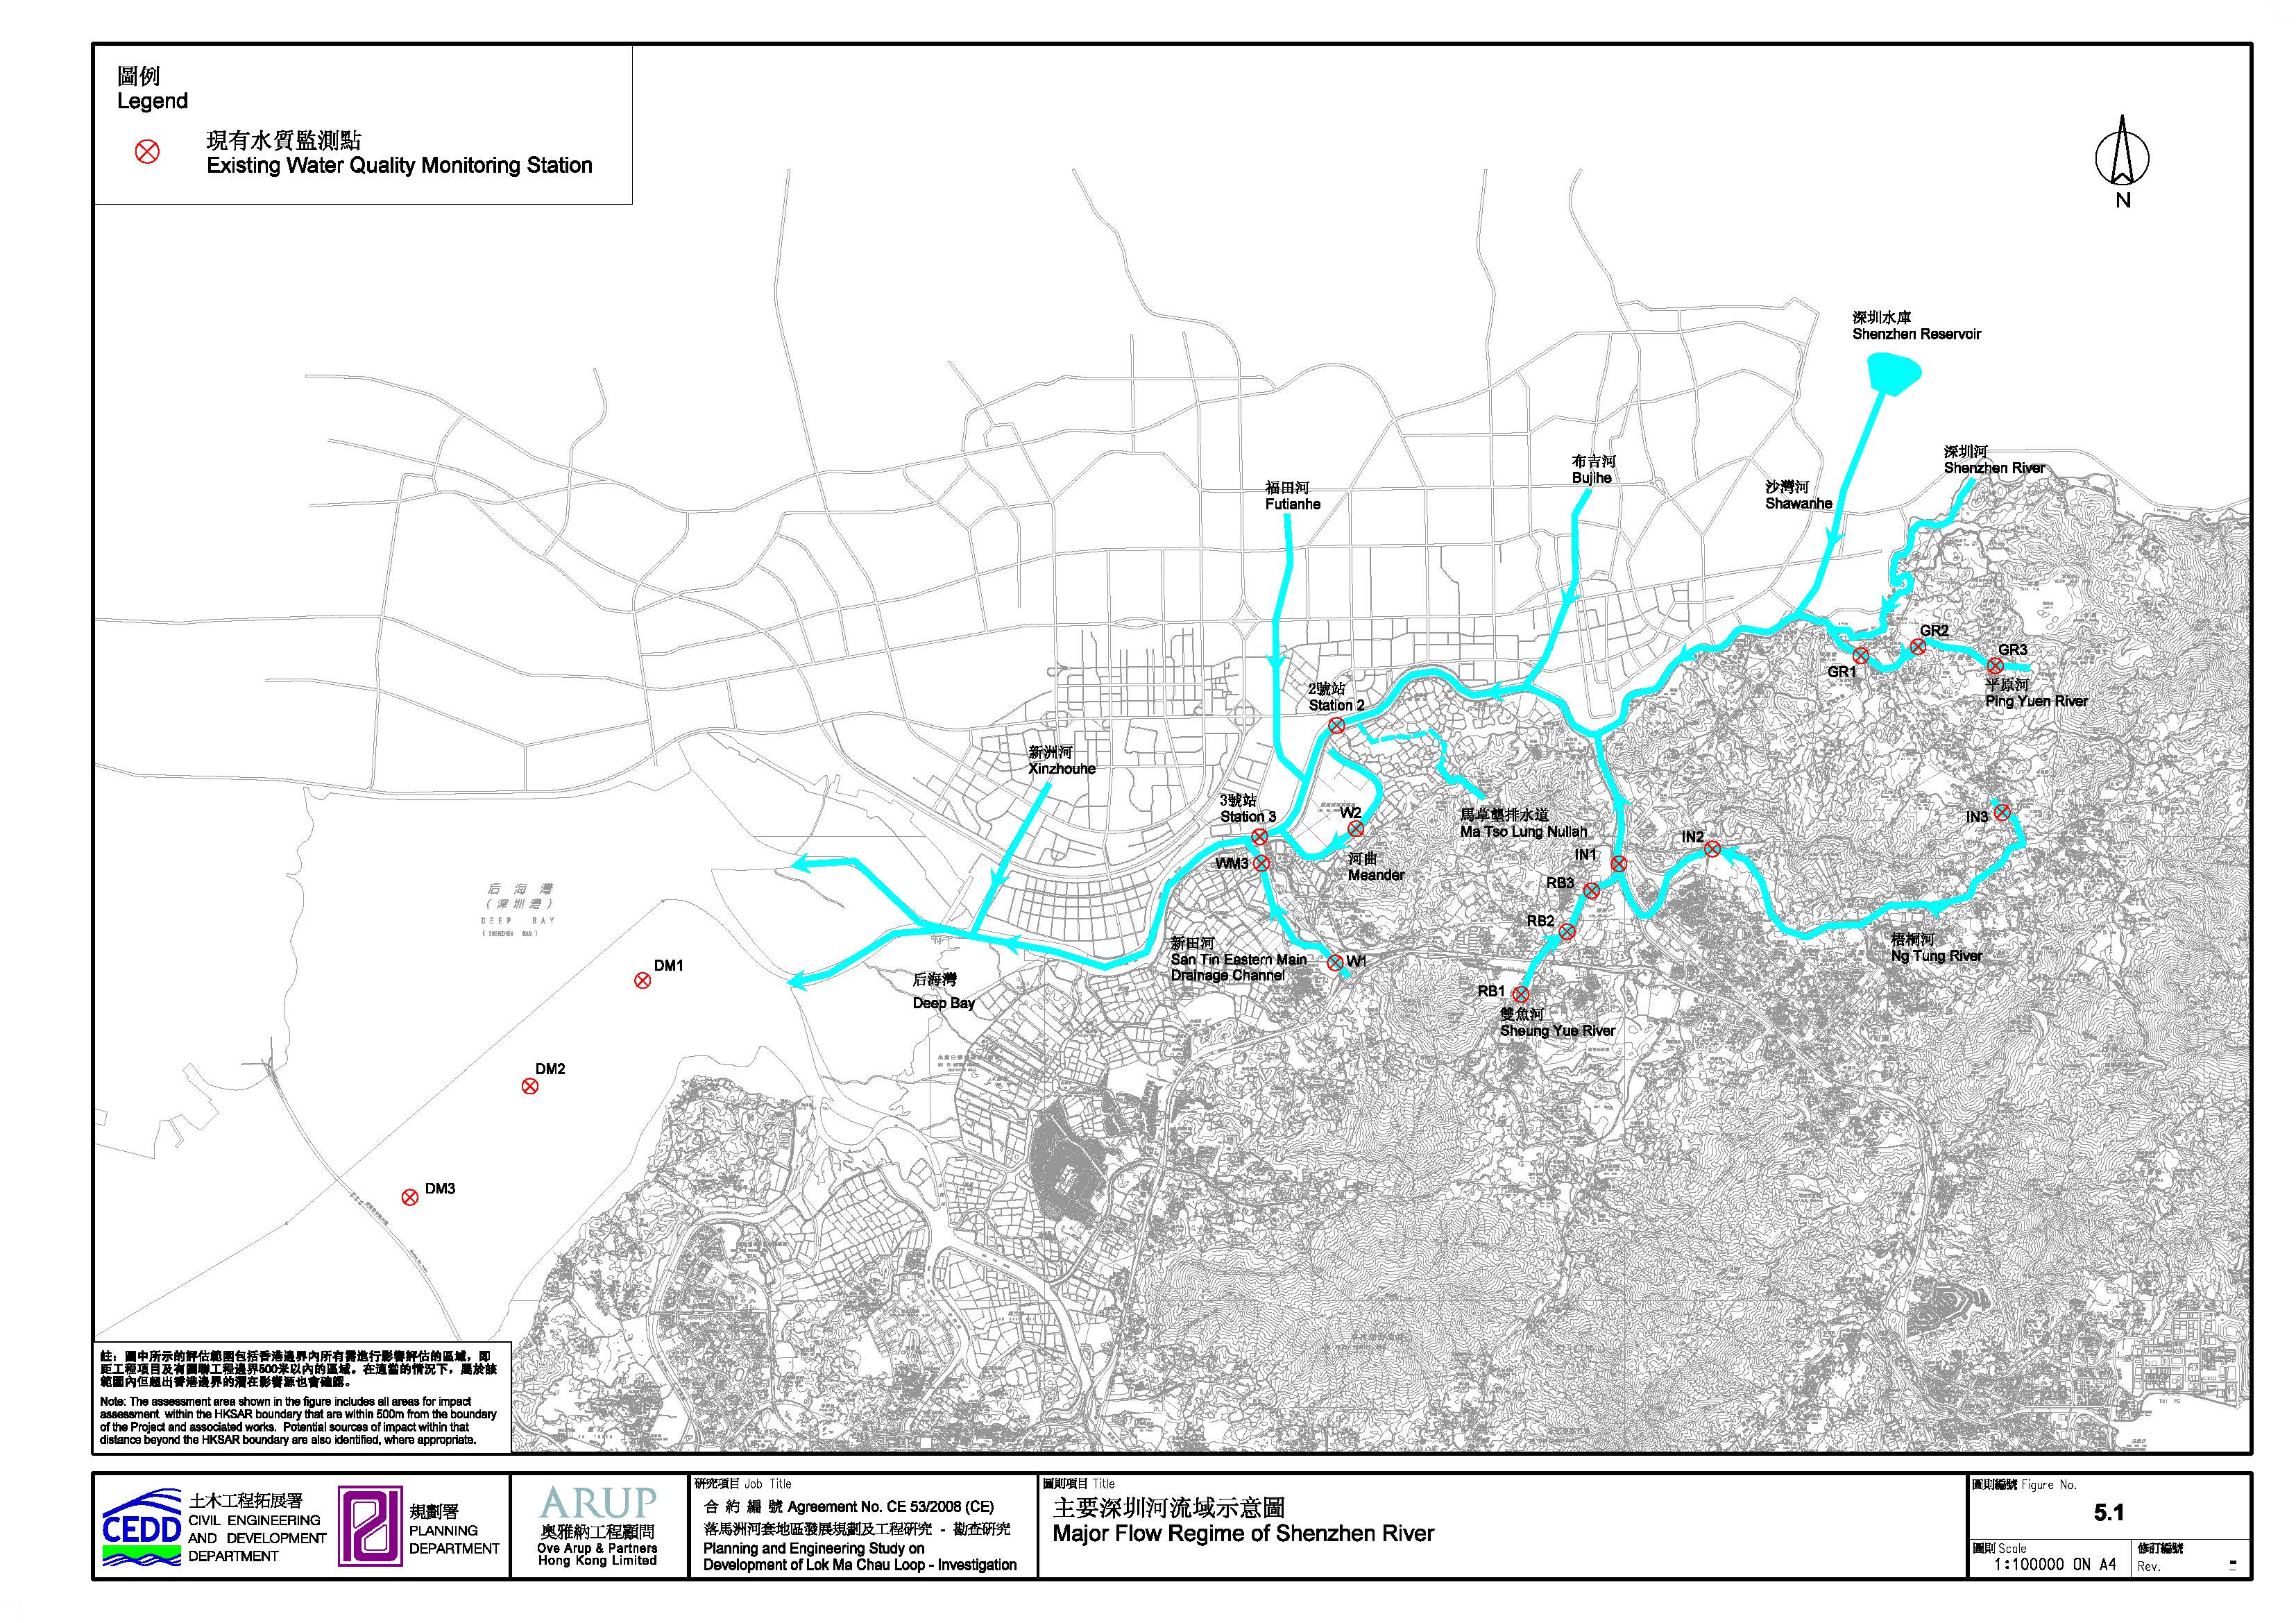
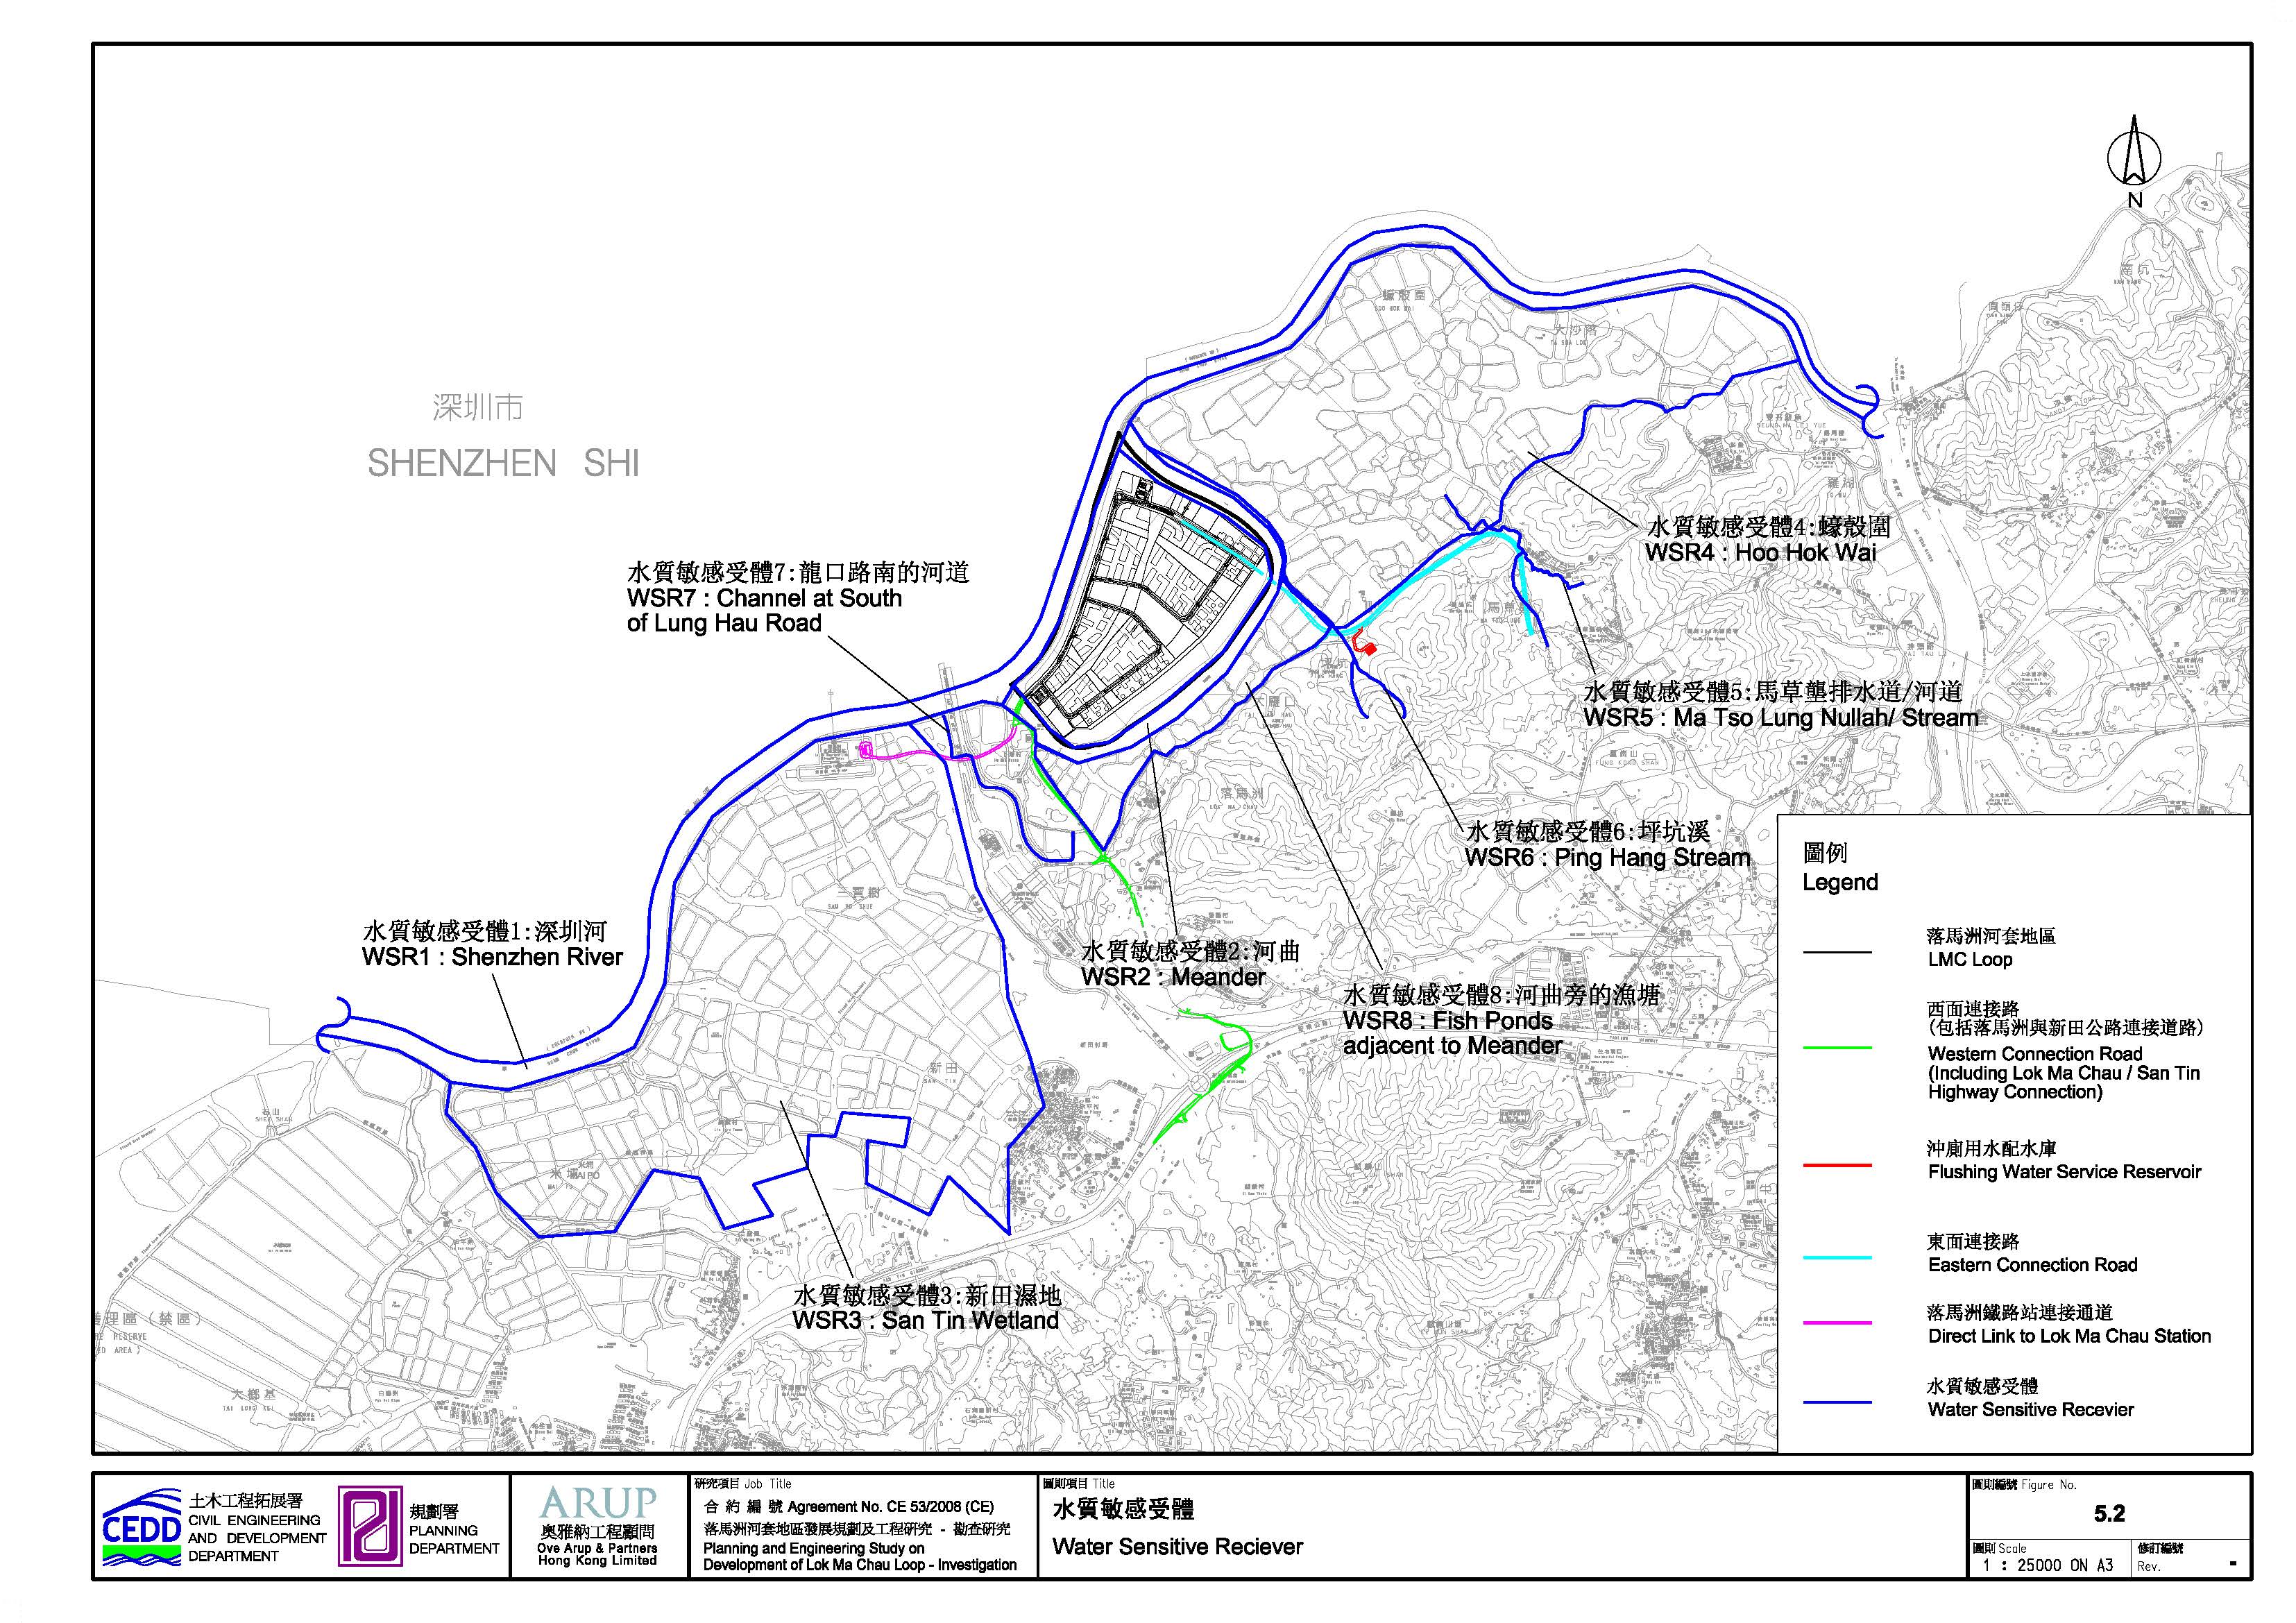