12.1.1
ERM-Hong Kong Ltd (ERM) has been commissioned
to conduct a Hazard to Life Assessment (HA) for the In-Situ Reprovisioning of
Sha Tin Water Treatment Works (Sha Tin WTW) South Works Project (hereinafter
referred to as “the Project”). The hazard assessment is a part of the
Environmental Impact Assessment for the Project conducted under the EIAO. The
EIA Study Brief is registered as "In-situ Reprovisioning of Sha Tin Water
Treatment Works – South Works” (Reference No. ESB-220/2011) and was issued on 9
March 2011.
12.1.1
Requirements for assessment of hazards to
life are presented in Section 3.4.3 of the Study Brief. Section 3.4.3.2
stipulates that:
The Applicant shall investigate alternative construction methods to
avoid the use of explosives. If there is use of explosives for the construction
activities and the storage or blasting location is in close proximity to
populated areas and/or Potentially Hazardous Installation site (i.e. STWTW),
the Applicant shall carry out hazard assessment as follows:
(i) Identify hazardous scenarios associated with the transport, storage
and use of explosives (including possible damage scenarios to gas and chlorine
facilities) and then determine a set of relevant scenarios to be included in a
Quantitative Risk Assessment (QRA);
(ii) Execute a QRA of the set of hazardous scenarios determined in (i),
expressing population risks in both individual and societal terms;
(iii) Compare individual and societal risks with the criteria for
evaluating hazard to life stipulated in Annex 4 of the TM; and
(iv) Identify and assess practicable and cost-effective risk mitigation
measures.
The methodology to be used in the hazard assessment should be consistent
with previous studies having similar issues (e.g. Shatin-to-Central Link (Tai
Wai to Hung Hom Section) (ESB-191/2008), and Central Kowloon Route
(ESB-156/2006).
12.1.2
Section 3.4.3.3 of the Study Brief stipulates
that:
The Applicant shall investigate methods to
avoid and/or minimize chlorine risks. The Applicant shall carry out hazard
assessment to evaluate potential hazard to life during construction and
operation stages of the Project due to STWTW. The hazard assessment shall
include the following:
(i) Identify hazardous scenarios
associated with the transport, storage and use of chlorine at STWTW (including
possible damage scenarios associated with construction activities, storage of
liquid oxygen) and then determine a set of relevant scenarios to be included in
a QRA;
(ii) Execute a QRA of the set of hazardous
scenarios determined in (i), expressing population risks in both individual and
societal terms;
(iii) Compare individual and societal
risks with the criteria for evaluating hazard to life stipulated in Annex 4 of
the TM; and
(iv) Identify and assess practicable and
cost-effective risk mitigation measures.
The methodology to be used in the hazard
assessment should be consistent with previous studies having similar issues
(e.g. Shatin-to-Central Link (Tai Wai to Hung Hom Section) (ESB-191/2008), and
Integration of Siu Ho Wan and Silver Mine Bay Water Treatment Works
(ESB-150/2006)).
12.1.3
The scope section of the Study Brief also
states (Section 3.2.2 (vi)):
Potential hazard to life on construction
workers, operational staff and other sensitive receivers to be identified, with
STWTW is Potentially Hazardous Installations (PHI) due to the use of liquid
chlorine on site and the Beacon Hill North Offtake Station and its associated
750mm diameter high pressure gas pipeline that runs through the old Beacon Hill
Tunnel, and the possible use of explosives for blasting if applicable.
12.1.4
As required by the Study Brief, this
assessment concerns hazards related to transport, storage and use of chlorine
at Sha Tin WTW (STWTW) during the Construction Phase (South Works reprovisioning
works) and Operational Phase of the Project (after the project completion). The
approach adopted follows that of previous studies having similar issues.
12.1.5
Hazards relating to liquid oxygen are not
included in the assessment as it has been confirmed that there will be no
storage of liquid oxygen at Sha Tin WTW. Also, there will be no use of
explosives and hence this is not considered further in the assessment. Further,
it has been confirmed by HKCG that there are no high pressure gas pipelines
running through the old Beacon Hill Tunnel.
12.1.6
Additional hazard to life requirements are
also formulated in Section 2.1 (v) of the Study Brief, which as one of the
objectives of the EIA Study specifies:
To identify and assess the potential risk to
human life due to the construction works impact on the operation of the
existing PHI (Chlorine Store), the 400kV overhead power line and other notifiable gas installations
(NGIs), e.g. Beacon Hill North Offtake Station present or in the vicinity of
Project site and to propose measures to
mitigate these impacts.
These
issues are also addressed in relevant sections of this assessment.
12.2.1
Hong Kong Risk Guidelines (HKRG) for
Designated Projects are defined in Annex
4 of the Technical Memorandum to
Environmental Impact Assessment Process (EIAO-TM) in terms of individual
and societal risks as follows:
·
Maximum level of off-site individual risk
should not exceed 1 in 100000 per year, i.e. 1 × 10⁻⁵ per year; and
·
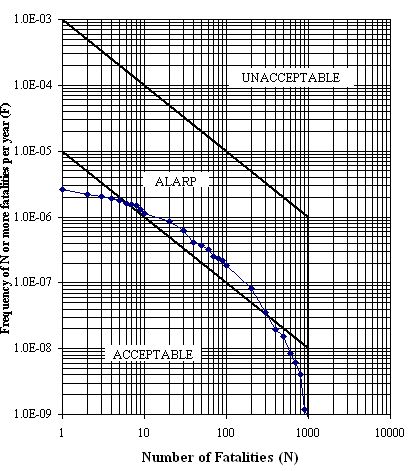
Societal Risk Guidelines as stipulated in
EIAO-TM are shown in Figure 12.1. For definitions of the individual and
societal risk measures see Section 12.12.
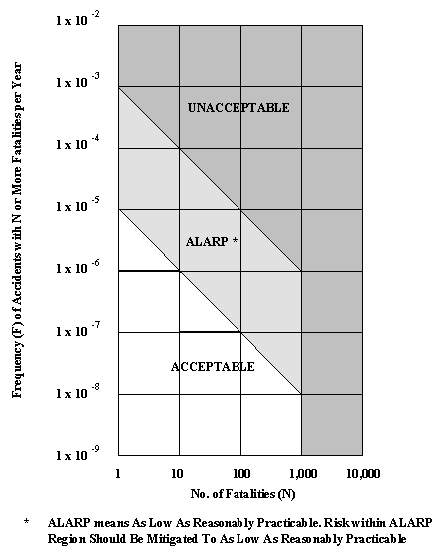
Figure 12.1 Societal Risk
Guidelines for Acceptable Risk Levels (EIAO-TM)
12.2.2
The Sha Tin WTW is designated as a
Potentially Hazardous Installation (PHI) owing to its use and storage of
chlorine in 1-tonne (1t) drums. A Consultation Zone (CZ), centred at the Chlorination
House, of 1000m radius but excluding the areas located at over 150 m above sea
level is established around the WTW (Figure 12.2). The Hong Kong Planning Standards and Guidelines
(HKPSG), Chapter 12, require that PHIs comply with Hong Kong Risk Guidelines as
described above.
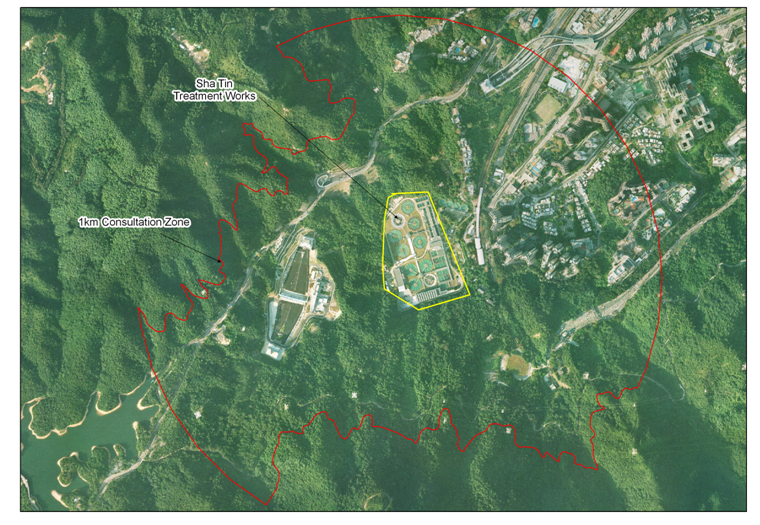
Figure 12.2 Sha Tin WTW
Location and Consultation Zone
12.3
Sha Tin Water Treatment Works: Location and Operations
Location
12.3.1
Sha Tin WTW lies at the head of a valley on
Keng Hau Road, Hin Tin to the south-west of Sha Tin new town. The site is
approximately rectangular in shape and measures 400 m north to south by 300 m
east to west. The treatment plant comprises a South Works and a North Works.
The Chlorination House is located in the south-west corner of the site. The
site location is shown in Figure 12.2 and the existing
site layout in Figure 12.3.
12.3.2
Sha Tin WTW is located at 30 m above the
Principal Datum (PD) and is surrounded on three sides by hills rising to
approximately 300 m. To the north-east the land slopes gently downwards towards
the town of Sha Tin. The topography is of particular relevance; since chlorine
is a dense gas, the spread of a chlorine cloud from any large release would be
restricted by the neighbouring hills and directed towards the populated areas.
The topography of the site is shown in Figure 12.4.
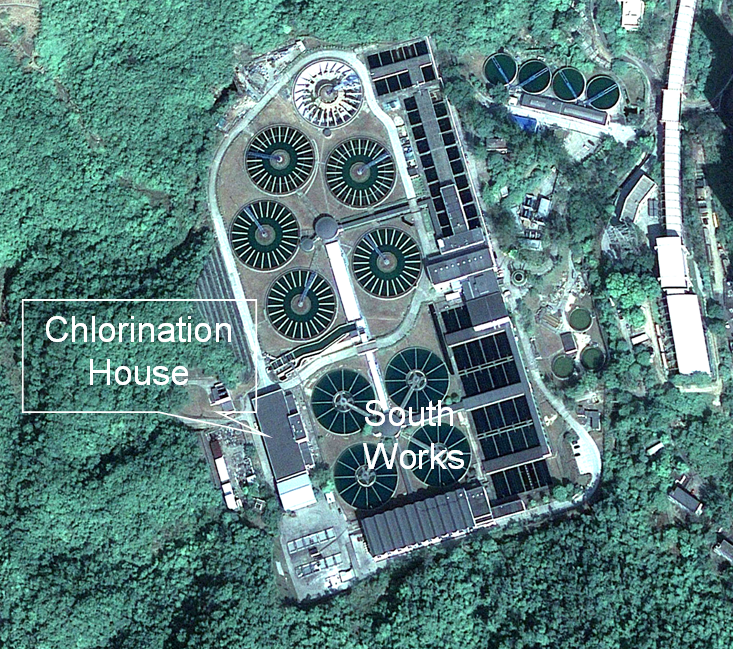
Figure 12.3 Existing Layout of Sha Tin WTW
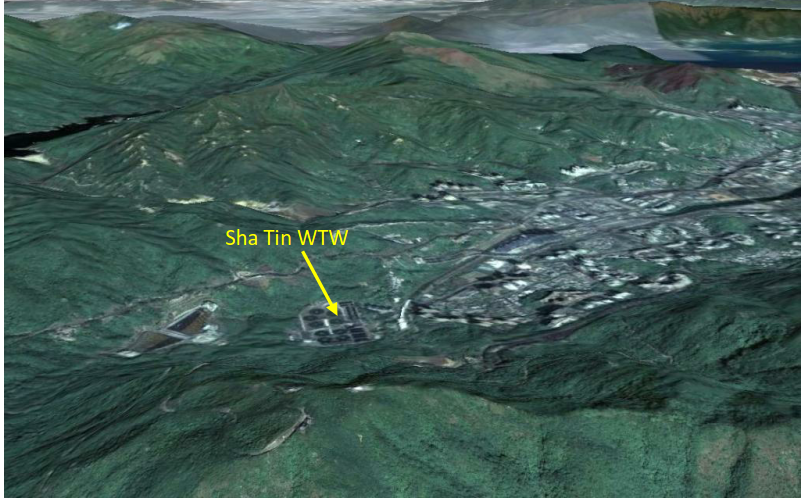
Figure 12.4 Topography of the Sha Tin WTW Area (not to scale)
Delivery, Storage and Handling of
Chlorine
12.3.3
Chlorine is delivered to Sha Tin WTW in
batches of up to 6×1-tonne drums. Unloading takes place inside the Chlorination
House, with the doors closed, in a designated truck unloading bay. The movement of drums
within the storage area and ‘drive-through’ unloading bay is carried out using
a hoist/monorail system with a purpose-built lifting beam. Prior to usage, the
drums are stored on cradles within the chlorine storage area.
12.3.4
The on-site chlorine delivery route is shown
in Figure 12.6.
Chlorination System
12.3.5
The draw-off units comprise of pairs of
drums, one drum on duty, the other serving as standby. The number of drums on
line is subject to the raw water quality. Changeover panels automatically
change the draw-off from duty to standby when the draw-off pressure falls below
a preset level. The changeover is achieved by electrically-actuated isolating
valves provided for each drum.
12.3.6
Liquid chlorine is drawn from the 1-tonne
drums and is passed to the evaporators for conversion into the gaseous state. The
gaseous chlorine passes through the chlorinators and dissolves in water at
ejectors to form chlorinated water for feeding into the bulk water stream
during the treatment process.
12.3.7
The chlorinators are of vacuum venturi type
and thus the section of line between the regulator and the chlorinator is at
negative pressure. This reduces the chances of chlorine leaks. Double non
return valves are provided within the chlorinator units.
Ventilation System
12.3.8
The chlorine drum storage area, evaporator
and chlorinator rooms are normally ventilated via a supply of fresh air at high
level which is extracted at low level. On detection of chlorine levels above 3
ppm there are visual and audible alarms, the ventilation fans stop and the
normally-open motorised louvres shut.
Chlorine Scrubbing System
12.3.9
An emergency chlorine scrubbing system is
installed to remove any leaked chlorine in the chlorine handling and storage
areas. The system is a packed tower utilising sodium hydroxide as the
neutralising agent. The plant and equipment are installed in a separate
scrubber room.
12.3.10
On detection of chlorine at a concentration
of 3 ppm or above in the chlorine handling or storage areas, the scrubbing
system will activate automatically. The air/chlorine mixture in the affected
areas is drawn into the scrubber by the scrubber fan via ducting connected to
the normal ventilation system. An electrically-operated isolating damper is
provided in the scrubber intake which opens automatically when the scrubber fan
starts up.
12.3.11
The scrubber system is normally set at auto
standby mode and is activated if the chlorine concentration rises above 3 ppm. A
continuous chlorine monitor is installed at a point downstream of the packed
tower and upstream of the vent/recycle changeover dampers to monitor the
scrubber performance; a “Chlorine concentration high” alarm will be initiated
if the concentration of chlorine in the tower exhaust exceeds the preset value.
12.3.12
The sodium hydroxide solution is of 10-12%
concentration and is held in a solution tank beneath the packed tower. When the
system is in operation, the sodium hydroxide is re-circulated by a pump to the
distributor at the top of the packed tower to provide adequate irrigation to
the packing. Sufficient solution is provided to absorb 1 tonne of chlorine. A
mist eliminator is provided at the top of the packed tower to prevent
entrainment of liquid into the treated air.
12.3.13
The scrubber is provided with the following
additional features: a sampling point, a top entry mixer (for preparation of the
sodium hydroxide solution), a direct reading transparent level gauge, an
inspection window and level indication with high and low level alarms and a
temperature measurement device for monitoring the temperature of caustic
solution during the preparation process.
Emergency Repair/Stoppage Kit for Chlorine
Spillage/Leakage
12.3.14
According to the Fire Services Department’s
fire safety requirements, an emergency repair/stoppage kit for chlorine
spillage/leakage is provided and maintained in good working condition at all
times for use by the trained persons and stowed adjacent to but outside the
store/plant room. Regular drills are conducted to train personnel on the proper
use of the breathing apparatus and protective clothing.
12.4.1
This project concerns a major reprovisioning
of the Sha Tin WTW South Works. During the reprovisioning, since parts of the
plant (i.e. the South Works) will have to be temporarily shut down, the water
throughput will decrease and accordingly, chlorine storage and usage levels will
be significantly reduced. Following completion of the reprovisioning water
throughput will return to 1,227 Mld.
12.4.2
The reprovisioning will involve introduction
of new treatment technologies for the South Works and construction of a number
of new facilities. Details are shown in Figure 12.5.
12.4.3
The current chlorine dosage levels are at or
below 2 mg/l. This will be reduced to 1.7 mg/l following the reprovisioning,
due to the introduction of new treatment technologies. This will result in a
permanent reduction in chlorine usage once reprovisioning is completed. Therefore,
it is worth highlighting that this is an improvement project that will lead to
a reduction in risks associated with the Sha Tin WTW. The operational parameters
of the WTW during and after the reprovisioning are presented in Table 12.1.
12.4.4
Before the start of the construction of
reprovisioning of South Works, 31 excess storage castors for storage of
chlorine drums will be carefully selected and to be removed from the
chlorination house (i.e. reduced from 221 castors to 190 castors before the
start of the construction works).
12.4.5
During and after the reprovisioning, the
existing on-site chlorine delivery route along the east & south & west
boundaries of the site will be replaced by the route along the east & north
& west site boundaries. Details are shown in Figure 12.6. The purpose of this is to separate the
existing North Works and the construction activities in order to maintain
continuous operation, maintenance and security of the existing North Works and
in particular to separate chlorine deliveries from the construction activities.
12.4.6
Details of the construction programme are provided
in Appendix
2.1. In general, the existing on-site chlorine delivery
route along the east & south & west boundaries of the site will be used
during Stage 1 of the reprovisioning and that along the east & north &
west boundaries of the site as shown in Figure 12.6 will be used for Stage 2; the intent being
to segregate chlorine delivery trucks from construction activities. Description
and locations of different construction activities are also provided in Appendix
12.8.
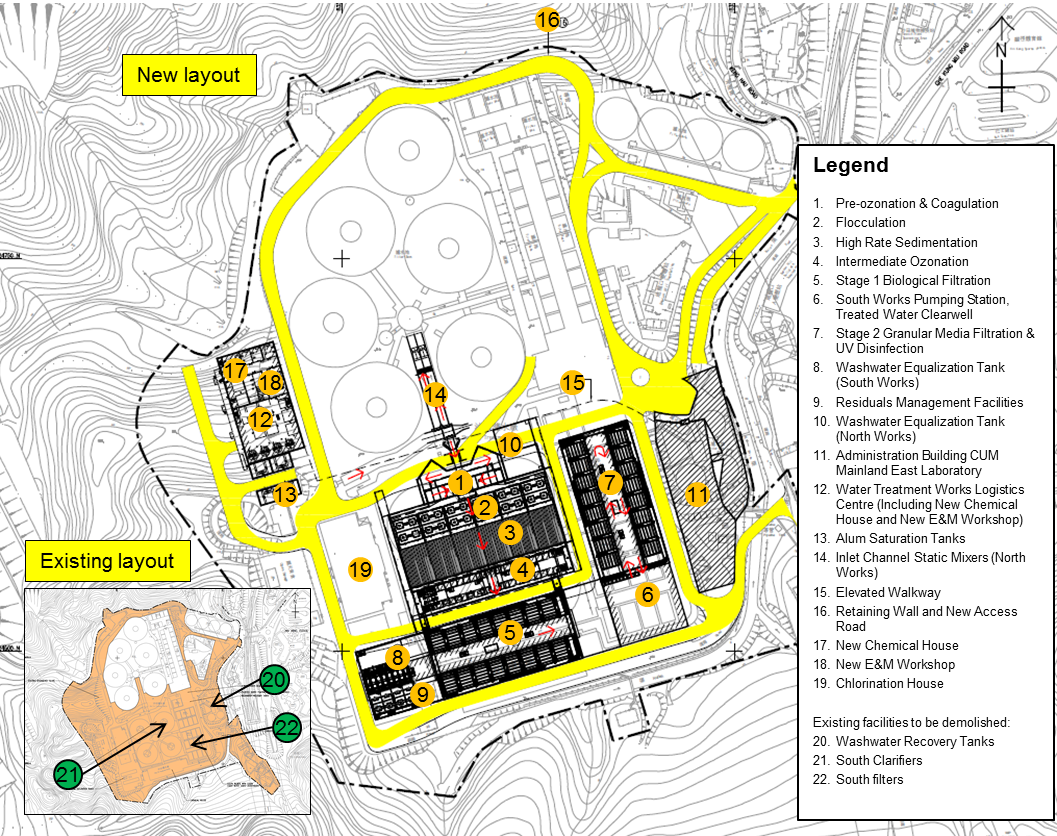
Figure 12.5 New Treatment
Facilities and Sha Tin WTW Layout following the Reprovisioning of South Works
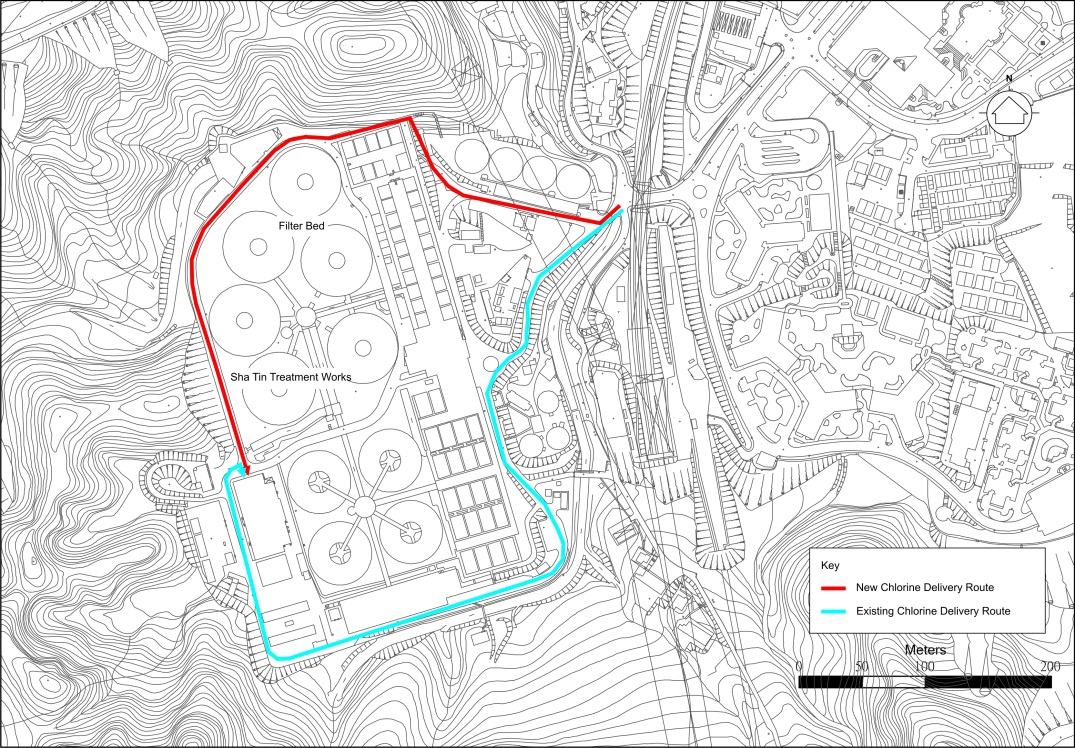
Figure
12.6 Existing Chlorine Delivery Route at Sha Tin WTW and the New
Route to be used during and after the Reprovisioning of South Works
12.5.1
Based on the South Works reprovisioning
schedule, two scenarios have been considered in the QRA. These are the Construction
Phase of this project and the Operational Phase following the completion of the
reprovisioning. The main assumptions used for each scenario, based on WTW
operational data provided by WSD, are listed in Table 12.1. Population data for the construction and
operational phase scenarios are projected to years 2016 and 2031, respectively.
Details of the population data for each assessment year are provided in Section 12.8 and Table 12.3.
12.5.2
The WTW operating data for these two
scenarios are consistent with Scenarios 2 and 4 of ERM (2011a).
Table 12.1 Scenarios
Considered in the QRA
|
Scenario
|
Assessment year
|
Maximum Chlorine Storage at WTW (tonnes)
|
Chlorine Storage Time Distribution Assumed in the QRA
(tonnes, % of time)
|
Average Chlorine Usage at WTW (tonnes per
year)
|
|
Scenario
1: Construction Phase
|
2016
|
158
|
158 (100%)
|
642
|
|
Scenario
2:
Operational
Phase
|
2031
|
190
|
190 (20%)
150 (80%)
|
761
|
2001 QRA
12.6.1
In 1997, the Water Supplies Department (WSD)
commissioned ERM to carry out a Reassessment
of Chlorine Hazards for Eight Existing Water Treatment Works. The WTWs
considered were:
·
Au Tau WTW;
·
Pak Kong WTW;
·
Sha Tin WTW;
·
Sheung Shui WTW;
·
Tai Po Tau WTW;
·
Tsuen Wan WTW;
·
Tuen Mun WTW; and
·
Yau Kom Tau WTW.
12.6.2
The approved methodology for the above QRA
studies is detailed in the 8 WTW Study Methodology
Report (ERM, 1997).
12.6.3
Results for the Sha Tin WTW (ERM, 2001),
illustrated here in Figure 12.7 showed that:
·
The risk was in the ‘ALARP
region’; and
·
The maximum number N of fatalities was
assessed at over 900.
Figure
12.7 FN curve from the 2001 Sha Tin WTW Hazard
Assessment (ERM, 2001)
2011 QRA for Hin Keng Station and SCL Alignment
12.6.4
In 2008–2011, ERM conducted a QRA study on
behalf of MTRCL to assess the chlorine hazards related to the Sha Tin WTW
operations in connection with the proposed Sha Tin to Central Link (SCL)
project. This study assessed the impact of increased population from SCL work
areas, future SCL alignment and the proposed Hin Keng Station that will be
located within the Sha Tin WTW Consultation Zone (ERM, 2011a). The SCL QRA also
took into account the South Works reprovisioning that will proceed concurrently
with the SCL construction and the modified WTW operational parameters (chlorine
usage and storage quantities) during the reprovisioning and after its
completion.
12.6.5
The present QRA for the on-site transport,
storage and handling of chlorine at Sha Tin WTW follows the methodology of both
previous studies.
12.7.1
For the sake of consistency, this study uses
the same meteorological data set as was used in the previous QRAs (ERM 2001, 2011a),
i.e. the data recorded at the Sha Tin weather station in the year 1996 by the
Hong Kong Observatory.
12.7.2
The weather data have been rationalised into
different combinations of wind direction, speed and atmospheric stability
class. The probabilities of occurrence of each combination during day and night
are presented in Table 12.2. The
Pasquill-Gifford stability classes range from A through F. Class A represents
extremely unstable conditions which typically occur under conditions of strong
daytime insolation. Class F on the other hand represents stable conditions
which typically arise on clear nights with little wind. Turbulent mixing, which
affects the dispersion of a chlorine cloud, increases through the stability
class range from F to A.
Table 12.2 Meteorological Data for Sha Tin Water Treatment Works
|
|
|
DAY Probability
|
NIGHT Probability
|
|
|
Direction
|
Wind Speed
(m/s):
|
2.3
|
1.5
|
3.5
|
1.5
|
1.5
|
3.5
|
1.5
|
TOTAL
|
|
|
Atmospheric
Stability :
|
B
|
D
|
D
|
F
|
D
|
D
|
F
|
|
|
N
|
|
0.0509
|
0.0380
|
0.0120
|
0.0153
|
0.0224
|
0.0045
|
0.0761
|
0.2191
|
|
NE
|
|
0.0458
|
0.0228
|
0.0253
|
0.0149
|
0.0107
|
0.0239
|
0.0529
|
0.1963
|
|
E
|
|
0.0450
|
0.0200
|
0.0299
|
0.0115
|
0.0116
|
0.0173
|
0.0774
|
0.2126
|
|
SE
|
|
0.0146
|
0.0065
|
0.0059
|
0.0027
|
0.0023
|
0.0029
|
0.0233
|
0.0581
|
|
S
|
|
0.0171
|
0.0106
|
0.0125
|
0.0042
|
0.0029
|
0.0050
|
0.0346
|
0.0868
|
|
SW
|
|
0.0247
|
0.0113
|
0.0429
|
0.0050
|
0.0034
|
0.0103
|
0.0528
|
0.1504
|
|
W
|
|
0.0023
|
0.0020
|
0.0004
|
0.0017
|
0.0018
|
0.0000
|
0.0139
|
0.0220
|
|
NW
|
|
0.0038
|
0.0048
|
0.0059
|
0.0039
|
0.0036
|
0.0032
|
0.0294
|
0.0546
|
|
Total
|
|
0.2042
|
0.1160
|
0.1346
|
0.0590
|
0.0587
|
0.0671
|
0.3604
|
1.0000
|
12.8
Population Data
General
Approach
12.8.1
The approach to the population data for this
study is the same as in the QRA for Sha Tin WTW for the SCL Project (ERM, 2011a).
The population data from the 2011 study were updated where applicable based on
more recent information.
12.8.2
The population data used in this study is
summarised in Table 12.3. A
definition of the time periods included in Table 12.3 is
provided in Appendix
12.6.
Sources
of Information
12.8.3
Population data for the South Works reprovisioning
workforce and Sha Tin WTW staff quarters were provided by WSD.
12.8.4
Railway-specific data such as SCL train and
station loadings for the Operational Phase, population of the Tai Wai MTR
Depot, number and locations of the SCL construction workers etc. were obtained
from MTRCL.
12.8.5
The Planning Department provided the GIS
coverage of Tertiary Planning Units (TPUs) further divided into Street Blocks
(SB). Detailed TPU-based population data and their projections to the future
are publicly available from the Plan-D website.
12.8.6
The Territory Population and Employment Data
Matrix (TPEDM) population projections for different Planning Data Zones (PDZ)
were also obtained from PlanD. These were used to obtain population projections
up to the year 2031 and the average household size for different areas.
12.8.7
Hong Kong conducts a population census once
every ten years and a by-census in the middle of the intercensal period. By-census
differs from a full census in not having a complete headcount but enquiring on
the detailed characteristics of the population on the basis of a large sample.
Census data is presented on Centamap website ([1]) for most
building groups and the population is further updated based on Territory
Planning Unit (TPU) Large Street Block (SB) population from 2011 Census.
12.8.8
If the population data was not directly
available, data on the number of floors and units of the residential
developments were obtained from the Centamap website and, together with the
TPEDM data on average household size, were used to estimate the current
population of these developments.
12.8.9
The Centamap website was also used to verify
the locations and/or further existence of the population units assumed in the
previous assessments and to check for any new developments that may have been recently
constructed.
12.8.10
Daily attendance data at Hin Tin Swimming
Pool and the highest and average daily usage data for the Hin Tin Playground
were obtained from Leisure and Cultural Services Department (LCSD).
12.8.11
Most of the road populations were estimated
based on the Annual Average Daily Traffic (AADT) data from the Transport
Department’s (TD) Annual Traffic Census 2013 () which is the
latest available data.
12.8.12
Recent data for the Tsing Sha Highway and
Lion Rock Tunnel, such as Staff in administration building, toll plaza, etc.
were obtained from TD in 2014 ().
12.8.13
A site survey covering a large part of the
area within the 1-km CZ considered in the study was conducted by ERM personnel
on 28 April 2009. An additional site survey of the areas to be affected by the
SCL project site was conducted in July 2011. Another site survey was conducted
in Jan 2014 to further update the population.
12.8.14
Although site surveys indicated no population
at the Beacon Hill North Offtake Station, Towngas has since advised that a
number of their staff are located on this site from time to time. This
population has therefore been included in this assessment taking into
consideration both the site surveys and the Towngas information. However, this
has no significant impact on the results.
12.8.15
For most kindergartens, primary and secondary
schools and colleges, data from the Education Bureau website () was used.
This included the number of classrooms and the capacity of each classroom.
12.8.16
For cases where population data were not
available from publicly available data sources, the required information was
obtained by telephone interviews and e-mail inquiries.
12.8.17
The percentages of the maximum population
present (occupancy) at different times of the day and the indoor/outdoor
fractions for the total unit population are consistent with those used in the
previous QRA (ERM, 2011a).
Population
Units
12.8.18
The population units are defined for the QRA
purposes in the form of GIS-based polygons, points and lines. Outside the WTW
site the units used in this study are the same as in the previous QRA (ERM, 2011a)
however more detailed population units for different South Works reprovisioning
work areas are considered.
12.8.19
The full list of population units considered
is provided in Table 12.3 and their
locations shown in Figure 12.8 and Figure 12.9. The
population units within the 1-km Consultation Zone of the WTW are referenced
with letters while those outside the CZ are denoted by numbers.
South
Works Reprovisioning Work Areas and Workforce Population Data
12.8.20
Based on information provided by WSD, eight population
polygons, T1 to T8 (see Figure 12.8, Figure 12.9 and Figure 12.10) have
been defined for different project work areas at the WTW. Details on the
construction activities within each of these areas are provided in Appendix
12.8.
12.8.21
Since a different number of workers will be
needed for each construction activity and the activities at different site
areas will occur at different times, the total number of workers on site will
be changing and there will be no period when the workforce will be present
simultaneously in all locations. A conservative case was therefore selected
with a relatively high total population of 198 construction workers and
resident site staff (RSS) for supervision of the construction activities
simultaneously present at areas T1, T2 and T5. The resulting total numbers of
people at each site for this representative period are shown in Table 12.3. These
198 construction and RSS workers are conservatively assumed to be present year
round.
12.8.22
It is assumed that 10% of the 85 construction
workers and 50% of the 113 RSS will be located indoors. Thus, at each site, the
average proportion of people indoors can be estimated at (8.5 + 56.5)/(85 + 113)
= 33%.
12.8.23
It may be noted that the spatial distribution
of the reprovisioning workers and number of workers are different from those
assumed in the SCL QRA (ERM, 2011a). These have been revised based on updated
information provided by WSD. The SCL QRA assumed a uniform density of workers
over the southern works area whereas a more detailed spatial distribution is
now available as adopted in the current assessment. The estimated number of
workers has increased based on the latest project schedule. These changes,
however, do not have a significant impact on the analysis.
12.8.24
The WTW has a reception facility for visitors
as an integrated part of the WTW. The
visitor reception facility is located within the boundary fence of the WTW,
which walk-in visitors are not allowed.
Only visitors permitted by WSD are allowed to enter into the boundary of
the WTW. In addition, visitors will be
briefed on the safety and emergency procedures in case of fire and chlorine
leak. Visitors will also be escorted by
WSD staff when they are within the WTW.
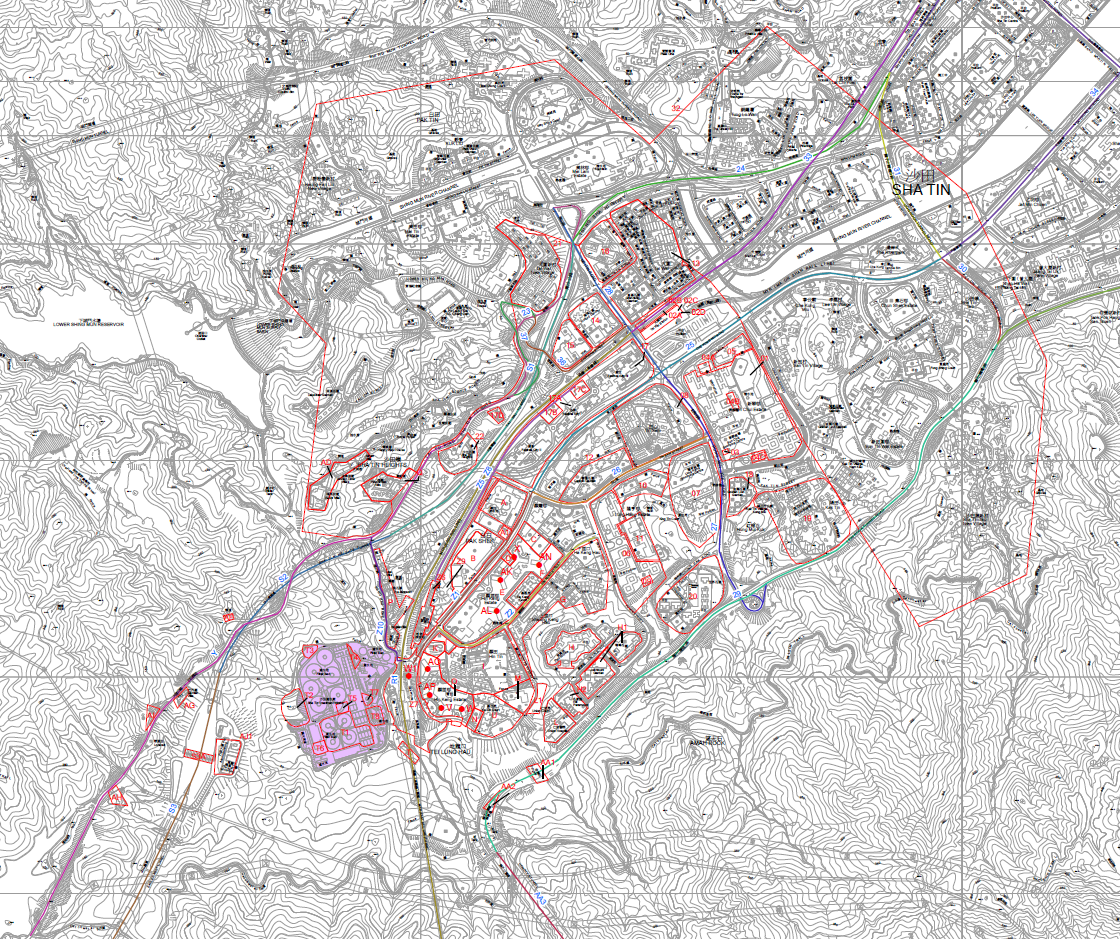
Figure 12.8 Population Units used in QRA (figure 1 of 2)
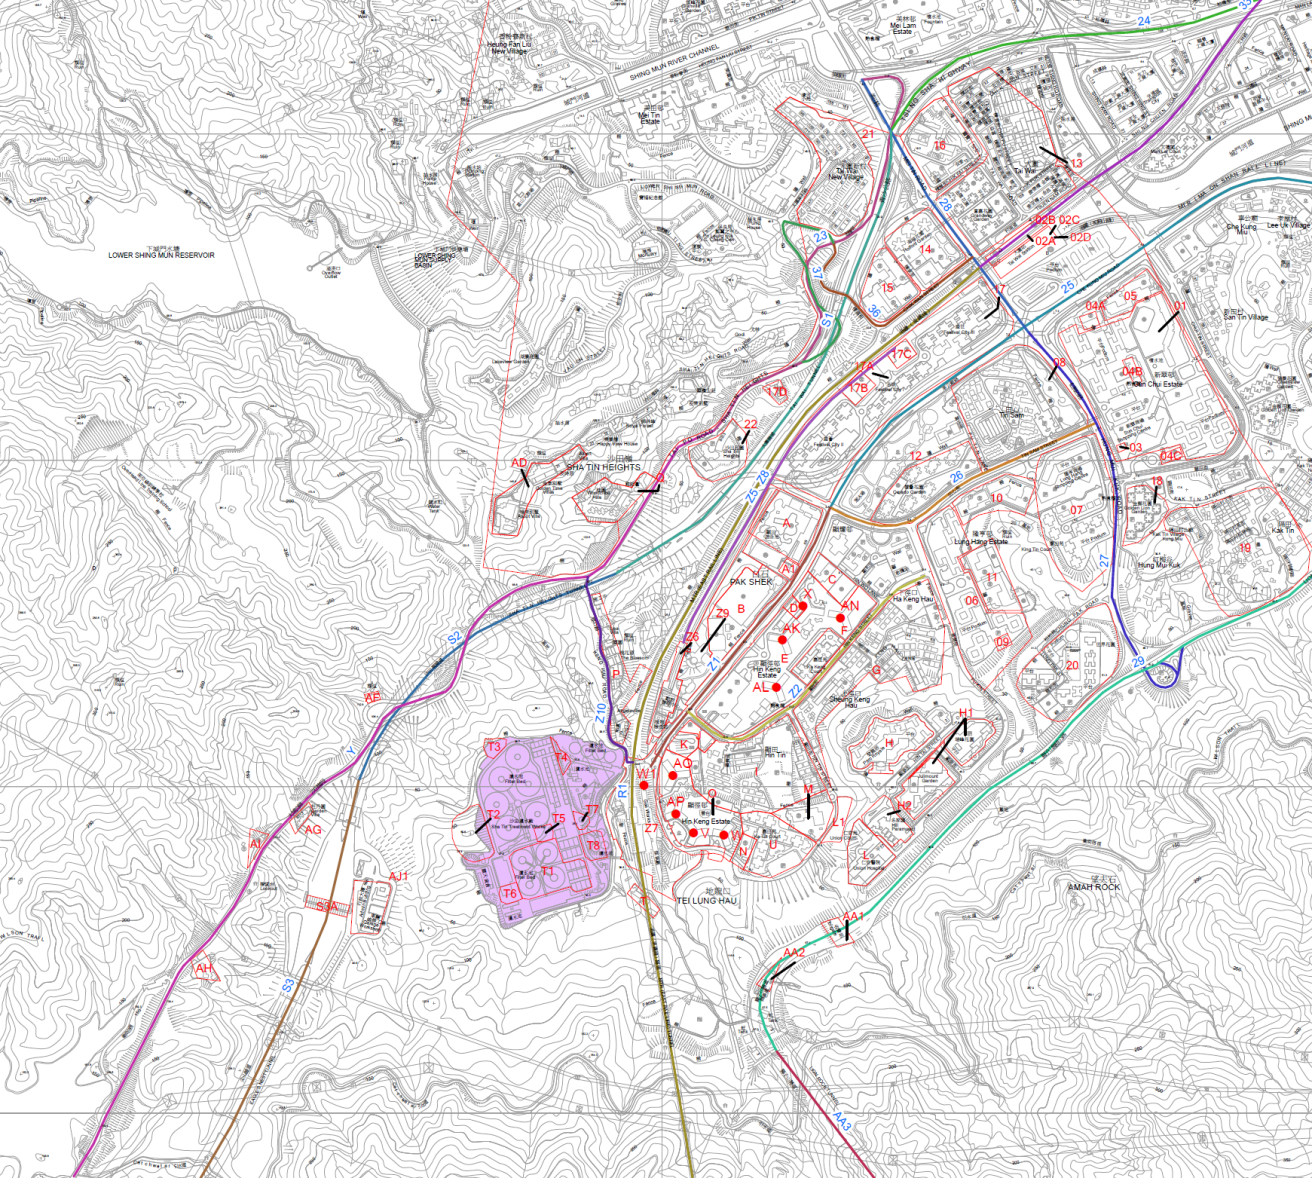
Figure 12.9 Population Units used in QRA (figure 2 of 2)
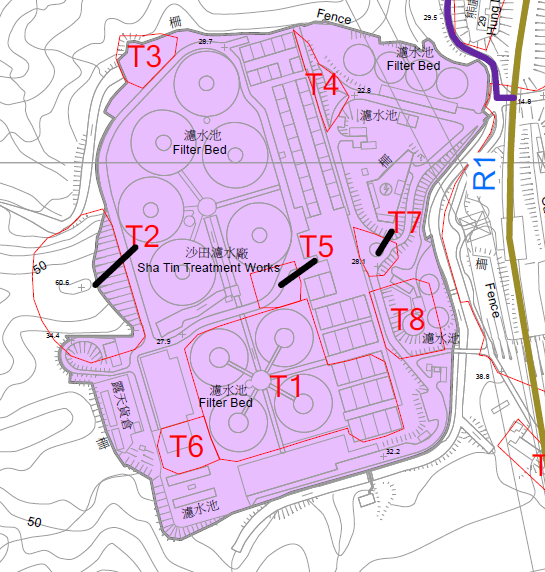
Figure 12.10 Population Units for the Reprovisioning Works
Population Forecast
12.8.25
The residential population levels determined as
described above have been scaled up or down according to the population trends
determined from the area-specific TPEDM PDZ-based projections. For construction
phase, the maximum population between 2011 and 2016 will be used. For
operational phase, the maximum population between 2011, 2016 and 2031 will be
used. Relevant scaling factors are listed in Appendix
12.6.
12.8.26
The methodology of this scaling is consistent
with that used in the SCL Project QRA (ERM 2011a) except population is update
based on the latest available data.
12.8.27
As no information on the future traffic
trends was available for the road population and the examination of past
traffic data shows no significant upward traffic trend over recent years, the
road population numbers derived from the 2013 Traffic Census were not further
projected to the future years.
Table 12.3 Detailed Population Data
|
Ref.
(see
Fig
12.8)
|
Name
|
Base data/ data used previously
|
Const.
Phase
(2016)
|
Oper. Phase
(2031)
|
Occupancy
|
Fraction
Indoors
|
Vulner-ability Factor
|
No.
of Floors
|
Remarks
|
|
Night
|
Jammed
Peak
|
Peak
Hour
|
Weekend
Day
|
Working
Day
|
|
01
|
Sun Chui Estate
|
18937
|
18937
|
20673
|
100%
|
50%
|
50%
|
70%
|
50%
|
99%
|
1
|
35
|
Value from
Centamap (updated based on 2011 Population Census Street Block data), scaled
according to 2011 based TPEDM projection.
|
|
02A
|
East Rail Tai Wai Station
|
2000
|
2000
|
2083
|
20%
|
100%
|
100%
|
50%
|
50%
|
0%
|
1
|
1
|
Based on MTRCL
data. SCL is under construction under Year 2014 and will operate at Year 2018
(1).
|
|
02B
|
East Rail Train at Tai Wai Station
|
1304
|
1304
|
1464
|
20%
|
100%
|
100%
|
50%
|
50%
|
100%
|
1
|
1
|
Based on MTRCL
data. SCL is under construction under Year 2014 and will operate at Year 2018
(1).
|
|
02C
|
SCL Tai Wai Station
|
500
|
500
|
1250
|
20%
|
100%
|
100%
|
50%
|
50%
|
100%
|
1
|
1
|
Based on MTRCL
data. SCL is under construction under Year 2014 and will operate at Year 2018
(1).
|
|
02D
|
Development atop Tai Wai
Station
|
0
|
0
|
6752
|
100%
|
50%
|
50%
|
70%
|
50%
|
99%
|
1
|
39
|
Value from
Planning Department. The residential and commercial development is now
pending for approval.
Population
intake in Year 2019 tentatively.
No. of
building = 8 and no. of floor = 39 - 49 (conservatively assumed 39)
|
|
03
|
T.W.G.Hs. Mok Wong Fung Yee Home for
the Elderly, G/F floor Sun Chui Estate
|
68
|
121
|
121
|
100%
|
100%
|
100%
|
100%
|
100%
|
95%
|
3.3
|
1
|
Base value
from: http://www.swd.gov.hk/ (1).
75 bed space
and 46 staff were considered in 2016 & 2031.
|
|
04A
|
Cheong Wong Wai Primary School
|
315
|
418
|
418
|
0%
|
50%
|
50%
|
0%
|
100%
|
95%
|
3.3
|
5
|
School
capacity from: http://www.edb.gov.hk/ was taken as base value. (1) Assume
30 students per class. 13 classes, 28 staff. Numbers of class and staff
numbers from http://www.chsc.hk/ were considered in 2016 & 2031.Time
factor of 0.67 applied in modelling.
|
|
04B
|
Free Methodist Bradbury Chun Lei
Primary School
|
1087
|
829
|
829
|
0%
|
50%
|
50%
|
0%
|
100%
|
95%
|
3.3
|
5
|
School
capacity from: http://www.edb.gov.hk/ was taken as base value. (1).
Assume 30 students per class. 26 classes, 49 staff. Numbers of class and
staff numbers from http://www.chsc.hk/ were considered in 2016 & 2031. Time factor of 0.67 applied in modelling.
|
|
04C
|
KCBC Hay Nien (Yan Ping) Primary
School
|
780
|
385
|
385
|
0%
|
50%
|
50%
|
0%
|
100%
|
95%
|
3.3
|
5
|
Base school capacity
value was referenced: from 2001 QRA. (1)
Assume 30 students per class. 12 classes, 25 staff. Numbers of class and
staff numbers from http://www.chsc.hk/ were considered in 2016 & 2031. Time
factor of 0.67 applied in the modelling.
|
|
05
|
Ng Yuk Secondary School and TWGHs
Wong Fut Nam College
|
2386
|
2515
|
2515
|
0%
|
50%
|
50%
|
0%
|
100%
|
95%
|
1
|
5
|
Base school
capacity value was referenced: http://www.edb.gov.hk/. (1)
Shatin Tsung
Tsin Secondary School moved to ref. 17B, TWGHs Wong Fut Nam College
temporarily using the site as a decanting site. Information from
http://www.chsc.hk/. Assume 45 students per class for Form 1-5 and 30
students per class for Form 6. 46 classes of Form 1-5, 10 classes of Form 6
and 145 staff. Numbers of class and staff numbers from http://www.chsc.hk/.
Numbers are combined for the 2 schools were considered in 2016 & 2031. Time
factor of 0.67 applied in modelling.
|
|
06
|
Lung Hang Estate
|
14020
|
18288
|
18288
|
100%
|
50%
|
50%
|
70%
|
50%
|
99%
|
1
|
12
|
Value from
Centamap (updated based on 2011 Population Census Street Block data), scaled
according to 2011 based TPEDM projection.
|
|
07
|
King Tin Court
|
3836
|
5004
|
5004
|
100%
|
50%
|
50%
|
70%
|
50%
|
99%
|
1
|
35
|
Value from
Centamap (updated based on 2011 Population Census Street Block data)., scaled
according to 2011 based TPEDM projection.
|
|
08
|
Tin Sam Village
|
1537
|
2005
|
2005
|
100%
|
50%
|
50%
|
70%
|
50%
|
99%
|
1
|
3
|
Value from
Centamap (updated based on 2011 Population Census Street Block data), scaled
according to 2011 based TPEDM projection.
|
|
09
|
Salvation Army - Hong Kong and Macau
Command Lung Hang Residence for Senior Citizens (The) G/F Lung Hang Estate
|
134
|
134
|
134
|
100%
|
100%
|
100%
|
100%
|
100%
|
95%
|
3.3
|
1
|
Value from ERM
(2001) report (1).
|
|
10.1
|
PLK C. H. Wong Primary School
|
1215
|
860
|
860
|
0%
|
50%
|
50%
|
0%
|
100%
|
95%
|
3.3
|
6
|
Base school
capacity value was referenced: http://www.edb.gov.hk/ (1). Assume
30 students per class. 27 classes, 50 staff. Numbers of class and staff
numbers from http://www.chsc.hk/ were considered in 2016 & 2031. Time
factor of 0.67 applied in modelling.
|
|
10.2
|
PLK C W Chu College
|
1035
|
1114
|
1114
|
0%
|
50%
|
50%
|
0%
|
100%
|
95%
|
1
|
5
|
Base school
capacity value was referenced: http://www.edb.gov.hk/ (1).. Assume
45 students per class for Form 1-5 and 30 students per class for Form 6. 20
classes of Form 1-5, 5 classes of Form 6 and 64 staff. Numbers of class and
staff numbers from http://www.chsc.hk/ were considered in 2016 & 2031. Time
factor of 0.67 applied in modelling.
|
|
11
|
Lok Sin Tong Young Ko Hsiao Lin
Secondary School and Pok Oi Hospital Chan Kai Memorial College
|
2428
|
2413
|
2413
|
0%
|
50%
|
50%
|
0%
|
100%
|
95%
|
1
|
5
|
Base school
capacity value was referenced: http://www.edb.gov.hk/ (1). Assume
45 students per class for Form 1-5 and 30 students per class for Form 6. 44
classes of Form 1-5, 10 classes of Form 6 and 133 staff. Numbers of class and
staff numbers from http://www.chsc.hk/ were considered in 2016 & 2031.
Numbers are combined for the 2 schools. Time factor of 0.67 applied in modelling
|
|
12
|
Carado Garden
|
6252
|
8155
|
8155
|
100%
|
50%
|
50%
|
70%
|
50%
|
99%
|
1
|
20
|
Value from
Centamap (updated based on 2011 Population Census Street Block data), scaled
according to 2011 based TPEDM projection.
|
|
13
|
Misc. residential buildings
|
7786
|
7786
|
7786
|
100%
|
50%
|
50%
|
70%
|
50%
|
99%
|
1
|
10
|
Value from
Centamap (updated based on 2011 Population Census Street Block data), scaled
according to 2011 based TPEDM projection.
|
|
14
|
Holford Garden
|
2184
|
2184
|
2184
|
100%
|
50%
|
50%
|
70%
|
50%
|
99%
|
1
|
25
|
Value from
Centamap (updated based on 2011 Population Census Street Block data), scaled
according to 2011 based TPEDM projection.
|
|
15
|
Christian Alliance Cheng Wing Gee
College and GCC&ITKD Lau Pak Lok Secondary School
|
2324
|
2277
|
2277
|
0%
|
50%
|
50%
|
0%
|
100%
|
95%
|
1
|
5
|
Base school
capacity value was referenced: http://www.edb.gov.hk/ (1). Assume
45 students per class for Form 1-5 and 30 students per class for Form 6. 42
classes of Form 1-5, 9 classes of Form 6 and 117 staff. Numbers of class and
staff numbers from http://www.chsc.hk/ were considered in 2016 & 2031.
Numbers are combined for the 2 schools. Time factor of 0.67 applied in modelling.
|
|
16
|
Shatin Public School
|
220
|
523
|
523
|
0%
|
50%
|
50%
|
0%
|
100%
|
95%
|
3.3
|
1
|
Base school
capacity value was referenced: http://www.edb.gov.hk/ (1). Special School for slightly mentally
challenged students. Both primary and secondary students. Assume 30 students
per primary class. Assume 45 students per class for Form 1-5 and 30 students
per class for Form 6. 7 classes of primary, 5 classes of Form 1-5, 1 class of
Form 6 and 58 staff. Numbers of class and staff numbers from
http://www.chsc.hk/ were considered in 2016 & 2031. Time factor of 0.67
applied in modelling.
|
|
17
|
Tai Wai MTR Depot
|
47
|
47
|
47
|
44%
|
50%
|
50%
|
55%
|
100%
|
80%
|
1
|
1
|
Following to
information provided by MTRCL (QRA 2011). (1).
|
|
17A
|
Festival City Development being constructed in Tai Wai Depot area
|
6107
|
11932
|
11932
|
100%
|
50%
|
50%
|
70%
|
50%
|
99%
|
1
|
40
|
Values from
Planning Department.
|
|
17B
|
Shatin Tsung Tsin Secondary School
|
1343
|
1343
|
1343
|
0%
|
50%
|
50%
|
0%
|
100%
|
95%
|
1
|
8
|
Assume 45
students per class for Form 1-5 and 30 students per class for Form 6. 25
classes of Form 1-5, 5 classes of Form 6 and 68 staff. Numbers of class and
staff numbers from http://www.chsc.hk/. Time factor of 0.67 applied in
modelling. Confirmed by site survey Jan 2014.
|
|
17C
|
Immaculate Heart of Mary School
|
860
|
860
|
860
|
0%
|
50%
|
50%
|
0%
|
100%
|
95%
|
3.3
|
8
|
Assume 30
students per class. 27 classes, 50 staff. Numbers of class and staff numbers
from http://www.chsc.hk/. Time factor of 0.67 applied in modelling. Confirmed
by site survey Jan 2014.
|
|
17D
|
Caltex Petrol Station
|
10
|
10
|
10
|
50%
|
100%
|
100%
|
100%
|
100%
|
0%
|
1
|
-
|
Confirmed by
site survey Jan 2014.
Assume no. of
population is 10 conservatively.
|
|
18
|
Golden Lion Garden –
Phase II
|
3664
|
3664
|
4000
|
100%
|
50%
|
50%
|
70%
|
50%
|
99%
|
1
|
35
|
Value from
Centamap (updated based on 2011 Population Census Street Block data), scaled
according to 2011 based TPEDM projection.
|
|
19
|
Kak Tin Village
|
1013
|
1013
|
1106
|
100%
|
50%
|
50%
|
70%
|
50%
|
99%
|
1
|
1
|
Number of
houses extracted from Centamap, scaled according to PDZ projection. Note that
in the 2001 Report, unit 21 populations was listed together with unit 19,
scaled according to 2011 TPEDM based projection.
|
|
20
|
Worldwide Garden
|
1268
|
1654
|
1654
|
100%
|
50%
|
50%
|
70%
|
50%
|
99%
|
1
|
35
|
Value from
Centamap (updated based on 2011 Population Census Street Block data), scaled
according to 2011 based TPEDM projection.
|
|
21
|
Tai Wai
Village
|
1350
|
1350
|
1350
|
100%
|
50%
|
50%
|
70%
|
50%
|
99%
|
1
|
3
|
Value from
Centamap (updated based on 2011 Population Census Street Block data), scaled
according to 2011 based TPEDM projection.
|
|
22
|
Sha Tin Heights
|
279
|
290
|
290
|
100%
|
50%
|
50%
|
70%
|
50%
|
99%
|
1
|
5
|
Based on number of units
extracted from Centamap and PDZ household size (3.46), scaled according to
2011-based TPEDM projection.
|
|
23
|
Tai Po Road (1 km from WTW to Mei Tin
Rd)
|
724
|
724
|
724
|
2%
|
100%
|
33%
|
16%
|
18%
|
0%
|
1
|
-
|
Traffic data
from 2013 Annual Traffic Census were considered in 2016 & 2031; length
0.8 km. Assume one direction jammed and the other free-flow at Jammed Peak.
|
|
24
|
Tai Po Road (Mei Tin Rd to 3 km from
WTW)
|
836
|
836
|
836
|
1%
|
100%
|
16%
|
8%
|
9%
|
0%
|
1
|
-
|
Traffic data
from 2013 Annual Traffic Census were considered in 2016 & 2031; length
1.4 km. Assume one direction jammed and the other free-flow at Jammed Peak.
|
|
25
|
Che Kung Miu Road (Lion Rock Tunnel
Rd to 1 km from WTW)
|
322
|
322
|
322
|
5%
|
100%
|
100%
|
50%
|
55%
|
0%
|
1
|
-
|
Traffic data
from 2013 Annual Traffic Census were considered in 2016 & 2031; length
1.8 km.
|
|
26
|
Tin Sam Street
|
107
|
107
|
107
|
5%
|
100%
|
100%
|
50%
|
55%
|
0%
|
1
|
-
|
Traffic data
from 2013 Annual Traffic Census were considered in 2016 & 2031; length
0.7 km.
|
|
27
|
Hung Mui Kuk Road
|
208
|
208
|
208
|
5%
|
100%
|
100%
|
50%
|
55%
|
0%
|
1
|
-
|
Traffic data
from 2013 Annual Traffic Census were considered in 2016 & 2031; length
0.8 km.
|
|
28
|
Mei Tin Road
|
203
|
203
|
203
|
5%
|
100%
|
100%
|
50%
|
55%
|
0%
|
1
|
-
|
Traffic data
from 2013 Annual Traffic Census were considered in 2016 & 2031; length
0.7 km.
|
|
29
|
Lion Rock Tunnel Road – Sha
Tin Rd to Lion Rock Tunnel
|
2471
|
2471
|
2471
|
4%
|
100%
|
84%
|
42%
|
46%
|
0%
|
1
|
-
|
Traffic data
from 2013 Annual Traffic Census were considered in 2016 & 2031. Road
length ~2.6 km; Assumed one direction jammed and the other free-flow at
Jammed Peak.
|
|
30
|
Lion Rock Tunnel Road – Che
Kung Miu Rd to Sha Tin Rd
|
39
|
39
|
39
|
5%
|
100%
|
100%
|
50%
|
55%
|
0%
|
1
|
-
|
Traffic data
from 2013 Annual Traffic Census were considered in 2016 & 2031; length
0.4 km.
|
|
31
|
Lion Rock Tunnel Road – Tai
Po Rd to Che Kung Miu Rd
|
112
|
112
|
112
|
5%
|
100%
|
100%
|
50%
|
55%
|
0%
|
1
|
-
|
Traffic data
from 2013 Annual Traffic Census were considered in 2016 & 2031; length
0.6 km.
|
|
32
|
Populated area 2–3km
northeast of Sha Tin WTW
|
78044
|
84436
|
84436
|
100%
|
50%
|
50%
|
70%
|
50%
|
99%
|
1
|
20
|
Value from
Centamap (updated based on 2011 Population Census Street Block data), scaled
according to 2011 based TPEDM projection.
|
|
33
|
East Rail
Train near Shatin WTW (Outside 1-km CZ)
|
718
|
718
|
806
|
20%
|
100%
|
100%
|
50%
|
50%
|
100%
|
1
|
1
|
Following to
the information provided by MTRCL (QRA 2011). Length = 1.5 km
SCL is under construction under Year 2014 and will operate at Year 2018.
|
|
34
|
Sha Tin Rural
Commetee Road
|
N/A
|
N/A
|
N/A
|
N/A
|
N/A
|
N/A
|
N/A
|
N/A
|
N/A
|
N/A
|
N/A
|
Outside of
consideration 2-km Zone
|
|
35
|
Shatin Wai
Road to Sha Tin Road
|
N/A
|
N/A
|
N/A
|
N/A
|
N/A
|
N/A
|
N/A
|
N/A
|
N/A
|
N/A
|
N/A
|
Outside of
consideration 2-km Zone
|
|
36
|
Chik Wan
Street
|
217
|
217
|
217
|
2%
|
100%
|
33%
|
16%
|
18%
|
0%
|
1
|
0
|
Assume
population 30% of Tai Po Rd (Ref. 23)
|
|
37
|
Lower Shing
Mun Road
|
217
|
217
|
217
|
2%
|
100%
|
33%
|
16%
|
18%
|
0%
|
1
|
0
|
Assume
population 30% of Tai Po Rd (Ref. 23)
|
|
A
|
Hin Tin
Swimming Pool
|
300
|
300
|
300
|
0%
|
50%
|
50%
|
100%
|
50%
|
30%
|
1
|
-
|
Based on the
average daily usage data provided by LCSD and an interview with the pool
staff, assuming each user would spend about 1.5 hours at the pool. 50% of
maximum occupancy assumed. *Population for summer is 300. Population for rest
of the year is 123. 30% of population is indoors in summer. 50% is indoors
for rest of the year (1). The population data is verified in 2014 .
|
|
A1
|
Auxiliary
Medical Service NTE Regional Office
|
10
|
10
|
10
|
0%
|
100%
|
100%
|
0%
|
100%
|
95%
|
1
|
2
|
2 storeys
office, confirmed with observation during site survey Jan 2014. Assume no. of
staff: 10 conservatively.
|
|
B1
|
Hin Tin Playground
|
133
|
0
|
128
|
0%
|
50%
|
50%
|
100%
|
50%
|
0%
|
1
|
-
|
Based on the
average daily usage data provided by LCSD, assuming each user would spend
about 1.5 hours at the playground. To be converted to the SCL Project works
areas (unit Z9) during the SCL construction phases. Part of the Playground to
be permanently used by the planned SCL Hin Keng Station (1).
|
|
B2
|
Hin Tin tennis court and Football
field
|
87
|
87
|
87
|
0%
|
50%
|
50%
|
100%
|
50%
|
0%
|
1
|
-
|
Based on the
average daily usage data provided by LCSD, assuming each user would spend
about 1.5 hours at the playground(1).
The population
data is verified in 2014.
|
|
C
|
Carmel Alison Lam Primary School
|
1042
|
764
|
764
|
0%
|
50%
|
50%
|
0%
|
100%
|
95%
|
3.3
|
6
|
Base school
capacity value was referenced: http://www.edb.gov.hk/ (1). Assume
30 students per class. 24 classes, 44 staff. Numbers of class and staff
numbers from http://www.chsc.hk/ were considered in 2016 & 2031. Time
factor of 0.67 applied in modelling.
|
|
D
|
Wong Wah San Hostel for the Elderly
|
140
|
0
|
0
|
100%
|
100%
|
100%
|
100%
|
100%
|
95%
|
3.3
|
1
|
Name changed
(from Wong Wah San Hostel for the Elderly to SAGE Mrs. Wong Yee Jar Jat
Memorial Home for the Elderly) and moved to Hin Yeung House (Ref. AK).
This location is
changed purpose of use and moved to Ref. AL (SAGE Mrs. Wong Yee Jar Jat
Memorial Neighbourhood Elderly Centre).
|
|
E
|
Hin Keng Estate North
|
10229
|
10277
|
10277
|
100%
|
50%
|
50%
|
70%
|
50%
|
99%
|
1
|
35
|
Value from
Centamap (updated based on 2011 Population Census Street Block data), scaled
according to 2011 based TPEDM projection.
|
|
F
|
Ka Keng Court
|
1083
|
1089
|
1089
|
100%
|
50%
|
50%
|
70%
|
50%
|
99%
|
1
|
41
|
Value from
Centamap (updated based on 2011 Population Census Street Block data), scaled
according to 2011 based TPEDM projection.
|
|
G
|
Sheung/Ha Keng Hau Village
|
2045
|
2055
|
2055
|
100%
|
50%
|
50%
|
70%
|
50%
|
99%
|
1
|
3
|
Value from
Centamap (updated based on 2011 Population Census Street Block data), scaled
according to 2011 based TPEDM projection.
|
|
H
|
Parc Royale
|
2570
|
2582
|
2582
|
100%
|
50%
|
50%
|
70%
|
50%
|
99%
|
1
|
20
|
Value from
Centamap (updated based on 2011 Population Census Street Block data), scaled
according to 2011 based TPEDM projection.
|
|
H1
|
Julimount Garden
|
693
|
904
|
904
|
100%
|
50%
|
50%
|
70%
|
50%
|
99%
|
1
|
22
|
Value from
Centamap (updated based on 2011 Population Census Street Block data), scaled
according to 2011 based TPEDM projection.
|
|
H2
|
Hill Paramount
|
443
|
578
|
578
|
100%
|
50%
|
50%
|
70%
|
50%
|
99%
|
1
|
27
|
Value from
Centamap (updated based on 2011 Population Census Street Block data), scaled
according to 2011 based TPEDM projection.
|
|
I
|
Hin Tin Village Housing
|
1176
|
1181
|
1181
|
100%
|
50%
|
50%
|
70%
|
50%
|
99%
|
1
|
3
|
Value from
Centamap (updated based on 2011 Population Census Street Block data), scaled
according to 2011 based TPEDM projection.
|
|
J
|
Market Place/Bazaar/Restaurant
|
400
|
400
|
400
|
0%
|
50%
|
50%
|
100%
|
50%
|
90%
|
1
|
4
|
2001 QRA
population numbers increased, portion outdoors and time distribution slightly
modified following the 2009 survey. Shops and sports centre across the street
taken into account. (1) Confirmed to be still existing and
applicable during site survey Jan 2014.
|
|
K
|
Bus Station
|
50
|
50
|
50
|
10%
|
100%
|
100%
|
50%
|
50%
|
0%
|
1
|
1
|
Value from
2001 QRA reduced following the 2009 survey (1). Confirmed to be
still existing and applicable during site survey Jan 2014.
|
|
L
|
Union Hospital and Staff Quarters
|
473
|
473
|
473
|
100%
|
100%
|
100%
|
100%
|
100%
|
99%
|
3.3
|
13
|
Based on ERM
(2001) (1).
|
|
L1
|
Proposed residential HOS development
at Hin Tin St. (construction)
|
200
|
200
|
0
|
0%
|
50%
|
50%
|
0%
|
100%
|
0%
|
1
|
0
|
Based on information from Housing
Authority
|
|
|
HOS development at Hin Tin St.
occupied
|
0
|
0
|
810
|
100%
|
50%
|
50%
|
70%
|
50%
|
99%
|
1
|
40
|
Based on information from Housing
Authority
|
|
M
|
Helen Liang Memorial School
|
1040
|
1070
|
1070
|
0%
|
50%
|
50%
|
0%
|
100%
|
95%
|
1
|
6
|
Base school
capacity value was referenced: http://www.edb.gov.hk/ (1). Assume
45 students per class for Form 1-5 and 30 students per class for Form 6. 20
classes of Form 1-5, 4 classes of Form 6 and 50 staff. Numbers of class and
staff numbers from http://www.chsc.hk/ were considered in 2016 & 2031. Time
factor of 0.67 applied in modelling.
|
|
N
|
CUHK FAA Thomas Cheung Primary School
|
1116
|
606
|
606
|
0%
|
50%
|
50%
|
0%
|
100%
|
95%
|
3.3
|
6
|
Base school
capacity value was referenced: http://www.edb.gov.hk/ (1). Assume
30 students per class. 19 classes, 36 staff. Numbers of class and staff
numbers from http://www.chsc.hk/ were considered in 2016 & 2031. Time
factor of 0.67 applied in modelling.
|
|
O
|
Hin Keng Estate South
|
8985
|
9027
|
9027
|
100%
|
50%
|
50%
|
70%
|
50%
|
99%
|
1
|
35
|
Value from
Centamap (updated based on 2011 Population Census Street Block data), scaled
according to 2011 based TPEDM projection.
|
|
P
|
Residential Area (Keng Hau Road)
|
122
|
129
|
129
|
100%
|
50%
|
50%
|
70%
|
50%
|
99%
|
1
|
3
|
Based on number of units
and PDZ household size (3.3).
|
|
Q
|
K. K. Terrace, Woodcrest Hills
|
171
|
178
|
178
|
100%
|
50%
|
50%
|
70%
|
50%
|
99%
|
1
|
1
|
Based on number of units
extracted from Centamap and PDZ household size (3.46), scaled according to
2011-based TPEDM projection.
|
|
R1
|
East Rail Train near Sha Tin WTW
|
718
|
718
|
806
|
16%
|
100%
|
100%
|
41%
|
41%
|
100%
|
1
|
1
|
Based on MTRCL data.
SCL is under construction in
Year 2014 and will operate at Year 2018. (1).
|
|
S1
|
Tsing Sha Hwy (formerly Route 16:
Northern Section)
|
540
|
559
|
559
|
1%
|
100%
|
17%
|
8%
|
9%
|
0%
|
1
|
-
|
Based on the
traffic data provided by TD. Traffic in stationary on one direction during
Jammed Peak was considered.
|
|
S2
|
Sha Tin Heights Tunnel (formerly
Route 16: Sha Tin Tunnel)
|
1620
|
1676
|
1676
|
1%
|
100%
|
17%
|
8%
|
9%
|
100%
|
1
|
-
|
Based on the
traffic data provided by TD. Traffic in stationary on one direction during
Jammed Peak was considered. Shatin Heights Tunnel is 100% indoor.
|
|
S3
|
Route 8 (formerly Route 16): Toll
Plaza
|
693
|
731
|
731
|
3%
|
100%
|
55%
|
27%
|
34%
|
0%
|
1
|
-
|
Based on the
traffic data provided by TD. Traffic in stationary on one direction during
Jammed Peak was considered. Population in Toll Plaza is separated from Ref.
S3 to S31
|
|
S3A
|
Tsing Sha Highway Toll Plaza
|
10
|
10
|
10
|
50%
|
90%
|
100%
|
100%
|
100%
|
0%
|
1
|
-
|
10 Booths was
observed on site survey Jan 2014 and based on data provided by TD.
|
|
T
|
Staff Quarters of Sha Tin WTW
|
10
|
10
|
10
|
100%
|
50%
|
50%
|
70%
|
50%
|
99%
|
1
|
1
|
Based on WSD data
(1).
|
|
T1
|
WTW reprovisioning workers, South
Works
|
0
|
93
|
0
|
0%
|
50%
|
50%
|
0%
|
100%
|
33%
|
1
|
-
|
Based on WSD
data (1).
|
|
T2
|
WTW reprovisioning workers, Chemical
House
|
0
|
70
|
0
|
0%
|
50%
|
50%
|
0%
|
100%
|
33%
|
1
|
-
|
Based on WSD
data (1).
|
|
T5
|
WTW reprovisioning workers, Washwater
Recovery Tank
|
0
|
35
|
0
|
0%
|
50%
|
50%
|
0%
|
100%
|
33%
|
1
|
-
|
Based on WSD
data (1).
|
|
U
|
Ka Tin Court
|
4707
|
4729
|
4729
|
100%
|
50%
|
50%
|
70%
|
50%
|
99%
|
1
|
35
|
Value from
Centamap (updated based on 2011 Population Census Street Block data), scaled
according to 2011 based TPEDM projection.
|
|
V
|
Assemblies of God Wa Wai Church Hin
Keng Anglo-Chinese Kindergarten G/F of Hin Kwai House
|
90
|
0
|
0
|
0%
|
50%
|
50%
|
0%
|
100%
|
95%
|
3.3
|
1
|
Base value
from: http://www.edb.gov.hk (1). Confirmed to be shut down during
site survey Jan 2014.
|
|
W
|
Po Leung Kuk District Support Centre
(Shatin) G/F of Hin Fu House
|
0
|
50
|
50
|
0%
|
100%
|
100%
|
100%
|
100%
|
95%
|
3.3
|
1
|
Based on site
survey Jan 2014 and telephone interview, there is approximately 50 people
including a dental care centre of 1 dental bed.
|
|
W1
|
Beacon Hill North Gas Offtake Station
|
3
|
3
|
3
|
0%
|
50%
|
50%
|
0%
|
100%
|
95%
|
1
|
1
|
Based on the
site surveys and Towngas information (2).
|
|
X
|
Kindergarten G/F of Hing Tak Lau
|
240
|
118
|
118
|
0%
|
50%
|
50%
|
0%
|
100%
|
95%
|
3.3
|
1
|
Base value
from: http://www.edb.gov.hk (1). confirmed with observation during
site survey Jan 2014. 98 students in total with 20 staff, data from
http://www.chsc.hk/ were considered in 2016 & 2031.
|
|
Y
|
Tai Po Road
|
1574
|
1574
|
1574
|
2%
|
100%
|
32%
|
16%
|
18%
|
0%
|
1
|
-
|
Traffic data
from the 2013 annual traffic census. Length 1.5 km. Traffic in stationary on
one direction during Jammed Peak was considered.
|
|
Z1
|
Che Kung Miu Road
|
300
|
300
|
300
|
5%
|
100%
|
100%
|
50%
|
55%
|
0%
|
1
|
-
|
Value from 2001 QRA,
partially verified during 2009 ERM survey, population was updated from Site
survey Jan 2014. 86 vehicles per 5
minutes in average.
More conservative data
(2011) were adopted (1).
|
|
Z2
|
Hin Keng Street
|
270
|
270
|
270
|
5%
|
100%
|
100%
|
50%
|
55%
|
0%
|
1
|
-
|
Value from 2001 QRA,
partially verified during 2009 ERM survey, population was updated from Site
survey Jan 2014. 30 vehicles per 5 minutes in average.
More conservative data
(2011) were adopted (1).
|
|
Z5
|
SCL train (moving)
|
0
|
0
|
501
|
16%
|
100%
|
100%
|
41%
|
41%
|
100%
|
1
|
-
|
Based on MTRCL
data (1).
|
|
Z6
|
Hin Keng Station
|
0
|
0
|
372
|
16%
|
100%
|
100%
|
41%
|
41%
|
0%
|
1
|
4
|
Based on MTRCL
data. SCL is under construction in Year 2014 and will operate at Year 2018 (1).
|
|
|
Stationary train at HIK Station
|
0
|
0
|
607
|
16%
|
100%
|
100%
|
41%
|
41%
|
100%
|
1
|
-
|
Based on MTRCL
data. SCL is under construction in Year 2014 and will operate at Year 2018 (1).
|
|
|
HIK Station construction workers
|
0
|
140
|
0
|
0%
|
50%
|
50%
|
10%
|
100%
|
0%
|
1
|
-
|
Based on MTRCL
data. SCL is under construction in Year 2014 and will operate at Year 2018 (1).
SCL construction workers are conservatively included in 2016 scenario.
|
|
Z7
|
SCL Tunnel portal construction
workers
|
0
|
120
|
0
|
0%
|
50%
|
50%
|
10%
|
100%
|
0%
|
1
|
-
|
Based on MTRCL
data. SCL is under construction in Year 2014 and will operate at Year 2018 (1).
SCL construction workers are conservatively included in 2016 scenario.
|
|
Z8
|
SCL Alignment construction workers
|
0
|
20
|
0
|
0%
|
50%
|
50%
|
10%
|
100%
|
0%
|
1
|
-
|
Based on MTRCL
data. SCL is under construction in Year 2014 and will operate at Year 2018 (1).
SCL construction workers are conservatively included in 2016 scenario.
|
|
Z9
|
SCL Construction Offices/yard
|
0
|
80
|
0
|
0%
|
50%
|
50%
|
10%
|
100%
|
50%
|
1
|
1
|
Based on MTRCL
data. SCL is under construction in Year 2014 and will operate at Year 2018
(1).
|
|
Z10
|
Keng Hau Rd underpass below the SCL
alignment
|
6
|
11
|
11
|
5%
|
100%
|
100%
|
50%
|
55%
|
0%
|
1
|
-
|
Based on ERM 2011 site survey (1), population taken from Site survey Jan
2014. 8 vehicles per 5 minutes in average were
considered in 2016 & 2031.
|
|
AA1
|
Lion Rock Tunnel Toll Plaza
|
12
|
12
|
12
|
50%
|
100%
|
100%
|
100%
|
100%
|
0%
|
1
|
-
|
12 Booths as observed on site survey
Jan 2014. Information provided by Transport Department. Assume no. of staff :
1 staff per booth
|
|
AA2
|
Lion Rock Tunnel Office (Transport
Department)
|
63
|
63
|
63
|
50%
|
100%
|
100%
|
100%
|
100%
|
95%
|
1
|
2
|
2 storey, confirmed with observation
during site survey Jan 2014.
Information provided by Transport Department. No. of staff at LRT =
75; Assume no. of staff at toll plaza = 12
|
|
AA3
|
Lion Rock Tunnel (Inside the tunnel)
|
190
|
190
|
190
|
4%
|
100%
|
84%
|
42%
|
46%
|
100%
|
1
|
-
|
Traffic data from 2013 Annual Traffic
Census. Road length ~200m; Traffic in stationary on one
direction during Jammed Peak was considered.
Lion Rock Tunnel is 100% indoor.
|
|
AD
|
Ascot Villas, Golden Time Villas,
Chase Villa and Albert Villas
|
135
|
135
|
135
|
100%
|
50%
|
50%
|
70%
|
50%
|
99%
|
1
|
3
|
Confirmed with observation during
site survey Jan 2014. Ascot Villas: 3 3-storey blocks, 15 units in total,
data from https://bmis.buildingmgt.gov.hk/,
Golden Time Villas: 17 3-storey houses, 17 units in total, data from
https://bmis.buildingmgt.gov.hk/, checked with view from aerial map, Chase
Villa - 4 units data from https://bmis.buildingmgt.gov.hk/ and Albert Villas
- 9 units confirmed during site survey. Population estimated from number of
units.
|
|
AF
|
Luk Hop Village
|
6
|
6
|
6
|
100%
|
50%
|
50%
|
70%
|
50%
|
99%
|
1
|
2
|
Confirmed with observation during
site survey Jan 2014. 2 blocks, confirmed with view from aerial map.
Population estimated from number of units.
|
|
AG
|
Garden Villa
|
0
|
48
|
48
|
100%
|
50%
|
50%
|
70%
|
50%
|
99%
|
1
|
2
|
Confirmed with observation during
site survey Jan 2014. 8 blocks low-rise (2 storey) Appears to be abandoned /
under construction in google map, confirmed during site survey Jan 2014.
Population estimated from number of units. Assume 2015 complete works. Assume
1 unit per floor, 3 people per units.
|
|
AH
|
Kothari House
|
9
|
9
|
9
|
100%
|
50%
|
50%
|
70%
|
50%
|
99%
|
1
|
3
|
Confirmed with observation during
site survey Jan 2014. 3 Detached Houses (3 storey each), confirmed during
site survey Jan 2014, assume 3 people per house.
|
|
AI
|
Shell Petrol Filling Station
|
10
|
10
|
10
|
50%
|
100%
|
100%
|
100%
|
100%
|
0%
|
1
|
-
|
Confirmed with observation during
site survey Jan 2014. 3 staff observed during site survey Jan 2014.
Conservatively assumed 10 people at Filling station.
|
|
AJ1
|
Tsing Sha Hwy Administration Building
|
370
|
370
|
370
|
14%
|
20%
|
38%
|
14%
|
38%
|
95%
|
1
|
3
|
3 storey building, confirmed with
observation during site survey Jan 2014.
|
|
AK
|
"SAGE Mrs. Wong Yee Jar Jat
Memorial Home for the Elderly, G/F of Hin Yeung House"
|
137
|
137
|
137
|
100%
|
100%
|
100%
|
100%
|
100%
|
99%
|
3.3
|
1
|
Confirmed with observation during
site survey Jan 2014. In total 90 bed space and no. of staff : 47.
Information from http://www.swd.gov.hk/.
|
|
AL
|
"SAGE Mrs. Wong Yee Jar Jat
Memorial Neighbourhood Elderly Centre, G/F of Hin Hing House; Shatin
Inhabitants Association Hin Keng Intergrated Service Centre G/F of Hin Hing
House"
|
45
|
45
|
45
|
0%
|
100%
|
100%
|
100%
|
100%
|
95%
|
3.3
|
1
|
Confirmed with observation during
site survey Jan 2014.
Assume no. of population : 30 and no. of staff :15
|
|
AN1
|
Po Leung Kuk 82 Hin Keng Centre G/F
of Hin Pui House
|
45
|
45
|
45
|
0%
|
100%
|
100%
|
100%
|
100%
|
95%
|
3.3
|
1
|
Confirmed with observation during
site survey Jan 2014. Information on hostel on:
http://www.swd.gov.hk/en/print/page_2595/
Assume no. of population : 30 and no. of staff: 15.
|
|
AN2
|
Po Leung Kuk 82 Hin Keng Hostel for Severely Mentally Handicapped Persons G/F of Hin Pui House
|
3
|
3
|
3
|
100%
|
100%
|
100%
|
100%
|
100%
|
99%
|
3.3
|
1
|
Confirmed with observation during
site survey Jan 2014. Information on hostel on:
http://www.swd.gov.hk/en/print/page_2595/ and
http://www.hkscaa.org/download/disabled_resident_service.pdf/, Hostel has
bedspace for 1.
Assume no. of staff :2.
|
|
AO1
|
Hin Keng Estate Management Office,
Incorporated Owners of Hin Keng Estate G/F of Hin Yau House
|
10
|
10
|
10
|
0%
|
100%
|
100%
|
50%
|
100%
|
95%
|
1
|
1
|
Confirmed with observation during
site survey Jan 2014. Information from http://www.swd.gov.hk/
Assume no. of staff : 10.
|
|
AO2
|
Mental Health Association of Hong
Kong Hin Keng House, G/F of Hin Yau
House
|
56
|
56
|
56
|
100%
|
100%
|
100%
|
100%
|
100%
|
95%
|
3.3
|
1
|
Confirmed with observation during
site survey Jan 2014. Maximum capacity 42 bed space. Information from
http://www.swd.gov.hk/
Assume no. of staff : 14.
|
|
AP
|
Chinese YMCA of Hong Kong Hin Keng
Centre (Integrated Team) G/F of Hin Wan House
|
45
|
45
|
45
|
0%
|
100%
|
100%
|
100%
|
100%
|
95%
|
1
|
1
|
Confirmed with observation during
site survey Jan 2014.
Assume no. of population : 30 and no. of staff :15.
|
|
|
CZ total
|
44425
|
44461
|
46209
|
|
|
|
|
|
|
|
|
|
|
|
Total
(inside & outside CZ)
|
214932
|
234986
|
246732
|
|
|
|
|
|
|
|
|
|
Note
1: These values are consistent with those used in the QRA for the SCL Project.
See ERM (2011a) for details.
Note
2: Working Day population of Beacon Hill North Gas Offtake Station has been
estimated assuming 30 persons present for 5% of time, 15 for 5% of time, 2
persons for 30% of time and none during 60% of time.
Note
3: Population is assumed zero growth despite decreasing trend in population for
certain well established areas after the base year (i.e. zero growth in year 2016
and 2031 despite decreasing trend in the areas where applicable).
Note
*: The STWTW Reprovisioning Project construction workers are (on-site
population) included to follow the approved SCL EIA methodology, despite that HKRG
is meant to assess the potential off-site risk and the on-site population are
considered as "voluntary risk takers".
Hazardous
Characteristics of Chlorine
12.9.1
The following lines summarise some of the key
hazardous characteristics of chlorine (Chlorine Handbook, ICI, 1995):
·
Chlorine gas is heavier than
air and as a result will tend to accumulate in low places when released to the
atmosphere and flow downhill in still air. However, slight breezes or thermal turbulence
will cause it to move upward, so people are not necessarily safe simply because
they are above the point of release;
·
Chlorine gas has a
greenish-yellow colour which is only visible at high concentrations (above
approximately 500 ppm) many times higher than the danger level (see Table 12.4 below); and
·
Chlorine gas is a
respiratory irritant. Symptoms caused by inhalation of chlorine include:
headaches, pain, difficult breathing, burning sensation of the chest, nausea
and watering of the eyes.
12.9.2
The physiological effects of chlorine are
summarised in Table 12.4.
Table 12.4 Physiological
Effects of Chlorine
|
Concentration
(ppm)
|
Effects
|
|
0.2–3.5
|
Threshold of odour perception in most
individuals.
|
|
3–5
|
Tolerated without undue ill effect for half
to one hour.
|
|
5–8
|
Slight irritation of the mucous membranes
of the upper respiratory tract and the eyes.
|
|
15
|
Effects are immediate. Irritation of nose,
throat and eyes with cough and lachrymation.
|
|
30
|
Immediate cough with a choking sensation,
retrosternal chest pain and a sense of constriction in the chest.
|
|
40–60
|
Development of a chemical
tracheo-bronchitis and pulmonary oedema.
|
|
1000
|
Concentration likely to be fatal after a
few deep breaths.
|
Review of Past Incidents
12.9.3
In light of the recent judgement of the Court
of Final Appeal (FACV 28/2005) the Hazard Identification results of ERM (2001)
have been carefully reviewed for the purpose of the current assessment. In
particular, the latest version of the world wide accident database MHIDAS has
been independently reviewed in order to update the Hazard Identification
conclusions. However, only a few relevant chlorine incidents occurred worldwide
since the previous review, and after examination of their nature it has been
concluded that no revisions of the previously identified hazard scenarios or
their frequencies are necessary for this study.
12.9.4
The following reference data had been
searched and consulted:
·
MHIDAS Database (MHIDAS is a
Major Hazard Incident Data Service developed by the Safety and Reliability
Directorate of the UK Atomic Energy Authority. MHIDAS contains incidents from
over 95 countries particularly the UK, USA, Canada, Germany, France and India.
The database allows access to many other important sources of accident data,
such as the Loss Prevention Bulletin);
·
HSELine (The Library and
Information Services of the UK Health and Safety Executive has accumulated in a
computer database documents relevant to health and safety at work. HSELine
contains citations to HSE and Health and Safety Commission publications,
together with documents, journal articles, conference proceedings, etc.);
·
Lees (1996);
·
AQUALINE;
·
Chlorine Institute; and
·
Chlorine Transport Risk
Studies (DNV, 1997; Atkins, 2006).
Hazard and Operability Study
12.9.5
A Hazard and Operability (HAZOP) study was
conducted for Sha Tin WTW as part of the Eight
WTWs Study (ERM, 2001) to provide a full and systematic identification of
the hazards associated with the delivery, storage and handling of chlorine. The
HAZOP technique provides a means of examining deviations from the design
intent, their causes, consequences and safeguards, in a structured manner.
12.9.6
The HAZOP sessions considered each of the
following aspects of the design and operation of the WTW:
·
transport of chlorine
containers along the site access road (including manoeuvring of the truck
outside the entrance to the truck unloading bay);
·
handling of containers
within the Chlorination House;
·
containers in storage;
·
connection and disconnection
of containers;
·
chlorination system
(including the liquid chlorine pipework, evaporators, chlorinators and
ejectors); and
·
Contain and Absorb system.
12.9.7
The HAZOP considered the various operating
modes of the plant (auto/manual) as well as planned maintenance operations.
Prior to the HAZOP study, previous HAZOP studies of WTWs and chlorine leak
incidents were reviewed to provide additional input to the identification of
the chlorine release scenarios.
12.9.8
HAZOP results presented in ERM (2001) show
that the primary hazard arises from a loss of containment of chlorine with
subsequent acute exposure of people leading to injuries or fatalities. Releases
may range in size from a small leak (e.g. via a valve gland), through to
dislodgement of a fusible plug or catastrophic failure of the container itself.
The releases may be isolatable (i.e. via closure of the changeover valves or
drum valve) or non-isolatable (i.e. a leak from the shell of the container).
12.9.9
The physical state of the release may be gas,
liquid or two-phase depending on the precise location, e.g. a small leak
downstream of the evaporator is likely to be gas, a leak from the ‘pigtail’
connection is likely to be two-phase (due to flashing in the line), whereas a
leak from the container shell itself is likely to be liquid. The release may
arise from failure of the chlorine equipment itself or failure induced by an
external event such as an earthquake or landslide. The quantity of chlorine
released may vary from a few kilograms to several tonnes released
instantaneously, e.g. in the case of a severe external event such as an
earthquake. For releases occurring within the Chlorination House a Contain and
Absorb system is provided to minimise the likelihood of the release escaping to
atmosphere.
Characterisation of Chlorine Release
Scenarios
12.9.10
Following the HAZOP study, the next step in
the Hazard Assessment is to characterise the release scenarios identified in
HAZOP in terms of the releasing inventory, hole size and phase of release (Table 12.5). This follows the approach outlined in the
Consultants' Methodology Report for the Eight
WTWs Study (ERM, 1997).
12.9.11
Chlorine release scenarios due to the
construction activities are separately discussed in Sections 12.9.12–12.9.15 below.
Table 12.5 Characterisation
of Chlorine Release Scenarios
|
Chlorine
release scenario
|
Outcome
|
Releasing
inventory (tonnes)
|
Hole
size (diameter)
|
Phase
|
|
1.
ACCESS ROAD
|
|
1.1 Truck fire
|
Considered to result in melting of the
fusible plugs on up to three drums (1).
|
3
|
3×6 mm
|
liquid
|
|
1.2 Fire on the roadside
|
Considered to present negligible risk as
truck does not park on site other than within chlorine building
|
-
|
-
|
-
|
|
1.3 Manoeuvring accident
|
Considered to result in a single drum – small
leak (e.g. valve gland failure)
|
1
|
3 mm
|
liquid
|
|
1.4 Rollover
|
Single drum – small leak(e.g. valve gland
failure)
Single drum – medium leak(e.g. guillotine failure of drum valve)
|
1
1
|
3 mm
8 mm
|
liquid
liquid
|
|
|
Three drums – medium leak
(e.g. guillotine failure of drum valves on three drums)
|
3
|
3×8mm
|
liquid
|
|
|
Fire (outcomes as item 1.1 above)
|
|
|
|
|
1.5 Collision
|
Single drum – rupture
Fire (outcomes as item 1.1 above)
|
1
|
-
|
liquid
|
|
1.6 Load-
Shedding
|
Single drum – small leak
|
1
|
3 mm
|
liquid
|
|
Single drum – medium leak
|
1
|
8 mm
|
liquid
|
|
1.7 Spontaneous
drum failure
|
Single drum – medium leak
|
1
|
8 mm
|
liquid
|
|
Single drum – large leak
(eg. dislodgement of a fusible plug)
|
1
|
20 mm
|
liquid
|
|
|
Single drum – rupture
|
1 (inst)
|
-
|
liquid
|
|
2.
DRUM HANDLING
|
|
2.1 Dropped
drum
|
Single drum – medium leak
|
1
|
8 mm
|
liquid
|
|
Single drum – large leak (e.g. dislodgement
of fusible plugs)
|
1
|
20 mm
|
liquid
|
|
Single drum – rupture
|
1 (inst)
|
-
|
liquid
|
|
2.2 Collision of drum with another object
|
Single drum – medium leak
|
1
|
8 mm
|
liquid
|
|
2.3 Accidental impact of drum on pigtail
during setdown at standby position
|
Pigtail – guillotine failure
|
1
|
4.5 mm
|
two-phase
|
|
2.4 Dropped drum due to overextension of
truck crane
|
Single drum – medium leak
|
1
|
8 mm
|
liquid
|
|
2.5 Dropped drum due to incorrect alignment of monorail track
|
As item 2.1 above
|
|
|
|
|
3.
CONTAINERS IN STORAGE
|
|
3.1 Leaking
chlorine drums
|
Single drum – medium leak
|
1
|
8 mm
|
liquid
|
|
Single drum – large leak
|
1
|
20 mm
|
liquid
|
|
Single drum – rupture
|
1 (inst)
|
-
|
liquid
|
|
3.2 Overfilled drums leading to
overpressurisation on thermal expansion
|
As item 3.1 above
|
|
|
|
|
3.3 Impurities in chlorine drum leading to
explosion or leak
|
As item 3.1 above
|
|
|
|
|
3.4 Object falls onto chlorine containers
|
Considered to present negligible risk as
there are no objects likely to fall which could cause significant damage to
the drums.
|
-
|
-
|
-
|
|
3.5 Fire (external or internal)
|
Considered to present negligible risk as Chlorination
House is 2 hour fire-rated structures. The most significant internal source
of fire is considered to be the chlorine truck. However, pessimistically, all
truck fires are modelled as occurring outdoors
|
-
|
-
|
-
|
|
3.6 External explosion
|
Single drum – medium leak
|
1
|
8 mm
|
liquid
|
|
3.7 Lightning strike
|
Considered to present negligible risk as
the Chlorination House is lightning protected and a lightning, while it can
result in electrical damage, is unlikely to cause a chlorine release
|
-
|
-
|
-
|
|
3.8 Extreme wind
|
Considered to present negligible risk as the
Chlorination House is designed for typhoon loading
|
-
|
-
|
-
|
|
3.9 Flooding
|
Considered to pose negligible risk as could
only affect empty drums
|
-
|
-
|
-
|
|
3.10 Construction activities
|
No construction activities inside the Chlorination
House are anticipated during the construction and operational phases of this
project.
|
-
|
-
|
-
|
|
3.11 Subsidence
|
Considered to present negligible risk, due
to topographical and geological properties of the site
|
-
|
-
|
-
|
|
3.12 Earthquake (2)
|
Overhead crane dislodged from rails:
Single drum – rupture
Roof collapse:
Multiple drum – rupture
|
1 (inst)
36 (inst) (5)
|
-
|
liquid
|
|
3.13 Aircraft crash
|
Roof collapse:
Multiple drum – rupture
(similar to earthquake)
|
36 (inst) (5)
|
-
|
liquid
|
|
3.14 Sabotage
|
Considered to present negligible risk
(issues of site security were considered in the HAZOP studies and appropriate
actions have been raised.)
|
-
|
-
|
-
|
|
3.15 Vehicle crash
|
Single drum – medium leak
|
1
|
8 mm
|
liquid
|
|
3.16 Electromagnetic interference
|
Considered to present negligible risk as
precautions are adopted in the design of the electrical systems.
|
-
|
-
|
-
|
|
4. CONNECTION
AND DISCONNECTION OF CHLORINE CONTAINERS
|
|
4.1 Human error or equipment failure during
connection or disconnection of drums
|
Pigtail – guillotine failure
|
1
|
4.5 mm
|
two-phase
|
|
5.
CHLORINATION SYSTEM
|
|
5.1–5.5 Failures associated with the
chlorination system pipework
|
Liquid chlorine pipework – guillotine
failure
|
1.05 (3)
|
4.5 mm (4)
|
two-phase
|
|
5.6–5.7 Failure of evaporator
|
Evaporator – leak or rupture
|
1.05
|
4.5 mm
|
two-phase
|
Notes
(1) In
the 2001 QRA a mixture of “old” and “new” chlorine drums was assumed (with 6
and 1 fusible plug, respectively). According to the recent WSD information, the
“old” drums are no longer in use, so only the “new”-type drums are considered.
(2) For
assessment of effects of earthquake on Chlorination House see Appendix
12.7
(3) Inventory
of drum (1 tonne) and evaporator (50 kg)
(4) Diameter
of liquid chlorine pipework is 20mm but limiting orifice size is that of
pigtail, i.e. 4.5 mm.
(5) The
values listed are for the maximum 190 tonnes storage. For reduced storage
scenarios they are reduced in proportion to the storage levels (see discussion
in Appendix 12.7).
(6) Construction
Phase only
Hazards Associated with Reprovisioning Works
12.9.12
Possible hazardous scenarios associated with
reprovisioning works that might have potential to damage chlorine facilities/trucks
and lead to a chlorine release were identified using a structured HAZID
workshop approach, conducted on 11 November 2011 and attended by
representatives of AECOM, WSD, MTRCL and ERM.
12.9.13
Following the workshop, a quantitative
analysis was performed on each of the potential hazards identified. Details are
provided in Appendix 12.8.
12.9.14
It was also concluded that while other reprovisioning
activities may in some cases lead to potential chlorine releases (e.g.
collision of a construction vehicle with chlorine truck), such events are
already included in Table 12.5 and therefore no additional chlorine release
scenarios arising from construction activities need to be considered. The
following points are particularly noteworthy:
·
Reprovisioning works will be well segregated
from the WTW operations. In particular, completely separate access routes will
be used for construction trucks and chlorine delivery trucks. A new road will
be constructed so that completely separate on-site roads will be used all the
way up to the front entrance gate;
·
Chlorine gas is dissolved into water within
the Chlorination House prior to bulk dosing. All underground piping running
across the site therefore contains chlorinated water and not chlorine gas. Any
damage to this piping from reprovisioning works will not lead to a hazard; and
·
Any tower cranes will be located at least 70 m
away from the Chlorination House. Even if one of these cranes were to collapse,
it cannot impact on the Chlorination House; they are simply too far away
compared to the crane height. Similarly, the potential ground vibrations due to
crane collapse or bore piling would be too weak to damage the Chlorination
House.
·
The construction activities involving mobile
or tower crane usage are well separated from the chlorine delivery routes. The
two tower cranes to be used during Stage 2 Activity 2 (see Appendix
12.8. for details of construction activities) will be placed
more than 60 m away from the new chlorine delivery route. Therefore, a direct
tower crane impact (either due to crane collapse and dropped/ swinging loads)
on chlorine truck is not credible taking into account sufficient separation
between the proposed tower crane (used for Stage 2 Activity 2) locations and
the new chlorine delivery route.
·
For mobile crane impact, the possibility will
be eliminated by suspending the chlorine deliveries during the short period of
construction of the concerned section of elevated walkway under Stage 2
Activity 10, therefore mobile crane impacts on chlorine trucks are no longer
considered.
12.9.15
Nevertheless, a number of good practice
recommendations were formulated at the workshop. Subsequently a number of other
good practice measures have also been recommended. These measures are further
discussed in Section 12.13 and
listed in Table 12.22.
Hazards Associated with Liquid Oxygen
12.9.16
The South Works reprovisioning will introduce
new treatment technologies including ozonation to reduce chlorine consumption. As
liquid oxygen (LOX) was used in connection with ozonation process in other WTWs,
the Study Brief requires the hazards associated with storage of liquid oxygen
to be included in this QRA. However, as per the latest design, sufficient
standby Vacuum Pressure Swing Adsorption (VPSA) units will be provided such
that LOX is no longer required as a back-up oxygen supply for ozone generation ().
The hazards associated with the LOX are therefore disregarded in this study. The
primary function of Vacuum-Pressure Swing Adsorption (VPSA) units is to
separate gases from a mixture, in this case to separate oxygen from air. VPSA
units work on the principle that nitrogen tends to be adsorbed more strongly to
certain materials. VPSAs can produce at least 90% pure oxygen with nitrogen and
argon as the main impurities.
Potential Hazards to/from Other Projects and
Installations
12.9.17
The only nearby installation handling
hazardous material is the Towngas Beacon Hill North Gas Offtake Station located
to the east of the WTW (Figure 12.11). Construction activities at the Sha Tin WTW
are too far away (at a distance of at least 75 m) to have any impact on this
offtake station as well as
the underground gas pipes and the aboveground gas pipes installed through the
Old Beacon Hill Tunnel. More details are provided in Appendix 12.8. Similarly,
any chlorine releases from Sha Tin WTW, while affecting the surrounding
population, will have no effect on the equipment at Beacon Hill. There is
therefore no potential for events at Sha Tin WTW to escalate to the Beacon Hill
North Gas Offtake Station and its associated pipelines.
12.9.18
There is potential for gas releases from the
Beacon Hill North Gas Offtake Station and its associated 750mm diameter intermediate
pressure pipeline and a new 500mm intermediate pressure gas pipeline to potentially
impact on the chlorine facilities at the WTW. A gas release may, if ignited,
lead to a fireball, flash fire or jet fire. Consequences of a gas release from
the Beacon Hill North Offtake Station and adjacent pipeline were assessed as
part of the recent SCL EIA and presented in Appendix
13B of the EIA report (ERM, 2011b). The Sha Tin WTW Chlorination House,
some 300 m away from the nearest Towngas equipment cannot be affected by jet
fires or fireballs, and lies beyond the consequence distance of a flash fire (maximum
distance to 0.85 LFL for a full bore pipeline rupture is calculated at 196 m). Furthermore,
since the building is fireproof and flash fires are of short duration with
negligible radiation effects, an external flash fire cannot lead to a chlorine
release inside the Chlorination House as stated in Table 12.5. While Appendix 13B of the SCL EIA report is
limited to the hazardous scenarios due to the use of explosives, other external
hazardous scenarios such as earthquake, aircraft crash will not result in more
severe fire cases and worst case consequence remain as full-bore rupture. Hence
the conclusion that the Chlorination House cannot be affected by jet fires or
fire balls, which are the worst case consequences, remains valid.
12.9.19
It follows, that gas releases from the
pipelines within the Old Beacon Hill Tunnel also cannot impact on the Chlorination
House as the tunnel portal is a similar distance away at more than 300 m.
12.9.20
While parts of the new chlorine delivery road
are within the hazard range of a jet fire or fireball originating at the
off-take station, such jet could not reach the chlorine truck since it would be
screened by the MTR East Rail track enclosure (see Figure 12.11). On the
other hand, a flash fire from the off-take station or associated underground
pipeline could affect the chlorine trucks on the WTW access road, leading to
secondary fires and a chlorine release due to melting of fusible plugs on some
chlorine drums.
12.9.21
The probability of such chlorine release is however
extremely low. This may be estimated
using the following data:
·
typical
failure frequency for the underground gas pipelines 10-5 per km-year
()
·
conservative
delayed ignition probability of 40% ()
·
300 m length
of the relevant pipeline segment
·
probability
of wind blowing from the eastern direction of 20%
·
fraction of
the year when a chlorine truck is present on the access road: about 0.001,
based on 127 trucks per year and 10 km/h speed on the access road
Based on the above, a probability of a flash fire affecting a
chlorine truck on the access road can be estimated at 2.4 × 10⁻¹⁰
per year. This is a very conservative estimate, since the pipeline failure
frequencies used here include all possible leak sizes, while only a full bore
rupture with a conditional probability of about 1% has a potential to cause an
extensive flash fire that could reach the access road.
12.9.22
A similar
calculation may be performed for the above ground installations of the offtake
station. The frequency of a flash fire with consequence distance of more than
100 m (the closest distance between off-take station and chlorine trucks is
about 125 m) can be estimated at about 2.0 × 10⁻⁹ per year). This
yields an impact frequency of 2.0 × 10-9 × 0.2 × 0.001 = 4 × 10-13
per year.
12.9.23
Both these
frequencies are several orders of magnitude lower than the 3.0 × 10⁻⁷
per year frequency of chlorine release due to the truck fire adopted in this
QRA (Table 12.17) and less
than the 10-9 per year cut-off frequency adopted in Hong Kong. The
risk of events at the Towngas facilities impacting on chlorine trucks is
therefore not significant. The risk from the gas facilities to nearby
population including operators and construction workers at STWTW is assessed
taking into account the MTR East Rail track as stated in Section 12.9.20.
12.9.24
The Beacon Hill North Offtake Station will be relocated about 10 m to the west of
the existing location. This is already taken into consideration in the above
analysis, and the population at the offtake station will not exceed the levels
assumed for that location in Table 12.3 (30 persons
present yearly for 5% of time, 15 for 5% of time, 2 persons for 30% of time and
none during 60% of time).
12.9.25
As part of the SCL project, explosives will
be transported through the Sha Tin WTW Consultation Zone on the Che Kung Miu
Road. Explosives will be transported in quantities of up to 200 kg, an
initiation of which may impact the Chlorination House or chlorine trucks. Based
on the approved SCL QRA (ERM, 2011b) the probability of an explosion of an
explosive delivery truck is 7.69 × 10⁻¹⁰
per km and the number of explosive deliveries using that road is 336 per year. The
impact radius of an explosives truck explosion is only about 100 m (ERM, 2011b).
It is conservatively assumed that about a 500m section of Che Kung Miu Rd may
impact the on-site chlorine delivery truck. This leads to the relevant
explosion probability near Sha Tin WTW of 336 × 0.5 × 7.69 × 10-10 = 1.3 × 10⁻⁷ per year. With the
chlorine truck presence factor of 0.001 (see above), this leads to an event
frequency of 1.3 × 10⁻¹⁰ per year, again below the 10-9
per year cut-off frequency adopted in Hong Kong. Note that this estimation
conservatively assumed that the chlorine trucks on the whole length of the
access road can be affected by a Che Kung Miu Road explosion, while in fact the impact radius of an explosives truck
explosion is only about 100 m so only a small fraction of the Sha Tin WTW
on-site chlorine delivery road can be affected.
12.9.26
Similarly, an explosives truck explosion
cannot affect the Chlorination House. As shown in the approved QRA for the SIL(E)
Project (ERM, 2010) an explosion of a truck with a load of 200 kg explosives as
used for the SCL project can affect concrete structures at a distance of not
more than 62 m, while the Chlorination House is about 360 m away from Che Kung
Miu Road.
12.9.27
As concluded in the
assessment by AECOM (see Appendix 12.9), the
construction activities at the Sha Tin WTW will have no effect on the nearby
400kV overhead power line. Due to the adequate separation distance there is
also no potential for domino effect from this installation.
12.9.28
Therefore, escalation events to/from the Beacon Hill North Offtake Station,
the gas pipelines, the SCL Project explosives transport on Che Kung Miu Road and
the 400kV overhead power lines were not assessed further in this QRA.
12.9.29
Apart from
the normal operation of the north part of the WTW there will be no other
projects at the site of Sha Tin WTW concurrent with South Works reprovisioning
project.
12.9.30
A review of all committed
and planned developments has been conducted as part of this EIA and, as stated
in Section 2.8 of this report, the only relevant concurrent project outside the
WTW is the SCL Project of MTRC. The construction workers and future passengers
of the SCL have been included in this QRA.
12.9.31
It may be noted
that that there will be a new 500mm diameter gas pipeline installation works
within the Beacon Hill North Offtake Station area and the Old Beacon Hill
Tunnel. However, according to the information from Towngas, all the installation
works within Sha Tin WTW Consultation Zone will be completed before the start
of the Sha Tin WTW reprovisioning project.
12.9.32
Apart from the effects on population,
potential chlorine releases at the WTW will not lead to any other hazardous events. Similarly, while the chlorine release
scenarios caused by external causes are considered in the QRA, no potential
impact from other concurrent planned or committed project has been identified.
Therefore, apart from the increase of population, there will be no potential domino
effect from other projects.
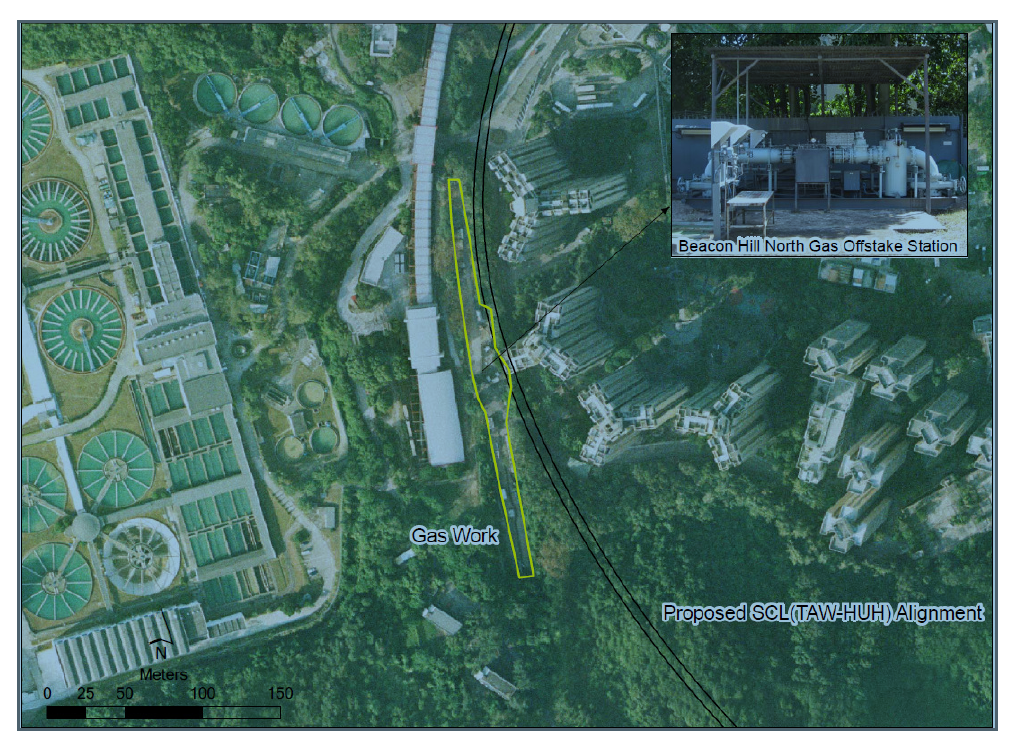
Figure 12.11 Beacon Hill North
Gas Offtake Station
12.10 Consequence
Analysis
Overview
12.10.1
The assessment of the consequences of a
chlorine release essentially involves three steps:
·
modelling the initial
release of chlorine (whether inside or outside the chlorine building);
·
modelling the dispersion of
chlorine in the atmosphere; and
·
assessing the toxic impact
to people (whether indoors or outdoors).
Initial Release of Chlorine
12.10.2
The initial release of chlorine or 'source
term' is modelled using standard discharge rate formulae as detailed in (ERM,
1997). Releases direct from the chlorine container are the most significant
and, in the case of chlorine drums, these are modelled as liquid releases.
12.10.3
The rapid flashing of chlorine which occurs
following a liquid leak from a drum is conservatively assumed to result in 100%
entrainment of the liquid as aerosol with no rain-out. For catastrophic
(instantaneous) liquid releases, the rapid boiling of chlorine on contact with
the ground is assumed to result in entrainment of twice the initial flash
fraction as aerosol, following Lees (1996). The remainder of the liquid
chlorine is modelled as a spreading, evaporating pool.
12.10.4
For releases of chlorine within the chlorine
building, a simple 'perfect mixing' model is used to account for the initial
dilution of chlorine. Instantaneous releases of 1 tonne of chlorine are assumed
to result in pressurisation of the building to the extent that there could be a
release of chlorine via weak points in the building structure, e.g. door seals.
Continuous releases are assumed to be entirely contained, except in the event
of failure of the Contain and Absorb system for which two modes of failure are
considered: normal ventilation remains on or a door is left open.
12.10.5
The results of the 'source term' modelling of
chlorine releases are summarised in Table 12.6 below.
Table
12.6 Summary of Source Term Modelling Results
for Sha Tin WTW
|
Release
case
|
Hole
size
(mm)
|
Phase
|
Mode
of release to atmosphere (for internal release cases only)
|
Release
rate to atmosphere or instantaneous release quantity
|
Release
duration
(Note
1)
|
|
External
releases (1-tonne drum)
|
|
|
|
|
Small leak
|
3
|
Liquid
|
-
|
0.2 kg/s
|
83 min
|
|
Medium leak
|
8
|
Liquid
|
-
|
1.4 kg/s
|
12 min
|
|
Large leak
|
20
|
Liquid
|
-
|
8.8 kg/s
|
114 s
|
|
Rupture
|
-
|
Liquid
|
-
|
1000 kg
|
-
|
|
Internal
releases (1-tonne drum or chlorine pipework)
|
|
|
|
Pigtail–guillotine failure
|
4.5
|
Two-phase
|
Normal ventilation remains
on
|
0.027 kg/s
|
10 min
(Note 2)
|
|
|
|
|
Door left open
|
0.013 kg/s
|
10 min
|
|
Medium leak from drum
|
8
|
Liquid
|
Normal ventilation remains
on
|
0.30 kg/s
|
10 min
|
|
|
|
|
Door left open
|
0.13 kg/s
|
10 min
|
|
Large leak from drum
|
20
|
Liquid
|
Normal ventilation remains
on
|
0.55 kg/s
|
10 min
|
|
|
|
|
Door left open
|
0.24 kg/s
|
10 min
|
|
Rupture
|
-
|
Liquid
|
Pressurisation of Chlorination
House – release via weak points (Note 4)
|
1.62 kg/s
|
10 s
(Note 3)
|
Note 1: assumes
no intervention by operating staff
Note 2: upper
limit of 10 min set for duration of releases from chlorine building (by which
time action would be taken to shut-off ventilation, close doors etc.)
Note 3: assumed
release duration for catastrophic failure of a drum, e.g. a split along a weld
(QRA not sensitive to this assumption)
Note 4: 'Normal
ventilation remains on' and 'Door left open' are not included for this mode of
release since 'Pressurisation of Chlorination House – release via weak points'
will be more dominant in the QRA.
12.10.6
It is also apparent that the chlorine
building has a significant effect in modifying the release of chlorine to the
atmosphere, given failure of the Contain and Absorb system. The rate of
chlorine release is reduced dramatically (e.g. for a medium leak the rate of
chlorine to atmosphere is reduced from 1.4 kg/s to 0.3 kg/s or 0.13 kg/s) and
the chlorine becomes diluted in the building air.
12.10.7
The failure mode of the Contain and Absorb
system 'Normal ventilation remains on' is a more severe case than 'Door left
open' in terms of the chlorine release rate to atmosphere. This is because the
normal ventilation (typically 2.6 air changes per hour) provides a more rapid
release of chlorine to the environment than if a door is left open (normal
ventilation shutdown, chlorine scrubber system in operation).
Toxic Impact Assessment
12.10.8
Similar to the previous QRAs (ERM 2001, 2011a),
the following probit equation (TNO, 1992) has been used in this study to
estimate the likelihood of fatality due to exposure to chlorine:
Pr
= -14.3 + lnC2.3t
where
Pr
= probit value
C
= chlorine concentration (mg/m3)
t =
exposure time (minutes)
12.10.9
Table 12.7 shows the relationship between the chlorine
concentration and the probability of fatality for the TNO probit (assuming 10
minute exposure duration).
Table 12.7 Chlorine
Toxicity Relationship
|
Chlorine concentration (ppm)
|
Probit value for 10 min exposure
(TNO probit)
|
Probability of fatality
(LD = Lethal Dose)
|
|
251
|
3.17
|
0.03
(LD03)
|
|
557
|
5.00
|
0.50
(LD50)
|
|
971
|
6.28
|
0.90
(LD90)
|
Dispersion of Chlorine in the Atmosphere
12.10.10
The Eight
WTWs Study used advanced techniques for prediction of the dispersion of
chlorine in the atmosphere. The effects of buildings and variable ground
terrain on the dispersion of chlorine in the atmosphere are modelled. The
modelling of the dispersion of chlorine in the atmosphere involves three
elements.
·
Wind tunnel simulations;
·
Computational Fluid Dynamics
(CFD); and
·
Flat terrain dispersion
modelling.
12.10.11
The wind tunnel and CFD studies represent the
'state of the art' in dense gas dispersion modelling and provide the only
rigorous means of accounting for the effects of buildings and complex terrain.
Wind tunnel testing has been used in the Eight
WTWs Study to investigate a range of release conditions, wind directions
and wind speeds in near-neutral atmospheric conditions. CFD has been used to
determine the influence of atmospheric stability on the dispersion of chlorine
and provide a broad comparison against the wind tunnel results for neutral
stability. In the Eight WTWs Study
wind tunnel simulations were undertaken for all eight sites, whereas CFD
modelling was undertaken for two sites representing the extremes of topography
(Sha Tin WTW and Tai Po Tau WTW). Both the wind tunnel testing and CFD
modelling have included off-site high rise buildings as well as on-site
buildings as these have a significant influence on the dispersion of the
chlorine.
12.10.12
The role of the flat terrain dispersion
modelling has been to provide the 'source term' for both the wind tunnel and
CFD studies. The model used in the Eight
WTWs Study was DRIFT (Webber et al, 1992), an integral dispersion model
developed by AEA Technology under the sponsorship of the UK Health and Safety
Executive. DRIFT contains the necessary thermodynamics and heat transfer
sub-models to be able to simulate the dispersion of a cold, aerosol-laden cloud
typical of the early stage of a chlorine release. As DRIFT runs in a matter of
minutes, it has also been possible to use the code to simulate the full range
of chlorine release rates and weather conditions. In conjunction with the wind
tunnel and CFD, this provides all the data needed for input to the QRA.
12.10.13
The results of wind tunnel testing for Sha
Tin WTW are summarised in Table 12.8 and Figures
B1 to B14 in Appendix
12.2.
Table 12.8 Summary of
Wind Tunnel Tests Results for Sha Tin WTW
|
Release
case
|
Release
location
|
Description
|
Weather
class
|
Wind
direction
(Note
1)
|
Maximum
extent
of LD03 contour (m)
(Note
2)
|
|
0.2 kg/s
(aerosol)
Continuous
|
Access Road
|
Small leak (3 mm) from
chlorine drum
|
D2
|
SW, W
|
No LD03
contour
off-site
|
|
0.5 kg/s
(vapour) continuous
|
Chlorination House
|
Chlorine vapour release
from store due to large leak (20 mm) from drum within store followed by
failure of Contain and Absorb System
|
D2
|
SW, W, SE
|
No LD03
contour
off-site
|
|
|
|
|
D5
|
SW, SE
|
No LD03
contour
off-site
|
|
1.4 kg/s
(aerosol) continuous
|
Access road
|
Medium leak (8 mm) from
chlorine drum
|
D2
|
S, SW,
W
NW,
SE,
NNE
|
No LD03
contour
off-site
|
|
|
|
|
D5
|
W, SE
|
No LD03
contour
off-site
|
|
1 tonne
(aerosol) instantaneous
|
Chlorination House
|
Catastrophic failure of a
chlorine drum
|
D2
|
SSW,
WSW,
SE,
NNE,
WNW
|
350
650
250
285
No LD03
contour
off-site
|
|
|
|
|
D5
|
WSW,
SE
|
315
250
|
|
1 tonne
(aerosol) instantaneous
|
Access road
|
Catastrophic failure of a
chlorine drum
|
D2
|
S
SW
W
NW
SE
NNE
|
295
640
260
480
300
355
|
|
|
|
|
D5
|
W
SE
|
165
210
|
Note
1: Following standard meteorology notation, wind directions refer to the
direction from where the wind blows.
Note
2: Downwind distance to 3% nominal
outdoor fatality probability, i.e. not taking into account escape and assuming
10 min exposure duration or cloud passage time (whichever is shorter)
12.10.14
From the results in Table 12.8, Appendix 12.2 and RWDI (1998), the
key findings of the wind tunnel testing may be summarised as follows:
·
The wind tunnel results show
that the LD03 contour only exceeds the site boundary for 1 tonne instantaneous
releases. For 1.4 kg/s and 0.5 kg/s continuous releases the LD03 does not
extend off-site; and
·
The LD contours for the 1
tonne instantaneous release cases are strongly influenced by the topography and
buildings near Sha Tin WTW. In particular:
-
The chlorine clouds are
constrained by the hills surrounding the WTW on three sides. However it is
noted that the LD03 contour does extend to an elevation of 100m above Principal
Datum (NNE wind direction) with significant concentrations of chlorine also
present at greater elevations (e.g. 30 ppm at 200m above PD); and
-
The nearest high rise blocks
of the Hin Keng Estate act as an effective barrier to chlorine dispersion in
the WSW direction with the chlorine cloud instead diverting down the Sha Tin
valley (i.e. following the path of least resistance).
12.10.15
The results of the CFD modelling for Sha Tin
WTW and Tai Po Tau WTW are presented in Appendix 12.3 and
summarised in Table 12.9. Full details can be found in HSL (1998) and
HSL (1999).
Table 12.9 Summary of
CFD Modelling Results
|
Release
case
|
Weather
Class
|
Maximum
extent of LD contour (m)
|
|
|
|
LD90
|
LD50
|
LD03
|
|
Sha
Tin WTW
|
|
|
|
|
|
1.4kg/s continuous
|
D2
F2
|
110
145
|
140
155
|
205
225
|
|
1 tonne instantaneous
|
D2
F2
|
170
220
|
200
255
|
255
275
|
|
Tai
Po Tau WTW
|
|
|
|
|
|
1.4kg/s continuous
|
D2
F2
|
135
130
|
165
180
|
265
330
|
|
1 tonne instantaneous
|
D2
F2
B2
|
200
180
75
|
215
255
95
|
255
355
105
|
12.10.16
From Table 12.9, HSL
(1998) and HSL (1999), the key findings of the CFD modelling may be summarised
as follows:
·
Atmospheric stability does
not significantly influence the hazard range of either a 1.4 kg/s continuous
release of chlorine or a 1 tonne instantaneous release of chlorine for the two
weather conditions of most interest in this study (i.e. D – neutral stability
and F – stable conditions). This is because, in the presence of buildings and
complex, heavily-vegetated terrain, atmospheric stability has less of an
influence on chlorine dispersion;
·
For B (unstable conditions)
the CFD results for Tai Po Tau WTW indicate that the chlorine hazard range is
significantly reduced compared to neutral conditions (i.e. a factor of 2.5
shorter for a 1 tonne instantaneous release). HSL indicate that this is due to
the unstable wind field which significantly enhances vertical dispersion of the
chlorine. However, as B conditions account for no more than 20% of the weather
in Hong Kong, this is not considered a significant factor for the QRA (i.e. risks
are not considered to be significantly overestimated by ignoring B conditions);
and
·
For F (stable conditions) the CFD results for
Tai Po Tau WTW indicate that, whilst the chlorine hazard range is not
significantly affected by atmospheric stability, the direction of travel of the
chlorine cloud may be affected. At Tai Po Tau WTW, the chlorine releases in F
conditions more closely followed the topographic contours than the equivalent
releases in D conditions, which followed the direction of the wind.
12.10.17
The results of the flat terrain dispersion
modelling using DRIFT are presented in Appendix 12.1 and
summarised in Table 12.10 below.
Table 12.10 Summary of
DRIFT Results
|
Release case
|
Weather Class
|
Maximum extent of LD contour (m)
|
|
|
|
LD90
|
LD50
|
LD03
|
|
0.2
kg/s continuous
|
D2
|
86
|
119
|
182
|
|
1.4
kg/s continuous
|
D2
|
268
|
362
|
550
|
|
1
tonne instantaneous
|
D2
|
325
|
425
|
600
|
|
3
tonnes instantaneous
|
D2
|
586
|
735
|
1044
|
|
10
tonnes instantaneous
|
D2
|
1004
|
1286
|
1790
|
12.10.18
From the results in Table 12.10 it is
possible to derive a relationship between the chlorine release rate (or release
quantity) and the downwind hazard range. The relationship is used in the QRA,
as described below.
12.10.19
Table 12.11 compares the key results from the wind tunnel
testing, CFD modelling, and DRIFT flat terrain dispersion modelling.
Table
12.11 Comparison of
Wind Tunnel, CFD and DRIFT Results (Neutral stability, 2m/s wind speed)
|
Release
case
|
Maximum
extent of LD03 contour (m)
|
|
|
|
|
Wind
tunnel
|
CFD
|
DRIFT
|
|
0.2
kg/s continuous
|
<125
|
-
|
182
|
|
1.4
kg/s continuous
|
<125
|
260
(Note 1)
|
550
|
|
1
tonne instantaneous
|
250-650
|
255
|
600
|
Note
1: Result from higher order discretisation scheme used in CFD modelling (HSL,
1998)
12.10.20
From Table 12.11 the
following key points emerge:
· The
chlorine hazard range predicted by the wind tunnel testing and CFD modelling is
generally shorter than that predicted by the DRIFT flat terrain dispersion
modelling, particularly for continuous-type releases. This highlights the
importance of modelling the effects of buildings and complex terrain, which act
to increase turbulence and cause greater mixing of the chlorine. (It should
also be noted that there is an inherent limitation in models such as DRIFT,
whereby the surface roughness chosen must be small in relation to the cloud
height. For dense gas release this limits the scope of DRIFT-type simulations
to relatively smooth terrain, which is not applicable to Hong Kong conditions);
· The
hazard range predicted by the wind tunnel testing for the 1.4 kg/s continuous
release case is significantly shorter than that predicted by the CFD modelling
(less than half). The reason for this is not certain, however an independent
technical review of the wind tunnel testing (Webber, 1998) highlighted the
limitation of modelling this type of release in the wind tunnel (1:500 scale)
due to the difficulty of accurately simulating turbulence close to the ground
near the source of the release. It is possible, therefore, that in the wind
tunnel the degree of turbulence was greater than would occur in practice for
this type of release. In view of this, the QRA uses the CFD modelling results
for this release, in preference to those generated by the wind tunnel; and
· The
hazard range predicted by the wind tunnel for 1 tonne instantaneous releases
are greater than those predicted by the CFD modelling. The reason for this is
not clear; however, as the wind tunnel results err on the conservative side (whilst
eliminating the pessimism in the DRIFT-type predictions for these releases)
they have been used in preference in the QRA.
Rationalisation of Chlorine Dispersion
Modelling Results
12.10.21
The preceding sections have discussed the
results arising from the various strands of work on chlorine dispersion
modelling. The following paragraphs summarise how these results have been
applied in the QRA. More details are provided in Appendix 12.4.
12.10.22
Wind
tunnel testing: the wind direction-specific
cloud shapes generated in the wind tunnel have been used directly in the QRA.
This has been achieved through use of Graphical Information Systems (GIS)
software which is described in further detail below. Another output of the wind
tunnel testing was the influence of wind speed on the chlorine hazard range.
From the wind tunnel test results for all eight WTWs a simple scale factor was
derived to modify the cloud contours for the 2m/s wind speed case to determine
those for the 5m/s case.
12.10.23
CFD modelling: the CFD
modelling results show no significant influence of atmospheric stability on the
chlorine hazard range (for D and F conditions), therefore this parameter is not
considered further in the QRA. However the CFD results for the 1.4 kg/s continuous
release case (D2 weather conditions), which are consistent for Sha Tin WTW and
Tai Po Tau WTW, are used in the QRA in preference to those from the wind
tunnel.
12.10.24
DRIFT
modelling:
the DRIFT flat terrain dispersion modelling results are not used directly in
the QRA. However the relationships derived from the DRIFT modelling for the
chlorine release rate/quantity versus hazard range are used to scale the wind
tunnel results for the complete range of release scenarios which need to be
considered in the QRA. One further aspect which needs to be considered in
applying the results of the wind tunnel testing in the QRA is the number of
individual wind tunnel directions which are considered. In the wind tunnel
testing up to eight wind directions were typically modelled for the most
important release scenarios (e.g. a 1 tonne instantaneous release). However, in
a QRA, it is usually necessary to consider a greater number of possible
directions, in order to eliminate any spurious, numerical error in the risk
results. The process of interpolating between the modelled wind directions is
called 'wind smoothing' (achieved mathematically in software such as RISKPLOT
the Consultants proprietary risk integration tool).
12.10.25
The application of wind smoothing in this
study was considered in detail in Technical
Note 1 (ERM, 1998). It was concluded that for sites with relatively flat
surrounding terrain, wind smoothing could be achieved by the simple method of
cloud 'rotation' (i.e. rotation of clouds to fill the directional 'gaps' left
by the wind tunnel). However for sites with complex terrain and/or high rise
buildings it would be necessary to demonstrate that the important effects of
the topography and buildings had been adequately captured in the raw wind
tunnel data. For Sha Tin WTW it was demonstrated in Technical Note 1 that sufficient number of wind directions were
considered in the wind tunnel testing, such that further wind smoothing was
either not necessary or could be achieved easily by the method of cloud
rotation without introducing any significant additional error.
Chlorine Cloud Height
12.10.26
Information on the height of a chlorine cloud
has been obtained from the wind tunnel simulations, CFD modelling and DRIFT
flat terrain dispersion modelling. This is useful for determining the degree of
protection of people inside high rise buildings. Details are presented in Appendix
12.5.
12.10.27
The data in Appendix 12.5 have been
rationalised for use in the QRA as shown in Table 12.12.
Table 12.12 Chlorine
Cloud Heights
|
Release case
|
Chlorine cloud height (m)
(Note 1)
|
Equivalent number of storeys (Note
2)
|
|
1.4
kg/s continuous
|
30
|
10
|
|
1
tonne instantaneous
|
6
|
2
|
|
10
tonnes instantaneous
|
9
|
3
|
Note
2: Assumes 3 m per storey
Modelling
of Escape from the Chlorine Cloud
12.10.28
In risk assessments for toxic gas releases it
is common practice to take into account the possibility of escape of exposed
persons. This is because at lower concentrations of the gas, people may be able
to obtain protection by moving indoors or directly out of the cloud.
12.10.29
Annex F1 of ERM
(2001) provides details of the modelling of escape from a chlorine cloud which
is also followed in this study. The methodology is similar to that developed by
the UK Health and Safety Executive (Lees and Ang, 1989). It assumes that a
person outdoors will have a probability of escape dependent on the chlorine
cloud concentration, with escape occurring either directly out of the cloud or
to a nearby building. The methodology takes into account the dose received
during escape as well as the subsequent dose in the place of refuge. Suitable
conservative assumptions are made for the time of escape bearing in mind the
debilitating effect of the chlorine gas.
12.10.30
Incorporating all the above considerations it
is possible to calculate an ‘effective’ outdoors fatality probability, i.e. the
fatality probability that can be applied to the total outdoor population at any
given location taking into account the probability of escape.
12.10.31
The consequence analysis gives three fatality
probability contours for each release scenario, corresponding to 3%, 50% and
90% nominal outdoor fatality probability. The effective outdoors fatality
probabilities corresponding to these levels of fatality are shown in Table 12.13.
Table
12.13 Effective Outdoors Probability of Fatality
|
Nominal outdoor fatality
probability
(for a person remaining outdoors)
|
% of population attempting escape
|
Effective outdoor fatality
probability
(taking into account the
probability of escape)
|
|
90%
|
0%
|
90%
|
|
50%
|
80%
|
31%
|
|
3%
|
80%
|
0.7%
|
Protection for Persons Indoors
12.10.32
Following similar previous studies undertaken
in Hong Kong and elsewhere, it is assumed that the probability of fatality for
a person indoors is 10% of that for a person remaining outdoors, i.e. nominal
outdoor fatality probability.
12.10.33
Protection is also considered for people on
the upper floors of high rise buildings. This is based on data on the typical
height of a chlorine cloud provided by the dispersion modelling.
Sensitive Populations
12.10.34
Certain groups of people, i.e. the young, the
elderly and the infirm will be more sensitive to the effects of chlorine than
others (ERM, 1997). This is
taken into account in the QRA by increasing the fatality rate applied to
certain sensitive receivers such as nurseries, primary schools, old people
homes and hospitals (see Table 12.3).
12.10.35
In line with data published by Withers and
Lees (1985) and risk criteria applied to sensitive developments in the UK and
Australia, the fatality rate for these groups of people is set a factor of 3.3
higher than for the average population.
Release Scenarios Considered
12.11.1
The consequence analysis from wind tunnel
testing and CFD modelling shows that it is only certain, severe types of
chlorine release which could produce fatal off-site concentrations of chlorine (Table 12.8 and Table 12.9). The release cases which fall into this
category are external continuous releases of 1.4 kg/s or more (equivalent to
guillotine failure of a drum valve) and instantaneous releases of 1 tonne or
more, either external or in which containment provided by the building is lost,
e.g. due to an earthquake or aircrash.
12.11.2
These results mean that many of the chlorine
release scenarios identified in Section 12.9 (Table 12.5) can be eliminated from further
consideration in the QRA.
12.11.3
Table 12.14 considers
each release scenario in turn and, based on the results of the consequence
analysis, determines whether the scenario poses an off-site hazard. Table 12.15 then summarises the results of the analysis
in Table 12.14 by
grouping the release scenarios into 'events' having identical release
characteristics (i.e. the same release rate, duration and phase of release).
Table 12.14 Rationalisation
of Chlorine Release Scenarios
|
Chlorine
release scenario
|
Outcome
|
Hole
size
|
Phase
|
Chlorine
release rate from primary source
(kg/s)
|
Chlorine
release quantity
(tonnes)
|
Chlorine
release rate (or quantity) to
atmosphere
|
Significant
off-site hazard ? (Y/N)
|
Event
Ref (2)
|
|
1. ACCESS ROAD
|
|
1.1 Truck fire
|
Considered to result in
melting of the fusible plugs on up to three drums.
|
3×6mm
|
Liquid
|
2.4
|
3
|
2.4 kg/s
|
Y
|
RU1TMML
|
|
1.3 Manoeuvring accident
|
Single drum – small leak
|
3 mm
|
liquid
|
0.2
|
1
|
0.2 kg/s
|
N
|
-
|
|
1.4 Rollover
|
Single drum – small leak
Single drum – medium leak
|
3 mm
8 mm
|
liquid
liquid
|
0.2
1.4
|
1
|
0.2 kg/s
1.4 kg/s
|
N
Y
|
-
RU1TSML
|
|
|
Three drums – medium leak
|
3×8mm
|
liquid
|
4.2
|
3
|
4.2 kg/s
|
Y
|
RU1TMML
|
|
|
Fire (outcomes as item 1.1
above)
|
|
|
|
|
|
|
|
|
1.5 Collision
|
Single drum – rupture
Fire (outcomes as item 1.1
above)
|
-
|
liquid
|
-
|
1 (inst)
|
1 tonne
|
Y
|
RU1TSRU
|
|
1.6 Loadshedding
|
Single drum – small leak
|
3 mm
|
liquid
|
0.2
|
1
|
0.2 kg/s
|
N
|
-
|
|
|
Single drum – medium leak
|
8 mm
|
liquid
|
1.4
|
1
|
1.4 kg/s
|
Y
|
RU1TSML
|
|
1.7 Spontaneous container
failure
|
Single drum – medium leak
|
8 mm
|
liquid
|
1.4
|
1
|
1.4 kg/s
|
Y
|
RU1TSML
|
|
|
Single drum – large leak
|
20 mm
|
liquid
|
8.8
|
1
|
8.8 kg/s(3)
|
Y
|
RU1TSRU
|
|
|
Single drum – rupture
|
-
|
liquid
|
-
|
1 (inst)
|
1 tonne
|
Y
|
RU1TSRU
|
|
2. DRUM HANDLING
|
|
2.1 Dropped drum
|
Single drum – medium leak
|
8 mm
|
liquid
|
1.4
|
1
|
0.30 kg/s
|
N
|
-
|
|
|
Single drum – large leak
|
20 mm
|
liquid
|
8.8
|
1
|
0.55 kg/s
|
N
|
-
|
|
|
Single drum – rupture
|
-
|
liquid
|
-
|
1 (inst)
|
16 kg
|
N
|
-
|
|
2.2 Collision of drum with
another object
|
Single drum – medium leak
|
8 mm
|
liquid
|
1.4
|
1
|
0.30 kg/s
|
N
|
-
|
|
2.3 Accidental impact of
drum on pigtail during setdown at standby position
|
Pigtail – guillotine
failure
|
4.5 mm
|
two-phase
|
0.12
|
1
|
0.027 kg/s
|
N
|
-
|
|
2.4 Dropped drum due
to overextension of truck crane
|
Single drum – medium leak
|
8 mm
|
liquid
|
1.4
|
1
|
0.30 kg/s
|
N
|
-
|
|
2.5 Dropped drum due
to incorrect alignment of monorail
track
|
As item 2.1 above
|
|
|
|
|
|
|
|
|
3. CONTAINERS IN STORAGE
|
|
3.1 Leaking chlorine drums
|
Single drum – medium leak
|
8 mm
|
liquid
|
1.4
|
1
|
0.30 kg/s
|
N
|
-
|
|
|
Single drum – large leak
|
20 mm
|
liquid
|
8.8
|
1
|
0.55 kg/s
|
N
|
-
|
|
|
Single drum – rupture
|
-
|
liquid
|
-
|
1 (inst)
|
16 kg
|
N
|
-
|
|
3.2 Overfilled drums
leading to overpressurisation on thermal expansion
|
As item 3.1 above
|
|
|
|
|
|
|
|
|
3.3 Impurities in chlorine
drum leading to explosion or leak
|
As item 3.1 above
|
|
|
|
|
|
|
|
|
3.6 External explosion
|
Single drum – medium leak
|
8 mm
|
liquid
|
1.4
|
1
|
0.30 kg/s
|
N
|
-
|
|
3.12 Earthquake
|
Overhead crane dislodged
from rails:
single drum-rupture
|
-
|
liquid
|
-
|
1 (inst)
|
16 kg
|
N
|
-
|
|
|
Roof collapse:
multiple drum-rupture
|
-
|
liquid
|
-
|
36 (4) (inst)
|
23 tonnes (1,4)
|
Y
|
EU1TMRU
EU1TMRU1G
|
|
3.13 Aircraft crash
|
Roof collapse:
multiple drum rupture
(similar to earthquake)
|
-
|
liquid
|
-
|
36 (4) (inst)
|
23 tonnes (1,4)
|
Y
|
AU1TMRU
|
|
3.15 Vehicle crash
|
Single drum – medium leak
|
8 mm
|
liquid
|
1.4
|
1
|
0.30 kg/s
|
N
|
-
|
|
4. CONNECTION AND
DISCONNECTION OF CHLORINE CONTAINERS
|
|
4.1 Human error or
equipment failure during connection/disconnection of drums
|
Pigtail – guillotine
failure
|
4.5 mm
|
two-phase
|
0.12
|
1
|
0.027 kg/s
|
N
|
-
|
|
5. CHLORINATION SYSTEM
|
|
|
5.1–5.5 Failures
associated with the chlorination system pipework
|
Liquid chlorine pipework –
guillotine failure
|
4.5 mm
|
two-phase
|
0.12
|
1.05
|
0.027 kg/s
|
N
|
-
|
|
5.6–5.7 Failure of
Evaporator
|
Evaporator – leak or
rupture
|
4.5 mm
|
two-phase
|
0.12
|
1.05
|
0.027 kg/s
|
N
|
-
|
Note (1): For large
instantaneous releases, 64% of the chlorine is estimated to be released
instantaneously to atmosphere as vapour and entrained aerosol. This comprises
the initial vapour flash fraction (19%) plus the entrained aerosol (2 × 19%)
plus the contribution from the evaporating chlorine pool over the first minute
(7%).
Note
(2): Key to event ref
E R
(Road) or E (Earthquake) or A (Aircraft crash) or I (internal)
U U
(Unisolated) or I (Isolated)
1T 1T
(1-tonne drums)
M S
(Single) or M (Multiple)
RU RU
(Rupture), LL (Large Leak), ML (Medium Leak) or SL(Small Leak)
1G Earthquake
of higher ground acceleration
Note
(3): These releases treated as effectively instantaneous releases due to short
release duration
Note
(4): The values listed are for the maximum 190 tonnes storage. For reduced
storage scenarios they are reduced in proportion to the storage levels (see
discussion in Appendix 12.7)
Table 12.15 Release
Scenarios Included in QRA
|
Event
Ref
|
Component
scenarios
|
Release
rate (or quantity) to atmosphere
|
Type
of release
|
Release
location
|
|
RU1TSML
|
Rollover
Loadshedding
Spontaneous leak
|
1.4 kg/s
|
Continuous
|
Access road
|
|
RU1TMML
|
Rollover
Truck fire
|
4.2 kg/s
|
Continuous
|
Access road
|
|
RU1TSRU
|
Truck impact
Spontaneous failure
|
1 tonne
|
Instantaneous
|
Access road
|
|
EU1TMRU
|
Earthquake: roof collapse,
ground acceleration 0.7g
|
23 (1) tonnes
|
Instantaneous
|
Chlorination House
|
|
EU1TMRU1G
|
Earthquake: roof collapse,
ground acceleration 1g
|
23 (1) tonnes
|
Instantaneous
|
Chlorination House
|
|
AU1TMRU
|
Aircraft crash
|
23 (1) tonnes
|
Instantaneous
|
Chlorination House
|
Note (1):
the values listed are for maximum 190 tonnes storage. For reduced storage
scenarios they are reduced in proportion to the storage levels
Frequency Estimation
12.11.4
Next step in the Hazard Assessment is to
determine the frequency of occurrence of scenarios listed in Table 12.15. This is based on the approach outlined in
the Consultants' Methodology Report
(ERM, 1997).
12.11.5
Table 12.16 summarises the base data which has been used
in the frequency calculations. Following the methodology described in ERM
(2001) and also applied in ERM (2011a), actual frequencies are then determined
based on these base failure data and the operational parameters of the WTW such
as chlorine use, chlorine storage levels, and length of the access road or, in
the case of the aircraft crash event, the Sha Tin WTW location in relation to
the flight path, number of flights into CLK airport etc. The resulting total
event frequencies are presented in Table 12.17.
Table
12.16 Base Failure Rate Data
|
Data
item
|
Value
|
Units
|
Source
|
|
1. Chlorination House
|
|
1.1 (i) Spontaneous
container failure frequency
(ii) Conditional
probability of catastrophic failure
(iii) Conditional
probability of
medium leak
(iv) Conditional probability of
large
leak
|
1.5E-4
2.7E-2
2.2E-1
8.1E-2
|
per year
-
-
-
|
Methodology Report (ERM, 1997), based on review of worldwide
failure data for chlorine containers and generic pressure vessel failure data
|
|
1.2 (i) Probability
of dropped
container
(ii) Conditional probability of catastrophic failure
|
7.7E-6
1.0E-4
|
per lift
-
|
Methodology
Report
(ERM, 1997) based on Hong Kong data for number of lifts which have occurred
without incident
|
|
2. Chlorine delivery vehicle
|
|
2.1 (i) Frequency
of loadshedding
(ii) Conditional probability of a medium leak
|
1.1E-7
6.3E-2
|
per truck-km
-
|
Methodology
Report
(ERM, 1997) based on Chlorine Transport Risk Study, DNV (1997)
|
|
2.2 (i) Frequency
of rollover
(ii) Conditional probability
of a small leak from a single drum
(ii) Conditional
probability of a medium leak of a single drum
(iii) Conditional
probability of medium
leak of multiple drums
|
1.9E-7
2.4E-1
1.5E-1
1.1E-2
|
per truck-km
-
-
-
|
Methodology
Report
(ERM, 1997) based on Chlorine Transport Risk Study, DNV (1997) (1)
|
|
2.3 (i) Frequency
of vehicle impact
(ii) Conditional
probability of drum rupture
|
4.0E-7
1.7E-2
|
per truck-km
-
|
Chlorine Transport Risk
Study, DNV (1997) (1)
|
|
2.4 Frequency of spontaneous truck fire
|
4.0E-9
|
per truck-km
|
Chlorine Transport Risk
Study, DNV (1997)
|
|
3. External events
|
|
3.1 (i) Frequency
of earthquake of 0.7g
ground acceleration
(ii) Probability
of roof collapse in an earthquake of 0.7g ground
acceleration
|
4.0E-7
0.1
|
per year
-
|
Cook et al. (1993)
Water Treatment Works
Seismic Hazard Assessment, Ove Arup (2001)
|
|
3.2 (i) Frequency
of earthquake of 1.0g
ground acceleration
(ii) Probability
of roof collapse in an earthquake of 1.0g ground
acceleration
|
2.5E-8
0.5
|
per year
-
|
Cook et al. (1993)
Water Treatment Works
Seismic Hazard Assessment, Ove Arup (2001)
|
|
3.3
Frequency of aircraft crash
|
1.2E-8
|
per landing
|
Based on US National
Transportation Safety Board aircraft crash date 1982–1998
(Annex H of ERM, 2001)
|
Note
1: The DNV (1997) rollover and impact frequencies were derived from the general
truck accident involvement rate on Hong Kong roads. This is a very conservative
assumption considering the very low traffic volume and very low chlorine truck
speed on the access road. Considering also the low traffic volume and low speed
of construction vehicles on site, the segregation of chlorine delivery route
and construction traffic access roads as well as implementation of the relevant
good practice measures recommended in this report, it is believed that even
with the presence of construction vehicles and machinery on-site, this
frequency remains valid for the Construction Phase of the Project and is still
conservative.
Table 12.17 Event Frequencies
|
Event
Ref
|
Component
scenarios
|
Frequency
(per
year)
|
Time
periods during which event could occur
|
|
RU1TSML1
|
Rollover
Loadshedding
Spontaneous leak
Total
|
2.22E-6
5.23E-7
1.74E-7
2.92E-6
|
All except Night
All except Night
All except Night
|
|
RU1TMML1
|
Rollover
Truck fire
Total
|
1.59E-7
3.04E-7
4.63E-7
|
All except Night
All except Night
|
|
RU1TSRU1
|
Truck impact
Spontaneous drum failure
Total
|
5.19E-7
8.44E-8
6.03E-7
|
All except Night
All except Night
|
|
EU1TMRU
|
Earthquake
|
4.0E-8
|
All
|
|
EU1TMRU1G
|
Earthquake
|
1.25E-8
|
All
|
|
AU1TMRU
|
Aircraft crash
|
1.44E-9
|
All
|
Note 1: Frequencies for the access
road events are proportional to the number of chlorine trucks per year and are
shown here for the operational phase WTW chlorine usage of 761 tonnes (127
trucks) per year, assuming the on-site length of the access route of 0.6 km and
the on-site chlorine truck speed of 10 km/h. Frequencies for the construction
phase scenario with lower chlorine usage were reduced accordingly.
Assessment Methodology
12.12.1
The QRA combines information on the
consequences of chlorine releases with information on the likelihood of
releases to generate two measures of risk - individual risk and societal risk.
Individual risk is the chance of death per year to a specified individual at a
specific location. Societal risk is the risk to the population as a whole.
12.12.2
The QRA has been undertaken using a GIS-based
software GISRisk, developed for the 8
WTW project. The GIS component of the software enables the complex cloud shapes
generated by the wind tunnel to be input directly into the QRA. It also
provides a graphical interface by which the population data, chlorine cloud
(LD) contours and individual risk contours can be viewed on a base map of the
area. GISRisk is an application of
standard, well-validated, commercial software, i.e. ESRI's ARCVIEW GIS
software, Microsoft Access and Microsoft Excel.
12.12.3
Associated with the GIS software is a
database containing all the relevant information relating to the WTW, the
defined events, the meteorological data, the population data and the chlorine
cloud coordinates. The database contains the routines for the calculation of
individual and societal risk.
12.12.4
The main outputs from the software are as
follows:
·
Individual
risk in the form of iso-risk contours overlaid on
a base map of the area;
·
Societal
risk in the form of an FN curve, which is a graphical representation of the cumulative
frequency (F) of N or more fatalities plotted against N on a log-log scale; and
·
Societal risk in the form of a Potential
Loss of Life (PLL) value, which expresses the risk to the population as a
whole and for each scenario and its location. The PLL is an integrated measure
of societal risk obtained by summing the product of each f-N pair, as below:
PLL
= f1N1 + f2N2 +… + fnNn
12.12.5
The individual and societal risk guidelines
are described in Section 12.2.
Societal Risk Results for STWTW
12.12.6
The FN curves for the construction and operational
phase scenarios for STWTW are presented in Figure 12.12 and
Figure 12.13 to assess the risk levels within STWTW CZ. Table 12.18 summarises the maximum N numbers derived from these figures. Table 12.19 and Table 12.20 present the overall PLL values, together
with a breakdown of the PLL by release scenario and affected population. These
results are very similar to those presented in the recent SCL QRA study (ERM,
2011a), since only a few population units have changed slightly.
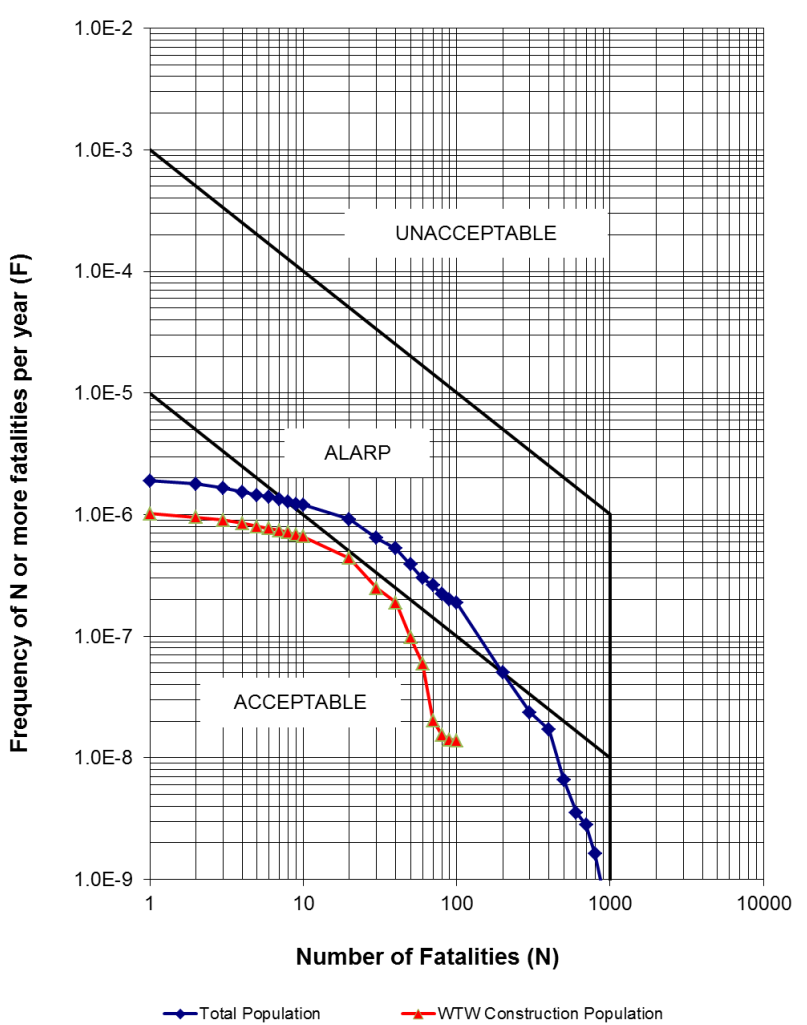
Figure
12.12 FN Curves for
STWTW: Construction Phase (PLL for Total Population is 7.4E-5 and PLL for
Construction Population is 2.28E-5)
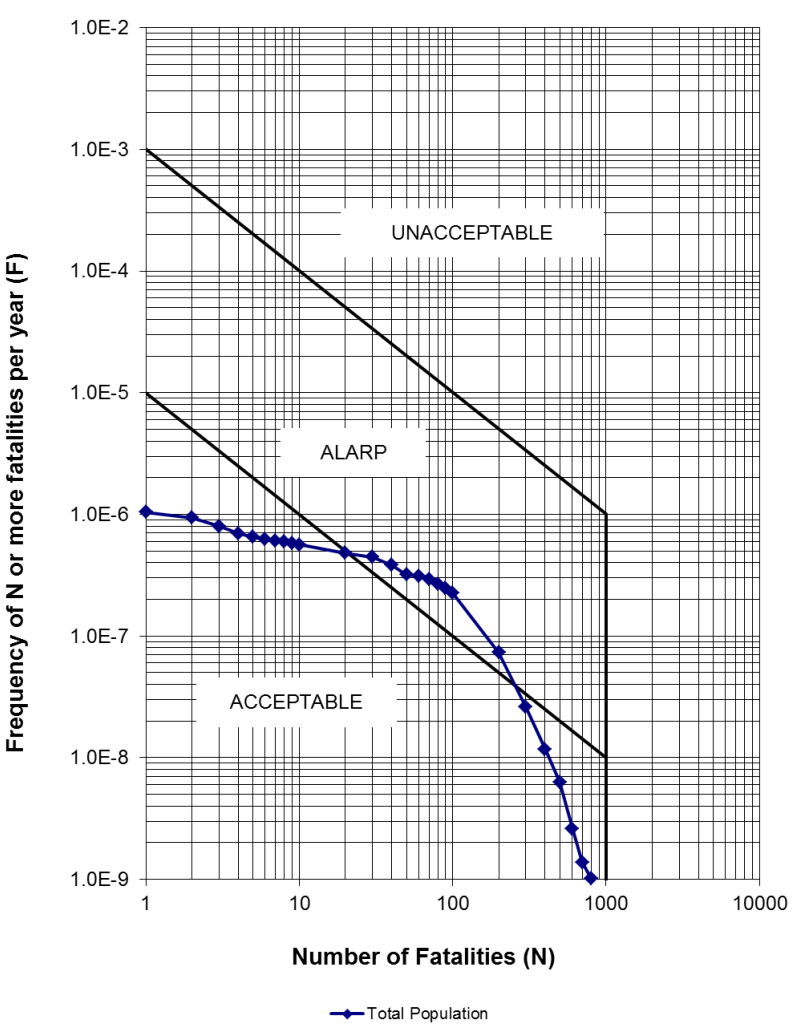
Figure 12.13 FN Curve for STWTW: Operational Phase (PLL for Total Population
is 6.0E-5)
Main
Risk Contributors
12.12.7
The high number of fatalities shown in Figure 12.12, Figure 12.13 and Table 12.18 are due to
the low frequency/high fatality events such as a multiple drum failure which
can result from the Chlorination House roof collapse during a significant
(ground acceleration greater than 0.7g) earthquake.
12.12.8
The earthquake frequencies used in this
study, 4 × 10⁻⁷ (i.e. once in 2.5 million years) and 2.5 × 10⁻⁸
for 0.7g and 1g earthquakes, respectively, as well as the probability of a
store roof collapse in an earthquake and the numbers of chlorine drums ruptured
were derived as part of the Reassessment
of Chlorine Hazard for Eight Existing Water Treatment Works study
commissioned by WSD.
12.12.9
While the earthquake scenarios are dominant
for the high N values of the FN
curve, the chlorine truck accident scenarios that can affect only the
populations close to WTW and on their own contribute to about 500 fatalities,
have higher frequencies than earthquakes, and contribute about 80% to the total
PLL (Table 12.19).
Table
12.18 Maximum N Value within the FN Chart
|
Scenario
|
Max N for
F > 1 × 10⁻⁹
|
|
Scenario
1: Construction Phase
|
880
|
|
Scenario
2: Operational Phase
|
810
|
|
2001
QRA (ERM, 2001)
|
980
|
Table 12.19 Breakdown of
PLL by Release Scenario
|
Release Scenario
|
Construction Phase
|
Operational Phase
|
|
RU1TMML
|
1.8E-5
(24.5%)
|
2.0E-5
(33.3%)
|
|
RU1TSML
|
2.7E-5
(36.7%)
|
2.4E-5
(40.2%)
|
|
RU1TSRU
|
1.3E-5
(17.4%)
|
2.8E-6
(4.7%)
|
|
Total: chlorine truck incidents
(on-site)
|
5.8E-5
(78.6%)
|
4.7E-5
(78.2%)
|
|
AU1TMRU
|
6.5E-7
(0.9%)
|
6.5E-7
(1.1%)
|
|
EU1TMRU
|
1.2E-5
(15.9%)
|
9.9E-6
(16.5%)
|
|
EU1TMRU1G
|
3.4E-6
(4.6%)
|
2.5E-6
(4.2%)
|
|
Total: earthquake and aircraft crash
|
1.6E-5
(21.4%)
|
1.3E-5
(21.8%)
|
|
Total (per year)
|
7.4E-5
(100%)
|
6.0E-5
(100%)
|
12.12.10
The maximum N value as shown in Table 12.18 is a
summation of all events causing N or
more fatalities. Being a summation of multiple events, the contribution of each
population group to the total will vary depending on wind direction for example;
it is therefore impossible to present a breakdown of max N by the different population groups. A more meaningful measure of
such contributions is PLL as presented in Table 12.20.
Nevertheless, while comparing the maximum N
values for Scenario 1 and Scenario 2 and that for the 2001 QRA, (Table 12.18), it may be noted that reduction of chlorine
storage results in a reduction of max N
despite the increase in population.
Table 12.20 Breakdown of
PLL by Population
|
Ref(1)
|
PLL Scenario 1
Construction Phase
|
%
|
PLL Scenario 2
Operational Phase
|
%
|
|
A
|
8.35E-8
|
0.1%
|
8.74E-8
|
0.1%
|
|
A1
|
4.59E-10
|
0.0%
|
6.45E-10
|
0.0%
|
|
B
|
1.41E-7
|
0.2%
|
3.57E-7
|
0.6%
|
|
C
|
4.21E-8
|
0.1%
|
4.80E-8
|
0.1%
|
|
D
|
0.00E+0
|
0.0%
|
0.00E+0
|
0.0%
|
|
E
|
9.47E-7
|
1.3%
|
1.05E-6
|
1.8%
|
|
F
|
1.91E-8
|
0.0%
|
2.31E-8
|
0.0%
|
|
G
|
6.17E-8
|
0.1%
|
6.65E-8
|
0.1%
|
|
H
|
2.30E-8
|
0.0%
|
2.32E-8
|
0.0%
|
|
H1
|
7.11E-9
|
0.0%
|
6.85E-9
|
0.0%
|
|
H2
|
3.88E-9
|
0.0%
|
3.86E-9
|
0.0%
|
|
I
|
8.44E-7
|
1.1%
|
9.82E-7
|
1.6%
|
|
J
|
2.16E-6
|
2.9%
|
2.59E-6
|
4.3%
|
|
K
|
3.24E-6
|
4.4%
|
3.77E-6
|
6.3%
|
|
L
|
1.55E-8
|
0.0%
|
1.59E-8
|
0.0%
|
|
L1
|
2.67E-8
|
0.0%
|
5.46E-9
|
0.0%
|
|
M
|
2.00E-8
|
0.0%
|
2.37E-8
|
0.0%
|
|
N
|
3.41E-7
|
0.5%
|
4.30E-7
|
0.7%
|
|
O
|
1.20E-5
|
16.3%
|
1.36E-5
|
22.7%
|
|
P
|
6.02E-7
|
0.8%
|
6.91E-7
|
1.2%
|
|
Q
|
8.71E-9
|
0.0%
|
8.89E-9
|
0.0%
|
|
R1
|
1.00E-6
|
1.4%
|
1.32E-6
|
2.2%
|
|
S1
|
3.52E-8
|
0.0%
|
3.82E-8
|
0.1%
|
|
S2
|
9.95E-8
|
0.1%
|
1.13E-7
|
0.2%
|
|
S3
|
8.94E-7
|
1.2%
|
9.59E-7
|
1.6%
|
|
S3A
|
7.84E-8
|
0.1%
|
8.49E-8
|
0.1%
|
|
T
|
1.68E-8
|
0.0%
|
1.78E-8
|
0.0%
|
|
T1
|
8.39E-6
|
11.4%
|
0.00E+0
|
0.0%
|
|
T2
|
8.64E-6
|
11.7%
|
0.00E+0
|
0.0%
|
|
T5
|
5.75E-6
|
7.8%
|
0.00E+0
|
0.0%
|
|
U
|
2.05E-7
|
0.3%
|
2.23E-7
|
0.4%
|
|
V
|
0.00E+0
|
0.0%
|
0.00E+0
|
0.0%
|
|
W
|
2.35E-7
|
0.3%
|
3.00E-7
|
0.5%
|
|
W1
|
4.11E-8
|
0.1%
|
4.83E-8
|
0.1%
|
|
X
|
8.19E-9
|
0.0%
|
1.49E-8
|
0.0%
|
|
Y
|
7.20E-7
|
1.0%
|
7.77E-7
|
1.3%
|
|
Z1
|
5.64E-6
|
7.7%
|
6.50E-6
|
10.9%
|
|
Z2
|
9.95E-7
|
1.4%
|
1.16E-6
|
1.9%
|
|
Z5
|
0.00E+0
|
0.0%
|
2.42E-8
|
0.0%
|
|
Z6
|
6.04E-6
|
8.2%
|
1.71E-5
|
28.6%
|
|
Z7
|
7.47E-6
|
10.2%
|
0.00E+0
|
0.0%
|
|
Z8
|
1.43E-8
|
0.0%
|
0.00E+0
|
0.0%
|
|
Z9
|
3.86E-7
|
0.5%
|
0.00E+0
|
0.0%
|
|
Z10
|
7.15E-7
|
1.0%
|
8.23E-7
|
1.4%
|
|
AA1
|
8.77E-10
|
0.0%
|
9.35E-10
|
0.0%
|
|
AA2
|
2.78E-11
|
0.0%
|
8.84E-10
|
0.0%
|
|
AA3
|
0.00E+0
|
0.0%
|
5.02E-11
|
0.0%
|
|
AD
|
4.08E-9
|
0.0%
|
4.25E-9
|
0.0%
|
|
AF
|
1.29E-9
|
0.0%
|
1.34E-9
|
0.0%
|
|
AG
|
4.40E-9
|
0.0%
|
5.17E-9
|
0.0%
|
|
AH
|
0.00E+0
|
0.0%
|
1.64E-11
|
0.0%
|
|
AI
|
4.12E-9
|
0.0%
|
4.12E-9
|
0.0%
|
|
AJ1
|
1.91E-7
|
0.3%
|
2.03E-7
|
0.3%
|
|
AK
|
8.75E-8
|
0.1%
|
8.96E-8
|
0.1%
|
|
AL
|
2.39E-8
|
0.0%
|
2.49E-8
|
0.0%
|
|
AN
|
3.23E-9
|
0.0%
|
3.60E-9
|
0.0%
|
|
AO
|
4.30E-6
|
5.8%
|
4.99E-6
|
8.3%
|
|
AP
|
3.91E-7
|
0.5%
|
4.51E-7
|
0.8%
|
|
others (outside CZ)
|
6.38E-7
|
0.9%
|
7.01E-7
|
1.2%
|
|
Total
|
7.36E-5
|
100.0%
|
5.98E-5
|
100.0%
|
Note 1: for description and locations of
population units see Table 12.3 and Figure 12.8
and Figure 12.9
Note 2: Highlighted are three top PLL
contributors for each scenario
12.12.11
In terms of the Potential Loss of Life (Table 12.20), the South Works reprovisioning workers (units
T1, T2 and T5) contribute about 31% of the total PLL value for the Construction
Phase. This high contribution is due to their proximity to the potential
chlorine release locations. The PLL reduces to 5.08 × 10⁻⁵ without
considering the construction workers, which is less than the total PLL value
for Scenario 2 (Operational Phase), which has a higher maximum chlorine storage
and usage after the WTW resumes its full throughput after the reprovisioning.
Individual Risk
12.12.12
The individual risk is defined as the
probability of a fatality for a hypothetical person spending 100% of their time
outdoors in the vicinity of the Sha Tin WTW. As noted in Section 12.2, HK Risk Guidelines stipulate that the maximum
level of off-site risk should not exceed 1 in 100000 per year, i.e. 1 × 10⁻⁵
per year.
12.12.13
Individual risk is independent of
the assumed population levels and depends only on the operating parameters of
the WTW. Therefore, the estimates of the maximum off-site individual risk
levels obtained for the purposes of SCL QRA (ERM, 2011a) remain valid for the
present assessment.
12.12.14
Following ERM (2011a), Figure 12.14 presents the individual risks obtained for
the worst case scenario assuming the maximum chlorine storage of 190 tonnes.
Risks for actual construction and operational phase scenarios will be slightly
lower due to the lower average chlorine storage and usage levels. As can be
seen, even for the worst-case scenario the risks are low, and nowhere outside
the WTW site boundary does the individual risk exceed 10-6 per year.
It is therefore concluded that Sha Tin WTW complies with the individual risk
criteria.
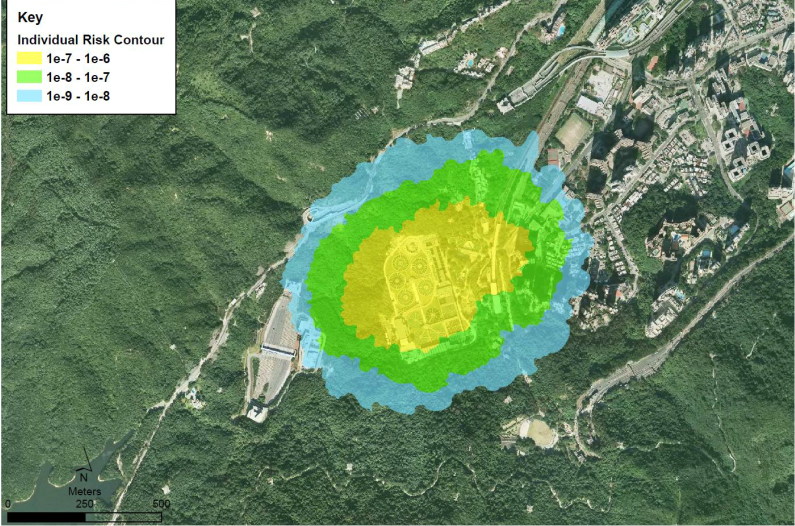
Figure 12.14 Individual Risk
Contours
Result Summary
12.12.15
The societal risk results are found to be
very similar to those obtained in the recent SCL QRA study (ERM, 2011a) and lie
within the “ALARP” region of the HKRG.
12.12.16
Individual risk levels are in compliance with
HKRG.
12.12.17
In terms of the Potential Loss of Life (Table 12.20), the South Works reprovisioning workers contribute
about 31%, of the total PLL value for the Construction Phase (Scenario 1). Without
the presence of the reprovisioning workers on-site, societal risks expressed in
terms of PLL for the Construction Phase (Scenario 1) are lower than for the
future Operational Phase (Scenario 2). This is due to the increase in chlorine
usage once the Sha Tin WTW returns to full capacity after the reprovisioning
work is complete.
12.12.18
Nevertheless, it should be stressed that the
South Works reprovisioning is an improvement project. The use of new treatment technologies
will lead to a permanent reduction in chlorine storage (from 221 tonnes to
maximum of 190 tonnes) and usage when compared to today’s levels.
Recommendations from Previous Studies
12.13.1
Since the societal risk levels for both
scenarios considered lie in the ALARP zone of the HKRG, mitigation measures are
required to reduce the risks to levels As Low As Reasonably Practicable. This
section discusses potential mitigation measures and assesses their
practicability.
12.13.2
A number of mitigation measures have been
considered and assessed in the original QRA for Sha Tin WTW (ERM, 2001).
According to the information provided by WSD, those of the 2001 measures
considered practicable have been already implemented at the WTW.
12.13.3
A comprehensive set of possible mitigation
measures, related to the WTW operations was also considered under the recent
SCL QRA (ERM, 2011a) however none of these measures passed the cost-benefit
analysis test. That ALARP analysis remains valid for the present QRA as well.
12.13.4
Another measure that would reduce the risks
related to the chlorine storage as well as on-site and off-site transport would
be the on-site generation of chlorine by electrolysis of brine solution and
on-site hypochlorite generation. Such a measure was suggested for consideration
in the CCPHI-approved QRA for the expansion of Tai Po WTW. However, according
to information provided by WSD, on-site generation of chlorine is not adopted
worldwide for drinking water treatment. For on-site generation of hypochlorite,
WSD has recently reviewed the latest developments of such technology. After
considering the merits and demerits of the technology, worldwide practice,
operation and maintenance details, capital and operating costs, regulations on
the Disinfection Byproducts (DBPs) and the suitability of its use in Hong Kong,
it has been concluded that among the options of chlorine base disinfectants
used for potable water treatment, liquid chlorine is still the most suitable
and cost-effective disinfectant for water treatment use in Hong Kong situation.
WSD has no plan to change the present practice of using liquid chlorine as a
disinfectant for the present moment. Nevertheless, WSD will continue to keep
under review the latest developments of use of alternative disinfectants in the
water supply industry.
Protection of the Reprovisioning Workers
12.13.5
ERM (2011a) conducted a detailed analysis of
possible measures for protection of the SCL construction workers and concluded
that the only potentially practicable mitigation option was the installation of
chlorine gas monitors in the relevant work areas. The same mitigation option is
appropriate for WTW reprovisioning workers. Gas detectors and audible alarms should
be provided around on-site work areas and these should be connected with
emergency response and evacuation plans with adequate training and drills. The
emergency response plan also applies to WSD STWTW operation workers and
surrounding population during both Construction and Operational Phases in case
there is chlorine leak in STWTW.
12.13.6
A number of measures, relating to protection
of construction workers on-site were also recommended in the EIA for Integration of Siu Ho Wan and Silver Mine
Bay Water Treatment Works (B&V, 2010). Most of these measures that are
relevant to this project (such as installation of audible chlorine release
alarm in the chlorine store area, imposing of speed limits for the chlorine
truck etc. have already been implemented at Sha Tin WTW. Nevertheless a number
of measures proposed in (B&V, 2010) has been considered in this study and
recommended as good practice measures (see Table 12.22).
Cost-Benefit
Analysis
12.13.7
Cost-benefit analysis compares the Implied
Cost of Averting a Fatality (ICAF) with “the adjusted value of life” which,
following ERM (2001, 2011a) is assumed at HK$ 660M. ICAF is defined as:
ICAF = Cost of mitigation measure /
(Reduction in PLL value × Design life of mitigation measure)
12.13.8
ICAF for provision of gas detectors and
emergency drills is estimated considering that they can enhance the escape
probability of workers and effectively provide a 50%()
PLL reduction for the reprovisioning workers (i.e. 50% reduction of the 2.28 ×
10-5 total for the rows T1, T2 and T5 in Table 12.20) over a three years period and that their
cost will amount to about HK$ 1M. Thus:
ICAF = 1M/(1.14 × 10-5 × 3) = 2.93
×
104M
As can be seen, the above ICAF is
well above the practicability criterion of 660M. Nevertheless, installation of
chlorine gas monitors with audible alarms in the relevant reprovisioning works
areas, establishing emergency response and evacuation plans and adequate
training and drills are recommended for implementation.
12.13.9
ERM (2011a) considered two measures to
mitigate the risks related to a massive chlorine release due to the chlorine
store roof collapse during an earthquake. These included the reduction of
chlorine storage at the WTW and the enhancement of the seismic performance of
the chlorine store. Both these measures were deemed not practicable based on
the cost-benefit analysis. Since for the operational phase scenario the PLL values
due to the earthquake and aircraft crash (see Table 12.19) are close to those obtained in the previous
study, the conclusion of ERM (2011a) remains valid. However, due to the
presence of construction workers, the cost-benefit analysis needs to be
repeated for the construction phase scenario. Details are provided in Table 12.21.
Table
12.21 Calculation
of ICAF for Candidate Mitigation Measures (Construction Phase Scenario)
|
Mitigation
measure
|
Cost
Estimate
(HK$M)
|
PLL
reduction (per year)
|
Design
life (years)
|
ICAF
(HK$M)
|
Practicable?
(ICAF<
$660M
?)
|
Notes
|
|
Chlorine
gas monitors with audible alarms in reprovisioning works areas, emergency
response and evacuation plans
|
1
|
1.14
× 10-5
|
3
|
2.93
× 104
|
N
|
Recommended
as a matter of good practice
|
|
Reduction
of chlorine storage at WTW
|
10
|
7.55
× 10-6
|
3
|
4.42
× 105
|
N
|
Further
reduction of storage may not be possible for logistical reasons or would
involve significant capital and operational costs (building alternative
storage elsewhere), that for the purpose of this analysis are estimated at
HK$ 10M. ICAF is estimated based on the 50% reduction in PLL due to the store
roof collapse. ERM (2011a) estimated ICAF for the Operational Phase at HK$ 33,333
M
|
|
Enhancement
of seismic performance of chlorine store
|
5
|
1.51
× 10-5
|
3
|
1.10
× 105
|
N
|
This
measure would eliminate (or significantly reduce) the seismic risk. However
it would involve major civil works, hence the estimated cost is HK$ 5M. ICAF
is estimated based on the 100% reduction in PLL due to the store roof
collapse. ERM (2011a) estimated ICAF for the Operational Phase at HK$ 8,333 M
|
12.13.10
Therefore, based on the cost-benefit
analysis, apart from the provision of chlorine gas monitors with audible alarms
in reprovisioning works areas and establishing emergency response and
evacuation plans, no additional risk mitigation measures during the Construction
and Operational Phases of this project are considered practicable.
Mitigated Case: Societal Risk Results
12.13.11
Based on estimation in SCL project,
implementation of the chlorine gas monitors with audible alarms in the relevant
works areas, establishing emergency response, and evacuation plans and adequate
training and drills will result in a 50% decrease in the PLL for the reprovisioning
workers, the total PLL for the Construction Phase would be reduced to 6.2 × 10⁻⁵
per year.
12.13.12
The FN curve obtained under the assumption
that risks to the construction workers are reduced by 50% is shown in Figure 12.15.
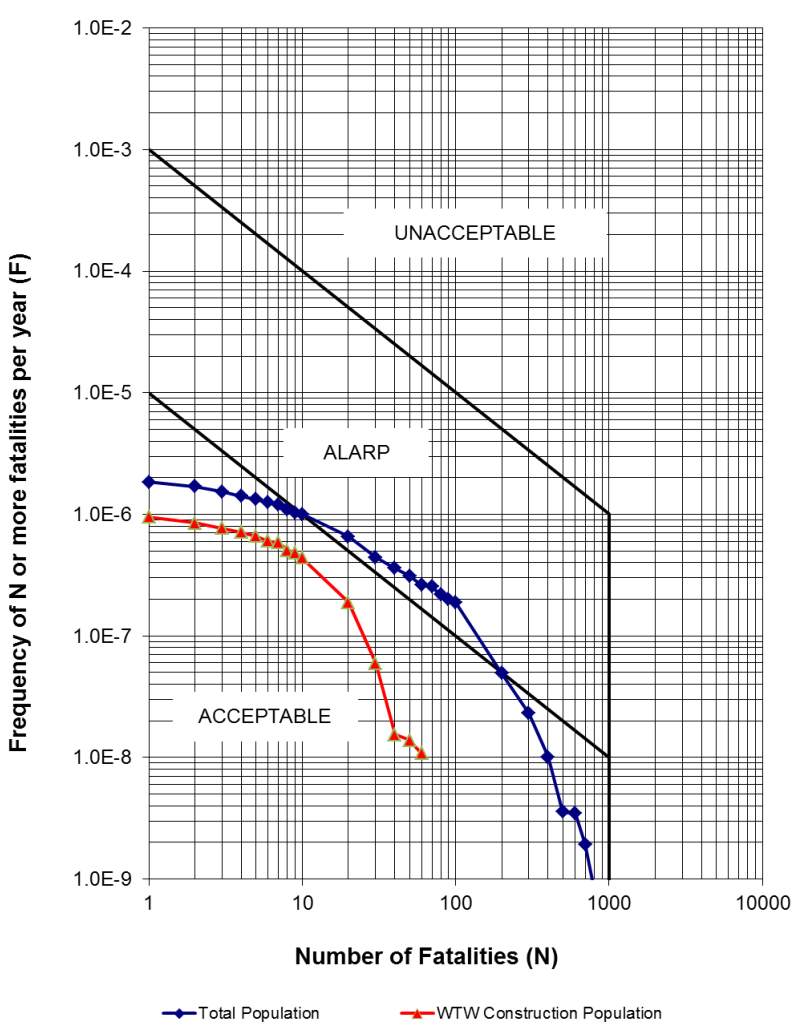
Figure 12.15 FN Curve for the Mitigated Case of Construction Phase Scenario
(PLL for Total Population is 6.2E-5 and PLL for Construction Population is 1.14E-5)
Good Practice Measures
12.13.13
In addition to the above specific mitigation
measures, general good practice measures should also be adopted. Chlorine risks
related to the construction activities were subject of the HAZID workshop
described in Section 12.9. The
workshop concluded with 22 detailed good practice measures concerning the
organisation of the works and workers protection as listed in Table 12.22.
12.13.14
In addition to the measures proposed at the
HAZID workshop, it is also recommended that an accompanying vehicle is provided
for the chlorine truck on the WTW site and that during the chlorine drums
delivery construction works are stopped and the construction workers moved away
from the Chlorination House.
12.13.15
A liaison between the contractor and HKCG should
be established with an emergency response plan to ensure gas safety at the
neighbouring Beacon Hill North Offtake Station and adjacent gas pipelines during
the reprovisioning works.
12.13.16
In order to avoid potential crane impact on
the chlorine truck, chlorine delivery will be temporarily suspended during the
short period of construction of the concerned section of elevated walkway and
hence mobile crane impact on the chlorine truck can be avoided.
12.13.17
The construction team and chlorine delivery
team will be instructed to immediately suspend operation in case of concurrent
operation and this clause will be added to the respective contractor’s
contract.
12.13.18
Most of the above good practice measures are
similar or equivalent to those proposed in the approved EIA for the Integration of Siu Ho Wan and Silver Mine
Bay Water Treatment Works (B&V, 2010). However, a number of additional
measures identified in B&V (2010) that are considered relevant to this
Project but had not been considered at the HAZID workshop are proposed. They
are listed in the bottom rows of Table 12.22. As indicated in Section 12.9, this study assumes that all these recommendations,
including establishing adequate emergency response and communication
procedures, staff training etc will be implemented during the construction
stage of the Project.
Table 12.22 Summary of Good Practice Measures to Protect
Reprovisioning Workers
|
Category
|
Recommendation
Reference
|
Proposed
Measure
|
Parties
Responsible
|
|
Construction Management
|
HAZID Recommendation #1
|
Ensure speed limit
enforcement is specified in the contractor's Method Statement to limit the
speed of construction vehicles on site
|
Engineer/WSD
|
|
Construction Management
|
HAZID Recommendation #2
|
Develop an audit procedure
to ensure enforcement of speed limits and to ensure adequate site access
control
|
Engineer/WSD
|
|
Construction Management
|
HAZID Recommendation #3
|
Ensure construction Method
Statement is endorsed by the Engineer
(AECOM) and WSD
|
Engineer/WSD
|
|
Construction Management
|
HAZID Recommendation #4
|
Ensure designated
manoeuvring area for the new access road construction is away from the Chlorination
House
|
WSD/Engineer/Contractor
|
|
Personnel Management &
Training
|
HAZID Recommendation #5
|
Provide training for both
chlorine delivery vehicle drivers and construction vehicles drivers to ensure
the right access route is used at any stage during the reprovisioning
activities
|
WSD/Engineer/Contractor
|
|
Personnel Management &
Training
|
HAZID Recommendation #6
|
Ensure that the emergency
response plan and procedures (including drills) cover the reprovisioning
activities
|
WSD/Engineer/Contractor
|
|
Personnel Management &
Training
|
HAZID Recommendation #7
|
Safety training to be
provided to construction workers and WSD/Engineer staff regarding evacuation
procedures
|
WSD/Engineer/Contractor
|
|
Construction Management
|
HAZID Recommendation #8
|
Ensure communication protocol
is in place between construction and operation staff with regard to the
change of chlorine delivery route and the switchover from the existing to new
chlorinated water piping.
|
WSD/Engineer/Contractor
|
|
Construction Management
|
HAZID Recommendation #9
|
Ensure temporary
suspension of crane operation and construction truck movements during
chlorine delivery
|
WSD/Engineer/Contractor
|
|
Construction Management
|
HAZID Recommendation #10
|
Provide a crash barrier
between the construction site and the north side of the Chlorination House
|
Engineer/WSD
|
|
Monitoring
|
HAZID Recommendation #11
|
Conduct vibration
monitoring at the Chlorination House during piling activities to ensure
vibration levels are acceptable and will not lead to any damage of the
Chlorination House
|
WSD/Engineer/Contractor
|
|
Construction Management
|
HAZID Recommendation #12
|
Dedicated person to
supervise the crossover between the construction access and operational
access routes
|
WSD/Engineer/Contractor
|
|
Investigation
|
HAZID Recommendation #13
|
Civil engineering
calculation to be performed to confirm differential settlement from
excavation work is within acceptable limits for the Chlorination House
|
Engineer/WSD
|
|
Monitoring
|
HAZID Recommendation #14
|
Provide settlement
monitoring for the Chlorination House to ensure no subsidence occurs from
nearby excavation works
|
WSD/Engineer/Contractor
|
|
Monitoring
|
HAZID Recommendation #15
|
Confirm the chlorine
concentration for the chlorinated water before the switchover from the
existing to new piping. This is to avoid the potential for chlorine gas
vapours being released if the concentration is too high and there is spillage
during switchover.
|
WSD
|
|
Construction Management
|
HAZID Recommendation #16
|
Develop an operating
procedure for performing the chlorinated water switchover from the existing
piping to new piping
|
WSD/Engineer/Contractor
|
|
Construction Management
|
HAZID Recommendation #17
|
Ensure the location/height
of the tower crane is such there is no impact on Chlorination House/chlorine
delivery route in case of falling, swinging or dropped load
|
WSD/Engineer/Contractor
|
|
Construction Management
|
HAZID Recommendation #18
|
Ensure the location/height
of the lifting equipment is such there is no impact on Chlorination House/chlorine
delivery route in case of falling, swinging or dropped load
|
WSD/Engineer/Contractor
|
|
Construction Management
|
HAZID Recommendation #19
|
Implement the controlled
demolition of the existing E&M workshop to ensure that any steel
structural elements can only fall away from the Chlorination House
|
WSD/Engineer/Contractor
|
|
Investigation
|
HAZID Recommendation #20
|
Confirm whether slope/boulder
stabilisation is required along the chlorine delivery route
|
Engineer/WSD
|
|
Monitoring
|
HAZID Recommendation #21
|
Conduct vibration monitoring at the slopes with
potential for slope/boulder disturbance located close to chlorine delivery
route
|
WSD/Engineer/Contractor
|
|
Construction Management
|
HAZID Recommendation #22
|
Stop any construction activities which may lead
to vibrations and potential slope/boulder disturbance during the chlorine
deliveries
|
WSD/Engineer/Contractor
|
|
Monitoring
|
S 12.13.5
|
Installation of chlorine
gas monitors with audible alarms in the relevant reprovisioning work areas
|
WSD/Engineer/Contractor
|
|
Construction Management
|
S 12.13.14
|
Provision of an accompanying
vehicle for the chlorine truck on the WTW site and ensuring that during the
chlorine drums delivery construction works are stopped and the construction
workers moved away from Chlorination House
|
WSD/Engineer/Contractor
|
|
Construction Management
|
S 12.13.15
|
Establish a liaison
between the contractor and HKCG and develop a chlorine/town gas emergency
plan to ensure gas safety during the Construction Phase.
|
WSD/Engineer/Contractor/HKCG
|
|
Construction Management
|
S 12.13.16
|
Temporarily suspend
chlorine delivery during the short period of construction of the concerned
section of elevated walkway to avoid mobile crane impact on the chlorine
truck.
|
WSD/Engineer/Contractor
|
|
Construction Management
|
S 12.13.17
|
Instruct the construction
team and chlorine delivery team to suspend operation in case of concurrent
operation and this clause will be added to the respective contractor’s
contract.
|
WSD/Engineer/Contractor
|
|
Construction Management
|
B&V (2010)
|
Provide clear road signs
for site vehicles
|
WSD/Engineer/Contractor
|
|
Construction Management
|
B&V (2010)
|
Large equipment/plant
movement should be controlled by “Permit-to-move” system
|
WSD/Engineer/Contractor
|
|
Construction Management
|
B&V (2010)
|
Define restricted zone for
the equipment (i.e. keep the equipment from the Chlorination Building at a
safe distance). The extent of the restricted zone would be determined by the
size of the equipment
|
WSD/Engineer/Contractor
|
|
Construction Management
|
B&V (2010)
|
Locate the construction
site office at or near property boundary away from the chlorine store as far
as possible
|
WSD/Engineer/Contractor
|
|
Construction Management
|
B&V (2010)
|
The number of workers
on-site should be kept to the minimum required to maintain the construction
programme. Entry of non-authorised personnel to the construction site to be
prohibited.
|
WSD/Engineer/Contractor
|
12.14.1 A Hazard Assessment of the risks associated with the on-site storage and
handling of chlorine at Sha Tin Water Treatment Works has been conducted for
the Construction and Operational Phases of the Project.
12.14.2 The assessment methodology and assumptions were based on the previous
assessments for Sha Tin WTW (ERM 2001, 2011a), however the information on
reprovisioning workers locations and numbers was more detailed than that used in
ERM (2011a). Minor updates to a few other population units were also made based
on latest information. These changes, however, are not significant.
12.14.3 For both Construction
and Operational Phases, the Individual Risk complies with the Hong Kong Risk
Guidelines.
12.14.4 The societal risk expressed in the form of FN curves, lies in the
“ALARP” region of the HKRG.
12.14.5 For the Construction Phase, good practice measures were considered
during a HAZID workshop and 22 recommendations were made. Several additional
good practice measures are proposed following B&V (2010). It is also
recommended that an accompanying vehicle is provided on-site for the chlorine
truck and the construction activities are temporarily stopped during chlorine
deliveries and that gas monitors with audible alarms are installed in the
relevant reprovisioning work areas. Implementation of these measures would
reduce the societal risks for the Construction Phase of the Project.
12.14.6 No specific mitigation measures are recommended for the Operational
Phase. These were subject of detailed analysis under the SCL QRA (ERM, 2011a),
but no risk mitigation measures related to the WTW operation
were found to be practicable.
12.14.7 The Sha Tin WTW Reprovisioning Project is an
improvement project. Due to the introduction of the new treatment technologies,
the reprovisioning works will lead to a permanent reduction in chlorine storage
(from 221 tonnes to maximum of 190 tonnes) and usage at the WTW. As a result, the residual
impacts from chlorine-related risks for the surrounding population will be
reduced in comparison with current levels.
12.15.1 Earlier sections of the report addressed risks associated with on-site
use, storage and transport of chlorine. This chapter of the report addresses
risks associated with the off-site chlorine transport within the Sha Tin WTW
Consultation Zone (CZ).
12.15.2 The objective of the study is to evaluate risks to the general public
located near or next to the designated chlorine transport route for the purpose
of evaluating the total chlorine risk and cumulative risks within the 1-km CZ. It
should be noted that this study only covers the road transport risk within Sha
Tin WTW CZ which is in line with the on-site risk assessment. The road
transport risk from Sham Shui Kok Dock to the Sha Tin WTW entrance gate was
assessed as a reference and the details are provided in Appendix 12.11. In addition, this study does not include the upstream transport risk
from the Mainland to the chlorine dock nor the risks associated with the
loading/unloading operations at the dock.
12.15.3 The indoor, outdoor and transient populations potentially exposed to the
chlorine hazards are considered for both the Construction Phase and Operational
Phase described in Table 12.1. Since transport
risks are directly proportional to quantity of chlorine transported, the most
relevant data from Table 12.1 are the annual
usage quantities of 642 and 761 tonnes/year for Construction and Operational
Phases respectively. This quantity of chlorine must be delivered by trucks to
the Sha Tin WTW, requiring 107 trucks per year during Construction Phase, and
127 trucks per year during Operational Phase.
12.15.4 A number of standard provisions will be implemented before the
commencement of the Project. These include a GPS fleet management system with
driver training to help enforce truck speeds, use of existing clamps with
independent checks to prevent load shedding and installation of fire screen and
larger fire extinguishers to prevent engine and wheel fires from spreading to
the cargo area. As these will be implemented before the onset of the Project,
credit is taken for these in the analysis. Also, the analysis is based on the
shortest transport route with lowest population density as described in Section 12.18.
1989
and 1997 DNV Technica Studies
12.16.1 The first comprehensive assessment of the risks associated with the
chlorine transport to different Water Treatment Works in Hong Kong was
conducted in 1989 (Technica, 1989) on behalf of the Water Supplies Department.
12.16.2
In 1997 DNV
Technica conducted another chlorine transport study using a modified
methodology and updated data relating to population, transport routes and WTW
chlorine usage levels (DNV, 1997). Some of the findings and/or assumptions of
the study, e.g. on the frequencies of transport-related chlorine releases were
subsequently used for the on-site chlorine transport hazard assessments of
ERM’s Eight WTWs Study and the later studies based on the same methodology (e.g.
ERM 1997, 2001, 2011a).
2006
Atkins Study
12.16.3 The most recent comprehensive risk assessment for the chlorine transport
in Hong Kong was conducted for the Water Supplies Department by Atkins (2006).
The QRA introduced a number of modifications to the methodology of the previous
transport studies and assessed the risks for the years of 2006 and 2016
considering a number of alternative road transport routes, starting at
different DG pier locations. It is of note that the Atkins study for the first
time included an assessment of chlorine road transport from the Sham Shui Kok
pier in North Lantau. This is the pier that will be used by WSD for deliveries
to Sha Tin WTW following commencement of the STWTW Reprovisioning Project. Sham
Shui Kok pier is used as the starting point of road transport in the current
assessment.
12.16.4 Similar to the DNV study, since the purpose was to address risks
associated with relocation of the Kowloon bay Dock, Atkins presents only the
overall FN curves without any breakdown by transport route to the individual
WTWs. However, a breakdown of PLL values is provided, and the Sha Tin WTW is
the greatest contributor. This is as expected, since Sha Tin WTW has the
largest consumption of chlorine and so the tonne-km of chlorine transport is
the highest.
12.16.5 The Atkins (2006) methodology is followed in this study with only a few
modifications, as described in the following sections.
12.17.1 The QRA combines information on the consequences of chlorine releases
with information on the likelihood of releases to determine the risk.
12.17.2 The assessment involves the following procedures:
·
Hazard
Identification;
·
Data
collection;
·
Consequence
analysis and modelling;
·
Frequency
analysis;
·
Risk
integration; and
·
Risk
mitigation.
12.17.3
The QRA
methodology is consistent with previous studies having similar issues and in
particular previous studies on chlorine transport in Hong Kong, i.e. DNV (1997)
and Atkins (2006).
12.17.4 A transport risk QRA model has been developed to enable assessment of
the risks associated with a specific transport route. The detailed analysis of
each route section is achieved by overlaying consequence contours from releases
modelled along the transport route with population local to each release point.
The steps involved in the calculation are summarised below:
· The frequency of each potential release
scenario is estimated combining the various probabilities associated with wind
direction and the base release frequency;
· The consequences of each release scenario are
modelled using the ALOHA model to obtain a fatality footprint. Three contours
corresponding to fatality probabilities of 0.9, 0.5 and 0.03 are obtained;
· The hazard footprints are overlaid on a
database of population polygons to determine the number of fatalities for each
release scenario;
· Combining the number of fatalities with the
frequency for all release locations enables the risk for the entire route
length to be determined.
12.17.5 Associated with the program is a database containing all the relevant
information relating to meteorological data, population data, the likelihood of
releases, and the chlorine cloud dimensions. The database contains the routines
for the calculation of societal risk.
12.18 Chlorine Transport Route
12.18.1 Chlorine is delivered to Sha Tin WTW in batches of up to 6×1-tonne
drums. The transport route from Sham Shui Kok dock on North Lantau is shown in Figure 12.16. The route passes
along the North Lantau Expressway, around the northern edge of Tsing Yi,
through Tsuen Wan and along Tai Po Road (Piper’s Hill) to Sha Tin (Table 12.23).
12.18.2 The transport route was divided into segments according to similar
attributes, such as road type and traffic density. A detailed description is
provided in Table 12.24. As shown in Table 12.24 and Figure 12.17 based on their
surroundings, particular route segments are characterised as either ‘open’ or
‘urban’. This has implications in the consequence modelling, as discussed in Section 12.21. Essentially,
heavily built up areas are assumed to have lower near surface wind speeds and
dispersion along streets will be more likely due to channelling effects of the
buildings. Areas of Tsing Yi, Tsuen Wan, Kowloon and Sha Tin are designated as
‘urban’ due to high density of buildings near the transport route. Other
sections of the route are designated as ‘open’.
12.18.3 Some roads are indicated as ‘Urban/Open’ as they have some sections with
each characteristic. These roads were subdivided into smaller sections for
modelling, some specified as ‘open’, some as ‘urban’.

Figure 12.16 Chlorine
Transport Route to Sha Tin Water Treatment Works
Table
12.23 Chlorine Truck Transport Route
|
Destination
|
Route
|
|
From
SSK Dock to Sha Tin WTW
|
Sham
Shui Kok Dock > Cheung Tung Road > Sunny Bay Road > N Lantau Highway
> Lantau Link > NW Tsing Yi Interchange > Tsing Yi North Costal road
> Tsing Tsuen Road > Tsuen Wan Road > Kwai Chung Road > Ching
Cheung Road > Tai Po Road > Tai Po Road (Piper’s Hill) > Tai Po Road
(Sha Tin Heights) > Tai Po Road > Tsing Sha Highway (Sha Tin) > Tai
Po Rd (Sha Tin) > Sha Tin Rural Committee Rd > Tai Chung Kiu Rd >
Che Kung Miu Road > Sha Tin WTW
|
Table 12.24 Details of
Route Sections
|
Section Name
|
Length
(km)
|
Characteristic
|
|
Sham Shui Kok Dock
|
0.51
|
Open
|
|
Cheung Tung Road
|
4.41
|
Open
|
|
Sunny Bay Road
|
1.35
|
Open
|
|
N Lantau Highway
|
0.72
|
Open
|
|
Lantau Link
|
4.13
|
Open
|
|
NW Tsing Yi Interchange
|
0.34
|
Open
|
|
Tsing Yi North Costal road
|
2.43
|
Urban/Open
|
|
Tsing Tsuen Road
|
1.50
|
Urban
|
|
Tsuen Wan Road
|
1.57
|
Urban
|
|
Kwai Chung Road
|
2.25
|
Open
|
|
Ching Cheung Road
|
2.20
|
Urban/Open
|
|
Tai Po Road
|
0.91
|
Open
|
|
Tai Po Road (Road-Piper’s
Hill)
|
1.18
|
Open
|
|
Tai Po Road (Sha Tin
Heights)
|
3.07
|
Open
|
|
Tsing Sha Highway (Sha Tin)
|
1.00
|
Urban
|
|
Tai
Po Road (Sha Tin)
|
1.03
|
Urban
|
|
Sha
Tin Rural Committee Road
|
0.67
|
Urban
|
|
Tai
Chung Kiu Road
|
1.70
|
Urban
|
|
Che Kung Miu Road
|
1.70
|
Urban/Open
|
|
Total
Route Length
|
32.67
|
|
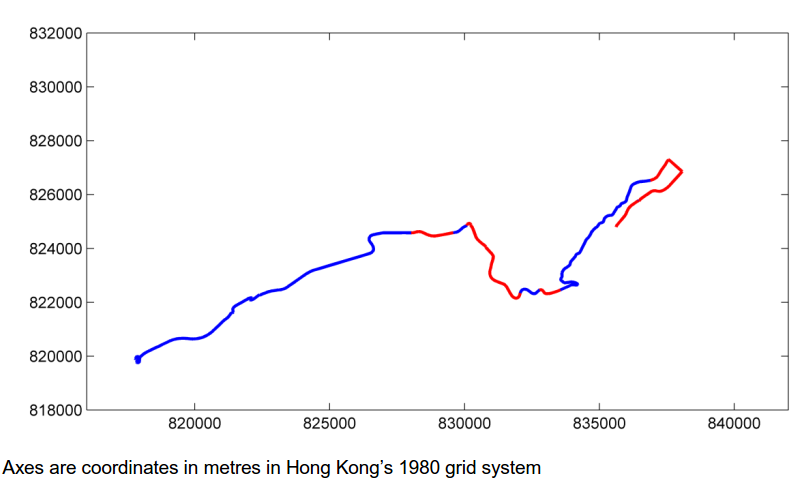
Figure
12.17 Open (blue) and Urban (red) Sections of the
Delivery Route
12.19.1 The hazardous properties of chlorine were discussed in Section 12.9. This is also applicable to
hazards associated with off-site transport.
12.19.2 Extensive reviews of the past chlorine incidents were conducted in
previous studies (Technica, 1989, DNV, 1997, ERM, 1997). In general, only a
small number of such incidents involved chlorine releases from drums or cylinders
during their road transport. For example, ERM (1997) attributes 14% of the 86
chlorine incidents recorded worldwide over 77 years to the road transport, but
about half of these occurred during the loading/unloading operations rather
than the transport itself.
12.19.3 The most recent review of past incidents for the period 1995–2004
worldwide was conducted by Atkins (2006). While it was noted that one major
incident (involving a 35-tonne road tanker rather than chlorine drums) occurred
during that time, the report concluded that no changes in the study
methodology, and in particular in the incident frequencies derived from the
generic worldwide data was necessary.
12.20.1 Hazard release scenarios for chlorine transport were identified in terms
of release inventory, hole size, and phase of release.
12.20.2 Table
12.25
lists the representative release cases considered
in this study, which are based on DNV (1997) and Atkins (2006). The associated
release rates are also shown in the table.
Table 12.25 Representative
Release Cases Considered
|
Release type
|
Event Code
|
Hole Size
|
Release Rate (kg/s)
|
|
Small
leak
|
SLD
|
2.5
mm
|
0.1
|
|
Medium
leak
|
MLD
|
7.5
mm
|
1
|
|
Large
leak
|
LLD
|
22.5
mm
|
10
|
|
Rupture
|
RD
|
|
instantaneous
1 t
|
|
Medium
leaks from 3 drums
|
RDM1
|
3×7.5mm
|
3
|
|
Medium
leaks from 6 drums
|
RDM2
|
6×7.5mm
|
6
|
· All chlorine releases from drums is
considered to be in the liquid phase, which is an approach consistent with the
SCL QRA (ERM, 2011a). This is slightly conservative over the Atkins (2006)
approach which distributed failures between vapour and liquid releases;
· For small leaks, two separate cases SLDF and
SLDS are considered in Atkins (2006) depending on whether the emergency
services succeeded or failed to stop the leak quickly. In the current study,
these two events are combined in the one SLD event, conservatively assuming a
failure in stopping the leak; and
· For
the RDM2 scenario, the current study assumes only new type drums will be used,
whereby each drum has only one fusible plug. If all six drums leak in a fire,
the total leak rate then becomes 6kg/s. Atkins (2006) assumed older type drums
which have 3 fusible plugs on each drum.
·
Modelling the initial discharge rate of chlorine;
·
Modelling the dispersion of chlorine in the
atmosphere; and
·
Assessing the toxic impact to people (whether
indoors or outdoors).
Initial Discharge Rate
Dispersion
of Chlorine in the Atmosphere
·
Increase the surface roughness;
·
Create more drag and lower the near surface wind
speeds; and
·
Create a channelling effect whereby winds along the
road are more likely than cross road directions. This is considered in further
detail in Section 12.22.
12.21.4 To differentiate between urban and open areas, ALOHA modelling was
performed twice for each release scenario. Open areas were modelled for the
weather class 5D (wind speed of 5 m/s and atmospheric stability class D), while
urban areas were modelled with a lower wind speed of 2 m/s (weather class 2D).
ALOHA default surface roughnesses for open and urban areas were used. This
approach is consistent with Atkins (2006).
12.21.5
Examples of ALOHA-derived consequence contours for
wind speed of 5 m/s in the open areas are shown in Figure 12.18 and Figure 12.19.
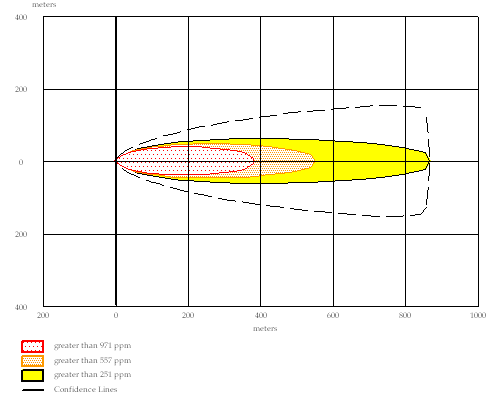
Figure 12.18 ALOHA
Consequence Contours, RD Case
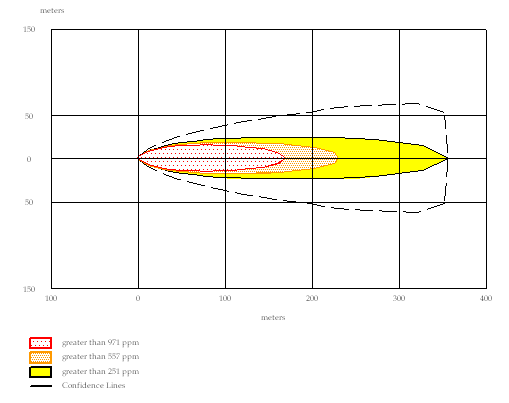
Figure 12.19 ALOHA
Consequence Contours, RDM1 Case
12.21.6 The current assessment applies 12 wind directions in line with Atkins
(2006). There is a difference in spatial resolution however. Atkins (2006)
modelled a release every kilometre along the route. This is considered
inadequate in the current study due to a higher resolution of population data.
Instead, releases are modelled at 796 release points along the delivery route,
which amounts to a release every 40 m on average.
12.21.7
Similar to a
number of other QRA studies (e.g. ERM, 2009), for the purposes of the risk
model used in this study, ALOHA-derived consequence contours are expressed in
terms an ellipse using the following four parameters as illustrated in Figure 12.20:
•
d:
maximum downwind distance;
•
c:
maximum half-width;
•
s:
offset distance between source and effect zone; and
•
m:
downwind distance at which the maximum width, c, occurs.
12.21.8
All consequence
data used in this QRA are summarised in Table 12.26. The fatality
probabilities adopted are discussed in the following sections.
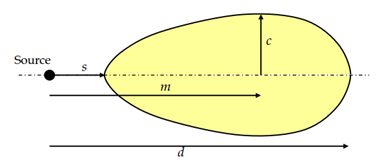
Figure 12.20 Presentation of
Consequence Results
Table 12.26 Consequence Distances (m)
|
Outcome ID
|
Release
|
Nominal
fatality
prob.
|
Outdoor
fatality prob.
|
Indoor
fatality prob.
|
Fatality
in vehicles
|
Open areas (5D)
|
Urban areas (2D)
|
|
d
|
c
|
s
|
m
|
d
|
c
|
s
|
m
|
|
SLD
|
0.1
kg/s
|
0.9
|
0.9
|
0.09
|
0.9
|
36
|
2.6
|
0
|
19.7
|
32
|
5.6
|
0
|
15.7
|
|
|
|
0.5
|
0.31
|
0.05
|
0.31
|
48
|
3.5
|
0
|
26.2
|
45
|
7.9
|
0
|
22.1
|
|
|
|
0.03
|
0.007
|
0.003
|
0.007
|
75
|
5.5
|
0
|
41
|
75
|
13.2
|
0
|
36.8
|
|
MLD
|
1
kg/s
|
0.9
|
0.9
|
0.09
|
0.9
|
108
|
11.4
|
0
|
58.6
|
101
|
32.1
|
0
|
66.7
|
|
|
|
0.5
|
0.31
|
0.05
|
0.31
|
152
|
14.3
|
0
|
70.7
|
139
|
36.9
|
0
|
84.5
|
|
|
|
0.03
|
0.007
|
0.003
|
0.007
|
240
|
19.6
|
0
|
106.5
|
221
|
46.4
|
0
|
125
|
|
LLD
|
10
kg/s
|
0.9
|
0.9
|
0.09
|
0.9
|
320
|
44.8
|
0
|
182
|
324
|
130
|
-10.9
|
230
|
|
|
|
0.5
|
0.31
|
0.05
|
0.31
|
453
|
51.2
|
0
|
234
|
425
|
150
|
-10.9
|
270
|
|
|
|
0.03
|
0.007
|
0.003
|
0.007
|
749
|
67.5
|
0
|
365
|
608
|
180
|
-10.9
|
380
|
|
RD
|
1
t
|
0.9
|
0.9
|
0.09
|
0.9
|
411
|
59.6
|
0
|
237
|
368
|
170
|
-18.9
|
260
|
|
|
|
0.5
|
0.31
|
0.05
|
0.31
|
573
|
71.2
|
0
|
304
|
460
|
190
|
-18.9
|
330
|
|
|
|
0.03
|
0.007
|
0.003
|
0.007
|
896
|
91.2
|
0
|
470.6
|
627
|
222.2
|
-18.9
|
400
|
|
RDM1
|
3
kg/s
|
0.9
|
0.9
|
0.09
|
0.9
|
179
|
22.1
|
0
|
84.6
|
177
|
62.9
|
-5.9
|
114
|
|
|
|
0.5
|
0.31
|
0.05
|
0.31
|
255
|
26
|
0
|
125
|
244
|
74.3
|
-5.9
|
158
|
|
|
|
0.03
|
0.007
|
0.003
|
0.007
|
425
|
36.4
|
0
|
197
|
394
|
91.4
|
-5.9
|
233
|
|
RDM2
|
6
kg/s
|
0.9
|
0.9
|
0.09
|
0.9
|
250
|
34.3
|
0
|
134
|
255
|
93
|
0
|
180
|
|
|
|
0.5
|
0.31
|
0.05
|
0.31
|
355
|
40
|
0
|
173
|
350
|
110
|
0
|
230
|
|
|
|
0.03
|
0.007
|
0.003
|
0.007
|
591
|
51.4
|
0
|
280
|
558
|
140
|
0
|
330
|
Chlorine Cloud Height
12.21.9 Information on the height of a chlorine cloud is required for
determining the degree of protection for people inside high rise buildings. Table 12.27 shows the
predicted cloud heights derived by Atkins (2006) from the wind tunnel
simulations, CFD modelling and DRIFT flat terrain dispersion modelling
performed for ERM’s Eight Water Treatment Works Study. The same data are
adopted for the present assessment and the same cloud heights are applied for
urban and open areas.
Table 12.27 Predicted
Chlorine Cloud Heights
|
Release Quantity (tonne)
|
Cloud Height (m)
|
|
LD03
|
LD50
|
LD90
|
|
1
|
6
|
3.75
|
3
|
|
3
|
11.25
|
7
|
5.6
|
|
10
|
16
|
10
|
8
|
12.21.10
Following Atkins
(2006), the above cloud heights have been further scaled for different release
quantities and converted into floor levels based on the assumption of 3 m per
storey. The resulting affected floor levels are tabulated in Table 12.28.
Table 12.28 Predicted
Affected Floor Levels
|
Release Scenario
|
Event Code
|
Floor Levels
|
|
|
|
LD03
|
LD50
|
LD90
|
|
Small
leak
|
SLD
|
1
|
1
|
1
|
|
Medium
leak
|
MLD
|
1
|
1
|
1
|
|
Large
leak
|
LLD
|
3
|
2
|
2
|
|
Rupture
|
RD
|
3
|
2
|
2
|
|
Medium
leaks from 3 drums
|
RDM1
|
2
|
1
|
1
|
|
Medium
leaks from 6 drums
|
RDM2
|
4
|
3
|
2
|
Toxic Impact Assessment
12.21.11
Similar to the
previous QRAs (ERM 2001, 2011a and Atkins, 2006), the following probit equation
(TNO, 1992) has been used in this study to estimate the likelihood of fatality
due to exposure to chlorine:
Pr = -14.3 + ln C2.3t
Where:
Pr = probit value,
C = chlorine concentration (mg/m3),
and
t = exposure time (minutes)
12.21.12 Table 12.29 shows the
relationship between the chlorine concentration and the probability of fatality
for the TNO probit obtained assuming a 10 minute exposure duration, which is
consistent with ERM (2001, 2011a) and Atkins (2006).
Table 12.29 Chlorine
Toxicity
|
Chlorine Concentration (ppm)
|
Probit Value for 10 min Exposure (TNO probit)
|
Nominal Probability of Fatality (LD = lethal dose)
|
|
251
|
3.17
|
0.03 (LD03)
|
|
557
|
5.00
|
0.50 (LD50)
|
|
971
|
6.28
|
0.90 (LD90)
|
Modelling of Escape from the Chlorine Cloud
12.21.13
In risk
assessments for toxic gas releases it is common practice to take into account
the possibility of escape of exposed persons. This is because at lower
concentrations of the gas, people may be able to obtain protection by moving
indoors or directly out of the cloud.
12.21.14
The approach
adopted for chlorine releases from trucks during transport is the same as that
described for releases from on-site facilities (Sections 12.10.28–12.10.31). This gives
effective outdoor fatality probabilities, i.e. the fatality probability that
can be applied to the total outdoor population at any given location taking
into account the probability of escape. These were summarised in Table 12.13 and are shown in
the consequence results (Table 12.26).
12.21.15
Atkins (2006) uses a slightly different, but
roughly equivalent approach, based on estimated escape distance and the basic
escape velocity of 2 m/s reduced according to the chlorine concentration level.
Protection for Persons Indoors
12.21.16
Following similar
previous studies undertaken in Hong Kong and elsewhere, and in particular
Atkins (2006), it is assumed that the probability of fatality for a person
indoors is 10% of that for a person remaining outdoors, i.e. the nominal
outdoor fatality probability.
12.21.17 Protection is also considered for people on the upper floors of high
rise buildings. This is based chlorine cloud height obtained from the
dispersion modelling. For each release scenario, the corresponding population
on affected floor levels has been predicted and included in the risk
assessment.
12.21.18 No protection is assumed in this QRA for the people in vehicles; the
road population is therefore treated the same way as the outdoors population.
Review
of Base Failure Rates
12.22.1
The current study
uses scenario frequencies consistent with Atkins (2006). The following
paragraphs discuss the basis for these frequencies and make comparisons with
other studies where applicable. In some cases, frequencies are refined compared
to the Atkins (2006) study based on updated information and to allow for
improvements in truck design that have been implemented since the previous
study.
Spontaneous Container Failure
12.22.2
Both DNV (1997)
and Atkins (2006) applied a frequency of 1.1 × 10⁻³ per container
year. This was estimated based on a limited number (only three reported cases
worldwide) of spontaneous chlorine container failure in transport over 20 years
and is likely an overestimate. Nevertheless, the Atkins (2006) base frequency
has been adopted for this study.
12.22.3
Following Atkins
(2006) this base frequency is converted to per truck-km units assuming 6 drums
per truck and an average truck speed of 45 km/h. This gives a spontaneous drum
failure rate of 1.67 × 10⁻⁸ per truck-km.
12.22.4
Conditional
probabilities for small, medium, and large leaks and drum rupture are adopted
as 0.54, 0.35, 0.065 and 0.045, respectively and are consistent with those of
Atkins (2006).
Load shedding
12.22.5
The load shedding
frequency of 1.1 × 10⁻⁷ per truck-km is consistent with DNV (1997)
and Atkins (2006). This estimate is based on historical data of world-wide
accidents (1.1 × 10⁻⁸ per truck km) but adjusted to Hong Kong
conditions by applying a factor of 100 accounting for the steepness of HK roads
and a factor of 0.1 to account for special, custom-built lashing arrangements
used in HK chlorine drum trucks (Figure 12.21).
12.22.6 In addition to the lashings, clamps (Figure 12.21) are used at each end to the drums (total 12 clamps for 6 drums) to
ensure that drums cannot roll off the truck. Although these clamps have been in
use for some years, no credit was taken in the previous Atkins (2006) analysis.
Consider the latest chlorine usage of 895 tonne per year and about 20 years of
operation since 1990, the total number of trips is given by N = 20 × 895/6 =
2983. Let p be the probability of
failure of an individual lashing/ clamp. The probability of no failure in a
single trip is given by (1 - p)12
considering there are 12 lashing/ clamps used for each trip. It follows that
the probability of having any failure in a single trip is1 - (1 - p)12. By assuming Poisson
Distribution with a 50% () level of
confidence, we have ln(2)/2983 = 1 - (1 - p)12
which gives p = 1.94 × 10⁻⁵.
12.22.7
The weight of a
fully-loaded chlorine drum is approximately 1.7 tonne and the existing clamps
can already stand the required dynamic load during chlorine transport. The
effectiveness of these clamps has been reviewed as part of the current study
and improvements have been recommended in the design which will be implemented
before the start of the Project. The modification aims to decrease the gaps
between clamps and chlorine drums. The clamps will be designed, tested, and
independently verified by a certified engineer to stand the required load, with
the consideration of stress during transport. The failure rate of the clamps is
further assessed by human error analysis and it is shown that failure should be
dominated by human error in tightening the clamps during loading. It is
therefore recommended that independent checks are performed during loading i.e.
operator who attaches the lashings should cross check that the clamps are
correctly tightened. Based on a human error analysis (Appendix 12.10), a factor
of 0.03 on the load shedding frequency is applied in the current study. This
gives a load shedding frequency of 3.49 × 10⁻⁹ per truck-km.
12.22.8
The conditional
probability of a leak is taken to be 0.25 per accident following DNV (1997) and
Atkins (2006). Of this, 25% are assumed to be medium leaks and 75% are small
leaks. This gives a conditional probability of medium leak of 0.0625 and small
leak of 0.1875.
12.22.9
Since the previous
study, however, emergency repair kits have been provided and are carried on all
chlorine trucks. These provide a means of sealing off small leaks from either
the valve area or the drum surface by clamping patches over the leaking area. A
reduction factor of 0.10 has been derived from human error analysis (Appendix 12.10). This is applied only to small leaks as the emergency kit is
considered ineffective for larger leaks. This gives a revised conditional
probability of 0.019 for small leaks while the conditional probability for
medium leaks is maintained at 0.0625. Errors related to other failure modes
such as mechanical failure can be estimated using similar approach as in Section 12.22.6 but with N = 6 ×
895/6 = 895 (6 years of operation) and consider each chlorine truck is equipped
with one emergency kit. Therefore p = ln(2)/895 = 7.74 × 10⁻⁴.
12.22.10
It may be noted
that no credit was taken for the emergency repair kit for small leaks resulting
from rollover or spontaneous drum failure scenarios. For truck rollover, the
driver and driver’s mate are considered to be incapacitated and unable to carry
out remedial measures while small leaks from spontaneous failures are likely to
go unnoticed during transit.
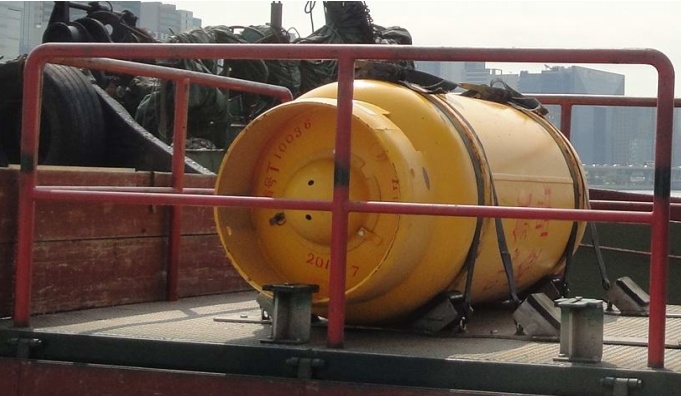
Figure 12.21 Drum Lashing
and Clamp Arrangements
Rollover
12.22.11
DNV (1997) and
Atkins (2006) adopted a rollover frequency of 1.9 × 10⁻⁷ per
truck-km. This value was based on the 1993 medium and heavy vehicles accident
involvement rate in Hong Kong of 5.9 × 10⁻⁷ per truck km, and 32%
rollover rate for dangerous goods trucks involved in accidents from a 1985
Belgium study (Technica, 1989). A detailed review of Hong Kong accident data
was carried out for the MTRC XRL project (ERM, 2009). This study suggests that
a lower involvement rate of 2.25 × 10⁻⁷ per vehicle-km is justified
for MGV/HGV.
12.22.12
Prior to
commencement of the reprovisioning project, a GPS fleet management system will
be implemented on all chlorine delivery trucks. This will provide local alarm
to warn the driver in case of speeding as well as provide centralised
monitoring with radio communication. Regular defensive driving training will
also be provided to drivers. Considering these new measures, the truck
involvement rate was adjusted by a factor of 0.12 (see Appendix 12.10).
12.22.13
Adopting the same
32% probability of rollover gives the base frequency used in this study of 8.64
× 10-9 per truck-km.
12.22.14
The conditional
probabilities of different leaks categories due to a drum impact in a rollover
(0.243, 0.154 and 0.0104 for the small, medium and multiple medium leaks,
respectively) adopted in this study are consistent with those of Atkins (2006)
and ERM (2011a).
12.22.15
Technica (1989)
and Atkins (2006) also considered the possibility of rollover leading to fire.
The conditional probability per rollover accident leading to fire for medium
leak from a single drum was specified as 9 × 10⁻⁴, conditional
probability for medium leaks from 3 drums as 6.66 × 10⁻⁴ and
conditional probability for medium leaks from 6 drums as 2.79 × 10⁻⁴.
These include the probability of fire resulting from a rollover.
Vehicle Impact
12.22.16
The crash
frequency (excluding rollover) of 4.0 × 10⁻⁷ per truck-km was used
by DNV (1997) and Atkins (2006). This value has been estimated in DNV (1997) in
the same way as the rollover frequency discussed above.
12.22.17
A detailed review
of Hong Kong accident data was carried out for the MTRC XRL project (ERM,
2009). This study suggests that a lower frequency of 2.25 × 10⁻⁷ per
vehicle-km (with a breakdown of 1.59 × 10⁻⁸, 1.43 × 10⁻⁷,
and 6.61 × 10⁻⁸ with respect to high, medium, and low truck impacts)
is justified for accidents having the potential to cause significant mechanical
(impact) energy on the cargo. Excluding the rollover events gives the base
frequency of 1.53 × 10⁻⁷ per truck-km.
12.22.18
This is further
adjusted by a factor of 0.12 to take credit for the GPS fleet management system
as discussed for the rollover scenarios. This gives a base frequency of 1.84 ×
10-8 per truck-km used in the current study.
12.22.19
The 0.017
conditional probability of a drum rupture conservatively includes all smaller
releases and is consistent with the two previous transport studies.
12.22.20
Technica (1989)
and Atkins (2006) also considered the possibility of collision leading to fire.
The conditional probability per accident leading to fire for medium leak from
single drum was specified as 9 × 10⁻⁴, conditional probability for
medium leaks from 3 drums as 6.66 × 10⁻⁴ and conditional probability
for medium leaks from 6 drums as 2.79 × 10⁻⁴. These include the
probability of fire resulting from an impact.
Truck Fire
12.22.21
DNV (1997), Atkins
(2006) and ERM (2011a) used a frequency of 4.0 × 10⁻⁹ per km for
truck fires affecting the load.
12.22.22
The incident rate
of truck fires was reviewed in detail in the XRL study (ERM, 2009). Based on
fire call data for all goods vehicles, an overall vehicle fire probability of
2.186 × 10⁻⁸ per km was derived, of which less than 20% spread to
affect the cargo (DNV, 1997 and Moreton, 1993). This gives a frequency of fire
affecting the chlorine drums of 4.37 × 10⁻⁹ per km which is very
similar to the value used in Atkins (2006) and DNV (1997).
12.22.23
Truck
modifications since the last assessment, however, include a fire screen, fire
resistant material over wheel arches, reduction of combustible materials and
provision of larger fire extinguishers. These will be implemented before the
start of the Project and are calculated to give an adjustment factor of 0.1 on
fire frequency affecting the chlorine drums (ERM, 2009).
12.22.24
Truck fires are
considered to cause medium leaks, with 25% causing a medium leak in a single
drum, 25% causing a medium leak in 3 drums and 50% causing a medium leak in all
6 drums. This approach is consistent with Atkins (2006).
Summary of Base Frequencies
12.22.25
Based on the above
considerations the following base frequencies (Table 12.30) have been
selected for the modelling in this QRA. Combining the base frequencies with the
conditional probabilities for different outcomes gives the event frequencies as
summarised in Table 12.31.
Table
12.30 Summary of Release Frequencies
|
Scenario
|
Frequency
(per truck-km)
|
Conditional
Probabilities for Different Leak Sizes
|
|
Small
(SLD)
|
Medium
(MLD)
|
Large
(LLD)
|
Rupture
(RD)
|
Medium Leaks from 3
Drums
(RDM1)
|
Medium Leaks from 6
Drums
(RDM2)
|
|
Spontaneous failure
|
1.67E-8
|
0.54
|
0.35
|
0.065
|
0.045
|
-
|
-
|
|
Load shedding
|
3.49E-9
|
0.019
|
0.0625
|
-
|
-
|
-
|
-
|
|
Rollover
|
8.64E-9
|
0.243
|
0.155
|
-
|
-
|
0.01106
|
2.79E-4
|
|
Collision
|
1.84E-8
|
-
|
9E-4
|
-
|
0.017
|
6.66E-4
|
2.79E-4
|
|
Truck fire
|
4.37E-10
|
-
|
0.25
|
-
|
-
|
0.25
|
0.50
|
Table 12.31 Event Outcome
Frequencies
|
Release Scenario
|
Event
Code
|
Frequency
(per truck-km)
|
|
Small
leak
|
SLD
|
1.12E-8
|
|
Medium
leak
|
MLD
|
7.54E-9
|
|
Large
leak
|
LLD
|
1.09E-9
|
|
Rupture
|
RD
|
1.07E-9
|
|
Medium
leaks from 3 drums
|
RDM1
|
2.17E-10
|
|
Medium
leaks from 6 drums
|
RDM2
|
2.26E-10
|
Road Traffic and Population
12.23.1
The road traffic
data were based on Annual Average Daily Traffic (AADT) and travel speed.
12.23.2
Traffic data for
the year 2031 were updated with consideration of the impact of the future Hong
Kong – Zhuhai – Macao Bridge (HKZMB) and the proposed Lantau Logistics Park
(LLP) development. The latest estimations on the AADT figures resulting from
the bridge were obtained from the Highways Department of HKSAR. The vehicle
composition and the proportion of traffic on North Lantau Highway that will
pass through Tsing Yi North Coastal Road in 2031 were also obtained and
incorporated into the traffic model.
12.23.3
It is assumed that
in case of a road incident leading to chlorine release, the road traffic will
come to a stop and form a traffic jam. Estimation of the traffic population
follows the Atkins (2006) approach and is based on the following assumptions:
·
At
least 20 minutes is required to clear the road traffic;
·
Average
vehicle interval (vehicle length and spacing) of 10 m;
·
Average
occupancy of vehicle of 3.3 persons;
·
An
escaping factor of 0.5 to account for half of the affected length of the road
is free of vehicles i.e. vehicle in front of the point of accident will
continue to move away, while vehicles behind the accident point will start to
accumulate into a traffic jam.
12.23.4
The traffic
population is calculated as follows:
 (1)
(1)
 (2)
(2)
where:
TPmax -
maximum traffic population (derived from the road geometry)
TPAADT - population based on the traffic flow data
TP -
traffic population (number of people on the affected length of
road) used in modelling
AL -
affected length of road (taken as 1000 m)
VI -
vehicle interval (10 m)
NL -
number of lanes
AO -
average occupancy (3.3)
EF -
escaping factor (0.5)
AADT -
Annual Average Daily Traffic (from Annual Traffic Census data)
DM -
Number of minutes in a day (1440)
ST -
Stopping time (20 min)
12.23.5
The above model
compares the road population under full traffic jam conditions (equation 1)
with the population that flows along the road within a 20 minute period
(equation 2). For roads with heavy traffic, a traffic jam will form quickly and
the affected population will be given by equation 1. For roads with light
traffic, there may be insufficient vehicles to lead to a long tail back and the
affected population will be limited to that derived from equation 2. The model
therefore takes the minimum of the two predictions.
12.23.6
The affected length
of road (AL) under full traffic jam conditions is taken to be the whole length
of the transport route. The population affected is then determined by
overlaying the consequence contours with the transport route. In other words,
the maximum length of road affected is equal to the maximum consequence
distance obtained from dispersion modelling. This is a slight refinement of the
Atkins (2006) approach wherein roads were considered in 1 km sections with a
release at the midpoint. This effectively limited the length of road affected
to 500 m in Atkins (2006).
General Population
12.23.7
The population densities of different land
uses were estimated based on the data collected from the Territorial Population
and Employment Data Matrix (TPEDM) and site specific surveys. The TPEDM data
covers the whole territory, and the predicted residential and employment
population for years 2016 and 2031 were applied in the chlorine transport QRA.
The population data from TPEDM is classified by Planning Data Zone (PDZ) zones.
The chlorine transport route and PDZ Zones in Hong Kong are shown in Figure 12.22. Outline
Zoning Plans (OZPs) within each PDZ are used as individual units to allocate
the population. A map of OZPs in Ma Wan, within 1 km distance from the
transport route is shown in Figure 12.23 for
illustration. A 2km wide corridor (1km either side of the transport route) of
population is considered along the full length of the route since the worst
case consequence distances are close to 1 km. A figure showing all population
polygons is provided in Figure 12.24.
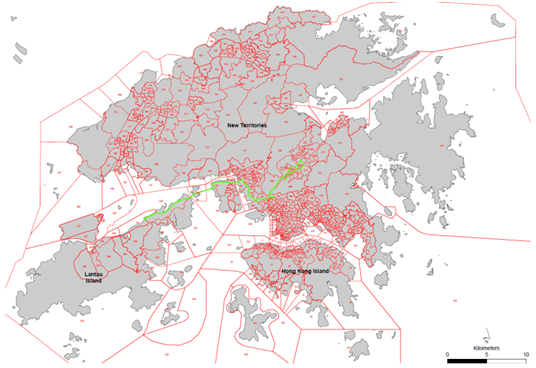
Figure 12.22 Chlorine
Transport Route and PDZ Zones
Figure 12.23 A Map of OZPs
in Ma Wan
12.23.8
Following the methodology of Atkins (2006),
the Domestic Plot Ratio (DPR) and
Non-Domestic Plot Ratio (NDPR) data
is used to estimate the height of buildings in different OZPs.
Table 12.32 summarises the DPR and NDPR data used in
this study. For each OZP zone, the total population is the sum of predicted
residential population (RPz)
and employment population (EPz).
The RPz and EPz are given by:
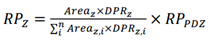 and
and
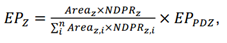 ,
,
where
·
RPz is the residential
population of an OZP zone within a PDZ zone;
·
EPz
is the employment population of an OZP zone within a PDZ zone;
·
Areaz
= is the area of the OZP zone within the PDZ zone;
·
DRPz
is the Domestic Plot Ratio of the OZP zone within the PDZ zone;
·
NDRPz
is the Non-Domestic Plot Ratio of the OZP zone within the PDZ zone;
·
n
is the number of OZP zones in the PDZ zone;
·
Areaz,i
is the area of the ith OZP zone with the PDZ zone;
·
DPRz,i
is the Domestic Plot Ratio of the ith OZP zone within the PDZ zone;
·
NDPRz,i
is the Non-Domestic Plot Ratio of the ith OZP zone within the PDZ
zone;
·
RPPDZ
is the residential population of the PDZ zone; and
·
EPPDZ
is the employment population of the PDZ zone.
12.23.9
The residential population and employment
population are further split into outdoor population and indoor population. For
each OZP zone, the proportion of indoor and outdoor from the previous chlorine
transport QRA (Atkins, 2006) is used. The data is shown in Table 12.32. For the residential population and
employment population,
IRPz = RPz ´ fin,
ORPz = RPz ´ fout,
IEPz = EPz ´ fin, and
OEPz = EPz ´ fout,
where
·
IRPz
is the indoor residential population of the OZP zone;
·
ORPz
is the outdoor residential population of the OZP zone;
·
IEPz
is the indoor employment population of the OZP zone;
·
OEPz
is the outdoor employment population of the OZP zone;
·
fin
is the ratio of indoor population to the total population of the OZP zone; and
·
fout
is the ratio of outdoor population to the total population of the OZP zone.
12.23.10
For each release scenario, the affected
indoor residential population (AIRP) and affected indoor employment population
(AIEP) are given by:
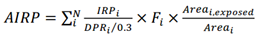 and
and
 ,
,
where
·
IRPi
and IEPi
are indoor residential population and indoor employment population of the ith affected OZP zone;
·
N
is the total number of affected OZP zones;
·
DPRi
and NDPRi are domestic
plot ratio non-domestic plot ratio of the ith
affected OZP zone;
·
DPRi/0.3
and NDPRi/0.3 are the
maximum number of floors for residential and employment population. This
assumption follows the Hong Kong Planning Standard Guideline, Chapter 2,
Section 3.6;
·
Fi
is the number of floors of the ith
affected OZP zone, if Fi
> maximum number of floors of the OZP zone, then Fi = maximum number of floors of the zone;
·
Areai,exposed is
the exposed plan area of the ith
affected OZP zone; and
·
Areai
is the total plan area of the ith
affected zone.
12.23.11
The affected outdoor residential population
(AORP) and affected outdoor employment population (AOEP) are given by:
 and
and
where
·
ORPi
and OEPi are outdoor
residential population and outdoor employment population of the ith affected OZP zone.
12.23.12
A day time population factor has been applied
to calculate the population during the day time. A factor of 0.25 has been used
for residential population and 0.8 has been used for employment population.
Table
12.32 Plot Ratio Data and Indoor/ Outdoor Population Ratio
|
Gzone
|
Description
|
DPR
|
NDPR
|
Indoor (fin)
|
Outdoor (fout)
|
|
AGR
|
Agriculture
|
0.00
|
0.01
|
0.00
|
1.00
|
|
C
|
Commercial
|
0.00
|
12.00
|
0.98
|
0.02
|
|
C/R
|
Commercial/Residential
|
5.00
|
2.50
|
0.95
|
0.05
|
|
CA
|
Conservation Area
|
0.00
|
0.01
|
0.00
|
1.00
|
|
CDA
|
Comprehensive Development
Area
|
3.00
|
1.50
|
0.98
|
0.02
|
|
G/IC
|
Government/Institution/Community
|
0.00
|
12.00
|
0.98
|
0.02
|
|
GB
|
Green Belt
|
0.00
|
0.01
|
0.00
|
1.00
|
|
I
|
Industrial
|
0.00
|
12.00
|
0.98
|
0.02
|
|
LDC
|
Land Development Corp Area
|
0.00
|
0.01
|
0.98
|
0.02
|
|
MRDJ
|
Major Road Junction
|
0.00
|
0.01
|
0.00
|
1.00
|
|
NPPS
|
Pedestrian Precinct
|
0.00
|
0.00
|
0.00
|
1.00
|
|
O
|
Open Space
|
0.00
|
0.01
|
0.00
|
1.00
|
|
OS
|
Open Storage
|
0.00
|
0.01
|
0.98
|
0.02
|
|
OU
|
Other Specified Uses
|
0.00
|
12.00
|
0.98
|
0.02
|
|
R(A)
|
Residential (Group A)
|
8.00
|
1.00
|
0.90
|
0.10
|
|
R(B)
|
Residential (Group B)
|
5.00
|
1.00
|
0.98
|
0.02
|
|
R(C)
|
Residential (Group C)
|
3.00
|
0.50
|
0.90
|
0.10
|
|
R(D)
|
Residential (Group D)
|
0.20
|
0.50
|
0.98
|
0.02
|
|
R(E)
|
Residential (Group E)
|
1.00
|
0.50
|
0.98
|
0.02
|
|
RAIL
|
Railway (MTR/KCR/LRT)
|
0.00
|
0.01
|
0.00
|
1.00
|
|
REC
|
Recreation
|
0.00
|
0.01
|
0.00
|
1.00
|
|
RPA
|
Reaction Priority Area
|
0.00
|
0.01
|
0.00
|
1.00
|
|
SSSI
|
Site of Special Scientific
Interest
|
0.00
|
0.01
|
0.00
|
1.00
|
|
U
|
Undetermined
|
0.00
|
0.01
|
0.98
|
0.02
|
|
V
|
Village Type Development
|
3.00
|
0.01
|
0.90
|
0.10
|
12.23.13
Site Surveys have been undertaken to collect
data to estimate road-side population densities along the chlorine transport
route. As the transport route mainly consists of highways and rural roads, the
road-side population in these road sections is low. Only the following route
sections have noticeable road-side population:
·
Ching Cheng Road;
·
Tai Po Road;
·
Tai Po Road-Sha Tin Heights;
·
Tai Po Road-Tai Wai;
·
Mei Tin Road; and
·
Che Kung Miu Road.
12.23.14
For areas close to the Sha Tin WTW, the population
data and population units used for the on-site chlorine assessment (see Section 12.8, Figure 12.8, Figure 12.9 and Table 12.3) are used for the off-site transport
assessment. This data provides a more detailed population breakdown in the
surroundings of the Sha Tin WTW.
12.23.15
Population polygons considered in this study
are shown in Figure 12.24.
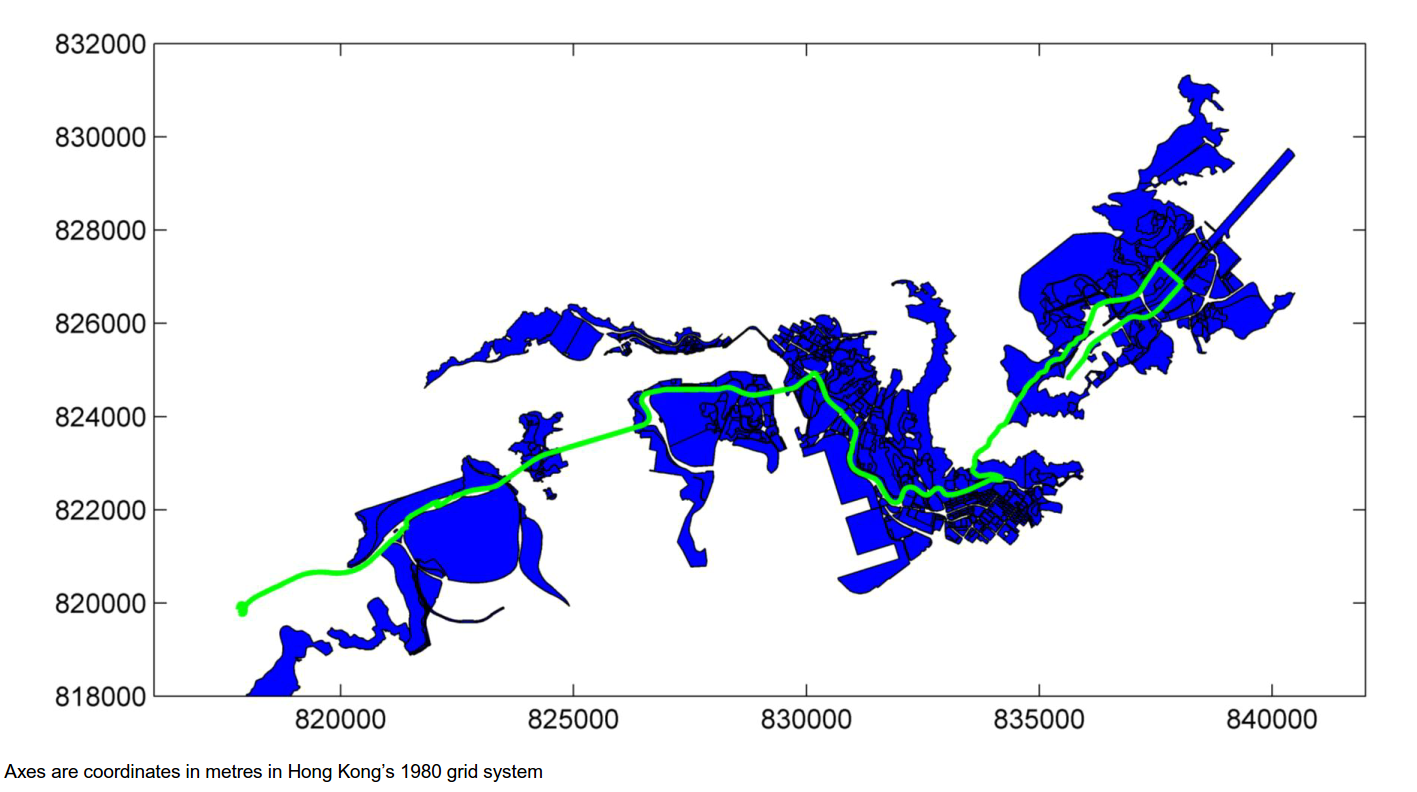
Figure 12.24 Population
Polygons
12.24.1
Following Atkins (2006), twelve wind
directions are used in the modelling (Table 12.33) directions are modelled. Following Atkins
(2006), it has been assumed that in the open areas, all wind directions are of
equal probability, while for the urban areas, based on the CFD modelling
reported in Technica (1989), the wind directions along the route are given a
higher probability than those at an angle to the route directions.
Table 12.33 Wind
Direction Probabilities
|
|
Open Areas
|
Urban Areas
|
|
Along route
|
8.33%
|
21.42%
|
|
30° to route
|
8.33%
|
8.33%
|
|
60°
to route
|
8.33%
|
4.17%
|
|
90°
to route
|
8.33%
|
3.58%
|
|
120°
to route
|
8.33%
|
4.17%
|
|
150°
to route
|
8.33%
|
8.33%
|
|
Backwards
(180°
to route)
|
8.33%
|
21.42%
|
|
210°
to route
|
8.33%
|
8.33%
|
|
240°
to route
|
8.33%
|
4.17%
|
|
270°
to route
|
8.33%
|
3.58%
|
|
300°
to route
|
8.33%
|
4.17%
|
|
330°
to route
|
8.33%
|
8.33%
|
12.24.2
Following Atkins (2006), stability class of D
(i.e. neutral stability) has been assumed in the QRA. A wind speed of 5 m/s is
adopted in open areas and 2 m/s in urban areas.
12.25.1
The QRA combines information on the
consequences of chlorine releases with information on the likelihood to
generate individual risk contours and FN curves. Individual risk is the chance
of death per year to a specified individual at a specific location. Societal
risk (FN curves) is the risk to the population as a whole.
Societal Risk
12.25.2
FN Curves for the Construction and
Operational Phases of the reprovisioning project within the 1-km Consultation
Zone are shown in Figure 12.25.
12.25.3
Risks during the Operational Phase are
slightly higher than the Construction Phase due to higher chlorine delivery
quantities (127 trucks per year during Operational Phase compared to 107 trucks
per year during construction).
12.25.4
As can be seen, the societal risks are in the
lower ALARP region. Nmax (the number of fatalities at frequency of
10-9 per year) is below 500 for both Construction and Operational
Phases.
12.25.5
A breakdown of risks by scenario is shown in Figure 12.26 for the operational case. Collisions, truck
rollover and spontaneous failures are the major contributors to the risk. This
can also be seen in the potential loss of life (PLL) data (Table 12.34).
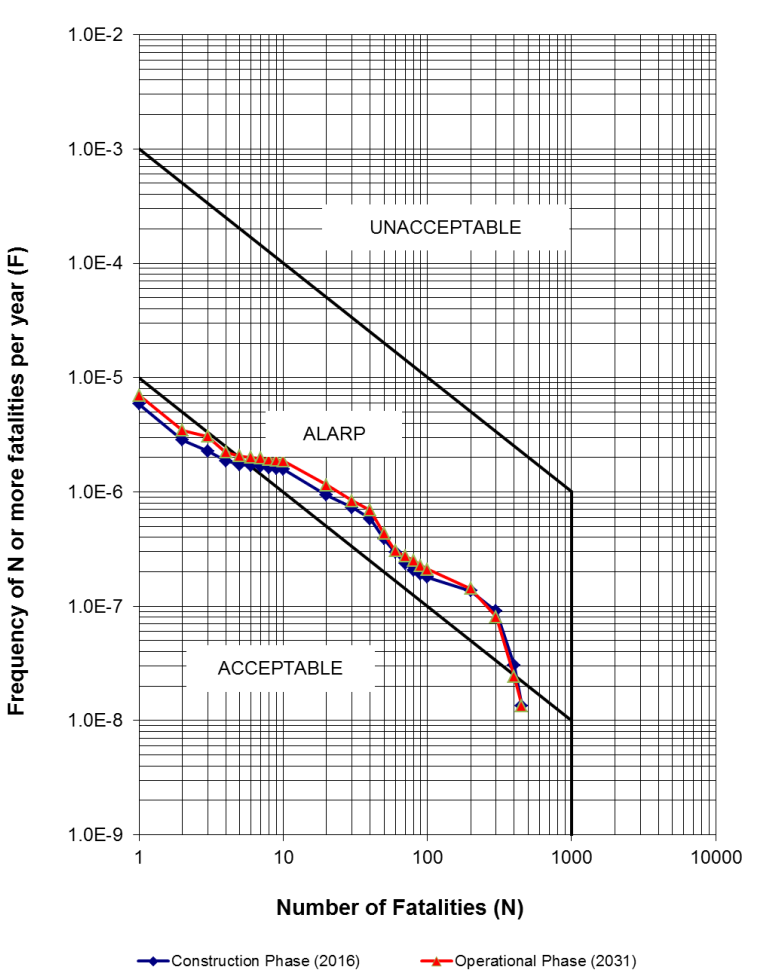
Figure 12.25 FN Curves for Off-site
Chlorine Transport
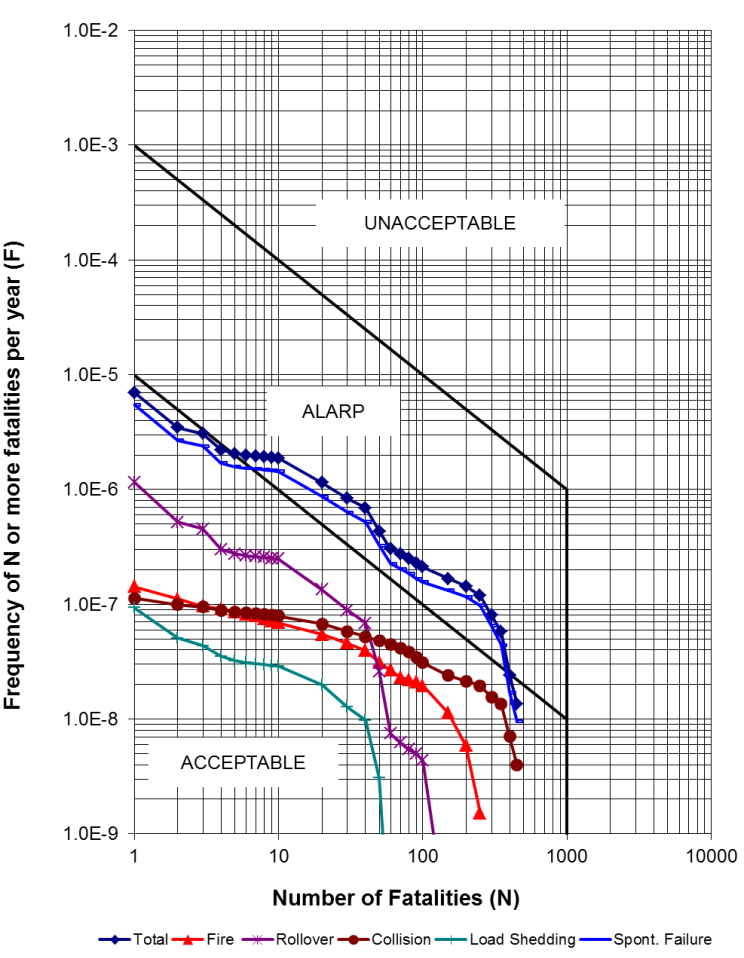
Figure 12.26 FN Curves for Off-site
Chlorine Transport Breakdown by Scenario
Table 12.34 PLL for
Off-site Chlorine Transport
|
Release Scenario
|
PLL
per year
(Construction
Phase)
|
PLL
per year (Operational Phase)
|
|
Spontaneous
failures
|
7.73E-5
|
8.75E-5
|
|
Fire
|
4.82E-6
|
5.44E-6
|
|
Collision
|
1.02E-5
|
1.12E-5
|
|
Rollover
|
7.34E-6
|
8.63E-6
|
|
Load
shedding
|
8.63E-7
|
1.01E-6
|
|
Total
|
1.01E-4
|
1.14E-4
|
Individual Risk
12.25.6
The individual risk (IR) for off-site
chlorine transport is shown in Figure 12.27. For brevity, only the Operational Phase is
shown since this is the worst case (chlorine transport quantities are slightly
higher during Operational Phase). For the Construction Phase, risks are
slightly lower. As can be seen, the individual risk levels are well below the
Hong Kong Risk Guidelines criterion of 10-5 per year. This is
typical of transport-related risks where the risk is spread along an extended
route.
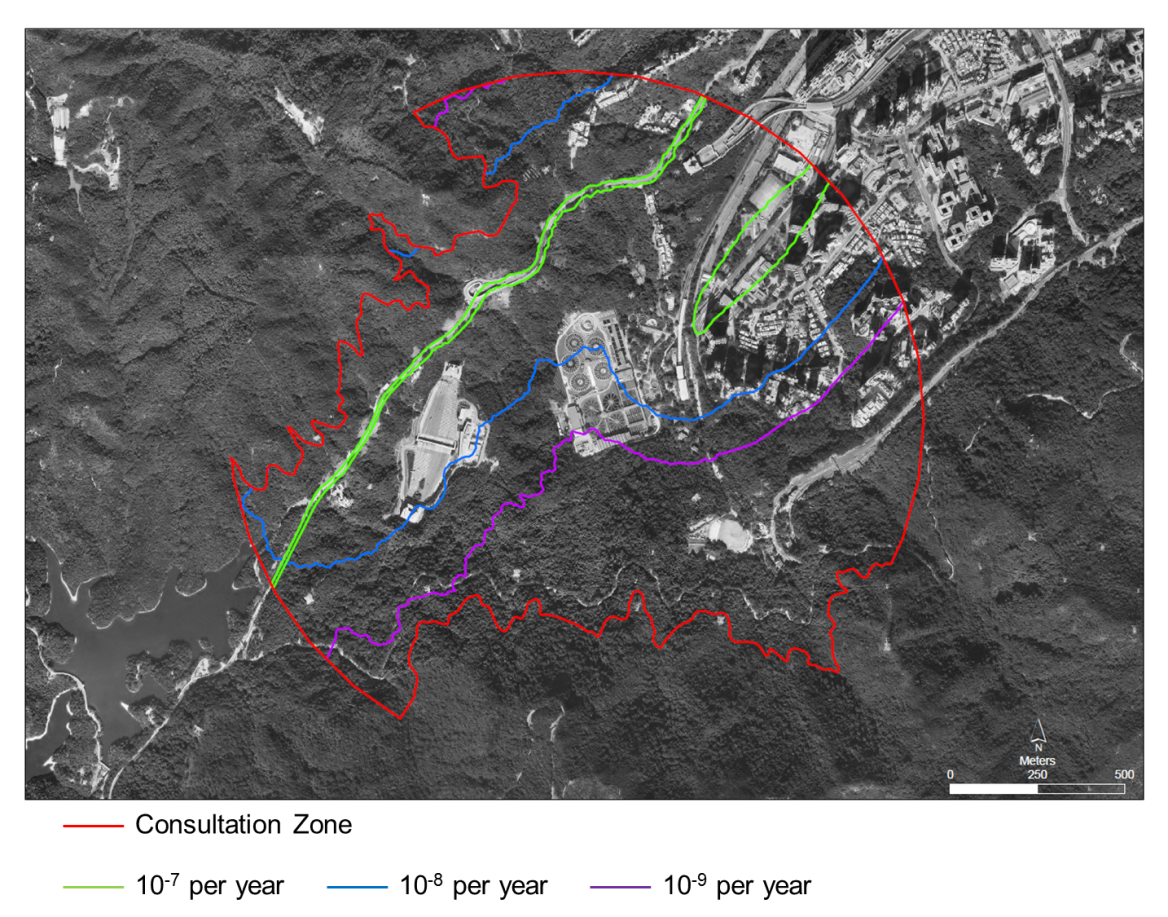
Figure 12.27 Individual Risk
for Off-site Chlorine Transport, Operational Phase
12.25.7
IR tends to be higher along the urban
sections of road, compared to open sections. This is due to the lower wind
speeds (2 m/s) assumed in the modelling for urban sections. Lower wind speeds
are detrimental to dispersion and hence larger toxic clouds are predicted.
Also, the channelling effect of building is reflected in the modelling of urban
areas by prescribing a higher probability of dispersion along the road
direction. These effects combined lead to higher IR in urban sections.
12.26.1
Since the societal risk levels lie in the
ALARP region of the HKRG, mitigation measures are required to reduce the risks
to levels As Low As Reasonably Practicable. This section discusses potential
mitigation measures and assesses their practicability.
12.26.2
The assessment focussed on the following
categories of mitigation options:
·
Improved design of the Water Treatment Works which
could result in reduced transport risk;
·
Improved truck design;
·
Improved chlorine drum design;
·
Improved procedural controls; and
·
Any other identified mitigation measures not
belonging to the above categories.
12.26.3
A number of mitigation measures have been
considered and assessed in the previous Chlorine Transport QRA (Atkins, 2006)
and, according to the information provided by WSD, those considered practicable
have been already implemented at the WTW. Nevertheless, some of the mitigation
measures at the WTW that were previously deemed not practicable, are re-examined
here based on the updated PLL results.
12.26.4
In addition, a series of workshops were
undertaken to further identify mitigation options and assess their
practicality.
12.26.5
Practical mitigation measures are further
considered in the Cost Benefit Analysis to ensure compliance with the ALARP
process.
Identification
of Potential Risk Mitigation
Measures
12.26.6
Potential risk mitigation measures were
identified using the following steps:
·
An initial list of risk mitigation measures was
identified, making reference, as far as possible, to existing and relevant Hong
Kong reports and other international references. The list was further
supplemented following two risk mitigation workshops held on 23 November 2011
and 18 January 2012;
·
The identified mitigation measures were discussed
with relevant specialists and screened for their practicability as part of the
two workshops and subsequent discussions with WSD;
·
A site visit was conducted on 26 April 2012 to
directly observe loading operations of chlorine trucks and the transport to Sha
Tin WTW; and
·
The potential mitigation measures assessed to be practical
(shortlist) are retained for the Cost Benefit Analysis.
Risk
Mitigation Workshop & Screening
12.26.7
The latest and most relevant report which
addressed chlorine transport risk mitigation is the Atkins (2006) study. The
study identified several risk mitigation measures related to chlorine transport
as summarised in Table 12.35.
Table
12.35 Risk Mitigation Measures from Atkins (2006) Study
|
Item
|
Risk
Reduction Measures
|
|
R1
|
Restrict the delivery of
chlorine by truck to night time deliveries only.
|
|
R2
|
Road improvements –
barriers, signs, etc.
|
|
R3
|
Road improvements – new
roads
|
|
R4
|
Optimise the transport
routes to minimise risks
|
|
R5
|
Optimise the transport
routes to minimise risks with import by truck direct from mainland China
|
|
R6
|
Improvements to drum
designs to minimise the risk of a leak in an impact situation (e.g. truck
crash, load shed, and boat collision)
|
|
R7
|
Internal excess flow valve
or restriction orifice in the valve pipe inside the drums which limits the
maximum flow in the event of a valve failure or valve damage
|
|
R8
|
Use of smaller drums
|
|
R9
|
Bulk transport of chlorine
|
|
R10
|
Improvements to truck’s
design and operation to reduce the chance of accidents:
- Crashes
- Load shedding
- Other potentially dangerous situations (e.g. driving off the side of a
road, brake failure causing loss of control on a steep road)
|
|
R11
|
Improvements to truck’s
design and operation to reduce the chance of a chlorine release once the
initial accident has happened.
|
|
R12
|
Improvements to truck’s
design and operation to reduce the consequences of a chlorine release once a
drum is leaking
|
|
R13
|
Improvements to truck’s
design and operation to improve emergency response in the event of a chlorine
incident
|
|
R14
|
Improvements to emergency
response in the event of a road truck chlorine incident
|
|
A1/ A2
|
Change the water treatment
process or use on-site generation at the WTWs so that chlorine drums are not
used, hence there is no longer any need to transport them
|
|
A3
|
Pre-treatment of water in
China so that the water reaching the WTWs in Hong Kong is of a significantly
higher standard
|
12.26.8
The first Risk Mitigation Workshop, attended
by representatives of MTRCL, WSD and ERM, was held on 23 November 2011 and discussed
a preliminary list of possible risk mitigation measures. The mitigation
measures identified during the first workshop were systematically presented and
discussed. Some were accepted and recommended, others deemed impractical.
12.26.9
Following the first workshop, a short list of
mitigation measures was selected for further evaluation and discussion on their
practicality.
12.26.10
The objective of the second Risk Mitigation
Workshop was to review the shortlisted mitigation measures and further assess
their practicability. Some additional potential mitigation measures were also
identified through the discussions.
12.26.11
Following the identification process
described above, the full list of potential risk mitigation measures is
provided in Table 12.36 together with an assessment of their
implementation practicality.
Table 12.36 Potential
Risk Mitigation Measures
|
Ref.
|
Potential
Risk Mitigation Measure
|
Source
|
Implementation
Status
|
Evaluation
of Risk Mitigation Practicality
|
Further
Consideration
|
|
Improvement
of Sha Tin WTW
|
|
|
|
|
|
1.1
|
Reduction of chlorine transport by on-site chlorine
generation
|
1st HAZID Workshop
|
Not implemented.
|
On-site generation of chlorine
is not adopted anywhere worldwide for drinking water treatment. For on-site
generation of hypochlorite, WSD has recently considered the latest
development of such technology. After considering the merits and
demerits of the technology, worldwide practice, operation and maintenance
details, capital and operating costs, regulations on the Disinfection
Byproducts (DBPs) and the suitability of its use in Hong Kong, it has been
concluded that among the options of chlorine based disinfectants used for
potable water treatment, liquid chlorine is still the most practical
disinfectant for water treatment used in Hong Kong situation. WSD has no plan
to change the present practice of using liquid chlorine as a disinfectant for
the present moment. Nevertheless, WSD will continue to keep under review the
latest development of use of alternative disinfectants in water supply
industry.
|
Keep in view.
|
|
1.2
|
Reduction of chlorine usage at WTW –
ozonation and UV
|
1st HAZID Workshop
Atkins (2006) (ref. A1, A2)
|
Will be implemented as part of
reprovisioning project to reduce chlorine to 761 tonnes/ year.
This is the basis for the hazard to life
assessment.
|
761 tonnes/ year is still required for
post-dosing. No further reduction is possible.
|
No further considerations required.
|
|
1.3
|
Reduction of chlorine transport by
pre-treatment in China
|
1st HAZID Workshop
Atkins (2006) (ref. A3)
|
Already implemented.
This is the basis for the hazard to life
assessment.
|
761 tonnes/ year is still required for
post-dosing. No further reduction is possible.
|
No further considerations required.
|
|
1.4
|
Other water treatment technologies
|
1st HAZID Workshop
|
Not implemented.
|
No other practical established technologies
available.
|
Refer to 1.1.
|
|
Improvement
of Truck Design
|
|
|
|
|
|
2.1
|
Provision of fire screen between wheels and
cargo and between cab and cargo and provision of fire retardant materials for
the wheel arches
|
1st HAZID Workshop
2nd HAZID Workshop
|
Fire shield already partially provided
between cab and cargo area as per truck specification. The truck flat bed is
metallic and also provides some fire protection.
In addition, before the start of the
reprovisioning works, the truck is planned to be improved to include a fire
screen between the cab and cargo area and around the wheel arches. This
should be constructed, installed and operated to international standards with
a minimum 3mm thick fire screen, extending 150mm on all sides, and 100mm
behind the cab of the vehicle.
This is the basis for the hazard to life
assessment.
|
This will be provided as a standard
provision before the start of the reprovisioning works.
|
No further considerations required.
|
|
2.2
|
Provision of sufficient capacity fire
extinguishers (minimum 2 × 9kg or AFFF-type), combined with driver training
|
1st HAZID Workshop
|
2 × 2kg fire extinguishers are currently
provided and the truck will be provided with 2 × 9L fire extinguishers with
dedicated driver training before the start of the reprovisioning works.
This is the basis for the hazard to life
assessment together with the firescreen measure (Item 2.1).
|
2 × 2kg fire extinguishers have been
provided as a standard provision. Improved (2 × 9L) fire extinguishers) will
be provided at the start of reprovisioning works.
|
No further considerations required.
|
|
2.3
|
Reduction of combustible such as provision
of fire resistant materials, cables, and limit on fuel tank capacity
|
1st HAZID Workshop
|
The truck design already considers minimum
amount of combustibles.
|
The truck design could be reviewed for
possible further practical reduction of combustible materials and possible
use of fire retardant materials in the cab to minimise truck fire load.
|
This potential risk mitigation
measure is further evaluated in the Cost Benefit Analysis.
|
|
2.4
|
Securing load by improving brackets/clamp
design
|
1st HAZID Workshop
2nd HAZID Workshop
Atkins (2006) (ref. R10)
|
The current assessment takes credit to the
existing clamp which is a standard provision of mitigation. This is the basis
for the hazard to life assessment.
To improve reliability of the clamp, the
drum clamping arrangements has been reviewed and an improved design will be
implemented before the start of the reprovisioning works.
It should be noted that the current QRA
does not take credit to the proposed new design of clamp.
|
This (existing clamp) is already provided
as a standard provision.
|
No further considerations required
|
|
2.5
|
Provision of side/ front/ rear crash guards
with high energy absorption
|
1st HAZID Workshop
|
Crash bars implemented but with limited
energy absorption capacity.
|
This option is considered practical subject
to agreement with the relevant authorities.
|
This potential risk mitigation
measure is further evaluated in the Cost Benefit Analysis.
|
|
2.6
|
Provision of side/ front/ rear panels to
contain leak
|
1st HAZID Workshop
2nd HAZID Workshop
|
Not implemented.
|
Solid and higher side panels on the truck
may help contain chlorine gas from minor leaks however the volume of gas from
a single drum after expansion is much greater than the possible volume that
can be contained within the truck. Specifically, each drum contains 1 tonne
of chlorine, which occupies 343 m3 as a gas at ambient conditions.
Assuming 1m high side panels, the volume that could be contained within the
truck is approximately 2.5 × 10 × 1 = 25m3. As such it is not
considered effective to contain chlorine leaks.
|
No further considerations required.
|
|
2.7
|
Provision of leak detectors and alarm with
appropriate training to handle leaked drums
|
1st HAZID Workshop
|
Already implemented.
This is the basis for the hazard to life
assessment.
|
Measure already implemented.
|
No further considerations required.
|
|
2.8
|
Improved tyres design and checks
|
1st HAZID Workshop
|
Annual vehicle check performed but no
specific measures implemented for tyres.
|
It is consider practical to implement
measures to ban the use of retreaded tyres and to perform visual checks on
truck condition on a more frequent basis than on annual basis.
|
This potential risk mitigation
measure is further evaluated in the Cost Benefit Analysis.
|
|
2.9
|
Cargo frame
|
1st HAZID Workshop
2nd HAZID Workshop
|
Not implemented.
|
Provision of a sturdy steel frame similar
to that being used for delivery of 50kg chlorine cylinders was considered
practical for providing additional protection of drums from impacts
(collisions, rollover) subject to acceptance by relevant authorities.
There are also concerns that such a frame would interfere with drum
loading/unloading since there is little spare space on the chlorine trucks.
|
This potential risk mitigation
measure is further evaluated in the Cost Benefit Analysis.
|
|
2.10
|
Securing load by improving latching
arrangements with additional ropes
|
Atkins (2006) (ref. R10)
Further reviewed following 2nd
HAZID Workshop
|
Not implemented.
|
Two lashing (one per cradle) are
already provided. Additional lashings would not provide any further benefit
and instead may pose some additional safety concerns. Additional lashings
will require the drums to be supported by more than two cradles which may
lead to possible loss to contact with the cradle supports and subsequent
unstable and unsafe conditions. The option of tying drums together with a
steel cable to mitigate load shedding was considered but would lead to new
hazards. The metal on metal contact with the drums could generate sparks and
lead to fire risk and also there could be new hazards arising during lifting
operations if these tie cables are not removed. Also under fire condition, it
will take more time to remove the drums from the fire source. Additional
lashings/ropes therefore not considered practical.
It has also been proposed to increase the
tensile strength of the lashing. According to the guidelines given by the
Chlorine Institute, the aggregate working load limit of the tie-down
assemblies used to secure an article in any direction must be at least one
half the weight of the article, for instance, the gross weight of a full drum
would be about 1,700 kg, then the minimum SWL of each fabric strap (using two
straps for one drum) should be 1700 / 2 × 0.5 = 425 kg. The existing
arrangement using fabric strap of 1,000kg SWL is therefore safe and adequate
for the purpose.
|
No further considerations required
|
|
Ref.
|
Potential Risk Mitigation Measure
|
Source
|
Implementation Status
|
Evaluation of Risk Mitigation Practicality
|
Further Consideration
|
|
Improvement
of Drum Design
|
|
|
|
|
|
3.1
|
Improvements to drum design to minimise the
risk of a leak in an impact situation (e.g. truck crash, rollover, load shedding)
|
1st HAZID Workshop
Atkins (2006) (ref. R6)
|
WSD indicated that, impact test has been
performed in City University to assess the impact ability of drums. This resulted
in recommendations that have led to drum design improvements: valve cap has
been strengthened and bolts changed to stainless steel to avoid corrosion.
The chlorine container replacement programme is retained at 12 years. In
addition there is a procedure to scrap drum in case of visual damage.
Already implemented. This is the basis for
the hazard to life assessment.
|
Already implemented.
|
No further considerations required.
|
|
3.2
|
Higher integrity drums (increased
thickness)
|
1st HAZID Workshop
|
Not implemented.
|
Not practical as drums need to comply with
Chinese standards GB5100. A drum with thickness higher than 12mm is not available
on the market.
GB5100 specifies the minimum wall thickness
of drums, which is about 4.1 mm for a 1-tonne drum of 800 mm diameter. The
current thickness (12 mm) is about 3 times the thickness required.
|
No further considerations required.
|
|
3.3
|
Use of smaller drums
|
1st HAZID Workshop
|
Not implemented.
|
Smaller drums are not available on the
market. This would also require redesign of the Chlorination House since a
larger number of drums would be required if the drums are smaller, to
maintain same storage capacity. However, the store is not large enough for increased
number of drums. This option is therefore not considered practical.
|
No further considerations required.
|
|
3.4
|
Use of 50kg cylinders instead of 1-tonne
drums
|
1st HAZID Workshop
Atkins (2006) (ref. R8)
|
Not implemented.
|
This would require redesign of the Chlorination
House as chlorine usage in Sha Tin WTW is very high and store would not be
large enough for number of cylinders required. This option is therefore not
considered practical.
|
No further considerations required.
|
|
3.5
|
Bulk transport of chlorine
|
1st HAZID Workshop
Atkins (2006) (ref. R9)
|
Not implemented.
|
The Chlorination House is designed for
handling one tonne drums (lifting equipment, cradles, process equipment, etc.
are designed for handling 1-tonne drums). This will require substantial Chlorine
House redesign and modifications. Also, concerns from district council expected
given the potential higher consequences than 1-tonne drums. This option is
not considered practical.
|
No further considerations required.
|
|
3.6
|
Internal excess flow valve or restriction
orifice in the valve pipe inside the drums which limits the maximum flow in the
event of a valve failure or valve damage
|
1st HAZID Workshop
Atkins (2006) (ref. R7)
|
Not implemented.
|
Not available on the market from the 1-tonne
drums supplier. This option is not considered practical.
|
No further considerations required.
|
|
3.7
|
Provision of special protective cap and
guard for the drum valves
|
1st HAZID Workshop
|
Implemented and improved following CityU
study.
This is the basis for the hazard to life
assessment.
|
Already implemented.
|
No further considerations required.
|
|
3.8
|
Higher frequency of integrity checks
(radiography or ultrasonic test inspection)
|
1st HAZID Workshop
|
Hydraulic testing up to 33 bar every 4
years. 100% radiography conducted at time of manufacture. The chlorine
container replacement programme is retained at 12 years. In addition there is
a procedure to scrap drum in case of visual damage.
|
Annual periodic radiography or ultrasonic
test inspections in addition to full checking at time of manufacture could be
conducted. Although, there is a high volume of drums to be checked, this
option may be considered practical.
|
This potential risk mitigation
measure is further evaluated in the Cost Benefit Analysis.
|
|
Ref.
|
Potential Risk Mitigation Measure
|
Source
|
Implementation Status
|
Evaluation of Risk Mitigation Practicality
|
Further Consideration
|
|
Procedural
Control Improvement
|
|
|
|
|
|
4.1
|
Emergency kit compliant with Chlorine
Institute specifications
|
1st HAZID Workshop
2nd HAZID Workshop
Atkins (2006) (ref. R13)
|
Already implemented, Kit A and Kit B as per
Institute requirements.
This is the basis for the hazard to life
assessment.
|
Already implemented.
|
No further considerations required.
|
|
4.2
|
Improvements to emergency response in the
event of a road truck chlorine incident
|
1st HAZID Workshop
|
FSD have internal guidelines and training
on emergency response to chlorine truck accident. WSD are now developing some
simulators and training for using the emergency repair kits for truck
drivers. WSD informed that drivers receive training and receive an annual
certificate. Communications and PA system available on trucks.
This is the basis for the hazard to life
assessment.
|
Already implemented.
|
No further considerations required.
|
|
4.3
|
Safe/defensive driving training to driver
combined with GPS speed control and monitoring system to ensure safe driving
behaviour from driver
|
1st HAZID Workshop
2nd HAZID Workshop
|
A GPS fleet management system is planned to
be implemented before the start of the reprovisioning works. This will be
used to monitor and enforce operating speeds of chlorine trucks. This will
also be used to monitor speed profiles and lower speed limits for specific
section of the route (high population areas or high transport risk).
This is the basis for the hazard to life
assessment.
|
This will be provided as a standard
provision before the start of the reprovisioning works.
|
No further considerations required.
|
|
4.4
|
Vehicle accompanying chlorine truck along
critical road sections in Sha Tin area
|
1st HAZID Workshop
2nd HAZID Workshop
|
Not implemented.
|
The use of an accompanying vehicle was
considered feasible if limited to WSD contract vehicles. Escort by FSD or
police vehicles was considered not feasible. An accompanying vehicle may help
mitigate frequency of collision by providing greater separation distance to
other road users but the effectiveness would be limited. An accompanying
vehicle may also provide rapid response to an incident (collision, fire,
etc.) but any action would be limited to containing a small leak.
|
This is considered as a “good
practice” measure. The vehicle should be equipped with emergency kit, fire
extinguisher, radio set for communication.
|
|
4.5
|
Escort vehicle with fire fighting
provisions
|
1st HAZID Workshop
|
Not implemented.
|
In addition to considerations for Item 4.4,
fire fighting services would require to be of similar design as FSD vehicles
and operated by non-FSD personnel. As such vehicle standard is not available
for non-FSD operation, agreement from FSD and HKPF is unlikely and such an
option is not considered practical.
|
Refer to Item 4.4.
|
|
4.6
|
Emergency response coordination between
drivers, accompanying vehicles if any and FSD
|
1st HAZID Workshop
Atkins (2006) (ref. R14)
|
The emergency response plan has already
implemented. This is the basis for the hazard to life assessment.
Communication system is provided with
procedures for contacting FSD and HKPF.
FSD have internal guidelines and training
on emergency response to chlorine truck accidents. WSD now provide emergency
repair kits and training for truck drivers to enable them to respond to small
leaks. Truck drivers receive training and an annual certificate.
|
Already implemented.
|
No further considerations required.
|
|
4.7
|
Chlorine contain and scrubber system in
trucks
|
1st HAZID Workshop
Atkins (2006) (ref. R11, R12)
|
Not implemented.
|
The “Scrub and Contain System” prepared by
US Scrubber System Supplier in 2003 was purely a proposal which was proven to
be not practical in design. Improved version of such “Scrub and Contain
System” is not available in the current market. WSD agreed to keep in view
latest technology for possible new method to reduce the risks further.
|
Keep in view.
|
|
4.8
|
Night time or early morning delivery
|
1st HAZID Workshop
Atkins (2006) (ref. R1)
|
Not implemented.
|
From an operational point of view, this
measure is not considered practicable because of the noise issue and low
manning levels for handling drums at night-time. Also, this poses some
control, monitoring and safety concern as small leakages would not be visible
and serious traffic accidents tend to occur at night or early morning (driver
over speeding under low traffic condition). Therefore, nigh time delivery is
not considered practical.
|
No further considerations required.
|
|
4.9
|
Traffic control during chlorine truck
passage
|
1st HAZID Workshop
|
Not implemented.
|
Chlorine delivery is relatively frequent
and stopping adjacent traffic during a delivery would affect a large number
of road users and cause public concern. This measure would also require
approval by the relevant authorities. This measure is not considered
practical in Hong Kong given the high traffic volumes.
|
No further considerations required.
|
|
4.10
|
Half-fill drums
|
1st HAZID Workshop
|
Not implemented.
|
Half fill drums would pose operational
constraints with different drums going to different WTWs. In addition, the
chlorine storage at Sha Tin WTW not big enough to double the number of drums
that would be required if each drum is only half full. This will require
substantial Chlorination House redesign and modifications. This is therefore
not considered practical.
|
No further considerations required.
|
|
Ref.
|
Potential Risk Mitigation Measure
|
Source
|
Implementation Status
|
Evaluation of Risk Mitigation Practicality
|
Further Consideration
|
|
Other
improvements
|
|
|
|
|
|
5.1
|
Road improvements – barriers, signs, etc.
|
1st HAZID Workshop
Atkins (2006) (ref. R2)
|
Not implemented.
|
All new public roads are designed and
constructed to the transport Planning & Design Manual issued by the
Transport Department. No further risk mitigation measures considered
practical.
|
No further considerations required.
|
|
5.2
|
Road improvements – new roads
|
1st HAZID Workshop
Atkins (2006) (ref. R3)
|
Not implemented.
|
The Transport Department is the responsible
authority for any road improvement works related to road safety and should
maintain the roads in safe condition. Further improvement is not considered
practical.
|
No further considerations required.
|
|
5.3
|
Alternative transport route
|
1st HAZID Workshop
2nd HAZID Workshop
Atkins (2006) (ref. R4)
|
The transport route has been reviewed, and
the shortest route with the lowest population density has been adopted. This
is as the basis for the hazard to life assessment.
|
Alternative routes through Tai Wai were
considered. Widening of Keng Hau Road may be considered for more direct route
from Tai Po Road to Sha Tin WTW. This will bypass heavily populated area in
Tai Wai. However, this road is steep, has a 5 tonne weight limit and passes
close to village houses. This alternative route is not considered practical.
Other routes are longer and with higher
population density. Therefore the most practical route has already been
considered.
|
No further considerations required.
|
|
5.4
|
Dedicated access tunnel from Tai Po Road
|
1st Workshop (ref.5.1.4)
|
Not implemented.
|
Not practical in short term.
|
This potential risk mitigation
measure is further evaluated in the Cost Benefit Analysis.
|
|
5.5
|
Optimise the transport routes to minimise
risks with import by truck direct from China
|
1st Workshop (ref.5.1.5)
Atkins (2006) (ref. R5)
|
Not implemented.
|
This recommendation is applicable only to
WTWs near the boundary and would transfer some of the risks to the Shenzhen
areas. This would be a sensitive issue and would be difficult to get approval
from the Chinese Authorities as the chlorine trucks would be required to
route through the heavily trafficked ports at the border.
This measure is therefore not considered
practical.
|
No further considerations required.
|
|
5.6
|
Alternative dock
|
2nd HAZID Workshop
|
Not implemented.
|
An alternate chlorine receiving dock in the
Sha Tin/Tai Po area would significantly shorten road transport distances with
corresponding reduction in risk. This was suggested in the 2006 Atkins study
and should be pursued as a long term objective.
The Tseung Kwan O dock could be
considered as an alternative choice however it requires chlorine transportation
in dense population areas. Therefore, to
date, no practicable site has been identified for an alternate dock. This
option is therefore not considered practical.
The option of extending the use of the Kai
Tak chlorine dock has also been considered. However, this option is not
feasible due to the Kai Tak development project.
|
Keep in view.
|
|
|
|
|
|
|
|
Cost
Benefit Analysis
12.26.12
The preceding sections identified a number of
mitigation measures to take forward into a cost-benefit analysis (CBA). CBA is
widely used in QRA studies to evaluate the cost-effectiveness of alternative
measures and provide a demonstration that all reasonably practicable measures
have been taken to reduce risks.
12.26.13
In this study, the CBA follows the
methodology adopted for the on-site Sha Tin WTW QRA and has been applied by
calculating the implied cost of averting a fatality (ICAF) for the various
mitigation measures identified in the preceding sections. The ICAF value is
calculated as follows:
ICAF = Cost of mitigation measure / (Reduction
in PLL value × Design life of mitigation measure).
12.26.14
ICAF is a measure of the cost per life saved
over the lifetime of a project due to implementation of a particular mitigation
measure. It may be compared with the value of life to determine whether a mitigation
measure is reasonably practicable to implement, i.e. if ICAF is less than the
value of preventing a fatality, then the mitigation measure should be
implemented. In this study the value of life is taken as HK$ 33M, which is the
same figure as used in previous QRA (ERM, 2001).
12.26.15
Depending on the level of risk, the value of
life figure may be adjusted to reflect people’s aversion to high risk.
Following ERM (2001) the aversion factor is taken as 20, as the FN curve runs
close to the 1000 fatalities cut-off line. The adjusted value of preventing a
fatality using the aversion factor of 20 becomes HK$ 660M. This also implies
the maximum justifiable spend (MJS) for a particular mitigation measure, which
is given by
MJS
= HK$ 660M × Reduction in PLL value × Design life of mitigation measure.
A mitigation measure is considered
cost effective if its cost is less than its MJS.
12.26.16
Table 12.37 summarises the Cost Benefit Analysis using
the ICAF method and MJS method for the various practical risk mitigation
measures identified above.
Table 12.37 Cost Benefit
Analysis
|
Ref.
|
Potential
Risk Mitigation Measure
|
Note
|
Cost
Estimate (HK$M)
|
PLL
reduction (per year)
|
Design
life (years)
|
MJS
(HK$M)
|
ICAF
(HK$M)
|
(ICAF
< $660M?)
|
Recommendation
|
|
1. Improvement
of Sha Tin WTW
|
|
|
|
|
|
|
|
|
|
Not applicable
|
|
|
|
|
|
|
|
|
|
|
2.
Improvement of Truck
Design
|
|
|
|
|
|
|
|
|
|
2.3
|
Reduction of combustible such as provision
of fire resistant materials, cables, and limit on fuel tank capacity
|
The cab design should be reviewed for
further reduction in combustible. The fuel tank quantity should also be kept
to the minimum required for the trip. This measure will have some but no
significant reduction in the PLL due to fire scenario (Fire Scenario PLL = 5.44E-6
per year). For the purpose of this assessment a conservative risk reduction
of 50% has been considered for all fire events.
The cost of implementation is based on
modification work assumed to be around HK$ 150,000 in total with a truck
service life of 10 years.
As this risk mitigation measure may require
research and approval by the relevant authorities, this option is not
considered practical in the short term.
|
0.15
|
2.72E-6
|
10
|
0.02
|
5,517
|
N
|
Considering the relative low cost of this
measure, it is recommended to further review the practicality of reducing
combustible materials or use of fire retardant materials in the cab. This
should include procedures to limit contents in fuel tanks. This should be
considered as a long term measure.
|
|
2.5
|
Provision of side/ front/ rear crash guards
with high energy absorption
|
This option will require design and testing
in accordance with the relevant authorities’ requirements. This may require
significant investment. For the purpose of this assessment a relatively low
capital expenditure (HK$ 0.5M per truck × 3 trucks) has been considered.
This measure will be effective for reducing
the likelihood of chlorine release events due to small impact (100%
reduction) and medium impact (50% reduction). This gives a base frequency of 7.13E-9
per truck-km for accidents having potential to cause significant mechanical
impact on the chlorine drums. As a result, PLL due to collision (see Table 12.34) is reduced from 1.12E-5
per year to 4.36E-6 per year.
As this risk mitigation measure may require
research, design, testing, and approval by the relevant authorities, this
option is not considered practical in the short term.
|
1.5
|
6.86E-6
|
10
|
0.05
|
21,851
|
N
|
It is recommended to implement side, front
and rear crash guards with high energy absorption in coordination and
accordance with the relevant authorities. Redesign of truck is required and
this item will be further reviewed for implementation if a practical design
can be agreed by relevant authorities.
|
|
2.8
|
Improved tyres design and checks
|
It is assumed that banning the use of
retreaded tyres and improved visual checks on the tyres will reduce the
overall PLL for fire (5.44E-6), collision (1.12E-5) and rollover (8.63E-6) events
by 1% overall. This gives a PLL reduction of (5.44E-6 + 1.12E-5 + 8.63E-6) ×
0.01 = 2.53E-7.
|
0.05
|
2.53E-7
|
5
|
8.34E-4
|
39,550
|
N
|
Considering the relative low cost of this
measure, it is recommended to ban the use of retreaded tyres and perform
regular visual checks on the tyres. This measure should be implemented before
the start of the reprovisioning project.
|
|
2.9
|
Cargo frame
|
Provision of a sturdy steel frame similar
to that being used for delivery of 50kg chlorine cylinders would require
design and testing in accordance with the relevant authority requirements.
This may require significant investment. For the purpose of this assessment a
relatively low capital expenditure (HK$ 0.5M per truck × 3 trucks) has been
considered.
Such cargo frame could reduce the
likelihood of chlorine release events due to rollover events by 90%. This
gives a PLL reduction of 8.63E-6 × 0.9 = 7.76E-6.
As this risk mitigation measure may require
research, design, testing, and approval by the relevant authorities, this
option is not considered practical in the short term.
|
1.5
|
7.76E-6
|
10
|
0.05
|
19,323
|
N
|
It is recommended to implement a sturdy
steel frame to minimise the potential for chlorine release due to truck
rollover. Redesign of truck is required and this item will be further
reviewed for implementation if a practical design can be agreed by relevant
authorities.
|
|
3.
Improvement
of Drum Design
|
|
|
|
|
|
|
|
|
|
3.8
|
Higher frequency of integrity checks
(radiography or ultrasonic test inspection)
|
Annual periodic radiography or ultrasonic test
inspections of the chlorine drums in addition to full checking at time of
manufacture and replacement of drums every 10 years will reduce the risk
associated with spontaneous failures (PLL = 8.75E-5 per year) by 90% if the
radiography of the drum is complete. A conservative 50% reduction in PLL is
assumed for calculation purposes. This gives a PLL reduction of 8.75E-5 × 0.5
= 4.38E-5.
This risk mitigation measure will require
procurement of new materials, additional resources and training. It may not
be practical as a short term mitigation measure.
|
5
|
4.38E-5
|
10
|
0.29
|
11,427
|
N
|
Annual periodic radiography or ultrasonic
test inspections of the chlorine drums should be considered for
implementation as soon as feasible. This should be considered as a long term
measure.
|
|
4. Procedural
Control Improvement
|
|
|
|
|
|
|
|
|
|
4.4
|
Vehicle accompanying chlorine truck along
critical road sections in Sha Tin area
|
This is considered as a “good practice”
measure.
|
-
|
-
|
-
|
|
-
|
-
|
-
|
|
5. Others
improvements
|
|
|
|
|
|
|
|
|
|
5.4
|
Dedicated access tunnel from Tai Po Road
|
The total PLL is 1.14E-4 (base case during
operation phase). Assuming a dedicated tunnel at Tai Po Road for chlorine
transport can completely reduce fatality afterwards, this gives a PLL
reduction of 1.14E-4. Although this measure has significant risk reduction,
this requires significant capital expenditure of around HK$ 500 M or more.
|
500
|
1.14E-4
|
50
|
3.76
|
87,868
|
N
|
-
|
|
|
|
|
|
|
|
|
|
|
|
Discussion
12.26.17
It can be concluded
from the Cost Benefit Analysis that the following risk mitigation measures
should be implemented. It should be noted that some of these mitigation
measures require further investigation, detailed design, testing or approval by
relevant authorities and are hence considered as long term mitigation measures.
The mitigation measures to be implemented together with the implementation
schedule are presented in Table 12.38 below. Item 2.5
(crash guards) and Item 2.9 (cargo frame) of Table 12.36 require redesign
of the truck and either of these will be implemented if a practical design
can be agreed by relevant authorities. No credit had been taken in the
analysis.
12.26.18
The FN curves after
implementing these recommendations are shown in Figure 12.28.
Table 12.38 Selected Risk
Mitigation Measures and Implementation Schedule
|
Ref.
|
Potential
Risk Mitigation Measure
|
Implementation
Schedule
|
|
2.3
|
Reduction of combustible such as provision
of fire resistant materials, cables, and limit on fuel tank capacity*
|
Long term measure
|
|
2.8
|
Improved tyre design and checks
|
To be implemented at the beginning of
project
|
|
3.8
|
Higher frequency of integrity checks
(radiography or ultrasonic test inspection)
|
Long term measure
|
|
4.4
|
Vehicle accompanying chlorine truck along
critical road sections in Sha Tin area*
|
Good practice measure
|
*Credit not
taken in the mitigated case.
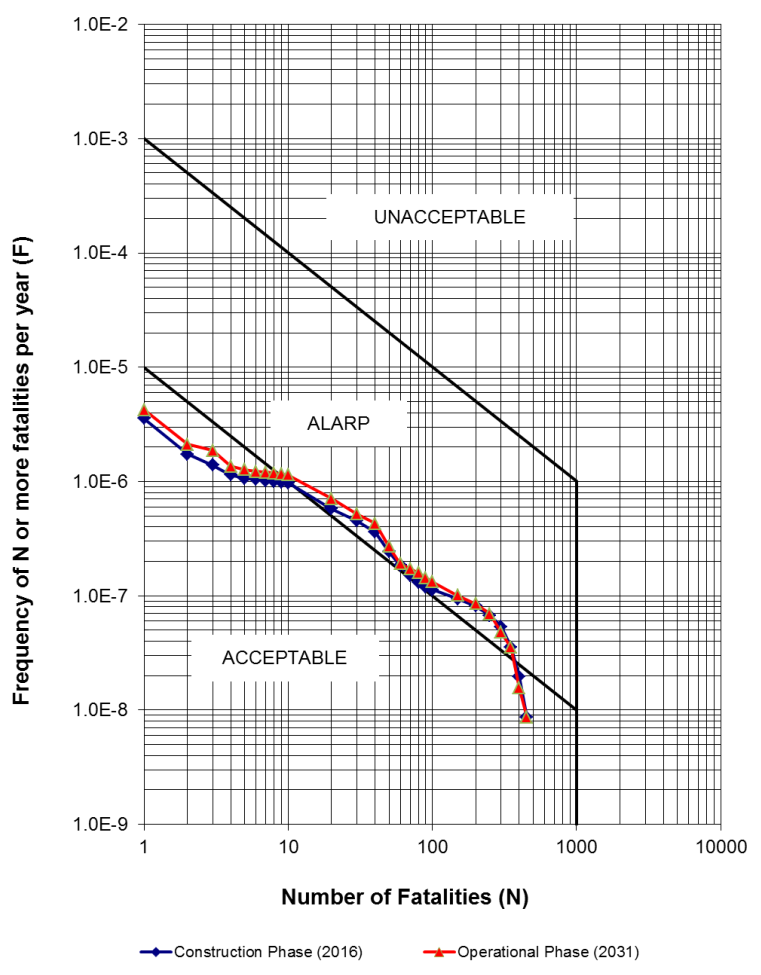
Figure
12.28 Mitigated FN Curves for STWTW
12.27.1
The risks related
to the chlorine transport to Sha Tin Water Treatment Works have been assessed.
The base case assessment considers the transport route within the Sha Tin WTW Consultation Zone.
IR results are well below the 10-5 per year for all section of the
route. This is typical of transport risks where the risks are distributed along
the length of the route.
12.27.2
The societal risk
expressed in the form of FN curves, lies in the “ALARP” region of the HKRG with
Nmax is below 500 for both Construction and Operational Phases.
12.27.3
A number of
mitigation measures have been considered and a number of short term and long
term risk mitigation measures have been recommended following a formal Cost
Benefit Analysis to ensure the risk is ALARP.
12.27.4
The following are
recommendations from the formal Cost Benefit Analysis:
Short term measures
·
It is recommended
to ban the use of retreaded tyres and perform regular visual checks on the
tyres. This measure should be implemented before the start of the
reprovisioning project (Item 2.8); and
·
Vehicle
accompanying chlorine truck along critical road sections in Sha Tin area is
recommended as a “good practice” measure. The function of the vehicle is to:
(i) monitoring the operation of the chlorine truck; and (ii) providing all
necessary assistance in case of any emergency happened to the chlorine truck at
the concerned road section. It is recommended that vehicle should be equipped
with emergency kit, fire extinguisher, radio set for communication (Item 4.4). The
accompanying vehicle will be ahead of the chlorine truck after the vehicles
entering the water treatment works site.
-
An accompanying vehicle may
provide rapid response to an incident (collision, fire, etc.) but any action
would be limited to containing a small leak.
Long
term measures
·
It is recommended
to limit fuel tanks capacity at the beginning of the Project (Item 2.3 –
advance measure);
·
It is recommended
to further review the practicality of reducing combustible materials or use of
fire retardant materials in the cab. (Item 2.3 – further measure); and
·
Annual periodic
radiography or ultrasonic test inspections of the chlorine drums should be
considered for implementation as soon as feasible (Item 3.8).
-
The implementation
programme for the two long term measures is proposed to split into 2 stages,
investigation stage and implementation stage. The investigation stage is to be
completed by Q1 of 2016 so that practical RMMs could be incorporated into the
next chlorine supply contract. The time frame for the implementation stage, for
those RMMs found practical in the investigation stage would be formulated.
-
The investigation
stage is further split into 2 phases, the review phase and the preliminary
design phase. Despite the fact that time frame for the two phases may vary from
one RMM to another RMM, as a general approach and on the assumption that
Environmental Permit for the South Works Reprovisioning Project could be
obtained in Q2 of 2015, the review phase is proposed to be completed by Q3 of
2015, leaving about 6 months for the preliminary design phase.
A detailed
implementation plan for selected risk mitigation measures is given in Table 12.39.
Table 12.39 Detailed
Implementation Plan for Selected Risk Mitigation Measures
|
Risk
Mitigation Measures
|
Date
of implementation
|
Implementation
Agent(s)
|
Relevant
Authorities
|
|
Improved tyre design and checks (Item 2.8)
|
To be implemented at the beginning of project
|
WSD/Chlorine Supply Contractor
|
EMSD
|
|
Limit on fuel tank capacity (Item 2.3 –
advance measure)
|
To be implemented at the beginning of
project
|
WSD/Chlorine Supply Contractor
|
EMSD
|
|
Provision of fire resistant materials,
cables (Item 2.3 – future measure)
|
Q3 of 2015
|
WSD/Chlorine Supply Contractor
|
EMSD/FSD
|
|
Higher frequency of integrity checks
(radiography or ultrasonic test inspection) (Item 3.8)
|
Q3 of 2015
|
WSD
|
-
|
|
Vehicle accompanying chlorine truck along
critical road sections in Sha Tin area (Item 4.4)
|
To be implemented at the beginning of
project
|
WSD
|
FSD
|
Items
to be further reviewed
·
It is recommended
to implement side, front and rear crash guards with high energy absorption in
coordination and accordance with the relevant authorities;
·
It is recommended to
implement a sturdy steel frame to minimise the potential for chlorine release
due to truck rollover; and
·
Items 2.5 (crash
guards) and 2.9 (cargo frame) require further review and either of these will
be implemented in Q1 of 2016 after a practical design is agreed by relevant
authorities during the investigation phase. These items will be kept in view
if the design cannot be finalised by Q1 of 2016.
12.27.5
The following
additional recommendations relating to the transport of Chlorine from SSK dock
to Sha Tin WTW have been made to ensure the risk remains in the ALARP region:
·
WSD will continue
to keep under review the latest development of use of alternative disinfectants
in water supply industry to aim at minimizing on-site chlorine storage;
·
Training should be
provided for the use of the GPS fleet management and improved safe driving;
·
It should be
ensured that independent checks are performed to ensure proper chlorine drum
latching and clamping;
·
Chlorine truck
drivers or driver attendants should be further trained to check and detect
potential chlorine leaks during transport. This should include the timely
application of the emergency kit;
·
Training should be
provided to driver and driver attendant for the emergency use of the new 2 × 9L
AFFF extinguishers;
·
Induction training
for new drivers and driver attendant should include familiarisation with the
route, familiarisation with chlorine risks, defensive driving, application of
emergency kits, use of fire extinguishers and emergency response;
·
Provision of a fire
screen between the cab and cargo as well as fire retardant materials for the
wheel arches on the chlorine truck should be planned and provided; and
·
To keep under
review alternate chlorine receiving dock in Sha Tin/Tai Po area for chlorine
delivery to STWTW.
12.28.1
Risks from the on-site
Sha Tin WTW chlorine facilities were combined with the off-site chlorine
transport risks within the 1-km STWTW CZ to obtain the total chlorine risks.
These are presented as FN curves in Figure 12.29. Both the Construction
Phase (2016) and the Operational Phase (2031) results lie in the ALARP region.
RMMs listed in Table 12.38 are not
considered. PLL values are presented in Table 12.40.
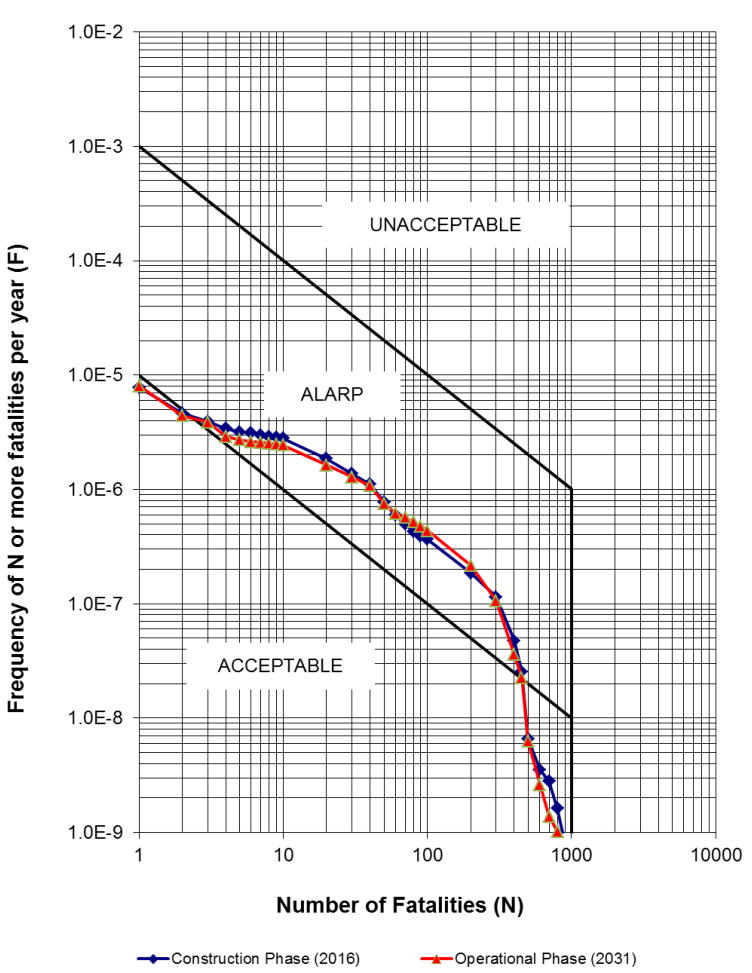
Figure
12.29 FN Curves for Total Chlorine Risk of STWTW
Table
12.40 PLL for On-site Chlorine and Off-site Chlorine Transport
|
|
PLL per
year
(Construction
Phase)
|
PLL per
year
(Operational
Phase)
|
|
Sha Tin WTW on-site
|
7.36E-5
|
5.98E-5
|
|
Off-site transport
|
1.01E-4
|
1.14E-4
|
|
Total
|
1.74E-4
|
1.74E-4
|
12.29 Individual Risk
12.29.1
Combined individual
risk contours for the on-site Sha Tin WTW and off-site transport of chlorine
are shown in Figure 12.30. Only the Operational
Phase (2031) results are shown since these have the higher risks owing to
higher chlorine usage.
12.29.2
Individual risks
are low, reaching a maximum of about 10-7 per year.
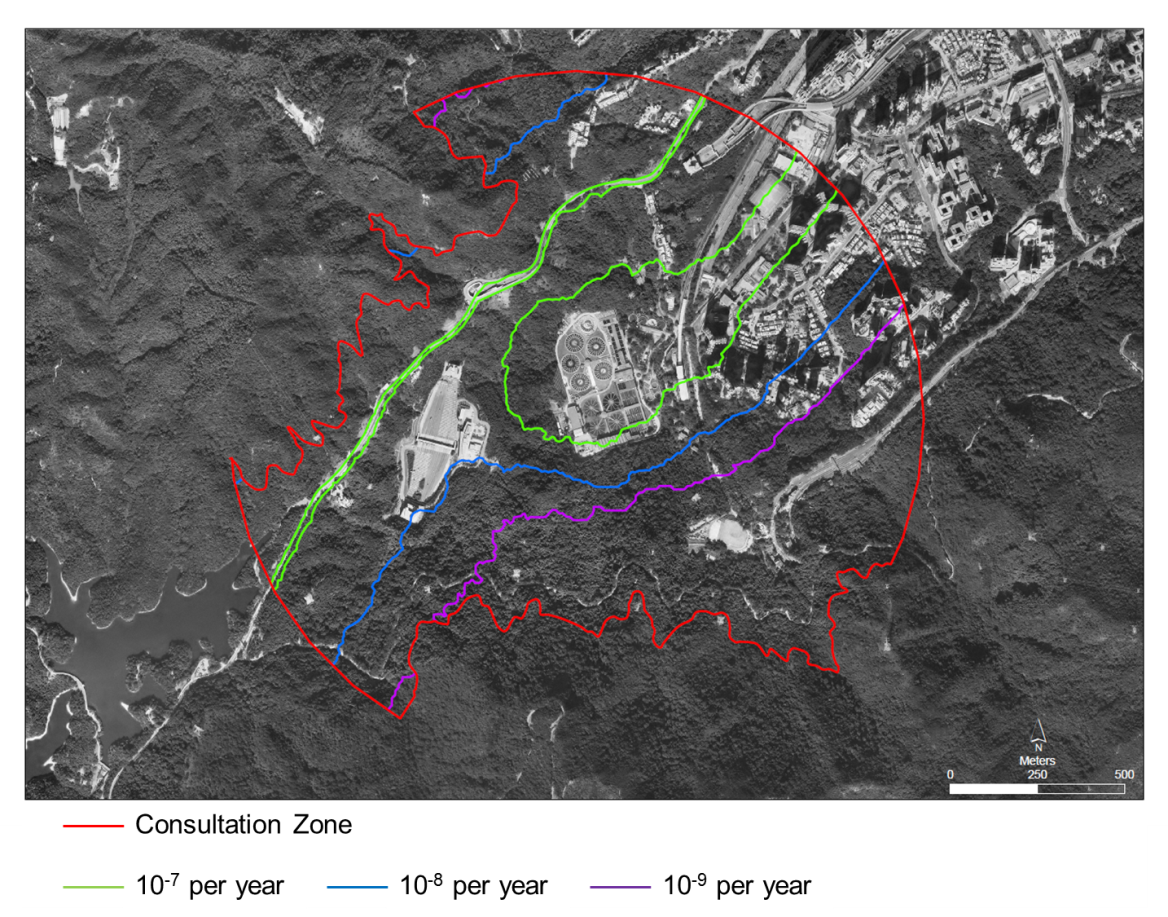
Figure 12.30 Chlorine Total Individual Risk, Operational Phase
12.30.1
This section
addresses requirements of Section 3.2.2 (xi) of the Study Brief related to
cumulative impacts of the Project. These are presented as combined Individual
Risk contours following the same approach as the approved EIA for the Kai Tak
Development project. RMMs listed in Table 12.38 are not
considered.
12.30.2
The cumulative
risks within the consultation zone of Sha Tin WTW from hazardous installations was
calculated by summing the risks from Sha Tin WTW on-site facilities, off-site
chlorine transport (section of route within consultation zone), the Beacon Hill
North Offtake Station, the 750mm and 500mm gas pipelines that run through the Old
Beacon Hill Tunnel, explosives transport through the consultation zone arising
from the construction of the SCL project and use of explosive at the Hin Keng
portal of SCL.
12.30.3
Assessment of risks
from the transport of explosives for SCL was obtained using the same transport
model as described in the SCL EIA (ERM, 2011b). The model was rerun for only
the section of route that intersects the Sha Tin WTW Consultation Zone. All
other parameters are identical to those described in ERM (2011b). These risks,
however, contribute only to the construction phase scenario when concurrent Sha
Tin WTW reprovisioning and SCL construction will take place. This risk
associated with SCL explosives transport are of the order of 2 × 10⁻⁸
per year and are included in the IR contour plots.
12.30.4
Risks associated
with the use of explosives were also extracted from the SCL EIA (ERM, 2011b).
The main hazards are related to ground vibrations leading to building collapse
or vibrations leading to falling objects. All buildings within the Sha Tin WTW Consultation
Zone are out of range of vibration effects from blasting activities at the Hin
Keng portal. The risk associated with initiation of explosives during transit
from the Hin Keng portal construction site entrance to the blast face were
calculated in the SCL EIA (ERM, 2011b) as 8.62 × 10⁻⁸ per year, and
included in the IR contour plot.
12.30.5
Risks from the
Beacon Hill North Offtake Station and the 750mm and 500mm pipelines were
established by conducting a QRA.
12.30.6
The FN curves for
the Construction Phase and Operation Phase are shown in Figure 12.31 and the resulting individual
risk contours are shown in Figure
12.32 and Figure 12.33
respectively. Cumulative risks are low, below
10-6 per year everywhere except for only a very small area around
the Beacon Hill North Offtake Station which has been fenced off to prevent the
public from getting near this Towngas installation.
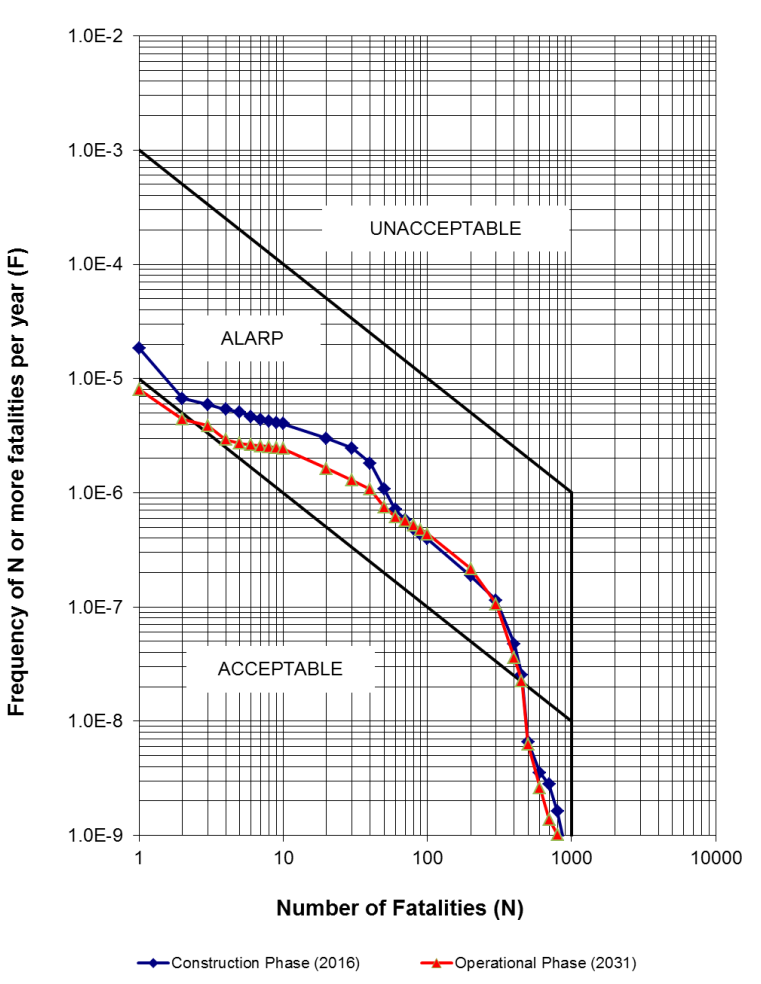
Figure 12.31 FN Curves of
cumulative risks within STWTW Consultation Zone

Figure 12.32 Cumulative Individual
Risk - Construction Phase
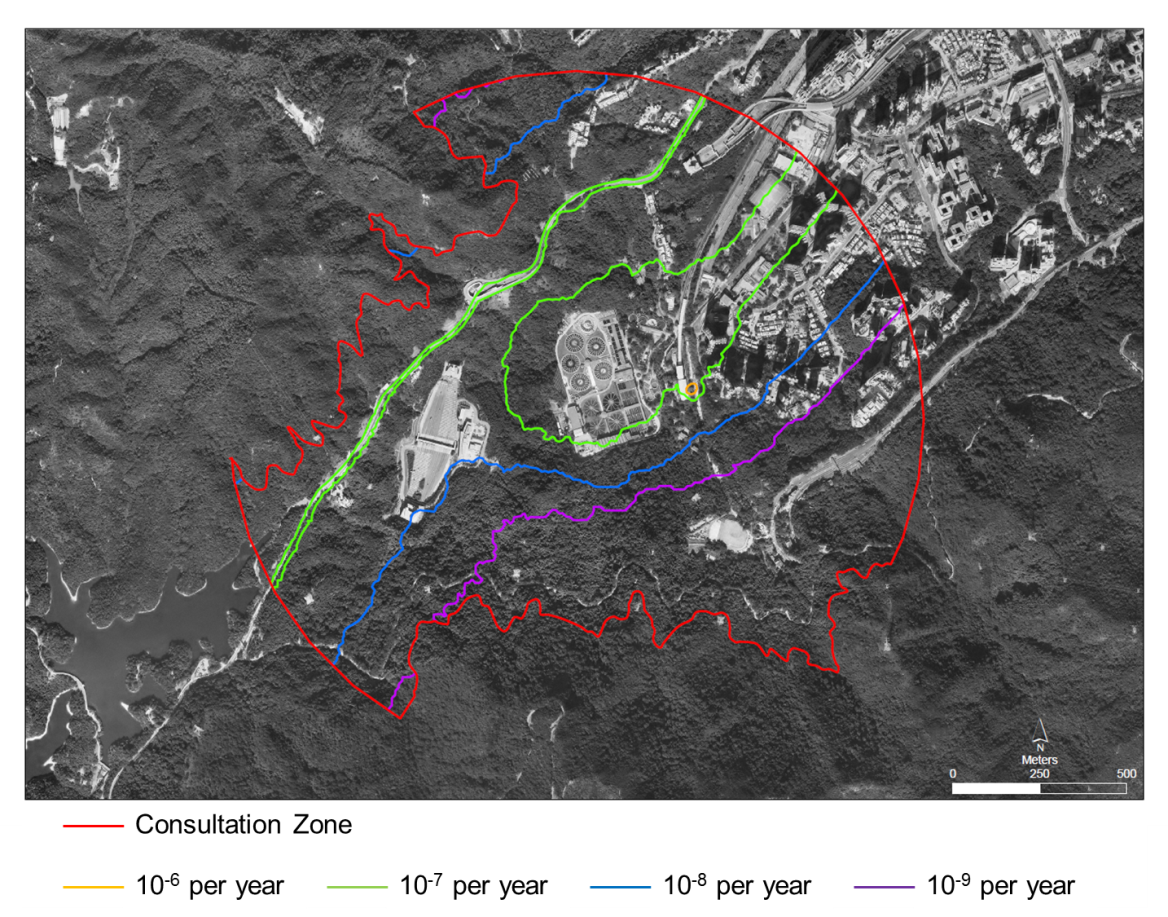
Figure 12.33 Cumulative Individual Risk – Operational Phase
12.31.1
This section
assesses the level of uncertainty in the estimates of individual and societal
risk by carrying out sensitivity studies on the key parameters and modelling
assumptions, in association with the Sha Tin WTW operation and its
reprovisioning works, BHN Offtake Station and gas pipelines within the Old
Beacon Hill Tunnel (this analysis shall be read together with the main report
figure assessing the 1-km STWTW CZ with the cumulative risk within the CZ (Figure 12.31). The purpose of this is to gauge the level of
confidence in the risk results.
12.31.2
The overall
approach to this study has been to move away from the pessimistic assumptions
of past studies to provide a more realistic assessment of the risks posed by
the delivery, storage and handling of chlorine at the STWTW. This has involved extensive reviews of all
aspects of the assessment methodology.
The overall approach which has been adopted may be described as
‘cautious best estimate’.
12.31.3
Annex
K of ERM (2001) lists the key parameters and
assumptions in the QRA, then identifies the level of uncertainty in the
parameter (or assumption) and, finally, assesses the overall level of
uncertainty in the risk results. The
focus of this analysis is on key parameters (or assumptions) which may either
significantly underestimate or overestimate the risk. The results of the uncertainty analysis are
summarised in Table 12.41 below.
Table 12.41 Summary of
Uncertainty Analysis
|
Parameter
|
Uncertainty in risk results
|
|
|
|
Magnitude
|
Affects
frequency (F) or number of fatalities (N) ?
|
|
|
|
|
|
1.
Influence
of atmospheric stability on direction of travel of chlorine cloud in complex
terrain
|
± a factor of 2
|
F or N
|
|
|
|
|
|
2.
Extent
of isopleths predicted by wind tunnel/ALOHA model
|
± a factor of 2
|
N
|
|
|
|
|
|
3.
Chlorine
toxicity relationship
|
overprediction
by a factor of 5 - 15
|
N
|
|
|
|
|
|
4.
Base
event frequency data
|
± a factor of 10
|
F
|
|
|
|
|
|
5.
Conditional
probabilities
|
± a factor of 3
|
F
|
12.31.4
From Table 12.41, it is apparent that there are significant
sources of uncertainty in the QRA. These
are associated, in particular, with:
·
the chlorine
toxicity relationship, which may overpredict the number of fatalities (or, for
an individual, the probability of fatality) by a factor of 5-15 when compared
to actual fatalities in past incidents of major chlorine releases in urban
environments; and
·
estimation of the
frequency of chlorine releases, for which the range of uncertainty is ± one order of magnitude (typical of the uncertainty in this aspect of QRA studies).
12.31.5
Considering the uncertainty magnitude shown
in Table 12.41, an uncertainty band of factor of ±30 could
be conservatively applied on the frequency (F) scale to account for the
uncertainties in parameters 4 and 5 above.
For consequence scale (N), if the N would be reduced by a factor of 10
(parameter 3 has an overestimation of 5-15) then the FN curve will be shifted
to the left, with an uncertainty band of factor of ±8 (= 2 × 2 × 10/5 for
parameters 1, 2 and 3). From the uncertainty analysis summarized in Table 12.41, it can be noted that the net effect of the
uncertainties is a shift in the FN curve further towards the left of the FN
diagram, with the above range of the FN curves lying in the ALARP region. Thus,
the overall approach which has been adopted may be described as ‘cautious best
estimate’.
12.31.6
In addition, a far more conservative approach
has been adopted in this study, including using maximum inventory and omitting
credits for risk reduction by “good practice” mitigation measures. They are
detailed below.
12.31.7
The maximum chlorine drum storage in the
chlorination house will be limited to 190 tonne, noting that there are 221
storage castors, 31 excess storage castors will be carefully selected and to be
removed from the chlorination house, priority will be given to those situated
immediately under the roof beams so as to further minimize the potential
chlorine release quantity upon roof beams collapse during earthquake. Hence, chlorine drums of 190 tonnes at the
Sha Tin WTW representing the maximum storage capacity is considered as the
reasonably worst case for modeling in the QRA.
12.31.8
The mitigation measures to be implemented
together with the implementation schedule are presented in Table 12.38.
However, it shall be noted that the selected mitigation measure “Vehicle
accompanying chlorine truck along critical road sections in Sha Tin area” is
considered as a good practice measure without taking credits in the QRA
model.
12.31.9
In addition, for the potential mitigation
measures discussed in Table 12.37, Item 2.5 (crash guards) and Item 2.9 (cargo
frame) require redesign of the truck and either of these will be implemented if
a practical design can be agreed by relevant authorities, hence, credits had
not been taken in the analysis at this stage.
12.31.10
Therefore,
the overall approach which has been adopted may be described as ‘cautious best
estimate’, and it shall be noted that the risk analysis are on conservative
side, with the off-set of uncertainties by using maximum inventory and omitting
credits for risk reduction by “good practice” mitigation measures.
12.31.11 Similar
considerations apply to the calculated individual risk levels. Individual risk
is proportional to the frequency and number of fatalities summed for all
incidents. In this case the combination of uncertainty in the parameters listed
in Table 12.41, above may mean that the individual risk is
underestimated by a factor of 2 × 2 × (1/5) × 10 × 3 ≈ 24. A better estimate of the uncertainty in the
individual risk may be obtained by considering the specific events which
contribute to individual risk. Close to
the site, the dominant contributors to individual risk are the events RU1TSRU
(a 1-tonne instantaneous release due to a truck impact or fire) and RUITSML (a
medium leak arising due to loadshedding or rollover). The uncertainty in the consequence assessment
for these events is as represented in Table 12.41.
However with regard to the frequency assessment, it is unlikely that the
current assessment, which is based on the frequency of truck accidents of
public roads (involving increased speeds and traffic compared to the WTW access
road) could be a significant underestimate.
Therefore assuming that the uncertainty in the base event frequency
(parameter 4 in Table 12.41) for these events is plus or minus a factor
of 3, then the possible underestimate in the overall individual risk is 2 × 2 ×
(1/5) × 3 × 3 ≈ 7.
12.31.12 This is
not considered to be a significant factor, as when occupancy is taken into
account, risks to actual individuals will still be below the criteria in the
Hong Kong Risk Guidelines. Taking maximum cumulative risk of chlorine, towngas
and explosives as example, IR of 10-6/year was found located in the
vicinity of towngas pipeline, worker exposure related to worker occupancy in
the vicinity (i.e. gas pipeline and SCL) is evaluated by assuming the
individual risk could be up to 10-5 per year (after taking into
account the uncertainties) then the risk to the most exposed individual (a
worker spending 100% of his time outdoors) is as follows:
IR (most exposed individual of Towngas
workers)
= 10-5 × fraction of (outdoor)
working hours each year
= 10-5 × 2920/8760 = 3.33×10⁻⁶
per year.
IR (most exposed individual of SCL workers)
= 10-5 × fraction of (outdoor)
working hours each year
= 10-5 × 3003/8760 = 3.43 × 10⁻⁶
per year.
Note:
Workers is assumed 100% of his time outdoors on conservative approach only, in
fact the workers will not stay 100% of his time outdoors.
12.31.13
Example for estimating fraction of outdoor
working hours each year is shown in Table 12.42.
Table 12.42 Fraction of
Outdoor Working Hours
|
Time Period (%)
|
50.00%
|
0.89%
|
13.39%
|
9.52%
|
26.19%
|
|
|
|
Population Ref.
|
Night
|
Jammed
Peak
|
Peak
Hour
|
Weekend
Day
|
Working
Day
|
Total
|
Hours
in a year
|
|
Towngas worker (W1)
|
0%
|
50%
|
50%
|
0%
|
100%
|
|
|
|
|
0.00%
|
0.45%
|
6.70%
|
0.00%
|
26.19%
|
33.33%
|
2920
|
|
SCL workers (Z6, Z7, Z8)
|
0%
|
50%
|
50%
|
10%
|
100%
|
|
|
|
|
0.00%
|
0.45%
|
6.70%
|
0.95%
|
26.19%
|
34.29%
|
3003
|
|
SCL Construction
Offices/yard (Z9)
|
0%
|
50%
|
50%
|
10%
|
100%
|
|
|
|
|
0.00%
|
0.45%
|
6.70%
|
0.95%
|
26.19%
|
34.29%
|
3003
|
12.32.1
Uncertainty factors in assessing BHN Offtake
Station and Old Beacon Hill Pipelines risk have also been estimated. Town gas contains hydrogen, methane and
carbon monoxide which are flammable. The effects of buoyancy are modelled in the
plume rise model and the presence of lighter gas (i.e., hydrogen) has
considerable contribution to the overall buoyancy. Methane is conservatively
chosen as the representative material for town gas in this assessment study to
effectively reduce the buoyancy effect and increase flammable cloud size near
ground level. The results given for hazard distances for flash fires and toxic
effects are therefore conservative.
12.32.2
Fireball events are found to dominate the PLL
and also the high fatality region of the FN curve. However, there are a number
of pessimism’s in the estimation of fireball effects. For instances, effects at
or near ground level may not be significant due to the initial plume rise due
to momentum effects prior to ignition; there are limited immediate ignition
sources for underground pipe sections and pipelines within tunnel leading to
fireball events.
12.32.3
The ignition probabilities adopted for this
study are significantly higher than historical data for US and European
pipeline failures. The overall ignition probability as given by EGIG data
(EGIG, 2007) is 0.1. Despite the urban environment of Hong Kong, the ignition
probabilities assumed in this study are probably on the conservative side.
12.32.4
In conclusion, after taking into account the
uncertainty in the hazard assessment by adopting conservative assumptions/
parameters and worst case scenario, this gives confidence that the risk level
in the assessment will not exceed the Hong Kong Risk Guidelines.
12.33.1
A Hazard Assessment
of the risks associated with the storage, handling and transport of chlorine at
Sha Tin Water Treatment Works has been conducted for the Construction and
Operational Phases of the reprovisioning project.
12.33.2
The assessment
methodology and assumptions were based on previous assessments having similar
issues, namely the SCL EIA (ERM 2011a) for on-site risks and Atkins (2006) for
the off-site transport risks.
12.33.3
In all cases, the
Individual Risk complies with the Hong Kong Risk Guidelines.
12.33.4
The societal risk
expressed in the form of FN curves, lies in the lower “ALARP” region of the
HKRG for the on-site facilities and in the lower “ALARP” region for the off-site
transport. Risk mitigation and cost-benefit analysis has therefore been
conducted. The combined on-site and off-site transport chlorine risk also lies
in the mid-ALARP region.
12.33.5
Cumulative risks
within the consultation zone were also presented by combining risks from the
on-site facilities, off-site chlorine transport (route section lying within
consultation zone only), the Beacon Hill North Offtake Station, the 750mm and
500mm gas pipelines that run through the old Beacon Hill Tunnel, explosive
transport and use for SCL construction.
12.33.6
The Sha Tin WTW
Reprovisioning Project is an improvement project. Due to the introduction of
the new treatment technologies, the reprovisioning works will lead to a
permanent reduction in chlorine storage and usage at the WTW. As a result, the
residual impacts from chlorine-related risks for the surrounding population
will be reduced in comparison with current levels.
On-site Chlorine
12.34.1
For the Construction
Phase, good practice measures were considered during a HAZID workshop and 22
recommendations were made. Several additional good practice measures are also proposed
following B&V (2010). It is also recommended that an accompanying vehicle
is provided on-site for the chlorine truck and the construction activities are
temporarily stopped during chlorine deliveries and that gas monitors with
audible alarms are installed in the relevant reprovisioning work areas.
Implementation of these measures would reduce the societal risks for the
Construction Phase of the Project.
12.34.2
No specific
mitigation measures are recommended for the Operational Phase. These were
subject of detailed analysis under the SCL QRA (ERM, 2011a), but no risk
mitigation measures related to the WTW operation were found to be practicable.
Off-site Chlorine Transport
12.34.3
A number of
mitigation measures have been considered and a number of short term and long
term risk mitigation measures have been recommended following a formal Cost-Benefit
Analysis to ensure the risk is ALARP.
Short term measures
·
It is recommended to ban the use of retreaded tyres and
perform regular visual checks on the tyres. This measure should be implemented
before the start of the reprovisioning project (Item 2.8); and
·
It is recommended to have a vehicle accompanying chlorine truck along critical road
sections in Sha Tin. The vehicle should be equipped with emergency kit, fire
extinguisher, radio set for communication (Item 4.4). The accompanying vehicle
will be ahead of the chlorine truck after the vehicles entering the water
treatment works site.
-
An accompanying
vehicle may provide rapid response to an incident (collision, fire, etc.) but
any action would be limited to containing a small
leak.
Long term measures
·
It is recommended
to limit fuel tanks capacity at the beginning of the Project (Item 2.3 –
advance measure);
·
It is recommended
to further review the practicality of reducing combustible materials or use of
fire retardant materials in the cab. (Item 2.3 – further measure); and
·
Annual periodic radiography or ultrasonic test inspections of the chlorine drums
should be considered for implementation as soon as feasible (Item 3.8).
Items to be further reviewed
·
It is recommended
to implement side, front and rear crash guards with high energy absorption in
coordination and accordance with the relevant authorities; and
·
It is recommended
to implement a sturdy steel frame to minimise the potential for chlorine release due to truck rollover.
·
The above two
items require further review and either of these will be implemented in Q1 of
2016 after a practical design is agreed by relevant authorities during the
investigation phase. These items will be kept in view if the design cannot be
finalised by Q1 of 2016.
12.34.4
The following
additional recommendations relating to the transport of Chlorine from SSK dock
to Sha Tin WTW have been made to ensure the risk remains in the ALARP region:
·
WSD will continue
to keep under review the latest development of use of alternative disinfectants
in water supply industry to aim at minimising on-site chlorine storage;
·
Training should be
provided for the use of the GPS fleet management and improved safe driving;
·
It should be
ensured that independent checks are performed to ensure proper chlorine drum
latching and clamping;
·
Chlorine truck
drivers or driver attendants should be further trained to check and detect
potential chlorine leaks during transport. This should include the timely
application of the emergency kit;
·
Training should be
provided to driver and driver attendant for the emergency use of the new 2 × 9L
AFFF extinguishers;
·
Induction training
for new drivers and driver attendant should include familiarisation with the
route, familiarisation with chlorine risks, defensive driving, application of
emergency kits, use of fire extinguishers and emergency response;
·
Provision of a
fire screen between the cab and cargo as well as fire retardant materials for
the wheel arches on the chlorine truck should be planned and provided; and
·
To keep under
review alternate chlorine receiving dock in Sha Tin/Tai Po area for chlorine
delivery to STWTW.
Atkins
(2006), Risk Assessment of the Transport of Liquid Chlorine from Sham Shui Kok
of North Lantau and Tuen Mun Area 40 to Various Waterworks Potentially
Hazardous Installations. Report for Water Supplies Department.
B&V
(2010) Integration of Siu Ho Wan and Silver Mine Bay
Water Treatment Works (ESB-150/2006), Final EIA Report by Black & Veatch.
CityU (2005)
City University of Hong Kong, Improvement to Chlorine Drum Design, Final Report
for Water Supplies Department.
Cook, I.,
N. J. Holloway, W. Nixon and D.W. Phillips (1993), Consultancy on the
Environmental Aspects of the Daya Bay Nuclear Power Station for the Government
of Hong Kong –
Risk Assessment Report.
DNV (1997),
Quantitative Risk Assessment of the Transport of Chlorine in Hong Kong for
Environmental Protection Department, EPD CE63/94.
ERM
(1997), Reassessment of Chlorine Hazard for Eight Existing Water Treatment
Works: Methodology Report, Final Report, 24 September 1997.
ERM
(1998), Technical Note 1: Application of Wind Tunnel Test Results in Hazard
Assessments, Report for Water Supplies Department CE14/96 Reassessment of
Chlorine Hazard for Eight Existing Water Treatment Works, 17 July 1998.
ERM
(2001), Reassessment of Chlorine Hazard for Eight Existing Water Treatment
Works: Hazard Assessment for Sha Tin Water Treatment Works, Final
Report, January 2001.
ERM (2009)
EIA for the Hong Kong Section of Guangzhou – Shenzhen – Hong Kong
Express Rail Link, Appendix 13: Hazard to life Assessment, (EIA-169/2009).
ERM
(2010), Environmental Impact Assessment of South Island Line
(East),
Appendix 7B, QRA for Shell LPG Depot (PHI Assessment), July
2010.
ERM (2011a),
Environmental Impact Assessment of Sha Tin to Central link – Tai Wai to Hung
Hom Section, Appendix 13C: PHI Assessment of Sha Tin Water Treatment Works,
October 2011, (EIA-200/2011).
ERM (2011b),
Environmental Impact Assessment of Sha Tin to Central link – Tai Wai to Hung
Hom Section, Appendix 13A, Storage and Transport of Explosives, Appendix 13B,
Use of Explosives, October 2011.
HSL
(1998), CFD Modelling of Chlorine Dispersion at Sha Tin WTW, The Health and
Safety Laboratory, March 1998.
HSL
(1999), CFD Modelling of Chlorine Dispersion at Tai Po Tau WTW, The Health and
Safety Laboratory, December 1998.
ICI
(1995), Chlorine Handbook, ICI Australia.
Lees F P (1996), Loss prevention in the Process
Industries, Butterworth Heinemann.
Lees and Ang (1989), Safety Cases within the CIMAH
Regulations 1984, Ch12 –
Quantitative Risk Assessment of Major Hazard Installations: 3, The HSE Risk
Assessment Tool.
Moreton P A (1993), An Investigation of the
Relative Risks from the Road Transport of Blasting Explosives in Maximum Size
Loads of 5te and 16te, February 1993, SRD/HSE R596.
Ove Arup (2001), Water Treatment Works Seismic
Hazard Assessment –
Seismic Assessment of Chlorine Storage Buildings and Chlorine Containers.
RWDI (1998), Wind Tunnel Study – Reassessment of Chlorine
Hazard for Sha Tin WTW, Rowan Williams Davies and Irwin Inc., January 1998.
TNO (1992), "Methods for the Determination of
Possible Damage to People and Objects Resulting from Releases of Hazardous
Materials", CPR 16E, Green Book, 1992.
Technica (1989) Risk Assessment of Liquid Chlorine
Transport for Water Supplies Department, Hong Kong.
Webber, D M, S J Jones, G A Tickle, and T Wren
(1992), UKAEA Report SRD/HSE R587 “ A model of dispersing gas cloud, and the
computer implementation DRIFT –
II Steady Continuous Releases”.
Webber (1998), Brief Review of RWDI and DRIFT
Results, 16 February 1998.
Withers, R.M.J. and F.P. Lees (1985), The
Assessment of Major Hazards: The Lethal Toxicity of Chlorine: “Part 1, Review
of Information on Toxicity”, 12, 231–282, and “Part 2, Model of Toxicity to Man”,
12, 283-302, Journal of Hazardous Materials.
~ End of Section 12 ~