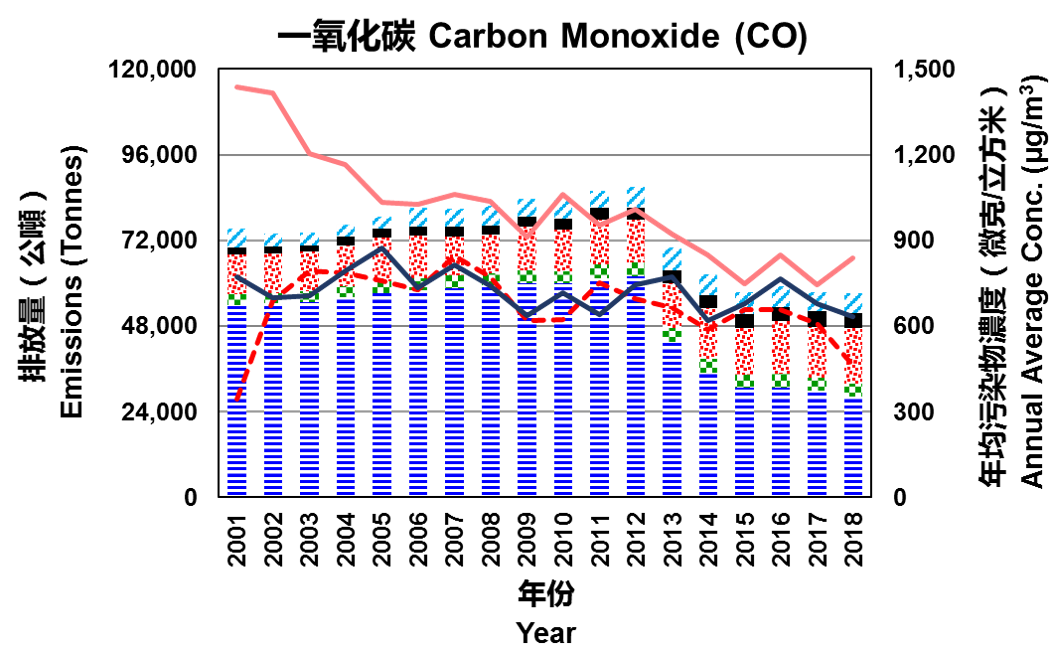
Between 2001 and 2018, CO emissions decreased by 24% which were mainly caused by the decline in emissions from the road transport sector. Road transport and navigation sectors were two major sources of CO emissions, accounting for 50% and 27% of the total CO emissions in 2018, respectively.
During the same period, the gap between the CO concentration levels measured at the EPD's roadside and ambient air quality monitoring stations have narrowed, indicating that vehicular CO emissions have been reduced.