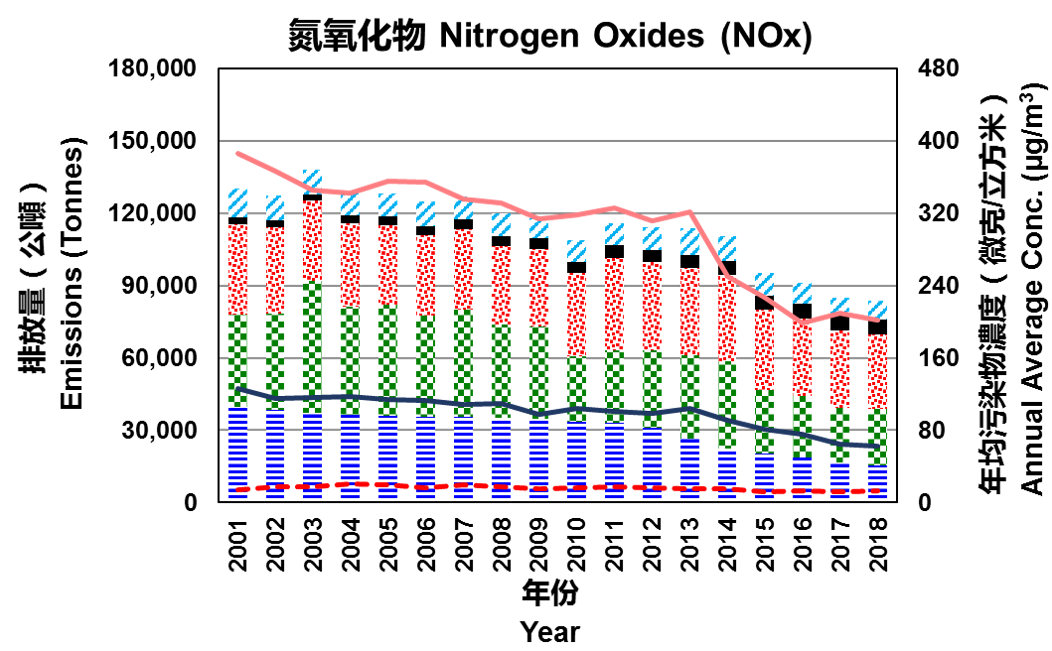
Between 2001 and 2018, NOx emissions decreased by 36%. Navigation, public electricity generation and road transport sectors were the top three sources of NOx emissions, accounting for 37%, 28% and 18% of total NOx emissions in 2018, respectively.
The background NOx concentration levels meassured at the Tap Mun rural air quality monitoring station over the past years have been very low. Hence the NOx concentrations measured in Hong Kong are mainly due to local emission sources. During the same period, NOx concentration levels measured at the EPD’s roadside air quality monitoring stations by and large followed the vehicular NOx emission trend.