1. Total Impacts - 3 Major Contributions
1.1 The air quality impact assessment should be conducted taken into account the best available information at the time of assessment. In evaluating the air quality impacts of a proposed project on air sensitive receivers, contributions from three tiers of emission sources, depending on their distance from the site, should be considered. The three tiers are:
|
Primary contributions: |
Project induced emissions |
|
Secondary contributions: |
Pollutant-emitting activities in the immediate neighbourhood |
|
Background contributions: |
Pollution not accounted for in the above two tiers |
2. Nature of Emissions
In most cases, the project-induced emissions are fairly well defined and quite often (but not necessarily) the major contributor to local air quality impacts. Examples include those due to emissions from the processes of the project and/or its induced traffic (e.g. a residential development leads to an increase in traffic volume in the nearby road network; the change in traffic distribution of new or enhanced road projects).
In the immediate vicinity of the project site, there are often pollutant emitting activities contributing further to local air quality impacts. For most local scale projects, any emission sources in an area within 500m of the project site boundary with notable impacts should be identified and included in an air quality assessment to cover the short-range contributions. In the exceptional cases where there is one or more significant sources nearby, the study area may have to be extended or alternative estimation approach to be employed to ensure these impacts are reasonably accounted for. Information of the source characteristics of some Tier 2 emission sources can be found in the Smart Air Modelling Platform (SAMP) [LINK] for easy reference. The applicability and validity of the data should be reviewed at the time of preparing the assessment.
The above two types of emission contributions should account for, to a great extent, the air quality impacts upon local air sensitive receivers, which are often amenable to estimation by the ‘steady state dispersion' type of models. However, a background air quality level should be prescribed to indicate the baseline air quality in the region of the project site, which would account for any pollution not covered by the two preceding contributions. The emission sources contributing to the background air quality would be located further afield and not easy to identify. In addition, the transport mechanism by which pollutants are carried over long distances is rather complex and cannot be adequately estimated by the 'steady state dispersion' type of models.
Background contributions are usually accounted for by the spatially averaged concentrations of regional air quality models (e.g. PATH) at a certain spatial resolution (e.g. 1km x 1km). The impact due to a point source, on the other hand, is usually confined within a plume whose dimension varies with downwind distance. When a point source is located closely to a receptor such that its spatially varying contribution cannot be well represented by the spatially averaged contribution of a regional air quality model, it should be modelled by a dispersion model; however, when obstacles are present so that their mixing effect can even out the point source’s spatially varying contribution, the point source can then be accounted for by a regional air quality model. In general, a major point source located within 4km from a receptor should be evaluated to see if it can cause direct impact and to establish its proper modelling tool accordingly (i.e. using dispersion model or regional model). The list of major point sources need to be considered in an air quality assessment and the associated details can be downloaded [LINK].
3. Estimation Approach
3.1.1 To balance the need for representativeness and the resource demand for long-term simulations, EPD currently accepts a minimum of one-year simulation of air quality for environmental impact assessments.
3.1.2 The default approach accepted by EPD (see Additional Note at the end for details) entails both meteorological and air quality data for all relevant time scales to be extracted from PATH modelling system on an hour-by-hour basis. (A brief description of PATH is in section 3.2 and more detailed description can be found on https://www.epd.gov.hk/epd/english/environmentinhk/air/guide_ref/guide_aqa_model.html.)
Meteorological data used to drive the models for Tiers 1 and 2 emissions and the concentration data to serve as Tier 3 contribution should be extracted consistently from the same grid cell(s) which cover(s) the project’s Tier 1 and Tier 2 assessment areas.
3.1.3 Over the spatial scale of typical EIAs in Hong Kong, the transport of pollutants from source to receptor for Tier 1 and Tier 2 usually happens in an hour or less. Such dispersion situation is also represented by the models for Tiers 1 and 2 which use hourly inputs to produce hourly outputs. Longer time averaged concentrations (i.e. daily and annual) should thus be constructed using these hourly values as basic building blocks.
3.1.4 The meteorological and air quality data pertaining to each of the three tiers must be fully synchronised to produce credible results, e.g. the daily ‘Total’ air quality would be the sum of the contributions from the three tiers for the same day.
3.1.5 Approaches other than the default approach to derive meteorological and air quality data (including those based on observation data only) will have to be fully justified to EPD on a case-by case basis (see Section 3.4.1). In any case, use of short-term measurements to prescribe the background concentrations is not acceptable.
3.2.1 Using air pollutant concentration outputs from the PATH modelling system as the Tier 3 background contribution has advantages over other sources of information since the system is capable of accounting for the changes to future air quality due to technology changes and deliberate government policies aimed at improving air quality, in both Hong Kong and the surrounding areas.
3.2.2 The PATH system consists of three major modules: a meteorological driver, an emission module and a chemical transport model. These are supported by the corresponding input data (see schematic in Figure 1).
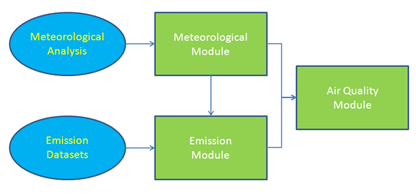
Figure 1: Schematics of the PATH system
3.2.3 PATH is set up on a three-dimensional grid system with horizontal nesting. The most commonly used horizontal domain currently has grid spacing of 1 km in both the N-S and E-W direction (see Figure 2). The thickness of the first model layer can be taken to be 17 m. The relevant outputs of the PATH systems are gridded meteorological and pollutant concentration data for every hour of the simulation period.
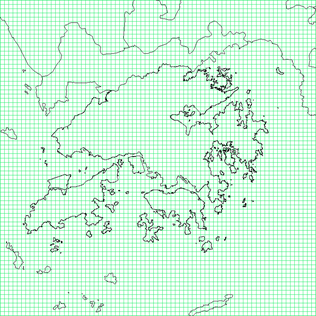
Figure 2: PATH's horizontal domain with grid spacing of 1 km
3.2.4 EPD has made available model outputs for public access online at https://aqia.epd.gov.hk. These include:
• Meteorological data for one representative year appropriate to drive air quality simulations using PATH, and
• Hourly concentrations of the first ten layers of the PATH domain for NO2, NOx, SO2, RSP, FSP, O3 and CO for some future years. These concentrations are linearly interpolated between model outputs for at least 2 years which are generated using EPD’s best estimate / projection of emissions and the meteorological data for the representative year.
3.2.5 Air quality modelling systems other than PATH may be used if it can be proved to the satisfaction of EPD that the proposed system is needed for the situation in question and / or is superior to PATH (see Guidelines on the Use of Alternative Computer Models in Air Quality Assessment [Link]).
3.3.1 Since the PATH’s concentration outputs from EPD have accounted for Tier 2 emissions, though in a different way to Tier 2 simulations because PATH is a grid-based model whereas air quality models for assessing Tier 2 sources are commonly of the plume / puff type, there will be double-counting of emissions in the total simulation if such PATH’s concentrations are used unadjusted. As this double-counting is undesirable for the assessment, a re-simulation of the Tier 3 contribution can be made with the emissions already accounted for in Tier 2 removed from the corresponding grid(s) and the re-simulated concentrations used as Tier 3 contribution. A similar logic would apply to using other chemical transport models (if approved by EPD) for Tier 3 contributions.
3.3.2 Care must be taken to ensure that all concentrations (NO2, RSP, FSP, etc.) from Tier 3 are taken consistently from either the original run (with Tier 2 emissions included) or the re-generated run (with Tier 2 emissions excluded to avoid double-counting). Any deviation from this basic consistency should be made clear, fully justified to and approved by EPD and documented in detail in appropriate reports.
3.4.1 The table below summarizes the possible combinations of input data for conducting a ‘Total’ air quality assessment. They are arranged in ascending order (from top to bottom) of computer resource requirement to facilitate finding an appropriate level of assessment.
3.4.2 In this table, three types of data are referred to. Within this context, meteorological data are always for driving air quality model (i.e. dispersion models) for assessing Tiers 1 and 2 emission sources; emissions always refer to those used in a photochemical model like PATH; and concentration data always refer to Tier 3 background contribution.
| Input Data | Criteria | Justifications needed* | Examples |
|---|---|---|---|
| LEVEL 1 | |||
|
Meteorological data: latest PATH model output provided by EPD **; Background Air pollutant Concentration data: latest PATH model output for specific future years provided by EPD **.. |
Site similarity and Conservativeness |
Overall landuse change induced by project is not significant and The background concentration of the assessment year will not be higher than that of the EPD provided year. |
Small projects in clean area. |
| LEVEL 2a | |||
|
Meteorological data: Same as 1 Background Air pollutant Concentration data: generate from PATH model simulation after replacing the emissions of specific future year(s) provided by EPD with project-grid specific emissions |
Site similarity and Conservativeness |
Overall landuse change induced by project is not significant |
Same as 1 but it is desirable to modify the emission of the project grid cell(s) to avoid double-counting. |
| LEVEL 2b | |||
|
Meteorological data: Same as 1 Background Air pollutant Concentration data: generate from PATH model simulation using specific emissions for any grid in the model domain |
Site similarity and Conservativeness |
Overall landuse change induced by project is not significant |
Same as 1 but emissions outside project-grid cell(s) are significantly different from the EPD provided year (condition for 2a may also apply). |
| LEVEL 3 | |||
|
Meteorological data: generate from PATH model simulation with project specific landuses Background Air pollutant Concentration data: generate from PATH model simulation using specific emissions for any grid in the model domain |
Where criteria for levels 1 to 2 are not met |
None |
Potentially any project, but more likely large scale infra-structural projects or strategic assessment. |
These should be established by the project proponent to the satisfaction of EPD
** See Section 3.2.4 on the meteorological and concentration data available for public access from EPD.
Air Quality Modelling & Forecasting Section,
Air Science and Modelling Group
Environmental Protection Department
January 2024
Additional Note
Model-output-based and Observation-based Approach to Air Quality Assessment
In the past, prior to EPD making meteorological and air quality model outputs publicly accessible, two approaches in driving models for air quality assessment were used and equally acceptable: one based solely on observations and the other based solely on model outputs. The only requirement was that the chosen approach had to be applied consistently throughout the assessment, meaning that using both model outputs and measurements to drive the models in a single assessment is not allowed.
Using model outputs solely for air quality assessment can do away the need to justify that future background air quality would be an improvement over the present situation, which is needed for the observation-based approach (see section 3.2.1). As a result of the convenience of using model outputs for this 3-tier assessment, almost all air quality assessments in EIAs are now conducted using model outputs. Given this prevailing trend, EPD now considers the model-output-based assessment as the default approach.