The EPD Hotline has been operating since 1986, serving as a focal point for the public to report pollution complaints to the Environmental Protection Department (EPD). In November 1995, the department extended its hotline service to six Local Hotlines to provide even better service to the public, on a more local basis. This service was further enhanced in 2002 with the establishment of the Customer Service Centre to provide a single-call-number service to the public for pollution complaints, smoky vehicle complaints, beach water grading enquiries and waste recycling enquiries.
The Customer Service Centre (CSC) is backed up by a sophisticated Customer Relationship Management (CRM) system and operated by well-trained hotline staff to provide an instant response to customer calls. The CRM system is further supported by a GIS (Geographic Information System)-based module that allows for spatial analysis of complaint information provided by the public, as well as an on-screen knowledge database system. A 24-hour service is maintained by hotline staff during office hours and by a telephone recording service after office hours.
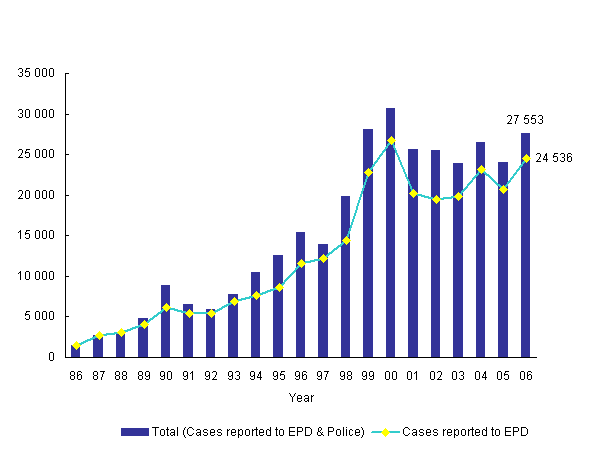
Pollution complaints that fall within the EPD's jurisdiction and require investigation are referred to the relevant staff. Other complaints or issues are referred to the relevant government departments. In 2006, there was an increase of 14% in pollution complaints (from 24 086 cases in 2005 to 27 553 cases in 2006). Air pollution constituted 48% of the total complaints, followed by noise pollution (32%) and waste & water pollution (19%). Most of the air pollution complaints concerned emissions from vehicles (53%). About 25% of all complaints concerned mobile or territory-wide issues.
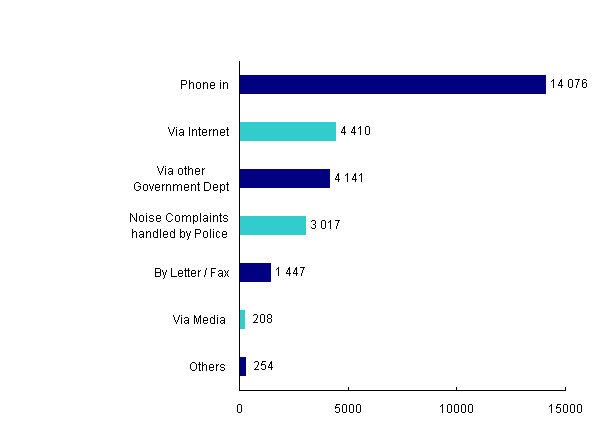
Most complaints reported to the EPD were by phone in 2006 (57%). Another 18% were received through internet, 17% were referred by other government departments, 6% were sent by mail, 1% came through the news media and 1% were received from other sources.
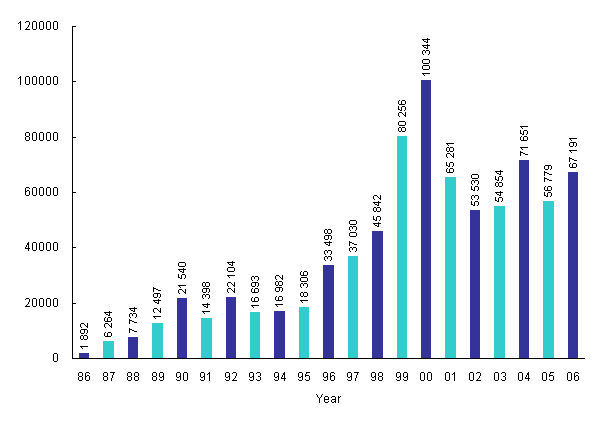
The Local Hotlines received 43 314 enquiries in 2006.
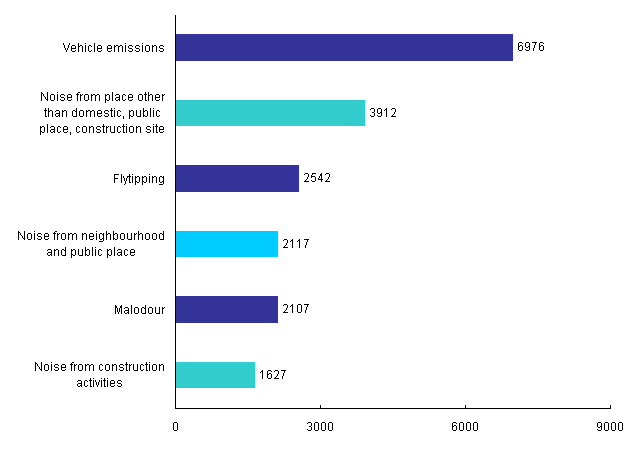
Top Six Types of Pollution Complaints in 2006
Number of Pollution Complaints from Year 1986 to 2006
Channels of Pollution Complaints in 2006
Change in Number of Pollution Complaints in 2006
| Nature | 2005 | 2016 | % Change | |
|---|---|---|---|---|
| Air | 12 343 | 13 264 | 7% | |
| Noise | -EPD cases | 5 034 | 5 738 | 14% |
| -Police cases | 3 410 | 3 017 | -12% | |
| Water | 1 991 | 1 939 | -3% | |
| Waste | 1 153 | 3 375 | 193% | |
| Miscellaneous | 155 | 220 | 42% | |
| Total | 24 086 | 27 553 | 14% |
Complaint Statistics Breakdown by District and Nature in 2006
| District | Total | % | Air | Noise | Water | Waste | Misc |
|---|---|---|---|---|---|---|---|
| Islands | 508 | 1.8 | 99 | 146 | 131 | 117 | 15 |
| Kwai Tsing | 1 182 | 4.3 | 248 | 634 | 50 | 246 | 4 |
| North | 765 | 2.8 | 270 | 236 | 85 | 141 | 33 |
| Sai Kung | 988 | 3.6 | 400 | 247 | 143 | 196 | 2 |
| Sha Tin | 1 145 | 4.2 | 240 | 638 | 142 | 108 | 17 |
| Tai Po | 880 | 3.2 | 265 | 255 | 104 | 241 | 15 |
| Tsuen Wan | 935 | 3.4 | 316 | 402 | 122 | 91 | 4 |
| Tuen Mun | 884 | 3.2 | 335 | 301 | 110 | 114 | 24 |
| Yuen Long | 1 655 | 6.0 | 637 | 440 | 205 | 342 | 31 |
|
Subtotal |
8 942 | 32.5 | 2 810 | 3 299 | 1 092 | 1 596 | 145 |
| Central & Western | 1 378 | 5.0 | 395 | 762 | 88 | 123 | 10 |
| Eastern | 1 310 | 4.8 | 470 | 589 | 95 | 153 | 3 |
| Southern | 463 | 1.7 | 130 | 177 | 63 | 91 | 2 |
| Wan Chai | 1 781 | 6.5 | 428 | 1 180 | 74 | 87 | 12 |
|
Subtotal |
4 932 | 17.9 | 1 423 | 2 708 | 320 | 454 | 27 |
| Kowloon City | 1 572 | 5.7 | 458 | 597 | 122 | 386 | 9 |
| Kwun Tong | 1 049 | 3.8 | 365 | 485 | 91 | 98 | 10 |
| Yau Tsim Mong< | 2 118 | 7.7 | 637 | 904 | 176 | 395 | 6 |
| Sham Shui Po | 1 362 | 4.9 | 345 | 471 | 109 | 417 | 20 |
| Wong Tai Sin | 585 | 2.1 | 237 | 287 | 29 | 29 | 3 |
|
Subtotal |
6 686 | 24.3 | 2 042 | 2 744 | 527 | 1 325 | 48 |
| Vehicles | 6 976 | 25.3 | 6 976 | 0 | 0 | 0 | 0 |
| Others | 17 | 0.6 | 13 | 4 | 0 | 0 | 0 |
| Grand Total | 27 553 | 100.0 | 13 264 | 8 755 | 1 939 | 3 375 | 220 |
Remarks :
1. Others - include territory-wide issues and other mobile sources which cannot be regionalised.
2. Noise cases include police cases.
Pollution Complaints by Trade Type in 2006
| Air | Noise | Water | Waste | Misc | Total | |
|---|---|---|---|---|---|---|
| Commercial | ||||||
| Restaurants / food shop | 1 440 | 1 662 | 192 | 10 | 6 | 3 310 |
| Land Transport | 58 | 406 | 27 | 17 | 2 | 510 |
| Retail Shops | 163 | 442 | 47 | 9 | 1 | 662 |
| Garage | 211 | 95 | 119 | 40 | 2 | 467 |
| Repair Services | 12 | 7 | 11 | 4 | 0 | 34 |
| School & Institutions | 4 | 222 | 13 | 2 | 3 | 244 |
| Car Parks | 40 | 45 | 6 | 9 | 9 | 109 |
| Laundries | 67 | 8 | 10 | 0 | 1 | 86 |
| Recreation Services | 15 | 34 | 7 | 5 | 1 | 62 |
| Religious Organisations | 92 | 28 | 4 | 6 | 2 | 132 |
| Sanitary Services | 31 | 29 | 6 | 1 | 1 | 68 |
| Hotels | 14 | 38 | 5 | 3 | 2 | 62 |
| Photo Finishing | 0 | 0 | 1 | 0 | 0 | 1 |
| Others | 562 | 895 | 224 | 82 | 44 | 1807 |
| Industrial | ||||||
| Construction Site & Renovation | 1 230 | 1 627 | 167 | 2 063 | 11 | 5 098 |
| Livestock Farm | 109 | 5 | 38 | 59 | 4 | 215 |
| Food Manufacturing | 99 | 18 | 18 | 2 | 0 | 137 |
| Godown/td> | 42 | 62 | 8 | 10 | 1 | 123 |
| Textile Industries | 47 | 0 | 7 | 1 | 0 | 55 |
| Chemical Products | 15 | 6 | 2 | 3 | 0 | 26 |
| Fabricated Metal Products | 11 | 8 | 1 | 0 | 0 | 20 |
| Other manufacturing industries | 36 | 9 | 4 | 2 | 0 | 51 |
| Basic Metal | 39 | 48 | 4 | 1 | 1 | 93 |
| Cement / Concrete / Batching Plants etc | 20 | 4 | 2 | 2 | 0 | 28 |
| Furniture and Fixtures | 11 | 5 | 0 | 0 | 0 | 16 |
| Printing | 28 | 6 | 1 | 1 | 0 | 36 |
| Rubber & Plastics | 22 | 4 | 3 | 0 | 0 | 29 |
| Paper Products | 4 | 1 | 1 | 0 | 0 | 6 |
| Others | 312 | 160 | 62 | 29 | 6 | 569 |
| Government / Public Facilities | ||||||
| Refuse Collection Point | 7 | 9 | 0 | 33 | 0 | 49 |
| Landfill | 131 | 0 | 0 | 1 | 1 | 133 |
| Sewage Treatment Plant | 6 | 1 | 6 | 0 | 0 | 13 |
| Refuse Transfer Station | 11 | 2 | 5 | 8 | 0 | 26 |
| Crematorium | 5 | 1 | 0 | 1 | 0 | 7 |
| Other Facilities | 66 | 74 | 7 | 14 | 15 | 176 |
| Domestic & Public place | 1 112 | 2 117 | 872 | 936 | 89 | 5 126 |
| Others | 216 | 40 | 59 | 21 | 18 | 354 |
| Intruder Alarm | 0 | 637 | 0 | 0 | 0 | 637 |
| Vehicle emissions | 6 976 | 0 | 0 | 0 | 0 | 6 976 |
| Total | 13 264 | 8 755 | 1 939 | 3 375 | 220 | 27 553 |
Remarks : Noise cases include police cases.
Pollution Complaints by Subject Categories in 2006
| Breakdown by Pollutant / Activities | |
|---|---|
| Air Pollution | |
| Vehicle emission | 6 976 |
| Ship emission | 7 |
| Open burning | 209 |
| Paint spraying | 158 |
| Asbestos | 225 |
| Cement dust | 7 |
| Dark smoke | 40 |
| Construction dust / air nuisance | 1 230 |
| Greasy fumes / cooking odour | 1 440 |
| Malodour | 2 107 |
| Mysterious gas incident / Gas leakage | 7 |
| Burning of incense paper, etc | 162 |
| Others | 696 |
| Sub-total | 13 264 |
| Noise Pollution | |
| Construction | |
| General works | 1 365 |
| Percussive piling | 262 |
| Neighbourhood & public place | 2 117 |
| Transport | |
| Road traffic | 337 |
| Aircraft / Helicopter (flight) | 7 |
| Marine traffic | 1 |
| Ind & comm | |
| Restaurants | 1 662 |
| MTRC | 25 |
| KCRC | 27 |
| LRT | 12 |
| Ferry facilities | 6 |
| Ind & within same building | 4 |
| Others - (Industrial, Commercial, etc) | 2 250 |
| Product noise (NCO) | 7 |
| Intruder alarm | 637 |
| Others | 36 |
| Sub-total | 8 755 |
| Water Pollution | |
| Discharge from construction sites | 167 |
| Discharge from restaurant / food shops | 192 |
| Discharge from septic tanks | 53 |
| Illegal pipe connection | 205 |
| Beach water quality | 4 |
| Domestic / public place discharge | 715 |
| Discharge from industrial activities other than construction activities | 127 |
| Discharge from commercial other than from restaurants or food shops | 419 |
| Others | 57 |
| Sub-total | 1 939 |
| Waste Pollution | |
| Flytipping | 2 542 |
| Marine dumping | 12 |
| Pig waste | 35 |
| Chicken waste | 16 |
| Pigeon waste | 5 |
| Mixed livestock waste | 4 |
| Chemical waste (lube. oil) | 109 |
| Chemical waste (misc.) | 101 |
| Chemical waste (asbestos) | 52 |
| Oily waste |
27 |
| Livestock rearing in prohibition areas / restriction areas | 422 |
| Others | 50 |
| Sub-total | 3 375 |
| Miscellanenous | 220 |
| Sub-total | 220 |
| Total: | 27 553 |
Remarks : Noise cases include police cases.
Incoming Calls to Customer Service Centre from Year 1986 to 2006
![]()
![]()
![]()