11
Hazard to Life Assessment
11.1 Introduction
11.1.1.1 This section identifies the hazardous scenarios associated with the generation, storage, utilization, processing and transmission (if applicable) biogas during the construction and operation of the proposed YLEPP and presents the analysis and findings of the Quantitative Risk Assessment (QRA) undertaken.
11.1.1.2 An organic wastes co-digestion facility that processes off-site pre-treated organic wastes (approximately 260 wet tonnes / day) and sewage sludge and handles the associated wastewater and biogas will be installed at YLEPP. The preliminary site layout of the proposed YLEPP and the location of its biogas related facilities are shown in Appendix 11.2.
11.1.1.3 In accordance with Section 3.4.8 of the EIA Study Brief (ESB-309/2018), a hazard assessment should be conducted to evaluate the biogas risk to existing, committed and planned off-site population due to operation of the organic wastes co-digestion facility.
11.2 Environmental Legislation, Standards and Criteria
11.2.1.1 The requirements and criteria for assessing hazard to life are outlined in Section 3.4.8 of the EIA Study Brief (ESB-309/2018) and Annex 4 of the Technical Memorandum on Environmental Impact Assessment Process (EIAO-TM), respectively. The estimated risk levels due to biogas-related operations are compared with the individual and societal risk criteria set out in the Hong Kong Risk Guidelines (HKRG) to determine the acceptability of the risk levels estimated in this hazard assessment.
Hong
Kong Risk Guidelines (HKRG), EIAO-TM Annex 4
11.2.1.2 Individual risk is the predicted increase in the chance of fatality per year to an individual due to a potential hazard. The individual risk guidelines require that the maximum level of individual risk should not exceed 1 in 100,000 per year i.e. 1×10⁻⁵ per year.
11.2.1.3 Societal risk refers to the risks to the whole population. It is expressed graphically by plotting the cumulative frequency (F) of N or more deaths in the population from incidents at a certain installation against the number of fatalities (N) (Drawing 11.1 refers). Two F-N risk lines are used in the HKRG to denote “Acceptable” or “Unacceptable” societal risks. To avoid major disasters, there is a vertical cut-off line at the 1,000 fatality level extending down to a frequency of 1 in a billion (1x10⁻⁹) per year. The intermediate region indicates that the acceptability of societal risk is borderline and that it should be reduced to a level which is “as low as reasonably practicable” (ALARP). It seeks to ensure that all practicable and cost effective measures that can reduce risk are considered.
|
|
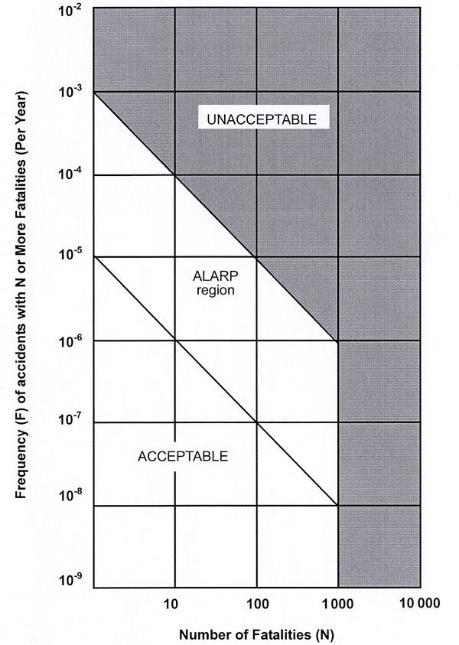
Drawing 11.1 Societal Risk Guidelines for Acceptable Risk Levels
11.3
Study Objectives and
Methodology
11.3.1 Study Objectives
11.3.1.1 The main objectives of the hazard assessment, as detailed in Appendix I of the EIA Study Brief, are to:
(i) identify hazardous scenarios associated with the generation, storage, utilization, processing and transmission (if applicable) of biogas due to the Project and then determine a set of relevant scenarios to be included in an QRA;
(ii) execute a QRA of the set of hazardous scenarios determined in sub-section (i) above, expressing population risks in both individual and societal terms;
(iii) compare individual and societal risks with the criteria for evaluating hazard to life stipulated in Annex 4 of the EIAO-TM; and
(iv) where the risk criteria in Annex 4 of the EIAO-TM cannot be met,
identify and assess practicable and cost-effective risk mitigation measures.
11.3.2 Methodology
11.3.2.1
To ensure that the methodology
and approach of this hazard assessment are consistent with those of previous
studies with similar issues, the hazard assessments under the approved EIAs for Organic
Waste Treatment Facilities (OTWF), Phase I (AEIAR-149/2010) [1] and OWTF, Phase 2 (AEIAR-180/2013) [2] have been reviewed and referenced for this Project.
11.3.2.2
The QRA consists of the
following six main tasks:
(i) Data / Information Collection and Update: Relevant data / information necessary for the hazard assessment, including project design and surroundings of the Project were collected and updated;
(ii) Hazard Identification: A set of relevant hazardous scenarios associated with the operations of the organic wastes co-digestion facility were identified by reviewing relevant literature and studies with similar installations as well as historical accident database, such as Major Hazard Incident Data Service (MHIDAS);
(iii) Frequency Estimation: Frequencies of each hazardous event leading to fatalities with full justification were estimated by reviewing historical accident data, previous similar projects and using Fault Tree Analysis (FTA) of the identified hazardous scenarios;
(iv) Consequence Analysis: The consequences of the identified hazardous scenarios were analysed by conducting source term modelling and effect modelling.
(v) Risk Integration and Evaluation: The risks associated with the identified hazardous scenarios were evaluated. The evaluated risks were compared with the HKRG in EIAO-TM to determine their acceptability; and
(vi) Identification of Mitigation Measures: Where necessary, practicable and cost-effective risk mitigation measures were identified and assessed to ensure compliance with the ALARP principle in the HKRG. Risks of the mitigated case were re-assessed to determine the level of risk reduction as required.
11.3.2.3 The main tasks of the QRA are shown schematically in Drawing 11.2.
|
|
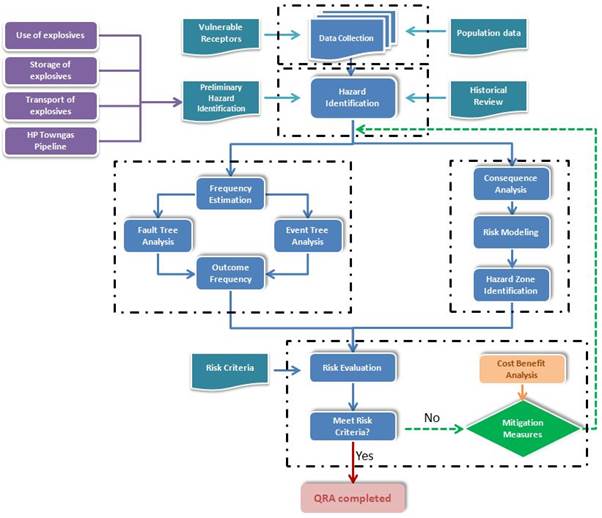
Drawing 11.2 Schematic Diagram of QRA
Process
11.3.3 Assessment Year
11.3.3.1 Based on the currently envisaged construction programme, the YLEPP will be constructed in two phases:
· the Phase 1 works will upgrade the existing YLSTW into YLEPP with a treatment capacity of 100,000 m3/day in ADWF. The tentative commission year of Phase 1 installation is 2026; and
· the Phase 2 works, which will further upgrade the treatment capacity to 180,000 m3/day in ADWF, will be implemented subject to further review of sewage flow projections . The tentative commission year of Phase 2 installation is 2030.
11.3.3.2 There are sludge treatment and biogas storage facilities in the existing YLSTW. Currently, the biogas storage capacity is 2,440m3, and stored in 2 gas holders with 1,220m3 each. The biogas storage capacity of the proposed YLEPP after Phase 2 installation completed in 2030 will be 6,000m3, which is much larger than the existing biogas storage capacity. Hazard assessment for the ultimate operation phase in 2030 represents the worst case scenario, and the scenario for existing biogas facilities is not further assessed in this hazard assessment.
11.3.3.3 The following scenarios are proposed for the QRA:
· Scenario 1: Phase 1 installation commissioned and Phase 2 installation being constructed; the current plan for implementation of Phase 2 works is from 2026 to 2030, there is an expectation of increase in surrounding population in the vicinity of the YLEPP; therefore, Year 2030 is proposed as the assessment year for this scenario as the risk levels will be on the conservative side;
· Scenario 2: Phase 2 installation commissioned; the tentative commission year of Phase 2 installation is 2030, as such, Year 2030 is proposed as the assessment year for this scenario.
11.3.3.4 Phase 2 works will be implemented subject to further review of sewage flow projections, the proposed plant’s co-use area will extend to part of the Phase 2 works site (i.e. the existing Aeration Tanks No. 1 to 4 and existing circular Final Sedimentation Tanks No. 1 to 4) if Phase 2 works is not commenced. A sensitivity test was conducted to assess the biogas risk levels in such case and details presented in Appendix 11.6.
11.4 Description of Surroundings
11.4.1
On-site Populations
11.4.1.1 The following population is anticipated in YLEPP:-
(i)
Construction workers: people
employed by contractors with induction trainings on potential risks and means
of evacuation in YLSTW / YLEPP. They workers should also have adequate
trainings in health and safety aspects. During the course of construction
works, the workers should have appropriate PPE and be under the supervision of
safety personnel.
(ii) Guided visitors: people visited the plant with pre-appointment similar to the current arrangement in other STWs being operated by DSD. The scheduled visits to YLEPP will be arranged after commissioning of Phases 1 and 2 respectively and the number of visitors shall limited to a maximum of 100 per visit. The visitors should be registered at the Administration Building upon arrival to YLEPP and briefed the potential risks before start of the visits. During the course of visits, the visitor should be accompanied by plant’s staffs who are familiar with the plant situations and evacuation means.
(iii) Co-use area users: people entered the plant’s co-use area without the need for pre-appointment. In case conditions permit, part of the YLEPP area as shown in Appendix 11.1 will be open to visitors after commissioning of Phases 1 and 2 works, respectively. The visitors will enter and exit YLEPP via a designated personnel access located at south-eastern corner of YLEPP during the opening hours, tentatively from 7:00am to 7:00pm per day. DSD will set up a control point at the personnel access to limit the number of visitors to a maximum of about 200 in normal situation. The area opened to general public use shall be fenced off to avoid trespassing to areas with potential hazards or health and safety concerns. It is anticipated that the visitors’ movement will also be closely monitored via CCTV or security staff on site.
11.4.1.2 The safety management measures described in Section 11.5.8 shall be implemented as requirements to protect the construction workers of the Project from the risks associated with the operating biogas facilities. With the safety management measures in place, the potential risks to the construction workers are expected to be low.
11.4.2
Surrounding Populations
11.4.2.1 Societal risk is a measure of the consequence magnitude and the frequency of the hazardous events. To establish the impact of any release (the number of people likely to be affected) in the future, it is necessary to know the future surrounding population levels. These would include residential population, government and institutional population and transport population but exclude staff of the YLEPP since they are considered as voluntary risk takers. In addition, the construction workers and the guided visitors will be adequately notified about the potential risks, and they will be supervised / guided by safety personnel / staff who are familiar with evacuation plan during emergency. As such, the construction workers and the guided visitors are considered to be voluntary risk takers and are not taken into account in this QRA.
11.4.2.2 The site of the proposed YLEPP is located within the existing Yuen Long Sewage Treatment Works (YLSTW) to the north of Yuen Long Industrial Estate. The proposed organic wastes co-digestion facility is located in the southwestern corner of the proposed YLEPP. All population groups included in this assessment are presented in Appendix 11.1A and Appendix 11.1B for Scenario 1 and Scenario 2 respectively.
Land and Building Population
11.4.2.3 Information from various sources were reviewed and adopted where applicable for the estimation of land and building populations (Table 11.1 refers). Site surveys were also conducted to verify relevant data (e.g. number of village houses) and fill the information gap of the reviewed data sources where necessary.
Table 11.1 Data Sources of Land and Building Population
|
Sources |
Data Reference |
|
Planning Department |
· 2014-based Territorial Population and Employment Data Matrix (TPEDM) [5] · Worker densities from Hong Kong Planning Standards and Guidelines [6] |
|
Lands Department |
·
GeoInfo Map and survey maps
on building information |
|
Site Surveys |
· Village house counts · Employment in Yuen Long Industrial Estate |
11.4.2.4 The predicted average household size for the residential populations within the study area has a declining trend within the construction period of Phase 2 works, i.e. Year 2026 to Year 2030, based on the TPEDM data. To be conservative, the residential populations in Year 2030 were assumed to be the same as those in Year 2026, and estimated based on the predicted average household size in Year 2026.
11.4.2.5 With reference to previous similar studies [1][2], four time modes as detailed in Table 11.2 were applied in this hazard assessment to reflect the temporal distribution of population and to address the variation in levels of activities that could lead to a release and the variation in population in the assessment area with time. The assumption of variation in occupancy of populations across different time modes based on relevant / similar studies [1][2][7][8] and site observations is listed in Table 11.3.
Table 11.2 Time Modes Adopted for Hazard Assessment
|
Day Category |
Time Period |
Time Mode |
|
|
Weekday |
Daytime |
(07:00 to 19:00) |
Weekday (Daytime) |
|
Night |
(19:00 to 07:00) |
Weekday (Night) |
|
|
Weekend |
Daytime |
(07:00 to 19:00) |
Weekend (Daytime) |
|
Night |
(19:00 to 07:00) |
Weekend (Night) |
|
Table 11.3 Occupancies of Population
Groups at Different Time Modes
|
Population Group |
Percentage of Occupancy
at Different Time Modes |
Indoor Ratio |
|||
|
Weekday (Daytime) |
Weekday (Night) |
Weekend (Daytime) |
Weekend (Night) |
||
|
50% |
100% |
70% |
100% |
95% |
|
|
Industrial |
100% |
10% |
50% |
10% |
95% |
|
Open Area |
100% |
10% |
100% |
10% |
0% |
|
Construction Site |
100% |
10% |
50% |
10% |
0% |
|
Open Carpark |
100% |
10% |
100% |
10% |
0% |
|
Site Office |
100% |
10% |
50% |
10% |
50% |
|
Open Storage |
100% |
10% |
100% |
10% |
0% |
11.4.2.6 The estimation of land and building populations is summarized Table 11.4 and detailed in Appendix 11.1. The assessment year for both Scenario 1 and Scenario 2 is 2030, the surrounding population are the same for both assessment scenarios.
Table 11.4 Land and Building
Population Considered for Hazard Assessment
|
ID |
Description |
Maximum Population in
2030 |
|
1a |
Leon
Court, Leon House, Green Garden, other village houses |
446 |
|
1b |
Open
Storage Area |
5 |
|
2 |
Ng Uk
Tsuen |
915 |
|
3 |
Jade
Court, Lai Yin Garden & Village Houses |
374 |
|
4 |
Open
Storage Area |
4 |
|
5a |
Village
Houses |
16 |
|
5b |
Open
Storage Area |
2 |
|
6 |
Dunwell
|
47 |
|
7 |
Eu
Yan San Centre |
170 |
|
8 |
Vogue
Laundry |
414 |
|
9 |
Yau
Sang Galvanizers (Hot-Dip) Co Ltd |
68 |
|
10 |
Kyowa
Industrial Co Ltd |
36 |
|
11 |
Acme
Agent |
50 |
|
12 |
TDK
Manufacturing (HK) Co Ltd |
81 |
|
13 |
San Miguel
Brewery Hong Kong Limited |
959 |
|
14 |
Topfine
Machinery (China) Co Ltd |
207 |
|
15 |
Bus
Depot |
41 |
|
16 |
Eu
Yan San Centre |
306 |
|
17 |
Wai
Yuen Tong Co Ltd |
327 |
|
18 |
Fung
Shing Steel Co., Ltd. |
23 |
|
19 |
Hong
Kong Petrochemical Co. Ltd |
247 |
|
20 |
Nestle
Hong Kong Limited |
347 |
|
21 |
Bright
Future Pharmaceutical Laboratories Ltd |
91 |
|
22 |
Noble
Phoenix Investments Limited (unoccupied) |
0 |
|
23 |
EMIX
Industry (HK) Limited |
38 |
|
24 |
Vacant |
0 |
|
25 |
Bright
Future Pharmaceutical Laboratories Ltd |
79 |
|
26 |
Bright
Future Pharmaceutical Laboratories Ltd |
48 |
|
27 |
Viva
Manufacturing Limited |
270 |
|
28 |
ClearWaterBay
Technology Limited |
21 |
|
29 |
Toppan
Forms Card Technologies Ltd |
49 |
|
30 |
Ushio
Hong Kong Limited |
68 |
|
31 |
Bus
Depot / Amenity Area |
0 |
|
32 |
Vacant |
0 |
|
33 |
Nam
Sang Wai |
45 |
|
34 |
Village
House |
6 |
|
35 |
Village
House |
3 |
|
36 |
Co-use
Area Users [Note 1] |
200 |
Note 1: The extent of YLEPP
public co-use area in Scenario 1 and Scenario 2 please refer to Appendix 11.1A and Appendix 11.1B respectively.
11.4.2.7 The traffic population considered in this assessment included the population travelling in motor vehicles on Wang Lok Street, Wang Lee Street, Fuk Hi Street, Fuk Yan Street and Fuk Wang Street. With reference to the Traffic Impact Assessment for this Project and Annual Traffic Census from Transport Department [9], the traffic population was estimated based on the following equation:
Traffic Population = (Person per
vehicle × Vehicle per hour × Road Width ) / Speed
11.4.2.8 The traffic population considered in this assessment, which was assumed to be 100% outdoor, is summarized in Table 11.5 and detailed in Appendix 11.1.
Table 11.5 Traffic
Population Considered for Hazard Assessment
|
ID |
Description |
Maximum Population in
2030 |
|
|
Daytime |
Night-time |
||
|
R1 |
Wang Lok Street |
12 |
12 |
|
R2 |
Wang Lee Street |
15 |
13 |
|
R3 |
Fuk Hi Street |
11 |
10 |
|
R4 |
Fuk Yan Street |
8 |
7 |
|
R5 |
Fuk Wang Street |
11 |
10 |
Pedestrian Population
11.4.2.9 The pedestrian population considered in this assessment included cyclists and pedestrians observed along Nam Sang Wai Road. The pedestrian flows were assessed by survey on site. The pedestrian population was estimated by the following equation:
Pedestrian Population (person /
m) = (Number of pedestrians passing a given point) / (Pedestrian speed)
11.4.2.10 The average numbers of cyclists and pedestrians recorded on Nam Sang Wai Road during site surveys conducted on weekends are around 150 and 200 person per hour, respectively. The travelling speed of cyclists was assumed to be 16km/hr while that of pedestrians was assumed to be 5km/hr based on observations during site surveys. The pedestrian population (including cyclists) was calculated to be 0.0494 person/m. The pedestrian population considered in this QRA is summarized in Table 11.6.
Table 11.6 Pedestrian Population
Considered for Hazard Assessment
|
ID |
Description |
Maximum Population in
2030 |
|
|
Daytime |
Night-time |
||
|
R6 |
Nam Sang Wai Road |
350 |
35 |
11.4.3
Meteorological Data
11.4.3.1 Meteorological data is required for consequence modelling and risk calculation. Consequence modelling (dispersion modelling) requires wind speed and stability class to determine the degree of turbulent mixing potential whereas risk calculation requires wind-rose frequencies for each combination of wind speed and stability class.
11.4.3.2 Meteorological data were obtained from Wetland Park Weather Station (2013-2017) where wind speed, stability class, weather class and wind direction are available. This data represented the weather conditions for the area and had already taken into account of seasonal variations, and therefore were considered applicable to this assessment.
11.4.3.3 The data were transformed into an array of weather classes that can be expressed in a combination of wind speed and Pasquill stability classes to represent daytime and night-time meteorological conditions in accordance with the Guidelines for Quantitative Risk Assessment: Purple Book [10]. Pasquill stability classes (A to F) represent the atmospheric turbulence with Class A being the most turbulent class while Class F is the least turbulent class. These combinations are considered adequate to reflect the full range of observed variations in these quantities. It is not necessary or efficient to consider every combination observed. The principle is to group these combinations into representative weather classes, which together would cover all conditions observed. Once the weather classes have been selected, frequencies for each wind direction for each weather class can then be determined. These frequency distributions are given in Table 11.7 and Table 11.8 for the daytime and night-time meteorological conditions respectively.
Table 11.7 Daytime Weather Class-Wind Direction Frequencies at Wetland Park Weather Station
|
Wind Direction |
Frequency (%) |
||||||
|
2B |
1D |
3D |
6D |
2E |
1F |
Total |
|
|
0 |
4.24 |
0.56 |
0.96 |
0.03 |
0.81 |
1.73 |
8.33 |
|
30 |
5.39 |
0.84 |
3.25 |
0.06 |
1.83 |
1.12 |
12.48 |
|
60 |
9.54 |
1.73 |
8.30 |
0.00 |
2.29 |
1.70 |
23.57 |
|
90 |
2.42 |
0.68 |
3.50 |
0.06 |
1.05 |
1.46 |
9.17 |
|
120 |
1.92 |
0.34 |
1.89 |
0.09 |
0.37 |
0.84 |
5.45 |
|
150 |
4.18 |
0.28 |
2.82 |
0.31 |
0.53 |
1.18 |
9.29 |
|
180 |
3.66 |
0.22 |
3.00 |
0.00 |
0.71 |
0.71 |
8.30 |
|
210 |
2.08 |
0.19 |
0.56 |
0.03 |
0.31 |
0.19 |
3.35 |
|
240 |
1.18 |
0.06 |
0.37 |
0.00 |
0.09 |
0.28 |
1.98 |
|
270 |
3.84 |
0.28 |
0.90 |
0.00 |
0.22 |
0.43 |
5.67 |
|
300 |
4.46 |
0.09 |
0.59 |
0.00 |
0.22 |
0.65 |
6.01 |
|
330 |
3.62 |
0.31 |
0.84 |
0.03 |
0.65 |
0.93 |
6.38 |
|
All |
46.53 |
5.58 |
26.98 |
0.62 |
9.08 |
11.21 |
100 |
Table 11.8 Night-time Weather Class-Wind Direction Frequencies at Wetland Park Weather Station
|
Wind Direction |
Frequency (%) |
||||
|
4D |
6D |
2E |
1F |
Total |
|
|
0 |
0.50 |
0.00 |
2.38 |
8.69 |
11.56 |
|
30 |
2.08 |
0.03 |
3.70 |
4.36 |
10.17 |
|
60 |
1.49 |
0.00 |
7.27 |
6.18 |
14.93 |
|
90 |
2.01 |
0.03 |
5.58 |
8.82 |
16.45 |
|
120 |
0.96 |
0.10 |
2.58 |
5.71 |
9.35 |
|
150 |
0.66 |
0.03 |
8.45 |
7.43 |
16.58 |
|
180 |
0.63 |
0.00 |
4.23 |
3.70 |
8.55 |
|
210 |
0.10 |
0.00 |
0.76 |
1.02 |
1.88 |
|
240 |
0.03 |
0.00 |
0.03 |
0.83 |
0.89 |
|
270 |
0.03 |
0.00 |
0.40 |
1.25 |
1.68 |
|
300 |
0.13 |
0.00 |
0.59 |
2.01 |
2.74 |
|
330 |
0.30 |
0.03 |
1.12 |
3.76 |
5.22 |
|
All |
8.92 |
0.23 |
37.09 |
53.76 |
100.00 |
11.5 Hazard Identification
11.5.1 Introduction
11.5.1.1 A hazard is described as the property of a material or activity with the potential to do harm. Potential hazards associated with generation, transfer, storage and use of biogas in the organic wastes co-digestion facility within the proposed YLEPP were identified. All the operation information and parameters have been confirmed with the engineers. This section outlines the hazards preliminarily identified for the facility.
11.5.1.2 Historical incidents and relevant studies of similar facilities were reviewed to identify the possible hazardous scenarios and to ensure that all the relevant hazardous scenarios were incorporated into this assessment.
11.5.2 Facility Description
11.5.2.1 The organic wastes co-digestion facility at the proposed YLEPP will receive approximately 260 wet tonnes / day of pre-treated organic wastes through pipelines or tankers for co-digestion with sewage sludge and handle the associated wastewater and biogas. Proven biological treatment technologies will be adopted to recover reusable energy, i.e. biogas, from source-separated organic waste and sewage sludge. Biogas generated will be used onsite heat and power production. The location plan of the facility and the treatment process are illustrated in Appendix 11.2.
Digesters
11.5.2.2 Ten cylindrical anaerobic sludge digesters, each of which is 19m (Dia.) x 25m (H) (internal dimension) in size, will be provided to handle the pre-treated organic waste and sludge. The biogas volume of each digester is 330m3, with a combined volume of 3,300m3. The working temperature and pressure of the digesters will be maintained at 40oC and 1 bar. Seven digesters will be constructed and operated after Phase 1 works, and the remaining three digesters will be constructed during Phase 2 works.
11.5.2.3 The digesters consist of concrete, steel or glass enamel holding tanks, with either gas or top mounted mixing systems. Approximately 260 wet tonnes / day of pre-treated organic waste and 1400 tonnes / day of sewage sludge will enter the digestion tanks along with additional water to reduce the Dissolved Solid (DS) content from an estimated 15% to 5%. The estimated average residence time of the organic waste / sludge within the digesters is assumed to be 20 days. Digested sludge / organic waste will be dewatered for disposal and the wastewater from the dewatered compost will be transferred to the side-stream treatment facilities / inlet works of YLEPP for treatment.
11.5.2.4 Heating is required for biomass feeding of the digesters and for heat loss compensation from the digesters. The required heating will be provided via heat recovered from the combined heat and power (CHP) unit, or from a boiler.
11.5.2.5 Pressure relief valves will be installed on the digesters to protect against overpressure (50 mbarg) or under pressure (-2 mbarg). Overflow pipes will be provided on the digesters for protection against overfilling.
Biogas Holders
11.5.2.6 The biogas generated will be stored in the biogas holders. There will be four cylindrical biogas holders, each of which is 15.6m (Dia.) x 14.6m (H) (internal dimension) in size with a maximum biogas storage of 1500m3 per tank. The total storage amount of the biogas will be around 7,200 kg. The quantity does not exceed the lower threshold quantity, i.e. 15 tonnes, for existing Potentially Hazardous Installations (PHIs) for flammable gas and town gas installations in Hong Kong. Therefore, the proposed waste treatment facilities are not classified as a PHI. The biogas storage would be maintained at a temperature 40oC and a pressure of 1.03 bar.
11.5.2.7 Dry seal (Wiggins) type biogas holders with steel containment will be used in the proposed facility for evening out variations in biogas production from the digesters. This type of gas holder typically consists of a cylindrical steel shell and a displacement piston, which is allowed to go up and down with the change of volume of gas. The gas tightness is maintained by a seal between the piston and the inside of the shell. There are pressure relief valves on the biogas holder for protection against the exceedance of designed gas storage pressure and over flow pipes for protection against overfilling.
11.5.2.8 A non-return valve will be installed at the inlet pipe to prevent gas from back-flow. Gas is discharged through the outlet pipe by suction blower. There will be emergency shut-off valves at the inlet and outlet pipes of the gas holder. In case of gas holder failure, the emergency shut-off valves can close the inlet and outlet pipes and the release of biogas to the atmosphere can be minimised.
Sulphur Absorption Vessels
11.5.2.9 The stored biogas will go through the sulphur absorption vessels to remove the hydrogen sulphide (H2S) before passing to the CHP generator to produce electricity and heat for use onsite.
11.5.2.10 Five duty and one standby sulphur absorption vessels, each of which is 3.7m (Dia.) x 4.6m (H) in size, will be provided downstream of the gasholders for the absorption of H2S in the biogas. The working temperature and pressure of the sulphur absorption vessels will be maintained at 40oC and 1.03 bar. The absorption vessels are made of steel and filled with zinc oxide or iron oxide as absorbents. An explosion proof blower will be used to extract the biogas from gasholder to the sulphur absorption vessels at 400 mbarg. In order to suit the actual needs, four duty and one standby sulphur absorption vessels will be provided after Phase 1 works.
Inlet / Outlet Piping
11.5.2.11 A total of 290m of aboveground inlet / outlet pipe (500mm Dia.) will be provided to the facility. All other piping will be underground or provided at the basement of concrete buildings. The working temperature and pressure of the inlet and outlet piping will be maintained at 40oC and 1.03 bar.
11.5.3 Biogas Properties
11.5.3.1 Biogas is a colourless flammable a combustible mixture of gases at atmospheric conditions that comprises mainly methane (CH4) and CO2. Generally, biogas from anaerobic digestion process has a methane content of 55% to 70% by volume. The exact composition of biogas depends on the substance that is being decomposed. If the material consists of mainly carbohydrates, such as glucose and other simple sugars and high-molecular compounds (polymers) such as cellulose and hemicellulose, the methane production is low. However, if the fat content is high, the methane production is likewise high [3]. In general, the physical properties of biogas are also very similar to those of natural gas. While it is non-toxic, in high concentrations it could lead to asphyxiation. A loss of containment can lead to jet fire (if stored/ transferred under sufficient pressure) or to an explosion if the gas accumulates in a confined space. The properties of biogas from Anaerobic Digestion (AD) process are summarized in Table 11.9 [1][2].
Table 11.9 Composition and Properties of Biogas from Anaerobic Digestion Process
|
Property |
Biogas from
Anaerobic Digestion |
|
Methane Content |
55% – 70% |
|
Carbon Dioxide
Content |
30% – 45% |
|
Density |
1.2 Kg/Nm3 |
|
Lower Caloric
Value |
23 MJ/Nm3 |
|
Flammability# |
Extremely
Flammable |
|
Auto-Ignition
Temperature# |
580°C |
|
Flash Points# |
-188°C |
|
Melting Point# |
-182.5°C |
|
Boiling Point# |
-161.4°C |
|
Flammable Limits# |
5% (Lower) – 15%
(Upper) |
|
Vapour Density# |
0.59-0.72 (air =
1) |
# Physical properties of biogas that are similar to natural gas.
11.5.3.2 Given that flammability increases with increase of methane content, and the exact composition of biogas varies with the substance that is being decomposed, it is conservatively assumed that the biogas is 100% methane in the risk model.
11.5.4 Review of Historical Incident Database and Relevant Studies
11.5.4.1 Relevant biogas or methane release scenarios from OWTF (which is a facility of a similar nature as the proposed facility at YLEPP) identified in historical incident databases, such as MHIDAS database, eMARS, FACTS and ARIA, were examined. The recorded hazardous scenarios were mainly associated with leakages from piping, valves and storage vessels and operator error. A total of 11 incidents records related to biogas and methane were identified and these are summarized in Table 11.10 and detailed in Appendix 11.3.
Table 11.10 Summary of Biogas
or Methane Incidents
|
Hazardous
Scenario |
No. of Cases |
Country |
|
Methane Storage
Tank Failure |
3 |
Turkey, India,
Australia |
|
Methane Pipeline
Failure |
2 |
UK, USA |
|
Anaerobic
Digestion Plant Failure |
6 |
Italy, France,
Germany, India |
11.5.4.2 The hazardous scenarios of biogas identified in the relevant studies were reviewed and adopted in this hazard assessment where applicable. Failure events and the respective hazardous scenarios associated with the biogas facilities were identified and assessed in the approved EIA studies for OWTF, Phase I (AEIAR-149/2010)[1] and OWTF, Phase 2 (AEIAR-180/2013)[2]. The identified hazardous scenarios were mainly associated with leakages from piping, valves and storage vessels due to undetected material defect.
11.5.5 Spontaneous Failures
Digester Failure
11.5.5.1 Failure of the digesters could be caused by undetected corrosion, fatigue, material or construction defect. Release of biogas could be from various parts of the digesters as well as the associated piping and devices. Possible hazardous outcomes include fireball, jet fire, flash fire and Vapour Cloud Explosion (VCE).
Gasholder Failure
11.5.5.2 Dry seal (Wiggins) type biogas holders will be used for the proposed facility (Section 11.5.2.7 refers). A dry seal (Wiggins) type gas holder is different from column guided water-sealed gas holder that do not have a gas holder crown. A seal is installed between the piston and the inside of the shell to maintain gas tightness inside the holder and prevent rotation or side movement of the piston. A levelling system consists of wire ropes and balance weights is equipped to prevent tilting of the piston. The seal and the levelling system will be inspected regularly.
11.5.5.3 Failure of the gas holders could be caused by undetected corrosion, fatigue, material or construction defect. Release of biogas could be from various parts of the gas holders or associated piping and devices. Possible hazardous outcomes include fireball, jet fire, flash fire and VCE.
Sulphur Absorption Vessel Failure
11.5.5.4 The absorbents used for removal of H2S in the sulphur absorption vessels are neither flammable nor explosive that the major hazard will be from the release of biogas. Failure of sulphur absorption vessels could be caused by undetected corrosion, fatigue, material or construction defect. Release of biogas could be from various parts of the process vessels as well as associated piping and devices. Possible hazardous outcomes include fireball, jet fire, flash fire and VCE.
Aboveground Inlet or Outlet Piping Failure
11.5.5.5 Piping will be used to connect process vessels to the gasholder, compressor, and further purification unit and CHP. Failure along the on-site piping may be caused by undetected corrosion, fatigue, material or construction defect, or associated with flange gasket / valve leakage resulting in continuous gas release to the atmosphere. Failures of gaskets and valve leak only tend to give relatively small scale leakage and will not contribute to any off-site risk. Nonetheless, gasket and valve leak failure were considered and included into pipework failure in this hazard assessment with reference to previous similar study [2]. Possible hazardous outcomes from aboveground / underground piping include flash fire and VCE, while jet fire could also result from failure of aboveground piping.
11.5.6 External Hazards
11.5.6.1 External hazards that are outside the control of the operating personnel could still pose a threat to the organic waste co-digestion facility at the proposed YLEPP. Such hazards are termed as ‘external hazards’ because they are independent of the operations on-site but can lead to major hazard scenarios. This section discusses the credibility of loss of containment due to the external hazards with respect to Hong Kong’s geographical location.
Aircraft Crash
11.5.6.2 The site is located more than 20 km northeast from the Hong Kong International Airport. The frequency of aircraft crash was estimated using the methodology of the HSE [13] and detailed in Section 11.6.3.
Earthquake
11.5.6.3 In Hong Kong, buildings and infrastructures are designed to withstand earthquakes up to Modified Mercali Intensity (MMI) VII. It is estimated that MMI VIII is required to provide sufficient intensity to result in damage to specially designed structure. It is assumed that failure in earthquake is possible for storage tank rupture, leakage, pipeline rupture and leakage. Details of frequency analysis are given in Section 11.6.3.
Vehicle Impact
11.5.6.4 Only authorised vehicles will be permitted to enter the proposed YLEPP, and speed will be restricted for vehicle movements around the site. Safety markings and marked crash barriers will be provided to the above ground piping, digesters and gasholders near the access road. Vehicle impact could cause only leak failure to digesters and gas holders as well as both rupture failure and leak failure to aboveground piping [2]. The accident rate was estimated based on statistical data for Vehicle/ Object Crash accident involving medium and heavy goods vehicles in recent years and detailed in Section 11.6.3.
Lightning
11.5.6.5 Lightning sparks could ignite combustible gas in air. The proposed YLEPP will be equipped with a lightning protection system that can effectively protect the equipment, include the organic waste co-digestion facility, from lightning. Lightning protection installations should be installed following IEC 62305, BS EN 62305, AS/NZS 1768, NFPA 780 or equivalent standards [17]. The installations will be protected with lightning conductors to safely earth direct lightning strikes. The double grounding system will be inspected regularly. Therefore, failures due to lightning strikes are to be covered by generic failure frequencies [2].
External Fire
11.5.6.6 External fire means the occurrence of fire event which leads to the failure of the equipment inside the organic waste co-digestion facility. The proposed YLEPP is surrounded by fish ponds to its west and north, Shan Pui River to its east, and the Yuen Long Industrial Estate to its south. With the consideration of its surrounding terrain and vegetation, the probability of hill fire is negligible.
11.5.6.7 In YLEPP, the facilities will be equipped with fire alarm and fire suppression system. In addition, stringent procedures will be implemented to prohibit smoking or naked flames to be used on-site to further lower the probability of initiation due to external fire.
Typhoon/ Tsunami
11.5.6.8 Loss of containment due to severe environmental event such as typhoon or tsunami (large scale tidal wave) is not possible as the proposed YLEPP is designed to withstand wind load for local typhoon while Hong Kong is not threatened by tsunami. Subsidence is usually slow in movement and such movement can be observed and remedial action can be taken in time. Thus, typhoon or tsunami causing a release of biogas is not considered further in this assessment.
Construction Activities
11.5.6.9 During the construction phase of the Project, all major construction activities should be arranged with either adequate setback or physical barrier from the existing gas installations. Implementation of those major construction works and movement of plants and vehicles would be stringently controlled to have a setback of at least 15m clear distance, or physical barrier with an empty digester / gas holder from the digesters / gas holders in operation.
11.5.6.10 Those major construction works shall include excavation and piling works, for which the following construction plants may be used:-
· Backhoe excavators
· Mobile cranes
· Piling rigs
11.5.6.11 For those construction works to be carried out in close proximity to the 15m zone from digesters / gas holders in operation, restriction shall be imposed to the height of construction plants. It is considered prudent to limit the height of plants for those major construction to 15m such that the plants would not damage digesters /gas holders in such incident as plant collapse or overturning.
11.5.6.12 Whenever practicable, the construction sequence shall be arranged with empty unit(s) for separating the major construction works from these digesters / gas holders in use. In addition, physical barriers such as concrete blocks will be set up at the 15m zone in order to avoid those construction plants or vehicles from colliding to the digester / gas holder units in use.
11.5.6.13 With the abovementioned measures, it is considered that hazards, such as damages due to plant and vehicle movement, in association with construction of Phase 1 and Phase 2 works should be eliminated. As such, there is no potential biogas hazard during the construction phase.
11.5.7 Possible Hazardous Scenarios Considered
11.5.7.1
The organic waste co-digestion
facility at the proposed YLEPP will be using organic waste treatment
technology, similar to that in the operation of the OWTF Phase 1 and Phase 2,
i.e. anaerobic digestion of the organic waste. The sulphur absorption vessels
would be structurally similar to anaerobic digestion vessels. Possible
hazardous scenarios of the facility are listed in Table 11.11.
Table 11.11 Possible Hazardous Scenarios and Hazardous Outcomes of the Organic Waste Co-digestion Facility at YLEPP
|
Potential Sources |
Release Type |
Hazardous Outcome |
|
Gasholder |
Rupture |
Fireball; VCE; and Flash fire |
|
Leak |
Fireball; VCE; and Flash fire |
|
|
Digester |
Rupture |
Fireball; VCE; and Flash fire |
|
Leak |
Fireball; VCE; and Flash fire |
|
|
Sulphur Absorption Vessel |
Rupture |
Fireball; VCE; and Flash fire |
|
Leak |
Fireball; VCE; and Flash fire |
|
|
Aboveground inlet or outlet piping / pump /
non-return valve / flange |
Rupture /
Leak |
Fireball; VCE; and Flash fire |
11.5.7.2 Hazardous outcomes were assessed using PhastRisk 6.7, to determine the risk impact, where the potential risk associated with the operation, layout and facilities threat posed to life and neighbouring property in a hazardous outcome at the Project.
11.5.8 Safety Management Measures Implemented during Construction Phase
11.5.8.1 To minimize the potential risks to the construction workers on-site during the construction phase of the Project, construction safety plan will be developed before commencement of the construction works and the following key safety management measures will be implemented:
· Method statements and risk assessments shall be prepared and safety control measures shall be in place before commencement of work;
· All work procedures shall be complied with the operating plant procedures or guidelines and regulatory requirements;
· Work permit system, on-site pre-work risk assessment and emergency response procedure shall be in place before commencement of work;
· All construction workers shall equip with appropriate personal protective equipment (PPE) when working at the Project Site;
· Safety training and briefings shall be provided to all construction workers; and
· Regular site safety inspections shall be conducted during the construction phase of the Project.
11.5.8.2 With the implementation of the above safety management measures, potential risks to the construction workers on-site are expected to be insignificant. The construction workers are not considered as off-site population and are not taken into account in this QRA.
11.6 Frequency Analysis
11.6.1 Introduction
11.6.1.1 Frequencies for each of the identified hazardous scenarios were estimated using the best available failure data or historical accident data in the process and gas industry or failure frequencies of similar installations or events. The frequencies documented in the relevant sources were reviewed and justified as necessary to reflect the specific operation and risk reduction practices evident at the organic waste co-digestion facility.
11.6.2 Spontaneous Failures Frequencies
Digester / Gasholder / Sulphur Absorption Vessel Failure
11.6.2.1 According to Guidelines for Quantitative Risk Assessment: Purple Book, the catastrophic rupture and leak failure frequencies of digester tank / gasholder / sulphur absorption vessel are 1 x 10⁻⁵ per year and 1 x 10⁻⁴ per year respectively [10].
Aboveground Piping Failure
11.6.2.2 According to Guidelines for Quantitative Risk Assessment: Purple Book, catastrophic rupture and leak failure frequencies of aboveground piping are 1 x 10⁻⁷ per metre per year (500 mm dia.) and 5 x 10⁻⁷ per metre per year (500 mm dia.) respectively [10].
11.6.2.3 A summary of the base event frequencies is shown in Table 11.12.
Table 11.12 Summary of
Spontaneous Failures Frequencies
|
Events |
Frequency of Occurrence |
|
|
Rupture / Catastrophic Failure |
Leak / Partial Failure |
|
|
Digester |
1.00 x 10⁻⁵ per year |
1.00 x10⁻⁴ per year |
|
Gasholder |
1.00 x 10⁻⁵ per year |
1.00 x10⁻⁴ per year |
|
Sulphur
Absorption Vessel |
1.00 x 10⁻⁵ per year |
1.00 x10⁻⁴ per year |
|
Aboveground
Inlet or Outlet Piping |
1.00 x 10⁻⁷ per metre per year |
5.00 x 10⁻⁷ per metre per year |
11.6.3 External Event Frequencies
Aircraft Crash
11.6.3.1 The model takes into account specific factors such as the target area of the proposed hazard site and its longitudinal (x) and perpendicular (y) distances from the runway threshold (Drawing 11.3 refers).
|
|
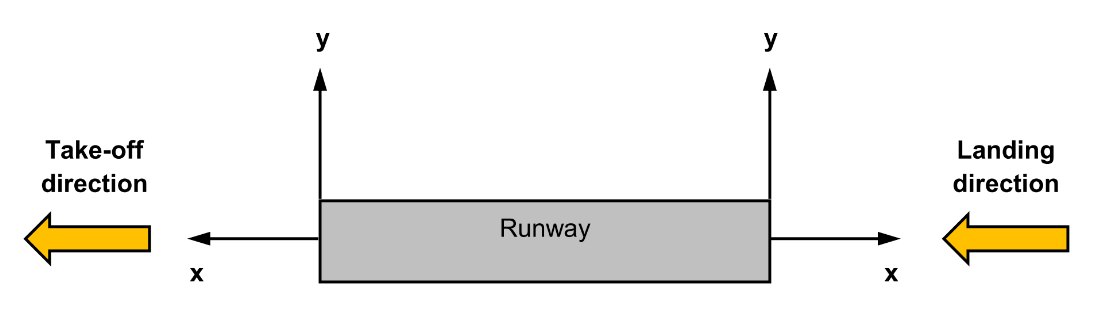
Drawing 11.3 Aircraft Crash Coordinate System
11.6.3.2 The crash frequency per unit ground area (per km2) is calculated as:
g(x,y)=NRF(x,y) (1)
where N
is the number of runway movements per year and R is the probability of
an accident per movement (landing or take-off). F(x,y)
gives the spatial distribution of crashes and is given by:
Landings
![]()
for ![]()
.
Take-off
![]()
for ![]()
.
11.6.3.3 Equations (2) and (3) are valid only for the specified range of x values. If x lies outside this range, the impact probability is zero. This case applies for 07L and 07R runways for arrival and 25L and 25R runways for departure flight path.
11.6.3.4
The probability of an accident
per movement R is interpreted from NTSB data for fatal accidents in the U.S.
involving scheduled airline flights during the period 1986 – 2010 (NTBS) . The 10-year moving
average suggested a downward trend with recent years showing a rate of about 2
x 10-7 per flight. There are only 13.5% of accidents associated with
the approach to landing, 15.8% associated with take-off and 4.2% are related to
the climb phase of the flight [20]. It is therefore assumed that the frequency
for the approach of landings is taken as 2.7x10⁻⁸ per flight and for
take-off is 4.0x10⁻⁸ per flight.
11.6.3.5 The number of runway movement of aircraft N is provided by yearly statistics of the Hong Kong International Airport (HKIA) from 2008 to 2017 [21] (Table 11.13). The number of movements at year 2030 is estimated by linear regression respectively for landing and take-off cases. The movement number for both landing and take-off adopted in the calculation has been divided by 4 to take into account that only a quarter of landing or take-off use a specific runway.
Table 11.13 Hong Kong
International Airport Civil International Air Transport Movements of Aircraft
|
Year |
Landing |
Take-off |
Total |
|
2008 |
150,577 |
150,561 |
301,138 |
|
2009 |
139,715 |
139,684 |
279,399 |
|
2010 |
153,277 |
153,257 |
306,534 |
|
2011 |
166,918 |
166,887 |
333,805 |
|
2012 |
175,861 |
175,823 |
351,684 |
|
2013 |
186,048 |
186,032 |
372,080 |
|
2014 |
195,520 |
195,488 |
391,008 |
|
2015 |
203,043 |
203,005 |
406,048 |
|
2016 |
205,793 |
205,773 |
411,566 |
|
2017 |
210,339 |
210,320 |
420,659 |
|
2030 |
340,876# |
340,854# |
681,730# |
Note:
#: based on an annual growth rate of +3.8% between 2008 and 2017 estimated by linear regression.
11.6.3.6 Only the aircraft arriving from north-east using either 25R or 25L arrival flight path as well as the aircraft departing towards northeast using either 07R or 07L departure flight path would have potential impact to the proposed YLEPP.
11.6.3.7 For the aircraft arriving from south-west using either 07R or 07L arrival flight path, the longitudinal distance from the runway is around -14km, which is much smaller than -3.275km and thus the potential impact is considered to be zero. Likewise, for the aircraft departing towards south-west using either 25R or 25L departure flight path, the longitudinal distance from the runway is around -14km, which is much smaller than -0.6km and thus the potential impact is considered to be zero.
11.6.3.8 The aircraft crash frequency was obtained by multiplying g(x,y) to the target area which was estimated to be 7.73 x 10⁻² km2 as tabulated in Table 11.14.
Table 11.14 Calculation for Aircraft Crash Frequency
|
Year |
Runway |
x (km) |
y (km) |
F(x,y) |
N (per year) |
R (per flight) |
Crash frequency
(per unit area) |
Target area (km2) |
Crash Frequency
(per year) |
|
2030 |
25R Landing |
9.6 |
16.0 |
6.4E-07 |
85219 |
2.7E-08 |
1.5E-09 |
7.73E-02 |
1.1E-10 |
|
2030 |
25L Landing |
9.2 |
17.6 |
5.6E-07 |
85219 |
2.7E-08 |
1.3E-09 |
7.73E-02 |
1.0E-10 |
|
2030 |
07R Landing |
-13.6 |
19.1 |
0 |
85219 |
2.7E-08 |
0.0E+00 |
7.73E-02 |
0.0E+00 |
|
2030 |
07 L Landing |
-13.8 |
17.5 |
0 |
85219 |
2.7E-08 |
0.0E+00 |
7.73E-02 |
0.0E+00 |
|
2030 |
07L Take-off |
9.6 |
16.0 |
1.2E-11 |
85213 |
4.0E-08 |
4.2E-14 |
7.73E-02 |
3.2E-15 |
|
2030 |
07R Take-off |
9.2 |
17.6 |
3.3E-12 |
85213 |
4.0E-08 |
1.1E-14 |
7.73E-02 |
8.8E-16 |
|
2030 |
25L Take-off |
-13.6 |
19.1 |
0 |
85213 |
4.0E-08 |
0.0E+00 |
7.73E-02 |
0.0E+00 |
|
2030 |
25R Take-off |
-13.8 |
17.5 |
0 |
85213 |
4.0E-08 |
0.0E+00 |
7.73E-02 |
0.0E+00 |
11.6.3.9 The total crash frequency was calculated to be 2.1 x 10⁻¹⁰ per year, which is much less than 1.0 x 10⁻⁹ per year. The risk of aircraft crash at the proposed YLEPP was therefore not considered further in the analysis.
11.6.3.10 As Hong Kong is situated in a region of low seismicity [14][15] and located rather far away from Circum-Pacific Seismic Belt that runs through Japan, Taiwan and the Philippines [16], the probability of earthquake occurrence at MMI VIII and higher is very low comparing with other places and is estimated to be 1.0×10⁻⁵ per year [2]. It was assumed that failure in earthquake was possible for storage tank rupture, leakage, pipeline rupture and leakage and the probability of failure in earthquake was assumed to be 0.01 [2][12].
Vehicle Impact
11.6.3.11 The overall numbers of accident involvements of Medium/ Heavy Goods Vehicles (M/HGVs) [22] in Hong Kong are tabulated in Table 11.15. The overall accident involvement rate of M/HGVs have been quite steady in recent years. The statistics indicate the overall high and medium impact accident involvement rate per million vehicle kilometre for MGV/HGVs is 0.18. The vehicle crash frequency was therefore estimated to be 1.8×10⁻⁷ per vehicle kilometre per year.
Table 11.15 Accident
Involvements of Medium / Heavy Goods Vehicles in Hong
Kong
|
Serious and Fatal Vehicle involvements of M/HGVs |
2003 |
2004 |
2005 |
2006 |
2007 |
2008 |
2009 |
2010 |
2011 |
2012 |
2013 |
2014 |
2015 |
2016 |
2017 |
Average |
|
Invol
rate: per
million veh-km |
0.79 |
0.89 |
0.89 |
0.86 |
0.82 |
0.80 |
0.76 |
0.83 |
0.91 |
0.89 |
0.87 |
0.93 |
0.86 |
0.96 |
0.94 |
0.87 |
|
Total
involvements |
1108 |
1197 |
1180 |
1155 |
1081 |
1045 |
907 |
1031 |
1 141 |
1 105 |
1 085 |
1 125 |
1 063 |
1 167 |
1 162 |
1103 |
|
Fatal involvements |
50 |
31 |
27 |
25 |
21 |
17 |
27 |
16 |
21 |
17 |
25 |
23 |
23 |
18 |
26 |
24 |
|
Serious injury involvements |
255 |
291 |
257 |
212 |
188 |
176 |
147 |
163 |
196 |
175 |
193 |
170 |
250 |
171 |
146 |
199 |
|
Fatal
vehicle involvements ratio |
4.5% |
2.6% |
2.3% |
2.2% |
1.9% |
1.6% |
3.0% |
1.6% |
1.9% |
1.5% |
2.3% |
2.0% |
2.2% |
1.5% |
2.2% |
2% |
|
Serious
injury involvements ratio |
23.0% |
24.3% |
21.8% |
18.4% |
17.4% |
16.8% |
16.2% |
15.8% |
17.2% |
15.8% |
17.8% |
15.1% |
23.5% |
14.7% |
12.6% |
18% |
|
High
impact accident involvement rate per million vehicle km |
0.04 |
0.02 |
0.02 |
0.02 |
0.02 |
0.01 |
0.02 |
0.01 |
0.02 |
0.01 |
0.02 |
0.02 |
0.02 |
0.01 |
0.02 |
0.02 |
|
Medium
impact accident involvement rate per million vehicle km |
0.18 |
0.22 |
0.19 |
0.16 |
0.14 |
0.13 |
0.12 |
0.13 |
0.16 |
0.14 |
0.15 |
0.14 |
0.20 |
0.14 |
0.12 |
0.16 |
11.6.3.12 A summary of the base event frequencies is presented in Table 11.16.
Table 11.16 Summary of Base
Event Frequencies
|
Events |
Frequency of Occurrence |
|
Aircraft Crash |
2.1x10⁻¹⁰ per year# |
|
Earthquake |
1.0×10⁻⁵ per year |
|
Vehicle Impact |
1.8×10⁻⁷ per vehicle-km per year |
Note:
#: The frequency is much less than 1.0 x 10⁻⁹ per year, hence the risk of aircraft crash at the proposed YLEPP was not further considered in the analysis.
11.6.4 Fault Tree Analysis
11.6.4.1 Fault Tree Analysis (FTA) was conducted to evaluate the frequencies of the identified biogas release scenarios. FTA is the use of a combination of simple logic gates, “AND” and “OR” gates, to synthesise a failure model of the biogas facilities. Fault Tree Analysis for Scenario 1 and Scenario 2 are shown in Appendix 11.4A and Appendix 11.4B respectively. The assumptions used in FTA are summarised in the following Table 11.17.
Table 11.17 Assumptions used
in Fault Tree Analysis
|
Items |
Assumed Value |
Justification |
|
Length of access
road |
0.65 km |
Measured from
the site plan (Figure 11.1
refers). |
|
No. vehicle
movements per day |
5 |
Only the general
routine maintenance vehicles will travel close to the organic waste
co-digestion facility. |
|
Probability of
vehicle running into gasholder / digesters / absorption vessels / pipelines |
0.5 |
With reference
to approved EIA report of the OWTF Phase 2 [2], and based on the fact that
concerned process vessels are only at one side of the road. |
|
Probability of
vehicle causing damage to gasholder / digesters / absorption vessels /
pipelines |
0.5 |
With reference
to approved EIA report of the OWTF Phase 2 [2]. |
|
Probability
pipeline rupture failure in car crash |
0.1 |
With reference
to approved EIA report of the OWTF Phase 2 [2]. |
|
Probability
pipeline leak failure in car crash |
0.9 |
With reference
to approved EIA report of the OWTF Phase 2 [2]. |
11.6.5 Ignition and Explosion Probability
11.6.5.1 In general, the probability of immediate or delayed ignitions depends on the scale of release, the presence and location of ignition sources, and the weather conditions.
11.6.5.2 Possible ignition sources include hot surfaces, static electricity, flame and hot particles from external fire etc. [23]. The ignition probabilities are further split between immediate ignition and delayed ignition in equal proportions [2]. Immediate ignition of biogas could lead to a fireball or jet fire, whereas delayed ignition could cause a flash fire or vapour cloud explosion. Table 11.18 shows the total ignition probabilities and explosion probabilities according to gas release size [23].
Table 11.18 Ignition and
Explosion Probabilities for Gas Releases
|
Release Size |
Ignition Probability |
Explosion Probability |
|
Minor (< 1
kg/s) |
0.01 |
0.04 |
|
Major (1 – 50
kg/s) |
0.07 |
0.12 |
|
Massive (> 50
kg/s) |
0.3 |
0.3 |
11.6.5.3 Event Tree Analysis (ETA) was developed to determine the possible hazard event outcomes from the identified hazardous events and to estimate the hazard event frequencies from the initiating release frequency. Event Tree Analyses are shown in Appendix 11.5A and Appendix 11.5B for Scenario 1 and Scenario 2 respectively.
11.6.6 Estimating Generic Frequencies
11.6.6.1 Generic frequency was estimated based on the historical incidents review identified the accidents involving generation, transfer, storage and use of biogas or methane, anaerobic digesters or facilities of similar nature. The generic accident frequency can be estimated through the information of the number of biogas plants works involved, the operating period and the total number of accidents occurred within the operating period. The objective of the generic frequency estimation is to confirm the appropriateness of adopting generic failure frequencies for this hazard assessment.
11.6.6.2 The generic frequencies estimated based on European experience were 1.73x10⁻⁴ incident per plant-year [2], whilst the overall failure frequency for organic waste co-digestion facility is 2.40 x10⁻³ (according to FTA shown in Appendix 11.4B), which is greater than the estimated value from the European historical incidents. The failure frequencies adopted for the facility in this hazard assessment were therefore considered reasonably conservative.
11.7 Consequence and Impact Analysis
11.7.1 Introduction
11.7.1.1 Consequence and impact analysis is conducted to provide a quantitative estimate of the likelihood and number of deaths associated with the range of possible outcomes (i.e. fireball, jet fire, flash fire etc.) which are resulted from failure cases identified. The consequence assessment consists of two major parts, including:
· Source term modelling – to determine the appropriate discharge models to be used for calculation of the release rate, duration and quantity of the release; and
· Effect modelling – to determine dispersion modelling, fire modelling and explosion modelling from the input of source term modelling.
11.7.1.2 Releases from hazardous sources and their consequences were modelled using PhastRisk 6.7.
11.7.2 Source Term Modelling
11.7.2.1 For instantaneous failure, the whole content release of a tank is modelled. In case of continuous release, release parameters such as release rate and exit velocity are calculated by a discharge model according to storage conditions. Release duration is based on capacity of the storage tank [2]. For piping connecting to the storage tank, release duration is based on the time to empty the whole tank gas content for anaerobic digesters and the response time to completely isolate the gasholder. Release parameters together with release duration are then fed into the dispersion model to calculate the effect. Process vessel, piping and storage vessel would be the major release sources.
11.7.3 Potential Hazardous Outcomes and Effect Modelling
11.7.3.1 This section gives a brief description of the physical effects models used in the study to assess the effects zones for the following hazardous outcomes in case of loss of containment at the co-digestion facility
Gas Dispersion / Flash Fire
11.7.3.2 Since biogas is lighter than air, its releases will tend to rise rapidly due to the buoyancy nature of the gas under atmospheric conditions. They will propagate and be diluted as a result of air entrainment with the influence of wind. The Unified Dispersion Model (UDM) model is used for the dispersion calculation of biogas for non-immediate ignition scenarios. The model takes into account various transition phases, from dense cloud dispersion to buoyant passive gas dispersion, in both instantaneous and continuous releases.
11.7.3.3 The principal hazard arising from a cloud of dispersing biogas is the delayed ignition of the flammable cloud that cause a flame to flash back to the release location and develop into a stable jet or crater fire. Large scale experiments on the dispersion and ignition of flammable gas clouds show that ignition is unlikely when the average concentration is below the Lower Flammable Limit (LFL) or above the Upper Flammable Limit (UFL).
11.7.3.4 Major hazards from flash fire are thermal radiation and direct flame contact. It is considered that there is no scope for escape within the LFL of a flammable cloud in a flash fire. Therefore, a fatality probability of 100% of persons present within the flammable cloud is assumed for flash fires.
Fireball
11.7.3.5 The release rate following a rupture, if ignition was immediate, would be too high to give a stable flame, and the initial ‘quasi instantaneous’ release is characterised as a fireball. The fireball is limited to a maximum duration of 30 seconds. The combustion would develop into a stable jet fire once the instantaneous release has been burnt and the release rate has become sufficiently steady for a flame to stabilise as stated by Bilo and Kinsman [24]. A release from a hole, if ignited, gives a stable flame close to the hole and produces a jet fire.
11.7.3.6 Due to the large size and intensity of a fireball, its effects are not significantly influenced by weather or wind direction. The principal hazard of fireball arises from thermal radiation. The thermal radiation from a fireball at given distances from the fireball centre are estimated using the PhastRisk’s built-in fireball modelling suite in which TNO model and HSE model are adopted. The modelling suite is set such that it decides the most appropriate one in the effect modelling. Sizes, height, shape, duration, heat flux and radiation are determined in the consequence analysis. A 100% fatality is assumed for anyone within the fireball radius.
Jet Fire
11.7.3.7 A jet fire occurs following the ignition and combustion of a pressurised flammable gas, which burns close to the release source. The jet fire which follows the fire ball is assumed to be directed vertically upwards out of the crater. The jet fire shape is the frustum of a cone and the location and orientation of the frustum are dependent on a number of factors such as release rate and wind speed.
11.7.3.8 Combustion in a jet fire occurs in the form of a strong turbulent diffusion flame that is strongly influenced by the initial momentum of the release. The principal hazards from a jet fire are thermal radiation and the potential for knock-on effects. Jet fires also dissipate thermal radiation and causes casualty and damage to the population and property nearby. The thermal effect to adjacent population is quantified in the consequence model.
Vapour Cloud Explosion
11.7.3.9 A vapour cloud explosion can occur when a flammable vapour is ignited in a confined or partially confined situation. When there is a large amount of pressurised gas rapidly releasing to the atmosphere from a pressurised tank, a vapour cloud could be formed, dispersed and mixed with the surrounding air. If the vapour cloud is passing through a confined / semi-confined environment and gets ignited, the confinement could limit the degree of expansion of the burning cloud and create an overpressure and explosion.
11.7.3.10 The risk model will accounted for the VCE hazard according to probabilities for delayed ignition in consequence modelling. The program models the delayed ignition effect by considering the flammable cloud area and location of ignition sources at each time step. Potential damage from a VCE is caused by overpressure.
11.7.3.11 Hazardous consequences, such as jet fire, flash fire, etc. were assessed using PHAST’s consequence models. Fatality probabilities of various hazardous event outcomes were evaluated at a number of end-point criteria in each type of hazard outcome. The estimation of the fatality/ injury caused by a physical effect such as thermal radiation or overpressure requires the use of probit equations, which describe the probability of fatality as a function of some physical effect. The probit is an alternative way of expressing the probability of fatality and is derived from a statistical transformation of the probability of fatality.
11.7.3.12 The probability of fatality, Pr, due to exposure to heat radiation, i.e. jet fire and fireball is given by the following probit relationship by Eisenberg et al. which provides one of the more conservative estimates [25]:
![]()
Where,
Pr is the probit associated
with the probability of fatality;
Q is the heat
radiation intensity (kW/m2);
t is the exposure
time (s).
Overpressure
11.7.3.13 The probability of fatality due to overpressure is taken from CIA guidelines [27] as shown in Table 11.19. The indoors fatality probability is higher taken into account the increased risk from flying debris such as breaking windows [11].
Table
11.19 End Point Criteria for Vapour Cloud Explosions
|
Overpressure
(psi) |
Fatality
Probability (Outdoors) |
Fatality
Probability (Indoors) |
|
5 |
0.09 |
0.55 |
|
3 |
0.02 |
0.15 |
|
1 |
0.00 |
0.01 |
11.8 Risk Evaluation
11.8.1 Introduction
11.8.1.1 By combining the population data, meteorological data, results of frequency estimation and consequence analysis, risk levels due to the operation of the organic waste co-digestion facility at the proposed YLEPP are assessed and evaluated in terms of both individual and societal risks.
11.8.1.2 Individual risk is a measure of the risk to a chosen individual at a particular location. As such, this is evaluated by summing the contributions to that risk across a spectrum of incidents which could occur at a particular location.
11.8.1.3 Societal risk is a measure of the overall impact of an activity upon the surrounding community. As such, the likelihoods and consequences of the range of incidents postulated for that particular activity are combined to create a cumulative picture of the spectrum of the possible consequences and their frequencies. This is usually presented as an F-N curve and the acceptability of the results can be judged against the societal risk criterion under the risk guidelines.
11.8.2 Individual Risk
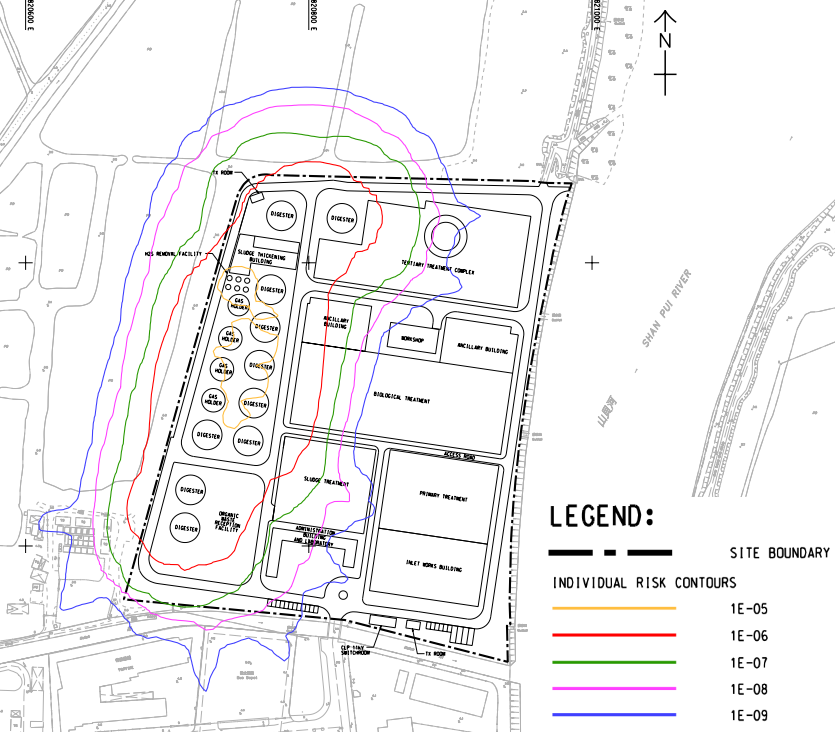
11.8.2.1 The individual risk (IR) contours associated with the organic waste co-digestion facility at the proposed YLEPP for Scenario 1 and Scenario 2 are shown in Drawing 11.4 and Drawing 11.5 respectively. The risk levels were estimated based on 100% occupancy with no allowance made for shelter or escape, which can be referred from the user manual of PhastRisk.
11.8.2.2 Individual risk contours down to the level 1×10⁻⁹ per year are shown in the drawing. The level 1×10⁻⁵ per year individual risk contour is confined entirely within the boundary of the YLEPP, i.e. the boundary of the existing YLSTW, for both Scenario 1 and Scenario 2. The maximum individual risk remains below 1×10⁻⁵ per year at the site boundary and meets the HKRG requirements.
|
|
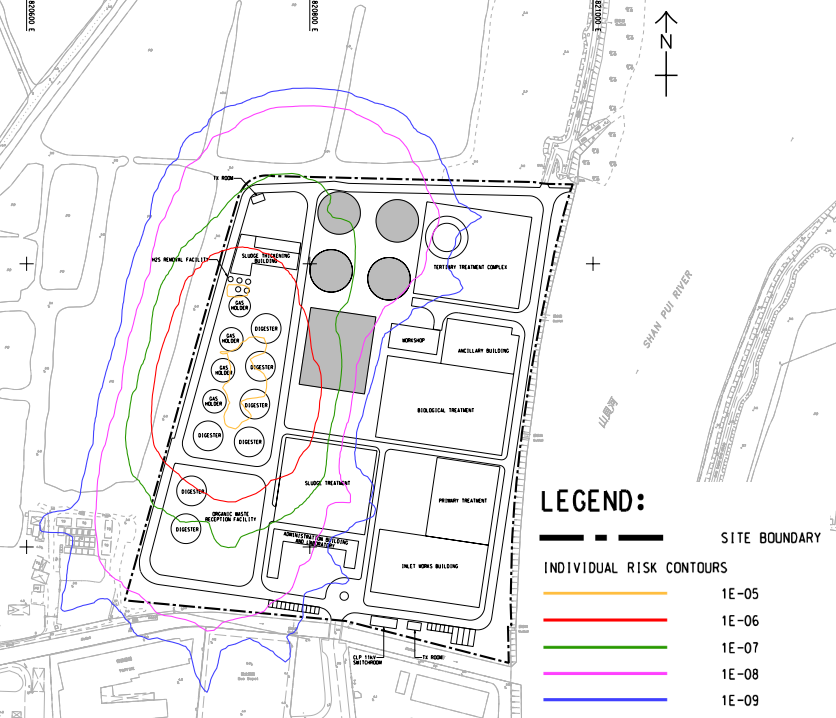
Drawing 11.4 Individual Risk Contours for Scenario 1
|
|
Drawing 11.5 Individual Risk Contours for Scenario 2
11.8.3 Societal Risk
11.8.3.1 The societal risk results for Scenario 1 and Scenario 2 at the proposed YLEPP are presented in Drawing 11.6 in form of F-N curves for comparison with the HKRG.
|
|
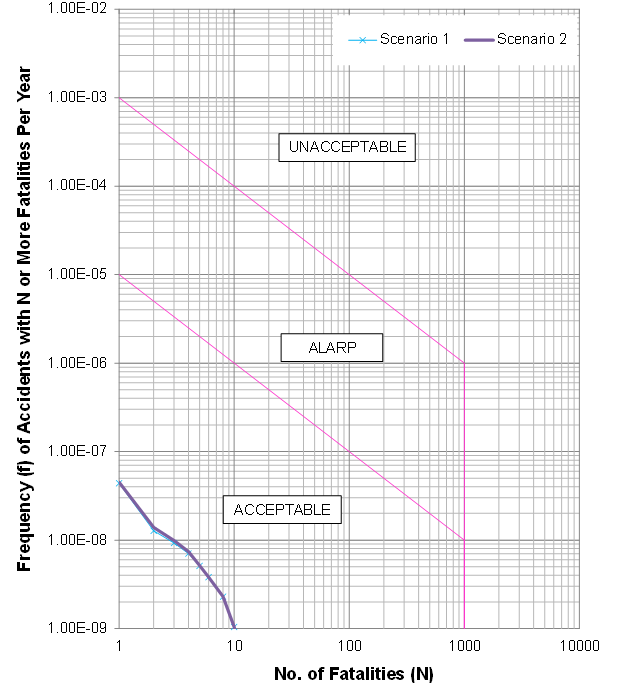
Drawing 11.6 Societal Risk Curve for YLEPP
11.8.3.2 The societal risks are low and within the “Acceptable” region. The potential loss of life (PLL) for the facility was estimated to be 9.15×10⁻⁸ per year and 9.51×10⁻⁸ per year, for Scenario 1 and Scenario 2 respectively.
11.9 Recommendations
11.9.1.1 While the risks associated with organic waste co-digestion facility are within the acceptable region and no mitigation measures are required, it is still advisable for the following good safety practices and recommended design measures to be followed for the design and operation of the facility as far as practicable:
· all electrical equipment inside the building should be classified in accordance with the electrical area classification requirements. No unclassified electrical equipment should be used during operations or maintenance;
· all safety valves should be designed to discharge the released fluid to a safe location and stop misdirection of fluid flows in order to avoid hazardous outcome;
· safety markings and crash barriers should be provided to the aboveground piping, digesters and gas holders near the entrance;
· fixed crash barriers should be provided in areas where process equipment is adjacent to the internal roadway to protect against vehicle collision. Adequate warning signage and lighting should also be provided and maximum speed limit should also be in place; and
· lightning protection installations should be installed following IEC 62305, BS EN 62305, AS/NZS 1768, NFPA 780 or equivalent standards;
· suitable fire extinguishers should be provided within the site. An External Water Spray System (EWSS) should be installed in appropriate areas, such as around the gasholders, digester and sulphur removal vessels. The facilities should also be equipped with fire and gas detection system and fire suppression system; and
· stringent procedures should be implemented to prohibit smoking or naked flames to be used on-site.
11.9.1.2 The following safety measures should be considered to further management and minimize the external hazards from construction activities risk during construction phases of the Project. With the implementation of the following safety measures, the failure frequencies associated with the construction activities should be well covered by the general failure frequencies summarized in Section 11.6.
· ensure speed limit enforcement is specified in the contractor’s method statement to limit the speed of construction vehicles on-site;
· conduct speed checks to ensure enforcement of speed limits and to ensure adequate site access control;
· a lifting plan, with detailed risk assessment, should be prepared and endorsed for heavy lifting of large equipment;
· vehicle crash barriers should be provided between the construction site and the operating biogas facilities;
· ensure that a hazardous are classification study is conducted and hazardous area maps are updated before the start of the construction activities to ensure ignition sources are controlled during both construction and operation phases;
· ensure work permit system for hot work activities within the Project Site is specified in the contractor’s method statement to minimize and control the ignition sources during the construction phase;
· ensure effective communication system / protocol is in place between the contractors and the operation staff;
· ensure the Project Construction Emergency Response Plan is integrated with the Emergency Response Plan for the YLEPP during construction phase. The plan should address stop work instructions to be promptly communicated to all construction workers performing hot works in case a confirmed biogas detection at the Project Site;
· ensure that the construction activities do not impede the functions of fire and gas detection system, fire protection system, muster areas, fire-fighting vehicle access and escape routes; and
· ensure a Job Safety Analysis is conducted for construction activities of the Project during the construction phase, to identify and analyze hazards associated with the construction activities (e.g. lifting operations by cranes) onto the operating biogas facilities. Potential risks of the construction activities shall be assessed, and risk precautionary measures shall be implemented in Contractor’s works procedures.
11.10 Conclusion
11.10.1.1 A quantitative hazard assessment was conducted to evaluate the biogas risk to existing, committed and planned off-site population due to operation of the organic wastes co-digestion facility at the proposed YLEPP in accordance with Section 3.4.8 and Appendix I of the EIA Study Brief (ESB-309/2018).
11.10.1.2 Both the individual and societal risk levels were found to meet relevant requirements stipulated in the HKRG, i.e. the off-site individual risk level is far below 1×10⁻⁵ per year and the societal risk falls into the “Acceptable” region, no mitigation measure is required.
11.11 Reference
[1] Environmental Protection Department. (2009). Environmental Impact Assessment for Organic Waste Treatment Facilities, Phase I (Register No.: AEIAR-149/2010). Prepared by AECOM.
[2] Environmental Protection Department. (2013).
Environmental Impact Assessment for Organic Waste Treatment Facilities, Phase 2
(Register No.: AEIAR-180/2013). Prepared by Mott MacDonald.
[3] Jørgensen,
P. J. (2009). Biogas-green energy. Faculty of Agricultural Sciences, Aarhus
University.
[4] Not Used.
[5] “Projection
of Population Distribution 2018-2026”. Planning Department, HKSAR. 8 June 2018.
https://www.pland.gov.hk/pland_en/info_serv/statistic/wgpd18.html
[6] HKPSG
[7] Civil
Engineering and Development Department (2008). Environmental Impact Assessment
for Kai Tak Development V (Register No.: AEIAR-130/2009). Prepared by Maunsell
Consultants Asia Ltd.
[8] Drainage
Services Department (2004). Environmental Impact Assessment for Tai Po Sewage
Treatment Works Stage V (Register No.: AEIAR-081/2004). Prepared by Maunsell
Consultants Asia Ltd.
[9] “Annual
Traffic Census 2017” Transport Department, HKSAR. August 2018.
https://www.td.gov.hk/filemanager/en/content_4915/annual%20traffic%20census%202017.pdf
[10] TNO
(2005). Guidelines for Quantitative Risk Assessment: Purple Book, CPR 18E.
Committee for the Prevention of Disasters, the Netherlands.
[11] ASD
Biodiesel (Hong Kong) Limited. (2008). Environmental Impact Assessment for
Development of a Biodiesel Plant at Tseung Kwan O Industrial Estate (Register
No.: AEIAR-131/2009). Prepared by Environmental Resources Management.
[12] Byrne, J.
P. (1997). The calculation of aircraft crash risk in the UK, HSE\R150.
Health and Safety Executive.
[13] Tierney,
K. J., & Anderson, R. (1990). Risk of hazardous materials release following
an earthquake. Preliminary Paper #152. University of Delaware, Disaster
Research Centre,
[14] Geotechnical
Engineering Office. (12002). Seismic hazard analysis of the Hong Kong region.
GEO Report No. 65, Geotechnical Engineering Office, Government of the Hong Kong
SAR.
[15] Geotechnical
Control Office. (1991). Review of Earthquake Data for the Hong Kong Region. GCO
Publication No. 1/91, Civil Engineering Services Dept., Hong Kong Government.
[16] “Chance
of a Significant Earthquake in Hong Kong” Hong Kong Observatory, HKSAR. 21
March 2018. https://www.hko.gov.hk/gts/equake/sig_eq_chance_e.htm
[19] Not Used.
[18] Not Used.
[20] Aviation
Statistical Reports, US National Transportation Safety Board.
[21] “Air
Traffic Statistics.” Civil Aviation Department, HKSAR. 12 November 2018.
https://www.cad.gov.hk/english/statistics.html
[22] “Road
Traffic Accident Statistics.” Transport Department, HKSAR. 10 July 2018.
www.td.gov.hk/en/road_safety/road_traffic_accident_statistics/index.html.
[23] Mannan,
S. (Ed.). (2005). Lees' loss prevention in the process industries.
Butterworth-Heinemann.
[24] Bilo, M.,
& Kinsman, P. (1997). MISHAP-HSE's pipeline risk-assessment methodology.
Pipes and Pipelines International, 42(4), 5-12.
[25] Eisenberg,
N. A., Lynch, C. J., & Breeding, R. J. (1975). Vulnerability model. A
simulation system for assessing damage resulting from marine spills. Enviro
control inc rockville md.
[26] Van
Wingerden, K., Van Den Berg, B., Van Leeuwen, D., Mercx, P., & Van Wees, R.
(1994). Guidelines for Evaluating the Characteristics of Vapor Cloud
Explosions, Flash Fires, and BLEVES. Center for Chemical Process Safety,
American Institute of Chemical Engineers, ISBN 0-8169-0474-x, New York, NY.
[27] UK
Chemical Industries Association. (1998). Guidance for the location and design
of occupied buildings on chemical manufacturing sites. Kings Building,
Smith Square, London SW1 P 3JJ ISBN, 1(85897), 0776.
[28] TNO
(1997). Methods for the Calculation of Physical Effects: Due to Releases of
Hazardous Materials (liquids and Gases),'Yellow Book'. CPR 14E. TNO BCommittee
for the Prevention of Disasters.
[29] Kinsella, K. G. (1993). A rapid assessment methodology for the prediction of vapour cloud explosion overpressure. In Proceedings of the International Conference and Exhibition on Safety, Health and Loss Prevention in the Oil, Chemical and Process Industries.