Long
Valley – Dry Season Monitoring programme
1.1
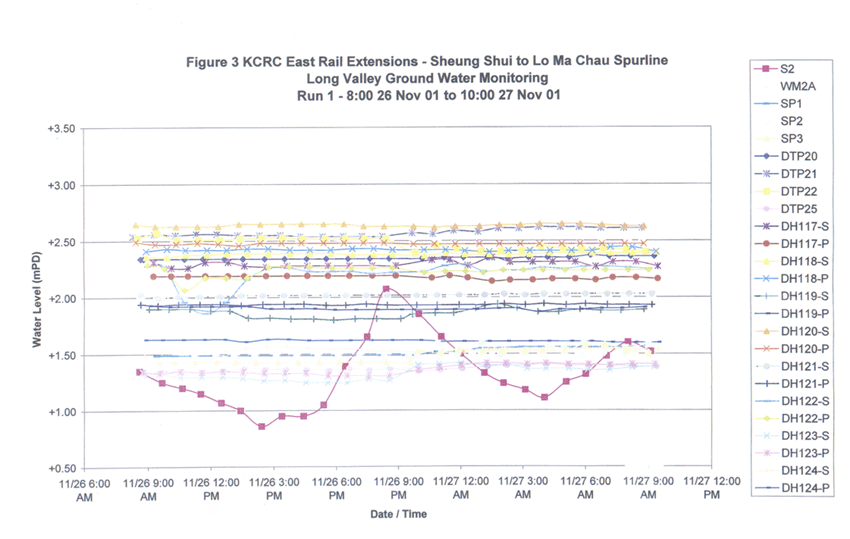
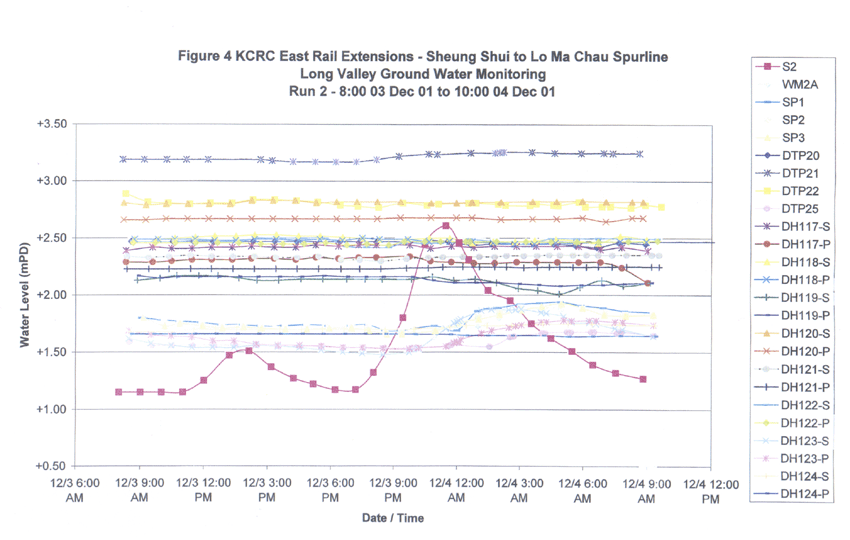
In order to maximise discovery of the transient tidal effects on the
groundwater within the main alluvial aquifer in Long Valley, a 26 hr programme
of Neap and Spring tide cycle observations was arranged amongst the 13
standpipe piezometers and 8 piezometers. Neap Tide observations were ordered on
26/27th November 2001 and Spring tide on 3/4th December:
·
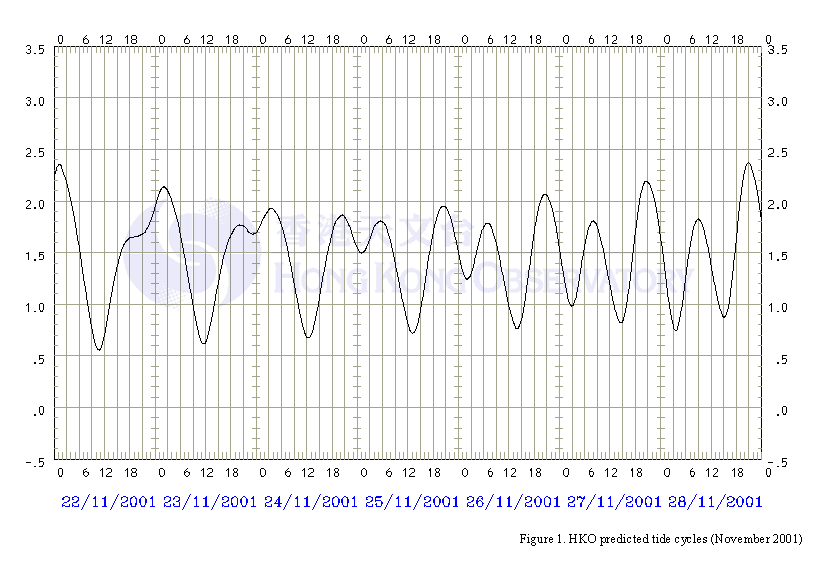
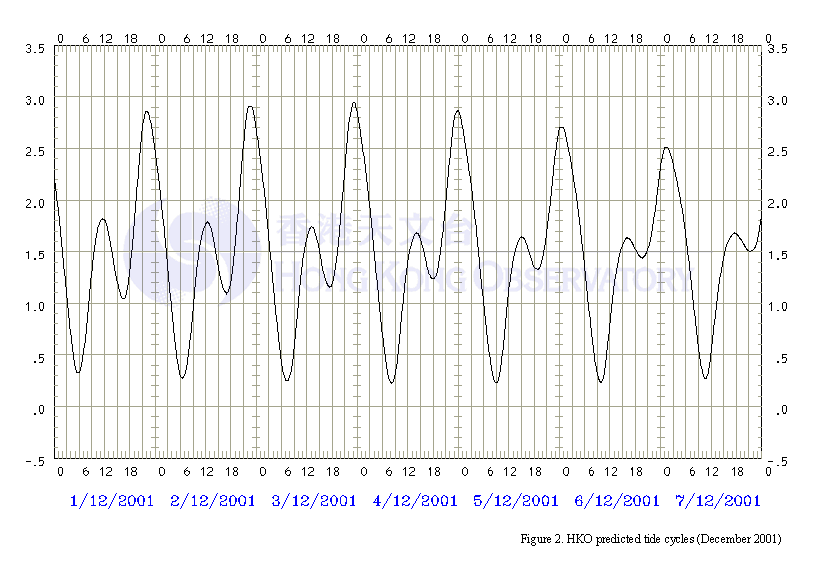
The HKO predicted tide cycles are shown in Figs
1 &2.
·
The actual plotted tidal and peizometric observations in Figures
3 & 4.
·
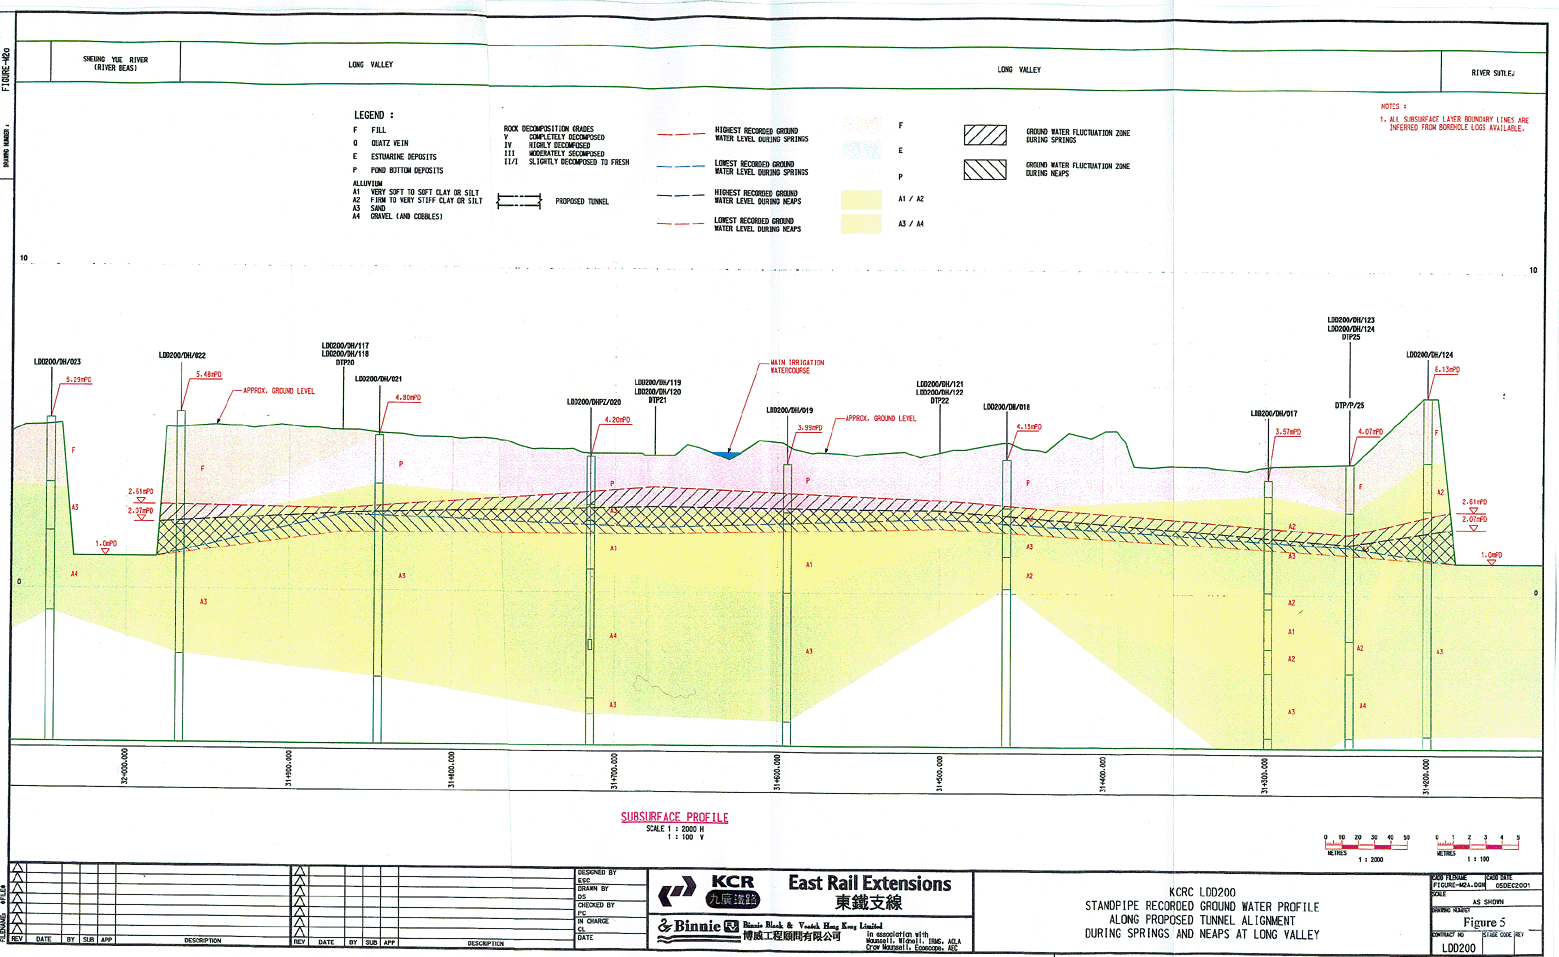
The preliminary analysis of the measured variation in dry season groundwater
levels in the main alluvial aquifer for the combined Neap and Spring tides
is given on Figure 5. The groundwater
regime across a 200m wide band centred on the railway is characterised.
1.2
Each period of peizometer reading was coupled with general observations
of other non-tidal stimuli in order to build up a picture of the groundwater
regime for normal agricultural operations within Long Valley. These outside
influences include:
· Temporary deflation of AFCD fabridam and alternative bypass pumping, (daytime only);
· Pumped irrigation supply from the main River and the new River Beas wetland;
· Temporary pumping from individual private wells;
· Temporary daytime pumping from the irrigation channel and cascade flooding of fields/ponds; and
· Consequences of major coffer dam blocking 80% of the main channel at the confluence with the River Indus (Spring Tide).
1.3
Tables A3.2.1 and A3.2.2 present the accompanying field notes for parts
of the monitoring period to demonstrate some of the varied influencing factors.
Table A3.2.1
Long Valley – Neap Tide – 26th /27th
November
|
AFCD Fabridam deflated and a single 8inch pump in
action feeding the irrigation system in its stead; |
|
Visit to WSD
fabridam/entrance of River Indus revealed a temporary channel works situation
with a major Coffer dam/bund. 80% of River Beas / Sutlej blocked off but
tidal regime still in place. |
|
Floor of
channel exposed above Ho Sheung Heung footbridge. Perforated channel floor
bleeding rust coloured groundwater upon retreat of the tide; |
|
Herons, Great
Egrets feeding in the mud deposited on the combined channel floor. More than
a dozen birds standing within the mud bottom at 100 to 150 m of the main
construction activity. East Rail passenger trains to Lo Wu run alongside the
eastern bund and delivery of goods train, laden with pigs to the Sheung Shui
Abattoir, also in evidence. Disembarking pigs present the most disturbing and
noisy aspect of the whole scenario. Construction activity on both banks with
movements of mixer trucks and dump trucks and backhoe excavation and loading
activity within the coffer dam. Large rip-rap also being tipped and placed
within the bunded area of combined channel floor. |
|
Also, Little
Egrets feeding on Beas Channel floor within 50 m of filling and spreading
activity at the top of the channel bund. |
|
Farmers using
several submersible pumps to lift irrigation water from the central channel
to supply water spinach beds above new tunnel alignment. Groundwater table
lower at the eastern side of Long Valley with substantial shrinkage cracks in
the fields (several metres long by 20 – 40mm wide and up to 200mm deep.) |
Table A3.2.2
Long Valley – Spring Tide –
3rd/4th December
Field Notes - Inspection at
16.30 to 18.00hrs
|
AFCD Fabridam
deflated, but a single 8inch pump delivering to the irrigation system; |
|
Ying Kong
covered channel bifurcation. Flow 90% directed to Long Valley; The other 10%
escaping through perforated weir towards one of the main channel wetlands. |
|
Natural
watercourse leading to Long Valley has been newly cleared of vegetation and
channel dug out in places to promote flow; |
|
Adjacent to Beas
River- Farmers observed using two submersible pumps in new wetland as their
source; |
|
Pumps in Long
Valley watercourse present but not in service. Marsh area remains flooded and
the well drowned. Lots of evidence of irrigation water having been used earlier
in the day with many of the fields still waterlogged and normally dry
channels showing signs of usage; |
|
Almost all
fields on the rail tunnel alignment have gone into service. Fallow and
totally overgrown plots are now all cleared and newly planted; |
|
Major channel
construction at north end immediately upstream of WSD fabridam. Channel floor
completion works entail coffer dam/bund across 80% of the width of the
channel and some 150m length. Tidal flow quite restricted. Coffer dam
purposely breached at 17.00 hrs by backhoe to flood the new floor and
presumably feed flows back up the River Indus towards Ping Che; Ebb tide from
Beas and Sutlej wholly diverted up the River Indus. |
|
Inspection at 23.00 to
00.30hrs |
|
AFCD Beas
Fabridam deflated and pump switched off; No flow in irrigation channel across
Long Valley, residual flow draining back to wetland; |
|
WSD Fabridam
area large proportion of the incoming tide feeding towards River Indus, but
Sutlej and Beas also rising. Heavily restricted flow and head loss in coffer
dam channel; |
|
High tide
occurred at approx 23.15 and reached top of Ho Sheung Heung bridge flap valve
plus 50mm. Tideflood and ebb very sharp. Coffer dam restricted flow; |
|
Met piezo
dipping teams and took a preliminary view of results. Response to overnight
high tide will be the key; No noticeable response to small tidal peak during
the day; |
|
Dogs barking
but not a hazard to piezo ops; |
|
Large numbers
of herons and great egrets flying as a consequence of disturbance by piezo
team and the undersigned; Flying typically in groups of 8 to 12 and sighted
mainly over the two drainage channels; |
|
Long Valley
extremely well lit by reflected street lighting and abattoir flood lighting.
Hand torches only necessary to read piezometer cable marking; Farmers also cropping
at midnight under flood lights. |
1.4
In the centre of Long Valley the influence of the tide is not as great
as that from the irrigation channel crossing the Valley from Beas to Sutlej.
The measured groundwater levels vary by as much as 1.5 m over a 10 days period
in the centre of the valley. In the east and west extremities the groundwater
level variation is less pronounced being typically 0.7 and 0.8m. The combined
plot in Figure 5 gives a reasonable low
water Neaps (Dry Season) boundary/envelope for the main aquifer.
1.5
The bottom of the dry season groundwater envelope is the key controller
necessary to safeguard the wetland ecology and the agricultural practices. This minimum groundwater envelope must not
be compromised by the tunneling works. The production piezometer monitoring
programme needed to uphold this criteria is set out in Table A3.2.3.
Table A3.2.3
Long Valley Tunnel Works
|
Piezometer Monitoring |
|
Groundwater
levels in Long Valley are to be monitored across the four sections defined in
the EIA/EM&A. Each section or gate comprises 3 boreholes and 5
piezometers (2 discrete piezometers and 3 standpipes); |
|
Environmental
controls on groundwater during the tunnelling contract require the following
periods of monitoring: Baseline ·
Baseline controls each year, or as directed by the Engineer; – a full
suite of hourly monitoring across all 20 instruments for a 26 hour period,
wet and dry season, spring and neap tides. Concurrently, tidal reference
shall also be taken hourly from the Beas River footbridge opposite Ho Sheung
Heung for each of the four monitoring periods; ·
On the basis of the four sets of results the Engineer will define an
acceptable baseline groundwater envelope for each of the four sections, for
the two seasons and two tides. Production ·
Production Monitoring – As each tunnel drive approaches one of the
four piezometer gates, daily monitoring of all 5 piezometers and the tide
will commence; ·
Daily piezometer monitoring, at a time of day to be agreed with the
Engineer, will be required throughout the whole period when any part of the
TBM lies within +/- 50m of the gate in plan; Part of the TBM shall be defined
as the length lying between the cutter face and the first whole fully
completed segment of permanent tunnel lining; ·
The frequency of monitoring may be increased, as directed by the
Engineer, should the monitored groundwater levels step outside the defined
acceptable groundwater envelope for the particular gate, season and tide; ·
Additional ad hoc piezometer monitoring may be ordered by the
Engineer, if any form of recharge is required to restore the local
groundwater to the acceptable envelope or that any part of the Action Plan
(as defined in the EIA) has to be invoked as a consequence of the passage of
the tunnel drive. Post Production ·
After full passage of the TBM through the piezo-gate, Post production
groundwater monitoring may be required to be undertaken weekly, for a period
of 6 weeks, or as directed by the Engineer. |
1.6
The upper limit line of the dry season groundwater envelope has not
been truly defined because the cofferdam facilitating the reconnection of the
River Indus has curtailed the maximum water level in the Beas and Sutlej during
the two reading periods. The Spring tide top water level was about 0.35m below
expectations.
Provisional Dry Season Groundwater Level Action and Limit levels
1.7
The provisional dry season absolute lower limit line for arresting any
adverse effects of groundwater lowering in the main alluvial aquifer should
be set at the bottom of the groundwater envelope shown in Figure
5. In order to adequately control the works:
·
The action line for commencement of groundwater augmentation in
consultation with the Long Valley farmers should be set at 0.3m above this
limit line.
·
Notification for preparation to augment water supply and take
groundwater re-charge actions as described in the Action Plan should be set at
0.5m above the absolute limit line.
1.8
Prior to commencement of tunneling operations a field sensitivity check
should be run of the consequences for the groundwater regime of pre-emptive
changes to the irrigation regime. Typically, an understanding should be
achieved of the likely groundwater response over a three day period of the
following:
·
Doubling of the flow in the irrigation channel by increasing the
impounding level of the AFCD dam and adjustment of flows in the channel by
changing the sluice valve settings;
·
Pumping from the main irrigation channel and maintaining standing water
levels in various combinations of the fallow fields;
·
Direct pumped re-charge to existing wells close to the tunnel
alignments
1.9
A re-run of the piezometer monitoring programme when the rivers are
fully operational at the end of the dry season is required to confirm these
provisional groundwater Action and Limit levels. A suite of wet season Spring
and Neap readings will need to be run in July 2002.
2.1
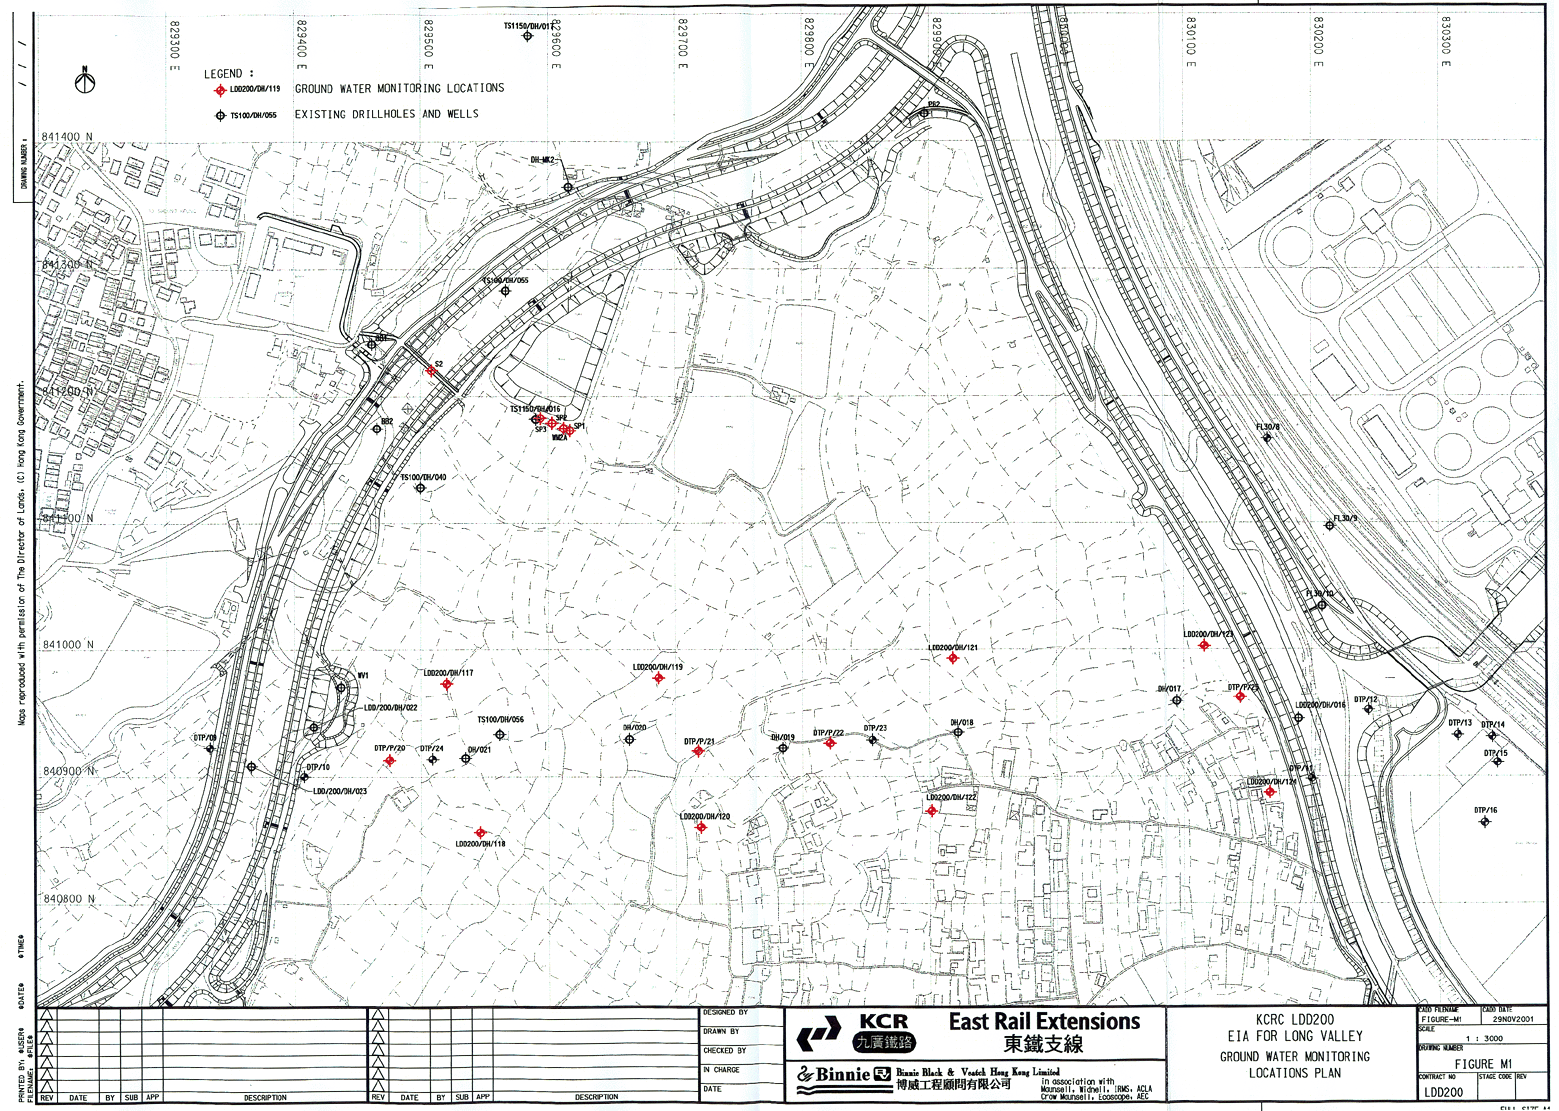
In October / November 2001, 14 drillholes, DTP/20 to 25 and LDD200/DH/117
to 124, were sunk at location in close proximity to the 4 representative sections
across the tunnel alignment within Long Valley. Locations of these drillholes
are shown in Figure M1 of appendix A3.2b.
2.2
Drillholes DTP/20 to 25 are located along the center line of the tunnel
alignment. The drillholes were sunk to 5m below Grade III or better rock. U100
or Mazier soil samples were collected at 2m interval. Permeability tests were
carried out in drillholes DTP/(P)/20 to 22 and 25 at the alluvial and CDV
layers. Standpipe piezometers were installed in these drillholes at the
alluvial layer. Drillholes DTP/(P)/20 to 24 revealed sandy/silty/gravelly
alluvial materials overlain by Fill. Drillhole DTP/P/25 revealed interbedded
layers of sandy/clayey and silty/clayey alluvial materials overlain by Fill.
Underneath the alluvial materials is completely decomposed volcanic tuff.
2.3
Drillholes LDD200/DH/117 to 124 are located at 60m, with 4 drillholes
on each side of the future tunnel alignment. The drillholes were sunk to 1m
below Grade III or better rock. Mazier soil samples were collected at 2m
interval. Permeability tests were carried out, in all the drillholes, at the
Alluvial and CDV layer. Standpipes and piezometers were installed in these
drillholes for ground water monitoring. Drillholes LDD200/DH/121 revealed
interbedded layers of sandy/clayey and silty/clayey alluvial materials.
Drillholes LDD200/DH/117, 118 & 122 revealed sandy/gravelly alluvial
materials overlain by Fill and Estuarine deposits. LDD200/DH/121 revealed
sandy/gravelly alluvial materials overlain by residual soil. LDD200/DH/124
revealed fill overlying silty and sandy alluvial materials. Underneath the
alluvial materials is completely decomposed volcanic tuff.
2.4
The borehole logs are attached in this Appendix
A 3.2a. The 4 sections across the tunnel alignment
have been updated with the new geological information and are presented in
Appendix 3.2b. The
geological material revealed from these boreholes are fully consistent with
that previously obtained.
2.5
Permeability tests were conducted at selected drillholes and the
findings are summarized below:-
|
Borehole No. |
Response zone (m,BGL) |
Materials with response zone |
Permeability (m/s) |
|
LDD200/DH/117
(I) |
4.50 – 5.50 |
Alluvium, A3/A4 |
6.82E-05 |
|
LDD200/DH/118
(I) |
5.50 – 6.50 |
Alluvium, A3/A4 |
4.56E-05 |
|
LDD200/DH/118 (II) |
12.50 – 13.50 |
CDV |
3.94E-07 |
|
LDD200/DH/119
(I) |
3.50 – 4.50 |
Alluvium, A4 |
1.48E-04 |
|
LDD200/DH/119
(II) |
11.00 – 12.00 |
CDV |
4.81E-07 |
|
LDD200/DH/122
(I) |
2.50 – 3.50 |
Alluvium, A3 |
3.01E-07 |
|
LDD200/DH/122
(II) |
10.50 – 11.50 |
CDV |
6.02E-07 |
|
LDD200/DH/123
(I) |
3.50 – 4.50 |
Alluvium, A3 |
2.34E-05 |
|
LDD200/DH/123
(II) |
11.00 – 12.00 |
CDV |
2.38E-06 |
|
LDD200/DH/124
(I) |
5.00 – 6.00 |
Alluvium, A3 |
8.28E-07 |
|
LDD200/DH/124
(II) |
14.00 – 15.00 |
CDV |
7.65E-06 |
|
DTP/20 (I) |
4.50 – 5.50 |
Alluvium, A3 |
6.62E-05 |
|
DTP/20 (II) |
12.00 – 13.00 |
CDV |
1.26E-06 |
|
DTP/21 (I) |
4.50 – 5.50 |
Alluvium, A3 |
1.88E-06 |
|
DTP/21 (II) |
11.00 – 12.00 |
CDV |
2.26E-06 |
|
DTP/22 (I) |
5.50 – 6.50 |
Alluvium, A3 |
8.89E-07 |
|
DTP/22 (II) |
12.00 – 13.00 |
CDV |
2.15E-07 |
|
DTP/25 (I) |
4.00 – 5.00 |
Alluvium, A3 |
1.94E-05 |
|
DTP/25 (II) |
12.00 – 13.00 |
CDV |
5.64E-06 |
2.6
The permeability test results obtained are mostly within the range of
values of the corresponding soil types previously reported.
3 SENSITIVITY
ANALYSIS
3.1
The variation in groundwater level under steady state condition after
installation of the twin tunnel has been presented in Appendix
A3.1. In this appendix, two sensitivity analyses had been carried out
to supplement the results previous reported.
3.2
In the first analysis, the upper bound value (ie. most permeable) of
the falling head tests results at CDV has been used to estimate the groundwater
table variation under steady state condition after construction of the twin
tunnel.
3.3
In the second analysis, the change in ground groundwater table with
time after tunnel construction has been estimated.
3.4
Same assumptions, as stated in paragraph 10.2 of Appendix
A3.1, except the permeability data input data has been adopted in the
sensitivity analyses. The permeability data adopted in these sensitivity analyses
are as follows:-
|
Soil |
Permeability |
|
Fill |
7.67 x 10⁻⁶
m/s |
|
Alluvial Clay/
Silt (A1/A2) |
5.32 x 10⁻⁶
m/s |
|
Alluvial
Sand/Gravel (A3/A4) |
4.36 x 10⁻⁵
m/s |
|
Completely
Decomposed Tuff (V) |
6.50 x 10⁻⁶ m/s |
3.5
The results of the analyses are presented in Appendix
A3.2 c and are summarized as follows:-
SECTION
A-A
|
|
Distance From Centre of
Twin Tunnels |
60mS |
- |
60mN |
120mN |
|
Total Head (mPD) |
Initial Condition |
3.84 |
3.59 |
3.32 |
2.97 |
|
With Twin Tunnels |
3.84 |
3.58 |
3.31 |
2.96 |
|
|
Difference |
- |
10mm Drop |
10mm Drop |
10mm Drop |
SECTION B-B
|
|
Distance From Centre of
Twin Tunnels |
60mS |
- |
60mN |
|
Total Head (mPD) |
Initial Condition |
3.80 |
3.56 |
3.38 |
|
With Twin Tunnels |
3.80 |
3.55 |
3.37 |
|
|
Difference |
- |
10mm Drop |
10mm Drop |
SECTION C-C
|
|
Distance From Centre of
Twin Tunnels |
60mS |
- |
60mN |
|
Total Head (mPD) |
Initial Condition |
3.85 |
3.66 |
3.45 |
|
With Twin Tunnels |
3.86 |
3.66 |
3.41 |
|
|
Difference |
10mm Rise |
- |
40mm Drop |
SECTION D-D
|
|
Distance From Centre of
Twin Tunnels |
60mS |
30mS |
20mS |
10mS |
70mN |
90mN |
|
Total Head (mPD) |
Initial Condition |
3.62 |
3.37 |
3.30 |
3.24 |
2.48 |
2.24 |
|
With Twin Tunnels |
3.72 |
3.54 |
3.48 |
3.45 |
2.26 |
2.07 |
|
|
Difference |
100mm Rise |
170mm Rise |
180mm Rise |
210mm Rise |
220mm Drop |
170mm Drop |
|
|
With Twin Tunnels |
3.62 |
3.37 |
3.30 |
3.24 |
2.47 |
2.12 |
|
|
Difference |
- |
- |
- |
- |
10mm Drop |
120mm Drop |
3.6
The sensitivity analyses indicate that only minor changes in
groundwater table would be resulted under i) a more permeable CDV layer and ii)
the transient period. Therefore, groundwater drawdown due to the presence of
the twin tunnel so as to adversly impact either the local ecology or the
agriculture would be insignificant, as compared to other factors, such as
seasonal and tidal (Neap/Spring) variations or local drawdown due to pumping
water from wells for irrigation purposes.