3.1 Introduction
This section presents the assessment of potential air quality impacts associated with the construction and operation phases of the Project. Dust generated from construction activities is the primary concern during the construction phase. During the operation phase the major sources of air pollution include the road traffic induced primarily from Shum Wan Road.
Representative Air Sensitive Receivers (ASRs) within 500 m of the Project area have been identified and the worst case impacts on these receivers have been assessed. The sensitive receivers required in the EIA Study Brief that are outside the 500 m boundary from the Project area have also been assessed. Suitable mitigation measures, where necessary, have been recommended to protect the nearby sensitive receivers and to achieve the legislative criteria and guidelines.
3.2
Environmental
Legislation, Standards and Guidelines
3.2.1 General
Potential air quality impacts associated with the construction and operation phases of the Project were assessed. Dust generated from excavation, site formation and associated works are the primary concern during the construction phase, emissions generated from increased traffic flow is the primary concern during the operation phase. Representative ASRs within 500 m of the Project boundary as well as areas where the air quality may be significantly affected by the Project have been identified and the worst case impacts on these receivers were assessed. Suitable mitigation measures, where necessary, are recommended to protect the ASRs and to achieve the legislative criteria and guidelines.
The following legislation and regulations provide the standards and guidelines for evaluation of air quality impacts and the type of works that are subject to air pollution control:
· Technical Memorandum on Environmental Impact Assessment Process (EIAO-TM) (Environmental Impact Assessment Ordinance (EIAO) (Cap. 499.S16), EIAO-TM, Annexes 4 and 12;
· Air Pollution Control Ordinance (APCO) (Cap. 311) and the Air Quality Objectives (AQO);
· Air Pollution Control (Construction Dust) Regulation
3.2.2
Technical Memorandum on Environmental Impact
Assessment Process
The criteria and guidelines for evaluation of air quality impacts are laid out in Annex 4 and Annex 12 of the EIAO-TM, respectively. Annex 4 stipulates the criteria for evaluating air quality impacts. These criteria include meeting the AQO and other standards established under the APCO, as well as meeting the hourly Total Suspended Particulate (TSP) concentration of 500 µg/m3 and the 5-second average odour concentration of 5 odour units (ou/m3). Annex 12 provides the guidelines for conducting air quality assessments under the EIA process, including determination of ASRs, assessment methodology and impact prediction and assessment.
3.2.3 Air
Pollution Control Ordinance
The principal legislation for the management of air quality is the APCO. It specifies AQOs which stipulate the statutory limits of air pollutants and the maximum allowable numbers of exceedance over specific periods. With passage of the Air Pollution Control (Amendment) Ordinance 2013 by the Legislative Council on 10 July 2013, the AQOs as listed in Table 3.1 have been effective since 1 January 2014.
Table 3.1: Air Quality Objectives Effective on 1 January 2014
|
Pollutant |
Averaging Time |
AQO
Concentration (µg/m³) |
Allowable
Number of Exceedances |
|
Sulfur Dioxide (SO2) |
10 minute |
500 |
3 |
|
24 hour |
125 |
3 |
|
|
Respirable Suspended Particulates (PM10) |
24 hour |
100 |
9 |
|
Annual |
50 |
Not applicable |
|
|
Fine Suspended Particles (PM2.5) |
24 hour |
75 |
9 |
|
Annual |
35 |
Not applicable |
|
|
Nitrogen Dioxide (NO2) |
1 hour |
200 |
18 |
|
Annual |
40 |
Not applicable |
|
|
Carbon Monoxide (CO) |
1 hour |
30,000 |
0 |
|
8 hour |
10,000 |
0 |
|
|
Ozone (O3) |
8 hour |
160 |
9 |
|
Lead (Pb) |
Annual |
0.5 |
Not applicable |
|
Total Suspended Particulates (TSP)(1) |
1 hour |
500 |
0 |
|
Odour(1) |
5 second |
5 ou/m3 |
0 |
Note (1) Criterion specified under EIAO-TM, not an AQO
3.2.4 Air
Pollution Control (Construction Dust) Regulation
The Air Pollution Control (Construction Dust) Regulation enacted under the APCO defines notifiable and regulatory works activities that are subject to construction dust control, as listed below:
Notifiable
Works:
1. Site formation
2. Reclamation
3. Demolition of a building
4. Work carried out in any part of a tunnel that is within 100 m of any exit to the open air
5. Construction of the foundation of a building
6. Construction of the superstructure of a building
7. Road construction work
Regulatory
Works:
1. Renovation carried out on the outer surface of the external wall or the upper surface of the roof of a building
1. Road opening or resurfacing work
2. Slope stabilisation work
3. Any work involving any of the following activities:
a. Stockpiling of dusty materials
b. Loading, unloading or transfer of dusty materials
c. Transfer of dusty materials using a belt conveyor system
d. Use of vehicles
e. Pneumatic or power-driven drilling, cutting and polishing
f. Debris handling
g. Excavation or earth moving
h. Concrete production
i. Site clearance
j. Blasting
Notifiable works require that advance notice of activities shall be given to EPD. The Air Pollution Control (Construction Dust) Regulation also requires the works contractor to ensure that both notifiable works and regulatory works are conducted in accordance with the Schedule of the Regulation, which provides dust control and suppression measures. The Project includes: site formation, loading, unloading or transfer of dusty materials; use of vehicles; excavation or earth moving, and; site clearance.
3.3 Project
Area
3.3.1 Local
Environment and Area Description
The Project is located to the western side of Brick Hill southwest of the Lowland, and faces the Aberdeen Channel on the south of Hong Kong island. The area comprises predominately the developed areas of the existing Middle Kingdom, Aviary, Flamingo Pond and Bird Paradise in the Ocean Park area in approximately seven hectares of the Project.
3.3.2 Meteorology
and Background Air Quality
The Pollutants in the Atmosphere and their Transport over Hong Kong (PATH) model, a regional air quality prediction model developed by EPD, was used to represent the meteorology at the Project. The PATH model can also be used to predict background air quality as a result of various sources in Hong Kong and the surrounding regions, including the Pearl River Delta Economic Zone (PRDEZ).
At the Project area, winds from the northeast are frequent in the autumn and winter. Southerly winds are dominant in spring and summer. Graph 3.1 shows seasonal windroses for Project area from PATH data at grid (28, 22). PATH uses wind data based on meteorology information from 2010.
|
Graph 3.1: Seasonal Windroses for the Project from PATH Data at Grid (28, 22) (Wind Blowing From) |
|
|
|
|

The Project is located in the Southern region. According to the Guidelines in Assessing the ‘TOTAL’ Air Quality Impacts (Jan 2013), the Project area is considered to be a Rural / New Development air quality category. The Hong Kong Electric Co. Ltd (HEC) operate monitoring stations at Chung Hom Kok and Ap Lei Chau closest to the Project area, for the latest 5-year-averaging period (2008 – 2012) were used to give an indication of ambient concentrations of NO2 at the Project area. HEC’s monitoring stations do not record TSP, Respirable Suspended Particulates (RSP) and Fine Suspended Particulates (FSP) and so, EPD’s Air Quality Monitoring Stations at rural / new development areas (Sha Tin, Tai Po, Tung Chung, Yuen Long and Tap Mun) as well as the Central / Western station were used to give indication of ambient concentrations of pollutants. The AQOs are also shown in Table 3.2 for reference.
Table 3.2: 5-year Annual Average Concentration at Representative Monitoring Stations (Year 2008-2012)
|
4th Highest 1-Hour Conc. (μg/m3) |
2nd Highest Daily Conc. (μg/m3) |
||||||
|
Conc. |
Source |
Conc. |
Source |
Conc. |
Source |
||
|
Nitrogen Dioxide (NO2) |
2008 |
199.3
|
EPD(4) |
N/A |
N/A |
20.5 |
HEC |
|
2009 |
181.3 |
16.5 |
|||||
|
2010 |
183.7 |
17.5 |
|||||
|
2011 |
190.2 |
24.0 |
|||||
|
2012 |
181.5 |
21.0 |
|||||
|
5-year mean |
187.2 |
19.9 |
|||||
|
AQO |
200 (19th highest) |
N/A |
|
40 |
|
||
|
Total Suspended Particulates
(TSP) |
2008 |
N/M
|
N/M |
190.4(2),
|
EPD(4) |
N/A |
N/A |
|
2009 |
N/M
|
156.8(2),
|
|||||
|
2010 |
N/M
|
240.0(2),
|
|||||
|
2011 |
N/M
|
160.6(2),
|
|||||
|
2012 |
N/M
|
146.3(2),
|
|||||
|
5-year mean |
N/M |
178.8(2), |
|||||
|
AQO |
500(3) (maximum) |
N/A |
|
N/A |
|
||
|
Respirable Suspended Particulates (RSP) |
2008 |
N/A |
N/A |
140.0 |
EPD(4) |
52.5 |
EPD(4) |
|
2009 |
152.3 |
46.5 |
|||||
|
2010 |
-(1) |
45.3 |
|||||
|
2011 |
118.7 |
48.5 |
|||||
|
2012 |
119.3 |
42.2 |
|||||
|
5-year mean |
132.6 |
47.0 |
|||||
|
AQO |
N/A |
|
100 (4th highest) |
50 |
|
||
|
Fine Suspended
Particulates (FSP) |
2008 |
N/A |
EPD(4) |
EPD(4) |
|||
|
2009 |
|||||||
|
2010 |
|||||||
|
2011 |
|||||||
|
2012 |
75.0 |
||||||
|
5-year mean |
77.7 |
30.3 |
|||||
|
AQO |
N/A |
|
75 (4th highest) |
35 |
|
||
Note:
(1) The value was recorded during a dust plume originated from the northern part of China in March 2010, which was an abnormal event, and hence has not been used in the calculation of the 5-year mean.
(2) Highest daily average
(3) Criterion specified under EIAO-TM, not an AQO
(4) Monitoring results from EPD’s Air Quality Monitoring Stations at Central/Western, Sha Tin, Tai Po, Tung Chung, Yuen Long and Tap Mun.
N/M Not Measured;
N/A Not applicable since there is no AQO for this parameter;
Underlined values indicate exceedance of the AQO value
The OPC conducted background dust monitoring at three locations namely Whisker’s Theatre (AM1), San Wai Village Wong Chuk Hang (AM2), and Ocean Park road, 50 m adjacent to Police Training School (AM3) between January and February 2007 as required under the issued EP (EP-249/2006) for the repositioning and long term operation plan of Ocean Park. The monitoring station at AM1 is the most relevant to this assessment as it is closest to the Project (1,100 m from the assessment boundary). The TSP concentrations measured at AM1 together with the relevant criterion are summarised in Table 3.3.
Table 3.3: Average TSP
Monitoring Results from AM1 Monitoring Stations
|
Averaging Period |
OPC’s AM1 Station Average Conc (μg/m3) [Range] (2 Jan to 18 Feb 2007) |
Criterion (μg/m3) |
|
|
Total
Suspended Particulates (TSP) |
Daily |
82
[43 – 120] |
Not
applicable |
|
Hourly |
292
[163 – 421] |
500* |
* Criterion specified under EIAO-TM, not an AQO
TSP is not measured on an hourly basis by the EPD. However, previous air quality monitoring at AM1 gives an indication of the likely hourly background TSP concentrations to be expected. As a full year of hourly monitoring data is not available from AM1, a monthly pattern for TSP at the relevant EPD monitoring stations is shown to illustrate how the monitored data may be used to indicate TSP concentrations in the Project area. Monthly concentrations are shown in Graph 3.2 for EPD monitoring stations Central/Western, Sha Tin, Tai Po, Tung Chung and Yuen Long in 2007.
|
|
|
|

The Environment Bureau released the report A Clean Air Plan for Hong Kong in March 2013. The report documents an air quality management system to reduce air pollution including, reducing roadside air pollution; reducing marine emissions; emission control of power plant, and; emission control of non-road mobile machinery. It is anticipated that the future background air quality would be improving.
The future background air pollutant concentrations were used for predicting the total air quality impact due to Project emissions were extracted from the PATH model 2015 released by EPD in December 2012. The background concentrations for 2015 are presented in Table 3.4.
As the PATH model does not generate TSP results, the PATH RSP results were taken to represent the background contributions to TSP at the sensitive receivers. This is considered to be a reasonable assumption as particulate matter of sizes larger than RSP from far-field sources would be largely settled before reaching the sensitive receivers. Therefore, the background hourly TSP levels can be reasonably estimated as the same as RSP concentrations for the purpose of estimating the cumulative 1-hour TSP levels due to the activities of the Project.
PATH model was used to predict far-field contributions to the background
RSP
levels on an hour-by-hour basis within the 500 m assessment area
during the construction phase of the Project. The
hourly RSP levels as predicted by PATH were multiplied by a factor of 0.75 to
conservatively estimate the corresponding FSP levels according to EPD’s Guidelines on the Estimation of PM2.5 for
Air Quality Assessment in Hong Kong.
The 2010 meteorological data as extracted from the relevant grids of
PATH was used for running models.
Table 3.4: PATH Background Concentration Predictions
|
Pollutant |
Year |
19th Highest 1-Hour Conc. (μg/m3) |
4nd Highest Daily Conc. (μg/m3) |
Annual
Conc. (μg/m3) |
|
NO2 |
2015 |
127 |
N/A |
21 |
|
AQO |
200 (19th highest) |
N/A |
40 |
|
|
RSP (PM10) |
2015 |
N/A |
73 |
38 |
|
AQO |
N/A |
100 (4th highest) |
50 |
|
|
FSP (PM2.5) |
2015 |
N/A |
55 |
29 |
|
AQO |
N/A |
75
(4th highest) |
35 |
N/A Not applicable since there is no AQO for this parameter.
3.3.3 Air
Sensitive Receivers
The existing and planned representative ASRs that could be affected by the Project within 500 m from its Project boundary were identified and are summarised in Table 3.5. The locations of ASRs and the boundary of 500 m study area are shown in Figure 3.1. It should be noted that five of the ASRs required to be assessed in the Study Brief, namely the Broadview Court, the Hong Kong Anti-cancer Society Jockey Club Cancer Rehabilitation Centre, South Wave Court, Pao Yue Kong swimming pool, and planned development on Wong Chuk Hang station depot are outside the 500 m boundary from the Project area.
ASR1 to ASR10 are assessed at 4 m, 8 m, 12 m, 16 m and 20 m above ground level and then every 10 m above that until the top of the buildings. ASRs within the existing Ocean Park, i.e. ASR11, ASR12 and ASR13, are assessed at 1.5 m above ground.
Table 3.5: Representative ASRs Identified for
Assessment
|
Description |
Existing/ Proposed |
Type of Use |
Approximate Horizontal Distance from Project boundary (m) |
Construction Phase |
Operation Phase |
|
|
ASR1 |
Victoria Shanghai Academy |
Existing |
Educational institution |
440 |
P |
P |
|
ASR2 |
Hong Kong Juvenile Care Centre |
Existing |
Educational institution |
430 |
P |
P |
|
ASR3 |
Po Chong Wan industrial area |
Existing |
Factory |
290 |
P |
P |
|
ASR4 |
Broadview Court |
Existing |
Residential |
580 |
P |
P |
|
ASR5 |
The Hong Kong Anti-cancer Society Jockey Club Cancer Rehabilitation Centre |
Existing |
Rehabilitation centre |
720 |
P |
P |
|
ASR6 |
South Wave Court |
Existing |
Residential |
800 |
P |
P |
|
ASR7 |
Pao Yue Kong swimming pool |
Existing |
Recreation |
920 |
P |
P |
|
ASR8 |
Development on Wong Chuk Hang station depot |
Planned |
Residential |
890 |
- |
P |
|
ASR9 |
Fisherman’s Wharf Hotel |
Planned |
Hotel |
70 |
- |
P |
|
ASR10 |
Spa Hotel |
Planned |
Hotel |
70 |
- |
P |
|
ASR11 |
Ocean Park |
Existing |
Recreation |
330 |
P |
P |
|
ASR12 |
Ocean Park |
Existing |
Recreation |
360 |
P |
P |
|
ASR13 |
Ocean Park |
Existing |
Recreation |
240 |
P |
P |
3.4 Identification
of Pollution Sources
3.4.1
Construction Phase
During the construction phase, the major activities that generate construction dust include site clearance, cutting / excavation on the hill slopes, stockpiles, excavation of ground for foundation works and site formation works, construction of superstructure, and vehicular movements on paved haul roads.
The excavation works will be the major source of dust emissions generated by the Project. It is estimated that the total amount of construction and demolition (C&D) materials to be generated would be approximately 86,300 m3, in which about 13,900 m3 would be rock and about 71,900 m3 would be soil and the remaining 500 m3 would be non-inert C&D material.
The maximum frequency of construction trucks
moving within the Project area along haul roads is 15 veh/hour. The
maximum frequency of the construction trucks arriving or exiting the Project
area is also 15 veh/hour. The construction trucks would arrive or exit
the construction site via Wong Chuk Hang Road, Nam
Long Shan Road, Shum Wan Road, Heung Yip Road and Police School Road. For
mitigating air quality impact, tarpaulin
covering of all dusty vehicle loads transported to, from and between Project
locations, and, the establishment and use of vehicle wheel and body washing
facilities at the exit points of the Project area are recommended to minimise nuisance to nearby ASRs. Therefore, potential air
quality impact from construction truck outside the Project area would be
insignificant.
The expected working hours on-site are from 8 a.m. to 6 p.m. Monday to Saturday. Concrete used for the construction of the superstructure is to be sourced from Wong Chuk Hang, therefore, no concrete batching plant is planned on-site.
Concurrent projects may include hotels at ASR locations ASR9 and ASR10, however, no information is available for the construction timetable of these projects and therefore cumulative impacts from concurrent sources cannot be assessed.
Construction programme of the project is from Year 2014 Q3 to Year 2017 Q1. According to the construction programme, the year with peak construction traffic to the Project area is identified to be 2015.
The contribution to the existing heavily trafficked Wong Chuk Hang Road, Nam Long Shan Road, Shum Wan Road, Heung Yip Road and Police School Road is expected to be limited. According to the 2012 Annual Traffic Census, the annual average daily traffic of Wong Chuk Hang Road and Nam Long Shan Road are 66,800 veh/day and 2,360 veh/day respectively.
The projected maximum traffic flows in 2015 of the concerned major road links within 500 m assessment area and their corresponding capacities are in Table 3.6. The estimated minimum overall traffic flows with construction traffic along the concerned road links are shown in Table 3.7.
Table 3.6: Projected Background Traffic Flows at Concerned Road Links (Year 2015) – Maximum
|
Concerned Roads Links |
Traffic flow (veh/hr) - Year 2015 |
|||
|
Without Project(1) |
With Project(2) |
Difference |
Capacity(3) |
|
|
Maximum
(4) |
|
|
|
|
|
A.
Wong Chuk Hang Road |
4,795 |
4,810 |
+15 |
5,550 |
|
B.
Nam Long Shan Road |
1,415 |
1,285 |
-130 |
2,400 |
|
C.
Shum Wan Road |
1,045 |
1,025 |
-20 |
1,600 |
|
D.
Heung Yip Road |
1,640 |
1,515 |
-125 |
3,400 |
|
E.
Police School Road |
1,105 |
980 |
-125 |
1,600 |
(1) Assume second entrance is still in operation without the construction of the Project
(2) Assume second entrance is closed while with the construction vehicles access to the Project
(3) Capacity used in the EIA traffic forecast
(4) Traffic flow during the project construction hours.
Table 3.7: Projected Traffic Flows at Concerned Road Links (Year 2015) – Minimum
|
Concerned Roads Links |
Traffic flow (veh/hr) - Year 2015 |
|||
|
Without Project(1) |
With Project(2) |
Difference |
Capacity(3) |
|
|
Minimum
(4) |
|
|
|
|
|
A. Wong Chuk
Hang Road |
4,485 |
4,500 |
+15 |
5,550 |
|
B. Nam Long Shan Road |
875 |
755 |
-120 |
2,400 |
|
C. Shum Wan Road |
940 |
710 |
-230 |
1,600 |
|
D. Heung Yip Road |
1,325 |
1,205 |
-120 |
3,400 |
|
E. Police School Road |
685 |
565 |
-120 |
1,600 |
(1) Assume second entrance is still in operation without the construction of the Project
(2) Assume second entrance is closed while with the construction vehicles access to the Project
(3) Capacity used in the EIA traffic forecast
(4) Traffic flow during the project construction hours.
It is noted that the estimated flow of “Maximum Hour with Construction Traffic” and “Minimum Hour with Construction Traffic” scenario for the concerned road links (except Wong Chuk Hang Road) are below “Maximum Hour without Construction Traffic” and “Minimum Hour without Construction Traffic”. All concerned road links are estimated to be operating within their capacity during the construction phase.
During the construction phase, the current second entrance gate to the Ocean Park along Shum Wan Road is assumed to be closed and the associated traffic from tourist coaches is diverted. The construction vehicles are assumed to use Shum Wan Road, however, the volume of construction vehicles is less than the coach volume and therefore a decrease in traffic along Nam Long Shan Road, Shum Wan Road, Heung Yip Road and Police School Road is expected.
For Wong Chuk Hang Road, estimated traffic flow of Maximum Hour and Minimum Hour with construction traffic is 15 veh/hr higher than that of without construction traffic, i.e. about 0.3% increased only. Minor increase to Wong Chuk Hang Road due to construction traffic and the associated coach diversion is expected. The environmental concern in term of air quality is considered insignificant.
3.4.2 Operation
Phase
During the operation phase, there may be air quality impacts on the ASRs due to vehicular emissions from the major road, namely the Shum Wan Road that would contribute to road traffic emissions within 500 m of the Project area. During the operation phase of the Project, the traffic projection shows that extra traffic flows will be generated by the Project, particularly along Shum Wan Road.
In addition there are also some gaseous emissions from the treatment of pool water in the pool filtration system. The pool treatment emissions are expanded in Section 3.5.2.
3.5 Key
Pollutants of Concern
3.5.1
Criteria pollutants
As
presented in Section 3.2, under the APCO, AQOs are stipulated for seven criteria air pollutants, namely, NO2, SO2, RSP, FSP, CO, O3 and Pb and the TM specifies criteria for TSP and odour. As identified in Section 3.4, during the construction phase the Project
area will have dust emitting activities, and during the operation phase, the Project would generate an increase in traffic flows to the area. Each
of the nine criteria pollutants has been reviewed for its relevance to the
Project as follows.
Total Suspended Particulates (TSP)
According
to the “Air Quality in Hong Kong 2012”
published by EPD1, major sources of TSP include power stations,
marine vessels, construction activities and vehicle exhausts. As the Project is
expected to produce construction dust, TSP has been identified as a key
pollutant of concern for assessment during construction phase.
[1]
http://www.aqhi.gov.hk/api_history/english/report/files/AQR2012e_final.pdf
Odour
No major odorous
industries or sources are located near the Project. The Project is not expected
to emit odour during either construction or operation
phases. Therefore, odour
is not considered as a key parameter for the air quality impact assessment
during construction or operation phase.
Nitrogen Dioxide (NO2)
According
to the most recently published, “2011
Hong Kong Emission Inventory Report” published by EPD2 in March
2013, navigation and road transport are the top two major sources of nitrogen
oxides (NOx) generated in Hong Kong,
constituting respectively about 33% and 29% of the total NOx
emission in 2011. NOx
would be transformed to NO2 in the presence of O3 under
sunlight. As summarised
in Table 3.2, the latest 5-year average of the 4th
highest hourly NO2 concentration at the chosen Air Quality
Monitoring Stations (i.e., Central/Western, Sha Tin,
Tai Po, Tung Chung, Yuen Long and Tap Mun) is about
94% of the corresponding AQO. The AQO
requires that the 19th highest hourly concentration is compliance
with the AQO criteria. The latest 5-year annual average of NO2
concentration at the chosen Air Quality Monitoring Stations is about 106% of
the corresponding AQO. Therefore, NO2 has been identified as a key
pollutant of concern for assessment during operation phase of the Project.
[2]
http://www.epd.gov.hk/epd/english/environmentinhk/air/data/files/2011HKEIReport.pdf
Respirable
Suspended Particulates (RSP)
According
to the latest statistics of “2011 Hong
Kong Emission Inventory Report”, navigation and road transport are the top
two major sources of RSP in Hong Kong, accounting for respectively about 37%
and 19% of the total RSP emissions in 2011.
As summarised in Table 3.2, the latest 5-year average of the annual RSP
concentration at the chosen Air Quality Monitoring Stations (i.e.,
Central/Western, Sha Tin, Tai Po, Tung Chung, Yuen
Long and Tap Mun) is about 94% of the corresponding
AQO. Therefore, RSP has been identified
as a key pollutant of concern from both construction and operation phases, and
will be assessed against the relevant AQOs for this Project.
Sulfur
Dioxide (SO2)
According
to the latest statistics of “2011 Hong
Kong Emission Inventory Report”, 54% of total SO2 emission in
Hong Kong is attributed to navigation whereas only below 1% of the total
emission is due to road transport. The
introduction of ultra-low sulfur diesel for vehicle fleet in 2000 has also
helped reducing the SO2 emission from road transport in Hong
Kong. As there are no significant
sources of sulfur dioxide emitted from the Project, sulfur dioxide is not
identified as a key air pollutant for air quality impact assessment for this
Project, though it is one of the criteria pollutants under the AQO.
Ozone (O3)
According
to the “Air Quality in Hong Kong 2012”
published by EPD, ozone is a major constituent of photochemical smog. It is not
a pollutant directly emitted from man-made sources but formed by photochemical
reactions of primary pollutants such as NOx
and volatile organic compounds (VOCs) under sunlight. As it takes several hours
for these photochemical reactions to take place, ozone recorded in one place
could be attributed to VOC and NOx
emissions from places afar. Hence, ozone is a regional air pollution
problem. In other words, unlike such air
pollutants as NOx, RSP and SO2,
ozone is not a pollutant directly attributable to emissions from nearby marine
or road traffic. However, used pool water will be generated and
discharged from the 28 swimming pools on-site annually during operation under a
separate flushing system from the backwash system. Backwash water from the daily operation of
the pool will be collected and treated by the on-site filtration system and
then discharged to the sewage system together with the water generated at the
pool deck areas. Ozone and sodium
hypochlorite will be used to treat the pool water. Ozone is mixed directly with the pool water, residual ozone released by the system is collected
and treated to convert it to oxygen. No ozone is expected to be emitted from
the process. As a result, ozone is not identified as a key
air pollutant for air quality impact assessment for this Project, though it is
one of the criteria pollutants under the AQO.
Carbon Monoxide (CO)
According
to the latest statistics of “2011 Hong
Kong Emission Inventory Report”, road transport and navigation are the top
two major sources of CO emissions in Hong Kong, contributing to respectively
about 67% and 18% of the total CO emission in 2011. However, based on the “Air Quality in Hong Kong 2012” published by EPD, the highest 1-hour
CO level and the highest 8-hour CO concentration in Mong
Kok are respectively 3,810 μg/m3 and
3,018 μg/m3, which are only 13% and
30% of the corresponding AQO respectively. Given that the ambient CO levels are
well below the relevant AQO with large margins as opposed to the other
pollutants such as RSP, it is considered appropriate to select RSP, but not CO,
as the key pollutants for air quality impact assessment against the AQO for
this Project.
Lead (Pb)
Since
leaded petrol was banned in Hong Kong on 1 April 1999, it is no longer
considered as a primary source in Hong Kong.
According to the “Air Quality in
Hong Kong 2012” published by EPD, the ambient lead concentrations continued
to remain at very low levels during 2012 as in previous years, and the overall
3-month averages, ranging from 0.011 μg/m3
(in Tung Chung) to 0.057 μg/m3 (in
Yuen Long), were well below the annual AQO limit of 0.5 μg/m3. Therefore, it is not considered as a key air
pollutant for the air quality impact assessment of this Project.
Fine Suspended Particulates (FSP)
According
to the “Air Quality in Hong Kong 2012”
published by EPD, major sources of RSP include marine vessels, diesel vehicles
and power stations. FSP is a finer
component of RSP. As
the Project is expected to produce dust during the construction phase and an
increase in traffic during operation phase, FSP has been identified as a key
pollutant of concern for assessment during both construction and operation
phases.
3.5.2
Non-criteria
pollutants
Used pool
water will be generated and discharged from the 28 swimming pools on-site
annually during operation under a separate flushing system from the backwash
system. Backwash water from the daily operation of the pool will be collected
and treated by the on-site filtration system and then discharged to the sewage
system together with the water generated at the pool deck areas. Ozone and
sodium hypochlorite will be used to treat the pool water. Sodium hypochlorite is mixed directly with
the pool water, during chemical reaction with the pool
water hydrogen gas will be released. As
the gaseous releases of hydrogen are associated with routine maintenance of the
pool water, insignificant quantity is expected and therefore hydrogen is not
assessed for the Project.
3.5.3
Identified key air pollutants for assessment
Based on
the above review results, the following key air pollutants of concerns are
identified for the purpose of air quality impact assessment of the Project:
· For construction phase – TSP, RSP and FSP; and
· For operation phase – NO2, RSP and FSP.
3.6
Emission
Inventory
3.6.1
Construction Phase
Dust Emission Factors
Dust emissions include TSP, RSP and FSP. Prediction of dust emissions is based on emissions factors from the Compilation of Air Pollution Emission Factors (AP-42), 5th Edition published by the US Environmental Protection Agency (USEPA). The emission factor for a typical heavy construction activity is 2.69 megagrams (Mg)/hectare/month according to Section 13.2.3.3 of AP-42. The number of working days per month and number of working hours per day of the Project are anticipated to be 26 days and 10 hours, respectively. Thus, these assumptions have been adopted in the model calculation. Based on Table 11.9-4 of AP-42, the emission factor for wind erosion of 0.85 Mg/hectare/year is adopted.
With reference to the USEPA document Estimating Particulate Matter Emissions from Construction Operations, 1999, a typical ratio of 0.3:1 is used for RSP:TSP. Therefore, the RSP emission rates for heavy construction activities and wind erosion are estimated as 30% of the corresponding TSP emission rates. Based on the USEPA’s Examination of the Multiplier Used to Estimate PM2.5 Fugitive Dust Emissions from PM10, April 2005, FSP emission from heavy construction activities and wind erosion can be estimated as 3% of the corresponding TSP emissions. Details of these emission factors are given in Table 3.8.
For mitigated scenarios, the active construction areas will have ground watering applied approximately once every 2.5 hours or four times per day. This gives rise to an estimated dust suppression efficiency of 91.7%3 (refer to Appendix 3.1 for detailed calculations). The unmitigated scenario does not employ any watering for dust suppression.
[3] Equation (3-2) in USEPA EPA-450/3-38-008 Control of Open Fugitive Dust Sources Final Report, September 1988
Table 3.8: Key Dust
Emission Factors Adopted in the Assessment
|
Activities |
Emission
Factors |
Reference |
|
Heavy
construction activities including all above ground and open construction
works, excavation and slope cutting works(1) |
TSP Emission Factor = 2.69 Mg/hectare/month RSP Emission Factor = 2.69 x 30% Mg/hectare/month FSP Emission Factor = 2.69 x 3%
Mg/hectare/month |
Section 13.2.3.3 AP-42, 5th
Edition USEPA document Estimating Particulate Emissions from Construction Operations, 1999 Thompson G. Pace, USEPA. |
|
Wind
erosion from heavy construction |
TSP Emission Factor = 0.85 Mg/hectare/year RSP Emission Factor = 0.85 x 30% Mg/hectare/year FSP Emission Factor = 0.85 x 3%
Mg/hectare/year |
Table 11.9-4. AP-42, 5th Edition
USEPA document Estimating Particulate Emissions from Construction Operations, 1999 Thompson G. Pace, USEPA. |
|
Paved haul road |
TSP or RSP
or FSP Emission Factor = k x (sL) 0.91 x (W) 1.02 g/VKT where k is particle size multiplier(2) sL is road surface silt loading W is average truck weight |
Section 13.2.1,
AP-42, 5th Edition (Jan 2011 edition) |
|
Loading or unloading of dusty materials for stockpile |
TSP or RSP or FSP Emission Factor = k*0.0016*[(U/2.2)1.3/(M/2)1.4] kg/Mg k is particle size multiplier(3) U is Average wind speed M is Moisture content |
Section 13.2.4.3 AP-42, 5th Edition |
(1) For this Project, ‘heavy construction activity’ refers to ‘heavy activities associated with site excavation, and formation works.
(2) The particle size multipliers for TSP, RSP and FSP are made reference to Section 13.2.1 (Table 13.2.1-1) of the USEPA Compilation of Air Pollution Emission Factors (AP-42), 5th Edition (Jan 2011 edition).
(3) The particle size multipliers for TSP, RSP and FSP are made reference to Section 13.2.4.3 of the USEPA Compilation of Air Pollution Emission Factors (AP-42), 5th Edition (Jan 2011 edition).
3.6.2 Operation
Phase
Vehicular
Emissions
During
the operation phase, there will be cumulative
air quality impacts on the ASRs due to vehicular emissions from existing and
proposed open roads outside the Project area but within the 500 m
assessment area. Emissions are determined from vehicular fleet information and
are described in Section 3.7.5.
3.7
Air Quality Modelling Methodology
3.7.1 Introduction
The
Project is assessed through air quality modelling, using of the Gaussian air
quality models, FDM and CALINE4, as well as vehicular emission inventory model,
EMFAC-HK v2.6, and background model, PATH. In accordance with the EPD’s Guidelines on Choice of Models and
Model Parameters, the following models have been employed:
· Pollutants in the Atmosphere and the Transport over Hong Kong (PATH) has been used to predict the current background air pollution due to sources outside the Project boundary. Sources include, but are not limited to: the Pearl River Deltas Economic Zone (PRDEZ); the Hong Kong International Airport; power plants in HKSAR; roads beyond the Project, and; marine emissions. Background data predicted by PATH for year 2015 represents the worst case year relevant to the assessment of the Project.
· FDM was used to predict the air pollutant concentrations due to fugitive and open dust source impacts during the construction phase.
· EMFAC-HK v2.6 model has been used to determine the fleet average emission factors, for all the planned and existing roads within the 500 m assessment area. The model has included the effect of Inspection and Maintenance (I/M) program and is applicable for calendar years between 2013 and 2040.
· CALINE4 has been used to predict the air pollutant concentrations due to vehicular emissions from all open road links within the 500 m assessment area, which are as shown in Figure 3.5.
3.7.2
Model
limitations
· Causality effects
Gaussian plume models assume pollutant material is transported in a straight line instantly (like a beam of light) to receptors that may be several hours or more in transport time away from the source. The model takes no account for the fact that the wind may only be blowing at 1 m/s and will have only travelled 3.6 km in the first hour. This means that Gaussian models cannot account for causality effects, where the plume may meander across the terrain as the wind speed or direction changes. This effect is not considered to be significant for the Project as the area is small.
· Low wind speeds
Gaussian-plume models ‘break down’ during low wind speed or calm conditions due to the inverse speed dependence of the steady state plume equation. These models usually set a minimum wind speed of 0.5 or 1.0 m/s and ignore or overwrite data below this limit.
· Straight-line trajectories
Gaussian models will typically overestimate terrain impingement effects during stable conditions because they do not account for turning or rising wind caused by the terrain itself. For the Project assessment this effect may cause an over-estimation at lower terrain levels where impingement occurs. However as dust emissions are a non-buoyant, ground level source, this effect is expected to be minor and any overestimation conservative. For vehicular sources this effect is expected to be minor as the majority of the effects are felt close to the road-side.
· Spatially uniform meteorological conditions
Gaussian models assume that the atmosphere is uniform across the entire modelling domain, and that transport and dispersion conditions exist unchanged long enough for the material to reach the receptor even if this is several kilometres away. In the atmosphere, truly uniform conditions rarely occur. As the Project area and surrounding assessment area is sufficiently small, hence uniform meteorological conditions are considered appropriate.
· No memory of previous hour’s emissions
In calculating each hour’s ground-level concentrations, Gaussian models have no memory of the contaminants released during the previous hours. This limitation is especially important for the proper simulation of morning inversion break-up, fumigation and diurnal recycling of pollutants.
[4] Good Practice Guide for Atmospheric Dispersion Modelling. Ministry for the Environment, New Zealand (June 2004)
3.7.3 Background
Model
Model
Description - PATH
The PATH model is a numerical air quality modelling system developed specifically for use in Hong Kong. The model comprises of three modules: an emission model; a prognostic meteorological model and an Eulerian transport and chemistry model. These modules are interfaced together and set up on a series of nested domains to account for influences outside of Hong Kong.
Assumptions
and Inputs – PATH
An
updated version of PATH was released by EPD for general use in December 2012.
As there is no significant inventory update since the release of the latest
PATH and the submission of this EIA report, use of the 2012 PATH model in its
current state is considered appropriate.
For EIA applications, PATH simulates wind field, pollutant emissions,
transportation and chemical transformation and outputs pollutant concentrations
over Hong Kong and the Pearl River Delta (PRD) region at a fine grid size of
1.5 km.
During the 12th Hong Kong-Guangdong Joint Working Group
Meeting on Sustainable Development and Environmental Protection (Nov 2012), the
Hong Kong and Guangdong Governments jointly endorsed a Major Air Pollutant
Emission Reduction Plan for the Pearl River Delta Region up to year 2020. A
comprehensive emission inventory for Hong Kong and PRD was compiled for year
2010 based on current best estimates and projected to years 2015 and 2020 in
accordance with the emission reduction measures proposed in the plan. The
emission inventory for year 2010 was used in PATH and produced reasonable
agreement with air quality measurements. The projected emission inventories for
years 2015 and 2020 were also used in PATH to predict air qualities for future
years. The emission inventories include the total emissions from six key
groups, namely, public electricity generation, road transport (emissions
estimated based on VKT forecast provided by TD and EMFAC-HK model version 2.1),
navigation, civil aviation (emissions estimated based on forecasted air traffic
movements), other fuel combustion (covering emissions from such major
facilities as HK & China Gas, Green Island Cement and Integrated Waste
Management Facilities) and non-combustion. The Hong Kong emission inventories
of the key air pollutants of concerns for the Project are summarised in Table 3.9.
Table 3.9: Summary of Years 2015 and 2020 Hong Kong Emission Inventory for the PATH Model
|
Pollutant |
Total Emission in
2015 (ton/year) |
Total Emission in
2020 (ton/year) |
|
SO2 |
26,625 |
23,075 |
|
NOx |
98,100 |
87,200 |
|
RSP |
5,706 |
5,389 |
PATH model was used to quantify the background air quality during both construction and operation phases of the Project. Emission sources including roads, marine, airports, power plants and industries within the Pearl River Delta Economic Zone and Hong Kong were considered in the PATH model. Details of the PATH Model and related emission inventory can be found in EPD’s website.
The hourly NOx and RSP concentrations as extracted from the PATH for year 2015 are adopted as the background air pollutant concentrations in the estimation of cumulative impact for the Project during the Project period.
The construction dust and vehicular emissions at local scale (i.e. within the 500 m assessment area) have been modelled by near-field dispersion model, FDM and CALINE4 respectively. Adding the PATH background concentrations to the near-field modelling results would lead to certain amount of double counting, and hence conservative cumulative modelling results.
3.7.4
Construction
Phase
Model Description
- FDM
To assess the air quality through air
quality modelling, use of the model FDM was required. In accordance with the
EPD’s Guidelines on Choice of Models and
Model Parameters, FDM is proposed to predict the air pollutant
concentrations due to open dust source impacts for dust effects. The FDM is a
computerised air quality model specifically designed for computing the
concentration and deposition impacts from fugitive dust sources. The model is
generally based on the Gaussian Plume formulation for computing concentrations,
but the model has been specifically adapted to incorporate an improved gradient
transfer deposition algorithm. FDM is one of the air quality models listed as
commonly used for EIA studies by EPD in Guidelines
on Choice of Models and Model Parameters.
Methodology - FDM
Heavy construction associated with site
formation, loading, unloading or transfer of dusty materials; use of vehicles;
excavation or earth moving, and; site clearance, and
wind erosion at the Project are the main sources of dust emissions during the
Project.
A tiered approach is used to estimate the
project emissions throughout the carrying out of the Project. Pollutants
assessed are TSP, RSP and FSP. For hourly TSP, daily RSP and daily FSP emissions,
a tiered modelling approach is proposed. Tier 1 and annual screening assumes
100% of the active area for a given year is emitting dust. The Tier 1 and
annual scenarios (i.e. assuming 100% active area for the Project) is
hypothetical and used for screening purposes to identify which ASRs may be
subject to TSP concentrations above the relevant standards. The Tier 1 hourly
TSP, daily RSP, daily FSP, annual RSP and annual FSP levels at all the ASRs are
then predicted for scenarios of with and without dust mitigation measures in
place.
For the purpose of the Tier 1 and annual
screening, the dust mitigation measures, including frequent water spraying, are
taken into account when estimating the dust emission rates from the
construction activities. Details of the
Tier 1 and annual dust sources including their coordinates and dimensions are
found in Appendix 3.3
and estimated emission rates are detailed in Appendix
3.2. Locations of the assumed
dust sources for Tier 1 and annual assessment are shown in Figure 3.2
(heavy construction and haul roads) and Figure 3.3
(stockpiles). The Tier 1 hourly TSP, daily RSP, daily FSP levels, annual
RSP and annual FSP at all the ASRs are then predicted for both scenarios of
with and without the dust mitigation measures in place.
The ASRs identified with hourly TSP, daily
RSP, daily FSP, annual RSP and/ or annual FSP non-compliance under Tier 1 screening,
where mitigation measures are in place, are then selected for the subsequent
Tier 2 assessment.
It is assumed in the Tier 2 assessment that
the percentage active area of the Project area for each stage and the
corresponding active areas of the relevant concurrent project would be located
closest to the ASR being assessed. The Tier 2 hourly TSP, daily RSP, FSP
levels, annual RSP and/ or annual FSP at each of these ASRs are then predicted
with the dust mitigation measures in place.
Roughness Factor
The “Guideline
on Air Quality model (revised), EPA - 450/2-78-027R, July 1986” is used to
calculate the roughness length for use in FDM.
The EPD “Guideline
on Choice of Models and Model Parameters” states: the selection of rural or
urban dispersion coefficients in a specific application should follow a land
use classification procedure. If the land use types including industrial,
commercial and residential uses account for 50% or more of an area within a
3 km radius from the source, the site is classified as urban; otherwise it
is classified as rural. The surface roughness height is closely related to the
land use characteristics of a study area and associated with the roughness
element height. As a first approximation, the surface roughness can be estimated
as 3 to 10 percent of the average height of physical structures. Typical values
used for urban and new development areas are 370 cm and 100 cm, respectively.
Within a three kilometre radius of the
Project area 28.9% is classified as rural / new development, 14.2% is
classified as urban and the remaining 56.9% is sea. As the sea roughness is
typically given a value of 0.01 cm and urban is assumed to be 370 cm,
an area averaged roughness height of 81.5 cm is used. This is to take
account of the low turbulence over the sea water, and also the very large
turbulence generated due to nearby large structures.
3.7.5 Operation
Phase
Model Description – EMFAC-HK v2.6
EMFAC-HK v2.6 is an emissions inventory model that calculates emissions inventories for motor vehicles operating on roads in Hong Kong. The model is used for estimating vehicular tailpipe emissions including FSP, RSP and NOx. The model can take into account both vehicle technologies and driving conditions. The model follows that of the California Air Resources Boards’ EMFAC model but with modifications to cater for local factors, including the substantial reduction of the smoky vehicle problem in recent years.
Assumptions and Inputs – EMFAC-HK v2.6
For all the planned and existing roads within the 500 m assessment area,
the EMFAC-HK v2.6 model (I and M), which is the latest version at the time of
preparing this report, has been used to determine the fleet average
emission factors.
The Burden mode, used for calculating area-specific emission factors, has been selected in the model. Under this mode, the total emissions of pollutants such as FSP, RSP and NOx were computed for each type of vehicle class based on temperature, relative humidity, speed corrected emission factors and vehicle activity. Hourly output was selected.
The assumptions
and input parameters on modelling of vehicle emission factors
are presented in the following sections. The
traffic data used for the assessment includes the hourly traffic flows of 16
vehicle classes at various road links and the speed fractions of various
vehicle classes in four model
years. The model years are: 2017 (the year when
operation of the Project is planned to commence); intermediate years 2022 and
2027, and 2032 (15 years after commencement of operation of the Project).
Traffic data is provided by the Traffic Consultant, and are presented in the following sections. The traffic forecast data has been submitted to the Transport Department (TD) for review. The correspondence from TD is provided in Appendix 3.4 for reference. The 24-hour traffic patterns are given in Appendix 3.5.
Vehicle Emission
Standards
The emission standards, according to the
latest implementation programme (as of December 2013) have been adopted in
EMFAC-HK v2.6 model for vehicles registered in Hong Kong. In this model,
the latest European Union (EU) emission standard, Euro VI, for all vehicle
classes can be applied, with the exception of motorcycles which do not have
applicable new EU emission standards.
Road Grouping
The road links for assessment have been grouped into three types. Emission factors for the following three road types have been calculated:
· Road Type 1 – Local Distributor (50 km/h);
· Road Type 2 – Primary Distributor (50 km/h), and;
· Road Type 3 – Primary Distributor (70 km/h).
The road types are characterised by continuous and interrupted flow with different design speed limits. It is assumed that there is continuous traffic flow in Road Types 2 and 3, whereas there is interrupted flow in Road Type 1.
Vehicle Classes
Vehicles operating on open roads have been
categorised into 16 vehicle classes according to the Guideline on Modelling Vehicle Emission – Appendix I for EMFAC-HK
v2.6, and is presented in Table 3.10.
Table 3.10: Vehicle Classification in the EMFAC-HK Model
|
Index |
Description |
Notation in EMFAC-HK Model |
Fuel Type |
Gross Vehicle Weight |
|
1 |
Private Cars (PC) |
PC |
ALL |
ALL |
|
3 |
Taxi |
taxi |
ALL |
ALL |
|
4 |
Light Goods Vehicles (<=2.5t) |
LGV3 |
ALL |
<=2.5ton |
|
5 |
Light Goods Vehicles (2.5-3.5t) |
LGV4 |
ALL |
>2.5-3.5ton |
|
6 |
Light Goods Vehicles (3.5-5.5t) |
LGV6 |
ALL |
>3.5ton |
|
7 |
Medium & Heavy Goods Vehicles (5.5-15t) |
HGV7 |
ALL |
>5.5ton-15ton |
|
8 |
Medium & Heavy Goods Vehicles (>=15t) |
HGV8 |
ALL |
>15ton |
|
11 |
Public Light Buses |
PLB |
ALL |
ALL |
|
12 |
Private Light Buses (<=3.5t) |
PV4 |
ALL |
<=3.5ton |
|
13 |
Private Light Buses (>3.5t) |
PV5 |
ALL |
>3.5ton |
|
14 |
Non-franchised Buses (<6.4t) |
NFB6 |
ALL |
<=6.4ton |
|
15 |
Non-franchised Buses (6.4-15t) |
NFB7 |
ALL |
>6.4ton – 15ton |
|
16 |
Non-franchised Buses (>15t) |
NFB8 |
ALL |
<=15ton |
|
17 |
Single Deck Franchised Buses |
FBSD |
ALL |
ALL |
|
18 |
Double Deck Franchised Buses |
FBDD |
ALL |
ALL |
|
19 |
Motor Cycles |
MC |
ALL |
ALL |
Exhaust / Evaporation Technology Fraction
Vehicle
classes are grouped with different exhaust technology indexes and technology
fractions. Each technology group represent a distinct emission control
technologies. The EMFAC-HK v2.6 model has a set of default exhaust technology
fractions which best represents the scheduled implementation of new vehicle
emission standards as of December 2013. As there is no update to the planned
emission control measures since the release of the guideline in December 2013,
the default exhaust technology fractions are considered to be applicable in
this assessment.
Vehicle Population
According
to the Guideline on Modelling Vehicle
Emissions, the vehicle population forecast function in
EMFAC-HK v2.6 used 2010 as the base year. Natural replacement of vehicles
and a set of annual growth rates and survival rates for different vehicles are
assumed for years 2011 to 2040. In particular, vehicles including private cars,
motorcycles, and goods vehicles are assumed to grow by a varying percentage
(from 0% - 2.5% annual) during the period whereas the number of franchised
buses, public light buses and taxis are assumed to have no growth.
The default populations from the 2012
population information have been adopted for the model years (2017, 2022, 2027,
and 2032). The vehicle age distributions, in the base year 2010, are presented
in Appendix
3.6 for reference.
The use of electric vehicles (EVs), which do not have tailpipe
emissions, has been promoted by the government in the recent years. By April
2012, there were more than 310 EVs in Hong Kong. The introduction of EVs will
have an impact on the future vehicle fleet composition, although the effect is
still unknown. Impacts will vary with policy in the future and the successful
application of EVs as an alternative to the traditional vehicles. As a
conservative approach, this assessment does not take into account the presence
of EVs and any programme on the promotion of EVs.
Accrual Rate
Default values and compositions have been adopted with reference to in the EMFAC-HK v2.6 Guideline.
Diurnal Variation
of Daily Vehicle Kilometres Travelled (VKT)
For each vehicle class, the Vehicle Kilometres Travelled (VKT) of individual hours is calculated by multiplying the hourly number of vehicles with the length of the corresponding road link (in kilometres). Diurnal (24-hour) traffic pattern has been provided by Traffic Consultant. The lengths of individual road links of the connecting road are given in Appendix 3.7. The 24-hour VKT values for all vehicle classes in each of the model years 2017, 2022, 2027 and 2032 together with a graphical plot, are provided in Appendix 3.8.
Daily Trips
The daily trips were used to estimate the cold start emissions of the petrol and LPG vehicles only, as is prescribed by the model. Therefore, trips for vehicles other than petrol or LPG type vehicles would be assumed to be zero. Different road types have different number of trips as follows.
Primary Distributor (Road Types 3)
Zero trips are assumed in Primary Distributor (Road Type 3) since there will be no cold start under normal circumstances.
Primary Distributor and Local Road (Road Types 1 and
2)
Trip within assessment area = (Trip within
HK / VKT within HK) x VKT within assessment
area
Trip within HK is the default data of EMFAC-HK v2.6 model. VKT within HK is the VKT of local roads in Hong Kong, which is estimated based on the default VKT data of EMFAC-HK v2.6 model and the relevant data as published in the “Annual Traffic Census 2012” by TD. Details of the trip estimation are as shown in Appendix 3.9. According to the Mobile Source Group of EPD, the default VKT and trips in the model are based on EPD’s estimated data for Hong Kong. VKT within assessment area is calculated as mentioned above. The trips in each year are provided in Appendix 3.8.
While the number of trips is dependent on vehicle population, no project-specific vehicle population data can be identified for the assessment area according to the Traffic Consultants. However, project-specific VKT has been estimated based on the traffic forecast in the assessment area. Moreover, it can be argued that VKT is related to vehicle population in such a way that a higher vehicle population would generally result in a higher VKT. As a result, it has been proposed to estimate the number of trips in the assessment area on the basis of the project-specific VKT and the assumption that the number of trips per VKT in the assessment area would be similar to the number of trips per VKT in Hong Kong. It is considered that this proposed approach is based on best available data and reasonable assumption. This approach for estimating the number of trips together with the results of estimation has been submitted to TD for review. The correspondence from TD is provided in Appendix 3.4 for reference.
Hourly Temperature
and Relative Humidity Profile
Annual and monthly hourly average ambient temperature and relative humidity obtained from the meteorological data as extracted from the 2012 HKO’s King’s Park meteorology station (with at least 90% valid data) have been adopted. The 24-hour variations of the annual averages of temperature and relative humidity are presented graphically in Appendix 3.10.
Speed Fractions
The 24-hour speed fractions for different road types and individual vehicle classes are provided by the Traffic Consultant, and are calculated based on the 24-hour traffic flow in each model year and the volume / capacity ratio of different road types. For each vehicle class, the VKT of each road link was grouped into sub-groups with speed bins of 8 km/h (0 - 8 km/h, 8 - 16 km/h, 16 - 24 km/h, etc.). The speed fraction of each sub-group was derived by the summation of the total VKT of road link within this sub-group divided by the total VKT of all road links. The estimated speed fractions provided by the Traffic Consultant are given in Appendix 3.11.
The
maximum speed for Heavy Goods Vehicles, Franchised Buses and Non-franchised
Buses has been restricted to 70 km/h and for Public Light Buses to
80 km/h.
Predicted
Emission Factors by EMFAC-HK v2.6 model
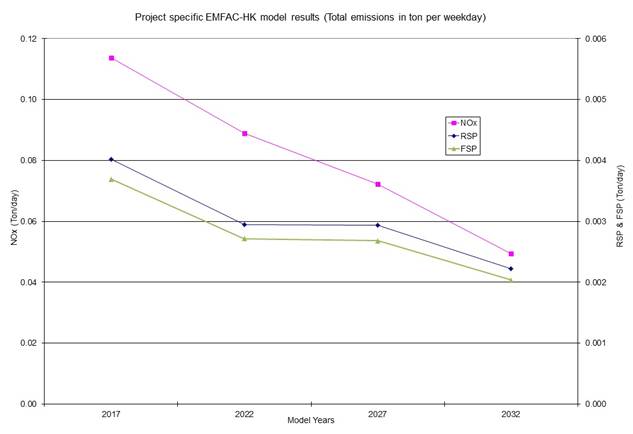
To determine the emissions with 15 years after commencement of the Project, emission rates were modelled for years 2017, 2022, 2027 and 2032. Upon modelling with EMFAC-HK v2.6, the emissions for each vehicle class at different hours are then divided by the corresponding VKT to obtain 24-hr emission factors in grams/vehicle-kilometre (g/veh-km). The calculations of emission factors for each model year are shown in Appendix 3.12. By comparing the total emissions in different model years as shown in Graph 3.3, year 2017 represents the worst case scenario where the total emission is the highest among all model years. This is because despite the increased traffic volume, the total emissions are expected to decrease as a result of the retirement of older and more polluting vehicles in the fleet, which would be replaced with newer vehicles with lower emissions. Therefore, it is proposed to use the emission factors of this worst case year 2017 for the prediction of air quality impacts due to vehicular emissions in order to arrive at conservative impact assessment results.
Graph 3.3: Comparison of FSP, RSP and NOx EMFAC Results for 2017, 2022, 2027 and 2032
|
|
Model Description – CALINE4
CALINE4 is a line source air quality model developed by the California Department of Transportation and is one of the models prescribed by the EPD Guidelines on Choice of Models and Model Parameters. It is based on the Gaussian diffusion equation and employs a mixing zone concept to characterise pollutant dispersion over the roadway.
The purpose of the model is to assess air quality impacts near transportation facilities. Given source strength, meteorology and site geometry, CALINE4 can predict pollutant concentrations for receptors located within 500 m of a given roadway. As with all Gaussian models, CALINE4 has some limitations, as described in Section 3.7.2.
Assumptions and Inputs – CALINE4
The predicted traffic flows have taken into
account the Project. Appendix
3.5 presents
details of the 24-hour traffic forecast for
different vehicles and individual road links within
the 500 m assessment area (see Figures
3.5) as
provided by the Traffic Consultants.
Hourly meteorological data for a full year as extracted from the PATH model released by EPD in December 2012 (meteorological data year 2010, grid 28, 22) has been adopted for use in CALINE4. The data is considered to be the most up-to-date data available. PATH data has been observed to have a lower mixing height for some hours, when compared to the measured mixing height. The minimum mixing height recorded by HKO in year 2010 is 121.3 m, whereas the PATH minimum mixing height is 40 m. The HKO minimum mixing height of 121.3 m is used to replace any PATH mixing height below this value. This approach is considered appropriate as it will minimise over-estimation due to lower mixing heights and also will minimise under-estimation due to high stacks being excluded in the mixing volume. The PATH data with the above modification is considered to be representative of the site wind data at the Project. A roughness coefficient of 370 cm is used.
Based on the worst case emission factors and the 24-hour traffic flow in year 2017, the composite fleet emission factors have been calculated for the road links, as detailed in Appendices 3.13 and 3.14.
Other Assumptions
The Ozone Limiting Method (OLM) as described
in EPD’s Guidelines on Choice of Models and Model Parameters
has been adopted to estimate the conversion of NOx
to NO2 from vehicular emissions. The ozone concentrations are based
on the future hourly background ozone concentrations for year 2015 which were
extracted from grid (28, 22) of the most up to date PATH. Grid (28, 22) of the
PATH model is used because the majority of the Project area falls within this
grid (see Figure 3.6).
The NOx/NO2
conversion for vehicular is therefore estimated as follows:
[NO2]vehicle
= 0.075 x [NOx]vehicle +
minimum of {0.925 x [NOx]vehicle
or (46/48) x [O3]PATH}
where
[NO2]vehicle
is the estimated hourly vehicular NO2
concentration (predicted by CALINE4);
[NOx]vehicle is
the hourly NOx concentration as predicted
by CALINE4 for vehicular emissions at the receptor, and;
[O3]PATH is the hourly ozone concentrations as
extracted from the aforementioned
grid of the PATH model for year 2015.
To estimate the total hourly concentrations, the hourly pollutant
concentrations as predicted by CALINE4 (vehicular) are added together with the
future hourly background pollutant concentrations as extracted from the
relevant grid of the PATH model. Therefore, the total hourly concentrations of
NO2 are calculated as follows:
[NO2]total
= [NO2]vehicle + [NO2]PATH
where
[NO2]total
is the total hourly NO2
concentration;
[NO2]vehicle is the hourly vehicular NO2
concentration which is first predicted by CALINE4 NOx
and then converted to NO2 by using OLM, and;
[NO2]PATH is the hourly NO2
concentrations as extracted from the aforementioned grid of the PATH model for
year 2015.
Similarly, the total hourly RSP and hourly
FSP concentrations are also calculated by adding together the hourly results
predicted by CALINE4 and PATH.
With the total hourly NO2, RSP
and FSP estimated, the daily results are obtained by taking the arithmetic mean
of the 24 hour results. Similarly, the annual concentrations are calculated as
the arithmetic mean of the whole year of hourly results.
3.8
Prediction and Evaluation of
Environmental Impact
3.8.1
Construction Phase
General
The
construction of the Project would commence in year 2014 for completion of the
major dust emitting activities in May 2015 (see construction programme in Appendix 2.2). The total construction programme
is about 29 working months. According to
the current construction programme, the construction
works are scheduled to be conducted in sequence. No blasting activity and no
on-site concrete batching plant are expected. No cumulative dust impact with
concurrent project is anticipated. Given the scale of the Project, the amount
of dust generation would not be significant provided that appropriate dust
suppression measures as stipulated in “The
Air Pollution Control (Construction Dust) Regulation” be implemented. In particular it should be noted that,
tarpaulin covering of all dusty vehicle loads transported to, from and between
Project locations, and, the establishment and use of vehicle wheel and body
washing facilities at the exit points of the Project area are recommended to minimise nuisance to nearby ASRs.
It should
be noted for approximately half of the year, wind direction blows offshore,
that is any dust emissions are blowing away from the ASRs. During the summer
months, when the wind is blowing onshore, historic measurements have shown the
background concentrations to be lower.
The pollutants assessed for the construction phase include TSP, RSP and
FSP.
Tier 1 Results
It should be noted that as explained in Section 3.7.4, the Tier 1 scenario represents a hypothetical worst case where 100% of the work areas are assumed as active areas that are generating dust and the Tier 1 results are for screening purposes so that the ASRs of concerns (i.e., with exceedance under the hypothetical Tier 1 scenario) would be identified for undergoing the Tier 2 assessment.
According to the
modelling results as summarised in Table 3.11, all the ASRs would be in compliance with the
hourly TSP criterion (i.e., not exceeding the hourly concentration of
500 µg/m3) as well as the corresponding AQOs for daily RSP (i.e.,
exceeding 100 µg/m3 for
no more than 9 times per year) and daily FSP (i.e.,
exceeding 75 µg/m3 for
no more than 9 times per year) under the Tier 1 mitigated scenario. Results summary for construction phase is
given in Appendix 3.15.
Table 3.11: Summary of Predicted Cumulative TSP, RSP and FSP Concentrations for Tier 1 Construction Dust at All ASRs (Mitigated and Unmitigated)
|
Air Pollutant |
Averaging Time |
Criteria (μg/m3) |
Allowable Exceedances
in a Year |
Scenario |
Range of Concentrations (μg/m3) |
Remark |
|
TSP |
1
hour |
500 |
0 |
Unmitigated |
166 - 1490 |
Maximum values |
|
Mitigated |
147 - 165 |
|||||
|
RSP |
24
hours |
100 |
9 |
Unmitigated |
73 - 87 |
10th maximum values |
|
Mitigated |
72 - 74 |
|||||
|
FSP |
24
hours |
75 |
9 |
Unmitigated |
54 - 56 |
10th maximum values |
|
Mitigated |
54 - 55 |
Total
Suspended Particulate (TSP)
According
to the cumulative dust modelling using PATH 2015 background and conservative
Tier 1 emissions, all ASRs are predicted to be in compliance with the TSP
criterion under the mitigated scenario. Figure 3.7 and 3.8 show Tier 1 hourly TSP concentration
contours for unmitigated and mitigated scenarios respectively.
Respirable Suspended Particulate (RSP)
According
to the cumulative dust modelling using PATH 2015 background and conservative
Tier 1 emissions, all ASRs are predicted to be in compliance with the AQO for
daily RSP under the mitigated scenario. Tier 1 daily RSP concentration contours
for unmitigated and mitigated scenarios are as shown in Figure 3.9 and 3.10 respectively.
Fine
Suspended Particulate (FSP)
According
to the cumulative dust modelling using PATH 2015 background and conservative
Tier 1 emissions, all ASRs are predicted to be in compliance with the AQO for
daily RSP under the mitigated scenario. Figure 3.11 and 3.12 show Tier 1 daily FSP concentration contours
for unmitigated and mitigated scenarios respectively.
Tier 2 Results
As all
sensitive receivers are compliant with the relevant criteria under the Tier 1
scenario, no Tier 2 assessment is necessary.
Annual
It should be noted that as explained in Section 3.7.4, the annual scenario represents a hypothetical worst case where 100% of the work areas are assumed as active areas that are generating dust and the annual results are for screening purposes.
According to the
modelling results as summarised in Table 3.12, all the ASRs would be in compliance with the
corresponding AQOs for annual RSP and annual FSP under the annual mitigated
scenario.
Table 3.12: Summary of Predicted Cumulative RSP and FSP Concentrations for Annual Construction Dust at All ASRs (Mitigated and Unmitigated)
|
Air Pollutant |
Averaging Time |
Criteria (μg/m3) |
Scenario |
Range of Concentrations (μg/m3) |
|
RSP |
Annual |
50 |
Unmitigated |
39
- 45 |
|
Mitigated |
38 - 39 |
|||
|
FSP |
Annual |
35 |
Unmitigated |
29* |
|
Mitigated |
29* |
* Note: all concentrations within the range are equal to the listed value after rounding off to zero decimal place.
Respirable Suspended Particulate (RSP)
According
to the cumulative dust modelling using PATH 2015 background and conservative
annual emissions, all ASRs are predicted to be in compliance with the AQO for
annual RSP under the mitigated scenario.
Figure
3.13 and 3.14 show annual RSP concentration contours for
unmitigated and mitigated scenarios respectively.
Fine
Suspended Particulate (FSP)
According
to the cumulative dust modelling using PATH 2015 background and conservative
annual emissions, all ASRs are predicted to be in compliance with the AQO for
annual FSP under the mitigated scenario. Figure 3.15 and 3.16 show annual FSP concentration contours for
unmitigated and mitigated scenarios respectively.
3.8.2 Operation
Phase
General
Vehicular emissions due to the increased
traffic along the Shum Wan Road from the operation of the Project would be major
source of nearby air emissions identified. It should be noted for approximately
half of the year, wind direction blows offshore, that is any traffic emissions
within the assessment area are blowing away from the ASRs. During the summer
months, when the wind is blowing onshore, historic measurements have shown the
background concentrations to be lower.
During the operation phase the major sources of air pollution include the road traffic and background sources. The major road servicing the Project is Shum Wan Road. The 24-hour traffic flows of all vehicles along Shum Wan Road, with and without the Project are shown Table 3.13. Additional traffic induced by all vehicles due to the Project development for 24 hours along Shum Wan Road is only 3% to 4%.
Table 3.13: 24-hour Traffic Flows of all Vehicles at Shum Wan Road - With Project and Without Project (Year 2017)
|
Road ID |
Road Name |
Bound |
24-hour
traffic flow - With project |
24-hour
traffic flow - Without project |
Additional
traffic induced by project development |
Additional
traffic induced by project development |
|
35 |
Shum Wan Road |
Northbound |
7490 |
7210 |
280 |
4% |
|
36 |
Shum Wan Road |
Southbound |
7605 |
7375 |
230 |
3% |
According to the government’s “A Clean Air Plan for Hong Kong, March 2013”, the total RSP emissions in Hong Kong from the vehicle fleet equates to 1,180 tonnes/year. Of this 1,150 tonnes (97%) can be attributed to heavy and light goods vehicles, franchised and non-franchised buses and private and public light buses. The total NO2 emissions in Hong Kong from the vehicle fleet equates to 32,700 tonnes/year. Of this 24,030 tonnes (73%) can be attributed to heavy and light goods vehicles, franchised and non-franchised buses and private and public light buses. As the aforementioned vehicles have the greatest bearing on the increase of emissions in the assessment area, the increase in heavy and light goods vehicles, franchised and non-franchised buses and private and public light buses due to the project development is summarised in Table 3.14. Additional traffic induced by such vehicles due to the Project development for 24 hours along Shum Wan Road is only 2% to 4%.
Table 3.14: 24-hour Traffic Flows of Heavy and Light Goods Vehicles, Franchised and Non-franchised Buses, Private and Public Light Buses at Shum Wan Road - With Project and Without Project (Year 2017)
|
Road ID |
Road Name |
Bound |
24 hour traffic flow - With project |
24 hour traffic flow - Without project |
Additional traffic induced by project
development |
Additional traffic induced by project
development |
|
35 |
Shum Wan Road |
Northbound |
2620 |
2525 |
95 |
4% |
|
36 |
Shum Wan Road |
Southbound |
2660 |
2605 |
55 |
2% |
Note: #Road Section will
be opened after 2017 upon the Wong Chuk Hang CDA Site
is in place
In view of the minor increases (not more than
4%) in the vehicular traffic flows along Shum Wan Road that would be caused by
the Project, it is anticipated that extra vehicular emissions due to the
induced traffic by the Project would have insignificant effect on the air
quality at all ASRs within the assessment area during the operation phase.
According to the modelling results as summarised in Table 3.15, all the ASRs would
be in compliance with the corresponding AQOs for daily and annual RSP; for
daily and annual FSP; as well as for hourly and annual NO2. Results summary for operation phase are found
in Appendix 3.16.
Table 3.15: Summary of Predicted Operation Cumulative RSP, FSP and NO2 Concentrations for All ASRs
|
Air Pollutant |
Averaging Time |
AQO (μg/m3) |
Allowable Exceedances
in a Year |
Range of Concentrations (μg/m3) |
Remark |
|
NO2 |
1 hour |
200 |
18 |
130 – 157 |
19th maximum values |
|
1 year |
40 |
0 |
22 – 36 |
Annual
average |
|
|
RSP |
24
hours |
100 |
9 |
73* |
10th maximum values |
|
1 year |
50 |
0 |
38 – 39 |
Annual average |
|
|
FSP |
24 hours |
75 |
9 |
55* |
10th maximum values |
|
1 year |
35 |
0 |
29* |
Annual average |
* Note: all concentrations within the range are equal to the listed value after rounding off to zero decimal place.
Background
Contribution
Contribution from road traffic within the assessment area and the background contribution are summarised in Table 3.16. For NO2, maximum contributions from the road traffic within the assessment area are 48% and 41% for hourly and annual NO2 respectively. For RSP there is maximum 1% contribution from road traffic within the assessment area for both daily and annual results. For FSP, maximum contributions from the road traffic within the assessment area are 1% and 2% for hourly and annual FSP respectively. Therefore, contributions to the predicted air quality impacts on the ASR would be mainly from the background rather than from the Project.
Table 3.16: Summary of Predicted Project and Background Contribution from Vehicular Emission During Operation Phase
|
Contribution from road traffic/background |
Air pollutant |
||
|
NO2 |
RSP |
FSP |
|
|
Hourly contribution from road traffic within the assessment area |
0% -64% (1) |
N/A |
N/A |
|
Hourly contribution from the background |
36% - 100% (1) |
N/A |
N/A |
|
Daily contribution from road traffic within the assessment area |
N/A |
0% - 1% (2) |
0% - 1% (2) |
|
Daily contribution from the background |
N/A |
99% - 100% (2) |
99% - 100% (2) |
|
Annual contribution from road traffic within the assessment area |
2% - 40% |
0% - 1% |
0% - 2% |
|
Annual contribution from the background |
60% - 98% |
99% - 100% |
98% - 100% |
Note: N/A - Not applicable
(1) - 19th Max Hourly contribution
(2) – 10th Highest Daily
Nitrogen Dioxide
(NO2)
The major source of NO2 during the
operation phase is the background and local vehicular emissions. The PATH model has projected the background
annual average NO2 concentration at the grid located at the Project
to be 21 µg/m3 in year 2015. According to the cumulative operation phase
modelling using PATH 2015 background, all ASRs are predicted to be in
compliance with the relevant AQO for NO2. Figure
3.17 and 3.18 show
hourly and annual NO2 concentration contours respectively.
Respirable Suspended Particulate (RSP)
The major source of RSP emissions during the
operation stage is expected due to background and local traffic emissions. The PATH model has projected the 10th
highest background daily average RSP at the grid located at the Project to be 73 µg/m3.
According to the cumulative operation phase modelling using PATH 2015
background, all ASRs are predicted to be in compliance with the relevant AQO
for RSP. Figure 3.19 and 3.20 show
daily and annual RSP concentration contours respectively.
Fine Suspended
Particulate (FSP)
The major source of FSP emissions during the
operation phase is from background and local traffic emissions. The PATH model
has projected the 10th highest background daily average FSP at the
grid located at the Project to be 54 µg/m3
in year 2015. According to the
cumulative operation phase modelling using PATH 2015 background, all ASRs are
predicted to be in compliance with the relevant AQO for FSP. Figures 3.21 and 3.22 show
daily and annual RSP concentration contours respectively.
3.9 Mitigation of Adverse Environmental
Impact
3.9.1 Construction
Phase
Dust
Control Measures
To
achieve compliance with the FSP, RSP and TSP criteria during the construction
phase, good practices for dust control should be implemented to reduce dust
impacts. The dust control measures are detailed as follows:
§ Use of regular water spraying (once every 2.5 hours or 4 times per day) to reduce dust emissions from heavy construction activities (including ground excavation, earth moving, etc.) at all active works area, exposed site surfaces and unpaved roads, particularly during dry weather.
§ Covering 80% of stockpiling area by impervious sheets and spraying all dusty material with water immediately prior to any loading transfer operations to keep the dusty materials wet during material handling at the stockpile areas.
Good Site Management
§ Good site management is important to help reduce potential air quality impact down to an acceptable level. As a general guide, the Contractor should maintain high standards of housekeeping to prevent emissions of fugitive dust. Loading, unloading, handling and storage of raw materials, wastes or by-products should be carried out in a manner so as to minimise the release of visible dust emission. Any piles of materials accumulated on or around the work areas should be cleaned up regularly. Cleaning, repair and maintenance of all plant facilities within the work areas should be carried out in a manner minimising generation of fugitive dust emissions. The material should be handled properly to prevent fugitive dust emission before cleaning.
Disturbed Parts of the Roads
§ Main temporary access points should be paved with concrete, bituminous hardcore materials or metal plates and be kept clear of dusty materials; or
§ Unpaved parts of the road should be sprayed with water or a dust suppression chemical so as to keep the entire road surface wet.
Exposed Earth
§ Exposed earth should be properly treated by compaction, hydroseeding, vegetation planting or seating with latex, vinyl, bitumen within six months after the last construction activity on the site or part of the site where the exposed earth lies.
Loading, Unloading or Transfer of Dusty Materials
§ All dusty materials should be sprayed with water immediately prior to any loading or transfer operation so as to keep the dusty material wet.
Debris Handling
§ Any debris should be covered entirely by impervious sheeting or stored in a debris collection area sheltered on the top and the three sides.
§ Before debris is dumped into a chute, water should be sprayed onto the debris so that it remains wet when it is dumped.
Transport of Dusty Materials
§ Vehicles used for transporting dusty materials/ spoils should be covered with tarpaulin or similar material. The cover should extend over the edges of the sides and tailboards.
Wheel washing
§ Vehicle wheel washing facilities should be provided at each construction site exit. Immediately before leaving the construction site, every vehicle should be washed to remove any dusty materials from its body and wheels.
Use of vehicles
§ The speed of the trucks within the Project area should be controlled to about 10 km/hour in order to reduce adverse dust impacts and secure the safe movement around the Project area.
§ Immediately before leaving the construction site, every vehicle should be washed to remove any dusty materials from its body and wheels.
§ Where a vehicle leaving the construction site is carrying a load of dusty materials, the load should be covered entirely by clean impervious sheeting to ensure that the dusty materials do not leak from the vehicle.
Site hoarding
§ Where a site boundary adjoins a road, street, service lane or other area accessible to the public, hoarding of not less than 2.4 m high from ground level should be provided along the entire length of that portion of the site boundary except for a site entrance or exit.
3.9.2
Operation Phase
As all ASRs would comply with the corresponding AQO for RSP, FSP and NO2, no mitigation measure during the operation phase is required.
3.10 Evaluation of Residual Impact
3.10.1
Construction Phase
With
proper implementation of the recommended mitigation measures, all ASRs are
predicted to comply with the TSP criterion as well as the relevant AQO for RSP
and FSP, hence there are no adverse residual impacts anticipated during the
construction phase.
3.10.2
Operation Phase
The project is assessed to be in compliance
with the AQO for FSP, RSP and NO2 during the operation phase, hence no adverse residual impacts are anticipated.
3.11 Conclusion
3.11.1 Construction
Phase
Potential air quality impacts from the construction works of the Project
would mainly be related to construction dust from site clearance, excavation,
foundation and site formation works. With proper implementation of the recommended
mitigation measures, it has been assessed that all ASRs are predicted to comply
with the TSP criterion as well as the relevant AQO for RSP and FSP. Hence,
there are no adverse residual air quality impacts
anticipated during the construction phase.
3.11.2 Operation
Phase
Vehicular emissions due to the increased traffic along the Shum Wan Road from the operation of the Project would be major source of air emissions identified. Based on the modelling results, it is predicted that all the identified ASRs would be in compliance with the AQOs for daily RSP, annual RSP, daily FSP, annual FSP, hourly NO2 and annual NO2. Hence, no adverse residual air quality impacts are anticipated during the operation phase.