|
Agreement
No. CE 72/2019 (EP) Environmental Impact Assessment (EIA) Report for the New Contaminated Sediment Disposal Facility to the West of Lamma Island
July 2022
|
3.
Water Quality Impact
3.1
Introduction
This Section presents an evaluation of the potential water quality impacts from the construction and operation of the Project in accordance with Clause 3.4.3 of the EIA Study Brief, and the results were assessed with reference to the relevant environmental legislation, standards and criteria.
3.2
Relevant
Legislation and Guidelines
The following legislation and relevant guidance or non-statutory guidelines are applicable to the evaluation of water quality impacts associated with the construction and operation of the Project:
§ Water Pollution Control Ordinance (WPCO);
§ Technical Memorandum for Effluents Discharged into Drainage and Sewerage Systems, Inland and Coastal Waters (TM- ICW);
§ Environmental Impact Assessment Ordinance (EIAO) and the Technical Memorandum on EIA Process (EIAO-TM), Annexes 6 and 14; and
§ Practice Note for Professional Persons, Construction Site Drainage (ProPECC PN1/94).
3.2.1 Water Pollution Control Ordinance
(WPCO)
The Water Pollution Control Ordinance (WPCO) is the primary legislation for the control of water pollution and water quality in Hong Kong. Under the WPCO, Hong Kong waters are divided into 10 Water Control Zones (WCZs). Each WCZ has a designated set of statutory Water Quality Objectives (WQOs).
The proposed CMPs are situated to the west of Lamma Island within the Southern WCZ under the WPCO. According to Clause 3.4.3.2 of the EIA Study Brief, the Assessment Area for water quality impact assessment shall cover the Southern WCZ and Western Buffer WCZ as designated under the WPCO. In addition, some of the concurrent projects are located close to the Victoria Harbour WCZ and the Assessment Area is therefore extended to cover Victoria Harbour WCZ for cumulative assessment. The applicable WQOs for these WCZs are presented in Table 3.1.
Table 3.1 Summary of Water Quality Objectives for Southern WCZ, Western Buffer WCZ and Victoria Harbour WCZ
|
|
Water Quality Objective |
Southern WCZ |
Western Buffer WCZ |
Victoria Harbour WCZ |
|
A |
AESTHETIC APPEARANCE |
|
|
|
|
a) |
Waste discharges shall cause no objectionable odours or discolouration of the water. |
Whole zone |
Not applicable |
Not applicable |
|
b) |
There should be no objectionable odours or discolouration of the water. |
Not applicable |
Whole zone |
Whole zone |
|
c) |
Tarry residues, floating wood, articles made of glass, plastic, rubber or of any other substances should be absent. |
Whole zone |
Whole zone |
Whole zone |
|
d) |
Mineral oil should not be visible on the surface. Surfactants should not give rise to lasting foam. |
Whole zone |
Whole zone |
Whole zone |
|
e) |
There should be no recognisable sewage-derived debris. |
Whole zone |
Whole zone |
Whole zone |
|
f) |
Floating, submerged and semi-submerged objects of a size likely to interfere with the free movement of vessels, or cause damage to vessels, should be absent. |
Whole zone |
Whole zone |
Whole zone |
|
g) |
Waste discharges shall not cause the water to contain substances which settle to form objectionable deposits. |
Whole zone |
Not applicable |
Not applicable |
|
h) |
The water should not contain substances which settle to form objectionable deposits. |
Not applicable |
Whole zone |
Whole zone |
|
B |
BACTERIA |
|
|
|
|
a) |
The level of Escherichia coli should not exceed 610 per 100 mL, calculated as the geometric mean of all samples collected in one calendar year. |
Secondary Contact Recreation Subzones & Fish Culture Subzones |
Secondary Contact Recreation Subzones and Fish Culture Subzones |
Not applicable |
|
b) |
The level of Escherichia coli should not exceed 180 per 100 mL, calculated as the geometric mean of all samples collected from March to October inclusive in one calendar year. Samples should be taken at least 3 times in a calendar month at intervals of between 3 and 14 days. |
Bathing Beach Subzones |
Recreation Subzones |
Not applicable |
|
c) |
The level of Escherichia coli should be less than 1 per 100 mL, calculated as the running median of the most recent 5 consecutive samples taken at intervals of between 7 and 21 days. |
Not applicable |
Water Gathering Ground Subzones |
Not applicable |
|
d) |
The level of Escherichia coli should not exceed 1000 per 100 mL, calculated as the geometric mean of the most recent 5 consecutive samples taken at intervals of between 7 and 21 days. |
Not applicable |
Other inland waters |
Inland waters |
|
C |
COLOR |
|
|
|
|
a) |
Human activity should not cause the colour of water to exceed 30 Hazen units. |
Not applicable |
Water Gathering Ground Subzones |
Not applicable |
|
b) |
Human activity should not cause the colour of water to exceed 50 Hazen units. |
Not applicable |
Other inland waters |
Inland waters |
|
D |
DISSOLVED OXYGEN |
|
|
|
|
a) |
Waste discharges shall not cause the level of dissolved oxygen to fall below 4 milligrams per litre for 90% of the sampling occasions during the year; values should be calculated as the water column average (arithmetic mean of at least 3 measurements at 1 metre below surface, mid-depth, and 1 metre above seabed). In addition, the concentration of dissolved oxygen should not be less than 2 milligrams per litre within 2 metres of the seabed for 90% of the sampling occasions during the year. |
Marine waters excepting Fish Culture Subzones |
Marine waters excepting Fish Culture Subzones |
Not applicable |
|
b) |
The dissolved oxygen level should not be less than 5 milligrams per litre for 90% of the sampling occasions during the year; values should be calculated as water column average (arithmetic mean of at least 3 measurements at 1 metre below surface, mid-depth and 1 metre above seabed). In addition, the concentration of dissolved oxygen should not be less than 2 milligrams per litre within 2 metres of the seabed for 90% of the sampling occasions during the year. |
Fish Culture Subzones |
Fish Culture Subzones |
Not applicable |
|
c) |
Waste discharges shall not cause the level of dissolved oxygen to be less than 4 milligrams per litre. |
Inland waters of the Zone |
Not applicable |
Not applicable |
|
d) |
The level of dissolved oxygen should not fall below 4 mg per litre for 90% of the sampling occasions during the whole year; values should be calculated as the annual water column average (see Note). In addition, the concentration of dissolved oxygen should not be less than 2 mg per litre within 2 m of the seabed for 90% of the sampling occasions during the whole year. |
Not applicable |
Not applicable |
Marine waters |
|
e) |
The level of dissolved oxygen should not be less than 4 mg per litre. |
Not applicable |
Water Gathering Ground Subzones and other inland waters |
Inland waters |
|
E |
pH |
|
|
|
|
a) |
The pH of the water should be within the range of 6.5-8.5 units. In addition, waste discharges shall not cause the natural pH range to be extended by more than 0.2 units. |
Marine waters excepting Bathing Beach Subzones; Mui Wo (A), Mui Wo (B), Mui Wo (C), Mui Wo (E) and Mui Wo (F) Subzones |
Not applicable |
Not applicable |
|
b) |
The pH of the water should be within the range of 6.5-8.5 units. In addition, human activity should not cause the natural pH range to be extended by more than 0.2 unit. |
Not applicable |
Marine waters |
Marine waters |
|
c) |
The pH of the water should be within the range of 6.0-9.0 units. |
Mui Wo (D) Sub-zone and other inland waters. |
Not applicable |
Not applicable |
|
d) |
Human activity should not cause the pH of the water to exceed the range of 6.0-9.0 units. |
Not applicable |
Other inland waters |
Inland waters |
|
e) |
The pH of the water should be within the range of 6.0-9.0 units for 95% of samples. In addition, waste discharges shall not cause the natural pH range to be extended by more than 0.5 units. |
Bathing Beach Subzones |
Not applicable |
Not applicable |
|
f) |
Human activity should not cause the pH of the water to exceed the range of 6.5-8.5 units. |
Not applicable |
Water Gathering Ground Subzones |
Not applicable |
|
F |
TEMPERATURE |
|
|
|
|
a) |
Waste discharges shall not cause the natural daily temperature range to change by more than 2.0 degrees Celsius. |
Whole zone |
Not applicable |
Not applicable |
|
b) |
Human activity should not cause the natural daily temperature range to change by more than 2.0ºC. |
Not applicable |
Whole zone |
Whole zone |
|
G |
SALINITY |
|
|
|
|
a) |
Waste discharges shall not cause the natural ambient salinity level to change by more than 10%. |
Whole zone |
Not applicable |
Not applicable |
|
b) |
Human activity should not cause the natural ambient salinity level to change by more than 10%. |
Not applicable |
Whole zone |
Whole zone |
|
H |
SUSPENDED SOLIDS |
|
|
|
|
a) |
Waste discharges shall neither cause the natural ambient level to be raised by 30% nor give rise to accumulation of suspended solids which may adversely affect aquatic communities. |
Marine waters |
Not applicable |
Not applicable |
|
b) |
Human activity should neither cause the natural ambient level to be raised by more than 30% nor give rise to accumulation of suspended solids which may adversely affect aquatic communities. |
Not applicable |
Marine waters |
Marine waters |
|
c) |
Waste discharges shall not cause the annual median of suspended solids to exceed 20 milligrams per litre. |
Mui Wo (A), Mui Wo (B), Mui Wo (C), Mui Wo (E) and Mui Wo (F) Subzones |
Not applicable |
Not applicable |
|
d) |
Human activity should not cause the annual median of suspended solids to exceed 20 mg per litre. |
Not applicable |
Water Gathering Ground Subzones |
Not applicable |
|
e) |
Waste discharges shall not cause the annual median of suspended solids to exceed 25 milligrams per litre. |
Mui Wo (D) Sub-zone and other inland waters |
Not applicable |
Not applicable |
|
f) |
Human activity should not cause the annual median of suspended solids to exceed 25 mg per litre. |
Not applicable |
Other inland waters |
Inland waters |
|
I |
AMMONIA |
|
|
|
|
a) |
The ammonia nitrogen level should not be more than 0.021 milligram per litre, calculated as the annual average (arithmetic mean), as unionised form. |
Whole zone |
Not applicable |
Not applicable |
|
b) |
The un-ionized ammoniacal nitrogen level should not be more than 0.021 mg per litre, calculated as the annual average (arithmetic mean). |
Not applicable |
Whole zone |
Whole zone |
|
J |
NUTRIENTS |
|
|
|
|
a) |
Nutrients shall not be present in quantities sufficient to cause excessive or nuisance growth of algae or other aquatic plants. |
Marine waters |
Marine waters |
Marine waters |
|
b) |
Without limiting the generality of objective (a) above, the level of inorganic nitrogen should not exceed 0.1 milligram per litre, expressed as annual water column average (arithmetic mean of at least 3 measurements at 1 metre below surface, mid-depth and 1 metre above seabed). |
Marine waters |
Not applicable |
Not applicable |
|
c) |
Without limiting the generality of objective (a) above, the level of inorganic nitrogen should not exceed 0.4 mg per litre, expressed as annual water column average (arithmetic mean of at least 3 measurements at 1 m below surface, mid-depth and 1 m above seabed). |
Not applicable |
Marine waters |
Marine waters |
|
K |
5-DAY BIOCHEMICAL OXYGEN DEMAND |
|
|
|
|
a) |
The 5-day biochemical oxygen demand should not exceed 3 mg per litre. |
Not applicable |
Water Gathering Ground Subzones |
Not applicable |
|
b) |
Waste discharges shall not cause the 5-day biochemical oxygen demand to exceed 5 milligrams per litre. |
Inland waters of the Zone |
Not applicable |
Not applicable |
|
c) |
The 5-day biochemical oxygen demand should not exceed 5 mg per litre. |
Not applicable |
Other inland waters |
Inland waters |
|
L |
CHEMICAL OXYGEN DEMAND |
|
|
|
|
a) |
The chemical oxygen demand should not exceed 15 mg per litre. |
Not applicable |
Water Gathering Ground Subzones |
Not applicable |
|
b) |
Waste discharges shall not cause the chemical oxygen demand to exceed 30 milligrams per litre. |
Inland waters of the Zone |
Not applicable |
Not applicable |
|
c) |
The chemical oxygen demand should not exceed 30 mg per litre. |
Not applicable |
Other inland waters |
Inland waters |
|
M |
DANGEROUS SUBSTANCES / TOXIC SUBSTANCES |
|
|
|
|
a) |
Waste discharges shall not cause the concentrations of dangerous substances in marine waters to attain such levels as to produce significant toxic effects in humans, fish or any other aquatic organisms, with due regard to biologically cumulative effects in food chains and to toxicant interactions with each other. |
Whole zone |
Not applicable |
Not applicable |
|
b) |
Toxic substances in the water should not attain such levels as to produce significant toxic, carcinogenic, mutagenic or teratogenic effects in humans, fish or any other aquatic organisms, with due regard to biologically cumulative effects in food chains and to interactions of toxic substances with each other. |
Not applicable |
Whole zone |
Whole zone |
|
c) |
Waste discharges of dangerous substances shall not put a risk to any beneficial uses of the aquatic environment. |
Whole zone |
Not applicable |
Not applicable |
|
d) |
Human activity should not cause a risk to any beneficial use of the aquatic environment. |
Not applicable |
Whole zone |
Whole zone |
|
N |
TURBIDITY |
|
|
|
|
|
Waste discharges shall not reduce light transmission substantially from the normal level. |
Not applicable |
Bathing Beach Subzones |
Not applicable |
3.2.2 Technical Memorandum for Effluents
Discharged into Drainage and Sewerage Systems, Inland and Coastal Waters
(TM-ICW)
All discharges from the construction and operation phases of the proposed Project are required to comply with the Technical Memorandum Standards for Effluents Discharged into Drainage and Sewerage Systems, Inland and Coastal Waters (TM-ICW) issued under Section 21 of the WPCO.
The TM-ICW defines acceptable discharge limits to different types of receiving waters. Under the TM-ICW, effluents discharged into the drainage and sewerage systems, inshore and coastal waters of the WCZs are subject to pollutant concentration standards for specified discharge volumes. These are defined by the Environmental Protection Department (EPD) and are specified in licence conditions for any new discharge within a WCZ.
3.2.3
Technical
Memorandum on Environmental Impact Assessment Process (EIAO-TM)
Annexes 6 and 14 of the EIAO-TM provide general guidelines and criteria to be used in assessing water quality impacts.
The EIAO-TM recognises that, in the application of the above water quality criteria, it may not be possible to achieve the WQO at the point of discharge as there are areas which are subjected to greater impacts (which are termed by the EPD as the mixing zones), where the initial dilution of the discharge takes place. The definition of this area is determined on a case-by-case basis. In general, the criteria for acceptance of the mixing zones are that it must not impair the integrity of the water body as a whole and must not damage the ecosystem.
3.2.4
Practice Note for Professional Persons, Construction Site
Drainage
Apart from the above statutory requirements, the Practice Note for Professional Persons, Construction Site Drainage (ProPECC PN 1/94), issued by EPD in 1994, also provide useful guidelines on the prevention of water pollution associated with construction activities.
3.3
Baseline
Conditions
3.3.1 Assessment Area
According to Clause 3.4.3.2 of the EIA Study Brief, the Assessment Area for water quality impact assessment shall cover the Southern WCZ and Western Buffer WCZ as designated under the WPCO.
Water depth within the Assessment Area varies. In the East Lamma Channel, water depth typically exceeds -20 mPD with the exception of coastal waters. In the West Lamma Channel (where the proposed CMPs are located), water depth is generally less than -10 mPD in waters between Lamma and the Lantau Island. Waters south of Lamma is generally deeper and exceeds -20 mPD.
3.3.2 Marine Water Quality
Baseline marine water quality of the Assessment Area has been determined through a review of EPD routine water quality monitoring data collected between 1986 and 2020. This dataset provides Hong Kong’s most comprehensive long-term water quality monitoring data and allows an indication of temporal and spatial change in marine water quality in Hong Kong. Water quality monitoring data from EPD monitoring stations that are located within or close to the Assessment Area were used to provide the baseline water quality conditions of the Assessment Area. The monitoring results from 1986 to 2020 at the selected monitoring stations are summarised in Table 3.2 and Table 3.3. Locations of these stations are presented in Figure 3.1.
Compliance with the WQOs is generally observed in most water quality parameters at the selected monitoring stations at the relevant WCZs, except for total inorganic nitrogen (TIN) levels. TIN levels consistently exceeded the WQO at all stations within the Southern WCZ and VM14 and VM15 within the Victoria Harbour WCZ during the period reviewed (Table 3.3), as a result of contribution from the Pearl River as well as the relatively low TIN criterion.
Table 3.2 Summary of EPD Routine Water Quality Monitoring Data from Selected Stations within the Assessment Area (1986 – 2020)
|
Parameter |
SM3 |
SM4 |
SM5 |
SM6 |
SM7 |
SM9 |
SM10 |
SM11 |
SM12 |
|
Temperature (°C) |
23.0 |
23.4 |
23.7 |
23.4 |
23.6 |
23.5 |
23.7 |
23.7 |
23.7 |
|
|
(14.2-29.4) |
(14.3-29.3) |
(14.2-29.6) |
(14.0-29.4) |
(14.2-29.8) |
(14.2-29.6) |
(13.5-29.9) |
(13.5-29.9) |
(13.7-29.7) |
|
Salinity (psu) |
32.2 |
31.5 |
31.1 |
31.4 |
30.7 |
30.3 |
30.0 |
30.2 |
30.4 |
|
|
(28.2-34.5) |
(24.2-34.4) |
(18.0-34.3) |
(22.9-34.3) |
(20.0-34.4) |
(19.5-34.3) |
(16.8-34.8) |
(14.9-34.3) |
(14.9-34.3) |
|
Dissolved Oxygen |
6.2 |
6.3 |
6.7 |
6.5 |
6.5 |
6.1 |
6.7 |
6.9 |
6.9 |
|
(mg L-1) |
(3.2-11.0) |
(3.1-11.3) |
(4.1-11.7) |
(3.5-10.4) |
(3.4-10.9) |
(3.2-9.4) |
(3.0-11.4) |
(3.1-11.6) |
(3.4-11.2) |
|
Dissolved Oxygen |
5.9 |
6.1 |
6.3 |
5.9 |
6.2 |
5.8 |
6.7 |
6.6 |
6.7 |
|
(mg L-1) - Bottom |
(1.3-13.4) |
(1.5-10.4) |
(2.0-10.4) |
(0.3-9.6) |
(2.2-11.1) |
(2.3-8.8) |
(2.0-10.8) |
(0.5-11.5) |
(2.4-11.4) |
|
Suspended Solids (mg L-1) |
5.1 |
4.4 |
5.9 |
5.8 |
6.8 |
8.3 |
9.0 |
8.1 |
8.8 |
|
(0.5-30.0) |
(0.7-26.5) |
(0.8-23.7) |
(0.8-33.7) |
(0.9-45.3) |
(0.9-46.4) |
(0.5-107.8) |
(0.8-46.7) |
(0.6-40.8) |
|
|
5-day Biochemical |
0.7 |
0.8 |
0.9 |
0.9 |
1.0 |
0.8 |
1.1 |
1.2 |
1.0 |
|
Oxygen Demand (mg L-1) |
(0.2-3.7) |
(0.1-3.5) |
(0.1-3.6) |
(0.1-3.7) |
(0.1-4.5) |
(0.1-3.0) |
(0.1-4.2) |
(0.1-4.4) |
(0.1-3.5) |
|
Unionised Ammonia |
0.002 |
0.003 |
0.002 |
0.002 |
0.003 |
0.004 |
0.004 |
0.004 |
0.003 |
|
(mg L-1) |
(<0.001-0.032) |
(0.001-0.017) |
(<0.001-0.018) |
(<0.001-0.025) |
(<0.001-0.016) |
(0.001-0.020) |
(0.001-0.022) |
(0.001-0.029) |
(0.001-0.028) |
|
Total Inorganic Nitrogen |
0.15 |
0.19 |
0.16 |
0.17 |
0.25 |
0.34 |
0.31 |
0.28 |
0.24 |
|
(mg L-1) |
(0.01-0.52) |
(0.01-1.04) |
(0.02-0.95) |
(0.01-0.87) |
(0.01-1.17) |
(0.05-1.15) |
(0.04-1.27) |
(0.02-1.22) |
(0.02-1.31) |
|
Orthophosphate |
0.014 |
0.015 |
0.012 |
0.013 |
0.017 |
0.022 |
0.019 |
0.019 |
0.016 |
|
Phosphorus (mg L-1) |
(0.003-0.039) |
(0.002-0.053) |
(0.003-0.102) |
(0.002-0.047) |
(0.002-0.040) |
(0.003-0.117) |
(0.002-0.056) |
(0.002-0.069) |
(0.002-0.046) |
|
Total Phosphorus (mg L-1) |
0.04 |
0.04 |
0.04 |
0.04 |
0.05 |
0.05 |
0.05 |
0.05 |
0.05 |
|
|
(0.02-0.23) |
(0.02-0.23) |
(0.02-0.23) |
(0.02-0.23) |
(0.02-0.25) |
(0.02-0.31) |
(0.02-0.74) |
(0.02-0.46) |
(0.02-0.48) |
|
Chlorophyll-a (µg L-1) |
2.7 |
3.8 |
4.4 |
4.2 |
5.2 |
3.9 |
6.9 |
7.4 |
5.9 |
|
|
(0.3-13.5) |
(0.3-30.7) |
(0.3-36.3) |
(0.3-37.3) |
(0.3-31.7) |
(0.3-27.7) |
(0.3-42.0) |
(0.3-49.0) |
(0.3-46.0) |
|
Escherichia coli |
29 |
19 |
2 |
3 |
13 |
55 |
12 |
6 |
31 |
|
(cfu/100ml) |
(1-3730) |
(1-6067) |
(1-790) |
(1-267) |
(1-2887) |
(1-9533) |
(1-2462) |
(1-480) |
(1-33354) |
Notes:
1. Data presented are depth-averaged values calculated by taking the means of three depths, i.e. surface (S), mid-depth (M) and bottom (B), except as specified.
2. Data presented are annual arithmetic means except for E. coli, which are geometric means.
3. Shaded cells indicate non-compliance with the WQOs.
Table 3.3 Summary of EPD Routine Water Quality Monitoring Data from Selected Stations within the Assessment Area (1986 – 2020)
|
Parameter |
WM1 |
WM2 |
WM3 |
WM4 |
VM6 |
VM7 |
VM8 |
VM12 |
VM14 |
VM15 |
|
Temperature (°C) |
22.9 |
23.2 |
23.1 |
23.1 |
23.1 |
23.1 |
23.1 |
23.1 |
23.4 |
23.5 |
|
|
(14.7-29.4) |
(14.7-29.6) |
(14.3-29.5) |
(14.8-29.5) |
(11.3-29.5) |
(11.4-29.5) |
(11.4-29.5) |
(11.5-29.6) |
(11.7-29.7) |
(15.9-29.6) |
|
Salinity (psu) |
32.0 |
31.0 |
31.4 |
31.0 |
31.2 |
31.0 |
31.0 |
30.9 |
29.5 |
31.0 |
|
|
(26.0-34.4) |
(23.6-34.2) |
(22.5-34.2) |
(18.5-34.2) |
(23.6-34.1) |
(21.7-33.9) |
(22.5-34.2) |
(23.5-34.1) |
(14.1-34.1) |
(21.1-34.0) |
|
Dissolved Oxygen |
6.1 |
6.0 |
5.7 |
5.7 |
5.0 |
5.2 |
5.8 |
5.1 |
5.3 |
5.2 |
|
(mg L-1) |
(2.7-9.7) |
(3.2-9.1) |
(2.8-9.4) |
(2.7-9.6) |
(2.0-11.2) |
(2.3-8.5) |
(3.0-10.8) |
(2.1-8.5) |
(2.8-10.3) |
(2.9-7.7) |
|
Dissolved Oxygen |
5.8 |
5.8 |
5.5 |
5.5 |
4.7 |
4.9 |
5.6 |
4.9 |
5.1 |
4.9 |
|
(mg L-1) - Bottom |
(1.5-9.8) |
(2.2-11.5) |
(1.3-12.0) |
(1.4-12.2) |
(0.2-13.6) |
(1.8-8.6) |
(1.3-13.1) |
(2.0-12.3) |
(2.0-8.6) |
(0.4-7.6) |
|
Suspended Solids (mg L-1) |
5.8 |
6.5 |
7.8 |
8.7 |
6.0 |
6.6 |
8.0 |
10.5 |
7.1 |
7.7 |
|
(0.8-22.6) |
(0.9-28.8) |
(1.1-41.8) |
(1.0-48.7) |
(1.0-29.0) |
(1.0-32.3) |
(1.0-69.0) |
(1.5-57.0) |
(1.2-37.7) |
(1.1-60.0) |
|
|
5-day Biochemical |
0.7 |
0.7 |
0.7 |
0.7 |
1.0 |
1.0 |
0.9 |
0.9 |
1.0 |
0.9 |
|
Oxygen Demand (mg L-1) |
(0.1-2.9) |
(0.1-3.3) |
(0.1-3.3) |
(0.2-2.9) |
(0.1-3.4) |
(0.1-7.1) |
(0.2-6.2) |
(0.1-9.3) |
(0.1-7.2) |
(0.1-4.2) |
|
Unionised Ammonia |
0.003 |
0.004 |
0.006 |
0.004 |
0.008 |
0.009 |
0.007 |
0.008 |
0.008 |
0.007 |
|
(mg L-1) |
(0.000-0.020) |
(0.001-0.015) |
(0.001-0.023) |
(0.001-0.015) |
(0.001-0.055) |
(0.001-0.035) |
(0.001-0.088) |
(0.001-0.036) |
(0.001-0.182) |
(0.001-0.041) |
|
Total Inorganic Nitrogen |
0.18 |
0.29 |
0.31 |
0.30 |
0.38 |
0.39 |
0.32 |
0.39 |
0.43 |
0.41 |
|
(mg L-1) |
(0.02-0.50) |
(0.06-0.77) |
(0.09-0.69) |
(0.11-0.70) |
(0.10-0.95) |
(0.02-0.93) |
(0.04-1.58) |
(0.05-0.86) |
(0.10-1.45) |
(0.13-0.91) |
|
Orthophosphate |
0.016 |
0.022 |
0.027 |
0.024 |
0.039 |
0.039 |
0.028 |
0.038 |
0.037 |
0.037 |
|
Phosphorus (mg L-1) |
(0.002-0.079) |
(0.003-0.105) |
(0.003-0.103) |
(0.003-0.133) |
(0.002-0.158) |
(0.003-0.100) |
(0.003-0.187) |
(0.005-0.106) |
(0.003-0.150) |
(0.004-0.092) |
|
Total Phosphorus (mg L-1) |
0.05 |
0.05 |
0.06 |
0.05 |
0.08 |
0.08 |
0.06 |
0.07 |
0.07 |
0.07 |
|
|
(0.02-0.38) |
(0.02-0.46) |
(0.02-0.31) |
(0.02-0.50) |
(0.02-0.37) |
(0.02-0.36) |
(0.02-0.40) |
(0.02-0.34) |
(0.02-0.32) |
(0.03-0.34) |
|
Chlorophyll-a (µg L-1) |
2.7 |
2.9 |
2.4 |
2.2 |
3.2 |
3.2 |
3.3 |
2.7 |
2.9 |
3.5 |
|
|
(0.2-25.3) |
(0.3-35.0) |
(0.2-19.5) |
(0.2-16.1) |
(0.3-31.3) |
(0.2-29.3) |
(0.2-40.3) |
(0.2-32.0) |
(0.2-28.3) |
(0.2-45.0) |
|
Escherichia coli |
112 |
223 |
761 |
259 |
3639 |
2647 |
921 |
1588 |
1167 |
1710 |
|
(cfu/100ml) |
(1-8400) |
(1-16867) |
(4-40000) |
(1-26333) |
(30-50000) |
(15-68503) |
(10-120567) |
(51-184000) |
(12-101167) |
(10-78033) |
Notes:
1. Data presented are depth-averaged values calculated by taking the means of three depths, i.e. surface (S), mid-depth (M) and bottom (B), except as specified.
2. Data presented are annual arithmetic means except for E. coli, which are geometric means.
3. Shaded cells indicate non-compliance with the WQOs.
3.3.3 Water Quality in Typhoon Shelter
Five EPD water quality monitoring stations in typhoon shelters were identified within the Assessment Area, namely ST1 (Cheung Chau), ST3 (Hei Ling Chau), VT8 (Rambler Channel), VT10 (New Yau Ma Tei) and VT12 (Government Dockyard). Locations of these typhoon shelter stations in the Assessment Area are presented in Figure 3.1. Baseline water quality of these stations has been determined through a review of water quality monitoring data between 1986 and 2020.
The monitoring results are presented in Table 3.4 and indicate the compliance with the WQOs for most parameters at all stations, except the TIN levels at all stations exceeded the WQO for Southern WCZ (0.1 mg L-1) and Victoria Harbour WCZ (0.4 mg L-1). In addition, Escherichia coli (E. coli) levels at station VT10 were consistently high over the years from 1986 to 2020.
Table 3.4 Summary of EPD Typhoon Shelter Water Quality Monitoring Data within the Assessment Area (1986 – 2020)
|
Parameter |
ST1 |
ST3 |
VT8 |
VT10 |
VT12 |
|
Temperature (°C) |
24.4 |
24.3 |
24.3 |
24.2 |
24.4 |
|
|
(16.5-30.0) |
(16.8-29.9) |
(17.3-30.2) |
(16.9-29.9) |
(17.1-30.1) |
|
Salinity (psu) |
29.8 |
29.7 |
29.0 |
29.9 |
29.8 |
|
|
(21.2-33.2) |
(21.0-33.4) |
(18.2-33.1) |
(22.5-33.0) |
(22.9-32.7) |
|
Dissolved Oxygen |
6.5 |
7.0 |
5.2 |
4.2 |
4.5 |
|
(mg L-1) |
(4.3-11.8) |
(4.3-11.7) |
(2.9-9.4) |
(2.2-7.9) |
(2.5-10.9) |
|
Dissolved Oxygen |
6.4 |
6.9 |
5.3 |
4.1 |
4.5 |
|
(mg L-1) - Bottom |
(3.8-10.7) |
(3.9-11.3) |
(2.5-9.4) |
(2.2-7.4) |
(2.6-10.4) |
|
Suspended Solids (mg L-1) |
7.9 |
9.3 |
10.1 |
7.2 |
9.7 |
|
(1.1-25.7) |
(0.8-34.7) |
(1.9-23.0) |
(1.6-22.5) |
(2.2-43.9) |
|
|
5-day Biochemical |
1.1 |
1.3 |
0.7 |
1.1 |
1.1 |
|
Oxygen Demand (mg L-1) |
(0.3-2.7) |
(0.3-4.5) |
(0.2-4.0) |
(0.3-5.1) |
(0.2-5.1) |
|
Unionised Ammonia |
0.004 |
0.003 |
0.005 |
0.008 |
0.007 |
|
(mg L-1) |
(0.001-0.009) |
(0.001-0.011) |
(0.001-0.012) |
(0.002-0.024) |
(0.002-0.017) |
|
Total Inorganic Nitrogen |
0.28 |
0.30 |
0.49 |
0.55 |
0.48 |
|
(mg L-1) |
(0.09-0.63) |
(0.10-0.68) |
(0.20-1.15) |
(0.32-0.88) |
(0.27-0.73) |
|
Orthophosphate |
0.013 |
0.014 |
0.025 |
0.037 |
0.036 |
|
Phosphorus (mg L-1) |
(0.002-0.030) |
(0.002-0.030) |
(0.007-0.047) |
(0.011-0.071) |
(0.003-0.063) |
|
Total Phosphorus (mg L-1) |
0.040 |
0.042 |
0.054 |
0.075 |
0.072 |
|
|
(0.02-0.10) |
(0.02-0.14) |
(0.04-0.11) |
(0.05-0.13) |
(0.03-0.11) |
|
Chlorophyll-a (µg L-1) |
7.0 |
8.8 |
2.5 |
3.7 |
5.1 |
|
|
(0.7-26.0) |
(0.8-32.4) |
(0.3-17.0) |
(0.3-21.0) |
(0.3-33.0) |
|
Escherichia coli |
87 |
4 |
724 |
4273 |
857 |
|
(cfu/100ml) |
(15-4193) |
(1-45) |
(30-5650) |
(195-135000) |
(70-20300) |
Notes:
1. Data presented are depth-averaged values calculated by taking the means of three depths, i.e. surface (S), mid-depth (M) and bottom (B), except as specified.
2. Data presented are annual arithmetic means except for E. coli, which are geometric means.
3. Shaded cells indicate non-compliance with the WQOs.
3.3.4 Marine Sediment Quality
Baseline marine sediment quality in the Assessment Area has been determined through a review of EPD routine sediment quality monitoring data collected between 1986 and 2020. Sediment monitoring data from relevant EPD monitoring stations were used to represent the sediment quality adjacent to the Project (Table 3.5). Locations of these selected stations are presented in Figure 3.2.
Sediment monitoring data from the EPD monitoring stations were compared with the relevant sediment quality criteria specified in ETWB TC(W) No. 34/2002. The EPD routine monitoring data indicate that the contaminant levels in the sediments within the Southern WCZ are below Lower Chemical Exceedance Level (LCEL). Minor LCEL exceedances of silver were recorded within Western Buffer WCZ. For sediments within the Victoria Harbour WCZ, the contaminant level for copper and silver at both monitoring stations exceeded Upper Chemical Exceedance Level (UCEL).
Table 3.5 Summary of EPD Routine Marine Sediment Quality Monitoring Data within the Assessment Area (1986-2020)
|
Parameter |
ETWB TC(W) No. 34/2002 Guideline |
SS3 |
SS4 |
SS5 |
SS6 |
WS1 |
WS2 |
VS6 |
VS9 |
|
|
LCEL |
UCEL |
|||||||||
|
Arsenic (mg kg-1) |
12 |
42 |
7.5 |
8.8 |
8.7 |
6.3 |
8.7 |
9.2 |
9.2 |
7.9 |
|
|
|
|
(3.0-14.0) |
(3.8-16.0) |
(3.8-18.0) |
(1.7-12.0) |
(2.2-14.0) |
(1.4-17.0) |
(4.6-46.0) |
(3.0-32.0) |
|
Cadmium (mg kg-1) |
1.5 |
4 |
0.2 |
0.3 |
0.3 |
0.2 |
0.3 |
0.2 |
0.7 |
0.7 |
|
|
|
|
(<0.1-6.8) |
(<0.1-9.1) |
(<0.1-8.9) |
(<0.1-5.9) |
(<0.1-8.6) |
(<0.1-9.2) |
(<0.1-8.7) |
(<0.1-7.8) |
|
Chromium (mg kg-1) |
80 |
160 |
30.9 |
36.4 |
40.1 |
22.2 |
39.1 |
36.7 |
46.6 |
55.9 |
|
|
|
|
(17.0-62.0) |
(25.0-54.0) |
(25.0-52.0) |
(10.0-48.0) |
(13.0-84.0) |
(23.0-59.0) |
(17.0-92.0) |
(27.0-120.0) |
|
Copper (mg kg-1) |
65 |
110 |
24.6 |
36.7 |
39.7 |
12.2 |
59.6 |
37.5 |
136.1 |
139.3 |
|
|
|
|
(0.5-290.0) |
(18.0-76.0) |
(26.0-57.0) |
(3.0-31.0) |
(0.5-280.0) |
(17.0-140.0) |
(28.0-440.0) |
(8.0-400.0) |
|
Lead (mg kg-1) |
75 |
110 |
37.3 |
43.9 |
51.8 |
26.5 |
40.1 |
39.4 |
77.3 |
47.5 |
|
|
|
|
(20.0-190.0) |
(25.0-73.0) |
(32.0-71.0) |
(16.0-55.0) |
(2.5-68.0) |
(22.0-54.0) |
(29.0-160.0) |
(21.0-260.0) |
|
Mercury (mg kg-1) |
0.5 |
1 |
0.12 |
0.15 |
0.16 |
0.06 |
0.21 |
0.14 |
0.79 |
0.31 |
|
|
|
|
(<0.05-0.80) |
(<0.05-0.69) |
(<0.05-0.35) |
(<0.05-0.18) |
(<0.05-2.30) |
(<0.05-0.57) |
(0.18-8.00) |
(<0.05-1.80) |
|
Nickel (mg kg-1) |
40 |
40 |
20.5 |
22.0 |
24.7 |
14.3 |
21.3 |
22.7 |
20.6 |
27.6 |
|
|
|
|
(9.0-35.0) |
(11.0-32.0) |
(11.0-37.0) |
(5.0-29.0) |
(8.0-47.0) |
(13.0-31.0) |
(5.0-35.0) |
(10.0-62.0) |
|
Silver (mg kg-1) |
1 |
2 |
<0.2 |
0.2 |
0.5 |
<0.2 |
1.0 |
0.4 |
2.8 |
2.6 |
|
|
|
|
(<0.2-0.5) |
(<0.2-1.0) |
(<0.2-1.0) |
(<0.2-0.5) |
(<0.2-3.0) |
(<0.2-3.0) |
(<0.2-6.0) |
(<0.2-11.0) |
|
Zinc (mg kg-1) |
200 |
270 |
94.6 |
109.8 |
134.9 |
63.5 |
116.7 |
109.3 |
189.9 |
141.3 |
|
|
|
|
(41.0-680.0) |
(75.0-140.0) |
(85.0-170.0) |
(29.0-120.0) |
(9.0-300.0) |
(66.0-180.0) |
(74.0-300.0) |
(62.0-400.0) |
|
Total Polychlorinated Biphenyls |
23 |
180 |
15 |
15 |
15 |
14 |
16 |
16 |
32 |
17 |
|
(PCBs) (μg kg-1) |
|
|
(3-25) |
(3-23) |
(3-18) |
(3-18) |
(3-25) |
(3-24) |
(14-310) |
(3-24) |
|
Low Molecular Weight |
550 |
3,160 |
<180 |
<180 |
<180 |
<180 |
<180 |
<180 |
<180 |
<180 |
|
Polycyclic Aromatic Hydrocarbons (PAHs) (μg kg-1) |
|
|
(<180-227) |
(<180-275) |
(<180-203) |
(<180-194) |
(<180-316) |
(<180-220) |
(<180-697) |
(<180-252) |
|
High Molecular Weight |
1,700 |
9,600 |
54 |
74 |
62 |
<32 |
121 |
98 |
930 |
99 |
|
PAHs (μg kg-1) |
|
|
(<32-373) |
(<32-210) |
(<32-191) |
(<32-116) |
(<32-570) |
(<32-1477) |
(<32-6160) |
(<32-433) |
|
Chemical Oxygen Demand (mg kg-1) |
-- |
-- |
15082 |
14201 |
13983 |
9156 |
14824 |
13699 |
21230 |
17551 |
|
|
|
|
(9400-28000) |
(9600-25000) |
(6000-18000) |
(3600-18000) |
(190-21000) |
(3900-21000) |
(11000-40000) |
(9500-33000) |
|
Total Kjeldahl Nitrogen |
-- |
-- |
423.2 |
443.4 |
518.3 |
331.8 |
475.4 |
478.8 |
522.8 |
443.5 |
|
(mg kg-1) |
|
|
(220.0-960.0) |
(92.0-920.0) |
(60.0-1300.0) |
(100.0-780.0) |
(8.9-1100.0) |
(260.0-1800.0) |
(100.0-1800.0) |
(82.0-1300.0) |
Notes:
1. Data presented are arithmetic mean and ranges over the years.
2. Underlined values are above the LCEL. Bold values are above the UCEL.
3.3.5 Sediment Quality in Typhoon Shelter
Baseline sediment quality in typhoon shelters within the Assessment Area has also been determined through the review of EPD routine sediment quality monitoring data collected between 1986 and 2020 ([1]). Stations SS7, SS8, VS17, VS19 and VS21 are identified within the Assessment Area and their locations are presented in Figure 3.2. Sediment monitoring data of these stations are presented in Table 3.6. The levels for metals, Polycyclic Aromatic Hydrocarbons (PAHs) and Polychlorinated Biphenyls (PCBs) were compared with the relevant sediment quality criteria specified in ETWB TC(W) No. 34/2002.
The EPD routine monitoring data indicated that except Station SS8, the contaminant levels in the sediments of Stations SS7, VS17, VS19 and VS21 were higher than the LCEL for some parameters including Chromium, Copper, Lead, Nickel, Silver, Zinc and PCBs. The levels of Copper, Nickel, Silver and Zinc at Station VS17 and the levels of Copper at Station VS21 exceeded UCEL.
Table 3.6 Summary of EPD Routine Typhoon Shelters and Government Dockyard Sediment Quality Monitoring Data at Selected Locations within the Assessment Area (1986 – 2020)
|
Parameter |
ETWB TC(W) No. 34/2002 Guideline |
SS7 |
SS8 |
VS17 |
VS19 |
VS21 |
|
|
LCEL |
UCEL |
||||||
|
Arsenic (mg kg-1) |
12 |
42 |
8.5 |
7.8 |
10.3 |
6.6 |
8.8 |
|
|
|
|
(5.9-14.0) |
(5.7-11.0) |
(6.4-15.0) |
(4.2-11.0) |
(4.3-12.0) |
|
Cadmium (mg kg-1) |
1.5 |
4 |
0.1 |
<0.1 |
0.7 |
0.4 |
0.4 |
|
|
|
|
(<0.1-0.2) |
(<0.1-0.1) |
(0.2-1.8) |
(0.2-0.8) |
(0.3-0.6) |
|
Chromium (mg kg-1) |
80 |
160 |
44.4 |
37.3 |
115.4 |
34.2 |
43.6 |
|
|
|
|
(31.0-60.0) |
(32.0-43.0) |
(28.0-330.0) |
(23.0-47.0) |
(28.0-62.0) |
|
Copper (mg kg-1) |
65 |
110 |
91.1 |
33.7 |
202.9 |
81.9 |
158.8 |
|
|
|
|
(39.0-130.0) |
(27.0-43.0) |
(33.0-730.0) |
(36.0-170.0) |
(89.0-220.0) |
|
Lead (mg kg-1) |
75 |
110 |
58.7 |
44.2 |
77.3 |
46.4 |
50.0 |
|
|
|
|
(33.0-230.0) |
(38.0-51.0) |
(54.0-120.0) |
(24.0-120.0) |
(33.0-63.0) |
|
Mercury (mg kg-1) |
0.5 |
1 |
0.17 |
0.13 |
0.24 |
0.26 |
0.22 |
|
|
|
|
(0.10-0.30) |
(0.10-0.23) |
(0.07-0.62) |
(<0.05-0.81) |
(0.16-0.59) |
|
Nickel (mg kg-1) |
40 |
40 |
21.3 |
23.6 |
40.4 |
19.7 |
22.4 |
|
|
|
|
(15.0-30.0) |
(20.0-29.0) |
(12.0-160.0) |
(13.0-26.0) |
(19.0-27.0) |
|
Silver (mg kg-1) |
1 |
2 |
<0.2 |
<0.2 |
3.2 |
1.4 |
1.4 |
|
|
|
|
(<0.2-<0.2) |
(<0.2-<0.2) |
(<0.2-12.0) |
(1.0-3.0) |
(1.0-2.0) |
|
Zinc (mg kg-1) |
200 |
270 |
167.8 |
134.4 |
284.4 |
213.3 |
243.9 |
|
|
|
|
(110.0-230.0) |
(110.0-220.0) |
(110.0-400.0) |
(100.0-420.0) |
(110.0-430.0) |
|
Total Polychlorinated Biphenyls (PCBs) (μg kg-1) |
23 |
180 |
18 |
18 |
32 |
18 |
21 |
|
|
|
|
(18-21) |
(18-18) |
(18-76) |
(18-20) |
(18-29) |
|
Low Molecular Weight Polycyclic |
550 |
3,160 |
<180 |
<180 |
<180 |
<180 |
<180 |
|
Aromatic Hydrocarbons (PAHs) (μg kg-1) |
|
|
(<180-226) |
(<180-357) |
(<180-512) |
(<180-392) |
(<180-277) |
|
High Molecular Weight Polycyclic |
1,700 |
9,600 |
182 |
154 |
1309 |
338 |
286 |
|
Aromatic Hydrocarbons (PAHs) (μg kg-1) |
|
|
(86-651) |
(40-1452) |
(257-5368) |
(37-1499) |
(108-634) |
|
Chemical Oxygen Demand (mg kg-1) |
-- |
-- |
14833 |
11794 |
20000 |
17333 |
16611 |
|
|
|
|
(12000-18000) |
(8900-17000) |
(15000-26000) |
(12000-26000) |
(14000-20000) |
|
Total Kjeldahl Nitrogen |
-- |
-- |
523.3 |
536.1 |
568.3 |
539.4 |
453.9 |
|
(mg kg-1) |
|
|
(410.0-680.0) |
(410.0-650.0) |
(200.0-1000.0) |
(380.0-730.0) |
(370.0-610.0) |
Notes:
1. Data presented are arithmetic mean and ranges over the years.
2. Underlined values are above the LCEL. Bold values are above the UCEL.
3.3.6 Sediment Quality within the Study
Area
Sediment samples were collected in mid-2020 to determine the levels of contaminants in sediment within the majority of the Study Area. The sediment quality results are presented in Annex B of Method Statement for Water Quality Modelling Assessment (Annex 3A) for reference. A summary of highest contaminant levels among all stations sampled is provided under Table 3.7. Based on the results, none of the contaminants exceeded the corresponding LCEL. The sediment within the Study Area is considered to be not contaminated.
Table 3.7 Highest Contaminant Levels among all Stations from the Sediment Sampling conducted in mid-2020
|
Contaminant |
LCEL (mg kg-1) |
UCEL (mg kg-1) |
Highest Contaminant Levels amongst all Stations (mg kg-1) |
|
Arsenic |
12 |
42 |
11 |
|
Cadmium |
1.5 |
4 |
0.25 |
|
Chromium |
80 |
160 |
49 |
|
Copper |
65 |
110 |
43 |
|
Lead |
75 |
110 |
46 |
|
Mercury |
0.5 |
1 |
0.41 |
|
Nickel |
40 |
40 |
24 |
|
Silver |
1 |
2 |
0.84 |
|
Zinc |
200 |
270 |
110 |
|
Total PCBs |
0.023 |
0.18 |
<0.018 |
|
LMW PAH |
0.55 |
3.16 |
0.24 |
|
HMW PAH |
1.7 |
9.6 |
1.182 |
|
TBT (in interstitial water) |
0.15 mg L-1 |
0.15 mg L-1 |
<0.01 µg kg-1 in interstitial water |
3.3.7 Water Sensitive Receivers
The sensitive receivers that may be affected by changes in water quality arising from the Project are identified in accordance with the EIAO-TM and with reference to current land uses and relevant published plans (e.g. relevant Outline Zoning Plans, Development Permission Area Plans, Outline Development Plans and Layout Plans). For each of the sensitive receivers, established threshold criteria or guidelines have been utilised for establishing the significance of impacts to water quality.
WSRs in the vicinity of the Project site are identified as below, including coral communities, gazetted and non-gazetted bathing beaches, seawater intakes, typhoon shelters, fish culture zone (FCZ), Site of Special Scientific Interest (SSSI) ([17]), Green Turtle nesting ground, secondary contact recreation subzones, habitat for FP, nursery area and spawning ground for commercial fisheries resources and proposed/ potential marine parks. In addition, other WSRs of concern which are further away are also included. The locations of the identified WSRs are listed in Table 3.8 and shown in Figure 3.3. Note that some WSRs, such as secondary contact recreation subzones, habitat for FP, nursery area and spawning ground for commercial fisheries resources, cover larger swath of marine waters in Hong Kong and these WSRs are represented by observation points of other WSRs within their area. Secondary contact recreation subzones are situated mainly along the coastline of Lamma Island, Cheung Chau and Hei Ling Chau which are represented by other identified WSRs (including coral communities: CR01-CR03, CR05-CR09, CR11, CR20-CR23, Sham Wan: TNG, gazette beaches: B1-B4, non-gazetted beaches: NB3-NB4 and seawater intakes: C3-C4). Habitat for FP is generally located in southern and eastern waters and the majority of porpoise sightings have been made to the south of Soko Islands and Cheung Chau, around Shek Kwu Chau, and between the waters of Soko Islands and Shek Kwu Chau. The South Lantau Marine Park and the potential South Lamma Marine Park (i.e. MP1-A-MP1-C and MP2) are the key observation points / WSRs representing habitat for FP. The nursery area and spawning ground for commercial fisheries resources are located within the Study Area, however, the Project area (i.e. Key Area for CMP development) is considered very small (<1% when comparing to the recognized nursery area and spawning ground for commercial fisheries resources in Hong Kong waters). In addition, the potential for the Assessment Area to function as important spawning grounds and nursery area is not high as assessed in Section 5.3.3. Therefore, no observation points were set within and in the vicinity of the Project area. The other identified WSRs, including FCZ2-FCZ3, MP1-A-MP1-C, MP2, CR01, CR11, CR21, TNG, B1-B4, NB3-NB4, C3-C5, TS1 locating within the nursery area and spawning ground for commercial fisheries resources were selected to represent the observation points.
Table 3.8 Water Sensitive Receivers (WSRs) in the Vicinity of the Project Site
|
Description |
Location |
Model Output Location |
Geodesic Distance from Key Area (km) |
|
Fisheries Sensitive Receivers |
|
||
|
Fish Culture Zone |
Cheung Sha Wan FCZ |
FCZ1 |
6.9 |
|
(FCZ) |
Lo Tik Wan FCZ |
FCZ2 |
4.7 |
|
|
Sok Kwu Wan FCZ |
FCZ3 |
4.5 |
|
|
Ma Wan FCZ |
FCZ4 |
14.7 |
|
Marine Ecological Sensitive Receivers |
|
||
|
Marine Park (MP) |
Potential South Lamma MP |
MP1-A |
3.8 |
|
MP1-B |
2.6 |
||
|
MP1-C |
4.6 |
||
|
South Lantau MP |
MP2 |
11.3 |
|
|
Corals |
Cheung Chau |
CR01 |
3.7 |
|
|
CR11 |
3.2 |
|
|
|
B1 |
4.0 |
|
|
|
Hei Ling Chau |
CR02 |
3.9 |
|
|
CR03 |
3.7 |
|
|
|
CR09 |
6.5 |
|
|
|
Chi Ma Wan Peninsula |
CR04 |
6.4 |
|
|
Sunshine Island |
CR05 |
4.8 |
|
|
CR06 |
4.7 |
|
|
|
CR07 |
4.9 |
|
|
|
CR08 |
5.5 |
|
|
|
Kau Yi Chau |
CR10 |
6.8 |
|
|
CR26 |
7.3 |
|
|
|
CR27 |
7.5 |
|
|
|
Siu Kau Yi Chau |
CR28 |
8.1 |
|
|
CR29 |
8.1 |
|
|
|
CR30 |
7.8 |
|
|
|
Hung Shing Yeh |
CR20 |
3.7 |
|
|
Ha Mei Wan |
CR21 |
3.5 |
|
|
Pak Kok |
CR22 |
4.3 |
|
|
Shek Kok Tsui |
CR23 |
3.0 |
|
|
Sandy Bay |
CR24 |
7.0 |
|
|
Green Island |
CR25 |
7.9 |
|
|
Peng Chau |
CR31 |
8.6 |
|
|
CR32 |
8.3 |
|
|
|
CR33 |
8.1 |
|
|
|
CR34 |
7.6 |
|
|
|
CR35 |
7.3 |
|
|
|
Sham Wan |
TNG |
5.4 |
|
Green Turtle Nesting Ground / SSSI |
Sham Wan |
TNG |
5.4 |
|
Water Sensitive Receivers |
|
||
|
Gazetted Beaches |
Cheung Chau Tung Wan Beach |
B1 |
4.0 |
|
|
Kwun Yam Wan Beach |
B2 |
3.4 |
|
|
Hung Shing Yeh Beach |
B3 |
3.9 |
|
|
Lo So Shing Beach |
B4 |
3.9 |
|
|
Tung Wan Beach, Ma Wan |
B5 |
14.5 |
|
|
Approach Beach |
B6 |
16.3 |
|
|
Ting Kau Beach |
B7 |
16.5 |
|
|
Lido Beach |
B8 |
16.5 |
|
|
Casam Beach |
B9 |
16.3 |
|
|
Hoi Mei Wan Beach |
B10 |
16.2 |
|
|
Gemini Beach |
B11 |
16.1 |
|
|
Anglers’ Beach |
B12 |
16.2 |
|
Non-gazetted Beaches |
Tai Kwai Wan |
NB3 |
4.5 |
|
|
Po Yue Wan |
NB4 |
5.0 |
|
Seawater Intakes |
Pumping Station at Tai Kwai Wan |
NB3 |
4.5 |
|
|
Sha Wan Drive |
C1 |
6.8 |
|
|
Wah Fu Estate |
C2 |
6.5 |
|
|
Lamma Power Station |
C3 |
2.6 |
|
|
Integrated Waste Management Facilities at Shek Kwu Chau |
C4 |
8.2 |
|
|
Offshore LNG Terminal |
C5 |
11.8 |
|
|
Tsuen Wan |
C6 |
16.8 |
|
|
MTR Tsing Yi Station |
C7 |
14.1 |
|
|
MTR Kowloon Station |
C8 |
11.9 |
|
|
China H.K. City |
C9 |
12.4 |
|
|
Queen Mary Hospital |
C10 |
7.1 |
|
|
Kwai Chung Hospital |
EMSD1 |
14.0 |
|
WSD Flushing Intakes |
Tsing Yi |
WSD1 |
14.4 |
|
|
Kennedy Town |
WSD2 |
8.0 |
|
|
Sheung Wan |
WSD3 |
10.1 |
|
|
Centrol Water Front |
WSD4 |
10.6 |
|
|
Ap Lei Chau |
WSD5 |
7.9 |
|
|
Kowloon South |
WSD6 |
11.9 |
|
|
Cheung Sha Wan |
WSD7 |
13.6 |
|
|
Tsuen Wan |
WSD8 |
17.1 |
|
|
Near Hong Kong Garden |
WSD9 |
16.0 |
|
Typhoon Shelters |
Cheung Chau |
TS1 |
4.4 |
|
|
Hei Ling Chau |
TS2 |
5.2 |
|
|
Aberdeen |
TS3 |
7.6 |
|
|
Rambler Channel |
TS4 |
15.6 |
|
|
New Yau Ma Tei |
TS5 |
12.8 |
|
|
Government Dockyard |
TS6 |
13.3 |
|
Remarks: There are some other WSRs, such as secondary contact recreation subzones, habitat for finless porpoise, nursery area and spawning ground for commercial fisheries resources, cover larger swath of marine waters in Hong Kong and these WSRs are represented by observation points of other WSRs within their areas as indicated below: · Secondary contact recreation subzones: CR01-CR03, CR05-CR09, CR11, CR20-CR23, TNG, B1-B4, NB3-NB4, C3-C4 · Habitat for finless porpoise: observation points in the Assessment Area, especially the proposed and potential marine parks (i.e. MP1-A-MP1-C and MP2) · Nursery area and spawning ground for commercial fisheries resources: FCZ2-FCZ3, MP1-A-MP1-C, MP-2, CR01, CR11, CR21, TNG, B1-B4, NB3-NB4, C3-C5, TS1 |
|||
3.4
Assessment
Criteria
3.4.1 Suspended Solids
Elevation in suspended solids (SS) concentrations resulting from the Project’s construction and operation activities will be assessed against the WQO. The WQO for SS is defined as not to raise the natural ambient level by 30%, nor cause the accumulation of SS which may adversely affect aquatic communities. The assessment criterion is hence defined as the WQO allowable increase in SS concentrations within the corresponding WCZs.
SS data from EPD’s routine water quality monitoring programme from 1986 to 2020 have been analysed to determine the WQO allowable SS increase at the WSRs. This is calculated as 30% of the ambient level (90th percentile value) from the 1986 to 2020 baseline marine water quality data. For each WSR, ambient level was derived from the closest EPD water quality monitoring station. The assessment criterion for SS at each WSR is summarized in Table 3.10.
For seawater intake WSRs, the Water Supplies Department (WSD) has a set of standards for the quality of abstracted seawater (Table 3.9). Water quality of identified seawater intake in this Project has been assessed against an SS criterion of < 10mg L-1, in addition to the WQOs.
Table 3.9 WSD’s Water Quality Criteria for Water at Seawater Intakes
|
Parameter |
Criterion |
|
Colour (HU) |
< 20 |
|
Turbidity (NTU) |
< 10 |
|
Threshold Odour No. |
< 100 |
|
Ammoniacal Nitrogen (mg L-1) |
< 1 |
|
Suspended Solids (mg L-1) |
< 10 |
|
Dissolved Oxygen (mg L-1) |
> 2 |
|
5-day Biochemical Oxygen Demand (mg L-1) |
< 10 |
|
Synthetic Detergents (mg L-1) |
< 5 |
|
E. coli (cfu/100mL) |
< 20,000 |
Based on the EIA Report of Hong Kong Offshore LNG Terminal ([2]), the allowable SS level of 100 mg L-1 for intakes at Lamma Power Station (LPS) is recommended. The value is adopted in this EIA.
Coral communities have been identified within the Assessment Area. There are no established legislative criteria for water quality at coral communities; however, information on hard coral tolerances to SS indicates that a 20% reduction in annual growth rate corresponds to a 30% increase in average long-term background SS levels. WQO standards of SS (30% increase) at the identified coral communities in this EIA is also derived (Table 3.10). The WQO standards are utilised in this EIA for determining the acceptability of impacts on corals.
In addition, the Agriculture, Fisheries and Conservation Department (AFCD) has identified a guideline value for the protection of water quality at FCZs and a maximum value of 50mg L-1 is recommended. This criterion has been adopted in previous approved EIA Reports ([3]) ([4]) ([5]) ([6]) ([7]). Thus, for the purposes of this assessment, both the AFCD criterion and the WQO are considered to be generally applicable for the FCZs identified in the Assessment Area. While both AFCD criterion and WQO are generally considered acceptable but on the conservative side, the lower amongst the two has been adopted for this assessment purpose.
Table 3.10 Allowable Increase in SS (mg L-1) Levels for Water Sensitive Receivers and Observation Points
|
Description |
Location |
Model Output Location |
EPD Station |
Relevant Depth |
Dry Season (Ambient Level) (1) |
Dry Season (WQO Allowable Change) |
Wet Season (Ambient Level) (1) |
Wet Season (WQO Allowable Change) |
|
Fisheries Sensitive Receivers |
|
|
|
|
|
|
||
|
Fish Culture Zone (FCZ) |
Cheung Sha Wan FCZ |
FCZ1 (2) (7) |
SM12 |
Depth-averaged |
20.3 |
6.1 |
14.0 |
4.2 |
|
|
Lo Tik Wan FCZ |
FCZ2 (2) (7) |
SM3 |
Depth-averaged |
10.3 |
3.1 |
9.5 |
2.9 |
|
|
Sok Kwu Wan FCZ |
FCZ3 (2) |
SM4 |
Depth-averaged |
8.3 |
2.5 |
7.7 |
2.3 |
|
|
Ma Wan FCZ |
FCZ4 (2) |
WM4 |
Depth-averaged |
21.1 |
6.3 |
13.3 |
4.0 |
|
Marine Ecological Sensitive Receivers |
|
|
|
|
|
|
||
|
Marine Park (MP) |
Potential South Lamma MP |
MP1-A (6) (7) |
SM5 |
Depth-averaged |
13.5 |
4.1 |
10.0 |
3.0 |
|
|
MP1-B (6) (7) |
SM6 |
Depth-averaged |
12.5 |
3.7 |
10.5 |
3.1 |
|
|
|
MP1-C (6) (7) |
SM6 |
Depth-averaged |
12.5 |
3.7 |
10.5 |
3.1 |
|
|
|
Proposed South Lantau MP |
MP2 (6) (7) |
SM12 |
Depth-averaged |
20.3 |
6.1 |
14.0 |
4.2 |
|
Corals |
Cheung Chau |
CR01 (5) (7) |
SM12 |
Bottom |
22.0 |
6.6 |
18.0 |
5.4 |
|
|
CR11 (5) (7) |
SM12 |
Bottom |
22.0 |
6.6 |
18.0 |
5.4 |
|
|
|
B1 (5) (7) |
SM12 |
Bottom |
22.0 |
6.6 |
18.0 |
5.4 |
|
|
|
Hei Ling Chau |
CR02 (5) |
SM11 |
Bottom |
20.0 |
6.0 |
17.0 |
5.1 |
|
|
CR03 (5) |
SM11 |
Bottom |
20.0 |
6.0 |
17.0 |
5.1 |
|
|
|
CR09 (5) |
SM11 |
Bottom |
20.0 |
6.0 |
17.0 |
5.1 |
|
|
|
Chi Ma Wan Peninsula |
CR04 |
SM12 |
Bottom |
22.0 |
6.6 |
18.0 |
5.4 |
|
|
Sunshine Island |
CR05 (5) |
SM11 |
Bottom |
20.0 |
6.0 |
17.0 |
5.1 |
|
|
CR06 (5) |
SM11 |
Bottom |
20.0 |
6.0 |
17.0 |
5.1 |
|
|
|
CR07 (5) |
SM11 |
Bottom |
20.0 |
6.0 |
17.0 |
5.1 |
|
|
|
CR08 (5) |
SM11 |
Bottom |
20.0 |
6.0 |
17.0 |
5.1 |
|
|
|
Kau Yi Chau |
CR10 |
SM9 |
Bottom |
13.0 |
3.9 |
26.0 |
7.8 |
|
|
CR26 |
SM9 |
Bottom |
13.0 |
3.9 |
26.0 |
7.8 |
|
|
|
CR27 |
SM9 |
Bottom |
13.0 |
3.9 |
26.0 |
7.8 |
|
|
|
Siu Kau Yi Chau |
CR28 |
SM10 |
Bottom |
18.0 |
5.4 |
17.4 |
5.2 |
|
|
CR29 |
SM10 |
Bottom |
18.0 |
5.4 |
17.4 |
5.2 |
|
|
|
CR30 |
SM10 |
Bottom |
18.0 |
5.4 |
17.4 |
5.2 |
|
|
|
Hung Shing Yeh |
CR20 (5) |
SM5 |
Bottom |
16.0 |
4.8 |
14.0 |
4.2 |
|
|
Ha Mei Wan |
CR21 (5) (7) |
SM5 |
Bottom |
16.0 |
4.8 |
14.0 |
4.2 |
|
|
Pak Kok |
CR22 (5) |
WM1 |
Bottom |
16.0 |
4.8 |
16.0 |
4.8 |
|
|
Shek Kok Tsui |
CR23 (5) |
SM7 |
Bottom |
14.0 |
4.2 |
18.0 |
5.4 |
|
|
Sandy Bay |
CR24 |
WM2 |
Bottom |
19.0 |
5.7 |
19.0 |
5.7 |
|
|
Green Island |
CR25 |
VM8 |
Bottom |
23.0 |
6.9 |
19.0 |
5.7 |
|
|
Peng Chau |
CR31 |
SM10 |
Bottom |
18.0 |
5.4 |
17.4 |
5.2 |
|
|
CR32 |
SM10 |
Bottom |
18.0 |
5.4 |
17.4 |
5.2 |
|
|
|
CR33 |
SM10 |
Bottom |
18.0 |
5.4 |
17.4 |
5.2 |
|
|
|
CR34 |
SM9 |
Bottom |
13.0 |
3.9 |
26.0 |
7.8 |
|
|
|
CR35 |
SM9 |
Bottom |
13.0 |
3.9 |
26.0 |
7.8 |
|
|
|
Sham Wan |
TNG (5) (7) |
SM4 |
Bottom |
10.0 |
3.0 |
10.0 |
3.0 |
|
Green Turtle Nesting Ground / SSSI |
Sham Wan |
TNG (5) (7) |
SM4 |
Depth-averaged |
8.3 |
2.5 |
7.7 |
2.3 |
|
Water Sensitive Receivers |
|
|
|
|
|
|
||
|
Gazetted Beaches |
Cheung Chau Tung Wan Beach |
B1 (5) (7) |
SM12 |
Depth-averaged |
20.3 |
6.1 |
14.0 |
4.2 |
|
|
Kwun Yam Wan Beach |
B2 (5) (7) |
SM12 |
Depth-averaged |
20.3 |
6.1 |
14.0 |
4.2 |
|
|
Hung Shing Yeh Beach |
B3 (5) (7) |
SM5 |
Depth-averaged |
13.5 |
4.1 |
10.0 |
3.0 |
|
|
Lo So Shing Beach |
B4 (5) (7) |
SM5 |
Depth-averaged |
13.5 |
4.1 |
10.0 |
3.0 |
|
|
Tung Wan Beach, Ma Wan |
B5 |
WM4 |
Depth-averaged |
21.1 |
6.3 |
13.3 |
4.0 |
|
|
Approach Beach |
B6 |
WM4 |
Depth-averaged |
21.1 |
6.3 |
13.3 |
4.0 |
|
|
Ting Kau Beach |
B7 |
WM4 |
Depth-averaged |
21.1 |
6.3 |
13.3 |
4.0 |
|
|
Lido Beach |
B8 |
WM4 |
Depth-averaged |
21.1 |
6.3 |
13.3 |
4.0 |
|
|
Casam Beach |
B9 |
WM4 |
Depth-averaged |
21.1 |
6.3 |
13.3 |
4.0 |
|
|
Hoi Mei Wan Beach |
B10 |
WM4 |
Depth-averaged |
21.1 |
6.3 |
13.3 |
4.0 |
|
|
Gemini Beach |
B11 |
WM4 |
Depth-averaged |
21.1 |
6.3 |
13.3 |
4.0 |
|
|
Anglers’ Beach |
B12 |
WM4 |
Depth-averaged |
21.1 |
6.3 |
13.3 |
4.0 |
|
Non-gazetted Beaches |
Tai Kwai Wan |
NB3 (5) (7) |
SM12 |
Depth-averaged |
20.3 |
6.1 |
14.0 |
4.2 |
|
|
Po Yue Wan |
NB4 (5) (7) |
SM12 |
Depth-averaged |
20.3 |
6.1 |
14.0 |
4.2 |
|
Seawater Intakes |
Sha Wan Drive |
C1 |
WM2 |
Bottom |
19.0 |
5.7 |
19.0 |
5.7 |
|
|
Wah Fu Estate |
C2 |
WM1 |
Bottom |
16.0 |
4.8 |
16.0 |
4.8 |
|
|
Lamma Power Station |
C3 (3) (5) (7) |
SM5 |
Bottom |
16.0 |
84.0 |
14.0 |
86.0 |
|
|
Integrated Waste Management Facilities at Shek Kwu Chau |
C4 (5) (7) |
SM12 |
Bottom |
22.0 |
6.6 |
18.0 |
5.4 |
|
|
Offshore LNG Terminal |
C5 (7) |
SM12 |
Bottom |
22.0 |
6.6 |
18.0 |
5.4 |
|
|
Tsuen Wan |
C6 |
VM14 |
Bottom |
16.0 |
4.8 |
13.0 |
3.9 |
|
|
MTR Tsing Yi Station |
C7 |
VM12 |
Bottom |
27.0 |
8.1 |
25.6 |
7.7 |
|
|
MTR Kowloon Station |
C8 |
VM6 |
Bottom |
15.0 |
4.5 |
14.0 |
4.2 |
|
|
China H.K. City |
C9 |
VM6 |
Bottom |
15.0 |
4.5 |
14.0 |
4.2 |
|
|
Queen Mary Hospital |
C10 |
WM2 |
Bottom |
19.0 |
5.7 |
19.0 |
5.7 |
|
|
Kwai Chung Hospital |
EMSD1 |
VM12 |
Bottom |
27.0 |
8.1 |
25.6 |
7.7 |
|
WSD Flushing Intakes |
Tsing Yi |
WSD1 (4) |
VM12 |
Depth-averaged |
22.7 |
6.8 |
17.7 |
5.3 |
|
|
Kennedy Town |
WSD2 (4) |
VM8 |
Depth-averaged |
17.3 |
5.2 |
11.7 |
3.5 |
|
|
Sheung Wan |
WSD3 (4) |
VM7 |
Depth-averaged |
13.7 |
4.1 |
10.8 |
3.2 |
|
|
Centrol Water Front |
WSD4 (4) |
VM6 |
Depth-averaged |
11.1 |
3.3 |
9.8 |
0.2 |
|
|
Ap Lei Chau |
WSD5 (4) |
SM3 |
Depth-averaged |
10.3 |
3.1 |
9.5 |
0.5 |
|
|
Kowloon South |
WSD6 (4) |
VM6 |
Depth-averaged |
11.1 |
3.3 |
9.8 |
0.2 |
|
|
Cheung Sha Wan |
WSD7 (4) |
VM15 |
Depth-averaged |
15.1 |
4.5 |
13.8 |
4.1 |
|
|
Tsuen Wan |
WSD8 (4) |
VM14 |
Depth-averaged |
15.3 |
4.6 |
11.2 |
3.4 |
|
|
Near Hong Kong Garden |
WSD9 (4) |
WM4 |
Depth-averaged |
21.1 |
6.3 |
13.3 |
4.0 |
|
|
Pumping Station at Tai Kwai Wan |
NB3 (4) |
SM12 |
Depth-averaged |
20.3 |
6.1 |
14.0 |
4.2 |
|
Typhoon Shelters |
Cheung Chau |
TS1 (7) |
SM12 |
Depth-averaged |
20.3 |
6.1 |
14.0 |
4.2 |
|
|
Hei Ling Chau |
TS2 |
SM10 |
Depth-averaged |
16.0 |
4.8 |
15.1 |
4.5 |
|
|
Aberdeen |
TS3 |
WM1 |
Depth-averaged |
10.8 |
3.2 |
10.4 |
3.1 |
|
|
Rambler Channel |
TS4 |
VM14 |
Depth-averaged |
15.3 |
4.6 |
11.2 |
3.4 |
|
|
New Yau Ma Tei |
TS5 |
VM15 |
Depth-averaged |
14.2 |
4.2 |
13.8 |
4.1 |
|
|
Government Dockyard |
TS6 |
VM15 |
Depth-averaged |
14.2 |
4.2 |
13.8 |
4.1 |
Notes:
1. Ambient level is calculated as 90th percentile of the EPD routine monitoring data (1986-2020) at respective EPD station close to the WSRs.
2. For FCZs, AFCD has identified a guideline value for the protection of water quality at FCZs and a maximum value of 50mg L-1 is recommended. While both AFCD criterion and WQO are generally considered acceptable but on the conservative side, the lower amongst the two has been adopted for this assessment purpose.
3. This table is applicable for those sensitive receivers which were assessed against the WQO. There are other assessment criteria of certain type of WSRs. The allowable SS level for intake at the LPS is 100 mg L-1.
4. WSD stipulates a specific requirement for the
seawater intake, the SS level being maintained below 10 mg L-1.
This is applicable only to wet season at WSD4, WSD5 and WSD6 where
baseline SS level is lower than 10 mg L-1. For other seawater intake
stations where baseline SS level exceed 10 mg L-1, WQO criteria of
elevation not exceeding 30% of the ambient level would be adopted.
5. The WSR also represents secondary contact
recreation subzone.
6. The WSR also represents habitat for FP.
7. The WSR also represents nursery area and
spawning ground for commercial fisheries resources.
3.4.2 Dissolved Oxygen
Oxygen depletion resulting from the Project’s construction and operation activities will be assessed against the WQO. The assessment criterion is defined as the WQO allowable changes in dissolved oxygen (DO) levels at the WSRs. The depletion of DO in the water column is not expected to affect the operation of seawater intakes; therefore no assessment criteria for seawater intake WSRs are proposed, except for WSD intakes where the WSD DO criterion is adopted.
DO data from EPD’s routine water quality monitoring programme from 1986 to 2020 have been analysed to determine WQO allowable changes in DO levels at the WSRs. Allowable DO change is calculated as the ambient DO level minus the WQO, i.e. 4 mg L-1 for depth-averaged, surface and middle layers, and 2 mg L-1 for bottom layer. Ambient level is calculated as the 10th percentile value from the 1986 to 2020 marine water quality data. For each WSR, ambient level was derived from the closest EPD water quality monitoring station. The assessment criterion for DO at each WSR is summarized in Table 3.11.
For FCZs, in accordance with the WQO, the DO criterion is set at > 5 mg L-1 (depth-averaged).
Table 3.11 Allowable DO Depletion (mg L-1) for Water Sensitive Receivers and Observation Points
|
Description |
Location |
Model Output Location |
EPD Station |
Relevant Depth |
Annual Ambient Level (1) |
Annual WQO Allowable Change |
|
Fisheries Sensitive Receivers |
|
|
|
|
||
|
Fish Culture Zone (FCZ) |
Cheung Sha Wan FCZ |
FCZ1 (2) |
SM12 |
Depth-averaged |
5.4 |
0.4 |
|
|
Lo Tik Wan FCZ |
FCZ2 (2) (6) |
SM3 |
Depth-averaged |
4.5 |
0.0 |
|
|
Sok Kwu Wan FCZ |
FCZ3 (2) (6) |
SM4 |
Depth-averaged |
5.0 |
0.0 |
|
|
Ma Wan FCZ |
FCZ4 (2) |
WM4 |
Depth-averaged |
4.1 |
0.0 |
|
Marine Ecological Sensitive Receivers |
|
|
|
|
||
|
Marine Park (MP) |
Potential South Lamma MP |
MP1-A (5) (6) |
SM5 |
Depth-averaged |
5.4 |
1.4 |
|
|
MP1-B (5) (6) |
SM6 |
Depth-averaged |
5.2 |
1.2 |
|
|
|
MP1-C (5) (6) |
SM6 |
Depth-averaged |
5.2 |
1.2 |
|
|
|
South Lantau MP |
MP2 (5) (6) |
SM12 |
Depth-averaged |
5.4 |
1.4 |
|
Corals |
Cheung Chau |
CR01 (4) (6) |
SM12 |
Bottom |
5.2 |
3.2 |
|
|
CR11 (4) (6) |
SM12 |
Bottom |
5.2 |
3.2 |
|
|
|
B1 (4) (6) |
SM12 |
Bottom |
5.2 |
3.2 |
|
|
|
Hei Ling Chau |
CR02 (4) |
SM11 |
Bottom |
4.5 |
2.5 |
|
|
CR03 (4) |
SM11 |
Bottom |
4.5 |
2.5 |
|
|
|
CR09 (4) |
SM11 |
Bottom |
4.5 |
2.5 |
|
|
|
Chi Ma Wan Peninsula |
CR04 |
SM12 |
Bottom |
5.2 |
3.2 |
|
|
Sunshine Island |
CR05 (4) |
SM11 |
Bottom |
4.5 |
2.5 |
|
|
CR06 (4) |
SM11 |
Bottom |
4.5 |
2.5 |
|
|
|
CR07 (4) |
SM11 |
Bottom |
4.5 |
2.5 |
|
|
|
CR08 (4) |
SM11 |
Bottom |
4.5 |
2.5 |
|
|
|
Kau Yi Chau |
CR10 |
SM9 |
Bottom |
4.1 |
2.1 |
|
|
CR26 |
SM9 |
Bottom |
4.1 |
2.1 |
|
|
|
CR27 |
SM9 |
Bottom |
4.1 |
2.1 |
|
|
|
Siu Kau Yi Chau |
CR28 |
SM10 |
Bottom |
5.0 |
3.0 |
|
|
CR29 |
SM10 |
Bottom |
5.0 |
3.0 |
|
|
|
CR30 |
SM10 |
Bottom |
5.0 |
3.0 |
|
|
|
Hung Shing Yeh |
CR20 (4) |
SM5 |
Bottom |
4.5 |
2.5 |
|
|
Ha Mei Wan |
CR21 (4) (6) |
SM5 |
Bottom |
4.5 |
2.5 |
|
|
Pak Kok |
CR22 (4) |
WM1 |
Bottom |
3.2 |
1.2 |
|
|
Shek Kok Tsui |
CR23 (4) |
SM7 |
Bottom |
4.4 |
2.4 |
|
|
Sandy Bay |
CR24 |
WM2 |
Bottom |
3.7 |
1.7 |
|
|
Green Island |
CR25 |
VM8 |
Bottom |
3.9 |
1.9 |
|
|
Peng Chau |
CR31 |
SM10 |
Bottom |
5.0 |
3.0 |
|
|
CR32 |
SM10 |
Bottom |
5.0 |
3.0 |
|
|
|
CR33 |
SM10 |
Bottom |
5.0 |
3.0 |
|
|
|
CR34 |
SM9 |
Bottom |
4.1 |
2.1 |
|
|
|
CR35 |
SM9 |
Bottom |
4.1 |
2.1 |
|
|
|
Sham Wan |
TNG (4) (6) |
SM4 |
Bottom |
4.3 |
2.3 |
|
Green Turtle Nesting Ground / SSSI |
Sham Wan |
TNG (4) (6) |
SM4 |
Depth-averaged |
5.0 |
1.0 |
|
Water Sensitive Receivers |
|
|
|
|
||
|
Gazetted Beaches |
Cheung Chau Tung Wan Beach |
B1 (4) (6) |
SM12 |
Depth-averaged |
5.4 |
1.4 |
|
|
Kwun Yam Wan Beach |
B2 (4) (6) |
SM12 |
Depth-averaged |
5.4 |
1.4 |
|
|
Hung Shing Yeh Beach |
B3 (4) (6) |
SM5 |
Depth-averaged |
5.4 |
1.4 |
|
|
Lo So Shing Beach |
B4 (4) (6) |
SM5 |
Depth-averaged |
5.4 |
1.4 |
|
|
Tung Wan Beach, Ma Wan |
B5 |
WM4 |
Depth-averaged |
4.1 |
0.1 |
|
|
Approach Beach |
B6 |
WM4 |
Depth-averaged |
4.1 |
0.1 |
|
|
Ting Kau Beach |
B7 |
WM4 |
Depth-averaged |
4.1 |
0.1 |
|
|
Lido Beach |
B8 |
WM4 |
Depth-averaged |
4.1 |
0.1 |
|
|
Casam Beach |
B9 |
WM4 |
Depth-averaged |
4.1 |
0.1 |
|
|
Hoi Mei Wan Beach |
B10 |
WM4 |
Depth-averaged |
4.1 |
0.1 |
|
|
Gemini Beach |
B11 |
WM4 |
Depth-averaged |
4.1 |
0.1 |
|
|
Anglers’ Beach |
B12 |
WM4 |
Depth-averaged |
4.0 |
0.0 |
|
Non-gazetted Beaches |
Tai Kwai Wan |
NB3 (4) (6) |
SM12 |
Depth-averaged |
5.4 |
1.4 |
|
|
Po Yue Wan |
NB4 (4) (6) |
SM12 |
Depth-averaged |
5.4 |
1.4 |
|
Seawater Intakes |
Sha Wan Drive |
C1 |
WM2 |
Bottom |
3.7 |
1.7 |
|
|
Wah Fu Estate |
C2 |
WM1 |
Bottom |
3.2 |
1.2 |
|
|
Lamma Power Station |
C3 (4) (6) |
SM5 |
Bottom |
4.5 |
2.5 |
|
|
Integrated Waste Management Facilities at Shek Kwu Chau |
C4 (4) (6) |
SM12 |
Bottom |
5.2 |
3.2 |
|
|
Offshore LNG Terminal |
C5 (6) |
SM12 |
Bottom |
5.2 |
3.2 |
|
|
Tsuen Wan |
C6 |
VM14 |
Bottom |
3.7 |
1.7 |
|
|
MTR Tsing Yi Station |
C7 |
VM12 |
Bottom |
3.3 |
1.3 |
|
|
MTR Kowloon Station |
C8 |
VM6 |
Bottom |
3.0 |
1.0 |
|
|
China H.K. City |
C9 |
VM6 |
Bottom |
3.0 |
1.0 |
|
|
Queen Mary Hospital |
C10 |
WM2 |
Bottom |
3.7 |
1.7 |
|
|
Kwai Chung Hospital |
EMSD1 |
VM12 |
Bottom |
3.3 |
1.3 |
|
WSD Flushing Intakes (3) |
Tsing Yi |
WSD1 |
VM12 |
Depth-averaged |
3.8 |
1.8 |
|
|
Kennedy Town |
WSD2 |
VM8 |
Depth-averaged |
4.5 |
2.5 |
|
|
Sheung Wan |
WSD3 |
VM7 |
Depth-averaged |
3.9 |
1.9 |
|
|
Centrol Water Front |
WSD4 |
VM6 |
Depth-averaged |
3.7 |
1.7 |
|
|
Ap Lei Chau |
WSD5 |
SM3 |
Depth-averaged |
4.5 |
2.5 |
|
|
Kowloon South |
WSD6 |
VM6 |
Depth-averaged |
3.7 |
1.7 |
|
|
Cheung Sha Wan |
WSD7 |
VM15 |
Depth-averaged |
4.1 |
2.1 |
|
|
Tsuen Wan |
WSD8 |
VM14 |
Depth-averaged |
4.0 |
2.0 |
|
|
Near Hong Kong Garden |
WSD9 |
WM4 |
Depth-averaged |
4.1 |
2.1 |
|
|
Pumping Station at Tai Kwai Wan |
NB3 |
SM12 |
Depth-averaged |
5.4 |
3.4 |
|
Typhoon Shelters |
Cheung Chau |
TS1 (6) |
SM12 |
Depth-averaged |
5.4 |
1.4 |
|
|
Hei Ling Chau |
TS2 |
SM10 |
Depth-averaged |
5.2 |
1.2 |
|
|
Aberdeen |
TS3 |
WM1 |
Depth-averaged |
4.4 |
0.4 |
|
|
Rambler Channel |
TS4 |
VM14 |
Depth-averaged |
4.0 |
0.0 |
|
|
New Yau Ma Tei |
TS5 |
VM15 |
Depth-averaged |
4.1 |
0.1 |
|
|
Government Dockyard |
TS6 |
VM15 |
Depth-averaged |
4.1 |
0.1 |
Notes:
1. Ambient level is calculated as 10th percentile of the EPD routine monitoring data (1986-2020) at respective EPD station close to the WSRs.
2. For FCZs, in accordance with the WQO, the DO criterion is set at > 5 mg L-1 (depth-averaged).
3. There is a specific
requirement for WSD seawater intakes and the DO should be maintained at above 2
mg L-1. Allowable DO depletion is calculated as 10th percentile
of the ambient DO level minus 2 mg L-1. There is no
applicable standard for other seawater intakes, thus those intakes are not
included.
4. The WSR also represents secondary contact
recreation subzone.
5. The WSR also represents habitat for FP.
6. The WSR also represents nursery area and
spawning ground for commercial fisheries resources.
3.4.3 Sediment Deposition
Impacts to coral colonies will be assessed with regard to sediment deposition. The assessment criterion of 100 g m-2 day-1, which represents an indicative level above which could result in moderate to severe impact on corals, has been used in approved EIA Reports ([8]) ([9]) ([10]) ([11]) and has been adopted here.
3.4.4 Nutrients
Elevation in the levels of nutrients as a result of the Project’s construction activities, if any, will be compared against the respective WQOs (Table 3.1 refers).
3.4.5 Dissolved Metals and Organics
Contaminants
Assessment of dissolved metals and organics contaminants will be conducted based on the assessment criteria presented in Table 3.12. ([12])
Table 3.12 Summary of Assessment Criteria for Dissolved Metals and Organic Contaminants
|
Parameter |
Unit |
Assessment Criteria Adopted |
|
Metals |
|
|
|
Cadmium (Cd) |
mg L-1 |
5.5 (a) |
|
Chromium (Cr) |
mg L-1 |
4.4 (a) |
|
Copper (Cu) |
mg L-1 |
1.3 (a) |
|
Nickel (Ni) |
mg L-1 |
70 (a) |
|
Lead (Pb) |
mg L-1 |
4.4 (a) |
|
Zinc (Zn) |
mg L-1 |
8 (a) |
|
Mercury (Hg) |
mg L-1 |
0.4 (a) |
|
Arsenic (As) |
mg L-1 |
13 (a) |
|
Silver (Ag) |
mg L-1 |
1.4 (a) |
|
PAHs |
||
|
Total PAHs |
mg L-1 |
0.2 (b) |
|
PCBs |
|
|
|
Total PCBs |
mg L-1 |
0.03 (b) |
|
Organotins |
|
|
|
Tributyltin (TBT) |
mg L-1 |
0.006 (b) |
Notes:
(a) Australian and New
Zealand Guidelines for Fresh and Marine Water Quality. Default guideline value
for protection for 95% Species in Marine water. Available at: https://www.waterquality.gov.au/anz-guidelines/guideline-values/default/water-quality-toxicants/search
For chromium, the more stringent standard for Cr(VI) is adopted. For
arsenic, there is no standard for marine water, standard for freshwater for
As(V) was thus adopted which is more conservative than that for As(III).
(b) U.S. Environmental Protection Agency, National Recommended Water Quality Criteria, 2009. (https://www.epa.gov/wqc/national-recommended-water-quality-criteria-aquatic-life-criteria-table). The Criteria Continuous Concentration (CCC) is an estimate of the highest concentration of a material in surface water (ie saltwater) to which an aquatic community can be exposed indefinitely without resulting in an unacceptable effect. CCC is used as the criterion of the respective compounds in this study.
3.5
Assessment
Methodology
The methodology employed to assess potential water quality impacts associated with the construction and operation of the Project is presented in the Water Quality Modelling Method Statement and has been based on the information presented in the Project Description (Section 2). Full details of the scenarios examined in the modelling works and the uncertainties in various aspects of the modelling assessment are provided in Method Statement for Water Quality Modelling Assessment (Annex 3A). Verification of hydrodynamic model has been provided under Appendix A of Annex 3A. The WSRs assessed are presented in Figure 3.3.
3.6
Potential
Sources of Impact
The key construction and operation activities of the Project are discussed in Section 2.6.4. Potential sources of impacts to water quality arising from the Project may occur during both construction and operation activities, including:
Construction activities:
§ Dredging of the seabed for the formation of CMP
Operation activities:
n Disposal of contaminated sediment in the formed CMP
n Capping of the exhausted CMP by uncontaminated sediment up to the original seabed level
Note that the construction activities (dredging) could overlap with operation activities (backfilling and capping) to maintain uninterrupted disposal service of the proposed WL Facility. As a conservative approach, the assessment has considered these construction and operation activities of the Project to be conducted at the respective maximum rates as discussed in Section 2.6.4. The assessment has also considered that the identified concurrent marine works would be conducted with their maximum allowed sediment loss rates as discussed in Annex 3A. The following key water quality issues have been assessed and discussed in the following sections:
n Changes in water quality due to construction and operation activities (i.e. dredging, disposal and capping) – these construction and operation activities would result in loss of sediment into the water column, increased sedimentation, release of sediment-bounded contaminants and nutrients as well as depletion of dissolved oxygen, and thus affect the surrounding body of water;
n Marine vessel discharges - wastewater from construction vessels and sewage from workforce, etc., if uncontrolled, would result in deterioration of water quality; and
n Changes in flow regime – each of the proposed CMPs would require dredging of seabed, causing localised depression. During the operation of each proposed CMP, the CMPs would be backfilled and thus the depression would be gradually reduced. When a CMP reaches its disposal capacity, it would then be capped with uncontaminated sediments. Throughout these processes, the change in seabed level at these CMPs may cause localized change in flow regime.
3.7
Impact
Assessment
3.7.1 Changes in Water Quality due to Construction and Operation
Activities
3.7.1.1 Suspended
Solids (SS) Dispersion and Sedimentation
Sediment plume modelling has been conducted to assess the potential SS impact from dredging, disposal (backfilling) and capping works of the Project. Two representative scenarios for sediment plume modelling have been conducted in accordance with the Method Statement for Water Quality Modelling Assessment (Annex 3A), including:
n Scenario C1 – assume three CMPs located at east of the Key Area (closer to Lamma Island) to be constructed and operated concurrently; hopper barge backfilling at the northernmost CMP, grab dredging (with 2 grab dredgers) at the middle CMP and hopper barge capping at the southernmost CMP as well as other concurrent projects;
n Scenario C2 - similar to scenario C1 except dredging would be conducted by one TSHD;
Details on the number of concurrent plants, type of plants used, working rate, number of working hours per day as well as other concurrent projects for Scenario C1 and Scenario C2 are discussed in Section 3 and 6 of Method Statement for Water Quality Modelling Assessment (Annex 3A). The modelling predictions for these scenarios are presented below.
Scenario C1
In this scenario, three CMPs located at east of the Key Area (closer to Lamma Island) are assumed to be constructed and operated concurrently. For conservative assessment on the hydrodynamic regime in the Assessment Area, the coastline of potential artificial islands in the Central Waters has been taken into account in the modelling ([13]). Concurrent backfilling in the northernmost pit at rate of 26,700 m3/day, grab dredging by two grab dredgers at the middle pit with rate of 50,000 m3/week per dredger, as well as capping at the southernmost pit at rate of 26,700 m3/day are modelled. This scenario conservatively assumes that the most contaminating activity (backfilling) would be conducted at the northern CMP, followed by the second contaminating activity (dredging) at the middle CMP, and the least contaminating activity (capping) at the southern CMP, thus representing the worst case scenario in terms of contaminants retention in Hong Kong waters.
In addition, sediment loss from other concurrent projects include:
n TSHD dredging under Improvement Dredging for Lamma Power Station Navigation Channel (AEIAR-212/2017) at a rate of 78,900 m3/day in dry season and 132,500 m3/day in wet season
n Dredging with 3 grab dredgers under Providing Sufficient Water Depth for Kwai Tsing Container Basin and its Approach Channel (AEIAR-156/2010) at a rate of 4,000 m3/day
n Open sea disposal at South of Cheung Chau at a rate of 22,800 m3/day
n Sediment disposal at South of Tsing Yi at a rate of 1,600 m3/day
Predicted levels of maximum SS elevation at the identified WSRs are provided in Table 3.13. Contour plots of predicted maximum SS elevation (depth-averaged, surface, middle and bottom depths) are provided in Figures 1 and 2 of Annex 3B. The predicted maximum SS elevations at the WSRs are relatively low due to the good tidal flushing and the relatively large separation distance from the Project site. The predicted maximum SS elevations at the identified WSRs are below the corresponding assessment criteria, and thus are in compliance with the relevant WQO. The maximum SS elevation of 1.1 mg L-1 is predicted to occur at MP1-C (Potential South Lamma MP) for dry season. For wet season, the predicted maximum of 0.8 mg L-1 was predicted at MP1-B (Potential South Lamma MP) and at CR01 (corals at Cheung Chau). The Potential South Lamma MP is located over 2 km from the Project site. The predicted sedimentation flux at nearby coral locations are also below the corresponding assessment criterion of 100 g/m2/day and thus no unacceptable impacts to coral communities are expected due to sediment deposition from the Project. Contour plots of predicted maximum sedimentation flux are provided in Figure 5 of Annex 3B. The maximum sedimentation flux is predicted to occur at CR22 (Pak Kok) in dry season (38 g/m2/day) and CR23 (Shek Kok Tsui) in wet season (50 g/m2/day) (Table 3.14).
In general, the sediment plume is predicted to be elongated along the dominant flow direction (NNW-SSE axis). The elongation is more pronounced in dry season than wet season. Sediment plume from this Project is predicted to have some levels of overlap with that from the TSHD dredging under Improvement Dredging for Lamma Power Station Navigation Channel. The overlapping is more pronounced in wet season because of more lateral dispersion across the dominant flow direction. Such overlapping of sediment plume would not result in notable cumulative sediment impact.
Scenario C2
In this scenario, three CMPs located at east of the Key Area (closer to Lamma Island) are assumed to be constructed and operated concurrently. For conservative assessment on the hydrodynamic regime in the Assessment Area, the coastline of potential artificial islands in the Central Waters has been taken into account in the modelling. Concurrent backfilling in the northernmost pit at rate of 26,700 m3/day, TSHD dredging at the middle pit with rate of 256,200 m3/week, as well as capping at the southernmost pit at rate of 26,700 m3/day are modelled.
In addition, sediment loss from other concurrent projects include:
n TSHD dredging under Improvement Dredging for Lamma Power Station Navigation Channel (AEIAR-212/2017) at a rate of 78,900 m3/day in dry season and 132,500 m3/day in wet season
n Dredging with 3 grab dredgers under Providing Sufficient Water Depth for Kwai Tsing Container Basin and its Approach Channel (AEIAR-156/2010) at a rate of 4,000 m3/day
n Open sea disposal at South of Cheung Chau at a rate of 45,100 m3/day ([14])
n Sediment disposal at South of Tsing Yi at a rate of 1,600 m3/day
Predicted maximum levels of SS elevation at the identified WSRs are provided in Table 3.13. Contour plots of predicted maximum SS elevation (depth-averaged, surface, middle and bottom depths) are provided in Figures 3 and 4 of Annex 3B. The predicted maximum SS elevations at the identified WSRs are relatively low and similar to the prediction under Scenario C1. Typically the predicted maximum SS elevations under Scenario C2 are of < 0.1 mg L-1 difference from those under Scenario C1. No exceedance of assessment criteria for SS elevation at WSRs is predicted. The maximum SS elevation of 1.1 mg L-1 is predicted to occur at MP1-C (Potential South Lamma MP) for dry season. For wet season, the predicted maximum of 0.8 mg L-1 is predicted at CR01 (corals at Cheung Chau).
The predicted sedimentation flux at the identified coral locations are also below the corresponding assessment criterion on 100 g/m2/day and thus no unacceptable impacts to coral communities are expected due to sediment deposition from the Project. Contour plots of predicted maximum sedimentation flux are provided in Figure 5 of Annex 3B. The maximum sedimentation flux is predicted to occur at CR22 (Pak Kok) in dry season (38 g/m2/day) and CR23 (Shek Kok Tsui) in wet season (48 g/m2/day) (Table 3.14). Note that the sediment loss from TSHD is expected to occur at the lower part of the water column and was modelled accordingly. Therefore, suspended sediments from TSHD could settle at shorter distance from the sediment sources under this circumstance. This explains the lower sedimentation flux predicted at nearby coral WSRs when compared with Scenario C1.
The sediment plume under this scenario is also very similar to that of Scenario C1 given the same hydrodynamics. The increased sediment loss rate from TSHD dredging is predicted to have limited impact on the extent of the sediment plume. On the other hand, the increased sediment loss from the disposal works at South of Cheung Chau resulted in slight increase in plume extent.
Time series plots of predicted SS elevation at WSRs with the highest SS elevation (MP1-B, MP1-C, CR01 and CR22) and predicted sedimentation flux with the highest values at CR01 and CR22 under various scenarios are presented in Annex 3C. The predicted SS elevation varies with tidal conditions and reaches the maximum at about once in each 15-day tidal cycle. Surface level SS elevation is typically lower than the corresponding level near the bottom, and the depth-averaged level is typically in between the two.
While a portion of nursery area and spawning ground
for commercial fisheries resources is located in the mixing zone of the
Project, such areas are considered very small
(<1% when comparing to the recognized nursery area and spawning ground for
commercial fisheries resources in Hong Kong waters). In addition, the potential for the
Assessment Area to function as important spawning grounds and nursery area is
not high as assessed in Section 5.3.3. The dredging, backfilling and capping of CMPs
would only generate temporary and localised low level SS elevation. Unacceptable water quality impact to the nursery
area and spawning ground for commercial fisheries resources due to the Project
is not anticipated.
It should be highlighted that in all the scenarios, the assumed sediment loss rates under the construction and operation activities of the Project (i.e. dredging, backfilling and capping) were at the respective maximum. Similarly, it is also assumed that all the identified concurrent marine works would be conducted with their maximum allowed sediment loss rates. This means the predicted SS elevation in all scenarios would be conservative. Under these representative and conservative scenarios, no unacceptable adverse impacts from SS dispersion and sedimentation are anticipated.
Overall, full compliance of SS and sedimentation flux is predicted at all identified WSRs in dry and wet seasons. No unacceptable impacts are expected due to SS dispersion and sedimentation from the Project to the identified WSRs in the Assessment Area, including coral communities, gazetted and non-gazetted bathing beaches, seawater intakes, typhoon shelters, FCZ, SSSI, Green Turtle nesting ground, secondary contact recreation subzones, habitat for FP, nursery area and spawning ground for commercial fisheries resources and proposed/ potential marine parks.
Table 3.13 Predicted SS Elevation at Identified WSRs
|
Description |
Location |
Model Output Location |
EPD Station |
Relevant Depth |
Dry Season (WQO Allowable Change) (mg L-1) |
Dry Season Max Increase (mg L-1) |
Dry Season Compliance Time % |
Wet Season (WQO Allowable Change) (mg L-1) |
Wet Season Max Increase (mg L-1) |
Wet Season Compliance Time % |
||
|
Scenario C1 |
Scenario C2 |
Scenario C1 |
Scenario C2 |
|||||||||
|
Fisheries Sensitive Receivers |
||||||||||||
|
Fish Culture Zone (FCZ) |
Cheung Sha Wan FCZ |
FCZ1 |
SM12 |
Depth-averaged |
6.1 |
0.0 |
0.0 |
100% |
4.2 |
0.0 |
0.0 |
100% |
|
Lo Tik Wan FCZ |
FCZ2 (3) |
SM3 |
Depth-averaged |
3.1 |
0.0 |
0.0 |
100% |
2.9 |
0.2 |
0.2 |
100% |
|
|
Sok Kwu Wan FCZ |
FCZ3 (3) |
SM4 |
Depth-averaged |
2.5 |
0.0 |
0.0 |
100% |
2.3 |
0.0 |
0.0 |
100% |
|
|
Ma Wan FCZ |
FCZ4 |
WM4 |
Depth-averaged |
6.3 |
0.1 |
0.1 |
100% |
4.0 |
0.2 |
0.2 |
100% |
|
|
Marine Ecological Sensitive Receivers |
||||||||||||
|
Marine Park (MP) |
Potential South Lamma MP |
MP1-A (2) (3) |
SM5 |
Depth-averaged |
4.1 |
0.0 |
0.0 |
100% |
3.0 |
0.1 |
0.1 |
100% |
|
MP1-B (2) (3) |
SM6 |
Depth-averaged |
3.7 |
0.6 |
0.6 |
100% |
3.1 |
0.8 |
0.7 |
100% |
||
|
MP1-C (2) (3) |
SM6 |
Depth-averaged |
3.7 |
1.1 |
1.1 |
100% |
3.1 |
0.6 |
0.6 |
100% |
||
|
South Lantau MP |
MP2 (2) (3) |
SM12 |
Depth-averaged |
6.1 |
0.1 |
0.1 |
100% |
4.2 |
0.0 |
0.0 |
100% |
|
|
Corals |
Cheung Chau |
CR01 (1) (3) |
SM12 |
Bottom |
6.6 |
0.0 |
0.0 |
100% |
5.4 |
0.8 |
0.8 |
100% |
|
CR11 (1) (3) |
SM12 |
Bottom |
6.6 |
0.0 |
0.0 |
100% |
5.4 |
0.5 |
0.5 |
100% |
||
|
B1 (1) (3) |
SM12 |
Bottom |
6.6 |
0.0 |
0.0 |
100% |
5.4 |
0.6 |
0.5 |
100% |
||
|
Hei Ling Chau |
CR02 (1) |
SM11 |
Bottom |
6.0 |
0.0 |
0.0 |
100% |
5.1 |
0.2 |
0.1 |
100% |
|
|
CR03 (1) |
SM11 |
Bottom |
6.0 |
0.0 |
0.0 |
100% |
5.1 |
0.3 |
0.2 |
100% |
||
|
CR09 (1) |
SM11 |
Bottom |
6.0 |
0.0 |
0.0 |
100% |
5.1 |
0.0 |
0.0 |
100% |
||
|
Chi Ma Wan Peninsula |
CR04 |
SM12 |
Bottom |
6.6 |
0.0 |
0.0 |
100% |
5.4 |
0.0 |
0.0 |
100% |
|
|
Sunshine Island |
CR05 (1) |
SM11 |
Bottom |
6.0 |
0.0 |
0.0 |
100% |
5.1 |
0.0 |
0.0 |
100% |
|
|
CR06 (1) |
SM11 |
Bottom |
6.0 |
0.0 |
0.0 |
100% |
5.1 |
0.0 |
0.0 |
100% |
||
|
CR07 (1) |
SM11 |
Bottom |
6.0 |
0.0 |
0.0 |
100% |
5.1 |
0.1 |
0.0 |
100% |
||
|
CR08 (1) |
SM11 |
Bottom |
6.0 |
0.0 |
0.0 |
100% |
5.1 |
0.0 |
0.0 |
100% |
||
|
Kau Yi Chau |
CR10 |
SM9 |
Bottom |
3.9 |
0.0 |
0.0 |
100% |
7.8 |
0.0 |
0.0 |
100% |
|
|
CR26 |
SM9 |
Bottom |
3.9 |
0.0 |
0.0 |
100% |
7.8 |
0.0 |
0.0 |
100% |
||
|
CR27 |
SM9 |
Bottom |
3.9 |
0.0 |
0.0 |
100% |
7.8 |
0.1 |
0.1 |
100% |
||
|
Siu Kau Yi Chau |
CR28 |
SM10 |
Bottom |
5.4 |
0.0 |
0.0 |
100% |
5.2 |
0.1 |
0.1 |
100% |
|
|
CR29 |
SM10 |
Bottom |
5.4 |
0.0 |
0.0 |
100% |
5.2 |
0.1 |
0.1 |
100% |
||
|
CR30 |
SM10 |
Bottom |
5.4 |
0.0 |
0.0 |
100% |
5.2 |
0.1 |
0.1 |
100% |
||
|
Hung Shing Yeh |
CR20 (1) |
SM5 |
Bottom |
4.8 |
0.0 |
0.0 |
100% |
4.2 |
0.1 |
0.1 |
100% |
|
|
Ha Mei Wan |
CR21 |
SM5 |
Bottom |
4.8 |
0.0 |
0.0 |
100% |
4.2 |
0.2 |
0.1 |
100% |
|
|
Pak Kok |
CR22 (1) (3) |
WM1 |
Bottom |
4.8 |
0.8 |
0.8 |
100% |
4.8 |
0.6 |
0.6 |
100% |
|
|
Shek Kok Tsui |
CR23 (1) |
SM7 |
Bottom |
4.2 |
0.6 |
0.6 |
100% |
5.4 |
0.7 |
0.6 |
100% |
|
|
Sandy Bay |
CR24 (1) |
WM2 |
Bottom |
5.7 |
0.2 |
0.2 |
100% |
5.7 |
0.2 |
0.2 |
100% |
|
|
Green Island |
CR25 |
VM8 |
Bottom |
6.9 |
0.4 |
0.4 |
100% |
5.7 |
0.5 |
0.5 |
100% |
|
|
Peng Chau |
CR31 |
SM10 |
Bottom |
5.4 |
0.0 |
0.0 |
100% |
5.2 |
0.1 |
0.1 |
100% |
|
|
CR32 |
SM10 |
Bottom |
5.4 |
0.0 |
0.0 |
100% |
5.2 |
0.0 |
0.0 |
100% |
||
|
CR33 |
SM10 |
Bottom |
5.4 |
0.0 |
0.0 |
100% |
5.2 |
0.0 |
0.0 |
100% |
||
|
CR34 |
SM9 |
Bottom |
3.9 |
0.0 |
0.0 |
100% |
7.8 |
0.0 |
0.0 |
100% |
||
|
CR35 |
SM9 |
Bottom |
3.9 |
0.0 |
0.0 |
100% |
7.8 |
0.0 |
0.0 |
100% |
||
|
Sham Wan |
TNG (1) (3) |
SM4 |
Bottom |
3.0 |
0.0 |
0.0 |
100% |
3.0 |
0.0 |
0.0 |
100% |
|
|
Green Turtle Nesting Ground / SSSI |
Sham Wan |
TNG |
SM4 |
Depth-averaged |
2.5 |
0.0 |
0.0 |
100% |
2.3 |
0.0 |
0.0 |
100% |
|
Water Sensitive Receivers |
||||||||||||
|
Gazetted Beaches |
Cheung Chau Tung Wan Beach |
B1 (1) (3) |
SM12 |
Depth-averaged |
6.1 |
0.0 |
0.0 |
100% |
4.2 |
0.4 |
0.4 |
100% |
|
Kwun Yam Wan Beach |
B2 (1) (3) |
SM12 |
Depth-averaged |
6.1 |
0.0 |
0.0 |
100% |
4.2 |
0.2 |
0.2 |
100% |
|
|
Hung Shing Yeh Beach |
B3 (1) (3) |
SM5 |
Depth-averaged |
4.1 |
0.0 |
0.0 |
100% |
3.0 |
0.0 |
0.0 |
100% |
|
|
Lo So Shing Beach |
B4 (1) (3) |
SM5 |
Depth-averaged |
4.1 |
0.0 |
0.0 |
100% |
3.0 |
0.1 |
0.1 |
100% |
|
|
Tung Wan Beach, Ma Wan |
B5 |
WM4 |
Depth-averaged |
6.3 |
0.0 |
0.0 |
100% |
4.0 |
0.0 |
0.0 |
100% |
|
|
Approach Beach |
B6 |
WM4 |
Depth-averaged |
6.3 |
0.1 |
0.1 |
100% |
4.0 |
0.1 |
0.1 |
100% |
|
|
Ting Kau Beach |
B7 |
WM4 |
Depth-averaged |
6.3 |
0.0 |
0.0 |
100% |
4.0 |
0.0 |
0.0 |
100% |
|
|
Lido Beach |
B8 |
WM4 |
Depth-averaged |
6.3 |
0.0 |
0.0 |
100% |
4.0 |
0.1 |
0.1 |
100% |
|
|
Casam Beach |
B9 |
WM4 |
Depth-averaged |
6.3 |
0.1 |
0.1 |
100% |
4.0 |
0.1 |
0.1 |
100% |
|
|
Hoi Mei Wan Beach |
B10 |
WM4 |
Depth-averaged |
6.3 |
0.1 |
0.1 |
100% |
4.0 |
0.1 |
0.1 |
100% |
|
|
Gemini Beach |
B11 |
WM4 |
Depth-averaged |
6.3 |
0.3 |
0.3 |
100% |
4.0 |
0.2 |
0.2 |
100% |
|
|
Anglers’ Beach |
B12 |
WM4 |
Depth-averaged |
6.3 |
0.2 |
0.2 |
100% |
4.0 |
0.2 |
0.2 |
100% |
|
|
Non-gazetted Beaches |
Tai Kwai Wan |
NB3 (1) (3) |
SM12 |
Depth-averaged |
6.1 |
0.0 |
0.0 |
100% |
4.2 |
0.0 |
0.0 |
100% |
|
Po Yue Wan |
NB4 (1) (3) |
SM12 |
Depth-averaged |
6.1 |
0.0 |
0.0 |
100% |
4.2 |
0.0 |
0.0 |
100% |
|
|
Seawater Intakes |
Sha Wan Drive |
C1 |
WM2 |
Bottom |
5.7 |
0.0 |
0.0 |
100% |
5.7 |
0.0 |
0.0 |
100% |
|
Wah Fu Estate |
C2 |
WM1 |
Bottom |
4.8 |
0.0 |
0.0 |
100% |
4.8 |
0.0 |
0.0 |
100% |
|
|
Lamma Power Station (b) |
C3 (1) (3) |
SM5 |
Bottom |
84.0 |
0.0 |
0.0 |
100% |
86.0 |
0.0 |
0.0 |
100% |
|
|
Integrated Waste Management Facilities at Shek Kwu Chau |
C4 (1) (3) |
SM12 |
Bottom |
6.6 |
0.0 |
0.0 |
100% |
5.4 |
0.0 |
0.0 |
100% |
|
|
Offshore LNG Terminal |
C5 (3) |
SM12 |
Bottom |
6.6 |
0.0 |
0.0 |
100% |
5.4 |
0.0 |
0.0 |
100% |
|
|
Tsuen Wan |
C6 |
VM14 |
Bottom |
4.8 |
0.0 |
0.0 |
100% |
3.9 |
0.0 |
0.0 |
100% |
|
|
MTR Tsing Yi Station |
C7 |
VM12 |
Bottom |
8.1 |
0.0 |
0.0 |
100% |
7.7 |
0.0 |
0.0 |
100% |
|
|
MTR Kowloon Station |
C8 |
VM6 |
Bottom |
4.5 |
0.0 |
0.0 |
100% |
4.2 |
0.0 |
0.0 |
100% |
|
|
China H.K. City |
C9 |
VM6 |
Bottom |
4.5 |
0.0 |
0.0 |
100% |
4.2 |
0.0 |
0.0 |
100% |
|
|
Queen Mary Hospital |
C10 |
WM2 |
Bottom |
5.7 |
0.0 |
0.0 |
100% |
5.7 |
0.0 |
0.0 |
100% |
|
|
Kwai Chung Hospital |
EMSD1 |
VM12 |
Bottom |
8.1 |
0.0 |
0.0 |
100% |
7.7 |
0.0 |
0.0 |
100% |
|
|
WSD Flushing Intakes |
Tsing Yi |
WSD1 |
VM12 |
Depth-averaged |
6.8 |
0.1 |
0.1 |
100% |
5.3 |
0.1 |
0.1 |
100% |
|
Kennedy Town |
WSD2 |
VM8 |
Depth-averaged |
5.2 |
0.3 |
0.3 |
100% |
3.5 |
0.2 |
0.2 |
100% |
|
|
Sheung Wan |
WSD3 |
VM7 |
Depth-averaged |
4.1 |
0.0 |
0.0 |
100% |
3.2 |
0.1 |
0.1 |
100% |
|
|
Centrol Water Front |
WSD4 |
VM6 |
Depth-averaged |
3.3 |
0.0 |
0.0 |
100% |
0.2 |
0.0 |
0.0 |
100% |
|
|
Ap Lei Chau |
WSD5 |
SM3 |
Depth-averaged |
3.1 |
0.0 |
0.0 |
100% |
0.5 |
0.1 |
0.1 |
100% |
|
|
Kowloon South |
WSD6 |
VM6 |
Depth-averaged |
3.3 |
0.0 |
0.0 |
100% |
0.2 |
0.0 |
0.0 |
100% |
|
|
Cheung Sha Wan |
WSD7 |
VM15 |
Depth-averaged |
4.5 |
0.0 |
0.0 |
100% |
4.1 |
0.0 |
0.0 |
100% |
|
|
Tsuen Wan |
WSD8 |
VM14 |
Depth-averaged |
4.6 |
0.0 |
0.0 |
100% |
3.4 |
0.0 |
0.0 |
100% |
|
|
Near Hong Kong Garden |
WSD9 |
WM4 |
Depth-averaged |
6.3 |
0.2 |
0.2 |
100% |
4.0 |
0.1 |
0.1 |
100% |
|
|
Pumping Station at Tai Kwai Wan |
NB3 |
SM12 |
Depth-averaged |
6.1 |
0.0 |
0.0 |
100% |
4.2 |
0.0 |
0.0 |
100% |
|
|
Typhoon Shelters |
Cheung Chau |
TS1 (3) |
SM12 |
Depth-averaged |
6.1 |
0.0 |
0.0 |
100% |
4.2 |
0.0 |
0.0 |
100% |
|
|
Hei Ling Chau |
TS2 |
SM10 |
Depth-averaged |
4.8 |
0.0 |
0.0 |
100% |
4.5 |
0.0 |
0.0 |
100% |
|
|
Aberdeen |
TS3 |
WM1 |
Depth-averaged |
3.2 |
0.0 |
0.0 |
100% |
3.1 |
0.0 |
0.0 |
100% |
|
|
Rambler Channel |
TS4 |
VM14 |
Depth-averaged |
4.6 |
0.0 |
0.0 |
100% |
3.4 |
0.0 |
0.0 |
100% |
|
|
New Yau Ma Tei |
TS5 |
VM15 |
Depth-averaged |
4.2 |
0.0 |
0.0 |
100% |
4.1 |
0.0 |
0.0 |
100% |
|
|
Government Dockyard |
TS6 |
VM15 |
Depth-averaged |
4.2 |
0.0 |
0.0 |
100% |
4.1 |
0.0 |
0.0 |
100% |
Notes:
1. The WSR also represents secondary contact
recreation subzone.
2. The WSR also represents habitat for FP.
3. The WSR also represents nursery area and
spawning ground for commercial fisheries resources.
Table 3.14 Predicted Sedimentation Flux (g/m2/day) at the Identified Coral WSRs
|
Location |
Model Output Location |
EPD Station |
Assessment Criterion (g/m2/day) |
Dry Season Max Increase (g/m2/day) |
Wet Season Max Increase (g/m2/day) |
||
|
Scenario C1 |
Scenario C2 |
Scenario C1 |
Scenario C2 |
||||
|
Cheung Chau |
CR01 |
SM12 |
100 |
0 |
0 |
33 |
43 |
|
CR11 |
SM12 |
100 |
0 |
0 |
30 |
28 |
|
|
B1 |
SM12 |
100 |
0 |
0 |
24 |
24 |
|
|
Hei Ling Chau |
CR02 |
SM11 |
100 |
0 |
0 |
7 |
6 |
|
CR03 |
SM11 |
100 |
0 |
0 |
10 |
9 |
|
|
CR09 |
SM11 |
100 |
0 |
0 |
0 |
0 |
|
|
Chi Ma Wan Peninsula |
CR04 |
SM12 |
100 |
0 |
0 |
0 |
0 |
|
Sunshine Island |
CR05 |
SM11 |
100 |
0 |
0 |
1 |
1 |
|
CR06 |
SM11 |
100 |
0 |
0 |
0 |
0 |
|
|
CR07 |
SM11 |
100 |
0 |
0 |
2 |
2 |
|
|
CR08 |
SM11 |
100 |
0 |
0 |
1 |
1 |
|
|
Kau Yi Chau |
CR10 |
SM9 |
100 |
0 |
0 |
2 |
2 |
|
CR26 |
SM9 |
100 |
0 |
0 |
1 |
1 |
|
|
CR27 |
SM9 |
100 |
0 |
0 |
3 |
3 |
|
|
Siu Kau Yi Chau |
CR28 |
SM10 |
100 |
1 |
1 |
4 |
4 |
|
CR29 |
SM10 |
100 |
2 |
2 |
3 |
3 |
|
|
CR30 |
SM10 |
100 |
1 |
1 |
3 |
3 |
|
|
Hung Shing Yeh |
CR20 |
SM5 |
100 |
0 |
0 |
2 |
2 |
|
Ha Mei Wan |
CR21 |
SM5 |
100 |
0 |
0 |
6 |
6 |
|
Pak Kok |
CR22 |
WM1 |
100 |
38 |
38 |
40 |
36 |
|
Shek Kok Tsui |
CR23 |
SM7 |
100 |
29 |
29 |
50 |
48 |
|
Sandy Bay |
CR24 |
WM2 |
100 |
7 |
7 |
9 |
9 |
|
Green Island |
CR25 |
VM8 |
100 |
20 |
20 |
20 |
20 |
|
Peng Chau |
CR31 |
SM10 |
100 |
0 |
0 |
0 |
0 |
|
CR32 |
SM10 |
100 |
0 |
0 |
0 |
0 |
|
|
CR33 |
SM10 |
100 |
0 |
0 |
0 |
0 |
|
|
CR34 |
SM9 |
100 |
0 |
0 |
0 |
0 |
|
|
CR35 |
SM9 |
100 |
0 |
0 |
0 |
0 |
|
|
Sham Wan |
TNG |
SM4 |
100 |
0 |
0 |
0 |
0 |
|
Note: Sedimentation flux predicted by the model is instantaneous even though the output unit was based on daily. The values presented are the amount of sediment in gram settled on one square meter of area if the maximum sedimentation rate sustained for one day. In reality such instantaneous maximum would occur just once in the entire modelling period and would be far shorter than 1 day. Thus the presented results are conservative when interpreted based on the assessment criterion. |
|||||||
To ensure the water quality impact assessment provide sufficient
coverage in terms of potential worse case for the WSRs to the west of the
Project, two additional scenarios, Scenario C1A and Scenario C2A, which were
not described in the Method Statement for
Water Quality Modelling Assessment (Annex 3A), were conducted to assess the
potential water quality impact of concurrent dredging, backfilling and capping
works at west of the Key Area. The
adopted modelling assumptions for these two additional scenarios (C1A and C2A)
are entirely the same as Scenarios C1 and C2, except for the locations of sediment
sources under this Project. The impact
assessment on changes in water quality and the modelling results of these two
additional scenarios (C1A and C2A) are presented in Annex 3E. From the modelling results between Scenario
C1/C2 and Scenario C1A/C2A, the maximum SS elevation at WSRs were generally
higher for CMPs locating to the eastern edge contributed by the dredging at
Lamma Power Station Navigation Channel.
Therefore, Scenarios C1 and C2, assuming the three CMPs located at east
of the Key Area (closer to Lamma Island) with sediment sources at the eastern
edge of the CMPs, represent the worst case scenarios for conservative
assessment.
While the change of coastline due to the proposed Kau Yi Chau Artificial Islands (KYCAI) development is not expected to be significant during initial years of construction and operation activities of the Project as the reclamation works of the proposed KYCAI development would be carried out gradually, the extent of sediment dispersion during initial years of construction and operation activities of the Project when the coastline of the proposed KYCAI development is yet to be formed, was further investigated. Two additional scenarios, Scenario C1B and Scenario C2B, which were not described in the Method Statement for Water Quality Modelling Assessment (Annex 3A), were conducted to assess the potential water quality impact of concurrent dredging, backfilling and capping works without considering the coastline of the proposed KYCAI. The results of the investigation are presented in Annex 3F. Overall, the model predictions showed that the construction and operation of the Project will not result in notable difference of water quality at nearby WSRs with and without KYCAI configuration. The predicted levels of SS elevation at all scenarios are expected to be limited and in compliance with the corresponding assessment criteria. Unacceptable water quality impacts are not expected under these scenarios with and without KYCAI configuration. Given the sediment plume is predicted to be elongated along the dominant flow direction (NNW-SSE axis), the change in flow regime due to the proposed KYCAI coastline is expected to be a contributing factor affecting the extent of sediment dispersion in the Assessment Area. As the Project is expected to have a service lifetime for up to 20 years, Scenarios C1 and C2 (with the consideration of proposed KYCAI coastline) are considered as the representative scenarios for conservative assessment.
3.7.1.2 Dissolved Oxygen (DO) Depletion
The degree of DO depletion exerted by a sediment plume is a function of the sediment oxygen demand of the sediment, its concentration in the water column and the rate of oxygen replenishment. The impact of the sediment oxygen demand on DO concentrations has been calculated based on the following equation:
DO (mg O2 L-1) = DO (g O2/m3) = SS (g DW/m3) × sediment oxygen demand (mg O2 kg-1 DW)
The assumption behind this equation is that all the released organic matter is eventually re-mineralized within the water column. This leads to an estimated depletion with respect to the background DO concentrations. This DO depletion depends on the quality of the released sediments, i.e. on the percentage of organic matter in the sediment. The fraction of organic matter in sediment (Chemical oxygen demand in Table 3.5) was taken as 28,000 mg kg-1 (maximum value at stations SS3 and SS4 from 1986-2020) with reference to EPD Marine Monitoring data shown in Table 3.5 as a representative value for sediments within the Study Area. Based on the predicted maximum SS elevation level of 1.1 mg L-1 the corresponding level of DO depletion is calculated to be:
DO (mg O2 L-1) = 1.1 (g DW m-3) × 28,000 (mg O2 kg-1 DW) = 30.8 (mg O2 m-3) = 0.0308 mg L-1
The
maximum predicted DO depletion level is around 0.03 mg L-1 (at MP1-C, where allowable DO depletion is
1.2 mg/L), which is considered to be insignificant. DO depletion levels
at other identified WSRs would be even lower due to insignificant SS elevation
from the Project. The estimated maximum levels of DO depletion from
backfilling, dredging and capping are presented in Figure 6 of Annex 3B to illustrate the spatial
coverage.
As discussed in Section 3.7.1.1, while a portion of nursery area and spawning ground for commercial fisheries resources is located in the mixing zone of the Project, such areas are considered very small (<1% when comparing to the recognized nursery area and spawning ground for commercial fisheries resources in Hong Kong waters) and the potential to function as important spawning grounds and nursery area is not high. The dredging, backfilling and capping of CMPs would only generate temporary and insignificant DO depletion. Unacceptable water quality impact to the nursery area and spawning ground for commercial fisheries resources due to the Project is not anticipated.
Note that there are WSRs with low DO baseline levels which make allowable DO depletion level close to zero. These WSRs include Lo Tik Wan FCZ (FCZ2), Sok Kwu Wan FCZ (FCZ3), Ma Wan FCZ (FCZ4), Anglers’ Beach (B12) and Rambler Channel (TS4). Among these WSRs, SS elevation was predicted to be at detectable level of 0.2 mg/L at FCZ2 (wet season only), FCZ4 (wet season only), and B12 (both dry and wet seasons), while the predicted SS elevation at TS4 was negligible. The level of DO depletion corresponding to 0.2 mg/L of SS elevation is 0.0056 mg/L, which is considered to be negligible. Therefore, the negligible levels of DO depletion is not expected to result in notable deterioration of water quality at these WSRs. Overall, no unacceptable water quality impact from DO depletion is anticipated to the identified WSRs in the Assessment Area, including coral communities, gazetted and non-gazetted bathing beaches, seawater intakes, typhoon shelters, FCZ, SSSI, Green Turtle nesting ground, secondary contact recreation subzones, habitat for FP, nursery area and spawning ground for commercial fisheries resources and existing/ potential marine parks.
3.7.1.3 Release of Sediment-bounded
Contaminants
As discussed in Section 3.3.6, sediment samples collected within the Study Area indicated low levels of sediment contamination within the Project Site. Therefore, risk of release of sediment-bounded contaminant from dredging works of the Project is minimal. On the other hand, the contamination levels of sediments for backfilling of the Project could vary and sediment-bounded contaminants from backfilling is more likely to be released.
The risk of release of sediment-bounded contaminants was assessed with the aid of computational modelling using Delft3D. Similar to the case of sediment dispersion modelling, two modelling scenarios were simulated in accordance with the Method Statement for Water Quality Modelling Assessment (Annex 3A), namely:
n Scenario C3 – assume three CMPs located at east of the Key Area (closer to Lamma Island) to be constructed and operated concurrently; hopper barge backfilling at the northernmost CMP and grab dredging (with 2 grab dredgers) at the middle CMP;
n Scenario C4 - similar to scenario C3 except the dredging would be conducted by one TSHD (concurrent works on the east side of project);
To ensure the water quality impact assessment provide sufficient coverage in terms of potential worse case for the WSRs to the west of the Project, two additional scenarios, Scenario C3A and Scenario C4A, which were not described in the Method Statement for Water Quality Modelling Assessment (Annex 3A), were conducted to assess the potential water quality impact of concurrent dredging, backfilling and capping works at west of the Key Area. The adopted modelling assumptions for these two additional scenarios (C3A and C4A) are entirely the same as Scenarios C3 and C4, except for the locations of sediment sources under this Project. The impact assessment on changes in water quality and the modelling results of these two additional scenarios (C3A and C4A) are presented in Annex 3E. From the modelling results between Scenario C3/C4 and Scenario C3A/C4A, the maximum conservative tracer concentrations at WSRs were generally higher for CMPs locating to the eastern edge contributed by the dredging at Lamma Power Station Navigation Channel. Therefore, Scenarios C3 and C4, assuming the three CMPs located at east of the Key Area (closer to Lamma Island) with sediment sources at the eastern edge of the CMPs, represent the worst case scenarios for conservative assessment.
In the model simulation, conservative tracer was released into the water column at the same rate as sediment of the corresponding sources for backfilling and dredging of the Project specified in Scenarios C1 and C2 respectively. On the other hand, the actual release rates of contaminants would only be a minor fraction of the released sediment based on sediment contaminant levels. Therefore, a tracer-to-contaminant conversion ratio would be applied to both the predicted tracer levels from dredging and backfilling. For instance, the modelling release rate for conservative tracers from backfilling and dredging under this Project were 60000 g/s and 1405.4 g/s respectively, while the actual rate of release for Arsenic from backfilling and dredging would be 2.52 g/s and 1.546×10⁻² g/s. The corresponding tracer-to-contaminant conversion ratio for arsenic from backfilling and dredging are therefore calculated to be 2.52 ÷ 60000 = 4.2 ×10⁻⁵ and 1.546×10⁻² ÷ 1405.4 = 1.1×10⁻⁵ respectively. Note that given the use of uncontaminated filling materials for capping, it is assumed there would be no release of contaminants from capping and thus there is no conservative tracer release modelled for capping. Contaminant levels at WSRs were estimated based on the predicted concentration of conservative tracer, as well as levels of contaminants in sediment.
Contaminant
Level at WSR (µg L-1)
= Conservative Tracer Concentration for Backfilling (mg L-1) × Tracer-to-Contaminant Conversion Ratio
for Backfilling (µg kg-1) +
Conservative Tracer Concentration for Dredging (mg L-1) × Tracer-to-Contaminant Conversion Ratio
for Dredging (µg kg-1)
Based on the formula above, the estimated levels of Arsenic at CR03 in Scenario 3 in dry season could be calculated as follows:
Arsenic
Level at CR03 in
Scenario 3 in dry season (µg L-1)
= 5.5821 mg L-1 × 4.2 ×10-5
+ 2.1394 mg L-1 × 1.1×10-5
= 2.344 ×10⁻⁴ mg L-1 + 2.353×10⁻⁵ mg L-1
= 2.580×10⁻⁴ mg L-1
= 0.2580 µg L-1
Figures 7 and 8 of Annex 3B shows the contour plots for the modelled maximum depth-averaged levels of conservative tracers from backfilling and dredging activities, respectively. The WSRs with the maximum predicted conservative tracer concentrations under various modelling scenarios are provided below in Table 3.15. The maximum levels of conservative tracer were predicted for a few WSRs, namely, CR01 (Cheung Chau), CR03 (Hei Ling Chau) CR23 (Shek Kok Tsui) and NB4 (Po Yue Wan). This means the potential maximum levels of contaminants (which would be proportional to the predicted tracer concentration), would be maximum among these WSRs. The predicted concentration of two kinds of conservative tracers, the corresponding tracer-to-contaminant ratios as well as the calculated levels of contaminants at these four WSRs are presented in Table 3.16.
As shown in Table 3.16, the predicted levels of contaminants at the most impacted WSRs were all below the corresponding assessment criteria shown in Table 3.12. Compliance at all other WSRs in the Assessment Area is also expected for all the contaminants considered. As discussed in Section 3.7.1.1, while a portion of nursery area and spawning ground for commercial fisheries resources is located in the mixing zone of the Project, such areas are considered very small (<1% when comparing to the recognized nursery area and spawning ground for commercial fisheries resources in Hong Kong waters) and the potential to function as important spawning grounds and nursery area is not high. The backfilling and dredging of CMPs would only generate temporary and insignificant levels of contaminants. Unacceptable water quality impact to the nursery area and spawning ground for commercial fisheries resources due to the Project is not anticipated. Therefore, it is concluded that no unacceptable water quality impact associated with release of sediment-bounded contaminants is anticipated to the identified WSRs in the Assessment Area, including coral communities, gazetted and non-gazetted bathing beaches, seawater intakes, typhoon shelters, FCZ, SSSI, Green Turtle nesting ground, secondary contact recreation subzones, habitat for FP, nursery area and spawning ground for commercial fisheries resources and existing/ potential marine parks.
Table 3.15 Predicted Maximum Conservative Tracer Concentrations at WSRs under various Scenarios
|
Season |
Dry |
Wet |
||||||
|
Scenario |
C3 |
C4 |
C3 |
C4 |
||||
|
|
Tracer for Backfilling |
Tracer for Dredging |
Tracer for Backfilling |
Tracer for Dredging |
Tracer for Backfilling |
Tracer for Dredging |
Tracer for Backfilling |
Tracer for Dredging |
|
FCZ1 |
3.1987 |
1.1461 |
3.1987 |
1.1848 |
1.2331 |
0.4318 |
1.2331 |
0.5258 |
|
FCZ2 |
0.0429 |
0.0146 |
0.0429 |
0.0144 |
1.2790 |
0.5672 |
1.2790 |
0.3829 |
|
FCZ3 |
0.0180 |
0.0061 |
0.0180 |
0.0061 |
0.8227 |
0.3442 |
0.8227 |
0.2645 |
|
FCZ4 |
0.2791 |
0.0891 |
0.2791 |
0.0897 |
0.5149 |
0.2028 |
0.5149 |
0.1732 |
|
MP1-A |
0.0371 |
0.0183 |
0.0371 |
0.0187 |
1.4724 |
0.6020 |
1.4724 |
0.6181 |
|
MP1-B |
0.2385 |
0.1220 |
0.2385 |
0.1243 |
1.1740 |
0.6038 |
1.1740 |
0.5516 |
|
MP1-C |
0.3417 |
0.4192 |
0.3417 |
0.4604 |
0.8480 |
0.4182 |
0.8480 |
0.5758 |
|
MP2 |
3.0911 |
1.2808 |
3.0911 |
1.3531 |
0.6955 |
0.2612 |
0.6955 |
0.3451 |
|
CR01 |
5.0780 |
1.8991 |
5.0780 |
1.9752 |
2.2607 |
0.7885 |
2.2607 |
1.0715 |
|
CR11 |
5.3228 |
2.0018 |
5.3228 |
2.0830 |
2.0789 |
0.7301 |
2.0789 |
0.9802 |
|
CR02 |
5.4092 |
2.0614 |
5.4092 |
2.1611 |
2.0080 |
0.6400 |
2.0080 |
0.7881 |
|
CR03 |
5.5821 |
2.1394 |
5.5821 |
2.2421 |
2.0857 |
0.6584 |
2.0857 |
0.8029 |
|
CR09 |
3.5933 |
1.2922 |
3.5933 |
1.3370 |
1.1929 |
0.4354 |
1.1929 |
0.5282 |
|
CR04 |
3.3606 |
1.2119 |
3.3606 |
1.2542 |
1.4269 |
0.4900 |
1.4269 |
0.6214 |
|
CR05 |
4.8809 |
1.7467 |
4.8809 |
1.7998 |
1.5002 |
0.5247 |
1.5002 |
0.5775 |
|
CR06 |
4.8841 |
1.7634 |
4.8841 |
1.8227 |
1.4131 |
0.4961 |
1.4131 |
0.5525 |
|
CR07 |
5.1851 |
1.8661 |
5.1851 |
1.9266 |
1.3345 |
0.4681 |
1.3345 |
0.4385 |
|
CR08 |
4.5568 |
1.5973 |
4.5568 |
1.6392 |
1.2474 |
0.4443 |
1.2474 |
0.4180 |
|
CR10 |
1.8136 |
0.5815 |
1.8136 |
0.5868 |
1.2425 |
0.4280 |
1.2425 |
0.3471 |
|
CR26 |
1.7709 |
0.5599 |
1.7709 |
0.5628 |
1.0244 |
0.3672 |
1.0244 |
0.3087 |
|
CR27 |
1.7366 |
0.5700 |
1.7366 |
0.5782 |
0.9315 |
0.3436 |
0.9315 |
0.2956 |
|
CR28 |
2.3390 |
0.7792 |
2.3390 |
0.7916 |
1.0624 |
0.3871 |
1.0624 |
0.3643 |
|
CR29 |
2.3285 |
0.7761 |
2.3285 |
0.7886 |
1.0842 |
0.3939 |
1.0842 |
0.3722 |
|
CR30 |
2.3809 |
0.7940 |
2.3809 |
0.8068 |
1.1001 |
0.3999 |
1.1001 |
0.3759 |
|
CR20 |
0.0253 |
0.0124 |
0.0253 |
0.0126 |
1.0887 |
0.4983 |
1.0887 |
0.5444 |
|
CR21 |
0.0330 |
0.0162 |
0.0330 |
0.0165 |
1.0084 |
0.4807 |
1.0084 |
0.5104 |
|
CR22 |
0.2099 |
0.0658 |
0.2099 |
0.0649 |
1.2407 |
0.5601 |
1.2407 |
0.5477 |
|
CR23 |
0.2551 |
0.0906 |
0.2551 |
0.0907 |
1.8171 |
0.8007 |
1.8171 |
0.6264 |
|
CR24 |
0.0480 |
0.0155 |
0.0480 |
0.0153 |
1.3820 |
0.5579 |
1.3820 |
0.3943 |
|
CR25 |
0.0959 |
0.0304 |
0.0959 |
0.0304 |
0.9386 |
0.3848 |
0.9386 |
0.2915 |
|
CR31 |
2.1793 |
0.7390 |
2.1793 |
0.7556 |
0.9513 |
0.3450 |
0.9513 |
0.3416 |
|
CR32 |
1.4729 |
0.4865 |
1.4729 |
0.4942 |
0.7835 |
0.2894 |
0.7835 |
0.2816 |
|
CR33 |
2.0383 |
0.6870 |
2.0383 |
0.7014 |
0.9312 |
0.3358 |
0.9312 |
0.3274 |
|
CR34 |
2.4844 |
0.8252 |
2.4844 |
0.8391 |
1.1082 |
0.4010 |
1.1082 |
0.3869 |
|
CR35 |
2.8964 |
0.9607 |
2.8964 |
0.9752 |
1.1060 |
0.4003 |
1.1060 |
0.3962 |
|
TNG |
0.0003 |
0.0001 |
0.0003 |
0.0001 |
0.5302 |
0.2360 |
0.5302 |
0.2785 |
|
B1 |
5.1422 |
1.9372 |
5.1422 |
2.0242 |
1.9525 |
0.6860 |
1.9525 |
0.8931 |
|
B2 |
5.1095 |
1.9427 |
5.1095 |
2.0267 |
1.9471 |
0.6633 |
1.9471 |
0.8647 |
|
B3 |
0.0264 |
0.0129 |
0.0264 |
0.0131 |
1.1009 |
0.5038 |
1.1009 |
0.5505 |
|
B4 |
0.0308 |
0.0151 |
0.0308 |
0.0154 |
1.2534 |
0.5742 |
1.2534 |
0.6286 |
|
B5 |
0.2010 |
0.0644 |
0.2010 |
0.0649 |
0.5366 |
0.2125 |
0.5366 |
0.1815 |
|
B6 |
0.1578 |
0.0509 |
0.1578 |
0.0512 |
0.4543 |
0.1809 |
0.4543 |
0.1495 |
|
B7 |
0.1438 |
0.0462 |
0.1438 |
0.0465 |
0.3837 |
0.1527 |
0.3837 |
0.1259 |
|
B8 |
0.1574 |
0.0508 |
0.1574 |
0.0511 |
0.4655 |
0.1834 |
0.4655 |
0.1491 |
|
B9 |
0.1576 |
0.0508 |
0.1576 |
0.0511 |
0.4743 |
0.1869 |
0.4743 |
0.1528 |
|
B10 |
0.1572 |
0.0507 |
0.1572 |
0.0510 |
0.5074 |
0.2003 |
0.5074 |
0.1635 |
|
B11 |
0.1805 |
0.0578 |
0.1805 |
0.0581 |
0.5454 |
0.2153 |
0.5454 |
0.1795 |
|
B12 |
0.1749 |
0.0559 |
0.1749 |
0.0562 |
0.5262 |
0.2075 |
0.5262 |
0.1728 |
|
NB3 |
4.6613 |
1.7409 |
4.6613 |
1.8108 |
0.9513 |
0.3560 |
0.9513 |
0.4820 |
|
NB4 |
5.2762 |
2.1481 |
5.2762 |
2.2662 |
1.2728 |
0.4706 |
1.2728 |
0.6290 |
|
C1 |
0.0537 |
0.0171 |
0.0537 |
0.0170 |
1.6731 |
0.6901 |
1.6731 |
0.4690 |
|
C2 |
0.0268 |
0.0088 |
0.0268 |
0.0087 |
1.6762 |
0.6403 |
1.6762 |
0.4410 |
|
C3 |
0.0274 |
0.0134 |
0.0274 |
0.0137 |
1.0685 |
0.5161 |
1.0685 |
0.5249 |
|
C4 |
4.3139 |
1.7329 |
4.3139 |
1.8211 |
1.2110 |
0.4369 |
1.2110 |
0.6042 |
|
C5 |
2.1299 |
0.8843 |
2.1299 |
0.9334 |
0.4579 |
0.1725 |
0.4579 |
0.2264 |
|
C6 |
0.1113 |
0.0358 |
0.1113 |
0.0360 |
0.4479 |
0.1760 |
0.4479 |
0.1432 |
|
C7 |
0.0795 |
0.0252 |
0.0795 |
0.0253 |
0.4679 |
0.1900 |
0.4679 |
0.1575 |
|
C8 |
0.0028 |
0.0009 |
0.0028 |
0.0008 |
0.7571 |
0.3015 |
0.7571 |
0.2077 |
|
C9 |
0.0019 |
0.0006 |
0.0019 |
0.0006 |
0.6956 |
0.2680 |
0.6956 |
0.1887 |
|
C10 |
0.0501 |
0.0161 |
0.0501 |
0.0159 |
1.9174 |
0.7882 |
1.9174 |
0.5355 |
|
EMSD1 |
0.0399 |
0.0126 |
0.0399 |
0.0126 |
0.4962 |
0.1951 |
0.4962 |
0.1600 |
|
WSD1 |
0.0883 |
0.0281 |
0.0883 |
0.0282 |
0.4809 |
0.1914 |
0.4809 |
0.1587 |
|
WSD2 |
0.0760 |
0.0236 |
0.0760 |
0.0234 |
1.3843 |
0.5631 |
1.3843 |
0.3567 |
|
WSD3 |
0.0167 |
0.0052 |
0.0167 |
0.0051 |
0.8792 |
0.3637 |
0.8792 |
0.2734 |
|
WSD4 |
0.0079 |
0.0024 |
0.0079 |
0.0024 |
0.7532 |
0.3025 |
0.7532 |
0.2130 |
|
WSD5 |
0.0107 |
0.0035 |
0.0107 |
0.0035 |
1.0831 |
0.4368 |
1.0831 |
0.3035 |
|
WSD6 |
0.0043 |
0.0013 |
0.0043 |
0.0013 |
1.0365 |
0.3821 |
1.0365 |
0.2552 |
|
WSD7 |
0.0021 |
0.0007 |
0.0021 |
0.0007 |
0.6140 |
0.2319 |
0.6140 |
0.1755 |
|
WSD8 |
0.1152 |
0.0371 |
0.1152 |
0.0373 |
0.4501 |
0.1768 |
0.4501 |
0.1440 |
|
WSD9 |
0.1641 |
0.0524 |
0.1641 |
0.0526 |
0.4934 |
0.1947 |
0.4934 |
0.1579 |
Table 3.16 Estimation of Contaminant Levels at the Most Impacted WSRs
|
|
Contaminant Concentration (µg/L) (a) |
Assessment Criteria (µg/L) |
|||||||
|
Dry Season |
Wet Season |
||||||||
|
Scenario C3 |
|||||||||
|
Most Impacted WSRs |
CR03 |
NB4 |
CR01 |
CR23 |
|
||||
|
Tracer Conc. (mg/L) from Backfilling |
5.5821 |
5.2762 |
2.2607 |
1.8171 |
|
||||
|
Tracer Conc. (mg/L) from Dredging |
2.1394 |
2.1481 |
0.7885 |
0.8007 |
|
||||
|
|
Contaminant Release Rate (g/s) |
|
|
|
|
|
|||
|
Parameters |
Modelled Backfilling (b) |
Actual Backfilling (b) |
Modelled Dredging (b) |
Actual Dredging (b) |
|
|
|
|
|
|
Arsenic |
60000 |
2.52 |
1405.4 |
1.546E-02 |
0.2580 |
0.2452 |
0.1036 |
0.0851 |
13 |
|
Cadmium |
60000 |
0.24 |
1405.4 |
3.514E-04 |
0.0229 |
0.0216 |
0.0092 |
0.0075 |
5.5 |
|
Chromium |
60000 |
9.6 |
1405.4 |
6.887E-02 |
0.9980 |
0.9495 |
0.4003 |
0.3300 |
4.4 |
|
Copper |
60000 |
6.6 |
1405.4 |
6.043E-02 |
0.7060 |
0.6728 |
0.2826 |
0.2343 |
1.3 |
|
Lead |
60000 |
6.6 |
1405.4 |
6.465E-02 |
0.7124 |
0.6792 |
0.2849 |
0.2367 |
4.4 |
|
Mercury |
60000 |
0.06 |
1405.4 |
5.762E-04 |
0.0065 |
0.0062 |
0.0026 |
0.0021 |
0.4 |
|
Nickel |
60000 |
2.4 |
1405.4 |
3.373E-02 |
0.2746 |
0.2626 |
0.1094 |
0.0919 |
70 |
|
Silver |
60000 |
0.12 |
1405.4 |
1.181E-03 |
0.0130 |
0.0124 |
0.0052 |
0.0043 |
1.4 |
|
Zinc |
60000 |
16.2 |
1405.4 |
1.546E-01 |
1.7425 |
1.6609 |
0.6971 |
0.5787 |
8 |
|
Total PCB |
60000 |
0.0108 |
1405.4 |
2.530E-05 |
1.04E-03 |
9.88E-04 |
4.21E-04 |
3.41E-04 |
0.03 |
|
LMW PAHs |
60000 |
0.1896 |
1405.4 |
3.373E-04 |
0.0182 |
0.0172 |
0.0073 |
0.0059 |
0.2 (c) |
|
HMW PAHs |
60000 |
0.576 |
1405.4 |
1.661E-03 |
0.0561 |
0.0532 |
0.0226 |
0.0184 |
|
|
TBT |
60000 |
0.00495 |
1405.4 |
7.730E-09 |
4.61E-04 |
4.35E-04 |
1.87E-04 |
1.50E-04 |
0.006 |
|
Scenario C4 |
|||||||||
|
Most Impacted WSRs |
CR03 |
NB4 |
CR01 |
|
|||||
|
Tracer Conc. (mg/L) from Backfilling |
5.5821 |
5.2762 |
2.2607 |
|
|||||
|
Tracer Conc. (mg/L) from Dredging |
2.2421 |
2.2662 |
1.0715 |
|
|||||
|
|
Contaminant Release Rate (g/s) |
|
|
|
|
||||
|
Parameters |
Modelled Backfilling (b) |
Actual Backfilling (b) |
Modelled Dredging (b) |
Actual Dredging (b) |
|
|
|
|
|
|
Arsenic |
60000 |
2.52 |
17792.0 |
1.957E-01 |
0.2591 |
0.2465 |
0.1067 |
13 |
|
|
Cadmium |
60000 |
0.24 |
17792.0 |
4.448E-03 |
0.0229 |
0.0217 |
0.0093 |
5.5 |
|
|
Chromium |
60000 |
9.6 |
17792.0 |
8.718E-01 |
1.0030 |
0.9552 |
0.4142 |
4.4 |
|
|
Copper |
60000 |
6.6 |
17792.0 |
7.650E-01 |
0.7104 |
0.6778 |
0.2948 |
1.3 |
|
|
Lead |
60000 |
6.6 |
17792.0 |
8.184E-01 |
0.7172 |
0.6846 |
0.2980 |
4.4 |
|
|
Mercury |
60000 |
0.06 |
17792.0 |
7.295E-03 |
0.0065 |
0.0062 |
0.0027 |
0.4 |
|
|
Nickel |
60000 |
2.4 |
17792.0 |
4.270E-01 |
0.2771 |
0.2654 |
0.1161 |
70 |
|
|
Silver |
60000 |
0.12 |
17792.0 |
1.495E-02 |
0.0130 |
0.0125 |
0.0054 |
1.4 |
|
|
Zinc |
60000 |
16.2 |
17792.0 |
1.957E+00 |
1.7538 |
1.6739 |
0.7283 |
8 |
|
|
Total PCB |
60000 |
0.0108 |
17792.0 |
3.203E-04 |
1.05E-03 |
9.91E-04 |
4.26E-04 |
0.03 |
|
|
LMW PAHs |
60000 |
0.1896 |
17792.0 |
4.270E-03 |
0.0182 |
0.0172 |
0.0074 |
0.2 (c) |
|
|
HMW PAHs |
60000 |
0.576 |
17792.0 |
2.103E-02 |
0.0562 |
0.0533 |
0.0230 |
||
|
TBT |
60000 |
0.00495 |
17792.0 |
9.785E-08 |
4.61E-04 |
4.35E-04 |
1.87E-04 |
0.006 |
|
Notes:
(a) Contaminant concentrations (µg L-1) = Conservative Tracer Concentration for Backfilling (mg L-1) [Table 3.15 referred] × Tracer-to-Contaminant Conversion Ratio for Backfilling (µg kg-1) + Conservative Tracer Concentration for Dredging (mg L-1) [Table 3.15 referred] × Tracer-to-Contaminant Conversion Ratio for Dredging (µg kg-1)
(b) The modelled backfilling / dredging rates refer to the release rates of conservative tracers in the model, which is chosen to be the same as that of the corresponding sediment loss rate (i.e. 60 kg/s as discussed in Table 3.2 of Annex 3A). The actual release rates refer to the release rates of each contaminant from each sediment sources from this Project, including dredging and backfilling. Please refer to Table 3.4 of Annex 3A for the actual backfilling / dredging rates.
(c) Assessment criterion is applicable to total PAHs, i.e. sum of estimated LMW PAHs and HMW PAHs.
3.7.1.4 Release of Sediment-bounded
Nutrients
The release of sediment-bounded nutrient is estimated based on ammonia and organic nitrogen (Org-N) content. It is assuming 100% of sediment-bounded ammonia as well as organic nitrogen would be released into the water column. Furthermore, it is estimated about 26% of Org-N ([15]) released into the water column would be converted into ammonia within 3 days (beyond which would be flushed out of waters of Hong Kong and no longer be a concern of water quality). Elevation of inorganic nitrogen is estimated accordingly based on the maximum SS elevation at WSRs as well as the total Kjeldahl nitrogen (TKN) and ammonia-nitrogen levels at the nearby EPD Sediment Quality Monitoring Stations SS3 and SS4:

The predicted maximum SS elevation at the most impacted WSR (MP1-C) is only 1.1 mg L-1. The TIN release potential in sediment is 270.32 mg kg-1 (based on the maximum TKN and ammonia nitrogen level from 1987 to 2020 as well as conversion ratio of 26% for Org-N to ammonia nitrogen, refer to Annex 3A for derivation). The corresponding TIN elevation at this most impacted WSR is calculated to be 1.1 mg L-1 × 270.32 mg kg-1 = 0.00030 mg L-1, which is less than 1% of the corresponding WQO in the Southern WCZ (as well as all other WCZs) and considered insignificant. The expected level of TIN elevation at other identified WSRs would be even lower. No unacceptable water quality impact from TIN elevation is anticipated.
Assuming 100% of TIN elevation exists as ammonia nitrogen (which is very conservative), the potential increase in unionized ammonia (UIA) can be estimated based on the predicted TIN elevation as well as the typical ammonia nitrogen to UIA ratio around the Project Site (which is about 7.2% for EPD Marine Water Quality Monitoring Stations SM6 and SM7). The potential elevation of UIA can be calculated accordingly:

![]()
![]()
The predicted change is below 1% of the corresponding
WQO and is considered inconsequential at the most impacted WSR. The expected level of UIA elevation at other
identified WSRs would be even lower. No
unacceptable water quality impact from UIA elevation is anticipated.
As discussed in Section 3.7.1.1, while a portion of
nursery area and spawning ground for commercial fisheries resources is located
in the mixing zone of the Project, such areas are considered very small (<1% when comparing to the recognized nursery
area and spawning ground for commercial fisheries resources in Hong Kong
waters) and the potential to function as important spawning grounds and
nursery area is not high. The backfilling and dredging of CMPs
would only generate temporary and insignificant levels of sediment-bounded nutrients. Unacceptable water quality impact to the nursery
area and spawning ground for commercial fisheries resources due to the Project
is not anticipated.
No unacceptable water quality impact from TIN and UIA
elevation is anticipated to the identified WSRs in the Assessment Area,
including coral communities, gazetted and non-gazetted bathing beaches,
seawater intakes, typhoon shelters, FCZ, SSSI, Green Turtle nesting ground,
secondary contact recreation subzones, habitat for FP, nursery area and
spawning ground for commercial fisheries resources and existing/ potential
marine parks.
The modelled maximum depth-averaged levels of TIN and UIA from backfilling, dredging and capping activities are presented in Figures 9 and 10 of Annex 3B to illustrate the spatial coverage.
3.7.2 Marine Vessel Discharges
Marine work vessels including grab dredgers or TSHD, transport barges for grab dredging, as well as barges for backfilling and capping, may generate minor streams of wastewater, including seawater/rain deck drains, engine cooling water, other wastewaters such as wastewater / chemical waste/bilge water. Sewage would also be generated from workforce on these vessels. Typically, wastewater and sewage would be collected on board for disposal at appropriate facilities on land (i.e. sewage to sewer; chemical wastes to licensed contractor; etc.). Considering the relatively small scale of operation (typically 2 grab dredgers or 1 TSHD, plus transport barges for delivery sediment offsite from dredging, hopper barges / TSHD for backfilling and capping), standard site practices detailed in Section 3.8 as well as the suitable collection and disposal of wastewater / sewage, no unacceptable water quality impact associated with marine vessel discharges is expected.
3.7.3 Accidental Spillage or Leakage of Fuel/ Chemicals
The use of
fuel/chemicals associated with the works vessels and construction plants would
mean there is a potential of spillage or leakage of such materials if not
properly managed. It is expected that
chemicals used on the works vessels would be held in low quantities. Fuel spill or leaks would tend to float on
the water surface and will evaporate into the atmosphere and dissipate
rapidly. Given the risk of spillage and
leakage would generally be limited to minor volumes, no significant water
quality impacts would be expected in the event that an unplanned accidental
spill or leak occurred. Measures would
be implemented for the safe storage, handling and disposal of chemicals and
oils to prevent the release into the marine environment. Precautionary measures such as bunding of
machinery areas (e.g. provision of drip tray for generators) and availability
of spill clean-up kits would be in place to prevent spillage or leakage of
fuel/chemical to reach the marine environment.
A contingency / spill response plan would also be in place to provide
timely and effective response and remediation of spillage event. Unacceptable water quality impacts associated
with accidental spillage or leakage of fuel/ chemicals are thus not expected.
3.7.4 Changes in Flow Regime
Hydrodynamic modelling has been conducted to determine the changes from the presence of localised depressions at the dredged CMPs by comparing prediction against a base case scenario without the Project. Based on the latest information, as the CMPs will be constructed and operated sequentially, no more than three pits will be active (dredging / backfilling / capping) at any one time. A representative scenario with 3 CMPs in operation is modelled for the assessment. For the northern CMP, seabed level was assumed to be at the designed depth of the CMP, representing the condition when dredging of CMP has been completed. For the middle CMP, seabed level was assumed to be at midway between the designated top and bottom of the CMP, representing the operation phase of CMP for backfilling. For the southern CMP, seabed level was assumed to be at midway of the designed top of the CMPs and the designed top of the capping material layer, representing the operation phase of CMP for capping. The modelled bathymetry of baseline and with Project scenarios are presented in Figure 3.4.
Figure 3.4 Modelled Bathymetry
|
Baseline Scenario |
With Project Scenario |
|
|
|
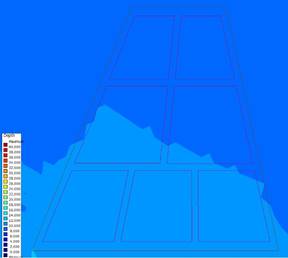
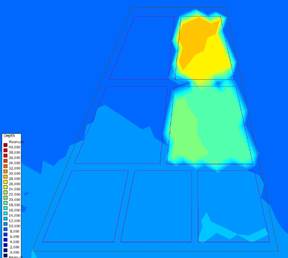
In both base case and with-Project scenarios, the effect of nearby major projects has been taken into account. In particular, the bathymetry at the Lamma Power Station Navigation Channel as well as dredging area for the Kwai Tsing Container Basin and its Approach Channel have been taken into account, while the Artificial Islands in the Central Waters were assumed to be completed for worst case modelling scenario.
It should be noted that there is also potential future development of offshore wind farm to the southwest of the Lamma Island. The project (located >2 km south of the Key Area of the Project) would involve the installation of monopiles or jacket structures to support no greater than 35 units of wind turbines. Separate hydrodynamic modelling was conducted under the corresponding EIA to assess the potential change in flow regime due to the presence of hydraulic structures for wind turbines and the model findings indicated that hydrodynamic impacts due to the wind farm during operation are considered to be negligible. In view of the very limited potential impact on flow regime, the presence of potential wind farm development has not been taken into account in the hydrodynamic modelling for this modelling exercise.
The
change in flow regime is assessed by comparing the tidal discharges across
selected major channels within the model domain. Momentary flow at these
selected channels is obtained from the corresponding cross sections in the
model. These cross sections are shown in Figure 3.5. The water current vector plots for
the hydrodynamic modelling are presented in Annex 3D.
Figure 3.5 Cross Sections of Selected Major Channels
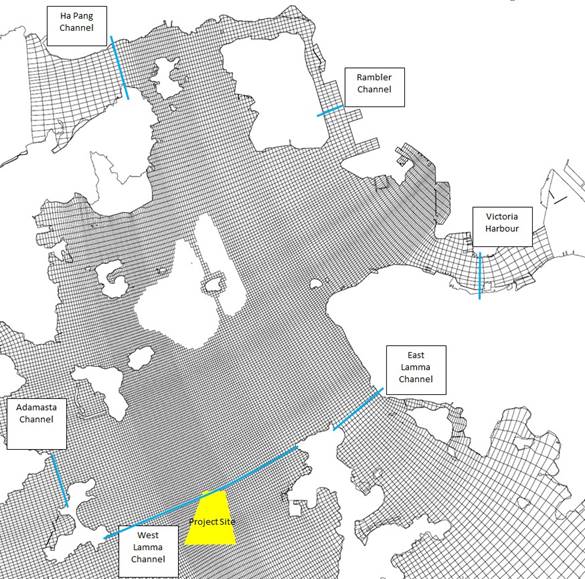
A summary of tidal discharge along the direction of the East Lamma Channel, West Lamma Channel, Victoria Harbour, Ha Pang Channel and Rambler Channel is provided in Table 3.17. Similar comparisons were also made in previous change in flow regime assessment in approved EIAs (e.g. EIA for the Expansion of Hong Kong International Airport into a Three-Runway System). The predicted change in tidal discharge across these nearby channels is small. No unacceptable change in flow regime is anticipated at these channels and the associated waterbodies.
Table 3.17 Predicted Tidal Discharges across Major Nearby Channels
|
Cross Section |
Flow Direction |
Dry Season |
Wet Season |
||||||
|
|
|
Base Case |
With Project |
Base Case |
With Project |
||||
|
|
|
Average |
Average |
Change (m3/s) |
% Change |
Average |
Average |
Change (m3/s) |
% Change |
|
Adamasta Channel |
Eastward |
659 |
649 |
-10 |
-1.5% |
1351 |
1299 |
-52 |
-3.8% |
|
Westward |
962 |
954 |
-8 |
-0.8% |
414 |
410 |
-4 |
-1.0% |
|
|
East Lamma Channel |
Northward |
13927 |
13901 |
-26 |
-0.2% |
12402 |
12492 |
90 |
0.7% |
|
Southward |
11690 |
11666 |
-24 |
-0.2% |
11527 |
11406 |
-121 |
-1.0% |
|
|
West Lamma Channel |
Northward |
11351 |
11401 |
50 |
0.4% |
12021 |
11991 |
-30 |
-0.2% |
|
Southward |
11749 |
11783 |
34 |
0.3% |
12385 |
12338 |
-47 |
-0.4% |
|
|
Victoria |
Eastward |
4089 |
4089 |
0 |
0.0% |
3453 |
3456 |
3 |
0.1% |
|
Westward |
3455 |
3457 |
2 |
0.1% |
4454 |
4451 |
-3 |
-0.1% |
|
|
Ha Pang Channel |
Eastward |
22392 |
22400 |
8 |
0.0% |
20946 |
21043 |
97 |
0.5% |
|
Westward |
19693 |
19700 |
7 |
0.0% |
19825 |
19671 |
-154 |
-0.8% |
|
|
Rambler Channel |
Northward |
1268 |
1271 |
3 |
0.2% |
1006 |
997 |
-9 |
-0.9% |
|
Southward |
1300 |
1299 |
-1 |
-0.1% |
1451 |
1449 |
-2 |
-0.1% |
|
Percentile distribution plots for tidal discharges across major nearby channels are presented in Table 3.18. Time series plot for instantaneous tidal discharges across these channels are presented in Table 3.19. As shown, the change in tidal flow rate induced by the Project is minimal at all of the major channels considered.
Average current velocity as well as modal current direction of the tide at selected locations are presented in Table 3.20 and Table 3.21. These selected locations are shown in Figure 3.6. As shown, the predicted change in average current velocity at selected locations (which include both major channels as well as around the proposed WL Facility) is expected to be limited. In most locations the predicted change in average current velocity was well below 1%. For Location 5 (around Adamasta Channel) and Location 7 (> 2 km north of the Key Area), the predicted changes are slightly higher in wet season and could reach up to 3.4% and 2% change respectively. In terms of dominant current direction of the tidal flow, Table 3.21 indicated there is barely any change in predicted modal current direction in base case and with project scenarios. The modal direction remains in the same class at most locations except for Locations 6 and 7, where modal direction in wet season under base case and with project scenarios were predicted to be in consecutive modal classes. This means there would be limited change in terms of current under with Project scenario.
Given the bathymetry change considered is reasonably conservative, it is anticipated that throughout the lifespan of the proposed CMPs at West Lamma, the potential change in flow regime would be of similar order, regardless of the actual design of CMPs as long as (1) there would be at most 3 active CMPs (i.e. dredging / backfilling / capping), and (2) total footprint for all the currently active CMPs does not exceed 100 hectares.
In view of the small change in tidal discharges across the major nearby channels as well as tidal current velocity and direction, no unacceptable change in flow regime from project operation is expected.
Predicted bed shear stress under various scenarios were reviewed to identify possibility of erosion from the proposed CMPs by tidal current. Table 3.22 shows percentile analysis of predicted bed shear stress within the northeastern CMP, which was modelled to have the highest change in seabed level among the three CMPs assumed to be in operation. In dry season, the predicted bed shear stress at Project site would be generally lower than that of the base case condition. In wet season, the predicted bed shear stress at Project site would be higher than that of the base case and mostly stays under 0.3 N/m2, at which bottom sediment may start getting re-suspended from seabed.
It should be highlighted that the modelled seabed level was based on the worst case assumption which assumes rather sharp change in bathymetry from outside of Project to individual CMPs (i.e. no slope). In the final design of the Project, the presence of sloped CMPs will (1) allow more gradual change in bathymetry and (2) reduce the overall change in seabed level, both of which would result in less change in current and thus the bed shear stress. In view of above, significant erosion from the proposed CMPs by tidal current is not expected.
Table 3.18 Predicted Percentile Distribution of Tidal Discharges across Major Nearby Channels (Black: Base Case; Blue: With Project)
|
Location |
Season |
Percentile Distribution of Tidal Discharges |
|
Adamasta Channel (Positive: Ebbing / Eastward; Negative: Flooding / Westward) |
Dry |
|
|
Wet |
|
|
|
East Lamma Channel (Positive: Flooding / Northward; Negative: Ebbing / Southward) |
Dry |
|
|
Wet |
|
|
|
West Lamma Channel (Positive: Flooding / Northward; Negative: Ebbing / Southward) |
Dry |
|
|
Wet |
|
|
|
Victoria |
Dry |
|
|
Wet |
|
|
|
Ha Pang Channel (Positive: Ebbing / Eastward; Negative: Flooding / Westward) |
Dry |
|
|
Wet |
|
|
|
Rambler Channel (Positive: Flooding / Northward; Negative: Ebbing / Southward) |
Dry |
|
|
Wet |
|
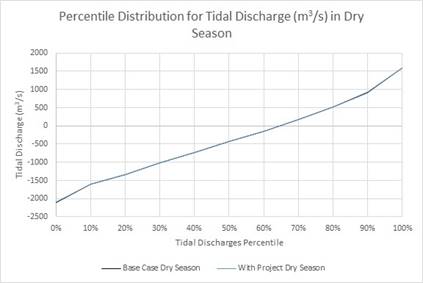
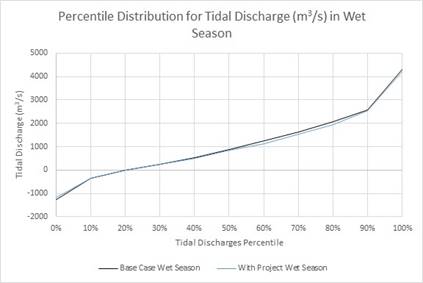
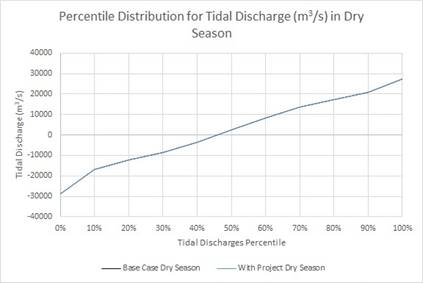
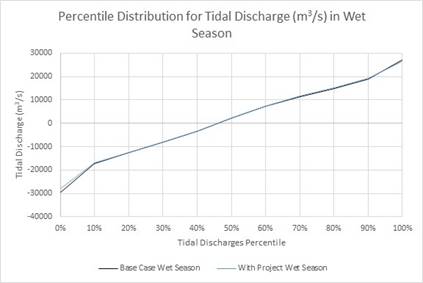
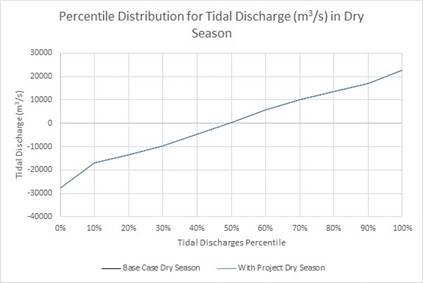
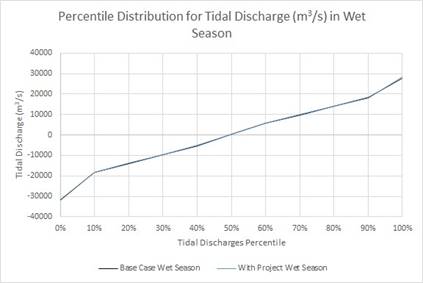
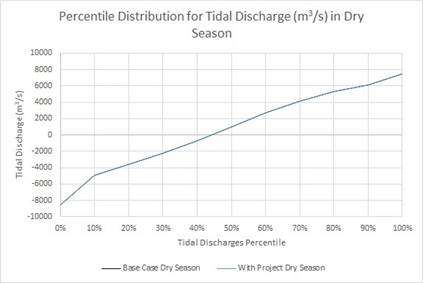
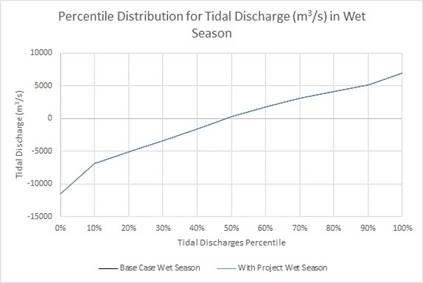
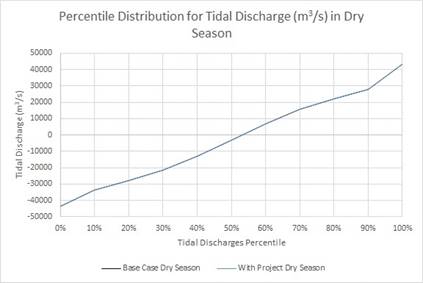
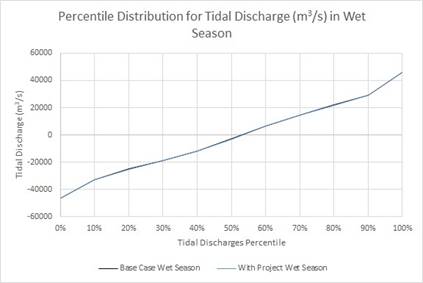
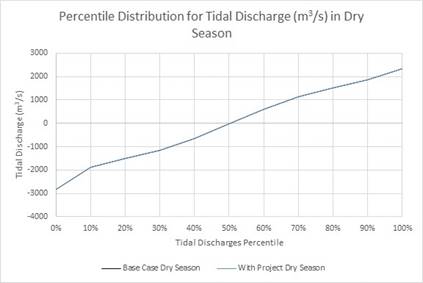
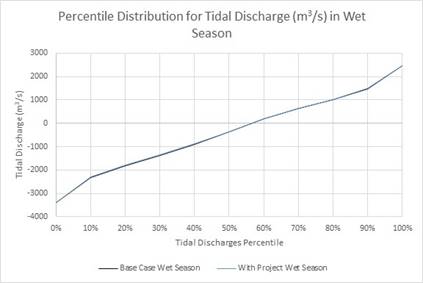
Table 3.19 Predicted Instantaneous Tidal Discharges across Major Nearby Channels (Black: Base Case; Blue: With Project)
|
Location |
Season |
Percentile Distribution of Tidal Discharges |
|
Adamasta Channel (Positive: Ebbing / Eastward; Negative: Flooding / Westward) |
Dry |
|
|
Wet |
|
|
|
East Lamma Channel (Positive: Flooding / Northward; Negative: Ebbing / Southward) |
Dry |
|
|
Wet |
|
|
|
West Lamma Channel (Positive: Flooding / Northward; Negative: Ebbing / Southward) |
Dry |
|
|
Wet |
|
|
|
Victoria |
Dry |
|
|
Wet |
|
|
|
Ha Pang Channel (Positive: Ebbing / Eastward; Negative: Flooding / Westward) |
Dry |
|
|
Wet |
|
|
|
Rambler Channel (Positive: Flooding / Northward; Negative: Ebbing / Southward) |
Dry |
|
|
Wet |
|
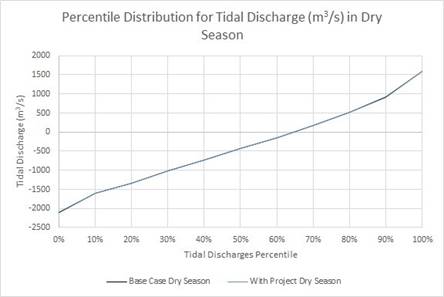
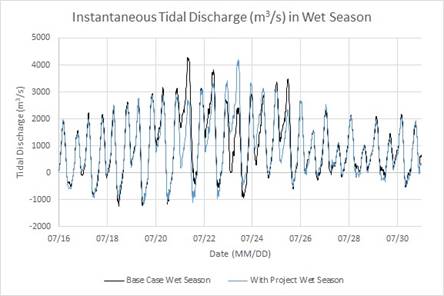
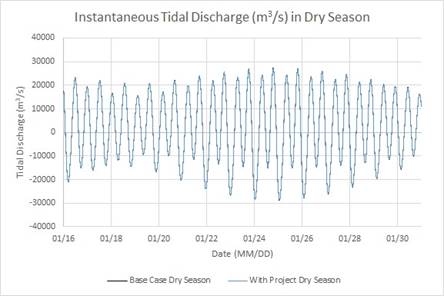
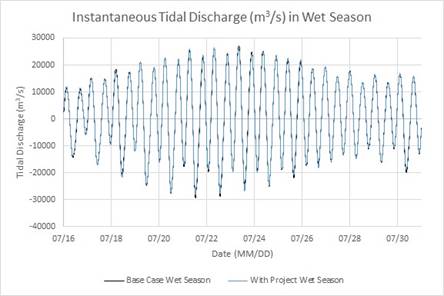
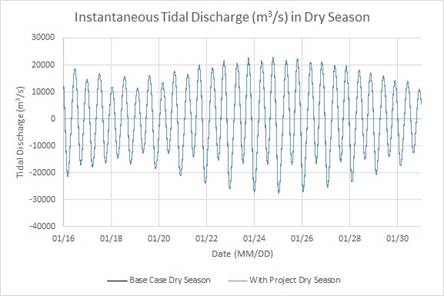
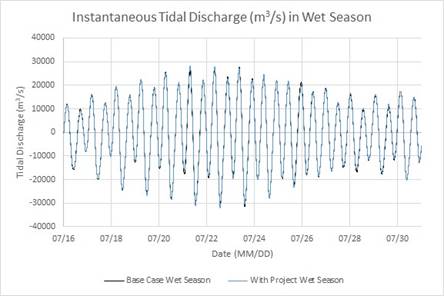
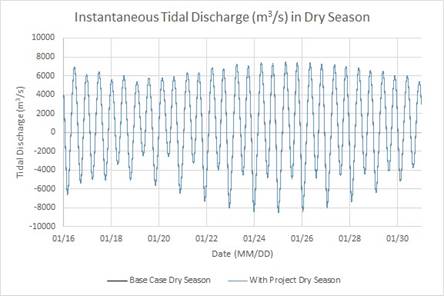
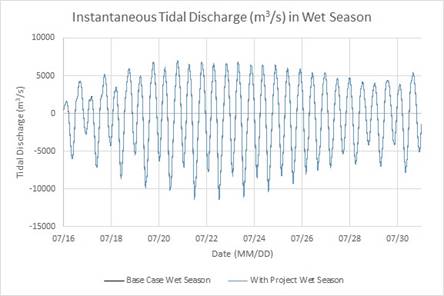
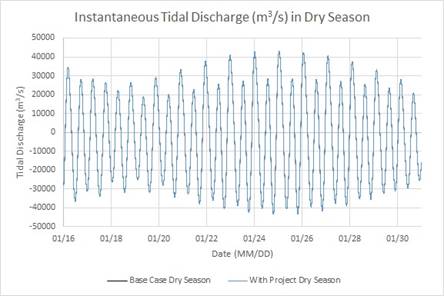
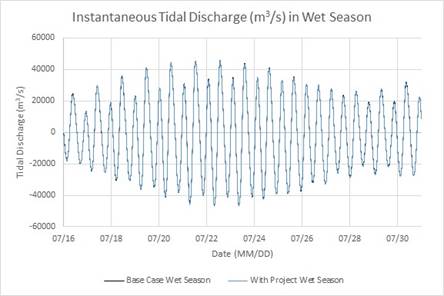
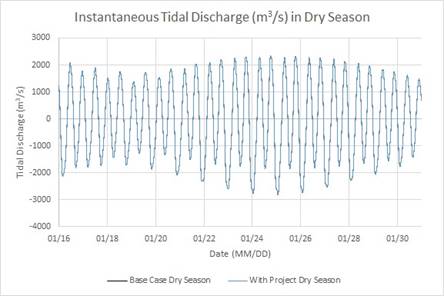
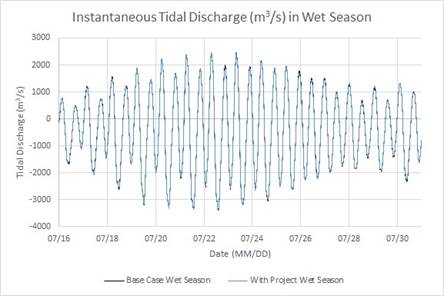
Figure 3.6 Selected Velocity Points
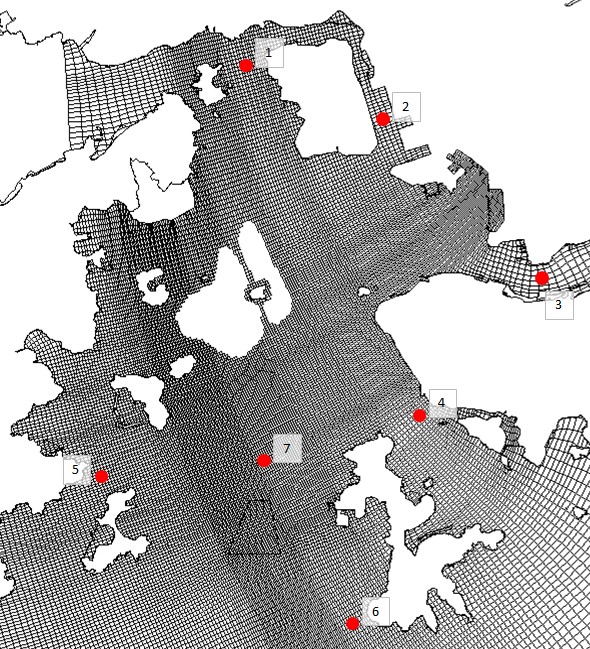
Table 3.20 Predicted Average Velocity at Selected Locations across Modelled Area
|
Location # |
Dry Season |
Wet Season |
||||||
|
Base Case |
With Project |
Base Case |
With Project |
|||||
|
Average |
Average |
Change (m/s) |
% Change |
Average |
Average |
Change (m/s) |
% Change |
|
|
1 |
0.457 |
0.457 |
0.000 |
0.0% |
0.425 |
0.424 |
-0.001 |
-0.3% |
|
2 |
0.124 |
0.124 |
0.000 |
0.1% |
0.127 |
0.127 |
-0.001 |
-0.4% |
|
3 |
0.248 |
0.248 |
0.000 |
0.1% |
0.279 |
0.279 |
-0.001 |
-0.2% |
|
4 |
0.226 |
0.226 |
0.000 |
-0.2% |
0.217 |
0.218 |
0.001 |
0.3% |
|
5 |
0.125 |
0.125 |
0.000 |
-0.4% |
0.156 |
0.151 |
-0.005 |
-3.4% |
|
6 |
0.151 |
0.152 |
0.000 |
0.3% |
0.160 |
0.160 |
0.001 |
0.5% |
|
7 |
0.166 |
0.167 |
0.001 |
0.5% |
0.200 |
0.196 |
-0.004 |
-2.0% |
Note: Average velocity was calculated based on average of current magnitude regardless of direction or tide.
Table 3.21 Predicted Modal Class of Current Direction at Selected Locations across Modelled Area
|
Location # |
Dry Season |
Wet Season |
||||||
|
Base Case |
With Project |
Base Case |
With Project |
|||||
|
Modal
Class |
Modal
Class |
Modal
Class |
Modal
Class |
Modal
Class |
Modal
Class |
Modal
Class |
Modal
Class |
|
|
1 |
130-135 |
320-325 |
130-135 |
320-325 |
130-135 |
325-330 |
130-135 |
325-330 |
|
2 |
150-155 |
340-345 |
150-155 |
340-345 |
155-160 |
160-165 |
155-160 |
160-165 |
|
3 |
80-85 |
255-260 |
80-85 |
255-260 |
85-90 |
255-260 |
85-90 |
255-260 |
|
4 |
135-140 |
315-320 |
135-140 |
315-320 |
135-140 |
315-320 |
135-140 |
315-320 |
|
5 |
180-185 |
185-190 |
180-185 |
185-190 |
30-35 |
35-40 |
30-35 |
35-40 |
|
6 |
310-315 |
315-320 |
310-315 |
315-320 |
135-140 |
320-325 |
135-140 |
315-320 |
|
7 |
0-5 |
355-360 |
0-5 |
355-360 |
0-5 |
10-15 |
5-10 |
10-15 |
Note: Modal class was calculated based on 5 degree increment. The modal class for highest frequency direction as well as the second peak at around the opposite direction were presented.
Table 3.22 Predicted Bed Shear Stress Level at Project Site (Solid Line: Base Case; Dashed Line: With Project)
|
Dry Season |
|
|
Wet Season |
|
|
Output Point Location |
|
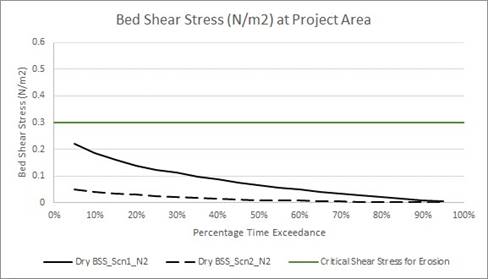
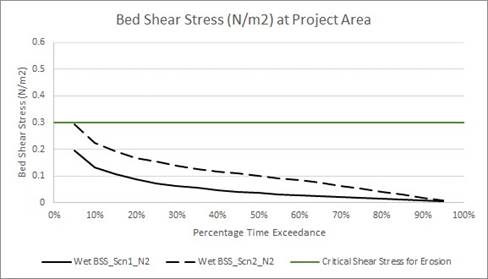
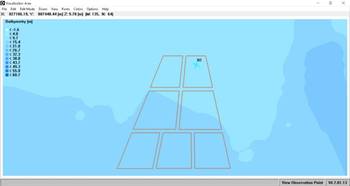
3.8
Mitigation
Measures
No unacceptable water quality impact in terms of SS elevation, sedimentation flux, dissolved oxygen depletion, release of sediment bounded-contaminants and nutrients, marine vessel discharges, accidental spillage or leakage of fuel/ chemicals as well as flow regime was predicted from the proposed dredging, backfilling and capping of CMPs at the respective maximum work rates based on the findings of computational modelling. To further minimise potential water quality impact associated with the Project, the following mitigation measures are recommended to be applied for the Project:
§ Cage-type silt curtain will be installed around closed grab to control sediment loss from grab dredging;
§ Dredging should be conducted by either one TSHD at rate of 256,200 m3/week or no more than two grab dredgers at a total rate of 100,000 m3/week;
§ Maximum rate of backfilling is 26,700 m3/day;
§ Maximum rate of capping is 26,700 m3/day;
To protect the marine environment, the following standard measures and good site practices are recommended to be implemented to avoid / minimise the potential impacts from marine works:
§ All vessels and plants (e.g. closed grab) should be well maintained and inspected before use to limit any potential discharges to the marine environment;
§ All vessels must have a clean ballast system;
§ No overflow is permitted from TSHD;
§ The Lean Mixture Overboard (LMOB) system of TSHD will only be in operation at the beginning and end of the dredging cycle when the drag head is being lowered and raised;
§ Dredged marine mud will be disposed of in a gazetted marine disposal area in accordance with the Dumping at Sea Ordinance (DASO) permit conditions;
§ Care should be taken during lowering and lifting grabs to minimise unnecessary disturbance to the seabed;
§ Disposal vessels will be fitted with tight bottom seals in order to prevent leakage of material during transport;
§ Barges will be filled to a level, which ensures that material does not spill over during transport to the disposal site and that adequate freeboard is maintained to ensure that the decks are not washed by wave action;
§ After dredging, any excess materials will be cleaned from decks and exposed fittings before the vessel is moved from the dredging area;
§ When the dredged material has been unloaded at the disposal areas, any material that has accumulated on the deck or other exposed parts of the vessel will be removed and placed in the hold or a hopper. Under no circumstances will decks be washed clean in a way that permits material to be released overboard. Dredgers will maintain adequate clearance between vessels and the seabed at all states of the tide and reduce operations speed to ensure that excessive turbidity is not generated by turbulence from vessel movement or propeller wash;
§ Marine works shall not cause foam, oil, grease, litter or other objectionable matter to be present in the water within and adjacent to the works site. Wastewater from potentially contaminated area on working vessels should be minimized and collected. These kinds of wastewater should be brought back to port and discharged at appropriate collection and treatment system;
§ No solid waste is allowed to be disposed overboard;
§ Safe storage, handling and disposal of chemicals
and oils to prevent the release into the marine environment;
§ Bunding of machinery areas (e.g. provision of drip
tray for generators) and availability of spill clean-up kits would be in place
to prevent spillage or leakage of fuel/chemical to reach the marine
environment; and
§ A contingency / spill response plan would be in place to provide timely and effective response and remediation of spillage event.
3.9
Cumulative
Impacts
The concurrent projects have been identified for this Project and described in detail in Annex 2A. The potential cumulative impact and necessary assessment in the modelling exercise are discussed and considered accordingly (see Section 6 of Annex 3A). Based on the modelling results as discussed in Section 3.7, no WQO non-compliance is expected due to the cumulative impacts of the construction and operation activities of the Project and nearby concurrent projects.
Based on the information available at the time of preparation of this EIA study for the Project, the proposed KYCAI development (including the Hong Kong Island – Northeast Lantau (HKI-NEL) Link), locating > 4 km away from the Project, is a major proposed reclamation and development project in the Central Waters and will likely coincide with the construction and operation of the Project, thus the potential cumulative impacts are discussed further in this section. It is understood that the tentative reclamation area of the KYCAI development is about 1,000 hectares and the coastline with KYCAI has been considered in the water quality modelling exercise for conservative assessment on the hydrodynamic regime in the Assessment Area ([16]). The sea tunnel section for HKI-KYC Link would be constructed using immersed tube tunnel (IMT) method while temporary and/ or permanent reclamation and decommissioning of the temporary reclamation are likely required for the construction of the landing of HKI-KYC Link at the Western HKI. For the marine viaduct section of KYC-NEL Link between KYCAI and NEL, some marine works such as construction of marine piles and pile caps would be required. Potential dredging works may be involved for the sea tunnel section, marine viaduct constructions and the rearrangement of anchorages in Kellett Bank. Release and suspension of sediments and backfilling materials may occur during the marine works for the proposed infrastructures on the reclaimed KYCAI such as submarine utilities, rail links as well as breakwater, barging facilities, piers and berthing facilities. The KYCAI development is currently in early planning stage and detailed construction programme and sequence are not yet available. According to the relevant project profiles, it is expected that non-dredged method would be adopted for KYCAI reclamation so as to minimize the amount of dredging required. Furthermore, reclamation filling is expected to be carried out behind leading seawalls, together with silt curtain surrounding the works area to control the off-site migration of fine from the dredging, ground improvement and reclamation filling operations. Dredging rate and the grab descending speed would be controlled to minimise disturbance to the seabed and sediment loss during potential dredging works for the HKI-NEL Link and the rearrangement of anchorages in Kellett Bank. These mitigation measures would help to confine the sediment plume generated from the proposed KYCAI development. Besides, other suitable mitigation measures will also be explored under the Agreement No. CE 15/2020 (CE) Artificial Islands in the Central Waters - Investigation (“the CW Study”). To minimize adverse cumulative impact from the two projects, the two CEDD Project teams will communicate with each other on the work programmes of the two projects, so as to optimise the works plan and schedule (e.g. adjusting working rates of dredging and capping works of the Project).
All predicted results are well below the respective assessment criteria of SS and sedimentation flux. Given the large separation distance between the proposed KYCAI development and the WL Facility, schedule/ working rates of dredging and capping works to be adjusted in view of the interface with concurrent projects/ activities, as well as the minimal impact brought about by the WL Facility on the sensitive receivers, it is considered that the cumulative impact as a result of the two projects will not affect the environmental acceptability of the WL Facility. The KYCAI developments are Designated Projects and separate EIAs will be conducted to assess amongst others. The cumulative water quality impacts from concurrent projects will be assessed so as to formulate a package of detailed measures to be adopted to control the cumulative impact within the acceptable level.
3.10
Residual
Impacts
No exceedance of WQO criterion at all the identified WSRs is expected from the construction and operation activities of the Project. With the implementation of the proposed mitigation measures, it is anticipated that water quality impacts arising from the Project could be further minimised. Therefore, no unacceptable residual water quality impact is expected from the construction and operation activities of the Project.
3.11
Environmental
Monitoring and Audit
Marine water quality monitoring at selected WSRs is recommended for marine dredging, backfilling and capping of the Project. Sediment quality monitoring is also recommended for backfilling of the CMPs. Regular site audit would also be conducted throughout the Project. The specific monitoring requirements are detailed in the standalone Environmental Monitoring and Audit (EM&A) Manual.
3.12
Conclusion
Computational modelling has been conducted to predict various potential water quality impacts from the proposed marine dredging, backfilling and capping operations under this Project, including SS elevation, sedimentation, DO depletion, release of nutrient, heavy metal and trace organic contaminants. Full compliance is predicted at all identified WSRs for all parameters in dry and wet seasons. To ensure environmental compliance, marine water monitoring and sediment monitoring for the construction and operation activities of the Project is recommended.
Other potential water quality impacts from marine vessel discharges were also addressed. Appropriate precautionary and mitigation measures are recommended to minimize the potential water quality impact from these works. Environmental monitoring and audit is recommended to ensure the proper implementation of these measures.
The potential change in flow regime due to the presence of the Project has been assessed using computational modelling. The findings indicated that the change in flow regime would be minimal. No unacceptable change in flow regime on the surrounding water would be expected.
([2]) ERM – Hong Kong, Ltd (2018) EIA for Hong Kong Offshore LNG Terminal. Final EIA Report. For CLP.
([4]) Mott MacDonald (2010) EIA for Providing Sufficient Water Depth for Kwai Tsing Container Basin and its Approach Channel. Final EIA Report. For CEDD.
([5]) ERM – Hong Kong, Ltd (2002) EIA for the Proposed Submarine Gas Pipeline from Cheng Tou Jiao Liquefied Natural Gas Receiving Terminal, Shenzhen to Tai Po Gas Production Plank, Hong Kong. Final EIA Report. For the Hong Kong and China Gas Co., Ltd.
([6]) Maunsell (2001) EIA for Tai Po Sewage Treatment Works - Stage V. Final EIA Report. For Drainage Services Department, Hong Kong SAR Government.
([7]) ERM - Hong Kong, Ltd (2007) Liquefied Natural Gas (LNG) Receiving Terminal and Associated Facilities. Final EIA Report. For CAPCO.
([8]) Mott MacDonald (2017) EIA for Improvement Dredging for Lamma Power Station Navigation Channel. Final EIA Report. For HK Electric.
([9]) Mott MacDonald (2010) EIA for Providing Sufficient Water Depth for Kwai Tsing Container Basin and its Approach Channel. Final EIA Report. For CEDD.
([10]) ERM – Hong Kong, Ltd (2000) EIA for Construction of an International Theme Park in Penny's Bay of North Lantau together with its Essential Associated Infrastructures - Environmental Impact Assessment. Final EIA Report. For Civil Engineering Department, Hong Kong SAR Government.
([11]) ERM - Hong Kong, Ltd (2006) Liquefied Natural Gas (LNG) Receiving Terminal and Associated Facilities. For CAPCO. Final EIA Report. December 2006.
([12]) An updated set of criteria has been adopted instead of those listed in the Method Statement for Water Quality Modelling Assessment.
([13]) The coastline of the proposed KYCAI is referenced from the information paper on “Studies related to artificial islands in the Central Waters” discussed on 14 May 2019 for Public Works Subcommittee of Finance Committee (PWSC(2019-20)5)
([14]) The disposal rate at South of Cheung Chau facilities is higher for Scenario C2 due to the use of TSHD for dredging of the Project. The details have been discussed in Section 6.4 of Water Quality Modelling Method Statement (Annex 3A).
([16])
The coastline of the proposed KYCAI is referenced from the information paper on
“Studies related to artificial islands in the Central Waters” discussed on 14
May 2019 for Public Works Subcommittee of Finance Committee (PWSC(2019-20)5)
([17]) South Lamma SSSI and Sunshine Island SSSI in the vicinity of the Project are terrestrial-related SSSIs and they are unlikely to be impacted by the Project which is marine-based works in nature. They are thus not considered as WSRs. Sham Wan SSSI is a marine-related SSSI and it has been considered as WSR, which is represented by Green Turtle nesting ground at Sham Wan (TNG).