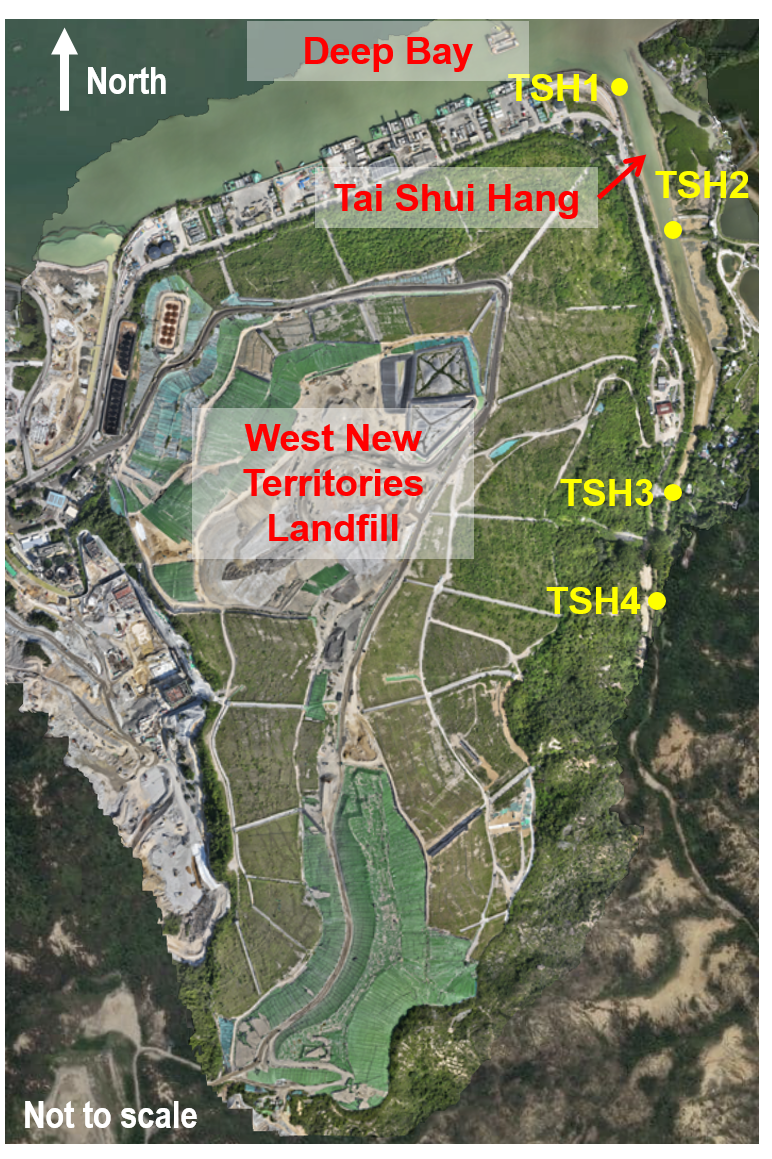
Environmental Protection Department (hereafter referred to as "EPD") has been continuously conducting water quality monitoring at Tai Shui Hang near the West New Territories (WENT) Landfill. Regular water sampling and testing are conducted at four designated water quality monitoring points (namely TSH1, TSH2, TSH3 and TSH4) as shown in the figure below. The EPD collects water samples twice per month during, before and after the wet season (i.e. March to October of each year) and once per month during the dry season (i.e. November to February of the following year). The water quality in Tai Shui Hang is monitored and assessed with reference to the Water Quality Index (WQI) used by the EPD.
Locations of Water Quality Monitoring Points at Tai Shui Hang
Water Quality Index (WQI) for Rivers in Hong Kong
Water Quality Index (WQI) is a numerical value used to gauge and denote, based on monitoring data, the overall state of health of rivers and streams in Hong Kong. The WQI is calculated based on three key water quality parameters: dissolved oxygen, five-day biochemical oxygen demand (BOD5) and ammonia-nitrogen levels. The index is classified into five grades (Excellent, Good, Fair, Bad and Very Bad) and the scoring is based on the calculation method shown in the table below.
Calculation of WQI
|
No. of points awarded |
Dissolved Oxygen |
BOD5 |
Ammonia Nitrogen |
|
1 |
91 – 110 |
< 3 |
< 0.5 |
|
2 |
71 – 90 111 – 120 |
3.1 – 6.0 |
0.5 – 1.0 |
|
3 |
51 – 70 121 – 130 |
6.1 – 9.0 |
1.1 – 2.0 |
|
4 |
31 – 50 |
9.1 – 15.0 |
2.1 – 5.0 |
|
5 |
< 30 or > 130 |
> 15.0 |
> 5.0 |
All parameters carry equal weighting, and the WQI is the sum of points converted from these three parameters. The WQI values range from 3 to 15, corresponding to the following gradings of river water quality conditions.
WQI gradings
|
WQI |
River Water Quality Condition |
|
3.0 – 4.5 |
Excellent |
|
4.6 – 7.5 |
Good |
|
7.6 – 10.5 |
Fair |
|
10.6 – 13.5 |
Bad |
|
13.6 – 15.0 |
Very Bad |
For further details about the WQI assessment and grading, please visit this website.
Water Quality Monitoring Data at Tai Shui Hang (2024 to July 2026)
| Water Quality Monitoring Point (1) |
Dissolved Oxygen (% saturation) |
5-day Biochemical Oxygen Demand (mg/L) |
Ammonia Nitrogen (mg/L) | WQI | River Water Quality Condition | |||||||||||||||||||||||||||||||
| Date of sample taken : 9/1/2024 | ||||||||||||||||||||||||||||||||||||
| TSH1 | 114.2 | <2 | 0.31 | 4 | Excellent | |||||||||||||||||||||||||||||||
| TSH2 | 150 | <2 | 0.38 | 7 | Good | |||||||||||||||||||||||||||||||
| TSH3 | 102.6 | <2 | <0.01 | 3 | Excellent | |||||||||||||||||||||||||||||||
| TSH4 | 99.8 | <2 | <0.01 | 3 | Excellent | |||||||||||||||||||||||||||||||
| Date of sample taken : 20/2/2024 | ||||||||||||||||||||||||||||||||||||
| TSH1 | 97.8 | <2 | 0.17 | 3 | Excellent | |||||||||||||||||||||||||||||||
| TSH2 | 96.9 | <2 | 0.43 | 3 | Excellent | |||||||||||||||||||||||||||||||
| TSH3 | 108.8 | <2 | 0.072 | 3 | Excellent | |||||||||||||||||||||||||||||||
| TSH4 | 97.5 | <2 | 0.039 | 3 | Excellent | |||||||||||||||||||||||||||||||
| Date of sample taken : 15/3/2024 | ||||||||||||||||||||||||||||||||||||
| TSH1 | 85.1 | <2 | 0.14 | 4 | Excellent | |||||||||||||||||||||||||||||||
| TSH2 | 66.7 | <2 | 0.22 | 5 | Good | |||||||||||||||||||||||||||||||
| TSH3 | 93.6 | <2 | 0.017 | 3 | Excellent | |||||||||||||||||||||||||||||||
| TSH4 | 91.1 | <2 | 0.013 | 3 | Excellent | |||||||||||||||||||||||||||||||
| Date of sample taken : 25/3/2024 | ||||||||||||||||||||||||||||||||||||
| TSH1 | 108.7 | <2 | 0.056 | 3 | Excellent | |||||||||||||||||||||||||||||||
| TSH2 | 105.3 | <2 | 0.38 | 3 | Excellent | |||||||||||||||||||||||||||||||
| TSH3 | 94.1 | <2 | <0.01 | 3 | Excellent | |||||||||||||||||||||||||||||||
| TSH4 | 87 | <2 | 0.02 | 4 | Excellent | |||||||||||||||||||||||||||||||
| Date of sample taken : 3/4/2024 | ||||||||||||||||||||||||||||||||||||
| TSH1 | 98.1 | <2 | 0.1 | 3 | Excellent | |||||||||||||||||||||||||||||||
| TSH2 | 89.4 | <2 | 0.79 | 5 | Good | |||||||||||||||||||||||||||||||
| TSH3 | 97.2 | <2 | 0.015 | 3 | Excellent | |||||||||||||||||||||||||||||||
| TSH4 | 90.1 | <2 | 0.027 | 4 | Excellent | |||||||||||||||||||||||||||||||
| Date of sample taken : 18/4/2024 | ||||||||||||||||||||||||||||||||||||
| TSH1 | 125.7 | <2 | 0.063 | 5 | Good | |||||||||||||||||||||||||||||||
| TSH2 | 98.6 | <2 | 0.059 | 3 | Excellent | |||||||||||||||||||||||||||||||
| TSH3 | 87 | <2 | 0.012 | 4 | Excellent | |||||||||||||||||||||||||||||||
| TSH4 | 87 | <2 | <0.01 | 4 | Excellent | |||||||||||||||||||||||||||||||
| Date of sample taken : 9/5/2024 | ||||||||||||||||||||||||||||||||||||
| TSH1 | 83.6 | <2 | <0.01 | 4 | Excellent | |||||||||||||||||||||||||||||||
| TSH2 | 86.6 | <2 | <0.01 | 4 | Excellent | |||||||||||||||||||||||||||||||
| TSH3 | 83.5 | <2 | 0.021 | 4 | Excellent | |||||||||||||||||||||||||||||||
| TSH4 | 84.2 | <2 | 0.026 | 4 | Excellent | |||||||||||||||||||||||||||||||
| Date of sample taken : 17/5/2024 | ||||||||||||||||||||||||||||||||||||
| TSH1 | 126.2 | <2 | 0.064 | 5 | Good | |||||||||||||||||||||||||||||||
| TSH2 | 119.6 | 2.1 | 0.11 | 4 | Excellent | |||||||||||||||||||||||||||||||
| TSH3 | 114.5 | <2 | 0.053 | 4 | Excellent | |||||||||||||||||||||||||||||||
| TSH4 | 93.1 | <2 | 0.066 | 3 | Excellent | |||||||||||||||||||||||||||||||
| Date of sample taken : 12/6/2024 | ||||||||||||||||||||||||||||||||||||
| TSH1 | 83.4 | <2 | 0.024 | 4 | Excellent | |||||||||||||||||||||||||||||||
| TSH2 | 82.5 | 2.2 | <0.01 | 4 | Excellent | |||||||||||||||||||||||||||||||
| TSH3 | 93.4 | <2 | 0.025 | 3 | Excellent | |||||||||||||||||||||||||||||||
| TSH4 | 92.2 | <2 | <0.01 | 3 | Excellent | |||||||||||||||||||||||||||||||
| Date of sample taken : 20/6/2024 | ||||||||||||||||||||||||||||||||||||
| TSH1 | 88.5 | <2 | <0.01 | 4 | Excellent | |||||||||||||||||||||||||||||||
| TSH2 | 93.9 | <2 | 0.01 | 3 | Excellent | |||||||||||||||||||||||||||||||
| TSH3 | 91.3 | <2 | 0.019 | 3 | Excellent | |||||||||||||||||||||||||||||||
| TSH4 | 89.4 | <2 | <0.01 | 4 | Excellent | |||||||||||||||||||||||||||||||
| Date of sample taken : 3/7/2024 | ||||||||||||||||||||||||||||||||||||
| TSH1 | 92.2 | <2 | 0.021 | 3 | Excellent | |||||||||||||||||||||||||||||||
| TSH2 | 110.1 | <2 | <0.01 | 3 | Excellent | |||||||||||||||||||||||||||||||
| TSH3 | 95.9 | <2 | 0.02 | 3 | Excellent | |||||||||||||||||||||||||||||||
| TSH4 | 94.5 | <2 | 0.1 | 3 | Excellent | |||||||||||||||||||||||||||||||
| Date of sample taken : 23/7/2024 | ||||||||||||||||||||||||||||||||||||
| TSH1 | 81.8 | <2 | 0.14 | 4 | Excellent | |||||||||||||||||||||||||||||||
| TSH2 | 91.9 | <2 | 0.12 | 3 | Excellent | |||||||||||||||||||||||||||||||
| TSH3 | 92.5 | <2 | 0.072 | 3 | Excellent | |||||||||||||||||||||||||||||||
| TSH4 | 91.8 | <2 | 0.092 | 3 | Excellent | |||||||||||||||||||||||||||||||
| Date of sample taken : 7/8/2024 | ||||||||||||||||||||||||||||||||||||
| TSH1 | 84 | <2 | 0.042 | 4 | Excellent | |||||||||||||||||||||||||||||||
| TSH2 | 81.7 | <2 | 0.051 | 4 | Excellent | |||||||||||||||||||||||||||||||
| TSH3 | 102.9 | <2 | 0.02 | 3 | Excellent | |||||||||||||||||||||||||||||||
| TSH4 | 99.8 | <2 | 0.024 | 3 | Excellent | |||||||||||||||||||||||||||||||
| Date of sample taken : 23/8/2024 | ||||||||||||||||||||||||||||||||||||
| TSH1 | 94.3 | <2 | 0.061 | 3 | Excellent | |||||||||||||||||||||||||||||||
| TSH2 | 95.5 | <2 | 0.037 | 3 | Excellent | |||||||||||||||||||||||||||||||
| TSH3 | 95.2 | <2 | 0.043 | 3 | Excellent | |||||||||||||||||||||||||||||||
| TSH4 | 93.9 | <2 | 0.068 | 3 | Excellent | |||||||||||||||||||||||||||||||
| Date of sample taken : 11/9/2024 | ||||||||||||||||||||||||||||||||||||
| TSH1 | 95.4 | <2 | 0.092 | 3 | Excellent | |||||||||||||||||||||||||||||||
| TSH2 | 94.3 | <2 | 0.2 | 3 | Excellent | |||||||||||||||||||||||||||||||
| TSH3 | 94 | <2 | 0.03 | 3 | Excellent | |||||||||||||||||||||||||||||||
| TSH4 | 92.2 | <2 | <0.01 | 3 | Excellent | |||||||||||||||||||||||||||||||
| Date of sample taken : 26/9/2024 | ||||||||||||||||||||||||||||||||||||
| TSH1 | 88.6 | <2 | 0.011 | 4 | Excellent | |||||||||||||||||||||||||||||||
| TSH2 | 73.8 | <2 | 0.067 | 4 | Excellent | |||||||||||||||||||||||||||||||
| TSH3 | 92.4 | <2 | 0.03 | 3 | Excellent | |||||||||||||||||||||||||||||||
| TSH4 | 92.1 | <2 | 0.019 | 3 | Excellent | |||||||||||||||||||||||||||||||
| Date of sample taken : 7/10/2024 | ||||||||||||||||||||||||||||||||||||
| TSH1 | 88.8 | <2 | 0.15 | 4 | Excellent | |||||||||||||||||||||||||||||||
| TSH2 | 107.6 | <2 | 0.074 | 3 | Excellent | |||||||||||||||||||||||||||||||
| TSH3 | 97.3 | <2 | 0.011 | 3 | Excellent | |||||||||||||||||||||||||||||||
| TSH4 | 97.5 | <2 | <0.01 | 3 | Excellent | |||||||||||||||||||||||||||||||
| Date of sample taken : 16/10/2024 | ||||||||||||||||||||||||||||||||||||
| TSH1 | 91.6 | <2 | 0.031 | 3 | Excellent | |||||||||||||||||||||||||||||||
| TSH2 | 95.5 | <2 | 0.022 | 3 | Excellent | |||||||||||||||||||||||||||||||
| TSH3 | 97.5 | <2 | 0.06 | 3 | Excellent | |||||||||||||||||||||||||||||||
| TSH4 | 98.1 | <2 | 0.07 | 3 | Excellent | |||||||||||||||||||||||||||||||
| Date of sample taken : 12/11/2024 | ||||||||||||||||||||||||||||||||||||
| TSH1 | 80.2 | <2 | 0.072 | 4 | Excellent | |||||||||||||||||||||||||||||||
| TSH2 | 79.8 | <2 | 0.064 | 4 | Excellent | |||||||||||||||||||||||||||||||
| TSH3 | 95.9 | <2 | 0.062 | 3 | Excellent | |||||||||||||||||||||||||||||||
| TSH4 | 95.4 | <2 | 0.031 | 3 | Excellent | |||||||||||||||||||||||||||||||
| Date of sample taken : 4/12/2024 | ||||||||||||||||||||||||||||||||||||
| TSH1 | 109.4 | <2 | 0.041 | 3 | Excellent | |||||||||||||||||||||||||||||||
| TSH2 | 108.3 | <2 | 0.022 | 3 | Excellent | |||||||||||||||||||||||||||||||
| TSH3 | 94.1 | <2 | <0.01 | 3 | Excellent | |||||||||||||||||||||||||||||||
| TSH4 | 92 | <2 | <0.01 | 3 | Excellent | |||||||||||||||||||||||||||||||
| Date of sample taken : 9/1/2025 | ||||||||||||||||||||||||||||||||||||
| TSH1 | 92.8 | <2 | 0.03 | 3 | Excellent | |||||||||||||||||||||||||||||||
| TSH2 | 102.1 | <2 | 1.6 | 5 | Good | |||||||||||||||||||||||||||||||
| TSH3 | 96.5 | <2 | <0.01 | 3 | Excellent | |||||||||||||||||||||||||||||||
| TSH4 | 94.3 | <2 | 0.013 | 3 | Excellent | |||||||||||||||||||||||||||||||
| Date of sample taken : 27/2/2025 | ||||||||||||||||||||||||||||||||||||
| TSH1 | 96.7 | <2 | 0.13 | 3 | Excellent | |||||||||||||||||||||||||||||||
| TSH2 | 90.5 | <2 | 0.15 | 3 | Excellent | |||||||||||||||||||||||||||||||
| TSH3 | 91.4 | <2 | 0.02 | 3 | Excellent | |||||||||||||||||||||||||||||||
| TSH4 | 87.9 | <2 | 0.04 | 4 | Excellent | |||||||||||||||||||||||||||||||
| Date of sample taken : 11/3/2025 | ||||||||||||||||||||||||||||||||||||
| TSH1 | 99.1 | <2 | 0.22 | 3 | Excellent | |||||||||||||||||||||||||||||||
| TSH2 | 80.9 | <2 | 0.3 | 4 | Excellent | |||||||||||||||||||||||||||||||
| TSH3 | 98.8 | <2 | 0.01 | 3 | Excellent | |||||||||||||||||||||||||||||||
| TSH4 | 93.5 | <2 | 0.02 | 3 | Excellent | |||||||||||||||||||||||||||||||
| Date of sample taken : 19/3/2025 | ||||||||||||||||||||||||||||||||||||
| TSH1 | 86.8 | <2 | 0.15 | 4 | Excellent | |||||||||||||||||||||||||||||||
| TSH2 | 84.5 | <2 | 0.16 | 4 | Excellent | |||||||||||||||||||||||||||||||
| TSH3 | 95.9 | <2 | 0.02 | 3 | Excellent | |||||||||||||||||||||||||||||||
| TSH4 | 92.4 | <2 | 0.01 | 3 | Excellent | |||||||||||||||||||||||||||||||
| Date of sample taken : 16/4/2025 | ||||||||||||||||||||||||||||||||||||
| TSH1 | 86.6 | <2 | 0.19 | 4 | Excellent | |||||||||||||||||||||||||||||||
| TSH2 | 88 | <2 | 0.2 | 4 | Excellent | |||||||||||||||||||||||||||||||
| TSH3 | 103.2 | <2 | <0.01 | 3 | Excellent | |||||||||||||||||||||||||||||||
| TSH4 | 93.1 | <2 | 0.12 | 3 | Excellent | |||||||||||||||||||||||||||||||
| Date of sample taken : 24/4/2025 | ||||||||||||||||||||||||||||||||||||
| TSH1 | 100.4 | <2 | 0.11 | 3 | Excellent | |||||||||||||||||||||||||||||||
| TSH2 | 92.7 | <2 | 0.27 | 3 | Excellent | |||||||||||||||||||||||||||||||
| TSH3 | 71 | 18 | 5.09 | 12 | Bad (2) | |||||||||||||||||||||||||||||||
| TSH4 | 66.3 | 26 | 5.89 | 13 | Bad (2) | |||||||||||||||||||||||||||||||
| Date of sample taken : 13/5/2025 (2) | ||||||||||||||||||||||||||||||||||||
| TSH1 | 83.3 | <2 | 0.15 | 4 | Excellent | |||||||||||||||||||||||||||||||
| TSH2 | 83.7 | <2 | 0.1 | 4 | Excellent | |||||||||||||||||||||||||||||||
| TSH3 | 64.9 | <2 | 0.98 | 6 | Good | |||||||||||||||||||||||||||||||
| TSH4 | 70.2 | 3 | 1.2 | 7 | Good | |||||||||||||||||||||||||||||||
| Date of sample taken : 23/5/2025 (2) | ||||||||||||||||||||||||||||||||||||
| TSH1 | 102.8 | <2 | 0.04 | 3 | Excellent | |||||||||||||||||||||||||||||||
| TSH2 | 105.1 | <2 | 0.07 | 3 | Excellent | |||||||||||||||||||||||||||||||
| TSH3 | 92.7 | <2 | 0.19 | 3 | Excellent | |||||||||||||||||||||||||||||||
| TSH4 | 69.2 | <2 | 0.6 | 6 | Good | |||||||||||||||||||||||||||||||
| Date of sample taken : 9/6/2025 | ||||||||||||||||||||||||||||||||||||
| TSH1 | 125 | <2 | 0.03 | 5 | Good | |||||||||||||||||||||||||||||||
| TSH2 | 117 | <2 | 0.07 | 4 | Excellent | |||||||||||||||||||||||||||||||
| TSH3 | 83 | <2 | 0.27 | 4 | Excellent | |||||||||||||||||||||||||||||||
| TSH4 | 85 | <2 | 0.28 | 4 | Excellent | |||||||||||||||||||||||||||||||
| Date of sample taken : 25/6/2025 | ||||||||||||||||||||||||||||||||||||
| TSH1 | 83 | <2 | 0.06 | 4 | Excellent | |||||||||||||||||||||||||||||||
| TSH2 | 88 | <2 | 0.09 | 4 | Excellent | |||||||||||||||||||||||||||||||
| TSH3 | 94 | <2 | 0.07 | 3 | Excellent | |||||||||||||||||||||||||||||||
| TSH4 | 88 | <2 | 0.12 | 4 | Excellent | |||||||||||||||||||||||||||||||
| Date of sample taken : 8/7/2025 | ||||||||||||||||||||||||||||||||||||
| TSH1 | 105 | <2 | 0.02 | 3 | Excellent | |||||||||||||||||||||||||||||||
| TSH2 | 117 | <2 | 0.06 | 4 | Excellent | |||||||||||||||||||||||||||||||
| TSH3 | 105 | <2 | 0.01 | 3 | Excellent | |||||||||||||||||||||||||||||||
| TSH4 | 108 | <2 | 0.04 | 3 | Excellent | |||||||||||||||||||||||||||||||
| Date of sample taken : 18/7/2025 | ||||||||||||||||||||||||||||||||||||
| TSH1 | 82.6 | 2 | 0.03 | 4 | Excellent | |||||||||||||||||||||||||||||||
| TSH2 | 117.9 | <2 | 0.02 | 4 | Excellent | |||||||||||||||||||||||||||||||
| TSH3 | 91.1 | <2 | 0.03 | 3 | Excellent | |||||||||||||||||||||||||||||||
| TSH4 | 90.2 | <2 | 0.04 | 4 | Excellent | |||||||||||||||||||||||||||||||
| Date of sample taken : 11/8/2025 | ||||||||||||||||||||||||||||||||||||
| TSH1 | 89.6 | <2 | 0.02 | 4 | Excellent | |||||||||||||||||||||||||||||||
| TSH2 | 96.3 | <2 | 0.04 | 3 | Excellent | |||||||||||||||||||||||||||||||
| TSH3 | 89.5 | <2 | 0.02 | 4 | Excellent | |||||||||||||||||||||||||||||||
| TSH4 | 89.7 | <2 | 0.02 | 4 | Excellent | |||||||||||||||||||||||||||||||
| Date of sample taken : 21/8/2025 | ||||||||||||||||||||||||||||||||||||
| TSH1 | 91 | <2 | 0.06 | 3 | Excellent | |||||||||||||||||||||||||||||||
| TSH2 | 91.2 | <2 | 0.06 | 3 | Excellent | |||||||||||||||||||||||||||||||
| TSH3 | 92.6 | <2 | 0.03 | 3 | Excellent | |||||||||||||||||||||||||||||||
| TSH4 | 92.1 | <2 | 0.05 | 3 | Excellent | |||||||||||||||||||||||||||||||
| Date of sample taken : 2/9/2025 | ||||||||||||||||||||||||||||||||||||
| TSH1 | 92.5 | <2 | 0.03 | 3 | Excellent | |||||||||||||||||||||||||||||||
| TSH2 | 97.7 | <2 | 0.01 | 3 | Excellent | |||||||||||||||||||||||||||||||
| TSH3 | 91.1 | <2 | 0.03 | 3 | Excellent | |||||||||||||||||||||||||||||||
| TSH4 | 90.3 | <2 | 0.02 | 4 | Excellent | |||||||||||||||||||||||||||||||
| Date of sample taken : 16/9/2025 | ||||||||||||||||||||||||||||||||||||
| TSH1 | 82.6 | <2 | 0.02 | 4 | Excellent | |||||||||||||||||||||||||||||||
| TSH2 | 79.1 | <2 | 0.06 | 4 | Excellent | |||||||||||||||||||||||||||||||
| TSH3 | 90.5 | <2 | 0.01 | 3 | Excellent | |||||||||||||||||||||||||||||||
| TSH4 | 90.6 | <2 | 0.01 | 3 | Excellent | |||||||||||||||||||||||||||||||
| Date of sample taken : 6/10/2025 | ||||||||||||||||||||||||||||||||||||
| TSH1 | 86.2 | <2 | 0.08 | 4 | Excellent | |||||||||||||||||||||||||||||||
| TSH2 | 82.7 | <2 | 0.07 | 4 | Excellent | |||||||||||||||||||||||||||||||
| TSH3 | 91.9 | <2 | 0.01 | 3 | Excellent | |||||||||||||||||||||||||||||||
| TSH4 | 92 | <2 | 0.06 | 3 | Excellent | |||||||||||||||||||||||||||||||
| Date of sample taken : 30/10/2025 | ||||||||||||||||||||||||||||||||||||
| TSH1 | 94.9 | <2 | 0.16 | 3 | Excellent | |||||||||||||||||||||||||||||||
| TSH2 | 95.2 | <2 | 0.07 | 3 | Excellent | |||||||||||||||||||||||||||||||
| TSH3 | 93.8 | <2 | 0.01 | 3 | Excellent | |||||||||||||||||||||||||||||||
| TSH4 | 94.1 | <2 | 0.03 | 3 | Excellent | |||||||||||||||||||||||||||||||
| Date of sample taken : 18/11/2025 | ||||||||||||||||||||||||||||||||||||
| TSH1 | 95.1 | <2 | 0.14 | 3 | Excellent | |||||||||||||||||||||||||||||||
| TSH2 | 89.6 | <2 | 0.1 | 4 | Excellent | |||||||||||||||||||||||||||||||
| TSH3 | 94.1 | <2 | 0.01 | 3 | Excellent | |||||||||||||||||||||||||||||||
| TSH4 | 92.5 | <2 | 0.01 | 3 | Excellent | |||||||||||||||||||||||||||||||
| Date of sample taken : 16/12/2025 | ||||||||||||||||||||||||||||||||||||
| TSH1 | 96.6 | <2 | 0.11 | 3 | Excellent | |||||||||||||||||||||||||||||||
| TSH2 | 85.8 | <2 | 0.11 | 4 | Excellent | |||||||||||||||||||||||||||||||
| TSH3 | 91.8 | <2 | 0.02 | 3 | Excellent | |||||||||||||||||||||||||||||||
| TSH4 | 91.8 | <2 | 0.02 | 3 | Excellent | |||||||||||||||||||||||||||||||
| Date of sample taken : 29/1/2026 | ||||||||||||||||||||||||||||||||||||
| TSH1 | 98.9 | <2 | 0.1 | 3 | Excellent | |||||||||||||||||||||||||||||||
| TSH2 | 101.1 | <2 | 0.08 | 3 | Excellent | |||||||||||||||||||||||||||||||
| TSH3 | 103.1 | <2 | 0.01 | 3 | Excellent | |||||||||||||||||||||||||||||||
| TSH4 | 104.7 | <2 | 0.07 | 3 | Excellent | |||||||||||||||||||||||||||||||
| Date of sample taken : 25/2/2026 | ||||||||||||||||||||||||||||||||||||
| TSH1 | 94.8 | <2 | 0.043 | 3 | Excellent | |||||||||||||||||||||||||||||||
| TSH2 | 100.5 | <2 | 0.022 | 3 | Excellent | |||||||||||||||||||||||||||||||
| TSH3 | 98.3 | <2 | 0.01 | 3 | Excellent | |||||||||||||||||||||||||||||||
| TSH4 | 98.9 | <2 | 0.014 | 3 | Excellent | |||||||||||||||||||||||||||||||
| Date of sample taken : 11/3/2026 | ||||||||||||||||||||||||||||||||||||
| TSH1 | 91.2 | <2 | 0.14 | 3 | Excellent | |||||||||||||||||||||||||||||||
| TSH2 | 108.8 | <2 | 0.16 | 3 | Excellent | |||||||||||||||||||||||||||||||
| TSH3 | 96.1 | <2 | 0.012 | 3 | Excellent | |||||||||||||||||||||||||||||||
| TSH4 | 93.6 | <2 | 0.034 | 3 | Excellent | |||||||||||||||||||||||||||||||
| Date of sample taken : 24/3/2026 | ||||||||||||||||||||||||||||||||||||
| TSH1 | 103.8 | <2 | 0.04 | 3 | Excellent | |||||||||||||||||||||||||||||||
| TSH2 | 108.8 | <2 | 0.053 | 3 | Excellent | |||||||||||||||||||||||||||||||
| TSH3 | 106.3 | <2 | 0.012 | 3 | Excellent | |||||||||||||||||||||||||||||||
| TSH4 | 101.4 | <2 | 0.01 | 3 | Excellent | |||||||||||||||||||||||||||||||
| Date of sample taken : 13/4/2026 | ||||||||||||||||||||||||||||||||||||
| TSH1 | 98.3 | <2 | 0.01 | 3 | Excellent | |||||||||||||||||||||||||||||||
| TSH2 | 95.4 | <2 | 0.01 | 3 | Excellent | |||||||||||||||||||||||||||||||
| TSH3 | 99.6 | <2 | 0.01 | 3 | Excellent | |||||||||||||||||||||||||||||||
| TSH4 | 91.9 | <2 | 0.01 | 3 | Excellent | |||||||||||||||||||||||||||||||
| Date of sample taken : 21/4/2026 | ||||||||||||||||||||||||||||||||||||
| TSH1 | 102.2 | <2 | 0.023 | 3 | Excellent | |||||||||||||||||||||||||||||||
| TSH2 | 104.1 | <2 | 0.019 | 3 | Excellent | |||||||||||||||||||||||||||||||
| TSH3 | 103.4 | <2 | 0.012 | 3 | Excellent | |||||||||||||||||||||||||||||||
| TSH4 | 92 | <2 | 0.01 | 3 | Excellent | |||||||||||||||||||||||||||||||
| Date of sample taken : 11/5/2026 | ||||||||||||||||||||||||||||||||||||
| TSH1 | 93.9 | <2 | 0.014 | 3 | Excellent | |||||||||||||||||||||||||||||||
| TSH2 | 90.6 | <2 | 0.035 | 3 | Excellent | |||||||||||||||||||||||||||||||
| TSH3 | 97.4 | <2 | 0.015 | 3 | Excellent | |||||||||||||||||||||||||||||||
| TSH4 | 96.5 | <2 | 0.035 | 3 | Excellent | |||||||||||||||||||||||||||||||
| Date of sample taken : 27/5/2026 | ||||||||||||||||||||||||||||||||||||
| TSH1 | 105 | 3.2 | 0.035 | 4 | Excellent | |||||||||||||||||||||||||||||||
| TSH2 | 104.6 | 3.2 | 0.045 | 4 | Excellent | |||||||||||||||||||||||||||||||
| TSH3 | 101.5 | <2 | 0.01 | 3 | Excellent | |||||||||||||||||||||||||||||||
| TSH4 | 98.3 | <2 | 0.01 | 3 | Excellent | |||||||||||||||||||||||||||||||
| Date of sample taken : 12/6/2026 | ||||||||||||||||||||||||||||||||||||
| TSH1 | 98.9 | <2 | 0.026 | 3 | Excellent | |||||||||||||||||||||||||||||||
| TSH2 | 98.8 | <2 | 0.018 | 3 | Excellent | |||||||||||||||||||||||||||||||
| TSH3 | 103.9 | <2 | 0.013 | 3 | Excellent | |||||||||||||||||||||||||||||||
| TSH4 | 100.4 | <2 | 0.01 | 3 | Excellent | |||||||||||||||||||||||||||||||
| Date of sample taken : 25/6/2026 | ||||||||||||||||||||||||||||||||||||
| TSH1 | 90.6 | <2 | 0.012 | 3 | Excellent | |||||||||||||||||||||||||||||||
| TSH2 | 91.3 | <2 | 0.031 | 3 | Excellent | |||||||||||||||||||||||||||||||
| TSH3 | 95.0 | <2 | 0.060 | 3 | Excellent | |||||||||||||||||||||||||||||||
| TSH4 | 93.5 | <2 | 0.036 | 3 | Excellent | |||||||||||||||||||||||||||||||
| Date of sample taken : 11/7/2026 | ||||||||||||||||||||||||||||||||||||
| TSH1 | 97.7 | <2 | 0.051 | 3 | Excellent | |||||||||||||||||||||||||||||||
| TSH2 | 102.2 | <2 | 0.065 | 3 | Excellent | |||||||||||||||||||||||||||||||
| TSH3 | 99.5 | <2 | 0.051 | 3 | Excellent | |||||||||||||||||||||||||||||||
| TSH4 | 98.8 | <2 | 0.046 | 3 | Excellent | |||||||||||||||||||||||||||||||
Remarks :
- The contract for the WENT Landfill does not specify requirements for water quality monitoring at Tai Shui Hang. If unusual changes in water quality are detected, the EPD will take follow-up actions.
- On 24 April 2025, the ammonia-nitrogen levels at the upstream monitoring points of Tai Shui Hang (TSH3 and TSH4) ranged from 5.09 to 5.89 mg/L, receiving the lowest WQI scoring (i.e., 5 points). The BOD5 levels were 18 and 26 mg/L, receiving the lowest WQI scoring (i.e., 5 points). However, subsequent monitoring showed that the water quality at both monitoring locations had returned to "Excellent" to "Good" levels. For further details, please refer to the discussion paper for the meeting of the Food, Environment and Hygiene Committee, Tuen Mun District Council held on 19 June 2025.
Please click here for monitoring results of year 2018 to 2023.
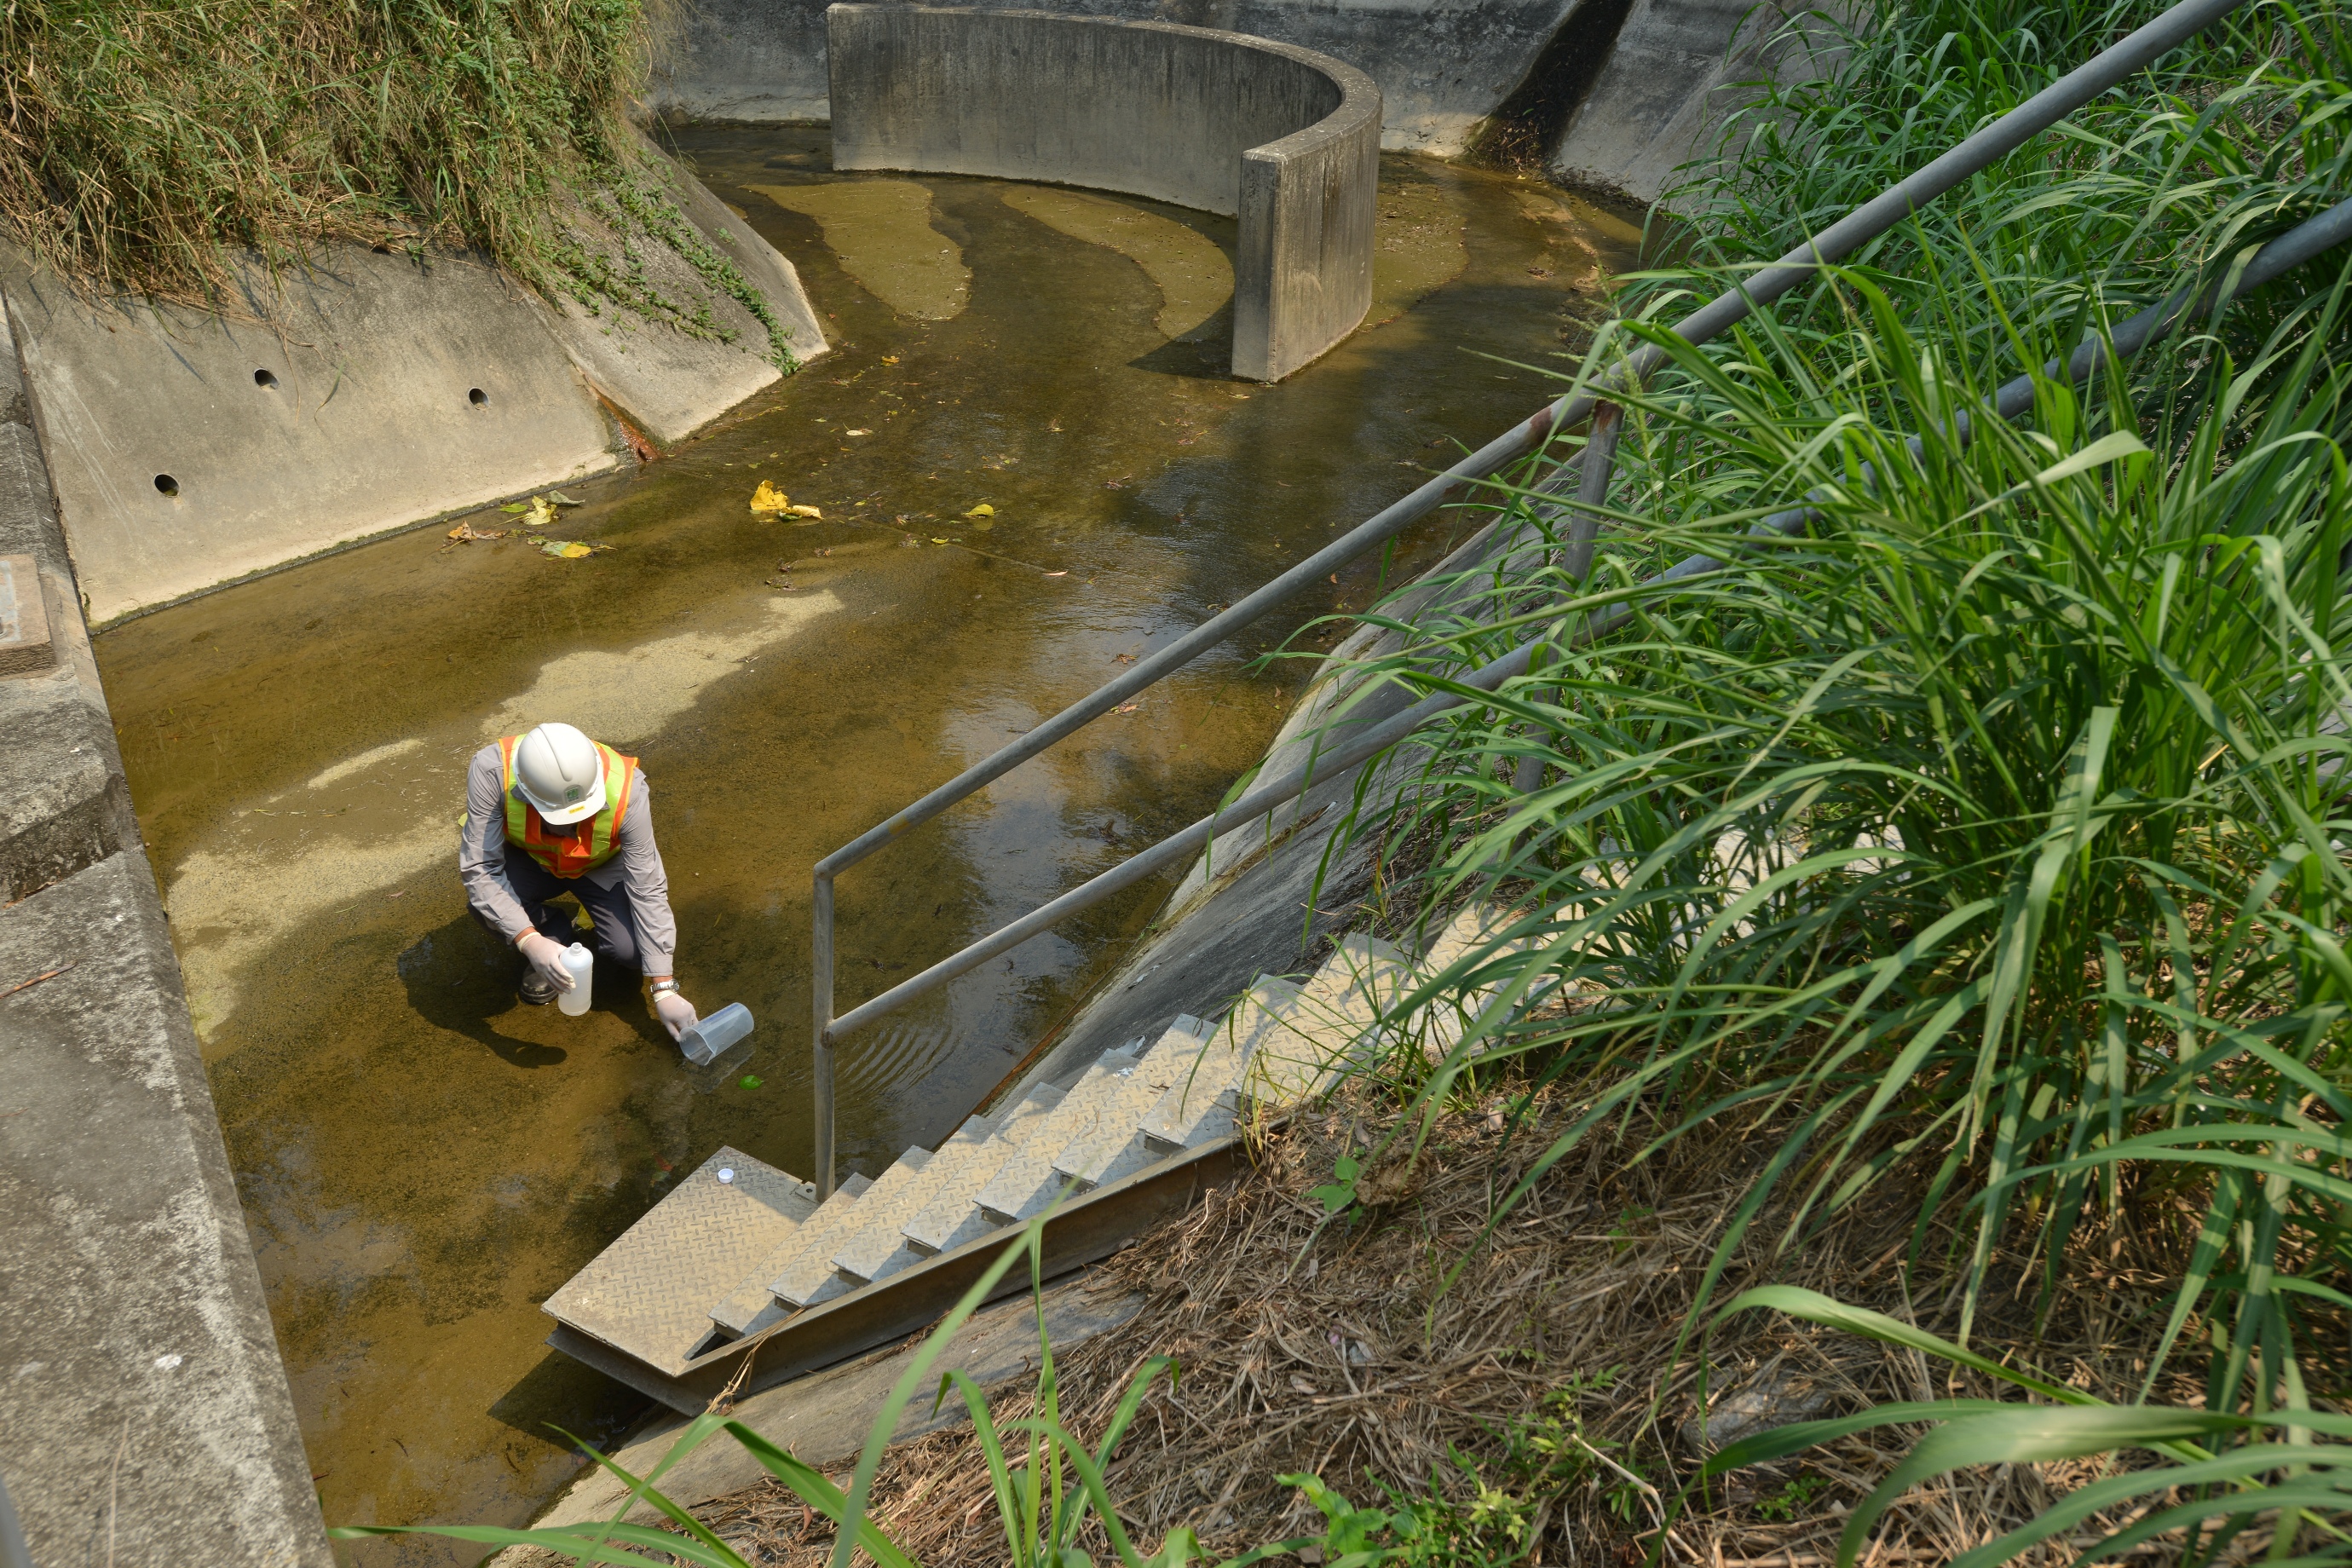
EPD staff collect water samples from Tai Shui Hang (TSH3)
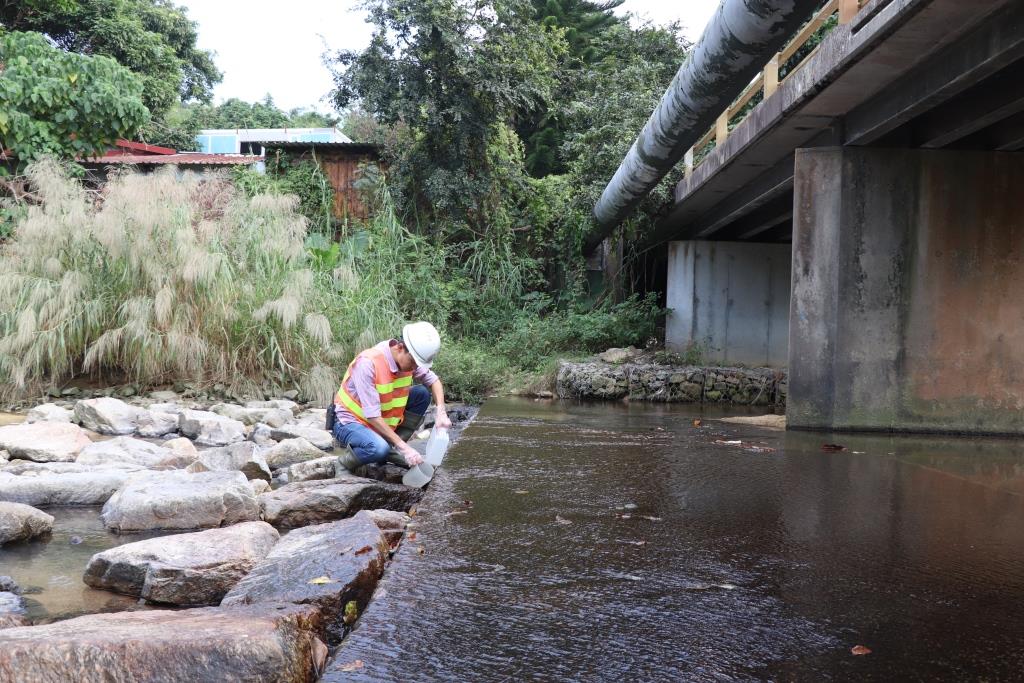
Upstream of Tai Shui Hang (TSH4)