

Characteristics of Sound and the Decibel Scale
The higher the frequency, the more high-pitched a sound is perceived. The sounds produced by drums have much lower frequencies than those produced by a whistle, as shown in the following diagrams. Please click on the demo button to hear their sounds and the difference in pitch.
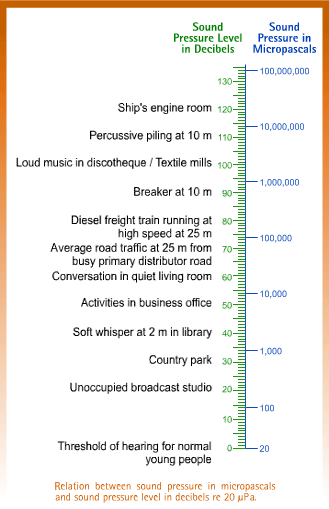
Human ear can perceive a very wide range of sound pressure. The softest sound a normal human ear can detect has a pressure variation of 20 micro Pascals, abbreviated as µPa, which is 20 x 10-6 Pa ("20 millionth of a Pascal") and is called the Threshold of Hearing. On the other hand, the sound pressure close to some very noisy events such as launching of the space shuttle can produce a large pressure variation at a short distance of approximately 2000 Pa or 2 x 10⁹ µPa. The following table illustrates sound pressure level of the above events expressed in Pa and µPa.
|
Sound
Pressure expressed in
|
||
|---|---|---|
|
Pa
|
µPa
|
|
| Softest Noise just Heard by a Human Ear |
20
x 10-6
|
20
|
| Launching of the Space Shuttle |
2,000
|
2
x 109
|
To express sound or noise in terms of Pa is quite inconvenient because we have to deal with numbers from as small as 20 to as big as 2,000,000,000.The following table shows some common sound or noise in terms of µPa:
| Source of Sound/Noise |
Approximate
Sound Pressure
in µPa |
|---|---|
| Launching of the Space Shuttle |
2,000,000,000
|
| Full Symphony Orchestra |
2,000,000
|
| Diesel Freight Train at High Speed at 25 m |
200,000
|
| Normal Conversation |
20,000
|
| Soft Whispering at 2 m in Library |
2,000
|
| Unoccupied Broadcast Studio |
200
|
| Softest Sound Human can Hear |
20
|
A simpler way is to use a logarithmic scale for the loudness of sound or noise, using 10 as the base. The following is a brief introduction of the common logarithm to the base 10.
Click on the demo button, you may learn more about the relationship between linear and logarithmic scales.
To avoid expressing sound or noise in terms of Pa, which could involve some unmanageable numbers, the decibel or dB scale is used. The scale uses the hearing threshold of 20 μPa or 20 x 10-6 Pa as the reference level. This is defined as 0 dB.
Sound pressure level, which is often abbreviated as SPL or Lp, in decibels (dB), can then be obtained using the following formula. You can click on the demo button to learn the formula.
In the following chart, some sounds are expressed both linearly in µPa and logarithmically in dB. One can see how the logarithmic scale helps us to handle numbers on a wide scale much more easily.
One useful aspect of the decibel scale is that it gives a much better approximation to the human perception of relative loudness than the Pascal scale. This is because human ear responds to the logarithmic change in level, which corresponds to the decibel scale.
Adding 60 apples to 60 apples results in 120 apples. But this is not the case with sounds when they are expressed in decibels. In fact, adding 60 decibels to 60 decibels gives 63 decibels. The following formula explains the general principle of adding sounds on the decibel scale. Please click on the demo button to see the details.
One can use the above formula to add three sounds together - 60 dB, 65 dB and 70 dB. Please click on the demo button to learn how to use the formula to add the three sounds together.
Addition of sound levels can also be done simply using the following chart.
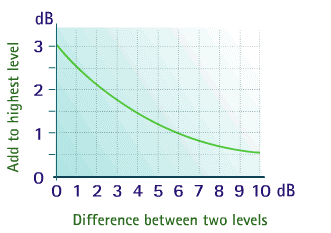
Let us try adding the three sounds of 60 dB, 65 dB and 70 dB by using the chart.
In using the Chart, two sounds are added together first. The resultant sound is then added to a third sound and so on. Please click on the demo button to understand how to add the SPL1, SPL2 and SPL3 together.
One
single sound pressure level is often used to describe
a sound. This can be done by adding
the contribution from all octave bands or
1/3 octave bands together to yield one single
sound pressure level.
The response of the ear to sound is dependent
on the frequency of the sound. The human ear
has peak response around 2,500 to 3,000 Hz
and has a relatively low response at low frequencies.
Hence, the single sound pressure level obtained
by simply adding the contribution from
all octave bands or 1/3 octave bands together
will not correlate well with the non-linear frequency
response of the human ear. This has led to the concept of weighting
scales. The following diagram shows the "A-weighting"
scale:
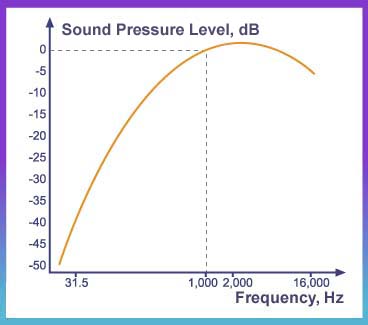
In the "A-weighting" scale, the sound pressure levels for the lower frequency bands and high frequency bands are reduced by certain amounts before they are being combined together to give one single sound pressure level value. This value is designated as dB(A). The dB(A) is often used as it reflects more accurately the frequency response of the human ear. Weighting networks are often incorporated in measuring equipments to give readings in dB(A).