
6.1
Water Quality Assessment
6.1
IntroductionIntroduction
This
Section of the EIA describes the impacts on water quality by the construction
and operation of the proposed LNG terminal and associated facilities. Impacts have been assessed with reference to
the relevant environmental legislation, standards and tolerance criteria.
6.2
Legislative Requirements and Assessment
Criteria
The
following relevant legislation and associated guidance are applicable to the
evaluation of water quality impacts associated with the Project.
· Water Pollution Control
Ordinance (WPCO);
· Environmental Impact
Assessment Ordinance (Cap. 499. S.16), Technical Memorandum on Environmental
Impact Assessment Process (EIAO-TM), Annexes 6 and 14.
·Water Pollution Control
Ordinance (WPCO);
·Environmental Impact Assessment Ordinance (Cap.
499. S.16), Technical Memorandum on Environmental Impact Assessment Process
(EIAO-TM), Annexes 6 and 14.
Apart from these statutory
requirements, the Practice Note for
Professional Persons, Construction Site Drainage (ProPECC PN 1/94), issued
by ProPECC in 1994, also provides useful guidance on the management of
construction site drainage and the prevention of water pollution associated
with construction activities.
6.2.1
Water
Pollution Control Ordinance
Under the WPCO, Hong Kong waters are divided
into 10 Water Control Zones (WCZs), each of which has a set of statutory Water
Quality Objectives (WQOs) designed to protect the marine environment and its
users.
The proposed LNG terminal, water
main and submarine cable are within the Southern WCZ. The proposed gas pipeline route is from South
Soko within the Southern WCZ, passing through
the North Western WCZ, to Black Point within the Outer Deep Bay WCZ (Figure 6.1).
The applicable WQOs associated with the WCZs are summarised in Table 6.1.
Table 6.1 Water Qulaity Objectives Application to
the StudyTable 6.1 Water Quality Objectives Applicable to the Study
|
Water Quality
Objective
|
Deep Bay WCZ
|
North Western
WCZ
|
Southern WCZ
|
|
A. AESTHETIC APPEARANCE
|
|
|
|
|
a) Waste discharges shall cause no objectionable odours or
discolouration of the water.
|
Whole zone
|
Whole zone (including North Western Supplementary Zone)
|
Whole zone (including Southern Supplementary Zone
and Second Southern Supplementary Zone)
|
|
b) Tarry residues, floating wood, articles made of glass,
plastic, rubber or of any other substances should be absent.
|
Whole zone
|
Whole zone (including North Western Supplementary Zone)
|
Whole zone (including Southern Supplementary Zone
and Second Southern Supplementary Zone)
|
|
c) Mineral oil should not be visible on the surface. Surfactants should not give rise to a
lasting foam.
|
Whole zone
|
Whole zone (including North Western Supplementary Zone)
|
Whole zone (including Southern Supplementary Zone
and Second Southern Supplementary Zone)
|
|
d) There should be no recognisable sewage-derived debris.
|
Whole zone
|
Whole zone (including North Western Supplementary Zone)
|
Whole zone (including Southern Supplementary Zone
and Second Southern Supplementary Zone)
|
|
e)Floating, submerged and semi-submerged objects of a size
likely to interfere with the free movement of vessels, or cause damage to
vessels, should be absent.
|
Whole zone
|
Whole zone
(including North Western Supplementary Zone)
|
Whole zone (including Southern Supplementary Zone
and Second Southern Supplementary Zone)
|
|
f) Waste discharges shall not cause the water to contain
substances which settle to form objectionable deposits.
|
Whole zone
|
Whole zone
(including North Western Supplementary Zone)
|
Whole zone (including Southern Supplementary Zone
and Second Southern Supplementary Zone)
|
|
B. BACTERIA
|
|
|
|
|
a) The level of Escherichia
coli should not exceed 610 per 100 mL, calculated as the geometric mean
of all samples collected in one calendar year..
|
Secondary Contact Recreation Subzone
and Mariculture
Subzone
|
Secondary Contact Recreation Subzone and North Western Supplementary Zone
|
Secondary Contact Recreation
Subzones and Fish Culture
Subzones; and Second
Southern Supplementary Zone
|
|
b)The level of Escherichia
coli should not exceed 180 per 100 mL, calculated as the geometric mean
of all samples collected from March to October inclusive in one calendar
year. Samples should be taken at least
3 times in a calendar month at intervals of between 3 and 14 days.
|
Yung Long Bathing Beach
Subzone
|
Bathing Beach Subzone
|
Bathing
Beach Subzones
|
|
c)The level of Escherichia
coli should be less than 1 per 100 mL, calculated as the geometric mean
of the most recent 5 consecutive samples taken at intervals of between 7 and
21 days.
|
-
|
-
|
Southern
Supplementary Zone
|
|
C. DISSOLVED OXYGEN
|
|
|
|
|
a)Waste discharges shall not cause the level of dissolved
oxygen to fall below 4 mg per litre for 90% of the sampling occasions during
the year; values should be taken at 1 metre below surface.
|
Inner Marine Subzone excepting Mariculture Subzone
|
-
|
-
|
|
b)Waste discharges shall not cause the level of dissolved
oxygen to fall below 4 mg per litre for 90% of the sampling occasions during
the year; values should be calculated as water column average. In addition, the concentration of dissolved
oxygen should not be less than 2 mg per litre within 2 metres of the seabed
for 90% of the sampling occasions during the year.
|
Outer Marine Subzone excepting Mariculture Subzone
(water column average specified as arithmetic mean of at least 2 measurements
at 1 metre below surface and 1 metre above seabed)
|
Marine Waters (water column average specified as
arithmetic mean of at least 3 measurements at 1 metre below surface,
mid-depth and 1 metre above seabed); and North Western Supplementary Zone
|
Marine
waters excepting Fish
Culture Subzones
and Second Supplementary Zone
|
|
c)The dissolved oxygen level should not be less than 5 mg
per litre for 90% of the sampling occasions during the year; values should be
taken at 1 metre below surface.
|
Mariculture Subzone
|
-
|
Fish
Culture Subzones
|
|
d)Waste
discharges shall not cause the level of dissolved oxygen to be less than 4
milligrams per litre.
|
-
|
-
|
Inland
waters of the Zone and Southern Supplementary Zone
|
|
D. pH
|
|
|
|
|
a) The pH of the water should be within the range of 6.5 -
8.5 units. In addition, waste
discharges shall not cause the natural pH range to be extended by more than
0.2 units.
|
Marine waters excepting Yung Long
Bathing Beach
Subzone
|
Marine waters (including North Western Supplementary Zone)
excepting Bathing Beach Subzones
|
Beach
Subzones; Mui Wo (A), Mui Wo (B), Mui Wo (C), Mui Wo (E), Mui Wo (F)
Subzones; and Second Southern Supplementary Zone
|
|
b)The pH of the water should be within the range of 6.0 - 9.0
units for 95% of samples. In addition,
waste discharges shall not cause the natural pH range to be extended by more
than 0.5 units.
|
Yung Long Bathing Beach
Subzone
|
Bathing Beach Subzones
|
Bathing
Beach Subzones
|
|
c) The pH
of the water should be within the range of 6.0-9.0 units.
|
-
|
-
|
Mui Wo
(D) Sub-zone and other inland waters
|
|
d)Human activity should not cause the pH of the water to
exceed the range of 6.5-8.5 units.
|
-
|
-
|
Southern
Supplementary Zone
|
|
E. TEMPERATURE
|
|
|
|
|
Waste discharges shall not cause the natural daily
temperature range to change by more than 2.0 oC.
|
Whole zone
|
Whole zone (including North Western Supplementary Zone)
|
Whole
zone (including Southern Supplementary Zone and Second Southern Supplementary
Zone)
|
|
F. SALINITY
|
|
|
|
|
Waste discharges shall not cause the natural ambient
salinity level to change by more than 10%.
|
Whole zone
|
Whole zone (including North Western Supplementary Zone)
|
Whole
zone (including Southern Supplementary Zone and Second Southern Supplementary
Zone)
|
|
G. SUSPENDED SOLIDS
|
|
|
|
|
a)Waste discharges shall neither cause the natural ambient
level to be raised by 30% nor give rise to accumulation of suspended solids
which may adversely affect aquatic communities.
|
Marine waters
|
Marine waters (including North Western Supplementary Zone)
|
Marine waters (including Second Southern Supplementary
Zone)
|
|
b)Waste
discharges shall not cause the annual median of suspended solids to exceed 20
milligrams per litre.
|
-
|
-
|
Beach
Subzones; Mui Wo (A), Mui Wo (B), Mui Wo (C), Mui Wo (E), Mui Wo (F)
Subzones; and Southern Supplementary Zone
|
|
c)Waste
discharges shall not cause the annual median of suspended solids to exceed 25
milligrams per litre.
|
-
|
-
|
Mui Wo
(D) Subzone and other Inland Waters
|
|
H. AMMONIA
|
|
|
|
|
The un-ionized ammoniacal nitrogen level should not be more
than 0.021 mg per litre, calculated as the annual average (arithmetic mean).
|
Whole zone
|
Whole zone (including North Western Supplementary Zone)
|
Whole
zone (including Southern Supplementary Zone and Second Southern Supplementary
Zone)
|
|
I. NUTRIENTS
|
|
|
|
|
a)Nutrients shall not be present in quantities sufficient to
cause excessive or nuisance growth of algae or other aquatic plants.
|
Inner and Outer marine Subzones
|
Marine waters (including North Western Supplementary Zone)
|
Marine waters (including Second Southern Supplementary Zone)
|
|
b)Without limiting the generality of objective (a) above,
the level of inorganic nitrogen should not exceed 0.1 milligram per litre,
expressed as annual water column average (arithmetic mean of at least 3
measurements at 1 metre below surface, mid-depth and metre above seabed).
|
-
|
-
|
Marine waters (including Second Southern Supplementary Zone)
|
|
c)Without limiting the generality of objective (a) above,
the level of inorganic nitrogen should not exceed 0.3 mg per litre, expressed
as annual water column average (arithmetic mean of at least 3 measurements at
1m below surface, mid-depth and 1m above seabed).
|
-
|
Castle Peak Bay Subzone
|
-
|
|
d)Without limiting the generality of objective (a) above,
the level of inorganic nitrogen should not exceed 0.7 mg per litre, expressed
as annual mean.
|
Inner Marine Subzone
|
-
|
-
|
|
e)Without limiting the generality of objective (a) above,
the level of inorganic nitrogen should not exceed 0.5 mg per litre, expressed
as annual water column average.
|
Outer Marine Subzone (water column average specified as
arithmetic mean of at least 2 measurements at 1 metre below surface and 1
metre above seabed)
|
Marine waters
(including North Western Supplementary Zone)
excepting Castle
Peak Bay Subzone (water column average specified
as arithmetic mean of at least 3 measurements at 1m below surface, mid-depth
and 1m above seabed)
|
-
|
|
J. 5-DAY BIOCHEMICAL OXYGEN DEMAND
|
|
|
|
|
a) Waste discharges shall not cause the 5-day biochemical
oxygen demand to exceed 5 milligrams per litre.
|
Yuen Long & Kam Tin (Lower) Subzone and other inland
waters
|
Inland waters (except the subzones stated in b))
|
Inland waters of the Zone
|
|
b) Waste discharges shall not cause the 5-day biochemical
oxygen demand to exceed 3 milligrams per litre.
|
Yuen Long & Kam Tin (Upper) Subzone, Beas Subzone,
Indus Subzone, Ganges Subzone and Water Gathering Ground Subzones
|
Tuen Mun (A), Tuen Mun (B) and Tuen
Mun (C)
Subzones and Water Gathering
Ground Subzones
|
Southern Supplementary Zone
|
|
K. CHEMICAL OXYGEN DEMAND
|
|
|
|
|
a) Waste discharges shall not cause the chemical oxygen
demand to exceed 30 milligrams per litre.
|
Yuen Long & Kam Tin (Lower) Subzone and other inland
waters
|
Inland waters (except the subzones stated in b))
|
Inland waters of the Zone
|
|
b) Waste discharges shall not cause the chemical oxygen
demand to exceed 15 milligrams per litre.
|
Yuen Long & Kam Tin (Upper) Subzone, Beas Subzone,
Indus Subzone, Ganges Subzone and Water Gathering Ground Subzones
|
Tuen Mun (A), Tuen Mun (B) and Tuen
Mun (C)
Subzones and Water Gathering
Ground Subzones
|
Southern Supplementary Zone
|
|
L. TOXINS
|
|
|
|
|
a)Waste discharges shall not cause the toxins in water to
attain such levels as to produce significant toxic, carcinogenic, mutagenic
or teratogenic effects in humans, fish or any other aquatic organisms, with
due regard to biologically cumulative effects in food chains and to
interactions of toxic substances with each other.
|
Whole zone
|
Whole zone (including North Western Supplementary Zone)
|
Southern Supplementary Zone and Second Southern Supplementary Zone
|
|
b)Waste discharges shall not cause a risk to any beneficial
uses of the aquatic environment.
|
Whole zone
|
Whole zone (including North Western Supplementary Zone)
|
Southern Supplementary Zone and Second Southern Supplementary Zone
|
|
M. DANGEROUS SUBSTANCES
|
|
|
|
|
a)
Waste discharges
shall not cause the concentrations of dangerous substances in marine waters
to attain such levels as to produce significant toxic effects in humans, fish
or any other aquatic organisms, with due regard to biologically cumulative
effects in food chains and to toxicant interactions with each other.
|
-
|
-
|
Whole zone
|
|
b)
Waste discharges of
dangerous substances shall not put a
risk to any beneficial uses of the aquatic environment.
|
-
|
-
|
Whole zone
|
|
N. PHENOLS
|
|
|
|
|
Phenols shall not be present in such quantities as to
produce a specific odour, or in concentration greater than 0.05 mg per litre
as C6H5OH.
|
Yung Long Bathing Beach
Subzone
|
Bathing Beach Subzones
|
-
|
|
O.
TURBIDITY
|
|
|
|
|
Waste discharges shall not reduce light transmission
substantially from the normal level.
|
Yung Long Bathing Beach
Subzone
|
Bathing Beach Subzones
|
-
|
6.2.2
Technical Memorandum Standards for
Effluents Discharged into Drainage and Sewerage Systems, Inland and Coastal
Waters
All
discharges during both the construction and operational phases of the proposed
development are required to comply with the Technical
Memorandum Standards for Effluents Discharged into Drainage and Sewerage
Systems, Inland and Coastal Waters (TM) issued under Section 21 of the WPCO.
The
TM defines acceptable discharge
limits to different types of receiving waters.
Under the TM, effluents
discharged into the drainage and sewerage systems, inshore and coastal waters
of the WCZs are subject to pollutant concentration standards for specified
discharge volumes. These are defined by
the Environmental Protection Department (EPD) and are specified in licence
conditions for any new discharge within a WCZ.
The
proposed LNG terminal at South Soko will be required to comply with Table 10a of the TM - Standards for effluents
discharged into the inshore waters of Southern, Mirs Bay, Junk Bay, North
Western, Eastern Buffer and Western Buffer Water Control Zones.
6.2.3
Technical
Memorandum on Environmental Impact Assessment Process (EIAO-TM)
Annexes
6 and 14 of the EIAO-TM provide general guidelines and criteria to be used in
assessing water quality impacts.
The EIAO-TM recognises that, in the application of the above water
quality criteria, it may not be possible to achieve the WQO at the point of
discharge as there are areas which are subjected to greater impacts (which are
termed by the EPD as the mixing zones),
where the initial dilution of the discharge takes place. The definition of this area is determined on
a case-by-case basis. In general, the
criteria for acceptance of the mixing zones are that it must not impair the
integrity of the water body as a whole and must not damage the ecosystem.
6.2.4
Suspended
Solids Impacts
The Water Quality Objective (WQO)
for suspended solids in marine waters of the Southern WCZ,
the North Western WCZ and the Deep Bay WCZ states that:
Waste
discharges shall neither cause the natural ambient level to be raised by 30%
nor give rise to accumulation of suspended solids, which may adversely affect
aquatic communities
As the proposed submarine pipeline
alignment passes through these three WCZs, the impact assessment of the
submarine pipeline will be divided between the respective WCZs.
Analysis of EPD routine water
quality monitoring data from the years of 1996 to 2006 has been undertaken to
determine the allowable increase in suspended solids concentrations within the
WCZ. Data have been analysed from EPD
monitoring stations that are in the proximity of the proposed works (Figure 6.2).
The SS criterion, in accordance with
the WQO, at specific sensitive receivers is discussed in Section 6.3.5, Part 2.
WQO for SS in Deep Bay Water Control
Zone
Suspended
solids data from EPD monitoring station DM4 and DM5, have been analysed to
determine the allowable increase at the sensitive receivers close to the shore
approach at Black Point within the outer Deep Bay WCZ. For those sensitive receivers within the
inner Deep Bay WCZ, the SS criterion will make reference to station DM4.
WQO for SS North Western Water
Control Zone
Suspended solids data from EPD
monitoring stations NM5, NM6 and NM8, have been analysed to determine the
allowable increase at the sensitive receivers close to relevant sections of the
proposed submarine gas pipeline.
WQO for SS Southern Water Control
Zone
Suspended solids data from EPD
monitoring station SM20 have been analysed to determine the allowable increase
at sensitive receivers close to the proposed terminal at South Soko within the Southern WCZ. The
SS criteria derived from stations SM13 and SM17 will be used for those
respective sensitive receivers near to them.
SS
Criterion for Seawater Intakes
The
power station intakes have specific requirements for intake water quality. The applicable criteria for the Black Point
Power Station and Castle Peak Power Station seawater intakes are temperature
between 17 and 32°C
and SS levels below 764 mg L-1 respectively. It is hence reasonable to adopt an SS
assessment criterion of 700 mg L-1
for these two seawater intakes.
There
are no particular criteria specified for the industrial intake at Tuen Mun Area
38, the Airport intakes ([1])
and Tai Kwai Wan pumping station intakes and hence the WQO was used as the
criteria for these intakes.
The
Water Supplies Department (WSD) has a set of standards for the quality of abstracted
seawater (Table 6.2). Water quality at the Tuen Mun WSD sea water
intake has been assessed against these standards, in addition to the WQOs.
Table 6.26.2 WSD Water Quality Criteria for Abstracted
Seawater
|
Parameter
|
Criterion
|
|
Colour (HU)
|
< 20
|
|
Turbidity (NTU)
|
< 10
|
|
Threshold Odour No.
|
< 100
|
|
Ammoniacal Nitrogen (mg L-1)
|
< 1
|
|
Suspended Solids (mg L-1)
|
< 10 (20 is the upper threshold)
|
|
Dissolved Oxygen (mg L-1)
|
> 2
|
|
5-day Biochemical Oxygen Demand (mg L-1)
|
< 10
|
|
Synthetic Detergents (mg L-1)
|
< 5
|
|
E. coli (cfu 100mL-1)
|
< 20,000
|
SS
Criterion for Fish Culture Zones
There is a
general water quality protection guideline for suspended solids (SS), which has
been proposed by the AFCD ([2]). The guideline requires the maximum SS levels
to remain below 50 mg L-1. This criterion has been adopted in approved
EIA Reports ([3]) ([4]).
There is a
general water quality protection guideline for suspended solids (SS), which has
been proposed by the AFCD ([5]). The guideline requires the maximum SS levels
to remain below 50 mg L-1.
This
criterion has been adopted in approved EIA Reports ([6]) ([7]).
· SS Criterion for Subtidal Hard Bottom Habitat
There
are no established legislative criteria for water quality at subtidal hard bottom
habitat (coral). An elevation criterion
of 10 mg L-1 in SS has
been adopted as the critical value above which impacts to the habitat may
occur, as adopted in approved EIA Reports ([8]).
6.2.5
Sediment Quality
Dredged
sediments destined for marine disposal are classified according to a set of
regulatory guidelines (Management of
Dredged / Excavated Sediment, ETWBTC No. 34/2002) issued by the
Environment, Transport and Works Bureau (ETWB) in August 2002. These guidelines comprise a set of sediment
quality criteria, which include organic pollutants and other substances. The requirements for the marine disposal of
sediment are specified in the ETWBTC No.
34/2002. Marine disposal of dredged
materials is controlled under the Dumping
at Sea Ordinance 1995.
6.2.6
Other
Assessment Criteria
Sediment Deposition
In the marine ecological impact
assessment, a hard coral species was found at the south western coast of South Soko (see Part
2 - Sections 6.3 and 6.9).
Impacts to coral communities have also been assessed with regard to
sediment deposition. The assessment
criterion of 200 g m-2 day-1,
has been used in an approved EIA Report ([9]) and has been adopted here. Impacts to artificial reefs (ARs) through
deposited sediments have also been assessed using this criterion.
Dissolved Oxygen
The release of sediment contaminants into
the water column or the effluent discharge due to the Project may consume the
dissolved oxygen (DO) in the receiving water.
Oxygen depletion resulting from the dredging operations or the effluent
discharge will be assessed against the WQO.
The allowable change in DO levels in each WCZ has been calculated based
on the EPD routine water quality monitoring data over the period 1996 to 2006.
The assessment criterion for DO, in
accordance with the WQO, at each sensitive receiver is discussed in Section 6.3.5, Part 2.
In
addition, the WQO that is specific to Fish Culture Zones is set at no less than
5 mg L-1 measured
at 1 m below the water surface (Table 6.1).
Dissolved
Metals and Organic Compounds
There are no quantitative standards for
dissolved metals in the marine waters of Hong Kong. It is thus proposed to make reference to the
relevant UK
water quality standards ([10]).
This standard has been adopted in the previous approved EIAs, i.e., EIA for Decommissioning of Cheoy Lee
Shipyard at Penny’s Bay ([11]), EIA
for Disposal of Contaminated Mud in the East Sha Chau Marine Borrow Pit ([12]) and EIA
for Wanchai Development Phase II ([13]).
Water sampling was conducted and the
results showed that the concentrations of the dissolved metals in the marine
water column at all sampling stations were found below the reporting limits,
with the exception of copper. This
indicates that the ambient concentrations of these dissolved metals are
minimal. For copper, the mean concentration
has been calculated based on the water sampling results for each WCZ. Table
6.3 shows the assessment criteria and the respective allowable increases
for dissolved metals due to the Project.
Table 6.3 Summary of Assessment Criteria and the Allowable
Increases for Dissolved Metals due to the Project
|
Parameter
|
Assessment Criterion
(µg L-1)
|
Ambient Concentration
(a)
(µg L-1)
|
Allowable
Increase
(µg L-1)
|
|
Arsenic
|
25.0
|
<1
|
24.5
|
|
Cadmium
|
2.5
|
<0.5
|
2.25
|
|
Chromium
|
15.0
|
<5
|
12.5
|
|
Copper – Deep Bay WCZ
|
5.0
|
2.3
|
2.7
|
|
Copper – North Western
WCZ
|
5.0
|
2.3
|
2.7
|
|
Copper – Southern
WCZ
|
5.0
|
2.6
|
2.4
|
|
Lead
|
25.0
|
<2
|
24
|
|
Mercury
|
0.3
|
<0.2
|
0.2
|
|
Nickel
|
30.0
|
<2
|
29.0
|
|
Silver
|
2.3
|
<1
|
1.8
|
|
Zinc
|
40.0
|
<10
|
35.0
|
|
Total PCBs
|
0.03
|
-
|
-
|
|
Total PAHs
|
3.0
|
-
|
-
|
|
TBT
|
0.1
|
-
|
-
|
|
Alpha-BHC
|
0.0049
c
|
-
|
-
|
|
Beta BHC
|
0.017
c
|
-
|
-
|
|
Gamma BHC
|
0.16
b
|
-
|
-
|
|
Delta-BHC
|
-
d
|
-
|
-
|
|
Heptachlor
|
0.053
b
|
-
|
-
|
|
Aldrin
|
1.3
b
|
-
|
-
|
|
Heptachlor epoxide
|
0.053
b
|
-
|
-
|
|
Alpha Endosulfan
|
0.034
b
|
-
|
-
|
|
p, p'-DDT
|
0.13
b
|
-
|
-
|
|
p, p'-DDD
|
0.00031
c
|
-
|
-
|
|
p, p'-DDE
|
0.00022
c
|
-
|
-
|
|
Endosulfan sulfate
|
89
c
|
-
|
-
|
|
Notes:
(a)
The
ambient concentrations were derived from the water sampling results for this
project.
(b)
The
water quality criteria were derived from the USEPA water quality
criteria. The Criteria Maximum
Concentration (CMC) is an estimate of the highest concentration of a material
in surface water to which an aquatic community can be exposed briefly without
resulting in an unacceptable effect.
CMC is used as the criterion of the respective compounds in this
study.
(c)
No
saltwater criteria for this chlorinated pesticide were defined by USEPA. The water quality criterion to protect
human health for the consumption of aquatic organisms is provided for
reference.
(d)
No
water quality criteria for delta-BHC were defined by USEPA.
|
The water sampling results also showed
that the concentrations of the organic compounds were all below the reporting
limits. There are no existing regulatory
standards or guidelines for total PCBs, total PAHs and TBT in water and hence
reference has been made to the USEPA water quality criteria ([14]), Australian water quality guidelines ([15]),
and international literature ([16]), , respectively. The assessment criteria for total PCBs, total
PAHs and TBT are 0.03 µg L-1,
3.0 µg L-1 and 0.1 µg L-1.
Residual Chlorine
As
discussed in the Project Description
(Section 3) the water system used to
warm up the LNG will require the use of chlorine as an antifoulant. The resultant discharge to the
marine environment will contain total residual chlorine. A suggested water quality
criterion for total residual chlorine has been proposed by the EPD based on the
results of the Harbour Area Treatment
Scheme (HATS) Environmental and Engineering Feasibility Assessment Studies.
The
criterion value of 0.01 mg L-1 (daily maximum) at the edge of the mixing
zone has been chosen as the criterion against which to assess the results from
the computer modelling of chlorine dispersion. This is also the criterion
adopted in the previously approved EIA for the 1,800 MW Gas-fired Power Station
at Lamma Extension ([17]).
6.3
Baseline
Conditions and Water Quality Sensitive Receivers
6.3.1
Hydrodynamics
In general, long period swell waves
generated in the South China Sea propagate into Hong Kong
waters, with energy dissipation due to refraction, diffraction, shoaling, wave breaking,
bottom friction and shielding due to offshore islands. This results in wave energy reduction inshore
of the outer islands and into shallower Hong Kong
waters. It also gives Hong Kong a
distinctive two peak frequency distribution, where one peak represents offshore
swells and the other the shorter period inshore wind-driven waves. The NE Monsoon is generally stronger and more
persistent than the SW Monsoon. The
highest percentage of strong winds and hence waves are generated from north to
southeast.
Current velocities are influenced by
the semi-diurnal tidal regime of the South China Sea
and the freshwater flows of the Pearl River Estuary during the wet season. The further upstream of the Pearl River
Estuary the greater the tidal distortion, shorter floodtide, longer ebb, and
the greater the effect of fresh water flows.
Deep Bay Water Control Zone
The Black Point landing point is surrounded by a shallow and
sediment-laden water body in the Outer
Deep Bay
region between Hong Kong and Shenzhen. Deep
Bay has a surface area of
approximately 112 km2 (11,200 ha) with a length of about 15 km and
an average depth of 3 m ([18]).
The
hydrodynamic regime of the Deep
Bay area is
unidirectional and the current direction reverses during ebb and flood
tides. Tidal flow is dynamic and complex
in the Deep Bay
areas due to the seasonal influx of freshwater from the Pearl
River to the Urmston
Road. The
Urmston Road is one of the main flow routes into and out of the Pearl River
Estuary and carries significant volumes of water on each tide ([19]).
North Western Water Control Zone
The North Western WCZ is situated at
the mouth of the Pearl River Estuary and, as such, is heavily influenced by the
freshwater flows from the hinterland.
The area shows distinct seasonality as a result of the seasonal influx
of freshwater from the Pearl River. The estuarine influence is especially
pronounced in the wet summer months when the freshwater flows are greatest and
strong salinity and temperature stratification is prominent. During winter months water conditions are
more typically marine (with lower nutrient levels and
higher DO levels) and
salinity and other parameters vary less with depth. Ebb tide currents are towards the southeast
where the flood tide currents move to the northwest. Current velocities in areas near to East of
Sha Chau have been predicted in previous studies to be less than 2.0 m s-1
on the surface and rarely exceeding 0.25 m s-1 near
seabed ([20]).
Southern Water Control Zone
Hydrodynamics at South Soko are influenced
by the fringing coastal estuarine plume to the west generated by the output
from the Pearl River. These are stronger in the summer months when
rainfall increases. Tidal currents are
moderate at the south-eastern side of South Soko Island relative to the northern-western
side. The northern side of the Island
is, however, less exposed to the oceanic swells than the southern side of the Island.
The southern waters are also
influenced by the semi diurnal tidal regime of the South
China Sea and the freshwater flows of the Pearl River Estuary,
particularly during the wet season. The
southern waters wave climate is mostly determined by the seasonal monsoon
winds, typhoon events and the coastal geomorphology, which influences the wave
trains as they propagate inshore. Long
period swell waves generated in the South China Sea propagate into Hong Kong waters, with energy dissipation due to
refraction, diffraction, shoaling, wave breaking, bottom friction and shielding
due to offshore islands.
6.3.2
Water
Quality
Water quality has been determined
through a review of EPD routine water quality monitoring data collected between
1996 and 2006. This dataset provides
Hong Kong’s most comprehensive long term water quality monitoring data and
provides an indication of temporal and spatial change in marine water quality
in Hong Kong.
Deep Bay Water Control Zone
On the
basis of the 1996 to 2006 monitoring data, Dissolved Oxygen (DO) levels
in Deep Bay the WCZ exhibited a decline from
1996 to 2003 followed by an increase, whereas, Total Inorganic Nitrogen (TIN) and
Unionised Ammonia have been increasing over time. An increasing trend of SS levels between 1998
and 2001 is observed; however, between 2002 and 2006 SS levels have been
declining. It is noted from reviewing the data
for SS that the range of values recorded is high and values up to 62 mg L-1
at DM5 and 66 mg L-1 at DM4 have been recorded. Water quality within the Deep Bay WCZ is
generally compliant with the WQOs. The
exception as discussed above has been TIN, the levels of which have exceeded
the WQO of < 0.5 mg L-1 in all years. The increased levels in E. coli have been attributed to discharges from the Pearl River
Estuary (Table
6.4).
North Western Water Control Zone
The water quality in the North
Western WCZ is influenced by effluent discharges from sewage treatment works,
such as those at Siu Ho Wan and Pillar Point and Pearl River Delta flows in
general. Data collected between 1996 and 2006
indicate that there have been elevations of SS and Unionised Ammonia. A decreasing trend for DO is observed over
1996-2003 and an increase is found afterwards.
In terms of compliance with the WQOs, no exceedances have been recorded,
with the exception of TIN, which exceeds the WQO of 0.5 mg L-1 on a
continual basis, particularly at NM5 and NM6 (Table 6.4). It is noted from
reviewing the data for SS that the range of values recorded is high and values
up to 81 mg L-1 at NM5 and 73 mg L-1 at NM8 have been
recorded. Among the mentioned monitoring
stations, NM5 recorded the highest geometric mean of E. coli, equals to 520 cfu 100mL-1.
Southern Water Control Zone
Data collected between 1996 and 2006
indicate that there is an increasing trend for DO, Unionised Ammonia and TIN
within the Southern WCZ and followed by a decrease
since 2004. E. coli, has exhibited a
decrease since 2002 and E. coli
levels in the Southern WCZ are considered to be low in comparison to other
stations in Hong Kong. In terms of WQO compliance, only exceedances
in TIN (> 0.1 mg L-1) have been recorded consistently over time (Table 6.4). It is noted from reviewing the data for SS
that the range of values recorded is moderate and values up to 53 mg L-1
at SM20, 40 mg L-1 at SM17 and 42 mg L-1 at SM13 have
been recorded.
6.3.3
Water
Quality in the Marine
Park
The Agriculture, Fisheries and
Conservation Department (AFCD) commenced a routine water quality monitoring
programme in 1999 to collect baseline water quality data from the Sha Chau and Lung Kwu
Chau Marine
Park. The water quality monitoring results for the
Sha Chau and Lung
Kwu Chau
Marine Park
(1999 – 2005) are presented in Table 6.5.
It is apparent from the data that
the mean values of suspended sediment range between stations from 9.7 to 37.2
mg L-1.
Table 6.4 EPD Water Quality Monitoring Data 1996
- 2006 in the Deep Bay, North Western and Southern Water Control Zones
|
Water Quality Parameter
|
Deep Bay WCZ
|
North Western WCZ
|
Southern
WCZ
|
|
|
DM4
|
DM5
|
NM5
|
NM6
|
NM8
|
SM13
|
SM17
|
SM20
|
|
Temperature (ºC)
|
23.9
|
23.6
|
23.4
|
23.5
|
23.5
|
23.5
|
23.1
|
23.4
|
|
|
(14.4 - 32.8)
|
(14.4 - 31.1)
|
(15.5 - 30.3)
|
(15.1 - 29.8)
|
(15.4 - 30.1)
|
(15.5 - 29.8)
|
(15.6 - 29.8)
|
(15.4 - 29.8)
|
|
|
|
|
|
|
|
|
|
|
|
pH
|
7.9
|
7.9
|
8.0
|
8.1
|
8.1
|
8.2
|
8.1
|
8.1
|
|
|
(6.3 - 9.0)
|
(6.2 - 8.7)
|
(7.3 - 8.7)
|
(6.9 - 8.5)
|
(7.4 - 8.7)
|
(7.6 - 9.1)
|
(7.2 - 9.3)
|
(7.6 - 8.9)
|
|
|
|
|
|
|
|
|
|
|
|
Dissolved Oxygen (mg L-1)
Depth-averaged
|
6.0
|
5.9
|
5.9
|
6.4
|
6.5
|
6.9
|
6.6
|
6.5
|
|
|
(0.6 - 10.2)
|
(2.6 - 10.0)
|
(2.3 - 9.2)
|
(3.3 - 11.8)
|
(2.7 - 11.7)
|
(1.8 - 10.3)
|
(2.4 - 10.4)
|
(2.3 - 9.9)
|
|
|
|
|
|
|
|
|
|
|
|
Dissolved Oxygen (mg L-1)
Bottom
|
6.1
|
5.7
|
5.5
|
6.3
|
6.4
|
6.6
|
6.1
|
6.3
|
|
|
(2.9 - 10.2)
|
(2.6 - 10.0)
|
(2.3 - 8.8)
|
(3.3 - 11.8)
|
(2.7 - 11.7)
|
(1.8 - 10.2)
|
(2.4 - 10.4)
|
(2.3 - 8.6)
|
|
|
|
|
|
|
|
|
|
|
|
Dissolved Oxygen (% sat.)
Depth-averaged
|
82.2
|
81.2
|
80.4
|
87.2
|
89.8
|
97.2
|
92.6
|
91.5
|
|
|
(8.8 - 144.9)
|
(37.7 - 136.0)
|
(32.7 - 130.0)
|
(47.1 - 170.2)
|
(40.0 - 166.5)
|
(26.9 - 157.8)
|
(36.0 - 207.3)
|
(32.3 - 147.4)
|
|
|
|
|
|
|
|
|
|
|
|
Dissolved Oxygen (% sat.) Bottom
|
82.5
|
79.1
|
76.1
|
86.5
|
88.2
|
93.3
|
85.4
|
88.5
|
|
|
(40.1 - 144.9)
|
(37.7 - 122.1)
|
(32.7 - 110.3)
|
(47.1 - 167.4)
|
(40.0 - 166.5)
|
(26.9 - 156.9)
|
(36.0 - 145.6)
|
(32.3 - 131.2)
|
|
|
|
|
|
|
|
|
|
|
|
5-day Biochemical Oxygen Demand (mg
L-1)
|
1.1
|
0.9
|
0.8
|
0.9
|
0.8
|
1.0
|
0.7
|
0.8
|
|
|
(<0.1 - 3.7)
|
(<0.1 - 4.9)
|
(<0.1 - 4.1)
|
(<0.1 - 4.9)
|
(<0.1 - 5.5)
|
(<0.1 - 6.7)
|
(<0.1 - 4.0)
|
(<0.1 - >7.4)
|
|
|
|
|
|
|
|
|
|
|
|
Suspended Solids (mg L-1)
|
14.3
|
11.1
|
12.3
|
9.6
|
13.3
|
7.8
|
6.8
|
10.0
|
|
|
(2.4 - 66.0)
|
(1.1 - 62.0)
|
(1.6 - 81.0)
|
(0.9 - 48.0)
|
(1.3 - 73.0)
|
(1.0 - 42.0)
|
(0.8 - 40.0)
|
(1.0 - 53.0)
|
|
|
|
|
|
|
|
|
|
|
|
Total Inorganic Nitrogen (mg L-1)
|
1.02
|
0.67
|
0.56
|
0.51
|
0.33
|
0.19
|
0.14
|
0.19
|
|
|
(0.13 - 2.77)
|
(0.14 - 2.46)
|
(0.03 - 2.30)
|
(0.01 - 1.74)
|
(0.01 - 1.80)
|
(0.02 - 0.59)
|
(0.01 - 0.68)
|
(0.01 - 0.87)
|
|
|
|
|
|
|
|
|
|
|
|
Unionised Ammonia (mg L-1)
|
0.012
|
0.007
|
0.006
|
0.005
|
0.003
|
0.003
|
0.002
|
0.002
|
|
|
(0.000 - 0.050)
|
(0.000 - 0.028)
|
(0.000 - 0.027)
|
(0.000 - 0.027)
|
(0.000 - 0.016)
|
(0.000 - 0.011)
|
(0.000 - 0.008)
|
(0.000 - 0.009)
|
|
|
|
|
|
|
|
|
|
|
|
Chlorophyll-a (microgram L-1)
|
3.2
|
2.3
|
2.5
|
3.4
|
3.5
|
5.0
|
3.2
|
4.2
|
|
|
(<0.2 - 63.0)
|
(<0.2 - 49.0)
|
(<0.2 - 28.0)
|
(<0.2 - 44.0)
|
(<0.2 - 50.0)
|
(<0.2 - 27.0)
|
(<0.2 - 30.0)
|
(0.2 - 28.0)
|
|
|
|
|
|
|
|
|
|
|
|
Escherichia
coli (cfu 100mL-1)
|
222
|
408
|
520
|
27
|
3
|
3
|
1
|
1
|
|
|
(2 - 9,500)
|
(4 - 41,000)
|
(4 - 28,000)
|
(<1 - 4,200)
|
(<1 - 270)
|
(<1 - 2,000)
|
(<1 - 200)
|
(<1 - 320)
|
|
|
|
|
|
|
|
|
|
|
|
Notes:
1.
Data presented are depth averaged
calculated by taking the means of three depths, i.e. surface (S), mid-depth
(M) and bottom (B), except as specified.
2.
Data presented are annual
arithmetic means except for E. coli,
which are geometric means.
3.
Data enclosed in brackets indicate
the ranges regardless of the depths.
4.
Shaded cells indicate
non-compliance with the WQOs.
5.
Outliers have been removed.
|
Table
6.5 Summary of Water Quality in the
Sha Chau & Lung Kwu
Chau Marine
Park ([21])
|
Water Quality Parameter
|
Sha Chau and Lung Kwu Chau Marine Park
|
|
N Lung Kwu Chau
|
N Sha Chau
|
Pak Chau
|
SE Sha Chau
|
|
(1999 – 2005)
|
(1999 – 2000)
|
(1999 – 2005)
|
(1999 – 2000)
|
|
Temperature
(°C)
|
24.1
|
24.3
|
24.1
|
24.3
|
|
Salinity
(ppt)
|
24.7
|
23.9
|
25.1
|
25.1
|
|
pH
|
7.9
|
8.1
|
7.9
|
8.1
|
|
Dissolved
Oxygen (mg L-1)
|
6.2
|
5.8
|
6.2
|
5.8
|
|
Turbidity
(NTU)
|
1.1
|
1.1
|
1.2
|
1.3
|
|
Suspended
Solids (mg L-1)
|
20.3
|
9.7
|
37.2
|
10.0
|
|
BOD5
(mg L-1)
|
1.1
|
0.8
|
1.2
|
0.7
|
|
Ammonia
Nitrogen (mg L-1)
|
0.2
|
0.2
|
0.2
|
0.2
|
|
Unionized
Ammonia (mg L-1)
|
0.050
|
0.029
|
0.071
|
0.030
|
|
Nitrite Nitrogen (mg L-1)
|
0.29
|
0.34
|
0.29
|
0.33
|
|
Nitrate Nitrogen (mg L-1)
|
1.50
|
3.77
|
1.38
|
3.68
|
|
Total
Inorganic Nitrogen (mg L-1)
|
1.38
|
0.54
|
1.31
|
0.56
|
|
Total
Kjeldahl Nitrogen (mg L-1)
|
2.26
|
3.98
|
2.37
|
3.81
|
|
Total
Nitrogen (mg L-1)
|
5.18
|
14.82
|
5.13
|
16.21
|
|
Orthophosphate
Phosphorus (mg L-1)
|
0.27
|
0.06
|
0.13
|
0.05
|
|
Total
Phosphorus (µg L-1)
|
0.74
|
0.10
|
0.65
|
0.09
|
|
Silica
(mg L-1)
|
1.02
|
1.16
|
1.02
|
1.10
|
|
Chlorophyll-a
(µg L-1)
|
2.59
|
2.59
|
2.09
|
2.78
|
|
Phaeo-pigment
(µg L-1)
|
1.90
|
1.07
|
1.81
|
1.09
|
|
E. coli (CFU/100 mL)
|
343
|
54
|
201
|
58
|
|
Faecal
Coliforms (CFU/100 mL)
|
1298
|
117
|
1070
|
114
|
|
Notes:
Data presented are mean depth
averaged calculated by taking the means of three depths, i.e. surface (S),
mid-depth (M) and bottom (B), except as specified.
|
6.3.4
Sediment
Quality
EPD
Sediment Quality Monitoring
EPD
collects sediment quality data as part of the marine water quality monitoring
programme. There are five relevant
monitoring stations in the vicinity of the proposed South Soko LNG terminal and
along the proposed pipeline route, i.e., Station SS6 in the Southern WCZ,
Stations NS4 and NS6 in the Northwestern WCZ
and Stations DS3 and DS4 in the Deep Bay WCZ.
The locations of these stations are shown in Figure
6.2. Data for these stations, which were obtained
from the EPD, are presented in Table 6.6. The data represent the range of values
obtained over the period 1996 to 2005.
As with the water quality data, this dataset provides Hong Kong’s most
comprehensive long term sediment quality monitoring data and provides an
indication of temporal and spatial change in marine sediment quality in Hong
Kong. The values for metals, Polycyclic
Aromatic Hydrocarbons (PAHs) and Polychlorinated Biphenyls (PCBs) may also be
compared to the relevant sediment quality criteria specified in the Environment Transport & Works Bureau Technical Circular No 34/2002
Management of Dredged/Excavated Sediment (ETWBTC 34/2002).
A
comparison of the data with the sediment quality criteria (i.e., Lower Chemical
Exceedance Level (LCEL) and Upper Chemical Exceedance Level (UCEL)) shows that
the levels of arsenic (expressed in arithmetic mean) for
Stations DS3 and DS4 have exceeded the LCEL and they are classified as Category
M but neither of them has exceeded the UCEL.
Though
the maximum values of arsenic recorded at NS4 and NS6 and copper and zinc
recorded at DS3 have exceeded the LCELs, their mean values were below the
LCELs. The sediments in the Southern WCZ
(SS6) were all below the LCEL and this suggests that the sediment quality in
the southern Hong Kong waters was the least
polluted of the three WCZs.
Ground Investigation Works ([22])
In
addition to the background data presented above, a ground investigation and
marine sediment sampling survey was conducted within the proposed dredging
areas at South Soko and those areas associated
with the proposed submarine utilities. A
combination of grab samples and vibrocore samples was taken. Vibrocore samples were taken down to the
proposed dredging depth. The
contaminants tested included all of the contaminants stated in Table 1 -
Analytical Methodology in Appendix B of ETWBTC No 34/2002 plus
PCBs and 12 Chlorinated Pesticides.
Tier
III biological screening was also performed on samples with one or more
contaminant levels exceeding the LCEL and exceeding 10 times the UCEL ([23]). The ecotoxicological testing programme
featured a suite of tests that include three phylogenetically distinct species
(amphipod, polychaete and bivalve larvae) which interact with bedded sediments
in different ways. The objective of the
bioassays was to determine if there is a potential risk of toxicological
impacts from the sediment to the marine biota, and whether there is any
difference in the toxicity of the sediment samples taken from the Project site
and the reference station ([24])
.
Based
on the results, which are presented in detail in the Waste Management section (Part
2 - Section 7), metal concentrations
exceeding the LCEL (including nickel, lead, arsenic and silver) were found at a
locations along the proposed pipeline route and to the south of the South Soko
Island. In the areas where the sediment samples failed the biological
tests, the sediments were classified for Type 2 disposal (disposal at a
confined marine disposal site). At the Urmston Road
crossing, i.e., drill no. DC2 (Part 2
– Figure
7.2),
nickel concentrations in the sediment sample exceeded the UCEL but were within
the 10 x LCEL. This sediment sample was
classified as Category H (requiring Type 2 confined marine disposal). Next to the Lung Kwu Chau and Sha Chau
Marine Park,
i.e., drill no. GV16 (Part 2 – Figure 7.2),
lead concentrations in the sediment sample exceeded the UCEL but also were
below the 10 x LCEL and thus was classified as Category H.
Among
the sampling stations, GSH6, GSH7 and GSH8 were located near to the EPD
sediment monitoring station, DS4. The
sediment test results at those stations were generally comparable with EPD
routine monitoring data. For other
sampling stations, they were remote from the respective EPD sediment monitoring
stations and hence no comparison is applicable.
In addition, elutriate tests have also been undertaken. The results of the elutriate tests are
presented and discussed in Part 2 –
Section 6.6.
6.3.5
Water
Quality Sensitive Receivers
The
construction and operation phases of the proposed LNG terminal and the
installation of the submarine gas pipeline, water main and power cable have the
potential to affect local water quality.
The Sensitive Receivers (SRs) that may be affected by changes in water
quality are identified in accordance with the EIAO-TM. For each of the
sensitive receivers, established threshold criteria or guidelines have been
utilised for establishing the significance of impacts to water quality. The locations of the sensitive receivers are
provided in Figures 6.3
and 6.4. The shortest distances from the identified
water quality sensitive receivers to the proposed LNG terminal and the pipeline
route alignment are detailed in Table 6.7. A summary of the WQO assessment criteria
of SS and DO for each of the sensitive receivers is presented in Table 6.8 and Table 6.9 respectively.
Table 6.6 Summary
of EPD Sediment Quality Monitoring Data Collected between 1996 and 2005
|
Parameter
|
Deep
Bay WCZ
|
North
Western WCZ
|
Southern WCZ
|
Sediment
Quality Criteria
|
|
|
DS3
|
DS4
|
NS4
|
NS6
|
SS6
|
LCEL
|
UCEL
|
|
COD (mg
kg-1)
|
14,885
|
14,540
|
13,635
|
13,300
|
9,945
|
-
|
-
|
|
(7,700 - 18,000)
|
(8,800 - 20,000)
|
(6,700 - 19,000)
|
(7,400 - 20,000)
|
(7,700 - 12,000)
|
|
|
|
Total
Carbon (% w/w)
|
0.5
|
0.6
|
0.6
|
0.5
|
0.5
|
-
|
-
|
|
(0.4 - 0.8)
|
(0.3 - 1.3)
|
(0.3 - 0.8)
|
(0.4 - 0.8)
|
(0.2 - 0.6)
|
|
|
|
Ammonia
Nitrogen (mg kg-1)
|
4.9
|
6.3
|
14.2
|
4.3
|
7.8
|
-
|
-
|
|
(0.2 - 20.0)
|
(<0.05 - 36.0)
|
(0.2 - 39.0)
|
(0.1 - 16.0)
|
(0.3 - 21.0)
|
|
|
|
TKN (mg
kg-1)
|
316
|
285
|
275
|
269
|
290
|
-
|
-
|
|
(150 - 470)
|
(110 - 820)
|
(160 - 530)
|
(140 - 480)
|
(200 - 410)
|
|
|
|
Total
Phosphorous (mg kg-1)
|
208
|
165
|
145
|
150
|
191
|
-
|
-
|
|
(100 - 320)
|
(77 - 270)
|
(92 - 220)
|
(73 - 260)
|
(130 - 260)
|
|
|
|
Total
Sulphide (mg kg-1)
|
44
|
15
|
23
|
6
|
18
|
-
|
-
|
|
(2 - 160)
|
(<0.2
- 76)
|
(<0.2
- 77)
|
(<0.2
- 38)
|
(0.2 - 59)
|
|
|
|
Arsenic
(mg kg-1)
|
16
|
14
|
12
|
11
|
6
|
12
|
42
|
|
(8 - 20)
|
(8 - 19)
|
(9 - 18)
|
(6 - 22)
|
(5 - 8)
|
|
|
|
Cadmium
(mg kg-1)
|
0.2
|
0.1
|
0.1
|
0.1
|
0.1
|
1.5
|
4
|
|
(<0.1 - 0.4)
|
(<0.1 - 0.2)
|
(<0.1 - 0.2)
|
(<0.1 - 0.2)
|
(<0.1 - 0.1)
|
|
|
|
Chromium
(mg kg-1)
|
43
|
32
|
28
|
28
|
23
|
80
|
160
|
|
(23 - 53)
|
(14 - 50)
|
(20 - 44)
|
(15 - 45)
|
(16 - 32)
|
|
|
|
Copper
(mg kg-1)
|
48
|
26
|
23
|
17
|
12
|
65
|
110
|
|
(12 - 77)
|
(6 - 64)
|
(17 - 42)
|
(7 - 34)
|
(8 - 17)
|
|
|
|
Lead
(mg kg-1)
|
54
|
40
|
39
|
30
|
26
|
75
|
110
|
|
(30 - 69)
|
(18 - 68)
|
(29 - 47)
|
(17 - 49)
|
(22 - 32)
|
|
|
|
|
|
|
|
|
|
|
|
|
Mercury
(mg kg-1)
|
0.12
|
0.07
|
0.08
|
0.06
|
0.06
|
0.5
|
1
|
|
(<0.05 - 0.18)
|
(<0.05 - 0.15)
|
(<0.05 - 0.23)
|
(<0.05 - 0.15)
|
(<0.05 - 0.10)
|
|
|
|
Nickel
(mg kg-1)
|
28
|
19
|
18
|
18
|
15
|
40
|
40
|
|
(14 - 37)
|
(7 - 31)
|
(13 - 30)
|
(9 - 28)
|
(11 - 22)
|
|
|
|
Silver
(mg kg-1)
|
0.5
|
0.4
|
0.4
|
0.4
|
0.4
|
1
|
2
|
|
(<0.2 - 0.8)
|
(<0.2 - 0.5)
|
(<0.2 - 0.5)
|
(<0.2 - 0.5)
|
(<0.2 - 0.5)
|
|
|
|
Zinc
(mg kg-1)
|
145
|
96
|
96
|
74
|
66
|
200
|
270
|
|
(69 - 230)
|
(36 - 180)
|
(67 - 110)
|
(34 - 120)
|
(52 - 86)
|
|
|
|
Total
PCBs (µg kg-1)
|
18
|
18
|
18
|
18
|
18
|
23
|
180
|
|
(18 - 18)
|
(18 - 18)
|
(18 - 18)
|
(18 - 18)
|
(18 - 18)
|
|
|
|
Low
Molecular Wt PAHs (µg kg-1)
|
92
|
91
|
92
|
90
|
90
|
550
|
3,160
|
|
(90 - 96)
|
(90 - 94)
|
(90 - 99)
|
(90 - 94)
|
(90 - 90)
|
|
|
|
High
Molecular Wt PAHs (µg kg-1)
|
83
|
60
|
59
|
29
|
27
|
1,700
|
9,600
|
|
(29 - 151)
|
(16 - 254)
|
(21 - 139)
|
(16 - 84)
|
(19 - 47)
|
|
|
|
Notes:
1. Data
presented in bracket is the minimum and maximum data range of each parameter.
2. Low
Molecular Wt PAHs include acenaphthene, acenaphthylene, anthracene,
fluoreneand phenanthrene.
3. High
Molecular Wt PAHs include benzo[a]anthracene, benzo[a]pyrene, chrysene,
dibenzo[a,h]anthracene, fluoranthene, pyrene, benzo[b]fluoranthene,
benzo[k]fluoranthene, indeno[1,2,3- c,d]pyrene
and benzo[g,h,I]perylene.
4. LCEL
= Lower Chemical Exceedance Level
5. UCEL
= Upper Chemical Exceedance Level
6.
Shaded cells indicate exceedance of
LCEL
|
Table
66.7 Shortest
Distance to Sensitive Receivers (SRs) around Proposed LNG Terminal at South
Soko and Submarine Pipeline Section from South Soko to Black Point
|
Sensitive Receiver
|
Name
|
ID
|
Shortest Distance to the LNG
terminal
|
Shortest Distance to the Submarine
Water Main1
|
Shortest Distance to the Submarine
Cable1
|
Shortest Distance to the Pipeline1
|
Assessment Criteria2
|
|
Fisheries and Marine
Ecological Sensitive Receivers
|
|
Fisheries Resources
|
|
Spawning/
Nursery Grounds
|
Fisheries Spawning/Nursery Grounds
in South Lantau
|
SR24
|
2.6 km
|
1.1 km
|
1.3 km
|
2.4 km
|
Water Quality Objectives (WQO)
|
|
|
|
SR27
|
1.1 km
|
1.7 km
|
1.9 km
|
1.0 km
|
Water Quality Objectives (WQO)
|
|
|
Fisheries
Spawning Ground in North Lantau
|
SR8
|
> 10 km
|
> 10 km
|
> 10 km
|
2.7 km
|
Water Quality Objectives (WQO)
|
|
Artificial Reef Deployment Area
|
Sha Chau and
Lung Kwu Chau
|
SR6e
|
> 10 km
|
> 10 km
|
> 10 km
|
< 1 km
|
·
Water Quality Objectives (WQO)
·
Deposition Rate below 200 gm-2
day-1
|
|
|
Northeast Airport
|
SR7d
|
>10 km
|
> 10 km
|
> 10 km
|
7.7 km
|
·
Water Quality Objectives (WQO)
·
Deposition Rate below 200 gm-2
day-1
|
|
Fish Fry Habitat
|
Pak Tso Wan
|
SR16b
|
< 1 km
|
< 1 km
|
< 1 km
|
< 1 km
|
Water Quality Objectives (WQO)
|
|
|
|
|
|
|
|
|
Water Quality Objectives (WQO) ;
except SS elevation below 50 mgL-1
|
|
|
|
|
|
|
|
|
Water Quality Objectives (WQO);
except SS elevation below 50 mgL-1
|
|
|
|
SR2
|
> 10 km
|
> 10 km
|
> 10 km
|
5.1 km
|
Water Quality Objectives (WQO)
|
|
Marine Ecological Resources
|
|
Seagrass Beds
|
Pak Nai
|
SR2
|
> 10 km
|
> 10 km
|
> 10 km
|
5.1 km
|
Water Quality Objectives (WQO)
|
|
|
Tung Chung
Bay
|
SR39
|
> 10 km
|
7.8 km
|
7.8 km
|
6.6 km
|
Water Quality Objectives (WQO)
|
|
Marine Park
|
Designated Sha Chau and Lung Kwu
Chau
|
SR6a
|
> 10 km
|
> 10 km
|
> 10 km
|
< 1 km
|
Water Quality Objectives (WQO)
|
|
|
SR6b
|
> 10 km
|
> 10 km
|
> 10 km
|
< 1 km
|
Water Quality Objectives (WQO)
|
|
|
SR6c
|
> 10 km
|
> 10 km
|
> 10 km
|
1.4 km
|
Water Quality Objectives (WQO)
|
|
|
SR6d
|
> 10 km
|
> 10 km
|
> 10 km
|
2.7 km
|
Water Quality Objectives (WQO)
|
|
|
Potential Southwest
Lantau Marine
Park
|
SR19a
|
> 10 km
|
6.2 km
|
6.2 km
|
< 1 km
|
Water Quality Objectives (WQO)
|
|
|
SR19b
|
> 10 km
|
6.5 km
|
6.3 km
|
< 1 km
|
Water Quality Objectives (WQO)
|
|
|
SR19c
|
7.8 km
|
5.5 km
|
5.3 km
|
< 1 km
|
Water Quality Objectives (WQO)
|
|
Intertidal Mudflats
|
Pak Nai
|
SR1
|
> 10 km
|
> 10 km
|
> 10 km
|
1.7 km
|
Water Quality Objectives (WQO)
|
|
|
Yi O
|
SR14
|
>10 km
|
5.6 km
|
5.1 km
|
1.7 km
|
Water Quality Objectives (WQO)
|
|
|
Shui Hau Wan
|
SR33
|
6.6 km
|
2.9 km
|
2.1 km
|
5.9 km
|
Water Quality Objectives (WQO)
|
|
Mangroves
|
Pak Nai
|
SR2
|
> 10 km
|
> 10 km
|
> 10 km
|
5.1 km
|
Water Quality Objectives (WQO)
|
|
|
Tung Chung
Bay
|
SR39
|
> 10 km
|
7.8 km
|
7.8 km
|
6.6 km
|
Water Quality Objectives (WQO)
|
|
|
Fan Lau Tung Wan
|
SR15b
|
7.05 km
|
3.9 km
|
3 km
|
1.8 km
|
Water Quality Objectives (WQO)
|
|
Horseshoe Crab Nursery Grounds
|
Pak Nai
|
SR1
|
> 10 km
|
> 10 km
|
> 10 km
|
1.7 km
|
Water Quality Objectives (WQO)
|
|
Sham Wat Wan
|
SR10
|
> 10 km
|
6.9km
|
6.9 km
|
2.3 km
|
Water Quality Objectives (WQO)
|
|
Tai O
|
SR12
|
> 10 km
|
5.7 km
|
5.7 km
|
1.9 km
|
Water Quality Objectives (WQO)
|
|
|
Yi O
|
SR14
|
>10 km
|
5.6 km
|
5.1 km
|
1.6 km
|
Water Quality Objectives (WQO)
|
|
|
Sha Lo Wan
|
SR18
|
> 10 km
|
7.7 km
|
7.7 km
|
3.1 km
|
Water Quality Objectives (WQO)
|
|
|
Tong Fuk Miu Wan
|
SR33
|
6.6 km
|
2.9 km
|
2.1 km
|
5.9 km
|
Water Quality Objectives (WQO)
|
|
|
Tung Chung
Bay
|
SR39
|
> 10 km
|
7.8 km
|
7.8 km
|
6.6 km
|
Water Quality Objectives (WQO)
|
|
Protection Zone
|
Chinese White Dolphin Protection
Zone in Mainland Waters
|
SR11
|
>10 km
|
>10 km
|
>10 km
|
4.2 km
|
Water Quality Objectives (WQO)
|
|
|
|
SR11a
|
>10 km
|
9.2 km
|
8.3 km
|
1.9 km
|
Water Quality Objectives (WQO)
|
|
|
|
SR11b
|
9.15 km
|
7.2 km
|
6. 5 km
|
1.9 km
|
Water Quality Objectives (WQO)
|
|
Subtidal Hard Bottom Habitat
(coral)
|
Southern Side of South
Soko
|
SR 31
|
370 m
|
1 km
|
1 km
|
< 1 km
|
·
Water Quality Objectives (WQO)
·
SS elevations below 10 mg L-1
·
Deposition rate below 200 g m-2
day-1
|
|
Water Quality Sensitive
Receivers
|
|
Others
|
|
Gazetted Beaches
|
Butterfly Beach
|
SR5c
|
>10 km
|
>10 km
|
>10 km
|
8.1 km
|
Water Quality Objectives (WQO)
|
|
|
Tuen Mun Beaches
|
SR5d
|
>10 km
|
>10 km
|
>10 km
|
>10 km
|
Water Quality Objectives (WQO)
|
|
|
Tong Fuk
|
SR34
|
7.8 km
|
4.4 km
|
4.4 km
|
6.9 km
|
Water Quality Objectives (WQO)
|
|
|
Upper Cheung
Sha Beach
|
SR35
|
8.93 km
|
5.9 km
|
5.9 km
|
8.0 km
|
Water Quality Objectives (WQO)
|
|
|
Lower Cheung
Sha Beach
|
SR36
|
9.8 km
|
7.2 km
|
7.2 km
|
8.9 km
|
Water Quality Objectives (WQO)
|
|
|
Pui O Wan
|
SR37
|
> 10 km
|
9.8 km
|
9.8 km
|
>10 km
|
Water Quality Objectives (WQO)
|
|
Non-gazetted Beaches
|
Lung Kwu Sheung Tan
|
SR5a
|
> 10 km
|
> 10 km
|
> 10 km
|
4.0 km
|
Water Quality Objectives (WQO)
|
|
|
Lung Kwu Tan
|
SR5b
|
> 10 km
|
> 10 km
|
> 10 km
|
4.7 km
|
Water Quality Objectives (WQO)
|
|
|
Fan Lau Sai Wan
|
SR15a
|
7.95 km
|
4.7 km
|
3.8 km
|
1.4 km
|
Water Quality Objectives (WQO)
|
|
|
Fan Lau Tung Wan
|
SR15b
|
7.05 km
|
3.9 km
|
3 km
|
1.8 km
|
Water Quality Objectives (WQO)
|
|
|
Tsin Yue Wan
|
SR15c
|
9.0 km
|
5.4 km
|
4.5 km
|
1.6 km
|
Water Quality Objectives (WQO)
|
|
Seawater Intakes
|
Black Point Power Station
|
SR4
|
> 10 km
|
> 10 km
|
> 10 km
|
< 1 km
|
·
Temperature between 17-32 °C
·
SS elevations less than 700 mg L-1
|
|
|
Castle
Peak Power Station
|
SR7a
|
> 10 km
|
> 10 km
|
> 10 km
|
4.1 km
|
·
Temperature between 17-32 °C
·
SS elevations less than 700 mg L-1
|
|
|
Tuen Mun Area 38
|
SR7b
|
>10 km
|
> 10 km
|
> 10 km
|
5.8 km
|
Water Quality Objectives (WQO)
|
|
|
Tuen Mun Flushing
Water
|
SR 7h
|
>10 km
|
> 10 km
|
> 10 km
|
9.67 km
|
WSD Water Quality Standards
|
|
|
Airport
|
SR7c
SR7d
SR7e
SR7f
|
>10 km
|
>
10 km
>
10 km
8.1
km
8.1 km
|
>
10 km
>
10 km
8.1
km
8.1 km
|
6.4
km
7.7
km
5.1
km
6.1 km
|
Water Quality Objectives (WQO)
|
|
|
Pumping Station at Tai Kwai Wan
|
SR7g
|
>10 km
|
> 10 km
|
> 10 km
|
> 10 km
|
Water Quality Objectives (WQO)
|
|
Notes:
1.
Distances are approximate and will depend on the final design of the
alignment of the submarine utilities which will be determined during the
detailed design stage.
2.
Refer to next two tables for the
details of the WQO criteria for SS and DO at each station.
|
Table 66.8 Ambient Level and WQO Allowable Increase
in SS at Sensitive Receivers (SRs) around Proposed LNG Terminal at South Soko
and Submarine Pipeline from South Soko to
Black Point
|
Sensitive Receiver
|
Name
|
ID
|
Respective EPD Monitoring Station
|
Relevant Depth
|
Suspended Solids
(mg L-1)
|
|
|
|
|
Annual
|
Dry
|
Wet
|
|
|
|
|
Ambient Level
|
WQO Allowable
Increase
|
Ambient Level
|
WQO Allowable
Increase
|
Ambient Level
|
WQO Allowable
Increase
|
|
Fisheries and Marine Ecological Sensitive Receivers
|
|
|
|
|
|
|
|
|
|
Fisheries
Resources
|
|
|
|
|
|
|
|
|
|
|
|
Spawning/Nursery Grounds
|
Fisheries
Spawning/Nursery Grounds in South Lantau
|
SR24,
27
|
SM20
|
Depth-averaged
|
22.2
|
6.7
|
23
|
6.9
|
18.3
|
5.5
|
|
|
Fisheries Spawning Ground in North Lantau
|
SR8
|
NM5
|
Depth-averaged
|
23.2
|
7
|
27.2
|
8.2
|
18.6
|
5.6
|
|
Artificial Reef Deployment Area
|
Sha Chau and Lung Kwu Chau
|
SR6e
|
NM5
|
Depth-averaged
|
23.2
|
7
|
27.2
|
8.2
|
18.6
|
5.6
|
|
|
Northeast Airport
|
SR7d
|
NM3
|
Depth-averaged
|
17
|
5.1
|
15.6
|
4.7
|
17.4
|
5.2
|
|
Fish Fry Habitat
|
Pak Tso Wan
|
SR16b
|
SM20
|
Depth-averaged
|
22.2
|
6.7
|
23
|
6.9
|
18.3
|
5.5
|
|
Fish Culture Zone
|
Cheung Sha Wan
|
SR38
|
NM3
|
Depth-averaged
|
17
|
N/A
|
15.6
|
N/A
|
17.4
|
N/A
|
|
|
Ma Wan
|
SR40a,
40b
|
SM13
|
Depth-averaged
|
15.7
|
N/A
|
15.8
|
N/A
|
13.1
|
N/A
|
|
Oyster Production Farm
|
Pak Nai
|
SR2
|
DM4
|
Surface 4
|
21.7
|
6.5
|
23.6
|
7.1
|
12
|
3.6
|
|
Marine
Ecological Resources
|
|
|
|
|
|
|
|
|
|
|
|
Seagrass Beds
|
Pak Nai
|
SR2
|
DM4
|
Surface 4
|
21.7
|
6.5
|
23.6
|
7.1
|
12
|
3.6
|
|
|
Tung Chung Bay
|
SR39
|
NM8
|
Surface 4
|
17.5
|
5.3
|
21.5
|
6.5
|
12
|
3.6
|
|
Marine Park
|
Designated Sha Chau and Lung Kwu Chau
|
SR6a-d
|
NM5
|
Depth-averaged
|
23.2
|
7
|
27.2
|
8.2
|
18.6
|
5.6
|
|
|
Potential Southwest Lantau
|
SR19a-c
|
NM8
|
Depth-averaged
|
28.3
|
8.5
|
29.7
|
8.9
|
21.7
|
6.5
|
|
Intertidal Mudflats
|
Pak Nai
|
SR1
|
DM4
|
Surface 4
|
21.7
|
6.5
|
23.6
|
7.1
|
12
|
3.6
|
|
|
Yi O
|
SR14
|
NM8
|
Surface 4
|
17.5
|
5.3
|
21.5
|
6.5
|
12
|
3.6
|
|
|
Shui Hau Wan
|
SR33
|
SM13
|
Surface 4
|
12
|
3.6
|
13
|
3.9
|
8.3
|
2.5
|
|
Mangroves
|
Pak Nai
|
SR2
|
DM4
|
Surface 4
|
21.7
|
6.5
|
23.6
|
7.1
|
12
|
3.6
|
|
|
Tung Chung Bay
|
SR39
|
NM8
|
Surface 4
|
17.5
|
5.3
|
21.5
|
6.5
|
12
|
3.6
|
|
|
Fan Lau
Tung Wan
|
SR15b
|
SM20
|
Surface 4
|
14
|
4.2
|
15
|
4.5
|
10
|
3
|
|
Horseshoe Crab Nursery Grounds
|
Pak Nai
|
SR1
|
DM4
|
Depth-averaged
|
32.4
|
9.7
|
32.2
|
9.7
|
19.9
|
6
|
|
|
Sham Wat Wan
|
SR10
|
NM8
|
Depth-averaged
|
28.3
|
8.5
|
29.7
|
8.9
|
21.7
|
6.5
|
|
|
Tai O
|
SR12
|
NM8
|
Depth-averaged
|
28.3
|
8.5
|
29.7
|
8.9
|
21.7
|
6.5
|
|
|
Yi O
|
SR14
|
NM8
|
Depth-averaged
|
28.3
|
8.5
|
29.7
|
8.9
|
21.7
|
6.5
|
|
|
Sha Lo Wan
|
SR18
|
NM6
|
Depth-averaged
|
20.8
|
6.2
|
25.9
|
7.8
|
16
|
4.8
|
|
|
Tong Fuk Miu Wan
|
SR33
|
SM13
|
Depth-averaged
|
15.7
|
4.7
|
15.8
|
4.8
|
13.1
|
3.9
|
|
|
Tung Chung Bay
|
SR39
|
NM8
|
Depth-averaged
|
28.3
|
8.5
|
29.7
|
8.9
|
21.7
|
6.5
|
|
Protection Zone
|
Chinese White Dolphin Protection Zone in Mainland Waters
|
SR11,
11a-b
|
NM8
|
Depth-averaged
|
28.3
|
8.5
|
29.7
|
8.9
|
21.7
|
6.5
|
|
Others
|
|
|
|
|
|
|
|
|
|
|
|
Gazetted Beaches
|
Butterfly Beach
|
SR5c
|
NM5
|
Depth-averaged
|
23.2
|
7
|
27.2
|
8.2
|
18.6
|
5.6
|
|
|
Tuen Mun Beaches
|
SR5d
|
NM3
|
Depth-averaged
|
17
|
5.1
|
15.6
|
4.7
|
17.4
|
5.2
|
|
|
Tong Fuk
|
SR34
|
SM13
|
Depth-averaged
|
15.7
|
4.7
|
15.8
|
4.8
|
13.1
|
3.9
|
|
|
Upper Cheung Sha Beach
|
SR35
|
SM13
|
Depth-averaged
|
15.7
|
4.7
|
15.8
|
4.8
|
13.1
|
3.9
|
|
|
Lower Cheung Sha Beach
|
SR36
|
SM13
|
Depth-averaged
|
15.7
|
4.7
|
15.8
|
4.8
|
13.1
|
3.9
|
|
|
Pui O Wan
|
SR37
|
SM13
|
Depth-averaged
|
15.7
|
4.7
|
15.8
|
4.8
|
13.1
|
3.9
|
|
Non-gazetted Beaches
|
Lung Kwu Sheung Tan
|
SR5a
|
NM5
|
Depth-averaged
|
23.2
|
7
|
27.2
|
8.2
|
18.6
|
5.6
|
|
|
Lung Kwu Tan
|
SR5b
|
NM5
|
Depth-averaged
|
23.2
|
7
|
27.2
|
8.2
|
18.6
|
5.6
|
|
|
Fan Lau Sai Wan
|
SR15a
|
SM20
|
Depth-averaged
|
22.2
|
6.7
|
23
|
6.9
|
18.3
|
5.5
|
|
|
Fan Lau Tung Wan
|
SR15b
|
SM20
|
Depth-averaged
|
22.2
|
6.7
|
23
|
6.9
|
18.3
|
5.5
|
|
|
Tsin Yue Wan
|
SR15c
|
SM20
|
Depth-averaged
|
22.2
|
6.7
|
23
|
6.9
|
18.3
|
5.5
|
|
Seawater Intakes
|
Tuen Mun Area 38
|
SR7b
|
NM3
|
Bottom
|
51
|
15.3
|
47.4
|
14.2
|
32.8
|
9.8
|
|
|
Airport
|
SR7c-f
|
NM6
|
Bottom
|
25.5
|
7.7
|
29.6
|
8.9
|
29.4
|
8.8
|
|
|
Pumping Station at Tai Kwai Wan
|
SR7g
|
SM17
|
Bottom
|
26
|
7.8
|
25
|
7.5
|
26.2
|
7.9
|
|
|
Tuen Mun WSD 5
|
SR7h
|
NM3
|
Bottom
|
51
|
N/A
|
47.4
|
N/A
|
32.8
|
N/A
|
|
Notes:
|
|
|
|
|
|
|
|
|
|
|
|
1. Ambient level is calculated as 90th percentile of the EPD
routine monitoring data (1996-2006) at respective EPD station close to the
WSRs.
2. Allowable increase is calculated as 30% of the ambient SS levels in
accordance with the WQO.
3. This table is applicable for those sensitive receivers which were
assessed against the WQO. “N/A”
denotes that the WQO is not applicable for the assessment and it should refer
to Section 6.2.4 for the specific
assessment criterion of SS for the other sensitive receivers.
4. These intertidal sensitive receivers occur at the water surface and
are in fact completely unsubmerged for a substantial proportion of the
time. Tidal range in Hong
Kong is 2.5 m and this is the maximum depth these sensitive
receivers would be submerged during the tidal cycle. It is considered that water quality
reflecting surface conditions is appropriate for these periodically submerged
sensitive receivers.
5.
Seawater is abstracted via a box
culvert of 1.38 m height situating at the seabed.
|
|
|
|
|
|
|
|
|
|
|
|
|
|
|
|
|
|
|
|
|
|
|
|
|
|
|
Table 66.9 Ambient Level and Allowable Increase in DO
at Sensitive Receivers (SRs) around Proposed LNG Terminal at South Soko and
Submarine Pipeline from South Soko to Black
Point
|
Sensitive Receiver
|
Name
|
ID
|
Respective EPD Monitoring Station
|
Relevant Depth
|
Dissolved Oxygen
(mg L-1)
|
|
|
|
|
Annual
|
Dry
|
Wet
|
|
|
|
|
Ambient Level
|
Allowable Change
|
Ambient Level
|
Allowable Change
|
Ambient Level
|
Allowable Change
|
|
Fisheries and Marine Ecological Sensitive Receivers
|
|
Fisheries
Resources
|
|
Spawning/Nursery Grounds
|
Fisheries
Spawning/Nursery Grounds in South Lantau
|
SR24,
27
|
SM20
|
Depth-averaged
|
8
|
-4
|
8.2
|
-4.2
|
7.8
|
-3.8
|
|
|
Fisheries Spawning Ground in North Lantau
|
SR8
|
NM5
|
Depth-averaged
|
8
|
-4
|
7.9
|
-3.9
|
6.8
|
-2.8
|
|
Artificial Reef Deployment Area
|
Sha Chau and Lung Kwu Chau
|
SR6e
|
NM5
|
Depth-averaged
|
8
|
-4
|
7.9
|
-3.9
|
6.8
|
-2.8
|
|
|
Northeast Airport
|
SR7d
|
NM3
|
Depth-averaged
|
5.8
|
-1.8
|
6.6
|
-2.6
|
5.2
|
-1.2
|
|
Fish Fry Habitat
|
Pak Tso Wan
|
SR16b
|
SM20
|
Depth-averaged
|
8
|
-4
|
8
|
-4
|
7.9
|
-3.9
|
|
Fish Culture Zone
|
Cheung Sha Wan
|
SR38
|
SM13
|
Depth-averaged
|
8
|
-3
|
7.8
|
-2.8
|
8.5
|
-3.5
|
|
|
Ma Wan
|
SR40a-b
|
NM3
|
Depth-averaged
|
5.8
|
-0.8
|
6.6
|
-1.6
|
5.2
|
-0.2
|
|
Oyster Production Farm
|
Pak Nai
|
SR2
|
SM20
|
Surface 5
|
7.6
|
-3.6
|
7.6
|
-3.6
|
7.3
|
-3.3
|
|
Marine
Ecological Resources
|
|
Seagrass Beds
|
Pak Nai
|
SR2
|
DM4
|
Surface 5
|
7.6
|
-3.6
|
7.6
|
-3.6
|
7.3
|
-3.3
|
|
|
Tung Chung Bay
|
SR39
|
NM8
|
Surface 5
|
7.9
|
-3.9
|
8
|
-4
|
7.9
|
-3.9
|
|
Marine Park
|
Designated Sha Chau and Lung Kwu Chau
|
SR6a-d
|
NM5
|
Depth-averaged
|
8
|
-4
|
7.9
|
-3.9
|
6.8
|
-2.8
|
|
|
Potential Southwest Lantau
|
SR19a-c
|
NM8
|
Depth-averaged
|
7.9
|
-3.9
|
8.0
|
-4.0
|
7.9
|
-3.9
|
|
Intertidal Mudflats
|
Pak Nai
|
SR1
|
DM4
|
Surface 5
|
7.6
|
-3.6
|
7.6
|
-3.6
|
7.3
|
-3.3
|
|
|
Yi O
|
SR14
|
NM8
|
Surface 5
|
7.9
|
-3.9
|
8.0
|
-4.0
|
7.9
|
-5.1
|
|
|
Shui Hau Wan
|
SR33
|
SM13
|
Surface 5
|
8.4
|
-4.4
|
7.8
|
-3.8
|
9.1
|
-5.1
|
|
Mangroves
|
Pak Nai
|
SR2
|
DM4
|
Surface 5
|
7.6
|
-3.6
|
7.6
|
-3.6
|
7.3
|
-3.3
|
|
|
Yi O
|
SR14
|
NM8
|
Surface 5
|
7.9
|
-3.9
|
8
|
-4.0
|
7.9
|
-3.9
|
|
|
Shui Hau Wan
|
SR33
|
SM13
|
Surface 5
|
8.4
|
-4.4
|
7.8
|
-3.8
|
9.1
|
-5.1
|
|
Horseshoe Crab Nursery Grounds
|
Pak Nai
|
SR1
|
DM4
|
Depth-averaged
|
7.5
|
-3.5
|
7.6
|
-3.6
|
7.3
|
-3.3
|
|
|
Sham Wat Wan
|
SR10
|
NM8
|
Depth-averaged
|
7.9
|
-3.9
|
8.0
|
-4.0
|
7.9
|
-3.9
|
|
|
Tai O
|
SR12
|
NM8
|
Depth-averaged
|
7.9
|
-3.9
|
8.0
|
-4.0
|
7.9
|
-3.9
|
|
|
Yi O
|
SR14
|
NM8
|
Depth-averaged
|
7.9
|
-3.9
|
8.0
|
-4.0
|
7.9
|
-3.9
|
|
|
Sha Lo Wan
|
SR18
|
NM6
|
Depth-averaged
|
8.1
|
-4.1
|
8.1
|
-4.1
|
8.0
|
-4.0
|
|
|
Tong Fuk Miu Wan
|
SR33
|
SM13
|
Depth-averaged
|
8.0
|
-4.1
|
7.8
|
-3.8
|
8.5
|
-4.5
|
|
|
Tung Chung Bay
|
SR39
|
NM8
|
Depth-averaged
|
7.9
|
-3.9
|
8.0
|
-4.0
|
7.9
|
-3.9
|
|
Protection Zone
|
Chinese White Dolphin Protection Zone in Mainland Waters
|
SR11,
11a-b
|
NM8
|
Depth-averaged
|
7.9
|
-3.9
|
8.0
|
-4.0
|
7.9
|
-3.9
|
|
Subtidal Hard Bottom Habitat (coral)
|
Southern Side of South Soko
|
SR31
|
SM20
|
Depth-averaged
|
8.0
|
-4.0
|
8.0
|
-4.0
|
7.9
|
-3.9
|
|
Water Quality Sensitive Receivers
|
|
Others
|
|
Gazetted Beaches
|
Butterfly Beach
|
SR5c
|
NM5
|
Depth-averaged
|
8.0
|
-4.0
|
7.9
|
-3.9
|
6.8
|
-2.8
|
|
|
Tuen Mun Beaches
|
SR5d
|
NM3
|
Depth-averaged
|
5.8
|
-1.8
|
6.6
|
-2.6
|
5.2
|
-1.2
|
|
|
Tong Fuk
|
SR34
|
SM13
|
Depth-averaged
|
8.0
|
-4.1
|
7.8
|
-3.8
|
8.5
|
-4.5
|
|
|
Upper Cheung Sha Beach
|
SR35
|
SM13
|
Depth-averaged
|
8.0
|
-4.1
|
7.8
|
-3.8
|
8.5
|
-4.5
|
|
|
Lower Cheung Sha Beach
|
SR36
|
SM13
|
Depth-averaged
|
8.0
|
-4.1
|
7.8
|
-3.8
|
8.5
|
-4.5
|
|
|
Pui O Wan
|
SR37
|
SM13
|
Depth-averaged
|
8.0
|
-4.1
|
7.8
|
-3.8
|
8.5
|
-4.5
|
|
Non-gazetted Beaches
|
Lung Kwu Sheung Tan
|
SR5a
|
NM5
|
Depth-averaged
|
8.0
|
-4.0
|
7.9
|
-3.9
|
6.8
|
-2.8
|
|
|
Lung Kwu Tan
|
SR5b
|
NM5
|
Depth-averaged
|
8.0
|
-4.0
|
7.9
|
-3.9
|
6.8
|
-2.8
|
|
|
Fan Lau Sai Wan
|
SR15a
|
SM20
|
Depth-averaged
|
8.0
|
-4.0
|
8.0
|
-4.0
|
7.9
|
-3.9
|
|
|
Fan Lau Tung Wan
|
SR15b
|
SM20
|
Depth-averaged
|
8.0
|
-4.0
|
8.0
|
-4.0
|
7.9
|
-3.9
|
|
|
Tsin Yue Wan
|
SR15c
|
SM20
|
Depth-averaged
|
8.0
|
-4.0
|
8.0
|
-4.0
|
7.9
|
-3.9
|
|
Seawater Intakes
|
Black Point Power Station
|
SR4
|
DM5
|
Bottom
|
7.3
|
-5.3
|
7.7
|
-5.7
|
6.5
|
-4.5
|
|
|
Castle Peak Power Station
|
SR7a
|
NM5
|
Bottom
|
8.0
|
-6.0
|
7.6
|
-5.6
|
6.2
|
-4.2
|
|
|
Tuen Mun Area 38
|
SR7b
|
NM5
|
Bottom
|
8.0
|
-6.0
|
7.6
|
-5.6
|
6.2
|
-4.2
|
|
|
Airport
|
SR7c-f
|
NM6
|
Bottom
|
8.2
|
-6.2
|
8.3
|
-6.3
|
7.6
|
-5.6
|
|
|
Pumping Station at Tai Kwai Wan
|
SR7g
|
SM17
|
Bottom
|
8.0
|
-6.0
|
8.0
|
-6.0
|
7.9
|
-5.9
|
|
|
Tuen Mun WSD 4
|
SR7h
|
NM3
|
Bottom
|
5.6
|
3.6
|
6.7
|
4.7
|
4.7
|
2.7
|
|
Notes:
|
|
1. Ambient level is calculated
as 90th percentile of the EPD routine monitoring data (1996-2006)
at respective EPD station close to the WSRs.
|
|
2. For depth-averaged, surface
layer and middle layer, allowable change is calculated as WQO criterion of 4
mg L-1 minus the ambient level.
|
|
3. For bottom layer, allowable
change is calculated as WQO criterion of 2 mg L-1 minus the
ambient level.
|
|
4. Tuen Mun WSD intake has a DO criterion of
more than 2 mg L-1.
Seawater is abstracted via a box culvert of 1.38 m height situating at
the seabed.
|
|
5. These intertidal sensitive
receivers occur at the water surface and are in fact completely unsubmerged
for a substantial proportion of the time.
Tidal range in Hong Kong is 2.5 m and
this is the maximum depth
these sensitive receivers would be submerged during the tidal cycle. It is considered that water quality reflecting
surface conditions is appropriate for these periodically submerged sensitive
receivers.
|
Fisheries Resources
The following fisheries resources
have been identified as water quality sensitive receivers:
·
Commercial Fisheries Spawning
Grounds/Nursery Areas;
·
Artificial Reef Deployment Sites;
·
Fish Culture Zone; and
·
Oyster Production.
Brief descriptions of these
sensitive receivers are presented below.
Commercial Fisheries
Spawning Grounds/Nursery Areas
The waters of South Lantau and
Northwest Lantau have been identified as important fisheries spawning/nursery
grounds for commercial fisheries in Hong Kong ([25]).
A recent study has shown that the marine waters near Pak Tso Wan in
South Soko support fish fry and hence this beach has been identified as a sensitive
receiver ([26]).
Recent findings from ichthyoplankton and fish fry baseline survey
undertaken as part of this EIA have indicated that the waters at Pak Tso Wan do
not appear to support fish fry abundances that are significantly different to
other sites in Hong Kong (see Part 2 – Section 10: Fisheries Impact
Assessment for further details).
To date there are no legislated
water quality standards for spawning and nursery grounds in Hong
Kong. Guideline values have
been identified for fisheries and selected marine ecological sensitive
receivers as part of the AFCD study, Consultancy
Study on Fisheries and Marine Ecological Criteria for Impact Assessment. (3) The AFCD study recommends a maximum SS
concentration of 50 mg L-1. Although
a maximum concentration value is recommended, the study acknowledges that
site-specific data should be considered on a case-by-case basis and hence the
WQOs are adopted in this Study as the assessment criteria for the grounds.
With regard to the water quality
modelling, impacts to these and other transitory or mobile sensitive receivers
were not plotted as discrete points, rather, an assessment of potential impacts
was undertaken through a review of the modelling results and is discussed
separately in the Fisheries Impact
Assessment (Part 2 - Section 10).
Artificial
Reef Deployment Sites
There are two gazetted Artificial
Reef Deployment Sites (ARs):
·
the Sha Chau and Lung Kwu Chau AR site
(situated within the Sha Chau and Lung
Kwu Chau Marine Park); and
·
the Airport AR site (located at the
northeast of the Hong Kong
International Airport)
(Figure
6.3).
The Sha Chau and Lung Kwu Chau AR
site and the Airport AR site are approximately 0.8 km and 8.3 km from proposed
pipeline alignment, respectively. The
ARs have been deployed to act as a fisheries resource enhancement tool, to
encourage growth and development of a variety of marine organisms, and to
provide feeding opportunities for the Indo-Pacific Humpback Dolphin (see Part 2 - Section 9: Marine Ecology
Assessment).
There is no specific water quality
criterion for the AR sites, thus the WQOs were adopted as assessment
criteria.
AR sites were treated as discrete
assessment points in the model.
Fish Culture Zones
There are two fish culture
zones (FCZs), which are Ma Wan North and East and Cheung Sha Wan, located
within the North Western waters and the Southern waters, respectively. These FCZs are each over 10 km from the
proposed terminal and pipeline. The only
Water Quality Objective (WQO) that is specific to FCZs is for dissolved oxygen,
which is set at no less than 5 mg L-1. In addition to dissolved oxygen, there is a
general water quality protection guideline for suspended solids (SS), which has
been proposed by AFCD.[27])The guideline requires that
the SS levels remain below 50 mg L-1.
There are two fish culture
zones (FCZs), which are Ma Wan North and East and Cheung Sha Wan, located
within the North Western waters and the Southern waters, respectively. These FCZs are each over 10 km from the
proposed terminal and pipeline. The only
Water Quality Objective (WQO) that is specific to FCZs is for dissolved oxygen,
which is set at no less than 5 mg L-1.
In addition to dissolved oxygen, there is a general water quality
protection guideline for suspended solids (SS), which has been proposed by
AFCD.[28])The
guideline requires that the SS levels remain below 50 mg L-1.
With regard to the water
quality modelling, the FCZs were regarded as discrete points for evaluation in
the assessment against the above criterion and guideline.
Oyster Production Area
There is an area of oyster
production along the coast of Deep Bay in Hong Kong
waters. The shallowness of Deep Bay as
a result of silt carried down from the Pearl River and typical estuarine
conditions within Deep
Bay enhances oyster
cultivation.
There is no specific water quality
criterion for an oyster production farm, thus water quality impacts have been
assessed with reference to the WQOs.
The
area was regarded as the nearest discrete point to the works site. If no non-compliances are found at the point,
it is assumed that there will be no impacts to the area beyond this point.
· Marine Ecological Resources
The following Marine Ecological
Resources have been identified as water quality sensitive receivers.
·
Marine Park;
·
Seagrass Beds, Mangroves, Intertidal
Mudflats and Horseshoe Crabs;
·
Chinese White Dolphin Protection Zone in
Mainland China;
and
·
Subtidal Hard Bottom Habitat.
Marine Park
The Sha Chau and Lung Kwu Chau Marine
Park, designated
specifically for the protection of the Indo-Pacific Humpback Dolphin (Sousa chinensis), lies within the study
area (Figure
6.3). Water quality impacts are compared to the WQO
for SS. For the water quality
assessment, discrete points have been plotted at a number of locations along
the boundaries of the Marine
Park which face the
proposed pipeline alignment. A potential
Marine Park
is located to the southwest of Lantau
Island.
Seagrass
Beds, Mangroves, Intertidal Mudflats & Horseshoe Crabs
Seagrass beds, mangroves, mudflats
and areas where horseshoe crabs are known to breed are identified (Figure 6.3).
There are no specific legislative water quality criteria for these
habitats and hence the WQO has been adopted. These habitats have been plotted
as discrete points for evaluation. Note
that SR2 is representative for the habitats at Pak Nai. If no impacts are determined at SR2, it is
assumed that the impacts will not occur beyond SR2.
Marine
Mammal Habitat
Of
the two resident Hong Kong marine mammal species, Chinese White Dolphins (also
called Indo-Pacific Humpback dolphins) have been recorded across all waters of
the Study Area from Deep Bay to South Lantau, whereas Finless Porpoises are
only recorded in the South Lantau part of the
Study Area. The baseline conditions and
ecological importance evaluated for these two species are elaborated in Part 2 – Section 9: Marine Ecology
Assessment.
Given
that the marine mammals are mobile within the Study Area, the habitat is not
plotted as a discrete point for evaluation; rather it is assessed through the
contour plots which show the mixing zones of the water quality assessment
parameters.
Chinese
White Dolphin Protection Zone in Mainland China
A Chinese White Dolphin Protection
Zone is located west of Lantau
Island, close to the Hong
Kong SAR boundary, in Mainland Chinese waters (Figure 6.3).
The closest boundary of the Protection Zone is approximately 8 km from
the proposed terminal at South Soko and approximately 0.8 km from the proposed
pipeline alignment. The Chinese White
Dolphin Protection Zone is identified as a sensitive receiver and has been
plotted as discrete points for evaluation in the water quality assessment. Water quality impacts are compared to the
WQOs.
Subtidal
Hard Bottom Habitat
Dive
surveys have been conducted at South Soko and
the results showed that hard corals were in low abundance and diversity (see Part 2 – Section 9: Marine Ecology
Assessment for further details). The
corals recorded during the dive surveys are all common Hong Kong species with
the exception of the relatively little known hard coral recorded on the southern coast of the South Soko
Island. The habitat has been plotted as a discrete
point ([29])
for evaluation in the water quality assessment and specific tolerance criteria
relevant to corals have been adopted.
·
Other Water Quality Sensitive Receivers
The following additional water quality
sensitive receivers have been identified and included in the assessment.
·
Bathing Beaches; and
·
Seawater Intakes.
Bathing
Beaches
There are several gazetted beaches
identified and a number of non-gazetted bathing beaches (Figure 6.3).
Gazetted beaches include the beaches at Tong Fuk, Cheung Sha and Tuen
Mun. Non-gazetted beaches are located at
Lung Kwu Tan and around Fan Lau. The
closest non-gazetted beach to the pipeline alignment is Fan Lau Sai Wan at a
distance of approximately 1 km. The
closest gazetted bathing beach is Tong Fuk at a distance of approximately 4.4
km from the water main and power cable.
Bathing beaches have been plotted as discrete points for evaluation in
the water quality assessment.
Water quality impacts at gazetted
and non-gazetted bathing beaches have been determined based on the compliance
with the WQOs (Table 6.1).
Seawater
Intakes
There are nine seawater intakes
identified as potential sensitive receivers, namely those at Black Point Power
Station, Castle Peak Power Station, Tuen Mun Area 38, Tuen Mun WSD and the
Airport and Tai Kwai Wan pumping station.
The intakes are situated submerged in the water near to the seabed.
The intakes have been plotted as
discrete points for evaluation in the water quality assessment.
6.4
Potential
Sources of Impact
Potential sources of impacts to
water quality as a result of the project may occur during both the construction
and operation phases.
6.4.1
Construction Phase
The main construction activities
associated with the proposed project that have the potential to cause impacts
to water quality involve the following:
·
Dredging and filling for seawall
enhancements for the LNG terminal at South Soko;
·
Filling for reclamation at the berths;
·
Dredging for the approach channel and
turning basin near the terminal for the LNG carrier;
·
Dredging and jetting for the installation
of the submarine gas pipeline connecting the LNG terminal at South
Soko to the power station at Black Point;
·
Dredging and jetting for the installation
of the submarine water main connecting the LNG terminal at South
Soko to Shek Pik Reservoir;
·
Jetting for the installation of the
submarine cable circuits connecting the LNG terminal at South
Soko to the electricity sub station at Shek Pik;
·
Piling for the jetty near the terminal for
LNG carriers;
·
Sewage discharges due to the on-site
workforce;
·
Site runoff including stockpiling of
excavated materials and pollutants entering the receiving waters and/or water
drainage system;
·
Hydrotest water discharges; and,
·
Oil spills due to accidental events.
6.4.2
Operational Phase
The potential impacts to water
quality arising from the operation of the LNG terminal have been identified as
follows:
·
Changes to the hydrodynamic regime through
the reclamation of the terminal site;
·
Maintenance dredging of the approach
channel and turning basin for the LNG carrier causing a temporary increase in
SS concentrations in the water column;
·
Discharge of cooled water from the
regasification process resulting in a decrease in temperature and the input of
antifoulants into the surrounding waters;
·
Storm water run-off from the terminal site;
·
Sewage discharges due to the operational
workforce;
·
Vessel discharges;
·
LNG spillage due to accidental events; and
·
Fuel spillage due to accidental events.
6.5
Water
Quality Impact Assessment Methodology
6.5.1
General Methodology
The methodology employed to assess
the above impacts is presented in the Water
Quality Method Statement (Annex 6A)
and has been based on the information presented in the Project Description (Part 2 -
Section 3).
Impacts
due to the dispersion of fine sediment in suspension during the construction of
the proposed LNG terminal and associated facilities have been assessed using
computational modelling. Mitigation
measures, as proposed in Section 6.8
such as the use of silt curtain, were assumed to be absent for modelling the
worst case scenario.
The
simulation of operational impacts on water quality has also been performed by
means of computational modelling. The
models have been used to simulate the effects of cooled water discharges on
temperature and water quality (due to antifoulants).
Full
details of the scenarios examined in the modelling works are provided in Annex 6A. As discussed previously, the water quality
sensitive receivers as well as the additional water quality modelling output
points in the vicinity of the proposed LNG terminal at South Soko Island and the submarine utilities are
presented in Figure
A2.1.
6.5.2
Uncertainties in the Assessment
Methodology
Uncertainties
in the assessment of the impacts from suspended sediment plumes should be
considered when drawing conclusions from the assessment. In carrying out the assessment, worse case
assumptions have been made in order to provide a conservative assessment of
environmental impacts. These assumptions
are as follows.
·
The assessment is based on the peak
dredging and filling rates. In reality,
these will only occur for short periods of time; and
·
The calculations of loss rates of sediment
to suspension are based on conservative estimates for the types of plant and
methods of working.
The
assumptions presented above allow a conservative approach to be applied to the
water quality assessment.
The
following uncertainties has not included in the modelling assessment:
·
Ad
hoc
navigation of marine traffic;
·
Near shore scouring of bottom sediment; and
·
Transits of marine barges to and from the
site.
It
is noted that the above present mechanisms through which minor localised and
short term changes in SS levels may occur during construction. Elevations of this type will be picked up and
monitored during the water quality monitoring programme for the construction
works which is presented in Section 6.10.
6.6
Construction Phase Water Quality
Impact Assessment
6.6.1
Suspended Sediment
The potential main impacts to water
quality arising from this project during the construction phase relate to
disturbances to the seabed and re-suspension of some marine sediment leading to
the potential for physio-chemical changes in the water column.
· Assessment
of Concurrent Construction Phase Activities
As discussed in the Water Quality Method Statement (Annex 6A),
during the construction phases, a number of marine activities have the
potential to occur simultaneously. The
locations of the marine activities are shown in Figure 6.5 and the indicative drawings for
each activity are illustrated in Figures 6.6 – 6.9.
In order to assess the potential
cumulative impacts to water quality as a result of activities running
concurrently, a total of 13 scenarios have been developed (Table 6.10). It should be
noted that of these 13 scenarios, SR4a and SR4b are variations of the same
construction activities, i.e., trailing suction hopper dredger versus closed
grab dredger.
The selected scenarios represent
periods during the construction programme when the maximum number of activities
may take place in close proximity at any given time. Such works include those associated with the
construction of the LNG terminal at South
Soko Island,
as well as the installation of the submarine pipeline (including the gas
receiving station) and utilities (i.e., water main and power cable). The construction programme and the
construction sequence for the marine works is shown in Part 2 - Annex 6A.
Note that the scenarios may not
occur in sequential order, for example, Scenario 1 may not necessarily be the
first batch of works to be performed whereas it is possible that Scenario 2
will be taken place prior to it.
Assessment of each scenario enables the examination of impacts due to
the concurrent activities. Whenever the
scenarios are compliant with the assessment criteria, the individual activities
are considered to be environmentally acceptable. When any non-compliances with the WQO or
specific assessment criteria are identified in the assessment, further
discussions on the activity(ies) that contribute to the exceedance will be
presented. Mitigation measures, if
deemed necessary, will also be recommended.
Data
were extracted from the modelling results to determine the predicted levels of
suspended sediment at each of the sensitive receivers. The maximum and mean elevations of SS at
relevant depths for the respective sensitive receivers are presented under each
scenario.
The determination of the
acceptability of any elevation in SS levels has been based on the WQO or
specific tolerance criteria. It should
be noted that elevations in the SS level due to concurrent operations have been
assessed as the maximum concentrations at water depths over a full 15 day
spring-neap tidal cycle in both the dry and wet season, as required by the EIA
Study Brief (ESB-126/2005).
In the following text, each scenario
shown in Table 6.10 will be discussed
in the subsequent paragraphs followed by a discussion of the results for the
gas pipeline installation works.
Table
66.10 Construction
Phase Scenarios to be examined in the Water Quality Impact Assessment for LNG
|
Scenario ID
|
Tasks
|
Details of Construction Activities
|
No. of Plant
|
Plant Type
|
Code
|
|
Scenario
1
|
Reclamation
Areas
|
Grab
Dredging underneath Seawall at Tung Wan (Area A)
|
1 no.
|
Grab
Dredger
|
SS
|
01
|
|
|
Reclamation
Areas
|
Grab Dredging underneath Seawall for
Western Berth at Sai Wan
(Area
B)
|
1 no.
|
Grab
Dredger
|
SS
|
02
|
|
|
Reclamation
Areas
|
Sand
filling Seawall Trench and Reclamation for the Western Berth
|
1 no.
|
Pelican
Barge
|
SS
|
32
|
|
Scenario
2
|
Submarine
Water Main
|
Grab
Dredging at South
Soko Shore
Approach
|
1 no.
|
Grab
Dredger
|
SS
|
06
|
|
|
Submarine
Water Main
|
Grab
Dredging at Shek
Pik Shore
Approach
|
1 no.
|
Grab
Dredger
|
SS
|
07
|
|
|
Submarine
Water Main
|
Grab
Dredging Waterway Crossing Sand Borrow Area & Marine Navigation Channel
|
1 no.
|
Grab
Dredger
|
SS
|
08
|
|
Scenario
3
|
Submarine
Water Main
|
Post
Trenching Jetting near South Soko
|
1 no.
|
Jetting
Machine
|
SS
|
09
|
|
|
Submarine
Water Main
|
Post
Trenching Jetting near Shek Pik
|
1 no.
|
Jetting
Machine
|
SS
|
10
|
|
Scenario
4a
|
Jetty
Box
|
Grab
Dredging at Jetty Box
|
1 no.
|
Grab
Dredger
|
SS
|
03
|
|
|
Approach
Channel and Turning
Basin
|
Grab
Dredging at Approach Channel & TB at Area C
|
1 no.
|
Grab
Dredger
|
SS
|
04a
|
|
|
Approach
Channel and Turning
Basin
|
Grab
Dredging at Approach Channel & TB at Area D
|
1 no.
|
Grab
Dredger
|
SS
|
05
|
|
Scenario
4b
|
Jetty
Box
|
Grab
Dredging at Jetty Box
|
1 no.
|
Grab
Dredger
|
SS
|
03
|
|
|
Approach
Channel and Turning
Basin
|
TSHD
Dredging at Approach Channel & TB at Area C
|
1 no.
|
TSHD
|
SS
|
04b
|
|
|
Approach
Channel and Turning
Basin
|
Grab
Dredging at Approach Channel & TB at Area D
|
1 no.
|
Grab
Dredger
|
SS
|
05
|
|
Scenario
5
|
Submarine
Cable Circuit
|
Submarine
Cable Installation by Direct Burying (Jetting)
|
1 no.
|
Jetting
Machine
|
SS
|
14
|
|
|
Submarine
Intake
|
Grab
Dredging under intake
|
1 no.
|
Grab
Dredger
|
SS
|
15
|
|
|
Cooled
Water Outfall
|
Grab
Dredging under outfall
|
1 no.
|
Grab Dredger
|
SS
|
28
|
|
Scenario
6
|
Gas
Receiving Station
|
Grab
Dredging at GRS
|
1 no.
|
Grab
Dredger
|
SS
|
29
|
|
|
Gas
Receiving Station
|
Grab
Dredging at GRS
|
1 no.
|
Grab
Dredger
|
SS
|
30
|
|
|
Gas
Receiving Station
|
Sand
filling Seawall Trench and Reclamation at GRS
|
1 no.
|
Pelican
Barge
|
SS
|
31
|
|
Scenario
7
|
Submarine
Gas Pipeline
|
Grab
Dredging at South
Soko Shore
Approach (KP 0 - KP 1)
|
1 no.
|
Grab
Dredger
|
SS
|
21
|
|
Scenario
8
|
Submarine
Gas Pipeline
|
TSHD
Dredging from Fan Lau Crossing to West Lantau
(KP 1 - KP 24.5)
|
1 no.
|
TSHD
|
SS
|
32
|
|
Scenario
9
|
Submarine
Gas Pipeline
|
Grab
Dredging from Northwest Lantau to Urmston Road
Crossing (KP 24.5 – KP 31)
|
3 nos.
|
Grab
Dredger
|
SS
|
33
|
|
Scenario
10
|
Submarine
Gas Pipeline
|
Grab
Dredging across Urmston Road
Crossing (KP31– KP 33.5)
|
1 no.
|
Grab
Dredger
|
SS
|
34
|
|
Scenario
11
|
Submarine
Gas Pipeline
|
Grab
Dredging at West of Black Point (KP33.5 – KP 37)
|
3 nos.
|
Grab
Dredger
|
SS
|
19
|
|
Scenario
12
|
Submarine
Gas Pipeline
|
Grab
Dredging at West of Black Point (KP 37 – KP 37.803)
|
1 no.
|
Grab
Dredger
|
SS
|
35
|
|
Scenario
13
|
Submarine
Gas Pipeline
|
Grab
Dredging at Black
Point Shore
Approach (KP37.803 - KP38.303)
|
1 no.
|
Grab
Dredger
|
SS
|
16
|
|
Notes:
1.
Grab dredger with a minimum 8m3
closed grab
2.
TSHD denotes
Trailing Suction Hopper Dredger with hopper capacity of 11,300m3.
3.
TB denotes Turning Basin.
4.
GRS denotes Gas
Receiving Station.
5.
KP in the
bracket denotes the distance point.
|
Scenario
1
Scenario 1 allows the assessment of
impacts through concurrent dredging works for the western berth at Sai Wan and
seawall modification works at Tung Wan lasting for about 45 days and
sandfilling for the seawall trench and reclamation lasting for about 15
days. There is no sandfilling works for
the seawall modification at Tung Wan.
Modelling results indicate that SS
elevations will be compliant with the WQO at all sensitive receivers in both
seasons (Table 6.11) with the
exception of SR16b (fish fry habitat at Pak Tso Wan).
Contour plots (Annex 6C) show the SS dispersion (> 5 mg L-1) due to
the dredging works at Sai Wan and Tung Wan will be confined to the dredging
area. It is predicted that a mean (over
15 days spring-neap cycle) depth-averaged SS level of > 5 mg L-1
with respect to dredging works at Tung Wan will occur within 200 m from the
source and maximum (over 15 days spring-neap cycle) depth-averaged SS level of
> 5 mg L-1 will take place within 500 m from the source.
The sediment plume extension due to
sandfilling for the seawall trench at the western berth would have a size of
less than 1 km from the source. The
sandfilling works will be carried out over a short duration (about a week) and
hence the impact to water quality would be in short-term. It is worth to note that in the model, the
reclamation for the western berth is assumed to be filled with marine sands
without deploying any mitigation measures to minimise the dispersion of SS such
as the preconstruction of a seawall. In
reality it is likely that a completed seawall will be in place during
reclamation and the filling works will be taken place behind the seawall. In addition, the seawall trench will be
filled with rocks instead of marine sand.
The tentative layout showing the seawall construction is illustrated in Figure 6.6a.
As a completed seawall will likely
be in place to a level above the high tide level during filling it will act as
an effective barrier against the ocean currents washing out the filling
materials. Therefore, the impact of sand
filling on the surrounding water and hence suspended solid elevations will be
substantially reduced from the levels determined from the model.
Impact
of SS elevations on fish fry habitat at Pak Tso Wan is discussed in the marine
ecology assessment (see Part 2 – Section
9: Marine Ecology Assessment).
Mitigation measures such as silt curtain (stand type) installed at Pak
Tso Wan are suggested to avoid any adverse impacts due to sandfilling works to
SR16b. Details will be discussed in Section 6.8.
Table
66.11 Predicted
SS Elevation (mg L-1) in Scenario 1
|
Sensitive Receiver
|
Name
|
ID
|
Relevant Water Depth (a)
|
Allowable Elevation
|
Predicted SS Elevation (mg L-1)
|
|
Dry
|
Wet
|
Dry
|
Wet
|
Dry
|
Wet
|
Dry
|
Wet
|
|
Max
|
Max
|
Mean
|
Mean
|
90%-tile
|
90%-tile
|
|
Protection Zone
|
Chinese White Dolphin Protection
Zone in Mainland Waters
|
SR11
|
a
|
8.9
|
6.5
|
0.1
|
0.1
|
0.0
|
0.0
|
0.0
|
0.0
|
|
Protection Zone
|
Chinese White Dolphin Protection
Zone in Mainland Waters
|
SR11a
|
a
|
8.9
|
6.5
|
0.1
|
0.1
|
0.0
|
0.0
|
0.0
|
0.0
|
|
Protection Zone
|
Chinese White Dolphin Protection
Zone in Mainland Waters
|
SR11b
|
a
|
8.9
|
6.5
|
0.1
|
0.1
|
0.0
|
0.0
|
0.1
|
0.1
|
|
Horseshoe Crab Nursery Grounds
|
Tai O
|
SR12
|
a
|
8.9
|
6.5
|
0.0
|
0.0
|
0.0
|
0.0
|
0.0
|
0.0
|
|
Intertidal Mudflats
|
Yi O
|
SR14
|
s
|
6.5
|
3.6
|
0.0
|
0.0
|
0.0
|
0.0
|
0.0
|
0.0
|
|
Horseshoe Crab Nursery Grounds
|
Yi O
|
SR14
|
a
|
8.9
|
6.5
|
0.0
|
0.1
|
0.0
|
0.0
|
0.0
|
0.0
|
|
Non-gazetted Beaches
|
Fan Lau Sai Wan
|
SR15a
|
a
|
6.9
|
5.5
|
0.0
|
0.1
|
0.0
|
0.0
|
0.0
|
0.0
|
|
Mangroves
|
Fan Lau Tung Wan
|
SR15b
|
s
|
4.5
|
3
|
0.0
|
0.0
|
0.0
|
0.0
|
0.0
|
0.0
|
|
Non-gazetted Beaches
|
Fan Lau Tung Wan
|
SR15b
|
a
|
6.9
|
5.5
|
0.0
|
0.1
|
0.0
|
0.0
|
0.0
|
0.0
|
|
Non-gazetted Beaches
|
Tsin Yue Wan
|
SR15c
|
a
|
6.9
|
5.5
|
0.0
|
0.0
|
0.0
|
0.0
|
0.0
|
0.0
|
|
Fish Fry Habitat
|
Pak Tso Wan
|
SR16b
|
a
|
6.9
|
5.5
|
22.9
(c)
|
36.8
(c)
|
5.0
|
8.9
|
11.0
|
19.1
|
|
Horseshoe Crab Nursery Grounds
|
Sha Lo Wan
|
SR18
|
a
|
7.8
|
4.8
|
0.0
|
0.0
|
0.0
|
0.0
|
0.0
|
0.0
|
|
Spawning/Nursery Grounds
|
Fisheries Spawning/Nursery Grounds
in South Lantau
|
SR24
|
a
|
6.9
|
5.5
|
0.6
|
0.4
|
0.1
|
0.1
|
0.2
|
0.1
|
|
Spawning/Nursery Grounds
|
Fisheries Spawning/Nursery Grounds
in South Lantau
|
SR27
|
a
|
6.9
|
5.5
|
2.5
|
2.6
|
0.3
|
0.5
|
0.6
|
1.4
|
|
Subtidal Hard Bottom Habitat
(coral)
|
Southern Side of South
Soko
|
SR31
|
a
|
10
(b)
|
10
(b)
|
2.9
|
1.6
|
0.7
|
0.3
|
1.5
|
0.6
|
|
Intertidal Mudflats
|
Shui Hau Wan
|
SR33
|
s
|
3.9
|
2.5
|
0.0
|
0.0
|
0.0
|
0.0
|
0.0
|
0.0
|
|
Horseshoe Crab Nursery Grounds
|
Tong Fuk Miu Wan
|
SR33
|
a
|
4.8
|
3.9
|
0.0
|
0.0
|
0.0
|
0.0
|
0.0
|
0.0
|
|
Gazetted Beaches
|
Tong Fuk
|
SR34
|
a
|
4.8
|
3.9
|
0.0
|
0.0
|
0.0
|
0.0
|
0.0
|
0.0
|
|
Gazetted Beaches
|
Upper Cheung
Sha Beach
|
SR35
|
a
|
4.8
|
3.9
|
0.0
|
0.0
|
0.0
|
0.0
|
0.0
|
0.0
|
|
Seagrass Beds/Mangroves
|
Tung Chung
Bay
|
SR39
|
s
|
6.5
|
3.6
|
0.0
|
0.0
|
0.0
|
0.0
|
0.0
|
0.0
|
|
Horseshoe Crab Nursery Grounds
|
Tung Chung
Bay
|
SR39
|
a
|
8.9
|
6.5
|
0.0
|
0.0
|
0.0
|
0.0
|
0.0
|
0.0
|
|
Notes:
a. s
= surface, m = middle, b = bottom, a = depth-averaged
b. The
tolerance assessment criterion of 10 mg L-1 was adopted for the
coral.
c.
Shaded area indicates
non-compliance with the assessment criterion.
|
|
|
|
8.9
|
6.5
|
|
|
|
|
|
|
|
|
|
|
|
|
|
|
Scenario 2
Scenario 2 allows the assessment of
impacts through concurrent dredging works for the South
Soko and Shek Pik shore approach and crossings of the sand borrow
area and marine navigation channel. All
the dredging works at the three areas will be carried out by a closed grab
dredger and will last for less than 3 months.
Modelling results indicate that SS
elevations will be compliant with the WQO at all sensitive receivers in both
seasons (Table 6.12) with the
exception of SR16b (fish fry habitat at Pak Tso Wan).
As
seen from the contour plots (Annex 6C),
a sediment plume of > 5 mg L-1 (maximum over a complete
sprint-neap cycle at any depth during both seasons) would constitute < 2.3%
of south Lantau fisheries spawning/nursery ground (22,000 ha). In view of the relatively limited spread of
SS due to the dredging works, the detailed fisheries assessment (see Section 10: Fisheries Impact Assessment)
concludes that unacceptable impacts on the fisheries area would not arise.
Mitigation
measures have been suggested to avoid any adverse impacts of the dredging works
to SR16b. Details will be discussed in Section 6.8.
Table
66.12 Predicted
SS Elevation (mg L-1) in Scenario 2
|
Sensitive Receiver
|
Name
|
ID
|
Relevant Water Depth (a)
|
Allowable Elevation
|
Predicted SS Elevation (mg L-1)
|
|
Dry
|
Wet
|
Dry
|
Wet
|
Dry
|
Wet
|
Dry
|
Wet
|
|
Max
|
Max
|
Mean
|
Mean
|
90%-tile
|
90%-tile
|
|
Protection Zone
|
Chinese White Dolphin Protection
Zone in Mainland Waters
|
SR11
|
a
|
8.9
|
6.5
|
0.0
|
0.0
|
0.0
|
0.0
|
0.0
|
0.0
|
|
Protection Zone
|
Chinese White Dolphin Protection
Zone in Mainland Waters
|
SR11a
|
a
|
8.9
|
6.5
|
0.0
|
0.0
|
0.0
|
0.0
|
0.0
|
0.0
|
|
Protection Zone
|
Chinese White Dolphin Protection
Zone in Mainland Waters
|
SR11b
|
a
|
8.9
|
6.5
|
0.0
|
0.1
|
0.0
|
0.0
|
0.0
|
0.0
|
|
Horseshoe Crab Nursery Grounds
|
Tai O
|
SR12
|
a
|
8.9
|
6.5
|
0.0
|
0.0
|
0.0
|
0.0
|
0.0
|
0.0
|
|
Intertidal Mudflats
|
Yi O
|
SR14
|
s
|
6.5
|
3.6
|
0.0
|
0.0
|
0.0
|
0.0
|
0.0
|
0.0
|
|
Horseshoe Crab Nursery Grounds
|
Yi O
|
SR14
|
a
|
8.9
|
6.5
|
0.0
|
0.0
|
0.0
|
0.0
|
0.0
|
0.0
|
|
Non-gazetted Beaches
|
Fan Lau Sai Wan
|
SR15a
|
a
|
6.9
|
5.5
|
0.1
|
0.1
|
0.0
|
0.0
|
0.0
|
0.0
|
|
Mangroves
|
Fan Lau Tung Wan
|
SR15b
|
s
|
4.5
|
3
|
0.1
|
0.0
|
0.0
|
0.0
|
0.0
|
0.0
|
|
Non-gazetted Beaches
|
Fan Lau Tung Wan
|
SR15b
|
a
|
6.9
|
5.5
|
0.2
|
0.1
|
0.0
|
0.0
|
0.0
|
0.0
|
|
Non-gazetted Beaches
|
Tsin Yue Wan
|
SR15c
|
a
|
6.9
|
5.5
|
0.1
|
0.1
|
0.0
|
0.0
|
0.1
|
0.0
|
|
Fish Fry Habitat
|
Pak Tso Wan
|
SR16b
|
a
|
6.9
|
5.5
|
16.2
(c)
|
15.5
(c)
|
1.6
|
3.1
|
4.4
|
7.8
(c)
|
|
Horseshoe Crab Nursery Grounds
|
Sha Lo Wan
|
SR18
|
a
|
7.8
|
4.8
|
0.0
|
0.0
|
0.0
|
0.0
|
0.0
|
0.0
|
|
Spawning/Nursery Grounds
|
Fisheries Spawning/Nursery Grounds
in South Lantau
|
SR24
|
a
|
6.9
|
5.5
|
2.5
|
1.1
|
0.1
|
0.1
|
0.2
|
0.2
|
|
Spawning/Nursery Grounds
|
Fisheries Spawning/Nursery Grounds
in South Lantau
|
SR27
|
a
|
6.9
|
5.5
|
0.8
|
0.4
|
0.0
|
0.0
|
0.1
|
0.1
|
|
Subtidal Hard Bottom Habitat
(coral)
|
Southern Side of South
Soko
|
SR31
|
a
|
10
(b)
|
10
(b)
|
0.2
|
0.2
|
0.0
|
0.0
|
0.1
|
0.0
|
|
Intertidal Mudflats
|
Shui Hau Wan
|
SR33
|
s
|
3.9
|
2.5
|
0.0
|
0.0
|
0.0
|
0.0
|
0.0
|
0.0
|
|
Horseshoe Crab Nursery Grounds
|
Tong Fuk Miu Wan
|
SR33
|
a
|
4.8
|
3.9
|
0.0
|
0.0
|
0.0
|
0.0
|
0.0
|
0.0
|
|
Gazetted Beaches
|
Tong Fuk
|
SR34
|
a
|
4.8
|
3.9
|
0.0
|
0.0
|
0.0
|
0.0
|
0.0
|
0.0
|
|
Gazetted Beaches
|
Upper Cheung
Sha Beach
|
SR35
|
a
|
4.8
|
3.9
|
0.0
|
0.0
|
0.0
|
0.0
|
0.0
|
0.0
|
|
Seagrass Beds/Mangroves
|
Tung Chung
Bay
|
SR39
|
s
|
6.5
|
3.6
|
0.0
|
0.0
|
0.0
|
0.0
|
0.0
|
0.0
|
|
Horseshoe Crab Nursery Grounds
|
Tung Chung
Bay
|
SR39
|
a
|
8.9
|
6.5
|
0.0
|
0.0
|
0.0
|
0.0
|
0.0
|
0.0
|
|
Notes:
1. s
= surface, m = middle, b = bottom, a = depth-averaged
2. The
tolerance assessment criterion of 10 mg L-1 was adopted for the
coral.
3. Shaded
area indicates non-compliance with the assessment criterion.
|
Scenario
3
Scenario
3 assesses the impacts due to post trenching jetting near South
Soko and Shek Pik. The
jetting works ([30]) at these two areas are unlikely to be carried
out simultaneously and the works will probably be conducted sequentially (each
of which will last for less than 15 days).
Thus Scenario 3 is regarded as a highly conservative case.
Modelling results indicate that SS
elevations will be compliant with the WQO in both seasons (Table 6.13) with exception of SR16b (fish fry habitat at Pak Tso
Wan).
Though the maximum depth-averaged SS
at SR16b is predicted to be above the tolerance criterion in both seasons, the
90th percentile SS is well below the criterion. As shown by the time-series plots (Annex 6C) several peaks for exceedances
are observed and this suggests that the impact to the fish fry habitat is
instantaneous rather than continuous. In
addition, the jetting works will only last for approximately half a month and
hence the impact to the fish fry habitat would be temporary. Hence, it is anticipated that the short-term
exceedances would not cause any unacceptable impacts to the habitat.
From
contour plots (Annex 6C), it could be
seen that the sediment plume of > 5 mg L-1 (maximum bottom SS
elevation per day) is expected to constitute < 4.9% (jetting near Shek Pik)
to < 5.3% (jetting near South Soko Island) of south Lantau fisheries
spawning/nursery area (22,000 ha). The
two plumes at Shek Pik and South Soko will not
overlap with each other. It can be
concluded that the spread of SS will be minimal and if any exceedances do arise
they will be of a short duration. It is
concluded in the detailed fisheries assessment (see Part 2 – Section 10: Fisheries Impact Assessment) that this limited
sediment plume would not attribute to unacceptable impacts in the fisheries
area.
Mitigation
measures have been suggested to avoid any adverse impacts from jetting works to
SR16b. Details will be discussed in Section 6.8.
Table
66.13 Predicted
SS Elevation (mg L-1) in Scenario 3
|
Sensitive Receiver
|
Name
|
ID
|
Relevant Water Depth (a)
|
Allowable Elevation
|
Predicted SS Elevation (mg L-1)
|
|
Dry
|
Wet
|
Dry
|
Wet
|
Dry
|
Wet
|
Dry
|
Wet
|
|
Max
|
Max
|
Mean
|
Mean
|
90%-tile
|
90%-tile
|
|
Protection Zone
|
Chinese White Dolphin Protection
Zone in Mainland Waters
|
SR11
|
a
|
8.9
|
6.5
|
0.1
|
0.0
|
0.0
|
0.0
|
0.0
|
0.0
|
|
Protection Zone
|
Chinese White Dolphin Protection
Zone in Mainland Waters
|
SR11a
|
a
|
8.9
|
6.5
|
0.1
|
0.0
|
0.0
|
0.0
|
0.1
|
0.0
|
|
Protection Zone
|
Chinese White Dolphin Protection
Zone in Mainland Waters
|
SR11b
|
a
|
8.9
|
6.5
|
0.3
|
0.1
|
0.0
|
0.0
|
0.1
|
0.0
|
|
Horseshoe Crab Nursery Grounds
|
Tai O
|
SR12
|
a
|
8.9
|
6.5
|
0.1
|
0.0
|
0.0
|
0.0
|
0.0
|
0.0
|
|
Intertidal Mudflats
|
Yi O
|
SR14
|
s
|
6.5
|
3.6
|
0.1
|
0.0
|
0.0
|
0.0
|
0.0
|
0.0
|
|
Horseshoe Crab Nursery Grounds
|
Yi O
|
SR14
|
a
|
8.9
|
6.5
|
0.1
|
0.0
|
0.0
|
0.0
|
0.0
|
0.0
|
|
Non-gazetted Beaches
|
Fan Lau Sai Wan
|
SR15a
|
a
|
6.9
|
5.5
|
0.1
|
0.0
|
0.0
|
0.0
|
0.1
|
0.0
|
|
Mangroves
|
Fan Lau Tung Wan
|
SR15b
|
s
|
4.5
|
3
|
1.6
|
0.0
|
0.1
|
0.0
|
0.2
|
0.0
|
|
Non-gazetted Beaches
|
Fan Lau Tung Wan
|
SR15b
|
a
|
6.9
|
5.5
|
2.3
|
0.1
|
0.1
|
0.0
|
0.3
|
0.0
|
|
Non-gazetted Beaches
|
Tsin Yue Wan
|
SR15c
|
a
|
6.9
|
5.5
|
0.2
|
0.0
|
0.0
|
0.0
|
0.1
|
0.0
|
|
Fish Fry Habitat
|
Pak Tso Wan
|
SR16b
|
a
|
6.9
|
5.5
|
36.1
(c)
|
57.4
(c)
|
0.7
|
1.2
|
1.4
|
0.5
|
|
Horseshoe Crab Nursery Grounds
|
Sha Lo Wan
|
SR18
|
a
|
7.8
|
4.8
|
0.0
|
0.0
|
0.0
|
0.0
|
0.0
|
0.0
|
|
Spawning/Nursery Grounds
|
Fisheries Spawning/Nursery Grounds
in South Lantau
|
SR24
|
a
|
6.9
|
5.5
|
0.2
|
0.1
|
0.0
|
0.0
|
0.1
|
0.0
|
|
Spawning/Nursery Grounds
|
Fisheries Spawning/Nursery Grounds
in South Lantau
|
SR27
|
a
|
6.9
|
5.5
|
2.5
|
2.6
|
0.1
|
0.1
|
0.2
|
0.1
|
|
Subtidal Hard Bottom Habitat
(coral)
|
Southern Side of South
Soko
|
SR31
|
a
|
10
(b)
|
10
(b)
|
3.7
|
2.3
|
0.1
|
0.0
|
0.3
|
0.1
|
|
Intertidal Mudflats
|
Shui Hau Wan
|
SR33
|
s
|
3.9
|
2.5
|
0.0
|
0.0
|
0.0
|
0.0
|
0.0
|
0.0
|
|
Horseshoe Crab Nursery Grounds
|
Tong Fuk Miu Wan
|
SR33
|
a
|
4.8
|
3.9
|
0.0
|
0.0
|
0.0
|
0.0
|
0.0
|
0.0
|
|
Gazetted Beaches
|
Tong Fuk
|
SR34
|
a
|
4.8
|
3.9
|
0.0
|
0.0
|
0.0
|
0.0
|
0.0
|
0.0
|
|
Gazetted Beaches
|
Upper Cheung
Sha Beach
|
SR35
|
a
|
4.8
|
3.9
|
0.0
|
0.0
|
0.0
|
0.0
|
0.0
|
0.0
|
|
Seagrass Beds/Mangroves
|
Tung Chung
Bay
|
SR39
|
s
|
6.5
|
3.6
|
0.0
|
0.0
|
0.0
|
0.0
|
0.0
|
0.0
|
|
Horseshoe Crab Nursery Grounds
|
Tung Chung
Bay
|
SR39
|
a
|
8.9
|
6.5
|
0.0
|
0.0
|
0.0
|
0.0
|
0.0
|
0.0
|
|
Notes:
a. s
= surface, m = middle, b = bottom, a = depth-averaged
b. The
tolerance assessment criterion of 10 mg L-1 was adopted for the
coral.
c. Shaded
area indicates non-compliance with the assessment criterion.
|
Scenario 4a
Scenario 4a examined the impacts due
to concurrent dredging works at the approach channel and turning basin which
would last for about 3 months. All
dredging works have been modelled assuming the use of grab dredgers which is
thereafter regarded as “Case 1” for the dredging at the approach channel and
turning basin.
Modelling results indicate that SS
elevations will be compliant with the WQO and tolerance criterion at most
sensitive receivers in both seasons (Table
6.14), with the exception of SR31, i.e., subtidal hard bottom habitat
(coral).
Though the maximum depth-averaged SS
at SR31 is predicted to marginally exceed the tolerance criterion of 10 mg L-1
in the dry season, the 90th percentile SS is well below the
criterion.
It should be noted that the sediment
release due to the grab dredging at the approach channel was modelled to be
stationary and close to the shore in order to look into the most conservative
case. In reality, the grab dredger will
move around within the approach channel and off shore turning basin. Hence, the SS elevations at SR 31 will be
much less than the predicted value.
It is also worth noting that the
dredging works at the main jetty may be combined with that for Area C. In other words, a grab dredger would be
mobilised for dredging the main jetty followed by dredging at Area C. If this is the case, there would be only two
grab dredgers on site and not three as modelled.
Mitigation
measures such as deployment of a silt curtain (stand type) surrounding the
coral habitat have been suggested to avoid any adverse impacts of dredging
works to SR31. Details will be discussed
in Section 6.8.
The
sediment plume of > 5 mg L-1 (maximum over a complete spring-neap
cycle at any depth during both seasons) is expected to constitute < 2.1% of
the spawning/nursery ground (Annex 6C). The detailed fisheries assessment (see Part 2 – Section 10: Fisheries Impact
Assessment) concludes that this limited spread of sediment in the fisheries
area would not cause any unacceptable impacts.
Scenario
4b
An alternative to Scenario 4a is to
dredge the approach channel and turning basin using a Trailing Suction Hopper
Dredger (TSHD) which is thereafter regarded as “Case 2” for the dredging at the
approach channel and turning basin which would last for less than 3
months. This has been modelled as
Scenario 4b. The other assumptions
modelled in Scenario 4a remain the same.
Modelling results indicate that SS
elevations will be compliant with the WQO and tolerance criterion at most
sensitive receivers in both seasons (Table
6.15) with the exception of SR31, i.e., subtidal hard bottom habitat
(coral).
Though the maximum depth-averaged SS
at SR31 is predicted to marginally exceed the tolerance criterion of 10 mg L-1
in both seasons, the 90th percentile SS is well below the
criterion. The exceedances are likely
due to the dredging at the approach channel and turning basin. As aforesaid, the sediment release due to the
grab dredging at the approach channel was modelled to be stationary and close
to the shore in order to look into the most conservative case. In reality, the grab dredger will move around
within the approach channel and off shore turning basin. Hence, the SS elevations at SR 31 will be
much less than the predicted value.
Mitigation
measures have been suggested to avoid any adverse impacts of dredging works to
SR31. Details will be discussed in Section 6.8.
The
sediment plume of > 5 mg L-1 (maximum bottom SS elevation per
day) is expected to constitute < 3.7% of the fisheries spawning/nursery ground
in south Lantau (Annex 6C). The detailed fisheries assessment (see Part 2 – Section 10: Fisheries Impact
Assessment) concludes that this limited spread of sediment in the fisheries
area would not cause any unacceptable impacts.
Table
6.14 Predicted SS Elevation (mgL-1) in
Scenario 4a
Table 6.14 Predicted
SS Elevation (mg L-1) in Scenario 4a
|
Sensitive Receiver
|
Name
|
ID
|
Relevant Water Depth (a)
|
Allowable Elevation
|
Predicted SS Elevation (mg L-1)
|
|
Dry
|
Wet
|
Dry
|
Wet
|
Dry
|
Wet
|
Dry
|
Wet
|
|
Max
|
Max
|
Mean
|
Mean
|
90%-tile
|
90%-tile
|
|
Protection Zone
|
Chinese White Dolphin Protection
Zone in Mainland Waters
|
SR11
|
a
|
8.9
|
6.5
|
0.1
|
0.0
|
0.0
|
0.0
|
0.0
|
0.0
|
|
Protection Zone
|
Chinese White Dolphin Protection
Zone in Mainland Waters
|
SR11a
|
a
|
8.9
|
6.5
|
0.1
|
0.0
|
0.0
|
0.0
|
0.1
|
0.0
|
|
Protection Zone
|
Chinese White Dolphin Protection
Zone in Mainland Waters
|
SR11b
|
a
|
8.9
|
6.5
|
0.1
|
0.0
|
0.0
|
0.0
|
0.1
|
0.0
|
|
Horseshoe Crab Nursery Grounds
|
Tai O
|
SR12
|
a
|
8.9
|
6.5
|
0.1
|
0.1
|
0.0
|
0.0
|
0.0
|
0.0
|
|
Intertidal Mudflats
|
Yi O
|
SR14
|
s
|
6.5
|
3.6
|
0.1
|
0.0
|
0.0
|
0.0
|
0.0
|
0.0
|
|
Horseshoe Crab Nursery Grounds
|
Yi O
|
SR14
|
a
|
8.9
|
6.5
|
0.1
|
0.0
|
0.0
|
0.0
|
0.0
|
0.0
|
|
Non-gazetted Beaches
|
Fan Lau Sai Wan
|
SR15a
|
a
|
6.9
|
5.5
|
0.0
|
0.0
|
0.0
|
0.0
|
0.0
|
0.0
|
|
Mangroves
|
Fan Lau Tung Wan
|
SR15b
|
s
|
4.5
|
3
|
0.0
|
0.0
|
0.0
|
0.0
|
0.0
|
0.0
|
|
Non-gazetted Beaches
|
Fan Lau Tung Wan
|
SR15b
|
a
|
6.9
|
5.5
|
0.0
|
0.0
|
0.0
|
0.0
|
0.0
|
0.0
|
|
Non-gazetted Beaches
|
Tsin Yue Wan
|
SR15c
|
a
|
6.9
|
5.5
|
0.0
|
0.0
|
0.0
|
0.0
|
0.0
|
0.0
|
|
Fish Fry Habitat
|
Pak Tso Wan
|
SR16b
|
a
|
6.9
|
5.5
|
0.3
|
0.2
|
0.1
|
0.0
|
0.1
|
0.1
|
|
Horseshoe Crab Nursery Grounds
|
Sha Lo Wan
|
SR18
|
a
|
7.8
|
4.8
|
0.1
|
0.0
|
0.0
|
0.0
|
0.0
|
0.0
|
|
Spawning/Nursery Grounds
|
Fisheries Spawning/Nursery Grounds
in South Lantau
|
SR24
|
a
|
6.9
|
5.5
|
0.2
|
0.1
|
0.0
|
0.0
|
0.0
|
0.0
|
|
Spawning/Nursery Grounds
|
Fisheries Spawning/Nursery Grounds
in South Lantau
|
SR27
|
a
|
6.9
|
5.5
|
0.2
|
0.2
|
0.0
|
0.0
|
0.1
|
0.1
|
|
Subtidal Hard Bottom Habitat
(coral)
|
Southern Side of South
Soko
|
SR31
|
a
|
10
(b)
|
10
(b)
|
15.5
4, 5
|
10.0
|
5.0
|
3.7
|
8.3
|
6.0
|
|
Intertidal Mudflats
|
Shui Hau Wan
|
SR33
|
s
|
3.9
|
2.5
|
0.0
|
0.0
|
0.0
|
0.0
|
0.0
|
0.0
|
|
Horseshoe Crab Nursery Grounds
|
Tong Fuk Miu Wan
|
SR33
|
a
|
4.8
|
3.9
|
0.0
|
0.0
|
0.0
|
0.0
|
0.0
|
0.0
|
|
Gazetted Beaches
|
Tong Fuk
|
SR34
|
a
|
4.8
|
3.9
|
0.0
|
0.0
|
0.0
|
0.0
|
0.0
|
0.0
|
|
Gazetted Beaches
|
Upper Cheung
Sha Beach
|
SR35
|
a
|
8.9
|
6.5
|
0.0
|
0.0
|
0.0
|
0.0
|
0.0
|
0.0
|
|
Seagrass Beds/Mangroves
|
Tung Chung
Bay
|
SR39
|
s
|
8.9
|
6.5
|
0.0
|
0.0
|
0.0
|
0.0
|
0.0
|
0.0
|
|
Horseshoe Crab Nursery Grounds
|
Tung Chung
Bay
|
SR39
|
a
|
8.9
|
6.5
|
0.0
|
0.0
|
0.0
|
0.0
|
0.0
|
0.0
|
|
Notes:
·
s = surface, m = middle, b =
bottom, a = depth-averaged
·
The tolerance assessment criterion
of 10 mg L-1 was adopted for the coral.
·
Shaded area indicates non-compliance
with the assessment criterion.
·
Contribution of each individual
activities are 24% from grab dredging at jetty box, 29% from grab dredging at
approach channel and turning basin (area C), 46% from grab dredging at
approach channel and turning basin (area D).
|
Table
66.15 Predicted
SS Elevation (mg L-1) in Scenario 4b
|
Sensitive Receiver
|
Name
|
ID
|
Relevant Water Depth (a)
|
Allowable Elevation
|
Predicted SS Elevation (mg L-1)
|
|
Dry
|
Wet
|
Dry
|
Wet
|
Dry
|
Wet
|
Dry
|
Wet
|
|
Max
|
Max
|
Mean
|
Mean
|
90%-tile
|
90%-tile
|
|
Protection Zone
|
Chinese White Dolphin Protection
Zone in Mainland Waters
|
SR11
|
a
|
8.9
|
6.5
|
0.1
|
0.0
|
0.0
|
0.0
|
0.0
|
0.0
|
|
Protection Zone
|
Chinese White Dolphin Protection
Zone in Mainland Waters
|
SR11a
|
a
|
8.9
|
6.5
|
0.1
|
0.0
|
0.0
|
0.0
|
0.1
|
0.0
|
|
Protection Zone
|
Chinese White Dolphin Protection
Zone in Mainland Waters
|
SR11b
|
a
|
8.9
|
6.5
|
0.2
|
0.1
|
0.1
|
0.0
|
0.1
|
0.0
|
|
Horseshoe Crab Nursery Grounds
|
Tai O
|
SR12
|
a
|
8.9
|
6.5
|
0.1
|
0.1
|
0.0
|
0.0
|
0.0
|
0.0
|
|
Intertidal Mudflats
|
Yi O
|
SR14
|
s
|
6.5
|
3.6
|
0.1
|
0.0
|
0.0
|
0.0
|
0.0
|
0.0
|
|
Horseshoe Crab Nursery Grounds
|
Yi O
|
SR14
|
a
|
8.9
|
6.5
|
0.1
|
0.0
|
0.0
|
0.0
|
0.0
|
0.0
|
|
Non-gazetted Beaches
|
Fan Lau Sai Wan
|
SR15a
|
a
|
6.9
|
5.5
|
0.0
|
0.0
|
0.0
|
0.0
|
0.0
|
0.0
|
|
Mangroves
|
Fan Lau Tung Wan
|
SR15b
|
s
|
4.5
|
3
|
0.0
|
0.0
|
0.0
|
0.0
|
0.0
|
0.0
|
|
Non-gazetted Beaches
|
Fan Lau Tung Wan
|
SR15b
|
a
|
6.9
|
5.5
|
0.0
|
0.0
|
0.0
|
0.0
|
0.0
|
0.0
|
|
Non-gazetted Beaches
|
Tsin Yue Wan
|
SR15c
|
a
|
6.9
|
5.5
|
0.0
|
0.0
|
0.0
|
0.0
|
0.0
|
0.0
|
|
Fish Fry Habitat
|
Pak Tso Wan
|
SR16b
|
a
|
6.9
|
5.5
|
0.2
|
0.3
|
0.1
|
0.0
|
0.2
|
0.1
|
|
Horseshoe Crab Nursery Grounds
|
Sha Lo Wan
|
SR18
|
a
|
7.8
|
4.8
|
0.0
|
0.0
|
0.0
|
0.0
|
0.0
|
0.0
|
|
Spawning/Nursery Grounds
|
Fisheries Spawning/Nursery Grounds
in South Lantau
|
SR24
|
a
|
6.9
|
5.5
|
0.2
|
0.1
|
0.0
|
0.0
|
0.1
|
0.0
|
|
Spawning/Nursery Grounds
|
Fisheries Spawning/Nursery Grounds
in South Lantau
|
SR27
|
a
|
6.9
|
5.5
|
0.2
|
0.3
|
0.0
|
0.0
|
0.1
|
0.1
|
|
Subtidal Hard Bottom Habitat
(coral)
|
Southern Side of South
Soko
|
SR31
|
a
|
10
(b)
|
10
(b)
|
12.1
(c), (d)
|
10.5
(c), (e)
|
2.9
|
2.5
|
5.6
|
4.3
|
|
Intertidal Mudflats
|
Shui Hau Wan
|
SR33
|
s
|
3.9
|
2.5
|
0.0
|
0.0
|
0.0
|
0.0
|
0.0
|
0.0
|
|
Horseshoe Crab Nursery Grounds
|
Tong Fuk Miu Wan
|
SR33
|
a
|
4.8
|
3.9
|
0.0
|
0.0
|
0.0
|
0.0
|
0.0
|
0.0
|
|
Gazetted Beaches
|
Tong Fuk
|
SR34
|
a
|
4.8
|
3.9
|
0.0
|
0.0
|
0.0
|
0.0
|
0.0
|
0.0
|
|
Notes:
a. s
= surface, m = middle, b = bottom, a = depth-averaged
b. The
tolerance assessment criterion of 10 mg L-1 was adopted for the
coral.
c.
Shaded area indicates non-compliance
with the assessment criterion.
d. Contribution
of each individual activities are 31% from grab dredging at jetty box, 10%
from grab dredging at approach channel and turning basin (area C), 59% from
TSHD dredging at approach channel and turning basin (area D).
e. Contribution
of each individual activities are 16% from grab dredging at jetty box, 46%
from TSHD dredging at approach channel and turning basin (area C), 37% from
grab dredging at approach channel and turning basin (area D).
|
Scenario
5
Scenario 5 allows the assessment of
impacts through dredging works at the outfall and intake as well as jetting for
the submarine cable circuit between Shek Pik and South
Soko.
This scenario is also taken as a
conservative case. The tentative
construction programme shows that the probability of concurrent dredging and
jetting works is very low. Besides,
dredging under the intake and outfall is likely to be carried out sequentially
and will not overlap.
Modelling results also indicate that
SS elevations will be compliant with the WQO and tolerance criterion at most
sensitive receivers in both seasons (Table
6.16) with the exception of SR16b (fish fry habitat at Pak Tso Wan).
The maximum depth-averaged SS at
SR16b is predicted to marginally exceed the tolerance criterion in the wet
season. As shown in the time-series
plots (Annex 6C), the exceedances
will be of a short duration. Hence it is
anticipated that the exceedances would be temporary and they would not cause
any unacceptable impacts to the habitat.
The exceedance is likely to be attributable to jetting for the submarine
cable as presented in the contour plots (Annex
6C).
Due to the relatively limited spread
of SS, any exceedances of the WQOs or tolerance criterion at sensitive
receivers are predicted to be transient.
In addition, the SS elevation could be further reduced by implementing
mitigation measures. No unacceptable
impacts are thus expected to occur.
Scenarios 1 to 5 simulate the marine
works in the vicinity of Soko
Islands. The model results for the intertidal and
subtidal coastal areas around Soko
Islands are presented in Table C1 in Annex 6C for reference.
Based on the results of Scenarios 1
to 5, it is worth noting the following:
· Should some
of the aforementioned dredging/jetting works at northwest, east and south of South Soko
Island be carried out
concurrently, it is expected that the sediment plumes from these three areas
will not overlap. This is illustrated in
the contour plots (Annex 6C) which
show that South Soko Island
itself serves as a natural barrier.
· It is
concluded that SS elevations due to grab dredging are generally confined to the
works area whereas those due to TSHD dredging and jetting are confined not only
to the works area but also to the bottom layer of the water column.
· It is
expected that the non-compliances at SR16b and SR31 would be temporary rather
than persistent (short duration of disturbance in which the works are close to
the sensitive receivers).
· For the
moving sources including in Scenarios 3, 4b and 5, snap-shots of maximum SS
elevation per day are presented to show the maximum values occurring at a
certain moment of time in a day. It is
considered the snap-shots are more appropriate than the SS elevation plots of
maximum values over a complete spring neap cycle which are gestalt images and
may not be representative of any given moment in time. This means the time in which each grid cell’s
maximum occurred is independent of the other grid cells and therefore should not
be interpreted against the WQO.
·Should some
of the aforementioned dredging/jetting works at northwest, east and south of
South Soko Island be carried out concurrently, it is expected that the sediment
plumes from these three areas will not overlap.
This is illustrated in the contour plots (Annex 6C) which show that South Soko Island itself serves as a
natural barrier.
·It is
concluded that SS elevations due to grab dredging are generally confined to the
works area whereas those due to TSHD dredging and jetting are confined not only
to the works area but also to the bottom layer of the water column.
·It is
expected that the non-compliances at SR16b and SR31 would be temporary rather
than persistent (short duration of disturbance in which the works are close to
the sensitive receivers).
·For the
moving sources including in Scenarios 3, 4b and 5, snap-shots of maximum SS
elevation per day are presented to show the maximum values occurring at a
certain moment of time in a day. It is
considered the snap-shots are more appropriate than the SS elevation plots of
maximum values over a complete spring neap cycle which are gestalt images and
may not be representative of any given moment in time. This means the time in which each grid cell’s
maximum occurred is independent of the other grid cells and therefore should
not be interpreted against the WQO.
Table
66.16 Predicted
SS Elevation (mg L-1) in Scenario 5
|
Sensitive Receiver
|
Name
|
ID
|
Relevant Water Depth (a)
|
Allowable Elevation
|
Predicted SS Elevation (mg L-1)
|
|
Dry
|
Wet
|
Dry
|
Wet
|
Dry
|
Wet
|
Dry
|
Wet
|
|
Max
|
Max
|
Mean
|
Mean
|
90%-tile
|
90%-tile
|
|
Protection Zone
|
Chinese White Dolphin Protection
Zone in Mainland Waters
|
SR11
|
a
|
8.9
|
6.5
|
0.1
|
0.0
|
0.0
|
0.0
|
0.0
|
0.0
|
|
Protection Zone
|
Chinese White Dolphin Protection
Zone in Mainland Waters
|
SR11a
|
a
|
8.9
|
6.5
|
0.1
|
0.0
|
0.0
|
0.0
|
0.0
|
0.0
|
|
Protection Zone
|
Chinese White Dolphin Protection
Zone in Mainland Waters
|
SR11b
|
a
|
8.9
|
6.5
|
0.1
|
0.0
|
0.0
|
0.0
|
0.1
|
0.0
|
|
Horseshoe Crab Nursery Grounds
|
Tai O
|
SR12
|
a
|
8.9
|
6.5
|
0.1
|
0.1
|
0.0
|
0.0
|
0.0
|
0.0
|
|
Intertidal Mudflats
|
Yi O
|
SR14
|
s
|
6.5
|
3.6
|
0.0
|
0.0
|
0.0
|
0.0
|
0.0
|
0.0
|
|
Horseshoe Crab Nursery Grounds
|
Yi O
|
SR14
|
a
|
8.9
|
6.5
|
0.1
|
0.0
|
0.0
|
0.0
|
0.0
|
0.0
|
|
Non-gazetted Beaches
|
Fan Lau Sai Wan
|
SR15a
|
a
|
6.9
|
5.5
|
0.1
|
0.0
|
0.0
|
0.0
|
0.0
|
0.0
|
|
Mangroves
|
Fan Lau Tung Wan
|
SR15b
|
s
|
4.5
|
3
|
0.4
|
0.0
|
0.0
|
0.0
|
0.0
|
0.0
|
|
Non-gazetted Beaches
|
Fan Lau Tung Wan
|
SR15b
|
a
|
6.9
|
5.5
|
0.5
|
0.1
|
0.0
|
0.0
|
0.1
|
0.0
|
|
Non-gazetted Beaches
|
Tsin Yue Wan
|
SR15c
|
a
|
6.9
|
5.5
|
0.2
|
0.0
|
0.0
|
0.0
|
0.0
|
0.0
|
|
Fish Fry Habitat
|
Pak Tso Wan
|
SR16b
|
a
|
6.9
|
5.5
|
3.5
|
5.7
(c)
|
0.2
|
0.1
|
0.4
|
0.1
|
|
Horseshoe Crab Nursery Grounds
|
Sha Lo Wan
|
SR18
|
a
|
7.8
|
4.8
|
0.0
|
0.0
|
0.0
|
0.0
|
0.0
|
0.0
|
|
Spawning/Nursery Grounds
|
Fisheries Spawning/Nursery Grounds
in South Lantau
|
SR24
|
a
|
6.9
|
5.5
|
3.2
|
0.3
|
0.1
|
0.0
|
0.1
|
0.0
|
|
Spawning/Nursery Grounds
|
Fisheries Spawning/Nursery Grounds
in South Lantau
|
SR27
|
a
|
6.9
|
5.5
|
3.1
|
1.8
|
0.1
|
0.1
|
0.1
|
0.1
|
|
Subtidal Hard Bottom Habitat
(coral)
|
Southern Side of South
Soko
|
SR31
|
a
|
10
(b)
|
10
(b)
|
6.1
|
3.7
|
1.9
|
1.3
|
3.9
|
2.4
|
|
Intertidal Mudflats
|
Shui Hau Wan
|
SR33
|
s
|
3.9
|
2.5
|
0.0
|
0.0
|
0.0
|
0.0
|
0.0
|
0.0
|
|
Horseshoe Crab Nursery Grounds
|
Tong Fuk Miu Wan
|
SR33
|
a
|
4.8
|
3.9
|
0.0
|
0.0
|
0.0
|
0.0
|
0.0
|
0.0
|
|
Gazetted Beaches
|
Tong Fuk
|
SR34
|
a
|
4.8
|
3.9
|
0.0
|
0.0
|
0.0
|
0.0
|
0.0
|
0.0
|
|
Gazetted Beaches
|
Upper Cheung
Sha Beach
|
SR35
|
a
|
4.8
|
3.9
|
0.0
|
0.0
|
0.0
|
0.0
|
0.0
|
0.0
|
|
Seagrass Beds/Mangroves
|
Tung Chung
Bay
|
SR39
|
s
|
6.5
|
3.6
|
0.0
|
0.0
|
0.0
|
0.0
|
0.0
|
0.0
|
|
Horseshoe Crab Nursery Grounds
|
Tung Chung
Bay
|
SR39
|
a
|
8.9
|
6.5
|
0.0
|
0.0
|
0.0
|
0.0
|
0.0
|
0.0
|
|
Notes:
a. s
= surface, m = middle, b = bottom, a = depth-averaged
b. The
tolerance assessment criterion of 10 mg L-1 was adopted for the
coral.
c.
Shaded area indicates
non-compliance with the assessment criterion.
|
Scenario 6
Scenario 6 allows the assessment of
impacts due to concurrent dredging works and backfilling works for the seawall
trench and GRS reclamation at Black Point.
The dredging works will be carried by two closed grab dredgers while the
sandfilling works will be conducted by a pelican barge. The construction of the GRS requires a small
area to be dredged (Figure
6.9)
prior to the installation works for the submarine gas pipeline.
In the model, it has been assumed
that the sandfilling works are continuous over a spring-neap cycle. In view of small volume of seawall trench to
be filled, this assumption will be very conservative as the filling works are
expected to be completed within a few days.
It is worth to note that in the
model the reclamation for the GRS is assumed to be undertaken without applying
any mitigation measures (the most conservative case) such as the
preconstruction of a seawall. In reality,
however, a completed seawall will be in place while reclamation works are
taking place. The tentative layout of
the seawall is illustrated in Figure 6.9.
Seawalls which are constructed above the high tide level are an
effective barrier against the washing out of filling materials by water
currents. Therefore, the impact of sand
filling on the surrounding water and hence suspended solid elevations will be
substantially reduced from the levels determined from the model.
Modelling results indicate that SS
elevations will be compliant with the WQO at all sensitive receivers in both
seasons (Table 6.17). Due to the relatively limited spread of SS
and no exceedances of the WQOs or tolerance criterion at sensitive receivers,
no unacceptable impacts would be expected to occur.
Table
66.17 Predicted
SS Elevation (mg L-1) in Scenario 6
|
Sensitive Receiver
|
Name
|
ID
|
Relevant Water Depth (a)
|
Allowable Elevation
|
Predicted SS Elevation (mg L-1)
|
|
Dry
|
Wet
|
Dry
|
Wet
|
Dry
|
Wet
|
Dry
|
Wet
|
|
Max
|
Max
|
Mean
|
Mean
|
90%-tile
|
90%-tile
|
|
Intertidal Mudflats
|
Pak Nai
|
SR01
|
s
|
7.1
|
3.6
|
1.0
|
0.8
|
0.0
|
0.0
|
0.1
|
0.0
|
|
Horseshoe Crab Nursery Grounds
|
Pak Nai
|
SR01
|
a
|
9.7
|
6
|
4.5
|
1.2
|
0.2
|
0.1
|
0.6
|
0.3
|
|
Seagrass Beds/Mangroves/Oyster Farm
|
Pak Nai
|
SR02
|
s
|
7.1
|
3.6
|
0.0
|
0.1
|
0.0
|
0.0
|
0.0
|
0.0
|
|
Seawater Intakes
|
Black Point Power Station
|
SR04
|
b
|
700
(b)
|
700
(b)
|
48.7
|
38.3
|
2.7
|
3.0
|
7.7
|
9.2
|
|
Non-gazetted Beaches
|
Lung Kwu Sheung Tan
|
SR05a
|
a
|
8.2
|
5.6
|
0.9
|
0.2
|
0.0
|
0.0
|
0.1
|
0.0
|
|
Non-gazetted Beaches
|
Lung Kwu Tan
|
SR05b
|
a
|
8.2
|
5.6
|
0.6
|
0.4
|
0.0
|
0.0
|
0.1
|
0.1
|
|
Gazetted Beaches
|
Butterfly Beach
|
SR05c
|
a
|
8.2
|
5.6
|
0.0
|
0.0
|
0.0
|
0.0
|
0.0
|
0.0
|
|
Marine Park
|
Designated Sha Chau and Lung Kwu
Chau
|
SR06a
|
a
|
8.2
|
5.6
|
0.2
|
0.1
|
0.0
|
0.0
|
0.0
|
0.0
|
|
Marine Park
|
Designated Sha Chau and Lung Kwu
Chau
|
SR06b
|
a
|
8.2
|
5.6
|
0.1
|
0.1
|
0.0
|
0.0
|
0.0
|
0.0
|
|
Marine Park
|
Designated Sha Chau and Lung Kwu
Chau
|
SR06c
|
a
|
8.2
|
5.6
|
0.2
|
0.2
|
0.0
|
0.0
|
0.1
|
0.1
|
|
Marine Park
|
Designated Sha Chau and Lung Kwu
Chau
|
SR06d
|
a
|
8.2
|
5.6
|
0.2
|
0.2
|
0.0
|
0.0
|
0.0
|
0.0
|
|
Artificial Reef Deployment Area
|
Sha Chau and Lung Kwu Chau
|
SR06e
|
a
|
8.2
|
5.6
|
0.1
|
0.1
|
0.0
|
0.0
|
0.0
|
0.0
|
|
Seawater Intakes
|
Castle
Peak Power Station
|
SR07a
|
b
|
700
(b)
|
700
(b)
|
2.9
|
2.0
|
0.1
|
0.2
|
0.3
|
0.5
|
|
Seawater Intakes
|
Tuen Mun Area 38
|
SR07b
|
b
|
14.2
|
9.8
|
0.4
|
0.5
|
0.0
|
0.1
|
0.1
|
0.2
|
|
Seawater Intakes
|
Airport
|
SR07c
|
b
|
8.9
|
8.8
|
0.1
|
0.0
|
0.0
|
0.0
|
0.0
|
0.0
|
|
Seawater Intakes
|
Airport
|
SR07d
|
b
|
8.9
|
8.8
|
0.0
|
0.0
|
0.0
|
0.0
|
0.0
|
0.0
|
|
Artificial Reef Deployment Area
|
Northeast Airport
|
SR07d
|
a
|
4.7
|
5.2
|
0.0
|
0.0
|
0.0
|
0.0
|
0.0
|
0.0
|
|
Seawater Intakes
|
Airport
|
SR07e
|
b
|
8.9
|
8.8
|
0.0
|
0.0
|
0.0
|
0.0
|
0.0
|
0.0
|
|
Seawater Intakes
|
Airport
|
SR07f
|
b
|
8.9
|
8.8
|
0.0
|
0.0
|
0.0
|
0.0
|
0.0
|
0.0
|
|
Spawning/Nursery Grounds
|
Fisheries Spawning Ground in North Lantau
|
SR08
|
a
|
8.2
|
5.6
|
0.2
|
0.3
|
0.0
|
0.0
|
0.1
|
0.1
|
|
Horseshoe Crab Nursery Grounds
|
Sham Wat Wan
|
SR10
|
a
|
8.9
|
6.5
|
0.1
|
0.1
|
0.0
|
0.0
|
0.0
|
0.0
|
|
Notes:
a. s
= surface, m = middle, b = bottom, a = depth-averaged
b. The
assessment criterion of 700 mg L-1 was adopted for these seawater
intakes.
|
Scenarios
7 to 14 (Gas Pipeline)
The proposed pipeline installation
methods have been presented in the Project
Description (Part 2 – Section 3). Modelling details are presented in Part 2 - Annex 6A and a brief
description is presented below.
12-hour dredging works undertaken by
closed grab dredger(s) for the installation of the pipeline will be undertaken
in four separate zones. These zones
refer to the types of protection proposed for the pipeline (Figure 6.5) and are presented below
(corresponding sections of the pipeline route with distance points (KP) are
presented in brackets).
·
Scenario
7: South Soko Shore Approach (KP 0 – KP 1)
·
Scenario
9: Northwest Lantau
to Urmston Road
Crossing (KP 24.5 – KP 31)
·
Scenario
10: Urmston Road Crossing (KP 31 – KP 33.5)
·
Scenario
11: West of Black Point (KP 33.5 – KP
37)
·
Scenario
12: West of Black Point (KP 37 – KP
37.803)
·
Scenario
13: Black Point
Shore Approach (KP 37.803
– KP 38.303)
For
the zone of West of South Soko to West Lantau,
TSHD dredging will be used and hence the following scenario has been defined:
For the zone
of West of South Soko to West Lantau, TSHD
dredging will be used and hence the following scenario has been defined:
·
Scenario
9: Fan Lau Crossing to West
Lantau (KP 5 – KP 24.5)
The TSHD
will conduct dredging for approximately 45 minutes and will travel to the
disposal site before the next dredging event starts. The model has assumed 24-hour operation ([31]). It is proposed to be used mainly in the West
Lantau areas, where Chinese White Dolphins are present, because a TSHD will extensively reduce the construction
duration and hence cause less disturbances to dolphins (for details refer to Part 2 – Section 9: Marine Ecology Assessment).
The TSHD
will conduct dredging for approximately 45 minutes and will travel to the
disposal site before the next dredging event starts. The model has assumed 24-hour operation ([32]). It is proposed to be used mainly in the West
Lantau areas, where Chinese White Dolphins are present, because a TSHD will extensively reduce the construction
duration and hence cause less disturbances to dolphins (for details refer to Part 2 – Section 9: Marine Ecology
Assessment).
The alignment of the
submarine gas pipeline, the respective construction works and trench type in
each zone, as well as the coordinates of the distance points (KP) are shown in Figure 6.5.
Grab Dredging for the Submarine Gas
Pipeline
Grab dredging will be carried out
along the majority of the gas pipeline section including the South Soko Shore
Approach, Northwest Lantau to Urmston Road
Crossing, West of Black Point, Black Point Shore Approach and at the gas
receiving station (GRS). Potential
impacts from dredging works at the GRS have been discussed in the previous
section (see Scenario 6), no
unacceptable impacts were predicted.
Potential impacts to water quality as a result of the other pipeline
works are discussed below.
·
Scenario
7: Grab Dredging for South Soko Shore
Approach (KP 0-1): Modelling
results (Table 6.18) indicate that SS
elevations will be compliant with the WQO at all sensitive receivers in both
seasons, with the exception of SR16b (fish fry habitat at Pak Tso Wan). As seen from Table 6.18, the maximum depth-averaged SS elevations at Pak Tso Wan
would be about 10.6 and 6.0 mg L-1, marginally exceeding the WQOs of
6.9 and 5.5 mg L-1 in the dry and wet seasons,
respectively.
The contour
plots ([33]) (Annex 6C), however,
show that the sediment plume (maximum depth averaged of > 5 mg L-1) would
disperse a maximum of 300 m from the centreline of the gas pipeline over a
short period. In view of the short
period of dredging at the shore approach (less than 1 month), the
non-compliance will be temporary and water quality will return to normal after
the construction period ends.
The contour
plots ([34]) (Annex 6C), however, show that the
sediment plume (maximum depth averaged of > 5 mg L-1) would
disperse a maximum of 300 m from the centreline of the gas pipeline over a
short period. In view of the short
period of dredging at the shore approach (less than 1 month), the non-compliance
will be temporary and water quality will return to normal after the
construction period ends.
As discussed above, the plume
will be confined largely to the construction works area and hence it is
anticipated that there will be no significant adverse impacts to the
nursery/spawning ground of commercial fisheries resources. It should be noted that although the WQO is
temporarily exceeded the elevations area within the reported tolerance criteria
of fish. Literature
reviews indicate that lethal responses had not been reported in adult fish at
values below 125 mg L-1 ([35]) and that sublethal effects were only observed
when levels exceeded 90 mg L-1 ([36]). A recent study indicated that an appropriate
tolerance level for fish in Hong Kong would be
50 mg L-1 ([37]).
As discussed above, the plume
will be confined largely to the construction works area and hence it is
anticipated that there will be no significant adverse impacts to the
nursery/spawning ground of commercial fisheries resources. It should be noted that although the WQO is
temporarily exceeded the elevations area within the reported tolerance criteria
of fish. Literature
reviews indicate that lethal responses had not been reported in adult fish at
values below 125 mg L-1 and that sublethal effects were only observed
when levels exceeded 90 mg L-1
. A recent study indicated that an appropriate
tolerance level for fish in Hong Kong would be 50 mg L-1 (.
The
impacts to the fish fry habitat and the nursery/spawning ground will be
discussed in detail in Part
2 – Section 10: Fisheries Impact Assessment.
In
order to avoid any adverse impacts to water quality at Pak Tso Wan, it is
recommended that 2 layers of silt curtain (stand type enclosing Pak Tso Wan and
cage type enclosing the grab dredging area) will be installed. Details are discussed in Section 6.8.
·
Scenario
9: Grab Dredging in Northwest Lantau to Urmston Road Crossing West of Black
Point (KP 24.5-31): This scenario
simulates three grab dredgers, which are located evenly at least 2,167 m apart,
conducting the works simultaneously.
Modelling results (Table 6.20)
indicate that SS elevations will be compliant with the WQO and tolerance
criterion at all sensitive receivers in both seasons.
From the daily maximum contour
plots (Figures 6.11a to 6.11f), it is expected that the
sediment plumes (maximum depth-averaged of > 5 mg L-1) will extend just inside the Marine Park,
i.e. at the boundary of the Marine
Park. WQO exceedances will not be expected for the
waters inside the Marine
Park.
As
a mitigation measure, a cage type silt curtain will be deployed for each grab
dredger to enclose the dredging area in order to avoid the plume entering the Marine Park. Hence no unacceptable adverse impact to the Marine Park
and water quality are expected.
·
Scenario
10: Grab Dredging for Black
Point Shore
Approach across Urmston Road
Crossing (KP 31–33.5): Modelling results (Table 6.21) indicate that SS elevations
will be compliant with the WQO and tolerance criterion at all sensitive
receivers in both seasons.
The
contour plots (([41])) (Annex 6C) show the maximum
depth-averaged SS plume of > 5 mg L-1 will not disperse more than
200 m from the centreline of the gas pipeline.
The plume would not reach any sensitive receivers and its maximum extent
will be limited to a period of less than 2 hours over the tidal cycle, it is
expected that no unacceptable water quality impacts will arise.
·
Scenario
11: Grab Dredging at West of Black Point (KP 33.5-37): Modelling results (Table 6.22) indicate that SS elevations
will be compliant with the WQO and tolerance criterion at all sensitive
receivers in both seasons.
The
contour plots ([42]) (Annex 6C) show the maximum
depth-averaged SS plume of > 5 mg L-1 will not disperse more than
300 m from the centreline of the gas pipeline and its maximum extent will be
limited to a period of less than 2 hours over a tidal cycle. The plume would remain in the open water in
the Urmston Road. Since the sediment plume will not reach any
sensitive receivers, no unacceptable impacts to water quality are expected.
·
Scenario
12: Grab Dredging at West of Black Point (KP 37-37.803): Modelling results (Table 6.23) indicate that SS elevations
will be compliant with the WQO and tolerance criterion at all sensitive
receivers in both seasons.
The
contour plots ([43]) (Annex 6C) show the maximum
depth-averaged SS plume > 5 mg L-1 will not disperse more than
350 m from the centreline of the gas pipeline and its maximum extent will be
limited to a period of less than 2 hours over a tidal cycle. The plume would not reach the coast and any
sensitive receivers. Therefore, no
unacceptable adverse water quality impacts are expected.
·
Scenario
13: Grab Dredging at Black
Point Shore
Approach (KP 37.803-38.303): Modelling results (Table 6.24) indicate that SS elevations
will be compliant with the WQO and tolerance criterion at all sensitive
receivers in both seasons.
The
contour plots ([44]) (Annex 6C) show the maximum
depth-averaged SS plume > 5 mg L-1 will not disperse more than
350 m from the centreline of the gas pipeline and its maximum extent will be
limited to a period of less than 2 hours over a tidal cycle. The plume would reach the coast but since it
is an artificial seawall of low ecological value, it is expected that no
unacceptable impacts will arise.
TSHD Dredging for the Submarine Gas
Pipeline
As an alternative to grab dredging,
TSHD will be undertaken for the pipeline section crossing west of South Soko to
West Lantau.
Potential impacts to water quality as a result of the works are
discussed below.
·
Scenario 8: TSHD Dredging from Fan Lau
Crossing to West Lantau (KP 1-24.5): Modelling results (Table 6.19) indicate that SS elevations will be compliant with the
WQO and tolerance criterion at all sensitive receivers in both seasons with the
exception of minor WQO exceedance at the boundary of the potential Marine Park
in Southwest Lantau.
As
shown in Table 6.19, the maximum SS
elevations will comply with the WQO in the dry season and will marginally
exceed the WQO in the wet season by 0.4 mg L-1 and 2.4 mg L-1
at SR19b and SR19c respectively. The
exceedances are predicted to occur in the wet season but in face no TSHD
dredging works will be conducted in Indo-Pacific Humpback Dolphin peak calving
season of March through August, i.e. the wet season. Therefore, no unacceptable adverse impacts
due to the dredging works on the potential Marine Park
will be expected.
·
As
seen from the daily maximum depth-averaged SS plots shown in Figures
6.12a to 6.12f,
the sediment plume >
5 mg L-1 due to dredging would be confined to the
works area and remain in the open waters.
It is expected that the plume will disperse to a maximum extent of
approximately 200 m from the centreline of the gas pipeline in the direction of
the current and would stay away from the nursery/spawning ground of commercial
fisheries resources in south Lantau and the proposed Marine Park.
It
is also considered that SS elevations have no direct impacts to the Chinese
White Dolphins. It is aforementioned
that the TSHD is assumed in the modelling to be operated for 24 hours a day ([45])
and the dredging works carried out by the TSHD is non-continuous. The TSHD will conduct dredging for
approximately 45 minutes and will travel to the disposal site before the next
dredging event starts. Consequently the
sediment plumes will settle rapidly before the next dredging cycle commences as
evidenced in the time-series plots (Figures
6.13a to 6.13c). It is proposed to
be mainly used in the West Lantau areas, where
Chinese White Dolphins are present because a TSHD will extensively reduce the
construction duration and hence cause less disturbance to dolphins (details
refer to Part 2 – Section 9: Marine
Ecology Assessment).
Figure 66.13a Predicted SS Elevations at SR19a (Boundary of
the Proposed Southwest Lantau
Marine Park)
over a Simulation Period (upper: Dry Season; lower: Wet Season)
·
·
·
Figure 66.13b Predicted SS Elevations at SR19b
(Boundary of the Proposed
Southwest Lantau
Marine Park)
over a Simulation Period (upper: Dry Season; lower: Wet Season)
Figure 66.13c Predicted SS Elevations at SR19c (Boundary of
the Proposed Southwest Lantau
Marine Park)
over a Simulation Period (upper: Dry Season; lower: Wet Season)
Table
6.618 Predicted
SS Elevation (mg L-1) for Scenario 7 - Grab Dredging for the South Soko
Shore Approach (KP0-1)
|
Sensitive Receiver
|
Name
|
ID
|
Relevant Water Depth (a)
|
Allowable Elevation
|
Predicted
SS Elevation (mg L-1)
|
|
|
|
Dry
|
Wet
|
Dry
|
Wet
|
Dry
|
Wet
|
Dry
|
Wet
|
|
|
|
Max
|
Max
|
Mean
|
Mean
|
90%-tile
|
90%-tile
|
|
Intertidal Mudflats
|
Pak Nai
|
SR01
|
s
|
7.1
|
3.6
|
0.0
|
0.0
|
0.0
|
0.0
|
0.0
|
0.0
|
|
Horseshoe Crab Nursery Grounds
|
Pak Nai
|
SR01
|
a
|
9.7
|
6
|
0.0
|
0.0
|
0.0
|
0.0
|
0.0
|
0.0
|
|
Seagrass Beds/Mangroves/Oyster Farm
|
Pak Nai
|
SR02
|
s
|
7.1
|
3.6
|
0.0
|
0.0
|
0.0
|
0.0
|
0.0
|
0.0
|
|
Seawater Intakes
|
Black Point Power Station
|
SR04
|
b
|
700 (b)
|
700 (b)
|
0.0
|
0.0
|
0.0
|
0.0
|
0.0
|
0.0
|
|
Non-gazetted Beaches
|
Lung Kwu Sheung Tan
|
SR05a
|
a
|
8.2
|
5.6
|
0.0
|
0.0
|
0.0
|
0.0
|
0.0
|
0.0
|
|
Non-gazetted Beaches
|
Lung Kwu Tan
|
SR05b
|
a
|
8.2
|
5.6
|
0.0
|
0.0
|
0.0
|
0.0
|
0.0
|
0.0
|
|
Gazetted Beaches
|
Butterfly Beach
|
SR05c
|
a
|
8.2
|
5.6
|
0.0
|
0.0
|
0.0
|
0.0
|
0.0
|
0.0
|
|
Marine Park
|
Designated Sha Chau and Lung Kwu Chau
|
SR06a
|
a
|
8.2
|
5.6
|
0.0
|
0.0
|
0.0
|
0.0
|
0.0
|
0.0
|
|
Marine Park
|
Designated Sha Chau and Lung Kwu Chau
|
SR06b
|
a
|
8.2
|
5.6
|
0.0
|
0.0
|
0.0
|
0.0
|
0.0
|
0.0
|
|
Marine Park
|
Designated Sha Chau and Lung Kwu Chau
|
SR06c
|
a
|
8.2
|
5.6
|
0.0
|
0.0
|
0.0
|
0.0
|
0.0
|
0.0
|
|
Marine Park
|
Designated Sha Chau and Lung Kwu Chau
|
SR06d
|
a
|
8.2
|
5.6
|
0.0
|
0.0
|
0.0
|
0.0
|
0.0
|
0.0
|
|
Artificial Reef Deployment Area
|
Sha Chau and Lung Kwu Chau
|
SR06e
|
a
|
8.2
|
5.6
|
0.0
|
0.0
|
0.0
|
0.0
|
0.0
|
0.0
|
|
Seawater Intakes
|
Castle Peak Power Station
|
SR07a
|
b
|
700 (b)
|
700 (b)
|
0.0
|
0.0
|
0.0
|
0.0
|
0.0
|
0.0
|
|
Seawater Intakes
|
Tuen Mun Area 38
|
SR07b
|
b
|
14.2
|
9.8
|
0.0
|
0.0
|
0.0
|
0.0
|
0.0
|
0.0
|
|
Seawater Intakes
|
Airport
|
SR07c
|
b
|
8.9
|
8.8
|
0.0
|
0.0
|
0.0
|
0.0
|
0.0
|
0.0
|
|
Seawater Intakes
|
Airport
|
SR07d
|
b
|
8.9
|
8.8
|
0.0
|
0.0
|
0.0
|
0.0
|
0.0
|
0.0
|
|
Artificial Reef Deployment Area
|
Northeast Airport
|
SR07d
|
a
|
4.7
|
5.2
|
0.0
|
0.0
|
0.0
|
0.0
|
0.0
|
0.0
|
|
Seawater Intakes
|
Airport
|
SR07e
|
b
|
8.9
|
8.8
|
0.0
|
0.0
|
0.0
|
0.0
|
0.0
|
0.0
|
|
Seawater Intakes
|
Airport
|
SR07f
|
b
|
8.9
|
8.8
|
0.0
|
0.0
|
0.0
|
0.0
|
0.0
|
0.0
|
|
Spawning/Nursery Grounds
|
Fisheries Spawning Ground in North Lantau
|
SR08
|
a
|
8.2
|
5.6
|
0.0
|
0.0
|
0.0
|
0.0
|
0.0
|
0.0
|
|
Horseshoe Crab Nursery Grounds
|
Sham Wat Wan
|
SR10
|
a
|
8.9
|
6.5
|
0.0
|
0.0
|
0.0
|
0.0
|
0.0
|
0.0
|
|
Protection Zone
|
Chinese White Dolphin Protection Zone in Mainland Waters
|
SR11
|
a
|
8.9
|
6.5
|
0.0
|
0.0
|
0.0
|
0.0
|
0.0
|
0.0
|
|
Protection Zone
|
Chinese White Dolphin Protection Zone in Mainland Waters
|
SR11a
|
a
|
8.9
|
6.5
|
0.0
|
0.0
|
0.0
|
0.0
|
0.0
|
0.0
|
|
Protection Zone
|
Chinese White Dolphin Protection Zone in Mainland Waters
|
SR11b
|
a
|
8.9
|
6.5
|
0.0
|
0.0
|
0.0
|
0.0
|
0.0
|
0.0
|
|
Horseshoe Crab Nursery Grounds
|
Tai O
|
SR12
|
a
|
8.9
|
6.5
|
0.0
|
0.0
|
0.0
|
0.0
|
0.0
|
0.0
|
|
Intertidal Mudflats
|
Yi O
|
SR14
|
s
|
6.5
|
3.6
|
0.0
|
0.0
|
0.0
|
0.0
|
0.0
|
0.0
|
|
Horseshoe Crab Nursery Grounds
|
Yi O
|
SR14
|
a
|
8.9
|
6.5
|
0.0
|
0.0
|
0.0
|
0.0
|
0.0
|
0.0
|
|
Non-gazetted Beaches
|
Fan Lau Sai Wan
|
SR15a
|
a
|
6.9
|
5.5
|
0.0
|
0.0
|
0.0
|
0.0
|
0.0
|
0.0
|
|
Mangroves
|
Fan Lau Tung Wan
|
SR15b
|
s
|
4.5
|
3
|
0.0
|
0.0
|
0.0
|
0.0
|
0.0
|
0.0
|
|
Non-gazetted Beaches
|
Fan Lau Tung Wan
|
SR15b
|
a
|
6.9
|
5.5
|
0.0
|
0.0
|
0.0
|
0.0
|
0.0
|
0.0
|
|
Non-gazetted Beaches
|
Tsin Yue Wan
|
SR15c
|
a
|
6.9
|
5.5
|
0.0
|
0.0
|
0.0
|
0.0
|
0.0
|
0.0
|
|
Fish Fry Habitat
|
Pak Tso Wan
|
SR16b
|
a
|
6.9
|
5.5
|
10.6 (d)
|
6.0 (d)
|
0.7
|
0.5
|
1.6
|
1.6
|
|
Horseshoe Crab Nursery Grounds
|
Sha Lo Wan
|
SR18
|
a
|
7.8
|
4.8
|
0.0
|
0.0
|
0.0
|
0.0
|
0.0
|
0.0
|
|
Spawning/Nursery Grounds
|
Fisheries Spawning/Nursery Grounds in South
Lantau
|
SR24
|
a
|
6.9
|
5.5
|
0.0
|
0.0
|
0.0
|
0.0
|
0.0
|
0.0
|
|
Spawning/Nursery Grounds
|
Fisheries Spawning/Nursery Grounds in South Lantau
|
SR27
|
a
|
6.9
|
5.5
|
0.1
|
0.2
|
0.0
|
0.0
|
0.0
|
0.1
|
|
Subtidal Hard Bottom Habitat (coral)
|
Southern Side of South Soko
|
SR31
|
a
|
10 (c)
|
10 (c)
|
0.2
|
0.3
|
0.0
|
0.0
|
0.1
|
0.0
|
|
Intertidal Mudflats
|
Shui Hau Wan
|
SR33
|
s
|
3.9
|
2.5
|
0.0
|
0.0
|
0.0
|
0.0
|
0.0
|
0.0
|
|
Horseshoe Crab Nursery Grounds
|
Tong Fuk Miu Wan
|
SR33
|
a
|
4.8
|
3.9
|
0.0
|
0.0
|
0.0
|
0.0
|
0.0
|
0.0
|
|
Gazetted Beaches
|
Tong Fuk
|
SR34
|
a
|
4.8
|
3.9
|
0.0
|
0.0
|
0.0
|
0.0
|
0.0
|
0.0
|
|
Gazetted Beaches
|
Upper Cheung Sha Beach
|
SR35
|
a
|
4.8
|
3.9
|
0.0
|
0.0
|
0.0
|
0.0
|
0.0
|
0.0
|
|
Seagrass Beds/Mangroves
|
Tung Chung Bay
|
SR39
|
s
|
6.5
|
3.6
|
0.0
|
0.0
|
0.0
|
0.0
|
0.0
|
0.0
|
|
Horseshoe Crab Nursery Grounds
|
Tung Chung Bay
|
SR39
|
a
|
8.9
|
6.5
|
0.0
|
0.0
|
0.0
|
0.0
|
0.0
|
0.0
|
|
Notes:
a. s
= surface, m = middle, b = bottom, a = depth-averaged
b.
The
assessment criterion of 700 mg L-1 was adopted for these seawater
intakes.
c.
The tolerance assessment criterion
of 10 mg L-1 was adopted for the coral.
d. Shaded
area indicates non-compliance with the assessment criterion.
|
Table
66.19 Predicted
SS Elevation (mg L-1) for Scenario 8 - TSHD Dredging for Pipeline
Section in Northwest of South Soko to West Lantau
(KP 1-24.5)
|
Sensitive Receiver
|
Name
|
ID
|
Relevant Water Depth (a)
|
Allowable Elevation
|
Predicted
SS Elevation (mg L-1)
|
|
|
|
Dry
|
Wet
|
Dry
|
Wet
|
Dry
|
Wet
|
Dry
|
Wet
|
|
|
|
Max
|
Max
|
Mean
|
Mean
|
90%-tile
|
90%-tile
|
|
Intertidal Mudflats
|
Pak Nai
|
SR01
|
s
|
7.1
|
3.6
|
0.0
|
0.0
|
0.0
|
0.0
|
0.0
|
0.0
|
|
Horseshoe Crab Nursery Grounds
|
Pak Nai
|
SR01
|
a
|
9.7
|
6
|
0.0
|
0.0
|
0.0
|
0.0
|
0.0
|
0.0
|
|
Seagrass Beds/Mangroves/Oyster Farm
|
Pak Nai
|
SR02
|
s
|
7.1
|
3.6
|
0.0
|
0.0
|
0.0
|
0.0
|
0.0
|
0.0
|
|
Seawater Intakes
|
Black Point Power Station
|
SR04
|
b
|
700 (b)
|
700 (b)
|
0.0
|
0.0
|
0.0
|
0.0
|
0.0
|
0.0
|
|
Non-gazetted Beaches
|
Lung Kwu Sheung Tan
|
SR05a
|
a
|
8.2
|
5.6
|
0.0
|
0.0
|
0.0
|
0.0
|
0.0
|
0.0
|
|
Non-gazetted Beaches
|
Lung Kwu Tan
|
SR05b
|
a
|
8.2
|
5.6
|
0.0
|
0.0
|
0.0
|
0.0
|
0.0
|
0.0
|
|
Gazetted Beaches
|
Butterfly Beach
|
SR05c
|
a
|
8.2
|
5.6
|
0.0
|
0.0
|
0.0
|
0.0
|
0.0
|
0.0
|
|
Marine Park
|
Designated Sha Chau and Lung Kwu Chau
|
SR06a
|
a
|
8.2
|
5.6
|
0.0
|
0.0
|
0.0
|
0.0
|
0.0
|
0.0
|
|
Marine Park
|
Designated Sha Chau and Lung Kwu Chau
|
SR06b
|
a
|
8.2
|
5.6
|
1.8
|
2.9
|
0.0
|
0.0
|
0.0
|
0.0
|
|
Marine Park
|
Designated Sha Chau and Lung Kwu Chau
|
SR06c
|
a
|
8.2
|
5.6
|
0.0
|
0.0
|
0.0
|
0.0
|
0.0
|
0.0
|
|
Marine Park
|
Designated Sha Chau and Lung Kwu Chau
|
SR06d
|
a
|
8.2
|
5.6
|
0.0
|
0.0
|
0.0
|
0.0
|
0.0
|
0.0
|
|
Artificial Reef Deployment Area
|
Sha Chau and Lung Kwu Chau
|
SR06e
|
a
|
8.2
|
5.6
|
0.1
|
0.4
|
0.0
|
0.0
|
0.0
|
0.0
|
|
Seawater Intakes
|
Castle Peak Power Station
|
SR07a
|
b
|
700 (b)
|
700 (b)
|
0.0
|
0.0
|
0.0
|
0.0
|
0.0
|
0.0
|
|
Seawater Intakes
|
Tuen Mun Area 38
|
SR07b
|
b
|
14.2
|
9.8
|
0.0
|
0.0
|
0.0
|
0.0
|
0.0
|
0.0
|
|
Seawater Intakes
|
Airport
|
SR07c
|
b
|
8.9
|
8.8
|
0.0
|
0.0
|
0.0
|
0.0
|
0.0
|
0.0
|
|
Seawater Intakes
|
Airport
|
SR07d
|
b
|
8.9
|
8.8
|
0.0
|
0.0
|
0.0
|
0.0
|
0.0
|
0.0
|
|
Artificial Reef Deployment Area
|
Northeast Airport
|
SR07d
|
a
|
4.7
|
5.2
|
0.0
|
0.0
|
0.0
|
0.0
|
0.0
|
0.0
|
|
Seawater Intakes
|
Airport
|
SR07e
|
b
|
8.9
|
8.8
|
0.0
|
0.0
|
0.0
|
0.0
|
0.0
|
0.0
|
|
Seawater Intakes
|
Airport
|
SR07f
|
b
|
8.9
|
8.8
|
0.0
|
0.0
|
0.0
|
0.0
|
0.0
|
0.0
|
|
Spawning/Nursery Grounds
|
Fisheries Spawning Ground in North Lantau
|
SR08
|
a
|
8.2
|
5.6
|
0.0
|
0.0
|
0.0
|
0.0
|
0.0
|
0.0
|
|
Horseshoe Crab Nursery Grounds
|
Sham Wat Wan
|
SR10
|
a
|
8.9
|
6.5
|
0.3
|
0.1
|
0.0
|
0.0
|
0.1
|
0.0
|
|
Protection Zone
|
Chinese White Dolphin Protection Zone in Mainland Waters
|
SR11
|
a
|
8.9
|
6.5
|
0.5
|
0.1
|
0.1
|
0.0
|
0.2
|
0.0
|
|
Protection Zone
|
Chinese White Dolphin Protection Zone in Mainland Waters
|
SR11a
|
a
|
8.9
|
6.5
|
0.4
|
0.2
|
0.1
|
0.0
|
0.2
|
0.1
|
|
Protection Zone
|
Chinese White Dolphin Protection Zone in Mainland Waters
|
SR11b
|
a
|
8.9
|
6.5
|
0.5
|
0.2
|
0.1
|
0.0
|
0.2
|
0.1
|
|
Horseshoe Crab Nursery Grounds
|
Tai O
|
SR12
|
a
|
8.9
|
6.5
|
0.5
|
0.5
|
0.1
|
0.0
|
0.2
|
0.1
|
|
Intertidal Mudflats
|
Yi O
|
SR14
|
s
|
6.5
|
3.6
|
0.2
|
0.0
|
0.0
|
0.0
|
0.1
|
0.0
|
|
Horseshoe Crab Nursery Grounds
|
Yi O
|
SR14
|
a
|
8.9
|
6.5
|
0.4
|
0.5
|
0.1
|
0.0
|
0.2
|
0.0
|
|
Non-gazetted Beaches
|
Fan Lau Sai Wan
|
SR15a
|
a
|
6.9
|
5.5
|
1.3
|
0.6
|
0.1
|
0.0
|
0.2
|
0.1
|
|
Mangroves
|
Fan Lau Tung Wan
|
SR15b
|
s
|
4.5
|
3
|
0.2
|
0.1
|
0.0
|
0.0
|
0.0
|
0.0
|
|
Non-gazetted Beaches
|
Fan Lau Tung Wan
|
SR15b
|
a
|
6.9
|
5.5
|
0.3
|
1.5
|
0.0
|
0.0
|
0.0
|
0.1
|
|
Non-gazetted Beaches
|
Tsin Yue Wan
|
SR15c
|
a
|
6.9
|
5.5
|
1.4
|
0.3
|
0.1
|
0.0
|
0.2
|
0.1
|
|
Fish Fry Habitat
|
Pak Tso Wan
|
SR16b
|
a
|
6.9
|
5.5
|
3.5
|
1.1
|
0.1
|
0.0
|
0.2
|
0.0
|
|
Horseshoe Crab Nursery Grounds
|
Sha Lo Wan
|
SR18
|
a
|
7.8
|
4.8
|
0.1
|
0.0
|
0.0
|
0.0
|
0.0
|
0.0
|
|
Potential Marine Park
|
Southwest Lantau
|
SR19a
|
a
|
8.9
|
6.5
|
2.5
|
2.4
|
0.2
|
0.1
|
0.4
|
0.3
|
|
Potential Marine Park
|
Southwest Lantau
|
SR19b
|
a
|
8.9
|
6.5
|
4.4
|
6.9 (d)
|
0.2
|
0.2
|
0.5
|
0.5
|
|
Potential Marine Park
|
Southwest Lantau
|
SR19c
|
a
|
8.9
|
6.5
|
8.8
|
8.9 (d)
|
0.2
|
0.2
|
0.5
|
0.4
|
|
Spawning/Nursery Grounds
|
Fisheries Spawning/Nursery Grounds in South
Lantau
|
SR24
|
a
|
6.9
|
5.5
|
1.1
|
0.5
|
0.0
|
0.0
|
0.1
|
0.0
|
|
Spawning/Nursery Grounds
|
Fisheries Spawning/Nursery Grounds in South
Lantau
|
SR27
|
a
|
6.9
|
5.5
|
1.1
|
0.2
|
0.0
|
0.0
|
0.1
|
0.0
|
|
Subtidal Hard Bottom Habitat (coral)
|
Southern Side of South Soko
|
SR31
|
a
|
10 (c)
|
10 (c)
|
0.5
|
0.3
|
0.0
|
0.0
|
0.1
|
0.0
|
|
Intertidal Mudflats
|
Shui Hau Wan
|
SR33
|
s
|
3.9
|
2.5
|
0.0
|
0.0
|
0.0
|
0.0
|
0.0
|
0.0
|
|
Horseshoe Crab Nursery Grounds
|
Tong Fuk Miu Wan
|
SR33
|
a
|
4.8
|
3.9
|
0.0
|
0.0
|
0.0
|
0.0
|
0.0
|
0.0
|
|
Gazetted Beaches
|
Tong Fuk
|
SR34
|
a
|
4.8
|
3.9
|
0.0
|
0.0
|
0.0
|
0.0
|
0.0
|
0.0
|
|
Gazetted Beaches
|
Upper Cheung Sha Beach
|
SR35
|
a
|
4.8
|
3.9
|
0.0
|
0.0
|
0.0
|
0.0
|
0.0
|
0.0
|
|
Seagrass Beds/Mangroves
|
Tung Chung Bay
|
SR39
|
s
|
6.5
|
3.6
|
0.0
|
0.0
|
0.0
|
0.0
|
0.0
|
0.0
|
|
Horseshoe Crab Nursery Grounds
|
Tung Chung Bay
|
SR39
|
a
|
8.9
|
6.5
|
0.0
|
0.0
|
0.0
|
0.0
|
0.0
|
0.0
|
|
Notes:
a. s
= surface, m = middle, b = bottom, a = depth-averaged
b.
The
assessment criterion of 700 mg L-1 was adopted for these seawater
intakes.
c.
The tolerance assessment criterion
of 10 mg L-1 was adopted for the coral.
d. Shaded
area indicates non-compliance with the assessment criterion.
|
Table
66.20 Predicted
SS Elevation (mg L-1) for Scenario 9 - Grab Dredging for Pipeline
Section from West Lantau to Urmston Road Crossing (KP 24.5-31)
|
Sensitive Receiver
|
Name
|
ID
|
Relevant
Water Depth (a)
|
Allowable Elevation
|
Predicted
SS Elevation (mg L-1)
|
|
|
|
Dry
|
Wet
|
Dry
|
Wet
|
Dry
|
Wet
|
Dry
|
Wet
|
|
|
|
Max
|
Max
|
Mean
|
Mean
|
90%-tile
|
90%-tile
|
|
Intertidal Mudflats
|
Pak Nai
|
SR01
|
s
|
7.1
|
3.6
|
0.0
|
0.0
|
0.0
|
0.0
|
0.0
|
0.0
|
|
Horseshoe Crab Nursery Grounds
|
Pak Nai
|
SR01
|
a
|
9.7
|
6
|
0.0
|
0.0
|
0.0
|
0.0
|
0.0
|
0.0
|
|
Seagrass Beds/Mangroves/Oyster Farm
|
Pak Nai
|
SR02
|
s
|
7.1
|
3.6
|
0.0
|
0.0
|
0.0
|
0.0
|
0.0
|
0.0
|
|
Seawater Intakes
|
Black Point Power Station
|
SR04
|
b
|
700 (b)
|
700 (b)
|
0.0
|
0.0
|
0.0
|
0.0
|
0.0
|
0.0
|
|
Non-gazetted Beaches
|
Lung Kwu Sheung Tan
|
SR05a
|
a
|
8.2
|
5.6
|
0.0
|
0.0
|
0.0
|
0.0
|
0.0
|
0.0
|
|
Non-gazetted Beaches
|
Lung Kwu Tan
|
SR05b
|
a
|
8.2
|
5.6
|
0.0
|
0.0
|
0.0
|
0.0
|
0.0
|
0.0
|
|
Gazetted Beaches
|
Butterfly Beach
|
SR05c
|
a
|
8.2
|
5.6
|
0.0
|
0.0
|
0.0
|
0.0
|
0.0
|
0.0
|
|
Marine Park
|
Designated Sha Chau and Lung Kwu Chau
|
SR06a
|
a
|
8.2
|
5.6
|
0.7
|
0.8
|
0.1
|
0.1
|
0.3
|
0.2
|
|
Marine Park
|
Designated Sha Chau and Lung Kwu Chau
|
SR06b
|
a
|
8.2
|
5.6
|
4.6
|
5.4
|
0.2
|
0.1
|
0.6
|
0.3
|
|
Marine Park
|
Designated Sha Chau and Lung Kwu Chau
|
SR06c
|
a
|
8.2
|
5.6
|
0.0
|
0.0
|
0.0
|
0.0
|
0.0
|
0.0
|
|
Marine Park
|
Designated Sha Chau and Lung Kwu Chau
|
SR06d
|
a
|
8.2
|
5.6
|
0.0
|
0.1
|
0.0
|
0.0
|
0.0
|
0.0
|
|
Artificial Reef Deployment Area
|
Sha Chau and Lung Kwu Chau
|
SR06e
|
a
|
8.2
|
5.6
|
0.8
|
0.5
|
0.1
|
0.1
|
0.2
|
0.2
|
|
Seawater Intakes
|
Castle Peak Power Station
|
SR07a
|
b
|
700 (b)
|
700 (b)
|
0.0
|
0.0
|
0.0
|
0.0
|
0.0
|
0.0
|
|
Seawater Intakes
|
Tuen Mun Area 38
|
SR07b
|
b
|
14.2
|
9.8
|
0.0
|
0.0
|
0.0
|
0.0
|
0.0
|
0.0
|
|
Seawater Intakes
|
Airport
|
SR07c
|
b
|
8.9
|
8.8
|
0.0
|
0.0
|
0.0
|
0.0
|
0.0
|
0.0
|
|
Seawater Intakes
|
Airport
|
SR07d
|
b
|
8.9
|
8.8
|
0.0
|
0.0
|
0.0
|
0.0
|
0.0
|
0.0
|
|
Artificial Reef Deployment Area
|
Northeast Airport
|
SR07d
|
a
|
4.7
|
5.2
|
0.0
|
0.0
|
0.0
|
0.0
|
0.0
|
0.0
|
|
Seawater Intakes
|
Airport
|
SR07e
|
b
|
8.9
|
8.8
|
0.0
|
0.0
|
0.0
|
0.0
|
0.0
|
0.0
|
|
Seawater Intakes
|
Airport
|
SR07f
|
b
|
8.9
|
8.8
|
0.0
|
0.0
|
0.0
|
0.0
|
0.0
|
0.0
|
|
Spawning/Nursery Grounds
|
Fisheries Spawning Ground in North Lantau
|
SR08
|
a
|
8.2
|
5.6
|
0.0
|
0.0
|
0.0
|
0.0
|
0.0
|
0.0
|
|
Horseshoe Crab Nursery Grounds
|
Sham Wat Wan
|
SR10
|
a
|
8.9
|
6.5
|
0.1
|
0.1
|
0.0
|
0.0
|
0.0
|
0.0
|
|
Protection Zone
|
Chinese White Dolphin Protection Zone in Mainland Waters
|
SR11
|
a
|
8.9
|
6.5
|
0.1
|
0.1
|
0.0
|
0.0
|
0.1
|
0.0
|
|
Protection Zone
|
Chinese White Dolphin Protection Zone in Mainland Waters
|
SR11a
|
a
|
8.9
|
6.5
|
0.1
|
0.0
|
0.0
|
0.0
|
0.0
|
0.0
|
|
Protection Zone
|
Chinese White Dolphin Protection Zone in Mainland Waters
|
SR11b
|
a
|
8.9
|
6.5
|
0.1
|
0.0
|
0.0
|
0.0
|
0.0
|
0.0
|
|
Horseshoe Crab Nursery Grounds
|
Tai O
|
SR12
|
a
|
8.9
|
6.5
|
0.1
|
0.2
|
0.0
|
0.0
|
0.1
|
0.0
|
|
Intertidal Mudflats
|
Yi O
|
SR14
|
s
|
6.5
|
3.6
|
0.1
|
0.0
|
0.0
|
0.0
|
0.0
|
0.0
|
|
Horseshoe Crab Nursery Grounds
|
Yi O
|
SR14
|
a
|
8.9
|
6.5
|
0.1
|
0.1
|
0.0
|
0.0
|
0.0
|
0.0
|
|
Non-gazetted Beaches
|
Fan Lau Sai Wan
|
SR15a
|
a
|
6.9
|
5.5
|
0.0
|
0.0
|
0.0
|
0.0
|
0.0
|
0.0
|
|
Mangroves
|
Fan Lau Tung Wan
|
SR15b
|
s
|
4.5
|
3
|
0.0
|
0.0
|
0.0
|
0.0
|
0.0
|
0.0
|
|
Non-gazetted Beaches
|
Fan Lau Tung Wan
|
SR15b
|
a
|
6.9
|
5.5
|
0.0
|
0.0
|
0.0
|
0.0
|
0.0
|
0.0
|
|
Non-gazetted Beaches
|
Tsin Yue Wan
|
SR15c
|
a
|
6.9
|
5.5
|
0.0
|
0.0
|
0.0
|
0.0
|
0.0
|
0.0
|
|
Fish Fry Habitat
|
Pak Tso Wan
|
SR16b
|
a
|
6.9
|
5.5
|
0.0
|
0.0
|
0.0
|
0.0
|
0.0
|
0.0
|
|
Horseshoe Crab Nursery Grounds
|
Sha Lo Wan
|
SR18
|
a
|
7.8
|
4.8
|
0.0
|
0.1
|
0.0
|
0.0
|
0.0
|
0.0
|
|
Spawning/Nursery Grounds
|
Fisheries Spawning/Nursery Grounds in South
Lantau
|
SR24
|
a
|
6.9
|
5.5
|
0.0
|
0.0
|
0.0
|
0.0
|
0.0
|
0.0
|
|
Spawning/Nursery Grounds
|
Fisheries Spawning/Nursery Grounds in South
Lantau
|
SR27
|
a
|
6.9
|
5.5
|
0.0
|
0.0
|
0.0
|
0.0
|
0.0
|
0.0
|
|
Subtidal Hard Bottom Habitat (coral)
|
Southern Side of South Soko
|
SR31
|
a
|
10 (c)
|
10 (c)
|
0.0
|
0.0
|
0.0
|
0.0
|
0.0
|
0.0
|
|
Intertidal Mudflats
|
Shui Hau Wan
|
SR33
|
s
|
3.9
|
2.5
|
0.0
|
0.0
|
0.0
|
0.0
|
0.0
|
0.0
|
|
Horseshoe Crab Nursery Grounds
|
Tong Fuk Miu Wan
|
SR33
|
a
|
4.8
|
3.9
|
0.0
|
0.0
|
0.0
|
0.0
|
0.0
|
0.0
|
|
Gazetted Beaches
|
Tong Fuk
|
SR34
|
a
|
4.8
|
3.9
|
0.0
|
0.0
|
0.0
|
0.0
|
0.0
|
0.0
|
|
Gazetted Beaches
|
Upper Cheung Sha Beach
|
SR35
|
a
|
4.8
|
3.9
|
0.0
|
0.0
|
0.0
|
0.0
|
0.0
|
0.0
|
|
Seagrass Beds/Mangroves
|
Tung Chung Bay
|
SR39
|
s
|
6.5
|
3.6
|
0.0
|
0.0
|
0.0
|
0.0
|
0.0
|
0.0
|
|
Horseshoe Crab Nursery Grounds
|
Tung Chung Bay
|
SR39
|
a
|
8.9
|
6.5
|
0.0
|
0.0
|
0.0
|
0.0
|
0.0
|
0.0
|
|
Notes:
a. s
= surface, m = middle, b = bottom, a = depth-averaged
b.
The
assessment criterion of 700 mg L-1 was adopted for these seawater
intakes.
c.
The tolerance assessment criterion
of 10 mg L-1 was adopted for the coral.
|
Table
66.21 Predicted
SS Elevation (mg L-1) for Scenario 10 - Grab Dredging across Urmston Road
Crossing (KP 31-33.5)
|
Sensitive Receiver
|
Name
|
ID
|
Relevant Water Depth (a)
|
Allowable Elevation
|
Predicted
SS Elevation (mg L-1)
|
|
|
|
Dry
|
Wet
|
Dry
|
Wet
|
Dry
|
Wet
|
Dry
|
Wet
|
|
|
|
Max
|
Max
|
Mean
|
Mean
|
90%-tile
|
90%-tile
|
|
Intertidal Mudflats
|
Pak Nai
|
SR01
|
s
|
7.1
|
3.6
|
0.0
|
0.0
|
0.0
|
0.0
|
0.0
|
0.0
|
|
Horseshoe Crab Nursery Grounds
|
Pak Nai
|
SR01
|
a
|
9.7
|
6
|
0.0
|
0.0
|
0.0
|
0.0
|
0.0
|
0.0
|
|
Seagrass Beds/Mangroves/Oyster Farm
|
Pak Nai
|
SR02
|
s
|
7.1
|
3.6
|
0.0
|
0.0
|
0.0
|
0.0
|
0.0
|
0.0
|
|
Seawater Intakes
|
Black Point Power Station
|
SR04
|
b
|
700 (b)
|
700 (b)
|
0.0
|
0.0
|
0.0
|
0.0
|
0.0
|
0.0
|
|
Non-gazetted Beaches
|
Lung Kwu Sheung Tan
|
SR05a
|
a
|
8.2
|
5.6
|
0.0
|
0.0
|
0.0
|
0.0
|
0.0
|
0.0
|
|
Non-gazetted Beaches
|
Lung Kwu Tan
|
SR05b
|
a
|
8.2
|
5.6
|
0.0
|
0.0
|
0.0
|
0.0
|
0.0
|
0.0
|
|
Gazetted Beaches
|
Butterfly Beach
|
SR05c
|
a
|
8.2
|
5.6
|
0.0
|
0.0
|
0.0
|
0.0
|
0.0
|
0.0
|
|
Marine Park
|
Designated Sha Chau and Lung Kwu Chau
|
SR06a
|
a
|
8.2
|
5.6
|
4.3
|
2.0
|
0.2
|
0.1
|
0.7
|
0.4
|
|
Marine Park
|
Designated Sha Chau and Lung Kwu Chau
|
SR06b
|
a
|
8.2
|
5.6
|
0.3
|
0.1
|
0.0
|
0.0
|
0.1
|
0.0
|
|
Marine Park
|
Designated Sha Chau and Lung Kwu Chau
|
SR06c
|
a
|
8.2
|
5.6
|
0.1
|
0.1
|
0.0
|
0.0
|
0.0
|
0.0
|
|
Marine Park
|
Designated Sha Chau and Lung Kwu Chau
|
SR06d
|
a
|
8.2
|
5.6
|
0.0
|
0.0
|
0.0
|
0.0
|
0.0
|
0.0
|
|
Artificial Reef Deployment Area
|
Sha Chau and Lung Kwu Chau
|
SR06e
|
a
|
8.2
|
5.6
|
0.3
|
0.2
|
0.0
|
0.0
|
0.1
|
0.0
|
|
Seawater Intakes
|
Castle Peak Power Station
|
SR07a
|
b
|
700 (b)
|
700 (b)
|
0.0
|
0.0
|
0.0
|
0.0
|
0.0
|
0.0
|
|
Seawater Intakes
|
Tuen Mun Area 38
|
SR07b
|
b
|
14.2
|
9.8
|
0.0
|
0.0
|
0.0
|
0.0
|
0.0
|
0.0
|
|
Seawater Intakes
|
Airport
|
SR07c
|
b
|
8.9
|
8.8
|
0.0
|
0.0
|
0.0
|
0.0
|
0.0
|
0.0
|
|
Seawater Intakes
|
Airport
|
SR07d
|
b
|
8.9
|
8.8
|
0.0
|
0.0
|
0.0
|
0.0
|
0.0
|
0.0
|
|
Artificial Reef Deployment Area
|
Northeast Airport
|
SR07d
|
a
|
4.7
|
5.2
|
0.0
|
0.0
|
0.0
|
0.0
|
0.0
|
0.0
|
|
Seawater Intakes
|
Airport
|
SR07e
|
b
|
8.9
|
8.8
|
0.0
|
0.0
|
0.0
|
0.0
|
0.0
|
0.0
|
|
Seawater Intakes
|
Airport
|
SR07f
|
b
|
8.9
|
8.8
|
0.0
|
0.0
|
0.0
|
0.0
|
0.0
|
0.0
|
|
Spawning/Nursery Grounds
|
Fisheries Spawning Ground in North Lantau
|
SR08
|
a
|
8.2
|
5.6
|
0.0
|
0.0
|
0.0
|
0.0
|
0.0
|
0.0
|
|
Horseshoe Crab Nursery Grounds
|
Sham Wat Wan
|
SR10
|
a
|
8.9
|
6.5
|
0.0
|
0.0
|
0.0
|
0.0
|
0.0
|
0.0
|
|
Protection Zone
|
Chinese White Dolphin Protection Zone in Mainland Waters
|
SR11
|
a
|
8.9
|
6.5
|
0.0
|
0.1
|
0.0
|
0.0
|
0.0
|
0.0
|
|
Protection Zone
|
Chinese White Dolphin Protection Zone in Mainland Waters
|
SR11a
|
a
|
8.9
|
6.5
|
0.0
|
0.0
|
0.0
|
0.0
|
0.0
|
0.0
|
|
Protection Zone
|
Chinese White Dolphin Protection Zone in Mainland Waters
|
SR11b
|
a
|
8.9
|
6.5
|
0.0
|
0.0
|
0.0
|
0.0
|
0.0
|
0.0
|
|
Horseshoe Crab Nursery Grounds
|
Tai O
|
SR12
|
a
|
8.9
|
6.5
|
0.0
|
0.0
|
0.0
|
0.0
|
0.0
|
0.0
|
|
Intertidal Mudflats
|
Yi O
|
SR14
|
s
|
6.5
|
3.6
|
0.0
|
0.0
|
0.0
|
0.0
|
0.0
|
0.0
|
|
Horseshoe Crab Nursery Grounds
|
Yi O
|
SR14
|
a
|
8.9
|
6.5
|
0.0
|
0.0
|
0.0
|
0.0
|
0.0
|
0.0
|
|
Non-gazetted Beaches
|
Fan Lau Sai Wan
|
SR15a
|
a
|
6.9
|
5.5
|
0.0
|
0.0
|
0.0
|
0.0
|
0.0
|
0.0
|
|
Mangroves
|
Fan Lau Tung Wan
|
SR15b
|
s
|
4.5
|
3
|
0.0
|
0.0
|
0.0
|
0.0
|
0.0
|
0.0
|
|
Non-gazetted Beaches
|
Fan Lau Tung Wan
|
SR15b
|
a
|
6.9
|
5.5
|
0.0
|
0.0
|
0.0
|
0.0
|
0.0
|
0.0
|
|
Non-gazetted Beaches
|
Tsin Yue Wan
|
SR15c
|
a
|
6.9
|
5.5
|
0.0
|
0.0
|
0.0
|
0.0
|
0.0
|
0.0
|
|
Fish Fry Habitat
|
Pak Tso Wan
|
SR16b
|
a
|
6.9
|
5.5
|
0.0
|
0.0
|
0.0
|
0.0
|
0.0
|
0.0
|
|
Horseshoe Crab Nursery Grounds
|
Sha Lo Wan
|
SR18
|
a
|
7.8
|
4.8
|
0.0
|
0.0
|
0.0
|
0.0
|
0.0
|
0.0
|
|
Spawning/Nursery Grounds
|
Fisheries Spawning/Nursery Grounds in South
Lantau
|
SR24
|
a
|
6.9
|
5.5
|
0.0
|
0.0
|
0.0
|
0.0
|
0.0
|
0.0
|
|
Spawning/Nursery Grounds
|
Fisheries Spawning/Nursery Grounds in South
Lantau
|
SR27
|
a
|
6.9
|
5.5
|
0.0
|
0.0
|
0.0
|
0.0
|
0.0
|
0.0
|
|
Subtidal Hard Bottom Habitat (coral)
|
Southern Side of South Soko
|
SR31
|
a
|
10 (c)
|
10 (c)
|
0.0
|
0.0
|
0.0
|
0.0
|
0.0
|
0.0
|
|
Intertidal Mudflats
|
Shui Hau Wan
|
SR33
|
s
|
3.9
|
2.5
|
0.0
|
0.0
|
0.0
|
0.0
|
0.0
|
0.0
|
|
Horseshoe Crab Nursery Grounds
|
Tong Fuk Miu Wan
|
SR33
|
a
|
4.8
|
3.9
|
0.0
|
0.0
|
0.0
|
0.0
|
0.0
|
0.0
|
|
Gazetted Beaches
|
Tong Fuk
|
SR34
|
a
|
4.8
|
3.9
|
0.0
|
0.0
|
0.0
|
0.0
|
0.0
|
0.0
|
|
Gazetted Beaches
|
Upper Cheung Sha Beach
|
SR35
|
a
|
4.8
|
3.9
|
0.0
|
0.0
|
0.0
|
0.0
|
0.0
|
0.0
|
|
Seagrass Beds/Mangroves
|
Tung Chung Bay
|
SR39
|
s
|
6.5
|
3.6
|
0.0
|
0.0
|
0.0
|
0.0
|
0.0
|
0.0
|
|
Horseshoe Crab Nursery Grounds
|
Tung Chung Bay
|
SR39
|
a
|
8.9
|
6.5
|
0.0
|
0.0
|
0.0
|
0.0
|
0.0
|
0.0
|
|
Notes:
a. s
= surface, m = middle, b = bottom, a = depth-averaged
b.
The
assessment criterion of 700 mg L-1 was adopted for these seawater
intakes.
c.
The tolerance assessment criterion
of 10 mg L-1 was adopted for the coral.
|
Table
66.22 Predicted
SS Elevation (mg L-1) for Scenario 11 - Grab Dredging for Pipeline
Section at West of Black Point (KP 33.5-37)
|
Sensitive Receiver
|
Name
|
ID
|
Relevant Water Depth (a)
|
Allowable Elevation
|
Predicted
SS Elevation (mg L-1)
|
|
|
|
Dry
|
Wet
|
Dry
|
Wet
|
Dry
|
Wet
|
Dry
|
Wet
|
|
|
|
Max
|
Max
|
Mean
|
Mean
|
90%-tile
|
90%-tile
|
|
Intertidal Mudflats
|
Pak Nai
|
SR01
|
s
|
7.1
|
3.6
|
0.0
|
0.0
|
0.0
|
0.0
|
0.0
|
0.0
|
|
Horseshoe Crab Nursery Grounds
|
Pak Nai
|
SR01
|
a
|
9.7
|
6
|
0.1
|
0.1
|
0.0
|
0.0
|
0.0
|
0.0
|
|
Seagrass Beds/Mangroves/Oyster Farm
|
Pak Nai
|
SR02
|
s
|
7.1
|
3.6
|
0.0
|
0.0
|
0.0
|
0.0
|
0.0
|
0.0
|
|
Seawater Intakes
|
Black Point Power Station
|
SR04
|
b
|
700 (b)
|
700 (b)
|
0.4
|
0.9
|
0.0
|
0.1
|
0.1
|
0.1
|
|
Non-gazetted Beaches
|
Lung Kwu Sheung Tan
|
SR05a
|
a
|
8.2
|
5.6
|
0.1
|
0.0
|
0.0
|
0.0
|
0.0
|
0.0
|
|
Non-gazetted Beaches
|
Lung Kwu Tan
|
SR05b
|
a
|
8.2
|
5.6
|
0.1
|
0.0
|
0.0
|
0.0
|
0.0
|
0.0
|
|
Gazetted Beaches
|
Butterfly Beach
|
SR05c
|
a
|
8.2
|
5.6
|
0.0
|
0.0
|
0.0
|
0.0
|
0.0
|
0.0
|
|
Marine Park
|
Designated Sha Chau and Lung Kwu Chau
|
SR06a
|
a
|
8.2
|
5.6
|
0.4
|
0.4
|
0.0
|
0.1
|
0.1
|
0.2
|
|
Marine Park
|
Designated Sha Chau and Lung Kwu Chau
|
SR06b
|
a
|
8.2
|
5.6
|
0.2
|
0.1
|
0.0
|
0.0
|
0.0
|
0.0
|
|
Marine Park
|
Designated Sha Chau and Lung Kwu Chau
|
SR06c
|
a
|
8.2
|
5.6
|
0.6
|
0.4
|
0.1
|
0.1
|
0.3
|
0.2
|
|
Marine Park
|
Designated Sha Chau and Lung Kwu Chau
|
SR06d
|
a
|
8.2
|
5.6
|
0.3
|
0.2
|
0.0
|
0.0
|
0.1
|
0.1
|
|
Artificial Reef Deployment Area
|
Sha Chau and Lung Kwu Chau
|
SR06e
|
a
|
8.2
|
5.6
|
0.2
|
0.2
|
0.0
|
0.0
|
0.1
|
0.0
|
|
Seawater Intakes
|
Castle Peak Power Station
|
SR07a
|
b
|
700 (b)
|
700 (b)
|
0.5
|
0.5
|
0.1
|
0.1
|
0.2
|
0.1
|
|
Seawater Intakes
|
Tuen Mun Area 38
|
SR07b
|
b
|
14.2
|
9.8
|
0.3
|
0.2
|
0.0
|
0.0
|
0.1
|
0.1
|
|
Seawater Intakes
|
Airport
|
SR07c
|
b
|
8.9
|
8.8
|
0.1
|
0.1
|
0.0
|
0.0
|
0.0
|
0.0
|
|
Seawater Intakes
|
Airport
|
SR07d
|
b
|
8.9
|
8.8
|
0.0
|
0.0
|
0.0
|
0.0
|
0.0
|
0.0
|
|
Artificial Reef Deployment Area
|
Northeast Airport
|
SR07d
|
a
|
4.7
|
5.2
|
0.0
|
0.0
|
0.0
|
0.0
|
0.0
|
0.0
|
|
Seawater Intakes
|
Airport
|
SR07e
|
b
|
8.9
|
8.8
|
0.0
|
0.0
|
0.0
|
0.0
|
0.0
|
0.0
|
|
Seawater Intakes
|
Airport
|
SR07f
|
b
|
8.9
|
8.8
|
0.0
|
0.0
|
0.0
|
0.0
|
0.0
|
0.0
|
|
Spawning/Nursery Grounds
|
Fisheries Spawning Ground in North Lantau
|
SR08
|
a
|
8.2
|
5.6
|
0.4
|
0.3
|
0.1
|
0.1
|
0.3
|
0.2
|
|
Horseshoe Crab Nursery Grounds
|
Sham Wat Wan
|
SR10
|
a
|
8.9
|
6.5
|
0.0
|
0.1
|
0.0
|
0.0
|
0.0
|
0.0
|
|
Protection Zone
|
Chinese White Dolphin Protection Zone in Mainland Waters
|
SR11
|
a
|
8.9
|
6.5
|
0.0
|
0.1
|
0.0
|
0.0
|
0.0
|
0.0
|
|
Protection Zone
|
Chinese White Dolphin Protection Zone in Mainland Waters
|
SR11a
|
a
|
8.9
|
6.5
|
0.0
|
0.0
|
0.0
|
0.0
|
0.0
|
0.0
|
|
Protection Zone
|
Chinese White Dolphin Protection Zone in Mainland Waters
|
SR11b
|
a
|
8.9
|
6.5
|
0.0
|
0.0
|
0.0
|
0.0
|
0.0
|
0.0
|
|
Horseshoe Crab Nursery Grounds
|
Tai O
|
SR12
|
a
|
8.9
|
6.5
|
0.0
|
0.0
|
0.0
|
0.0
|
0.0
|
0.0
|
|
Intertidal Mudflats
|
Yi O
|
SR14
|
s
|
6.5
|
3.6
|
0.0
|
0.0
|
0.0
|
0.0
|
0.0
|
0.0
|
|
Horseshoe Crab Nursery Grounds
|
Yi O
|
SR14
|
a
|
8.9
|
6.5
|
0.0
|
0.0
|
0.0
|
0.0
|
0.0
|
0.0
|
|
Non-gazetted Beaches
|
Fan Lau Sai Wan
|
SR15a
|
a
|
6.9
|
5.5
|
0.0
|
0.0
|
0.0
|
0.0
|
0.0
|
0.0
|
|
Mangroves
|
Fan Lau Tung Wan
|
SR15b
|
s
|
4.5
|
3
|
0.0
|
0.0
|
0.0
|
0.0
|
0.0
|
0.0
|
|
Non-gazetted Beaches
|
Fan Lau Tung Wan
|
SR15b
|
a
|
6.9
|
5.5
|
0.0
|
0.0
|
0.0
|
0.0
|
0.0
|
0.0
|
|
Non-gazetted Beaches
|
Tsin Yue Wan
|
SR15c
|
a
|
6.9
|
5.5
|
0.0
|
0.0
|
0.0
|
0.0
|
0.0
|
0.0
|
|
Fish Fry Habitat
|
Pak Tso Wan
|
SR16b
|
a
|
6.9
|
5.5
|
0.0
|
0.0
|
0.0
|
0.0
|
0.0
|
0.0
|
|
Horseshoe Crab Nursery Grounds
|
Sha Lo Wan
|
SR18
|
a
|
7.8
|
4.8
|
0.0
|
0.0
|
0.0
|
0.0
|
0.0
|
0.0
|
|
Spawning/Nursery Grounds
|
Fisheries Spawning/Nursery Grounds in South
Lantau
|
SR24
|
a
|
6.9
|
5.5
|
0.0
|
0.0
|
0.0
|
0.0
|
0.0
|
0.0
|
|
Spawning/Nursery Grounds
|
Fisheries Spawning/Nursery Grounds in South
Lantau
|
SR27
|
a
|
6.9
|
5.5
|
0.0
|
0.0
|
0.0
|
0.0
|
0.0
|
0.0
|
|
Subtidal Hard Bottom Habitat (coral)
|
Southern Side of South Soko
|
SR31
|
a
|
10 (c)
|
10 (c)
|
0.0
|
0.0
|
0.0
|
0.0
|
0.0
|
0.0
|
|
Intertidal Mudflats
|
Shui Hau Wan
|
SR33
|
s
|
3.9
|
2.5
|
0.0
|
0.0
|
0.0
|
0.0
|
0.0
|
0.0
|
|
Horseshoe Crab Nursery Grounds
|
Tong Fuk Miu Wan
|
SR33
|
a
|
4.8
|
3.9
|
0.0
|
0.0
|
0.0
|
0.0
|
0.0
|
0.0
|
|
Gazetted Beaches
|
Tong Fuk
|
SR34
|
a
|
4.8
|
3.9
|
0.0
|
0.0
|
0.0
|
0.0
|
0.0
|
0.0
|
|
Gazetted Beaches
|
Upper Cheung Sha Beach
|
SR35
|
a
|
4.8
|
3.9
|
0.0
|
0.0
|
0.0
|
0.0
|
0.0
|
0.0
|
|
Seagrass Beds/Mangroves
|
Tung Chung Bay
|
SR39
|
s
|
6.5
|
3.6
|
0.0
|
0.0
|
0.0
|
0.0
|
0.0
|
0.0
|
|
Horseshoe Crab Nursery Grounds
|
Tung Chung Bay
|
SR39
|
a
|
8.9
|
6.5
|
0.0
|
0.0
|
0.0
|
0.0
|
0.0
|
0.0
|
|
Notes:
s
= surface, m = middle, b = bottom, a = depth-averaged
The assessment criterion of 700 mg L-1
was adopted for these seawater intakes.
The tolerance assessment criterion
of 10 mg L-1 was adopted for the coral.
|
Table
66.23 Predicted SS Elevation (mg L-1)
for Scenario 12 - Grab Dredging for Pipeline Section at West of Black Point (KP
37-37.803)
|
Sensitive Receiver
|
Name
|
ID
|
Relevant Water Depth (a)
|
Allowable Elevation
|
Predicted
SS Elevation (mg L-1)
|
|
|
|
Dry
|
Wet
|
Dry
|
Wet
|
Dry
|
Wet
|
Dry
|
Wet
|
|
|
|
Max
|
Max
|
Mean
|
Mean
|
90%-tile
|
90%-tile
|
|
Intertidal Mudflats
|
Pak Nai
|
SR01
|
s
|
7.1
|
3.6
|
0.1
|
0.3
|
0.0
|
0.0
|
0.0
|
0.0
|
|
Horseshoe Crab Nursery Grounds
|
Pak Nai
|
SR01
|
a
|
9.7
|
6
|
0.4
|
0.5
|
0.0
|
0.0
|
0.1
|
0.1
|
|
Seagrass Beds/Mangroves/Oyster Farm
|
Pak Nai
|
SR02
|
s
|
7.1
|
3.6
|
0.0
|
0.0
|
0.0
|
0.0
|
0.0
|
0.0
|
|
Seawater Intakes
|
Black Point Power Station
|
SR04
|
b
|
700 (b)
|
700 (b)
|
6.1
|
4.3
|
0.6
|
0.4
|
1.8
|
1.7
|
|
Non-gazetted Beaches
|
Lung Kwu Sheung Tan
|
SR05a
|
a
|
8.2
|
5.6
|
0.3
|
0.0
|
0.0
|
0.0
|
0.0
|
0.0
|
|
Non-gazetted Beaches
|
Lung Kwu Tan
|
SR05b
|
a
|
8.2
|
5.6
|
0.2
|
0.1
|
0.0
|
0.0
|
0.0
|
0.0
|
|
Gazetted Beaches
|
Butterfly Beach
|
SR05c
|
a
|
8.2
|
5.6
|
0.0
|
0.0
|
0.0
|
0.0
|
0.0
|
0.0
|
|
Marine Park
|
Designated Sha Chau and Lung Kwu Chau
|
SR06a
|
a
|
8.2
|
5.6
|
0.0
|
0.0
|
0.0
|
0.0
|
0.0
|
0.0
|
|
Marine Park
|
Designated Sha Chau and Lung Kwu Chau
|
SR06b
|
a
|
8.2
|
5.6
|
0.0
|
0.0
|
0.0
|
0.0
|
0.0
|
0.0
|
|
Marine Park
|
Designated Sha Chau and Lung Kwu Chau
|
SR06c
|
a
|
8.2
|
5.6
|
0.1
|
0.1
|
0.0
|
0.0
|
0.0
|
0.0
|
|
Marine Park
|
Designated Sha Chau and Lung Kwu Chau
|
SR06d
|
a
|
8.2
|
5.6
|
0.1
|
0.0
|
0.0
|
0.0
|
0.0
|
0.0
|
|
Artificial Reef Deployment Area
|
Sha Chau and Lung Kwu Chau
|
SR06e
|
a
|
8.2
|
5.6
|
0.0
|
0.0
|
0.0
|
0.0
|
0.0
|
0.0
|
|
Seawater Intakes
|
Castle Peak Power Station
|
SR07a
|
b
|
700 (b)
|
700 (b)
|
0.4
|
0.6
|
0.0
|
0.0
|
0.1
|
0.1
|
|
Seawater Intakes
|
Tuen Mun Area 38
|
SR07b
|
b
|
14.2
|
9.8
|
0.1
|
0.2
|
0.0
|
0.0
|
0.1
|
0.0
|
|
Seawater Intakes
|
Airport
|
SR07c
|
b
|
8.9
|
8.8
|
0.0
|
0.0
|
0.0
|
0.0
|
0.0
|
0.0
|
|
Seawater Intakes
|
Airport
|
SR07d
|
b
|
8.9
|
8.8
|
0.0
|
0.0
|
0.0
|
0.0
|
0.0
|
0.0
|
|
Artificial Reef Deployment Area
|
Northeast Airport
|
SR07d
|
a
|
4.7
|
5.2
|
0.0
|
0.0
|
0.0
|
0.0
|
0.0
|
0.0
|
|
Seawater Intakes
|
Airport
|
SR07e
|
b
|
8.9
|
8.8
|
0.0
|
0.0
|
0.0
|
0.0
|
0.0
|
0.0
|
|
Seawater Intakes
|
Airport
|
SR07f
|
b
|
8.9
|
8.8
|
0.0
|
0.0
|
0.0
|
0.0
|
0.0
|
0.0
|
|
Spawning/Nursery Grounds
|
Fisheries Spawning Ground in North Lantau
|
SR08
|
a
|
8.2
|
5.6
|
0.1
|
0.1
|
0.0
|
0.0
|
0.0
|
0.0
|
|
Horseshoe Crab Nursery Grounds
|
Sham Wat Wan
|
SR10
|
a
|
8.9
|
6.5
|
0.0
|
0.0
|
0.0
|
0.0
|
0.0
|
0.0
|
|
Protection Zone
|
Chinese White Dolphin Protection Zone in Mainland Waters
|
SR11
|
a
|
8.9
|
6.5
|
0.0
|
0.0
|
0.0
|
0.0
|
0.0
|
0.0
|
|
Protection Zone
|
Chinese White Dolphin Protection Zone in Mainland Waters
|
SR11a
|
a
|
8.9
|
6.5
|
0.0
|
0.0
|
0.0
|
0.0
|
0.0
|
0.0
|
|
Protection Zone
|
Chinese White Dolphin Protection Zone in Mainland Waters
|
SR11b
|
a
|
8.9
|
6.5
|
0.0
|
0.0
|
0.0
|
0.0
|
0.0
|
0.0
|
|
Horseshoe Crab Nursery Grounds
|
Tai O
|
SR12
|
a
|
8.9
|
6.5
|
0.0
|
0.0
|
0.0
|
0.0
|
0.0
|
0.0
|
|
Intertidal Mudflats
|
Yi O
|
SR14
|
s
|
6.5
|
3.6
|
0.0
|
0.0
|
0.0
|
0.0
|
0.0
|
0.0
|
|
Horseshoe Crab Nursery Grounds
|
Yi O
|
SR14
|
a
|
8.9
|
6.5
|
0.0
|
0.0
|
0.0
|
0.0
|
0.0
|
0.0
|
|
Non-gazetted Beaches
|
Fan Lau Sai Wan
|
SR15a
|
a
|
6.9
|
5.5
|
0.0
|
0.0
|
0.0
|
0.0
|
0.0
|
0.0
|
|
Mangroves
|
Fan Lau Tung Wan
|
SR15b
|
s
|
4.5
|
3
|
0.0
|
0.0
|
0.0
|
0.0
|
0.0
|
0.0
|
|
Non-gazetted Beaches
|
Fan Lau Tung Wan
|
SR15b
|
a
|
6.9
|
5.5
|
0.0
|
0.0
|
0.0
|
0.0
|
0.0
|
0.0
|
|
Non-gazetted Beaches
|
Tsin Yue Wan
|
SR15c
|
a
|
6.9
|
5.5
|
0.0
|
0.0
|
0.0
|
0.0
|
0.0
|
0.0
|
|
Fish Fry Habitat
|
Pak Tso Wan
|
SR16b
|
a
|
6.9
|
5.5
|
0.0
|
0.0
|
0.0
|
0.0
|
0.0
|
0.0
|
|
Horseshoe Crab Nursery Grounds
|
Sha Lo Wan
|
SR18
|
a
|
7.8
|
4.8
|
0.0
|
0.0
|
0.0
|
0.0
|
0.0
|
0.0
|
|
Spawning/Nursery Grounds
|
Fisheries Spawning/Nursery Grounds in South
Lantau
|
SR24
|
a
|
6.9
|
5.5
|
0.0
|
0.0
|
0.0
|
0.0
|
0.0
|
0.0
|
|
Spawning/Nursery Grounds
|
Fisheries Spawning/Nursery Grounds in South
Lantau
|
SR27
|
a
|
6.9
|
5.5
|
0.0
|
0.0
|
0.0
|
0.0
|
0.0
|
0.0
|
|
Subtidal Hard Bottom Habitat (coral)
|
Southern Side of South Soko
|
SR31
|
a
|
10 (c)
|
10 (c)
|
0.0
|
0.0
|
0.0
|
0.0
|
0.0
|
0.0
|
|
Intertidal Mudflats
|
Shui Hau Wan
|
SR33
|
s
|
3.9
|
2.5
|
0.0
|
0.0
|
0.0
|
0.0
|
0.0
|
0.0
|
|
Horseshoe Crab Nursery Grounds
|
Tong Fuk Miu Wan
|
SR33
|
a
|
4.8
|
3.9
|
0.0
|
0.0
|
0.0
|
0.0
|
0.0
|
0.0
|
|
Gazetted Beaches
|
Tong Fuk
|
SR34
|
a
|
4.8
|
3.9
|
0.0
|
0.0
|
0.0
|
0.0
|
0.0
|
0.0
|
|
Gazetted Beaches
|
Upper Cheung Sha Beach
|
SR35
|
a
|
4.8
|
3.9
|
0.0
|
0.0
|
0.0
|
0.0
|
0.0
|
0.0
|
|
Seagrass Beds/Mangroves
|
Tung Chung Bay
|
SR39
|
s
|
6.5
|
3.6
|
0.0
|
0.0
|
0.0
|
0.0
|
0.0
|
0.0
|
|
Horseshoe Crab Nursery Grounds
|
Tung Chung Bay
|
SR39
|
a
|
8.9
|
6.5
|
0.0
|
0.0
|
0.0
|
0.0
|
0.0
|
0.0
|
|
Notes:
·
s = surface, m = middle, b =
bottom, a = depth-averaged
· The assessment criterion of 700 mg L-1
was adopted for these seawater intakes.
·
The tolerance assessment criterion
of 10 mg L-1 was adopted for the coral.
|
Table 66.24 Predicted SS Elevation (mg L-1)
for Scenario 13 - Grab Dredging for Pipeline Section at Black Point
Shore Approach (KP
37.803-38.303)
|
Sensitive Receiver
|
Name
|
ID
|
Relevant Water Depth (a)
|
Allowable Elevation
|
Predicted
SS Elevation (mg L-1)
|
|
|
|
Dry
|
Wet
|
Dry
|
Wet
|
Dry
|
Wet
|
Dry
|
Wet
|
|
|
|
Max
|
Max
|
Mean
|
Mean
|
90%-tile
|
90%-tile
|
|
Intertidal Mudflats
|
Pak Nai
|
SR01
|
s
|
7.1
|
3.6
|
0.1
|
0.2
|
0.0
|
0.0
|
0.0
|
0.0
|
|
Horseshoe Crab Nursery Grounds
|
Pak Nai
|
SR01
|
a
|
9.7
|
6
|
0.3
|
0.4
|
0.0
|
0.0
|
0.1
|
0.1
|
|
Seagrass Beds/Mangroves/Oyster Farm
|
Pak Nai
|
SR02
|
s
|
7.1
|
3.6
|
0.0
|
0.0
|
0.0
|
0.0
|
0.0
|
0.0
|
|
Seawater Intakes
|
Black Point Power Station
|
SR04
|
b
|
700 (b)
|
700 (b)
|
1.5
|
1.4
|
0.1
|
0.1
|
0.3
|
0.3
|
|
Non-gazetted Beaches
|
Lung Kwu Sheung Tan
|
SR05a
|
a
|
8.2
|
5.6
|
0.2
|
0.0
|
0.0
|
0.0
|
0.0
|
0.0
|
|
Non-gazetted Beaches
|
Lung Kwu Tan
|
SR05b
|
a
|
8.2
|
5.6
|
0.1
|
0.1
|
0.0
|
0.0
|
0.0
|
0.0
|
|
Gazetted Beaches
|
Butterfly Beach
|
SR05c
|
a
|
8.2
|
5.6
|
0.0
|
0.0
|
0.0
|
0.0
|
0.0
|
0.0
|
|
Marine Park
|
Designated Sha Chau and Lung Kwu Chau
|
SR06a
|
a
|
8.2
|
5.6
|
0.0
|
0.0
|
0.0
|
0.0
|
0.0
|
0.0
|
|
Marine Park
|
Designated Sha Chau and Lung Kwu Chau
|
SR06b
|
a
|
8.2
|
5.6
|
0.0
|
0.0
|
0.0
|
0.0
|
0.0
|
0.0
|
|
Marine Park
|
Designated Sha Chau and Lung Kwu Chau
|
SR06c
|
a
|
8.2
|
5.6
|
0.1
|
0.1
|
0.0
|
0.0
|
0.0
|
0.0
|
|
Marine Park
|
Designated Sha Chau and Lung Kwu Chau
|
SR06d
|
a
|
8.2
|
5.6
|
0.1
|
0.0
|
0.0
|
0.0
|
0.0
|
0.0
|
|
Artificial Reef Deployment Area
|
Sha Chau and Lung Kwu Chau
|
SR06e
|
a
|
8.2
|
5.6
|
0.0
|
0.0
|
0.0
|
0.0
|
0.0
|
0.0
|
|
Seawater Intakes
|
Castle Peak Power Station
|
SR07a
|
b
|
700 (b)
|
700 (b)
|
0.3
|
0.4
|
0.0
|
0.0
|
0.1
|
0.1
|
|
Seawater Intakes
|
Tuen Mun Area 38
|
SR07b
|
b
|
14.2
|
9.8
|
0.2
|
0.1
|
0.0
|
0.0
|
0.1
|
0.0
|
|
Seawater Intakes
|
Airport
|
SR07c
|
b
|
8.9
|
8.8
|
0.0
|
0.0
|
0.0
|
0.0
|
0.0
|
0.0
|
|
Seawater Intakes
|
Airport
|
SR07d
|
b
|
8.9
|
8.8
|
0.0
|
0.0
|
0.0
|
0.0
|
0.0
|
0.0
|
|
Artificial Reef Deployment Area
|
Northeast Airport
|
SR07d
|
a
|
4.7
|
5.2
|
0.0
|
0.0
|
0.0
|
0.0
|
0.0
|
0.0
|
|
Seawater Intakes
|
Airport
|
SR07e
|
b
|
8.9
|
8.8
|
0.0
|
0.0
|
0.0
|
0.0
|
0.0
|
0.0
|
|
Seawater Intakes
|
Airport
|
SR07f
|
b
|
8.9
|
8.8
|
0.0
|
0.0
|
0.0
|
0.0
|
0.0
|
0.0
|
|
Spawning/Nursery Grounds
|
Fisheries Spawning Ground in North Lantau
|
SR08
|
a
|
8.2
|
5.6
|
0.1
|
0.1
|
0.0
|
0.0
|
0.0
|
0.0
|
|
Horseshoe Crab Nursery Grounds
|
Sham Wat Wan
|
SR10
|
a
|
8.9
|
6.5
|
0.0
|
0.0
|
0.0
|
0.0
|
0.0
|
0.0
|
|
Protection Zone
|
Chinese White Dolphin Protection Zone in Mainland Waters
|
SR11
|
a
|
8.9
|
6.5
|
0.0
|
0.0
|
0.0
|
0.0
|
0.0
|
0.0
|
|
Protection Zone
|
Chinese White Dolphin Protection Zone in Mainland Waters
|
SR11a
|
a
|
8.9
|
6.5
|
0.0
|
0.0
|
0.0
|
0.0
|
0.0
|
0.0
|
|
Protection Zone
|
Chinese White Dolphin Protection Zone in Mainland Waters
|
SR11b
|
a
|
8.9
|
6.5
|
0.0
|
0.0
|
0.0
|
0.0
|
0.0
|
0.0
|
|
Horseshoe Crab Nursery Grounds
|
Tai O
|
SR12
|
a
|
8.9
|
6.5
|
0.0
|
0.0
|
0.0
|
0.0
|
0.0
|
0.0
|
|
Intertidal Mudflats
|
Yi O
|
SR14
|
s
|
6.5
|
3.6
|
0.0
|
0.0
|
0.0
|
0.0
|
0.0
|
0.0
|
|
Horseshoe Crab Nursery Grounds
|
Yi O
|
SR14
|
a
|
8.9
|
6.5
|
0.0
|
0.0
|
0.0
|
0.0
|
0.0
|
0.0
|
|
Non-gazetted Beaches
|
Fan Lau Sai Wan
|
SR15a
|
a
|
6.9
|
5.5
|
0.0
|
0.0
|
0.0
|
0.0
|
0.0
|
0.0
|
|
Mangroves
|
Fan Lau Tung Wan
|
SR15b
|
s
|
4.5
|
3
|
0.0
|
0.0
|
0.0
|
0.0
|
0.0
|
0.0
|
|
Non-gazetted Beaches
|
Fan Lau Tung Wan
|
SR15b
|
a
|
6.9
|
5.5
|
0.0
|
0.0
|
0.0
|
0.0
|
0.0
|
0.0
|
|
Non-gazetted Beaches
|
Tsin Yue Wan
|
SR15c
|
a
|
6.9
|
5.5
|
0.0
|
0.0
|
0.0
|
0.0
|
0.0
|
0.0
|
|
Fish Fry Habitat
|
Pak Tso Wan
|
SR16b
|
a
|
6.9
|
5.5
|
0.0
|
0.0
|
0.0
|
0.0
|
0.0
|
0.0
|
|
Horseshoe Crab Nursery Grounds
|
Sha Lo Wan
|
SR18
|
a
|
7.8
|
4.8
|
0.0
|
0.0
|
0.0
|
0.0
|
0.0
|
0.0
|
|
Spawning/Nursery Grounds
|
Fisheries Spawning/Nursery Grounds in South
Lantau
|
SR24
|
a
|
6.9
|
5.5
|
0.0
|
0.0
|
0.0
|
0.0
|
0.0
|
0.0
|
|
Spawning/Nursery Grounds
|
Fisheries Spawning/Nursery Grounds in South
Lantau
|
SR27
|
a
|
6.9
|
5.5
|
0.0
|
0.0
|
0.0
|
0.0
|
0.0
|
0.0
|
|
Subtidal Hard Bottom Habitat (coral)
|
Southern Side of South Soko
|
SR31
|
a
|
10 (c)
|
10 (c)
|
0.0
|
0.0
|
0.0
|
0.0
|
0.0
|
0.0
|
|
Intertidal Mudflats
|
Shui Hau Wan
|
SR33
|
s
|
3.9
|
2.5
|
0.0
|
0.0
|
0.0
|
0.0
|
0.0
|
0.0
|
|
Horseshoe Crab Nursery Grounds
|
Tong Fuk Miu Wan
|
SR33
|
a
|
4.8
|
3.9
|
0.0
|
0.0
|
0.0
|
0.0
|
0.0
|
0.0
|
|
Gazetted Beaches
|
Tong Fuk
|
SR34
|
a
|
4.8
|
3.9
|
0.0
|
0.0
|
0.0
|
0.0
|
0.0
|
0.0
|
|
Gazetted Beaches
|
Upper Cheung Sha Beach
|
SR35
|
a
|
4.8
|
3.9
|
0.0
|
0.0
|
0.0
|
0.0
|
0.0
|
0.0
|
|
Seagrass Beds/Mangroves
|
Tung Chung Bay
|
SR39
|
s
|
6.5
|
3.6
|
0.0
|
0.0
|
0.0
|
0.0
|
0.0
|
0.0
|
|
Horseshoe Crab Nursery Grounds
|
Tung Chung Bay
|
SR39
|
a
|
8.9
|
6.5
|
0.0
|
0.0
|
0.0
|
0.0
|
0.0
|
0.0
|
|
Notes:
·
s = surface, m = middle, b =
bottom, a = depth-averaged
· The assessment criterion of 700 mg L-1
was adopted for these seawater intakes.
·
The tolerance assessment criterion
of 10 mg L-1 was adopted for the coral.
|
6.6.2 Sediment Deposition
The majority of SS elevations in
water have been predicted to be temporary and to remain within relatively close
proximity to the dredging or jetting works and, as such, the majority of
sediment has been predicted to settle within relatively close proximity of the
works areas.
The
simulated deposition rates ([46])
at the artificial reefs (ARs), i.e., SR6e and SR7d and the subtidal hard bottom
habitat, i.e., SR31 during the dry and wet seasons have been assessed for the
respective construction works. Table 6.25 summarises the predicted
deposition rates. The exceedances, which
are predicted to occur at SR31 only, are marginally above the criterion of 200
g m-2 day-1. Based
on the model results, the exceedances are mainly due to the dredging works at
the approach channel and the turning basin.
It
is anticipated that the exceedances could be mitigated by deploying a silt
curtain (stand type) enclosing the coral area.
The SS elevations would be reduced by a factor of 2.5 or about 60% ([47])
and hence the deposition rates will be reduced and a level well below the
criterion. Thus, no unacceptable impacts
are expected to be posed by the works.
Table 66.25 Predicted Deposition Rate (g m-2
day-1) for the Marine Works at the Artificial Reefs and Subtidal
Hard Bottom Habitat
|
LNG Terminal, Submarine Water Main and Submarine Cable Circuit
|
|
|
|
|
|
|
|
Sensitive Receiver
|
Name
|
ID
|
Assessment Criterion
|
Scenario 1
|
Scenario 2
|
Scenario 3
|
|
|
|
|
|
(g m-2 day-1)
|
Dry
|
Wet
|
Dry
|
Wet
|
Dry
|
Wet
|
|
|
Artificial Reef Deployment Area
|
Sha Chau and Lung Kwu Chau
|
SR06e
|
200
|
0.0
|
0.0
|
0.0
|
0.0
|
0.0
|
0.0
|
|
|
Artificial Reef Deployment Area
|
Northeast Airport
|
SR07d
|
200
|
0.0
|
0.0
|
0.0
|
0.0
|
0.0
|
0.0
|
|
|
Subtidal Hard Bottom Habitat (coral)
|
Southern Side of South Soko
|
SR31
|
200
|
33.9
|
31.6
|
1.6
|
1.5
|
4.9
|
3.7
|
|
|
LNG Terminal, Submarine Water Main and Submarine Cable Circuit
|
|
|
|
|
|
|
|
|
|
Sensitive Receiver
|
Name
|
ID
|
Assessment Criterion
|
Scenario 4a
|
Scenario 4b
|
Scenario 5
|
Scenario 6
|
|
|
|
|
(g m-2 day-1)
|
Dry
|
Wet
|
Dry
|
Wet
|
Dry
|
Wet
|
Dry
|
Wet
|
|
Artificial Reef Deployment Area
|
Sha Chau and Lung Kwu Chau
|
SR06e
|
200
|
0.0
|
0.0
|
0.0
|
0.0
|
0.0
|
0.0
|
0.1
|
0.0
|
|
Artificial Reef Deployment Area
|
Northeast Airport
|
SR07d
|
200
|
0.0
|
0.0
|
0.0
|
0.0
|
0.0
|
0.1
|
0.0
|
0.0
|
|
Subtidal Hard Bottom Habitat (coral)
|
Southern Side of South Soko
|
SR31
|
200
|
209.4 (a)
|
221.5 (a)
|
131.1
|
182.4
|
85.6
|
90.4
|
0.0
|
0.0
|
Table 66.25
(cont’d) Predicted Deposition Rate
(g m-2 day-1) for the Marine Works at the Artificial
Reefs and Subtidal Hard Bottom Habitat
|
Submarine Gas Pipeline
|
|
|
|
|
|
|
|
Sensitive Receiver
|
Name
|
ID
|
Assessment Criterion
|
Scenario 7
(Grab Dredging at KP 0-1)
|
Scenario 8
(TSHD Dredging at KP 1-24.5)
|
Scenario 9
(Grab Dredging at KP 24.5-31)
|
|
|
|
|
(g m-2 day-1)
|
Dry
|
Wet
|
Dry
|
Wet
|
Dry
|
Wet
|
|
Artificial Reef Deployment Area
|
Sha Chau and Lung Kwu Chau
|
SR06e
|
200
|
0.0
|
0.0
|
0.1
|
0.2
|
2.7
|
2.6
|
|
Artificial Reef Deployment Area
|
Northeast Airport
|
SR07d
|
200
|
0.0
|
0.0
|
0.0
|
0.0
|
0.0
|
0.0
|
|
Subtidal Hard Bottom Habitat (coral)
|
Southern Side of South Soko
|
SR31
|
200
|
1.0
|
1.4
|
1.1
|
0.6
|
0.0
|
0.0
|
Table 66.25
(cont’d) Predicted Deposition Rate
(g m-2 day-1) for the Marine Works at the Artificial
Reefs and Subtidal Hard Bottom Habitat
|
Sensitive Receiver
|
Name
|
ID
|
Assessment Criterion
|
Scenario 10
(Grab Dredging at
KP 31-33.5)
|
Scenario 11
(Grab Dredging at KP 33.5-37)
|
Scenario 12
(Grab Dredging at KP 37-37.803)
|
Scenario 13
(Grab Dredging at KP
37.803-38.303)
|
|
|
|
|
(g m-2 day-1)
|
Dry
|
Wet
|
Dry
|
Wet
|
Dry
|
Wet
|
Dry
|
Wet
|
|
Artificial Reef Deployment Area
|
Sha Chau and Lung Kwu Chau
|
SR06e
|
200
|
0.6
|
0.3
|
0.5
|
0.5
|
0.1
|
0.1
|
0.1
|
0.1
|
|
Artificial Reef Deployment Area
|
Northeast Airport
|
SR07d
|
200
|
0.0
|
0.0
|
0.0
|
0.0
|
0.0
|
0.0
|
0.0
|
0.0
|
|
Subtidal Hard Bottom Habitat (coral)
|
Southern Side of South Soko
|
SR31
|
200
|
0.0
|
0.0
|
0.0
|
0.0
|
0.0
|
0.0
|
0.0
|
0.0
|
Notes:
o
The shaded area indicates non-compliance
with the assessment criterion.
6.6.3 Dissolved Oxygen Depletion
The
dispersion of sediment due to dredging/jetting operations is not expected to
impact the general water quality of the receiving waters. Due to the low nutrient content of sediments
(see Part 2 – Section 7: Waste Management),
the elevation in SS levels is not expected to cause a pronounced increase in
oxygen demand and, therefore, the effect on dissolved oxygen (DO) is
anticipated to be minor. Therefore, the
effects of increased SS concentrations as a result of the proposed works on
levels of dissolved oxygen, biochemical oxygen demand and nutrients (as
unionised ammonia) are predicted to be minimal.
Effects will be transient, localised in extent and of a small
magnitude. As such, no adverse impacts
to water quality through sediment release are expected to occur.
In
order to verify the above assessment, depletion of dissolved oxygen has been
calculated. The sediment plumes
predicted from the modelling runs described above would have a negligible
effect on dissolved oxygen levels in the receiving waters. The degree of oxygen depletion exerted by a
sediment plume is a function of the sediment oxygen demand of the sediment, its
concentration in the water column and the rate of oxygen replenishment.
The
impact of the sediment oxygen demand (SOD) on dissolved oxygen concentrations
has been calculated based on the following equation ([48]):
DODep
= C * SOD * K * 10-6
where DODep = Dissolved oxygen depletion (mg L-1)
C = Suspended solids concentration (mg L-1)
SOD = Sediment oxygen demand (mg kg-1)
K = Daily oxygen uptake factor (set as 1
([49]))
By
reviewing the EPD sediment quality monitoring data and the recent approved EIA
Report ([50])
which used 15,000 mg kg-1 for North Western WCZ, the sediment oxygen
demand criteria used in this study are 20,000 mg kg-1 for Deep Bay
WCZ and North Western WCZ and 12,000 mg kg-1 for Southern WCZ.
In
the abovementioned EIA Report, K was set to be 1, which means instantaneous
oxidation of the sediment oxygen demand.
This was a conservative prediction of DO depletion since oxygen
depletion is not instantaneous and will depend on tidally averaged suspended
sediment concentrations.
It
is worth noting that the above equation does not account for re-aeration which
would tend to reduce impacts of SS on the DO concentrations in the water
column. The proposed analysis, which is
on the conservative side, will not, therefore, underestimate the DO depletion.
Further,
it should be noted that time has to pass for sediment in suspension to exert
any oxygen demand in the water column and, in the meantime, the sediment will
be transported and mixed or dispersed with oxygenated water. As a result, the oxygen demand and the impact
on DO concentrations will diminish as the suspended sediment concentrations
decrease.
The
most sensitive receivers to the DO depletion are likely to be the ecological
and fisheries resources. The results (Table 6.26) show that the predicted
oxygen depletion at these WSRs is predicted to be compliant with the WQO
criterion, with the exception of SR16b (fish fry habitat at Pak Tso Wan).
For
SR16b, mitigation measures such as deployment of a silt screen enclosing the
bay are recommended to be used to reduce the SS level and hence the DO
depletion to an acceptable level.
Details of the mitigation measures are discussed in Section 6.8.
Contour
plots of maximum DO depletion are shown in Annex
6C. It shows that DO is depleted by
less than 1 mg L-1 for most of construction works with exception for
the sandfilling works and those non-stationary works, i.e. jetting for water
main (Scenario 3), TSHD dredging for approach channel and turning basin
(Scenario 4b), and jetting for submarine cable (Scenario 5). Interpreting the maximum depletion plots for
the moving sources should be treated with caution. The maximum DO level plots for those moving
sources are gestalt image and may not be representative of any given moment in
time. The time in which each grid cell’s
maximum occurs is independent of the other grid cells.
For
the sandfilling works, the impacts would be substantially reduced when the
seawall in reality ([51])
is to be in place, as aforementioned in Section
6.6.1, to minimise the spread of sediment and hence DO depletion.
Table 66.26 Predicted Dissolved Oxygen Depletion (mg L-1)
for Scenarios 1 to 3 due to Increase in SS Concentrations (only results where
depletions are predicted have been presented)
|
LNG Terminal, Submarine Water Main and Submarine Cable Circuit
|
|
|
|
|
|
|
|
|
|
|
Sensitive Receiver
|
Name
|
ID
|
Relevant Depth 1
|
WQO Allowable Depletion
|
Scenario 1
|
Scenario 2
|
Scenario 3
|
|
Dry
|
Wet
|
Dry
|
Wet
|
Dry
|
Wet
|
Dry
|
Wet
|
|
Max
|
Max
|
Max
|
Max
|
Max
|
Max
|
|
Fish Fry Habitat
|
Pak Tso Wan
|
SR16b
|
a
|
4
|
3.9
|
0.3
|
0.4
|
0.2
|
0.2
|
0.4
|
0.7
|
|
Spawning/Nursery Grounds
|
Fisheries Spawning/Nursery Grounds in South
Lantau
|
SR24
|
a
|
4.2
|
3.8
|
0.0
|
0.0
|
0.0
|
0.0
|
0.0
|
0.0
|
|
|
|
SR27
|
a
|
4.2
|
3.8
|
0.0
|
0.0
|
0.0
|
0.0
|
0.0
|
0.0
|
|
Subtidal Hard Bottom Habitat (coral)
|
Southern Side of South Soko
|
SR31
|
a
|
4
|
3.9
|
0.0
|
0.0
|
0.0
|
0.0
|
0.0
|
0.0
|
Table 66.26
(cont’d) Predicted Dissolved
Oxygen Depletion (mg L-1) for Scenarios 4a to 5 due to Increase in
SS Concentrations (only results where depletions are predicted have been
presented)
|
LNG Terminal, Submarine Water Main and Submarine Cable Circuit
|
|
|
|
|
|
|
|
|
|
|
Sensitive Receiver
|
Name
|
ID
|
Relevant Depth 1
|
WQO Allowable
Depletion
|
Scenario 4a
|
Scenario 4b
|
Scenario 5
|
|
Dry
|
Wet
|
Dry
|
Wet
|
Dry
|
Wet
|
Dry
|
Wet
|
|
Max
|
Max
|
Max
|
Max
|
Max
|
Max
|
|
Fish Fry Habitat
|
Pak Tso Wan
|
SR16b
|
a
|
4
|
3.9
|
0.0
|
0.0
|
0.0
|
0.0
|
0.0
|
0.1
|
|
Spawning/Nursery Grounds
|
Fisheries Spawning/Nursery Grounds in South
Lantau
|
SR24
|
a
|
4.2
|
3.8
|
0.0
|
0.0
|
0.0
|
0.0
|
0.0
|
0.0
|
|
|
|
SR27
|
a
|
4.2
|
3.8
|
0.0
|
0.0
|
0.0
|
0.0
|
0.0
|
0.0
|
|
Subtidal Hard Bottom Habitat (coral)
|
Southern Side of South Soko
|
SR31
|
a
|
4
|
3.9
|
0.2
|
0.1
|
0.2
|
0.2
|
0.1
|
0.0
|
Table 66.26
(cont’d) Predicted Dissolved Oxygen Depletion
(mg L-1) for Scenario 6 due to Increase in SS Concentrations (only
results where depletions are predicted have been presented)
|
LNG Terminal, Submarine Water Main and Submarine Cable Circuit
|
|
|
|
|
|
|
Sensitive Receiver
|
Name
|
ID
|
Relevant Depth 1
|
WQO Allowable
Depletion
|
Scenario 6
|
|
Dry
|
Wet
|
Dry
|
Wet
|
|
Max
|
Max
|
|
Intertidal
Mudflats
|
Pak
Nai
|
SR01
|
s
|
3.6
|
3.3
|
0.0
|
0.0
|
|
Horseshoe
Crab Nursery Grounds
|
Pak
Nai
|
SR01
|
a
|
3.6
|
3.3
|
0.1
|
0.0
|
|
Seagrass
Beds/Mangroves/Oyster Farm
|
Pak
Nai
|
SR02
|
s
|
3.6
|
3.3
|
0.0
|
0.0
|
|
Artificial
Reef Deployment Area
|
Sha
Chau and Lung Kwu Chau
|
SR06e
|
a
|
3.9
|
2.8
|
0.0
|
0.0
|
|
Fish Fry Habitat
|
Pak Tso Wan
|
SR16b
|
a
|
4
|
3.9
|
0.0
|
0.0
|
|
Spawning/Nursery Grounds
|
Fisheries Spawning/Nursery Grounds in South
Lantau
|
SR24
|
a
|
4.2
|
3.8
|
0.0
|
0.0
|
|
|
|
SR27
|
a
|
4.2
|
3.8
|
0.0
|
0.0
|
|
Subtidal Hard Bottom Habitat (coral)
|
Southern Side of South Soko
|
SR31
|
a
|
4
|
3.9
|
0.0
|
0.0
|
Table 66.26
(cont’d) Predicted Dissolved Oxygen
Depletion (mg L-1) for Scenario 7 due to Increase in SS
Concentrations (only results where depletions are predicted have been
presented)
|
Submarine Gas Pipeline
|
|
|
|
|
|
|
|
|
Sensitive Receiver
|
Name
|
ID
|
Relevant Depth 1
|
WQO Allowable Depletion
|
Scenario 7
|
|
|
Dry
|
Wet
|
Dry
|
Dry
|
|
|
Max
|
Max
|
|
|
Marine Park
|
Designated Sha Chau and Lung Kwu Chau
|
SR06a
|
a
|
3.9
|
2.8
|
0.0
|
0.0
|
|
|
Marine Park
|
Designated Sha Chau and Lung Kwu Chau
|
SR06b
|
a
|
3.9
|
2.8
|
0.0
|
0.0
|
|
|
Artificial Reef Deployment Area
|
Sha Chau and Lung Kwu Chau
|
SR06e
|
a
|
3.9
|
2.8
|
0.0
|
0.0
|
|
|
Spawning/Nursery Grounds
|
Fisheries Spawning/Nursery Grounds in North
Lantau
|
SR08
|
a
|
3.9
|
2.8
|
0.0
|
0.0
|
|
|
Fish Fry Habitat
|
Pak Tso Wan
|
SR16b
|
a
|
4
|
3.9
|
0.0
|
0.0
|
|
|
Subtidal Hard Bottom Habitat (coral)
|
Southern Side of South Soko
|
SR31
|
a
|
4
|
3.9
|
0.0
|
0.0
|
|
Table 66.26
(cont’d) Predicted Dissolved
Oxygen Depletion (mg L-1) for Scenarios 8 and 9 due to Increase in
SS Concentrations (only results where depletions are predicted have been
presented)
|
Submarine Gas Pipeline
|
|
|
|
|
|
|
|
|
|
Sensitive Receiver
|
Name
|
ID
|
Relevant Depth 1
|
WQO Allowable
Depletion
|
Scenario 8
|
Scenario 9
|
|
Dry
|
Wet
|
Dry
|
Wet
|
Dry
|
Wet
|
|
Max
|
Max
|
Max
|
Max
|
|
Marine Park
|
Designated Sha Chau and Lung Kwu Chau
|
SR06a
|
a
|
3.9
|
2.8
|
0.0
|
0.0
|
0.0
|
0.0
|
|
Marine Park
|
Designated Sha Chau and Lung Kwu Chau
|
SR06b
|
a
|
3.9
|
2.8
|
0.0
|
0.0
|
0.1
|
0.1
|
|
Marine Park
|
Potential Southwest Lantau
|
SR19a
|
a
|
4
|
3.9
|
0.5
|
0.5
|
0.1
|
0.0
|
|
Marine Park
|
Potential Southwest Lantau
|
SR19b
|
a
|
4
|
3.9
|
0.9
|
1.4
|
0.1
|
0.0
|
|
Marine Park
|
Potential Southwest Lantau
|
SR19c
|
a
|
4
|
3.9
|
1.8
|
1.8
|
0.0
|
0.0
|
|
Artificial Reef Deployment Area
|
Sha Chau and Lung Kwu Chau
|
SR06e
|
a
|
3.9
|
2.8
|
0.0
|
0.0
|
0.0
|
0.0
|
|
Spawning/Nursery Grounds
|
Fisheries Spawning/Nursery Grounds in North
Lantau
|
SR08
|
a
|
3.9
|
2.8
|
0.0
|
0.0
|
0.0
|
0.0
|
|
Fish Fry Habitat
|
Pak Tso Wan
|
SR16b
|
a
|
4
|
3.9
|
0.0
|
0.0
|
0.0
|
0.0
|
|
Subtidal Hard Bottom Habitat (coral)
|
Southern Side of South Soko
|
SR31
|
a
|
4
|
3.9
|
0.0
|
0.0
|
0.0
|
0.0
|
Table 66.26
(cont’d) Predicted Dissolved Oxygen
Depletion (mg L-1) for Scenarios 10 and 11 due to Increase in SS
Concentrations (only results where depletions are predicted have been
presented)
|
Submarine Gas Pipeline
|
|
|
|
|
|
|
|
|
|
Sensitive Receiver
|
Name
|
ID
|
Relevant Depth 1
|
WQO Allowable Depletion
|
Scenario 10
|
Scenario 11
|
|
Dry
|
Wet
|
Dry
|
Wet
|
Dry
|
Wet
|
|
Max
|
Max
|
Max
|
Max
|
|
Marine Park
|
Designated Sha Chau and Lung Kwu Chau
|
SR06a
|
a
|
3.9
|
2.8
|
0.1
|
0.0
|
0.0
|
0.0
|
|
Marine Park
|
Designated Sha Chau and Lung Kwu Chau
|
SR06b
|
a
|
3.9
|
2.8
|
0.0
|
0.0
|
0.0
|
0.0
|
|
Artificial Reef Deployment Area
|
Sha Chau and Lung Kwu Chau
|
SR06e
|
a
|
3.9
|
2.8
|
0.0
|
0.0
|
0.0
|
0.0
|
|
Spawning/Nursery Grounds
|
Fisheries Spawning/Nursery Grounds in North
Lantau
|
SR08
|
a
|
3.9
|
2.8
|
0.0
|
0.0
|
0.0
|
0.0
|
|
Fish Fry Habitat
|
Pak Tso Wan
|
SR16b
|
a
|
4
|
3.9
|
0.0
|
0.0
|
0.0
|
0.0
|
|
Subtidal Hard Bottom Habitat (coral)
|
Southern Side of South Soko
|
SR31
|
a
|
4
|
3.9
|
0.0
|
0.0
|
0.0
|
0.0
|
Table 66.26
(cont’d) Predicted Dissolved Oxygen
Depletion (mg L-1) for Scenarios 12 and 13 due to Increase in SS
Concentrations (only results where depletions are predicted have been
presented)
|
Submarine Gas Pipeline
|
|
|
|
|
|
|
|
|
|
Sensitive Receiver
|
Name
|
ID
|
Relevant Depth (a)
|
WQO Allowable Depletion
|
Scenario 12
|
Scenario 13
|
|
Dry
|
Wet
|
Dry
|
Wet
|
Dry
|
Wet
|
|
Max
|
Max
|
Max
|
Max
|
|
Marine Park
|
Designated Sha Chau and Lung Kwu Chau
|
SR06a
|
a
|
3.9
|
2.8
|
0.0
|
0.0
|
0.0
|
0.0
|
|
Marine Park
|
Designated Sha Chau and Lung Kwu Chau
|
SR06b
|
a
|
3.9
|
2.8
|
0.0
|
0.0
|
0.0
|
0.0
|
|
Artificial Reef Deployment Area
|
Sha Chau and Lung Kwu Chau
|
SR06e
|
a
|
3.9
|
2.8
|
0.0
|
0.0
|
0.0
|
0.0
|
|
Spawning/Nursery Grounds
|
Fisheries Spawning/Nursery Grounds in North
Lantau
|
SR08
|
a
|
3.9
|
2.8
|
0.0
|
0.0
|
0.0
|
0.0
|
|
Fish Fry Habitat
|
Pak Tso Wan
|
SR16b
|
a
|
4
|
3.9
|
0.0
|
0.0
|
0.0
|
0.0
|
|
Subtidal Hard Bottom Habitat (coral)
|
Southern Side of South Soko
|
SR31
|
a
|
4
|
3.9
|
0.0
|
0.0
|
0.0
|
0.0
|
Notes:
a. s
= surface, m = middle, b = bottom, a = depth-averaged
6.6.4 Nutrients
An
assessment of nutrient release during dredging has been carried out in relation
to the modelling results of the sediment plume due to unmitigated dredging
works and the sediment testing results. In
the calculation it has been assumed that all TIN and unionised ammonia (NH3-N)
concentrations in the sediments are released to the water. This is the most conservative assumption and
will likely result in an overestimation of the potential impacts.
The maximum predicted SS concentration at
each SR is multiplied by the maximum concentration of TIN in sediment (mg kg-1)
in the corresponding WCZ to give the maximum increase in TIN (mg L-1). The calculations of TIN are shown below.
|
Deep Bay WCZ
|
NW WCZ
|
South WCZ
|
|
Max SS * 142 * 10-6
|
Max SS * 100 * 10-6
|
Max SS * 71 * 10-6
|
The
calculated TIN concentrations due to the increase in SS by the dredging works
are presented in Annex 6D based on
the marine sediment testing results (Part
2 – Section 7: Waste Management).
The existing water quality conditions in Deep Bay WCZ, North Western WCZ
and Southern WCZ have already breached the WQO
for TIN. The increase in TIN
concentrations at all sensitive receivers would be less than 0.006 mg L-1,
which is considered to be a minimal effect on the water quality. The dredging works will not significantly
contribute to the non-compliance with the WQO.
Ammoniacal Nitrogen (NH4-N) is
the sum of ionised ammoniacal nitrogen and unionised nitrogen (NH3-N). Under normal conditions of Hong
Kong waters, more than 90% of the ammoniacal nitrogen would be in
the ionised form. For the purpose of
assessment, a correction (as a function of temperature, pH, and salinity) has
been applied based on the EPD monitoring data, i.e. temperature of 24 degrees
Celsius, salinity of 28 ppt and pH of 8 which represent the typical conditions
of Hong Kong waters. From this it
derived that NH3-N constitutes 5% of ammoniacal nitrogen. In view that the mineralisation of the organic
nitrogen will also contribute to ammonia, the calculations of NH3-N
are based on maximum TKN concentrations (mg kg-1) in the sediment in
each WCZ. Note that it is a highly
conservative approach since it is assumed that 100% of organic nitrogen will be
mineralised to ammonium but this is unlikely to occur in reality.
The maximum SS concentration at each SR is
multiplied by the following factors for the calculations of NH3-N.
|
Deep Bay WCZ
|
NW WCZ
|
South WCZ
|
|
Max SS * 2,600 * 10-6 * 5%
|
Max SS * 2,100 * 10-6 * 5%
|
Max SS * 1,300 * 10-6 * 5%
|
The
results which are presented in Annex 6D
show that the increase in NH3-N concentrations due to the dredging
works would be negligible relative to the ambient concentrations. The total concentrations of NH3-N
at the water quality sensitive receivers are predicted to be well below the WQO
criterion of 0.021 mg L-1.Thus it is anticipated that the impacts of
the SS elevations due to the dredging works on the nutrient levels are minimal
and acceptable.
6.6.5 Heavy Metals and Micro-Organic
Pollutants
Elutriate
tests were carried out to assess the potential of release of heavy metals and
micro-organic pollutants from the dredged marine mud. The test results have been assessed and compared
to the relevant water quality standards as shown in Annex 6D.
The
results show that dissolved metal concentrations for all samples are below the
reporting limits, with the exception of copper.
In addition, all dissolved metal concentrations are found to be well
below the water quality standards.
The
results also show that PAHs, PCBs, TBT and chlorinated pesticides are all below
the reporting limits. This indicates
that the leaching of these pollutants is unlikely to occur at levels of concern.
Unacceptable
water quality impacts due to the potential release of heavy metals and
micro-organic pollutants from the dredged sediment are not expected to occur.
6.6.6 Piling
Works
The
LNG jetty will be located to the south of the South Soko Island.
There will be two installation methods for the piling works (see Part 2 – Section 3: Project Description),
namely bored piles and percussive piles.
Bored Piles
For
the bored piles, a permanent casing will be driven into the seabed and the excavation
of the marine soil will then be occur inside.
After the removal of marine soil, an I-beam will be put inside the
casing, followed by concreting. Since
the excavation of mud will be carried out inside the casing, it is anticipated
that any sediment will be trapped within the casing. In addition, the quantity of the excavated
marine mud is expected to be minimal and the mud will be disposed of by a
barge. Therefore, it is unlikely to
cause unacceptable impacts to the surrounding water.
Percussive Piles
The
percussive piles comprising steel piles below seabed level and cast in situ
reinforced concrete piles above seabed level.
This is achieved by driving steel tubes down to required design soil
resistances then filling the tubes from just below seabed level. No soil or sediment excavation will be
carried out. It is hence expected that
the piling works will cause limited disturbance to the sediments and are
unlikely to cause unacceptable impacts to the receiving water.
6.6.7 Wastewater Discharges
It is conservatively assumed that a
workforce of up to 1,600 people may be required during the construction
stage. Wastewater from temporary on-site
facilities will be controlled to prevent direct discharges to marine waters
adjacent to the reclamation. Wastewater
may include sewage effluent from toilets and discharges from on-site kitchen
facilities. It is assumed that the unit
flow per construction worker on a remote site will be similar to a temporary
housing area for which a value of 150 L per head per day is adopted. For a workforce of 1,600 people this will
equate to a flow of 240m3 day-1. The influent strength will be in accordance
with Table 4 of the DSD’s sewage manual.
The options for dealing with sewage generated
from a construction site work force are as follows:
·
Option 1, Septic Tank Soakaway: This is considered acceptable for small
quantities of sewage and where the ground conditions are suitable with
appropriate soak away capacity. This
will only be considered for a small number of workers at an isolated location,
but not for the main site area for which a more robust system is required to
handle the estimated flow of 240m3 day-1.
·
Option 2, Collect and Convey to a Public
STW:
This is a commonly adopted approach by contractors working in the more
urbanised areas of Hong Kong, where there is
no viable public sewer or a septic tank soakaway near to the site. South
Soko Island
is a remote island for which there is no existing public sewage works available. During the early stages of the site formation
works when the construction force is relatively low, i.e. up to 500 people,
this option would likely to be viable and cost effective and as such the
contractor may elect to collect and convey the sewage from the island to a
Public Sewage Treatment Plant in a nearby land base area such as Tsing Yi. However, if the anticipated average sewage
volume of 150 L per head per day is actually realised, the viability and cost
effectiveness of this option may diminish as the workforce increases to the
assumed 1,600 people during the construction of the process facility. In this event the contractor may consider
setting up a temporary sewage treatment facility on site as described in Option
3. In reality, the actual sewage flow
generated from the construction work force is likely to be much less than the
assumed average of 150 L per head per day and also the maximum number
of workers is considered to be a conservative estimate. The viability and selection of this option
would therefore need to be assessed by the contractor at the time of
construction. However, it is noted that
collection and conveyance of the sewage provides a secure disposal option
without the risk of operational problems that may occur with a temporary sewage
treatment works.
·
Option 3, Provision of Temporary STW to
Serve the Work Force: Due to the remoteness of the site and the
relatively large sewage volume it is feasible that the contractor may elect to
construct a temporary sewage treatment works.
For this scenario, during the construction stage, the contractor would
likely choose the nearest sensible point to dispose of the treated sewage. For this purpose a point immediately north of
the proposed Tung Wan area is selected as the most likely location for
discharge into the sea in order to place it within an area with active currents
to assist with dispersion (Figure 6.10). It is assumed that the treated sewage will be
discharged through an open pipe without the need for dispersers.
For
the purpose of the EIA, Option 3 is adopted in the computational model for the
water quality assessment as it is the most onerous scenario assuming the
anticipated larger sewage flow may be generated and the contractor may wish to
consider this option. Modelling has
been conducted to determine the dispersion of treated wastewater discharges
during the construction phase as described in the Water Quality Method Statement (Annex
6A).
In order to satisfy the requirements
of the WPCO-TM
effluent discharge standard, a Blivet Process train sewage treatment plant is
recommended although the Contractor will select their own preferred solution.
The results (Annex 6E) indicate that the impacts are negligible. No non-compliances with the WQO or tolerance criterion
are predicted to occur in either the dry or wet seasons.
6.6.8 Land Based Construction
Activities
During land based construction
activities for the LNG terminal and for the access roads, the primary sources
of potential impacts to water quality will be from pollutants in site run-off
which may enter marine waters.
Due
to limited space at South Soko site, all
excavated soil will be delivered off-site (see details in Part 2 – Section 7: Waste Management).
A drainage system will be
constructed around the land based working sites for the tanks. However, such drainage system can only be
constructed after slope cutting works which is required for the site formation. The drainage will collect the site runoff and
prevent it from running into the surrounding water.
With the proper implementation of
mitigation measures as recommended in (Section
6.8.2), it is anticipated that no adverse water quality impacts would arise
from the land based works.
6.6.9 Vessel Discharges
Construction vessels have the
potential to generate the following liquid discharges:
·
Uncontaminated deck drainage;
·
Ballast water (in emergency situations
only);
·
Potentially contaminated drainage from
machinery spaces; and
·
Sewage/grey water.
Deck drainage is likely to be
uncontaminated and is not likely to impact water quality.
Ballast water will be taken on and
will therefore not be discharged during normal operations. In the event that ballast water does need to be
discharged, it will not be contaminated and thus has no implications for water
quality.
Other sources of possible impacts to
water quality may arise from discharges of hydrocarbons (oil and grease) from
machinery space drainage and Biochemical Oxygen Demand (BOD) and
microbiological constituents associated with sewage/grey water. These waste streams are all readily amenable
to control as part of appropriate practice on vessels. Possible impacts associated with construction
vessels discharges are therefore considered to be minor.
No solid wastes will be permitted to
be disposed of overboard by vessels during construction works, thus impacts
from such sources will be eliminated.
6.6.10 Hydrotest Water
Before installation of the tank wall
insulation, raw freshwater will be needed to hydrotest the LNG tanks and
associated gas pipeline. Similarly, the
submarine pipeline would be hydrotested with water prior to commissioning.
Hydrotest for Tanks
The
potential additive to the hydrotest water will be low concentrations of
chlorine (approximately 0.05 mg L-1). It is expected that the
discharged water will be discharged at the new outfall at South
Soko, which will comply with the WQOs and discharge license
requirements.
Hydrotest for Pipeline
Hydrotest water will not contain a
dye chemical but may contain trace concentrations of a corrosion
inhibitor. Added chemicals may include
an oxygen scavenger (e.g., Ammonium bisulphite) and an antifoulant (e.g., Phosphonium
sulphate). The purpose of the oxygen
scavenger would be to react with the oxygen within the hydrotest water to form
an aggregate, ideally consuming all oxygen in the water. Oxygen scavengers are designed to be
non-toxic.
The antifoulant would be added to
inhibit biological growth within the tanks and the pipeline. Potential impacts to water quality would
arise from the potentially anoxic condition of the hydrotest water, as well as
potential toxicity presented by the antifoulant.
The corrosion inhibitor for the hydrotest
is widely used in the oil and gas industry.
The ecotoxicity and safety information for the proposed corrosion
inhibitor to be used for the hydrotest is summarised below and presented in Annex 6J. It shows that the corrosion inhibitor is harmless
to moderately toxic to organisms.
The hydrotested water will be
discharged at a discharge rate of 0.19 m3 s-1 from either
the existing Black Point Power Station cooling water outfall or the new South Soko outfall.
The discharge will only last for about 2 days.
A near-field modelling study has
been carried out to assess the initial dilution since the decay rate of the
chemicals involved in the pipeline testing is unclear. The model assumptions are presented in Annex 6A.
Table 6.27
shows the LC50 ([52])
/EC50 ([53])
determined from the toxicity test results for each group (Annex 6J). The corrosion
inhibitor (with initial concentration of 50,000 mg L-1) will be
diluted to these values in order to avoid adverse impacts to these organisms
and hence a dilution factor for each group is determined.
Table 66.27 Toxicity Results (LC50 /EC50)
and the Corresponding Dilution Factor
|
Organism to be Responded
|
LC50 /EC50 (mg L-1)
|
Dilution Factor (Dilution Rate)
|
|
Fish
|
LC50 >1000
|
50 (0.02)
|
|
Marine invertebrates
|
EC50 = 260.1
|
200 (0.005)
|
Tables 6.28 and
6.29 show the distance away from the
release point to achieve the required dilution rates for both seasons. .
Table 66.28 Model Results for Hydrotested Water Released
at Black Point
|
Dilution Factor (Dilution Rate)
|
Achieved during Dry Season:
|
Achieved during Wet Season:
|
|
50
(0.02)
|
<
100m
|
<
100m
|
|
200
(0.005)
|
<
100m
|
<
100m
|
Table 66.29 Model Results for Hydrotested Water Released
at South Soko
|
Dilution rate
|
Achieved during Dry Season:
|
Achieved during Wet Season:
|
|
50
(0.02)
|
13 – 50
m
|
200 –
300 m
|
|
200
(0.005)
|
150 –
500 m
|
0.7 – 1
km
|
The
results show that when the hydrotested water is released at the Black Point
Power Station cooling water outfall, the required dilution of 50 and 200 will
be achieved in the close proximity of the outfall. Assuming that the hydrotested water is
released at the new South Soko outfall, the
dilution achievement is slightly better in the dry season than in the wet
season. For both seasons, a dilution of
50 and 200 would be obtained within less than 1 km from the outfall. Hence the effect of the corrosion inhibitor on the fish and
marine invertebrates is minimal.
6.7 Operation
Phase Water Quality Impact Assessment
6.7.1 Hydrodynamics
Changes to water quality,
sedimentation and erosion processes would arise if there was a significant change
to the hydrodynamic regime of the South Soko
coastline due to the reclamation works and seawall construction in the eastern
and western sides of the island.
The design of the proposed LNG
terminal has incorporated considerations to reduce impacts to
hydrodynamics. The terminal footprint is
relatively small (with less than 2 hectares of reclaimed land, see Part 2 – Section 3: Project Description)
and is confined to areas of low current movement and water circulation (Figures SK_B01-B08 in Annex 6B). As such, adverse impacts to hydrodynamics are
not expected to occur.
The approach channel and the turning
basin will be located to the south of the South Soko Island.
The approach channel and turning basin will be dredged to approximately
-15.0 mPD. The results of modelling
current velocities (Figures SK_F01-08
in Annex 6F) indicated that
hydrodynamic changes due to the deepened seabed level are negligible. No adverse impacts to water quality as a
result of these minor changes in hydrodynamics are expected to occur.
The model results also show that at
the location of the outfall, i.e. to the southeast of South Soko Island, the low speed currents inhibit
the spread of pollutants resulting in no impacts to the water quality sensitive
receivers. .
6.7.2 Suspended Sediments
Maintenance Dredging
Dredging
works associated with maintenance of the approach channel and turning basin are
predicted to be approximately 10 to 20 kiloton year-1, which is
equivalent to approximately 1 to 2 cm year-1, which is of a lower
magnitude than those associated with the construction phase dredging. According to these estimates, maintenance
dredging is expected to be required once every ten years and will be restricted
to specific small areas.
Apart from the low frequency of the
maintenance dredging, the scale of the maintenance dredging would be much less
than the dredging works for the approach channel and turning basin which has
been assessed as unlikely to pose any adverse water quality impacts on the sensitive
receivers. Hence, although increases in
suspended solids in the water column may occur, these would be expected to be
compliant with applicable standards. By
implementing applicable mitigation measures such as deployment of silt curtain
(stand type and/or cage type) the SS elevation would be further reduced. Thus, any associated impacts are expected to
be of a relatively low scale, temporary and localised to the works area.
6.7.3 Temperature
Cooled Water Discharge
During the operation of the LNG
terminal, there will be cooled water discharges from the terminal outfall as
seawater will be used in the Open Rack Vaporizers. Cooled water with a temperature of
approximately 12.5°C below ambient will be discharged at the seawater
outfall, which is located close to the seabed in the vicinity of the LNG
carrier jetty. There are no water
quality sensitive receivers in the immediate vicinity of the proposed discharge
point.
The maximum flow rate of the
discharge is expected to be equivalent to 18,000 m3 hr-1. Compliance with the WQO (D ± 2 °C from ambient) must be achieved at
sensitive receivers. The discharge of
cooled water has been simulated using computational modelling.
The results from the cooled water
discharge modelling are included in Annex
6G and have been presented as contour plots showing impacts of cooled water
discharges in the vicinity of the outfall.
Figures SK_G01-G02 show the
differences of the maximum temperature reduction between the maximum
operational discharges and the baseline, representing the most conservative
case.
It can be seen from the contour
plots that the extent of temperature change from ambient for both the wet and
dry seasons is predicted to be confined to the bottom layer, with no impact to
the surface layer of the water column and no impact at sensitive
receivers. This may be expected as the
discharge of cooled water is close to the bottom and the relatively higher
density of the cooled water results in weak vertical mixing.
Due
to the distance to sensitive receivers, no non-compliance with the WQO has been
predicted in either the dry or wet seasons.
For the most conservative case (maximum operational discharge, see Figures SK_G01 and SK_G02), the
temperature change is predicted to be less than 2 °C in both the dry and wet
seasons. The temperature change of 2 °C will be confined to < 200 m
from the outfall in the dry season and the wet season. The model results indicate that the
dispersion of cooled water is rapid and not expected to cause an unacceptable
impact.
6.7.4 Residual Chlorine
Dispersion
To counteract settling and actively
growing fouling organisms, the LNG cooled water circuits will be dosed with
antifoulants. An efficient anti-biofouling
system will be designed to prevent the growth of micro and macrofouling
organisms on surfaces that are immersed in or in contact with seawater. Anitfoulant control in the once through
seawater is critical since marine growth in the piping and equipment must be
controlled. This includes the Open Rack
Vaporizers (ORVs) which will become fouled and lose heat transfer efficiency if
algae or marine animals are allowed to build up on the heat transfer panels
within these units. More importantly,
marine growth will promote pitting corrosion.
Biological control must not only render the incoming biological material
incapable of growth, but it must carry a residual concentration through the
system to protect it from new growth caused by airborne biological agents or
prior contamination that could possibly cause growth in the system.
Sodium Hypochlorite
Chlorine, typically in the form of
sodium hypochlorite, is commonly used as an antifouling agent in plants worldwide
where seawater is used for cooling/warming.
Sodium hypochlorite is an antifoulant that has been researched
intensively. In once-through systems
sodium hypochlorite is the most important antifoulant that is applied. Sodium hypochlorite is generated in a sodium
hypochlorite generator by passing electrical current through seawater causing
it to form sodium hypochlorite and small amounts of hydrogen. The hydrogen is vented to a safe location
which is 2 to 3 meters above any personnel or adjacent equipment and will
readily disperse upwards in a dilute form that is below the Lower Explosive
Limit (LEL) for hydrogen. Hydrogen
readily disperses since it is lighter than air.
The sodium hypochlorite generators can be controlled to only generate as
much sodium hypochlorite as required.
Sodium hypochlorite will provide free residual chlorine in the seawater
that can be adjusted to carry over to the ORVs providing them with protection
from air borne algae that could cause algae growth on the ORVs.
The ORV residual chlorine discharge
will be at 0.3 mg L-1. This
limit will be maintained by controlling sodium hypochlorite feed automatically
using residual chlorine monitors in the discharge. When chlorine (or hypochlorite) is added to
seawater a series of chemical reactions occurs.
The end products of these reactions include a wide range of halogenated
organic compounds. Using a low level of
chlorine to prevent settlement of marine organism, rather than killing them,
reduces the likelihood of halogenated organics being formed.
According to the Integrated
Pollution Prevention and Control (IPPC), Reference Document on the application
of Best Available Techniques to Industrial Cooling Systems (BREF) (2001),
“Sodium hypochlorite is the most commonly oxidising antifoulant used in large
once-through systems. It can be produced
on marine sites by electrolysis of seawater.
This process, called electrochlorination, avoids the transport and
storage of dangerous chlorine gas or solution.
The consumption of sodium hypochlorite as active chlorine demand is
generally lower in and around saltwater systems than on freshwater systems,
because of a higher level of dissolved and particulate organic matter in fresh
water. Due to its higher bromide
content, the formation of halogenated organics in seawater is reported to be
lower than in freshwater (rivers), but no publications could confirm this.”
Other Alternatives
There are a number of alternatives
to sodium hypochlorite for controlling biological growth that have been considered,
including:
·
Ultra Violet (UV) Light;
·
Ozone;
·
Chlorine Dioxide;
·
Copper Systems; and
·
Commercial antifoulants.
Ultra Violet (UV) Light
A non-chemical alternative to sodium
hypochlorite is the use of UV light to control biological growth in the seawater
cooling system. UV light serves as an
antifoulant by damaging a microorganism’s DNA structure, inhibiting its ability
to reproduce or killing the organism outright. UV treatment does not require
chemicals nor does it produce harmful reaction products.
According to the Integrated
Pollution Prevention and Control (IPPC), Reference Document on the application
of Best Available Techniques to Industrial Cooling Systems (BREF) (2001),
“UV-light may also offer possibilities in recirculating systems as a supplementary
technique. UV-light alone however,
cannot attack the biofouling that has settled on the surfaces of the Cooling
Water System. In order to be effective,
relatively clear cooling water is needed, since the light must be able to
penetrate into the water column.”
While UV light has been a useful
technique for certain cooling water systems, there are several issues that
limit its applicability to the treatment of the Project’s ORV system. There is a notable lack of operational
experience with UV treatment in subsurface marine applications. Monitoring the operation and changing the UV
lights once every 5,000 hours would be difficult when the system is located at
15 - 25 m below sea level. Silt and
other materials present in the seawater would foul the lights, requiring
frequent cleaning for it to remain effective at these depths. Expensive additional pre-treatment of the
water might even be necessary to ensure that the UV light penetrates the water
column. As a direct, non-chemical process, UV light does not provide residual
biological control which is necessary to protect the ORVs.
While the environmental effects of
UV light are expected to be less harmful then halogenated antifoulants, the
technique requires special care, is expensive, is unproven in subsurface marine
applications, does not provide residual fouling protection and is not
applicable in all situations. UV-light alone cannot attack the biofouling that
has settled on the surfaces of the ORV since it does not provide residual biological
control. Thus, UV light is not
considered technically acceptable for this application.
Ozone
In recent years, ozone has been
employed as an alternative to chlorine disinfection in potable water and
wastewater applications. Ozone kills
microorganisms by damaging or destroying the cell wall. Ozone can be generated onsite with
electricity using commercially available ozone generators which use either a
Pressure Swing Absorption (PSA) unit or liquid oxygen tank to provide a pure or
enriched source of oxygen
According to the Integrated
Pollution Prevention and Control (IPPC), Reference Document on the application
of Best Available Techniques to Industrial Cooling Systems (BREF) (2001), “With
the relatively smaller volumes of recirculating wet systems alternative
treatments are successfully applied, such as ozone, but they require specific
process conditions and can be quite costly.”
There are several notable
environmental and safety issues that limit the applicability of ozone for the
proposed use. Corrosion is a
particularly complex problem with ozone treatment. As a strong oxidant, ozone
accelerates the corrosion of metals in water, damaging any pipes and equipment
not made of corrosion-resistant materials.
Without corrosion protection measures, ozone could accelerate the
corrosion of the vaporizers causing them to have a shortened lifespan and
possible failure. Correcting this
problem would necessitate the use of exotic metallurgy, introducing the risk of
putting metallic ions to the seawater which could also damage the ORVs.
Ozone production requires a
considerable amount of energy and is relatively expensive due to the fact that
the efficiency of the ozone generators is very low. The ozone generators would
require an ozone destruction unit (fired unit) to destroy any excess ozone
production which would be harmful to the atmosphere. This destruction unit is also expensive and
would represent an additional source of NOX emissions. Additionally, ozone, like UV, does not
provide residual biological control since it is very reactive and will be
consumed in the first few seconds after application.
In terms of safety, ozone is a
noxious gas which can damage lung function. Any uncontrolled ozone release from
a generator or destruction unit would represent a potential hazard to site
workers.
Ozone is preferably used in very
clean recirculating cooling systems, and it is noted that its high reactivity
makes ozone unsuitable for application in once-through system or long line
systems. Ozone is not practical in this
application due to the lack of experience of this size unit, corrosion
concerns, lack of residual biological control, high costs, increased NOx
emissions and potential environmental hazard from ozone releases.
Chlorine
Dioxide
Chlorine dioxide is an effective
biological control agent normally used in applications onshore where ammonia or
other agents make the use of free chlorine ineffective. Unlike UV light or ozone, chlorine dioxide
does provide a residual that would protect the ORVs. Chlorine dioxide must be generated onsite
using special equipment.
According to the Integrated
Pollution Prevention and Control (IPPC), Reference Document on the application
of Best Available Techniques to Industrial Cooling Systems (BREF) (2001), “Chlorine dioxide (ClO2) has been considered as an
alternative to hypochlorite (HOCl) for seawater conditions and as a freshwater
biocide due to its effectiveness as a disinfectant and to its strong reduction
in the formation of organohalogenated by-products in the effluent. It has been
reported as an effective and economical application in cooling water systems
for control of micro-organisms at relatively low dosages.”
There are several notable
environmental and safety issues that limit the applicability of chlorine
dioxide for the proposed use. The
generation of chlorine dioxide would depend on the delivery of hazardous
chemicals to the site. The generation
equipment would consume a large area of space along with chemical storage. As a consequence, capital and operating costs
for a chlorine dioxide system would be considerably higher than those for a
conventional sodium hypochlorite system.
While some residual antifouling
capacity is beneficial, chlorine dioxide can leave undesirable residuals that
are much more persistent in the environment than free chlorine. Since chlorine dioxide is resistant to
oxidation and reaction with ammonia, it will persist in the seawater much
longer than the other options. Chlorine
dioxide can react with other compounds to form undesirable by-products such as
aldehydes, ketones and quinones or even epoxydes under certain
circumstances. Some aldehydes and
eopxydes are known to be carcinogens or mutagens which may persist past the
mixing zone upon discharge into the open sea.
Since chlorine dioxide is not widely used for this purpose, the impacts
of reactions with organic compounds that form undesirable disinfection
by-products are not as well studied.
The environmental and safety risks of
using chlorine dioxide prevent this option from being further considered for
this application.
Copper
Systems
Copper systems use copper ions to
control biological growth by inhibiting the attachment of fouling organisms to
process piping and equipment surfaces.
The copper ions are supplied by the electrolysis of seawater which
eliminates the need to transport and store hazardous chemicals.
According to notes on copper ion
treatment provided in the Integrated Pollution Prevention and Control (IPPC),
Reference Document on the application of Best Available Techniques to
Industrial Cooling Systems (BREF) (2001), “…the residual concentration of the
lethal copper compounds needs further examination as the discharge to the
receiving water could cause harmful effects.”
There are several notable
operational and environmental issues that limit the applicability of copper
ions for the proposed use. One basic concern is that copper ion treatment is
not a common technique and that to our knowledge none of the LNG terminal
operators have experience operating this unconventional control system. Another
concern is that existing copper ion treatment has not yet been attempted in a
system that contains aluminium. As such,
there is the potential that an undesirable reduction-oxidation reaction may
take place between the copper ions and the aluminium in the ORVs, accelerating
the corrosion of the vaporizers.
While copper is commonly used as a
protective coating for vessels, the proposed application would introduce
considerable amounts of the metal directly into the marine environment. The
concentrations of copper at the seawater outfall could potentially reach levels
of concern given the high volume of ORV throughput and the duration of the
project.
Given the uncertainty of ORV
corrosion and the introduction of a non-biodegradable metal to the marine
environment, copper ion treatment is not considered technically acceptable for
this application.
Commercial
Antifoulants
One chemical company produces an
antifoulant that is a catatonic surfactant that is short-lived in plant systems
and the environment because of rapid absorption onto anionic substrates and
sediments in natural aquatic ecosystems.
Mussels do not detect this chemical
as a noxious compound, and they do not close their shells. This allows the mussels to be killed quickly,
with significant mortality in 4 to 24 hours.
The agent causes detachment of adults and is effective on molluscs at
all life stages. It also effectively
controls microfouling organisms, barnacles, hydrozoa, bryozoa, bacteria, fungi,
algae, Asiatic clams, and bacterial, fungal, and algal slime. The agent is
compatible with stainless steel, copper alloys, most plastics and rubbers,
chrome alloys, aluminium, and FRP piping.
There are several notable
operational and environmental issues that limit the applicability of this
antifouling agent for the proposed use.
The chemical is corrosive to skin and is flammable, making it a hazard
to handle. The high residual levels after discharge along with the extremely
high cost of this material make it operationally and environmentally unsuitable
for this application. As such, the
chemical is not considered suitable for this application due to its potential
negative effects on sea life and excessive cost.
Summary
To conclude, UV and ozone generator
options are not recommended because they do not provide the required residual
biological control for the ORVs along with other operational difficulties. Although chlorine dioxide provides residual control,
it uses hazardous chemicals and will consume considerable space for producing
the chlorine dioxide and chemical storage and unloading, in addition to operator safety issues. The proposed commercial antifoulant is not
considered suitable for this application due to its potential negative effects
on sea life and excessive cost.
Copper ion treatment is currently
not in wide use and there is limited operating experience for this
unconventional system. Additionally, the
potential corrosion problems with the copper-aluminium interaction on the Open
Rack Vaporizers (ORV’s) are unknown and are therefore currently not viewed as a
viable option.
The one viable option remaining is
sodium hypochlorite. It is a safe,
proven option that has been used successfully for many years on many once
through seawater applications with ORVs.
For most applications, a carefully designed sodium hypochlorite system
offers the most complete and comprehensive technique for the reduction of both
macrofouling and microfouling.
Careful design can also dramatically
reduce the environmental impact of modern sodium hypochlorite systems. This includes a properly designed chlorine
monitor to control the residual chlorine levels in the system with care being
taken to choose an instrument that has the proper operating range to provide
maximum sensitivity throughout all foreseeable operational scenarios.
Residual chlorine in the marine
environment can be harmful to marine organisms only if concentrations exceed
tolerance levels. It has been found that
harmful effects begin to occur at concentrations above 0.02 mg L-1 in
water ([54]).
The discharge limit for residual chlorine is 1.0 mg L-1
according to EPD’s Technical Memorandum
for Effluents issued under Section 21
Water Pollution Control Ordinance, Cap 358.
There is no value specified in the WQOs for the Southern
WCZ, nor for any other WCZ.
The criterion value of 0.01 mg L-1 (daily maximum)
at the edge of the mixing zone has been chosen as the criterion against which
to assess the results from the computer modelling of chlorine dispersion, which
is also the criterion adopted in the approved EIA Report for the 1,800 MW
Gas-fired Power Station at Lamma Extension ([55]).
The water quality impacts due to
chlorine discharges have been assessed using computational modelling (see Water Quality Method Statement in Annex 6A). The results from the chlorine simulations are
presented as contour plots of mean and depth averaged chlorine concentrations
for the spring and neap tidal periods in the wet and dry seasons. The contour plots are provided in Annex 6H. Figures
SK_H01-08 present the maximum operational discharges, while Figures SK-H09-16 show the fluctuating
operational discharges. Both discharge
rates appear to result in a similar pattern of residual chlorine dispersion.
The dispersion results obtained for
both the wet and dry seasons have shown that the majority of the residual
chlorine is contained within the bottom layer, with little or no chlorine in
the middle and the surface layers. This
indicates that the release of the chlorine near to the seabed and the
relatively higher density of the cooled water, in which the chlorine is
discharged, results in weak vertical mixing.
The model used the assumption that
the terminal would discharge total residual chlorine at a maximum concentration
of 0.3 mg L-1. This
concentration is similar to that for most power stations in Hong
Kong and is below the EPD’s limit of 1.0 mg L-1
Based on the predictions, the
maximum extent of the > 0.01 mg L-1 contour is <300 m from the
discharge point during the dry season and <100 m during the wet season (Figure SK_H01 and Figure SK_H05). These areas
were defined as the “mixing zones”.
Due to the small extent of the
plumes, and the fact that no sensitive receivers would be affected, no
unacceptable water quality impacts from residual chlorine discharge are
expected to occur. The short duration
peaks of residual chlorine discharge will also not contribute to any
unacceptable adverse impacts. The
assessment confirms the environmental suitability of the proposed discharge.
6.7.5 On-site Wastewater Discharges
During
operation of the LNG Receiving Terminal, it is expected that there will be a
workforce of about 100 people. It has been conservatively
estimated that an average of approximately 35 m3 of sewage would be
produced by this workforce per day (Annex 6A). This is based on an average unit flow factor
of 60 L per day per head for each person employed based on the Drainage Service
Departments (DSD’s) Sewerage Manual
and an additional commercial unit flow factor of 290 L per day per head.
As the sewage from the LNG Plant is
of domestic sewage type, BOD, SS, TN and E.Coli
are applicable to the sewage treatment process.
Whilst the treated effluent shall comply with all parameters in the TM, the discharge of chemical substances
are not a concern for domestic type sewage and are not considered. Oil and grease will be controlled by fitting
grease traps to the wastewater outlets from the kitchens.
A sewage treatment system will be
provided for the treatment of wastewater. A sanitary waste system consisting of
a collection system will be provided. Due to the low number of operational staff in the terminal,
the volume of the sewage generated would be limited and would be treated
on-site before being discharged in accordance with the EPD’s required standards
under the Water Pollution Control
Ordinance. The sewage will be
discharged from the seabed outfall to the south of the South Soko Island (Figure 6.10).
The sewage flow
generated from the LNG Receiving Terminal operations is small. For this scale of flow a packaged sewage
treatment plant offers the optimum solution such as a rotating biological
contactor (RBC) plant or blivet plant coupled with a disinfection system.
Modelling has been conducted to
determine the dispersion of the treated wastewater discharge during the
operation phase. Modelling methods are
discussed in the Water Quality Method
Statement (Annex 6A). The results (see Annex 6I) indicate that the impacts of the wastewater discharges
are negligible. No non-compliance with
the WQO is predicted to occur in either the dry or wet seasons throughout the
operation phase.
6.7.6 Vessel Discharges
No
adverse impacts are expected to occur from vessel discharges during the
operation phase.
No
ballast water from the LNG Carrier will be discharged in Hong
Kong waters. The LNG
Carrier will arrive at the Hong Kong terminal
loaded with LNG and with empty ballast water tanks. Ballast water will be taken into the LNG
carrier ballast tanks at the discharge terminal simultaneously with the LNG
discharge.
The
handling of that ballast water by the LNG Carrier will then always be in
accordance with IMO resolution A.868(20)
adopted by the IMO assembly in November 1997.
This requires the LNG Carrier to have the ability to change all ballast
water at sea between discharge port and load port. In addition, the provisions of the Convention for the Control and Management of
Ship's Ballast Water and Sediments adopted 13 February 2004 (which entered
into force at a later date) will also be fully complied with.
6.7.7 Accidental Spill of
LNG
An LNG release would be vaporized quickly into
the atmosphere and would not be expected to impact water or sediment
quality. If spilled onto the LNG
Terminal jetty deck or into the ocean (LNG is less dense than water), LNG would
boil rapidly (due to exposure to higher ambient temperatures). Because of the material’s density and
turbulence created by the rapid boiling, an LNG spill would vaporize rapidly,
leaving no environmental residue.
It is worth noting that there is a sump at
the berth large enough to capture and manage a major spill from the unloading
lines and contain it on the site. Other
leaks at the terminal are designed to be routed to containment basins for
evaporation and treatment and would not reach the sea. Therefore an LNG spill would be only
associated with the unloading arms, which are hanging out to the sea, outside
of the spill containment area. It should
also be noted that the LNG terminal has an emergency shutdown system (PERC)
that continuously monitors the mooring system and motions of the unloading
arms. Upon sensing any irregularities in
either of these systems, the unloading operation is automatically shutdown.
This system has quick operating shutoff valves that among other places are
located at the unloading arm connection to minimize the possibility of a LNG
spill. The system can also be actuated manually by the terminal operator who is
always present at the dock during unloading or the ship’s cargo master who is
also present. Thus, if the ship were to break from its mooring, the LNG
transfer would shutdown instantly without loss of cargo.
A leak from the unloading arms has a
frequency of 4 x10⁻³ per year, while a full rupture has a frequency
of 4 x10⁻⁵ per year (for details
refer to Part 2 - Section 13.5). Other sections of LNG Receiving Terminal have
an even lower frequency of leakage and hence the leak from the unloading arms
is examined. To investigate the effects
of a spill on water quality, a full bore rupture scenario was modelled. It was assumed that unloading arms part when
an extremely high atypical wave due to a passing ship causes the LNG Carrier to
break free from its moorings.
The pumping rate during carrier unloading
is 601 kg s-1 (equivalent to 1.3 m3 s-1) per
unloading arm. For the purpose of
modelling, if a rupture occurs, a 30 seconds release of LNG is assumed. This is based on the closing time of the
emergency shutdown valves (ESV) and the reaction time of personnel to activate
the emergency shutdown device (ESD).
However, the inventory of LNG between ESVs is about 80m3. A release would therefore consist of the
inventory plus 30s of pumping, a total of about 120 m3. The modelling assumes this is released at a
constant rate of 1.3 m3 s-1 for 92s. In reality, once the ESVs close, the
discharge rate will decrease beyond 30s and be caused by gravity draining
only. The modelling approach is
therefore conservative.
The spill is further assumed to take place
on water and is allowed to spread isotropically without confinement. Modelling was performed using PHAST for four
weather conditions covering a range of atmospheric stability classes of B
through to F, and a range of wind speeds from 2m s-1 to 7m s-1. The model includes the effects of
gravitational spreading, surface tension forces and vaporisation rate in
calculating the pool size. The PHAST
model was adopted as it is used in the Quantitative Risk Assessments (QRAs) for
the terminal and marine transit of the LNG Carrier.
The results (Figure 6.14) show transient pool behaviour, growing to maximum size
after about 1 minute and completely vaporising after 2 minutes. The liquid rainout fraction is about 20%
whereas 80% of LNG would be vaporised (conservatively a release height of 1 m
was specified in the modelling) but depends on weather conditions. This factor explains the difference in the
four curves. The results show that the
pool size is likely to be affected by atmospheric stability and less so by wind
speed. The pool size radius is in a
range of 23 m and 31 m, which is considered to be small. It is hence anticipated that substantial
vaporisation, which is caused by turbulent mixing and heat transfer from the
air to vaporise the LNG, will take place before the LNG reaches the water.
Similarly, results of the QRA of the LNG
Carrier transit have indicated that in the highly unlikely event of a breach of
containment of the double hull of the LNG Carrier the spill would have a
maximum radius of 85 m in the worse case event.
This has been determined through mathematical modelling, again using the
PHAST model for consistency amongst the QRAs.
In summary, should an accidental spill of
LNG occur on the sea surface the LNG will not mix with water or dissolve in
water but will stay on the surface and evaporate rapidly leaving no
residue. The LNG spill will cause
immediate cooling of the surface water which will rapidly return to normal
temperature due to the buffering effect of the ocean. Hence no impacts to water quality would be
expected in the unlikely event of an accidental spill of LNG on the water.
Figure 6.14 LNG Pool Size for a Spill from the
Unloading Arm
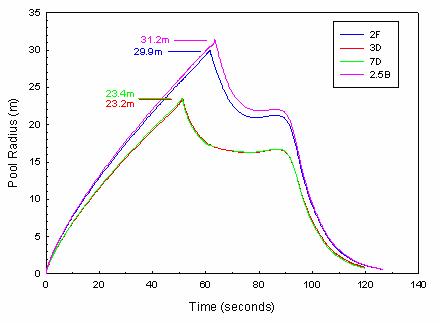
Figure 6.14 LNG Pool Size for a Spill from the Unloading Arm
Notes:
“2F”
denotes a wind speed of 2 m s-1 under stable air-turbulence
conditions.
“3D” denotes
a wind speed of 3 m s-1 under neutral air-turbulence conditions.
“7D”
denotes a wind speed of 7 m s-1 under neutral air-turbulence
conditions.
“2.5B”
denotes a wind speed of 2.5 m s-1 under unstable air-turbulence
conditions.
6.7.8 Accidental Spill of
Fuel from LNG Carrier
In
the event of an accident, the special design of the storage tanks will prevent
the fuel from leaking into the sea. Fuel
for propulsion and ship services is carried in storage tanks installed inside double
hulls at the forward end and the aft end of the vessel. The forward storage tanks are located aft of
the fore peak tank and forward ballast tank or bow thruster room at a distance
about 10 to 20 m from the bow to afford protection against collision. The outboard sides and bottom of all fuel
tanks are separated from the hull sides and bottom with abutting ballast tanks
or void spaces so that any potential oil tank boundary leakage will not reach
the sea. In addition, hull bottom or
side damage will not impair the tank boundary thus preventing pollution of the
sea. This feature constitutes double
hull protection and hence reduces the likelihood of failure as far as
reasonably practicable.
It
is considered that a spillage of fuel is highly unlikely given the above. However, the Study Brief requires that a
potential scenario is examined.
Uncertainty of Fuel Spill
How
much fuel will actually be contained within the ship’s fuel storage system for
every voyage cannot be estimated with certainty; however the following factors
have to be taken into account:
·
LNG tanks not filled to capacity;
·
Protective location of fuel tanks; and
·
Geometric factor of fuel tanks.
Therefore,
although the worst case analysis of the largest single tank being breached was modelled,
the frequency of such an event is very small and hence in the unlikely event of
such an event arising the quantity of fuel released will be lower than that
modelled. In the model, it is assumed
that all oil is released from a fulfilled tank and the protection features of
the tank are not considered in the model although it is unlikely to occur.
Impact Assessment
Should
any rupture in the tank occur it is essential to implement the emergency
contingency plans to effectively control and clean up accidental spillages and
to reduce the quantities of fuel reaching water sensitive receivers. This is the purpose of carrying out
athematical modelling to assess the behaviour of a hypotetical fuel spill from
and LNG carrier. The modelling
assumptions are presented in Annex 6A.
It
is important to note that the modelling is based on a multiplicity of
conservative parameter inputs to identify an extreme range of plume
movement. The output is intended to
facilitate implementation of an effective contingency plan to ensure best
practice of controlling accidental oil spillages, notwithstanding the very low
likelihood of such an event occurring in practice.
The
most conservative case considered is the holing of the largest single tank
containing fuel on board a 215,000 m3 class LNG Carrier, which is a
carrier class considered in the MQRA.
This worst case scenario considers only the consequence on water quality
and as it does not consider the low frequency it is extremely conservative in
nature.
In
the model, a point close to South Soko Island
was chosen based on the potential LNG carrier transit route and the closeness
to the sensitive receivers at the south of the South Soko Island.
In
order to examine the dispersion pattern and movement of an oil plume, it is
assumed that no evaporation and emulsification is allowed and consequently a
highly conservative case has been simulated.
The modelling has been conducted using the Oil module of the particle
tracking (PART) model of the Delft
3D suite of models.
It is assumed that necessary contingency
actions will be implemented within 24 hours after the release and hence a
summary of the fuel spill travel route and corresponding time during a 24 hour
period is shown in Tables 6.30 and 6.31.
Table
66.30 Movement
of Fuel Spill (Dry Season)
|
Location
|
The nth hour after
Release
|
|
South
of South Soko Island (release point)
|
0
– 16
|
|
South
coast of Tau Lo Chau
|
17
– 23
|
|
Open
water to southeast of South
Soko Island
|
24
|
Table
66.31 Movement
of Fuel Spill (Wet Season)
|
Location
|
The nth hour after
Release
|
|
South
of South Soko Island (release point)
|
0
|
|
Tau
Lo Chau (to southeast of South
Soko Island)
|
2
– 5
|
|
East
coast of South Soko Island
|
6
|
|
Open
water (southeast to South
Soko Island)
|
7
– 10
|
|
Open
water (southeast to Cheung Chau)
|
11
– 22
|
|
Open
water (southeast to Lamma
Island)
|
23
– 24
|
For the dry season, the contingency actions
should be implemented to control and contain the fuel plume within 24 hours
before it disperses farther to the open water.
For the wet season, the plume is likely to
move much faster and farther. In order
to control and contain the fuel plume, it is recommended that the contingency
actions should be implemented within 6 to 10 hours.
6.7.9 Contaminated Site
Run-off
Measures
have been put in place to ensure the management and control of day-to-day activities
at the terminal that involve the use of potentially contaminating materials,
such as fuel and lube oils. These
measures are presented and discussed in Section
14. The measures will ensure that
surrounding marine waters are not affected by contaminants in run-off from the
site.

6.8 Water Quality Mitigation Measures – Construction Phase
The water quality modelling works
have indicated that for both the dry and wet seasons, the works can proceed at
the recommended working rates without causing unacceptable impacts to water
quality sensitive receivers. In
instances where there are exceedances of the applicable standards, they have
been predicted to be transient and not of concern.
Unacceptable impacts to water
quality sensitive receivers have largely been avoided through the adoption of
the following measures.
·
Siting:
A number of locations were studied for the LNG terminal and the
associated pipeline, water main and cable routes, with the principal aim of
avoiding direct impacts to sensitive receivers.
·
Reduction
in Indirect Impacts: The LNG
terminal and the associated pipeline, water main and cable routes are located
at a sufficient distance from water quality sensitive receivers so that the
dispersion of sediments from the construction works does not affect the
receivers at levels of concern (as defined by the WQO and tolerance
criteria).
·
Adoption
of Acceptable Working Rates:
The modelling work has demonstrated that the selected working rates for
the dredging and jetting operations will not cause unacceptable impacts to the
receiving water quality. Details
regarding the working rates for different scenarios are presented in Section 3.4 of Annex 6A.
·
Pipeline Alignment: A number of alternative gas pipeline routes
were studied and the preferred alignment avoids direct impacts to sensitive
receivers (See Part 2 – Section 2:
Consideration of Alternatives).
In
addition to these pro-active measures that have
been adopted for the proposed Project, the following operational constraints
and good site practice measures for dredging and construction run-off are also
recommended. It should be noted that
there is no requirement for constraints on the timing or sequencing of the works,
as all concurrent scenarios have been demonstrated not to cause adverse water
quality impacts.
6.8.1 Dredging
The impacts to water quality from
the loss of sediment to suspension was assessed in terms of the maximum rates
of dredging and/or filling during the construction of the seawall, reclamation,
approach channel and turning basin, water main and the gas receiving
station. The assessment was carried out
based on the predicted loss rates of fine sediment to suspension from the
different types of plant working on the site during the times of maximum
dredging and/or filling. The highest
loss rate was predicted to occur during the time at which the maximum rate of
dredging was occurring. The maximum loss
rate should then be limited to the values adopted in the Study and it was
predicted that this rate of loss would not give rise to adverse impacts. It is therefore recommended that the maximum
loss rate during the dredging works be kept at these limits.
The following measures shall also
apply at all times:
·
No overflow is permitted from the trailing
suction hopper dredger and the Lean Mixture Overboard (LMOB) system will only
be in operation at the beginning and end of the dredging cycle when the drag
head is being lowered and raised.
·
Dredged marine mud will be disposed of in a
gazetted marine disposal area in accordance with the Dumping at Sea
Ordinance (DASO) permit conditions.
·
Disposal vessels will be fitted with tight bottom
seals in order to prevent leakage of material during transport.
·
Barges will be filled to a level, which
ensures that material does not spill over during transport to the disposal site
and that adequate freeboard is maintained to ensure that the decks are not
washed by wave action.
·
After dredging, any excess materials will
be cleaned from decks and exposed fittings before the vessel is moved from the
dredging area.
·
The contractor(s) will ensure that the
works cause no visible foam, oil, grease, litter or other objectionable matter
to be present in the water within and adjacent to the dredging site.
·
If installed, degassing systems will be
used to avoid irregular cavitations within the pump.
·
Monitoring and automation systems will be
used to improve the crew’s information regarding the various dredging
parameters to improve dredging accuracy and efficiency.
·
Control and monitoring systems will be used
to alert the crew to leaks or any other potential risks.
·
When the dredged material has been unloaded
at the disposal areas, any material that has accumulated on the deck or other
exposed parts of the vessel will be removed and placed in the hold or a
hopper. Under no circumstances will
decks be washed clean in a way that permits material to be released overboard.Dredgers
will maintain adequate clearance between vessels and the seabed at all states
of the tide and reduce operations speed to ensure that excessive turbidity is
not generated by turbulence from vessel movement or propeller wash.
·
Deploy
silt curtain to reduce the elevation of suspended solids to nearby sensitive receivers
during specific works described in Section
6.6.
As discussed in Section 6.6, it is expected that the construction works are
generally environmentally acceptable for most sensitive receivers. They will give rise to short-term exceedances
at three sensitive receivers, i.e., fish fry habitat at Pak Tso Wan, subtidal
hard bottom habitat at the southern side of South Soko and in some areas of the
Sha Chau and Lung
Kwu Chau
Marine Park. The assessment presented in Section 6.6 is based on the unmitigated
situation and assumed that no mitigation measures are adopted during
construction. In view of these
exceedances, specific mitigation measures are recommended, as summarised in Table 6.32. Deployment of both stand type and cage type
silt curtains is proposed to reduce the SS elevation at Pak Tso Wan. Figure 6.15
depicts
the envisaged double layers stand type silt curtain installation at Pak Tso Wan
and a stand type silt curtain enclosing the sandfilling area in case the
seawall trench is to be filled with sand.
A stand type silt curtain is recommended enclosing the subtidal hard
bottom habitat at the southern side of South Soko
(see Figure
6.16)
and the deployment of a cage type silt curtain is proposed for enclosing the
dredging areas next to the grab dredgers at the approach channel and turning
basin. If the water monitoring results
show any exceedances which are confirmed to be caused by the dredging works, an
additional stand type silt curtain will be installed where considered
appropriate and effective. Figure 6.16
illustrates
its possible location. Cage type silt
curtains are proposed to be adopted for the grab dredgers at those dredging
areas that are close to the western boundary of the Marine Park
(see Figure
6.17).
Details
of silt curtain installation should be proposed by the contractor prior to the
commencement of dredging/jetting works and submitted to the IEC for approval.
Reduction
factors for SS elevations are taken from a review of approved EIAs presented in
Annex 6L.
For
Scenario 3, the predicted exceedances at Pak Tso Wan after deployment of the
proposed mitigation measures are regarded as residual impact and the evaluation
of the residual impact is discussed in Section
6.11.1.
Table 66.32 Predicted SS Elevations after Implementation
of Mitigation Measures
|
Sensitive
Receiver
|
Name
|
ID
|
Scenario
|
WQO Allowable Elevation
|
Without Mitigation Measures
|
Proposed Mitigation Measures
|
Reduction Factor of Cage Type Curtain
|
With Cage Type Curtain
|
Reduction Factor of Stand Type Curtain
|
With Stand Type Curtain
|
|
Maximum Predicted SS Elevation (mg L-1)
|
Maximum Predicted SS Elevation(mg L-1)
|
Maximum Predicted SS Elevation (mg L-1)
|
|
Dry
|
Wet
|
Dry
|
Wet
|
|
|
Dry
|
Wet
|
|
Dry
|
Wet
|
|
Fish Fry Habitat
|
Pak Tso Wan
|
SR16b
|
1
|
6.9
|
5.5
|
22.9
|
36.8
|
Seawall (completely
constructed) in place prior to the reclaiming works and
2 layer silt curtains (stand type
enclosing SR16b and cage type next to grab dredger)
|
75%
|
5.7
|
9.2
|
60%
|
-
|
3.7
|
|
Fish Fry Habitat
|
Pak Tso Wan
|
SR16b
|
2
|
6.9
|
5.5
|
16.2
|
15.5
|
2 layers of silt curtains
(stand type enclosing SR16b and cage type next to grab dredger)
|
75%
|
4.1
|
3.9
|
60%
|
-
|
-
|
|
Fish Fry Habitat
|
Pak Tso Wan
|
SR16b
|
3
|
6.9
|
5.5
|
36.1
|
57.4
|
Double layers silt curtain
(stand type enclosing SR16b)
|
N/A
|
N/A
|
N/A
|
80% (a)
|
7.2
|
11.5
|
|
Subtidal Hard Bottom Habitat
(coral)
|
Southern Side of South Soko
|
SR31
|
4a
|
10
|
10
|
15.5
|
-
|
2 layers of silt curtains
(stand type enclosing SR31 and cage type next to grab dredgers)
|
75%
|
3.9
|
-
|
60%
|
1.6
|
-
|
|
Subtidal Hard Bottom Habitat
(coral)
|
Southern Side of South Soko
|
SR31
|
4b
|
10
|
10
|
12.2 (b)
|
12.7 (b)
|
2 layers of silt curtains
(stand type enclosing SR31 and cage type next to grab dredgers)
|
75%
|
8.4
|
7.6
|
60%
|
3.4
|
3.0
|
|
Fish Fry Habitat
|
Pak Tso Wan
|
SR16b
|
5
|
6.9
|
5.5
|
-
|
5.7
|
2 layers of silt curtains
(stand type enclosing SR16b and cage type next to grab dredger)
|
75%
|
-
|
1.4
|
60%
|
-
|
-
|
|
Fish Fry Habitat
|
Pak Tso Wan
|
SR16b
|
7
|
6.9
|
5.5
|
10.6
|
6.0
|
2 layers of silt curtains (stand
type enclosing SR16b and cage type next to grab dredger)
|
75%
|
2.65
|
1.5
|
60%
|
-
|
-
|
|
Potential Marine Park
|
Southwest Lantau
|
SR19b
|
8
|
8.9
|
6.5
|
-
|
6.9
|
TSHD operated in 12 hrs and avoid the calving season of March through
August
|
-
|
-
|
-
|
-
|
-
|
-
|
|
Potential Marine Park
|
Southwest Lantau
|
SR19c
|
8
|
8.9
|
6.5
|
-
|
8.9
|
TSHD operated in 12 hrs and avoid the calving season of March through
August
|
-
|
-
|
-
|
-
|
-
|
-
|
|
Entire Designated Marine
Park
|
Sha Chau and Lung Kwu Chau
|
-
|
9
|
8.2
|
5.6
|
< 10 (c)
|
< 10 (c)
|
Silt curtain (cage type next to grab dredger)
|
75%
|
< 2.5
|
< 2.5
|
-
|
-
|
-
|
Notes:
1.
The reduction factor is calculated as (1 -
40%(first layer of silt curtain) x 50%(second layer of silt curtain)) = 80%
(The first layer of silt curtain could filter mainly the coarse fraction of the
sediment whereas the second layer of silt curtain may be slightly less
effective to deal with the fine fraction of the sediment left by the first
layer.)
2.
Contribution of SS from TSHD is predicted
to be 59% and 46% during the dry and wet seasons respectively.
3. The
exceedance occurs just at the western boundary of the Marine Park.
/As
presented in Table 6.34, the majority
of the SS impacts could be mitigated to a level below the WQO. The only residual impacts greater than the
WQO would be due to the jetting works close to Pak Tso Wan (Scenario
3).
The evaluation of residual impacts is presented in Section 6.11.
6.8.2 Jetting
Impacts
to water quality sensitive receivers would largely be avoided during the
installation of the water main and cable circuits through the following
measures.
·
Jetting
speeds should be limited to a maximum of 65 m hr-1 for water mains
construction.
·
Jetting
speeds should be limited to a maximum of 150 m hr-1 for cable circuit
installation.
6.8.3 Land Based
Construction Activities
Appropriate on-site measures are
defined to reduce potential impacts, which will be sufficient to prevent
adverse impacts to water quality from land based construction activities. These measures are appropriate for general
land based construction activities.
Construction Run-off
·
Prior to the commencement of the site
formation earthworks, surface water flowing into the site from uphill will be
intercepted through perimeter channels at site boundaries and safely discharged
from the site via adequately designed sand/silt removal facilities such as sand
traps.
·
Channels, earth bunds or sand bag barriers
will be provided on site to direct stormwater to silt removal facilities. The design of silt removal facilities will
make reference to the guidelines in Appendix A1 of ProPECC
PN 1/94.
·
The surface runoff or extracted ground water
contaminated by silt and suspended solids will be collected by the on-site
drainage system and discharged into storm drains after the removal of silt in
silt removal facilities.
·
Unprotected partially formed soil slopes
will be temporarily protected by plastic sheetings, suitably secured against
the wind, at the end of each working day.
·
Earthworks to form the final surfaces will
be followed up with surface protection and drainage works to prevent erosion
caused by rainstorms.
·
Appropriate surface drainage will be
designed and provided where necessary.
All slope drainage will be designed to the Geotechnical Manual for
Slopes published by the Geotechnical Engineering Office of The Civil Engineering
and Development Department.
·
Temporary trafficked areas and access roads
formed during construction will be protected by coarse stone ballast or
equivalent. These measures shall prevent
soil erosion caused by rainstorms.
·
Drainage systems, erosion control and silt
removal facilities will be regularly inspected and maintained to ensure proper
and efficient operation at all times and particularly following
rainstorms. Deposited silt and grit will
be removed regularly.
·
Measures will be taken to reduce the
ingress of site drainage into excavations.
If trenches have to be excavated during the wet season, they will be
excavated and backfilled in short sections wherever practicable. Water pumped out from trenches or foundation
excavations will be discharged into storm drains via silt removal facilities.
·
Open stockpiles of construction materials
(for example, aggregates, sand and fill material) of more than 50 m3 will have
measures in place to prevent the washing away of construction materials, soil,
silt or debris into any drainage system.
·
Manholes (including newly constructed ones)
will be adequately covered and temporarily sealed so as to prevent silt,
construction materials or debris being washed into the drainage system.
·
The precautions to be taken at any time of
year when rainstorms are likely together with the actions to be taken when a
rainstorm is imminent or forecasted and actions to be taken during or after
rainstorms are summarised in Appendix A2 of ProPECC
PN 1/94.
·
Oil interceptors will be provided in the
drainage system where necessary and regularly emptied to prevent the release of
oil and grease into the storm water drainage system after accidental spillages.
·
Temporary and permanent drainage pipes and
culverts provided to facilitate runoff discharge will be adequately designed
for the controlled release of storm flows.
·
The temporary diverted drainage will be
reinstated to the original condition when the construction work has finished or
when the temporary diversion is no longer required.
Boring and Drilling Water
·
Water used in ground boring and drilling
for preparation of blasting or rock / soil slope stabilization works will be
re-circulated to the extent practicable after sedimentation. When there is a need for final disposal, the wastewater
will be discharged into storm drains via silt removal facilities.
Wastewater from Building
Construction
·
Wastewater generated from concreting,
plastering, internal decoration, cleaning work and other similar activities, will
undergo large object removal by installing bar traps at the drain inlets. It is not considered necessary to carry out
silt removal due to the small quantities of water involved. Similarly, pH adjustment of such water is not
considered necessary due to the small quantities and the fact that the water is
only likely to be mildly alkaline.
Wastewater from Site Facilities
·
During the early stages of work, portable
chemical toilets will be used and the effluent will be shipped offsite until
the temporary sewage treatment work (STW) plant is operational.
·
Sewage from toilets, kitchens and similar
facilities will be discharged into a foul sewer. Wastewater collected from canteen kitchens,
including that from basins, sinks and floor drains, will be discharged into
foul sewers via grease traps. The foul
sewer will then lead to the temporary STW plant prior to effluent discharge to
the ocean.
·
Vehicle and plant servicing areas, vehicle
wash bays and lubrication bays will, as far as practical, be located within
roofed areas. The drainage in these
covered areas will be connected to foul sewers via an oil/water
interceptor.
·
Oil leakage or spillage will be contained
and cleaned up immediately. Waste oil
will be collected and stored for recycling or disposal, in accordance with the Waste
Disposal Ordinance.
Storage and Handling of Oil,
Other Petroleum Products and Chemicals
·
Fuel tanks and chemical storage areas will
be provided with locks and be sited on sealed areas.
·
The storage areas of oil, fuel and
chemicals will be surrounded by bunds or other containment device to prevent
spilled oil, fuel and chemicals from reaching the receiving waters.
·
The Contractors will prepare guidelines and
procedures for immediate clean-up actions following any spillages of oil, fuel
or chemicals.
·
Surface run-off from bunded areas will pass
through oil/water separators prior to discharge to the stormwater system.
Wastewater from Concrete Batching Plant
·
Wastewater generated from the
washing down of mixer trucks and drum mixers and similar equipment should be
recycled to the extent practicable. To
prevent pollution from wastewater overflow, the pump sump of any wastewater
recycling system will be provided with a standby pump of adequate capacity.
·
Under normal circumstances, surplus
wastewater from the concrete batching will be treated in silt removal and pH
adjustment facilities before it is discharged into foul sewers. Discharge of this wastewater into storm drains
will require more elaborate treatment and regular testing checks. Surface run-off will be separated from the concrete
batching plant to the extent practical and diverted to the stormwater drainage
system. Surface run-off contaminated by
materials in the concrete batching plant will be adequately treated before
disposal into stormwater drains.
6.9 Water
Quality Mitigation Measures – Operation Phase
6.9.1 Hydrodynamics
The hydrodynamic modelling has
predicted that the reclamations and the marine works and structures will have
minimal effects on hydrodynamics and water quality. Mitigation measures are not considered to be
necessary.
6.9.2 Cooled Water and Residual Chlorine
Discharge
The relatively low concentration of
antifoulant combined with the high degree of mixing inherent in the coastal
margin will result in rapid dilution of the effluent to non-significant
concentrations and hence mitigation measures are considered unnecessary.
6.9.3 Storage and Handling of Oil, Other
Petroleum Products and Chemicals
·
Fuel tanks and chemical storage areas
should be provided with locks and be sited on sealed areas.
·
The storage areas of oil, fuel and chemicals
should be surrounded by bunds to prevent spilled oil, fuel and chemicals from
reaching the receiving waters.
·
Guidelines and procedures will be developed
for immediate clean-up actions following any spillages of oil, fuel or
chemicals.
·
Surface run-off from bunded areas should
pass through oil/grease traps prior to discharge to the stormwater system.
Other
measures are detailed in Section 14 for the
prevention of groundwater contamination.
6.9.4 Wastewater
·
Sewage from toilets, kitchens and similar
facilities should be discharged into a foul sewer. Wastewater collected from canteen kitchens,
including that from basins, sinks and floor drains, should be discharged into foul
sewers via grease traps. The foul sewer
will then lead to the sewage treatment plant prior to discharge to the ocean.
·
Vehicle and plant servicing areas, vehicle
wash bays and lubrication bays should, to the extent practical, be located
within roofed areas. The drainage in
these covered areas should be connected to foul sewers via a oil / water
separator.
·
Oil leakage or spillage should be contained
and cleaned up immediately. Waste oil
should be collected and stored for recycling or disposal, in accordance with
the Waste
Disposal Ordinance.
6.10 Environmental
Monitoring and Audit (EM&A)
6.10.1 Construction Phase
Water quality monitoring and
auditing is recommended for the construction phase. The specific monitoring requirements are
detailed in the Environmental Monitoring and
Audit Manual (EM&A) associated with this EIA Report.
6.10.2 Operation Phase
As no unacceptable impacts have been
predicted to occur during the operation of the LNG terminal at South Soko
Island, monitoring of impacts
to marine water quality during the operational phase is not considered
necessary. It is noted that discharges
from the site will require a license under the WPCO which stipulates regular effluent monitoring as part of the
license conditions.
6.11 Residual
Environmental Impacts
6.11.1 Construction
Phase
Unmitigated
scenarios have been evaluated in Section
6.6 and most of the impacts in terms of WQO exceedances could be mitigated
by adopting effective mitigation measures such as silt curtains. Table
6.35 shows a schedule of proposed mitigation measures for all marine
works.
Table 66.35 Summary of Proposed Mitigation Measures
|
Marine Work Location (Zone)
|
Marine Work and Plant Type
|
No. of Plants
|
Proposed Mitigation Measures
|
|
Western Berth, South
Soko
|
Dredging by Closed Grab Dredger
|
1
|
Double-Layer stand type silt
curtain will be provided at Pak Tso Wan (see Figure 6.15) during the dredging activities at
western berth. Cage type silt curtain
will be installed next to the grab dredger.
|
|
Sai Wan (western berth), South Soko
|
Sandfilling by Pelican Barge
|
1
|
Seawall
(completely constructed) in place prior to the reclaiming works. In case the seawall trench is filled with
sand instead of rock, a silt curtain (stand type enclosing the sandfilling
area, see Figure
6.15) will be
installed.
|
|
Tung Wan, South
|
Dredging by Closed Grab Dredger
|
1
|
Although no predicted WQO
exceedances, cage type silt curtain will be installed next to the grab
dredger to minimise the sediment dispersion.
|
|
Approach Channel and Turning Basin
|
Dredging by Closed Grab Dredger or
TSHD
|
3 grabs or 2 grabs + 1 TSHD (please
refer to EIA S6 for further details)
|
Silt curtain (cage type, see Figure 6.17) will be used during grab dredging
activities at AC/TB. Silt curtain (stand
type) will be provided at South of South Soko
to protect the coral (see Figure 6.16).
Should exceedance occur during water quality monitoring, additional
silt curtain (stand type) (see Figure 6.16) will be installed at the edge of
the channel dredging area.
|
|
Submarine Water Main (at South Soko shore approach)
|
Dredging by Closed Grab Dredger
|
1
|
Double-Layer silt curtain will be
provided at Pak Tso Wan (see Figure 6.15) during the dredging activities at
western berth. Cage type silt curtain
will be installed next to the grab dredger.
|
|
Submarine Water Main (at Shek Pik
shore approach)
|
Dredging by Closed Grab Dredger
|
1
|
Not required due to no predicted
WQO exceedances.
|
|
Submarine Water Main (waterway
crossing sand borrow area and marine navigation channel)
|
Dredging by Closed Grab Grab
Dredger
|
1
|
Not required due to no predicted
WQO exceedances.
|
|
Submarine Water Main (near South Soko)
|
Jetting by Jetting machine
|
1
|
Double-Layer silt curtain (Figure 6.15) will be provided at Pak Tso Wan
during the jetting activities near Pak Tso Wan, South
Soko
|
|
Submarine Water Main (near Shek
Pik)
|
Jetting by Jetting machine
|
1
|
Not required due to no predicted
WQO exceedances.
|
|
Submarine Cable Circuit
|
Jetting by Jetting machine
|
1
|
Double-Layer silt curtain (Figure 6.15) will be provided at Pak Tso Wan
during the jetting activities near Pak Tso Wan, South
Soko
|
|
Submarine Intake
|
Dredging by Closed Grab Dredger
|
1
|
Not required due to no predicted
WQO exceedances.
|
|
Cooled Water Outfall
|
Dredging by Closed Grab Dredger
|
1
|
Not required due to no predicted
WQO exceedances.
|
|
Gas Receiving Station at Black
Point
|
Dredging by Closed Grab Dredger
|
2
|
Not required due to no predicted
WQO exceedances.
|
|
Gas Receiving Station at Black
Point
|
Sandfilling by Pelican Barge
|
1
|
Not required due to no predicted
WQO exceedances.
|
|
Gas Pipeline (KP 0 – 1 )
|
Dredging by Closed Grab Dredger
|
1
|
Double-Layer silt curtain (see Figure 6.15) will be provided at Pak Tso Wan
during the dredging activities near the west of South
Soko. Cage type silt
curtain will be installed next to the grab dredger.
|
|
Gas Pipeline (KP 1 – 24.5)
|
Dredging by TSHD
|
1
|
The TSHD will be operated 12 hours a
day and the dredging works will avoid the Chinese While Dolphin calving
season from March to August.
|
|
Gas Pipeline (KP 24.5 – 31)
|
Dredging by Closed Grab Dredger
|
3
|
Cage type silt curtain will be used
during grab dredging activities along Lung Kwu Chau/Sha Chau Marine Park
Boundary.
|
|
Gas Pipeline (KP 31 – 33.5)
|
Dredging by Closed Grab Dredger
|
1
|
Not required due to no predicted
WQO exceedances. Should exceedance
occur during water quality monitoring, silt curtain (cage type) (see Figure 6.17) will be used during the dredging
activity.
|
|
Gas Pipeline (KP 33.5 – 33.976)
|
Dredging by Closed Grab Dredger
|
1
|
Not required due to no predicted
WQO exceedances. Should exceedance
occur during water quality monitoring, silt curtain (cage type) (see Figure 6.17) will be used during the dredging
activity.
|
|
Gas Pipeline (KP 33.976 – 35.39)
|
Dredging by Closed Grab Dredger
|
1
|
Not required due to no predicted WQO
exceedances. Should exceedance occur
during water quality monitoring, silt curtain (cage type) (see Figure 6.17) will be used during the dredging
activity.
|
|
Gas Pipeline (KP 35.39 – 37)
|
Dredging by Closed Grab Dredger
|
1
|
Not required due to no predicted
WQO exceedances. Should exceedance
occur during water quality monitoring, silt curtain (cage type) (see Figure 6.17) will be used during the dredging
activity.
|
|
Gas Pipeline (KP 37 – 37.803)
|
Dredging by Closed Grab Dredger
|
1
|
Not required due to no predicted
WQO exceedances. Should exceedance
occur during water quality monitoring, silt curtain (cage type) (see Figure 6.17) will be used during the dredging
activity.
|
|
Gas Pipeline (KP 37.803 – 38.303)
|
Dredging by Closed Grab Dredger
|
1
|
Not required due to no predicted
WQO exceedances. Should exceedance occur
during water quality monitoring, silt curtain (cage type) (see Figure 6.17) will be used during the dredging
activity.
|
The
predicted residual impacts would be in three main areas, i.e. Pak Tso Wan, West
Lantau and the fisheries spawning/nursery ground in South
Lantau.
For
Pak Tso Wan, it is anticipated that no unacceptable residual impacts will arise
from the jetting works based on the impact assessment presented in Section 6.6 and summarised below:
·
The
mitigated maximum short-term SS elevation is predicted to be 7.2 and 11.5 mg L-1
marginally exceeding the WQO of 6.9 and 5.5 mg L-1 for the dry and wet seasons
respectively.
·
The
elevation of SS levels will be of a short duration (< 2 days) and the levels
will return to normal shortly after the jetting machine has moved
elsewhere.
·
The
mixing zone is expected to be confined to the immediate vicinity of the works
area.
·
The
short-term maximum residual SS concentration is predicted to be well below the
level used to assess impacts to fisheries (50 mgL-1).
For
West Lantau, it is anticipated that no
unacceptable residual impacts will arise based on the impact assessment
presented in Section 6.6 and
summarised below:
·
The
daily maximum SS elevation of > 5 mg L-1 is predicted to be confined to the
works sites and the mean SS elevations are well below the WQO.
·
The
model assumes 24-hour operation but according to the construction schedule the
dredging works will be carried out for the daytime (12 hours per day).
·
Based
on the model results, the predicted exceedances of SS at the boundary of the
potential Southwest
Lantau Marine
Park will occur only in
the wet season. In reality, the TSHD
dredging will avoid the Indo-Pacific Humpback Dolphin calving season period of
March to August, i.e. the wet season.
For the remaining period that TSHD dredging will be scheduled, no WQO
exceedances are predicted and hence no adverse impact on the potential Marine Park
as well as other water sensitive receivers in West Lantau
waters will arise.
·
Each
TSHD dredging event will last for about 45 minutes within 2 to 3 hour period
during a 12-hour working day.
·
The
elevation of SS levels will be of a short duration and intermittent.
·
TSHD
dredging largely reduce the construction period and hence cause less
disturbance to the fisheries/ecological resources.
For
the fisheries spawning/nursery ground in South Lantau,
it is anticipated that no unacceptable residual impacts will arise based on the
impact assessment presented in Section
6.6 and summarised below:
·
Mixing
zones due to the dredging/jetting works are expected to be confined to the
works areas.
·
The
short-term maximum residual SS concentration is predicted to be well below the
level used to assess impacts to fisheries (50 mgL-1).
·
The
sediment plume caused by the non-concurrent activities occupy a relatively
small portion of the fisheries ground.
·
With
proper mitigation measures and good working practices, the impacts will be
largely reduced.
An evaluation of the residual impacts on
the above water sensitive areas is presented in Table 6.36.
Table 66.36 Evaluation of Residual Impact on Water
Quality Sensitive Areas
|
Evaluation Criteria
|
Water Quality Sensitive Areas
|
|
|
Fish fry habitat at Pak Tso Wan
|
Fisheries Spawning/Nursery Ground in South
Lantau
|
Marine mammal habitat in West Lantau including the Potential Marine Park
|
|
Effects on Public health and health of biota or
risk to life
|
Water quality exceedance is not
expected to adversely affect fish fry (refer to Part 2 – Section 10: Fisheries Impact Assessment).
|
Water quality exceedance is not
expected to adversely affect the fisheries ground (refer to Part 2 – Section 10: Fisheries Impact
Assessment).
|
Water
quality exceedances would not directly impact dolphins (Sousa chinensis) and are not expected to have indirect biological
consequences affecting their health.
WQO is mainiained at the boundary of the Potential Marine
Park.
|
|
The magnitude of the adverse environmental
impacts
|
Although
there would be exceedance of the WQO, water quality will comply with
fisheries assessment criteria. No adverse
impact is predicted.
|
Exceedances of the WQO will be
minor. Therefore the magnitude of
impact to water quality sensitive receivers would be low.
|
Exceedances of the WQO will be
minor offshore and of relatively short duration. Therefore the magnitude of impact to water
quality sensitive receivers would be low.
|
|
The geographic extent of the adverse
environmental impacts
|
Geographic extent of mixing zone is
small.
|
Geographic extent of mixing zone is
small and will be centred on the position where dredging/jetting works is
being conducted.
|
Geographic extent of mixing zone is
small and will be centred on the position where dredging works is being
conducted along the route and does not enter the Potential Marine
Park.
|
|
The duration and frequency of the adverse
environmental impacts
|
Occasional,
short duration, minor exceedances of WQO during a 2 month period.
|
The mixing zone will persist during
dredging/jetting works.
|
The mixing zone will persist during
dredging works which last for 40-45 minutes every 2-3 hours for 12 hours per
day.
|
|
The likely
size of the community or the environment that may be affected by the adverse
impacts
|
The sandy shore at Pak Tso Wan is
small in extent.
|
The area of fisheries ground
occupied by the mixing zone is small.
|
The area of West
Lantau waters occupied by the mixing zone is very small.
|
|
The degree to which the adverse environmental impacts
are reversible or irreversible
|
Water quality exceedances are
completely reversible as suspended sediment will settle out of the water
column.
|
Water quality exceedances are
completely reversible as suspended sediment will settle out of the water column.
|
Water quality exceedances are
completely reversible as suspended sediment will settle out of the water
column. Affected benthic communities are expected to recover quickly.
|
|
The ecological context
|
Pak Tso Wan is considered to be of medium
ecological value (refer to Part 2 –
Section 9: Marine Ecology Assessment)
|
South
Lantau waters are valuable for fisheries
operations.
|
West
Lantau waters are high ecological value marine
mammal habitat for Indo-Pacific Humpback dolphins.
|
|
International and regional importance (details refer to Part 2 – Section 9: Marine Ecology Assessment)
|
No adverse impact is
predicted. Pak Tso Wan sandy shore is
not of international or regional importance.
|
South
Lantau waters have been classified as
commercial importance for fisheries.
|
West Lantau has the highest density
of dolphins and highest encounter rate of young animals compared to other Hong Kong waters.
|
|
Both the likelihood and degree of uncertainty of
adverse environmental impacts
|
No
adverse impacts are predicted.
Predictions are based on water quality modelling results with highly
conservative assumptions.
|
Assessment
is based on water quality modelling results with highly conservative
assumptions and hence low likelihood of adverse environmental impacts is
expected.
|
Assessment
is based on water quality modelling results with highly conservative
assumptions and hence low likelihood of adverse environmental impacts is
expected.
|
|
Compliance with relevant established principles
and criteria
|
Yes
|
Yes
|
Yes
|
|
Compliance
with relevant established principles and criteria
|
Yes
|
Yes
|
Yes
|
|
|
|
|
|
|
|
|
|
|
|
|
|
|
|
|
|
|
|
|
|
|
6.11.2 Operation Phase
Given the rapid dilution of the
cooled water discharges from the terminal outfall and that the limited volume of sewage generated would be treated on site
before being discharged in accordance with the EPD’s required standards,
residual environmental impacts during the operation phase are not expected.
6.12 Cumulative Impacts
At present there are no committed projects
that could have cumulative impacts with the construction of the terminal at South Soko and the associated submarine utilities. For the projects discussed below,
installation of the gas pipeline will be of most relevance due to its proximity
to these projects.
The construction of the
HK-Zhuhai-Macau Bridge (HZMB) is now at the preliminary design stage and hence
the available information is not sufficient for cumulative impact
assessment. Discussions with the
Highways Department (HyD) have been conducted regarding the construction
programme for the HZMB. It is understood
that the design of the HZMB is now progressing and that all design details and
the construction programme are confidential.
Should it be confirmed that the pipeline and HZMB construction
programmes overlap, the cumulative impacts would need to be addressed in the
EIA Study for the HZMB.
There
is a possibility for an overlap of construction works for the submarine natural
gas pipeline and the construction of the Emissions Control Project at Castle
Peak Power Station. The submarine gas
pipeline will be located more than 4 km to the west of the dredging area of the
Emission Control Project (ECP). The
water quality modelling results of the ECP EIA showed that the maximum westward
extension of the sediment plume due to the dredging works was predicted to be
less than 1 km in both seasons. In this
Study, it is predicted that the sediment plume due to the jetting for the gas
pipeline will not extend eastward by more than 1 km. This means the sediment plumes raised by the
two projects are unlikely to overlap and that cumulative impacts are not
predicted.
The
Lantau Logistics Park (LLP) is proposed to be developed on a reclamation area
off the north shore of Lantau Island,
immediately to the north of, and encompassing, the existing Siu Ho Wan railway
depot. With reference to the Project
Profile for the LLP ([56]), the exact layout of the proposed LLP
reclamation is the subject of further study and will be confirmed by the
detailed investigations which are ongoing.
The way forward and construction programme of the LLP are also uncertain
at this stage. Should the construction
works of the LLP and the gas pipeline overlap, the sediment plumes are unlikely
to coincide as the works areas are more than 6 km apart.
6.13 Conclusions
This
Section of the EIA has described the
impacts on water quality arising from the construction and operation of the
proposed LNG terminal and the installation of the submarine gas pipeline,
watermain and cable. The purpose of the
assessment was to evaluate the acceptability of predicted impacts to water
quality.
Computer
modelling has been used to simulate the loss of sediment to suspension during
the construction phase and the impacts due to cooled water discharges during
the operation phase. The results and
findings of the computer modelling have been provided and summarized.
Potential
impacts arising from the proposed dredging or jetting works are predicted to be
largely confined to the specific works areas.
The predicted elevations of suspended sediment concentrations are
transient in nature and not predicted to cause adverse impacts to water quality
at the sensitive receivers.
During the operation phase, adverse
impacts to water quality are not expected to occur as the area affected by the
cooled water discharge is extremely small and in the immediate vicinity of the
discharge point.