3. AIR QUALITY
3.1 Introduction
3.1.1.1 This section presents the assessment on potential air quality impacts on the air sensitive receivers (ASRs) arising from construction and operation of the Project. Assessment has been conducted in accordance with the criteria and guidelines as stipulated in Annex 4 and Annex 12 of the Technical Memorandum on Environmental Impact Assessment Process (EIAO-TM) as well as the requirements given in Clause 3.4.4 of the EIA Study Brief (ESB-359/2023).
3.2 Environmental Legislation, Standards and Guidelines
3.2.1.1 The criteria for evaluating air quality impacts and the guidelines for air quality assessment are laid out in Annex 4 and Annex 12 of the EIAO-TM.
3.2.2 Air Quality Objectives & Technical Memorandum on EIA Process
3.2.2.1
The Air Pollution Control
Ordinance provides the statutory authority for controlling air pollutants from
a variety of sources. The Hong Kong Air
Quality Objectives (AQOs), which stipulate the maximum allowable concentrations
over specific periods for typical pollutants, should be met. The prevailing AQOs are listed in Table 3.1.
Table 3.1 Hong Kong Air Quality Objectives
|
Pollutants |
Averaging Time |
Concentration
Limit (µg/m3) [1] |
Number
of Exceedance Allowed per Year |
|
Respirable Suspended
Particulates (RSP or PM10) [2] |
24-hour |
75 |
9 |
|
Annual |
30 |
N/A [4] |
|
|
Fine Suspended
Particulates (FSP or PM2.5) [3] |
24-hour |
37.5 |
18 |
|
Annual |
15 |
N/A [4] |
|
|
Nitrogen Dioxide
(NO2) |
1-hour |
200 |
18 |
|
24-hour |
120 |
9 |
|
|
Annual |
40 |
N/A [4] |
|
|
Sulphur Dioxide (SO2) |
10-min |
500 |
3 |
|
24-hour |
40 |
3 |
|
|
Carbon Monoxide
(CO) |
1-hour |
30,000 |
0 |
|
8-hour |
10,000 |
0 |
|
|
24-hour |
4,000 |
0 |
|
|
Ozone |
8-hour |
160 |
9 |
|
Peak season |
100 |
N/A [4] |
|
|
Lead (Pb) |
Annual |
0.5 |
NA [4] |
Note:
[1] All measurements of the concentration
of gaseous air pollutants, i.e., sulphur dioxide, nitrogen dioxide, ozone and
carbon monoxide, are to be adjusted to a reference temperature of 293 Kelvin
and a reference pressure of 101.325 kilopascal.
[2] Suspended particulates in
air with a nominal aerodynamic diameter of 10µm or smaller.
[3] Suspended particulates in
air with a nominal aerodynamic diameter of 2.5µm or smaller.
[4] Not applicable.
3.2.3 Air Pollution Control (Construction Dust) Regulation
3.2.3.1 Notifiable and regulatory works are under the control of Air Pollution Control (Construction Dust) Regulation. This Project is expected to include notifiable works (site formation, reclamation, road construction and tunnel work) and regulatory works (site clearance, road opening or resurfacing work, slope stabilisation work, stockpiling of materials, loading and unloading of materials, and excavation / earth moving works, etc.). Contractors and site agents are required to inform Environmental Protection Department (EPD) and adopt mitigation measures to minimise dust and gaseous emission, while carrying out construction works, to the acceptable level.
3.2.4 Air Pollution Control (Non-road Mobile Machinery) (Emission) Regulation
3.2.4.1 The Air
Pollution Control (Non-road Mobile Machinery) (Emission) Regulation came
into effect on 1 June 2015. Under the
Regulation, non-road mobile machinery (NRMMs), except those exempted, are
required to comply with the prescribed emission standards. From 1 September 2015, all regulated machines
sold or leased for use in Hong Kong must be approved or exempted with a proper
label in a prescribed format issued by EPD.
Starting from 1 December 2015, only approved or exempted NRMMs with a
proper label are allowed to be used in specified activities and locations
including construction sites. The
Contractor is required to ensure the adopted machines or non-road vehicle under
the Project could meet the prescribed emission standards and requirement.
3.2.5 Air Pollution Control (Fuel Restriction) Regulation
3.2.5.1 The Air Pollution Control (Fuel Restriction) Regulation was enacted in 1990 to impose legal control on the type of fuels allowed for use and their sulphur contents in commercial and industrial processes to reduce sulphur dioxide (SO2) emissions. In April 2025, the Regulation was amended to tighten the limit on the sulphur content of liquid fuel for industrial and commercial use from 0.005% to 0.001%.
3.2.6 Air Pollution Control (Fuel for Vessels) Regulation
3.2.6.1 The Air Pollution Control (Fuel for Vessels) Regulation comes into effect on 1 January 2019. Under the Regulation, all marine vessels are required to use compliant fuel (including fuel with sulphur content not exceeding 0.5% or liquefied natural gas) within Hong Kong waters, irrespective of whether they are sailing or berthing.
3.2.7 Air Pollution Control (Marine Light Diesel) Regulation
3.2.7.1 The Air
Pollution Control (Marine Light Diesel) Regulation was introduced in April
2014 to control the maximum sulphur content of locally supplied marine light
diesel at 0.05%.
3.2.8 Development Bureau Technical Circular (Works)
3.2.8.1 The Development Bureau Technical Circular (Works) No. 13/2020 Timely Application of Temporary Electricity and Water Supply for Public Works Contract and Wider Use of Electric Vehicles in Public Works Contracts is one of the environmental guidelines on timely application of temporary electricity and wider use of electric vehicles in public works contract. Development Bureau Technical Circular (Works) No. 1/2015 Emissions Control of NRMM in Capital Works Contracts of Public Works also requires that no exempted generators, air compressors, excavators and crawler cranes shall be allowed in the new capital works contracts of public works (including design and build contracts) with an estimated contract value exceeding $200 million, unless is at the discretion of the Architect/Engineer considering no feasible alternative.
3.2.9 Practice Note on Control of Air Pollution in Vehicle Tunnels
3.2.9.1 The Practice Note on Control of Air Pollution in Vehicle Tunnels prepared by EPD provides guidelines on control of air pollution in vehicle tunnels. Guideline values on tunnel air quality are presented in Table 3.2.
Table 3.2 In-Tunnel Air Quality Guidelines
|
Pollutant |
Averaging Time |
Maximum Concentration |
|
|
µg/m3
[1] |
ppm |
||
|
Carbon Monoxide (CO) |
5 minutes |
115,000 |
100 |
|
Nitrogen Dioxide (NO2) |
5 minutes |
1,800 |
1 |
|
Sulphur Dioxide |
5 minutes |
1,000 |
0.4 |
|
Notes: [1] Measured at
298K and 101.325kPa |
|||
3.2.10 Air Pollution Control Ordinance – Specified Processes and the Licensing of Premises
3.2.10.1 Process stipulated in Schedule 1 of the Air Pollution Control Ordinance (APCO) is classified as Specified Process (SP). A licence is required to conduct the process in a premises under Part IV of the ordinance. SP relevant to the Project would be Cement Works (Concrete Batching Plant) – Works in which (a)(i) cement is handled, (ii) argillaceous and calcareous materials are used in the production of cement clinker, or (iii) in which cement clinker is ground; and (b)(i) the total bulk storage capacity exceeds 50 tonnes; (ii) the total installed capacity of concrete mixers exceeds 3 m3, or (iii) the total hourly concrete production rate exceeds 20 m3 per hour.
3.2.10.2 Grant of a SP licence by EPD is subject to whether the applicant can fulfil the environmental standards to avoid causing air pollution. A guidance note named Guidance Note on the Best Practicable Means for Specified Process – Cement Works (Concrete Batching Plant) (BPM 3/2 (2025)) sets out the minimum requirements for the provision and maintenance of the best practical means for an individual concrete batching plant (either on land or on a ship or barge). Apart from the suggested control measures in the BPM 3/2 (2025), particulates emission concentration limit of 10 mg/m3 (expressed at reference condition, 0°C, 101.325 kPa) shall be satisfied by all plants.
3.3 Description of the Environment
3.3.1.1
The Project would cover areas in north Lantau, south of Ma Wan and west
Tsing Yi. The main alignment of the
Project would connect north Lantau and west Tsing Yi via bridges crossing Kap
Shui Mun and Ma Wan Channel.
3.3.2 Background Air Quality
3.3.2.1
The nearest EPD air quality
monitoring stations (AQMS) are located at Kwai Chung and Tuen Mun and Tung
Chung for Tsing Yi side and Lautau side,
respectively. The recent five years
(2019 - 2023) annual average concentrations of air pollutants relevant to the
Project are summarised in Table 3.3, Table 3.4 and Table 3.5. In general, the pollutant
concentrations would comply with the prevailing AQOs. However, at Kwai Chung,
the annual average NO2 concentrations in Years 2019 to 2023 and
annual average FSP concentrations in Years 2019 and 2021 to 2023 failed to
comply with the prevailing AQO. At Tuen
Mun, the 10th highest daily average RSP during Years 2019 to 2021
and Year 2023, the annual average RSP, the 19th highest 24-hour
average FSP and annual average FSP concentrations in Years 2019 to 2023, as
well as annual average NO2 in Years 2019 and 2021 failed to comply
with the prevailing AQO. Moreover, at
Tung Chung, the 10th highest 24-hour average RSP and annual average RSP concentrations in Year 2019, and 19th
highest 24-hour average FSP and annual average FSP concentrations in Years 2019
and 2021 failed to comply with the prevailing AQOs. Despite these exceedances,
a general decreasing trend in all these parameters has been observed over the
past five years.
Table 3.3 Average Concentrations of Pollutants in the Recent Five Years (Year 2019 – 2023) at Kwai Chung EPD Air Quality Monitoring Station
|
Averaging
Time |
2019 |
2020 |
2021 |
2022 |
2023 |
|
|
Respirable Suspended Particulates (RSP) (µg/m3) |
10th Highest 24-hour |
59 |
46 |
56 |
53 |
54 |
|
Annual |
29 |
23 |
26 |
23 |
25 |
|
|
Fine Suspended Particulates (FSP) (µg/m3) |
19th Highest 24-hour |
34 |
27 |
32 |
34 |
30 |
|
Annual |
18 |
14 |
16 |
15 |
16 |
|
|
Nitrogen Dioxide (NO2) |
19th Highest |
184 |
184 |
180 |
168 |
182 |
|
10th Highest 24-Hour |
96 |
89 |
96 |
84 |
97 |
|
|
Annual |
54 |
48 |
52 |
44 |
50 |
|
|
Remarks: [1] Bolded value indicates exceedance of
the prevailing AQOs. |
||||||
Table 3.4 Average Concentrations of Pollutants in the Recent Five Years (Year 2019 – 2023) at Tuen Mun EPD Air Quality Monitoring Station
|
Pollutant |
Averaging Time |
2019 |
2020 |
2021 |
2022 |
2023 |
|
Respirable Suspended Particulates (RSP) (µg/m3) |
10th Highest 24-hour |
89 |
84 |
87 |
65 |
76 |
|
Annual |
41 |
34 |
36 |
32 |
34 |
|
|
Fine Suspended Particulates (FSP) (µg/m3) |
19th Highest 24-hour |
46 |
41 |
42 |
39 |
38 |
|
Annual |
24 |
20 |
19 |
18 |
19 |
|
|
Nitrogen Dioxide (NO2) |
19th Highest |
166 |
166 |
172 |
128 |
160 |
|
10th Highest 24-hour |
90 |
80 |
92 |
71 |
85 |
|
|
Annual |
47 |
40 |
44 |
39 |
40 |
|
|
Remarks: [1] Bolded value indicates exceedance of
the prevailing AQOs. |
||||||
Table 3.5 Average Concentrations of Pollutants in the Recent Five Years (Year 2019 – 2023) at Tung Chung EPD Air Quality Monitoring Station
|
Pollutant |
Averaging Time |
2019 |
2020 |
2021 |
2022 |
2023 |
|
Respirable Suspended Particulates (RSP) (µg/m3) |
10th Highest 24-hour |
75 |
66 |
63 |
57 |
51 |
|
Annual |
30 |
25 |
26 |
23 |
22 |
|
|
Fine Suspended Particulates (FSP) (µg/m3) |
19th Highest 24-hour |
43 |
34 |
38 |
36 |
28 |
|
Annual |
19 |
14 |
17 |
14 |
14 |
|
|
Nitrogen Dioxide (NO2) |
19th Highest |
149 |
113 |
115 |
94 |
118 |
|
10th Highest 24-hour |
80 |
64 |
61 |
51 |
58 |
|
|
Annual |
33 |
28 |
26 |
25 |
26 |
|
|
Remarks: [1] Bolded value indicates exceedance of
the prevailing AQOs. |
||||||
3.3.2.2 Apart
from the past air quality monitoring data, EPD has released a set of background
levels from “Pollutants in the Atmosphere and their Transport over Hong Kong”
(PATH) model PATHv3.0. In view the
operational phase of the Project will commence in year 2033, the relevant air
pollutant concentrations in the Study Area would be referenced to the PATHv3.0
data in relevant years 2030, as shown in below Table 3.6. In addition, the locations of the Project and
the concerned PATH grids are illustrated in Figure
3.1.
Table 3.6 Background Air Pollutants in Year 2030 Extracted from PATHv3.0
|
|
Pollutant Concentration (µg/m3) |
|||||||
|
RSP |
FSP |
NO2 |
||||||
|
10th Highest 24-hour |
Annual |
19th Highest 24-hour |
Annual |
19th Highest 1-hour |
10th Highest 24-hour |
Annual |
||
|
Prevailing AQOs (No. of Allowed Exceedance) |
75 |
30 |
37.5 |
15 |
200 |
120 (9) |
40 |
|
|
PATH v3.0 Grid |
26,35 |
51.10 |
19.05 |
29.14 |
11.65 |
91.32 |
42.96 |
23.30 |
|
26,36 |
50.72 |
19.04 |
28.93 |
11.64 |
94.63 |
48.31 |
25.62 |
|
|
27,34 |
51.29 |
18.90 |
28.52 |
11.51 |
93.87 |
46.03 |
24.74 |
|
|
27,35 |
51.54 |
19.05 |
29.02 |
11.64 |
96.15 |
42.76 |
23.98 |
|
|
27,36 |
51.07 |
19.04 |
28.72 |
11.65 |
95.74 |
44.41 |
24.50 |
|
|
28,34 |
51.48 |
18.95 |
28.62 |
11.58 |
101.41 |
50.66 |
28.68 |
|
|
28,35 |
51.32 |
18.92 |
28.32 |
11.56 |
99.71 |
48.04 |
27.10 |
|
|
28,36 |
50.81 |
19.04 |
27.88 |
11.68 |
98.64 |
49.48 |
27.27 |
|
|
29,35 |
51.00 |
19.12 |
28.40 |
11.75 |
104.05 |
57.29 |
31.58 |
|
|
29,36 |
50.95 |
19.33 |
28.25 |
11.94 |
103.52 |
57.13 |
30.68 |
|
|
29,37 |
50.67 |
19.41 |
27.72 |
12.03 |
100.61 |
54.34 |
30.62 |
|
|
30,35 |
50.91 |
19.19 |
28.55 |
11.81 |
105.76 |
57.68 |
32.50 |
|
|
30,36 |
51.21 |
19.20 |
28.43 |
11.83 |
103.42 |
55.52 |
30.66 |
|
|
30,37 |
51.28 |
19.37 |
28.20 |
11.99 |
101.31 |
53.23 |
28.83 |
|
|
30,38 |
50.09 |
19.22 |
27.99 |
11.86 |
96.91 |
47.08 |
25.40 |
|
|
31,35 |
50.68 |
19.23 |
28.14 |
11.84 |
104.93 |
55.48 |
31.00 |
|
|
31,36 |
51.07 |
19.61 |
28.84 |
12.18 |
99.92 |
52.91 |
29.21 |
|
|
31,37 |
50.57 |
19.42 |
28.65 |
12.01 |
93.26 |
43.77 |
24.66 |
|
|
31,38 |
50.46 |
18.89 |
27.62 |
11.56 |
89.21 |
38.81 |
22.33 |
|
|
32,35 |
51.22 |
19.44 |
28.59 |
12.01 |
103.35 |
49.55 |
29.29 |
|
|
32,36 |
51.26 |
19.76 |
29.09 |
12.29 |
96.54 |
45.60 |
26.62 |
|
|
32,37 |
50.46 |
19.35 |
28.13 |
11.92 |
91.49 |
39.27 |
22.54 |
|
3.4 Identification of Air Sensitive Receivers
3.4.1 Assessment Area
3.4.1.1 In
accordance with Clause 3.4.4.2 of the EIA Study Brief, the assessment area for
air quality assessment should be defined by a distance of 500m from the
boundary of the Project area.
Illustration of the proposed assessment area is presented in Figure 3.1.
3.4.2 Identification of Representative Air Sensitive Receivers
3.4.2.1
In accordance with Annex 12 of the EIAO-TM, any domestic premises,
hotel, hostel, hospital, clinic, nursery, temporary housing accommodation,
school, educational institution, office, factory, shop, shopping centre, place
of public worship, library, court of law, sports stadium or performing arts
centre are considered as ASRs.
Places/premises in which exposure is transient in nature (for example,
cycle track, pedestrian walkway, bus stop, mini-bus stop, and taxi stand) are
not considered to be ASRs.
3.4.2.2
For identification of the representative ASRs within the assessment area
that would likely be affected by the potential impacts from the construction
and operation of the Project, a review has been conducted based on relevant
available information including topographic maps, Outline Zoning Plans (OZPs)
(such as OZP No. S/I-NEL/12 - North-East Lantau, S/I-MWI/14 - Ma Wan and
S/TY/32 - Tsing Yi) and other published plans in the vicinity of the Project
site. The representative ASRs within the
assessment area are identified and given in Table 3.7 below. Their locations are illustrated in Figure 3.2.
Table 3.7 Representative Air Sensitive Receivers
|
ASR ID |
Description |
Land Use |
Approximate Distance from
Project Area (m) |
Assessment Height (mAG) [1] |
|
A01 |
Lantau Toll Plaza
Administration Building |
Office |
Within Project area |
1.5, 5,
10, 15 |
|
A02 |
Village House at
San Po Tsui |
Residential |
70 |
1.5, 5 |
|
A03 |
Village House at Yi
Chuen |
Residential |
Within Project area |
1.5, 5 |
|
A04 |
Village House at
Tso Wan |
Residential |
180 |
1.5, 5 |
|
A05 |
The Boy's Brigade,
Hong Kong |
GIC |
420 |
1.5, 5,
10 |
|
A06 |
Ma Wan Fire Station |
GIC |
460 |
1.5, 5,
10, 15, 20, 25 |
|
A07 |
Ma Wan Police Post |
GIC |
470 |
1.5, 5,
10, 15 |
|
A08 |
Noah's Ark |
Hotel |
420 |
1.5, 5,
10, 15 |
|
A09 |
Lantau Link
Visitors Centre |
Recreational |
45 |
1.5, 5,
10 |
|
A10 |
Tsing Yi Administration
Building |
Office |
Within Project area |
1.5, 5,
10, 15 |
|
A11 [2] |
Administration
Building of Hongkong United Dockyards Limited [2] |
Office |
Within Project area |
1.5, 5,
10, 15, 20 |
|
A12 |
Administration
Building of Shell Tsing Yi Installation |
Office |
30 |
1.5, 5,
10, 15, 20, 25 |
|
A13 |
Office of Shell
Tsing Yi Installation |
Office |
95 |
1.5, 5,
10, 15 |
|
A14 |
Office of Shell
Tsing Yi Installation |
Office |
110 |
1.5, 5,
10 |
|
A15 |
Not Used |
- |
- |
- |
|
A16 |
Northwest Tsing Yi
Interchange Vehicle Maintenance Workshop |
Office |
Within Project area |
1.5, 5 |
|
A17 |
Hobby NaNa Café (Coffee Shop) |
Commercial |
100 |
1.5, 5 |
|
A18 |
Hobby NaNa Café (Model Train Shop) |
Commercial |
110 |
1.5, 5 |
|
Remarks: 1.
Full range of assessment height for each ASR
has been covered. |
||||
3.4.2.3 As mentioned in Section 2, there are potential concurrent projects, namely the Sunny Bay Development, the Underground Quarrying Contract at Tsing Yi North, Ma Wan South Development (MWSD) and the development at Hongkong United Dockyards (HUD development), within the 500m air quality assessment area. However, apart from the Underground Quarrying Contract at Tsing Yi North, which is targeted for construction during 2027 to 2028, no concrete implementation programmes are available for other concurrent projects. No approved rezoning proposal / planning application and associated design plan of these projects are available at the time of this EIA study. Besides, the proposed developments have not yet obtained the rezoning application approval. On the above basis, these developments would not be considered as planned ASRs in this EIA Study.
3.5 Identification of Air Pollution Impacts
3.5.1
Construction Phase
3.5.1.1
With reference to Section 2, the Project include construction of
the Main Bridges (i.e. the cable-supported bridges crossing Ma Wan Fairway and
Kap Shui Mun Fairway), construction of viaduct at Ma Wan South (connecting the
cable-supported bridges), construction of North Lantau Interchange (including
slip roads, tunnel and viaducts), construction of Tsing Yi Connection
(consisting of slip roads and viaducts to connect the Main Bridges to existing
roads), modification and realignment of existing roads, and associated works
including reclamation, site formation and slope works, etc. The locations of the key construction
elements are presented in Figure
2.1.1 to Figure 2.1.4 and the construction method are presented in Figure 2.8.1 to Figure 2.8.13. The construction of the project is
tentatively scheduled to begin in Year 2027 and complete in Year 2033, which
has been detailed in Section 2.10.
3.5.1.2
During the construction phase, the Project would generate fugitive dust
and gaseous emission with potential impacts on neighbouring ASRs from various
construction activities, including site formation, site clearance, excavation,
reclamation, tunnelling, foundation works, handling and stockpiling of dusty
materials, wind erosion of limited exposed area, operation of barging points
(loading and unloading of materials), use of on-site mechanical machineries,
and emissions from construction vehicles and construction vessels, etc.
3.5.1.3
Site formation, site clearance, excavation, tunnelling, foundation
works, material handling (including operation of barging points) and
stockpiling would involve earth moving activities and be affected by wind
erosion and hence would be dusty in nature.
The locations of the dusty works area are presented in Appendix 3.11. The potential construction air quality impact
associated with these works would be evaluated in Section 3.7.1.
3.5.1.4
Reclamation would be required at Tsing Yi Tower Island, Ma Wan South
Tower Island, Ma Wan South Anchorage Island and Kap Shui Mun Tower Island, as
shown in Figure 2.1.1, to
accommodate and protect the proposed bridge towers and anchorage. The detail construction method has been
presented in Section 2.9.3. The
seabed treatment would be conducted by non-dredged deep cement mixing (DCM)
method as far as practicable. Dredging
would be avoided as far as practicable, and would only be conducted for area
where DCM method is engineering ineffective and for local obstruction removal
to facilitate DCM works. After the
seabed treatment, seawall would be constructed by blockwork and rock rill, and
finally complete the reclamation with reclamation filling. The dredged materials would be handled as
mentioned in Section 6, which stated that the sediment would be wetted
and properly covered when placed on barges, and loading of sediment onto barge
shall be controlled to avoid splashing and overflowing of sediment slurry, so
as to minimise potential odour and dust emissions. With proper implementation of above
mitigation measures, it is expected that odour impact would not be arisen from
the excavated / dredged sediment from the Project. Seabed treatment works would be non-dusty as
it is conducted under sea level. Seawall
construction works would also be non-dusty for the involved works involving
installation of rockfill and blockwork mostly under sea level. Reclamation filling works would be non-dusty
for most of the filling would be conducted under sea level, while the filling
works would become dusty when working above sea level. The potential odour impact and construction
air quality impact associated with reclamation works would be evaluated in Section
3.7.1.
3.5.1.5
On-site use of diesel-powered engines is also the potential source for
air pollutants, such as NO2, SO2, CO and smoke. The engine emissions from the NRMM are
regulated under the Air Pollution Control (Non-Road Mobile Machinery)
(Emission) Regulation. Fuel with
sulphur content not exceeding 0.001% by weight will be used to minimise SO2
emission in accordance with the Air Pollution Control (Fuel Restriction)
Regulation. In addition, the use of
NRMMs with exempted label under the Air Pollution Control (NRMM) Regulation
will be avoided as far as practicable.
The equipment would also be properly maintained to minimise any
emissions. Based on latest engineering
information, NRMM such as dump trucks, lorries, excavators, backhoes, breakers
and cranes would be used for the construction of the Project. On-site power supply
will be provided and the use of diesel generators and machinery will be avoided
during the construction stage, as far as practicable. Moreover, the construction works would be
conducted at various construction works area at North Lantau Interchange area,
Tsing Yi Connection area, and reclamation areas at Tsing Yi Tower Island, Ma
Wan South Tower Island, Ma Wan South Anchorage Island and Kap Shui Mun Tower
Island and in different time frame to reduce the potential air quality impacts
from NRMM. Each of the construction
works area would be limited in area size, as shown in Appendix 3.11, limiting the number
of NRMMs at any given time to less than 15 for each work site. Due to the limited number of NRMMs, the
associated potential air emission would be considered limited.
3.5.1.6
A maximum of 30 construction vessels trips per day are required for the marine construction
works. With reference to Section 6 and
summarised in Table 3.8, a
maximum of 4 barge trips per day of waste materials would be transported away
from the TYLL construction sites and via the barging points located at Tai
Chuen in northeast Lantau and Tsing Yi west to the north of Tsing Ma Bridge, as
shown in Figure 2.2.
Moreover, a maximum of 26 trips per day of other construction vessels
(including barges, tug boats, vessels for transporting equipment, etc.) would
be required for the marine construction works. These marine vessels would
operate using fuel that fulfill the requirements in Air Pollution Control
(Fuel for Vessels) Regulation and Air Pollution Control (Marine Light
Diesel) Regulation. The vessel
engines would be switched off during hotelling.
The navigation route of the construction vessels would be designed to be
farthest away from the ASRs, with a minimal distance of over 70 m from the
nearest ASR A2 at Lantau and over 200m the nearest ASR A9 at Tsing Yi. Therefore, the impact of marine emissions
associated with construction activities is expected to be limited on the nearby
ASRs.
3.5.1.7
A maximum of 208 truck trips per day (207 trucks of
construction and demolition materials, general refuse and floating refuse + 1
truck of chemical waste) would be required to transport materials to / from the
construction site during construction of the Project. The breakdown for each construction site has
been presented in below Table 3.8. The tentative transport routings have been
designed to avoid the use of local roads, as stated in Section 6 - Table 6.7 and the
truck traffic should avoid peak hours, as far as practicable. The C&D
materials would be reused on-site or recycled before transported to Public Fill
Reception Facilities (PFRFs) (such as Tuen Mun Area 38 Fill Bank) or West New
Territories (WENT) Landfill via Lantau Link and North Lantau Highway. The
minimum separation between the transportation route of C&D materials and
the closest ASR (A01) would be about 50m. The chemical wastes generated during
construction phase would be transported to Chemical
Waste Treatment Centre (CWTC) in Tsing Yi via Lantau Link, Tsing Sha Highway and Tsing Yi
Road. The minimum separation between the transportation
route of chemical wastes and the closest ASR (A10) would be about 70m. Dump
trucks are equipped with water-tight container and mechanical cover, which
would not cause fugitive dust emission on the open road. With the
implementation of these design measures, it is anticipated that no adverse air
quality impact would be caused by the transportation of spoils along the
routes.
Table 3.8 Breakdown of Trips for Waste Disposal
|
Transfer Point |
Treatment Facility / Disposal Site |
Maximum
No. of Trips per Day |
||
|
Dump
Truck |
Marine
Vessel |
|||
|
Tsing Yi Area |
Tsing Yi barging point |
PFRFs / WENT Landfill |
207 |
2 |
|
Lantau Area |
Lantau barging point |
|||
|
Reclamation sites |
- |
Disposal site(s) allocated by MFC |
0 |
2 |
|
All work sites |
- |
CWTC |
1 |
0 |
|
Total |
208 |
4 |
||
3.5.1.8
To provide sufficient amount of concrete for construction of the
Project, a potential temporary concrete batching plant (CBP) of approximately
not more than 10,000 tonnes capacity may be erected by the contractor, subject
to the contractor’s design. The potential
temporary CBP will be removed upon the completion of the Project. No operation phase air quality impact would
be anticipated from the potential temporary CBP. The potential temporary CBP would be located
farthest away from the ASR as practicable within the tentative area shown in Figure 3.2, which is at least 70m from
the nearest ASR A02. If the contractor
erects the temporary CBP, on-site electricity supply should be provided, such
that no diesel fuel would be used for the CBP.
No diesel fuel combustion emission would be anticipated from the
CBP. The associated air quality control
measures would be implemented at the potential temporary CBP to minimise the
potential air quality impact. The
associated construction phase air quality impact due to the potential temporary
CBP would be addressed by the associated SP License application under the Air
Pollution Control (Specified Processes) Regulation. A comprehensive EM&A program, including
continuous dust monitoring, would be implement during construction phase to
ensure no adverse
construction air quality impacts from the presence of the temporary CBP. More details of the mitigation
measures presented in Section 3.8.1.
3.5.1.9
In view of the minor impact by NRMMs, construction vehicles and
construction vessels, particulates from construction activities and CBP would
be the major air pollutant during construction phase.
Concurrent Project
3.5.1.10 As mentioned in Section 2, cumulative
construction phase air quality impact would be anticipated from concurrent
projects, such as the Sunny Bay Development, the Underground Quarrying Contract
at Tsing Yi North, the MWSD and the HUD development. However, apart from
the Underground Quarrying Contract at Tsing Yi North, which is targeted for
construction during 2027 to 2028, no concrete implementation
programmes are available for other concurrent
projects. No approved rezoning proposal
/ planning application and associated design plan of these projects are
available at the time of this EIA study.
Besides, the proposed developments have not yet obtained the rezoning
application approval. On the above basis, the potential cumulative construction phase air quality impacts of these projects would be assessed
qualitatively in this EIA Study.
Notwithstanding the above, cumulative impact from these projects (if any) would be considered in separate
studies of these projects by respective project
proponents.
3.5.1.11 Cumulative impact would be
expected during construction phase of the Project from concurrent projects,
including Hong Kong Island West – Northeast Lantau Link (HKIW-NEL Link), Road
P1 (Tai Ho – Sunny Bay Section) and Route 11 (section between Yuen Long and
North Lantau). Details of the concurrent
projects are shown in Section 2 and Appendix 2.1.
Review of Dust Monitoring Data of Past Project
3.5.1.12 A review of dust monitoring data during construction phase of similar infrastructure projects including Cross Bay Link (CBL) (AEIAR-172/2013), Tseung Kwan O – Lam Tin Tunnel (TKO-LTT) (AEIAR-173/2013), Route 9 Project (AEIAR-018/1999), Hong Kong - Zhuhai - Macao Bridge Hong Kong Link Road (HKLR) (AEIAR-144/2009) has been conducted. CBL is an approximately 1.8 km long marine viaduct in the form of a bridge. TKO-LTT includes marine viaducts at Tseung Kwan O Interchange with small scale reclamation of 3 ha. HKLR consists of 9.4 km long viaduct (which mostly are marine viaduct) and concrete batching plant. Route 9 included a 1.6km long marine viaduct in the form of a bridge and involving area of west Tsing Yi, where the Project located, and existing concrete batching plant is located in the area. The abovementioned projects are large-scale infrastructure projects of similar nature to the 3.3km long marine viaduct of the Project, with small scale reclamation and potential temporary concrete batching plant. The work sites of these projects were located in close vicinity of ASRs. Good site practices and mitigation measures as recommended in the EIA Report were adopted. Some existing ASRs were located in close vicinity of construction works and CBP, and selected as dust monitoring stations for impact monitoring during construction phase of the projects. In view of the above, the data of these monitoring stations of both projects were selected for review.
3.5.1.13 For CBL project, the measured 1-hr TSP and 24-hr TSP levels at all monitoring stations were below the action levels of 278 µg/m3 and 190 µg/m3 respectively and limit levels of 500 µg/m3 and 260 µg/m3 respectively during site clearance and site formation with the monitoring locations located from the work site boundary from 10m to 40 m. No exceedance of action level and limit level was recorded.
3.5.1.14 For TKO-LTT project, during 2016 – 2024, the measured 24-hr TSP levels at all monitoring stations located from 0m – 160m from the work site boundary complied with limit level of 260 µg/m3 except two measurement events of exceedance recorded. After investigation, the exceedance events were not related to the construction of the project. In fact, over 99% of the measured 24-hr TSP levels at all monitoring stations were below the action level (i.e. 165 - 210 µg/m3) during the whole construction period.
3.5.1.15 For Route 9 project, the measured 1-hr TSP and 24-hr TSP levels at all monitoring stations complied with action levels (i.e., 318 µg/m3 – 350 µg/m3, and 163 µg/m3 - 200 µg/m3, respectively) and limit levels (i.e., 500 µg/m3 and 260 µg/m3, respectively) during site clearance and excavation with the monitoring location as close as 40m from the construction works. No exceedance of action level and limit level was recorded.
3.5.1.16 For HKLR project, a majority of the measured 1-hr TSP and 24-hr TSP levels at the monitoring stations complied with action levels (i.e., 352 µg/m3 – 381 µg/m3, and 164 µg/m3 - 186 µg/m3, respectively) as well as the limit levels (i.e., 500 µg/m3 and 260 µg/m3, respectively) during the construction of the land and marine viaduct. Only two limit level exceedances associated project works were recorded at the monitoring station located 90m away from the soil handling works. No action level nor limit level exceedances related project works were recorded after enhancing water spraying for soil handling works.
3.5.1.17 In view of the insignificant dust impact caused by these past similar scale projects, the potential construction air quality impact by the Project is evaluated qualitatively.
3.5.2 Operational phase
3.5.2.1 In
addition to the background pollutant concentrations, potential air quality
impacts during the operational phase would be associated with vehicular
emissions from the existing and planned road network within 500m assessment
area, from the proposed open roads under the Project, from the proposed
tunnels, vehicular emissions from concerned facilities such as public transport
interchanges (PTIs), bus terminus/depot, heavy goods vehicle (HGV)/coach
parking sites, industrial emissions within 500m assessment area, industrial
emissions from major point sources within 4 km, and marine emissions within
500m assessment area.
Vehicular Emissions from the Existing, Planned and Proposed Road Network
3.5.2.2
The TYLL main bridge, the associated slip roads at
Tsing Yi, and the associated slip roads at north Lantau were proposed under the
Project. Major existing roads within 500m assessment area include Tsing Long
Highway, Tsing Yi North Coastal Road, North West Tsing Yi Interchange, Cheung
Tsing Highway, Sai Tso Wan Road, Lautau Link (including Tsing Ma Bridge) and Ma Wan
Road, etc. Planned roads within the 500m assessment area include the HKIW-NEL
Link, the Road P1 (Tai Ho-Sunny Bay) Section and the Route 11 (section between
Yuen Long and North Lantau). Vehicular emissions
from all the existing, planned and proposed open roads were considered in the modelling
assessment. The associated road traffic
data (including TD’s endorsement), and calculation of vehicular emission
sources are presented in Appendix 3.1 and Appendix
3.2, respectively.
3.5.2.3 Existing
tunnels within 500m would include the west portal of Cheung Ching Tunnel and
Nam Wan Tunnel. No existing tunnel
ventilation building was identified for Cheung Ching Tunnel and Nam Wan Tunnel. There is no proposed ventilation building
under the Project. Hence, vehicular
emission from the proposed tunnels would be emitted from the portals in the
quantitative modelling. According to section 3.5.4 of the approved EIA Report
for Route 11 (AEIAR-255/2023) and the latest concurrent project information, no
vehicular emission would be emitted from ventilation building. Hence, the
vehicular emission from the planned tunnels would be assumed to be emitted from
the portals for the modelling assessment.
Locations of portals of the tunnels are presented in Appendix 3.3.
Vehicular Emission associated with the
Concerned Facilities
3.5.2.4 Facilities
with frequent operation associated with vehicles also contribute to ambient air
quality by vehicular running, idling and start emission within the facilities
of concerned. The facilities of concern within assessment area, such as parking
sites, public light bus (PLB) terminus and Transport Department Vehicle
Examination Complex (TDVEC), were identified and their locations are
illustrated in Appendix 3.4.
The vehicular emission from these concerned facilities would be included in the
modelling assessment.
Industrial Emissions and Major Point Sources
within 4 km
3.5.2.5 There are a total of 9 industrial emission sources with specified process (SP) licenses identified within the 500m assessment area. The industrial emission sources with SP licences are listed in Table 3.9.
Table 3.9 Identified Industrial Emission Sources within 500m Assessment Boundary
SP Licence No.
|
Industrial Emission Source
|
L-3-266(1) |
Anderson Concrete Limited STW2 Plant |
L-3-256(2) |
Anderson Concrete Limited (Tsing Tim Street) |
L-3-213(6) |
Alliance Construction Materials Limited |
L-15-027(5) |
Asphalt Surface (International) Limited (AP-5) |
L-3-247(2) |
Anderson Concrete Limited (Sai Tso Wan Road) |
L-25-004(5) |
Shell Tsing Yi Installation |
L-25-013(5) |
Chevron Hong Kong Limited Tsing Yi Terminal |
L-15-042(1) |
Anderson Asphalt Limited |
L-11-057(1) |
Tapbo Environmental Limited |
3.5.2.6 There are
3 major point sources within 4 km from the Project, namely Asphalt Plant
(AP-5), CWTC and Kwai Chung Crematorium. Kwai Chung Crematorium and CWTC are
separated from the Project area and assessment area by hills at Tsing Yi (Sam
Chi Heung and Liu To Shan) and hence unlikely to pose direct impact to the
identified ASRs. Furthermore, the air
quality impacts from the Kwai Chung Crematorium and CWTC have been taken into
account by PATH model as background concentrations. Thus, these two sources
would be excluded from the quantitative air quality assessment. On the other hand, the Asphalt Plant (AP-5)
is located within the assessment area.
The potential impact from Asphalt Plant (AP-5) would be included in the
quantitative air quality assessment.
3.5.2.7 Site
survey has been conducted on 31 March 2025. No non-SP industrial emission
sources were identified. Thus, only the emission from these industrial
facilities with SP licenses, including the major point source Asphalt Plant
(AP-5) would be included in the modelling assessment. The locations of the industrial and major
point source considered in the modelling assessment are presented in Appendix 3.5.
Marine emissions from marine vessels within
500m assessment area
3.5.2.8 The
proposed TYLL main bridge would cross the Ma Wan Fairway (MWF) and Kap Shui Mun
Fairway (KSMF), which are partially located within the assessment boundary.
3.5.2.9 Marine
traffic emission within the assessment boundary would be anticipated from the
marine activities at MWF and KSMF, and the associated in-shore area, as well as
the hotelling activities at Tsing Yi Shell Installation. Therefore, the marine traffic emission would
be considered in the modelling assessment.
3.5.2.10 Marine
traffic data provided by Marine Traffic Consultant and agreement with Marine
Department are presented in Appendix
3.6. Emission inventory of the
marine traffic emission is presented in Appendix
3.7.
Identification of Key Air Pollutants from the
Project
3.5.2.11 Vehicular
emission is the dominant source of air pollutants within the Project during
operational phase. The key air pollutants associated with vehicular emission
during operational phase include NOX, RSP and FSP.
Emissions due to Concurrent Project
3.5.2.12
As mentioned in Section 2,
cumulative operation
phase air quality impact would be anticipated from concurrent projects, such as
the Sunny Bay Development, the Underground Quarrying Contract at Tsing Yi
North, the MWSD and the HUD development.
However, apart from the Underground Quarrying
Contract at Tsing Yi North, which is targeted for construction during 2027 to
2028, no concrete
implementation programmes are available for other
concurrent projects. No approved rezoning proposal /
planning application and associated design plan of these projects are available
at the time of this EIA study. Besides,
the proposed developments have not yet obtained the rezoning application
approval. On the above basis, the
potential cumulative operation phase air quality impact of these projects (if
any) would be considered in separate studies of these projects.
3.5.2.13 Cumulative impact would be
expected during operation phase of the Project from concurrent projects,
including Hong Kong Island West – Northeast Lantau Link (HKIW-NEL Link), Road
P1 (Tai Ho – Sunny Bay Section) and Route 11 (section between Yuen Long and North
Lantau). Emissions from these projects
are considered above in Section 3.5.2.2. Details of the concurrent projects are
shown in Section 2 and Appendix
2.1.
3.6 Assessment Methodology
3.6.1
Construction Phase
3.6.1.1 In accordance with Clause 3 (i), Appendix B of the EIA Study Brief, the construction phase air quality impact assessment is conducted qualitatively.
3.6.1.2 With reference to past air quality monitoring data, the construction of similar scale projects did not pose adverse construction phase air quality impacts, as presented in Section 3.5.1. It is anticipated that the Project would not cause adverse air quality impacts during construction phase with the implementation of appropriate mitigation measures, and good site practices.
3.6.1.3 A comprehensive EM&A programme with RSP and FSP real-time monitoring would be conducted to ensure the proper implementation of measures and the compliance of AQOs during the construction of the Project.
3.6.2
Operational phase
3.6.2.1 The AERMOD models will be used to simulate dispersion of emission from the sources identified in Section 3.5.2. The future background concentrations for air pollutants from EPD’s latest PATH v3.0 model have been adopted. According to EPD’s Technical Note for Modelling Vehicular Emissions Using AERMOD (the TNVE), AERMOD model will be used to simulate open road emissions as line sources, tunnel portal emissions as volume source. Vehicular emission associated with the existing on-street minibus termini, bus depot, heavy goods vehicle and coach parking site would be modelled as area source in AERMOD. Marine emissions would be modelled in AERMOD as point source or horizontal point source, while industrial emission would be modelled in AERMOD as point source or area source.
Background Pollutant Concentrations – PATH v3.0 Model
3.6.2.2 As suggested by EPD’s “Guidelines on Assessing the ‘TOTAL’ Air Quality Impacts”, an integrated modelling system, PATH v3.0 is applied to estimate the background pollutant concentrations. The emission sources including those in Pearl River Delta Economic Zone, roads, marine, airport, power plants and industries within Hong Kong are all considered in the PATH model. The 500m assessment area covers the PATH grid cells listed in Table 3.6. The locations of the Project on the PATH gird cells are illustrated in Figure 3.1.
Determination of the Assessment Year
3.6.2.3 With reference to Clause 5 (iv) of Appendix B of the EIA Study Brief, the year with highest emission from road vehicles and marine vessels in the assessment area within 15 years upon commissioning of the Project would be selected as the assessment year.
3.6.2.4 The Project will be completed and commence operation in Year 2033. Therefore, Years 2033, 2036, 2041, 2046 and 2048 are selected for sensitivity testing for the assessment year. The vehicular and marine emission burden of these years would be calculated. The Years 2033 and 2041 were selected as the assessment years for the highest total emission burden of particulate matters (RSP and FSP) and NOX, respectively.
Table 3.10 Vehicular and Marine Emission Burden within the Assessment Area
|
Source |
Pollutant |
Emission Burden (tonne per year) |
||||
|
Year 2033 |
Year 2036 |
Year 2041 |
Year 2046 |
Year 2048 |
||
|
Vehicular |
NOX |
91.39 |
57.97 |
47.07 |
31.26 |
32.31 |
|
RSP |
4.10 |
2.15 |
1.99 |
1.47 |
1.49 |
|
|
FSP |
3.77 |
1.97 |
1.83 |
1.36 |
1.37 |
|
|
Marine |
NOX |
752.38 |
775.89 |
811.15 |
811.15 |
811.15 |
|
RSP |
21.58 |
22.07 |
22.81 |
22.81 |
22.81 |
|
|
FSP |
20.02 |
20.48 |
21.17 |
21.17 |
21.17 |
|
|
Total |
NOX |
843.77 |
833.86 |
858.22 |
842.41 |
843.46 |
|
RSP |
25.68 |
24.22 |
24.80 |
24.29 |
24.30 |
|
|
FSP |
23.79 |
22.46 |
23.00 |
22.52 |
22.54 |
|
|
Remark: [1] The vehicular emission burden is based on the annual minimum temperature and relative humidity of
the PATH grids, where each road links is situated. |
||||||
Vehicle Emissions from Open Road and Concerned
Facilities
3.6.2.5 EPD’s latest EMFAC-HK v4.3 model would be adopted to determine the vehicle emission factors of NOX (i.e. initial NO + initial NO2), FSP and RSP for vehicle emissions arising from open road within 500m assessment area, tunnel portal(s), Concerned facilities, such as on-street PLB termini, and heavy goods vehicle and coach parking site. The “vehicle fleet” refers to all motor vehicles operating on roads within this study area. The modelled fleet is broken down into 18 vehicle classes based on the information in the Transport Monthly Digest and vehicle population provided by EPD.
3.6.2.6 The input parameters and model assumptions made in EMFAC-HK model are summarised as follows.
(a) Referring to the EPD’s Guideline on Modelling Vehicle Emissions, “EMFAC mode” is used for calculating emission factors in terms of grams of pollutants emitted per vehicle activity. It is selected for this study, since it can provide the emission factors according to the actual hourly travelling speeds of vehicles of each road.
(b) Start emissions, running exhaust emissions and idling emissions associated with on-street PLB termini within 500m study area are modelled based on the estimated / scheduled information from minibus companies. For the existing heavy goods vehicle carparks and bus depot, the calculation of start emissions is based on the traffic data provided by the traffic consultant, who conducts at least 24 hours of site survey on normal working day. The vehicular emissions associated with TDVEC would be calculated based information provided by Transport Department.
(c) The diurnal variation of daily trips is used to estimate the start emissions of diesel vehicles fitted with selective catalytic reduction (SCR) devices, petrol and liquefied petroleum gas (LPG) vehicles. Zero trip is assumed for franchised buses on open roads, as the associated vehicular start up within the Project area would be conducted at PLB termini, HGV/coach parking sites, and bus depot. The default trip and VKT values from EMFAC-HK model v4.3 are used in the calculations and the proportion of local and rural roads within Hong Kong of 3.62% is assumed based on The Annual Traffic Census 2023.
(d) Based on the available speed information provided by traffic consultant, emission factors of each vehicle class are adopted according to the travelling speed of each road link at each hour. All the vehicle classes on the same road link are assumed to have the same travelling speed, except medium goods vehicles, heavy goods vehicles, buses and PLBs, which have speed limit.
(e) In accordance with the Road Traffic Ordinance, for any road with design speed limit of 70 kph or above, the speed limit for medium goods vehicles, heavy goods vehicles, and buses would be limited to not more than 70 kph. Thus, the speeds of medium goods vehicles, heavy goods vehicles, and buses from the flow speed or 70 kph, whichever is lower, is adopted. For the PLB, the speed limit should be limited to posted speed of the carriageway or 80 kph, whichever is lower, is adopted.
(f) For the estimation of air quality impact of NO2, RSP and FSP, the air pollutant emission rate would be estimated for model input based on the meteorological data in each hour for each month extracted from the PATHv3.0 grids where the road links are located will be used as input for the model. For the estimation of air quality impact of short-term NO2 (i.e., hourly NO2 and daily NO2), short-term and long-term RSP (i.e., daily RSP and annual RSP) and short-term and long-term FSP (i.e., daily FSP and annual FSP), an approach of using daily profile of lowest temperature and relative humidity data in each hour for each month was adopted. For long-term NO2 (i.e., annual NO2), an approach of using daily profile of averaged temperature and relative humidity data in each hour for each month was adopted.
3.6.2.7 The local/rural roads with potential start emission are identified based on Traffic Consultant’s advice, desktop review and site survey. Both running emissions and start emission are considered for these roads, whereas only running emissions are considered for the major roads and local/rural roads without potential start emissions. The locations of road segments with potential start emissions are illustrated in Appendix 3.2.
3.6.2.8 The Smart Air Modelling Platform v2.1 (SAMP v2.1), developed by EPD, is adopted to calculate the composite vehicular emission rates. In addition, the “zero emission vehicle scenario”, which consider the projected population and proportion of zero emission vehicles (ZEV), such as electric vehicles, is enabled to provide more realistic estimation. The projections of ZEV for different vehicle classes, are based on the Summary of assumptions for projecting vehicle population & emissions by EPD. The calculated 24-hour emission rates of 18 vehicle classes for each road are then adopted in the subsequent air dispersion modelling (i.e. AERMOD). The emission rates and detailed model input parameters are presented in Appendix 3.2.
Meteorological Data and Surface Characteristic Parameter Adopted in
AERMOD
3.6.2.9 Hourly meteorological conditions including wind data, temperature, relative humidity, pressure cloud cover and mixing height are extracted from the WRF meteorological data adopted in the PATH v3.0 model. With reference to ReadMe for AERMET Tool in SAMP v2.1 developed by EPD, the minimum wind speed is capped at 0.5 m/s. The mixing height was capped between 119 m and 2,009 m according to the observation in Year 2019 by HKO. The height of the input data was assumed to be 8.5 m above ground (mAG) for the first layer of the WRF data as input. The meteorological data was input as on-site data in AERMET (the meteorological preprocessor of AERMOD).
3.6.2.10 Surface characteristic parameters such as albedo, Bowen ratio and surface roughness are required in the AERMET. The land use characteristics of the surrounding would be classified and these parameters of each landuse would then be suggested by AERMET default according to its land use characteristics. The detailed assumptions for surface characteristic parameters are presented in Appendix 3.8. The AERMET meteorological data are then employed for the AERMOD model run. Elevated terrain mode was adopted for this assessment. With reference to EPD’s Guidelines on Choice of Models and Model Parameters, the population recorded in the latest 2021 population census would be adopted, i.e. 495,798 for Kwai Tsing district and 320,094 for Tsuen Wan district. Given the high population density, urban mode would be adopted in AERMOD.
Vehicular Road
Traffic Emission on Open Road
3.6.2.11 Emissions on all existing and planned roads within the assessment area were included in this assessment. The dispersion of NO, NO2, FSP and RSP concentrations would be modelled using AERMOD. Open sections of existing and planned road networks within the assessment area were considered in the model. Detail settings follow the Technical Note for Modelling Vehicular Emissions Using AERMOD (TNVE) issued by EPD in January 2024. The release height of vehicular emission in the model would be a weighted average of the suggested average vehicle height for each vehicle class in Table 1 of the TNVE.
Portal Emissions from Tunnel
3.6.2.12 The vehicular emissions (initial NO, initial NO2, RSP and FSP) in tunnel discharged to the atmosphere from portals located within 500m assessment boundary (including Cheung Ching Tunnel, Nam Wan Tunnel, planned tunnels by Route11, HKIW-NEL Link, and proposed tunnel by the Project) would be calculated based on the 24-hour vehicle emission factors predicted by EMFAC-HK model and vehicle flows in the assessment year provided by the traffic consultant. The lowest temperature and the lowest relative humidity among the PATH Grids where the tunnel located are adopted to determine the composite emission factors. The detailed calculations of the portal emissions were presented in Appendix 3.3.
3.6.2.13 Portal emissions would be modelled in accordance with the TNVE. Pollutants ejected from the portal would be modelled as a 100m long portal jet such that 2/3 of the total emissions were dispersed within the first 50 m jet from the portal and 1/3 of the total emissions within the second 50 m jet. Portal emission would be modelled as volume sources in the AERMOD. For odd number of volume sources, an average emission rate of a volume source in the first half of the portal source length and the second half of the portal source length would be assigned to the middle volume source.
Vehicular
Emission Associated with the Concerned Facilities
3.6.2.14 Vehicular emissions induced by the identified Concerned Facilities, such as bus depot, vehicle examination complex, on-street minibus terminus, heavy goods vehicle and coach parking sites will be included in this assessment to avoid any underestimation of air quality impact. The vehicular emissions from these facilities within the 500m assessment area were calculated based on the start emission and running exhaust emission factors predicted by EMFAC-HK model, cold idling emission factors from the Calculation of Start Emissions in Air Quality Impact Assessment published by EPD, warm idling emission factors from Road Tunnels: Vehicle Emissions and Air Demand for Ventilation published by World Road Association and traffic data provided by the traffic consultant. As presented in Section 3.6.2.4, both Year 2033 and Year 2041 were selected as the assessment years, and thus the vehicular emissions from these facilities were calculated for Year 2033 and Year 2041 accordingly. As a conservative estimation, the lowest temperature and relative humidity data among all PATH grids (i.e., 9ºC and 17%) within 500m assessment area were adopted to determine the start emission factors and running emission factors. The traffic data and emission factors are presented in Appendix 3.4.
3.6.2.15 Calculations of emission associated with these facilities were referenced to the Calculation of Start Emission in Air Quality Impact Assessment published by EPD. Start emissions from diesel vehicles fitted with selective catalytic reduction (SCR) devices were adjusted based on the idling emission and would be released over total spread distance of 700 m from where the start takes place, while start emissions for LPG minibus, taxis and private light bus were adjusted based on the idling emission and would be released over a total spread distance of 150 m from where the start takes place. Running exhaust and idling emissions would be released on the spot. For identified terminus, depot, vehicle examination centres, and parking sites, running exhaust and idling emissions from terminating and non-terminating vehicles, and adjusted start emission from terminating vehicles are considered for emissions inside the concerned facilities while the remaining adjusted start emission from terminating vehicles is considered for emissions outside the concerned facilities. The spread routes have been presented in Appendix 3.4.
3.6.2.16
According to site survey
conducted on 12 December 2024 and 31 March 2025, the parking site of DSL (L17)
is the only existing semi-enclosed parking site with no forced ventilation, TDVEC is the only semi-enclosed facility with mechanical ventilation systems, while other existing parking sites
are open air design. The vehicular emission for the facilities with open-air
design would be modelled as “AREAPOLY” source in AERMOD. The vehicular emission
for semi-enclosed parking sites/TDVEC
would be modelled as “VOLUME” source in AERMOD. The
vehicle emission emitted from the mechanical ventilation systems in TDVEC would
be modelled as “POINT/POINTHOR” sources in AERMOD. For the TDVEC, it was observed during the
site visit that retractable hoses are attached to the tailpipes of vehicles to
collect the vehicular exhaust during inspection of running emissions. The collected exhaust would be discharged to
the atmosphere via mechanical system.
Hence, as a conservative assumption, 100% of the TDVEC vehicular
emission are emitted from the mechanical ventilation system as “POINTHOR"
sources, and 100% of emissions (except Running Emissions generated from Vehicle
Inspections) are dispersed via natural ventilation as "Volume
Sources". The detailed model configurations and inputs for each facility
are presented in Appendix 3.4.
Marine Emissions
3.6.2.17 The alignment of the proposed road under the Project would cross Kap Shui Mun and Ma Wan Channel. Marine emission from routine ferry service and other marine vessels would be anticipated.
3.6.2.18 Marine traffic data within 500 m assessment area for the sensitivity tests were provided by marine traffic consultant and were endorsed by the Marine Department (MD). The marine traffic data and MD’s endorsement were presented in Appendix 3.6. Detail breakdown of the marine vessel types and calculation of the marine emission are presented in a separate Technical Note for Marine Emission at Ma Wan and Kap Shui Mun Fairways.
3.6.2.19 With reference to the Study on Marine Vessels Emission Inventory (MVEIS) by HKUST, “Emission estimate methodology for maritime navigation”[1], and International Maritime Organisation Fourth GHG Study 2020 (IMO Study), the marine emission is estimated in activities-based approach. The emission factors were derived in units of work (gram per kilowatt-hour), dependent on fractional load of the equipment during different vessel activity modes. The calculation can be summarised as below:
|
Emission = P × FL × T × EF where P = the installed power of equipment; FL = fractional load of equipment in a specific mode; T = operation time-in-mode; and EF = fractional load emission factor of equipment. |
3.6.2.20 Typical power equipment installed on marine vessels are Main Engine (ME) for propulsion, Auxiliary Engine (AE) for electricity and Auxiliary Boiler (AB) for fuel pre-heating and pumping. Subject to the vessel types, different combinations of engines are equipped on a vessel. Typical engine power rating engine type, fuel type of each vessel type were adopted from MVEIS and IMO Study.
3.6.2.21 Typical engine load factor by vessel type and by operation mode refers to MVEIS and “Emission estimate methodology for maritime navigation”. Engine load factor of the marine source was then determined according to its vessel type and its operation model. The time-in-mode was estimated by the distance and vessel speed travelled in the corresponding mode.
3.6.2.22 The stack height and exit temperature of the vessels are determined from desktop review or site observations. Other stack parameters, including exit velocity and stack diameter, are referenced from recent EIAs for the Widening of Tsuen Wan Road and Route 11 projects, considering the adjacent assessment areas to the Project and the highly similar vessel types. The vessels were modelled as a point source or horizontal point source in AERMOD, as presented in the detailed model configurations in Appendix 3.7.
Existing
Industrial Emission and Major Point Sources within 4 km
3.6.2.23 The locations of industrial emission sources with SP licences and major point sources within 4 km shown in Appendix 3.5. Chimney survey has been conducted on 31 March 2025. No non-SP industrial emission sources were identified within the 500m assessment area. Thus, only these industrial sources with SP licenses would be included in this assessment.
3.6.2.24 There would be insignificant FSP, RSP or NOx emission from two of the industrial emission sources within 500m, namely Shell Tsing Yi Installation and Chevron Hong Kong Limited Tsing Yi Terminal, as indicated in their respective SP licenses. In view of the key air pollutants due to the Project are FSP, RSP and NO2 as identified in Section 3.5.2, the emissions from Shell and Chevron would be excluded from this assessment.
3.6.2.25 The chimney parameters such as stack height, stack temperature, stack exit velocity, stack diameter and the locations for the chimneys would be referring to the respective SP licenses / Air Pollution Control Plans. The emission parameters of the industrial emission sources (except Shell Tsing Yi Installation and Chevron Hong Kong Limited Tsing Yi Terminal) are listed in Appendix 3.5.
3.6.2.26 AERMOD modelling for industrial emissions and major point source within 4 km emissions would be conducted according to requirements in EPD’s Technical Note for Modelling Industrial Emissions.
Cumulative Air Quality Impact
3.6.2.27 The background air pollutant concentration from PATH v3.0 model is added to the sum of the AERMOD model results sequentially on an hour-to-hour basis to derive the short-term and long-term cumulative impacts at the ASRs.
3.6.2.28 The cumulative air pollutant concentrations at the representative ASRs would be compared against the corresponding criteria.
Ozone Limiting
Method for Short-term Cumulative NO2 Assessment
3.6.2.29 For the short-term cumulative NO2 concentrations, ozone limiting method (OLM) is adopted for the conversion of residual NO to NO2. In this method, the conversion of NO from vehicle-related sources (i.e. emissions from open roads, portals, bus and Concerned Facilities) and NOx from industrial and marine sources to NO2 based on the predicted O3 level from PATH v3.0. According to EPD’s Guidelines on Choice of Models and Model Parameters, the initial NO2/NOx ratios would be 0.1 for non-road sources (including marine and industrial emission sources). The NO2/NOx conversion was calculated as follows:
|
[NO2]predicted
= [NO2]vehicular + 0.1 ´ [NOx]marine/chimney
where [NO2]predicted is
the predicted NO2 concentration [NO2]vehicular is
the sum of predicted initial NO2 concentration from open roads, portals, bus and minibus termini, heavy
goods vehicle and coach parking sites [NOx]marine/chimney is the sum of predicted initial NOx concentration
from the marine and industrial emission sources [NO]vehicular is
the sum of predicted initial NO concentration from the Concerned Facilities MIN means
the minimum of the two values within the brackets [O3]PATH is
the representative O3 from rerun PATH concentration (from other
contribution) (46/48) is the molecular weight of NO2 divided by the molecular weight of O3 |
Jenkin Method for Cumulative Assessment for Annual NO2
Concentration
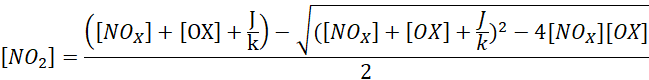
3.6.2.30 With reference to EPD’s Guidelines on Choice of Models and Model Parameters, Jenkin method was adopted for the conversion of cumulative annual average NOX to NO2 by using the empirical relationship in observed annual mean of NOX and NO2 concentrations. The empirical relationship is derived from the annual mean observed data by relevant EPD’s air quality monitoring stations (AQMS) and roadside stations.
|
where [NO2] is the NO2
concentration [NOx] is the NOx
concentration [OX] is the sum of NO2 concentration
and O3 concentration (i.e. [OX] = [NO2] + [O3]) J is the photolysis
rate of NO2 k is the rate
coefficient for reaction between NO and O3 |
3.6.2.31 The above functional form was used to analyse the annual mean data obtained from nearest EPD’s air quality monitoring stations including Kwai Chung general station, Tap Mun general station and roadside station (i.e. Mong Kok roadside station), in order to obtain the empirical relationship. The Kwai Chung general station is the nearest station and therefore chosen as the representative station. Tap Mun general station and roadside station are also included in order to cover a wider range of NOx concentration. Scattered plot for recent 5 years annual means of NO2 versus NOx obtained from relevant air quality monitoring stations would be created for fitting curve at a certain combination of [OX] and J/k values, which should be within the typical value range for Hong Kong. The obtained curve would be adopted for the cumulative annual average NOx to NO2 conversion. The curve should be slightly higher than all the mean data obtained from air quality monitoring stations to avoid underestimation of the cumulative NO2 concentration. Detailed derivations of NOX-to-NO2 conversion equation using Jenkin method are presented in Appendix 3.10.
3.7 Prediction and Evaluation of Environmental Impacts
3.7.1
Construction Phase
Construction Phase Air Quality Impact
3.7.1.1
Among the potential dust emission sources identified in Section 3.5.1, dominant dust emission would be
associated with reclamation works (works above sea level), site formation, site
clearance, excavation, tunnelling, foundation works, handling and stockpiling
of dusty materials and wind erosion of limited exposed area. No dust emission would be expected from
underwater construction works, such as seabed treatment for reclamation. The dust emission arising from the
construction of superstructures is expected to be minor. According to the tentative construction
programme presented in Section 2.10, the construction would be started
in 2027 and be completed by 2033.
3.7.1.2
Suppression measures stipulated in Air Pollution Control
(Construction Dust) Regulation would be implemented as far as practicable
to abate the fugitive dust, and gaseous emission from the construction
sites. Regular watering will be provided
at the excavation and filling works, spoil handing and exposed areas. Stockpile areas should be covered with
impervious sheets, as far as practicable.
Haul roads (if any) should be paved and regularly wetted to suppress the
fugitive dust emission caused by the travelling construction vehicles. Vehicles transporting dusty spoil should be
properly covered with mechanical covers or tarpaulin sheets to avoid any dust
pickup by gust during travel. Wheel
washing facility would also be provided at each exit of construction sites such
that no residue on the body of construction vehicle would cause dust emission
on public roads. With the implementation
of appropriate mitigation measures and good site practices, the fugitive dust and
gaseous emission from the construction works would be reduced to minimum.
3.7.1.3
With reference to Table 2.5, a
potential reclamation at North Lantau has been replaced by pile-supported
Vessels Impact Protection Systems (VIPS), which is superstructure supported by
piles. The reclamation and associated dust emission has been avoided. Dust emission from filling works of the
potential reclamation at the North Lantau area have been avoided. No significant dust impact would be
anticipated from the marine-based piling works and subsequent superstructure
works.
3.7.1.4
Kap Shui Mun Tower Island, Ma Wan South Anchorage
Island, Ma Wan South Tower Island and Tsing Yi Tower Island (total area above
sea level of 9.8 ha) would be formed by small reclamations along the TYLL main
bridge for the construction of the bridge towers and anchorages. Locations of these reclamations of relatively
small scales are presented in Figure 3.2. The reclamation works including seabed
treatment works, the seawall construction and the reclamation filling works
below sea level would be marine based in nature and hence no significant dust
emission would be anticipated. After the
reclamation level reaches above sea level, potential construction dust impact
would be expected for the filling works.
Duration of the dusty works and the distance between works area from
nearest ASRs are listed in below Table 3.11. In view of the small reclamation areas of no
more than 4 ha above sea level for each island, the relatively short dusty
construction works period of no more than 10 months for each small reclamation
area and large separation of over 350m from nearby ASRs, the associated
construction dust impact arising from the reclamation works would be
anticipated minimal. Regular watering on
exposed construction areas, good site practices and mitigation measures as
stipulated in the Air Pollution Control (Construction Dust) Regulation
will be implemented to minimise the potential air quality impact.
Table 3.11 Duration of Dusty Activities for Different Works Area and Corresponding Distance from ASR
Dusty Works
Area
|
Material
Handling Rate, m3/day
|
Expected
Duration of Dusty Construction Activities, months
|
Dusty
Construction Activities
|
Approximate
Distance from Nearest ASR
|
North Lantau Interchange
|
2,500
|
28
|
Site formation
|
40m from A03
|
45
|
Tunnelling works
|
|||
Kap Shui Mun Tower Island
|
3,900
|
3
|
Reclamation
works above sea level
|
510m from A03;
510m from A05
|
Ma Wan South Anchorage Island
|
3,900
|
6
|
Reclamation
works above sea level
|
440m from A08
|
Ma Wan South Tower Island
|
3,900
|
6
|
Reclamation works
above sea level
|
750m from A08
|
Tsing Yi Tower Island
|
1,900
|
10
|
Reclamation
works above sea level
|
90 m from A11 [1];
350m from A10
|
Remarks
[1]
A11 would be resumed under the Project before construction commencement
|
||||
3.7.1.5 For
construction of tunnel and slope works for at-grade roads at North Lantau area,
excavation by blasting would be required.
The locations of blasting areas are presented in Figure 3.3. Blasting would only be conducted once per
day. For tunnel blasting, blast door
would be closed, and ventilation system would be stopped during tunnel blasting
to minimise potential dust emission from blasting activities. Dust filter of at least 80% dust removal
efficiency would be installed at the exhaust of the ventilation system. During open blasting activities, blast
screen, blast cages, roof-over protective cover and
blast mats will be implemented to minimise potential dust emission. The separation distances from the ASRs are
more than 250m from all blasting works area, except ASRs A03 is located only
approximately 40m from the blasting works area for construction of the Lantau
Anchorage. The areas within 30m from
the blasting area will be wetted with water prior to blasting and blasting
shall not be carried out when the strong wind signal or tropical cyclone
warning signal No. 3 or higher is hoisted, according to the Air Pollution
Control (Construction Dust) Regulation.
Where necessary, mist spraying measures will be implemented at the
mucking out locations. Also, sequence of
construction works would be adopted to avoid dusty construction activities to
be carried out simultaneously close to ASRs as far as practicable. With all
these proper designs, best site practices and appropriate mitigation measures
in place, adverse dust impact due to blasting is not anticipated.
3.7.1.6 The spoil from the excavation
works would be transported with dump trucks and barges out of the construction
works sites to disposal outlet. The induced road traffic or marine traffic
would cause vehicle emission and marine emission along the routes. Dump trucks would collect spoils from the
construction works sites and transport via transportation routes as stated in Section
6 and summarised in Table 3.8.
A maximum of 207 dump trucks per day would be expected for transporting
inert and non-inert C&D materials, general refuse and floating refuse
generated by the Project, and a maximum of 1 truck trips per day for
transporting chemical waste during construction phase. The routings for trucks have been optimised
to maximise the distance from nearby ASRs, the use of local roads have been
avoided as far as practicable and the truck traffic should avoid peak hours as
far as practicable. Dump truck is
equipped with water-tight container and mechanical cover, which would not cause
fugitive dust emission on the open road. Spoils on the deck of the barges
should be covered by tarpaulin to avoid dust emission. The engine of the barge
should be switched off during berthing as far as practicable. With the
implementation of these mitigation measures, it is anticipated that no adverse
air quality impact would be caused by the transportation of spoils along the
routes. During detailed design and
construction phases, review on contemporary issues shall be conducted to
optimise the construction methodology and the minimisation of construction
vehicle trips.
3.7.1.7
Dredged and fill materials and other construction materials would be
transported between the barging points and the reclamation site via
construction vessels and trucks. A
maximum of 4 vessel trips per day would be expected to transport dredged
materials (e.g. sediment), and inert and non-inert C&D materials, during
reclamation works and site formation works.
These construction vessels would operate using fuel that fulfill the requirements in Air Pollution Control (Fuel
for Vessels) Regulation and Air Pollution Control (Marine Light Diesel)
Regulation. The vessel engines would
be switched off during hotelling. The
navigation route of the construction vessels would be designed to be farthest
away from the ASRs. Therefore, the
associated marine emission would be minimised.
As mentioned in Section 3.5.1.7, a maximum of 208 trucks per day
would be required to transport materials to / from the construction site during
construction of the Project. With the
implementation of these design or mitigation measures detailed in Section 3.7.1.6, it is anticipated that no
adverse air quality impact would be caused by the transportation of spoils
along the routes.
3.7.1.8 Two barging points located at
Tsing Yi west and northeast Lantau would be provided for loading and unloading
of dredged and fill materials to/from the barges. The tipping hall of the barging points would
be enclosed by 3-side screen with top and provision of water spraying and
flexible dust curtains to minimise potential dust emission from the operation
of the barging points. The barging point
at Tsing Yi and the associated marine navigation route would be located over
200m from the nearest ASR A9, while the barging point at northeast Lantau and
the associated marine navigation route would be located over 70m from the
nearest ASR A2. With the large
separation distance and implementation of these mitigation measures at the
tipping hall, it is anticipated that no adverse air quality impact would be
caused by the operation of the barging point during construction of the
Project.
3.7.1.9
Some existing ASRs located within the Project boundary would be
retained, including Lantau Toll Plaza Administration Building (ASR A01) and
Tsing Yi Administration Building (ASR A10), while the Administration Building
of Hongkong United Dockyards Limited (ASR A11) would be removed due to land
resumption. Dusty activities should be
located away from these nearby ASRs as far as practicable to minimise the
potential dust impact. In addition to
regular watering, hoarding of not less than 3.5m high should be provided to
shield off ASRs from these dusty works.
Dust monitoring at these locations shall be considered to ensure no
adverse air quality impact during the construction phase.
3.7.1.10 Air quality impact may arise from a potential CBP to be erected within the Project area, subject to the contractor design. The tentative location of the CBP would be located in North Lantau area near the tentative barging point at a distance of about 70m from the nearest ASR at A02, as shown in Figure 3.1. The CBP would have the capacity of not more than 10,000 tonnes and its associated air quality impact would be addressed in Air Pollution Control Plan (APCP) supporting the application of SP License for the CBP under APCO. The proposed CBP shall be operating in accordance with the BPM 3/2 (2025) to prevent any noxious or offensive emissions. PME in the CBP will be powered by electricity, thereby there are no air emissions from fuel combustion. Given the proper implementation of dust suppression measures, such as installation of dust filter, watering and measures in the BPM 3/2 (2025), and dust monitoring programme to be conducted, no adverse dust impact would be anticipated from the operation of the CBP on nearby ASRs.
3.7.1.11
Referring to Section 3.5.1, potential odour impact would be expected
due to dredged materials. During the
dredging process, the dredged materials would be properly covered on
barges. Loading of dredged materials
would be controlled to avoid splashing.
Transportation barges would be equipped with tight fitting seals to
ensure dredged materials are well confined, such that the potential odour
impact would be minimised.
Cumulative Impacts from Concurrent Projects
3.7.1.12
The construction
works of the HKIW-NEL Link, the Road P1 (Tai Ho – Sunny Bay Section) and the
Route 11 would be expected to be concurrent with the Project. The associated construction works programme
is presented in Section
2. It is anticipated that
appropriate mitigation measures stipulated in Air Pollution Control
(Construction Dust) Regulation, such as regularly watering
and paved haul road, and good site practice
would also be implemented by the contractors of all these projects, resulting
in minimum fugitive dust and gaseous emissions from their construction
activities. The applicant/contractor shall closely liaise with relevant parties
of the concurrent projects to avoid any heavy dusty activities to be conducted
at the same time. A comprehensive
EM&A programme with RSP and FSP real-time monitoring would be conducted to
ensure the proper implementation of mitigation measures, to be detailed in Section
3.8.1, and the compliance of AQOs during the
construction of the TYLL in the area.
3.7.1.13
With reference to Appendix 2.1,
there are no concrete implementation programme nor
approved rezoning proposal / planning application for the concurrent projects MWSD and the HUD
development at the time of this EIA study. Being housing developments, it is expected that the
construction of these concurrent projects would involve site formation works,
infrastructure works and building construction (sub-structure and
superstructure construction). The major
construction phase air quality impact would be expected due to the associated
excavation activities and air emissions due to the use of NRMMs, which could be
alleviated with mitigation measures in below Section 3.8.1.1 to Section 3.8.1.4.
No adverse construction phase air quality impact due to these concurrent
projects would be expected, with proper implementation of mitigation
measures. Cumulative impacts from and on
these concurrent projects during the construction phase will be assessed in
separate studies conducted by their respective project proponents when detailed
design information and implementation programme become available.
3.7.1.14
With reference to Appendix 2.1,
there is no concrete implementation programme nor
approved rezoning proposal / planning application for the concurrent project Sunny Bay Development at the time of this EIA study.
Being a reclamation and infrastructure project, it is expected that the construction of
these concurrent projects would involve reclamation works and infrastructure
works. The major construction phase air
quality impact would be expected due to the associated filling activities,
excavation activities and barging activities, as well as air emissions due to
the use of NRMMs and marine vessels, which could be alleviated with mitigation
measures in below Section 3.8.1.1 to Section 3.8.1.4 and Section 3.8.1.9 to Section 3.8.1.10.
No adverse construction phase air quality impact due to the concurrent
project would be expected, with proper implementation of mitigation
measures. Cumulative impacts from and on
the concurrent project during the construction phase will be assessed in
separate studies conducted by the proponent of the concurrent project when
detailed design information and implementation programme become available.
3.7.1.15
With reference to Appendix 2.1,
there is no concrete implementation programme nor
approved rezoning proposal / planning application for the concurrent project Underground Quarrying
Contract at Tsing Yi North at the time of this EIA
study. Being an underground quarry
project, it is
expected that the construction of the concurrent project would involve site
formation and excavation works. The
major construction phase air quality impact would be expected due to the
associated excavation and material handling activities, as well as air emissions
due to the use of NRMMs, which could be alleviated with mitigation measures in
below Section 3.8.1.1 to Section 3.8.1.4.
No adverse construction phase air quality impact due to the concurrent
project would be expected, with proper implementation of mitigation
measures. Cumulative impacts from and on
the concurrent projects during the construction phase will be assessed in
separate studies conducted by the proponent of the concurrent project when
detailed design information and implementation programme become available.
3.7.1.16
The potential cumulative construction phase air quality impact would
also be recorded during the environmental monitoring and audit as detailed in
below Section 3.10.1 for checking compliance with
legislative requirements.
3.7.2 Operational phase
3.7.2.1 The cumulative air quality impact due to all identified emission sources within 500m assessment area and background concentration at representative ASRs in Year 2033 and 2041 have been evaluated. The predicted cumulative RSP and FSP concentrations at the representative ASRs in the worst-case Year of 2033 and cumulative NO2 concentrations at representative ASRs in the worst-case Year of 2041 are summarised in Table 3.12 and Table 3.13, respectively. The predictions showed that daily and annual averages of RSP and FSP, and hourly, daily and annual averages of NO2 at representative ASRs would comply with the prevailing AQOs. No adverse cumulative air quality impact would be anticipated from the Project. The detailed predictions with breakdown of contribution by sources for RSP and FSP in Year 2033, and for NO2 in Year 2041 are presented in Appendix 3.9, respectively.
3.7.2.2
According to the discrete results, the worst affected levels would be 5 mAG (metres above ground) for 10th
highest daily average RSP, 1.5 mAG for annual average
RSP, 5 mAG for 19th highest daily average
FSP, 1.5mAG for annual average FSP, 1.5mAG for 19th highest hourly
NO2, 1.5mAG for 10th highest daily NO2 and
1.5mAG for annual average NO2 concentrations, respectively.
In addition, for 10th highest daily average RSP and 19th highest
daily average FSP concentrations, the worst affected levels for most of the ASRs would be at 1.5 mAG. The contour plots of the abovementioned
levels are illustrated in Figure 3.4 – Figure 3.10.
No air sensitive uses is
located within the predicted exceedance zones as shown in the contour plots in Figure 3.4 – 3.10. No adverse air quality impact would be
anticipated from the Project.
Cumulative Impacts from Concurrent Projects