Modelling
Scenarios for Victoria Harbour under Normal Plant Operation
5.6.2.28 It should be highlighted that the existing STSTW already has a design flow capacity of 340,000m3 per day and this existing design capacity as well as the existing effluent design standard of STSTW will be retained for the CSTW. In other words, this Project will not induce any change to the flow and loading of THEES to the Victoria Harbour. The current flow of existing TPSTW is less than the full design capacity of 120,000 m3 per day but this full design capacity of 120,000 m3 per day was adopted for modelling to provide conservative assessment and there is currently no plan to further upgrade the flow capacity of TPSTW. The existing design capacity of STSTW of 340,000 m3 per day has been reviewed with reference to the latest population forecast (i.e. Enhanced 2011-based TPEDM) to remain valid and be able cater for sewage flow generated from the future development in Year 2041. The flow and load of THEES would be the same with and without this CSTW project. Thus, this water quality modelling exercise does not aim to assess the water quality change in Victoria Harbour induced by the Project but to update the potential cumulative water quality impact in the KTD waters and the adjacent Victoria Harbour with reference to the recent KTD water quality improvement measures proposed under Agreement CE30/2008 (CE), which was not considered during the EIA stage of the STSTW Stage III Extension project.
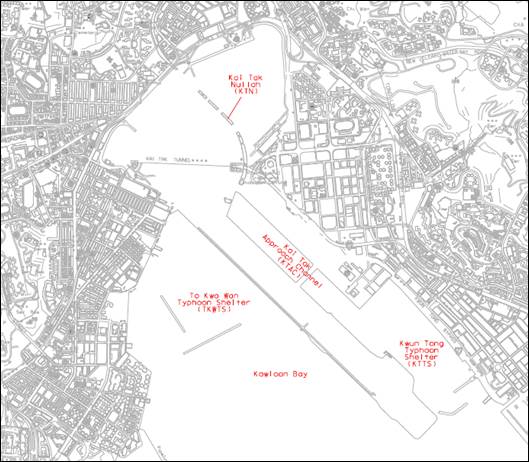
5.6.2.29 Based on the findings of the approved EIAs for “STSTW Stage III Extension”, “TPSTW Stage V” and “KTD” as well as the recent KTD study under Agreement No. CE30/2008 (CE), the water quality effect of the THEES effluent (under the design flow capacity of “TPSTW Stage V” and “STSTW Stage III Extension”, with or without considering the recent KTD water quality improvement measure) would be confined within the water bodies at or near the KTD areas (as shown in Diagram 5.02). Thus, the possible changes of implementation programme or layout of other planned projects such as TKO-LTT, PRS at Southwest Tsing Yi, 3RS, etc. (as listed in Table 5.10) would not have any significant implications on the conclusion of this water quality modelling exercise as these concurrent projects are far (over 10km) away from the THEES discharge point. The key concern of this modelling exercise would be changes in the cumulative impacts induced by the KTD project which is in close vicinity of the THEES discharge point.
Diagram 5.01 Water
Bodies Potentially Affected by the THEES Effluent
5.6.2.30 It should be noted that the extension or upgrading of treatment design capacity recently implemented for the existing STSTW and TPSTW (assessed under the EIAs for “STSTW Stage III Extension” and “TPSTW Stage V”) did not consider the water quality improvement measure proposed for the KTD project under Agreement No. CE30/2008 (CE) (i.e. the recommended IP scheme and the alternative 150m wide runway opening scheme as mentioned in Section 5.6.2.16). It is thus proposed to adopt the “do-nothing” condition of the KTD waters as a baseline scenario for this modelling exercise. This “do-nothing” scenario, namely Scenario 1, does not include the effect of the alternative IP / runway opening schemes considered for the KTD project. Scenario 1 would serve as a yardstick to measure the potential changes in the cumulative water quality impact as a result of the latest KTD measure.
5.6.2.31 It was assumed under this modelling exercise that the TPSTW and CSTW would reach their full design capacities in UDS. UDS was selected as the assessment time horizon for identification of the changes induced by the recent KTD project. The interim years before UDS would represent a less critical case with a lower degree of cumulative impacts as the effluent flow of TPSTW and CSTW would be smaller during the interim years. Any water quality change induced by the effluent flow builds up between the interim years and the ultimate stage would not be caused by this relocation project and therefore should not be the focus of this EIA Study. Thus, additional scenario to represent the existing or interim flow condition of the TPSTW and CSTW was considered unnecessary for the purpose of this modelling exercise.
Scenario 1 - UDS Baseline without KTD Mitigation Measures, Normal
THEES Operation with or without this Project (Do Nothing for KTD Waters)
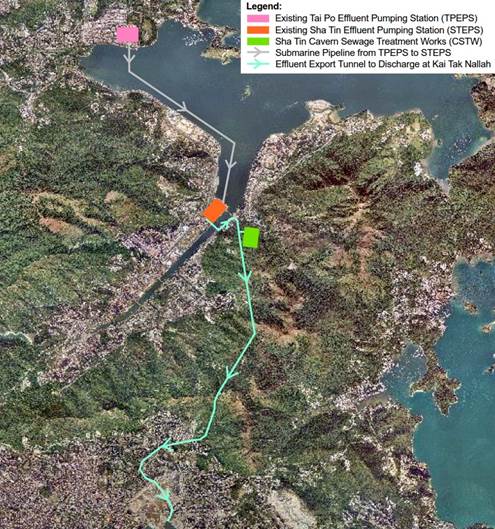
5.6.2.32 Scenario 1 represents the baseline condition under normal operation of the TPSTW, CSTW and THEES in UDS, which serves as a yardstick to measure the potential water quality changes caused by the latest KTD proposal. An average dry weather flow of 120,000m3 per day and 340,000m3 per day for TPSTW and CSTW, respectively, was assumed for modelling. This scenario represents the situation when all the treated effluent from TPSTW and CSTW is discharged into Victoria Harbour via KTN, as illustrated in Diagram 5.02 below. The effluent design standards were employed together with the hourly dry weather diurnal flow to derive the hourly pollution loadings as model inputs.
5.6.2.33 This scenario represents the “do-nothing” situation for the KTD waters without considering the effect of the alternative IP / runway opening schemes considered under Agreement No. CE30/2008 (CE). The background storm pollution loading data for the KTD waters derived from the Year 2013/14 storm pollution loading survey available from Agreement No. CE30/2008 (CE) (refer to Section 5.6.2.19) were adopted under Scenario 1 for conservative assessment. It is believed that the Government will continuously rectify storm pollution and thus the future background storm loading under the UDS would not be worse than the existing condition.
5.6.2.34 Since the same design capacity and effluent standards of the existing STSTW will be retained for the CSTW. The scenarios with and without this Project would be the same. Thus, extra scenario to simulate the water quality under the condition without this Project is not required.
Diagram
5.02 Generalized
THEES Effluent Flow to Victoria Harbour Considered Under Scenarios 1, 2a, 2b, 3a and
Scenarios 2a and 2b - UDS Cumulative Impact with KTD Mitigation
Measures, Normal THEES Operation with or without this Project (Design Effluent
Quality for THEES)
Scenario 2a – Interception and Pumping (IP) Scheme
5.6.2.35 Scenario 2a aims to assess the cumulative water quality impact caused by the new IP Scheme being planned for the KTD under Agreement No. CE30/2008 (CE). This IP Scheme would involve pumping some water from both KTN and KTAC for discharge into the more open water in Kowloon Bay. Under this scenario, there will be one intake point at KTN and another intake point at the northern part of KTAC. The water pumped from KTN and KTAC will be eventually combined and discharged into the Kowloon Bay through the same outfall. The discharge point is located near the middle of the former airport runway with better flushing capacity. The locations of the proposed intakes and outfall of the IP Scheme are shown in Diagram 5.03 below. Same as Scenario 1, the effluent design standards will be employed to derive the Project pollution loadings as model inputs for this scenario. The THEES effluent load under Scenario 2a is same as that adopted for Scenario 1, which was estimated using the design effluent standards. The generalized THEES effluent discharge arrangement for Scenario 2a is indicatively shown in Diagram 5.02 above.
Diagram
5.03 Proposed
Intake and Discharge Points of IP System

5.6.2.36 As shown in Diagram 5.03, the IP system consists of two intake points (Intakes 1 and 2 respectively) and one discharge point (Discharge 1) at middle of ex-runway. Two water pumping options, namely Co-used with the Kai Tak DCS and Not Co-used with the Ka Tak DCS respectively, have been considered under Agreement No. CE30/2008 (CE). For the Co-used Option, for Intake 1, a new pumping station will be set up solely for pumping water to Discharge 1. For Intake 2, co-use with DCS is possible by modifying the original intake point of the DCS South Plant to Intake 2, and hence the flow rates will be the monthly rates of the South Plant. For the Not Co-used Option, the arrangement is the same as the Co-used Option except that intake 2 will also cater for the flow for the DCS North Plant. Hence the flow rates at intake 2 will be the combined monthly rates of the South Plant and the North Plant.
5.6.2.37 The monthly flow rates of the Co-used and Not Co-used Options are summarized in Table 5.15 below. From the table, it is shown that the Co-used Option will involve a lower pumping rate and thus generate a smaller water circulation in the KTAC and KTTS, and since the main purpose of the KTD improvement proposal is to enhance the water quality of KTAC and KTTS, the Co-used Option is considered a worse case in terms of the water quality impact at KTAC and KTTS (where THEES effluent is discharged). Therefore, the Co-used Option was adopted in Scenario 2a for conservative assessment. In case the Not Co-used Option is selected as the final scheme, the associated water quality impact would not be worse than that resulted from the Co-used Option as assumed in Scenario 2a. The flow rates of the IP system presented in this EIA are based on the best available information obtained during the course of this modelling exercise. It was however found after completion of this modelling exercise that the flow rate of Intake 1 has been revised from 4.88 m3/s to 4 m3/s under the KTD study. Nevertheless, it was also found under the separate KTD study that the pumping rate of 4 m3/s at Intake 1 could achieve similar water quality improvement performance as a pumping rate of 4.88 m3/s. Furthermore, according to the KTD study, the pollution loading in both wet and dry weather conditions would be reduced significantly following the rectification of expedient connections and upgrading of existing Dry Weather Flow Interceptors currently being planned in the catchment areas. Therefore, it is believed that the pumping rate of 4 m3/s at Intake 1 would be sufficient to achieve the water quality improvement at KTAC and KTTS as predicted in this modelling exercise.
Table 5.15 Monthly Flow Rates of the Co-used and Not Co-used Options
|
|
Flow of South Plant of DCS |
Flow of North Plant of DCS |
Co-used Option |
Not Co-used Option (Scenario 2) |
||||||||
|
|
Flow at Intakes |
Flow at Outfall |
Flow at Intakes |
Flow at Outfall |
||||||||
|
|
Intake 1 |
Intake 2 |
Discharge 1 from new pumping station |
Discharge 1 from DCS |
Intake 1 |
Intake 2 |
Discharge 1 from new pumping station |
Discharge 1 from DCS |
||||
|
Month |
(m3/d) |
(m3/s) |
(m3/d) |
(m3/s) |
(m3/s) |
(m3/s) |
(m3/s) |
(m3/s) |
(m3/s) |
(m3/s) |
(m3/s) |
(m3/s) |
|
Jan |
85,000 |
0.98 |
80,000 |
0.93 |
4.88 |
0.98 |
4.88 |
0.98 |
4.88 |
1.91 |
4.88 |
1.91 |
|
Feb |
93,000 |
1.08 |
88,000 |
1.02 |
4.88 |
1.08 |
4.88 |
1.08 |
4.88 |
2.09 |
4.88 |
2.09 |
|
Mar |
109,000 |
1.26 |
115,000 |
1.33 |
4.88 |
1.26 |
4.88 |
1.26 |
4.88 |
2.59 |
4.88 |
2.59 |
|
Apr |
146,000 |
1.69 |
161,000 |
1.86 |
4.88 |
1.69 |
4.88 |
1.69 |
4.88 |
3.55 |
4.88 |
3.55 |
|
May |
182,000 |
2.11 |
212,000 |
2.45 |
4.88 |
2.11 |
4.88 |
2.11 |
4.88 |
4.56 |
4.88 |
4.56 |
|
Jun |
213,000 |
2.47 |
253,000 |
2.93 |
4.88 |
2.47 |
4.88 |
2.47 |
4.88 |
5.39 |
4.88 |
5.39 |
|
Jul |
230,000 |
2.66 |
266,000 |
3.08 |
4.88 |
2.66 |
4.88 |
2.66 |
4.88 |
5.74 |
4.88 |
5.74 |
|
Aug |
227,000 |
2.63 |
266,000 |
3.08 |
4.88 |
2.63 |
4.88 |
2.63 |
4.88 |
5.71 |
4.88 |
5.71 |
|
Sep |
212,000 |
2.45 |
247,000 |
2.86 |
4.88 |
2.45 |
4.88 |
2.45 |
4.88 |
5.31 |
4.88 |
5.31 |
|
Oct |
170,000 |
1.97 |
193,000 |
2.23 |
4.88 |
1.97 |
4.88 |
1.97 |
4.88 |
4.20 |
4.88 |
4.20 |
|
Nov |
134,000 |
1.55 |
144,000 |
1.67 |
4.88 |
1.55 |
4.88 |
1.55 |
4.88 |
3.22 |
4.88 |
3.22 |
|
Dec |
99,000 |
1.15 |
97,000 |
1.12 |
4.88 |
1.15 |
4.88 |
1.15 |
4.88 |
2.27 |
4.88 |
2.27 |
5.6.2.38 The proposed IP Scheme would utilize the water abstracted from KTN and KTAC in the DCS before discharges into the Kowloon Bay with potential thermal impact. However, as temperature change is not a potential concern for this Project, details of the possible integration of this IP Scheme with the DCS are considered irrelevant and therefore not presented in this EIA Report. However, the Intake Points 1 and 2 as shown in Diagram 5.03 are considered as WSRs (or cooling water intakes) under this modelling scenario for conservative assessment.
5.6.2.39 The monthly flow rates of the proposed IP scheme adopted under Scenario 2a are summarized in Table 5.16 below. The discharge flow rate at the outfall will be equal to the sum of the flow abstraction rates at Intake 1 and Intake 2 and are therefore not presented in the table.
Table
5.16 Monthly
Flow Rates of the Proposed IP Scheme Under Co-used Option for Model Input
|
Intake 1 |
Intake 2 |
|
|
January |
4.88 |
0.98 |
|
February |
4.88 |
1.08 |
|
March |
4.88 |
1.26 |
|
April |
4.88 |
1.69 |
|
May |
4.88 |
2.11 |
|
June |
4.88 |
2.47 |
|
July |
4.88 |
2.66 |
|
August |
4.88 |
2.63 |
|
September |
4.88 |
2.45 |
|
October |
4.88 |
1.97 |
|
November |
4.88 |
1.55 |
|
December |
4.88 |
1.15 |
5.6.2.40 Due to the recent background storm pollution reduction as a result of the hinterland improvement measures implemented in the KTD areas after approval of the EIA Report for KTD, the need of a wide (600m) opening at the former airport runway to enhance the water quality at KTAC as proposed under the approved EIA would not be required. The 600m runway opening proposal will be superseded by this IP Scheme recently proposed under Agreement No. CE30/2008 (CE) and therefore will not be further considered in this modelling exercise. Furthermore, opening a wide (600m) gap at the former airport runway is considered a more conservative improvement measure and would result a greater water quality improvement and flushing at the KTAC as compared to the IP Scheme considered in Scenario 2a and therefore will be a less critical case for cumulative water quality impacts at or near the THEES discharge point. The IP Scheme is considered a worst case for cumulative water quality impact at KTAC (as compared to the 600m runway opening proposal).
Scenario 2b – 150m
Runway Opening Option
5.6.2.41 Besides the proposed IP scheme, an alternative option of introducing a small (150m) opening at the northern section of the former airport runway has also been considered under Agreement No. CE30/2008 (CE). This 150m opening scenario would induce natural tidal flushing to the KTAC to improve the water quality without considering any water pumping system and is simulated under Scenario 2b of this modelling exercise as a reference scenario. The loading assumptions for THEES and background storm water discharges adopted for Scenario 2a and Scenario 2b are the same. The model grid layout adopted under Scenario 2a and Scenario 2b without and with the 150m opening respectively is shown Appendix 5.03. The THEES effluent flow and load under Scenario 2b are same as that adopted for Scenarios 1 and 2a. The THEES effluent discharge arrangement for Scenario 2b is also same as that under Scenarios 1 and 2a as indicatively shown in Diagram 5.02 above.
5.6.2.42 Scenarios 3a and 3b are basically same as Scenarios 2a and 2b respectively except that a more realistic worst case of THEES loading was adopted. The THEES effluent discharge arrangement for Scenarios 3a and 3b is however same as that under Scenarios 1, 2a and 2b as indicatively shown in Diagram 5.02 above.
5.6.2.43 Review of the actual effluent measurements (between January 2007 and October 2014) for the STSTW and TPSTW revealed that the actual effluent quality for these 2 STWs has been maintained at a level better than design effluent standards. The treatment level of the future CSTW will follow that of the existing STSTW. As far as the effect of THEES on the water quality impact assessment under this EIA Study is concerned (Remark: This modelling exercise aimed only to assess the changes of cumulative impacts induced by the KTD project and not to assess the water quality change induced by the CSTW), it was not unreasonable to take the THEES loading for the 5 key parameters (including BOD, TSS, TKN, NH3-N and Total N) based on the 95th percentile value from actual measurements. The 95th percentile values adopted under Scenarios 3a and 3b for these 5 parameters are the maximum of all the running yearly 95th percentile values over the period from January 2007 to October 2014, which is a conservative value. The measured mean values are much smaller than these measured 95th percentile value. Use of the measured 95th percentile value for modelling would provide a reasonable worst case for cumulative impact assessment.
Modelling Scenarios for Tolo
Harbour
Scenario 4 - UDS “Without Project” Condition of Tolo Harbour -
Overflow at Both TPSTW and Existing STSTW
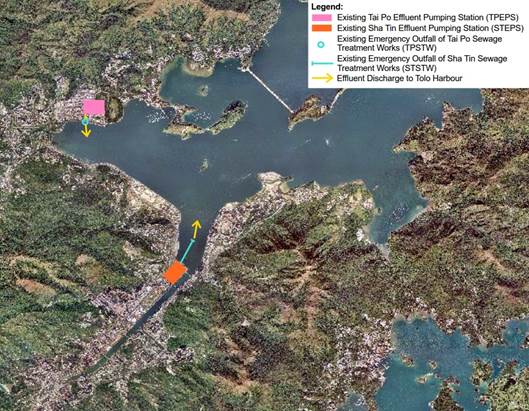
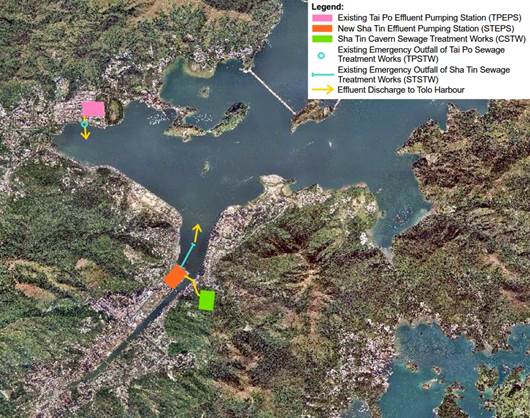
5.6.2.44 Scenario 4 represents the “without Project” condition of Tolo Harbour where secondarily treated and disinfected effluent from TPSTW and existing STSTW would be partially discharged into the harbour due to the capacity constraints of TPEPS and STEPS as discussed in Section 5.5.2.7. The other discharges in Tolo Harbour under this scenario would be the background storm water discharges from various river outlets. The UDS was selected as the time horizon for estimation of the pollution loading of the partial overflow from TPSTW and STSTW as well as the background storm pollution loads.
5.6.2.45 The model assumptions of this “without Project” scenario (including the quantity and duration of treated effluent overflow to Tolo Harbour from normal operation of TPSTW and STSTW) followed that adopted in “Scenario 5b” of the EIA for “TPSTW Stage V”, which assumed that no further upgrading of TPEPS and STEPS would be undertaken in the future and hence the largest amount of overflow would occur for worst case assessment.
5.6.2.46 The overflow discharges are caused by the capacity constraint of the TPEPS and STEPS. The amount of overflow discharges into the sea would therefore depend on the design capacities of TPSTW, STSTW, TPEPS and STEPS. Since the design capacities of the two STW and the two pumping stations under the “without Project” scenario would remain unchanged as compared to the past EIA assumption, it is considered reasonable to adopt the same quantity and duration of overflow estimated under the “TPSTW Stage V” EIA.
5.6.2.47 Normally, the TPEPS would pump the effluent from the TPSTW via a rising main and a submarine pipeline to the STEPS. The STEPS would receive the effluent from both TPSTW and STSTW for combined discharge to the KTN as illustrated in Diagram 5.02 above. Under the “without Project” scenario, it is assumed that effluent from TPSTW would occasionally exceed the existing capacity of the TPEPS and hence part of the secondarily treated and disinfected effluent would then be discharged via the existing emergency bypass outfall near TPSTW. On the other hand, combined flow from TPSTW and STSTW would also occasionally exceed the capacity of STEPS and part of the flow would then be discharged via the existing emergency outfall of STSTW. The indicative discharge locations of effluent overflow from TPEPS and STEPS considered under Scenario 4 are shown in Diagram 5.04 below. The daily flow and pollution load overflowed into Tolo Harbour would vary seasonally due to the seasonal change in storm water flow. It is also assumed that the overflow would occur only occasionally within a day and would be discharged intermittently. The pollution levels in the storm water would be the same as those in the effluent and no dilution of the treated effluent is assumed as conservative approach. The annual volumes of overflow assumed for modelling as adopted in the “TPSTW Stage V” are listed in the Table 5.17 below.
Table
5.17 Annual
Volumes of Secondarily Treated and Disinfected Effluent Overflow to Tolo
Harbour under “Without Project” Scenario
|
Discharge Location |
Total Volume of Secondarily Treated and Disinfected Effluent
Overflow discharged in a year (m3/year) |
|
Existing
Emergency Bypass of TPSTW |
9,832,240 |
|
Existing
Emergency Bypass of STSTW |
4,656,300 |
|
Total |
14,488,540 |
Diagram 5.04 Generalized
Effluent Flow to Tolo Harbour Considered Under Scenario 4
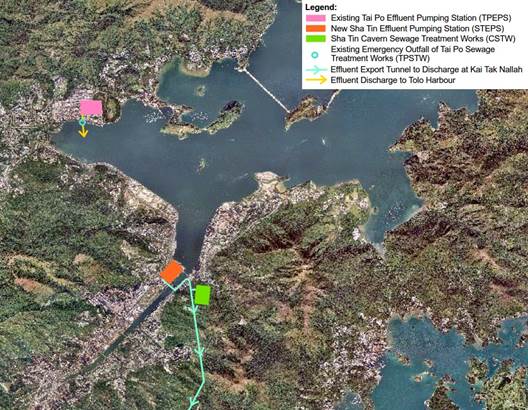
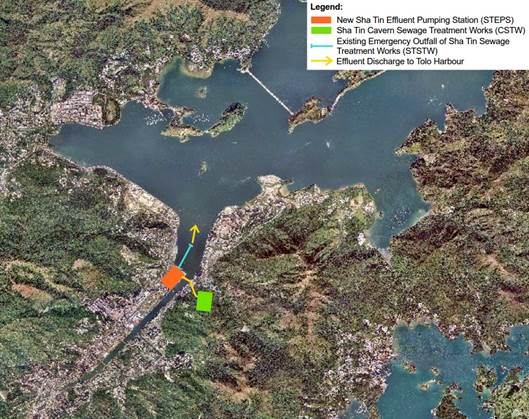
5.6.2.48 Scenario 5 represents the “with Project” condition of Tolo Harbour under the UDS. The existing STEPS receives the effluent from both TPSTW and STSTW for combined discharge to Kai Tak Nullah. The combined effluent flow from TPSTW and STSTW currently exceeds the existing capacity of the STEPS during storm events. Under the “with Project” scenario, as a separate gravity sewer bypassing the STEPS is proposed for connection of the treated effluent from the CSTW directly to the Effluent Export Tunnel of the THEES. Moreover, a new pumping station will be constructed to replace the STEPS for receiving solely the effluent flow from TPEPS and the design of this new pumping station will take full account of the design flow of the TPEPS to avoid effluent overflow in the future. Hence, no overflow discharge at STEPS was assumed in this “with Project” scenario. The overflow quantity at TPEPS would however remain unchanged (i.e. same as that adopted in Scenario 4 under the “without Project” condition) for conservative assessment. There is currently no plan to upgrade the flow capacity of the TPEPS. The reduced volume of overflow assumed in this “with Project” scenario is listed in the Table 5.18 below. The location of effluent overflow from TPEPS considered under Scenario 5 is indicatively shown in Diagram 5.05 below. No effluent overflow from STEPS is assumed under Scenario 5.
Table 5.18 Annual
Volume of Secondarily Treated and Disinfected Effluent Overflow to Tolo Harbour
under “With Project” Scenario
|
Discharge Location |
Total Volume of Secondarily Treated and Disinfected Effluent Overflow discharged in a year (m3/year) |
|
Existing Emergency Bypass of TPSTW |
9,832,240 |
|
Existing Emergency Bypass of STSTW |
0 |
|
Total |
9,832,240 |
Diagram 5.05 Generalized
Effluent Flow to Tolo Harbour Considered Under Scenario 5
Scenarios 6a and 6b – UDS THEES Maintenance Discharges
Scenario 6a - UDS THEES Maintenance
following Existing Practice
5.6.2.49 Maintenance of the THEES tunnel may be required under the existing practice to ensure proper functioning and integrity of the tunnel. During the inspection or maintenance of the THEES tunnel, temporary suspension of the normal THEES operation with effluent bypass into the Tolo Harbour is unavoidable to provide a safe and dry zone within the THEES tunnel for the necessary inspection / maintenance works. Thus, the necessity of effluent bypass to Tolo Harbour during the THEES maintenance is not induced by this Project. Under the existing practice, regular inspection and maintenance of the THEES tunnel would be conducted when necessary, with duration of no more than 4 weeks each time based on past records. Hence, Scenario 6a assumed a 4-week THEES maintenance period following the existing practice under the UDS. On the other hand, according to the existing EP for “TPSTW Stage V” (No. EP-265/2007/A), the THEES maintenance discharge shall be arranged to avoid the period from April to June. The period from April to June was identified in the approved EIA for “TPSTW Stage V” (completed in 2003) as the peak algae blooming season. Hence, it is assumed under Scenario 6a that the 4-week THEES maintenance would occur in March (outside the period from April to June) in accordance with the existing EP requirement. As confirmed by DSD, secondarily treated and disinfected sewage effluent from TPSTW and STSTW would be discharged into Tolo Harbour via the existing emergency outfalls of TPSTW and STSTW respectively during the THEES maintenance period, as illustrated in Diagram 5.06 below.
5.6.2.50 The UDS was selected as the assessment year horizon to study the potential water quality impacts arising from the THEES maintenance discharge. The maximum design capacities of TPSTW and CSTW were adopted to estimate the loading of THEES maintenance discharge under the UDS. The loading conditions not during the maintenance discharge are assumed to be the same as those adopted for Scenario 5. Scenario 5 represents the condition under normal THEES operation with this Project. Discharges incorporated in Scenario 5 include the partial overflow of secondarily treated and disinfected effluent flow from TPSTW (Remark: the partial overflow from STSTW as assumed under Scenario 4 would be removed under Scenario 5) as discussed in Section 5.6.2.48. Other discharges included in Scenario 5 cover the background storm pollution loading from river outlets estimated for the UDS as described in Sections 5.6.2.20 to 5.6.2.23 above. The background storm pollution loading from river outlets adopted under Scenario 5 is same as that under Scenario 4. The locations of the emergency outfalls of TPSTW and CSTW with reference to the identified WSRs are shown in Figure No. 60334056/EIA/5.03.
Diagram 5.06 Generalized
Effluent Flow to Tolo Harbour Considered Under Scenarios 6a and 6b
Scenario 6b - UDS THEES Maintenance outside Algae Blooming
Season
5.6.2.51 This Project only involves relocation of the existing STSTW into caverns without changing the flow and load of the STSTW. No change to the pollution loading and discharge points of the THEES maintenance will be induced by this Project. As mentioned above, under the existing practice, the THEES maintenance discharge is only restricted in the period from April to June, which was identified in the past approved EIA for “TPSTW Stage V” as the peak algae blooming season. However, as the EIA for “TPSTW Stage V” was completed over 10 years ago, the information collected during this past EIA is outdated. Based on the updated information provided by Agriculture, Fisheries and Conservation Department (AFCD) under this EIA, the months with higher red tide occurrence would actually occur in January to May. Hence, it is recommended under this Project that any future THEES maintenance event should be carefully planned and scheduled outside the updated algae blooming season (i.e. January to May). Scenario 6b is thus basically same as Scenario 6a except that the 4-week THEES maintenance period is assumed to occur around June and July outside the actual algae blooming season.
Scenario 7 – UDS Emergency Sewage Discharge from STSTW / CSTW
5.6.2.52 Currently, emergency discharge of primarily treated / settled effluent from the existing STSTW may be allowed via the existing submarine outfall of STSTW in case of power / plant failure. However, based on the past record, emergency sewage discharge to the Tolo Harbour from the existing STSTW had never happened before. This Project only involves relocation of the existing STSTW to caverns without changing the flow and load of the existing STSTW. Following the same arrangement of the existing STSTW, backup / standby facilities will be provided for the future CSTW to minimize the chance of emergency discharge. Thus, this Project will not change the flow, load and chance of any possible emergency discharge (as compared to the existing situation).
5.6.2.53 Scenario 7 thus represents an extremely remote event of emergency discharge from the CSTW. For the purpose of illustrating the possible water quality effect under this emergency situation, it is assumed under Scenario 7 that the emergency discharge would occur for a period of 6 hours with a total discharge volume of 85,000 m3. Since emergency discharge had never occurred at the existing STSTW, reference was made to the past record from existing TPSTW (with similar treatment processes). Based on the past record from TPSTW, emergency sewage discharge had occurred only once since 1995 due to CLP power supply failure to TPSTW Stage IV inlet works. The duration of the emergency discharge from TPSTW was less than 3 hours with a total discharge volume of less than 9,000 m3. Thus, this scenario of assuming a total discharge volume of 85,000 m3 over a 6-hour period would be a very adverse situation. This emergency discharge scenario was simulated for both dry and wet seasons. Under each season, four separate model runs were conducted to simulate the impacts for four emergency discharge periods centred at namely neap tide high water, neap tide low water, spring tide mid-flood and spring tide mid-ebb respectively. Amongst all the discharge timings simulated, the predicted impacts under spring tide mid-ebb and neap tide low water were found to be the worse under dry and wet seasons respectively and therefore the model results are only presented for these two worse case discharge timings in the subsequent assessment. It is assumed that the sewage would be discharged via the existing emergency submarine outfall of STSTW during the dry season in March and the wet season in July. In case of power failure, the emergency discharge from CSTW would still be subject to settlement / sedimentation prior to the discharge and thus would represent primarily treated sewage effluent. However, the quality of the emergency discharge is assumed under this scenario to be similar to that of the crude sewage for conservative assessment. The loading conditions not during emergency bypass would be the same as those adopted in Scenario 5 (see Section 5.6.2.50). The indicative location of the emergency discharge is shown in Diagram 5.07 below.
Diagram 5.07 Generalized
Effluent Flow to Tolo Harbour Considered Under Scenario 7
5.6.2.54 The Delft3D water quality modelling tools adopted for the assessment are not red tide modelling tools, which are not designed for the purpose of predicting the rise and fall of a red tide. Thus, the secondary water quality impact brought by the red tide occurrence, such as DO depletion, may not be truly reflected by the Delft3D module. The maximum DO depletion in Tolo Harbour simulated under this assessment may be underestimated. However, the model would still be useful to serve the prediction of a possible increase or decrease in algae concentration in marine water, and the predicted algae (or chlorophyll-a) concentration would provide an indication on the tendency of red tide occurrence in the marine water.
5.6.2.55 It should also be noted that the use of averaged meteorological data (e.g. in terms of solar radiation and temperature) as well as the averaged pollution loading (calculated theoretically) for model input (under the existing EIA practice) may not be able to reflect the episodic events (e.g. stratification induced by extreme air temperature) as well as the day-to-day and year-to-year fluctuation of the pollution discharge into the sea. These are the model limitations that may cause a deviation between the model prediction and the actual situation, which need to be observed when reviewing the model results of this assessment.
5.7 Land-based Construction
5.7.1 Prediction and Evaluation of Potential Impacts
5.7.1.1 The potential water quality impacts arising from the land-based construction works of this Project are evaluated in this section.
General Construction Activities
5.7.1.2 Effluent discharged from temporary site facilities should be controlled to prevent direct discharge to the neighbouring inland waters and storm drains. Such effluent may include wastewater resulting from wheel washing of site vehicles at site entrances. Debris and rubbish such as packaging, construction materials and refuse generated from the construction activities should also be properly managed and controlled to avoid accidental release to the local storm system and inland waters. Adoption of the guidelines and good site practices for handling and disposal of construction discharges as specified in Section 5.7.2 would minimize the potential impacts.
5.7.1.3 Construction site run-off and drainage may cause local water quality impacts. Increase in SS arising from the construction site could block the drainage channels. High concentrations of suspended degradable organic material in marine water could lead to reduction in DO levels in the water column.
5.7.1.4 It is important that proper site practice and good site management (as specified in the ProPECC PN 1/94 “Construction Site Drainage”) be followed to prevent run-off with high level of SS from entering the surrounding waters. With the implementation of appropriate measures to control run-off and drainage from the construction site, disturbance of water bodies would be avoided and deterioration in water quality would be minimal. Thus, unacceptable impacts on the water quality are not expected, provided that the relevant mitigation measures as specified in the ProPECC PN 1/94 “Construction Site Drainage” are properly implemented.
Accidental Spillage and Potential
Contamination of Surface Water and Groundwater
5.7.1.5 A large variety of chemicals may be used during construction activities. These chemicals may include petroleum products, surplus adhesives, spent lubrication oil, grease and mineral oil, spent acid and alkaline solutions/solvent and other chemicals. Accidental spillage of chemicals in the works areas may contaminate the surface water or groundwater nearby. The potential impacts could however be mitigated by practical mitigation measures and good site practices (as given in Section 5.7.2).
Sewage Effluent from Construction Workforce
5.7.1.6 Domestic sewage would be generated from the workforce during the construction phase. However, this temporary sewage can be adequately treated by interim sewage treatment facilities, such as portable chemical toilets. Based on the Drainage Services Department (DSD) Sewerage Manual, the sewage production rate for construction workers is estimated at 0.35 m3 per worker per day. For every 100 construction workers working simultaneously at the construction site, about 35 m3 of sewage would be generated per day. Provided that sewage is not discharged directly into storm drains or inland waters adjacent to the construction site, and temporary sanitary facilities are used and properly maintained, it is unlikely that sewage generated from the site would have a significant water quality impact.
Construction Works in Close Proximity of
Inland Water
5.7.1.7 Construction activities in close vicinity to the inland water courses may pollute the inland water bodies due to the potential release of construction wastes. Construction wastes are generally characterized by high concentration of SS and elevated pH. The implementation of measures to control runoff and drainage will be important for the construction works adjacent to the inland water in order to prevent runoff and drainage water with high levels of SS from entering the water environment. With the implementation of adequate construction site drainage as specified in the ProPECC PN 1/94 “Construction Site Drainage” and the provision of mitigation measures as described in the ETWB TC (Works) No. 5/2005 “Protection of natural streams/rivers from adverse impacts arising from construction works”, it is anticipated that unacceptable water quality impacts would not arise.
Groundwater Infiltration and Groundwater Drawdown
5.7.1.8 Construction of rock caverns and tunnels may result in infiltration of groundwater. The major concern from these construction activities would be the increase in site runoff and the associated potential drawdown of groundwater in any soil and aquifer layers). Practical groundwater control measures are given in Section 5.7.2 to minimize the potential impacts.
Groundwater from Potentially Contaminated Area
5.7.1.9
According to separate CAP
prepared for the Project, it is identified that the works areas at the existing
STSTW site would have land contamination issues. Any contaminated material
disturbed, or material which comes into contact with the contaminated material,
has the potential to be washed with site run-off into watercourses. Mitigation
measures should be implemented to control site runoff from the contaminated areas, and to prevent
runoff entering the adjacent waters.
5.7.1.10 Groundwater pumped out or from dewatering process during excavation works in the existing STSTW site would be potentially contaminated. Proper treatment, discharge or recharge of contaminated groundwater, if any, following the mitigation measures given in Section 5.7.2 would minimize the potential impacts. No direct discharge of contaminated groundwater will be allowed.
THEES Connection Works
5.7.1.11 As discussed in Section 5.5.1.8 above, the necessary THEES connection works required for this Project will be undertaken within the regular THEES maintenance windows for a duration not longer than 4 weeks each outside the algae blooming season (January to May) and the frequency of THEES maintenance will be no more than once per year during the construction phase of the Project, as confirmed by DSD. Hence, no additional cumulative water quality effect on the Tolo Harbour waters will be induced by the proposed THEES connection works. DSD will closely liaise with the Contractor during the construction phase of the Project to ensure that the THEES connection works would be conducted within the regular THEES maintenance periods and also outside the algae blooming season (January to May).
5.7.2 Mitigation of Adverse Impacts
5.7.2.1 Mitigation measures as listed below are recommended to minimize the potential water quality impacts from the land-based construction works.
Construction Site Run-off and General
Construction Activities
5.7.2.2 Water used in ground boring and drilling for site investigation or rock / soil anchoring should as far as practicable be re-circulated after sedimentation. When there is a need for final disposal, the wastewater should be discharged into storm drains via silt removal facilities.
Wheel Washing Water
5.7.2.3
All vehicles and plant should be cleaned before they leave a construction
site to minimize the deposition of earth, mud, debris on roads. A wheel washing
bay should be provided at every site exit if practicable and wash-water should
have sand and silt settled out or removed before discharging into storm drains. The section of construction road between the wheel washing bay and the public road
should be paved with backfall to reduce vehicle tracking of soil and to prevent
site run-off from entering public road drains.
Rubbish and Litter
5.7.2.4 Good site practices should be adopted to remove rubbish and litter from construction sites so as to prevent the rubbish and litter from spreading from the site area. It is recommended to clean the construction sites on a regular basis.
Construction Site
Run-off
5.7.2.5
The site practices outlined in ProPECC PN 1/94 “Construction Site
Drainage” should be followed as far as practicable to minimise surface run-off
and the chance of erosion. The following measures are
recommended to protect water quality and sensitive uses of
the coastal area, and when properly implemented should be sufficient to
adequately control site discharges so as to avoid water quality impact:
5.7.2.6
Surface run-off from construction sites should be discharged into storm
drains via adequately designed sand/silt removal facilities such as sand traps, silt traps and sedimentation basins.
Channels or earth bunds or sand bag barriers should be provided on site to
properly direct stormwater
to such silt removal facilities. Perimeter channels at site boundaries should
be provided on site boundaries where necessary to intercept storm run-off from
outside the site so that it will not wash across the site. Catchpits and
perimeter channels should be constructed in advance of site formation works and
earthworks.
5.7.2.7
Silt removal facilities, channels and manholes should be maintained and
the deposited silt and grit should be removed regularly, at the onset of and
after each rainstorm to prevent local flooding. Before disposal at the public
fill reception facilities, the deposited silt and grit should be solicited in
such a way that it can be contained and delivered by dump truck instead of
tanker truck. Any practical options
for the diversion and re-alignment of drainage should comply with both engineering and environmental requirements in
order to provide adequate hydraulic capacity of all drains. Minimum distance of
100m should be maintained between the discharge points of construction site
run-off and the existing saltwater intakes. No effluent will be discharged into
typhoon shelter.
5.7.2.8
Construction works should be programmed to minimize soil excavation
works in rainy seasons (April to September). If excavation in soil cannot be avoided in these months or at
any time of year when rainstorms are likely, for the purpose of preventing soil erosion, temporary
exposed slope surfaces should be covered e.g. by tarpaulin, and temporary
access roads should be protected by crushed stone or gravel, as excavation
proceeds. Intercepting channels should be provided (e.g. along the crest / edge
of excavation) to prevent storm runoff from washing across exposed soil
surfaces. Arrangements should always be in place in such a way that adequate
surface protection measures can be safely carried out well before the arrival
of a rainstorm.
5.7.2.9
Earthworks final surfaces should be well compacted and the subsequent
permanent work or surface protection should be carried out immediately after
the final surfaces are formed to prevent erosion caused by rainstorms. Appropriate drainage like intercepting channels should
be provided where necessary.
5.7.2.10
Measures should be taken to minimize the ingress of rainwater into
trenches. If excavation of trenches in wet seasons is necessary, they should be dug and backfilled in short sections.
Rainwater pumped out from trenches or foundation excavations should be
discharged into storm drains via silt removal facilities.
5.7.2.11
Construction materials (e.g. aggregates, sand and fill material) on
sites should be covered with tarpaulin or similar fabric during rainstorms.
5.7.2.12
Manholes (including newly constructed ones) should always be adequately
covered and temporarily sealed so as to prevent silt, construction materials or
debris from getting into the drainage system, and to prevent storm run-off from
getting into foul sewers. Discharge of surface run-off into foul sewers must
always be prevented in order not to unduly overload the foul sewerage system.
5.7.2.13
Good site practices should be adopted to remove rubbish and litter from
construction sites so as to prevent the rubbish and litter from spreading from the site area. It is recommended to
clean the construction sites on a regular basis.
Site Effluent
5.7.2.14 There is a need to apply to EPD for a discharge licence for discharge of effluent from the construction site under the WPCO. The discharge quality must meet the requirements specified in the discharge licence. All the runoff and wastewater generated from the works areas should be treated so that it satisfies all the standards listed in the TM-DSS. The beneficial uses of the treated effluent for other on-site activities such as dust suppression, wheel washing and general cleaning etc., can minimise water consumption and reduce the effluent discharge volume. If monitoring of the treated effluent quality from the works areas is required during the construction phase of the Project, the monitoring should be carried out in accordance with the relevant WPCO licence which is under the ambit of regional office (RO) of EPD.
Accidental Spillage and Potential Contamination of Surface Water and Groundwater
5.7.2.15 Contractor must register as a chemical waste producer if chemical wastes would be produced from the construction activities. The Waste Disposal Ordinance (Cap 354) and its subsidiary regulations in particular the Waste Disposal (Chemical Waste) (General) Regulation, should be observed and complied with for control of chemical wastes.
5.7.2.16 Any service shop and maintenance facilities should be located on hard standings within a bonded area, and sumps and oil interceptors should be provided. Maintenance of vehicles and equipment involving activities with potential for leakage and spillage should only be undertaken within the areas appropriately equipped to control these discharges.
5.7.2.17 Disposal of chemical wastes should be carried out in compliance with the Waste Disposal Ordinance. The Code of Practice on the Packaging, Labelling and Storage of Chemical Wastes published under the Waste Disposal Ordinance details the requirements to deal with chemical wastes. General requirements are given as follows:
· Suitable containers should be used to hold the chemical wastes to avoid leakage or spillage during storage, handling and transport;
· Chemical waste containers should be suitably labelled, to notify and warn the personnel who are handling the wastes, to avoid accidents; and
· Storage area should be selected at a safe location on site and adequate space should be allocated to the storage area.
Sewage Effluent from Construction
Workforce
5.7.2.18 The construction workforce on site will generate sewage. It is recommended to provide sufficient chemical toilets in the works areas. A licensed waste collector should be deployed to clean the chemical toilets on a regular basis.
5.7.2.19 Notices should be posted at conspicuous locations to remind the workers not to discharge any sewage or wastewater into the surrounding environment. Regular environmental audit of the construction site will provide an effective control of any malpractices and can encourage continual improvement of environmental performance on site. It is anticipated that sewage generation during the construction phase of the project would not cause water pollution problem after undertaking all required measures.
Construction Works in Close
Proximity of Inland Waters
5.7.2.20 The practices outlined in ETWB TC (Works) No. 5/2005 “Protection of natural streams/rivers from adverse impacts arising from construction works” should also be adopted where applicable to minimize the water quality impacts upon any natural streams or surface water systems. Relevant mitigation measures from the ETWB TC (Works) No. 5/2005 are listed below:
· Construction works close to the inland waters should be carried out in dry season as far as practicable where the flow in the surface channel or stream is low.
· The use of less or smaller construction plants may be specified in areas close to the water courses to reduce the disturbance to the surface water.
· Temporary storage of materials (e.g. equipment, chemicals and fuel) and temporary stockpile of construction materials should be located well away from any water courses during carrying out of the construction works.
· Stockpiling of construction materials and dusty materials should be covered and located away from any water courses.
· Construction debris and spoil should be covered up and/or disposed of as soon as possible to avoid being washed into the nearby water receivers.
· Proper shoring may need to be erected in order to prevent soil or mud from slipping into the watercourses.
Groundwater Infiltration and Groundwater Drawdown
5.7.2.21 Appropriate measures during the construction of the cavern construction should be implemented to minimize the groundwater infiltration. The water control strategies include:
· Probing Ahead: As normal practice, the Contractor will undertake rigorous probing of the ground ahead of excavation works to identify zones of significant water inflow. The probe drilling results will be evaluated to determine specific grouting requirements in line with the tunnel / cavern advance. In such zones of significant water inflow that could occur as a result of discrete, permeable features, the intent would be to reduce overall inflow by means of cut-off grouting executed ahead of the tunnel / cavern advance.
· Pre-grouting: Where water inflow quantities are excessive, pre-grouting will be required to reduce the water inflow into the tunnel / cavern. The pre-grouting will be achieved via a systematic and carefully specified protocol of grouting.
· In principle, the grout pre-treatment would be designed on the basis of probe hole drilling ahead of the tunnel / cavern face.
· The installation of waterproof lining would also be adopted after the formation of the tunnels and caverns.
5.7.2.22 In the event of excessive infiltration being observed as a result of the tunnelling or excavation works even after incorporation of the water control strategies, post-grouting should be applied as far as practicable as described below:
· Post-grouting: Groundwater drawdown will be most likely due to inflows of water into the tunnel / cavern that have not been sufficiently controlled by the pre-grouting measures. Where this occurs post grouting will be undertaken before the lining is cast. Whilst unlikely to be required in significant measure, such a contingency should be allowed for reduction in permeability of the tunnel / cavern surround (by grouting) to limit inflow to acceptable levels.
5.7.2.23 The practical groundwater control measures stated above are proven technologies and have been extensively applied in other past projects. These measures or other similar methods, as approved by the Engineer to suit the works condition shall be applied to minimize the groundwater infiltration.
5.7.2.24 In case seepage of groundwater occurs, groundwater should be pumped out from works areas and discharged to the storm system via silt trap. Uncontaminated groundwater from dewatering process should also be discharged to the storm system via silt removal facilities.
Groundwater from Potentially Contaminated Area
5.7.2.25 No directly discharge of groundwater from contaminated areas if any should be adopted. Prior to any excavation works within the potentially contaminated areas at the existing STSTW site (if found to be), the baseline groundwater quality in these areas should be reviewed based on the relevant site investigation data and any additional groundwater quality measurements to be performed with reference to Guidance Note for Contaminated Land Assessment and Remediation and the review results should be submitted to EPD for examination. If the review results indicated that the groundwater to be generated from the excavation works would be contaminated, this contaminated groundwater should be either properly treated or properly recharged into the ground in compliance with the requirements of the TM-DSS. If wastewater treatment is to be deployed for treating the contaminated groundwater, the wastewater treatment unit shall deploy suitable treatment processes (e.g. oil interceptor / activated carbon) to reduce the pollution level to an acceptable standard and remove any prohibited substances (such as TPH) to an undetectable range. All treated effluent from the wastewater treatment plant shall meet the requirements as stated in TM-DSS and should be either discharged into the foul sewers or tankered away for proper disposal.
5.7.2.26 If deployment of wastewater treatment is not feasible for handling the contaminated groundwater, groundwater recharging wells should be installed as appropriate for recharging the contaminated groundwater back into the ground. The recharging wells should be selected at places where the groundwater quality will not be affected by the recharge operation as indicated in section 2.3 of the TM-DSS. The baseline groundwater quality should be determined prior to the selection of the recharge wells, and submit a working plan to EPD for agreement. Pollution levels of groundwater to be recharged shall not be higher than pollutant levels of ambient groundwater at the recharge well. Groundwater monitoring wells should be installed near the recharge points to monitor the effectiveness of the recharge wells and to ensure that no likelihood of increase of groundwater level and transfer of pollutants beyond the site boundary. Prior to recharge, free products should be removed as necessary by installing the petrol interceptor. The Contractor should apply for a discharge licence under the WPCO through the Regional Office of EPD for groundwater recharge operation or discharge of treated groundwater.
THEES Connection Works
5.7.2.27 The THEES connection works required for this Project (see Section 5.5.1.8) shall be undertaken within the regular THEES maintenance windows for a duration not longer than 4 weeks each outside the algae blooming season (January to May) and the frequency of THEES maintenance shall be no more than once per year during the construction phase of the Project.
5.7.3 Environmental Monitoring and Audit
5.7.3.1 The potential water quality impact from the land-based construction works can be controlled by the recommended mitigation measures. No water quality monitoring specific to the land-based construction works is thus proposed. However, regular site inspections should be undertaken during the construction phase to inspect the construction activities and works areas in order to ensure the recommended mitigation measures are properly implemented. Details of the EM&A programme are presented in the standalone EM&A Manual.
5.7.4 Residual Impacts
5.7.4.1 No unacceptable residual land-based water quality impacts are anticipated during land-based construction with the above mitigation measures implemented.
5.8 Operational Effluent Discharges to Victoria Harbour – Normal THEES Operation
5.8.1 Prediction and Evaluation of Potential Impacts
5.8.1.1 A total of 5 modelling scenarios (namely Scenarios 1, 2a, 2b, 3a and 3b) were simulated to assess the potential cumulative water quality impacts upon the Victoria Harbour during the normal plant operation of this Project. Details of these modelling scenarios are provided in Sections 5.6.2.28 and 5.6.2.43 above.
5.8.1.2 The model results of the 5 scenarios are compared in Appendix 5.03 as contour plots for BOD, TIN, UIA, E. coli, SS, and sedimentation rate. All contour plots are presented as annual arithmetic averages except for the E. coli levels, which are annual geometric mean. Since the marine WQO in Victoria Harbour for depth-averaged (DA) DO and bottom DO is defined as not less than 4 and 2 mg/L respectively for 90% of times over a complete calendar year, the contour plots for DO are presented as 10th percentile (10%ile) values for comparison with the WQO.
5.8.1.3 Under the baseline “do-nothing” condition without any further water quality improvement work at Kai Tak (Scenario 1), the 10%ile bottom DO at KTAC would not meet the WQO of no less than 2 mg/L. Under Scenarios 2a and 3a (with the IP scheme to intercept the polluted water from KTN and KTAC to Kowloon Bay), significant improvement in the bottom DO levels would occur as compared to the baseline situation. For Scenario 2a (a conservative case using the design effluent standards for compiling the THEES effluent load), the bottom DO in the upper part of the KTAC would still exceed the WQO, whilst the exceedance in the lower reach of the KTAC was eliminated. Under Scenario 3a (adopting a more realistic worst case for the THEES effluent load, see Section 5.6.2.43), the exceedance for bottom DO in the whole KTAC area was removed. Under the alternative scheme (Scenarios 2b and 3b) with a 150m opening at the ex-airport runway to enhance natural flushing at KTAC, the exceedance for bottom DO in the whole KTAC would also be totally eliminated. Under all the 5 scenarios, full compliance with the WQO for bottom DO was predicted in KTTS, Kowloon Bay and the open water in Victoria Harbour outside the breakwaters of KTTS as shown in Appendix 5.03.
5.8.1.4 In terms of the DA DO, the 10%ile levels predicted in the whole KTAC and KTTS would exceed the WQO of less than 4 mg/L under Scenario 1 (baseline condition). Under Scenarios 2a and 3a (with the IP scheme), the exceedance in the KTTS area would be eliminated but residual exceedance was still predicted in the KTAC water. On the other hand, least improvement in the DA DO was predicted under Scenario 2b (i.e. the alternative runway opening scheme with a conservative THEES effluent load). Scenario 2b only eliminated the exceedance in the lower reach of the KTTS with residual exceedance in the upper part of the KTTS and the whole area of KTAC. Scenario 3b (runway opening scheme with a realistic THEES effluent load) however showed the best water quality effects as compared to Scenarios 2a, 2b and 3a. The exceedance for DA DO in the whole KTTS and most areas of KTAC would be removed under Scenario 3b. Under Scenarios 1 and 3a, higher DO level was predicted at the upper corner of Kowloon Bay when compared to Scenario 2a, owing to different loading assumptions adopted for these scenarios. Scenarios 1 and 2a adopted the same magnitude of overall pollution loading to KTD waters. However, Scenario 2a has diverted some loading from KTAC for discharge at the middle of the ex-airport runway and this additional discharge point is relatively close to Kowloon Bay, affecting the water quality at Kowloon Bay, whereas Scenario 1 assumed that there is no loading diversion from KTAC. As a result, there would be a slight DO decrease in the upper corner of Kowloon Bay under Scenario 2a as compared to the baseline condition under Scenario 1. Although Scenario 3a has a very similar setting as compared to Scenario 2a with load diversion from KTAC, the overall pollution loading to the KTD waters was significantly smaller under Scenario 3a with a more realistic loading assumption (see Sections 5.6.2.42 and 5.6.2.43). For example, the BOD level assumed for the THEES effluent is 20 mg/L (for Scenarios 1 and 2a) and <10 mg/L (for Scenario 3a). Hence, it can be observed that there would be a significant DO improvement in the KTD waters under Scenario 3a, not only at the upper corner of Kowloon Bay but also in the whole KTAC and KTTS area. Under all the 5 scenarios, full compliance with the WQO for DA DO was predicted in Kowloon Bay and the open water in Victoria Harbour outside the breakwaters of KTTS as shown in Appendix 5.03.
5.8.1.5 The cumulative water quality changes brought by the latest KTD improvement measures (under Scenarios 2a, 2b, 3a and 3b) are actually positive effects, minimizing the DO impact at KTAC and KTTS as compared to the baseline situation (Scenario 1). As there are no biological nor ecological sensitive receivers in KTAC and KTTS, the residual DO exceedance in KTAC / KTTS is considered not a critical concern for this Project, and in view that the overall impact zone with low DO levels in the KTAC and KTTS would be significantly improved and minimized with the latest KTD improvement measures, no unacceptable cumulative DO impact would arise.
Biochemical Oxygen
Demand
5.8.1.6 There is no marine WQO for BOD. Under the baseline condition (Scenario 1), the BOD levels ranged from about 3 to <20 mg/L in KTAC and about 1.5 to 3 mg/L in KTTS. The predicted BOD levels in Kowloon Bay and the open water of Victoria Harbour were low (ranged from <0.5 to about 1.5 mg/L only) under Scenario 1.
5.8.1.7 Under Scenarios 2a and 3a (with the IP Scheme), the BOD levels in KTAC and KTTS would be reduced to about 2.5 to <10 mg/L and about 1 to 2.5 mg/L respectively. No significant change in the overall BOD pattern in Kowloon Bay and the open Victoria Harbour would be induced by the IP scheme (under Scenarios 2a and 3a) as compared to the baseline situation under Scenario 1.
5.8.1.8 Scenarios 2b and 3b (the alternative runway opening scheme) would also induce some BOD improvements at KTAC and KTTS similar to the improvement achieved under Scenarios 2a and 3a (the IP scheme). However, the runway opening under Scenarios 2b and 3b would introduce a higher BOD levels in Kowloon Bay and a slight change of the BOD pattern in the Kowloon Bay as compared to the baseline situation (Scenario 1) as a result of the broader mixing between Kowloon Bay and KTAC waters induced by the runway opening. The BOD level at the upper corner of the Kowloon Bay would be increased to >2 mg/L under Scenarios 2b and 3b.
Suspended Solids
5.8.1.9 Under the baseline condition (Scenario 1), the SS level is generally over 20 mg/L in KTAC and generally over 10 mg/L in KTTS. The predicted SS levels in Kowloon Bay and the open water of Victoria Harbour were lower (< 8 mg/L in general) under Scenario 1. Under Scenarios 2a and 3a (with the IP scheme), the impact zone of high SS (>20 mg/L) in KTAC would be significantly reduced. The SS levels in most of the KTTS would also be reduced to <10 mg/L under Scenarios 2a and 3a. No significant change in the overall SS pattern in Kowloon Bay and the open Victoria Harbour would be induced by the IP scheme (under Scenarios 2a and 3a) as compared to the baseline situation under Scenario 1.
5.8.1.10 Scenarios 2b and 3b (the alternative runway opening scheme) would induce an even greater SS improvements at KTAC and KTTS. The impact zone of high SS (over 20 mg/L) in KTAC was totally removed under Scenarios 2b and 3b, refer to Appendix 5.03. However, the runway opening under Scenarios 2b and 3b would introduce a higher SS levels in Kowloon Bay and a slight change of the SS pattern in the Kowloon Bay as compared to the baseline situation (Scenario 1). The SS level at the upper corner of the Kowloon Bay would be increased to about 10 mg/L under Scenarios 2b and 3b. However, the SS increase in Kowloon Bay predicted under Scenarios 2b and 3b would still fully comply with the WQO for SS (of no more than 30% increase from the baseline). No unacceptable cumulative SS impacts would be anticipated.
Unionized Ammonia
5.8.1.11 Under the worst case assumption of Scenario 1 (adopting the discharge license standards for compiling the THEES effluent load for continuous discharge), the UIA levels exceed the WQO of 0.021 mg/L in KTAC and KTTS. The predicted UIA levels in KTAC were generally over 0.1 mg/L under the baseline condition, which is considered high. The predicted UIA levels in Kowloon Bay and the open water of Victoria Harbour outside the breakwaters of KTTS would be substantially lower and comply well with the WQO.
5.8.1.12 Under Scenarios 2a and 3a (with the IP scheme), exceedance was still predicted inside KTAC and KTTS but the extent of UIA level would be reduced as compared to the baseline condition. The area of high UIA impact zone (of >0.1 mg/L) in KTAC would be reduced by about 50% under Scenario 2a (adopting a conservative THEES effluent load) and totally removed under Scenario 3a (using a realistic THEES effluent load) as shown in Appendix 5.03. The IP scheme (under Scenarios 2a and 3a) would however divert some UIA from KTAC to the Kowloon Bay area, which causes a slight UIA increase in the Kowloon Bay area but full compliance of UIA would still be achieved in the whole Kowloon Bay water and the open water of Victoria Harbour under Scenarios 2a and 3a.
5.8.1.13 Scenarios 2b and 3b (the alternative runway opening scheme) would induce an even greater UIA improvements at KTAC and KTTS. The impact zone of high UIA (of over 0.1 mg/L) in KTAC was totally removed under Scenarios 2b and 3b, refer to Appendix 5.03. However, the runway opening under Scenarios 2b and 3b would allow broader mixing between Kowloon Bay and KTAC waters, discharging a relatively larger amount of UIA from KTAC to Kowloon Bay and causing an UIA increase in the Kowloon Bay waters. The UIA level would marginally exceed the WQO in a small area at the upper most corner of Kowloon Bay under Scenario 2b (using a conservative THEES load), whereas full UIA compliance in the whole Kowloon Bay area would still be maintained under Scenario 3b (using a realistic worst case of the THEES effluent load). Full UIA compliance would be achieved in the open Victoria Harbour channel outside the KTTS breakwaters under both Scenarios 2b and 3b.
5.8.1.14 As there are no biological nor ecological sensitive receivers in embayed waters of KTAC, KTTS and in areas near the upper corner of Kowloon Bay, the UIA exceedance (predicted in these embayed waters only) is considered not a critical concern. Although the alternative KTD improvement options (under Scenarios 2a, 2b, 3a and 3b) would induce a slight UIA increase in the Kowloon Bay waters, the overall extent of UIA impact in the KTD waters (including KTAC and KTTS) as a whole would be significantly improved as better water circulation would be introduced under the KTD improvement options. Thus, no unacceptable cumulative UIA impact would be anticipated.
Total Inorganic
Nitrogen
5.8.1.15 Under the baseline condition (Scenario 1), the TIN levels exceeded the WQO of 0.4 mg/L in KTAC and KTTS. The predicted TIN levels in KTAC were generally over 5 mg/L. The predicted TIN levels in Kowloon Bay and the open water of Victoria Harbour would be substantially lower and generally comply with the WQO under Scenario 1 except in a very small area at the upper most corner of Kowloon Bay where the TIN level is slightly over 0.4 mg/L, which exceeded the WQO and is caused by the nearby background polluted stormwater discharge assumed in the modelling exercise.
5.8.1.16 Under Scenarios 2a and 3a (with the IP scheme), exceedance was still predicted inside KTAC and KTTS but the extent of TIN level would be reduced. The area of high TIN impact zone (of >5 mg/L) in KTAC would be reduced by about 50% under Scenarios 2a and 3a as compared to the baseline condition (Scenario 1) as shown in Appendix 5.03. The IP scheme (under Scenarios 2a and 3a) would however divert some TIN from KTAC to the Kowloon Bay area, which causes a TIN increase in the Kowloon Bay. Thus, the area of marginal TIN exceedance in Kowloon Bay predicted under the baseline scenario (Scenario 1) would be further expanded under Scenarios 2a and 3a but the maximum TIN level in Kowloon Bay would still be less than 0.6 mg/L as compared to the WQO of 0.4 mg/L.
5.8.1.17 Scenarios 2b and 3b (the alternative runway opening scheme) would induce an even greater TIN improvement at KTAC and KTTS. The impact zone of high TIN (over 5 mg/L) in KTAC was totally removed under Scenarios 2b and 3b, refer to Appendix 5.03. However, the runway opening under Scenarios 2b and 3b would allow broader mixing between Kowloon Bay and KTAC waters, discharging a significant portion of TIN from KTAC to Kowloon Bay, which causes a TIN increase in the Kowloon Bay waters. The TIN level in the Kowloon Bay water would be increased to less than 5 mg/L in the upper most corner of Kowloon Bay under Scenarios 2b and 3b.
5.8.1.18 The implication of TIN exceedance in the KTD waters was assessed to be acceptable under the approved EIA for KTD (refer to Sections 8.7.8 to 8.7.13 of the EIA Report for KTD). With incorporation of the latest sewerage and drainage improvement works in the Kai Tak hinterland areas implemented after the approval of the EIA for KTD, the TIN levels in KTD waters predicted under this modelling exercise as presented above are lower than that predicted under the approved EIA for KTD. Following the same approach of the approved EIA for KTD, an assessment on the implication of TIN exceedance in Victoria Harbour is provided in the subsequent sections.
Implication of High TIN Level in Victoria Harbour
5.8.1.19 Inorganic nutrients such as TIN (N) and orthophosphate, PO4 (P) are essential to algal formation. As TIN is a nutrient, it is not toxic to marine life. The implication of high nutrient level in marine water would be the possible enhancement of excessive phytoplankton growth (algal bloom / red tide).
5.8.1.20 Algal bloom or red tide could lead to indirect water quality impacts such as oxygen depletion because the water can become completely deprived of oxygen when a bloom declines rapidly, since the biological degradation of dead algal material consumes large amounts of oxygen. Although the primary concern from algal blooms is oxygen depletion, a minority (about 10%) of blooms consist of toxin-producing species that synthesize phaecotoxins. Algal bloom could also cause other side effect such as discoloration of marine water, which may deteriorate the aesthetic quality of marine water. However, the associated visual / discoloration effect is reversible.
5.8.1.21 It should however be highlighted that red tides are natural phenomena which occur seasonally in both polluted and unpolluted waters (EPD’s publication “Marine Water Quality in Hong Kong 2014” refers) and could be induced by many factors other than the availability of nutrients in marine waters (e.g. availability of sunlight, water circulation, temperature and wind conditions etc.). Red tide occurrence would depend on a combination of different factors including flow condition, light penetration, salinity distribution, nutrient concentrations, nutrient ratios and species competition, etc.
5.8.1.22
Based on the EPD’s publications
“Marine Water Quality in Hong Kong in 2014”, red tides occurred more frequently
in the eastern (72%) and southern (18%)
waters. In 2014, a total of 23 red tides were recorded in Hong Kong waters.
Of these, 16 occurred in the eastern, 5 in Southern, 1 in Western Buffer, 1 in
North Western and none in Victoria Harbour.
5.8.1.23 For the background nutrient levels in 2014, with reference to the “Marine Water Quality in Hong Kong in 2014”, the range of TIN in the eastern waters was 0.01 - 0.21 mg/L (with a mean level of 0.04 -0.07 mg/L) whilst that of the central Victoria Harbour (VM1, VM2 and VM4 closest to the KTD waters) was 0.12 – 0.51 mg/L (with a mean level of 0.2 -0.29 mg/L). The range of PO4 in the eastern waters was 0.002 - 0.023 mg/L (with a mean level 0.005 - 0.008 mg/L) whilst that of the central Victoria Harbour was 0.013 – 0.043 mg/L (with a mean level of 0.019 – 0.027 mg/L). It could be concluded that the background nutrient levels, considering both N and P, were far higher in the Victoria Harbour. From the 2014 records for eastern water, it can be concluded that algal bloom could readily take off at a low N and P level provided that other environmental conditions were suitable.
5.8.1.24 In the open water environment in the Victoria Harbour, the effect of tidal flushing was high. As the water was frequently diluted by horizontal advection or vertical mixing, the accumulation of algal biomass and hence the chance of algal bloom was more effectively minimized.
Likelihood of Algal
Bloom in KTD Waters
5.8.1.25 The KTD water is subject to the direct influence of the polluted stormwater discharges from the hinterlands as well as the background water quality in the open Victoria Harbour where the nutrient levels are also affected by the polluted runoff generated from the old urbanized areas on both sides of the Victoria Harbour as well as the influences from other background nutrient sources such as the Pearl River discharges. The overall nutrient level in the KTD water is thus considered high. However, implementation of the proposed IP scheme or opening a gap at the runway would enhance the water circulation in the embayed waters of KTD which could reduce the potential for algal biomass accumulation and thus minimize the potential of red tide formation in the KTD area.
5.8.1.26 Based on the data provided in Section 5.8.1.23, it can be concluded that nutrient level in Kowloon Bay is already abundant (more than that in the eastern waters) but the existing red tide occurrence in the water was rare. Thus, it is expected that the potential increase or redistribution of nutrients in the future due to the proposed IP scheme or runway opening would unlikely cause any further effect on the algal bloom formation as the existing red tide occurrence in Kowloon Bay is limited by other factors. As shown in Appendix 5.03, there would be no significant change in the overall harbour water quality due to the proposed IP scheme or the runway opening. On the other hand, the proposed IP scheme or runway opening would further enhance the water circulation in the KTD waters to minimize the algae accumulation. Hence, the KTD improvement options would unlikely increase the risk of algal bloom as compared to the existing condition.
E. coli
5.8.1.27 There is no WQO for E. coli available for the KTD waters under the existing situation. Under the baseline condition (Scenario 1), the predicted E. coli levels were over 2000 no./100mL in KTAC and in general marginally below or around 610 no./100mL inside KTTS. The predicted E. coli levels in the open water of Victoria Harbour were generally below 610 no./100mL. However, high E. coli levels (> 2000 no./100mL) are also predicted in the nearshore area along the coastline of Victoria Harbour which is subject to the background polluted storm water discharges assumed in the modelling exercise.
5.8.1.28 Under Scenarios 2a and 3a (with the IP system) and Scenarios 2b and 3b (with the alternative runway opening scheme), slight E. coli improvement in KTAC and KTTS was observed as compared to the baseline conditions. However the overall E. coli pattern in the KTD waters is considered similar under all the 5 modelling scenarios, refer to Appendix 5.03.
5.8.1.29 There is no WQO for sedimentation rate available for the KTD waters. No ecological sensitive receiver of great importance (such as coral communities) is identified in the KTD waters. Under the baseline condition (Scenario 1), the predicted mean sedimentation rate were less than 5 g/m2/day in the Study Area except for some small areas in the KTTS and the lower reach of KTAC where the mean sedimentation rates were over 10 g/m2/day.
5.8.1.30 Under Scenarios 2a and 3a (with the IP system) and Scenarios 2b and 3b (with the alternative runway opening scheme), slight sedimentation reduction in KTAC and KTTS was observed as compared to the baseline conditions. The areas with relatively high sedimentation rate of over 10 g/m2/day in KTAC and KTTS were completely removed under Scenarios 2a, 2b, 3a and 3b. As shown in Appendix 5.03, the overall sedimentation pattern in the KTD waters is considered similar amongst the modelling scenarios.
Impact on WSRs
5.8.1.31 Following the same approach adopted under the approved EIA for KTD and the recent KTD studies under Agreement No. CE30/2008 (CE), this water quality assessment focussed only on the KTD water bodies (as shown in Diagram 5.01 above), which are within the potential influence zone of the KTD improvement measures and the THEES effluent discharge (refer to Section 5.6.2.29). Thus, the model results are only presented for the WSRs that are within the potential influence zone of the THEES effluent, including the WSD flushing water intakes at Tai Wan (W8) and Cha Kwo Ling (W12), the intake of the Kai Tak DCS and KTTS as well as the possible water sports area in KTTS currently being investigated under separate studies. Other WSRs were found not to be affected by the KTD improvement works and are therefore not presented.
WSD Flushing Water
Intakes
5.8.1.32 Based on the model results as summarized in Table 5.19 below, the pollution level predicted at the WSD intake points including Tai Wan (W8) and Cha Kwo Ling (W12) intakes would fully comply with the relevant WSD water quality standards for all the parameters of concern under all the assessment scenarios. Full compliance of WQO was predicted under all 5 scenarios at these two WSD flushing water intakes closest to the Project discharge.
Table 5.19 Predicted Water Quality
at Selected WSD Flushing Water Intakes
|
Parameter |
Scenario (see Remarks) |
WSD Flushing Water Intakes |
||
|
Tai Wan (W8) |
Cha Kwo Ling (W12) |
WSD WQC |
||
|
Maximum
Ammonia Nitrogen (mg/L) |
1 |
0.206 |
0.359 |
≤1 |
|
2a |
0.281 |
0.223 |
||
|
2b |
0.263 |
0.292 |
||
|
3a |
0.204 |
0.197 |
||
|
3b |
0.199 |
0.209 |
||
|
Maximum
Suspended Solids (mg/L) |
1 |
7.7 |
7.6 |
≤10 |
|
2a |
8.3 |
7.8 |
||
|
2b |
7.9 |
7.8 |
||
|
3a |
8.2 |
7.7 |
||
|
3b |
7.9 |
7.7 |
||
|
Minimum
Dissolved Oxygen (mg/L) |
1 |
5.6 |
5.6 |
≥2 |
|
2a |
5.5 |
5.6 |
||
|
2b |
5.6 |
5.6 |
||
|
3a |
5.6 |
5.6 |
||
|
3b |
5.6 |
5.6 |
||
|
Maximum BOD5 (mg/L) |
1 |
2.0 |
1.7 |
≤10 |
|
2a |
2.1 |
1.6 |
||
|
2b |
2.0 |
1.8 |
||
|
3a |
2.1 |
1.6 |
||
|
3b |
2.0 |
1.8 |
||
|
Maximum
E. coli (no./100mL) |
1 |
4,484 |
764 |
≤20,000 |
|
2a |
5,953 |
1,208 |
||
|
2b |
4,317 |
787 |
||
|
3a |
5,944 |
1,202 |
||
|
3b |
4,311 |
773 |
||
Remarks: Data presented are in
mid-depth water level.
Scenario 1: UDS
baseline condition of Victoria Harbour (w/o KTD improvement measures)
Scenario 2a: UDS Cumulative Impact Scenario (THEES based on design effluent
standards) with IP scheme to intercept waters at KTN and KTAC to Kowloon Bay
Scenario 2b: UDS Cumulative Impact Scenario (THEES based on design effluent
standards) with 150m opening at former Kai Tak runway
Scenario 3a: UDS Cumulative Impact Scenario (THEES based on actual measurements)
with IP scheme to intercept waters at KTN and KTAC to Kowloon Bay
Scenario 3b: UDS Cumulative Impact Scenario (THEES based on actual measurements)
with 150m opening at former Kai Tak runway
Kai Tak DCS Cooling
Water Intake
5.8.1.33 There are no specific criteria/requirements for the Kai Tak DCS cooling water intake from EMSD. The model results at the Kai Tak DCS cooling water intake are summarized in Table 5.20 below. Under Scenarios 1, 2b and 3b, the intake of the DCS is assumed to be at its existing location next to the To Kwa Wan Typhoon Shelter (TKWTS). Under Scenarios 2a and 3a, the proposed IP scheme will alter the intake point of the DCS. The alternative intake points of the DCS, namely Intake 1 and Intake 2, assumed under Scenarios 2a and 3a are shown in Diagram 5.02 above. The DCS operation is not sensitive to the water quality changes at the intake point as confirmed by EMSD. No unacceptable water quality impact upon the cooling water intake(s) would be resulted.
Table 5.20 Predicted
Water Quality at Kai Tak DCS Cooling Water Intake
|
Parameter |
Scenario (see Remarks) |
Kai Tak DCS Cooling Water Intakes |
||
|
C11 |
C12 |
C13 |
||
|
Maximum Ammonia Nitrogen (mg/L) |
1 |
0.245 |
- |
- |
|
2a |
- |
7.315 |
3.288 |
|
|
2b |
0.641 |
- |
- |
|
|
3a |
- |
4.798 |
1.971 |
|
|
3b |
0.374 |
- |
- |
|
|
Maximum Suspended Solids (mg/L) |
1 |
7.8 |
- |
- |
|
2a |
- |
60.7 |
31.8 |
|
|
2b |
8.6 |
- |
- |
|
|
3a |
- |
50.9 |
27.8 |
|
|
3b |
8.5 |
- |
- |
|
|
Minimum Dissolved Oxygen (mg/L) |
1 |
5.5 |
- |
- |
|
2a |
- |
0.7 |
1.4 |
|
|
2b |
5.4 |
- |
- |
|
|
3a |
- |
1.0 |
2.2 |
|
|
3b |
5.5 |
- |
- |
|
|
Maximum BOD5 (mg/L) |
1 |
2.0 |
- |
- |
|
2a |
- |
28.5 |
10.5 |
|
|
2b |
2.2 |
- |
- |
|
|
3a |
- |
17.8 |
7.0 |
|
|
3b |
2.1 |
- |
- |
|
|
Maximum E. coli
(no./100mL) |
1 |
1,992 |
- |
- |
|
2a |
- |
1 E+06 |
30,410 |
|
|
2b |
1,688 |
- |
- |
|
|
3a |
- |
1 E+06 |
29,182 |
|
|
3b |
1,631 |
- |
- |
|
Remarks: Data presented are
in mid-depth water level.
Scenario 1: UDS
baseline condition of Victoria Harbour (w/o KTD improvement measures)
Scenario 2a: UDS Cumulative Impact Scenario (THEES based on design
effluent standards) with IP scheme to intercept waters at KTN and KTAC to
Kowloon Bay
Scenario 2b: UDS Cumulative Impact Scenario (THEES based on
design effluent standards) with 150m opening at former Kai Tak runway
Scenario 3a: UDS Cumulative Impact Scenario (THEES based on actual
measurements) with IP scheme to intercept waters at KTN and KTAC to Kowloon Bay
Scenario 3b: UDS Cumulative Impact Scenario (THEES based on actual
measurements) with 150m opening at former Kai Tak runway
Kwun Tong Typhoon
Shelter / Potential Water Sports Area at Kai Tak
5.8.1.34 The model results at the KTTS are summarized in Table 5.21 below. Under Scenarios 2a, 2b, 3a and 3b (with the KTD improvement measures), the DO exceedance at KTTS would be completely eliminated and significant UIA and TIN reduction in the KTTS would also be achieved. Although UIA and TIN exceedances were still predicted in KTTS, there is no ecological sensitive receiver of significant important located in the typhoon shelter. The TIN exceedance in KTD waters was also assessed to be acceptable in Sections 5.8.1.19 to 5.8.1.26 above. The KTD improvement measures would actually contribute a positive water quality effect in the KTTS as compared to the baseline scenario. No unacceptable cumulative water quality impact would be anticipated.
5.8.1.35 The feasibility of locating a potential water sports area in KTTS will be investigated under separate studies of Agreement No. CE30/2008 (CE) and Agreement No. CE73/2014 (TP) [6]. The WQO laid down for secondary contact and recreational uses stipulates that the annual geometric mean E. coli level should not exceed 610 no./100mL. The model results showed that the annual geometric mean E. coli level predicted at the KTTS (where the potential water sports area is proposed) would be below or around 610 no./100mL as shown in Table 5.21 below. It should be highlighted that this potential water sports centre is not a confirmed project and its feasibility is still subject to confirmation under separate studies. Since this STSTW relocation project will not change the existing THEES effluent load, and if this potential water sports centre is carried forward under the separate KTD project, detailed justifications on the acceptability of using the KTTS for water sports activities (taking into account the cumulative effect of the existing THEES discharge as well as any additional mitigation measure required to further improve the water quality) will be provided under the separate KTD studies.
Table 5.21 Predicted
Water Quality at KTTS / Potential Water Sports Area
|
Parameter |
Scenario (see Remarks) |
WS1 (see Figure No.60334056/EIA/5.02) |
WQO |
|
10%ile Bottom Dissolved Oxygen (mg/L) |
1 |
1.7 |
≥2 |
|
2a |
2.9 |
||
|
2b |
2.2 |
||
|
3a |
3.7 |
||
|
3b |
3.1 |
||
|
10%ile Depth-Averaged Dissolved Oxygen (mg/L) |
1 |
3.3 |
≥4 |
|
2a |
4.8 |
||
|
2b |
4.3 |
||
|
3a |
5.2 |
||
|
3b |
4.9 |
||
|
Unionised Ammonia (Annual Average) (mg/L) |
1 |
0.068 |
≤0.021 |
|
2a |
0.033 |
||
|
2b |
0.038 |
||
|
3a |
0.019 |
||
|
3b |
0.022 |
||
|
Total Inorganic Nitrogen (Annual Average) (mg/L) |
1 |
2.66 |
≤0.4 |
|
2a |
1.56 |
||
|
2b |
1.79 |
||
|
3a |
1.59 |
||
|
3b |
1.79 |
||
|
Geometric Mean E.
coli (no./100mL) |
1 |
578 |
≤610 |
|
2a |
508 |
||
|
2b |
623 |
||
|
3a |
486 |
||
|
3b |
604 |
Remarks: Bolded
values indicate non-compliance of WQO.
Scenario
1: UDS
baseline condition of Victoria Harbour (w/o KTD improvement measures)
Scenario
2a: UDS Cumulative Impact
Scenario (THEES based on design effluent standards) with IP scheme to intercept
waters at KTN and KTAC to Kowloon Bay
Scenario
2b: UDS Cumulative
Impact Scenario (THEES based on design effluent standards) with 150m opening at
former Kai Tak runway
Scenario
3a: UDS Cumulative
Impact Scenario (THEES based on actual measurements) with IP scheme to
intercept waters at KTN and KTAC to Kowloon Bay
Scenario
3b: UDS Cumulative
Impact Scenario (THEES based on actual measurements) with 150m opening at former
Kai Tak runway
5.8.2 Mitigation of Adverse Impacts
5.8.2.1 The Project operation will not change the THEES effluent flow and load to the Victoria Harbour. Relocation of the existing STSTW to cavern will not cause any adverse water quality impact upon the Victoria Harbour including Kowloon Bay, KTAC and KTTS. The latest mitigation options proposed under the KTD project would significantly improve the water quality in KTAC and KTTS (where the THEES effluent is discharged) for all the key water quality parameters (including SS, BOD, TIN, UIA, DO and sedimentation) as compared to the baseline condition. The KTD project will in fact cause a beneficial cumulative water quality effect in the KTD water, minimizing the pollution level in KTAC and KTTS in the long term. The latest KTD measures (involving water pumping system or runway opening option) would however divert some pollution from KTAC waters to Kowloon Bay, resulting a slight higher pollution level in particular the nutrient level in the Kowloon Bay waters. However, as the overall pollution level in the KTAC would be significantly improved and no exceedance was predicted at the WSRs identified in Kowloon Bay, the overall cumulative water quality impact resulted from the KTD project during the operational phase would be acceptable. Thus, no further mitigation measure is proposed under this Project.
5.8.3 Environmental Monitoring and Audit
5.8.3.1 Under normal operation of THEES, the effluent from the CSTW and TPSTW would be transported to the Victoria Harbour for discharge into the KTN. A 3-month water quality monitoring programme is thus proposed for KTN at a frequency of once per month after commissioning of this Project. The monitoring results should be compared with the routine river water quality monitoring data collected by EPD to verify whether there is any adverse water quality impact at Kai Tak Nullah as compared to that before the implementation of this Project. Monitoring parameters should include DO, SS, BOD, NH3-N, nitrate-nitrogen (NO3-N) and E. coli. Daily effluent monitoring for the same parameters shall also be conducted at both TPSTW and STSTW during the water quality monitoring programme to provide necessary data to assist in identification of the potential impact. In case adverse impact on KTN is identified from the effluent and water quality monitoring results, the operating conditions of the treatment and THEES system should be investigated. In case adverse impact on KTN is identified from this Project with reference to the effluent and water quality monitoring results, the operating conditions of the treatment and THEES system should be investigated, and DSD should extend the water quality monitoring programme for at least three months or as agreed by the Director of Environmental Protection. Details of the monitoring programme are provided in the standalone EM&A Manual.
5.8.3.2
Monitoring of the treated
effluent quality from the CSTW should also be carried out in accordance with
the WPCO license to ensure that the effluent quality would comply with the
design standards, which is under the ambit of RO of EPD.
5.8.4 Residual Impacts
5.8.4.1 This Project would not change the flow and load of the THEES discharges to Victoria Harbour. No unacceptable residual water quality impacts would be expected.
5.9 Operational Effluent Discharges to Tolo Harbour – Normal Plant / THEES Operation
5.9.1 Prediction and Evaluation of Potential Impacts
5.9.1.1
Two modelling scenarios for
Tolo Harbour were simulated for normal operation of the STSTW under the UDS,
namely Scenarios 4 and 5 respectively.
Scenario 4 is the “without Project” condition in the UDS where the
existing partial effluent overflow from TPSTW and existing STSTW (due to the
storm effect and capacity constraint of TPEPS and STEPS) would be continued in
the future. Scenario 5 is the “with
Project” condition in the UDS where the STSTW will be relocated to cavern and
the existing partial effluent overflow from STEPS will be removed, details
refer to Sections 5.6.2.46 to
5.6.2.48 above.
5.9.1.2 The water quality simulation results of the 2 scenarios are presented in Appendix 5.04a as contour plots for DO, BOD, TIN, UIA, E. coli, SS, chlorophyll-a and sedimentation rate. All contour plots in Appendix 5.04a are presented as annual arithmetic averages except for the annual geometric mean E. coli levels, minimum DA DO and minimum bottom DO. The model results at different WSR points are summarized in Appendix 5.05. These WSR points include seawater intakes (WSD’s flushing water intakes and cooling water intake of CUHK), ecological resources (mangroves, SSSI, FCZ and corals), Shuen Wan Typhoon Shelter and Lung Mei Beach as shown in Figure No. 60334056/EIA/5.03. The model results (in Appendix 5.05) for ecological resources, Shuen Wan Typhoon Shelter and Lung Mei Beach are presented as minimum DO, geometric mean E. coli and maximum 5-day moving mean chlorophyll-a over the 1-year simulation period for comparison with the assessment criteria (based on the WQOs specified under the WPCO). In addition, the model results for sedimentation rate (in Appendix 5.05) are presented as maximum values for comparison with the reference sedimentation limit to address the potential sedimentation impact upon the coral communities. The model results for seawater intakes are presented as maximum values (for BOD, NH3-N and E. coli) and minimum value (for DO) to check against the target seawater quality objectives specified by the WSD.
5.9.1.3 The DO levels in Tolo Harbour predicted under Scenarios 4 and 5 are compared in Appendix 5.04a. The DO levels predicted under the 2 scenarios are considered within a similar range. The DO levels predicted at all WSRs would meet the WQO except for the mangrove site at Tolo Pond (M1) where the minimum surface and middle DO was only 1.5 and 3.4 mg/L respectively under the “without Project” scenario (Scenario 4) as compared to the WQO of no less than 4 mg/L (see Appendix 5.05). Operation of this Project (under Scenario 5) would improve the minimum middle DO level at this mangrove site to 3.5 mg/L (by about 1 mg/L). No change in the minimum surface DO at this mangrove site was predicted between the 2 scenarios. The low DO at M1 was mainly contributed from the background pollution loading assumed in the model and not induced by this Project.
Unionized Ammonia / Total Inorganic Nitrogen / Ammonia Nitrogen
5.9.1.4 The UIA and TIN levels predicted under Scenarios 4 and 5 are compared in Appendix 5.04a. Operation of this Project will improve the UIA and TIN level in the Sha Tin Hoi area of the Tolo Harbour. There is no WQO available for UIA and TIN in the marine water of Tolo Harbour. In terms of the NH3-N level, the WSD has specified a target objective for their flushing water intakes. The model results showed that full compliance with the target NH3-N objective would be achieved at the WSD flushing water intakes at Sha Tin (W1) and Tai Po (W2) under both Scenarios 4 and 5. The maximum NH3-N level predicted at W1 and W2 under the “without Project” scenario (Scenario 4) was 0.339 and 0.202 mg/L respectively as compared to the target objective of 1 mg/L (see Appendix 5.05). Operation of this Project (under Scenario 5) would improve the maximum NH3-N level at W1 to 0.242 mg/L as compared to the “without Project” condition of 0.339 mg/L. No significant change in the NH3-N level was however observed at W2 between the 2 scenarios.
Suspended Solids
5.9.1.5 The SS levels predicted under Scenarios 4 and 5 are compared in Appendix 5.04a. Operation of this Project under Scenario 5 would slightly reduce the mean SS level in Sha Tin Hoi waters. There is no WQO available for SS in the marine water of Tolo Harbour. The WSD has however specified a target SS objective for their flushing water intakes. Under the “without Project” scenario (Scenario 4), the maximum SS level predicted at the WSD flushing water intake at Sha Tin (W1) was 11.1 mg/L, which as compared to the WSD’s target objective of no more than 10 mg/L (see Appendix 5.05). Operation of this Project under Scenario 5 would reduce the maximum SS level at W1 to 10.2 mg/L as compared to the objective of 10 m/L. Full compliance with the target SS objective was observed at the WSD flushing water intake at Tai Po (W2) under both scenarios.
Biochemical Oxygen Demand
5.9.1.6 The BOD levels predicted under Scenarios 4 and 5 are compared in Appendix 5.04a. Operation of this Project under Scenario 5 would significantly reduce the mean BOD level in the whole Tolo Harbour and Channel WCZ. There is no WQO available for BOD in the marine water of Tolo Harbour. The WSD has however specified a target BOD objective for their flushing water intakes. Under the “without Project” condition (Scenario 4), the maximum BOD level predicted at W1 and W2 was 12.2 and 10.5 mg/L respectively, as compared to the WSD’s target objective of no more than 10 mg/L. With implementation of this Project (under Scenario 5), the BOD at W1 and W2 would fully comply with the target BOD objective of 10 mg/L (see Appendix 5.05).
5.9.1.7 The E. coli levels predicted under Scenarios 4 and 5 are compared in Appendix 5.04a. No obvious change in the E. coli pattern was observed between the 2 scenarios as seen from the contour plots. The geometric mean E. coli levels predicted in most areas of Tolo Harbour and Channel WCZ including all the FCZs are well below 610 no./100mL under both Scenarios 4 and 6, and complied with the WQO for secondary contact recreation subzone and FCZ. The geometric mean E. coli levels in the outer main channel of Shing Mun River (which are closest to the emergency submarine outfall of STSTW / CSTW) also complied well with the WQO of 610 no./100mL. Also, this Project (Scenario 5) would not cause any increase in the E. coli level in the Shing Mun River, as compared to Scenario 4 (without this Project). The geometric mean E. coli level predicted at Lung Mei Beach (B1) was predicted to be less than 10 no./100mL, which also complied with the beach WQO of 180 no./100mL (see Appendix 5.05). The maximum E.coli levels predicted at the WSD flushing water intakes (W1 and W2) are similar with and without this Project and all the maximum values are less than 1,500 no./100mL, which comply well with the WSD’s target objective of 20,000 no./100mL. E. coli exceedance was only predicted at one isolated WSR, namely the mangrove site at Tolo Pond (M1) where the geometric mean level would be 806 and 787 no./100mL for Scenarios 4 and 5 respectively, as compared to the WQO of no less than 610 no./100mL (see Appendix 5.05). As the exceedance was predicted under both Scenarios 4 (without Project scenario) and 5 (with Project scenario) and the E. coli level would be slightly improved under Scenario 5 (with Project scenario), the E. coli exceedance at M1 was not caused by this Project. No adverse E. coli impact is predicted from the Project operation.
Sedimentation
5.9.1.8 The sedimentation rates predicted under Scenarios 4 and 5 are compared in Appendix 5.04a. No obvious change in the sedimentation pattern was observed between the 2 scenarios as seen from the contour plots. The maximum sedimentation levels predicted in Tolo Harbour including all the coral sites are well below 100 g/m2/day under both scenarios and fully complied with the sedimentation criterion. No adverse sedimentation impact is predicted.
5.9.1.9
Chlorophyll-a is a green
pigment in plant. The level of chlorophyll-a can provide an indication
of algae or phytoplankton concentration in marine water. It should be
highlighted that the presence of algae / chlorophyll-a in water is
generally not harmful. Only their uncontrolled growth as algal bloom or red
tide would adversely affect the environment (refer to Sections 5.8.1.20 to 5.8.1.21 above). The storm and
sewage effluent loading assumed in this modelling exercise does not contain any
chlorophyll-a but is rich in nutrients. As nutrients (e.g. TIN) are
essential components of algal biomass, any nutrient loading to Tolo Harbour
could enhance the algal formation and thus increase the chlorophyll-a levels
in Tolo Harbour. Chlorophyll-a is commonly used as an indicator to show
the tendency of red tide occurrence in the marine water.
5.9.1.10 The chlorophyll-a levels predicted under Scenarios 4 and 5 are compared in Appendix 5.04a. Operation of this Project under Scenario 5 would reduce the chlorophyll-a concentration in the Harbour and Buffer Subzones of the Tolo Harbour and Channel WCZ. Tolo Harbour is a shallow landlocked water body with low water exchange rate and poor flushing capacity, which is susceptible to algal formation and accumulation of algae. Thus, the maximum chlorophyll-a levels at all WSRs are considered high under the “without Project” condition (Scenario 4). Implementation of this Project (Scenario 5) would minimize the chlorophyll-a level at the WSRs. In comparison with the “without Project” levels of 9 - 64 µg/L (under Scenario 4), the maximum chlorophyll-a predicted during operation of this Project (Scenario 5) would be reduced to 8 – 58 µg/L at the WSRs. Thus, this Proejct would potentially minimize the risk of red tide in Tolo Harbour.
5.9.1.11 It should be highlighted that not all WSRs are likely to be adversely affected by high level of chlorophyll-a. Since the primary concern of red tides is oxygen depletion, the key WSRs that are most sensitive to red tides is considered to be the fisheries operations at the FCZs and the sensitive fisheries resources in Tolo Harbour, If the bloom comprises toxin-producing species, the bloom could harm cultured fish or impact their marketability.
5.9.1.12 The water quality model used in this EIA incorporates various physical / biochemical processes. Biochemical processes such as nitrification, algal growth and decay and the decay of organic matter, were all taken into account in the modelling exercise. However, in terms of the effects on oxygen levels, the model results indicates that oxygen levels in the water of the four FCZs (namely F1, F2, F3 and F4 respectively) and the two sensitive fisheries resources (namely potential subzone of Yim Tin Tsai FCZ near Centre Island and important nursery area for commercial fisheries resources at Three Fathoms Cove respectively) would not be depleted under the modelling scenarios. In terms of chlorophyll-a, the maximum levels predicted at these FCZs and sensitive fisheries resources would be minimized from 18 – 36 µg/L (under the “without Project” scenario) to 12 - 25 µg/L (under the “with Project” scenario).
5.9.1.13 It should be noted that the potential impacts upon the two sensitive fishery resources (namely potential subzone of Yim Tin Tsai FCZ near Centre Island and important nursery area for commercial fisheries resources at Three Fathoms Cove respectively) are assessed with reference to the model results for TM4 and F3 respectively as shown in Figure No. 60334056/EIA/5.03. F3 is located at the centre point of the sensitive fishery area, which is considered representative. TM4 is also located near Centre Island but slightly closer to the Project effluent outfall and therefore also considered acceptable in representing the new fishery resource near Centre Island.
Impacts to Mangroves
5.9.1.14 The low DO and high E.coli levels predicted at the mangrove site at Tolo Pond M1 was mainly contributed from the background pollution loading assumed in the model and not induced by this Project as discussed in Sections 5.9.1.3 and 5.9.1.7. This Project would actually improve the DO and E. coli levels at M1 and thus no adverse water quality impact upon this mangrove site is predicted from the Project.
5.9.2 Mitigation of Adverse Impacts
5.9.2.1 The Project operation will improve the water quality in Tolo Harbour as compared to the “without Project” condition. This Project will not cause any adverse water quality impact upon the Tolo Harbour. This Project will in fact have a positive water quality effect in Tolo Harbour, minimizing the pollution level and thus potentially reduce the risk of algal bloom in the Tolo harbour (due to the predicted decrease in the chlorophyll-a and nutrient level) in the long term. No further mitigation measure is recommended for normal plant operation.
5.9.3 Environmental Monitoring and Audit
5.9.3.1 Monitoring of the treated effluent quality from the CSTW should be carried out in accordance with the WPCO license to ensure that the effluent quality would comply with the design standards, which is under the ambit of RO of EPD. No other monitoring programme specific to normal Project operation is considered necessary.
5.9.4 Residual Impacts
5.9.4.1 This Project would not adversely affect the Tolo Harbour water quality under normal plant operation. No unacceptable residual water quality impact is predicted.
5.10 THEES Maintenance Discharge from TPSTW and CSTW to Tolo Harbour
5.10.1 Prediction and Evaluation of Potential Impacts
5.10.1.1 A continuous THEES maintenance discharge for a period of 4 weeks under the UDS was simulated under Scenarios 6a and 6b. During the THEES maintenance period, secondarily treated and disinfected effluent would be discharged from both CSTW and TPSTW. Scenario 6a follows the existing practice where the THEES maintenance events could be scheduled in March (within the algae blooming season identified in this EIA). Scenario 6b however assumed that the THEES maintenance will be avoided in algae blooming season as recommended by this Project, details refer to Sections 5.6.2.49 to 5.6.2.51. The model results for Scenarios 6a and 6b (with THEES maintenance discharge) are compared with the model results for Scenario 5 (normal Project operation without THEES maintenance) to identify the water quality changes due to the THEES maintenance. Scenario 5 (“with Project” condition) is basically same as Scenario 4 (“without Project” condition) except that the existing partial effluent flow from STEPS would be removed under Scenario 5 as discussed in Section 5.6.2.48.
5.10.1.2 The water quality simulation results of Scenarios 6a and 6b are presented in Appendix 5.04a as contour plots for DO, BOD, TIN, UIA, E. coli, SS, chlorophyll-a and sedimentation rate. The model results at different WSRs are summarized in Appendix 5.05. The water quality parameters presented in Appendix 5.04a and Appendix 5.05 are described in Section 5.9.1.2 above.
5.10.1.3 As shown in Appendix 5.04a and Appendix 5.05, the extent of water quality impact is generally larger under the THEES maintenance (Scenarios 6a and 6b) than that of the normal plant operation (under Scenario 5).
5.10.1.4 Although the maintenance discharge event would inevitably cause an increase in pollution levels in Tolo Harbour, it should be highlighted that the potential impact would be reversible. The time for recovery at selected WSRs are presented as time series plots in Appendix 5.04b and Appendix 5.04c for Scenarios 6a and 6b respectively. Selected WSRs include WSD flushing water intakes at Sha Tin (W1) and Tai Po (W2), coral communities at Sha Tin Hoi North (CR16) and Sha Tin Hoi South (CR17), mangrove site at Tolo Pond (M1), fish culture zones at Yam Tin Tsai (F1), Yam Tin Tsai East (F2), Yung Shue Au (F3) and Lo Fu Wat (F4), beach at Lung Mei (B1), coral communities at Tai Po Industrial Estate (CR1) and EPD monitoring stations (TM4 and TM6) as shown in Figure No. 60334056/EIA/5.03. It should be noted that the water quality recovery time at the two sensitive fishery resources (namely potential subzone of Yim Tin Tsai FCZ near Centre Island and important nursery area for commercial fisheries resources at Three Fathoms Cove respectively) are assessed with reference to the time series plots for TM4 and F3 respectively (see Section 5.9.1.13 above).The time series plots for W1, W2, CR16, CR17, F1, F2, F3, F4, B1, TM4 and TM6 are presented for key parameters of concern including TIN, SS, chlorophyll-a, E. coli to illustrate the spatial changes of pollution elevations at WSRs both close to and further away from the maintenance discharge points. In addition, the time series plots also include DO at M1 and BOD (at W1 and W2) to show the water quality recovery trends at these WSR points, which are relatively close to the effluent bypass locations.
Dissolved Oxygen
5.10.1.5 The dissolved oxygen (DO) levels in Tolo Harbour predicted under Scenarios 5, 6a and 6b are compared in Appendix 5.04a. The contour plots showed that the mean DO levels in the inner Tolo Harbour near the TPSTW discharge would slightly increase under the maintenance discharge (Scenarios 6a and 6b) as compared to the baseline mean DO levels under Scenario 5. The THEES maintenance discharge under Scenario 6a would however decrease the minimum DO and minimum bottom DO values predicted over the simulation period in the inner Tolo Habour. Since the bypass of nutrient-rich effluent could simulate algal growth in the receiving water, DO increase may occur during the maintenance discharge period due to photosynthesis of green algae, which could produce oxygen in marine water, and hence, resulting an overall increase in the mean DO level over the simulation period. A decrease in the DO level could however occur after termination of the maintenance discharge due to the degradation of dead algal material when the algal growth is subsided, and thus causing a decrease in the minimum DO levels predicted over the simulation period, whilst the overall mean DO levels over the simulation period could be maintained to above or around the baseline levels. Scenario 6b (THEES maintenance outside algae blooming season) would however cause no obvious change in the pattern of minimum DA DO and minimum bottom DO as compared to the normal condition under Scenario 5.
5.10.1.6 The DO levels predicted at all WSRs under Scenarios 6a and 6b would meet the DO criterion except for the mangrove site at Tolo Pond (M1) where the minimum surface and middle DO would be 1.5 and 3.2 mg/L as well as 1.5 and 3.5 mg/L for Scenarios 6a and 6b respectively, as compared to the WQO of no less than 4 mg/L (see Appendix 5.05). However, the baseline minimum DO under Scenario 5 was also low with a surface and middle value of 1.5 and 3.5 mg/L respectively. Hence, the low DO at M1 was not caused by this Project and is mainly contributed from the background pollution loading. The change in DO at M1 caused by the THEES maintenance is considered small or negligible. The time series plots in Figure 19 of Appendix 5.04b and Appendix 5.04c also showed that the maintenance discharge would not cause any obvious DO decrease at M1. It should also be noted that the DO levels mentioned above represent the minimum values over the entire 1-year simulation period for comparison with the WQO. The time series plots showed that the DO levels at M1 would actually be higher than these minimum values for most of the times. Please also observe the model limitations as stated in Sections 5.6.2.54 and 5.6.2.55.
Unionized Ammonia / Total Inorganic Nitrogen /
Ammonia Nitrogen
5.10.1.7 The unionized ammonia (UIA) and total inorganic nitrogen (TIN) levels predicted under Scenarios 5, 6a and 6b are compared in Appendix 5.04a. The maintenance discharge under Scenarios 6a and 6b would inevitably cause a UIA and TIN increase in the inner Tolo Harbour. There is no WQO available for UIA and TIN in the marine water of Tolo Harbour. In terms of the ammonia nitrogen (NH3-N) level, the WSD has specified a target objective for their flushing water intakes. The maximum NH3-N level predicted at W1 was about 1.1 mg/L under Scenario 6a, which is near the WSD’s target objective of no more than 1 mg/L. However, for comparison, the normal NH3-N level at W1 (under Scenario 5) was only 0.242 mg/L (see Appendix 5.05). For the maintenance event outside algae blooming season (Scenario 6b), the maximum NH3-N level at W1 was reduced to 0.314 mg/L, which is well below the WSD target objective of 1 mg/L. Full compliance of NH3-N was predicted at the remaining WSD flushing water intake at Tai Po (W2) during the maintenance bypass event under Scenarios 5, 6a and 6b. It should be noted that the NH3-N levels mentioned above represent the maximum values over the entire 1-year simulation period. The NH3-N levels would actually be lower than these maximum values for most of the times.
5.10.1.8 As shown in the time series plots in Figures 10 to 12of Appendix 5.04b and Appendix 5.04c, greater TIN impact was found at the WSD flushing water intakes at Sha Tin (W1) and Tai Po (W2), coral communities at Sha Tin Hoi North (CR16) and Sha Tin Hoi South (CR17), which are relatively closer to the discharge points of the effluent bypass. The TIN increase at Yam Tin Tsai FCZ (F1), Yam Tin Tsai East FCZ (F2), Yung Shue Au FCZ / important nursery area for commercial fisheries resources at Three Fathoms Cove (F3), Lo Fu Wat FCZ (F4), beach at Lung Mei (B1), EPD monitoring station (TM6) and potential subzone of Yim Tin Tsai FCZ near Centre Island / EPD monitoring station (TM4), which are further away from the effluent bypass locations, would be less significant. Since the TIN level is the sum of NH3-N and oxidized nitrogen, the time series plots for TIN presented in Appendix 5.04b and Appendix 5.04c can also reflect the recovery period for NH3-N at the WSD flushing water intakes W1 and W2. The time series plots showed that the TIN levels at W1 and W2 would significantly increase during the maintenance discharge event (under Scenario 6a). TIN increase was also observed at W1 and W2 for the maintenance event outside algae blooming season under Scenario 6b but the magnitude of increase is significantly smaller. The TIN levels at W1 and W2 would return to the baseline condition within about 2 weeks after termination of the effluent bypass under both Scenarios 6a and 6b.
5.10.1.9 The suspended solids (SS) levels predicted under Scenarios 5, 6a and 6b are compared in Appendix 5.04a. The maintenance discharge under Scenarios 6a and 6b would not cause any obvious change in the mean SS pattern in the Tolo Harbour as compared to the normal condition under Scenario 5. There is no WQO available for SS in the marine water of Tolo Harbour. The WSD has however specified a target SS objective for their flushing water intakes. The maximum SS levels predicted at the WSD flushing water intakes at Sha Tin (W1) and Tai Po (W2) were 10.7 and 10.8 mg/L (under Scenario 6a), and 11.2 and 10.7 mg/L (under Scenario 6b) respectively, which are slightly above the WSD’s target objective of no more than 10 mg/L. Since the normal SS levels at W1 and W2 under Scenario 5 (of 10.2 and 9.3 mg/L respectively) are already high as compared to the WSD criterion of 10 mg/L., the SS contribution from the effluent bypass is considered small. . It should be noted that the SS levels mentioned above represent the maximum values over the entire 1-year simulation period. The SS levels would actually be lower than these maximum values and meet the SS objective for most of the times.
5.10.1.10 As shown in the time series plots in Figures 13 to 15 of Appendices 5.04b and 5.04c, greater SS increase was observed at W1, W2, CR16 and CR17 under Scenario 6a, whilst the SS increase at F1, F2, F3, F4, TM4, TM6 and B1, which are further away from the maintenance discharge, is less significant. The maintenance event outside algae blooming season (Scenario 6b) would however cause a smaller SS in
5.10.1.11 crease at all the selected WSRs. The time series plots showed that the SS impact at W1 and W2 would return to the normal levels within about 1 month after the end of the discharge period.
Biochemical Oxygen Demand
5.10.1.12 The BOD levels predicted under Scenarios 5, 6a and 6b are compared in Appendix 5.04a. The maintenance discharge under Scenario 6a and 6b would inevitably cause a BOD increase in the Tolo Harbour. There is no WQO available for BOD in the marine water of Tolo Harbour. The WSD has however specified a target BOD objective for their flushing water intakes. The maximum BOD levels predicted at W1 and W2 were 15.9 and 20.3 mg/L respectively under Scenario 6a, which are considered high as compared to the WSD’s target objective of no more than 10 mg/L (see Appendix 5.05). For comparison, the maximum BOD level at W1 and W2 under the normal THEES and Project operation (Scenario 5) was 9.1 and 8.5 mg/L respectively. The maintenance event outside algae blooming season (Scenario 6b) would reduce the maximum BOD level predicted at W1 and W2 to 9.1 and 8.5 mg/L respectively, which is same as the condition under normal THEES and Project operation (Scenario 5) and fully met the BOD criterion. It should be noted that the BOD levels mentioned above represent the maximum values over the entire 1-year simulation period. The BOD levels would actually be lower than these maximum values for most of the times.
5.10.1.13 As shown in the time series plots in Figures 20 and 21 of Appendices 5.04b and 5.04c, the BOD levels at W1 and W2 would increase during and after the maintenance discharge. The time series plots showed that the BOD levels at W1 and W2 would return to a condition similar to the baseline situation within about 2 months after termination of the maintenance discharge under Scenarios 6a, whilst the recovery time under Scenario 6b would be much shorter in 2 weeks after the end of the maintenance discharge.
E. coli
5.10.1.14 The E. coli levels predicted under Scenarios 5, 6a and 6b are compared in Appendix 5.04a. The E.coli levels in Tolo Harbour are predicted to be not significantly changed by the bypass of disinfected effluent. The E. coli pattern simulated under the maintenance discharge (Scenarios 6a and 6b) is similar to that of the normal Project operation (under Scenario 5). The geometric mean E. coli levels predicted in most areas of Tolo Harbour and Channel WCZ including all the FCZs are well below 610 no./100mL under Scenarios 6a and 6b, and fully complied with the WQO for secondary contact recreation subzone and FCZ. The geometric mean E. coli levels in the outer main channel of Shing Mun River (which are closest to the emergency submarine outfall of STSTW / CSTW) also complied well with the WQO of 610 no./100mL. Also, the THEES maintenance discharges (under Scenarios 6a and 6b) would not cause any increase in the E. coli level in the Shing Mun River, as compared to Scenario 5 (without THEES maintenance). The geometric mean E. coli level predicted at Lung Mei Beach (B1) was predicted to be less than 10 no./100mL under both scenarios, which also complied with the beach WQO of 180 mg/L (see Appendix 5.05). The maximum E.coli levels predicted at the WSD flushing water intakes (namely W1 and W2) are similar with and without the maintenance event and all the predicted maximum values are less than 1,500 no./100mL, which comply well with the WSD’s target objective of 20,000 no./100mL. No adverse E. coli impact would be caused by the maintenance discharge.
5.10.1.15 E. coli exceedance was only predicted at one isolated WSR, namely the mangrove site at Tolo Pond (M1) where the geometric mean level would be 803 and 792 no./100mL for Scenarios 6a and 6b respectively, as compared to the WQO of no less than 610 no./100mL (see Appendix 5.05). However, the baseline E. coli under Scenario 5 would also exceed the WQO with geometric mean value of 787 no./100mL. Hence, the E. coli exceedance at M1 was mainly caused by the background pollution loading. The E.coli contribution from the maintenance discharge is considered small.
5.10.1.16 The time series plots in Figures 16 to 18 of Appendices 5.04b and 5.04c also showed that the maintenance discharge would cause no obvious change to the baseline E. coli levels at W1, W2, CR16, CR17, F1, F2, F3, F4, B1, TM4 and TM6.
Sedimentation
5.10.1.17 The sedimentation rates predicted under Scenarios 5, 6a and 6b are compared in Appendix 5.04a. The model predicted that the sedimentation in Tolo Harbour was not adversely affected by the THEES maintenance discharge event. The sedimentation pattern simulated under all the scenarios is similar. The maximum sedimentation levels predicted in Tolo Harbour including all the coral sites are well below 100 g/m2/day under Scenarios 6a and 6b, and fully complied with the sedimentation criterion. No adverse sedimentation impacts would be caused by the maintenance discharge.
Chlorophyll-a
5.10.1.18 Tolo Harbour is a shallow landlocked water body with low water exchange rate and poor flushing capacity, which is susceptible to algal formation and accumulation of algae (see Section 5.9.1.9 above). Hence, the maximum chlorophyll-a levels at all WSRs under normal operation of the THEES in UDS (Scenario 5) is already considered high (see Appendix 5.05). The model predicted that the THEES discharge under the existing practice (Scenario 6a) would further increase the peak levels of chlorophyll-a at the WSRs. In comparison with the normal peak levels of 8 – 58 µg/L (under Scenario 5), the peak chlorophyll-a values predicted at the WSRs under Scenario 6a would range from 11 – 159 µg/L. The largest difference between Scenarios 5 and 6a was found at the coral site at Tai Po Industrial Estate (CR1) with an absolute difference of 77 µg/L. The maximum value of 159 µg/L would however occur at the mangrove site at Tolo Pond (M1). Please also observe the model limitations as stated in Sections 5.6.2.54 and 5.6.2.55. The maintenance event outside algae blooming season (Scenario 6b) would significantly reduce the peak chlorophyll-a values at the WSRs to 8 – 58 µg/L, which is same as the normal range under Scenario 5. The trends of chlorophyll-a during and after the maintenance discharge are illustrated in the time series plots in Figures 01 to 09 of Appendices 5.04b and 5.04c for W1, W2, CR16, CR17, F1, F2, F3, F4, TM4, TM6 and B1.
5.10.1.19 The key WSRs that are most sensitive to red tides is considered to be the fisheries operations at the FCZs and the sensitive fisheries resources in Tolo Harbour (refer to Sections 5.9.1.10 to 5.9.1.13 above), The peak chlorophyll-a values predicted at the four FCZs at Yam Tin Tsai (F1), Yam Tin Tsai East (F2), Yung Shue Au (F3) and Lo Fu Wai (F4) respectively, the potential subzone of Yam Tin Tsai FCZ and the important nursery area for commercial fisheries resources at Three Fathoms Cove would range from 22 – 79 µg/L under the existing practice of THEES maintenance (Scenarios 6a), as compared to the normal situation (Scenario 5) of 12 – 25 µg/L. This Project would optimize the THEES maintenance operation and reduce the peak chlorophyll-a levels at the FCZs and sensitive fisheries resources to a range of 12 – 49 µg/L under Scenario 6b. It should be noted that the chlorophyll-a levels mentioned above represent the maximum 5-day running means over the entire 1-year simulation period. The actual chlorophyll-a levels at these fisheries resources would be varying and the predicted peak chlorophyll-a levels would only occur for a short period of times as indicated in the time series plots in Figures 01 – 09 of Appendices 5.04b and 5.04c.
5.10.1.20 The time series plots in Appendices 5.04b and 5.04c also showed that the chlorophyll-a elevations caused by the THEES maintenance discharge would be reversible. The model predicted that the chlorophyll-a levels can return to the condition similar to the baseline levels within about 1.5 months after termination of the effluent bypass under Scenario 6a, whilst Scenario 6b is predicted to have a shorter recovery time of about 2 weeks after the end of the maintenance discharge.
Discussion on Potential Impacts on WSRs
5.10.1.21 THEES maintenance discharge would increase the NH3-N, SS and BOD levels at the WSD flushing water intakes at Sha Tin (W1) and Tai Po (W2), the chlorophyll-a levels at all WSRs as well as the E. coli levels at the mangrove site (M1) under Scenarios 6a and 6b. The implications of these pollution increases including the potential impacts upon the users of the recreational waters due to the discharge of secondarily treated and disinfected effluent into the Tolo Harbour are discussed in the sections below.
Impact to WSD Flushing Water Intakes (W1 and W2)
5.10.1.22 The THEES maintenance operation outside algae blooming season as recommended under this Project (Scenario 6b) would generally minimize the pollution levels at the flushing water intakes. The NH3-N and BOD exceedances predicted at the flushing water intakes under the existing THEES maintenance practice (Scenario 6a) would be eliminated under this Project with the THEES maintenance discharge outside algae blooming season (Scenario 6b), refer to Sections 5.10.1.7 and 5.10.1.12. However, residual SS impact was still predicted at the flushing water intake under the maintenance event outside algae blooming season. As compared to the target SS standard of 10 mg/L, the maintenance event outside algae blooming season would cause a SS exceedance level of only 1.2 and 0.7 mg/L at W1 and W2 respectively and this degree of SS exceedance is considered minor. Considering that the E. coli bacterial level at the intake points would not be adversely affected by the discharge of disinfected effluent and the SS increase induced by the THEES maintenance discharge would be small as compared to the background levels (see Section 5.10.1.9) and in view that this minor SS exceedance would only occur in a very short period of time and the pollution increase caused by the maintenance discharge would be reversible, no significant environmental / health impacts to the end users of the intake water would be anticipated from the THEES maintenance discharge. As a general measure, to minimize any impact on the flushing water intakes due to planned maintenance discharge, close communication between DSD and WSD is considered to be an effective means. Should it appear necessary, silt screen may be installed at the flushing water intakes to reduce the SS impacts arising from the planned maintenance discharge.
Chlorophyll-a Impacts at Fisheries Resources
5.10.1.23 This Project would optimize the THEES maintenance discharge and reduce the peak chlorophyll-a levels at all important fisheries resources identified in Tolo Harbour as compared to that induced by the existing THEES maintenance practices. This Project would thus have a beneficial effect to the fisheries resources and potentially minimize the risk of red tides during the regular THEES maintenance events (Please also see Section 5.10.1.9 above).
5.10.1.24
It should
however be highlighted that red tides are natural phenomena which occur seasonally in both polluted and unpolluted waters (EPD’s
publication “Marine Water Quality in Hong Kong 2014” refers) and could be induced by many factors other than the availability of
nutrients in marine waters (e.g. availability of sunlight, water
circulation, temperature and wind conditions etc.). Red tide occurrence would
depend on a
combination of different factors including flow condition, light penetration,
salinity distribution, nutrient concentrations, nutrient ratios and species
competition, etc. . Past research studies on long-term water quality data in Hong Kong
suggested that, under favourable environmental conditions (e.g. in stagnant
water, under calm wind condition and with sufficient light energy), red tide
can be trigged at a very low nutrient level.
5.10.1.25 From the past records, the last THEES maintenance event with significant volume of effluent bypass to Tolo Harbour under complete closure of the THEES effluent export tunnel occurred in December 2010. Appendix 5.08 compares the historic chlorophyll-a levels and red tide occurrences recorded in Tolo Harbour from January 2010 to December 2011 (i.e. before, during and after this historic THEES closure period). Other than one THEES closure event in December 2010, no other THEES closure period was recorded in January 2010 to December 2011. The comparison plot showed that, despite the high volume of effluent discharge to Tolo Harbour in December 2010, there is no marked increase in the chlorophyll-a levels and the frequency of red tide occurrence during and after the THEES closure event. Also, no correlation between the chlorophyll-a levels, the red tide occurrences and the historic THEES maintenance discharge is identified from the comparison plot. Thus, the THEES maintenance discharge may not be a critical or major factor for triggering red tide in Tolo Harbour. Nevertheless, specific water quality monitoring programme and mitigation measures are recommended under this Project to minimize any potential water quality impacts during the THEES maintenance discharge as presented in Sections 5.10.2 and 5.10.3 below.
5.10.1.26 It should also be noted that any potential impacts from red tide or harmful algal blooms (HABs) that may arise in the Tolo Harbour is currently managed and responded under the routine red tide monitoring and management protocol and response plan adopted by the government in Hong Kong. AFCD is acting as the coordinator of the Red Tide Reporting Network, to receive reports of red tide, conduct investigation and provide warning of the risk associated and appropriate mitigation measures. The objectives of this red tide monitoring programme are to provide coordination of monitoring and response to red tides/HABs and fish kills and to compile and synthesize data necessary to effectively manage fisheries resources, protect human health and the marine ecosystems. Details of the existing red tide monitoring and management plan are provided in the website (http://www.hkredtide.org/).
5.10.1.27 With implementation of the mitigation measures and monitoring programme recommended under this Project, the potential impacts from the maintenance discharge events would be minimized.
Impact to Mangroves
5.10.1.28 The low DO and high E.coli levels predicted at the mangrove site at Tolo Pond M1 was not caused by this Project and is mainly contributed from the background pollution loading as discussed in Sections 5.10.1.6 and 5.10.1.14. Although the high E. coli and low DO levels were predicted at the mangrove site at Tolo Pond (M1), the natural pollution tolerance (or pollution exclusion) displayed by mangroves is well documented. Past studies of mangroves concluded that the mangrove habitats are able to grow in areas of rich nutrient, low oxygen and high bacteria level and not adversely affected by high pollution loads (including concentrated sewage effluent) [7]. It is considered that the temporary and minor E. coli increase caused by the Project discharge would not adversely affect the mangrove site. No long-term insurmountable water quality impact upon the mangrove site would be caused by the maintenance discharge.
Impacts upon Water Recreational Uses
5.10.1.29 The marine water in Tolo Harbour and Channel WCZ is designated under the WPCO as secondary contact recreation subzone for water sports and water recreational activities. Since all the maintenance discharge effluents would be secondarily treated and disinfected prior to their discharge into the sea, the potential health impact upon the users of the recreational waters could be minimized. As shown in Figure 07 of Appendix 5.04a, the maintenance discharge would not cause any obvious elevation of E. coli levels in Tolo Harbour and Shing Mun River as compared to the baseline condition with full compliance with the WQO for E. coli (≤ 610 no./100mL) in most of the Tolo Harbour and Channel WCZ. As shown in Figure 07 of Appendix 5.04a, the temporary disinfected effluent would not induce any E. coli plume in Tolo Harbour. Thus, no health implication upon the users of the secondary recreational water would be anticipated from the maintenance discharge.
5.10.2 Mitigation of Adverse Impacts
5.10.2.1 THEES is currently in operation and is not proposed under this Project. To maintain proper functioning and integrity of the THEES, regular inspection and maintenance of the THEES system are inevitable under the existing practice. It should be highlighted that this Project will not change the frequency, flow and load of the existing THEES maintenance discharge. In fact, a number of additional mitigation measures (which are not adopted under the existing practice) are proposed under this Project to further minimize the water quality impact. These measures are described as follows.
5.10.2.2 Relevant government departments including EPD, WSD and AFCD as well as key stakeholders for mariculture and fisheries in Tolo Harbour should be informed of the THEES maintenance event prior to any THEES maintenance discharge.
5.10.2.3 It is also recommended under this Project that any THEES maintenance period should be shortened as far as possible and should be avoided in the algae blooming season (i.e. January to May).
5.10.3 Environmental Monitoring and Audit
5.10.3.1 Marine water quality monitoring is recommended in Tolo Harbour for THEES maintenance during both construction and operational phases of this Project. Marine water quality parameters such as SS, BOD, E.coli, chlorophyll-a, TIN, UIA and NH3-N should be monitored. A seven-month baseline monitoring programme covering the period from June to December (outside the algae blooming season) is proposed at a frequency of twice per month to establish the baseline water quality conditions at selected monitoring points. In case of THEES maintenance during the construction and operational phases of this Project, marine water quality in Tolo Harbour should be monitored at a frequency of 3 times per week throughout the maintenance period until the baseline water quality is restored or at least 1 month after termination of the effluent bypass (whichever is longer).
5.10.3.2 The monitoring programme for THEES maintenance during the construction and operational phases of this Project as discussed above shall continue in the first 3 years after commissioning of this Project. After 3 years of post-Project commissioning period, a review shall be conducted by DSD to determine whether such monitoring shall be continued. The review results shall be submitted to EPD, AFCD, WSD and other relevant parties. Any amendment on the monitoring programme shall be agreed by EPD, AFCD and WSD. Details of the monitoring programme and an event and action plan for the THEES maintenance are provided in the standalone EM&A Manual.
5.10.4 Residual Impacts
5.10.4.1
This Project would optimize
the existing THEES maintenance works to improve the water quality during the
THEES maintenance. No unacceptable residual water quality impacts are
anticipated from the Project.
5.11 Emergency Discharge from STSTW to Tolo Harbour
5.11.1 Evaluation and Prediction of Potential Impacts
5.11.1.1 Emergency discharge due to emergency situations (e.g. power / treatment failure) may occur at the existing STSTW and future CSTW. This Project would only involve relocation of the existing STSTW into caverns and would not change the flow, load and location of the emergency discharge as well as the chance of occurrence for the emergency discharge. Scenario 7 assumed that an emergency discharge from the STSTW would occur for a period of 6 hours in case of power or plant failure. In case of power failure, the emergency discharge from STSTW would still be subject to settlement / sedimentation prior to the discharge and thus would represent primarily treated sewage effluent. However, the quality of the emergency discharge is assumed under this scenario to be similar to that of the crude sewage for conservative assessment.
5.11.1.2 The model results for Scenario 7 are presented in Appendix 5.05 for DO, UIA, NH3-N, TIN, SS, BOD, E.coli, chlorophyll-a and sedimentation rate. The water quality parameters presented in Appendix 5.05 are also described in Section 5.9.1.2 above. Contour plots (e.g. in terms of annual mean value or maximum level) are not considered an effective means to illustrate the potential impact of this short-term discharge and therefore not included for this scenario.
Dissolved Oxygen
5.11.1.3 Full compliance of DO was predicted at all WSRs under Scenario 7 except for the mangrove site at Tolo Pond (M1) where the minimum surface and middle DO was only 1.5 and 3.5 mg/L respectively, as compared to the WQO of no less than 4 mg/L (see Appendix 5.05). However, under the normal operation of the Project (Scenario 5), the background minimum DO level at M1 was also 1.5 and 3.5 mg/L for surface and middle value respectively. The short-term emergency discharge would contribute zero impact upon the minimum DO predicted at this mangrove site. No adverse DO impact would be induced by the emergency discharge.
Unionized Ammonia / Total Inorganic Nitrogen / Ammonia Nitrogen
5.11.1.4 The short-term discharge under Scenario 7 would cause zero or negligible impact upon the predicted mean UIA and TIN level at all identified WSRs as compared to the normal plant operation under Scenario 5. There is no WQO available for UIA and TIN in the marine water of Tolo Harbour. In terms of the ammonia nitrogen (NH3-N) level, the WSD has specified a target objective for their flushing water intakes. The model results showed that the maximum NH3-N level predicted at the WSD flushing water intake at Sha Tin (W1) and Tai Po (W2) (under Scenario 7 with emergency discharge) was 0.464 and 0.201 mg/L respectively, which complied well with the target objective of 1 mg/L.
Suspended Solids
5.11.1.5 The short-term discharge under Scenario 7 would cause zero or negligible impact upon the predicted mean SS level at all identified WSRs as compared to the normal plant operation under Scenario 5 as shown in Appendix 5.05. There is no WQO available for SS in the marine water of Tolo Harbour. The WSD has however specified a target SS objective for their flushing water intakes. The maximum SS level predicted at the WSD flushing water intake at Sha Tin (W1) under the emergency discharge event (Scenario 7) was 10.3 mg/L, which is slightly above the WSD’s target objective of no more than 10 mg/L. However, under the normal operation of the Project (Scenario 5), the maximum SS level at W1 of 10.2 mg/L is already considered high as compared to the SS objective. The emergency discharge would induce only a 0.1 mg/L or negligible SS increase at this intake point. Full compliance with the SS objective would be achieved at the WSD flushing water intake at Tai Po (W2) under the emergency discharge event (Scenario 7).
Biochemical Oxygen Demand
5.11.1.6 The short-term discharge under Scenario 7 would cause zero or negligible impact upon the predicted BOD level in Tolo Harbour. There is no WQO available for BOD in the marine water of Tolo Harbour. The WSD has however specified a target BOD objective for their flushing water intakes. The maximum BOD level predicted at W1 and W2 was 9.1 and 8.7 mg/L respectively under the emergency discharge event (Scenario 7), which complied with the WSD’s target objective of 10 mg/L (see Appendix 5.05). No adverse BOD impact is predicted in Tolo Harbour.
E. coli
5.11.1.7 The short-term discharge under Scenario 7 would cause only a minor increase in the geometric mean E. coli levels in Tolo Harbour and Shing Mun River. The geometric mean E. coli levels predicted in most areas of Tolo Harbour and Channel WCZ including all the FCZs are still well below the WQO of 610 no./100mL for secondary contact recreation subzone and FCZ. The geometric mean E. coli levels in the outer main channel of Shing Mun River (which are closest to the emergency submarine outfall of STSTW / CSTW) also complied well with the WQO of 610 no./100mL. Also, the emergency discharges (Scenario 7) would not cause any obvious change in the annual geometric mean E. coli levels in the Shing Mun River, as compared to Scenario 5 (without emergency discharge). The geometric mean E. coli level predicted at Lung Mei Beach (B1) was predicted to be less than 10 no./100mL, which also complied with the beach WQO of 180 no./100mL (see Appendix 5.05). The short-term discharge of primarily treated sewage would however inevitably induce a significant E. coli elevation at the WSR points close to the discharge point. The maximum E.coli level predicted at the WSD flushing water intake at Sha Tin (W1) would reach 27,020 no./100mL under the emergency situation, as compared to the WSD’s target limit of 20,000 no./100mL. The maximum value predicted at the WSD flushing water intake at Tai Po (W2) was below 1,100 no./100mL, which is well below the WSD’s target objective of 20,000 no./100mL. It is however believed that WSD would provide necessary treatment including disinfection for the seawater extracted from the flushing water intakes and hence the potential health / environmental implications to the end users of these flushing waters would be minimized.
Sedimentation
5.11.1.8 The short-term discharge under Scenario 7 would cause negligible impact upon the maximum sedimentation rates in Tolo Harbour as shown in Appendix 5.05. The maximum sedimentation levels predicted in Tolo Harbour including all the coral sites are still less than 100 g/m2/day under Scenario 7, and fully complied with the sedimentation criterion. No adverse sedimentation impacts would be caused by the emergency discharge.
Chlorophyll-a
5.11.1.9 The short-term discharge under Scenario 7 would cause only a minor impact upon the maximum chlorophyll-a levels in Tolo Harbour as shown in Appendix 5.05. In comparison with the normal situation (under Scenario 5), the emergency discharge (under Scenario 7) would cause a chlorophyll-a increase at 3 WSR points, namely the coral site at Tai Po Industrial Estate (CR1), coral site at Whitehead Peninsula (CR16) and the mangrove site at Tolo Pond (M1) respectively. The emergency discharge would increase the maximum chlorophyll-a predicted at CR1, CR6 and M1 by only 1 - 4 µg/L respectively as compared to the normal level (under Scenario 5) of 17 - 58 µg/L. The chlorophyll-a level predicted in all the remaining WSRs including the FCZs and sensitive fisheries resources are found to be not affected by the emergency discharge.
Time Series Results at Selected WSRs
5.11.1.10 In order to identify the worst case scenarios for the emergency discharge, four separate model runs have been conducted to simulate the impacts for four temporary discharge periods centred at namely neap tide high water, neap tide low water, spring tide mid-flood and spring tide mid-ebb respectively under both wet and dry seasons. The impacts under different discharge scenarios were reviewed to identify the worst discharge situations in both dry and wet seasons, which would occur in spring tide mid-ebb and neap tide low water respectively. The time for recovery under the worst discharge situations at selected WSRs are presented as time series plots in Appendix 5.04d and Appendix 5.04e. Selected WSRs include WSD flushing water intakes at Sha Tin (W1) and Tai Po (W2), coral communities at Sha Tin Hoi North (CR16) and Sha Tin Hoi South (CR17), mangrove site at Tolo Pond (M1), fish culture zones and sensitive fisheries resources (F1, F2, F3, F4 and TM4, refer to Sections 5.9.1.13 and 5.10.1.4 above), beach at Lung Mei (B1) and EPD marine water quality monitoring station (TM6) as shown in Figure No. 60334056/EIA/5.03. The time series plots for W1, W2, CR16, CR17, F1, F2, F3, F4, B1, TM4 and TM6 are presented for key parameters of concern including TIN, SS, chlorophyll-a and E. coli to illustrate the spatial changes of pollution elevations at WSRs both close to and further away from the emergency discharge point. The time series plots for W1 and W2 are also presented for BOD to compare with the WSD target objective for BOD. As a relatively low DO level was only predicted at M1, the time series plot for DO was only presented for M1.
5.11.1.11 As shown in the time series plots, the chlorophyll-a levels at all selected WSRs are not sensitive to the emergency discharge. The model results showed that the discharge would not induce any obvious elevation of chlorophyll-a at all the selected WSR points.
5.11.1.12 Elevation of TIN, SS and E. coli was however observed at only three WSR points close to the emergency discharge, namely W1, CR16 and CR 17 respectively. Some elevation of TIN, SS and E. coli was observed at W1, CR16 and CR17 right after the emergency discharge. The TIN and SS levels at W1, CR16 and CR17, however, would be recovered to the baseline normal condition within about 2 weeks and a few days after termination of the emergency discharge for dry and wet seasons respectively. For the E. coli level at W1, C16 and C17, the background normal condition would be recovered within a few days after termination of the emergency discharge under both dry and wet seasons. The TIN, SS and E. coli levels at the distant WSRs (namely W2, F1, F2, F3, F4, B1, TM4 and TM6) is found not to be elevated during or after the emergency discharge event.
5.11.1.13 The time series plots also showed the BOD level at W1 and W2 and the DO level at M1 would not be significantly changed during and after the emergency discharge period.
5.11.2 Mitigation of Adverse Impacts
5.11.2.1 Emergency discharges from the Project would be the consequence of complete pump failure, interruption of the electrical power supply or failure of treatment units. Dual power supply or ring main supply from CLP should be provided to prevent the occurrence of power failure. In addition, standby facilities for the main treatment units and standby equipment parts / accessories should also be provided in order to minimize the chance of emergency discharge. CLP should be consulted in order to ascertain the power supply for normal plant operation within the caverns. It is recommended that government departments including EPD, WSD and AFCD as well as the key stakeholders for mariculture and fisheries in Tolo Harbour should be informed as soon as possible in case of any emergency discharge so that appropriate actions can be taken. In view of the potential E. coli elevation at the WSD flushing water intake at Sha Tin (W1), WSD may also consider, should it appear necessary, to shut down the Sha Tin seawater pumping station for a short period of time in case of emergency discharge in order to minimize any adverse impacts.
5.11.2.2 To provide a mechanism to minimise the impact of emergency discharges and facilitate subsequent management of any emergency, a contingency plan has been formulated to set out the emergency response procedure and actions to be followed in case of equipment or sewage treatment works failure. The existing contingency plan is attached in Appendix 5.07. The plant operators of CSTW should carry out necessary follow-up actions according to the procedures of this existing contingency plan to minimize any impact on the identified WSRs due to emergency bypass.
5.11.3 Environmental Monitoring and Audit
5.11.3.1 A contingency plan has been formulated for the existing STSTW to set out the emergency response procedure and actions to be followed in case of equipment or sewage treatment works failure. The plant operators of CSTW should carry out necessary follow-up actions according to the procedures of this existing contingency plan to minimize any impact on the identified WSRs due to emergency bypass.
5.11.3.2 Marine water quality monitoring is also recommended in Tolo Harbour for emergency discharge during operational phase of this Project. Marine water quality parameters such as SS, BOD, E.coli, chlorophyll-a, TIN, UIA and NH3-N should be monitored. A one-year baseline monitoring programme covering both dry and wet seasons is proposed at a frequency of twice per month to establish the baseline water quality conditions at selected monitoring points. In case of emergency discharge during the operational phase of this Project, marine water quality in Tolo Harbour should be monitored daily throughout the emergency discharge period until the baseline water quality is restored or at least 2 weeks after termination of the discharge (whichever is longer).
5.11.3.3 The monitoring programme for emergency discharge during the operational phase of this Project as discussed above shall continue in the first 3 years after commissioning of this Project. After 3 years of post-Project commission period, a review shall be conducted by DSD to determine whether such monitoring shall be continued. The review results shall be submitted to EPD, AFCD, WSD and other relevant parties. Any amendment on the monitoring programme shall be agreed by EPD, AFCD and WSD. Details of the monitoring programme and an event and action plan for the emergency discharge are provided in the standalone EM&A Manual.
5.11.4 Residual Impacts
5.11.4.1 No unacceptable residual water quality impacts are anticipated from the emergency discharge with the above mitigation measures implemented.
5.12 Operational Impact - Wastewater from Sludge Treatment
5.12.1 Evaluation and Prediction of Potential Impacts
5.12.1.1 During the operational phase, sludge from the CSTW will be dewatered by the dewatering facilities at the CSTW. Wastewater from the dewatering process will be fed back into the STSTW for treatment. There is no discharge of wastewater from the dewatering process. No adverse water quality impact associated with the wastewater from sludge treatment would be expected.
5.12.2 Mitigation of Adverse Impacts
5.12.2.1 No adverse water quality impact is identified from the sludge treatment process. Mitigation measures specific to the sludge treatment is considered not necessary.
5.12.3 Environmental Monitoring and Audit
5.12.3.1 No adverse water quality impact is identified from the sludge treatment process. Water quality monitoring specific to the sludge treatment is considered not necessary.
5.12.4 Residual Impacts
5.12.4.1 No unacceptable residual water quality impact would arise from the sludge treatment process.
5.13 Operational Impact - Non-point Source Storm Pollution
5.13.1 Evaluation and Prediction of Potential Impacts
5.13.1.1 Other potential source of impact on water quality during the operational phase would be non-point source surface runoff from the open paved areas including the access road and main and secondary portals of the cavern development. Based on the paved area of approximately 0.035 km2 and a runoff coefficient of 1, the total peak runoff generated from the Project sites would be in the order of about 7,400 m3 per hour under a 10-year-return-period rainstorm and design duration of 5 minutes according to the Stormwater Drainage Manual of the DSD. The surface runoff may contain small amount of oil and grit that may cause water quality impacts to the nearby receiving inland waters. However, impacts upon water quality will be minimal provided that a proper drainage system will be provided to receive surface run-off at the planning and design stages. With proper implementation of recommended mitigation measures and best management practices described in Section 5.13.2, adverse impact associated with the discharge of runoff is not anticipated.
5.13.2 Mitigation of Adverse Impacts
5.13.2.1 The design of the operational stage mitigation measures for the Project shall take into account the guidelines published in ProPECC PN 5/93 “Drainage Plans subject to Comment by the EPD”.
5.13.2.2 Best Management Practices (BMPs) to reduce storm water and non-point source pollution are also proposed as follows:
Design Measures
·
Exposed
surface shall be avoided within the road and portal sites to minimize soil
erosion. The access road and the
portal areas shall be either hard paved or covered by landscaping area where
appropriate.
· The streams near the Project site will be retained to maintain the original flow path. The drainage system will be designed to avoid flooding.
· Green areas / planting etc. should be introduced alongside the access road and within the portal areas, as far as possible, to minimize runoff pollution.
Devices/ Facilities to Control Pollution
5.13.2.3 In addition to the above, the following devices/ facilities should be incorporated into the design:
·
Screening
facilities such as standard gully grating and trash grille, with spacing which
is capable of screening off large substances such as fallen leaves and rubbish
should be provided at the inlet of drainage system.
·
Road gullies
with standard design and silt traps should be provided to remove particles
present in stormwater runoff, where appropriate.
Administrative Measures
5.13.2.4 Good management measures such as regular cleaning and sweeping of road surface/ open areas are suggested. The road surface/ open area cleaning should also be carried out prior to occurrence rainstorm.
5.13.2.5 Manholes, as well as stormwater gullies, ditches provided at the Project site should be regularly inspected and cleaned (e.g. monthly). Additional inspection and cleansing should be carried out before forecast heavy rainfall.
5.13.3 Environmental Monitoring and Audit
5.13.3.1 No adverse water quality impacts are anticipated from the non-point source pollution with the above mitigation measures implemented. Water quality monitoring specific to the non-point source pollution is not necessary
5.13.4 Residual Impacts
5.13.4.1 No unacceptable residual water quality impacts are anticipated from the non-point source pollution with the above mitigation measures implemented.
5.14 Conclusion
5.14.1 Construction Phase
Land-based Construction
5.14.1.1 Minor water quality impact would be associated with land-based construction. Impacts may result from the surface runoff, accidental spillage, sewage from on-site construction workers and groundwater infiltration. Impacts could be controlled to comply with the WPCO standards by implementing the recommended mitigation measures.
THEES Connection Works
5.14.1.2 Both the existing TPSTW and existing STSTW are secondary treatment plants with disinfection process. Under the normal operation of the THEES, the TPEPS would pump the secondarily treated and disinfected effluent of TPSTW via a rising main and a submarine pipeline to the STEPS. The STEPS would receive the secondarily treated and disinfected effluent from both TPSTW and STSTW for combined discharge to the KTN in the Victoria Harbour WCZ.
5.14.1.3 In order to maintain the current arrangement in discharging effluent to KTN through THEES tunnel, provision of a dry construction zone within the THEES tunnel to allow connection to the CSTW would be essential for the Project. The necessary construction activities for the THEES connection works would include pre-inspection of the THEES tunnel, modification of the existing THEES inlet chamber and strengthening works to the existing THEES tunnel. During the connection works, the THEES Tunnel needs to be temporarily suspended from its normal operation with effluent bypasses into the Tolo Harbour.
5.14.1.4 Under the existing practice, regular inspection and repair of the THEES would be carried out when necessary to maintain proper functioning and integrity of the THEES. During each THEES maintenance event, secondarily treated and disinfected effluent from TPSTW and STSTW would be temporarily discharged to the Tolo Harbour to provide a dry zone within the THEES tunnel for a maximum duration of 4 weeks. To avoid cumulative water quality impact to Tolo Harbour, the necessary THEES connection works required for this Project will be split into smaller sections and each section will be arranged to be undertaken within the regular THEES maintenance windows for a duration not longer than 4 weeks each outside the algae blooming season (January to May) and the frequency of THEES maintenance will be no more than once per year during the construction phase of the Project. Therefore, no additional cumulative water quality effect on the Tolo Harbour waters would be resulted from the proposed THEES connection works.
5.14.2 Operational Phase
5.14.2.1 The Project effluent together with the TPSTW effluent will be discharged to the Victoria Harbour under the THEES during normal operation. It should be highlighted that the existing STSTW already has a design flow capacity of 340,000m3 per day and this existing design capacity as well as the existing effluent design standard of STSTW will be retained for the CSTW. Hence, this Project will not induce any change to the flow and loading of THEES effluent to the Victoria Harbour.
5.14.2.2 Maintenance of the THEES tunnel is required to ensure proper functioning and integrity of the tunnel. During the inspection or maintenance of the THEES tunnel, temporary suspension of the normal THEES operation with effluent bypass into the Tolo Harbour is unavoidable to provide a safe and dry zone within the THEES tunnel for the necessary inspection / maintenance works. Since the THEES is currently in operation, the temporary effluent bypass under normal THEES maintenance is not induced by this Project.
5.14.2.3 Mathematical modelling was undertaken under this EIA to study the water quality impact arising from a 4-week THEES maintenance discharge in algae blooming season (January to May) under the ultimate development scenario. The model results indicated that the pollution level in Tolo Harbour would be increased during the maintenance period, but the pollution elevation associated with the maintenance discharge would be reversible.
5.14.2.4 The current design capacity, effluent design standards and effluent discharge points of the existing STSTW will be retained for the CSTW. This Project will not change the flow, load and discharge points of THEES effluents to Victoria Harbour and Tolo Harbour. The flow, load and discharge points of THEES would be the same with and without this Project. Thus, no adverse water quality in both Victoria Harbour and Tolo Harbour would arise from this Project.
5.14.2.5 In order to further minimize the water quality impact, it is recommended under this Project to schedule the THEES maintenance outside the algae blooming season (January to May). The water quality model predicted that the pollution elevation in Tolo Harbour and the associated water quality recovery period would be significantly reduced and minimized for the THEES maintenance discharge outside algae blooming season (January to May). An event and action plan and a water quality monitoring programme (as presented in the standalone EM&A Manual) is also proposed for the THEES maintenance events during both construction and operational phases to minimize the water quality impacts.
5.14.2.6 Emergency discharges from the Project would be the consequence of pump failure, interruption of the electrical power supply or failure of treatment units. Mitigation measures, including dual power supply or ring main supply from CLP, standby pumps, treatment units and equipment, would be provided to avoid the occurrence of any emergency discharge. A contingency plan has also been formulated to minimize the impact of emergency discharges and facilitate subsequent management of the emergency. An event and action plan and a water quality monitoring programme (as presented in the standalone EM&A Manual) is also proposed for the emergency discharge events during operational phase to minimize the water quality impacts.
<End of
Section 5>