4.1 Environmental Legislation and Guidelines
4.3 Identification of Air Sensitive Receivers
4.4 Identification of Potential Air Quality Impacts
4.6 Construction Phase Assessment Methodology
4.7 Operational Phase Assessment Methodology
4.8 Construction Air Quality Assessment
4.9 Operational Air Quality Assessment
4.11 Environmental Monitoring and Audit
4. Air Quality
4.1 Environmental Legislation and Guidelines
·
Limit
the contamination of the air in
· Ensure that the AQOs for 7 common air pollutants are met as soon as possible.
4.1.2.2 The AQOs stipulate concentrations for a range of pollutants namely sulphur dioxide (SO2), total suspended particulates (TSP), respirable suspended particulates (RSP), nitrogen dioxide (NO2), carbon monoxide (CO), photochemical oxidants (as ozone) and lead (Pb). The AQOs are shown in Table 4.1.
Table 4.1
|
Pollutant |
Concentration(i) mg/m3 Averaging Time |
||||
|
1 Hour(ii) |
8 Hours(iii) |
24 Hours(iii) |
3 Months(iv) |
1 Year(iv) |
|
|
|
800 |
– |
350 |
– |
80 |
|
Total Suspended Particulates (TSP) |
– |
– |
260 |
– |
80 |
|
Respirable Suspended Particulates (RSP)(v) |
– |
– |
180 |
– |
55 |
|
Nitrogen Dioxide (NO2) |
300 |
– |
150 |
– |
80 |
|
Carbon Monoxide (CO) |
30,000 |
10,000 |
– |
– |
– |
|
Photochemical Oxidants (as ozone(vi)) |
240 |
– |
– |
– |
– |
|
Lead |
|
|
|
1.5 |
|
(i) Measured at 298K (25°C) and 101.325 kPa (one atmosphere)
(ii) Not to be exceeded more than 3 times per year
(iii) Not to be exceeded more than once per year
(iv) Arithmetic means
(v) RSP means suspended particulates in air with a nominal aerodynamic diameter of 10μm and smaller
(vi) Photochemical oxidants are determined by measurements of ozone only
4.1.2.3 The EIAO-TM stipulates that the hourly total suspended particulates (TSP) level should not exceed 500 mg/m3 (measured at 25°C and one atmosphere) for construction dust impact assessment. Standard mitigation measures for construction sites are specified in the Air Pollution Control (Construction Dust) Regulation. Notifiable and regulatory works are also under the control of the Air Pollution Control (Construction Dust) Regulation, to which the Environmental Protection Department should be informed.
4.1.3 Tunnel Air Quality Guidelines
4.1.3.1 Air pollutant concentration of various common vehicular gaseous emissions recommended in Tunnel Air Quality Guidelines specified under the EPD’s Practice Note on Control of Air Pollution in Vehicle Tunnel 1995 should not be exceeded inside road tunnels or full noise enclosures. Table 4.2 presents the Tunnel Air Quality Guidelines values.
Table 4.2 Tunnel Air Quality Guidelines
|
Air Pollutant |
Averaging Time (min) |
Maximum Concentration |
|
|
μg/m3 |
ppm |
||
|
Carbon Monoxide (CO) |
5 |
115,000 |
100 |
|
Nitrogen Dioxide (NO2) |
5 |
1,800 |
1 |
|
Sulphur Dioxide (SO2) |
5 |
1,000 |
0.4 |
All limits are expressed at reference conditions of 298K and 101.325kPa
4.2.1 Background
4.2.2 North Lantau
4.2.2.1 The proposed southern landing of TM-CLKL is located in a rural area of North Lantau where small village houses are predominant. There are no major industrial activities within the area, except the MRTC Siu Ho Wan Depot and two industrial stacks located on the Airport Island. It should also be noted that some major air pollution sources exist further away from the study area in north Lantau including the Black Point Power Station, Castle Peak Power Station and Lamma Power Station. Notwithstanding the above, the area does contain both Hong Kong International Airport and the North Lantau transport corridor, both of which would be key air pollution sources for this study area.
4.2.2.2 The nearest EPD AQMS is located in Tung Chung and its latest five years of air quality statistics, i.e. 2003 to 2007, are summarised in Table 4.3 below, to show the trend of the air quality in the North Lantau.
Table 4.3 EPD Air Quality Monitoring Data at Tung Chung Station (2003- 2007)
|
Pollutant |
Year |
Highest 1-hour Average (µg/m3) |
Highest Daily Average (µg/m3) |
Annual Average (µg/m3) |
|
Tung Chung |
Tung Chung |
Tung Chung |
||
|
NOx |
2003 |
493 |
255 |
65 |
|
2004 |
472 |
292 |
76 |
|
|
2005 |
782 |
349 |
75 |
|
|
2006 |
466 |
321 |
75 |
|
|
2007 |
414 |
210 |
71 |
|
|
Annual Average in the Latest Five Year |
525 |
285 |
72 |
|
|
NO2 |
2003 |
298 |
166 |
45 |
|
2004 |
289 |
166 |
52 |
|
|
2005 |
268 |
147 |
46 |
|
|
2006 |
253 |
157 |
47 |
|
|
2007 |
248 |
127 |
46 |
|
|
Annual Average in the Latest Five Year |
271 |
153 |
47 |
|
|
O3 |
2003 |
303 |
127 |
43 |
|
2004 |
403 |
138 |
48 |
|
|
2005 |
357 |
140 |
38 |
|
|
2006 |
302 |
107 |
37 |
|
|
2007 |
308 |
117 |
40 |
|
|
Annual Average in the Latest Five Year |
335 |
126 |
41 |
|
|
|
|
|
|
|
|
TSP |
2003 |
N/A |
225 |
70 |
|
2004 |
N/A |
176 |
72 |
|
|
2005 |
N/A |
261 |
65 |
|
|
2006 |
N/A |
254 |
75 |
|
|
2007 |
N/A |
240 |
70 |
|
|
Annual Average in the Latest Five Year |
N/A |
231 |
70 |
|
|
RSP |
2003 |
458 |
210 |
54 |
|
2004 |
389 |
209 |
62 |
|
|
2005 |
366 |
217 |
57 |
|
|
2006 |
314 |
160 |
51 |
|
|
2007 |
314 |
199 |
54 |
|
|
Annual Average in the Latest Five Year |
368 |
199 |
56 |
Note: N/A – Not Applicable.
Shaded area – Monitoring results exceeded the criteria of AQO.
4.2.2.3 The air quality data in Table 4.3 shows that the 1-hour and annual averages for NO2, annual averages for TSP are all below the levels set by the AQO. However, the daily average for NO2, 1-hour average for O3, daily average for TSP, and daily and annual averages for RSP at Tung Chung exceed the AQO levels.
4.2.3 Tuen Mun
4.2.3.1 The proposed northern landing of the TM-CLKL is located within the Tuen Mun airshed. The land uses within the assessment area consists predominately of industrial establishments and recreational facilities. Traffic emissions from the nearby roads (e.g. Lung Mun Road and Lung Fu Road) and marine vessels (e.g. at River Trade Terminal) would be the major pollutant sources within the study area, whilst emissions from the industrial establishments in the vicinity would also be a potential source of air pollution. It should also be noted that some major air pollution sources are adjacent to the study area in Tuen Mun which include Black Point Power Station, Castle Peak Power Station, flare for the Pillar Point Valley Landfill, industrial uses at Tuen Mun Area 38 (e.g. Green Island Cement, Ecopark and Shiu Wing Steel Mill). There are three chimneys identified within 500m of the study area which are the chimneys of Butterfly Beach Laundry. The nearest EPD AQMS is located in Yuen Long and its air quality statistics in 2003-2007 are summarised in Table 4.4 to represent the background air quality in the Tuen Mun Area.
Table 4.4 EPD Air Quality Monitoring Data at Yuen Long Station (2003-2007)
|
Pollutant |
Year |
Highest 1-hour Average (µg/m3) |
Highest Daily Average (µg/m3) |
Annual Average (µg/m3) |
|
Yuen Long |
Yuen Long |
Yuen Long |
||
|
NOx |
2003 |
N/A |
N/A |
N/A |
|
2004 |
819 |
364 |
123 |
|
|
2005 |
882 |
353 |
114 |
|
|
2006 |
754 |
416 |
110 |
|
|
2007 |
597 |
288 |
104 |
|
|
Annual Average in the Latest Five Year |
763 |
355 |
113 |
|
|
NO2 |
2003 |
267 |
144 |
60 |
|
2004 |
317 |
166 |
67 |
|
|
2005 |
245 |
145 |
58 |
|
|
2006 |
307 |
198 |
58 |
|
|
2007 |
279 |
137 |
55 |
|
|
Annual Average in the Latest Five Year |
283 |
158 |
60 |
|
|
O3 |
2003 |
218 |
120 |
31 |
|
2004 |
289 |
102 |
35 |
|
|
2005 |
313 |
133 |
32 |
|
|
2006 |
335 |
116 |
32 |
|
|
2007 |
327 |
119 |
36 |
|
|
Annual Average in the Latest Five Year |
296 |
118 |
33 |
|
|
TSP |
2003 |
N/A |
389 |
98 |
|
2004 |
N/A |
320 |
113 |
|
|
2005 |
N/A |
252 |
104 |
|
|
2006 |
N/A |
448 |
101 |
|
|
2007 |
N/A |
304 |
97 |
|
|
Annual Average in the Latest Five Year |
N/A |
343 |
103 |
|
|
RSP |
2003 |
377 |
227 |
61 |
|
2004 |
366 |
225 |
71 |
|
|
2005 |
354 |
212 |
62 |
|
|
2006 |
293 |
246 |
62 |
|
|
2007 |
341 |
207 |
64 |
|
|
Annual Average in the Latest Five Year |
346 |
223 |
64 |
Note: N/A – Not Applicable.
Shaded area – Monitoring results exceeded the criteria of AQO.
4.2.3.2 The air quality data in Table 4.4 shows that the annual NO2 is below the level set by the AQO. However, the 1-hour and daily NO2, 1-hour O3, daily and annual TSP, and the daily and annual RSP at Yuen Long exceed the AQO levels.
4.3 Identification of Air Sensitive Receivers
4.3.1.1 Air Sensitive Receivers (ASRs) are identified in accordance with Annex 12 of the TM-EIAO, including any domestic premises, hotels, hostels, hospitals, medical clinics, nurseries, temporary housing accommodation, schools, educational institutions, offices, factories, shops, shopping centres, places of public worship, libraries, courts of law, sports stadiums or performing arts centres.
4.3.1.2 The existing ASRs are identified with reference to the latest information provided on the survey maps, topographic maps, aerial photos, land status plans and confirmed by various site surveys undertaken in mid October 2008. The planned ASRs are also identified with reference to the latest published Outline Zoning Plans (OZPs), including:
· Chek Lap Kok OZP (No S/I-CLK/11);
· Tung Chung Town Centre Area OZP (No S/I-TCTC/16);
· Revised Concept Plan for Lantau (reviewed from the 2004 Concept Plan by the Lantau Development Task Force);
· North-East Lantau OZP (No S/I-NEL/12); and
· Tuen Mun OZP (No S/TM/25).
4.3.1.3 The relevant stakeholders have also been approached to obtain the latest information on planning application, layout and building height, etc. The major planned uses in the vicinity of the area include:
· Future Tung Chung East and West Developments;
· Possible tourism initiatives in Lantau;
· Proposed Lantau Logistics Park (LLP) and possible LLP extension or other compatible uses;
· MTRC Siu Ho Wan Depot; and
· Shooting Range at Pillar Point Valley Landfill.
4.3.1.4 The other major concurrent projects in the study area comprise the HKBCF, HKLR and TMWB which all interface with the proposed TM-CLKL project. However, no ASRs are associated with these projects during either the construction or operational phases.
4.3.1.6 In addition, it should be noted that, although River Trade Golf is within the vicinity of the proposed alignment of the project and could be sensitive to air impacts, the facility is a Short Term Tenancy only (as detailed in the latest version of the land status plan, Map No. 5SE19C – Digital Map Data provided by Lands Department) and the tenancy will be terminated and the land resumed for use by the TM-CLKL project area for both use as part of Work Site WA18 (Section 3.5) and also permanently to form part of the proposed toll plaza. Therefore, the facility would not be an ASR.
4.3.1.7 Given the relatively low rise ASRs in the study area, the fact that the potential dust generating works will be undertaken at ground level, that the dust will comprise denser material that will not be expected to disperse to significant heights, remaining close to the ground and that this is the average height of the human breathing zone, 1.5m above local ground level is considered the most relevant for the dust assessment. The air quality impact at 1.5m above local ground level has, therefore, been assessed in the study for all representative ASRs. However, as indicated in Table 4.5 below, higher assessment levels have also been selected for elevated ASRs to show the vertical variation of the pollutant concentrations.
Table 4.5 Representative Air Sensitive Receivers
|
ASR |
Location |
Landuse |
No. of Storey |
Assessment Height (above ground level)(7) |
Horizontal Distance to the Alignment (m) |
|
Existing ASRs(1) |
|||||
|
ASR1(6) |
Tuen Mun Fireboat Station |
Office |
1 |
(1.5m)/- |
155 |
|
ASR2 |
DSD Pillar Point Preliminary Treatment Works |
Industrial/ Office |
5 |
(1.5m)/(1.5m,5m, 10m,15m, 20m) |
105 |
|
ASR3 |
EMSD Tuen Mun Vehicle Servicing Station |
Industrial/ Office |
1 |
(1.5m)/(1.5m,5m, 10m,15m, 20m) |
70 |
|
ASR5 |
Pillar Point Fire Station |
Office |
5 |
(1.5m)/(1.5m,5m, 10m,15m, 20m) |
30 |
|
ASR6 |
Butterfly Beach Laundry |
Industrial/ Office |
5 |
(1.5m)/(1.5m,5m, 10m,15m,20m) |
35 |
|
ASR7 |
River Trade Terminal |
Industrial/ Office |
5 |
(1.5m)/(1.5m,5m, 10m,15m, 20m) |
85 |
|
ASR8 |
Pak Mong Village House |
Residential |
3 |
(1.5m)/(1.5m,5m, 10m,15m,20m) |
310 |
|
ASR9A |
Siu Ho Wan MTRC Depot |
Industrial/ Office |
1 |
(1.5m)/(1.5m,5m, 10m,15m,20m) |
150 |
|
ASR9B |
Siu Ho Wan MTRC Depot |
Industrial/ Office |
1 |
(1.5m)/(1.5m,5m, 10m,15m,20m) |
60 |
|
ASR9C |
Siu Ho Wan MTRC Depot |
Industrial/ Office |
1 |
(1.5m)/(1.5m,5m, 10m,15m,20m) |
55 |
|
ASR10 |
Butterfly Beach Park |
Recreational uses |
At Grade |
(1.5m)/(1.5m,5m, 10m,15m) |
18 |
|
Planned ASR(2) |
|||||
|
ASR11A |
Future Tung Chung East Development |
Residential |
47(3) |
-/(1.5m,5m,10m, 15m,20m) |
235 |
|
ASR11B |
Future Tung Chung East Development |
Residential |
47 |
-/(1.5m,5m,10m, 15m,20m) |
70 |
|
ASR11C |
Future Tung Chung East Development |
Residential |
47 |
-/(1.5m,5m,10m, 15m,20m) |
125 |
|
ASR12A
|
Proposed Lantau Logistics Park |
Office |
10 – 25(4) |
-/(1.5m,5m,10m, 15m,20m) |
455 |
|
ASR12B |
Proposed Lantau Logistics Park |
Office |
10 – 25(4) |
-/(1.5m,5m,10m, 15m,20m) |
280 |
|
ASR12C |
Proposed Lantau Logistics Park |
Office |
10 – 25(4) |
-/(1.5m,5m,10m, 15m,20m) |
285 |
|
ASR13 |
Possible Lantau Logistics Park Extension or other compatible uses |
Office/ Recreational uses |
10 – 14(5) |
-/(1.5m,5m,10m, 15m,20m) |
275 |
|
ASR14 |
Reprovisioned Tuen Mun Fireboat Station |
Office |
1 |
-/(1.5m,5m,10m, 15m,20m) |
17 |
|
ASR15 |
Possible Theme Park/ Major Recreational Uses |
Recreational uses |
1 |
-/(1.5m,5m,10m, 15m,20m) |
330 |
Notes: (1): ASRs relevant to both the construction and operational phases of the project. ASR4 not used.
(2): The planned ASRs defined are relevant to the operational phase only as they will be either being built concurrently or will not be present during the construction phase of the TM-CLKL. Further details of the programming of the concurrent projects are presented in Section 3 of this report.
(3): In accordance with the existing development at Tung Chung, it is assumed the future development will be an equivalent height and therefore, blocks have been assumed to be 47 storeys high.
(4): With reference to the Revised Final Planning, Landscape and Urban Design Study Report of Lantau Logistics Park Development Feasibility Study, the future building heights on the LLP are proposed to be between 28m to 40m and that the area for commercial use including a public transport terminus will be 70m. Based upon this and assuming 2.8m per floor a total of 10 to 25 storeys have been assumed.
(5): The area planned for the Possible LLP Extension or other compatible uses has not been subject to detailed study and, as such, the height of the buildings has been assumed to be 40m with reference to Proposed LLP.
(6): ASR1 denotes the existing location of the Tuen Mun Fire Boat Station. However, as this facility will be relocated, during the operational stage the existing facility will not exist and be replaced by ASR14 in it new location.
(7) (1.5m)/(1.5m, 5m, etc) is for construction/operational phases respectively.
4.4 Identification of Potential Air Quality Impacts
4.4.1 Construction Phase
4.4.1.1 Potential construction air quality impacts would mainly be related to the dust nuisance from exposed site areas, including the reclamation areas when formed, movement of vehicles along unpaved roads material handling and wind erosion of the site. The major sources of dust will be from the following construction activities for the TM-CLKL project:
· Excavation;
· Road works;
· Slope works;
· Foundation works;
· Construction of road and superstructures;
· Wind erosion from reclaimed areas, open sites and stockpiling areas; and
· Demolition of existing structures.
4.4.2 Operational Phase
· Vehicle gaseous emissions from the open sections of TM-CLKL and the adjacent existing and planned trunk and local road networks; and
· Emissions from ventilation buildings and potentially from tunnel portals and of TM-CLKL.
4.5.1.1 Construction of the TM-CLKL project would be on-going between 2011 and its commissioning year of 2016. Details of the construction programming and sequencing is provided in Section 3 of this report.
4.5.1.2 However, in addition to the TM-CLKL project, there are numerous other projects that will be constructed and/or operational concurrently with the TM-CLKL project and these will need to be taken into account in the air quality assessment. Details of all the concurrent projects in the study area are detailed in Appendix A2 and the concurrent projects which are considered could potentially contribute to cumulative air quality impacts during the TM-CLKL construction and operational phases are detailed in Table 4.6 below, together with the method of assessment to be applied. As also detailed in Appendix A2, it should be noted that there is no available information on the implementation of the proposed Organic Waste Treatment in north Lantau and the IWMF in Tuen Mun and, as such, these projects have been excluded from both the construction and operational phase assessments.
Table 4.6 Potential Emission Sources of Concurrent Projects at Construction Phase and Operational Phase of TMCLKL
|
Project |
Model Applied for Assessment |
|
Construction Phase(3)(4) (5) |
|
|
Proposed Lantau Logistic Park (LLP) – 72ha. (Phase1) |
FDM |
|
HKBCF |
FDM |
|
TMWB |
FDM |
|
Operational Phase(4) (6) |
|
|
Airport Road |
CALINE4 |
|
Black Point Power Station |
PATH |
|
Castle Peak Power Station |
PATH |
|
Chimneys of Butterfly Beach Laundry |
ISCST3 |
|
Chimneys of Green Island Cement (GIC) with 24-hr operation |
ISCST3 (1) |
|
CT10 |
PATH |
|
CX Catering Facilities |
PATH |
|
Ecopark |
PATH |
|
Existing Airport Operation |
PATH |
|
Gas Flare in Pillar Point Valley Landfill |
ISCST3 |
|
Hong Kong – Zhuhai – Macao Bridge |
(2) |
|
HKBCF (open road and idling traffic) |
CALINE4/ISCST3 |
|
HKLR (open road and tunnel) |
CALINE4/ISCST3 |
|
Industrial uses in Tuen Mun Area 38 |
PATH |
|
Lamma Power Station |
PATH |
|
Marine Traffic from River Trade Terminal |
PATH |
|
Lung Fu Road |
CALINE4 |
|
Lung Mun Road |
CALINE4 |
|
North Lantau Highway |
CALINE4 |
|
Road P1 (Eastern Section) |
CALINE4 |
|
Sludge Treatment Facility |
PATH |
|
TMWB(7) |
ISCST3 |
|
Two Chimneys at Airport Island |
PATH |
Notes:
(1) The chimneys of GIC will be assessed by ISCST3 to estimate the background air quality contribution for ASRs in Tuen Mun and will not be included in the PATH modelling.
(2) The operational air impact assessment is assessed in terms of traffic generated on the existing roads and on TM-CLKL.
(3) There is no available information on the implementation programme and construction arrangement for the Possible Lantau Logistics Park or other compatible uses (Phase 2). Therefore, the air quality impacts from it for the construction phase will not be assessed. However, the potential Phase 1 LLP has been included.
(4) As the HKLR is far away from TMCLKL, the construction phase concurrent air quality impact with TM-CLKL on the ASRs is expected to be insignificant.
(5) The construction phase air quality impact from the Tung Chung East Future Development would not be assessed because the site formation works for TM-CLKL will have been completed when the construction works of the development are proposed to commence in 2015-2016.
(6) Only key emission sources included in the PATH modelling shown.
(7) The TMWB is assumed to be constructed between 2011 and 2016 and will be operational in 2016.
4.6 Construction Phase Assessment Methodology
4.6.1 General Approach
4.6.1.1 The emission factors of fugitive dust would be determined with reference to the Compilation of Air Pollutant Emission Factors, USEPA AP-42, 5th Edition, January 1995. The Fugitive Dust Model (FDM) would be used for the simulation of the construction dust dispersion from the areas of emissions. It is assumed that dust emission would be generated during the daytime working hours between 7:00am and 7:00pm on Monday to Saturday (excluding Sunday). Any construction works outside this period and during weekends/holidays would be reviewed for construction dust impact assessment as necessary.
4.6.2 Emissions Inventory
4.6.2.1 The following assumptions for the determination of the emission inventories are shown below:
· The dust contribution was determined by both the heavy construction activities due to the proposed project works and wind erosion;
· Emission factor is 2.69 Mg/hectare/month for general construction activities (AP-42, Section 13) which would generate fugitive dust and 0.85 Mg/hectare/year for wind erosion at open sites (AP-42, Section 11);
· The duration with works activities was assumed to be 12 hours per day (7:00am-7:00pm), 26 days per month, 12 months per year;
· The 1-hour and daily dust emissions due to heavy construction works were determined based on a total of 30% of the active working areas under construction at any time;
· The annual dust emission due to heavy construction works were determined based on total of 10% and 7% of active working areas for the Lantau and Tuen Mun, respectively, under construction at any time;
· The dust emissions due to wind erosion were determined based on 24 hours per day throughout the entire construction period. Wind erosion alone was assumed during night time between 7:00pm and 7:00am;
· According to the Air Pollution Control (Construction Dust) Regulation, dust suppression measures such as watering should be applied to all construction sites. Given the proximity of the works areas to the ASRs, dust mitigation would be needed and on-site dust suppressions are proposed as 87.5% and 91.7% based upon the watering for eight (8) times per day in Lantau and twelve (12) times per day in Tuen Mun, respectively; and
· All dust emission rates were calculated as follows:
Line Source (g/m-sec) = Emission factor x line width
Area Source (g/m2-sec) = Emission factor
4.6.2.2 For hourly and daily dust modelling, the equivalent emission factors have been determined as 8.9810 x 10⁻⁶g/s/m2 and 8.0860 x 10⁻⁷g/s/m2 for general construction activities and wind erosion respectively, while that for annual dust modelling are 2.9937 x 10⁻⁶g/s/m2 and 2.6953 x 10⁻⁷g/s/m2 respectively in Lantau. For hourly and daily dust modelling, the equivalent emission factors have been determined as 5.9874 x 10⁻⁶g/s/m2 and 8.0860 x 10⁻⁷g/s/m2 for general construction activities and wind erosion respectively, while that for annual dust modelling are 1.3971 x 10⁻⁶g/s/m2 and 1.8867 x 10⁻⁷g/s/m2 respectively in Tuen Mun. The detailed calculations of emission rates are presented in Appendix B10.
4.6.2.6 For the concurrent projects, namely the HKBCF and the Proposed Lantau Logistics Park which will be undertaken concurrently, similar assumptions have been made for the calculations of the emission factors for both wind erosion and general construction activities. The locations and dimensions of the emission sources of the concurrent projects, together with those of the TM-CLKL, are shown in Appendices B10.1-10.4. The detailed calculations of emission rates are presented in Appendix B10.
4.6.2.7 In summary the following scenarios have been modelled:
· Scenario 1 includes work areas A, B, C and G of the toll plaza, the north and south reclamations of the TM-CLKL, reclamations and works for the HKBCF and LLP Phase 1 and other land based works in North Lantau (realignment of Cheung Tung Road, slope excavation and slope stabilization works); and
· Scenario 2 includes work areas C, D, E, F, H and I of the toll plaza, reclamations and works for the HKBCF and LLP Phase 1 and other land based works at North Lantau (realignment of Cheung Tung Road, slope excavation and slope stabilization works).
4.6.3 Methodology of FDM Modelling
4.6.3.1 The sequential meteorological data in Year 2007 recorded at Hong Kong International Airports and Tuen Mun Meteorological Stations respectively obtained from Hong Kong Observatory (HKO) have been used to predict the 1-hour, 24-hour average and annual average TSP concentrations at representative ASRs. Since most of the construction activities except for the toll plaza, which generate fugitive dust would be undertaken at ground level or underground, the worst case impacts from dust on the ASRs would be at the ground floor of the ASRs. The height of 1.5m above ground, which is the breathing level of humans, has been adopted for the construction dust impact assessment. The following meteorological conditions have been adopted for the calculation of 1-hour, 24-hour and annual average TSP concentrations:
· Wind speed: hourly record of meteorological data from HKO;
· Wind direction: hourly record from meteorological data from HKO;
· Stability class: hourly record from meteorological data from HKO. It should be noted that the stability class G obtained from the HKO has been combined with class F for the purposes of the modelling and stability classes A-F applied;
· Mixing height: daily record from meteorological data at King’s Park Meteorological Station in Year 2007;
· Temperature: hourly record of meteorological data from HKO; and
· Anemometer height: 13.7mPD for Hong Kong International Airports Automatic Weather Station; 69.4mPD for Tuen Mun Automatic Weather Station.
4.6.3.2 Hourly, 24-hour and annual average TSP concentrations at the representative ASRs near to the construction work areas have been predicted with the use of the sequential meteorological data. For the hourly meteorological data which is not available, the missing data has been be replaced by the data from the previous hour.
4.6.3.3 The 5-year average TSP monitoring data at the EPD’s Tung Chung (70mg/m3) and Yuen Long (103mg/m3) AQMS as shown in Tables 4.3 and 4.4 above have been adopted as the background concentrations for construction dust impact assessment at the construction works sites in North Lantau and Tuen Mun, respectively.
4.6.3.4 Dust control measures in accordance with the requirements as stipulated in the Air Pollution Control (Construction Dust) Regulation will be recommended for implementation to ensure that any dust impacts are controlled to within the relevant standards. On this basis, watering at the same frequency as the works sites in Lantau of TM-CLKL has been assumed for the concurrent projects of HKBCF and LLP.
4.7 Operational Phase Assessment Methodology
4.7.1 General Approach
4.7.1.1 The overall methodology for the air quality impact assessment within the North Lantau and Tuen Mun study areas is as follows:
· Use of the PATH (Pollutants in the Atmosphere and the Transport over Hong Kong) model to quantify the background air quality from sources including those in Pearl River Delta Economic Zone, airport and power plants within Hong Kong and roads beyond north Lantau and Tuen Mun; and
· Use of near field dispersion models i.e. CALINE4 for line sources and ISCST3 for discrete point and volume sources to quantify the air quality impacts at local scale from sources including open road emissions and emissions from chimneys of industrial premises, ventilation buildings and tunnel portals.
4.7.1.2 The overall methodology is illustrated below:
|
|
|
|
|
|
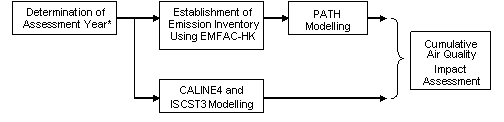
* Assessment year = maximum EMFAC-HK emission year from modelled years 2014#, 2016, 2021 and 2031
# Refer to Section 3.7 regarding Sequence B option for HKBCF Phase 1 commissioning in 2015.
4.7.1.3 The process for the operational air modelling is as follows and the detailed methodology and assumptions of each phase discussed in the sections below:
· PATH modelling;
· format of traffic figures;
· determination of the assessment year using EMFAC-HK;
· calculate the total vehicular tailpipe emissions from open roads, tunnel portal and ventilation buildings within North Lantau and Tuen Mun using EMFAC-HK;
· use the MM5 meteorological data extracted from the PATH model and process using the PCRAMMET model for input into the CALINE4 and ISCST3 models;
· use CALINE4 to assess air quality impacts from open roads; and
· use ISCST3 to assess air quality impacts from tunnel portals, ventilation buildings, the toll plaza underpass and from idling traffic (HKBCF).
4.7.2 PATH Modelling
4.7.2.1 The PATH modelling was undertaken by the HKBCF consultants for both the HKBCF, HKLR and TM-CLKL projects and as such the detailed methodology and results of the PATH modelling are provided in the HKBCF EIA report. However, a summary of the details are provided below. The pollutant dispersion from TM-CLKL and other roads within North Lantau and Tuen Mun are not included in the PATH modelling and as such, these near field emissions are predicted using CALINE4 and ISCST3. For example, the broad approach to predict cumulative NO2 levels is outlined below.
|
|
|
Meteorological data |
|
CALINE4 |
→ |
Cumulative NO2 (Road + Background) |
||
|
PATH |
→ |
|
→ |
|
|
= (A) |
||
|
|
|
Background of O3 and NO2 |
|
ISCST3 |
→ |
NO2 (Chimney + Tunnel Portal + Ventilation Buildings) = (B) |
||
|
|
|
|
|
|
|
|
||
|
Cumulative NO2 (Road + Chimney + Tunnel Portal + Ventilation Building + Background) = (A) + (B) |
|
|||||||
|
|
|
|
|
|
|
|
|
|
Emissions within Pearl River Delta Economic Zone (PRDEZ)
4.7.2.2 The Study of Air Quality in the Pearl River Delta Region conducted in Year 2000 had recommended various mitigation strategies to control and improve the regional air quality problems. In December 2003, the governments of HKSAR and Guangdong jointly drew up the Pearl River Delta Regional Air Quality Management Plan with a view to meeting the emission reduction targets recommended in the Study of Air Quality in the Pearl River Delta Region. The Pearl River Delta Air Quality Management and Monitoring Special Panel was also set up under the Hong Kong/Guangdong Joint Working Group on Sustainable Development and Environmental Protection to follow up on the tasks under the Management Plan.
4.7.2.3 A Mid-term Review Study on Pearl River Delta Regional Air Quality Management Plan was commissioned by Guangdong Environmental Protection Bureau (GPEPB) and HKEPD in Nov 2006 to update the regional pollutant emission for 2003 and 2010 Control Scenario, as well as to review the effect of control measures committed by the governments. This set of updated data will form the basis for emission projection in this study.
4.7.2.4 In addition, the mainland government has also prepared the 珠江三角洲環境保護規劃 in June 2006 which has also outlined the plan to control and reduce their emission up to 2020. Given the best available emission inventory for 2010 from the Mid-Term Review and the 2020 inventory compiled from 珠江三角洲環境保護規劃, it is considered reasonable to interpolate from these 2 sets of inventory to generate the 2015 inventory and then assume that the regional emission would then be capped within the assessment period of this project (that is, up to 2031). A summary of the 2031 PRDEZ emission inventory is given in the Appendix of the HKBCF EIA report.
Emissions from Hong Kong International Airport
4.7.2.5 A review of the operational activities on the Chek Lap Kok Airport reveals that there are 6 key groups of emission sources, including
· Aircraft movements;
· Ground Support Equipment (GSE);
· Auxiliary Power Units (APUs);
· Engine Run-Up Facility;
· Fuel Tanks; and
· Aircraft Maintenance.
4.7.2.6 The respective stakeholders for the above sources had been contacted to collate the latest operational information. The key assumptions adopted to compile the emission inventory are described in the following paragraphs. The operational information provided by the airport operator is given in the Appendix of the HKBCF EIA report.
4.7.2.7 Aircraft movements could be considered as comprising 4 main operation modes, including take-off, climb-out, final approach and idling / taxi-ing. Each mode would have different Emission Index (EI), fuel consumption rates and duration. The pollutant emissions from these modes would be a product of the EI, fuel consumption rates and the duration.
4.7.2.8 The latest operational information for aircraft movements including Landing-Take-Off Cycle (LTO), aircraft mix and the duration of idling and taxi-ing for 2020 (year when the airport would reach its capacity) had been collected from the airport operator.
4.7.2.9 Since there is no information on the EIs, fuel consumption rates and the duration for different types of aircrafts (except the taxi-ing and idling time) has been made reference to international reference such as USEPA’s “Evaluation of Air Pollutant Emissions from Subsonic Commercial Jet Aircraft”, FAA’s “Emission and Dispersion Modelling System” and the ICAO Engine database.
4.7.2.10 The airport operator has also advised that the airport would reach its full operational capacity (in terms of passenger and cargo handling) by Year 2020, which is 20 years ahead of the assumption adopted in the New Airport Master Plan 1991 (NAMP 1991). It is therefore assumed that the pollutant emission after Year 2020 would remain the same as those predicted for Year 2020. The updated emission inventory is given in the Appendix of the HKBCF EIA report.
4.7.2.11 Other than the emissions from aircrafts, the GSE (mostly diesel driven) would also generate air pollutants. According to the information available, GSE include tractors, belt loaders, catering trucks etc. Typical load factors and operation duration were also obtained from the operator.
4.7.2.12 The emission factors for GSE have been extracted from the FAA’s EDMS’s emission database. The Appendix of the HKBCF EIA report presents the predicted GSE emission for Year 2020 and it is assumed that the emission would be capped up to 2031.
4.7.2.13 It is assumed that all the GSE would be manoeuvring within the apron area. Hence the emission from GSE would be modelled as an area source covering the entire apron area. The temporal profile for GSE emissions is assumed to be the same as those for aircraft emissions.
4.7.2.14 Auxiliary power units would also generate air pollutants. Typical load factors and operation duration were also obtained from the operator. Reference has been made to the EDMS database for APUs for different types of aircrafts for Year 2020 (assumed to be capped to 2031, see the Appendix of the HKBCF EIA report).
4.7.2.15 It is assumed that all the APUs would be manoeuvring within the apron area. Hence the emission from APUs would be modelled as an area source covering the entire apron area and at an elevated level to take into account the thermal plume rise. The temporal profile for APU emissions is assumed to be the same as those for aircraft emissions.
4.7.2.16 The existing engine run-up facility is located in the west part of the airport island. Operational information is however not available. In order to conduct a more conservative assessment, it is assumed that all the aircrafts tested would be 747-400, and each test would consist of 5 LTO cycles. In addition, it is further assumed that there would be 3 times of testing each week. A summary of the predicted emission is given in the Appendix of the HKBCF EIA report.
4.7.2.17 The facility would be modelled as an area source. It is also assumed that the temporal profile would be constant throughout the year.
4.7.2.18 The existing fuel tank farm is located to the southeast corner of the Airport Island near the Scenic Hill. There are a total of 9 fuel tanks. Three more tanks would be installed to the west of the existing fuel tank farm. All the tanks have fixed roofs and are freely vented
4.7.2.19 Emissions from the fuel tanks were estimated using EDMS. Results indicate that the annual VOC emission from all fuel tanks would be 8 tonne for Year 2031 (see the Appendix of the HKBCF EIA report). The fuel tank farms have been modelled as point sources. It is assumed that the temporal profile would be constant throughout the year.
4.7.2.20 It is understood that the main sources of VOC from aircraft maintenance are the paint shops and the aircraft hangers. However, air extraction systems have been installed to extract the VOC to water scrubbers before discharging to the atmosphere. It is therefore anticipated that the VOC emission through the scrubbers is relatively insignificant. Hence the PATH model has not included any emissions from the aircraft maintenance facility.
Emissions from Power Plants within HKSAR
4.7.2.21 According to the information from the power stations in Hong Kong, about 28% of the electricity is generated from natural gas. It is also noted from their publication (eg annual reports) that they have plans to increase the utilisation of natural gas to 50%. It is considered reasonable to assume that, by the time of 2015, the utilisation rate of natural gas within HKSAR should have reached 50%, and from 2015 to 2031, the emission would be capped at the same level as 2015. An estimate of the emission with a natural gas utilisation rate of 50% is given in the Appendix of the HKBCF EIA report.
Industrial Sources within HKSAR
4.7.2.22 The emissions from other industrial sources have also been considered. Estimation has been made by projecting from the emission level for 2010 in the Mid-Term Review to the emission level for 2015. A summary of the industrial emission sources within HKSAR for 2031 is given in the Appendix of the HKBCF EIA report.
4.7.2.23 Other specific emission sources have been updated based on their respective best available information. A summary of the specific industrial emission sources within HKSAR for 2031 is given in the Appendix of the HKBCF EIA report. The assumptions for updating these specific industrial emission sources are given in Table 4.7 below. It should be noted that emissions from local chimney sources in the Tuen Mun area have not been modelled by PATH but by ISCST3 and the details are provided in the sections below.
Table 4.7 Assumptions for Updating Industrial Emission Sources
|
Emission Group |
Key Assumptions in Updating Emission Inventory |
|
Ecopark |
Based on their approved EIA Report |
|
IWMF |
According to the project proponent, there is no confirmed implementation and hence it is not included in the emission inventory compilation. |
|
Organic Waste Facilities |
According to the project proponent, there is no confirmed implementation and hence it is not included in the emission inventory compilation. |
|
STF |
Based on their approved EIA Report (ref: EIA-155/2008) |
|
Green Island Cement Facilities |
Based on their Specified Process Licence |
Marine Emissions within HKSAR
4.7.2.24 In the original PATH model, the marine emission sources in HK are apportioned into 2 counties including:
· HK Harbour - Marine emissions from vessels within the Victoria Harbour; and
· HK Waters - Marine emissions from vessels from area beyond the Victoria Harbour.
4.7.2.25 Marine emission inventory for Year 2010’s Control Scenario in the Mid-term Review Study will be adopted as the basis for emission projection. The emission from marine vessels are apportioned into different categories including supporting ships, international ferry, river trade, ocean going vessels, anchorage and other ships based on the emission breakdown of 2010’s Control Scenario.
4.7.2.26 For emission projection, reference has beenmade to the Study on Hong Kong Port – Master Plan 2020 – Final Strategic Environmental Assessment – Part 2 (Port 2020 Study). The growth factors detailed in Table 4.8 have, also, been adopted.
Table 4.8: Growth factor for Marine Vessels from 1997 to 2020
|
Emission Source
|
% Increase from Year 1997 |
||||
|
Ocean Going Ships |
Ferries |
River Trades |
Tug & Tow |
||
|
HK Harbour
|
1997 – 2020 (as in Port 2020 Study) |
99 |
0 |
145 |
-62 |
|
Equiv annual growth rate (assuming linear growth) |
3.04 |
0.00 |
3.97 |
-4.12 |
|
|
HK Waters
|
1997 – 2020 (as in Port 2020 Study) |
162 |
0 |
145 |
-62 |
|
Equiv annual growth rate (assuming linear growth) |
4.28 |
0.00 |
3.97 |
-4.12 |
|
|
CT 1-9
|
1997 – 2020 (as in Port 2020 Study) |
113.00 |
* TEU trend |
|
|
|
Equiv annual growth rate (assuming linear growth) |
3.34 |
|
|
|
|
|
|
|
|
|
|
|
|
CT 1- 11
|
1997 – 2020 (as in Port 2020 Study) |
182.00 |
* TEU trend |
|
|
|
Equiv annual growth rate (assuming linear growth) |
4.61 |
|
|
|
|
Note (*) Data (with CT at Tsing Yi) are extracted from Study on Hong Kong Port – Master Plan 2020 – Final Strategic Environmental Assessment – Part 2 (Port 2020 Study)
4.7.2.27 The emission for the assessment year 2031 can then be determined based on the 2010 emission and the equivalent annual growth factors and is given in the Appendix of the HKBCF EIA report.
Vehicular Emissions within HKSAR (Except those on Lantau)
4.7.2.28 For roads beyond Lantau, the emissions are predicted using EPD’s EmFAC-HK model which takes into account the exhaust technology, number of trip, different vehicle classes, different speed fraction etc of the entire Hong Kong region. The vehicle-kilometre-travelled (VKT) were forecasted by Arup’s in-house Territory Transport Model.
4.7.2.29 For the roads in HK, except those for Lantau needs to be included, the territory wide traffic forecast is only available for Year 2030 and all the major planned highway infrastructure has been included. It is also considered that the territory wide traffic forecast for 2031 would be very similar to that of 2030. A summary of the projected 2030 (equivalent to 2031) vehicular emission from HK roads other than those on Lantau is given in the Appendix of the HKBCF EIA report.
Other Emission Sources
4.7.2.30 The emissions from other emission sources (for example, Non-Road mobile source, VOC containing sources etc) have also been considered by projecting from the emission level for 2010 in the Mid-Term Review to the emission level for 2015. A summary of the other emission sources within HKSAR for 2031 is given in the Appendix of the HKBCF EIA report.
4.7.3 Traffic Figures
4.7.3.1 Summarised details of the traffic figures used in the air assessment are provided in Section 3.9 of this report. The traffic figures have been approved for use in the EIA by Transport Department (Appendix A3)and have taken account of the latest proposed layouts for the Airport island, special events such as Asia World Expo event days and TMWB been commissioned in 2016. It is, also assumed, that TMWB will not be tolled.
4.7.3.2 Typical forecasted weekday morning or afternoon peak traffic flows, including a breakdown of sixteen vehicle categories, on major roads related to this Project, with the worst case scenario traffic conditions, have been used for the EMFAC-HK modelling for calculating the emission factors of roads for CALINE4 assessment of the open roads, and ISCST3 modelling for portal, ventilation buildings and HKBCF idling traffic emissions assessment.
4.7.4 Determination of the Assessment Year
4.7.4.1 The air pollution impacts of future road traffic are typically calculated based on the highest emission strength from road vehicles within the first 15 years after commencement of operation of the TM-CLKL, that is, between 2016 and 2031. The assessment year is selected to represent the highest emission scenario, given the combination of vehicular emission factors and traffic flow for the selected year. As NO2 is the pollutant of primary concern for a road project, the worst assessment year has be determined based on the highest NOx emission scenario using the EMFAC-HK.
4.7.4.2 Sensitivity tests have been conducted to determine the worst-case scenario given the combination of vehicular emission factors and the projected traffic flow for the following selected years within 15 years after the commencement of the TM-CLKL. The representative years are 2016 (commencement of operation), 2021 (up to 60% of diesel goods vehicles being Euro V), and 2031 (15 years after commencement of operation). Notwithstanding the above, it is noted that the HKBCF, which is also scheduled for full commission in 2016, the same as the TM-CLKL, will have an interim opening before this date. There are currently two programmes being considered for the interim opening, 2014 (termed Sequence A) and 2015 (Sequence B). The 2014 was the original programme and this has formed the basis of the EIA Report. Details of both of these have been provided in Section 3 of this report.
4.7.4.3 At this interim stage, the southern viaduct of the TM-CLKL would have been completed to allow the HKBCF to function and traffic from the HKBCF, HKLR and Airport Island, as well as some local traffic, would be using this link at that time. As such, while year 2016 has been chosen for the EMFAC-HK sensitivity test as the data of the full commissioning of all these projects, it is possible the interim opening would results in different traffic mixes and patterns. In addition, it should be noted that the TMWB would not be assumed to be operational until 2016 either and this would, also, influence the traffic patterns at the interim opening compared to 2016, 2021 and 2031. Therefore, this interim stage year is also considered to need to be included in the sensitivity test. However, owing to the late formulation of Sequence B option for an interim opening in 2015, the sensitivity test has been based on the 2014 forecast year. Nevertheless, the 2014 traffic data is considered to be on the conservative side as explained in Section 3.7.1.5.
4.7.4.4 The whole set of emission factors for each of the years have been calculated in the same matter and a sensitivity test conducted to determine the worst scenario year. Based on the emission control schemes in the tested years, together with the varied Vehicle-Mile-Travelled (VMT), sets of emission inventories with emission factors have been produced for each year. Vehicles travelling at both the speed limit and at peak hour travel speeds for these years have been adopted, with the peak hour travel speeds being calculated based on the peak traffic flow of the corresponding year and the volume/capacity (V/C) ratios.
4.7.4.5 Emission factors in the year that has been shown to have the largest emission inventory for the TM-CLKL have been used as the model year for the air quality impacts assessment as it will represent the worst-case scenario prediction associated with vehicular gaseous emission.
4.7.5 Determination of Vehicular Emissions from Open Roads
Background
4.7.5.1 The cumulative air quality impact generated by vehicular gaseous emissions from open road sections and tunnel portals/ventilation buildings have been calculated based on the highest emission strength given by the combination of traffic flow and vehicle mixture in the worst case assessment year. The latest version of the model, EMFAC-HK V1.2, provided at the EPD’s website has been adopted to determine the total emission inventory. These results have been input into CALINE4 for modelling of open road source dispersion and ISCST3 for portal and ventilation building emission modelling. The exception to this are the emissions from the TMWB portal and ventilation building emissions which have been calculated for the purposes of the cumulative assessment using EURO 4 emission factors as the best available information at the time of reporting.
4.7.5.2 The emission factors for the traffic using the proposed toll plaza in Tuen Mun have also been derived using EMFAC-HK. The vehicles using the toll plaza have been divided into two main categories, the vehicles using the manual toll booths and those using the auto-toll, with constant average traffic speeds of 5mph and 30mph adopted for each category respectively.
4.7.5.3 The detailed procedures and assumptions for the EMFAC-HK modelling have been derived in accordance with EPD’s Guideline on Modelling Vehicle Emissions and are discussed below.
Vehicle Emissions and Diesel Fuel Standards
4.7.5.5 Based upon the above, it is reasonably assumed that the cross-boundary vehicles, that is vehicles travelling on the future HZMB, HKBCF, NLH and TM-CLKL, would perform to the same level as vehicles in Hong Kong of similar types as far as tailpipe emissions are concerned and all vehicles have, therefore, been considered as Hong Kong vehicles for the purposes of this assessment.
4.7.5.6 The latest implementation programme for vehicle emission and fuel standards considered in the calculation using EMFAC-HK model, which are also in line with those proposed in Macao and Mainland China, are as follows:
· Diesel vehicles < 3.5 tonnes: Euro IV-2006/2007; and
· Diesel vehicles > 3.5 tonnes: Euro IV-2006, Euro V-2010.
Vehicle Classes
4.7.5.7 All vehicles operating on roads included in the assessment have been categorised into 16 vehicle classes in accordance with Appendix I of EMFAC-HK Guideline as shown in Table 4.9 and detailed in Appendix B1.
Table 4.9 Vehicle Classification in EMFAC-HK
|
Vehicle Class |
EMFAC-HK Notation |
Descriptions |
Gross Vehicle Weight |
|
MC 1 |
PC+LGV(1) |
Petrol Private Cars & Light Goods Vehicles |
ALL |
|
MC 3 |
PC+LGV(3) |
Diesel Private Cars & Light Goods Vehicles <=2.5 tonne |
<=2.5ton |
|
MC 4 |
LGV(4) |
Light Goods Vehicles 2.5-3.5 tonne |
>2.5-3.5ton |
|
MC 5 |
PLB |
Public Light Buses |
ALL |
|
MC 6 |
LGV(6) |
Light Goods Vehicles >3.5 tonne |
>3.5ton-5.5ton |
|
MC 7 |
HGV(7) |
Medium Goods Vehicles with GVW <15 tonne |
>5.5ton-15ton |
|
MC 8 |
HGV(8) |
Medium & Heavy Goods Vehicles with GVW >=15 tonne |
>=15ton |
|
MC 10 |
FBDD |
Double Deck Franchised Buses |
ALL |
|
MC 11 |
MC |
Motor Cycles |
ALL |
|
TAXI 3 |
Taxi |
Taxi |
ALL |
|
TAXI 4 |
PV(4) |
Private Light Buses <=3.5 tonne |
<=3.5ton |
|
TAXI 5 |
PV(5) |
Private Light Buses >3.5 tonne |
>3.5ton |
|
TAXI 6 |
NFB(6) |
Non-franchised Buses <=6.4 tonne |
<=6.4ton |
|
TAXI 7 |
NFB(7) |
Non-franchised Buses 6.4-15 tonne |
>6.4-15ton |
|
TAXI 8 |
NFB(8) |
Non-franchised Buses >=15 tonne |
>15ton |
|
TAXI 10 |
FBSD |
Single Deck Franchised Buses |
ALL |
4.7.5.8 Details of the sixteen vehicle classes have been agreed for use by Transport Department.
Road Groupings
Exhaust Technology Fractions
4.7.5.10 The underlying assumptions of EMFAC-HK are that vehicles can be categorized into unique technology groups with each technology group representing vehicles with distinct emission control technologies, which have similar in-use deterioration rates, and respond the same to repair. The issue of the fuel quality is discussed above.
4.7.5.11 The Exhaust Technology Fraction for each vehicle class has been adopted from the information provided in the “Up to Date Vehicle Licensed Number by Age and Technology Group Fractions” obtained from the EPD's website. However, since there is no further information available after 2003, in order to adopt a conservative approach, the exhaust technology fractions after this year for each vehicle class have been assumed to be the same as in 2003. However, some adjustments have been made according to Appendix II of the EPD’s Guideline on Modelling Vehicle Emissions, Implementation Schedule of Vehicle Emission Standards in Hong Kong (Updated as at 17 August 2005), as detailed in Appendix B2. The details of the adjustments in each vehicle class are shown in Appendix B3.
Evaporative Technology Fractions
4.7.5.12 Default values and compositions have been adopted in this Study, in accordance to EPD’s Guideline on Modelling Vehicle Emissions.
Vehicle Population
4.7.5.13 In terms of the vehicle populations, reference has been made to EPD’s Guideline on Modelling Vehicle Emissions and the latest vehicle age distribution data (Year 2007) (provided by Air Policy Division of EPD) has been adopted in this assessment, with exception of the populations for private car, taxi, public light bus and private light bus which are greater than 3.5 tonnes. The corresponding populations have been calculated and provided in Appendix B4.
Vehicle Accrual
4.7.5.14 Since there is an absence of forecast information in the model year, “Default values and compositions” have been adopted in accordance with the EMFAC-HK Guidelines.
Daily Trips
4.7.5.15 With reference to the EPD’s Guideline on Modelling Vehicle Emissions, the diurnal variation of daily trips has been used to estimate the cold start emissions of petrol vehicles. Hence, trips for vehicles other than petrol type vehicles have been assumed to be zero. In contrast, estimations on number of trips for petrol type vehicles in different road section have assumed the following:
Trunk Road Sections
4.7.5.16 It is assumed that number of trips on the trunk road sections, including TR80, TR110, TP and TP_A, would be zero as no cold start would be reasonably expected on these road sections under normal circumstances.
Local Road Sections
4.7.5.17 It is assumed that the number of trips would be equal to the number of cold starts in these road sections. It is, also, assumed that the number of trips is directly proportional to the Vehicle-Mile-Travelled (VMT) and that the pattern would be similar throughout the Hong Kong territory. The number of trips in this study area has then been estimated by multiplying VMT within Study Area and Trips per VMT within Hong Kong as follows:
![]()
4.7.5.18 Trips per VMT within Hong Kong have been calculated based on the default data of EMFAC-HK, whereas VMT within Study Area have been calculated by multiplying the number of vehicles by the length of road travelled in the study area. The corresponding trips per VMT are shown in Appendix B5.
Daily Vehicle Miles Travelled (VMT)
4.7.5.19 Vehicle-Mile-Travelled (VMTs) are inputted in the model to represent the total distance travelled on a typical weekday. The regional specific VMT have been calculated by multiplying vehicle flow by the road section length.
Hourly Temperature and Relative Humidity Profile
4.7.5.21 According to the information provided by Hong Kong Observatory, the nearest meteorological station of this Project is Hong Kong International Airports Automatic Weather Station, with anemometer height of 13.7mPD above mean sea level. It is considered that the characteristics of the Hong Kong International Airports Automatic Weather Station would be representative of the study area and, therefore, annual and monthly hourly average ambient temperature and relative humidity obtained from this station for the year 2007 have been adopted in the model. It is confirmed that this data has 100% valid data for the year. The adopted values are shown in Appendix B6.
Model Year
4.7.5.22 For the purpose of finding the worst scenario year, the emission inventories for four years within 15 years after the commencement of the project, namely years 2014, 2016, 2021 and 2031, has been carried out and the results are provided in Appendix B7a. Based upon these results, a sensitivity test has been conducted to determine the worst scenario year, with the year with the largest emission inventory being used as the model year of the operational air quality impact assessment. Vehicles travelling at the speed limit, in addition to peak hour travel speeds, for all four years have been adopted.
Speed Fraction
4.7.5.23 In order to simulate the effect of different road speeds during rush and non-rush hours, sensitivity tests for Years 2014, 2016, 2021 and 2031 have been carried out. The design road speed limits were assumed for representing the situation during non-rush hour; while the vehicle speed of peak hour flow was adopted representing the situation during the rush hour. The estimated speed fractions had been estimated by travelling speeds provided in the TIA Report.
4.7.5.24 The peak flow hour travel speeds have been calculated based on the peak traffic flows in each year and the volume/capacity ratios (V/C) of the different road types. In order to obtain the speed fractions of each vehicle type, the vehicle speeds of each road were first calculated and weighed by the VMT.
4.7.5.25 In the model, the same travelling speeds have been applied to all vehicles for each type to demonstrate the effect of using peak flow speed and design speed. However, the diurnal variation of VMT for each vehicle have, also, been considered in the travelling speed estimation. In addition, in the speed fraction estimations, MGV, HGV, HGV and buses have been assumed to travel at speeds not exceeding 70 kph on all roads. The worst emission factors have been selected for predicting the vehicle emissions.
4.7.5.26 In respect of the toll plaza, as mentioned above, traffic speeds of 5kph and 30kphhave been assumed for vehicles using the normal manual booths and auto-toll booths, respectively. It is, also, assumed that these traffic speeds would be constant for each hour of a day. In addition, taking into account the relatively short time required for a vehicle to stop and pay the toll, no stopping has been assumed at either of the booth types.
4.7.5.27 The “Burden Mode” of EMFAC-HK is the only scenario that can consider and provide the hourly vehicular emissions according to the diurnal variations of vehicle-kilo-meter-travelled (VKT), trips, ambient temperature, relative humidity and speed and, therefore, has been adopted.
Output Frequency
4.7.5.28 Hourly average emission factors have been derived for the purpose of obtaining worst emission factors.
Calculation of Emission Factors
4.7.5.29 Emission inventories and Vehicle-Miles-Travelled (VMT) are extracted from the model for use. In respect of the trunk road sections, only “Run Exhaust” has been considered as it characterises continuous flows, whereas both “Start Exhaust” and “Run Exhaust” have been considered for local road sections of the need to take into account cold start emissions. The “Start Exhaust” is confined to petrol vehicles only.
4.7.5.30 In addition, as the results from EMFAC-HK are given in different fuel types, hourly emission factors have been calculated by dividing the total emission inventory by the total VKT in each vehicle class in each hour in order to obtain representative and generic emission factors for each of the vehicle categories. An example of this calculation for the emission factor of a LGV is as follows:
Emission Factor = Σ(Emission Inventory)i / Σ(VKT)i
![]()
Where: NCAT = Non Catalyst;
CAT = Catalyst; and
DSL= Diesel
4.7.5.31 The maximum value of calculated hourly emission factors in grams per miles per vehicle have then been selected for use in the modelling of the open roads using CAINE4 and deriving the emissions from tunnel portal and ventilation stacks for subsequent modelling by ISCST3.
4.7.6 Meteorological Data
4.7.6.1 The Memoscale Model 5 (MM5) meteorological data has been extracted from the PATH model and the hourly values for atmospheric stability from meteorological surface observations calculated by PCRAMMET for use in the CALINE4 and ISCST3 modelling.
4.7.6.2 The PCRAMMET model has been used to take the regional scale MM5 meteorological data extracted from the PATH Model and used it to:
· calculate hourly values for atmospheric stability from meteorological surface observations;
· interpolate twice daily mixing heights to hourly values; and
· convert suitable format for air quality dispersion models (e.g. ISCST3 Model).

· Year, Month, Day and Hour (YYYYMMDDHH) (Hour: 00 to 23);
· Wind Speed (meter per second);
· Wind Direction (360 points compass bearing, e.g. 90° refer to wind blowing from the East);
· Temperature (degree Celsius);
· Mixing Height (meter);
· Monin-Obukhov Length (meter);
· Ceiling Height (meter); and
· Cloud Coverage (Portion of sky covered by cloud).
4.7.6.5 Two input files were prepared from the raw MM5 data for input into the PCRAMMET models, namely the Mixing Height Data Record and the Surface Data Record.
4.7.6.6 The following assumptions have been made for the data conversion and for the running of PCRAMMET:
· Significant settling and removal processes of dry and wet deposition processes are unlikely to occur;
· Station numbers are arbitrary values for the ease of reference; and
· As one of the functions of PCRAMMET is to interpolate twice daily mixing heights to hourly values, in accordance with the User‘s Guide (P.2-4), AM Mixing Value refers to the minimum for a given day from 1200GMT, whilst PM Mixing Value refers to the maximum.
4.7.6.7 The following presents the procedure to convert raw meteorological data to the two files required to be input into PCRAMMET:
Mixing Height Data Record
· Step 1: Form a file with ASCII format;
· Step 2: Assign arbitrary Mixing Station Number;
· Step 3: List Day 1 to Day 365 (365 nos. data) plus 1 day before and after the year of record in accordance with the User’s Guide (P.2-3);
· Step 4: Replace the Mixing Heights if their values are lower than the annual minimum of Hong Kong Observatory’s measured data at King’s Park (minimum value is 129.0m in Year 2003); and
· Step 5: Calculate AM (minimum between Hour 00 to Hour 11) and PM (maximum between Hour 12 to Hour 23) Mixing Values from hourly mixing height data.
Surface Data Record
· Step 5 Form a file with ASCII format;
· Step 6 Assign arbitrary Surface Station Number;
· Step 7 List Day 1 to Day 365 and Hour 00 to Hour 23 (8,760 nos. data);
· Step 8 Compute Ceiling Height: (Hundreds of Feet)
= Ceiling Height (m) x 3.28ft/m / 100;
· Step 9 Compute Wind Direction (Tens of Degrees)
= Wind Direction (360o) / 10;
· Step 10 Compute Wind Speed (Knots)
= Wind Speed (m/s) x 1knot/0.514m/s
The wind speeds are set to 1.0 m/s for the wind speeds below 1.0 m/s;
· Step 11 Compute Dry Bulb Temperature (oF)
= Dry Bulb Temperature (oC) x (9/5) + 32; and
· Step 12 Compute Opaque Cloud Cover (tens of percent)
= if Cloud Coverage < 10% 0
= if 10% < Cloud Coverage < 19% 1
= if 20% < Cloud Coverage < 29% 2 and so on
= if overcast or 100% ‘-‘.
4.7.6.8 The data in CD144 format is then process into output files for use in the CALINE4 and ISCST modelling. In addition, the hourly mixing heights, wind directions, wind speeds and temperatures of the output files should be replaced by the data of the MM5 data in order to prevent any roundup problems.
4.7.7 Impact Modelling from Open Roads
4.7.7.1 The modelling of impacts from open stretches of road has been undertaken using the CALINE4 model. The hourly emission rates of each vehicle class (in grams per mile per vehicle) have been determined by dividing the emissions of the various road categories calculated with the EMFAC-HK model by the hourly traffic flow and the distance travelled. The composite emission factors in CALINE4 model have then been calculated.
4.7.7.2 The CALINE4 model has adopted grid-specific composite real meteorological data, including temperature, wind speed and direction, stability class and mixing height extracted and calculated from the MM5 data of the PATH and the PCRAMMET model.
4.7.7.3 The following meteorological conditions have been assumed in the CALINE4 Model:
· Wind speed: hourly wind speed from MM5 meteorological data;
· Stability class: hourly data from PCRAMMET output file;
· Wind direction: hourly data from MM5 meteorological data;
· Directional variability: calculated according to the stability class in PCRAMMET output file; (Stability Class A, Standard Deviation of Wind Direction (sA) = 22.5o; Stability Class B, sA = 22.5o; Stability Class C, sA = 17.5o; Stability Class D, sA = 12.5o; Stability Class E, sA = 7.5o; Stability Class F, sA = 3.8o; A surface roughness factor of (z0/15 cm)0.2 was adopted where z0 is the surface roughness in cm);
· Mixing height: hourly data from MM5 meteorological data (for the mixing height of MM5 lower than the minimum mixing height measured at King’s Park Meteorological Station in Year 2003, the minimum mixing height measured at King’s Park was adopted);
· Temperature: hourly data from MM5 meteorological data; and
· Surface roughness: 100cm for Grid (11, 30), 50cm for Grid (12, 30) at Tuen Mun and 296cm for Grid (12, 24), 100cm for Grid (13, 24) and 75cm for Grid (14, 25) at Lantau.
4.7.7.4 The study area in Tuen Mun is divided into two grids. Grid (11, 30) mainly contains low-rise industrial buildings and Grid (12, 30), also, contains low-rise industrial buildings but is adjacent to the sea. The study area at Lantau is divided into three grids. Grid (12, 24) contains high-rise residential buildings near Tung Chung and at the Future Tung Chung East Development and is adjacent to the sea. Grid (13, 24) mainly contains low-rise village houses at Pak Mong and Grid (14, 25) contains low-rise to medium rise buildings at Siu Ho Wan Depot and the Proposed LLP and is adjacent to the water. Weighted surface roughness lengths were estimated based upon the above information. The justifications for the estimation of surface roughness length are provided in Appendix B8.
4.7.7.5 In view of the constraints of the CALINE4 model in modelling elevated roads higher than 10m, the road heights of elevated road sections in excess of 10m high above local ground or water surface, such as the viaduct sections of the TM-CLKL, would be set to 10m in the CALINE4 model as a worst-case assumption. Based on findings in the operational noise assessment in Section 5, no noise barrier is proposed for the TM-CLKL project. Therefore, no barrier was included in CALINE4 modelling.
4.7.7.6 The Ozone Limiting Method (OLM) has been adopted for the conversion of NOx to NO2 based on the predicted O3 concentrations from the PATH modelling output for all vehicle emissions. A tailpipe emission NO2/NOx ratio of 7.5% according to the EPD’s “Guidelines on Choice of Models and Model Parameters” has also been assumed. The NO2/NOx conversion has been calculated as follows:
[NO2]pred = 0.075 x [NOx]pred + MIN{0.925 x [NOx]pred, or (46/48) x [O3]PATH}
4.7.7.7 The air quality impact at 1.5m, 5m, 10m, 15m and 20m above local the ground level has been modelled for the Tuen Mun area and, due to the potential for high rise buildings, at 1.5m, 5m, 10m, 15m and 20m above local the ground level in Lantau at the representative ASRs.
4.7.7.8 In addition, the cumulative impact of emissions from the open roads of HKLR and HKBCF have, also, been assessed and the emission factors of the roads have been provided by the HKLR and HKBCF projects for the assessment. The roads included comprise the alignment of the HKLR and the roads connecting to the HKBCF. The calculated composite emission factors of the roads are provided in Appendix B7b.
4.7.8 Determination of Emissions from Tunnel Portals and Ventilation Buildings
4.7.8.1 Emissions for tunnel portals and the ventilation buildings have been modelled using ISCST3. The hourly emissions inside tunnels have been calculated by multiplying the emission strength (g/km/veh), obtained by the EMFAC-HK modelling above, for the worst case year, by the product of the traffic flow (veh/hr) and the tunnel length (km).
4.7.8.3 The emissions from the ventilation buildings are proposed to be discharged from the vent shaft with and a discharge velocity of 8m/s and with a 45o angle upwards. The detailed information is presented in Appendix B9. Portal emissions have been assessed in accordance with the Permanent International Association of Road Congress Report (PIARC, 1991). The emissions would be assumed to be discharged in the first 100m of the outbound open road section in the direction of the vehicular movements. The total emissions would be apportioned into 8 volume sources with two thirds of the total strength being allotted to the first 4 sources and the remaining one third to the other 4 sources, as recommended by the PIARC guideline.
4.7.8.4 Details of other elements of the TM-CLKL project and concurrent project sources modelled by ISCST3 are presented below.
Toll Plaza Underpass
4.7.8.6 The length of the underpass would be a maximum of around 230m and no ventilation system would be needed to maintain the air quality inside the underpass. As such, longitudinal ventilation with 100% emission at the portal has been assumed. The detail calculations of the emission factors are presented in Appendix B9.
Emissions from Concurrent Projects
4.7.8.7 The emissions from the tunnel portals and ventilation buildings for the concurrent projects of the HKLR and TMWB have, also, been modelled with ISCST3.
Tunnel Section for HKLR under Scenic Hill
4.7.8.9 The HKLR proposed tunnel will pass through Scenic Hill on the south-eastern corner of the Airport. The length of the tunnel will be around 1.1km and the tunnel ventilation building would be located close to the western portal of the tunnel. A split of emissions of 30% from the tunnel portals and 70% from the ventilation building has been assumed and the emission is proposed to be discharged from the vent shaft with an exit velocity of 5m/s vertically. The detailed calculations, including the assumed emission rates calculated using EM-FAC, are presented in Appendix B9.
Tunnel of TMWB
4.7.8.10 The southern tunnel portal of the TMWB would exit at the toll plaza of the TM-CLKL at Tuen Mun and could result in cumulative air quality impacts at the ASRs in the area. However, the portal and the ventilation building of the northern section of the TMWB would not be in the TM-CLKL study area and has not been assessed. A tunnel ventilation building is proposed to be located adjacent to the southern portal of the tunnel, on the eastern side of the toll plaza. It was assumed that the emission split would be 10% from the southbound tube of the portal and 90% from the ventilation building. The emission rates for the TMWB tunnel have been derived using EURO 4 emission factors as the best information available. Detailed calculations are provided in Appendix B9.
4.7.8.11 Emissions from the TMWB ventilation building have, also, been assessed by the ISCST3 model as a point source with a 45o angle upwards discharge.
4.7.8.12 The Ozone Limiting Method (OLM) has been adopted for the conversion of NOx to NO2 based on the predicted O3 concentrations from the PATH modelling output for all vehicle emission sources from the tunnel portals and ventilation buildings. The NO2/NOx conversion was calculated as follows:
[NO2]pred = 0.075 x [NOx]pred + MIN{0.925 x [NOx]pred, or (46/48) x [O3]PATH}
4.7.9 Impact Modelling from Point Sources
4.7.9.1 In addition, the ISCST3 model has been used to calculate the emissions from back ground sources that have not been included in the PATH modelling, namely the stack emissions from Green Island Cement Plant and the Butterfly Beach Laundry and, also, from the landfill gas flare at Pillar Point Valley Landfill.
4.7.9.2 The air quality impact at 1.5m, 5m, 10m, 15m and 20m above local ground level of representative ASRs, will be assessed in the study.
4.7.9.3 Similar to the open road traffic emission using CALINE4 model, the ISCST3 model for the pollutant dispersion from tunnel portals and ventilation buildings has adopted the grid-specific composite real meteorological data, including temperature, wind speed and direction, stability class and mixing heights from the MM5 meteorological data and PC RAMMET models have been used.
Emissions from Green Island Cement Plant (GIC)
4.7.9.4 The potential emissions of the GIC that have been assessed include the major stack emissions from fuel combustion together with the fugitive emissions as listed in its Specified Process License. The detail calculations of the emission rates are presented in Appendix B9.
Emissions from Pillar Point Valley Landfill
4.7.9.5 Flaring emissions from the landfill gas flare at Pillar Point Valley Landfill have been assessed based on the information provided by EPD. Emission factor data are only available for particulates, 100% of which would be assumed as RSP as the worst case scenario. The detail calculations of the emission rates are presented in Appendix B9.
Emissions from Butterfly Beach Laundry
4.7.9.6 The Hospital Authority (HA) has a laundry, Butterfly Beach Laundry, at Tuen Mun, which comprises three chimneys which are connected to three boilers. The best available information provided by the Tuen Mun Regional Office of EPD with the consent of HA, has been used to define the emission factors for this source. According to the available information, only 2 of the chimneys are in operation, with the third used for standby purposes. Since only fuel consumption information of the boilers is available, the emission factors of the chimneys have been estimated in accordance with Table 1.3-1 “Criteria Pollution Emission Factors for Fuel Oil Combustion” from USEPA AP-42. The detail calculations of the emission rates are presented in Appendix B9.
4.7.9.7 The Ozone Limiting Method (OLM) has been adopted for the conversion of NOx to NO2 based on the predicted O3 concentrations from the PATH output modelling for all industrial emission sources from the tunnel portals and ventilation buildings. The NO2/NOx conversion was calculated as follows:
[NO2]pred = 0.1 x [NOx]pred + MIN{0.9 x [NOx]pred, or (46/48) x [O3]PATH}
4.7.10 Impact Modelling from Area Sources
4.7.10.1 Emissions from the idling vehicles at HKBCF have been modelled using ISCST3 and has included emissions from the idling vehicles which are approaching, inside and leaving the HKBCF. The emission rates were provided by the HKBCF project and the detail calculations of the emission rates and the locations of the area sources are presented in Appendix B9.
4.7.10.2 The Ozone Limiting Method (OLM) has been adopted for the conversion of NOx to NO2 based on the predicted O3 concentrations from the PATH modelling output for all vehicle emission sources. The NO2/NOx conversion was calculated as follows:
[NO2]pred = 0.075 x [NOx]pred + MIN{0.925 x [NOx]pred, or (46/48) x [O3]PATH}
4.7.10.3 As the land use types, including industrial, commercial and residential uses, in the area account for around 50% or more of the area within 3 km radius from the ventilation building, the site has been classified as urban and the “urban” mode algorithm has been adopted. The gradual plume rise option with the stack tip downwash component has, also, been adopted in the ISCST3 models.
4.7.11 Determination of Cumulative Impacts
4.7.11.1 The predicted overall cumulative hourly average concentrations of NO2 and RSP have been calculated by adding each predicted hourly result from CALINE4 (open roads) with each predicted hourly background results from PATH and each predicted hourly results from ISCST3 (emissions from the portals, ventilation buildings and chimneys) according to the time sequence of the results from PATH, CALINE4 and ISCST3. The predicted overall cumulative 24-hour and annual average concentrations of NO2 and RSP have been calculated from the overall cumulative hourly average concentrations of NO2 and RSP.
4.8 Construction Air Quality Assessment
4.8.1 Modelling Results for TM-CLKL with HKBCF and LLP
4.8.1.1 The following mitigation measures that have been recommended to reduce the dust generation from the TM-CLKL project to within the 1-hour (500 µg/m3), 24-hour (260 µg/m3) and Annual (80 µg/m3) criteria at ASRs:
(i) all unpaved roads/exposed area shall be watered which results in dust suppression by forming moist cohesive films among the discrete grains of road surface material. An effective watering programme of twice daily watering with complete coverage is estimated to reduce by 50%. This is recommended for all areas in order to reduce dust levels to a minimum;
(ii) watering of the construction area for 8 times per day in Lantau and 12 times per day in Tuen Mun to reduce dust emissions by 87.5% (100%-100%/8) and 91.7% (100%-100%/12), respectively, at the construction sites of the project.
4.8.1.2 The maximum predicted 1-hour, 24-hour and annual average TSP concentrations at representative ASRs in the study area for Scenario 1 and Scenario 2 with mitigation applied are shown in Table 4.10a and Table 4.10b below and the modelling results detailed in Appendix B10.
Table 4.10a 1-hour, 24-hour and Annual Average Maximum Cumulative TSP concentrations (µg/m3) at ASRs for Scenario 1 (including background level)
|
Receiver Reference |
Predicted Maximum 1-hour Concentration (Standard 500 µg/m3) |
Predicted Maximum 24-hour Concentration (Standard 260 µg/m3) |
Predicted Maximum Annual Concentration (Standard 80 µg/m3) |
|
|
ASR1* |
194.8 |
147.5 |
105.2 |
|
|
ASR2* |
191.9 |
114.0 |
103.7 |
|
|
ASR3* |
202.6 |
114.9 |
103.6 |
|
|
ASR5* |
234.6 |
133.4 |
105.0 |
|
|
ASR6* |
225.7 |
152.7 |
105.6 |
|
|
ASR7* |
241.2 |
128.6 |
104.4 |
|
|
ASR8** |
205.0 |
83.4 |
70.7 |
|
|
ASR9A** |
292.9 |
104.8 |
72.0 |
|
|
ASR9B** |
248.6 |
99.7 |
71.8 |
|
|
ASR9C** |
239.9 |
107.9 |
72.7 |
|
|
ASR10* |
188.8 |
112.2 |
103.5 |
|
|
Note: |
|
denotes TSP level in excess of criteria |
||
|
|
|
|
|
|
* With 91.7 % of dust reduction for heavy construction at works sites in the northern landing in Tuen Mun.
** With 87.5% of dust reduction for heavy construction at works sites in the southern landing in Lantau.
Table 4.10b 1-hour, 24-hour and Annual Average Maximum Cumulative TSP concentrations (µg/m3) at ASRs for Scenario 2 (including background level)
|
Receiver Reference |
Predicted Maximum 1-hour Concentration (Standard 500 µg/m3) |
Predicted Maximum 24-hour Concentration (Standard 260 µg/m3) |
Predicted Maximum Annual Concentration (Standard 80 µg/m3) |
|
|
ASR1* |
154.3 |
116.5 |
103.7 |
|
|
ASR2* |
254.2 |
131.3 |
104.3 |
|
|
ASR3* |
188.7 |
115.6 |
103.5 |
|
|
ASR5* |
256.3 |
164.5 |
106.0 |
|
|
ASR6* |
266.7 |
129.3 |
104.2 |
|
|
ASR7* |
245.4 |
147.4 |
105.4 |
|
|
ASR8** |
196.4 |
82.5 |
70.7 |
|
|
ASR9A** |
292.9 |
104.8 |
72.0 |
|
|
ASR9B** |
248.6 |
99.7 |
71.7 |
|
|
ASR9C** |
239.9 |
106.2 |
72.7 |
|
|
ASR10* |
262.4 |
130.1 |
103.8 |
|
|
Note: |
|
denotes TSP level in excess of criteria |
||
|
|
|
|
|
|
* With 91.7 % of dust reduction for heavy construction at works sites in the northern landing in Tuen Mun.
** With 87.5% of dust reduction for heavy construction at works sites in the southern landing in Lantau.
4.8.1.4 However, it can be seen from Tables 4.10a and 4.10b that the annual TSP concentrations exceed the criteria of 80µg/m3 at most of the sensitive receivers in Tuen Mun. However, it should be noted that the annual background levels are 103 µg/m3 for Tuen Mun, which is already in excess of the criterion. Based upon this, it can be seen that the contribution from the project is, generally, between 0.1% and 2.9% based on the predicted maximum annual concentration of the background average TSP levels in Tuen Mun (which are equivalent to 0.1% and 3.8% respectively based on the AQO for annual average TSP level). The contribution of the project is below 3% at all the ASRs.
4.8.1.5 The ASRs at the existing Tung Chung Town (North of NLH) have been considered in the EIA for the HKBCF. According to their findings, their predicted TSP levels would comply with the TSP criterion in EIAO-TM and HKAQO. Hence there would be no adverse cumulative dust impact caused.
4.8.1.6 However, in addition to these measures, under the auspices of the Air Pollution Control (Construction Dust) Regulation, the Contractor will be required to ensure that dust control measures stipulated in the Regulation should be implemented to control dust emissions. The dust control measures detailed below shall be incorporated into the Contract Specification as an integral part of good construction practice. These measures are, also, summarised in the Environmental Mitigation Implementation Schedule in Appendix A1.
(i) The Contractor shall, to the satisfaction of the Engineer, install effective dust suppression measures and take such other measures as may be necessary to ensure that at the Site boundary and any nearby sensitive receiver, dust levels are kept to acceptable levels;
(ii) The Contractor shall not burn debris or other materials on the works areas;
(iii) in hot, dry or windy weather, the watering programme shall maintain all exposed road surfaces and dust sources wet;
(iv) Where breaking of oversize rock/concrete is required, watering shall be implemented to control dust. Water spray shall be used during the handling of fill material at the site and at active cuts, excavation and fill sites where dust is likely to be created;
(v) Open dropping heights for excavated materials shall be controlled to a maximum height of 2m to minimise the fugitive dust arising from unloading;
(vi) During transportation by truck, materials shall not be loaded to a level higher than the side and tail boards, and shall be dampened or covered before transport. Materials having the potential to create dust shall not be loaded to a level higher than the side and tail boards, and shall be covered by a clean tarpaulin. The tarpaulin shall be properly secured and shall extend at least 300mm over the edges of the side and tail boards;
(vii) No earth, mud, debris, dust and the like shall be deposited on public roads. Wheel washing facility shall be usable prior to any earthworks excavation activity on the site;
(viii) Areas of exposed soil shall be minimised to areas in which works have been completed shall be restored as soon as is practicable; and
(ix) All stockpiles of aggregate or spoil shall be enclosed or covered and water applied in dry or windy condition.
4.9 Operational Air Quality Assessment
4.9.1 Assessment Year
4.9.1.1 Emission factors have been determined using the EMFAC-HK model for four different years, namely 2014, 2016, 2021 and 2031, to determine the worst case assessment year for further assessment.
4.9.1.2 The whole set of emission factors for years 2014, 2016, 2021 and 2031 have been calculated in the same matter and the details provided in Appendix B7a. Composite emission factors for the road links of the TM-CLKL project have been calculated using the weighted average of the emission factors of the sixteen vehicle types. Details of the sensitivity analysis are shown in Appendix B11 and Table 4.11 below.
Table 4.11 Sensitivity Test of Emission Inventory
|
Parameter |
Total Emission Inventory of the Road Links of the Project |
|||
|
Year 2014 |
Year 2016 |
Year 2021 |
Year 2031 |
|
|
NOx TP |
0.00 |
0.09 |
0.09 |
0.11 |
|
NOx TP_A |
0.00 |
0.07 |
0.07 |
0.08 |
|
NOx TR80 |
1.13 |
5.75 |
5.76 |
6.34 |
|
RSP TP |
0.00 |
0.01 |
0.01 |
0.01 |
|
RSP TP_A |
0.00 |
0.00 |
0.00 |
0.00 |
|
RSP TR80 |
0.06 |
0.25 |
0.17 |
0.17 |
4.9.1.3 In Table 4.11, it shows that the greatest emission inventory is for NOx in Year 2031. Although the greatest emission inventory is for RSP in Year 2016, the emission inventory of NOx has been determined to be much higher than that of RSP. Therefore, a more significant effect from NOx would be expected and it is concluded that Year 2031 was selected as the worst-case model year for the air quality impact assessment.
4.9.2 Emission Factors
As noted above, Year 2031 has been selected as representing the worst case year for assessment. As such, all further modelling will use the emission factors from 2031 to determine the impacts on sensitive receivers. The calculated emission factors for different vehicle categories for NOx and RSP are summarised in Tables 4.12 and 4.13 below.
Table 4.12 Emission Factors for NOx in Year 2031
|
Vehicle Class |
Description |
Emission Factors of NOx, g/mile-veh |
||||
|
LR |
TP |
TP_A |
TR80 |
TR110 |
||
|
MC 1 |
Petrol Private Cars & Light Goods Vehicles |
0.153 |
0.210 |
0.121 |
0.110 |
0.115 |
|
MC 3 |
Diesel Private Cars & Light Goods Vehicles <=2.5 tonne |
0.282 |
0.483 |
0.241 |
0.262 |
0.515 |
|
MC 4 |
Light Goods Vehicles 2.5-3.5 tonne |
0.266 |
0.414 |
0.241 |
0.260 |
0.509 |
|
MC 5 |
Public Light Buses |
0.000* |
0.000* |
0.000* |
0.000* |
0.000* |
|
MC 6 |
Light Goods Vehicles >3.5 tonne |
1.532 |
2.364 |
1.368 |
1.495 |
2.931 |
|
MC 7 |
Medium Goods Vehicles with GVW <15 tonne |
2.810 |
4.344 |
2.469 |
2.532 |
2.535 |
|
MC8 |
Medium & Heavy Goods Vehicles with GVW >=15 tonne |
3.651 |
5.618 |
3.207 |
3.289 |
3.293 |
|
MC 10 |
Double Deck Franchised Buses |
2.632 |
4.425 |
1.979 |
2.018 |
2.034 |
|
MC 11 |
Motor Cycles |
1.120 |
0.845 |
1.046 |
1.191 |
1.363 |
|
TAXI 3 |
Taxi |
0.357 |
0.546 |
0.000* |
0.287 |
0.300 |
|
TAXI 4 |
Private Light Buses <=3.5 tonne |
0.000* |
0.322 |
0.000* |
0.099 |
0.150 |
|
TAXI 5 |
Private Light Buses >3.5 tonne |
0.000* |
0.322 |
0.161 |
0.195 |
0.381 |
|
TAXI 6 |
Non-franchised Buses <=6.4 tonne |
1.529 |
2.414 |
1.368 |
1.372 |
1.374 |
|
TAXI 7 |
Non-franchised Buses 6.4-15 tonne |
2.816 |
4.344 |
2.451 |
2.509 |
2.512 |
|
TAXI 8 |
Non-franchised Buses >=15 tonne |
3.701 |
5.632 |
3.218 |
3.291 |
3.295 |
|
TAXI 10 |
Single Deck Franchised Buses |
0.000* |
3.459 |
1.529 |
1.550 |
1.558 |
The emission factors are zero in these cases as there are no Public Light Bus on any of the road links, no taxi on Toll Plaza with auto-tolled booths, no Private Light Buses <=3.5 tonne on Local Road and Toll Plaza with auto-tolled booths, no Private Light Buses >3.5 tonne on Local Road, nor no Single Deck Franchised Buses on the Local Road within the study area.
Table 4.13 Emission Factors for RSP in Year 2031
|
Vehicle Class |
Description |
Emission Factors of RSP, g/mile-veh |
||||
|
LR |
TP |
TP_A |
TR80 |
TR110 |
||
|
MC 1 |
Petrol Private Cars & Light Goods Vehicles |
0.009 |
0.038 |
0.008 |
0.004 |
0.005 |
|
MC 3 |
Diesel Private Cars & Light Goods Vehicles <=2.5 tonne |
0.141 |
0.161 |
0.161 |
0.073 |
0.079 |
|
MC 4 |
Light Goods Vehicles 2.5-3.5 tonne |
0.099 |
0.201 |
0.080 |
0.056 |
0.063 |
|
MC 5 |
Public Light Buses |
0.000* |
0.000* |
0.000* |
0.000* |
0.000* |
|
MC 6 |
Light Goods Vehicles >3.5 tonne |
0.096 |
0.188 |
0.080 |
0.055 |
0.061 |
|
MC 7 |
Medium Goods Vehicles with GVW <15 tonne |
0.126 |
0.241 |
0.095 |
0.073 |
0.082 |
|
MC8 |
Medium & Heavy Goods Vehicles with GVW >=15 tonne |
0.113 |
0.215 |
0.087 |
0.066 |
0.074 |
|
MC 10 |
Double Deck Franchised Buses |
0.087 |
0.161 |
0.080 |
0.040 |
0.044 |
|
MC 11 |
Motor Cycles |
0.080 |
0.080 |
0.054 |
0.047 |
0.110 |
|
TAXI 3 |
Taxi |
0.052 |
0.200 |
0.000* |
0.025 |
0.029 |
|
TAXI 4 |
Private Light Buses <=3.5 tonne |
0.000* |
0.483 |
0.000* |
0.042 |
0.049 |
|
TAXI 5 |
Private Light Buses >3.5 tonne |
0.000* |
0.322 |
0.161 |
0.107 |
0.111 |
|
TAXI 6 |
Non-franchised Buses <=6.4 tonne |
0.080 |
0.161 |
0.080 |
0.041 |
0.045 |
|
TAXI 7 |
Non-franchised Buses 6.4-15 tonne |
0.107 |
0.241 |
0.161 |
0.064 |
0.070 |
|
TAXI 8 |
Non-franchised Buses >=15 tonne |
0.098 |
0.215 |
0.080 |
0.060 |
0.065 |
|
TAXI 10 |
Single Deck Franchised Buses |
0.000* |
0.161 |
0.080 |
0.044 |
0.047 |
* The emission factors are zero in these cases as there are no Public Light Bus on any of the road links, no taxi on Toll Plaza with auto-tolled booths, no Private Light Buses <=3.5 tonne on Local Road and Toll Plaza with auto-tolled booths, no Private Light Buses >3.5 tonne on Local Road, nor no Single Deck Franchised Buses on the Local Road within the study area.
4.9.3 Modelling Results from Open Roads
4.9.3.1 The predicted hourly NO2 and RSP concentrations were derived from the CALINE4 modelling at 1.5m, 5m, 10m, 15m and 20m above ground for both Tuen Mun and the Lantau area at the representative ASRs in the study area. The results at 1.5m above ground are incldued in Appendix B12.
4.9.4 Modelling Results from Tunnel/Portal/Point/Area Sources
4.9.4.1 The predicted hourly, average NO2 and RSP concentrations were derived from the ISCST3 modelling at 1.5m, 5m, 10m, 15m and 20m above ground for both Tuen Mun and the Lantau area at the representative ASRs in the study area.
4.9.5 Cumulative Modelling Results
4.9.5.1 During the operational phase, the predicted maximum overall hourly, 24-hour and annual averaged NO2 and RSP concentrations have been calculated as described in Section 4.7.8 from combining the following results:
(i) predicted concentrations of background sources calculated by the PATH model;
(ii) background sources calculated by ISCST3, that is, Green Island Cement, Pillar Point Landfill flare and the Butterfly Laundry);
(iii) open road emissions calculated using CALINE4, including TM-CLKL, existing roads (eg NLH, Lung Mun Road, airport island) and, also, the emissions from the open roads of the concurrent projects of HKBCF and HKLR; and
(iv) emissions from the tunnel portals and ventilation buildings derived from ISCST3 for each hour at each sensitive receiver for the TM-CLKL (including the toll plaza underpass), HKLR and TMWB, together with the emissions from idling traffic on the HKBCF.
(i) A small area at at the TMWB tunnel portal in Tuen Mun, which indicates the hourly average NO2 level to be above 300µg/m3 (Figure 4.12b). As this area itself is zone as “Green Belt”, this is not justified as an exceedance;
(ii) A small area at the River Trade Terminal next to the TM-CLKL tunnel portal in Tuen Mun, which indicates the hourly average NO2 level to be above 300µg/m3 (Figure 4.12b). As this area itself is considered as a traffic emission source (non-air sensitive land use), this is not justified as an exceedance; and
(iii) A small area at the TM-CLKL tunnel portal in Tuen Mun which indicates the daily average NO2 level to be above 150µg/m3 (Figure 4.13b). As this area is part of the TM-CLKL project, this is not justified as an exceedance.
Table 4.14 Predicted Maximum Overall Hourly, 24-hour and Annual NO2 and RSP Concentrations (µg/m3) at ASRs (including background levels) for 1.5AG
|
Receiver Reference |
NO2(µg/m3) |
RSP(µg/m3) |
|||
|
1-hour (300 (µg/m3) |
24-hour ( 150µg/m3) |
Annual (80µg/m3) |
24-hour (180 (µg/m3) |
Annual (55µg/m3) |
|
|
ASR2 |
206 |
99 |
45 |
103 |
48 |
|
ASR3 |
256 |
106 |
44 |
111 |
48 |
|
ASR5 |
258 |
115 |
60 |
110 |
49 |
|
ASR6 |
223 |
126 |
52 |
125 |
50 |
|
ASR7 |
225 |
109 |
52 |
106 |
48 |
|
ASR8 |
216 |
109 |
28 |
89 |
43 |
|
ASR9A |
203 |
124 |
52 |
92 |
45 |
|
ASR9B |
199 |
115 |
53 |
91 |
45 |
|
ASR9C |
196 |
109 |
53 |
91 |
45 |
|
ASR10 |
245 |
133 |
46 |
131 |
49 |
|
ASR11A |
203 |
114 |
36 |
92 |
44 |
|
ASR11B |
205 |
119 |
44 |
92 |
45 |
|
ASR11C |
201 |
116 |
43 |
92 |
45 |
|
ASR12A |
188 |
100 |
35 |
90 |
44 |
|
ASR12B |
205 |
129 |
62 |
93 |
46 |
|
ASR12C |
210 |
130 |
62 |
94 |
46 |
|
ASR13 |
184 |
101 |
38 |
91 |
44 |
|
ASR14 |
168 |
71 |
26 |
93 |
46 |
|
ARS15 |
196 |
111 |
31 |
91 |
44 |
4.9.5.3 The ASRs at the existing Tung Chung Town (North of NLH) have been considered in the EIA for the HKBCF. According to their findings, their predicted NO2 and RSP levels would comply with the relevant criteria in EIAO-TM and HKAQO. Hence there would be no adverse cumulative impact caused.
4.9.6 In-tunnel and In-underpass Air Quality Assessment
4.9.6.1 In accordance with the “Practice Note or Control of Air Pollution in Vehicle Tunnels”, the air quality inside the tunnel should achieve the EPD recommended standard of 1ppm NO2 concentration. As advised by the ventilation engineer, the air quality inside the tunnel of TM-CLKL would comply with the above standard, which is the design requirement for the tunnel ventilation system.
4.9.6.2 Air quality inside the underpass was assessed based on the empirical formulae of fluid dynamics. A conversion factor of 12.5% including tailpipe NO2 emission (7.5% of NOx) plus 5% of NO2/NOx for tunnel air recommend in PIARC for air expelled from the tunnel was taken in the assessment. The assessment inside the underpass under normal traffic flow condition of vehicles was conducted at a speed of 30 kph. The detailed calculation of the inside underpass air quality assessments is shown in Appendix B13.
4.9.6.3 The calculated maximum NO2 concentration at normal traffic flow condition inside the proposed underpass is 423µg/m3, which complies with the Tunnel Air Quality Guideline as stated in Section 4.1.3.1.
4.10 Residual Impacts
4.10.1.1 No adverse residual impacts during the operational phase are predicted. However, for the construction phase, marginal exceedances of the annual average TSP levels at some sensitive receivers in Tuen Mun are predicted to occur. The magnitude of the residual impact is assessed in accordance with Section 4.4.3 of the TM-EIAO in Table 4.15 below.
Table 4.15 Assessment of Residual Impacts from Annual Construction Dust
|
Criteria |
Assessment |
|
Effects on public health and health of biota or risk to life. |
The dust generated during the construction works are unlikely to contain a significant proportion of fine particulates (less than 10 µm) which are deemed to the respirable and therefore have the potential to affect health if breathed in. In addition, about 99% of inhaled particulate matter is considered to be either exhaled or trapped in the upper areas of the respiratory system and expelled and as such, would be deemed to be more of a nuisance than a health risk. |
|
Magnitude of the adverse environmental impacts. |
The annual background levels in the area are already above the standard at 103 µg/m3 and the contribution of the project to dust levels in the area is relatively minor, being <3% (equivalent to 3.8% based on the AQO for annual average TSP level) at all ASRs. The only other concurrent project being undertaken in the vicinity is the TMWB but significant dust emissions from the tunnel works are not expected and as such, the TM-CLKL will not contribute to cumulative impacts with other projects. |
|
Geographic extent of the adverse environmental impacts. |
The geographic extent of the adverse impacts from dust will not be large and will be limited to within about 200m from the TM-CLKL works area. |
|
Duration and frequency of the adverse environmental impacts. |
The construction-phase impacts of TM-CLKL construction will be of short to moderate duration and, therefore, temporary and reversible. |
|
Likely size of the community or the environment that may be affected by the adverse impacts. |
As the impacts will be confined to a relatively small area, only a few ASRs in the immediate vicinity will be temporarily affected. |
|
Degree to which the adverse environmental impacts are reversible or irreversible. |
Construction-phase impacts should be reversible. |
|
Ecological context. |
The ecological value of the area is low given that is largely disturbed and developed already and occupied by commercial and industrial facilities. |
|
Degree of disruption to sites of cultural heritage. |
Not applicable |
|
International and regional importance. |
The impacts are localised and not of international and regional importance. |
|
Likelihood and degree of uncertainty of adverse environmental impacts. |
The impacts predicted are based upon worst case assumptions and modelling parameters and as such, would not occur to the extent predicted on all occasions. However, the assessment has been made using approved mathematical modelling techniques and the degree of certainty on the results is high. |
4.10.1.2 Based upon the above, the following factors should be considered in determining the residual impacts associated with the annual average dust levels:
· the dust impacts are not predicted to significantly affect their health or cause loss of life;
· the predicted impacts are temporary and reversible;
· impacts are localised and not of international and regional importance.
· the geographic extent of the adverse impacts is confided to a small area around the works site;
· the mitigation measures proposed will reduce the levels of impacts;
· the study area has not shown itself to be fragile or undisturbed;
· the TM-CLKL itself will not trigger cumulative impacts; and
· the contribution from the TM-CLKL to the background levels would be small overall, based upon the worst case assumptions and modelling.
4.10.1.3 Based upon these factors, the residual impacts associated with the annual dust exceedances for the TM-CLKL in Tuen Mun would be considered minor and acceptable.
4.11 Environmental Monitoring and Audit
4.11.1.1 The assessment has concluded that mitigated construction dust impacts are within the acceptable levels and no adverse residual impacts will occur. However, it is recommended that, given the close proximity of the ASRs to the works site, that construction phase environmental monitoring and audit is undertaken to ensure that there are no adverse impact during the implementation of the construction activities and ensure that recommended mitigation measures are implemented. EM&A during the operational phase is not required. Further details of the specific EM&A requirements are detailed in Section 15 of this report and in the EM&A Manual.
4.12 References
Screening Procedures for Estimating the Air Quality Impact of Stationary Sources, Revised, USEPA, EPA-454/R-92-019.
Permanent International Association of Road Congress Report (PIARC, 1991).
Guideline on Modelling Vehicle Emission, EPD.
Wisconsin Department of Natural Resources, http://dnr.wi.gov/air/aq/pollutant/tspart.htm