Page
13.2..... Literature Review for Environmental Legislation, Standards and Guidelines
13.3..... Development of Conceptual Model
13.4..... Hazard Identification
13.6..... Exposure Response Relationship
13.7..... Risk Characterization
13.8..... Reuse of Effluent Water
13.11... Risk Control and Management
LIST OF TABLES
Table 13.1 TAPs from Criteria Air
Pollutants of HKAQOs
Table 13.2 TAP Considered in Various
STW-related Literature and Guidelines
Table 13.3 Basis of the Toxicity Values from
Various Standards / Guidelines
Table 13.4 Toxicity Criteria of the
Non-carcinogenic Risk Assessment of the Identified TAPs
Table 13.5 Toxicity Criteria of
Carcinogenic Risks of the Identified TAPs
Table 13.6 List of Detectable TAPs
Table 13.7 List of Non-detectable TAPs
Table 13.8 Summary of short-listed TAPs for
Non-Carcinogenic Risk Assessment
Table 13.9 Summary of short-listed TAPs for
Carcinogenic Risk Assessment
Table 13.11 Summary of Concentration Levels
of Detectable TAPs at Emission Sources
Table 13.12 Removal Efficiency of Deodourizer
for Different TAPs
Table 13.13 Summary of Maximum Incremental
Concentration of TAPs with Non-carcinogenic Risk Level
Table
13.14 Background
Concentration of Criteria Pollutants from PATH Model
Table 13.15 Background TAPs Concentrations
Table 13.16 Maximum Predicted Cumulative
Annual Average Concentrations of TAPs
Table 13.17 Maximum Predicted Cumulative
Hourly Average Concentrations of TAPs
Table 13.18 Cancer Risk Guidance
Table 13.19 Total Incremental Cancer Risk
due to the Identified TAPs
Table 13.20 Indoor Air Quality Objectives for
Office and Public Places
Table 13.21 Potential Accidental Events and
Preventive Measures
List of DIAGRAMS
Diagram 13.01 Detailed UK Format for Health Risk
Assessment Conceptual Process
Diagram 13.02 Schematic Flow of Treatment Process
for Relocated STSTW
LIST OF FIGURES
60334056/EIA/13.01 Potential
Hukman Receptors for Health Impact From kRelocated STSTW
LIST OF APPENDICES
Appendix 13.01 Review
of TAP Toxicity Values
Appendix 13.02 TAP
Carcinogenic Effect and Classification
Appendix 13.03 Summary
of TAP Analysis and Emission Inventory
Appendix 13.04 Report
of TAPs Sampling and Analysis for Concentration
Appendix 13.05 Report
of TAPs Sampling and Analysis for Emission Rate
Appendix 13.06 (a to dd)
Calculation of Emission Rate of CSTW
Appendix 13.08 (a to
v)Predicted Cancer Risk of TAPs at Human Receptors
13
HEALTH IMPACT
13.1 Introduction
13.1.1.1 This section presents the framework for assessing potential health impact on the adjacent population in relation to Toxic Air Pollutants (TAPs) emissions associated with activities during the operation of the CSTW and the assessment findings.
13.1.1.2 With reference to Section 3.4.10.2 of the EIA Study Brief No. ESB-273/2014 for this Project, the Health Impact Assessment (HIA) shall cover the following aspects:
· TAPs emissions associated with activities during the operation of the CSTW; and
· Effluent reuse activities.
13.1.1.3 It should be noted that some TAPs may have malodorous properties at concentrations below those for toxic effects. However, the objective of this section is to assess the TAPs potential health impact against the toxicity criteria. Details of potential odour impact are addressed separately in Section 3 of this EIA Report.
13.2 Literature Review for Environmental Legislation, Standards and Guidelines
13.2.1
United Kingdom (UK) and European Union (EU) Guidance
13.2.1.1 The UK Department of Environment, Food, and Rural Affairs (DEFRA) under its previous name Department of Environment Transport and Regions (DETR) published definitive Guidelines for Environmental Risk Assessment and Management (refers to Diagram 13.01) in 2000.
Diagram 13.01 Detailed
UK Format for Health Risk Assessment Conceptual Process

13.2.1.2 In Europe, this guidance also formed the foundation for the later guidance recommended by European Groundwater and Contaminated Land Remediation Information System (EUGRIS). The EUGRIS group represents 6 countries: Denmark, France, Germany, Hungary, Italy and United Kingdom, and it is coordinated by the Federal Environmental Agency of Germany. They have developed "Integrated Soil and Water Protection: Risks from Large Scale Diffuse Pollution" (EURIG-SOWA, 2005), which recommends utilizing the UK DEFRA guidance for health risk assessment.
13.2.1.3 More recently Scotland and Ireland have developed an updated version of the DEFRA/DETR 2000 document, which they have published as “Scotland & Northern Ireland Forum for Environmental Research” (SNIFFER, 2007) guide. Although it references locally specific regulations, it contains the same fundamental principles and structure.
13.2.1.4 In addition, World Health Organization (WHO) has also sponsored an effort to harmonize the various guidance documents for Human Health Risk Assessment (HHRA). In 2010 they have developed a Human Health Risk Assessment Toolkit: Chemical Hazards. It offers a simplified approach, when appropriate, for the local project situation.
13.2.2 USEPA Guidance
13.2.2.1 The USEPA has published many specific guidance documents for various aspects of HHRA following the landmark “Risk Assessment in the Federal Government: Managing the Process” (NRC, 1983) publication of the most fundamental guide to principles for practice in the US. Several US states such as California, Minnesota and Texas have also developed separate regulatory programs specific to various industrial systems and new facilities in their states, for which chemical emissions to the air, water or soil are of concern. The principal USEPA versions identified below are those that most closely resemble the UK DEFRA Guidelines (2000) detailed above.
13.2.2.2 The particular USEPA publications most relevant to HHRA for HIA use include:
a) “Risk Characterization Policy; Guidance for Cumulative Assessment, Part 1: Planning and Scoping” (USEPA, 1997a);
b) Risk Assessment Guidance for Superfund, or RAGS http://www.epa.gov/oswer/riskassessment/risk_superfund.htm) (USEPA, 1989a- current); and
c) The current chemical toxicity database system: IRIS, the Integrated Risk Information System (http://www.epa.gov/iris/ , 2015).
13.2.3 Approach Determination
13.2.3.1 All of these versions call for the following general steps for HHRA and require a staged approach as follows:
Stage 1: Development of Conceptual Model of the Site
Stage 2: Hazard Identification
Stage 3: Exposure Assessment
Stage 4: Exposure Response Relationship
Stage 5: Hazard / Risk Characterization and Assessment
Stage 6: Risk
Control and Management
13.3 Development of Conceptual Model
13.3.1.1 In several previous EIA projects around the globe, including the UK, Israel, and Hong Kong (Integrated Waste Management Facilities EIA Report, EIA Study Brief No. ESB- 184/2008), a Conceptual Site Model (CSM) has been developed as an initial step. This step precedes the use of a predictive air quality model, such as the ISCST3 model, for detailed quantitative calculations of potential environmental air concentrations to support the advanced risk assessment. This quantitative analysis is performed after completion of the CSM, and upon agreement with the responsible agency on the results of the subsequent qualitative strategic review that determines which calculations are necessary and most appropriate.
13.4 Hazard Identification
13.4.1
General
13.4.1.1 The purpose of the hazard identification is to identify TAPs of potential concern for quantitative evaluation and to generate emissions estimates for non-carcinogenic (short- term (acute) and long-term (chronic)) and carcinogenic risks of exposure to the selected TAPs.
13.4.2
Sewage Treatment Process and Potential TAPs
13.4.2.1 As explained in Section 2 of this EIA Report, in order to meet the required effluent quality, the treatment process of biological treatment is proposed. The process of biological treatment for relocated STSTW is schematically illustrated in Diagram 13.02 below:
Diagram 13.02 Schematic Flow of Treatment Process for
Relocated STSTW
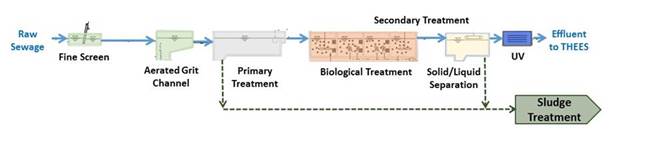
13.4.2.2 As noted above, the preliminary plan for the disinfection stage for the relocated STSTW will utilize UV irradiation instead of sodium hypochlorite (NaOCl) or other forms of chlorine. Because this avoids additional, but manageable, hazards of fugitive chlorine gas exposures to the public, chlorine gas related hazards were not included in this study. Only certain chlorinated chemical compounds, such as chloroform, were considered in the assessment due to reported presence and potential discharge of such compounds (of unknown origin) from the incoming raw sewage.
13.4.2.3 As explained in Section 2 of this Report, no anaerobic digestion with digesters are proposed inside caverns owing to fire safety and health concerns. With anaerobic digestion for the sludge treatment eliminated, the essential condition for the production of methane, i.e. a consistent anaerobic environment, would no longer exist, and therefore methane was excluded from this study.
13.4.2.4 Under normally controlled conditions, remaining organic matter entering any of the tanks (and forming sludge) can be decomposed by micro-organisms aerobically. The resultant products are primarily carbon dioxide and water:
Organic matter + oxygen
→ energy + carbon dioxide
+ water
13.4.2.5 When the organic load exceeds the carrying capacity of oxygen within the water, oxygen is not available for aerobic digestion. If seawater is used as the alternative source of oxygen for anaerobic digestion by micro-organisms, sulphate in the seawater can react with the organic matters to produce hydrogen sulphide. Organic-rich sediments act as a substrate for the action of sulphate-reducing bacteria (SRBs), which reduce sulphate in the absence of oxygen. Organic sulphur compounds, such as mercaptans, can also intensify any odours from hydrogen sulphide in a similar process:
Organic matter + sulphate → energy
+ hydrogen sulphide
(H2S) + water
Organic matter with sulphide → energy + mercaptans + water (minor pathway)
13.4.2.6 Both hydrogen sulphide and mercaptans contribute to odour. In upset conditions, indoor exposures to trapped H2S can potentially give rise to health effect to humans.
13.4.2.7 Incoming raw sewage are products of various daily activities like flushing and cleaning and therefore have complicated composition and may carry many different chemicals, which is also a source of TAPs. However, the concentration is believed to be very low as they were diluted by the flushing water or tap water.
13.4.3
Literature Review for Chemicals of Potential Concern (COPC)
13.4.3.1 A literature search for the published list of TAPs was carried out from various sources including:
· EPD of HKSAR government published criteria air pollutants specified under the AQOs;
· EPD published technical memorandum under the APCO (Cap.311); and
· USEPA published list of Hazardous Air Pollutants (HAPs) under the Clean Air Act, 1990.
13.4.3.2 The criteria air pollutants for which standards are specified under the AQOs in Hong Kong include sulphur dioxide, respirable suspended and fine suspended particulates, nitrogen dioxide, ozone, carbon monoxide and lead. These criteria air pollutants are regarded as indicators of air quality in Hong Kong and continuously monitored by EPD.
13.4.3.3 Of these criteria air pollutants, respirable suspended and fine particulates are normally generated from human activities such as the burning of fossil fuels in vehicles and other combustion activities. To minimize fire risks in caverns, no combustion activities would be allowed within the caverns. The operation of vehicles would be minimal and limited to that required for sludge delivery and staff transport only. For the above reasons, respirable suspended and fine particulates were not considered further in this study.
13.4.3.4 Ozone is mainly formed by photochemical reactions in the atmosphere in daylight. As the UV disinfection for the relocated STSTW would be conducted in water using UV lamps designed to minimize ozone generation (e.g. with doped quartz sleeves to restrict UV wavelengths favourable for ozone formation), the production of ozone (O3) would be negligible, and therefore ozone was not covered in this assessment.
13.4.3.5 The major source of heavy metals in the ambient air is from the traffic vehicles with combustion of fossil fuels. The heavy metals detected in air samples are bound to particulate matters. As discussed in the paragraph above, there is no combustion activities allowed inside the caverns and the use of vehicles in the relocated cavern STW is limited and should not be a concern. Hence, the heavy metals were not considered further in this assessment.
13.4.3.6 Therefore, three criteria air pollutants of Hong Kong’s AQOs, namely sulphur dioxide, nitrogen dioxide and carbon monoxide, were selected for further assessment as shown in Table 13.1.
Table 13.1 TAPs from Criteria Air Pollutants of HKAQOs
|
Item |
Chemical |
Source |
|
1 |
Sulphur dioxide |
Criteria air pollutants |
|
2 |
Nitrogen dioxide |
Criteria air pollutants |
|
3 |
Carbon monoxide |
Criteria air pollutants |
13.4.3.7 Apart from the criteria pollutants, a number of TAPs would be emitted from the operation of relocated STSTW. Relevant literatures as published since 1980 on STW were also selected for review. These literatures cover various countries including United States, New Zealand, United Kingdom, Japan, France, and Canada. Table 13.2 presents a summary of the review results with the TAPs as studied in these STW-related literatures and relevant guidelines as described in Section 13.4.3.1.
Table 13.2 TAP Considered in
Various STW-related Literature and Guidelines
|
Item |
Chemical |
USEPA [NOTE1] |
HKEPD [NOTE2] |
Group of Species |
Reference Study/ Literature in Section 13.13.1 |
|
4 |
Hydrogen
sulphide |
|
|
Inorganic compound |
[1]-[4],
[7]-[10], [12], [15]-[19], [22]-[24], [25] |
|
5 |
Ammonia
|
|
|
Inorganic compound |
[1]-[3],
[7], [9], [12], [15]-[16], [18], [21], [23]-[24], [25] |
|
6 |
Dimethyl
sulphide |
|
|
Organosulfur compound |
[10],
[12], [15], [17], [18], [24] |
|
7 |
Diethyl
sulphide |
|
|
Organosulfur compound |
[16] |
|
8 |
Acetone |
|
|
Ketone |
[5],
[6], [8] |
|
9 |
Butanone
(Methyl
ethyl ketone) |
|
|
Ketone |
[8],
[11], [13] |
|
10 |
Acetaldehyde |
√ |
|
VOCs |
[2],
[7], [24] |
|
11 |
Benzene |
√ |
√ |
VOCs |
[5],
[13], [22], [26] |
|
12 |
Carbon
disulphide |
√ |
|
VOCs |
[16],
[17] |
|
13 |
Carbon
tetrachloride |
√ |
√ |
VOCs |
[26] |
|
14 |
Chlorobenzene |
√ |
|
VOCs |
[5],
[26] |
|
15 |
Chloroform |
√ |
√ |
VOCs |
[5],
[6], [22], [26] |
|
16 |
Formaldehyde |
√ |
√ |
VOCs |
[12] |
|
17 |
Hexane
(or n-hexane) |
√ |
|
VOCs |
[11] |
|
18 |
Methanol |
√ |
|
VOCs |
[2] |
|
19 |
Methyl
chloride (Chloromethane) |
√ |
|
VOCs |
[22] |
|
20 |
Methyl
chloroform (1,1,1-Trichloroethane) |
√ |
|
VOCs |
[26] |
|
21 |
Methylene
chloride (Dichloromethane) |
√ |
√ |
VOCs |
[6],
[22] |
|
22 |
Styrene |
√ |
|
VOCs |
[6],
[24] |
|
23 |
1,1,2,2-Tetrachloroethane |
√ |
√ |
VOCs |
[22] |
|
24 |
Tetrachloroethylene
(Perchloroethylene) |
√ |
|
VOCs |
[5],
[22] |
|
25 |
Toluene |
√ |
|
VOCs |
[5],
[6], [11], [13], [22], [26] |
|
26 |
1,2,4-Trichlorobenzene |
√ |
|
VOCs |
[26] |
|
27 |
1,1,2-Trichloroethane |
√ |
|
VOCs |
[5] |
|
28 |
Trichloroethylene |
√ |
√ |
VOCs |
[26] |
|
29 |
Xylenes
(isomers
and mixture) |
√ |
|
VOCs |
[13],
[22], [26] |
|
30 |
Methyl
mercaptan (Methanethiol) |
|
|
VOCs |
[2],
[8], [10], [15], [17], [18] |
|
31 |
Ethyl
mercaptan (Ethanethiol) |
|
|
VOCs |
[2],
[8], [10], [16], [18], [25] |
|
32 |
1,2-Dichloroethane
|
|
|
VOCs |
[26] |
|
33 |
Ethylbenzene |
|
|
VOCs |
[26] |
|
34 |
a-Pinene |
|
|
VOCs |
[13] |
|
35 |
n-Decane |
|
|
VOCs |
[13] |
|
36 |
d-Limonene |
|
|
VOCs |
[13] |
|
37 |
Terpenes |
|
|
VOCs |
[18] |
|
38 |
o-Dichlorobenzene
(1,2-Dichlorobenzene) |
|
|
VOCs |
[22],
[26] |
|
39 |
m-Dichlorobenzene (1,3-Dichlorobenzene) |
|
|
VOCs |
[22],
[26] |
|
40 |
p-Dichlorobenzene
(1,4-Dichlorobenzene) |
|
|
VOCs |
[22],
[26] |
|
41 |
Naphthalene |
√ |
|
PAHs |
[27] |
|
42 |
Benzo(a)Pyrene |
|
√ |
PAHs |
[27] |
|
43 |
Acenaphthylene
|
|
|
PAHs |
[27] |
|
44 |
Acenaphthene
|
|
|
PAHs |
[27] |
|
45 |
Fluorene
|
|
|
PAHs |
[27] |
|
46 |
Phenanthrene
|
|
|
PAHs |
[27] |
|
47 |
Anthracene
|
|
|
PAHs |
[27] |
|
48 |
Fluoranthene
|
|
|
PAHs |
[27] |
|
49 |
Pyrene
|
|
|
PAHs |
[27] |
|
50 |
Benz(a)anthracene
|
|
|
PAHs |
[27] |
|
51 |
Chrysene
|
|
|
PAHs |
[27] |
|
52 |
Benzo(b)fluoranthene
|
|
|
PAHs |
[27] |
|
53 |
Benzo(k)fluoranthene
|
|
|
PAHs |
[27] |
|
54 |
Indeno
(1,2,3-cd)pyrene |
|
|
PAHs |
[27] |
|
55 |
Dibenz(a,h)anthracene
|
|
|
PAHs |
[27] |
|
56 |
Benzo(g,h,i)perylene
|
|
|
PAHs |
[27] |
Notes:
[NOTE1] USEPA published list of Hazardous Air Pollutants under
the Clean Air Act, 1990
[NOTE2] HKEPD published technical memorandum under the Air Pollution
Control Ordinance (Cap.311)
13.4.3.8
The review of STW-related
literature and guidelines as described above have identified total 56 nos.
TAPs. These 56 nos. TAPs, as summarized in Table 13.1
and Table 13.2 above, has established the
initial long TAP list for further quantitative evaluation.
13.4.4 Literature Review for Toxicity Values
13.4.4.1 The purpose of this review is to identify the types of adverse health effects a TAP may potentially cause, and to define the relationship between the concentration of a TAP and the likelihood or magnitude of an adverse health effect (response). Adverse health effects are typically characterized in the health risk assessment as non-carcinogenic health risk, which includes the chronic hazard related to long-term average exposure and acute hazard related to short-term exposure, as well as the carcinogenic health risk.
13.4.4.2 In reference to the chemical summary of USEPA, the chronic health hazard assessment for non-carcinogenic effects could be divided into both chronic inhalation exposure and chronic oral exposure. Since the general public (including visitors) would be restricted from direct contact with the sewage within the sewage treatment works or pumping stations, direct oral exposure by Human Receptors (HRs) is almost impossible to happen. Given the physicochemical characteristics of the TAPs and relatively low concentration, the deposited TAPs onto soil, water or plants (such as vegetables) are so minor that the indirect exposure through the ingestion of soil, water, or locally raised products (beef, dairy, pork and poultry products) are negligible. Therefore, further evaluation of carcinogenic and non-carcinogenic health risks posed by the inhalation exposure to these TAPs shall be undertaken.
13.4.4.3 For carcinogenic health risk, it is measured as the increase in the number of cases of cancer per million populations that is attributable to a TAP. The inhalation risk is expressed as an “inhalation unit risk (IUR)”, defined as the risk of developing cancer if a person is continuously exposed to a unit concentration (usually presented as 1 µg/m3) for a life time of 70 years.
13.4.4.4 For non-carcinogenic health risk, it is measured using an “inhalation reference concentration” (RfC), which is defined as an estimate of a continuous inhalation exposure to a chemical that is likely to be without risk of deleterious noncancer effect. In terms of the exposure duration, the RfC values are divided into chronic RfC for long-term exposure duration (i.e. over one year) and acute RfC for short-term exposure duration (i.e. over 1 hour).
13.4.4.5 To determine the toxicity values (IUR and RfC) for these identified TAPs in Section 13.4.3, various guidelines from international to local were reviewed. With reference to the Health Impact Assessment of the Expansion of Hong Kong International Airport to a Three-Runway System (3RS) (AEIAR-185/2014) in selection of toxicity values, the following hierarchy is established to determine the acceptable values for this assessment:
Worldwide Level:
· WHO
Country Level:
· USEPA’s Integrated Risk Information System (IRIS) (https://cfpub.epa.gov/ncea/iris2/atoz.cfm)
· Agency for Toxic Substances and Disease Registry (ATSDR) under United States Department of Health and Human Services
Local Level:
· Reference exposure levels (RELs) established by Office of Environmental Health Hazard Assessment (OEHHA) under California Environmental Protection Agency (Cal/EPA)
13.4.4.6 The toxicity values for non-carcinogenic pollutants can only be applied if the exposure duration are specified. The basis of the toxicity values amongst different guidelines are different, as illustrated in Section 13.4.4.5. Table 13.3 summarizes the basis for various standards / guidelines:
Table 13.3 Basis of the Toxicity Values from Various
Standards / Guidelines
|
Standards / Guidelines |
Description |
|
WHO |
Typical averaging times
are 24 hours for acute exposure and one year for chronic health effects.
Some guideline values are for health effects with averaging time of 30 min
for acute risk. |
|
USEPA - IRIS |
Based on the concentration
of a chemical that one can breathe every day for a lifetime that is anticipated
to cause harmful health effects. The chronic RfC is for concentration
protective over 7 years. |
|
USHHS - ATSDR |
Minimal Risk Levels (MRLs)
were developed by ATSDR as an estimate of the daily human exposure to a
hazardous substance that is likely to be over a specified duration of
exposure. MRLs are derived for acute (1-14 days) and chronic (365 days and
longer) exposure durations for inhalation routes of exposure. |
|
Cal/EPA - OEHHA |
Reference Exposure Levels
(RELs) were established by OEHHA as an estimate for health risk to humans.
Exposure averaging time for acute RELs is 1 hour and chronic RELs are
designed to address continuous exposure for up to a lifetime. |
13.4.4.7 Appendix 13.01 shows the toxicity values of the identified 56 nos. TAPs and the determination of toxicity values in terms of the hierarchy system as described above. Table 13.4 and Table 13.5 summarize the toxicity values for non-carcinogenic and carcinogenic and risk assessment separately.
Table 13.4 Toxicity Criteria of the Non-carcinogenic
Risk Assessment of the Identified TAPs
|
Item |
Chemical |
Group of Species |
RfC for Chronic Risk
Assessment (μg/m3) |
Standard / Guideline [1] |
RfC for Acute Risk
Assessment (μg/m3) [2] |
Standard / Guideline [3] |
|
1 |
Sulphur dioxide |
Criteria air pollutants |
- [4] |
- |
20 (24 hr) |
WHO |
|
2 |
Nitrogen dioxide |
Criteria air pollutants |
40 (annual) |
WHO |
200 (1 hr) |
WHO |
|
3 |
Carbon monoxide |
Criteria air pollutants |
- [5] |
- |
30000 (1 hr) |
WHO |
|
4 |
Hydrogen
sulphide |
Inorganic compound |
2 |
USEPA-IRIS |
150 (24 hrs) |
WHO |
|
5 |
Ammonia
|
Inorganic compound |
70 |
USHHA-ATSDR |
1190 |
USHHS-ATSDR |
|
6 |
Dimethyl
sulphide |
Organosulfur compound |
- |
- |
- |
- |
|
7 |
Diethyl
sulphide |
Organosulfur compound |
- |
- |
- |
- |
|
8 |
Acetone |
Ketone |
30863 |
USHHS-ATSDR |
61725 |
USHHS-ATSDR |
|
9 |
Butanone
(Methyl ethyl ketone) |
Ketone |
5000 |
USEPA-IRIS |
13000 |
Cal/EPD-OEHHA |
|
10 |
Acetaldehyde |
VOCs |
9 |
USEPA-IRIS |
470 |
Cal/EPD-OEHHA |
|
11 |
Benzene |
VOCs |
10 |
USHHS-ATSDR |
29 |
USHHS-ATSDR |
|
12 |
Carbon
disulphide |
VOCs |
700 |
USEPA-IRIS |
100 (24 hrs) |
WHO |
|
13 |
Carbon
tetrachloride |
VOCs |
100 |
USEPA-IRIS |
1900 |
Cal/EPA-OEHHA |
|
14 |
Chlorobenzene |
VOCs |
1000 |
Cal/EPA-OEHHA |
- |
- |
|
15 |
Chloroform |
VOCs |
98 |
USHHS-ATSDR |
488 |
USHHS-ATSDR |
|
16 |
Formaldehyde |
VOCs |
100 [6] |
WHO |
49 |
USHHS-ATSDR |
|
17 |
Hexane
(or n-hexane) |
VOCs |
700 |
USEPA-IRIS |
- |
- |
|
18 |
Methanol |
VOCs |
20000 |
USEPA-IRIS
|
28000 [7] |
Cal/EPA-OEHHA |
|
19 |
Methyl
chloride (Chloromethane) |
VOCs |
90 |
USEPA-IRIS |
1032 |
USHHS-ATSDR |
|
20 |
Methyl
chloroform (1,1,1-Trichloroethane) |
VOCs |
5000 |
USEPA-IRIS |
10906 |
USHHS-ATSDR |
|
21 |
Methylene
chloride (Dichloromethane) |
VOCs |
600 |
USEPA-IRIS |
3000 (24 hrs) |
WHO |
|
22 |
Styrene |
VOCs |
851 |
USHHS-ATSDR |
21286 [8] |
USHHS-ATSDR |
|
23 |
1,1,2,2-Tetrachloroethane |
VOCs |
- |
- |
- |
- |
|
24 |
Tetrachloroethylene
(Perchloroethylene) |
VOCs |
250 |
WHO |
41 |
USHHS-ATSDR |
|
25 |
Toluene |
VOCs |
3766 [9] |
USHHS-ATSDR |
7533 |
USHHS-ATSDR |
|
26 |
1,2,4-Trichlorobenzene |
VOCs |
- |
- |
- |
- |
|
27 |
1,1,2-Trichloroethane |
VOCs |
- |
- |
- |
- |
|
28 |
Trichloroethylene |
VOCs |
2 |
USEPA-IRIS
|
- [10] |
- |
|
29 |
Xylenes
(isomers and mixture) |
VOCs |
870 |
WHO |
8679 |
USEPA-IRIS |
|
30 |
Methyl
mercaptan (Methanethiol) |
VOCs |
- |
- |
- |
- |
|
31 |
Ethyl
mercaptan (Ethanethiol) |
VOCs |
- |
- |
- |
- |
|
32 |
1,2-Dichloroethane
|
VOCs |
2427 |
USHHS-ATSDR |
700 (24 hrs) |
WHO |
|
33 |
Ethylbenzene |
VOCs |
22000 |
WHO |
21699 |
USHHS-ATSDR |
|
34 |
a-Pinene |
VOCs |
- |
- |
- |
- |
|
35 |
n-Decane |
VOCs |
- |
- |
- |
- |
|
36 |
d-Limonene |
VOCs |
- |
- |
- |
- |
|
37 |
Terpenes |
VOCs |
- |
- |
- |
- |
|
38 |
o-Dichlorobenzene
(1,2-Dichlorobenzene) |
VOCs |
- |
- |
- |
- |
|
39 |
m-Dichlorobenzene(1,3-Dichlorobenzene) |
VOCs |
- |
- |
- |
- |
|
40 |
p-Dichlorobenzene
(1,4-Dichlorobenzene) |
VOCs |
60 |
USHHS-ATSDR |
12017 |
USHHS-ATSDR |
|
41 |
Naphthalene |
PAHs |
10 |
WHO |
- |
- |
|
42 |
Benzo(a)Pyrene
|
PAHs |
- |
- |
- |
- |
|
43 |
Acenaphthylene
|
PAHs |
- |
- |
- |
- |
|
44 |
Acenaphthene
|
PAHs |
- |
- |
- |
- |
|
45 |
Fluorene
|
PAHs |
- |
- |
- |
- |
|
46 |
Phenanthrene
|
PAHs |
- |
- |
- |
- |
|
47 |
Anthracene
|
PAHs |
- |
- |
- |
- |
|
48 |
Fluoranthene
|
PAHs |
- |
- |
- |
- |
|
49 |
Pyrene
|
PAHs |
- |
- |
- |
- |
|
50 |
Benz(a)anthracene
|
PAHs |
- |
- |
- |
- |
|
51 |
Chrysene
|
PAHs |
- |
- |
- |
- |
|
52 |
Benzo(b)fluoranthene
|
PAHs |
- |
- |
- |
- |
|
53 |
Benzo(k)fluoranthene
|
PAHs |
- |
- |
- |
- |
|
54 |
Indeno
(1,2,3-cd)pyrene |
PAHs |
- |
- |
- |
- |
|
55 |
Dibenz(a,h)anthracene
|
PAHs |
- |
- |
- |
- |
|
56 |
Benzo(g,h,i)perylene
|
PAHs |
- |
- |
- |
- |
Notes:
[1] The
hierarchy in selecting reference standard for chronic risk is WHO > More Stringent
Value from USEPA – IRIS and USHHS – ATSDR > CAL/EPA-OEHAA.
[2] The
hierarchy in selecting the WHO averaging time for acute risk is WHO (1 hr) >
WHO (24 hr) > WHO (8 hr). The guidance values for averaging time less than 1
hr (such as 15 min or 30 min) and 1 week are not adopted unless particularly
specialised in the WHO guidance, e.g. formaldehyde have the 30 min guideline
value but it is also applicable for long-term effects according to the
guideline by WHO [note 6 below]).
[3] The
hierarchy in selecting reference standard for acute risk is WHO > USHHS –
ATSDR > CAL/EPA-OEHHA (no acute risk level from USEPA-IRIS).
[4] According
to WHO Air Quality Guidelines, the air quality guideline values for sulphur
dioxide are for averaging time of 1 hour and 10 min. Thus, the chronic risk
level for averaging time of 1 year is not available.
[5] According
to WHO Air Quality Guidelines for Europe, the air quality guideline values for
carbon monoxide are for averaging time of 24 hour and 8 hours. Thus, the chronic
risk level for averaging time of 1 year is not available.
[6] According
to WHO Guideline for Indoor Air Quality (IAQ), the short-term (30-min)
guideline of 0.1mg/m3 of formaldehyde will also prevent long-term
health effects, including cancer.
[7] According
to WHO (Environmental Health Criteria), the occupational exposure limit for
methanol is 260 mg/m3 for an 8 hr working day. But the data is for
comparison and reference only, data on human dermal exposure methanol is
limited for establishment of guidance values.
[8] According
to WHO Air Quality Guidelines for Europe, only odour detection threshold level
of 70 µg/m3 was set as the air quality guideline for styrene. Hence
it is not selected as acute RfC.
The combined impact of all odorous chemicals was addressed in Section 3 of this EIA
Report.
[9] According
to WHO Air Quality Guidelines for Europe, the air quality guideline values for
toluene are for averaging time of 1 week. Thus, the chronic risk level for
averaging time of 1 year is not available.
[10] According
to WHO, the air quality guideline value for trichloroethylene is a
time-weighted average recommended by study group for reference. These values
are varied from different nations without final conclusion. Thus the value is
not adopted.
Table 13.5 Toxicity Criteria of Carcinogenic Risks of the Identified TAPs
|
Item |
Chemical |
Group of Species |
IUR (μg/m3)-1 |
Standard / Guideline [1] |
|
1 |
Sulphur
dioxide |
Criteria air pollutants |
- |
- |
|
2 |
Nitrogen
dioxide |
Criteria air pollutants |
- |
- |
|
3 |
Carbon
monoxide |
Criteria air pollutants |
- |
- |
|
4 |
Hydrogen
sulphide |
Inorganic compound |
- |
- |
|
5 |
Ammonia
|
Inorganic compound |
- |
- |
|
6 |
Dimethyl
sulphide |
Organosulfur compound |
- |
- |
|
7 |
Diethyl
sulphide |
Organosulfur compound |
- |
- |
|
8 |
Acetone |
Ketone |
- |
- |
|
9 |
Butanone
(Methyl ethyl ketone) |
Ketone |
- |
- |
|
10 |
Acetaldehyde |
VOCs |
2.2E-06 |
USEPA-IRIS |
|
11 |
Benzene |
VOCs |
6.0E-06 |
WHO |
|
12 |
Carbon
disulphide |
VOCs |
- |
- |
|
13 |
Carbon
tetrachloride |
VOCs |
6.0E-06 |
USEPA-IRIS |
|
14 |
Chlorobenzene |
VOCs |
- |
- |
|
15 |
Chloroform |
VOCs |
2.3E-05 |
USEPA-IRIS |
|
16 |
Formaldehyde |
VOCs |
1.3E-05 |
USEPA-IRIS |
|
17 |
Hexane
(or n-hexane) |
VOCs |
- |
- |
|
18 |
Methanol |
VOCs |
- |
- |
|
19 |
Methyl
chloride (Chloromethane) |
VOCs |
- |
- |
|
20 |
Methyl
chloroform (1,1,1-Trichloroethane) |
VOCs |
- |
- |
|
21 |
Methylene
chloride (Dichloromethane) |
VOCs |
1.0E-08 |
USEPA-IRIS |
|
22 |
Styrene |
VOCs |
- |
- |
|
23 |
1,1,2,2-Tetrachloroethane |
VOCs |
5.8E-05 |
OEHHA |
|
24 |
Tetrachloroethylene
(Perchloroethylene) |
VOCs |
2.6E-07 |
USEPA-IRIS |
|
25 |
Toluene |
VOCs |
- |
- |
|
26 |
1,2,4-Trichlorobenzene |
VOCs |
- |
- |
|
27 |
1,1,2-Trichloroethane |
VOCs |
1.6E-05 |
USEPA-IRIS |
|
28 |
Trichloroethylene |
VOCs |
4.3E-07 |
WHO |
|
29 |
Xylenes
(isomers and mixture) |
VOCs |
- |
- |
|
30 |
Methyl
mercaptan (Methanethiol) |
VOCs |
- |
- |
|
31 |
Ethyl
mercaptan (Ethanethiol) |
VOCs |
- |
- |
|
32 |
1,2-Dichloroethane
|
VOCs |
2.6E-05 |
USEPA-IRIS |
|
33 |
Ethylbenzene |
VOCs |
2.5E-06 |
OEHHA |
|
34 |
a-Pinene |
VOCs |
- |
- |
|
35 |
n-Decane |
VOCs |
- |
- |
|
36 |
d-Limonene |
VOCs |
- |
- |
|
37 |
Terpenes |
VOCs |
- |
- |
|
38 |
o-Dichlorobenzene
(1,2-Dichlorobenzene) |
VOCs |
- |
- |
|
39 |
m-Dichlorobenzene(1,3-Dichlorobenzene) |
VOCs |
- |
- |
|
40 |
p-Dichlorobenzene
(1,4-Dichlorobenzene) |
VOCs |
1.1E-05 |
OEHHA |
|
41 |
Naphthalene |
PAHs |
3.4E-05 |
OEHHA |
|
42 |
Benzo(a)Pyrene
|
PAHs |
8.7E-02 |
WHO |
|
43 |
Acenaphthylene
|
PAHs |
- |
- |
|
44 |
Acenaphthene
|
PAHs |
- |
- |
|
45 |
Fluorene
|
PAHs |
- |
- |
|
46 |
Phenanthrene
|
PAHs |
- |
- |
|
47 |
Anthracene
|
PAHs |
- |
- |
|
48 |
Fluoranthene
|
PAHs |
- |
- |
|
49 |
Pyrene
|
PAHs |
- |
- |
|
50 |
Benz(a)anthracene
|
PAHs |
1.1E-04 |
OEHHA |
|
51 |
Chrysene
|
PAHs |
1.1E-05 |
OEHHA |
|
52 |
Benzo(b)fluoranthene
|
PAHs |
1.1E-04 |
OEHHA |
|
53 |
Benzo(k)fluoranthene
|
PAHs |
1.1E-04 |
OEHHA |
|
54 |
Indeno
(1,2,3-cd)pyrene |
PAHs |
1.1E-04 |
OEHHA |
|
55 |
Dibenz(a,h)anthracene
|
PAHs |
1.2E-03 |
OEHHA |
|
56 |
Benzo(g,h,i)perylene
|
PAHs |
- |
- |
Note:
[1] The hierarchy in selecting standard
/ guideline is WHO > USEPA – IRIS > CAL/EPA-OEHAA (no IUR value from
USHHS-ATSDR).
13.4.5
TAP Sampling and Laboratory
Analysis
13.4.5.1 The characteristics of the sewage to be treated in the relocated STSTW should be similar to the existing scenario as the catchment remains the same and both facilities will adopt / adopted biological treatment process. The predicted source concentration levels of identified TAPs of sewage treatment facilities for the relocated STSTW therefore make reference to the TAPs concentration levels of treatment facilities in the existing STSTW. The treatment facilities include: open areas of inlet works, screening skips, primary sedimentation tanks, SBR tanks, aeration tanks, final sedimentation tanks, dewatered sludge skips at sludge dewatering house, influent and effluent channels of primary sedimentation tanks, mixed liquor channels for final sedimentation tanks, sludge holding tanks and overflow chambers of the digestion tanks, sludge transfer pumping station, covered surface of primary sedimentation tanks and the sludge dewatering house.
13.4.5.2 Sampling and testing were conducted at the facilities of existing STSTW to build the emission inventory of the TAPs. The findings of TAP analysis for ambient air concentrations are reported in Appendix 13.04, with emission rates results presented in Appendix 13.05.
13.4.5.3 Of those TAPs identified from literature review performed under Section 13.4.3, only 17 nos. TAPs can be detected, as shown in Appendix 13.03 and summarized in Table 13.6. The remaining non-detectable TAPs are believed to be either not exist or with concentration below the detection limit of the apparatus. Some of those detected TAPs have historically been associated with sewage treatment plants in general. These are thus expected to represent those compounds or groups of compounds for which regulatory permit limits may be applicable, whenever they appear to be the most toxic, prevalent, and persistent compounds in sewage treatment plants emissions.
Table 13.6 List of Detectable TAPs
|
Item |
Chemical |
Group of Species |
|
1 |
Sulphur dioxide |
Criteria air pollutants |
|
2 |
Nitrogen dioxide |
Criteria air pollutants |
|
4 |
Hydrogen sulphide |
Inorganic compound |
|
5 |
Ammonia |
Inorganic compound |
|
6 |
Dimethyl sulphide |
Organosulfur compounds |
|
12 |
Carbon disulphide |
VOCs |
|
15 |
Chloroform |
VOCs |
|
18 |
Methanol |
VOCs |
|
21 |
Methylene chloride (Dichloromethane) |
VOCs |
|
24 |
Tetrachloroethylene (Perchloroethylene) |
VOCs |
|
25 |
Toluene |
VOCs |
|
28 |
Trichloroethylene |
VOCs |
|
29 |
Xylenes |
VOCs |
|
33 |
Ethylbenzene |
VOCs |
|
35 |
n-Decane |
VOCs |
|
36 |
d-Limonene |
VOCs |
|
41 |
Naphthalene [1] |
PAHs |
Note:
[1] Naphthalene is
also a chemical compound of VOCs Group.
13.4.5.4 Of these detected TAPs, there are two air-quality related compounds (nitrogen dioxide and sulphur dioxide). Nitrogen dioxide and sulphur dioxide, which are criteria air pollutants of HKAQOs, have generally been found to be common in urban areas around the globe, are primarily the results of transportation, power generation and space heating combustion sources, rather than any direct association with wastewater treatment facilities. However, their inclusion in this assessment study may be useful for establishing their contribution to the “background” health risk situation in the vicinity of both the current and future facility operations.
13.4.5.5 The ammonia and hydrogen sulphide are the main sources of odour issues which may indirectly affect health, even if concentrations are below levels that could cause physical harm. If they or associated mercaptan odours are present at elevated “nuisance” levels, i.e. odour, they may promote public anxiety, which can be an emotional health issue. The combined impact due to various odorous chemicals are discussed in Section 3 of this EIA Report.
13.4.6
Screening of TAPs for Non-carcinogenic Effect
13.4.6.1
Appendix 13.03 presented a summary of TAP analysis for ambient concentrations and
emission inventory. By reviewing the TAP analysis results for the detectable
and undetectable TAPs, it is found that some VOCs, such as formaldehyde,
acetaldehyde and benzene, were not detected at all sampling location. For most
non-detectable TAPs, their measurement detection limits are far below the
toxicity level for both chronic risk and acute risk, as shown in Table
13.7. It is thus concluded that the non-carcinogenic health effect from
these TAPs are small as the detection limit is far below the standards.
Table 13.7 List of Non-detectable TAPs
|
Item |
Chemical |
Group of Species |
Detection Limit (μg/m3) |
Chronic RfC (μg/m3) |
Acute RfC (μg/m3) |
|
3 |
Carbon monoxide |
Criteria air pollutants |
1 |
- |
30000 (1 hr) |
|
7 |
Diethyl sulphide |
Organosulfur compounds |
369 |
- |
- |
|
8 |
Acetone |
Ketone |
237 |
30863 |
61725 |
|
9 |
Butanone (Methyl ethyl ketone) |
Ketone |
295 |
5000 |
13000 |
|
10 |
Acetaldehyde |
VOCs |
36 |
9 |
470 |
|
11 |
Benzene |
VOCs |
3 |
10 |
29 |
|
13 |
Carbon tetrachloride |
VOCs |
6 |
100 |
1900 |
|
14 |
Chlorobenzene |
VOCs |
5 |
1000 |
- |
|
16 |
Formaldehyde |
VOCs |
25 |
100 |
49 |
|
17 |
Hexane (or n-hexane) |
VOCs |
4 |
700 |
- |
|
19 |
Methyl chloride (Chloromethane) |
VOCs |
2 |
90 |
1032 |
|
20 |
Methyl chloroform (1,1,1-Trichloroethane) |
VOCs |
6 |
5000 |
10906 |
|
22 |
Styrene |
VOCs |
4 |
851 |
21286 |
|
23 |
1,1,2,2-Tetrachloroethane |
VOCs |
7 |
- |
- |
|
26 |
1,2,4-Trichlorobenzene |
VOCs |
7 |
- |
- |
|
27 |
1,1,2-Trichloroethane |
VOCs |
1 |
- |
- |
|
30 |
Methyl mercaptan (Methanethiol) |
VOCs |
2 |
- |
- |
|
31 |
Ethyl mercaptan (Ethanethiol) |
VOCs |
3 |
- |
- |
|
32 |
1,2-Dichloroethane |
VOCs |
4 |
2427 |
700 (24 hrs) |
|
34 |
a-Pinene |
VOCs |
6 |
- |
- |
|
37 |
Terpenes |
VOCs |
11 |
- |
- |
|
38 |
o-Dichlorobenzene (1,2-Dichlorobenzene) |
VOCs |
6 |
- |
- |
|
39 |
m-Dichlorobenzene(1,3-Dichlorobenzene) |
VOCs |
6 |
- |
- |
|
40 |
p-Dichlorobenzene (1,4-Dichlorobenzene) |
VOCs |
6 |
60 |
12017 |
|
42 |
Benzo(a)Pyrene |
PAHs |
0.75 |
- |
- |
|
43 |
Acenaphthylene |
PAHs |
0.75 |
- |
- |
|
44 |
Acenaphthene |
PAHs |
0.75 |
- |
- |
|
45 |
Fluorene |
PAHs |
0.75 |
- |
- |
|
46 |
Phenanthrene |
PAHs |
0.75 |
- |
- |
|
47 |
Anthracene |
PAHs |
0.75 |
- |
- |
|
48 |
Fluoranthene |
PAHs |
0.75 |
- |
- |
|
49 |
Pyrene |
PAHs |
0.75 |
- |
- |
|
50 |
Benz(a)anthracene |
PAHs |
0.75 |
- |
- |
|
51 |
Chrysene |
PAHs |
0.75 |
- |
- |
|
52 |
Benzo(b)fluoranthene |
PAHs |
0.75 |
- |
- |
|
53 |
Benzo(k)fluoranthene |
PAHs |
0.75 |
- |
- |
|
54 |
Indeno (1,2,3-cd)pyrene |
PAHs |
0.75 |
- |
- |
|
55 |
Dibenz(a,h)anthracene |
PAHs |
0.75 |
- |
- |
|
56 |
Benzo(g,h,i)perylene |
PAHs |
0.75 |
- |
- |
13.4.6.2 The measurement detection limits of acetaldehyde, benzene and formaldehyde are 36 µg/m3, 3 µg/m3 and 25 µg/m3 respectively. These levels are close to the chronic reference exposure levels of 9 µg/m3 (acetaldehyde), 10 µg/m3 (benzene) and the acute reference exposure level of 49 µg/m3 (formaldehyde). Although it is likely that the new facility may emit similar concentration of these compounds as the existing STSTW, the concentrations of acetaldehyde, benzene and formaldehyde on HRs would be extremely low after a dilution and dispersion factor of approximately 0.126 (i.e. the minimum dispersion factor as derived from dispersion model and tabulated in Appendix 13.07b) upon being released to the ambient air and disperse to HRs from the ventilation shaft. Thus, the potential adverse non-carcinogenic health effects are expected to be within an acceptable risk range, if not negligible.
13.4.6.3 Of all the PAHs, only naphthalene was detected at the existing inlet works. Naphthalene is of both PAHs group and VOC group due to its chemical structure consisting only of a fused pair of benzene rings. The measured detection limit of all the PAHs is 0.75 µg/m3. However, there is no non-carcinogenic inhalation criteria identified in the cited references for the PAHs except for naphthalene. For most PAHs, they have low solubility in water and low volatility, and are therefore predominantly in solid state or suspended in liquid rather than in ambient air. It is thus reasonable to conclude that these PAHs will have no non-carcinogenic adverse health impact even though the exact concentration level or reference level is not available.
13.4.6.4 Of all the identified criteria air pollutants from HKAQOs, carbon monoxide was not detected. The measurement detection limit of carbon monoxide is 2,000 ppb (~ 2289 µg/m3) and this is already far below the chronic reference exposure level limit (10,000 µg/m3) and acute chronic reference exposure level limit (30,000 µg/m3). It is reasonable to conclude, therefore, that carbon monoxide will have no non-carcinogenic adverse health impact even though the exact concentration level is not available.
13.4.6.5 No ketones (acetone or butanone) were detected during site measurement. The measurement detection limit of acetone and butanone is 100 ppb (~ 237 µg/m3 for acetone and ~ 295 µg/m3 for butanone) and this is already far below the chronic reference exposure level (30,836 µg/m3 for acetone and 5,000 µg/m3 for butanone) and the acute reference exposure level (61,725 µg/m3 for acetone and 13,000 µg/m3 for butanone). It is thus reasonable to conclude that these ketones will have no non-carcinogenic adverse health impact even though the exact concentration level is not available.
13.4.6.6 It is thus expected that there are no significant emissions of these undetected pollutants from the existing sewage treatment works. This is because their concentrations are too low to be detected using available methodology. Even if they present at their detection limits, their concentrations would be too low to have non-carcinogenic effect. In light of these results, no adverse non-carcinogenic health effects from these undetected compounds are anticipated under this project.
13.4.6.7 Besides the undetectable TAPs, the 17 nos. detectable TAPs were also reviewed before the quantitative assessment is proceeded. Based on the summary results in Table 13.4, it is observed that there is no published non-carcinogenic risk level (RfC) for dimethyl sulphide, d-limonene or n-decane available from WHO, USEPA-IRIS, USHHS-ATSDR or Cal/EPA-OEHHA. Therefore, further evaluation of non-carcinogenic effect posed by the inhalation exposure to these four compounds is not possible. As a result, only fourteen TAPs, as a short-listed TAPs summarized in Table 13.8, are covered for further non-carcinogenic risk assessment.
Table 13.8 Summary of short-listed TAPs for Non-Carcinogenic Risk Assessment
|
Item |
Chemical |
Group of Species |
|
1 |
Sulphur dioxide |
Criteria air pollutants |
|
2 |
Nitrogen dioxide |
Criteria air pollutants |
|
4 |
Hydrogen sulphide |
Inorganic compound |
|
5 |
Ammonia |
Inorganic compound |
|
12 |
Carbon disulphide |
VOCs |
|
15 |
Chloroform |
VOCs |
|
18 |
Methanol |
VOCs |
|
21 |
Methylene chloride (Dichloromethane) |
VOCs |
|
24 |
Tetrachloroethylene (Perchloroethylene) |
VOCs |
|
25 |
Toluene |
VOCs |
|
28 |
Trichloroethylene |
VOCs |
|
29 |
Xylenes |
VOCs |
|
33 |
Ethylbenzene |
VOCs |
|
41 |
Naphthalene [1] |
PAHs |
Note:
[1] Naphthalene is
also a chemical compound of VOCs Group.
13.4.7 Screening of TAPs for Carcinogenic Effect
13.4.7.1 Unlike the non-carcinogenic effect, the carcinogenic effect is evaluated in terms of the accumulative incremental cancer risk contributed by inhalation exposure to each TAPs. There are 39 nos. of TAPs found to be undetectable. (Details as listed in Appendix 13.03). They may either not exist or exist in concentration below the detection limit of the apparatus. These TAPs, if exist, may also contribute to carcinogenic effect, although small.
13.4.7.2 As a conservative approach for the calculation of the accumulative carcinogenic risk, it is necessary to consider the possible existence of all TAPs even though they are undetectable. It has assumed that these undetected TAPs will exist in concentration equivalent to 50% of the detection limit, which represents an averaged value of all the undetectable TAPs as some may have concentrations close to the detection limit or far below the detection limit. This assumption is built to develop the emission rates profile for the TAPs of carcinogenic impact to humans.
13.4.7.3 Prior to the quantitative evaluation of the carcinogenic effect, the carcinogenic effect of these 56 nos. TAPs should be considered. The recommendation from International Agency for Research on Cancer (IARC) under WHO on the carcinogenicity classifications of these TAPs are adopted. There are 5 classifications defined by IARC, including
|
Group 1 |
Carcinogenic
to humans |
|
Group 2A |
Probably
carcinogenic to humans |
|
Group 2B |
Possibly
carcinogenic to humans |
|
Group 3 |
Not
classifiable as to its carcinogenicity to
humans |
|
Group 4 |
Probably
not carcinogenic to humans |
13.4.7.4 The carcinogenic effect and classification of TAPs were reviewed, as described in Appendix 13.02. According to the classification from IARC, there are 16 nos. TAPs, such as toluene, sulphur dioxide, identified as Group 3, i.e. not classifiable as to its carcinogenicity to humans. Furthermore, there are no carcinogenic toxicity values (IUR) for these TAPs (except for 1,1,2-Trichloroethane) according to the summary in Table 13.4. Therefore, further carcinogenic risk assessment on these groups of TAPs is not necessary.
13.4.7.5 Meanwhile, there is no published carcinogenic toxicity values (IUR) for other 20 nos. of TAPs available from WHO, USEPA-IRIS, Cal/EPA-OEHHA, and none of these TAPs is classified as Group 1 carcinogenic chemical by IARC. Therefore, no further evaluation of carcinogenic effect is possible for these 20 nos. of TAPs.
13.4.7.6
Based on the detailed
screening process in Section 13.4.7.4 and
13.4.7.5, a short-listed TAPs are summarized
in Table 13.9 for further carcinogenic risk
assessment.
Table 13.9 Summary of short-listed TAPs for
Carcinogenic Risk Assessment
|
Item |
Chemical |
Group of Species |
IUR (μg/m3)-1 |
Standard / Guideline [1] |
IARC Group [2] |
|
10 |
Acetaldehyde |
VOCs |
2.2E-06 |
USEPA-IRIS |
Group 2B |
|
11 |
Benzene |
VOCs |
6.0E-06 |
WHO |
Group 1 |
|
13 |
Carbon tetrachloride |
VOCs |
6.0E-06 |
USEPA-IRIS |
Group 2B |
|
15 |
Chloroform |
VOCs |
2.3E-05 |
USEPA-IRIS |
Group 2B |
|
16 |
Formaldehyde |
VOCs |
1.3E-05 |
USEPA-IRIS |
Group 1 |
|
21 |
Methylene chloride (Dichloromethane) |
VOCs |
1.0E-08 |
USEPA-IRIS |
Group 2A |
|
23 |
1,1,2,2-Tetrachloroethane |
VOCs |
5.8E-05 |
Cal/EPA-OEHHA |
Group 2B |
|
24 |
Tetrachloroethylene
(Perchloroethylene) |
VOCs |
2.6E-07 |
USEPA-IRIS |
Group 2A |
|
28 |
Trichloroethylene |
VOCs |
4.3E-07 |
WHO |
Group 1 |
|
32 |
1,2-Dichloroethane |
VOCs |
2.6E-05 |
USEPA-IRIS |
Group 2B |
|
33 |
Ethylbenzene |
VOCs |
2.5E-06 |
Cal/EPA-OEHHA |
Group 2B |
|
40 |
p-Dichlorobenzene
(1,4-Dichlorobenzene) |
VOCs |
1.1E-05 |
Cal/EPA-OEHHA |
Group 2B |
|
41 |
Naphthalene |
PAHs |
3.4E-05 |
Cal/EPA-OEHHA |
Group 2B |
|
42 |
Benzo(a)Pyrene |
PAHs |
8.7E-02 |
WHO |
Group 1 |
|
50 |
Benz(a)anthracene |
PAHs |
1.1E-04 |
Cal/EPA-OEHHA |
Group 2B |
|
51 |
Chrysene |
PAHs |
1.1E-05 |
Cal/EPA-OEHHA |
Group 2B |
|
52 |
Benzo(b)fluoranthene |
PAHs |
1.1E-04 |
Cal/EPA-OEHHA |
Group 2B |
|
53 |
Benzo(k)fluoranthene |
PAHs |
1.1E-04 |
Cal/EPA-OEHHA |
Group 2B |
|
54 |
Indeno (1,2,3-cd)pyrene |
PAHs |
1.1E-04 |
Cal/EPA-OEHHA |
Group 2B |
|
55 |
Dibenz(a,h)anthracene |
PAHs |
1.2E-03 |
Cal/EPA-OEHHA |
Group 2A |
Notes:
[1] The hierarchy in selecting standard
/ guideline is WHO > USEPA – IRIS > CAL/EPA-OEHAA
[2] The group of carcinogenic risk is based on the classification of WHO International Agency for Research on Cancer (IARC), http://www.iarc.fr/.
13.5 Exposure Assessment
13.5.1
Identification of HRs
13.5.1.1 In accordance with Technical Memorandum of Air Pollution Control Ordinance (Cap.311), domestic premises, hotel, hostel, hospital, clinic, nursery, temporary housing accommodation, school, educational institution, office, factory, shop, shopping centre, place of public worship, library, court of law, sports stadium or performing arts centre are considered as sensitive receptors, also known as HRs.
13.5.1.2 Populations in the vicinity of the Project have been identified as potential HRs. Due to a few public’s concern on the potential health impact on the local community, potential HRs outside the 500m study area are also identified to investigate the potential impact in a longer range.
13.5.1.3 In this assessment, it is assumed that the relocated STSTW will operate on a 24-hour-per-day schedule with continuous air exhaust from the ventilation shaft. For evaluating chronic effects from long- term exposure to air pollutants, the exposure period is usually at least one year according to the definition of “chronic” in USEPA-IRIS, USHHS-ATSDR and Cal/EPA-OEHHA as summarised in Appendix 13.01. Since visitors to the charity and recreational parks will not be subject to long-term exposure from air pollutants, it is considered appropriate to exclude these HRs (HR9, HR10 and HR 15) from chronic risk assessment. Although the exposure time for the staff of government office (HR19), hospital (HR11, HR12 and HR26) and industry (HR28) as well as the students of schools (HR2, HR3, HR4, HR7 and HR29) is around 8 hours per day and 5 days per week, the exposure duration will be long in terms of a job and education. Being a conservative approach, these HRs are included in chronic risk assessment.
13.5.1.4 Similar to long-term exposure, the non-carcinogenic effects posed by acute exposure of TAPs via inhalation pathway are determined by assessing the predicted TAPs concentrations at HRs (1-hr average concentration). Given the duration of acute exposure, all HRs are included for acute risk assessment.
13.5.1.5 The representative HRs have been identified and are given in Table 13.10 below. Their locations are illustrated in Figure No. 60334056/EIA/13.01.
Table 13.10 Representative HRs in the vicinity of Relocated STSTW for
Operational Health Impact Assessment
|
HRs |
Description |
Land Use |
Assessment Height Above Ground (mAG) |
Shortest Distance from the Ventilation Shaft
/ Portal / Caverns (m) |
Acute Risk |
Chronic Risk |
|
HR1 |
Chevalier Garden |
Residential |
1.5, 5, 10, up to 80 with 10m interval |
810 |
√ |
√ |
|
HR1a |
Chevalier Garden (Block 17) |
Residential |
1.5, 5, 10, up to 80 with 10m interval |
800 |
√ |
√ |
|
HR1b |
Chevalier Garden (Block 6) |
Residential |
1.5, 5, 10, up to 70 with 10m interval |
870 |
√ |
√ |
|
HR1c |
Chevalier Garden (Block 1) |
Residential |
1.5, 5, 10, up to 70 with 10m interval |
810 |
√ |
√ |
|
HR2 |
Wellborn Kindergarten |
Education |
1.5, 5, 10, 20 |
800 |
√ |
√ |
|
HR3 |
Hay Nien Primary School |
Education |
1.5, 5, 10, 20, 30 |
940 |
√ |
√ |
|
HR4 |
Ma On Shan Tsung Tsin Secondary School |
Education |
1.5, 5, 10, 20, 30 |
970 |
√ |
√ |
|
HR5 |
Tai Shui Hang Village |
Residential |
1.5, 5, 10 |
1000 |
√ |
√ |
|
HR6 |
Block H, Kam Tai Court |
Residential |
1.5, 5, 10, up to 120 with 10m interval |
1100 |
√ |
√ |
|
HR7 |
S.K.H. Ma On Shan Holy Spirit Primary School |
Education |
1.5, 5, 10, 20, 30 |
1130 |
√ |
√ |
|
HR8 |
Ah Kung Kok Fishermen Village |
Residential / Retail |
1.5, 5, 10 |
800 |
√ |
√ |
|
HR9 |
China Hong Kong Mountaineering and Climbing
Union |
Societal / Storage |
1.5, 5, 10 |
800 |
√ |
- |
|
HR10 |
Breakthrough Youth Village |
Religion / Charity |
1.5, 5, 10, 20, 30 |
420 |
√ |
- |
|
HR11 |
Cheshire Home Sha Tin |
Hospital |
1.5, 5, 10, 20 |
530 |
√ |
√ |
|
HR12 |
The Neighbourhood Advice-Action Council Harmony Manor |
Mental Health Hospital |
1.5, 5, 10, 20 |
320 |
√ |
√ |
|
HR13 |
Shing Mun Springs Rehabilitation Centre |
Rehabilitation Centre |
1.5, 5, 10, 20 |
420 |
√ |
√ |
|
HR14 |
Mui Tsz Lam Village |
Residential |
1.5, 5, 10 |
1360 |
√ |
√ |
|
HR15 |
Ma On Shan Park / Promenade |
Recreational Use |
1.5 |
1180 |
√ |
- |
|
HR16 |
Block
F, Kam Tai Court |
Residential |
1.5, 5, 10, up to 120 with 10m interval |
1200 |
√ |
√ |
|
HR17 |
Sausalito |
Residential |
1.5, 5, 10, up to 90 with 10m interval |
1650 |
√ |
√ |
|
HR18 |
Ocean View |
Residential |
1.5, 5, 10, up to 100 with 10m interval |
1970 |
√ |
√ |
|
HR19 |
Marine Police Outer Waters District Headquarters and Marine Police North Police
Station |
Government Office |
1.5, 5, 10, 20 |
1720 |
√ |
√ |
|
HR20 |
Ah Kung Kok Fishermen Village |
Residential |
1.5, 5, 10 |
800 |
√ |
√ |
|
HR21 |
Seaview Villa |
Residential |
1.5, 5, 10 |
1730 |
√ |
√ |
|
HR22 |
Racecourse Gardens |
Residential |
1.5, 5, 10, up to 50 with 10m interval |
1610 |
√ |
√ |
|
HR23 |
Pictoria Garden |
Residential |
1.5, 5, 10, up to 70 with 10m interval |
1230 |
√ |
√ |
|
HR24 |
Kam On Garden |
Residential |
1.5, 5, 10 |
1860 |
√ |
√ |
|
HR25 |
Royal Ascot |
Residential |
1.5, 5, 10, up to 120 with 10m interval |
1950 |
√ |
√ |
|
HR26 |
Sha Tin Hospital |
Hospital |
1.5, 5, 10, up to 40 with 10m interval |
900 |
√ |
√ |
|
HR27 |
Garden Vista |
Residential |
1.5, 5, 10, up to 80 with 10m interval |
1240 |
√ |
√ |
|
HR28 |
Topsail Plaza |
Industrial |
1.5, 5, 10, up to 50 with 10m interval |
1020 |
√ |
√ |
|
HR29 |
Hong Kong Baptist University Affiliated School Wong Kam Fai Secondary School |
Education |
1.5, 5, 10, up to 50 with 10m interval |
1020 |
√ |
√ |
|
HR30 |
The Castello |
Residential |
1.5, 5, 10, up to 120 with 10m interval |
1050 |
√ |
√ |
|
HR31 |
Planned HR at existing STSTW site |
Residential & Recreational |
1.5, 5, 10, up to 120 with 10m interval |
1400 |
√ |
√ |
13.5.2
Emission Inventory
13.5.2.1 Based on the TAP analysis results in Appendix 13.04, the VOCs including naphthalene were mainly detected at the inlet works. As discussed in Section 13.4.2.2, no NaOCl or other forms of chlorine is adopted for disinfection purpose. The chlorine related VOCs observed at the inlet works are mainly come from incoming sewage instead of emission from sewage treatment process.
13.5.2.2 On the other hand, the concentration levels of sulphur dioxide (SO2) have been detected to be relatively high at several emission sources (such as inlet fine screen and channel). The high concentration levels may possibly come from upstream pumping stations and pipelines where sulphate reducing bacteria may exist and produce H2S and SO2 in a combination from anaerobic and acid environments. This presumption is supported by the measured high concentrations levels at the inlet works (including inlet fine screen, inlet channel and aerated grit channel). Other sources, such as the gas burner of the existing STSTW located close to and upwind of the sampling point, may also contribute.
13.5.2.3 Nitrogen dioxide (NO2) was either not detected or found with very small concentrations (as compared to the toxicity level of NO2) except the sampling point near the digested sludge holding tank. The concentration levels of NO2 at the digested sludge holding tank was detected to be above 1,000 ppb (~ 1,800 ug/m3). NO2 could be an intermediate product of both denitrification and dissimilatory nitrate reduction to ammonia (DNRA) in the anaerobic digestion process. This subject is not well studied scientifically. It is suspected that the accumulation of NO2 in the digested sludge holding tank is also due to the absence of ventilation in the tank head space. The surrounding environment of this sampling location has also been investigated, with strong indication that the NO2 content in the air sample is contributed by the existence of NO2 in the background ambient air as NO2 will be generated from the heavy traffic on Tate’s Cairn Highway and may possibly generated from the nearby waste gas burner, power house and salt water pumping station.
13.5.2.4 The maximum concentration level for each compound with major emission sources are summarized in the Table 13.11 below.
Table 13.11 Summary of Concentration Levels of Detectable TAPs at Emission
Sources
|
Item |
Toxic Air
Pollutants (TAPs) |
Max. Concentration Detected (µg/m3) |
Major Emission Sources |
|
1 |
Sulphur dioxide |
3,150 |
All treatment tanks |
|
2 |
Nitrogen dioxide |
2,614 |
Digested Sludge Holding
Tank[1] |
|
4 |
Hydrogen sulphide |
110,000 |
Inlet Works, Primary Sediment Tank, Aeration Tank |
|
5 |
Ammonia |
1,230 |
Inlet Works, Primary Sediment Tank, Sludge Skip [2] |
|
12 |
Carbon
disulphide |
6.7 |
Inlet Works, Aeration Tank |
|
15 |
Chloroform |
171 |
Inlet Works, Aeration Tank |
|
18 |
Methanol |
231.5 |
Inlet Works [3] |
|
21 |
Methylene
chloride (Dichloromethane) |
21.5 |
Inlet Works, Aeration Tank |
|
24 |
Tetrachloroethylene (Perchloroethylene) |
1,238 |
Inlet Works, Aeration Tank |
|
25 |
Toluene |
28.2 |
Inlet Works |
|
28 |
Trichloroethylene |
24 |
Inlet Works [3] |
|
29 |
Xylenes |
48 |
Inlet Works [3] |
|
33 |
Ethylbenzene |
13.4 |
Inlet Works [3] |
|
41 |
Naphthalene |
1.24 |
Inlet Works [3] |
[1] NO2 was mainly detected at the digested sludge tank. The
concentration of NO2 measured at other potential sources were very
small and is close to the detection limit 30 µg/m3.
[2] The concentration of ammonia
in another sampling event is measured to be 179 µg/m3.
[3] TAP was detected at this location under one sampling event.
13.5.2.5 In determining the Receptor Concentration Level (RCL) at HR, further measurement of the emission rates of the identified TAPs have been conducted. The CSTW would be located inside the modified cavern. All treatment units with potential TAPs emission will be covered and the collected air will be conveyed to the deodourizer for treatment before being discharged to the atmosphere. The residual TAPs in the exhaust air after deodouriziation and being dispersed to the atmosphere via the ventilation shaft, if found to be in a high concentration, might possibly cause potential health impact during the operation phase.
13.5.2.6
Based on some previous
studies on the performance of deodourizer, the removal efficiency of
deodourizer on the selected TAPs is tabulated in the Table
13.12 below.
Table 13.12 Removal Efficiency of Deodourizer for Different TAPs
|
Item |
Toxic Air Pollutants (TAPs) |
Deodourizer Removal Efficiency
(%) |
|
1 |
Sulphur dioxide |
0 |
|
2 |
Nitrogen dioxide |
0 |
|
4 |
Hydrogen sulphide |
99.5 |
|
5 |
Ammonia |
0 |
|
10 |
Acetaldehyde |
50 [41] |
|
11 |
Benzene |
50 [41] |
|
12 |
Carbon disulfide |
50 [30] |
|
13 |
Carbon tetrachloride |
50 [31] |
|
15 |
Chloroform |
50
[28] |
|
16 |
Formaldehyde |
50 [31] |
|
18 |
Methanol |
50 [32] |
|
21 |
Methylene chloride (Dichloromethane) |
50 [31] |
|
23 |
1,1,2,2-Tetrachloroethane |
50 [29] |
|
24 |
Tetrachloroethylene (Perchloroethylene) |
50
[28] |
|
25 |
Toluene |
50
[28] |
|
28 |
Trichloroethylene |
50
[28] |
|
29 |
Xylenes |
50
[28] |
|
32 |
1,2-Dichloroethane |
50 [30] |
|
33 |
Ethylbenzene |
50
[28] |
|
40 |
p-Dichlorobenzene
(1,4-Dichlorobenzene) |
0 |
|
41 |
Naphthalene |
50 [29] |
|
42 |
Benzo(a)Pyrene |
50 [28] |
|
50 |
Benz(a)anthracene |
50 [32] |
|
51 |
Chrysene |
0 |
|
52 |
Benzo(b)fluoranthene |
50 [28] |
|
54 |
Indeno (1,2,3-cd)pyrene
|
50 [28] |
|
55 |
Dibenz(a,h)anthracene |
50 [28] |
Note:
The reference details of [28] to [32] are listed in Section 13.13.2.
13.5.2.7 The removal efficiency of deodourization systems e.g. bio-trickling or activated carbon on H2S can typically achieve 99.5%, which will also be specified in the future works contracts as an requirement. This removal efficiency, with appropriate design conditions, is achievable and guaranteed by deodourizer suppliers and verified by commissioning tests. As such, this removal efficiency is directly used for calculation of concentration of residual H2S in the exhausted air from the ventilation shaft. The removal efficiencies of each species of VOCs and PAHs by deodourisation systems are different. Some previous studies have revealed that deodourization system using activated carbon type could remove at least 75% of most species of VOCs and PAHs, some may even have removal efficiency higher than 99%. As a conservative approach, the removal efficiency of 50% is used for all these VOCs and PAHs as tabulated in the Table 13.12 above. Although it is known that the deodourizer could also remove ammonia (NH3), SO2, NO2, 1,4-Dichlorobenzene and Chrysene to certain levels, without sufficient literature support, it is assumed that the removal efficiency is zero for these five TAPs aiming to have a more conservative assessment results.
13.5.2.8
As discussed in Section 13.4.2.3 and Section 2 of this EIA
Report, no anaerobic digestion with digesters are proposed inside caverns owing
to fire safety and health concerns. Further study of the emission rates of the
identified TAPs from non-digestion sludge shall be performed for the acceptable
data in this assessment.
13.5.2.9 It is well known that the emission of H2S in non-digested sludge would be higher than the digested sludge. Thus, the emission rate of H2S measured from undigested sludge from SCISTW, which has no digestion process unlike the existing STSTW, was adopted to represent the future emission rate of H2S from relocated STSTW in caverns. The calculation of H2S emission rate is presented in Appendix 13.06a. However, it should be noted that the treatment process adopted in SCISTW is CEPT which would generate more H2S than a biological treatment process which will be adopted in relocated STSTW. In other words, this approach is considered on the conservative side.
13.5.2.10
NH3 is a natural
by-product in the digestion process in bio-degradation of organic material.
Therefore, ammonium/ammonia level in digested sludge is typically higher than
raw sludge. As the relocated STSTW in caverns will not have sludge digestion
process, ammonia emission sampling data from SCISTW was adopted to represent
the relocated STSTW in caverns. The
calculation of NH3 emission rate is presented in Appendix 13.06b.
13.5.2.11
SO2 may be produced
in anaerobic conditions such as digestion process which is known as
dissimilatory sulfate reduction. Generally, this process reduces sulfate,
oxidizes hydrogen and organic compound and generates hydrogen sulfide. In some
cases where sulfur-containing compounds are degraded with the use of sulfate,
SO2 may be produced although compounds such as mercaptans would be
more prevalent. [33] Based on the above, with the absence of
anaerobic digestion process, the SO2 quantity associated with the
sludge handling process at the relocated STSTW in caverns is expected to be
similar or even lower than at the existing STSTW. Therefore, adopting the
emission samples at the existing STSTW is considered on the conservative side. The calculation of SO2 emission rate
is presented in Appendix 13.06c.
13.5.2.12 The sampling of NO2 at the existing STSTW using Ogawa Passive Sampler is a passive sampling approach by absorbing the NO2 from the ambient air on the surface of the absorbent pad for further laboratory testing. This NO2 Ogawa Passive Sampler (1.5 x 1.5 x 2 inches in dimensions) could not be used on emission rate measurement because it could not be placed into the outlet of the flux hood (1/4 inches in diameter). Therefore, the emission rates of NO2 at the designated locations could not be measured directly due to the restriction of the apparatus. For a conservative assessment purpose, the measured maximum NO2 concentration as indicated in Appendix 13.04 would be adopted as the concentration entering into the deodourizer. The calculation of NO2 emission rate is presented in Appendix 13.06d.
13.5.2.13 In general, the VOCs emissions from digestion process are relatively low and insignificant in comparison with the emissions from aeration tank and inlet works. [34] For PAHs compounds having two aromatic rings, i.e. naphthalene, they are volatile and always considered as VOCs species. As a conservative approach, the VOCs and PAHs (naphthalene) measured from the inlet works at existing STSTW are adopted as the quantity associated with the sludge handling process at the relocated STSTW in caverns. For other PAHs compounds identified as listed in Table 13.9, they have four to five aromatic rings but are non-detectable at existing STSTW according to Appendix 13.05. The carcinogenic risk assessment of these VOCs and PAHs would be carried out assuming that they will exist in concentrations equivalent to 50% of the detection limit as described in Section 13.4.7.2. The emission rate calculations of these VOCs and PAHs are presented in Appendix 13.06e to 13.06dd.
13.5.2.14 A summary of emission rates of the identified TAPs after deodourizer from CSTW is presented in Appendix 13.06.
13.5.3
Dispersion Model
13.5.3.1 The CSTW will operate 24-hour-per-day with continuous air exhaust from the ventilation shaft. The assessment heights are at predetermined heights above ground level according to the height of each HRs. The predicted TAPs concentration levels at the worst affected heights of the HRs are produced.
13.5.3.2 As the TAPs would be dispersed in a mode similar to the dispersion of odour causing compounds, the odour dispersion model with details presented in Section 3 of the EIA Report would also be adopted in the assessment for TAPs. The dispersion factors of the selected TAPs at representative HRs are derived from the odour dispersion model as shown in Appendix 13.07 and would be used for subsequent assessment of TAPs.
13.5.4
Receptor Concentration
Levels
13.5.4.1 For the chronic risk assessment, i.e. long-term exposure scenario, the incremental annual average concentration level of the selected TAPs on representative HRs due to the operation of CSTW is predicted and the assessment results are shown in Appendix 13.07b.
13.5.4.2 For the acute risk assessment, i.e. short-term exposure scenario, the incremental hourly concentration level of the selected TAPs on representative HRs due to the operation of CSTW is predicted and the assessment results are shown in Appendix 13.07c.
13.5.4.3 Based on the results summary as shown in Appendix 13.07a, the predicted maximum incremental annual and hourly average concentration levels of the identified TAPs due to the operation of CSTW are illustrated in the Table 13.13 below. The predicted incremental annual average TAPs concentrations on all HRs with sensitive uses at these levels are relatively small as compared to the chronic and acute reference exposure levels.
Table 13.13 Summary of Maximum Incremental Concentration of TAPs with
Non-carcinogenic Risk Level
|
Item |
TAPs |
Max. Incremental Annual Average Concentration at HR due to
Operation of CSTW (µg/m3) |
Chronic RfC (µg/m3) |
Max. Incremental Hourly Average Concentration at HR due to Operation
of CSTW (µg/m3) |
Acute RfC (µg/m3) |
|
1 |
Sulphur
dioxide |
1.7E-03 (-) |
- |
3.3E-01 (1.6628%) |
20 |
|
2 |
Nitrogen
dioxide |
2.7E-02 (0.0684%) |
40 |
5.3E+00 (2.6371%) |
200 |
|
4 |
Hydrogen
sulphide |
4.6E-04 (0.0230%) |
2 |
8.9E-02 (0.0591%) |
150 |
|
5 |
Ammonia |
1.9E-04 (0.0003%) |
70 |
3.6E-02 (0.0030%) |
1190 |
|
12 |
Carbon
disulphide |
1.0E-05 (0.0000%) |
700 |
2.0E-03 (0.0020%) |
100 |
|
15 |
Chloroform |
1.2E-04 (0.0001%) |
98 |
2.4E-02 (0.0048%) |
488 |
|
18 |
Methanol |
2.2E-04 (0.0000%) |
20000 |
4.3E-02 (0.0002%) |
28000 |
|
21 |
Methylene
chloride |
2.8E-05 (0.0000%) |
600 |
5.4E-03 (0.0002%) |
3000 |
|
24 |
Tetrachloroethylene
(Perchloroethylene) |
5.2E-04 (0.0002%) |
250 |
9.9E-02 (0.2426%) |
41 |
|
25 |
Toluene |
1.6E-05 (0.0000%) |
3766 |
3.1E-03 (0.0000%) |
7533 |
|
28 |
Trichloroethylene |
2.6E-05 (0.0013%) |
2 |
5.0E-03 (-) |
- |
|
29 |
Xylenes |
3.0E-05 (0.0000%) |
870 |
5.8E-03 (0.0001%) |
8679 |
|
33 |
Ethylbenzene |
1.2E-05 (0.0000%) |
22000 |
2.3E-03 (0.0000%) |
21699 |
|
41 |
Naphthalene |
1.6E-06 (0.0000%) |
10 |
3.1E-04 (-) |
- |
Note:
[1] Incremental percentage changes against the reference
exposure levels are
listed in the ( ).
13.6 Exposure Response Relationship
13.6.1
General
13.6.1.1 In this step of the risk assessment process, hypothetical HRs and their potential exposure pathways were identified. Selection of such potential exposure scenario was based on the characteristics of the sewage treatment works and surrounding area, and activities that could take place in the vicinity of the sewage treatment works. Dispersion of TAPs into ambient air allows direct human exposure to TAPs through inhalation. Since the general public (including visitors) would be restricted from direct contact with the sewage within the sewage treatment works or pumping stations, direct oral exposure by HRs is almost impossible to happen. Other exposure possibility is described in the following paragraphs.
13.6.2
Exposure Scenarios
13.6.2.1 The HHRAP (USEPA, 2005) suggests the evaluation of three pairs of potential receptors: a non-farming resident (child and adult), a subsistence farmer (child and adult), and a subsistence fisher (child and adult). However, the exact receptors to be evaluated were made site-specific based on land use and human activity patterns. Information on land use in the vicinity of the relocated STSTW was considered so that the receptor scenarios chosen for the health risk assessment would be appropriate for local receptors in Sha Tin.
13.6.2.2 The locations for potential exposure to STSTW-related TAPs have been selected based on a combination of the concentration levels on HRs and actual land uses identified in the vicinity of the site. Inhalation exposure has been evaluated under each scenario. The locations of the HRs as described in Table 13.5 above were evaluated in the context of the dispersion results to ensure that the locations of the maximum ambient concentrations were included in the evaluation. Under this scenario, the predicted annual average TAPs concentrations at HRs are adopted as chronic exposure for further assessment.
Residential
13.6.2.3 A reasonable resident scenario was evaluated at the off-site location with the highest estimated concentration for each TAP to ensure that potential exposures for a resident are not underestimated. Chronic exposure due to inhalation of vapour phase TAPs has been evaluated by air concentration modeling for adult and child residents.
Farming and Fishing
13.6.2.4 Given the physicochemical characteristics of the TAPs and their relatively low concentration, the deposited TAPs onto soil, water or plants (such as vegetables) are so minor that the indirect exposure through the ingestion of soil, water, or locally raised products (fish, beef, dairy, pork and poultry products) are negligible.
13.6.2.5 In conclusion, this exposure assessment is to predict the magnitude of potential human exposure to TAPs emissions from the ventilation shaft through the inhalation exposure pathway.
13.7 Risk Characterization
13.7.1.1 In the risk characterization step, potential human health risks associated with TAPs emissions from the relocated STSTW have been estimated. The risk characterization step combined the results of the exposure assessment and exposure response relationship to estimate the potential risks to human health.
Criteria Air Pollutants
13.7.2 Background Concentration of Criteria Pollutants
13.7.2.1 As suggested by “Guidelines on Assessing the Total Air Quality Impacts”, an integrated modelling system “Pollutants in the Atmosphere and their Transport over Hong Kong” model (PATH) which is developed and maintained by HKEPD is applied to estimate the background pollutant concentrations. The study area covers seven grid cells of PATH, namely grid (31, 35), (32, 35), (31, 34), (32, 34), (31, 33), (32, 33) and (33, 34). PATH dataset (Year 2020) of these seven grid cells, which is the best available background data, are adopted as the background concentration of SO2 and NO2 for the assessment. The background concentration at all the HRs are tabulated in Table 13.14 below.
Table 13.14 Background Concentration of
Criteria Pollutants from PATH Model
|
PATH Grid |
Annual
Average NO2 Concentration (µg/m3) |
Annual
Average SO2 Concentration (µg/m3) |
Maximum
Hourly Average NO2 Concentration (µg/m3) |
Maximum
Daily Average SO2 Concentration (µg/m3) |
|
|
HR 1 |
(32, 35) |
17 |
6 |
201 |
28 |
|
HR 1a |
(32, 35) |
17 |
6 |
201 |
28 |
|
HR 1b |
(32, 35) |
17 |
6 |
201 |
28 |
|
HR 1c |
(32, 35) |
17 |
6 |
201 |
28 |
|
HR 2 |
(32, 35) |
17 |
6 |
201 |
28 |
|
HR 3 |
(32, 35) |
17 |
6 |
201 |
28 |
|
HR 4 |
(32, 35) |
17 |
6 |
201 |
28 |
|
HR 5 |
(32, 35) |
17 |
6 |
201 |
28 |
|
HR 6 |
(32, 35) |
17 |
6 |
201 |
28 |
|
HR 7 |
(32, 35) |
17 |
6 |
201 |
28 |
|
HR 8 |
(32, 35) |
17 |
6 |
201 |
28 |
|
HR 9 |
(32, 35) |
17 |
6 |
201 |
28 |
|
HR 10 |
(32, 34) |
14 |
6 |
178 |
25 |
|
HR 11 |
(32, 34) |
14 |
6 |
178 |
25 |
|
HR 12 |
(32, 34) |
14 |
6 |
178 |
25 |
|
HR 13 |
(32, 34) |
14 |
6 |
178 |
25 |
|
HR 14 |
(33, 34) |
13 |
6 |
156 |
25 |
|
HR 15 |
(32, 35) |
17 |
6 |
201 |
28 |
|
HR 16 |
(32, 35) |
17 |
6 |
201 |
28 |
|
HR 17 |
(32, 35) |
17 |
6 |
201 |
28 |
|
HR 18 |
(32, 35) |
17 |
6 |
201 |
28 |
|
HR 19 |
(31, 35) |
20 |
6 |
211 |
30 |
|
HR 20 |
(32, 35) |
17 |
6 |
201 |
28 |
|
HR 21 |
(31, 35) |
20 |
6 |
211 |
30 |
|
HR 22 |
(31, 35) |
20 |
6 |
211 |
30 |
|
HR 23 |
(31, 34) |
19 |
6 |
214 |
29 |
|
HR 24 |
(31, 35) |
20 |
6 |
211 |
30 |
|
HR 25 |
(31, 35) |
20 |
6 |
211 |
30 |
|
HR 26 |
(31, 34) |
19 |
6 |
214 |
29 |
|
HR 27 |
(31, 34) |
19 |
6 |
214 |
29 |
|
HR 28 |
(31, 34) |
19 |
6 |
214 |
29 |
|
HR 29 |
(31, 33) |
17 |
6 |
188 |
29 |
|
HR 30 |
(32, 33) |
14 |
6 |
167 |
25 |
|
HR 31 |
(31, 35) |
20 |
6 |
211 |
30 |
13.7.3 Risk Due to Chronic Exposure to Criteria Pollutants
13.7.3.1 As shown in Table 13.14, the background annual average SO2 concentration predicted at all HRs based on territory-wide scale model results (PATH model) are 6 μg/m3. The maximum predicted incremental SO2 concentration due to the operation of CSTW is 1.7E-03 μg/m3, as indicated in Appendix 13.07. The maximum cumulative annual average SO2 concentration is predicted to be 6.0017 μg/m3, and the contribution percentage by the operation of CSTW is only 0.03%. Nevertheless, there is no exact risk criteria of SO2 due to chronic exposure. While it is not possible to totally rule out its potential health effect, the additional health effect, if presents, are likely to be very small.
13.7.3.2 For NO2, the background annual average concentrations predicted at all HRs based on territory-wide scale model results (PATH model) would range from 13 to 20 μg/m3 as shown in Table 13.14. The maximum predicted incremental NO2 concentration due to the operation of CSTW is 0.0270 μg/m3, as indicated in Appendix 13.07. The maximum cumulative annual average contribution of NO2 is predicted to be 20.0270 μg/m3, and the contribution percentage by the operation of CSTW is only 0.13%. While it is not possible to totally rule out its potential health effect, the additional health effect, if presents, are likely to be very small.
13.7.4 Risk Due to Acute Exposure to Criteria Pollutants
13.7.4.1 As shown in Table 13.14, the background daily average concentration of SO2 at all HRs would range from 25 to 30 µg/m3 based on territory-wide scale model results (PATH model), which already exceeds the acute toxicity criteria of 20 μg/m3. Nevertheless, the maximum contribution of incremental SO2 concentrations at all HRs by the operation of CSTW would be around 1%. Therefore, the additional acute adverse health effects would be negligible.
13.7.4.2
For NO2, the
background hourly average concentrations would range from 156 to 214 µg/m3 based
on territory-wide scale model results (PATH model). The predicted
cumulative hourly concentration of NO2 due to the operation of CSTW plus the
background concentration would range from 161.3 to
219.3 μg/m3. While it can be noted that the cumulative hourly
average NO2 at some HRs would be occasionally greater than the acute
toxicity criteria of 200 μg/m3 due to the high
background level. Nevertheless, the contribution of incremental NO2
concentrations at all HRs by the operation of CSTW would range from 2% to 3%.
Therefore, the acute adverse health effects of NO2 due
to the operation of CSTW would be very small.
13.7.4.3 In summary, the operation of CSTW would make only very small additional contributions to local concentration of SO2 and NO2. While it is not possible to rule out any potential adverse health effects from the operation of CSTW with complete certainty, the impact on health from small additional air pollutants is likely to be very small.
Other TAPs
13.7.5 Background Contribution of other TAPs
13.7.5.1 HKEPD has conducted VOC and carbonyl compounds measurements at the air quality monitoring stations (AQMS) in Yuen Long, Tung Chung, Tsuen Wan and Central Western. The Yuen Long AQMS and Tsuen Wan AQMS were characterised by the industrial activities in the vicinity. The Tung Chung AQMS were possibly influenced by the aircraft emissions from the airport and are too remote from Sha Tin. Therefore, the Central Western AQMS, which is less influenced by industrial or aircraft emission sources than the other AQMSs, has been adopted as a reference on background TAP concentrations, except ammonia for which the relevant data were only available from the Tsuen Wan AQMS.
13.7.5.2 The latest available yearly complete measurement data at Central Western AQMS and Tsuen Wan AQMS (for ammonia) in Year 2014 have formed the basis in determining the best available information on ambient TAP concentrations. Table 13.15 lists the detailed TAP measurements in Central Western AQMS and Tsuen Wan AQMS in Year 2014.
Table 13.15 Background TAPs Concentrations
|
Item |
Toxic Air Pollutants |
Annual Average Concentration in Year 2014
for Chronic Risk Assessment (µg/m3) [1] |
Max. Daily/Hourly Concentration for Acute
Risk Assessment (µg/m3)
[1] |
|
4 |
Hydrogen sulphide[3] |
- |
- |
|
5 |
Ammonia [2] |
8.0E+00 |
2.7E+01 |
|
12 |
Carbon disulphide |
- |
- |
|
15 |
Chloroform |
4.4E-01 |
8.6E-01 |
|
18 |
Methanol [3] |
- |
- |
|
21 |
Methylene Chloride |
5.4E+00 |
1.2E+01 |
|
24 |
Tetrachloroethylene
(Perchloroethylene) |
6.2E-01 |
2.0E+00 |
|
25 |
Toluene |
6.0E+00 |
2.7E+01 |
|
28 |
Trichloroethylene |
2.7E-01 |
1.4E+00 |
|
29 |
Xylenes |
2.8E+00 |
8.4E+00 |
|
33 |
Ethylbenzene |
1.2E+00 |
3.4E+00 |
|
41 |
Naphthalene |
1.0E+00 |
4.6E+00 |
Notes:
[1] The average and maximum
values of the latest available yearly TAPs monitoring results were adopted as
the background ambient concentrations of TAPs for chronic and acute risk assessment
separately.
[2] The ammonia monitoring results is only available in Tsuen Wan AQMS.
[3] “-“means no measurement at the AQMS.
13.7.6
Risk Due to Chronic Exposure
to other TAPs
13.7.6.1 The chronic risk has been evaluated for residency exposure to TAPs via direct inhalation. To determine the likelihood of adverse health effects, the factors of primary interest are the predicted incremental cumulative concentrations of these identified TAPs arising from the operation of CSTW at different HRs, as identified in Appendix 13.07 plus the background contribution as listed in Table 13.15 above.
13.7.6.2 Based on the maximum predicted cumulative annual average concentrations of TAPs as summarised in Table 13.13, it can be noted that the cumulative annual average TAP concentrations at all HRs would comply with all the chronic toxicity criteria. Therefore, the exposure of HRs to the TAPs is not anticipated to cause an adverse chronic non-carcinogenic health effects.
Table 13.16 Maximum Predicted Cumulative Annual Average Concentrations of
TAPs
|
Item |
TAP |
Max. Cumulative Annual Average Concentration (µg/m3) [2] [3] |
Chronic RfC (µg/m3) |
|
4 |
Hydrogen sulphide[1] |
- |
2 |
|
5 |
Ammonia |
8.0002
(YES) |
70 |
|
12 |
Carbon disulphide[2] |
- |
700 |
|
15 |
Chloroform |
0.4401
(YES) |
98 |
|
18 |
Methanol |
- |
20000 |
|
21 |
Methylene chloride |
5.4000
(YES) |
600 |
|
24 |
Tetrachloroethylene
(Perchloroethylene) |
0.6205
(YES) |
250 |
|
25 |
Toluene |
6.0000
(YES) |
3766 |
|
28 |
Trichloroethylene |
0.2700
(YES) |
2 |
|
29 |
Xylenes |
2.8000
(YES) |
870 |
|
33 |
Ethylbenzene |
1.2000
(YES) |
22000 |
|
41 |
Naphthalene |
1.0000
(YES) |
10 |
Notes:
[1] Background
concentrations in EPD’s Central Western AQMS and Tsuen Wan AQMS is not
available.
[2] For
predicted cumulative annual average TAP concentration, “YES” refers to its
compliance with criteria.
[3] Compliance
against the criteria is shown in the ( ).
13.7.7 Risk Due to Acute Exposure to other TAPs
13.7.7.1 In addition to the potential risk due to chronic exposure, the acute exposure risk has been evaluated based on the predicted incremental hourly average concentrations of these identified TAPs arising from the operation of CSTW, as identified in Appendix 13.07 plus the background contribution as listed in Table 13.15 above.
13.7.7.2 According to the maximum predicted cumulative hourly average concentrations of TAPs as summarised in Table 13.13, it can be noted that the cumulative hourly average TAP concentrations at all HRs would comply with all acute toxicity criteria. Therefore, the exposure of HRs to the TAPs is not anticipated to cause an adverse acute non-carcinogenic health effects.
Table 13.17 Maximum Predicted Cumulative Hourly Average Concentrations of
TAPs
|
Item |
TAP |
Max. Cumulative Hourly Average Concentration (µg/m3) |
Acute RfC (µg/m3) |
|
4 |
Hydrogen sulphide [1] |
- |
150 |
|
5 |
Ammonia |
27.0356
(YES) |
1190 |
|
12 |
Carbon disulphide [1] |
- |
100 |
|
15 |
Chloroform |
0.8836
(YES) |
488 |
|
18 |
Methanol [1] |
- |
28000 |
|
21 |
Methylene chloride |
12.0054
(YES) |
3000 |
|
24 |
Tetrachloroethylene
(Perchloroethylene) |
2.0995
(YES) |
41 |
|
25 |
Toluene |
27.0031
(YES) |
7533 |
|
28 |
Trichloroethylene [4] |
1.4050
(YES) |
- |
|
29 |
Xylenes |
8.4058
(YES) |
8679 |
|
33 |
Ethylbenzene |
3.4023
(YES) |
21699 |
|
41 |
Naphthalene [4] |
4.6003 |
- |
Notes:
[1] Background
concentrations in EPD’s Central Western AQMS and Tsuen Wan AQMS is not
available.
[2] For
predicted cumulative hourly average TAP concentration, “YES” refers to its
compliance with criteria.
[3] Compliance
against the criteria is shown in the ( ).
[4] Acute
toxicity criteria is not available.
13.7.7.3 In summary, as discussed in Sections 13.7.6 and 13.7.7 above, the cumulative concentration of individual TAP at each HR due to the operation of CSTW is not anticipated to cause any adverse impact when compare to either the long-term or short-term exposure toxicity risk levels. In this connection, the non-carcinogenic health risk for long-term or short-terms exposure to the identified TAPs with emission from the relocated STSTW could virtually be ignored.
13.7.8
Calculation of Carcinogenic Health
Risk
13.7.8.1 The USEPA has established the methodology for cancer risk estimates, as explained in Section 13.2.1 of its publication “Air Toxics Risk Assessment Reference Library – Volume 1 Technical Resource Manual”. The estimated individual cancer risk is expressed as the upper bound probability that a person may develop cancer over the course of their lifetime as a result of the exposure.
13.7.8.2 For inhalation exposures, the chronic cancer risks (i.e. carcinogenic health risk of individual TAP) is estimated using the Equation 13-1 below:
Risk inh(i) = ECL x IUR
(Equation
13-1)
Where:
Risk inh(i) = Cancer risk to an individual (expressed as an upper-bound risk of contracting cancer over a lifetime);
ECL = Estimate of long-term inhalation exposure concentration for a specific TAP; and
IUR = the corresponding inhalation unit risk estimate for that TAP.
This calculation is performed to estimate the probability of developing cancer over a lifetime (usually assumed to be 70 years) due to the continuous exposure to a specific TAP of ECL concentration. The ECL is an estimated based on the modelling data for one-year’s worth of time.
Characterization of Cancer Risk from Exposure to Multiple Pollutants is summarized as follows:
Total Incremental Cancer Risk = Cancer Riskinh(1) + Cancer Riskinh(2) + … + Incremental Cancer Risk inh(N) (Equation 13-2)
13.7.8.3 The USEPA has established relevant criteria for human health impact assessment for the carcinogenic risk for an individual potentially exposed to one or more TAP. The guidance is in Table 13.18 below:
Table 13.18 Cancer Risk Guidance
|
Risk Value |
Description |
|
Cancer risks less than or
equal to one in a million (1E- 06) |
Acceptable and no further evaluation warranted. |
|
Cancer risks between 1E-
04 to 1E- 06 |
Considered by the DAQ Risk Management Committee on a case-by-case
bases. Sources with risk falling within this range must
take steps to minimize the projected risk before a Pre-Construction Permit can
be issued. |
|
Cancer risks greater than
or equal to one in ten
thousand (1E- 04) |
Unacceptable. |
13.7.8.4 The incremental cancer risk of these identified TAPs at each HR due to the project are calculated and presented in Appendix 13.08. The highest incremental cancer risk for each individual TAP, as well as the total incremental cancer risk, at the HRs is 7.1E-08, as presented in Appendix 13.08v. The calculated highest incremental cancer risk is far below the acceptable target risk goal of one in a million (1E-06), according to the guidance established in Table 13.18 above, and as shown in Table 13.19 below.
Table 13.19 Total Incremental Cancer Risk due to the Identified TAPs
|
Item |
Toxic Air
Pollutants |
IUR (ug/m3)-1 |
Max. Predicted Incremental Concentration ECL (ug/m3) |
Highest
Cancer Risk |
|
10 |
Acetaldehyde |
2.2E-06 |
3.5E-05 |
7.7E-11 |
|
11 |
Benzene |
6.0E-06 |
2.7E-06 |
1.6E-11 |
|
13 |
Carbon tetrachloride |
6.0E-06 |
6.3E-06 |
3.8E-11 |
|
15 |
Chloroform |
2.3E-05 |
1.2E-04 |
2.8E-09 |
|
16 |
Formaldehyde |
1.3E-05 |
2.4E-05 |
3.1E-10 |
|
21 |
Methylene chloride
(Dichloromethane) |
1.0E-08 |
2.8E-05 |
2.8E-13 |
|
23 |
1,1,2,2-Tetrachloroethane |
5.8E-05 |
2.6E-05 |
4.2E-10 |
|
24 |
Tetrachloroethylene (Perchloroethylene) |
2.6E-07 |
5.2E-04 |
1.3E-10 |
|
28 |
Trichloroethylene |
4.3E-07 |
7.3E-06 |
1.1E-11 |
|
32 |
1,2-Dichloroethane |
2.6E-05 |
3.6E-06 |
9.5E-11 |
|
33 |
Ethylbenzene |
2.5E-06 |
1.2E-05 |
3.0E-11 |
|
40 |
p-Dichlorobenzene
(1,4-Dichlorobenzene) |
1.1E-05 |
1.3E-05 |
1.4E-10 |
|
41 |
Naphthalene |
3.4E-05 |
1.6E-06 |
5.6E-11 |
|
42 |
Benzo(a)Pyrene |
8.7E-02 |
7.5E-07 |
6.6E-08 |
|
50 |
Benz(a)anthracene |
1.1E-04 |
7.5E-07 |
8.3E-11 |
|
51 |
Chrysene |
1.1E-05 |
1.5E-06 |
1.7E-11 |
|
52 |
Benzo(b)fluoranthene |
1.1E-04 |
7.5E-07 |
8.3E-11 |
|
53 |
Benzo(k)fluoranthene |
1.1E-04 |
7.5E-07 |
8.3E-11 |
|
54 |
Indeno (1,2,3-cd)pyrene |
1.1E-04 |
7.5E-07 |
8.3E-11 |
|
55 |
Dibenz(a,h)anthracene |
1.2E-03 |
7.5E-07 |
9.0E-10 |
|
|
Total Incremental Cancer
Risk (highest): |
7.1E-08 |
||
13.7.8.5 In summary, for those non-human carcinogen or Group 3 IARC TAPs, such as hydrogen sulphide, ammonia, nitrogen dioxide, sulphur dioxide and xylenes, which are not covered in the calculation of total incremental cancer risk above, their potential contribution to the total incremental cancer risk can be ignored due to their non-carcinogenic properties. Therefore, considering the cancer risk results presented in Table 13.19, there is no significant carcinogenic health risk due to the exposure to be expected from emissions of any of the identified TAPs from the relocated STSTW.
13.8 Reuse of Effluent Water
13.8.1.1 The reuse of treated effluent from the STSTW by general public is not proposed in view of its high capital and recurrent costs as explained in Section 2.5.1.2. Treated effluent from the Project would be limited to non-potable use inside the plant i.e. polymer preparation. Polymer preparation will not involve direct human contact and the reused effluent will go back to the treatment unit for further treatment before being discharged. The health impact to humans is not expected during the operation phase of the effluent reuse system.
13.8.1.2 To avoid cross-connection of the effluent reuse system to the potable water supply, the pipes for the reused effluent water will be specially arranged to differentiate them from that of the potable water pipes, e.g. clearly labeled with warning signs and notices, colour-coded, and/or using different pipe size, so that physical connection of the reclaimed water pipes with the potable water fitting would not be possible.
13.9 Radon
13.9.1.1 Although the assessment of health risk of radon (Rn) emissions from the construction and operation of the Project is not required in the EIA Study Brief as it is more related to occupational health and safety, the issue is also discussed here for completeness.
13.9.1.2 Nui Po Shan cavern site is located within granite that is will contain uranium. As uranium in the granite decays radioactively, gaseous Rn (and its associated ionizing radiation “daughter products) will be continuously formed and released in the caverns.
13.9.1.3 The use of granite in concrete walls and floors and other construction materials in the relocated STSTW facilities may also contribute to elevated indoor Rn levels. The release of Rn from appropriately cured or sealed concrete is however expected to be minimal in view of its lower porosity, which inhibits the diffusion of Rn. Also, the uranium content in concrete or other construction material is generally lower when compared with granite. Based on the above, the release of Rn from concrete and other construction materials is not considered a concern compared with unlined granite walls or ceilings. In all cases adequately designed ventilation and filtration systems can be utilized to control Rn to acceptable levels.
Indoor Air Quality Objectives
for Office and Public Places
13.9.1.4 As given in Table 13.20, the Indoor Air Quality Objectives for Office and Public Places also recommended the Rn level for IAQ. The Rn level for “Excellent Class” offices and public spaces shall be below 150 Bq/m3, while that for “Good Class” shall be under 200 Bq/m3.
Table 13.20 Indoor Air Quality Objectives for Office and Public Places
|
Parameter |
Unit |
8-hour average |
|
|
Excellent Class |
Good Class |
||
|
Radon (Rn) |
Bq/m3 |
< 150 |
< 200 |
ProPECC PN 1/99 Control
of Radon
Concentration in New Buildings
13.9.1.5 A PN for Professional Persons was issued by the EPD to provide guidance for the control and mitigation of indoor Rn level in new buildings. A number of measures to minimize potential impacts from accumulation of Rn in new buildings are outlined in the PN. These measures should be followed as far as possible during operation.
WHO Recommendation
13.9.1.6 WHO recommends that countries implement national programmes to reduce the population’s risk from exposure to the national average Rn concentration, as well as reducing the risk for individuals exposed to high Rn levels. Building codes should be implemented to reduce Rn levels in homes under construction. A national reference level of 100 Bq/m3 is recommended. However, if this level cannot be reached under the prevailing country-specific conditions, the reference level should not exceed 300 Bq/m3.
13.9.1.7 Adequate ventilation would be maintained at the relocated STSTW to remove excessive heat from the treatment process and plants, as well as fugitive sewer gas or Rn from inside the caverns. Sufficient air change would help to ensure the removal of Rn and reduce the health risk (associated with Rn) to the exposed personnel (mainly worker in the relocated STSTW). With reference to the successful operation experience and monitoring data for Rn at Stanley STW (also a cavern STW), it is expected that the level of Rn exposure inside cavern would be sufficiently low with provision of suitable ventilation.
13.9.1.8 Monitoring of indoor Rn level at locations where human activities are expected can further minimize the potential exposure by allowing the removal of elevated Rn a (by increased ventilation rate) before the arrival of working personnel.
13.9.1.9 Since the risk posed to workers from direct Rn exposure is not significant when a proper ventilation system is available to adequately dilute the Rn concentration, the risk on off-site HRs will also be insignificant. The Occupational Safety and Health Ordinance provides the statutory authority for controlling the occupational health.
13.10 Uncertainty Analysis
13.10.1.1 Within any risk assessment process, a number of assumptions and simplifications are made in recognition of the lack of complete scientific knowledge and inherent variability in many of the parameters used in risk assessment. In some cases, the values may vary widely between a conservative upper confidence limit and an average value. In other cases, measurement data are too sparse to develop a statistically robust estimate of the mean. In those cases, judgments must be made in selecting an assumed value that is credible, but unlikely to be exceeded when future measurements become available.
13.10.1.2 The health risk assessment is a complex process, requiring the integration of the following:
· Identification of TAPs release into the environment;
· Transport of the TAPs by air dispersion in a variety of different and variable environments;
· Potential for adverse health effects in human, as extrapolated from animal studies; and
· Probability of adverse effects in a human population that is highly variable genetically, and in age, activity level and lifestyle.
13.10.1.3 Uncertainty can be introduced in the assessment at many steps of the process. The following paragraphs discuss the uncertainties associated with each stage of the assessment.
13.10.2
Hazard Identification
13.10.2.1 TAPs are identified based on the air pollutants listed in USEPA, HKEPD and other literature search related to sewage treatment works. This list of chemicals may not cover all the chemicals emitted from the relocated STSTW, which may underestimate the risk. However, it is considered that although the TAPs identified may not be exhaustive, it appeared sufficiently comprehensive for the purpose of the assessment.
13.10.3 Exposure Assessment
13.10.3.1 In this stage of the assessment, the dispersion factors derived from the odour dispersion model are used to predict the dispersed TAPs concentration levels at HRs. As the dispersion factors are simplifications of reality requiring exclusion of some variables that influence predications, which would introduce uncertainty in the prediction of TAPs concentrations at potential HRs, this model may in turn overestimate or underestimate the risk.
13.10.3.2 In the calculation of the accumulative carcinogenic risk, the concentration equivalent to 50% of the detection limit is adopted to present the concentration of undetected TAPs. As the percentage of 50% is an average value to represent all the undetectable TAPs, which would introduce uncertainty in the calculation of accumulative carcinogenic risk. However, the highest accumulative cancer risk is found far below the acceptable guidance level by approximately 2 order of magnitude, as presented in Section 13.7.4. Thus, this uncertainty introduced by this assumption is acceptable.
13.10.3.3 In the development of the emission inventory for NO2, the emission rates of NO2 at the designated locations could not be measured directly due to the restriction of the apparatus as discussed in Section 13.5.2.12. For a more conservative assessment, the maximum measured NO2 concentration is assumed to be the concentration level at each designated location for further calculation. Thus, the predicted concentration of NO2 at all the HRs and the corresponding non-carcinogenic risk would be overestimated as the existence of NO2 in ambient air (e.g. emissions from vehicles) were also measured.
13.10.3.4 The quantity of incoming sewage to CSTW is expected to reach 280,000 m3/day at Year 2036 (hereafter as interim stage) while the design capacity of 340,000 m3/day (hereafter as Ultimate Stage) has allowed certain contingencies and buffer in population growth beyond Year 2041. The potential TAP emission after deodorization treatment is estimated based on the Ultimate Stage. Thus, the predicted risk due to the emission of TAPs would be overestimated before the population reach the Ultimate Stage.
13.11 Risk Control and Management
13.11.1.1 The possible sources of the TAPs to the ventilation shaft for the relocated STSTW could be:
· Emissions from preliminary treatment units, such as screenings and grits;
· Emissions from sludge treatment facilities, such as dewatering equipment and sludge loading/disposal mechanism; and
· Emissions (e.g., H2S) due to leakage from covered tankage or improper installation;
· Emissions from leakage during upset conditions;
· Unusual emissions, when storm water runoff containing automotive oils or rubbish from unintended connections enter the system in an uncontrolled manner.
13.11.1.2 The relocated STSTW will be designed and operated as a modern facility. All treatment units with potential odour emission will be covered and the exhausted air will be conveyed to the deodourizer for treatment before discharge to the environment via ventilation shaft. With thorough control and monitoring system, the leakage during normal operation are not anticipated.
13.11.1.3 The operator must also be well trained to avoid any accidental events. The possible accidental events associated with health impacts and their corresponding preventive measures are listed in Table 13.21.
Table 13.21 Potential Accidental Events and Preventive Measures
|
Risks |
Preventive Measures |
|
Emission during upset conditions |
➢
Provision of sufficient standby units for all
major treatment units and E&M equipment; ➢
Provision
of dual power supply to the sewage treatment works. |
|
Emission from leakage from covered
tankage or improper installation |
➢
Install real-time monitoring sensor to
continuous monitor the concentration.
When concentration exceed the action limit, the operator will carry
out investigation and repairing works as soon as practicable. |
|
Aerial emissions (emission discharge
exceed the discharge limit) |
➢
Use of best available techniques in emission stack design, implement continuous and regular emission monitoring. |
|
Transportation, storage and handling |
➢
Implement good waste/sludge transportation, storage and handling practices; ➢
Develop procedures for and deploy as necessary emergency response including spill response for accidents involving transport vehicles; ➢
Enforce strict driver skill standards and implement driver and road safety behavior training. |
|
Chemical spillage and leakage |
➢
Implement proper chemicals and chemical wastes handling and storage procedures; ➢
Develop and implement spill prevention and response plan including provision of spill response equipment and trained personnel. |
|
Employee health and safety |
➢
Implement industry best practice with reference to international standards and
guidelines. |
13.11.1.4 To further avoid or minimize the potential health impacts associated with other possible accidental events, an emergency response plan should be developed and properly implemented for the Project. It should be noted that the emergency response plan should be specific to the final design and operation of the Project. With the implementation of the preventive measures outlined in Table 13.21 above, and with an effective emergency response plan for the Project, the health impacts associated with any potential accidental events could be minimized, if not entirely avoided.
13.12 Conclusion
13.12.1.1 The CSTW is fully enclosed in the cavern and the potential TAP emission from the sewage treatment facilities would be treated by the deodourizing units before being discharged into atmosphere from the ventilation shaft which is located at a remote uphill area.
13.12.1.2 The risk arising from exposure to TAPs associated with the emissions of the relocated STSTW is evaluated in this section. The non-carcinogenic and carcinogenic health impact of the TAPs imposed to the impacted HRs were assessed and compared with international guideline levels. It is concluded that the levels of TAPs at HRs were found to be extremely small when compared to the derived reference levels. The highest incremental cancer risk arising from the operation of CSTW is predicted to be 7.1E-08 which is far below the guidance level of 1E-06 adopted by USEPA and it is considered that the Project would not present an unacceptable risk and no further analysis is necessary. For the criteria air pollutants, while it is not possible to rule out the additional potential health effects from the operation of CSTW with complete certainty, the impact on health from extremely small additional air pollutants is likely to be very small and unlikely to be quantifiable.
13.12.1.3 Reuse of treated effluent from the Project by general public is not proposed. The treated effluent from the Project would be limited to non-potable use inside the plant. No direct human contact is involved and the health impact to humans is not expected during the operation phase of the effluent reuse system.
13.12.1.4 The results are sound and reasonable as the influent to the STSTW is mainly domestic waste water generated from day-to-day human activities. No further mitigation measures are required.
13.13 References
13.13.1 Literature for STW-related TAPs
[1] New Zealand Institute of Chemistry, 1998. Chemical Processes in New Zealand, Water Section, Article on Sewage Treatment (http://nzic.org.nz/ChemProcesses/water/13C.pdf)
[2] Water Environment Federation and American Society of Civil Engineers, 1995. Odor Control in Wastewater Treatment Plants. Water Environment Federation Manual of Practice No. 22 and ASCE Manuals and Reports on Engineering Practice No. 82. Alexandria, Va.: Water Environment Federation and American Society of Civil Engineers.
[3] Meridian Engineering and Technology, Consulting Engineers and Scientists, 1993. Reference Data Sheet on Sewer Gas(ES). (http://www.meridianeng.com/sewergas.html)
[4] Reviews in Environmental Science and Bio/Technology, 2006. Treatment of Biogas Produced in Anaerobic Reactors for Domestic Wastewater: Odor Control and Energy/Resource Recovery, (2006), 93-114. DOI 10.1007/s11157-005-2754-6
[5 ]Journal of Hazardous Materials, 2003. Recent advances in VOCs removal from water by pervaporation, (2003), 69-90. (www.elsevier.com/locate/jhazmat)
[6] Water Environment Research Foundation. Municipal Wastewater Treatment, Washington Statement Air Toxic Sources and Emmision Methods.
[7] Environmental Protection Agency, 1997. Wastewater Treatment Manuals-Primary, Secondary and Tertiary Treatment, 79-80.
[8] Water Environment Research Foundation, 2007. Minimization of Odors and Corrosion in Collection System. (http://tools.werf.org/Files/Front%20Matter.pdf)
[9] Water Environment Research Foundation, 2007. Odor Control “ABC’s” How to Compare and Evaluate Odor Control Technologies. (http://www.gesodorcontrol.com/abcs.pdf)
[10] Aysen M., 2002. A Study of Volatile Organic Sulfur Emissons Causing Urban Odors. Chemosphere. 51 (2003) 245-252.
[11] Applied Microbiology and Biotechnology, 2012. Abatement of Odorant Compounds in One-and two-phase Biotrickling Filters under Steady and Transient Conditions, 97: 4627-4638. DOI 10.1007/s00253-01204247-1
[12] Water Environment Research Foundation, 2007. Odor Control, Operation of Muicipal Wastewaer Treatment Plants, WEF Manual of Practice No.11, Sixth Edition. (http://www. Wef.org)
[13] Chemical Engineering Transactions, 2012. Characterising Volatile Organic Compounds from Sewer Emissions by Thermal Desorption Coupled with Gas-Chromatography-Mass Spectrometry, 30(2012), 73-78. DOI: 10.3303/CET1230013. (www.aidic.it/cet)
[14] Water Pollution Control Fedration, 1985. Eliminatin of Odor at Six Major Wastewter Treatment Plants, 57(10), 1027-1032. (http://www.jstor.org/stable/25042774)
[15] Sensors, 2009. Emmison Characteristics and Factors of Selected Odorous Compounds at a Wastewater Treatment Plant, 9(2009), 311-326. DOI: 10.3390/s90100311. (www.mdpi.com/journal/sensors)
[16] Water Science and Technolody, 1998. Fate of Dissolved Odorous Compounds in Sewage Treatment Plants, 38(3), 337-344. PII: S0273-1223(98)00560-5
[17] Water Research, 1994. Identification and Quantidication of Sulfur and Nitrogen Containing Odorous Compounds in Wastewater, 29(2), 711-718.
[18] Water Environment Research Foundation, 2003. Identifying and Controlling Odor in the Municipal Wastewater Environment Phase I: Literature Search and Review.
[19] Water Environment Research Foundation, 2003. Identifying and Controlling Odor in the Municipal Wastewater Environment Phase II: Impacts of In-Plant Paremeters on Biosolids Odor Quality.
[20] United States Environmental Protection Agency (USEPA) published list of Hazardous Air Pollutants under the Clean Air Act, 1990; https://www.epa.gov/haps/initial-list-hazardous-air-pollutants-modifications)
[21] Research Gate, 2005. Odor Abatement in Wastewater Treatment Plants. (http://www.researchgate.net/publication/229522985)
[22] Water Environment Research, 2003. Odor and Volatile Organic Compound Removal from Wastewater Treatment Plant Headworks Ventilation Air Using a Biofilter, 75(5), 444-454. (http://www.jstor.org/stable/25045719)
[23] Water Environment Federation, 1980. Odor Control: An Operator's Guide, 52(10), 2523-2537. http://www.jstor.org/stable/25040916
[24] Water Pollution Control Federation, 1980. Odor Control of Wastewater Treatment Plants, 52(5), 906-913. (http://ww.jstor.org/stable/25040812)
[25] Water Air and Soil Pollution, 2012. Simultaneous Removal of H2S, NH3 and Ethyl Mercaptan in Biotrickling Filters Packed with Poplar Wood and Polyyurethane Foam: Impact of pH During Startup and Crossed Effects Evaluation, 223(2012), 3485-3497. DOI: 10.1007/s11270-012-1126-4
[26] Water Environment Federation, Water Pollution Control Federation, 1986. Volatile Organic in the Wastewater and Airspaces of Three Wastewter Treatment Plants, 58(9), 886-895. (http://www.jstor.org/stable/25043074)
[27] Environment Research, 2004. Polycyclic Aromatic Hydrocarbons and Polychlorobiphenyls in Wastewaters and Sewage Sludges from the Paris Area (France), 95(2):184-97. (http://www.ncbi.nlm.nih.gov/pubmed/15147924)
13.13.2 Reference for Emission Inventory
[28]
Zeszyty Naukowe Wyższej Szkoły Zarządzania Ochroną Pracy W Katowicach, 2014.
The Effectiveness Adsorption of Carcinogenic PAHs on Mineral and on Organic
Sorbents, 10(2014), 5-16.
[29]
Journal of Environmental Science and Health, Part A, Toxic/Hazardous Substance
& Environmental Engineering, 2012. Effect of Carbon Sources on the Removal
of 1,1,2-trichloroethane and 1,1,2,2-tetrachloroethane in UASB Reactor, 47(4),
638-644.
http://www.ncbi.nlm.nih.gov/pubmed/22375547
[30]
Applied Microbiology and Biotechnology, 1994. Increased Removal Capacity for
1,2-Dichloroethane by Biological Modification of the Granular Activated Carbon
Process, 42(1), 167-172. http://www.ncbi.nlm.nih.gov/pubmed/7765815
[31]
Asian Journal of Atmospheric Environment, 2011. Efficiency Evaluation of
Adsorbents for the Removal of VOC and NO2 in an Underground Subway
Station, 5(2), 113-120.
[32] Taylor & Francis Group, 2005. Activated
Carbon Adsorption, 431-434.
[33] A
Jone Willey & Sons, Inc.,Publications, 2006. Wastewater Bacteria, 119-122.
[34]
Levis Publications, 2003. VOC Emissions from Wastewater Treatment Plants,
87-88.
13.13.3 Reference for Methodology
[35] EPD, Hong Kong. 2014. EIA Study Brief No. ESB-273/2014.
[36] Raymond K.S. Chan. 2011. Future Cavern Development in Hong Kong. Presentation to the HKIE-HKIP Joint Conference on Planning and Development of Underground Space.
[37] AECOM/Mansell. 2007. Kai Tak Development Engineering Study cum Design and Construction of Advance Works –Investigation, Design and Construction. KTAC Odour Assessment Methodology Paper. Agreement No. CE 35/2006 (CE).
[38] AECOM. 2008. Sludge Treatment Facilities EIA, EIA Study Brief No. ESB-169/2007, Potential Human Health Risk Assessment from the Construction and Operation of Sludge Treatment Facilities. Available at: (http://www.epd.gov.hk/eia/register/report/eiareport/eia_1552008/EIA%20Report/html/Tex t/S4_HRA.htm).
[39] AECOM. 2011. Tsang Tsui Ash Lagoon EIA, EIA Study Brief No. ESB-184/2008, Potential Health Impacts of Aerial Emissions from the IWMF during Operational Phase. Available at:
(http://www.epd.gov.hk/eia/register/report/eiareport/eia_2012011/EIA/EIA_HTML/S9a_He althImpact-TTAL.htm).
[40] Airport Authority Hong Kong. 2014. Expansion of Hong Kong International Airport into a Three-Runway System EIA, EIA Study Brief No. ESB-250/2012, Human Impact Assessment for Emissions of TAPs associated with the Operation of the Three-Runway System. Available at:
(http://www.epd.gov.hk/eia/register/report/eiareport/eia_2232014/html/Ch%2017%20-
[41] UK Department of Environment, Transport and region (DETR)/Department of Environment Food, Rural Areas. 2000. https://www.gov.uk/government/uploads/system/uploads/attachment_data/file/69450/pb1 3670-green-leaves-iii-1111071.pdf
[42] EUGRIS (European groundwater and contaminated land remediation information system). 2005. "Integrated Soil and Water Protection: Risks from Large Scale Diffuse Pollution" (SOWA). http://www.eugris.info/aboutEugris/EUGRIS%20Outline.pdf
[43] Scotland & Northern Ireland Forum for Environmental Research (SNIFFER). 2007. “Environmental Legislation and Human Health – Guidance for Assessing Risk. http://www.sniffer.org
[44] Brown, NJ. 1997. Health Hazard Manual: Wastewater Treatment Plant and Sewer Workers, Manuals and User Guides. Cornell University ILR School, http://digitalcommons.ilr.cornell.edu/manuals/.
[45] US EPA/USAID. 1992. Report EPA/625/R-92/004, US EPA (Office of Water) and USAID, Washington DC.
[46] US EPA. 1973. Water quality criteria. Ecological Research Series, EPA R-3-73-033. US Environmental Protection Agency, Washington, DC. US EPA (1986), EPA440/5-84-002. Office of Water Regulations and Standards Division, Washington DC.
[47] WHO. 2001. Water Quality: Guidelines, Standards and Health. Chap. 8, Risk Assessment. Edited by Lorna Fewtrell and Jamie Bartram. Published by IWA Publishing, London, UK. ISBN: 1 900222 28 0.
[48] WHO. 1993. Guidelines for Drinking Water Quality. Volume 1: Recommendations. Geneva.
[49] WHO. 1996. Guidelines for Drinking Water Quality. Volume 2: Health criteria and other supporting information. Geneva.
[50] WHO. 1997. Guidelines for Drinking Water Quality. Volume 3: Surveillance and control of community supplies. Geneva
[51] WHO. 1989. Health Guidelines for the Use of Wastewater in Agriculture and Aquaculture. Report of a WHO Scientific Group, Technical Report Series No. 778, WHO, Geneva.
[52] WHO. 1973. Reuse of Effluents: Methods of Wastewater Treatment and Public Health Safeguards. Report of a WHO Meeting of Experts, Technical Report Series No. 517, WHO, Geneva.
[53] WHO, 2006. WHO Air Quality Guidelines for Particulate Matter, Ozone, Nitrogen dioxide, and Sulphur Dioxide. Global update 2005. Summary of Risk Assessment.
WHO/SDE/PHE/OEH/06.02. Geneva.
[54] WHO. 2010. WHO Human Health Risk Assessment Toolkit: Chemical Hazards. http://www.who.int/ipcs/methods/risk_assessment/en/Environmental Health Guidance for Wastewater Applications. Geneva
13.13.4 Health Risk Assessment Guidance
[55] Lakes Environmental, 2005. IRAP-h (Integrated Risk Assessment Protocol – health), a Computer Model, which implements the analyses defined in the US EPA’s 2005 HHRAP (Human Health Risk Assessment Protocol. Toronto, CA. http://www.weblakes.com/products/iraph/
[56] National Research Council. 1983. Risk Assessment in the Federal Government: Managing the Process. http://www.nap.edu/openbook.php?isbn=0309033497
[57] Rebecca T. Parkin. 2008. Foundations and Frameworks for Human Microbial Risk Assessment. Center for Risk Science and Public Health School of Public Health and Health Services, the George Washington University Medical Center. Submitted to US EPA, Washington, DC.
[58] U.S. EPA. Human Health Risk Assessment Protocol for Hazardous Waste Combustion Facilities, EPA530-R-05-006. Office Of Solid Waste. September 2005
[59] U.S. EPA. 2005. Guidelines for Carcinogen Risk Assessment. EPA/630/P-03/001F. Risk Assessment Forum, Washington DC. U.S. EPA. 1994a. Air Emissions Models for Waste and Wastewater. EPA-453/R-94-080-A Appendix C. OAQPS, RTP, NC.
[60] U.S. EPA. 2001-2014.. Integrated Risk Information System (IRIS). National Center for Environmental Assessment, Office of Research and Development, Washington, DC. Available online at http://www.epa.gov/iris/.
[61] U.S. EPA. 1998b. Methodology for Assessing Health Risks Associated with Multiple Exposure Pathways to Combustor Emissions. Update to EPA-600/6-90-003 Methodology for Assessing Health Risks Associated with Indirect Exposure to Combustor Emissions. EPA-600/R-98-137. National Center for Environmental Assessment, Cincinnati, OH.
[62] U.S. EPA. 1997. “Risk Characterization Policy; Guidance for Cumulative Assessment, Part 1: Planning and Scoping” (USEPA, 1997a);
[63] U.S. EPA. 1997a. Exposure Factors Handbook. Office of Research and Development, National Center for Environmental Assessment. Office of Solid Waste and Emergency Response, Washington, DC.
[64] U.S. EPA. 1997b. Health Effects Assessment Summary Tables (HEAST). EPA-540-R-97-
036. FY 1997 Update.
[65] U.S. EPA. 1989. Development of Risk Assessment Methodology for Municipal Sludge Landfilling. EPA 600/6-90-008. ORD, Washington, DC.
[66] U.S. EPA.. 1989. Risk Assessment Guidance for Superfund, or RAGS http://www.epa.gov/oswer/riskassessment/risk_superfund.htm
[67] U.S. EPA. 1987b. Processes, Coefficients, and Models for Simulation Toxic Organics and Heavy Metals in Surface Waters. EPA/600/3-87/015. Office of Research and Development, Athens, GA.
[68] Odor and Biological Hazard Exposure Measurement Studies for Sewage Treatment Plants:
[69] Abdou, Mamdouh HM. 2007. Health Impacts on Workers in Wastewater Treatment Plants in Jeddah City, Saudi Arabia. J Egypt Public Health Assoc., 82, No. 5 & 6.
[70] Fracchia, L; Pietronave, S; Rinaldi, M; Martinotti, MG. 2006. Site-related airborne biological hazard and seasonal variations in two wastewater treatment plants. Water Research, 40:1985-94.
[71] Johnson, DE; et, al. 1978. Health Implications of Sewage Treatment Facilities, Southwest Research Institute, San Antonio, TX, Contract No. 68-02-1746, USEPA Health Effects Research Laboratory, Cincinnati, OH.
[72] King County Dept. of Natural Resources and Parks. 2003. Bridgewater Project, Appendix 5-A. Odor and Air Quality: Treatment Plant. Seattle, Washington.
[73] Nielson, EM, et al.. Bioaerosol Exposure in Waste Collection: A Comparative Study on the Significance of Collection Equipment, Type of Waste and Seasonal Variation. Ann. Occup. Hyg. 41, No. 3, pp 325-344. 1997.
[74] Walters, M; Milton, D; Larsson, L; and Ford, T. Airborne Environmental Endotoxins: A Cross Validation of Sampling and Analysis Techniques. Appl. and Envir. Microbiology, 60, No. 3, p.996-1005, March 1994.
[75] WHO/UNEP. 1991. Environmental Impact Assessment: Sewage Treatment Plant for Port Said. UNEP Regional Seas Reports and Studies No. 133. Ministry of Development, New Communities, Housing and Public Utilities of Egypt.
[76] Trace Toxic Chemical Exposure to Sewage Treatment Plant Workers:
[77] Elia, VJ; Clark, CS; Majeti, VA; Gartside, PS; MacDonald, T; Richdale, N; Meyer, CR; Van Meer, GL; Hunninen, K. 1983. Hazardous chemical exposure at a municipal wastewater treatment plant. Environ Res.; 32 (2):360-71. Copyright 2010, 1105 Media
Inc., March 24,
2012.
[78] Environmental Protection Bureau. 2009. Investigation and Evaluation of VOCs Total Emissions from the Storm and Sewerage Systems in Kaohsiung City Area, Environmental Protection Bureau, Kaohsiung City Government Report (in Chinese), Taiwan.
[79] Occupational Health & Safety Newsletter. March 24, 2012.. Two Workers Die from Hydrogen Sulphide Inhalation, (10/12/11), Firm Fined $166,890 (USD).
13.13.5 Radon Assessment
[80] AECOM (2003). Sludge Treatment Facilities – Feasibility Study – EIA Report (Agreement No. CE 28/2003).
[81] Arup (2009). West New Territories (WENT) Landfill Extensions – Feasibility Study – EIA Report (Agreement No. CE 43/2006).
<End of Section 13>