3.2
Environmental
Legislation, Standards and Guidelines
3.4
Identification
Of Air Sensitive Receivers
3.6
Identification
of Pollution Sources
3.7
Assessment
Methodology – Construction Phase
3.8
Assessment
Methodology – Operational Phase
3.11
Evaluation
of Residual Impacts
3.12
Environmental
Monitoring and Audit..
List of TABLES
Table 3.1.... Hong Kong Air Quality Objectives
Table 3.2.... Air Quality Standards for Non-AQO
Criteria Pollutants
Table 3.3.... Identified Representative Air Sensitive
Receivers
Table 3.5.... Background Concentrations extracted from
PATH v2.1 Model
Table 3.6.... Background Concentrations of Non-AQO Air
Pollutants
Table 3.7.... Construction Dust Assessment Scenarios
Table 3.8.... Emission Factor for Dusty Construction
Activities
Table 3.9.... Modelling Parameters
Table 3.10. 1-hour to 10-minute Conversion Factors
Table 3.11. 1-hour to 15-minute and 1-hour to 30-minute
Conversion Factors
Table 3.12. 1-hour to 5-second Conversion Factors
Table 3.13. Predicted Cumulative Dust Impact (Scenario
A)
Table 3.14. Predicted Cumulative Dust Impact (Scenario
B)
Table 3.15 The Predicted
Cumulative Dust Impacts of the Focused Assessments
Table 3.18. Predicted Odour
Impact at Representative Air Sensitive Receivers
List of figures
Figure 3.1 Location of Representative Air Sensitive Receivers
Figure 3.2 Proposed Facilities inside TPSTW
Figure 3.3 Contours of Cumulative Maximum hourly averaged TSP Concentration (μg/m3) at 1.5mAG during Construction phase (Scenario A)
Figure 3.4 Contours of Cumulative 10th Highest daily averaged RSP Concentration (μg/m3) at 1.5mAG during Construction phase (Scenario A)
Figure 3.5 Contours of Cumulative Annual averaged RSP Concentration (μg/ m3) at 1.5mAG during Construction phase (Scenario A)
Figure 3.6 Contours of Cumulative 19th Highest daily averaged FSP Concentration (μg/ m3) at 20mAG during Construction phase (Scenario A)
Figure 3.7 Contours of Cumulative Annual averaged FSP Concentration (μg/ m3) at 23mAG during Construction phase (Scenario A)
Figure 3.8 Contours of Cumulative Maximum hourly averaged TSP Concentration (μg/ m3) at 1.5mAG during Construction phase (Scenario B)
Figure 3.9 Contours of Cumulative 10th Highest daily averaged RSP Concentration (μg/ m3) at 1.5mAG during Construction phase (Scenario B)
Figure 3.10 Contours of Cumulative Annual averaged RSP Concentration (μg/ m3) at 1.5mAG during Construction phase (Scenario B)
Figure 3.11 Contours of Cumulative 19th Highest daily averaged FSP Concentration (μg/ m3) at 1.5mAG during Construction phase (Scenario B)
Figure 3.12 Contours of Cumulative Annual averaged FSP Concentration (μg/ m3) at 1.5mAG during Construction phase (Scenario B)
Figure 3.13 Contours of Cumulative Maximum hourly averaged TSP Concentration (μg/ m3) at 1.5mAG during Construction phase (Scenario C1)
Figure 3.14 Contours of Cumulative 10th Highest daily averaged RSP Concentration (μg/ m3) at 1.5mAG during Construction phase (Scenario C1)
Figure 3.15 Contours of Cumulative Annual averaged RSP Concentration (μg/ m3) at 1.5mAG during Construction phase (Scenario C1)
Figure 3.16 Contours of Cumulative 19th Highest daily averaged FSP Concentration (μg/ m3) at 20mAG during Construction phase (Scenario C1)
Figure 3.17 Contours of Cumulative Annual averaged FSP Concentration (μg/ m3) at 23mAG during Construction phase (Scenario C1)
Figure 3.18 Contours of Cumulative Maximum hourly averaged TSP Concentration (μg/ m3) at 1.5mAG during Construction phase (Scenario C2)
Figure 3.19 Contours of Cumulative 10th Highest daily averaged RSP Concentration (μg/ m3) at 1.5mAG during Construction phase (Scenario C2)
Figure 3.20 Contours of Cumulative Annual averaged RSP Concentration (μg/ m3) at 1.5mAG during Construction phase (Scenario C2)
Figure 3.21 Contours of Cumulative 19th Highest daily averaged FSP Concentration (μg/ m3) at 20mAG during Construction phase (Scenario C2)
Figure 3.22 Contours of Cumulative Annual averaged FSP Concentration (μg/ m3) at 23mAG during Construction phase (Scenario C2)
Figure 3.23 Contours of Cumulative Maximum hourly averaged TSP Concentration (μg/ m3) at 1.5mAG during Construction phase (Scenario C3)
Figure 3.24 Contours of Cumulative 10th Highest daily averaged RSP Concentration (μg/ m3) at 1.5mAG during Construction phase (Scenario C3)
Figure 3.25 Contours of Cumulative Annual averaged RSP Concentration (μg/ m3) at 1.5mAG during Construction phase (Scenario C3)
Figure 3.26 Contours of Cumulative 19th Highest daily averaged FSP Concentration (μg/ m3) at 20mAG during Construction phase (Scenario C3)
Figure 3.27 Contours of Cumulative Annual averaged FSP Concentration (μg/ m3) at 23mAG during Construction phase (Scenario C3)
Figure 3.28 Contours of Cumulative Maximum hourly averaged TSP Concentration (μg/ m3) at 1.5mAG during Construction phase (Scenario C4)
Figure 3.29 Contours of Cumulative 10th Highest daily averaged RSP Concentration (μg/ m3) at 1.5mAG during Construction phase (Scenario C4)
Figure 3.30 Contours of Cumulative Annual averaged RSP Concentration (μg/ m3) at 1.5mAG during Construction phase (Scenario C4)
Figure 3.31 Contours of Cumulative 19th Highest daily averaged FSP Concentration (μg/ m3) at 20mAG during Construction phase (Scenario C4)
Figure 3.32 Contours of Cumulative Annual averaged FSP Concentration (μg/ m3) at 23mAG during Construction phase (Scenario C4)
Figure 3.33 Contours of Cumulative Maximum hourly averaged TSP Concentration (μg/ m3) at 1.5mAG during Construction phase (Scenario D1)
Figure 3.34 Contours of Cumulative 10th Highest daily averaged RSP Concentration (μg/ m3) at 1.5mAG during Construction phase (Scenario D1)
Figure 3.35 Contours of Cumulative Annual averaged RSP Concentration (μg/ m3) at 1.5mAG during Construction phase (Scenario D1)
Figure 3.36 Contours of Cumulative 19th Highest daily averaged FSP Concentration (μg/ m3) at 1.5mAG during Construction phase (Scenario D1)
Figure 3.37 Contours of Cumulative Annual averaged FSP Concentration (μg/ m3) at 1.5mAG during Construction phase (Scenario D1)
Figure 3.38 Contours of Cumulative Maximum hourly averaged TSP Concentration (μg/ m3) at 1.5mAG during Construction phase (Scenario D2)
Figure 3.39 Contours of Cumulative 10th Highest daily averaged RSP Concentration (μg/ m3) at 1.5mAG during Construction phase (Scenario D2)
Figure 3.40 Contours of Cumulative Annual averaged RSP Concentration (μg/ m3) at 1.5mAG during Construction phase (Scenario D2)
Figure 3.41 Contours of Cumulative 19th Highest daily averaged FSP Concentration (μg/ m3) at 20mAG during Construction phase (Scenario D2)
Figure 3.42 Contours of Cumulative Annual averaged FSP Concentration (μg/ m3) at 1.5mAG during Construction phase (Scenario D2)
Figure 3.43 Contours of Cumulative Maximum hourly averaged TSP Concentration (μg/ m3) at 1.5mAG during Construction phase (Scenario D3)
Figure 3.44 Contours of Cumulative 10th Highest daily averaged RSP Concentration (μg/ m3) at 1.5mAG during Construction phase (Scenario D3)
Figure 3.45 Contours of Cumulative Annual averaged RSP Concentration (μg/ m3) at 1.5mAG during Construction phase (Scenario D3)
Figure 3.46 Contours of Cumulative 19th Highest daily averaged FSP Concentration (μg/ m3) at 1.5mAG during Construction phase (Scenario D3)
Figure 3.47 Contours of Cumulative Annual averaged FSP Concentration (μg/ m3) at 1.5mAG during Construction phase (Scenario D3)
Figure 3.48 Contours of Cumulative Maximum hourly averaged TSP Concentration (μg/ m3) at 1.5mAG during Construction phase (Scenario D4)
Figure 3.49 Contours of Cumulative 10th Highest daily averaged RSP Concentration (μg/ m3) at 1.5mAG during Construction phase (Scenario D4)
Figure 3.50 Contours of Cumulative Annual averaged RSP Concentration (μg/ m3) at 1.5mAG during Construction phase (Scenario D4)
Figure 3.51 Contours of Cumulative 19th Highest daily averaged FSP Concentration (μg/ m3) at 20mAG during Construction phase (Scenario D4)
Figure 3.52 Contours of Cumulative Annual averaged FSP Concentration (μg/ m3) at 1.5mAG during Construction phase (Scenario D4)
Figure 3.53 Contours of Cumulative 10th Highest daily averaged RSP Concentration (μg/ m3) at 20mAG during Operation phase
Figure 3.54 Contours of Cumulative Annual Averaged RSP Concentration (μg/ m3) at 40mAG during Operation phase
Figure 3.55 Contours of Cumulative 19th Highest daily averaged FSP Concentration (μg/ m3) at 20mAG during Operation phase
Figure 3.56 Contours of Cumulative Annual Averaged FSP Concentration (μg/ m3) at 40mAG during Operation phase
Figure 3.57 Contours of Cumulative 19th Highest hourly averaged N O2 Concentration (μg/ m3) at 35mAG during Operation phase
Figure 3.58 Contours of Cumulative Annual Averaged N O2 Concentration (μg/ m3) at 45mAG during Operation phase
Figure 3.59 Contours of Cumulative 4th Highest 10-min averaged SO2 Concentration (μg/ m3) at 65mAG during Operation phase
Figure 3.60 Contours of Cumulative 4th Highest daily averaged SO2 Concentration (μg/ m3) at 65mAG during Operation phase
Figure 3.61. Contours of Cumulative 5 Second
Average Odour Concentration (μg/ m3) at 15mAG during Operation phase
List of Appendices
Appendix 3.1 Calculation of Dust Emission Rate
Appendix 3.2 Calculation of Industrial Emission Rate
Appendix 3.3 Details of Surface Characteristics
Appendix 3.4 Traffic Forecast
Appendix 3.5 Weather Information from the Hong Kong Observatory (HKO)
Appendix 3.6 Calculation of Vehicular Emission
Appendix 3.7 Odour Survey for Tai Po Sewage Treatment Works
Appendix 3.8 Calculation of Odour Emission Rate
Appendix 3.9 Detailed Air Quality Assessment Results
3
Air
Quality Impact
3.1 Introduction
3.1.1.1 This section presents the assessment on potential air quality impacts arising from construction and operation of the Project, which has been conducted in accordance with the criteria and guidelines as stated in Section 1 of Annex 4 and Annex 12 of the Technical Memorandum on Environmental Impact Assessment Process (EIAO-TM) as well as the requirements given in the EIA Study Brief (No. ESB-321/2019).
3.2 Environmental Legislation, Standards and Guidelines
3.2.1.1 The criteria for evaluating air quality impacts and the guidelines for air quality assessment are laid out in Annex 4 and Annex 12 of the TM-EIAO.
3.2.2 Air Quality Objectives
3.2.2.1 The principal legislation for the management of air quality in Hong Kong is the Air Pollution Control Ordinance (APCO) (Cap. 311). The Air Quality Objectives (AQOs) given under the APCO stipulate the statutory ambient limits for air pollutants and the maximum allowable number of exceedances over specific averaging periods. The latest AQOs., which has been in effect from 1 January 2022, are presented in Table 3.1.
Table 3.1 Hong Kong Air Quality Objectives
|
Pollutants |
Averaging Time |
Concentration Limit (µg/m3) |
Number of Exceedance Allowed per Year |
|
Sulphur Dioxide |
10-min |
500 |
3 |
|
24-hour |
50 |
3 |
|
|
Respirable Suspended Particulates |
24-hour |
100 |
9 |
|
Annual |
50 |
N/A |
|
|
Fine Suspended Particulates |
24-hour |
50 |
18[4] |
|
Annual |
25 |
N/A |
|
|
Nitrogen Dioxide (NO2) [1] |
1-hour |
200 |
18 |
|
Annual |
40 |
N/A |
|
|
Ozone (O3) [1] |
8-hour |
160 |
9 |
|
Carbon Monoxide (CO) [1] |
1-hour |
30,000 |
0 |
|
8-hour |
10,000 |
0 |
|
|
Lead (Pb) |
Annual |
0.5 |
NA |
Note:
[1] Measured at 293K and 101.325 kPa.
[2] Suspended particles in air with a nominal aerodynamic diameter of 10 μm or less
[3] Suspended particles in air with a nominal aerodynamic diameter of 2.5 μm or less
[4] The number of exceedances allowed per year for 24-hour averaged FSP should be 18 days per calendar year for government projects
3.2.3 Technical Memorandum on EIA Process
3.2.3.1 A maximum hourly Total Suspended Particles (TSP) level of 500 µg m-3 at Air Sensitive Receivers (ASRs) is also stipulated in Section 1, Annex 4 of the EIAO-TM to assess potential construction dust impacts. The measures stipulated in the Air Pollution Control (Construction Dust) Regulation should also be followed whenever possible to ensure that any dust impacts are reduced.
3.2.3.2 Annex 4 of the EIAO-TM has also stipulated that the odour level at an ASR should not exceed 5 odour units based on an averaging time of 5 seconds for odour prediction assessment.
3.2.1 Air Quality Standards for Non-AQO Criteria Pollutants
3.2.2 Aside from the AQO criteria pollutants mentioned in Section 3.2.2, Volatile Organic Compounds (VOCs), Hydrogen Chloride (HCl) and Hydrogen Fluoride (HF) would also be emitted from the combustion of biogas at the proposed biogas engine and boilers. In accordance with Annex 4 of EIAO-TM, for air pollutants with no established criteria under the Air Pollution Control Ordinance nor in the EIAO-TM, standards or criteria adopted by recognized international organizations shall be met. The air quality standards for these pollutants are detailed in Table 3.2.
Table 3.2 Air Quality Standards for Non-AQO Criteria Pollutants
|
Pollutants |
Averaging Time |
Air Quality Standard (µg/m3) |
Reference |
|
Methane (CH4) |
15-minute |
600,000 |
TEEL-1 (the threshold concentration below which most people will experience no adverse health effects) from https://edms3.energy.gov/pac/Docs/Revision_26_Table4.pdf |
|
Hydrogen Chloride (HCl) |
1-hour |
2100 |
|
|
Annual |
20 |
||
|
Hydrogen Fluoride (HF) |
1-hour |
240 |
|
|
Annual |
14 |
||
|
Formaldehyde (CH2O) |
30-min |
100 |
World Health Organization Air Quality
Guidelines for Europe (https://www.euro.who.int/__data/assets/pdf_file/0005/74732/E71922.pdf) |
|
Annual |
9 |
Office of Environmental Health Hazard Assessment (OEHHA) Toxicity Criteria Database, California, USA (http://www.oehha.ca.gov/tcdb/index.asp). |
3.2.3 Air Pollution Control (Construction Dust) Regulation
3.2.3.1 Notifiable and regulatory works are under the control of Air Pollution Control (Construction Dust) Regulation. This Project is expected to include notifiable works (foundation and superstructure construction and demolition) and regulatory works (dusty material handling and excavation). Contractors are required to inform Environmental Protection Department (EPD) and adopt dust reduction measures to minimize dust emission, while carrying out construction works, to the acceptable level.
3.2.4 Air Pollution Control (Non-road Mobile Machinery) (Emission) Regulation
3.2.4.1 Under the Air Pollution Control (Non-road Mobile Machinery) (Emission) Regulation, only approved or exempted non-road mobile machineries with a proper label are allowed to be used in the construction site. The contractors are required to ensure the adopted non-road mobile machinery under the Project could meet the prescribed emission standards and requirement.
3.2.5 Air Pollution Control (Fuel Restriction) Regulation
3.2.5.1 Under the Air Pollution Control (Fuel Restriction) Regulation, types of fuel allowed for use and the sulphur contents in commercial and industrial processes are controlled to reduce sulphur dioxide (SO2) emissions. The contractors are required to use only fuels which are complied with the respective requirements such as gaseous fuel, conventional solid fuel with a sulphur content not exceeding 1% by weight, and liquid fuel with a sulphur content not exceeding 0.005% by weight and a viscosity not more than 6 centistokes at 40oC (i.e. Ultra Low Sulphur Diesel (ULSD)).
3.2.6 Recommended Pollution Control Clauses for Construction Contracts
3.2.6.1 The Recommended Pollution Control Clauses (RPCC) are a set of engineering practice to minimize the inconvenience and environmental nuisance to nearby residents and sensitive receivers. The contractors shall follow the requirements under RPCC, observe and comply with the Air Pollution Control Ordinance and its subsidiary regulations. Before the commencement of any work, the Engineer shall require the methods of working, plant, equipment and air pollution control system to be used on the site to be made available for inspection and approval to ensure that they are suitable for the project.
3.2.7 DEVB’s TC No.13/2020, Timely Application of Temporary Electricity and Water Supply for Public Works Contracts and Wider Use of Electric Vehicles in Public Works Contracts
3.2.7.1 The timely application of temporary electricity and water supply as well as the wider use of electric vehicles (EVs) in public works contracts are under this Circular. Timely provision of electricity and adoption of EVs could be able to improve roadside air quality and reduce carbon emissions, while timely provision of water supply could not only improve personal hygiene but also reduce pollution. Project team should timely apply for the temporary electricity and water supply with a target that the necessary cable/water mains laying works could be completed before the commencement date, and also specify the use of EVs in each public works contract in accordance with the minimum number as required under this Circular.
3.2.8 DEVB's TC No.1/2015, Emissions Control of NRMM in Capital Works Contracts of Public Works
3.2.8.1 In addition to the statutory requirements of the Air Pollution Control (Non-road Mobile Machinery) (Emission) Regulation, this Circular promulgates the requirements for the use of non-road mobile machinery (“NRMM”) approved under the regulation in new capital work contracts of public works including design and build contracts. No exempted NRMM for four types of NRMM, namely generators, air compressors, excavators and crawler cranes, are allowed in new capital works contracts of public works from 1 June 2019 onwards.
3.3 Study Area
3.3.1.1 Clause 3.4.4.2 of the EIA Study Brief prescribes the Study Area which is generally defined by a distance of 500 m from boundary of the Project, or to include other project locations as identified in the EIA. Figures 3.1 shows the Study Area within the 500 m envelope of the Project (including the works areas) and the identified representative ASRs which have been described in the next section in details. The Study Area is the same for both the construction and operational phases.
3.4 Identification of Air Sensitive Receivers
3.4.1.1 Air Sensitive Receivers (ASRs) have been identified in accordance with Annex 12 of EIAO-TM and are summarised in Table 3.3 and shown in Figure 3.1.
Table 3.3 Identified Representative Air Sensitive Receivers
|
ID |
Name |
Nature |
No. of Storeys |
Assessment Height (mAG) |
Separation Distance from the Nearest Site Boundary (m) |
|
ASR 1 |
Watson’s Water |
Industrial |
5 |
1.5, 5, 10, 15 and 20 |
39 |
|
ASR 2 |
Hong Kong Yakult |
Industrial |
3 |
1.5, 5 and 10 |
44 |
|
ASR 3 |
Maxim’s Food Factory 2 |
Industrial |
5 |
1.5, 5, 10, 15 and 20 |
40 |
|
ASR 4 |
PC3 Product Customization and Consolidation Centre |
Industrial |
8 |
1.5, 5, 10, 15, 20, 25, 30 and 35 |
53 |
|
ASR 5 |
Oriental Press Group Limited |
Industrial |
14 |
1.5, 5, 10, 15, 20, 25, 30, 35, 40, 45, 50, 55, 60 and 65 |
133 |
|
ASR 6 |
APT Telecom Services Ltd |
Industrial |
5 |
1.5, 5, 10, 15 and 20 |
96 |
|
ASR 7 |
Cabot Plastics Hong Kong Limited |
Industrial |
3 |
1.5, 5 and 10 |
38 |
|
ASR 8 |
Winner Food Products Limited |
Industrial |
6 |
1.5, 5, 10, 15, 20 and 23 |
40 |
|
ASR 9 |
Tung Fong Hung |
Industrial |
3 |
1.5, 5 and 10 |
4 |
|
ASR 10 |
Arvcto Digital Services |
Industrial |
4 |
1.5, 5, 10 and 15 |
4 |
|
ASR 11 |
Process Automation Ltd. |
Industrial |
4 |
1.5, 5, 10 and 15 |
4 |
|
ASR 12 |
Zama Industries Co., Ltd. |
Industrial |
3 |
1.5, 5 and 10 |
36 |
|
ASR 13 |
Taclon Industrial Ltd. |
Industrial |
3 |
1.5, 5 and 10 |
25 |
|
ASR 14 |
Hung Hing Offset Printing Centre |
Industrial |
3 |
1.5, 5 and 10 |
8 |
|
ASR 15 |
Tai Po Waterfront Park Viewing Point |
Recreational |
- |
1.5 |
240 |
|
ASR 16 |
Shuen Wan Golf Course (1) |
Recreational |
- |
1.5 |
495 |
|
ASR 17 |
Shuen Wan Golf Course (1) |
Recreational |
- |
1.5 |
531 |
|
ASR 18 |
Shuen Wan Golf Course (1) |
Recreational |
- |
1.5 |
67 |
|
ASR 19 |
Shuen Wan Golf Course (1) |
Recreational |
- |
1.5 |
56 |
Note (1) Shuen Wan Golf Course (SWGC) is a proposed project, which will be operated by end 2023 prior to the construction of this Project. ASR 16 and ASR 17 are representative receiver points with reference to the information provided in the approved EIA for SWGC (EIAO Register No.: AEIAR-221/2019).
3.5 Existing Air Quality
3.5.1.1 The Project is to upgrade the existing Tai Po Sewage Treatment Works (TPSTW). The existing TPSTW is situated at Dai Kwai Street, Tai Po Industrial Estate (TPIE).
3.5.1.2 Existing air quality in the Study Area is affected by emissions from the chimneys in TPIE and existing traffic from local roads, as well as odour emission from exposed area of some sewage treatment facilities in existing TPSTW.
3.5.1.3 Data collected by EPD air quality monitoring programme during the period of 2016 to 2020 were examined with the average period value presented in Table 3.4.
Table 3.4 5-year Averaged Annual Background Concentration of Air Pollutants recorded at Tai Po Station by EPD for the Period of 2016-2020
|
Pollutant |
Parameter |
Concentrations (μg/m3) |
AQOs (μg/m3) [2] |
|||||
|
2016 |
2017 |
2018 |
2019 |
2020 |
5-year mean |
|||
|
SO2 |
4th highest 10-minute |
37 |
39 |
24 |
20 |
19 |
28 |
500 (3) |
|
4th highest 24-hour |
10 |
9 |
8 |
10 |
7 |
9 |
50 (3) |
|
|
RSP |
10th highest 24-hour |
74 |
82 |
69 |
65 |
58 |
70 |
100 (9) |
|
Annual |
29 |
32 |
31 |
31 |
24 |
29 |
50 |
|
|
FSP |
19th highest 24-hour |
43 |
46 |
38 |
41 |
33 |
40 |
50 (18) |
|
Annual |
20 |
22 |
19 |
20 |
15 |
19 |
25 |
|
|
NO2 |
19th highest 1-hour |
112 |
127 |
125 |
142 |
106 |
122 |
200 (18) |
|
Annual |
33 |
39 |
36 |
36 |
30 |
35 |
40 |
|
|
O3 |
10th highest 8-hour |
147 |
181 |
167 |
197 |
165 |
171 |
160 (9) |
|
CO |
Max. 1-hour |
N/A |
N/A |
N/A |
N/A |
N/A |
N/A |
30,000 |
|
Max. 8-hour |
N/A |
N/A |
N/A |
N/A |
N/A |
N/A |
10,000 |
|
Notes:
[1] N/A – Not Available.
[2] Values in ( ) indicate the number of exceedances allowed per year.
[3] Data extracted from EPD Website (http://www.aqhi.gov.hk/en/download/air-quality-reportse469.html?showall=&start=1)
[4] Bolded and underlined values represent exceedances of the AQOs.
3.5.1.4 All measured 19th highest 1-hour NO2 levels from 2016 to 2020 complied with the AQO of 200 μg/m3. All measured annual mean levels were within the AQO of 40 μg/m3.
3.5.1.5 The 10th highest daily RSP levels from 2016 to 2020 complied with the AQO of 100μg/m3. The annual RSP levels were all within the AQO of 50μg/m3.
3.5.1.6 The 19th highest daily FSP levels had decreased from 43 μg/m3 in 2016 to 33 μg/m3 in 2020, as compared with the AQO of 50 μg/m3. The annual FSP levels were all within the AQO of 25μg/m3.
3.5.1.7 All the measured 4th highest 10-minute and 4th highest 24-hour SO2 levels were well within their respective AQOs of 500 μg/m3 and 50 μg/m3.
3.5.1.8 The highest 8-hour O3 levels ranged from 197 to 147μg/m3. Ozone is a product of photochemical reactions of NOx and volatile organic compounds (VOCs) instead of being emitted directly from human activities. In the presence of NOx (a common roadside pollutant), ozone will be broken down into oxygen. Exceedances found from Year 2017 to Year 2020 may be due to the regional O3 background and low local vehicle emissions, which result in small ozone scavenging effect and generally high level.
3.5.1.9 The highest 1-hour and 8-hour CO levels were not measured at Tai Po Station.
3.5.1.10 The future year background concentrations are made reference to the EPD’s PATH v2.1 modelling results. The dust (RSP and FSP) concentrations of the assessment year extracted from Year 2025 PATH results are presented in Table 3.5.
Table 3.5 Background Concentrations extracted from PATH v2.1 Model
|
Pollutant |
Parameter |
Concentrations in various PATH Grids (μg/m3) |
AQOs (μg/m3) [1] |
|||
|
41_48 |
41_49 |
42_48 |
42_49 |
|||
|
SO2 |
4th highest 10-mins [2] |
66 |
65 |
66 |
64 |
500 (3) |
|
4th highest 24-hour |
10 |
10 |
10 |
10 |
50 (3) |
|
|
RSP |
10th highest 24-hour[3] |
63 |
65 |
61 |
63 |
100 (9) |
|
Annual[4] |
27 |
27 |
26 |
27 |
50 |
|
|
FSP |
19th highest 24-hour |
34 |
36 |
32 |
36 |
50 (18) |
|
Annual[4] |
15 |
15 |
14 |
15 |
25 |
|
|
NO2 |
19th highest 1-hour |
76 |
73 |
69 |
70 |
200 (18) |
|
Annual |
14 |
12 |
11 |
11 |
40 |
|
|
O3 |
10th highest 8-hour |
195 |
194 |
195 |
193 |
160 (9) |
|
CO |
Max. 1-hour |
820 |
820 |
803 |
802 |
30,000 |
|
Max. 8-hour |
754 |
754 |
745 |
745 |
10,000 |
|
Note:
[1] Values in ( ) indicate number of exceedance allowed under the AQO.
[2] Values are given as highest 10-minute SO2 concentrations, which are estimated based on EPD’s “Guidelines on the Estimation of 10-minute Average SO2 Concentration for Air Quality Assessment in Hong Kong”.
[3] For 24-hr average PM10, the concentration is adjusted by adding 11.0 μg/m3, extracted from EPD’s Guidelines on Choice of Models and Model Parameters.
[4] For annual average PM10 and PM2.5 the concentration is adjusted by adding 10.3 μg/m3 and 3.5 μg/m3, extracted from EPD’s Guidelines on Choice of Models and Model Parameters.
[5] Bolded and underlined values represent exceedances of the AQOs
3.5.1.11 The background concentrations of non-AQO air pollutants assumed in this assessment are presented in Table 3.6.
Table 3.6 Background Concentrations of Non-AQO Air Pollutants
|
Non-AQO Air Pollutants |
HCl |
HF |
CH2O |
CH4 |
|
Background Conc. (μg/m3) |
N/A |
N/A |
3.86[1] |
N/A |
Note:
[1] Reference to EPD’s Air Quality in Hong Kong 2020 Report (EPD/TR 1/21).
[2] N/A: Not Available.
3.5.1.12 Odour surveys were conducted within TPSTW and areas near the TPSTW to determine the odour emission rate of different facilities within TPSTW and review the background odour intensity of ambient air in the vicinity of the TPSTW in Sep-Nov 2020 and Jul-Aug 2021. Based on the odour survey result, relatively high odour concentration was observed at various locations. The TPSTW has undergone odour improvement works including coverage of primary sedimentation tanks and the equipment modification / replacement works of the aeration tanks of the East Plant, as well as other reparation works. The plant is not operating at design operating condition. Therefore, emission rate for primary sedimentation tanks and aeration tanks were considered not representative to be used to conduct assessment. The final sedimentation tanks were located at the downstream of the concerned primary sedimentation and aeration tanks and therefore the emission rates measured at the final sedimentation tanks were also considered not representative to be used. Reference as stated in Section 3.8.1.2 were used for deriving the odour emission rates at the abovementioned locations. The detail of the odour surveys is presented in Appendix 3.7.
3.6 Identification of Pollution Sources
3.6.1 Construction Phase
3.6.1.1 Construction of the Project will be undertaken by stages. The New West Plant will be constructed in the expansion site first. Demolition of the existing West Plant and the upgrading works within the existing TPSTW will commence after commissioning of the New West Plant in the expansion site. The construction period of the New West Plant will be starting from 2025 and ended in 2029. The demolition and construction works within the existing TPSTW will be starting from 2029 and completed by 2036. The key air pollution sources in association with the Project during construction phase would be the dust emission (TSP, RSP and FSP) from the construction activities of the Project. The dusty construction activities include:
· Site clearance and site formation
· Demolition works
· Excavation for site formation work
· Wind erosion of construction site
3.6.1.2 Heavy construction activities such as demolition, excavation and wind erosion of exposed site area would contribute to construction dust. The locations of construction workfront for construction phases are presented in Appendix 3.1. The construction period is conservatively assumed to be 7 days per week and 10 operation hours per day from 08:00 to 18:00. Wind erosion is assumed for non-operation hours from 18:00 to 08:00 of the follow day.
3.6.1.3 Construction vehicles, estimated to be at most about 5 round trips per hour, will generally make use of Dai Kwai Street to access the Project Site. Dust emissions from these vehicles will generally be limited within the worksites and have already been taken into account in the derivation for heavy construction activities. Watering facilities will be provided at all vehicular egress. All construction vehicles will be thoroughly washed and those loaded with dusty materials will be covered by clean impervious sheets prior to leaving the construction site. Hence, the dust nuisance from construction vehicles outside the construction site is unlikely to be significant.
3.6.1.4 The requirements as stipulated in the Air Pollution Control (Non-road Mobile Machinery) (Emission) Regulation will be followed to control potential emissions from non-road mobile machinery. Therefore, gaseous emission (NOx, SO2 and CO) from diesel-fueled construction equipment would be minor and would not cause any adverse air quality impact.
3.6.1.5 Based on current available information, the construction of Shuen Wan Golf Course (at the existing Shuen Wan Restored Landfill) will be finished by 2023. The proposed Organic Waste Pre-treatment Centre (New Territories East) (OWPC) involves the re-development of the existing Shuen Wan Landfill Leachate Pre-treatment Works and the existing pilot-scale Food Waste Pre-treatment Facilities is located to the immediate north of the existing TPSTW. Since the construction of OWPC will be commenced by 2025 and completed by 2029, it will be included in the cumulative quantitative construction dust impact assessment of the construction works of the New West Plant and upgrading works of the West Plant.
3.6.1.6 The Proposed Upgrading of Tolo Harbour Effluent Export Scheme (THEES) expansion is partly located within the TPSTW. It has been included in the cumulative quantitative construction dust impact assessment. The key component of the THEES upgrading works (i.e. Upgrading of Tai Po Effluent Pumping Station) has been incorporated into the Project layout and located within the Project site (refers to Area 11 in Figure 3.2). Besides, there will be no other concurrent construction Projects within 500m assessment area during the construction of the Project. Therefore, no cumulative impact from other project is anticipated.
3.6.1.7 Apart from the construction dust emissions, cumulative air quality impact at the representative ASRs would also be expected due to the background pollutant concentrations, operation of the existing combined heat and power (CHP) generating system, vehicular emissions from existing open roads, vehicular emissions associated with the existing bus termini, heavy goods vehicle and coach parking sites and industrial emissions from Tai Po Industrial Estate (TPIE). The CHP generating system and industrial emissions from Tai Po Industrial Estate (TPIE) are shown in Appendix 3.2.
3.6.1.8 All the sewage treatment facilities including sedimentation tanks, aeration tanks and sludge tanks will be cleaned before demolition, odour emission is therefore not expected from the demolition works during construction phase.
3.6.1.9 Some of the buildings at the existing TPSTW have been built over 40 years. Asbestos containing materials (ACM) may be found in these old buildings. As the existing TPSTW is still in operation, asbestos survey on these buildings is not available at the time of this assessment. It is proposed that the asbestos investigations shall be conducted by registered asbestos consultants before the decommissioning of existing TPSTW. If any ACM is identified, the asbestos consultant shall formulate overall asbestos management and abatement strategies. The removal and disposal of the ACM shall be conducted by registered asbestos contractor following the Air Pollution Control (Asbestos) (Administration) Regulation.
3.6.2 Operational Phase
3.6.2.1 During the operation of the proposed sewage treatment works, odourous gases, biogas and ammonia will be generated. Odourous gases will be emitted from the sewage itself and produced during the breakdown of sewage during the treatment process. The major process equipment of the upgraded TPSTW and Co-digestion Facilities will be confined inside the substructure/superstructure, except for the final sedimentation tanks at the existing East Plant. The final sedimentation tanks at the existing East Plant would remain as open tanks and would not be enclosed during the Project operation as these tanks were not considered as major odour sources from the available survey data. Two stages de-odourization system (bio tricking filter and carbon adsorption) will be installed to treat the collected odourous gases. The overall odour removal efficiency would be not less than 99%. Odour releasing from the de-odourization system and exposed area of sewage would be the major odorous gases generated due to the operation of the upgraded TPSTW and Co-digestion Facilities. The proposed OWPC will be operated by 2029 and would contribute cumulative impact. The locations of the odour emission source is presented in Appendix 3.8.
3.6.2.2 Biogas would be produced during the anaerobic digestion of sludge. Nutrient like ammonium nitrogen would also be produced during the digestion and returned to the liquid stream in the filtrate/centrate from dewatering process of the digested sludge. This filtrate/centrate, which is known as sidestream, will be pre-treated before flow back to the biological treatment of the plant. Sidestream will be treated by using Anammox technology in order to remove the ammonium nitrogen content. Anammox is a biological process which convert ammonium nitrogen to nitrogen gas by oxidize partially to nitrite by Ammonium Oxidizing Bacteria and then further removed by Anammox bacteria. Ammonia gas (NH3) may also be formed during the Anammox process and will be collected via the odour duct to the deodorization system for treatment before discharge to the atmosphere. Therefore emission of NH3 would not be a concern. While for the biogas generated at the digester, it will be treated at the gas treatment facility before utilize as an energy source by the CHP generation system that produce electricity and heat. The major pollutants of emissions from operation of CHP generating system will be NO2, RSP, FSP and SO2. Treatment process within the gas treatment facility will include H2S removal by iron sponge, therefore, emission of SO2 is considered very minimal. Nevertheless, SO2, NO2, RSP and FSP and were included in the quantitative assessment.
3.6.2.3 It is expected pre-treatment of the organic waste, to avoid food packaging films and plastics in the organic wastes, shall be performed before transferring to TPSTW for digestion. It is expected that the food waste and sludge are unlikely to contain chlorinated food wastes and the emission of HF and HCl from the process is expected to be negligible. Regarding volatile organic compounds (VOCs), methane (CH4) and carbon monoxide(CO), which may be produced during incomplete combustion of biogas, the design of CHP will ensure proper mixing of the air and fuel, provide sufficient residence time and combustion temperature to prevent incomplete combustion. As a conservative approach, HCl, HF, VOCs (in terms of Formaldehyde CH2O), CH4 and CO emissions from the CHP generating system were also included in the quantitative assessment.
3.6.2.4 Flare system is also proposed for emergency use, only operate when all CHP systems were offline. The proposed design includes four 2MW CHP systems (3 duty and 1 standby) and three 600kW CHP systems (2 duty and 1 standby) to minimize the chances of emergency condition. Since it is used only during emergency situation and the chances is minimal, quantitative assessment is not included for the flare system.
3.6.2.5 Similar to the construction phase, the industrial emissions from TPIE and vehicular emission from the road traffic within the assessment area described in Section 3.6.1.7 are considered in the cumulative air quality impact assessment.
3.6.2.6 Besides, dewatered sludge will be transferred to TPSTW by covered storage container to avoid odour leakage during transportation to minimise the potential odour nuisance. While food waste from OWPC will be transferred by enclosed pipes, no odour nuisance is expected during transportation of food waste from OWPC to TPSTW.
3.7 Assessment Methodology – Construction Phase
3.7.1 Construction Dust from the Project
3.7.1.1 Construction activities with significant particulate emission were identified from the engineering design of construction method. Construction dust impact was predicted based on emission factors from US Environmental Protection Agency (USEPA) Compilation of Air Pollution Emission Factors (AP-42), 5th edition and activity information from engineering design. The major dusty construction activities for the Project to be concerned and considered in the modelling assessment include site clearance, demolition of the existing TPSTW facilities, piling and construction for TPSTW facilities as heavy construction activities during working hours. Wind erosion of open heavy construction work site was considered during non-working hours
3.7.1.2 The Project will be developed in phases. The heavy construction work fronts for different part (i.e. New West Plant and upgrade of existing West Plant) are illustrated in Appendix 3.1. Each part will be constructed separately. Since the site is flat, extensive site formation works is not expected. 100% active works area was assumed in the screening test. A focused assessment is undertaken whereby the percentage of daily maximum active works areas, which is assumed to be 50% of each work front, for the Project of each part are positioned closest to the potentially worst affected ASRs. The scenarios are presented in Table 3.7.
Table 3.7 Construction Dust Assessment Scenarios
Scenario |
Active Works Area % and Locations |
||
Construction of New West Plant |
Upgrade of Existing West Plant |
OWPC |
|
A |
100% |
0% |
100% |
B |
0% |
100% |
100% |
C1 |
50% (South) |
0% |
50% (West) |
C2 |
50% (North) |
0% |
50% (West) |
C3 |
50% (South) |
0% |
50% (East) |
C4 |
50% (North) |
0% |
50% (East) |
D1 |
0% |
50% (South) |
50% (West) |
D2 |
0% |
50% (North) |
50% (West) |
D3 |
0% |
50% (South) |
50% (East) |
D4 |
0% |
50% (North) |
50% (East) |
Notes:
[1] The locations of works area for each scenario can be referred to Appendix 3.1.
3.7.1.3 The emission factors for identified dust sources are summarized in Table 3.8 below. The detailed calculation of dust emission rates is presented in Appendix 3.1.
Table 3.8 Emission Factor for Dusty Construction Activities
|
Activity |
Emission Factor |
Remarks |
|
Heavy
Construction Activities |
E (TSP) = 2.69 Mg/hectare/month of activity E (RSP) = E (TSP) x 0.473 = 1.27 Mg/hectare/month of activity E (FSP) = E (TSP) x 0.072 = 0.19 Mg/hectare/month of activity |
USEPA AP-42, Section 13.2.3 USEPA AP-42, Section13.2.4
USEPA AP-42, Section13.2.4 |
|
Wind Erosion
|
E (TSP) = 0.85 Mg/hectare/year E (RSP) = E (TSP) x 0.473 = 0.40 Mg/hectare/year E (FSP) = E (TSP) x 0.072 = 0.06 Mg/hectare/year |
USEPA AP-42, Table 11.9.4 USEPA AP-42, Section13.2.4 USEPA AP-42, Section13.2.4 |
3.7.1.4 The construction period is assumed to be 10-hour (08:00-18:00) per day, 7 days a week in the assessment. Only wind erosion was assumed for other non-working hours (18:00 to 08:00 of the following day). Watering facilities will be provided at every designated vehicular exit point. Since all vehicles will be washed at exit points and vehicle loaded with the dusty materials will be covered entirely by clean impervious sheeting before leaving the construction site, dust nuisance from construction vehicle movement outside the worksites is unlikely to be significant.
3.7.2 Industrial Emission in the Surrounding Vicinity
3.7.2.1 The industrial emissions from TPIE within the assessment area were also considered as potential air pollutant emission sources. The chimneys and emission points from Specified Process (SP) and non-SP within TPIE were identified. For SP operation, the parameters and emission data of the emission points were extracted from the SP Licenses. For the non-SPs industries, the minimum emission rates for each air pollutant among the SP operation were adopted. CHP chimney within existing TPSTW was also included in the assessment. The location and emission inventory of the identified chimneys considered in the cumulative impact assessment are presented in Appendix 3.2.
3.7.3 Vehicular Emission from Open Roads
3.7.3.1 The roads included for the vehicular assessment is presented in Appendix 3.4. The construction period will be from year 2025 to year 2036. For a conservative estimation of vehicular emission, the vehicle emission factor is chosen by using the first year of the construction programme (i.e. year 2025), and predicted traffic flow of the last year of the construction year (i.e. year 2036). This combination represents the worst case scenario for the vehicular emission. The traffic forecast is presented in Appendix 3.4.
3.7.3.2 EMFAC-HK 4.3 model is adopted to estimate the emission rates of 18 types of vehicles and the inventories of exhaust oxides of nitrogen and particulate matter for worst-case scenario (year 2025). “EMFAC” mode is used for predicting the vehicular emission of 18 vehicle classes with different speed profiles. Vehicular emission factors of each road section of each hour of a day were derived using EPD’s EMFAC-HK v4.3 software. As a conservative approach, the following assumption has been adopted in the EMFAC model:
n Temperature : 6 deg.C (extracted from HKO Tai Po weather station in year 2020)
n Relative humidity : 24% (extracted from HKO Tai Po weather station in year 2020)
n Cold start emissions were assumed to roads with a speed limit of 50 km/hr
3.7.3.3 Emission from the vehicular emission in the vicinity of the Project, in particular Dai Kwai Street, Dai Hei Street and Dai Li Street within TPIE, were considered in the cumulative impact assessment.
3.7.3.4
As recommended in the EPD’s Guideline on Modelling Vehicle Emissions for
cold start emissions, default vehicle populations forecast in EMFAC-HK is used.
The default accrual rates in EMFAC-HK are estimated from the local mileage data
adjusted to reflect the total vehicle-kilometer-travelled (VKT) for each
vehicle class. The default value has been used. Cold start emissions are
assumed to be relevant to the roads with a speed limit of 50 km/hr for conservative approach. The percentage of minor roads
within the HKSAR are estimated using the data published by the Transport
Department, which is used to estimate the trips per VKT for the roads with cold
start emissions. The maximum starting emission (g/trip) among different
durations (from 5 min to 720 min) is used to reflect the worst
case scenario. The details of the calculations of emission factors are
presented in Appendix 3.6.
The hourly composite start emission factor (TSP, RSP,
FSP, initial NO and initial NO2) was determined by:
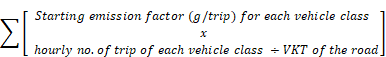
3.7.3.5
For running emissions, the hourly running exhaust emission factor (TSP,
RSP, FSP, initial NO and initial NO2) for each vehicle class was
determined by the running exhaust emission factor for the average road speed of
the concerned road link. The completed calculation result is displayed in Appendix 3.6. The hourly composite
running exhaust emission factor (TSP, RSP, FSP, initial NO and initial NO2)
was determined by:
![]()

3.7.3.6 The traffic data including the projected 24-hour traffic flows and vehicle compositions which were provided by the traffic consultant were adopted in this air quality assessment. The details of traffic data are presented in Appendix 3.4.
3.7.3.7 The raw Hong Kong Observatory data are presented in Appendix 3.5. The EMFAC output emission factors are provided in Appendix 3.6.
3.7.4 Vehicular emissions associated with the Existing Bus Termini, Heavy Goods Vehicle and Coach Parking Sites
3.7.4.1 The start emissions, running exhaust emissions and idling emissions associated with the vehicles at the existing bus termini, heavy goods vehicle and coach parking sites within the assessment area (TSP, RSP, FSP, initial NO and initial NO2) were calculated and included in the assessment. The calculation was based on the start emission and running exhaust emission factors predicted by EMFAC-HK model, cold idling emission factors from Calculation of Start Emissions in Air Quality Impact Assessment published by EPD, warm idling emission factors from Road Tunnels: Vehicle Emissions and Air Demand for Ventilation published by World Road Association and traffic data provided by the traffic consultant.
3.7.4.2 Calculations of emissions associated with the bus terminuses were made reference to the Calculation of Start Emissions in Air Quality Impact Assessment published by EPD. Start emissions for diesel vehicles fitted with selective catalytic reduction (SCR) devices and LPG vehicles were adjusted based on the idling emission and would be released over a total spread distance of 700 m and 150 m respectively from where the start takes place, while running exhaust and idling emissions would be released on the spot. The locations of emission sources and the detailed calculation of the emissions are presented in Appendix 3.6.
3.7.5 Background Contributions
3.7.5.1 As suggested by “Guidelines on Assessing the ‘TOTAL’ Air Quality Impacts”, an integrated modelling system, Pollutants in the Atmosphere and their Transport over Hong Kong model (PATH v2.1) which is developed and maintained by EPD was applied to estimate the background pollutant concentrations.
3.7.5.2 The study aera covers 4 grid cells of PATH v2.1, namely grid (41,48), (41,49), (42,48) and (42,49). The construction phase will be commenced in Year 2025, therefore PATH v2.1 data for Year 2025 of these 4 grid cells were adopted as the background concentration for the assessment. The hourly TSP concentration was assumed to be the same as that for RSP, as the best estimation.
3.7.6 Dispersion Modelling & Modelling Approach
3.7.6.1 According to the Model Guidelines, the steady-state Gaussian dispersion model United States Environmental Protection Agency (USEPA) AERMOD model was adopted for assessing the potential air quality impact arising from the construction activities and industrial emissions. The assessment area mostly falls under PATH v2.1 grid (41,48),(41,49),(42,48) and (42,49). Hourly meteorological data from the concerned grids are adopted in the model run. Mixing heights from the PATH v2.1 which are lower than the minimum mixing height recorded by the Hong Kong Observatory (HKO) in Year 2015 (i.e. 131m) are capped at 131m. For the treatment of calm hours, the wind speeds are capped at 1m/s for those from PATH v2.1 below 1m/s.
3.7.6.2 Dominant or representative land use in the vicinity of the assessment area was identified with the land utilization information (version 2020) disclosed by the Planning Department. Details of assumptions and methods to determine the surface characteristics of the grids is recorded in Appendix 3.3. The modelling parameters are summerised in Table 3.9 below.
Table 3.9 Modelling Parameters
|
Parameter |
Input |
|
Background Concentration |
PATH v2.1 Year 2025 |
|
Modelling Mode |
Urban |
|
Terrain Effect |
With terrain effect |
|
Population |
2,000 (Estimated from PlanD population projection data) |
|
Land use |
Refer to Appendix 3.3 for surface
characteristic parameters |
|
Meteorological Data |
Year 2015 hourly meteorological data adopted in PATH v2.1 |
|
Anemometer Height |
6m |
3.7.6.3 For vehicular emission from open roads, California Line Source Dispersion Model, version 4 (CALINE4), the USEPA approved line source air dispersion model developed by the California Department of Transport is used to assess the secondary contribution due to vehicular emission. The 500m quantitative assessment area is considered to be rural area. Therefore, surface roughness of 100cm is chosen with reference to EPD’s Guidelines on Choice of Models and Model Parameter (hereafter refer as “the Model Guidelines”). Flat terrain approach was adopted in CALINE4 to assume all road links to be at-grade. Width of the roads are added by 3m on both sides to represent the mixing zone. RSP and FSP concentrations were modelled by CALINE4, while hourly TSP concentration was assumed to be the same as that for RSP in the assessment.
3.7.6.4 Guided by a Working Group consisting of experts in air quality modelling, PATH v2.1 has gone through extensive testing. It was determined that PATH v2.1’s output of RSP and FSP concentrations should be adjusted as follows before being applied for EIA to account for the limited information on pollutant emissions on a larger scale:
n 10th highest daily RSP concentration: add 11.0 μg/m3.
n Annual RSP concentration: add 10.3 μg/m3
n 19th highest daily FSP concentration: Nil.
n Annual FSP concentration: add 3.5 μg/m3
3.7.6.5 For the estimation of SO2 Concentration, EPD’s “Guidelines on the Estimation of 10-minute Average SO2 Concentration for Air Quality Assessment in Hong Kong” as followed. The stability-dependent multiplicative factors for converting 1-hour average concentrations to to 10-minute average concentrations are extracted in Table 3.10 below.
Table 3.10 1-hour to 10-minute Conversion Factors
|
Pasquill Stability Class[1] |
A |
B |
C |
D |
E |
F |
|
Conversion Factors |
2.45 |
2.45 |
1.82 |
1.43 |
1.35 |
1.35 |
[1] PCRAMMET was applied to generate Pasquill-Gifford stability class hour by hour based on the meteorological data from the PATH v2.1.
3.7.6.6 For the estimation of methane and formaldehyde, 1-hour to 15-minute and 1-hour to 30-minute conversion factors were calculated. The model output (1-hour average) is first converted to 15-minute average value and 30-minute average value using the power law formula proposed by Duffee et al given below:
Cl = Cs(ts/tl)p
where Cl = concentration for the longer time-averaging period;
Cs = concentration for the shorter time-averaging period;
ts = shorter averaging time;
tl = longer averaging time; and
p = power law exponent which is dependent on the Pasquill stability class.
Reference to Duffee et al., 1991 (Richard A. Duffee, Martha A. O'Brien and Ned Ostojic, 'Odor Modelling - Why and How', Recent Developments and Current Practices in Odor Regulations, Controls and Technology, Air & Waste Management Association, 1991)
3.7.6.7 Such that the 1-hour average concentrations predicted by the AERMOD model were converted to 15-minute and 30-minute average concentrations. The conversion factors for different Pasquill stability classes are listed in Table 3.11 below.
Table 3.11 1-hour to 15-minute and 1-hour to 30-minute Conversion Factors
|
Pasquill Stability Class[1] |
A |
B |
C |
D |
E |
F |
|
1-hour to 15 minute Conversion Factors |
2 |
2 |
1.59 |
1.32 |
1.26 |
1.26 |
|
1-hour to 30 minute Conversion Factors |
1.41 |
1.41 |
1.26 |
1.16 |
1.15 |
1.12 |
Note:
[1] PCRAMMET was applied to generate Pasquill-Gifford stability class hour by hour based on the meteorological data from the PATH v2.1.
3.7.7 Cumulative Air Quality Impact
3.7.7.1 Cumulative air quality impacts upon ASRs were derived from the sum of predictions by local air quality models and background concentration from PATH v2.1 for Year 2025 on hour-by-hour basis. Averaging results, namely hourly, daily and annual, were derived from the cumulative hour-by-hour results in accordance with Title 40, Code of Federal Regulations, US Environmental Protection Agency (USEPA 40 CFR) Part 51 “Revision to the Guideline on Air Quality Models, Version 2005”. Hours with invalid Caline4’s output were excluded from the calculation of cumulative impact. Cumulative average predictions at each ASR amongst 365 days were ranked by highest concentration and compared with the maximum allowable concentration to determine the number of exceedances throughout a year. The air quality impact upon ASRs was evaluated by number of exceedances per annum against the AQO criteria.
3.8 Assessment Methodology – Operational Phase
3.8.1 Odour Emission Inventory of TPSTW
3.8.1.1 The general layout plan of the upgraded TPSTW is presented in Figure 3.2. Potential odour sources identified in the upgraded TPSTW include the following:
n Inlet works
n Primary treatment facilities
n Biological treatment facilities
n Sludge thickening facilities
n Digester battery
n Sludge dewatering facilities
n Side-stream treatment facilities
n Biogas recovery facilities
n Import sludge reception facilities
3.8.1.2 On-site odour measurement has been conducted at the facilities of the existing TPSTW in Sep-Nov 2020 and Jul-Aug 2021 to determine the odour emission rates by odour sampling and olfactometric analysis. The ambient temperature during sampling was ranged from 25– 36°C. The odour sampling and analysis report including the sampling location plan and sampling procedures is presented in Appendix 3.7. The measured odour emission rates of the sampling locations are summarized in Appendix 3.8. Besides, odour emission rates were referenced from Odour survey conducted within TPSTW in 2016, Yuen Long Effluent Polishing Plant (AEIAR-220/2019 - Yuen Long Effluent Polishing Plant), Shatin Sewage Treatment Works(AEIAR-202/2016 - Sha Tin Cavern Sewage Treatment Works) and Stonecutters Island Sewage Treatment Works (AEIAR-121/2008 - Harbour Area Treatment Scheme (HATS) Stage 2A). The emission rates for the same corresponding odour source for the proposed TPSTW were compared, the highest emission rates were adopted as the worst case scenario in this assessment. As mentioned in Section 3.5.1.11, the TPSTW is not operating at design operating condition. Therefore, emission rate for primary sedimentation tanks, aeration tanks and final sedimentation tanks collected from odour survey of this Project were considered not representative to be used to conduct assessment and survey result from other reference were adopted. The emission rate comparison table is presented in Appendix 3.8.
3.8.1.3 Unmitigated scenario and mitigated scenario are assessed for the odour impact. For the unmitigated scenario, on-site survey data on Year 2020 and 2021 were adopted where appropriate. The emission rates for unmitigated and mitigated scenario are presented in Appendix 3.8.
3.8.2 Odour Emission in the Surrounding Vicinity
3.8.2.1 The odour emissions from the adjacent Organic Waste Pre-treatment Centre (New Territories East) (OWPC) is considered as a potential odour emission source. Based on available information, the treatment capacity of OWPC will be upgraded from the existing 50 tonnes per day to 500 tonnes per day by 2030s. As a worst case scenario, the emission rate of the upgraded OWPC is assumed to be 10 times of the existing plant. The emission details of the upgraded OWPC is presented in Appendix 3.8.
3.8.3 Dispersion Modelling & Modelling Approach
3.8.3.1 AERMOD, the EPD approved air dispersion model, was employed to predict the odour impact from the operation of the Project at the representative ASRs. Odour emission from stacks and exhaust of de-odourization units were modelled as point sources in the assessment while open sewage tanks and channels were modelled as area source in the assessment. The upgraded TPSTW and Co-digestion Facilities, and OWPC were assumed to operate continuously on a 24-hour-per-day and 7-day-per-week basis.
3.8.3.2 The assessment has been based on the assumed reasonably worst case scenario under normal operating condition of the Project in year 2036. The modelled hourly averaged odour concentrations at the ASRs by the AERMOD were converted into 5-second averaged odour concentrations for comparison with the odour assessment’s criterion stipulated in the EIAO-TM. A set of conversion factors stipulated in “Approved Methods for Modelling and Assessment of Air Pollutants in New South Wales” published by the Department of Environment and Conservation, New South Wales, Australia were adopted in this assessment. As the emission points will be located at ground level, at the top of the deodourization units or build roof of the odour control buildings which would be less than 2.5 times of building structures. Therefore, building wake effect is expected. The conversion factors stated in this method are for converting 1-hour averaged concentrations to 1-second averaged concentration for near field regions. In this assessment, the conversion factors were directly adopted for converting 1-hour averaged concentrations to 5-second averaged concentration as a conservative approach. The conversion factors adopted in this assessment for different stability classes are shown in Table 3.12.
Table 3.12 1-hour to 5-second Conversion Factors
|
Pasquill Stability Class[1] |
Conversion Factor [2] |
|
|
Point Source |
Area Source |
|
|
A |
2.3 |
2.5 |
|
B |
2.3 |
2.5 |
|
C |
2.3 |
2.5 |
|
D |
2.3 |
2.5 |
|
E |
2.3 |
2.5 |
|
F |
2.3 |
2.5 |
Note:
[1] PCRAMMET was applied to generate Pasquill-Gifford stability class hour by hour based on the meteorological data from the PATH v2.1.
[2] Reference to Approved Methods for Modelling and Assessment of Air Pollutants in New South Wales published by the Department of Environment and Conservation, New South Wales, Australia. The derivation of the peak-to-mean ratios stated in the method was based on experimental and theoretical analyses and had assumed a 0.1% exceedance level (With reference to “Statistical Elements of Predicting Water Science and Technology, Australia, 44:0 pp 157-164, 2001”)
3.8.4 Air Pollutants Emission Inventory of TPSTW
3.8.4.1 The general layout plan of the proposed TPSTW is presented in Figure 3.2. Potential air pollutant sources identified in the proposed TPSTW include the following:
n Emission from CHP generating system
n Flare system
3.8.4.2 As discussed in Section 3.6.2.2, the major pollutants of emissions from operation of CHP generating system will be NO2, RSP, FSP, SO2, HCl, HF, VOCs (in terms of Formaldehyde CH2O), CH4 and CO. Flare system is proposed to consume the excess biogas collected from the digestion tanks by combustion. Since the use of flare system would not be operated in normal situation, it is not included in the assessment. The emission rates of the air pollutants at the exhausts of the CHP generating system are provided by Design Engineer. The detailed emission inventory is presented in Appendix 3.2.
3.8.5 Industrial Emission in the surrounding vicinity
3.8.5.1 As discussed in Section 3.7.2, the industrial emissions from TPIE within the assessment area were also considered as potential air pollutant emission sources. The location and emission inventory of the identified chimneys considered in the cumulative impact assessment are presented in Appendix 3.2.
3.8.5.2 The maximum concentration of the NO2 were calculated using the Ozone Limiting Method. For industrial chimneys, in accordance with USEPA AP-42, a 10% NO2/NOx ratio was assumed at the chimney emission points (Chapter 1.3 of USEPA AP-42 refers). The background concentration of ozone was taken from PATH v2.1 (Year 2025) data.
3.8.6 Vehicular Emission from Open Roads
3.8.6.1 As discussed in Section 3.7.3, emission from the vehicular emission in the vicinity of the Project, in particular Dai Kwai Street, Dai Hei Street and Dai Li Street within TPIE, were considered in the cumulative impact assessment. A sensitivity test for vehicular emission from the open roads in year 2036, 2043 and 2051 have been conducted and the result is presented in Appendix 3.6. Year 2051 was found to have the highest traffic emission. Therefore, combination of vehicle emission factor and predicted traffic flow in Year 2051 were chosen as the worst case scenario for the vehicular emission. Similar to construction phase, both running emission and cold start emission were included in the assessment. The details of the calculations of emission rate are presented in Appendix 3.6. NO, NO2, RSP and FSP concentrations were modelled by CALINE4 in the assessment.
3.8.6.2 The maximum concentration of the NO2 were calculated using the Ozone Limiting Method. For tailpipe emission, the predicted NO concentrations were converted to NO2 based on OLM and were added with the predicted NO2 concentrations to determine the total predicted NO2 concentrations at the ASRs. The background concentration of ozone was taken from PATH v2.1 (Year 2025) data.
3.8.6.3 The total predicted NO2 concentrations were calculated as follows:
[NO2]pred total = [NO2]pred t +0.1 x [NOx]pred i + MIN {[NO] pred t+0.9 x [NOx] pred i, or (46/48)x[O3] bkgd}
where
[NO2] pred total = the total predicted NO2 concentration
[NO2] pred t= the predicted NO2 concentration directly emitted from tailpipe emissions
[NOx] pred i= the predicted NOx concentration directly emitted from industrial chimneys
[NO] pred t= the predicted NO concentration directly emitted from tailpipe emissions
MIN means the minimum of the two values within the brackets
[O3]bkgd = the representative O3 background concentration; (46/48) is the molecular weight of NO2 divided by the molecular weight of O3
3.8.7 Background Contributions
3.8.7.1 Similar to Section 3.7.5, pollutants in PATH v2.1 for Year 2025 was adopted as the background concentration for the assessment. The PATH v2.1 data for Year 2025 of the relevant grid cells as mentioned in Section 3.7.5 were adopted as the background concentration for the assessment. The hourly TSP concentration was assumed to be the same as that for RSP, as the best estimation.
3.8.8 Dispersion Modelling & Modelling Approach & Cumulative Air Quality Impact
3.8.8.1 Same pollutant dispersion, modelling approach and cumulative air quality impact described in Section 3.7.6 and 3.7.7 were followed for the operational phase air pollutant impact assessment.
3.9 Impact Assessment
3.9.1 Construction Phase
3.9.1.1 The predicted dust impact to the ASRs during the construction of New West Plant are presented in Table 3.13. The detailed result is presented in Appendix 3.9. The contour plots of the worst impact level (i.e. 1.5mAG for maximum hourly average TSP, 10th highest daily average RSP and annual average RSP, 20mAG for 19th highest daily average FSP, 23mAG for annual average FSP) are presented in Figure 3.3 to 3.7.
Table 3.13 Predicted Cumulative Dust Impact (Scenario A)
Air Sensitive Receiver |
Maximum Hourly Average TSP Conc. (µg/m3) |
10th Highest Daily Average RSP Conc. (µg/m3) |
Annual Average RSP Conc. (µg/m3) |
19th Highest Daily Average FSP Conc. (µg/m3) |
Annual Average FSP Conc. (µg/m3) |
ASR 1 |
489 |
79 (0) |
37.6 |
34.8 (8) |
16.2 |
ASR 2 |
325 |
71.2 (0) |
31.3 |
33.6 (8) |
15.3 |
ASR 3 |
275 |
67.9 (0) |
29.7 |
33.2 (8) |
15.2 |
ASR 4 |
214 |
66.1 (0) |
29.0 |
34.9 (9) |
15.9 |
ASR 5 |
165 |
65.5 (0) |
28.6 |
34.9 (10) |
16.2 |
ASR 6 |
275 |
65.7 (0) |
29.2 |
36.6 (10) |
16.6 |
ASR 7 |
406 |
73.8 (0) |
32.1 |
36.4 (10) |
16.4 |
ASR 8 |
411 |
73.6 (0) |
33.5 |
36 (10) |
16.7 |
ASR 9 |
664 |
78 (1) |
38.9 |
33.9 (8) |
16.5 |
ASR 10 |
622 |
76.1 (0) |
36.9 |
33.5 (8) |
16.2 |
ASR 11 |
581 |
68.4 (0) |
32.1 |
32.7 (8) |
15.4 |
ASR 12 |
381 |
62.1 (0) |
27.5 |
32.2 (7) |
14.7 |
ASR 13 |
174 |
62.9 (0) |
27.6 |
32.3 (8) |
15.1 |
ASR 14 |
159 |
62 (0) |
26.6 |
32.1 (7) |
14.5 |
ASR 15 |
165 |
63.3 (0) |
27.4 |
33.8 (8) |
15.3 |
ASR 16 |
161 |
61.5 (0) |
26.0 |
32 (7) |
14.1 |
ASR 17 |
165 |
61.5 (0) |
26.1 |
32 (7) |
14.2 |
ASR 18 |
160 |
61.5 (0) |
26.3 |
32 (7) |
14.3 |
ASR 19 |
298 |
62 (0) |
27.4 |
32.1 (7) |
14.6 |
Remarks:
[1] Bolded value shows exceedance of relevant criteria of EIAO-TM / AQO.
[2] Values in ( ) indicate the number of exceedances.
3.9.1.2 For the construction of the New West Plant, the predicted cumulative daily average and annual RSP as well as daily average and annual FSP at the representative ASRs complied with the AQO while the predicted hourly average TSP at ASR 9, 10 and 11 exceeded the requirement of EIAO-TM. Focused construction dust assessments, assuming 50% of active works area to be located at the south portion and north portion respectively, were undertaken the construction of New West Plant (see Scenarios C1-C4 of Appendix 3.1). The result is presented in Section 3.9.1.5.
3.9.1.3 The predicted dust impact to the ASRs during the upgrade of existing West Plant are presented in Table 3.14. The detailed result is presented in Appendix 3.9. The contour plots of the worst impact level (i.e. 1.5 mAG) are presented in Figure 3.8 to 3.12.
Table 3.14 Predicted Cumulative Dust Impact (Scenario B)
Air Sensitive Receiver |
Maximum Hourly Average TSP Conc. (µg/m3) |
10th Highest Daily Average RSP Conc. (µg/m3) |
Annual Average RSP Conc. (µg/m3) |
19th Highest Daily Average FSP Conc. (µg/m3) |
Annual Average FSP Conc. (µg/m3) |
ASR 1 |
706 |
82.3 (1) |
41.5 |
35.3 (9) |
16.8 |
ASR 2 |
730 |
73.9 (0) |
36.0 |
34.6 (8) |
16.0 |
ASR 3 |
827 |
72.4 (0) |
34.6 |
34.6 (8) |
15.8 |
ASR 4 |
641 |
87.6 (3) |
42.5 |
38.4 (11) |
18.0 |
ASR 5 |
380 |
75.9 (0) |
33.9 |
36.4 (10) |
16.7 |
ASR 6 |
403 |
65.6 (0) |
29.0 |
36.6 (10) |
16.6 |
ASR 7 |
727 |
81.1 (2) |
39.8 |
37 (10) |
17.6 |
ASR 8 |
568 |
67.7 (0) |
30.5 |
35.4 (10) |
16.6 |
ASR 9 |
561 |
64.4 (0) |
28.9 |
32.6 (8) |
15.0 |
ASR 10 |
609 |
64.1 (0) |
28.4 |
32.5 (8) |
14.9 |
ASR 11 |
513 |
63.4 (0) |
27.9 |
32.3 (8) |
14.8 |
ASR 12 |
284 |
62.5 (0) |
27.5 |
32.2 (7) |
14.7 |
ASR 13 |
654 |
63.8 (0) |
29.6 |
32.3 (8) |
15.2 |
ASR 14 |
416 |
62 (0) |
27.6 |
32.1 (7) |
14.6 |
ASR 15 |
200 |
63.5 (0) |
27.6 |
33.8 (8) |
15.4 |
ASR 16 |
163 |
61.5 (0) |
26.1 |
32 (7) |
14.2 |
ASR 17 |
172 |
61.5 (0) |
26.2 |
32 (7) |
14.2 |
ASR 18 |
311 |
61.5 (0) |
26.7 |
32 (7) |
14.3 |
ASR 19 |
307 |
62 (0) |
28.0 |
32.1 (7) |
14.7 |
Remarks:
[1] Bolded value shows exceedance of relevant criteria of EIAO-TM / AQO.
[2] Values in ( ) indicate the number of exceedances.
3.9.1.4 For the upgrade of existing West Plant, the predicted cumulative daily average and annual RSP as well as daily average and annual FSP at the representative ASRs complied with the AQO while only the predicted hourly average TSP at ASR 5, 6, 12, 14, 15, 16, 17, 18 and 19 met the requirement of EIAO-TM. Focused construction dust assessments, assuming 50% of active works area to be located at the south portion and north portion respectively, were undertaken the upgrade of existing West Plant (see Scenarios D1-D4 of Appendix 3.1). The result is presented in Section 3.9.1.5.
3.9.1.5 The range of predicted dust impact of the focused assessments to each ASR during the construction of New West Plant and the upgrade of existing West Plant are presented in Table 3.15. The detailed result is presented in Appendix 3.9. The contour plots of the worst impact level for construction of New West Plant (Scenarios C1, C2, C3 and C4) (i.e. 1.5mAG for maximum hourly average TSP, 10th highest daily average RSP and annual average RSP, 20mAG for 19th highest daily average FSP, 23mAG for annual average FSP) are presented in Figure 3.13 to 3.32. The contour plots of the worst impact level for upgrading of Existing West Plant (Scenarios D1, D2, D3 and D4) (i.e. 1.5mAG for maximum hourly average TSP, 10th highest daily average RSP and annual average RSP, 1.5mAG and 20mAG for 19th highest daily average FSP, 1.5mAG for annual average FSP) are presented in Figure 3.33 to 3.52.
Table 3.15 The Predicted Cumulative Dust Impacts of the Focused Assessments
Air Sensitive Receiver |
Maximum Hourly Average TSP Conc. (µg/m3) |
10th Highest Daily Average RSP Conc. (µg/m3) |
Annual Average RSP Conc. (µg/m3) |
19th Highest Daily Average FSP Conc. (µg/m3) |
Annual Average FSP Conc. (µg/m3) |
ASR 1 |
159 - 406 |
62.6 - 74.6 (0) |
27 - 36 |
32.3 - 34.1 (8 - 9) |
15 - 16 |
ASR 2 |
159 - 446 |
63.6 - 70.1 (0) |
28 - 32 |
32.4 - 33.7 (8) |
15 |
ASR 3 |
159 - 474 |
62.9 - 68.9 (0) |
27 - 32 |
32.4 - 33.8 (8) |
15 |
ASR 4 |
165 - 378 |
64.1 - 77.3 (0) |
28 - 35 |
34.3 - 36.6 (9 - 11) |
16 - 17 |
ASR 5 |
165 - 228 |
63.6 - 70.1 (0) |
27 - 31 |
33.9 - 35.5 (8 - 10) |
15 - 16 |
ASR 6 |
165 - 237 |
64.5 - 65.7 (0) |
28 - 29 |
34.8 - 36.6 (9 - 10) |
16 - 17 |
ASR 7 |
165 - 397 |
65.9 - 76.7 (0) |
29 - 35 |
34.8 - 36.4 (9 - 10) |
16 - 17 |
ASR 8 |
165 - 323 |
64.5 - 69.2 (0) |
28 - 31 |
34.9 - 35.6 (9 - 10) |
16 - 17 |
ASR 9 |
159 - 427 |
62.3 - 74 (0) |
27 - 35 |
32.3 - 33.2 (8) |
15 - 16 |
ASR 10 |
159 - 385 |
62.2 - 72.3 (0) |
27 - 34 |
32.2 - 32.8 (8) |
15 - 16 |
ASR 11 |
159 - 361 |
62.2 - 67.8 (0) |
27 - 31 |
32.2 - 32.3 (8) |
15 |
ASR 12 |
160 - 222 |
61.9 - 62.3 (0) |
27 - 27 |
32.1 - 32.2 (7) |
14 - 15 |
ASR 13 |
159 - 423 |
62 - 62.9 (0) |
27 - 28 |
32.2 - 32.3 (7 - 8) |
15 |
ASR 14 |
159 - 244 |
61.8 - 62 (0) |
26 - 27 |
32 - 32.1 (7) |
14 - 15 |
ASR 15 |
165 - 165 |
63.2 (0) |
27 |
33.8 - 33.8 (8) |
15 |
ASR 16 |
160 - 161 |
61.5 (0) |
26 |
32 (7) |
14 |
ASR 17 |
164 - 165 |
61.5 (0) |
26 |
32 (7) |
14 |
ASR 18 |
159 - 187 |
61.5 (0) |
26 |
32 (7) |
14 |
ASR 19 |
175 - 195 |
62 (0) |
27 |
32.1 (7) |
14 - 15 |
Remarks:
[1] Bolded value shows exceedance of relevant criteria of EIAO-TM / AQO.
[2] Values in ( ) indicate the number of exceedances.
3.9.1.6 According to Table 3.15, the predicted cumulative hourly TSP, annual averaged RSP and FSP, 10th highest daily average RSP and 19th highest daily average FSP complied with the AQO. Therefore, no adverse air quality impact due to construction dust impact from the construction of TPSTW is anticipated.
3.9.1.7 As stipulated in the Air Pollution Control (Non-road Mobile Machinery) (Emission) Regulation will be followed to control potential emissions from non-road mobile machinery. Therefore, gaseous emission from diesel-fueled construction equipment would be minor and would not cause any adverse air quality impact.
3.9.1.8 The existing sewage pumping station and mains will be cleaned and flushed out properly to clear away any remaining potential sources of odour emission, such as sewage sludge from the facilities. The demolition including removal of the pumping station and mains will take place after the cleaning and flushing out. No unacceptable odour emission is anticipated during the construction phase. Hence, no adverse odour impact is anticipated from the decommissioning of the TPSTW.
3.9.2 Operational Phase (Gaseous Emission)
3.9.2.1 The predicted gaseous emission impact (RSP, FSP, NO2 and SO2) to the ASRs during operation of the upgraded TPSTW and Co-digestion Facilities are presented in Table 3.16. The detailed result is presented in Appendix 3.9. The contour plots of the corresponding worst impact levels for each pollutant (i.e. 20mAG for 10th highest daily averaged RSP and 19th highest daily averaged FSP, 40mAG for annual averaged RSP and annual averaged FSP, 35mAG for 19th highest hourly averaged NO2, 45mAG for annual averaged NO2, 65mAG for 4th highest 10-minute averaged SO2 and 4th highest daily averaged SO2) are presented in Figure 3.53 to 3.60. No air quality sensitive uses were predicted to fall within exceedance zones.
Table 3.16 Predicted Cumulative Gaseous Pollutants (RSP, FSP, NO2 and SO2) Concentrations at Representative Air Sensitive Receivers
Air Sensitive Receiver |
10th Highest Daily Average RSP Conc. (µg/m3) |
Annual Average RSP Conc. (µg/m3) |
19th Highest Daily Average FSP Conc. (µg/m3) |
Annual Average FSP Conc. (µg/m3) |
19th Highest Hourly Average NO2 Conc. (µg/m3) |
Annual AverageNO2 Conc. (µg/m3) |
4th
|
4th Highest Daily Average SO2 Conc. (µg/m3) |
ASR 1 |
61.8 (0) |
26.7 |
32.3 (8) |
14.7 |
84 (0) |
15.6 |
81.7 (0) |
11.8 (0) |
ASR 2 |
62 (0) |
26.5 |
32.2 (7) |
14.6 |
85 (0) |
16.0 |
77.8 (0) |
11.8 (0) |
ASR 3 |
62.3 (0) |
27.1 |
32.4 (8) |
15.1 |
88 (0) |
17.3 |
113.3 (0) |
11.8 (0) |
ASR 4 |
64.2 (0) |
28.6 |
34.6 (10) |
16.7 |
183 (3) |
34.0 |
79.7 (0) |
13.3 (0) |
ASR 5 |
65.5 (0) |
28.7 |
35.4 (10) |
16.7 |
163 (3) |
34.5 |
451.4 (0) |
28.7 (0) |
ASR 6 |
65.6 (0) |
28.6 |
36.5 (10) |
16.5 |
100 (0) |
25.6 |
70 (0) |
11.8 (0) |
ASR 7 |
63.6 (0) |
27.3 |
34.4 (8) |
15.5 |
91 (0) |
24.9 |
73.3 (0) |
11.9 (0) |
ASR 8 |
65.1 (0) |
28.5 |
35.3 (10) |
16.4 |
90 (0) |
25.4 |
71.1 (0) |
11.9 (0) |
ASR 9 |
62 (0) |
26.5 |
32.3 (8) |
14.6 |
84 (0) |
16.8 |
69 (0) |
11.4 (0) |
ASR 10 |
62 (0) |
26.8 |
32.2 (8) |
14.8 |
81 (0) |
16.4 |
69 (0) |
11.3 (0) |
ASR 11 |
62.2 (0) |
26.6 |
32.2 (8) |
14.7 |
80 (0) |
16.0 |
69 (0) |
10.9 (0) |
ASR 12 |
62.1 (0) |
26.4 |
32.2 (7) |
14.5 |
79 (0) |
15.5 |
69 (0) |
10.5 (0) |
ASR 13 |
62.1 (0) |
26.9 |
32.3 (8) |
14.9 |
77 (0) |
16.0 |
69.9 (0) |
10.7 (0) |
ASR 14 |
61.9 (0) |
26.3 |
32.1 (7) |
14.4 |
78 (0) |
14.1 |
69.7 (0) |
10.8 (0) |
ASR 15 |
63.2 (0) |
27.0 |
33.8 (8) |
15.2 |
82 (0) |
17.6 |
68.8 (0) |
11.8 (0) |
ASR 16 |
61.5 (0) |
26.0 |
32 (7) |
14.1 |
79 (0) |
12.1 |
67.3 (0) |
10.4 (0) |
ASR 17 |
61.5 (0) |
26.0 |
32 (7) |
14.2 |
76 (0) |
12.0 |
67.5 (0) |
10.2 (0) |
ASR 18 |
61.5 (0) |
26.1 |
32 (7) |
14.2 |
75 (0) |
12.9 |
69.7 (0) |
10.9 (0) |
ASR 19 |
61.6 (0) |
26.3 |
32.1 (7) |
14.4 |
76 (0) |
13.5 |
94.1 (0) |
11.6 (0) |
Remarks:
[1] Bolded value shows exceedance of relevant criteria of EIAO-TM / AQO.
[2] Values in ( ) indicate the number of exceedances.
3.9.2.2 According to the predicted results in Table 3.16, the concentrations of the AQO criteria pollutants (RSP, FSP, NO2 and SO2) at all representative ASRs would comply with the respective AQOs. Therefore, no adverse air quality impact due to gaseous emission from the operation of TPSTW is anticipated.
3.9.2.3 The predicted other non-AQO criteria gaseous emission impact (HCl, HF, CO, CH4 and CH2O) to the ASRs during operation of the upgraded TPSTW and Co-digestion Facilities are presented in Table 3.17. The detailed result is presented in Appendix 3.9. According to the predicted results in Table 3.17, the concentrations of the other gaseous pollutants (HCl, HF, CO, CH4 and CH2O) at all representative ASRs would comply with the air quality standard stated in Table 3.2. Therefore, no adverse air quality impact due to gaseous emission from the operation of TPSTW is anticipated.
Table 3.17 Predicted Cumulative Other Gaseous Pollutants (HCl, HF, CO, CH4 and CH2O) Concentrations at Representative Air Sensitive Receivers
Air Sensitive Receiver |
Highest 1-hour Average HCl Conc. (µg/m3) |
Annual Average HCl Conc. (µg/m3) |
Highest 1-hour Average HF Conc. (µg/m3) |
Annual Average HF Conc. (µg/m3) |
Highest 1-hour Average CO Conc. (µg/m3) |
Highest 8-hour Average CO Conc. (µg/m3) |
Highest 15-min Average CH4 Conc. (µg/m3) |
Highest 30-min Average CH2O Conc. (µg/m3) |
Annual Average CH2O Conc. (µg/m3) |
ASR 1 |
10.5 |
0.4 |
2.1 |
0.1 |
746.7 |
230.7 |
88.5 |
11.1 |
4.0 |
ASR 2 |
8.6 |
0.4 |
1.7 |
0.1 |
746.5 |
230.1 |
35.7 |
6.5 |
4.0 |
ASR 3 |
16.4 |
0.5 |
3.3 |
0.1 |
747.6 |
232.2 |
85.1 |
9.5 |
4.0 |
ASR 4 |
32.6 |
1.7 |
6.5 |
0.2 |
1032.3 |
298.4 |
353.4 |
33.2 |
5.6 |
ASR 5 |
104.3 |
1.9 |
20.9 |
0.3 |
787.8 |
280.1 |
257.3 |
25.2 |
5.2 |
ASR 6 |
15.3 |
0.2 |
3.1 |
0.0 |
759.1 |
229.4 |
23.0 |
5.8 |
3.9 |
ASR 7 |
10.7 |
0.3 |
2.1 |
0.0 |
763.1 |
230.3 |
33.5 |
6.6 |
3.9 |
ASR 8 |
20.9 |
0.3 |
4.2 |
0.1 |
760.8 |
229.7 |
35.6 |
6.8 |
3.9 |
ASR 9 |
4.7 |
0.3 |
0.9 |
0.1 |
748.8 |
226.7 |
16.3 |
5.2 |
3.9 |
ASR 10 |
6.2 |
0.4 |
1.2 |
0.1 |
748.2 |
226.7 |
26.8 |
6.1 |
3.9 |
ASR 11 |
6.1 |
0.6 |
1.2 |
0.1 |
748.1 |
226.6 |
18.0 |
5.4 |
3.9 |
ASR 12 |
5.1 |
0.5 |
1.0 |
0.1 |
748.3 |
226.6 |
20.9 |
5.6 |
3.9 |
ASR 13 |
5.3 |
0.2 |
1.1 |
0.0 |
750.6 |
227.0 |
19.7 |
5.3 |
3.9 |
ASR 14 |
5.4 |
0.3 |
1.1 |
0.0 |
748.7 |
226.9 |
18.1 |
5.4 |
3.9 |
ASR 15 |
8.5 |
0.1 |
1.7 |
0.0 |
757.3 |
229.2 |
15.7 |
5.2 |
3.9 |
ASR 16 |
7.4 |
0.1 |
1.5 |
0.0 |
745.8 |
226.2 |
10.1 |
4.7 |
3.9 |
ASR 17 |
7.8 |
0.1 |
1.6 |
0.0 |
745.2 |
226.2 |
8.6 |
4.6 |
3.9 |
ASR 18 |
6.3 |
0.2 |
1.3 |
0.0 |
745.8 |
226.7 |
16.8 |
5.3 |
3.9 |
ASR 19 |
9.6 |
0.3 |
1.9 |
0.1 |
745.6 |
226.8 |
13.2 |
4.9 |
3.9 |
Remarks:
[1] Bolded value shows exceedance of relevant criteria of AQO and Table3.2.
3.9.3 Operational Phase (Odour Impact)
3.9.3.1 The predicted odour impact to the ASRs during operation of the upgraded TPSTW and Co-digestion Facilities are presented in Table 3.18. The detailed result is presented in Appendix 3.9. The contour plots of the worst impact level (i.e. 15mAG) are presented in Figure 3.61.
Table 3.18 Predicted Odour Impact at Representative Air Sensitive Receivers
Air Sensitive Receiver |
Odour Unit (OU) per m3 |
ASR 1 |
2.3 |
ASR 2 |
1.4 |
ASR 3 |
2.1 |
ASR 4 |
3.2 |
ASR 5 |
2.7 |
ASR 6 |
2.2 |
ASR 7 |
1.5 |
ASR 8 |
3.1 |
ASR 9 |
2.0 |
ASR 10 |
3.3 |
ASR 11 |
1.6 |
ASR 12 |
1.3 |
ASR 13 |
2.2 |
ASR 14 |
2.8 |
ASR 15 |
1.2 |
ASR 16 |
0.9 |
ASR 17 |
0.6 |
ASR 18 |
1.6 |
ASR 19 |
1.2 |